Embed Size (px)
Citation preview
Corresponding Author: Durmishi H. Bujar, State University of Tetova, Department of Chemistry, Ilindeni Street n.n., 1200 Tetova,
Republic of Macedonia.
J. Chem. Bio. Phy. Sci.; Sec. D 2013; Vol.3, N0.3; 2352-2360.
Physico-Chemical Quality Assessment of the Drinking Water in the Summer
Season in Tetova
Durmishi H. Bujar, Arianit A. Reka,
Murtezan Ismaili and Agim Shabani
May 2013 - July 2013, Vol. 3, No. 3; 2352-2360. E- ISSN: 2249 –1929
Journal of Chemical, Biological and Physical Sciences An International Peer Review E-3 Journal of Sciences
Available online at www.jcbsc.org
Section D: Environment Science
CODEN (USA): JCBPAT Research article
2352 J. Chem. Bio. Phy. Sci. Sec. D; 2013, Vol.3, No.3; 2352-2360.
Physico-Chemical Quality Assessment of the Drinking Water in the Summer Season in Tetova
Durmishi H. Bujar1*, Arianit A. Reka1, Murtezan Ismaili2 and Agim Shabani1
1Department of Chemistry, State University of Tetova, Tetova, R. of Macedonia
2South East European University, Tetova, R. of Macedonia
Received: 6 July 2013; Revised: 25 July 2013; Accepted: 30 July 2013
Abstract: Water is the most essential product that is consumed by humans, which
must be prevented from deterioration in quality. The quality of drinking water
becomes even more important as water borne diseases spread through water. For this
purpose, we assess the quality of drinking water in the city of Tetova with some
physico-chemical parameters, which have a significant role in determining the
portability of drinking water. The obtained results were compared with Macedonian
standards as well as with those set by the WHO and the EU. In this research,
parameters such as temperature, pH, EC, TRAE, TDS, COD, TOC, DOC, nitrates and
chlorides were found to be within the permissible limits, while turbidity and residual
chlorine in some cases were found to be below ore above the recommended limit.
Finally, the Drinking Water Quality Index (DWQI) developed by Canadian Council
of Ministers of the Environmentfor fifteen sample points is calculated. It has been
found that drinking water in the 2011summer season was of an Excellent category
(average value of DWQI = 95.26) and suitable for drinking. We recommend that the
relevant municipal authorities make regular and proper amount disinfection of
drinking water, as there is no compromise that can be made when it comes to the
drinking water.
Key words: drinking water quality, DWQI, physico-chemical parameters, public
health.

Physico... Durmishi H. Bujar et al.
2353 J. Chem. Bio. Phy. Sci. Sec. D; 2013, Vol.3, No.3; 2352-2360.
INTRODUCTION
Environmental pollution and especially the contamination of water sources is a problem our society is facing today. The increasing urbanization, industrialization, the modernization of agriculture, the increase in traffic all contribute to global pollution, which in turn requires accurate monitoring and information about the quality of water resources. Water is a crucial natural resource, a basic human need and a precious natural asset. Concerns for the quality of water come from the global social trends, population growth and development activities, which have been the cause of pollution. Moreover, inadequate management of water systems can cause serious problems in the water availability and quality of water1. Hence it is necessary to evaluate the quality of the drinking water.
The drinking water quality directly affects human health. The impacts reflect the level of contamination of the whole drinking water supply system (raw water, treatment facilities and the distribution network to consumers)2. Drinking water is an essential environmental constituent and the quality of drinking water is an issue of primary interest for the residents of the European Union3.
The assessment of water quality is done in various ways. A very powerful tool for this purpose is the Drinking Water Quality Index (DWQI). The objective of an index is to turn multifaceted water quality data into simple information that is comprehensible and useable by the public4. The DWQI represents a simple number from 0 - 100 where a highest value indicates the best water quality and vice versa5- 7.
The aim of the article is to assess the physical-chemical quality of the drinking water in Tetova during the summer season 2011, in order to conclude the quality of the drinking water and its impact on the health of the population living in this region. This is done by comparing the values of the measured parameters with drinking water guidelines of Macedonia, the WHO and the EU. Categorization of drinking water is done with DWQI.
EXPERIMENTAL
The city of Tetova is situated in the north-west part of Macedonia and has about 70 000 inhabitants. The drinking water is supplied from surface sources of Sharr Mountain. Even though it has sufficient water resources and permanent water flows, the lack of water is being felt in this city. Statistics show that the average amount of water per inhabitant is about 350-400 litres per day. The drinking water in Tetova is disinfected with gaseous chlorine without any kind of special treatment, whereas the South East European University (SEEU) utilizes the underground drinking water that is extracted from three individual wells and is disinfected only by a UV radiation used as primary disinfectant (sample point T14 and T15).
The present measurements were carried out in June, July and August 2011. The water samples were collected from fifteen sample points selected in the city of Tetova (T1 – T15) in clean polyethylene and glass container of 1.5 litres. The water temperature, pH, electrical conductivity (EC) and total dissolved solids (TDS) of water samples were recorded at the sample points themselves.
All other physical-chemical parameters such as turbidity, residual chlorine, the total residue after evaporation (TRAE), chemical oxygen demand (COD), total organic carbon (TOC), dissolved organic carbon (DOC), nitrates and chlorides were analysed using standard methods8. Chlorides were determined by titration method, while nitrates were analysed by spectrophotometric method. Various different chemicals with pro-analysis and suprapur were used. To assess the physical-chemical quality of drinking water we used the Canadian Council of Ministers of the Environment Drinking Water

Physico... Durmishi H. Bujar et al.
2354 J. Chem. Bio. Phy. Sci. Sec. D; 2013, Vol.3, No.3; 2352-2360.
Quality Index9, which is widely used. According to this index the drinking water quality is ranked in the following five categories: Excellent (DWQI values 95–100), Good (DWQI values 80–94), Fair (DWQI values 60–79), Marginal (DWQI values 45–59) and Poor (DWQI values 0–44).
RESULTS AND DISCUSSIONS
The results are presented in Figures 1 - 7. A comparison of the various physical-chemical characteristics of the studied water samples has been made with the Macedonian10, WHO11 and EU standards.
Water temperature: The temperature plays a crucial role in physical-chemical and biological behavior of aquatic system12. Chemical reactions dependent the water temperature and it controls the metabolic and reproductive processes of aquatic species. The recorded temperature of drinking water was more or less similar in all sample points and slightly differed in months and the summer season
(Fig. 1). Water temperature in months was found to vary from 10.60 to 11.60 °C. The highest temperature was observed in T12 (August) and the lowest was recorded during June in T1. Seasonal
average with standard deviation was 11.12 ± 0.26°C.
Figure 1: Seasonal variation of average values of temperature and pH
Turbidity: Turbidity is a measurement of the amount of suspended material in the water. Higher turbidity increases water temperatures because suspended particles absorb more heat. Clean waters are generally associated with low turbidity, but there is a high degree of natural variability involved. Rain events can increase turbidity in surface waters by flushing sediment, organic matter and other mate-rials into the water. All samples are likely to show no significant difference except for sample T11 (July and August) where state regulation is exceeded (1.6 NTU). Range of turbidity was from 0.2 to 1.6 NTU units (Fig. 2). Monthly averages in June, July and August were 0.90, 0.86 and 0.96
respectively, while the seasonal average with standard deviationwas0.90 ± 0.43NTU. The consumption of highly turbid water may constitute a health risk as excessive turbidity can protect pathogenic microorganisms from the effects of disinfectants, and also stimulate the growth of bacteria during storage13.

Physico... Durmishi H. Bujar et al.
2355 J. Chem. Bio. Phy. Sci. Sec. D; 2013, Vol.3, No.3; 2352-2360.
Figure 2: Seasonal variation of average values of turbidity and residual chlorine
Residual chlorine: Residual chlorine (RC) has great significance in the presence or absence of microorganisms. The presence of RC in drinking water indicates that a sufficient amount of chlorine was added initially to the water to inactivate the bacteria and some viruses that cause diarrheal disease and the water is protected from recontamination during storage. The presence of free RC in drinking water is correlated with the absence of disease-causing organisms, and thus is a measure of the portability of water. RC during the season was found to vary from 0.00 to 0.32 mg/L in months. The highest value was observed in T8 (August) and the lowest was recorded in T14 and T15 (during the three months). In T14 and T15 the RC is not detected. Figure 3 shows that sample points T1 (June, July and August), T2 (July and August), T3 (August), T4 (August), T9 (June) and T10 (July) recorded lower values than the state recommended values. Monthly averages in June, July and August were
0.195, 0.190 and 0.194 respectively, while the seasonal average with standard deviation was 0.19 ± 0.09 mg/L.
Figure 3: Seasonal variation of residual chlorine in the summer season

Physico... Durmishi H. Bujar et al.
2356 J. Chem. Bio. Phy. Sci. Sec. D; 2013, Vol.3, No.3; 2352-2360.
pH: pH is a measure of hydrogen ion activity in water, or, water acidity. pH classified as a secondary drinking water contaminant whose impact is considered aesthetic. Water with a low pH can be acidic, naturally soft and corrosive. It can also damage metal pipes and cause aesthetic problems. Drinking water with a pH level above 8.5 indicates that a high level of alkalinity minerals is present. The recorded water pH was more or less similar in all sample points as well as seasons (Fig. 1). The pH for the water samples varied between 7.05 in T1 (June) to 8.82 in T11 (July), while average values for three months were 7.68, 7.84 and 7.84 respectively. The seasonal average with standard deviation was
7.79 ± 0.56.
Electrical conductivity: Electrical conductivity (EC) is a measure of the ability of water to conduct an electrical current. It is highly dependent on the amount of dissolved solids in the water. EC is an important water-quality measurement because it gives a good idea of the amount of dissolved material in the water. EC readings can help locate potential pollution sources because polluted water usually has higher values than unpolluted waters. The EC in summer showed very narrow changes in sample points T1 – T13, but higher values in T14 and T15. The EC values varied between 235 and 693
µS/cm. The maximum value was recorded in T15 (August) and the minimum in T1 (June), while
average values for three months were 325.67, 329.20 and 355.53 µS/cm respectively. The seasonal
average with standard deviation was 336.80 ± 138.65 µS/cm (Fig. 4).
TRAE: Total residue represents the sum of both dissolved and suspended material in water. The determination is not exact, because of the compromise that must be made in selecting the temperature at which the evaporated residue is to be dried. At temperatures sufficient to release water of hydration of the hydrated salts that form on evaporation, there is risk of volatilization of the more volatile dissolved or suspended materials in the sample. Because of these factors, the determination must be considered as providing only an approximation of the sum of dissolved and suspended matter. The TRAE values were found to be in range 132 – 386 mg/L within the permissible limits. The lower value was measured in T5 (June) and highest in T15 (August), while average values in months were 173.60, 192.07 and 208.00 mg/L respectively. The seasonal average with standard deviation was
191.22 ± 75.61 mg/L (Fig. 4).
Figure 4: Seasonal variation of average values of EC, TRAE and TDS
Physico... Durmishi H. Bujar et al.
2357 J. Chem. Bio. Phy. Sci. Sec. D; 2013, Vol.3, No.3; 2352-2360.
TDS: Total dissolved solids (TDS) is the term applied to the residue remaining in a weighed dish after the sample has been passed through a standard fibre glass filter and dried to constant mass at 103 –
105 °C or 179 – 181 °C. Dissolved minerals, gases and organic constituents may produce aesthetically displeasing colour, taste and odour. Water with higher solids content often has a laxative and some-times the reverse effect upon people whose bodies are not adjusted to them. TDS consists mainly of bicarbonate, carbonate, sulphate, chloride, nitrates and other substance. The values of TDS were in range 165.00 – 526 mg/L. The lower value was measured in T5 (June) and highest in T15 (August), while average values in months were 230.93, 241.47 and 249.53 mg/L respectively. The seasonal
average with standard deviation was 240.64 ± 108.94 mg/L (Fig. 4).
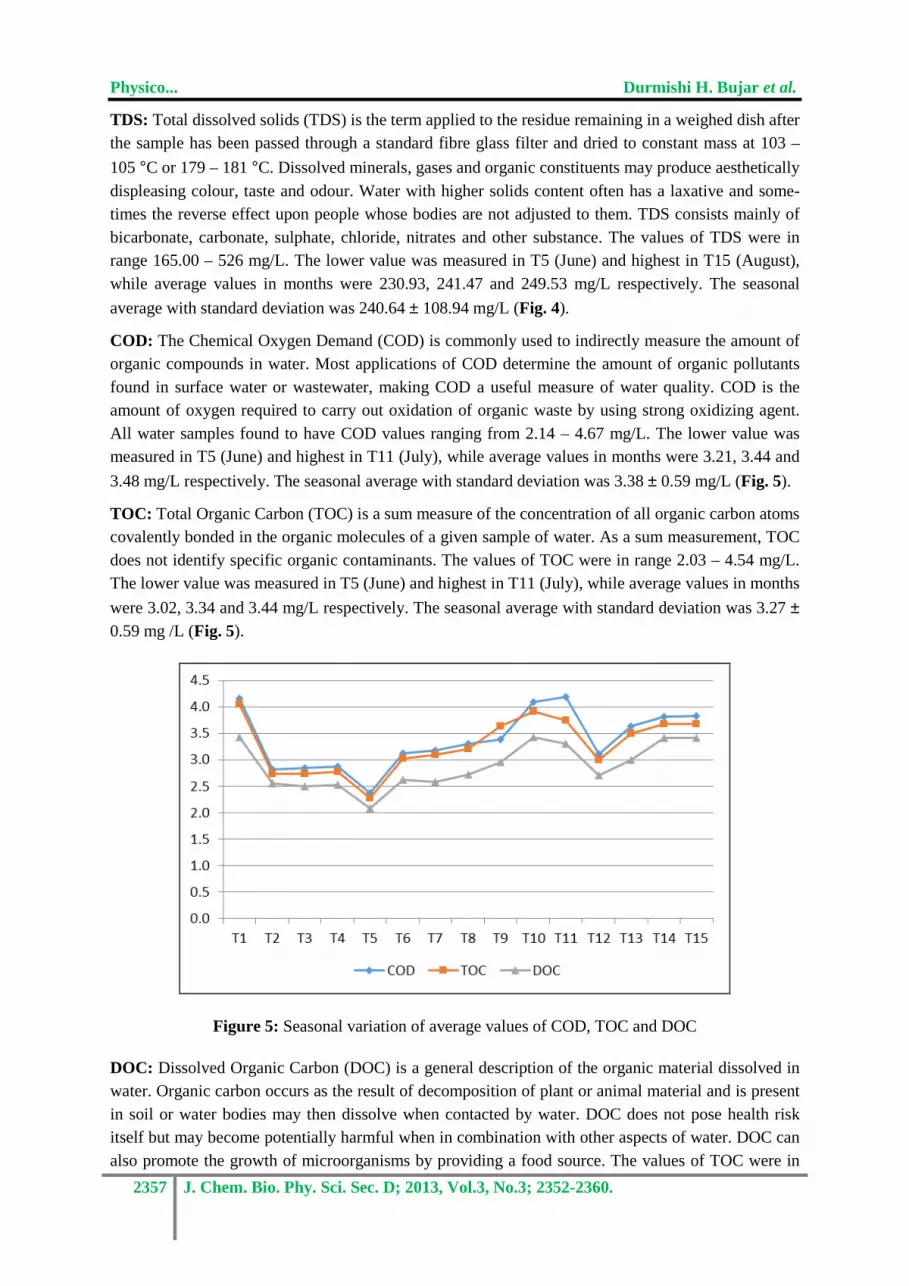
COD: The Chemical Oxygen Demand (COD) is commonly used to indirectly measure the amount of organic compounds in water. Most applications of COD determine the amount of organic pollutants found in surface water or wastewater, making COD a useful measure of water quality. COD is the amount of oxygen required to carry out oxidation of organic waste by using strong oxidizing agent. All water samples found to have COD values ranging from 2.14 – 4.67 mg/L. The lower value was measured in T5 (June) and highest in T11 (July), while average values in months were 3.21, 3.44 and
3.48 mg/L respectively. The seasonal average with standard deviation was 3.38 ± 0.59 mg/L (Fig. 5).
TOC: Total Organic Carbon (TOC) is a sum measure of the concentration of all organic carbon atoms covalently bonded in the organic molecules of a given sample of water. As a sum measurement, TOC does not identify specific organic contaminants. The values of TOC were in range 2.03 – 4.54 mg/L. The lower value was measured in T5 (June) and highest in T11 (July), while average values in months
were 3.02, 3.34 and 3.44 mg/L respectively. The seasonal average with standard deviation was 3.27 ± 0.59 mg /L (Fig. 5).
Figure 5: Seasonal variation of average values of COD, TOC and DOC
DOC: Dissolved Organic Carbon (DOC) is a general description of the organic material dissolved in water. Organic carbon occurs as the result of decomposition of plant or animal material and is present in soil or water bodies may then dissolve when contacted by water. DOC does not pose health risk itself but may become potentially harmful when in combination with other aspects of water. DOC can also promote the growth of microorganisms by providing a food source. The values of TOC were in

Physico... Durmishi H. Bujar et al.
2358 J. Chem. Bio. Phy. Sci. Sec. D; 2013, Vol.3, No.3; 2352-2360.
range 1.97 – 4.41 mg/L. The minimum was measured inT5 (June) and the maximum in T11 (July), while average values in months were 2.91, 3.21 and 2.53 mg/L respectively. The seasonal average
with standard deviation was 3.15 ± 0.59 mg/L (Fig. 5).
Nitrates: Nitrates generally occur in trace quantities in surface waters but may attain high levels in some ground waters. The main sources of nitrates in water are human and animal waste, industrial effluent, use of fertilizers and chemicals, silage through drainage system13. In excessive limits of nitrates (above 40 mg/L), it contributes to the illness known as methenoglobinemia or “blue baby” in infants. The nitrate values of the samples were found to be in range 0.40 – 28.50 mg/L within the permissible limits. The lower value was measured in T6 (June) and highest in T15 (August), while average values in months were 3.89, 4.72 and 5.95 mg/L respectively. The seasonal average with
standard deviation was 4.86 ± 7.93mg/L (Fig. 6).
Chlorides: Chloride ions are found naturally in some surface waters and groundwater. Higher-than-normal chloride concentrations in freshwater is detrimental to water quality. Chloride ions are not degraded in the environment and tend to remain in solution, once dissolved. Chloride ions that enter ground water can ultimately be expected to reach surface water and, therefore, influence aquatic environments and humans. High chloride content in water sample may be due to the pollution from chloride rich effluent of sewage and municipal waste. The chloride content of the samples is well within the desirable limits and varying from 0.70 – 32.60 mg/L. The lower value was measured in T5 (June) and highest in T15 (August), while average values in months were 6.23, 8.09 and 10.45 mg/L
respectively. The seasonal average with standard deviation was 8.26 ± 9.57 mg/L (Fig. 6).
Figure 6: Seasonal variation of average values of nitrates and chlorides
Assessment with DWQI: The results of drinking water quality assessment of Tetova by DWQI are shown in Fig. 7. It is found that drinking water in the summer season in all sample points has been of Excellent category with average value of DWQI = 95.26. Lower index value was in T14 and T15 (DWQI = 91.86), while higher inT6, T12 and T13 (DWQI = 100). In T14 and T15 from 12 parameters 1 have resulted failed (RC), while from 36 tests failed were 3 (RC), while in T1 failed were 1 parameter (RC) and 3 tests (RC). Compared with our previous results5 shows that the DWQI values have had slight improvement in the quality of drinking water.

Physico... Durmishi H. Bujar et al.
2359 J. Chem. Bio. Phy. Sci. Sec. D; 2013, Vol.3, No.3; 2352-2360.
Figure 7: DWQI values in the city of Tetova
CONCLUSIONS
From the results we can conclude that:
• Temperature, pH, EC, TDS, TRAE, COD, TOC, DOC, nitrates and chlorides were found to be within Macedonian, WHO and EU permissible limits for drinking water;
• Turbidity and RC (< 0.2 mg/L or > 0.3 mg/L) were in some cases below ore above the recommended values. This gives the opportunity to partially disinfected drinking water and consequently causes health implications for consumers. Therefore we recommend the relevant municipal authorities to make regular and proper amount of drinking water disinfection as there is no compromise with regard to this issue;
• A few failed parameters were turbidity and RC, and their values have caused lower values of DWQI in sample points T14, T15 and T1;
• DWQI is a very powerful and adequate tool for assessing the quality of drinking water.
REFRENECES
1. R.R. Krishnan, K. Dharmaraj and B.D.R. Kumari, J. En. Biol; 2007, 28, 105-108 2. V. Magnuss, Proc. ECOpole 3, 2009, 267-272 3. E. Chirila, T. Bari and L. Barbes, Ann. Chem.; 2010, 21, 87-90 4. M. Alam and J.K. Pathak, Nature Sci.; 2010, 8, 1-8 5. B.H. Durmishi, M. Ismaili, A. Shabani and Sh. Abduli, American Journal of Environmental
Sciences; 2012, 8 (2), 162-169 6. L. Li, P. Byleveld, A. Leask and W. Smith, Proceedings of the 18th World IMACS/MODSIM
Congress, Jul. 13-17, 2009, Cairns, Australia, 4326-4332 7. Z.A. Napacho and S.V. Manyele, Afr. J. Environ. Sci. Technol.; 2010, 4, 775-789

Physico... Durmishi H. Bujar et al.
2360 J. Chem. Bio. Phy. Sci. Sec. D; 2013, Vol.3, No.3; 2352-2360.
8. APHA, AWWA, WEF standard. Examination of water and waste water, 20th edition, APHA,Washington DC, 1998
9. Canadian Council of Ministers of the Environment, Canadian water quality guidelines for the protection of aquatic life: CCME Water Quality Index 1.0 User’s Manual, 2001, 1-12
10. Government of the Republic of Macedonia, State Drinking water regulation, Official gazette No. 57/2004, Skopje, Government of the Republic of Macedonia, 2004,1-40
11. WHO, Guidelines for drinking water quality. Health criteria and other supporting information, Geneva, World Health Organization, Vol. 2., 1998
12. P. Dwivedi and S. Sonar, Poll. Res.; 2004. 23(1),101-104
13. H. Zvikomborero, Physics and Chemistry of the Earth.; 2005, 30, 859-866
14. R.P. Singh and P. Mathur, J. Environ. Science; 2005, 9, 57-61
Corresponding Author: Durmishi H. Bujar, State University of Tetova,
Department of Chemistry, Ilindeni Street n.n., 1200 Tetova, Republic of Macedonia