Embed Size (px)
Citation preview

RESEARCH ARTICLE10.1002/2013GC005059
Piecewise delamination of Moroccan lithospherefrom beneath the Atlas MountainsM. J. Bezada1, E. D. Humphreys1, J.M. Davila2, R. Carbonell3, M. Harnafi4,I. Palomeras5, and A. Levander5
1Department of Geological Sciences, University of Oregon, Eugene, Oregon, USA, 2Real Instituto y Observatorio de laArmada, San Fernando, Spain, 3CSIC––Institute of Earth Sciences ‘‘Jaume Almera,’’, Barcelona, Spain, 4Institut Scientifique,Universit�e Mohammed V Agdal, Rabat, Morocco, 5Department of Earth Science, Rice University, Houston, Texas, USA
Abstract The elevation of the intracontinental Atlas Mountains of Morocco and surrounding regionsrequires a mantle component of buoyancy, and there is consensus that this buoyancy results from anabnormally thin lithosphere. Lithospheric delamination under the Atlas Mountains and thermal erosioncaused by upwelling mantle have each been suggested as thinning mechanisms. We use seismic tomogra-phy to image the upper mantle of Morocco. Our imaging resolves the location and shape of lithosphericcavities and of delaminated lithosphere �400 km beneath the Middle Atlas. We propose discontinuousdelamination of an intrinsically unstable Atlas lithosphere, enabled by the presence of anomalously hotmantle, as a mechanism for producing the imaged structures. The Atlas lithosphere was made unstable by acombination of tectonic shortening and eclogite loading during Mesozoic rifting and Cenozoic magmatism.The presence of hot mantle sourced from regional upwellings in northern Africa or the Canary Islandsenhanced the instability of this lithosphere. Flow around the retreating Alboran slab focused upwellingmantle under the Middle Atlas, which we infer to be the site of the most recent delamination. The AtlasMountains of Morocco stand as an example of large-scale lithospheric loss in a mildly contractional orogen.
Introduction
The Atlas Mountains form an intracontinental mountain chain stretching 2000 km from the Atlantic coast inMorocco to the Mediterranean coast in Tunisia (Figure 1b). These mountains are a structural inversion ofTriassic-Jurassic grabens created during the opening of the Atlantic and the Alpine Tethys [e.g., Frizon deLamotte et al., 2008, and references therein]. Contraction occurred in two distinct episodes during the Mid-Eocene and Pliocene-Quaternary [Frizon de Lamotte et al., 2000] and only produced modest amounts ofshortening. Total shortening estimates are of 15–30% for the High Atlas [Beauchamp et al., 1999; Teixellet al., 2003] and 10% or lower for the Middle Atlas [Gomez et al., 1998; Frizon de Lamotte et al., 2009; Teixellet al., 2009]. Shortening estimates are consistent with the modest elevations found in the eastern Atlas(Saharan and Tunisian Atlas, Aures Mountains, Figure 1b), whereas the elevations in the Moroccan Atlas(High and Middle Atlas) are much higher (Figure 1b). These elevation differences occur in spite of the similarcrustal thicknesses of the Moroccan and eastern Atlas, implying that the crust alone is not responsible forthe high elevations of the Moroccan Atlas [Ayarza et al., 2005]. Additionally, the Moroccan Atlas are flankedby two young upwarps that locally reach elevations of 2000 m without significant Cenozoic deformation:the Moroccan Meseta, and the Anti-Atlas, located on the northern edge of the West African Craton [Hefferanet al., 2000; Ennih and Li�egeois, 2001]. The eastern Atlas have no upwarps of similar magnitude. Given thatthe Moroccan and eastern Atlas share a common geologic history and crustal thickness [Frizon de Lamotteet al., 2009], and that much of the Moroccan Atlas elevation cannot be attributed to crustal tectonics, a man-tle component of buoyancy is required to account for the high Moroccan Atlas elevations [Ayarza et al.,2005; Teixell et al., 2005; Missenard et al., 2006; Frizon de Lamotte et al., 2009].
Mantle buoyancy beneath the Moroccan Atlas requires a thinned lithosphere. This is consistent with theoccurrence of Cenozoic magmatism with an alkaline, intraplate chemical affinity in Morocco that is absentfrom the eastern Atlas. A first pulse of magmatism occurred in the early Tertiary in eastern Morocco. After a30 m.y. volcanic pause, this was followed by a significantly larger episode starting in the mid-Miocene(Figure 1a). This second episode was significantly more voluminous and erupted in the Middle Atlas and
Key Points:� We image lithospheric cavities
beneath the Middle Atlas and centralHighAtlas� We image the delaminated
lithosphere of the Middle Atlas at�400 km depth� We propose piecewise delamination
of Atlas lithosphere
Supporting Information:� Supplementary Information Text
Correspondence to:M. J. Bezada,[email protected]
Citation:Bezada, M. J., E. D. Humphreys, J.M.Davila, R. Carbonell, M. Harnafi,I. Palomeras, and A. Levander (2014),Piecewise delamination of Moroccanlithosphere from beneath the AtlasMountains, Geochem. Geophys.Geosyst., 15, 975–985, doi:10.1002/2013GC005059.
Received 23 SEP 2013
Accepted 7 FEB 2014
Accepted article online 14 FEB 2014
Published online 9 APR 2014
BEZADA ET AL. VC 2014. American Geophysical Union. All Rights Reserved. 975
Geochemistry, Geophysics, Geosystems
PUBLICATIONS
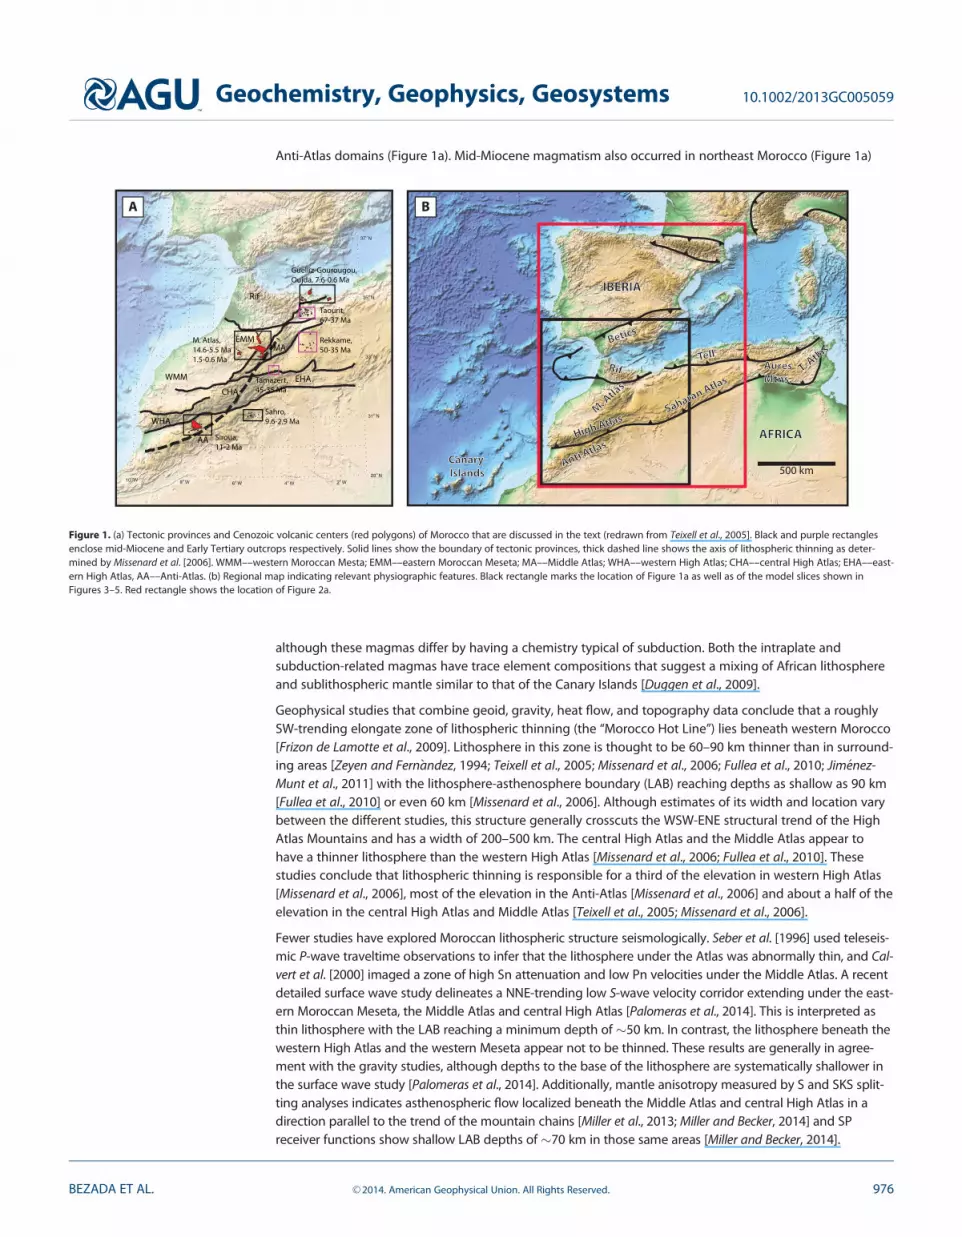
Anti-Atlas domains (Figure 1a). Mid-Miocene magmatism also occurred in northeast Morocco (Figure 1a)
although these magmas differ by having a chemistry typical of subduction. Both the intraplate andsubduction-related magmas have trace element compositions that suggest a mixing of African lithosphereand sublithospheric mantle similar to that of the Canary Islands [Duggen et al., 2009].
Geophysical studies that combine geoid, gravity, heat flow, and topography data conclude that a roughlySW-trending elongate zone of lithospheric thinning (the ‘‘Morocco Hot Line’’) lies beneath western Morocco[Frizon de Lamotte et al., 2009]. Lithosphere in this zone is thought to be 60–90 km thinner than in surround-ing areas [Zeyen and Fern�andez, 1994; Teixell et al., 2005; Missenard et al., 2006; Fullea et al., 2010; Jim�enez-Munt et al., 2011] with the lithosphere-asthenosphere boundary (LAB) reaching depths as shallow as 90 km[Fullea et al., 2010] or even 60 km [Missenard et al., 2006]. Although estimates of its width and location varybetween the different studies, this structure generally crosscuts the WSW-ENE structural trend of the HighAtlas Mountains and has a width of 200–500 km. The central High Atlas and the Middle Atlas appear tohave a thinner lithosphere than the western High Atlas [Missenard et al., 2006; Fullea et al., 2010]. Thesestudies conclude that lithospheric thinning is responsible for a third of the elevation in western High Atlas[Missenard et al., 2006], most of the elevation in the Anti-Atlas [Missenard et al., 2006] and about a half of theelevation in the central High Atlas and Middle Atlas [Teixell et al., 2005; Missenard et al., 2006].
Fewer studies have explored Moroccan lithospheric structure seismologically. Seber et al. [1996] used teleseis-mic P-wave traveltime observations to infer that the lithosphere under the Atlas was abnormally thin, and Cal-vert et al. [2000] imaged a zone of high Sn attenuation and low Pn velocities under the Middle Atlas. A recentdetailed surface wave study delineates a NNE-trending low S-wave velocity corridor extending under the east-ern Moroccan Meseta, the Middle Atlas and central High Atlas [Palomeras et al., 2014]. This is interpreted asthin lithosphere with the LAB reaching a minimum depth of �50 km. In contrast, the lithosphere beneath thewestern High Atlas and the western Meseta appear not to be thinned. These results are generally in agree-ment with the gravity studies, although depths to the base of the lithosphere are systematically shallower inthe surface wave study [Palomeras et al., 2014]. Additionally, mantle anisotropy measured by S and SKS split-ting analyses indicates asthenospheric flow localized beneath the Middle Atlas and central High Atlas in adirection parallel to the trend of the mountain chains [Miller et al., 2013; Miller and Becker, 2014] and SPreceiver functions show shallow LAB depths of �70 km in those same areas [Miller and Becker, 2014].
10ο W 8ο W 6ο W 4ο W 2ο W 29ο N
31ο N
33ο N
35ο N
37ο N
WMM
EMMMA
CHA
EHA
WHA
AA
Rif
M. Atlas,
14.6-5.5 Ma
1.5-0.6 Ma
Siroua,
11-2 Ma
Rekkame,
50-35 Ma
Taourit,
67-37 Ma
Guelliz-Gourougou,
Oujda, 7.6-0.6 Ma
Tamazert,
45-35 Ma
Sahro,
9.6-2.9 Ma
500 kmCanary Canary
IslandsIslands
AFRICAAFRICA
IBERIAIBERIA
Saharan Atlas
Saharan Atlas
M. A
tlas
M. A
tlas
Anti Atlas
Anti AtlasHigh Atlas
High Atlas
AuresAuresMtns.Mtns.
T. Atla
s
T. Atla
sBeticsBetics
RifRifTellTell
A B
Figure 1. (a) Tectonic provinces and Cenozoic volcanic centers (red polygons) of Morocco that are discussed in the text (redrawn from Teixell et al., 2005]. Black and purple rectanglesenclose mid-Miocene and Early Tertiary outcrops respectively. Solid lines show the boundary of tectonic provinces, thick dashed line shows the axis of lithospheric thinning as deter-mined by Missenard et al. [2006]. WMM––western Moroccan Mesta; EMM––eastern Moroccan Meseta; MA––Middle Atlas; WHA––western High Atlas; CHA––central High Atlas; EHA––east-ern High Atlas, AA––Anti-Atlas. (b) Regional map indicating relevant physiographic features. Black rectangle marks the location of Figure 1a as well as of the model slices shown inFigures 3–5. Red rectangle shows the location of Figure 2a.
Geochemistry, Geophysics, Geosystems 10.1002/2013GC005059
BEZADA ET AL. VC 2014. American Geophysical Union. All Rights Reserved. 976

In order to explain geochemical observations, Duggen et al. [2009] proposed that the elongate zone ofthinned lithosphere in Morocco acts as a corridor, channeling anomalously hot mantle rising under theCanary plume toward the Mediterranean. In this interpretation, the sublithospheric corridor formed throughthe delamination of a thick lithospheric root underlying the Moroccan Atlas chain and its formation pre-ceded and enabled inflow of plume mantle. Delamination of Atlas lithosphere is also proposed by Ramdani[1998] who cites the occurrence of intermediate-depth earthquakes under the Middle Atlas as additionalevidence. We discuss these purported intermediate-depth earthquakes below.
Recognizing the need for mantle support of elevation, but noting that the Moroccan Hot Line trendsobliquely to the structural trends, some authors favor a model in which lithospheric thinning results fromthe thermal erosion caused by a mantle upwelling. A ‘‘baby plume’’ mantle upwelling [Teixell et al., 2005;Missenard et al., 2006; Fullea et al., 2010] and flow caused by edge-driven convection [Fullea et al., 2010; Mis-senard and Cadoux, 2012] have each been suggested.
In this paper, we use seismic tomography of the upper mantle to suggest that lithospheric foundering(commonly referred to as delamination regardless of the mechanism) occurred in an irregular fashionbeneath the Middle and High Atlas Mountains. We then use the tomography, regional uplift, and volcanichistory to conclude that mantle upwelling induced by slab rollback beneath the Alboran Sea generatedmelt within an anomalously hot asthenosphere, and that this melt invaded the lithosphere and solidified aseclogite, triggering lithosphere delamination beneath the Middle Atlas.
2. Data Set and Method
Our tomography uses data from permanent networks and temporary deployments across the Iberian Penin-sula and Morocco (Figure 2) consisting of delays from 398 events recorded over a period of almost 5 years.The data are mostly teleseismic P arrivals augmented with selected local events (Figure 2). Delays were
10ο W 8ο W 6ο W 4ο W 2ο W 0ο
30ο N
32ο N
34ο N
36ο N
38ο N
40ο N
42ο N
44ο N
h < 50 km50 km < h < 300 km h > 300 km
PICASSOIberArrayNational and Regional Muenster and BristolTopoMed OBS
AB
C
Figure 2. (a) seismic stations used in the study (inverted triangles) as well as local events (stars). Symbol colors represent station networkaffiliation and event depths as indicated in the legend. Location of teleseismic events used in the study (red circles), note the (b) good azi-muthal coverage and (c) abundance of antipodal events.
Geochemistry, Geophysics, Geosystems 10.1002/2013GC005059
BEZADA ET AL. VC 2014. American Geophysical Union. All Rights Reserved. 977

determined by cross correlation of waveforms band pass filtered at frequencies of 1.0, 0.5, and 0.3 Hz. Over76,000 delays were inverted using rays traced iteratively through laterally heterogeneous media, frequency-dependent sensitivity kernels, and damping and smoothing regularization as described in Bezada et al.[2013]. Local events were relocated after each iteration using a grid-search approach. Node spacing is 42km in the interior of the model, increasing to 56 km in its outer edges. The surface wave model of Palomeraset al. [2014] served as starting constraint for the upper 150 km of the model: Shear wave velocities wereconverted to P-wave velocities using a constant Vp/Vs ratio and then expressed as anomalies from themean at each depth. The final model produces a good fit to the data, with final residuals showing a variancereduction of �81% with respect to the measured delays.
3. Seismic Anomalies
The dense and extensive station covering (Figure 2a) enables improved imaging constraint. In this paper,we describe features beneath Morocco and avoid discussion of the Alboran slab which is the subject ofBezada et al. [2013]. Our velocity model (Figure 3) is an update of the Bezada et al. [2013] model that bene-fits from data recorded by additional stations deployed in that area.
The velocity structure shallower than 90 km is dominated by low-velocity anomalies. The general trend of theseanomalies follows the Betics-Rif arc, and continues east to underlie the Guelliz-Gourougou volcanic fields. TheMiddle Atlas and the central High Atlas are also underlain by slow velocity anomalies. The central High Atlasanomaly is confined to the mountain chain and is visible as far down as�120 km depth, whereas the MiddleAtlas anomaly has larger amplitudes, extends east under the western Moroccan Meseta, and persists to almost200 km depth (Figure 3). The Anti-Atlas domain is underlain by neutral to weakly fast velocity anomalies. A slowanomaly is imaged in the SW part of our inversion domain near the Atlantic coast (where resolution is relativelypoor), which is prominent at depths greater than 150 km and extends to depths greater than 400 km (Figure 3).
In addition to the very fast Alboran slab, three small, fast anomalies are imaged at depths of 350–450 km,generally under the Middle Atlas region. Two of the anomalies occur beneath the SW and NE ends of theMiddle Atlas and a third one below the Atlantic coast of Morocco mostly offshore (Figure 3). A smaller fastanomaly is present deeper in the transition zone (530 km) between the Rif and eastern Moroccan Mesetaboth of which show weak slow anomalies at these depths (Figure 3).
4. Synthetic Tests
The interpretation of volumetrically small velocity anomalies in teleseismic tomography requires carefulconsideration. Bezada et al. [2013] tentatively interpret the fast anomaly near the top of the transition zoneunder the middle Atlas as delaminated Atlas lithosphere. To gain confidence on the authenticity of thisstructure we conduct a synthetic ‘‘squeezing’’ test.
The first step of our squeezing test is to invert the data under the constraint that no positive anomalies existat depths greater than 200 km, except those directly associated with the Alboran slab (see supporting infor-mation for details). The residuals from this inversion contain any delays that can’t be explained by the con-strained model. These unexplained delays are used as data for a second inversion. If a deep fast anomalyunder the Middle Atlas is required by the data, the second inversion should reproduce it.
As expected, in the ‘‘squeezed’’ model there are no positive anomalies between 350 and 450 km depth inthe region under the Middle Atlas and Moroccan Meseta (Figure 4). The slow anomalies to the south of thestudy area at these depths are largely unchanged except for small amplitude and geometry differences.
After inverting the residuals from the squeezed case, the only prominent anomaly at 390 km depth in theresulting model is SW-NE trending fast anomaly (�1.5%) located under the Middle Atlas (Figure 4). This testindicates the fast velocity anomaly that underlies the Middle Atlas near the top of the mantle transitionzone is required in order to fit portions of the data. Given this information and the location of the anomalyin correspondence with important surface and subsurface features, we conclude that this is a real featureand not an artifact created by the inversion.
The slow velocities surrounding the Alboran slab are a prominent feature in our model. Since slow rimsaround fast anomalies are a common artifact of seismic tomography inversions, we verify that this is not
Geochemistry, Geophysics, Geosystems 10.1002/2013GC005059
BEZADA ET AL. VC 2014. American Geophysical Union. All Rights Reserved. 978

the origin of our anomalies with a second synthetic test. The prescribed velocity model for this test consistsexclusively of a fast anomaly that simulates the Alboran slab. After eight iterations, the inversion recoversthe geometry of the prescribed anomaly very well. While there is a faint, thin rim of low velocities aroundthe fast anomaly, this artifact is much smaller in amplitude and lateral extent than the anomalies we imagein our final model (Figure 5). We conclude that the slow anomalies around the Alboran slab are an authenticfeature and not an artifact of the inversion procedure.
10ο W 8ο W 6ο W 4ο W 2ο W 29ο N
31ο N
33ο N
35ο N
37ο N
10ο W 8ο W 6ο W 4ο W 2ο W 29ο N
31ο N
33ο N
35ο N
37ο N
10ϒ W 8ϒ W 6ϒ W 4ϒ W 2ϒ W 29ϒ N
31ϒ N
33ϒ N
35ϒ N
37ϒ N
10ϒ W 8ϒ W 6ϒ W 4ϒ W 2ϒ W 29ϒ N
31ϒ N
33ϒ N
35ϒ N
37ϒ N
10ο W 8ο W 6ο W 4ο W 2ο W 29ο N
31ο N
33ο N
35ο N
37ο N
10ο W 8ο W 6ο W 4ο W 2ο W 29ο N
31ο N
33ο N
35ο N
37ο N
10ο W 8ο W 6ο W 4ο W 2ο W 29ο N
31ο N
33ο N
35ο N
37ο N
10ο W 8ο W 6ο W 4ο W 2ο W 29ο N
31ο N
33ο N
35ο N
37ο N
10ο W 8ο W 6ο W 4ο W 2ο W 29ο N
31ο N
33ο N
35ο N
37ο N
10ο W 8ο W 6ο W 4ο W 2ο W 29ο N
31ο N
33ο N
35ο N
37ο N
10ο W 8ο W 6ο W 4ο W 2ο W 29ο N
31ο N
33ο N
35ο N
37ο N
10ο W 8ο W 6ο W 4ο W 2ο W 29ο N
31ο N
33ο N
35ο N
37ο N
−3
−2
−1
0
1
2
3
125 km
230 km
435 km
310 km
390 km
195 km
530 km
90 km 160 km
50 km 60 km 75 km
Vp
an
om
aly
(%
)
Figure 3. Horizontal slices through the final model at different depths as indicated on each plot. Volcanic centers and tectonic boundariesfrom Figure 1a are overlaid on the model slices for spatial reference. Aside from the Alboran slab, above 160 km the model is dominatedby slow anomalies; below 300 km, spatially small fast anomalies occur beneath the Middle Atlas region.
Geochemistry, Geophysics, Geosystems 10.1002/2013GC005059
BEZADA ET AL. VC 2014. American Geophysical Union. All Rights Reserved. 979

The slow features at lithospheric depths in our model do not connect to the Atlantic in the west or underliethe Siroua and Sahro fields in the Anti-Atlas as was inferred by gravity and geochemical studies [Missenardet al., 2006; Duggen et al., 2009] and might be expected given the location of the magmatic centers. Weconduct a third test to investigate if the absence of this anomaly could be a product of inadequate cover-age in the southern end of the array.
In this test we generate synthetic delays from a prescribed model that incorporates a 200 km wide, 5% slowcorridor that connects the Middle Atlas anomaly with the Atlantic, following the trend defined by Missenardet al. [2006] (Figures 1 and 6). When we invert these delays, the resulting model successfully recovers thefull extent of the prescribed slow corridor, including the areas where the real tomography image does notshow slow anomalies (Figure 6). The results of this test suggest that, rather surprisingly, the lithosphereunder the Anti-Atlas is not thinned.
−3
−2
−1
0
1
2
3
10ο W 8ο W 6ο W 4ο W 2ο W 29ο N
31ο N
33οο N
35ο N
37ο N
100
200
300
400
500
600
−200 −100 0 100 200
NNE SSW
−200 −100 0 100 2000
1
2
3 HAWMM MA
10ϒ W 8οϖϖ W 6ο W 4ο W 2ο W 29ο N
31ο N
33ο N
35ο N
37ο N
−2
−1.5
−1
−0.5
0
0.5
1
1.5
2
10ο W 8ο W 6ο W 4ο W 2ο W 29ο N
31ο N
33ο N
35ο N
37ο N
Ele
v. (
km
)D
ep
th (
km
)
Distance (km)
Vp
an
om
aly
(%
)V
p a
no
ma
ly (
%)
A B
C D
Figure 4. Results of the squeezing test. (a) Horizontal slice through final velocity model at 390 km depth. (b) Horizontal slice through con-strained velocity model at 390 km depth, note the absence of fast anomalies other than those related to the Alboran slab. (c) Horizontalslice through residual model at 390 km depth; we recover a fast anomaly beneath the Middle Atlas from the residuals of the constrainedinversion. (d) Vertical cross section through the residual model and corresponding elevation profile (location indicated with a dashed linein Figure 4c). The fast anomaly at �400 km depth is located slightly south and east of the Middle Atlas. WMM––western Moroccan Meseta;MA––Middle Atlas; HA––High Atlas. Note the different color scale for the top and bottom plots. Volcanic centers and tectonic boundariesfrom Figure 1a are overlaid on the model slices for spatial reference.
Geochemistry, Geophysics, Geosystems 10.1002/2013GC005059
BEZADA ET AL. VC 2014. American Geophysical Union. All Rights Reserved. 980

5. Interpretation of Structures
There are three main structures in our velocity model that are relevant to the mantle-driven uplift in theMoroccan Atlas region.
At shallow sub-crustal depths, low seismic velocities are localized under the Middle Atlas and the centralHigh Atlas (Figure 3). In their shallowest expression, these structures correlate spatially with the mountainranges as well as the areas of thinnest lithosphere inferred from multi-parameter geophysical inversion
10ο W 8ο W 6ο W 4ο W 2ο W 29ο N
31ο N
33ο N
35ο N
37ο N
Observed, Depth = 90km
10ο W 8ο W 6ο W 4ο W 2ο W 29ο N
31ο N
33ο N
35ο N
37ο N
Synthetic - Prescribed, Depth = 90km
10ο W 8ο W 6ο W 4ο W 2ο W 29ο N
31ο N
33ο N
35ο N
37ο N
Synthetic - Recovered, Depth = 90km
−3 −2 −1 0 1 2 3
Vp anomaly (%)
A B C
Figure 6. Results of synthetic test. The three plots show horizontal slices at 90 km depth from (a) the final tomography model, (b) the prescribed velocity model with a through-goingthinned-lithosphere corridor connecting to the Atlantic, and (c) the model recovered by the inversion of delays generated from the prescribed model. Note that the inversion of the syn-thetic delays successfully recovers the entire lithospheric corridor, including the zone beneath the Anti-Atlas that is absent from the final tomography model. Volcanic centers and tec-tonic boundaries from Figure 1a are overlaid on the model slices for spatial reference.
8ο W 6ο W 4ο W 2ο W 0ο 32 ο N
34ο N
36ο N
38ο N
40ο N
8ο W 6ο W 4ο W 2ο W 0ο 32ο N
34ο N
36ο N
38ο N
40ο N
8ο W 6ο W 4ο W 2ο W 0ο 32ο N
34ο N
36ο N
38ο N
40ο N
−3 −2 −1 0 1 2 3 −2 −1 0 1 2
Observed, Depth =125 km Synthetic - Prescribed, Depth = 125 km Synthetic - Recovered, Depth = 125 km
Vp anomaly (%) Vp anomaly (%)
A B C
Figure 5. Results of synthetic test. The three plots show horizontal slices at 125 km depth from (a) the final tomography model, (b) the prescribed velocity model with only a fast velocityslab, and (c) the model recovered by the inversion of delays generated from the prescribed model. Note that artificial slow anomalies located around the fast slab in the recovered modelare much smaller in amplitude and extent than the slow anomalies in the final tomography model.
Geochemistry, Geophysics, Geosystems 10.1002/2013GC005059
BEZADA ET AL. VC 2014. American Geophysical Union. All Rights Reserved. 981
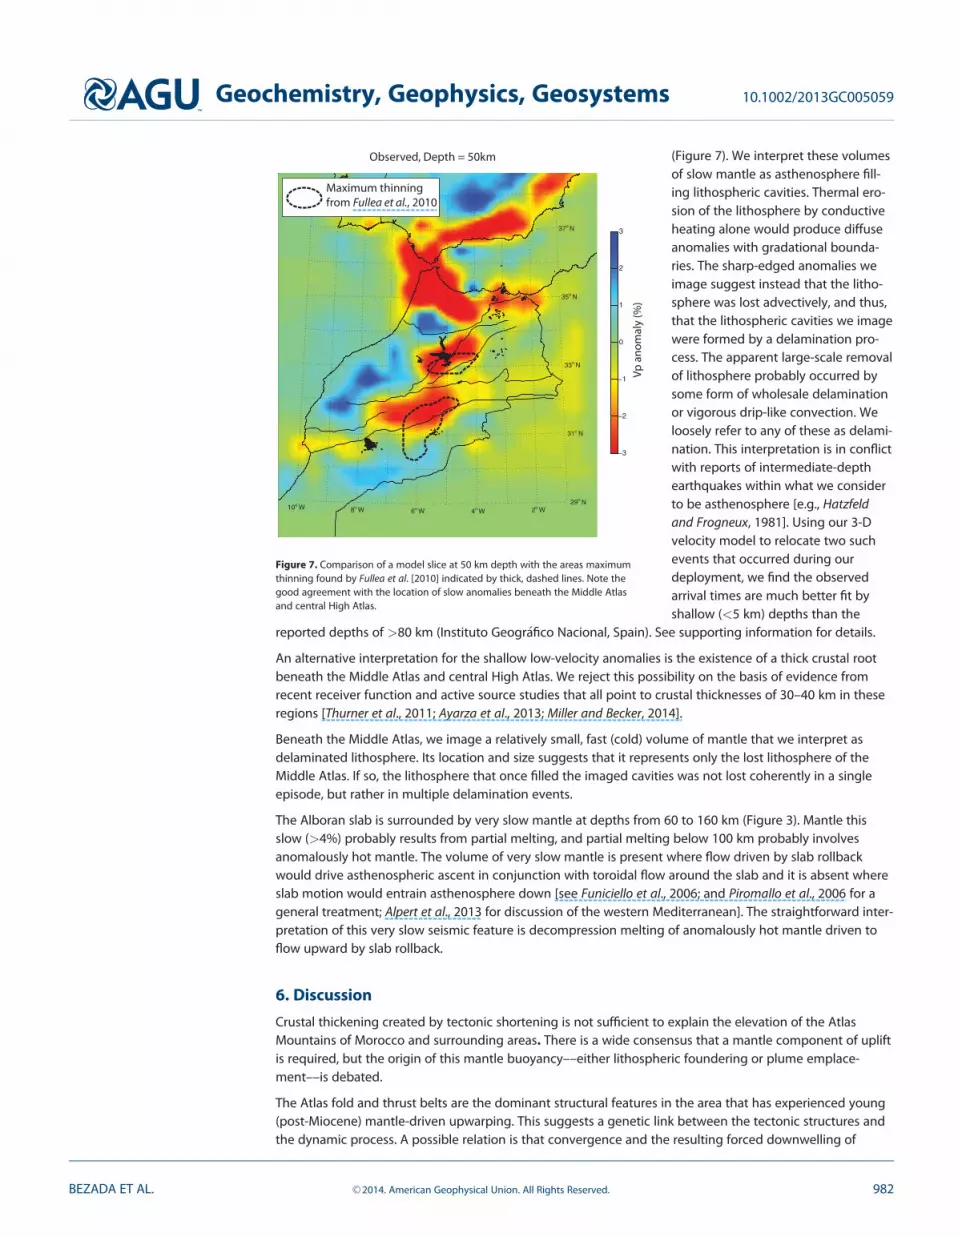
(Figure 7). We interpret these volumesof slow mantle as asthenosphere fill-ing lithospheric cavities. Thermal ero-sion of the lithosphere by conductiveheating alone would produce diffuseanomalies with gradational bounda-ries. The sharp-edged anomalies weimage suggest instead that the litho-sphere was lost advectively, and thus,that the lithospheric cavities we imagewere formed by a delamination pro-cess. The apparent large-scale removalof lithosphere probably occurred bysome form of wholesale delaminationor vigorous drip-like convection. Weloosely refer to any of these as delami-nation. This interpretation is in conflictwith reports of intermediate-depthearthquakes within what we considerto be asthenosphere [e.g., Hatzfeldand Frogneux, 1981]. Using our 3-Dvelocity model to relocate two suchevents that occurred during ourdeployment, we find the observedarrival times are much better fit byshallow (<5 km) depths than the
reported depths of >80 km (Instituto Geogr�afico Nacional, Spain). See supporting information for details.
An alternative interpretation for the shallow low-velocity anomalies is the existence of a thick crustal rootbeneath the Middle Atlas and central High Atlas. We reject this possibility on the basis of evidence fromrecent receiver function and active source studies that all point to crustal thicknesses of 30–40 km in theseregions [Thurner et al., 2011; Ayarza et al., 2013; Miller and Becker, 2014].
Beneath the Middle Atlas, we image a relatively small, fast (cold) volume of mantle that we interpret asdelaminated lithosphere. Its location and size suggests that it represents only the lost lithosphere of theMiddle Atlas. If so, the lithosphere that once filled the imaged cavities was not lost coherently in a singleepisode, but rather in multiple delamination events.
The Alboran slab is surrounded by very slow mantle at depths from 60 to 160 km (Figure 3). Mantle thisslow (>4%) probably results from partial melting, and partial melting below 100 km probably involvesanomalously hot mantle. The volume of very slow mantle is present where flow driven by slab rollbackwould drive asthenospheric ascent in conjunction with toroidal flow around the slab and it is absent whereslab motion would entrain asthenosphere down [see Funiciello et al., 2006; and Piromallo et al., 2006 for ageneral treatment; Alpert et al., 2013 for discussion of the western Mediterranean]. The straightforward inter-pretation of this very slow seismic feature is decompression melting of anomalously hot mantle driven toflow upward by slab rollback.
6. Discussion
Crustal thickening created by tectonic shortening is not sufficient to explain the elevation of the AtlasMountains of Morocco and surrounding areas. There is a wide consensus that a mantle component of upliftis required, but the origin of this mantle buoyancy––either lithospheric foundering or plume emplace-ment––is debated.
The Atlas fold and thrust belts are the dominant structural features in the area that has experienced young(post-Miocene) mantle-driven upwarping. This suggests a genetic link between the tectonic structures andthe dynamic process. A possible relation is that convergence and the resulting forced downwelling of
10ο W 8ο W 6ο W 4ο W 2ο W 29ο N
31ο N
33ο N
35ο N
37ο N
−3
−2
−1
0
1
2
3
Vp
an
om
aly
(%
)
Observed, Depth = 50km
Maximum thinning
from Fullea et al., 2010
Figure 7. Comparison of a model slice at 50 km depth with the areas maximumthinning found by Fullea et al. [2010] indicated by thick, dashed lines. Note thegood agreement with the location of slow anomalies beneath the Middle Atlasand central High Atlas.
Geochemistry, Geophysics, Geosystems 10.1002/2013GC005059
BEZADA ET AL. VC 2014. American Geophysical Union. All Rights Reserved. 982

mantle lithosphere initiated delamination of a mantle root beneath the fold and thrust belt [e.g., Ramdani,1998; Duggen et al., 2009]. Some authors, however, point to the facts that shortening across the Atlas issmall, that uplift extends into areas that experienced no shortening (e.g., the Moroccan Meseta and Anti-Atlas), and that the eastern Atlas experienced a similar shortening history but show no evidence for mantle-derived uplift [Teixell et al., 2005; Missenard et al., 2006; Frizon de Lamotte et al., 2009; Fullea et al., 2010].These observations, they argue, make it unlikely that lithospheric shortening is the sole cause ofdelamination.
Thermal erosion of the lithosphere by hot, upwelling mantle stands as an alternative explanation for sub-crustal buoyancy. The plume-like chemistry of the young lavas [Duggen et al., 2009] suggests the presenceof anomalously hot asthenosphere in the region, perhaps related to the Canary hotspot [Duggen et al.,2009] or to different regional [Ebinger and Sleep, 1998; Lustrino and Wilson, 2007] or local [Missenard andCadoux, 2012] upwellings.
With sound evidence supporting each of these possibilities, and with the aid of upper mantle seismic imag-ing, we prefer an explanation that incorporates elements of each hypothesis. Based on our imaging, weinfer a patchy set of recent delaminations in a region underlain by unusually hot asthenosphere.
We propose that the presence of hot mantle enabled the foundering of intrinsically unstable lithospherefrom beneath the Middle Atlas and central High Atlas. Delamination proceeded in a discontinuous, piece-wise fashion and did not result in the throughgoing removal of the entire Moroccan Atlas lithosphere asenvisioned by Duggen et al. [2009]. Each of the processes under consideration (lithospheric shortening andimpingement of hot mantle) would enhance lithospheric instability, especially in areas where astheno-sphere upflow generated melt that would freeze as eclogite within the lithosphere, thus tending to makethe process self-sustaining.
The most conspicuous delamination event occurred beneath the Middle Atlas. There, we image a large vol-ume of very slow mantle extending up to near the Moho, indicating a focused area of mantle upwelling.The only well-resolved structure that appears to be delaminated lithosphere is the relatively small high-velocity body residing at �400 km depth, also beneath the Middle Atlas, and both the shallow slow anddeep fast anomalies underlie a region of vigorous recent magmatism (Figure 3). This volume of delaminatedlithosphere is too small to account for all the lithosphere that would have occupied the imaged cavities(Figures 3 and 4). Thus the Middle Atlas event seems to represent only the most recent delamination.
Delamination under the High Atlas may have occurred in a similar manner to the Middle Atlas delaminationbut at an earlier time, or it may have proceeded in a more progressive fashion: for instance, lithospherefoundering could have started in the central High Atlas and progressed east and west through a series ofsmall-scale downwellings rather than the wholesale delamination of a coherent body as seems to be thecase in the Middle Atlas. In either of these cases, the lost lithosphere of the High Atlas would be more diffi-cult to image given that it would deeper in the mantle, broken up into smaller pieces, or both.
The inferences made above are based largely on robust observations of uplift, local tectonic history andupper mantle seismic imaging. To address the underlying causes of delamination, we consider the regionalsetting and published results of geodynamic modeling. Several factors combined to make the Atlas litho-sphere unstable and more vulnerable to delamination than the surrounding areas. Tectonic shorteningwould have produced some lithospheric thickening, forcing lithospheric protrusions into the asthenospherethat would tend to make these locations the sites of initial foundering, and thereby giving a structure to thedownwelling. Perhaps most important, eclogite loading associated with basaltic magmatism would havecreated a compositionally dense lithosphere [Elkins-Tanton and Hager, 2000; Krystopowicz and Currie, 2013].Early basalt intrusion probably occurred during Mesozoic rifting beneath the grabens that would becomethe Cenozoic Atlas mountain ranges. Further eclogite loading during the Eocene magmatism (Figure 1a,purple rectangles) would have contributed to densifying the Atlas lithosphere, as would magmatism thatoccurred in the last �11 m.y. (Figure 1a, black rectangles). The younger magmatism may have helped initi-ate convective instability. In addition to these destabilizing processes, presence of anomalously hotasthenosphere would have further increased the instability of Atlas lithosphere. Unusually hot mantleseems to underlie much of the circum-Mediterranean region [Spakman and Wortel, 2004] and probably isinvolved in the production of anorogenic volcanism throughout the region [Lustrino and Wilson, 2007].While the origin of the hot asthenosphere is speculative, various possible sources include diapiric
Geochemistry, Geophysics, Geosystems 10.1002/2013GC005059
BEZADA ET AL. VC 2014. American Geophysical Union. All Rights Reserved. 983

upwellings [Lustrino and Wilson, 2007], the north and east Africa domes [Ebinger and Sleep, 1998] and theCanary plume [Duggen et al., 2009].
The dynamics of mantle flow around the retreating Alboran slab helped focus upwelling mantle beneaththe Middle Atlas, where the imaged low-velocity anomalies are stronger (Figure 3). Toroidal flow around theslab seems to have directed hot mantle toward the Middle Atlas, and the vertical component of this slab-driven flow is expected to be strongest beneath the region of the Middle Atlas. The onset of delaminationmay have then helped to organize the mantle upwelling, further focusing it there.
Delamination of the Atlas lithosphere provides a means of understanding much of the dynamic uplift inMorocco as well as an interesting example of wholesale lithosphere loss in a mildly contractional orogen.The uplift of the Anti Atlas domain and the magmatism in its northern margin remain enigmatic, as there isno clear indication from the velocity structure or the mantle anisotropy of a thinned lithosphere [Milleret al., 2013; Palomeras et al., 2014, this study]. Edge-driven convection, perhaps as a south-propagatingdelamination or drip, is a possibility [Missenard and Cadoux, 2012]. Regardless, the young uplift and magma-tism, and the occurrence of low seismic velocities penetrating a volume of what is thought to be Archeancraton (Figure 3), appear to document the destruction of parts of this cratonic lithosphere.
7. Conclusions
We image a strongly heterogeneous mantle structure in the upper few hundred kilometers beneathMorocco, which indicates a vigorously active uppermost mantle (Figure 3). However, the structure is com-plex. We interpret the young uplift of Morocco as due to a series of lithospheric delaminations of an intrinsi-cally unstable Atlas-area lithosphere that currently is largely underlain by hot, plume-like asthenosphere,the Atlas lithosphere having been destabilized by a variety of mechanisms acting in different regions.Delamination resulted in the formation of lithospheric cavities, but not a continuous sublithospheric corri-dor from the Atlantic to the Mediterranean (Figures 3 and 6). Intermediate-depth earthquakes reported tohave occurred in these asthenosphere-filled cavities are actually crustal in nature (supporting information).
For the Middle Atlas and eastern Meseta, we attribute the apparent lithospheric cavity, and young magma-tism and uplift, to a delamination of the local lithosphere. We appear to image this lost lithosphere at adepth of �400 km (Figures 3 and 4). The connection between the large volume of slow mantle that nearlysurrounds the Alboran and the slow mantle under the Middle Atlas and eastern Moroccan Meseta (Figure 3)suggests that return flow around the retreating slab helped focus mantle upwelling under this part of theAtlas Mountains. Low velocities beneath the High Atlas from 60 to 125 km suggest a delamination of thislithosphere as well, although the velocities are not as strongly anomalous. This suggests the possibility ofan older (but not old) delamination of this lithosphere or a more slowly progressing delamination style dif-ferent from that of the Middle Atlas. For both of these regions, the lithosphere was made unstable by somecombination of eclogite loading during Mesozoic rifting and Cenozoic magmatism (Figure 1a), and litho-spheric convergence and thickening. Anti-Atlas uplift, with its young magmatism distributed along itsnorthern margin, is more difficult to explain, but perhaps involves edge-driven convection along the marginof the West African Craton.
ReferencesAlpert, L. A., M. S. Miller, T. W. Becker, and A. A. Allam (2013), Structure beneath the Alboran from geodynamic flow models and seismic ani-
sotropy, J. Geophys. Res. Solid Earth, 118, 4265–4277, doi:10.1002/jgrb.50309.Ayarza, P., F. Alvarez-Lobato, A. Teixell, M. Arboleya, E. Teson, M. Julivert, and M. Charroud (2005), Crustal structure under the central High
Atlas Mountains (Morocco) from geological and gravity data, Tectonophysics, 400(1-4), 67–84, doi:10.1016/j.tecto.2005.02.009.Ayarza, P., R. Carbonell, I. Palomeras, A. Levander, A. Teixell, C. A. Zelt, and A. Kchikach (2013), Constraints on the velocity structure and
accommodation of shortening in the Atlas Mountains (Morocco) from travel-time inversion of refraction/wide angle reflection seismic data,Abstract T43B-2655 presented at 2013 Fall Meeting, AGU, San Francisco, Calif., 9–13 Dec.
Beauchamp, W., R. W. Allmendinger, M. Barazangi, A. Demnati, M. E. Alji, and M. Dahmani (1999), Inversion tectonics and the evolution ofthe High Atlas Mountains, Morocco, based on a geological-geophysical transect, Tectonics, 18(2), 163–184, doi:10.1029/1998TC900015.
Bezada, M. J., E. D. Humphreys, D. R. Toomey, M. Harnafi, J. M. D�avila, and J. Gallart (2013), Evidence for slab rollback in westernmost Medi-terranean from improved upper mantle imaging, Earth Planet. Sci. Lett., 368, 51–60, doi:10.1016/j.epsl.2013.02.024.
Calvert, A., E. Sandvol, D. Seber, M. Barazangi, F. Vidal, G. Alguacil, and N. Jabour (2000), Propagation of regional seismic phases (Lg and Sn)and Pn velocity structure along the Africa-Iberia plate boundary zone: Tectonic implications, Geophys. J. Int., 142(2), 384.
Duggen, S., K. Hoernle, F. Hauff, A. Klugel, M. Bouabdellah, and M. Thirlwall (2009), Flow of Canary mantle plume material through a sub-continental lithospheric corridor beneath Africa to the Mediterranean, Geology, 37(3), 283, doi:10.1130/G25426A.1.
AcknowledgmentsWe thank Antonio Teixell and ananonymous reviewer for theirthoughtful reviews. This work isfunded by the PICASSO project (NSFgrant EAR-0808939). The deploymentand data processing for Spanishstations was funded by Consolider-Ingenio 2010 project TOPO-IBERIA(CSD2006-00041) as well as ALERT-ES(CGL2010-19803-C03-02). We wouldlike to thank Driss Elouai for his workdeploying and maintaining thePICASSO stations in Morocco. Wekindly thank Ingo Grevemeyer foraccess to data from the TOPO-MEDOBS deployment as well as ChristineThomas and James Wookey for accessto data from M€unster and Bristolstations in western Morocco.
Geochemistry, Geophysics, Geosystems 10.1002/2013GC005059
BEZADA ET AL. VC 2014. American Geophysical Union. All Rights Reserved. 984

Ebinger, C. J., and N. H. Sleep (1998), Cenozoic magmatism throughout east Africa resulting from impact of a single plume, Nature,395(6704), 788–791, doi:10.1038/27417.
Elkins-Tanton, L., and B. H. Hager (2000), Melt intrusion as a trigger for lithospheric foundering and the eruption of the Siberian floodbasalts, Geophys. Res. Lett., 27(23), 3937–3940, doi:10.1029/2000GL011751.
Ennih, N., and J.-P. Li�egeois (2001), The Moroccan Anti-Atlas: The West African craton passive margin with limited Pan-African activity.Implications for the northern limit of the craton, Precambrian Res., 112(3–4), 289–302, doi:10.1016/S0301-9268(01)00195-4.
Frizon de Lamotte, D., B. Saint Bezar, R. Bracene, and E. Mercier (2000), The two main steps of the Atlas building and geodynamics of thewestern Mediterranean, Tectonics, 19(4), 740–761, doi:10.1029/2000TC900003.
Frizon de Lamotte, D., M. Zizi, Y. Missenard, M. Hafid, M. E. Azzouzi, R. C. Maury, A. Charriere, Z. Taki, M. Benammi, and A. Michard (2008),The atlas system, in Continental Evolution: The Geology of Morocco, edited by A. Michard et al., pp. 133–202, Springer, Berlin.
Frizon de Lamotte, D., P. Leturmy, Y. Missenard, S. Khomsi, G. Ruiz, O. Saddiqi, F. Guillocheau, and A. Michard (2009), Mesozoic and Ceno-zoic vertical movements in the Atlas system (Algeria, Morocco, Tunisia): An overview, Tectonophysics, 475(1), 9–28, doi:10.1016/j.tecto.2008.10.024.
Fullea, J., M. Fernandez, J. C. Afonso, J. Verges, and H. Zeyen (2010), The structure and evolution of the lithosphere-asthenosphere bound-ary beneath the Atlantic-Mediterranean Transition Region, Lithos, 120(1-2), 74–95, doi:10.1016/j.lithos.2010.03.003.
Funiciello, F., M. Moroni, C. Piromallo, C. Faccenna, A. Cenedese, and H. A. Bui (2006), Mapping mantle flow during retreating subduction:Laboratory models analyzed by feature tracking, J. Geophys. Res., 111, B03402, doi:10.1029/2005JB003792.
Gomez, F., R. Allmendinger, M. Barazangi, A. Er-Raji, and M. Dahmani (1998), Crustal shortening and vertical strain partitioning in the Mid-dle Atlas Mountains of Morocco, Tectonics, 17(4), 520–533, doi:10.1029/98TC01439.
Hatzfeld, D., and M. Frogneux (1981), Intermediate depth seismicity in the western Mediterranean unrelated to subduction of oceaniclithosphere, Nature, 292(5822), 443–445, doi:10.1038/292443a0.
Hefferan, K. P., H. Admou, J. A. Karson, and A. Saquaque (2000), Anti-Atlas (Morocco) role in Neoproterozoic Western Gondwana reconstruc-tion, Precambrian Res., 103(1–2), 89–96, doi:10.1016/S0301-9268(00)00078-4.
Jim�enez-Munt, I., M. Fern�andez, J. Verg�es, D. Garcia-Castellanos, J. Fullea, M. P�erez-Gussiny�e, and J. C. Afonso (2011), Decoupled crust-mantle accommodation of Africa-Eurasia convergence in the NW Moroccan margin, J. Geophys. Res., 116, B08403, doi:10.1029/2010JB008105.
Krystopowicz, N. J., and C. A. Currie (2013), Crustal eclogitization and lithosphere delamination in orogens, Earth Planet. Sci. Lett., 361,195–207, doi:10.1016/j.epsl.2012.09.056.
Lustrino, M., and M. Wilson (2007), The circum-Mediterranean anorogenic Cenozoic igneous province, Earth Sci. Rev., 81(1–2), 1–65,doi:10.1016/j.earscirev.2006.09.002.
Miller, M. S., and T. W. Becker (2014), Reactivated lithospheric-scale discontinuities localize dynamic uplift of the Moroccan Atlas Mountains,Geology, 42(1), 35–38, doi:10.1130/G34959.1.
Miller, M. S., A. A. Allam, T. W. Becker, J. F. Di Leo, and J. Wookey (2013), Constraints on the tectonic evolution of the westernmost Mediter-ranean and northwestern Africa from shear wave splitting analysis, Earth Planet. Sci. Lett., 375, 234–243, doi:10.1016/j.epsl.2013.05.036.
Missenard, Y., and A. Cadoux (2012), Can Moroccan Atlas lithospheric thinning and volcanism be induced by edge-driven convection?,Terra Nova, 24(1), 27–33, doi:10.1111/j.1365-3121.2011.01033.x.
Missenard, Y., H. Zeyen, D. Frizon de Lamotte, P. Leturmy, C. Petit, M. S�ebrier, and O. Saddiqi (2006), Crustal versus asthenospheric origin ofrelief of the Atlas Mountains of Morocco, J. Geophys. Res., 111, B03401, doi:10.1029/2005JB003708.
Palomeras, I., S. Thurner, A. Levander, K. Liu, A. Villasenor, R. Carbonell, and M. Harnafi (2014), Finite-frequency Rayleigh wave tomographyof the western Mediterranean: Mapping its lithospheric structure, Geochem. Geophys. Geosyst., 15, 140–160, doi:10.1002/2013GC004861.
Piromallo, C., T. W. Becker, F. Funiciello, and C. Faccenna (2006), Three-dimensional instantaneous mantle flow induced by subduction, Geo-phys. Res. Lett., 33, L08304, doi:10.1029/2005GL025390.
Ramdani, F. (1998), Geodynamic implications of intermediate-depth earthquakes and volcanism in the intraplate Atlas mountains(Morocco), Phys. Earth Planet. Inter., 108, 245–260, doi:10.1016/S0031-9201(98)00106-X.
Seber, D., M. Barazangi, B. A. Tadili, M. Ramdani, A. Ibenbrahim, and D. Ben Sari (1996), Three-dimensional upper mantle structure beneaththe intraplate Atlas and interplate Rif mountains of Morocco, J. Geophys. Res., 101(B2), 3125–3138, doi:10.1029/95JB03112.
Spakman, W., and R. Wortel (2004), A tomographic view on Western Mediterranean geodynamics, TRANSMED Atlas Mediterr. Reg. CrustMantle, 31–52.
Teixell, A., M.-L. Arboleya, M. Julivert, and M. Charroud (2003), Tectonic shortening and topography in the central High Atlas (Morocco), Tec-tonics, 22(5), 1051, doi:10.1029/2002TC001460.
Teixell, A., P. Ayarza, H. Zeyen, M. Fernandez, and M. Arboleya (2005), Effects of mantle upwelling in a compressional setting: The AtlasMountains of Morocco, Terra Nova, 17(5), 456–461, doi:10.1111/j.1365-3121.2005.00633.x.
Teixell, A., G. Bertotti, D. F. de Lamotte, and M. Charroud (2009), The geology of vertical movements of the lithosphere: An overview, Tecto-nophysics, 475(1), 1–8, doi:10.1016/j.tecto.2009.08.018.
Thurner, S., I. Palomeras, and A. Levander (2011), PICASSSO Ps Receiver Function Analysis of the Lithospheric Structure Beneath the WesternMediterranean, Abstract T43E-2406 presented at 2011 Fall Meeting, AGU, San Francisco, Calif., 5–9 Dec.
Zeyen, H., and M. Fern�andez (1994), Integrated lithospheric modeling combining thermal, gravity, and local isostasy analysis: Applicationto the NE Spanish Geotransect, J. Geophys. Res., 99(B9), 18,089–18,102, doi:10.1029/94JB00898.
Geochemistry, Geophysics, Geosystems 10.1002/2013GC005059
BEZADA ET AL. VC 2014. American Geophysical Union. All Rights Reserved. 985


