Embed Size (px)
Citation preview
Electronic copy available at: http://ssrn.com/abstract=2568468
469C Bukit Timah Road
Oei Tiong Ham Building
Singapore 259772
Tel: (65) 6516 6134 Fax: (65) 6778 1020
Website: www.lkyspp.nus.edu.sg
Lee Kuan Yew School of Public Policy
Working Paper Series
Pointing Towards Policy Success?:
Water Policy Indicators in Practice
Janet S. Cuenca Lee Kuan Yew School of Public Policy
National University of Singapore Email: [email protected]
&
Michael P. Howlett Lee Kuan Yew School of Public Policy
National University of Singapore and
Department of Political Science Simon Fraser University Burnaby, BC, Canada Email: [email protected]
February 12, 2015
Working Paper No.: LKYSPP 15-15
Electronic copy available at: http://ssrn.com/abstract=2568468
2
Abstract
Drawing up policy options is a complex activity which involves defining and weighing the
merits and risks of various alternatives. In its modern version, this usually involves formal
policy analysis or “policy appraisal”; that is, policy work specifically undertaken to generate
and evaluate policy options or alternative course of actions to address problems or issues on a
policy agenda. Indicators have been demonstrated to have powerful influence on policies and
societies in general. In this light, the current research aims to conduct a case study of the role
of policy indicators in water policy formulation with the end in view of determining their
utilization and impact. The paper document the level and type of actual use of water policy
indicator; assesses the relevance of the use and influence of indicators in policy formulation
and identifies issues surrounding the use of indicators in policy formulation. In particular, it
looks into the role of various water policy indicators such as water poverty index, water
scarcity index, index of drinking water adequacy, Falkenmark indicator, and water footprint,
among others. The research addresses whether indicators influence policy formulation in this
sector, how they do so and under which circumstances.
Introduction: Policy Indicators and Policy Formulation
Drawing up policy options is a complex activity which involves defining and
weighing the merits and risks of various alternatives. In its modern version, this usually
involves formal policy analysis or “policy appraisal”; that is, policy work specifically
undertaken to generate and evaluate policy options or alternative course of actions to address
problems or issues on a policy agenda (Howlett et al. 2009).
Policy appraisal in this sense is a very specific type of policy formulation, which
involves the use of analytical methods (i.e., either formal or informal) to appraise policy
relevant knowledge or evidence, engaging policy makers and analysts in dialogue about the
Electronic copy available at: http://ssrn.com/abstract=2568468
3
nature of policy problems and solutions, and identifying and assessing the impacts of
different policy options. As such, as Turnpenny et al. (2013) note, policy appraisal is
concerned with “how evidence is collected, marshalled, communicated, digested and used.”
In particular, they highlight the role played by policy appraisal and its needs in government
knowledge collection, review, and utilization processes.
But what kinds of knowledge or evidence are used and by whom in this process is
unclear (Feldman 1989; Pawson 2002; Sanderson 2009, Nutley et al 2007). Various studies,
for example, have shown that expert knowledge has more indirect influence on policymakers
and other stakeholders by shaping their frameworks of thought, promoting individual and
collective learning, and “serving as ‘ammunition’ in political battles for power and influence”
(Weiss 1977 and 1986; Whiteman 1985, Landry et al 2003; Head et al 2014). While the use
of reports and other documents is uncertain, however, the role played by indicators and
measures in formulation and appraisal activity, as well as in other areas such as agenda
setting, has been highlighted in the policy literature (Kingdon 1984).
Indicators have been demonstrated to have powerful influence on societies in general,
but also specifically in the case of policy-making and policy appraisal. As Lehtonen (2009)
noted, research on the role of social science in policymaking showed that “presenting
information in the form of social statistics enhances its use.” However, he also noted that
while researchers and practitioners have given much attention to the technical details of
indicator design much less has been spent on the role of indicators in policymaking. In this
regard, he argues that policymakers’ direct and instrumental use of indicators, as is the case
with the other sources of knowledge cited above, may well “rather an exception than a rule.”
4
In this light, the current research conducts a case study of the role of policy indicators
in water policy formulation with the end of determining their utilization and impact in this
sector. In particular, it looks into the role of various water policy indicators such as the water
poverty index, water scarcity index, index of drinking water adequacy, Falkenmark indicator,
and water footprint, among other measures prevalent in the field. The research addresses the
following questions:
1. Document the level and type of actual use of water policy indicators
2. Assess the relevance of the use and influence of indicators in policy formulation
3. Identify issues surrounding the use of indicators in policy formulation
In particular it sets out to answer:
1. Do these indicators influence policy formulation?
2. If so, how they do so, and
3. Under which circumstances?
The paper is organized as follows: Section II provides the conceptual/analytical
framework adopted in the case study. Section III presents the case study on water policy
indicator use. Section IV examines the role of indicators based on the arguments put forward
by various scholars in the literature. The paper ends with the concluding remarks in Section
V.
Existing Research on the Policy Use of Indicators
In his pathbreaking 2009 work, Lehtonen’s (2009) developed an analytical framework
for assessing the policy role of indicators developed as part of the European-based Policy
Influence of Indicators (POINT) Project1, begun in 2008 to analyse the role of environmental
and sustainable development indicators in policymaking. The key questions the project
addressed are how such indicators were actually used in policy processes and whether they
5
had any influence on policy outcomes (Frederiksen et al. n.d.). In particular, the project
examined “ways in which indicators are used in practice, to what extent and in what way
indicators actually influence, support, or hinder policy and decision-making processes, and
what could be done to increase the chances that indicators will play a positive role in such
processes.” The Project’s overarching tasks2 were to:
Design a coherent framework of analysis and generate hypotheses on the use and
influence of indicators (i.e., environment and sustainable development indicators) in
European policies that are geared towards sustainability, and to
Test the analytical framework and the hypotheses on specific cases of sector
integration and sustainability indicators (i.e., indicators of integration of
environmental concerns into sectoral policies [e.g., agriculture, energy and transport];
indicators designed to follow up national sustainable development strategies; and
composite indicators [indices] of sustainability and well-being).
In Lehtonen (2009)’s framework, indicators are presented as a formal assessment
technology. As such, they are expected to be used in monitoring policy performance and
fostering accountability.
This framework is anchored on expectations of analysts and policy-makers with
respect to the roles of expert knowledge in decision-making, which are enumerated in
Lehtonen (2009) as threefold:
Instrumental role – information put to use for specific decisions or requested by
decision-makers for specific projects;
Conceptual or “enlightenment” role – knowledge provides broad information base for
decisions, by providing conceptual frameworks and fostering different types of
learning; and
Political role – justifying or legitimizing policies, decisions and actors, or postponing
actual decisions.3
6
Lehtonen (2009) adopts the use of “influence” as the organizing concept in his work,
instead of the term “use,” following the approach used by Henry and Mark (2003).4 It is
noteworthy that Lehtonen (2013) points out that a key lesson from indicator literature is the
importance of this distinction. As he notes, “more use does not necessarily imply more
influence, and more influence does not automatically equal ‘social betterment’.”
Lehtonen’s Framework
The focus of the framework Lehtonen developed for the POINT project is on which
types of influence indicators have on policy. This concerns identifying the ways in which
indicators influence policy, including the unintended types of influence and situations of
“non-use.” – and how to explain that (lack of) influence. This involves reference to various
factors such as indicator quality, user characteristics, and the political and institutional
context of indicator development and use.
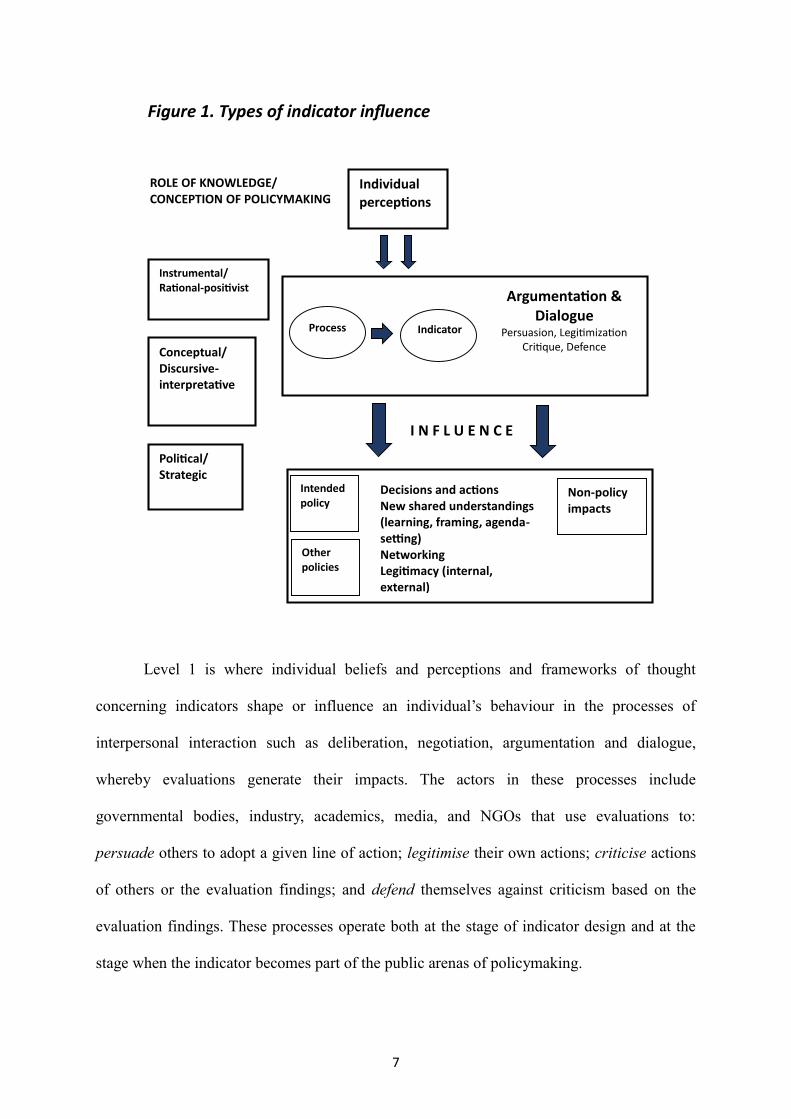
Figure 1 presents the framework for analysing the types of influence that indicators
have on policymaking. The framework consists of two levels of influence.
7
Level 1 is where individual beliefs and perceptions and frameworks of thought
concerning indicators shape or influence an individual’s behaviour in the processes of
interpersonal interaction such as deliberation, negotiation, argumentation and dialogue,
whereby evaluations generate their impacts. The actors in these processes include
governmental bodies, industry, academics, media, and NGOs that use evaluations to:
persuade others to adopt a given line of action; legitimise their own actions; criticise actions
of others or the evaluation findings; and defend themselves against criticism based on the
evaluation findings. These processes operate both at the stage of indicator design and at the
stage when the indicator becomes part of the public arenas of policymaking.
Figure 1. Types of indicator influence
ROLE OF KNOWLEDGE/ CONCEPTION OF POLICYMAKING
Individual perceptions
Instrumental/ Rational-positivist
Conceptual/ Discursive- interpretative
Political/ Strategic
Process Indicator
Argumentation & Dialogue
Persuasion, Legitimization Critique, Defence
Decisions and actions New shared understandings (learning, framing, agenda-setting) Networking Legitimacy (internal, external)
Intended policy
Other policies
Non-policy impacts
I N F L U E N C E
8
Level 2 concerns influence at the individual or collective level. The focus of the
framework is on influence at collective level, however, rather than the individual level. Such
influence can be on the policies in question (i.e., the policies for which the indicators have
been designed/intended policies), on other policies (e.g. energy indicators’ influence on
environmental policy), and on society at large (e.g. trust, and legitimacy of public authorities,
quality of democracy).
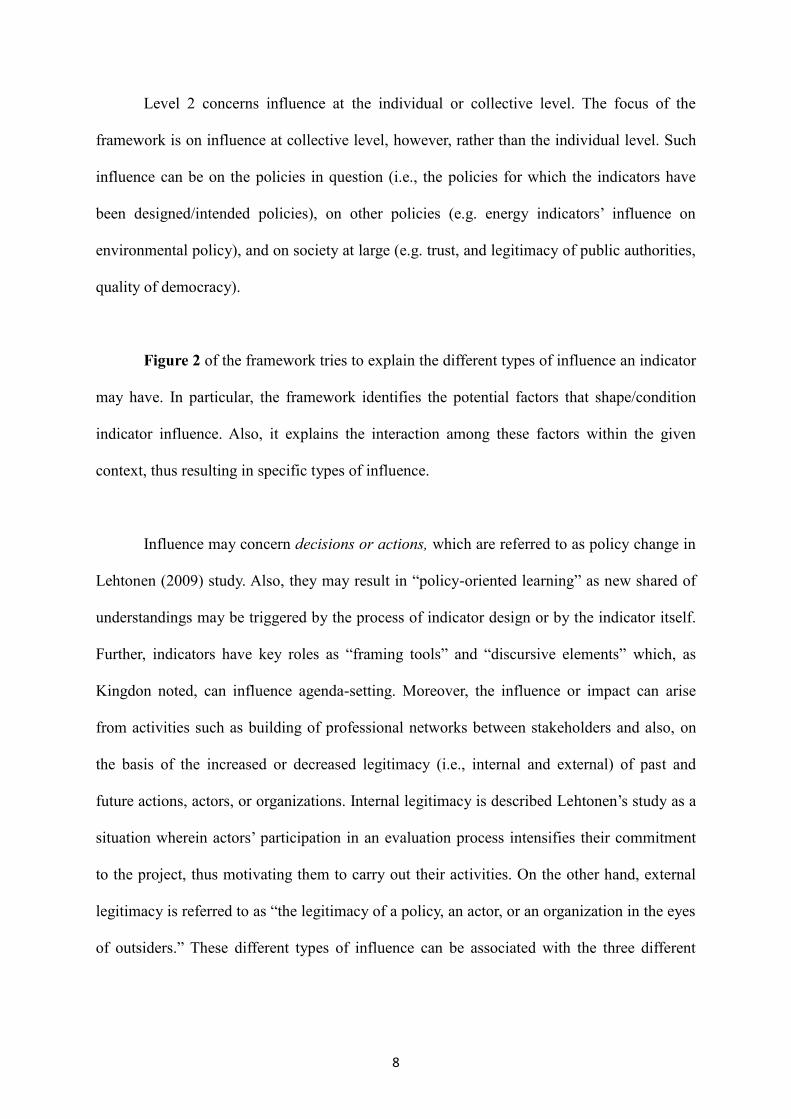
Figure 2 of the framework tries to explain the different types of influence an indicator
may have. In particular, the framework identifies the potential factors that shape/condition
indicator influence. Also, it explains the interaction among these factors within the given
context, thus resulting in specific types of influence.
Influence may concern decisions or actions, which are referred to as policy change in
Lehtonen (2009) study. Also, they may result in “policy-oriented learning” as new shared of
understandings may be triggered by the process of indicator design or by the indicator itself.
Further, indicators have key roles as “framing tools” and “discursive elements” which, as
Kingdon noted, can influence agenda-setting. Moreover, the influence or impact can arise
from activities such as building of professional networks between stakeholders and also, on
the basis of the increased or decreased legitimacy (i.e., internal and external) of past and
future actions, actors, or organizations. Internal legitimacy is described Lehtonen’s study as a
situation wherein actors’ participation in an evaluation process intensifies their commitment
to the project, thus motivating them to carry out their activities. On the other hand, external
legitimacy is referred to as “the legitimacy of a policy, an actor, or an organization in the eyes
of outsiders.” These different types of influence can be associated with the three different
9
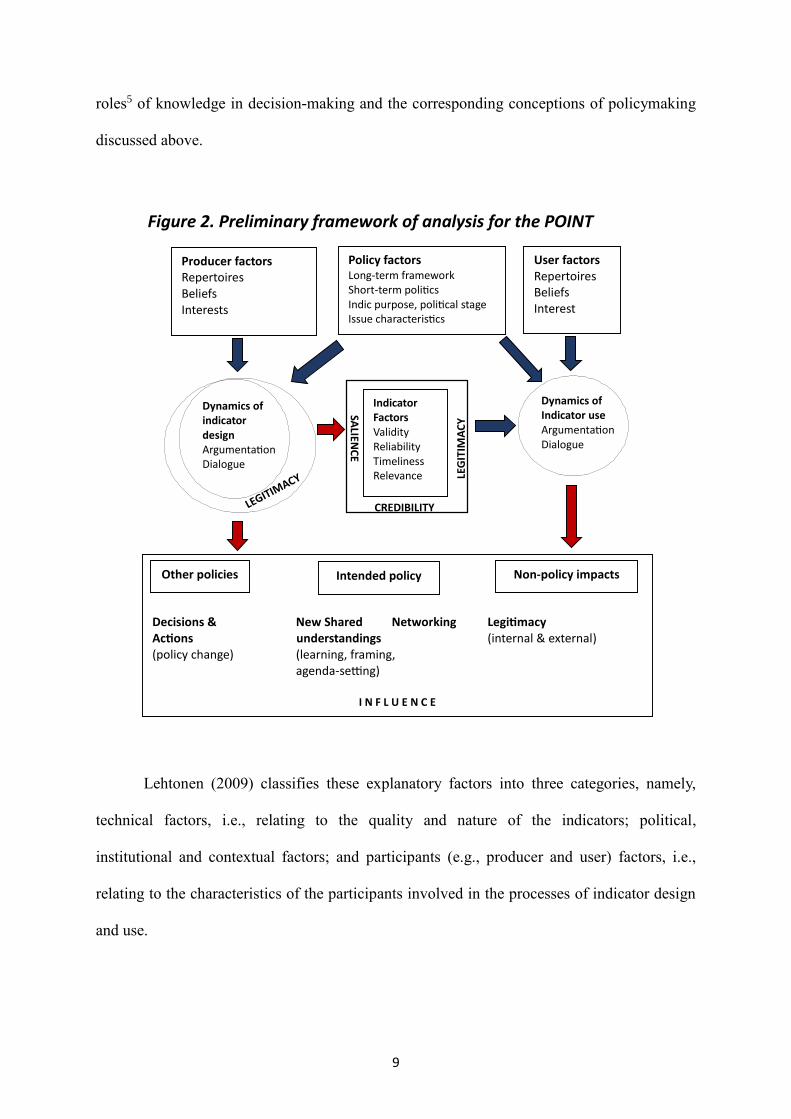
roles5 of knowledge in decision-making and the corresponding conceptions of policymaking
discussed above.
Lehtonen (2009) classifies these explanatory factors into three categories, namely,
technical factors, i.e., relating to the quality and nature of the indicators; political,
institutional and contextual factors; and participants (e.g., producer and user) factors, i.e.,
relating to the characteristics of the participants involved in the processes of indicator design
and use.
Figure 2. Preliminary framework of analysis for the POINT
project Producer factors Repertoires Beliefs Interests
Policy factors Long-term framework Short-term politics Indic purpose, political stage Issue characteristics
User factors Repertoires Beliefs Interest
Dynamics of indicator design Argumentation Dialogue
Indicator Factors Validity Reliability Timeliness Relevance LE
GIT
IMA
CY SA
LIENC
E
CREDIBILITY
Dynamics of Indicator use Argumentation Dialogue
Decisions & New Shared Networking Legitimacy Actions understandings (internal & external) (policy change) (learning, framing, agenda-setting)
I N F L U E N C E
Other policies Intended policy Non-policy impacts
10
User and producer factors include factors that relate to the characteristics/attributes of
people involved in processes such as professional and educational background, institutional
position, motivations, expectations/belief systems, mental models, and cognitive frames. He
argues that although indicators have explicit and “official” purposes, they can be viewed
differently by various stakeholders because of the differences in belief systems and cognitive
frames or repertoires (i.e., stabilized ways of thinking and acting on the individual level or
stabilized codes, operations, and technology on other levels).
Policy factors refer to wide range of elements relating to political and institutional
contexts. These include long-term “framework conditions” including the national policy style
and culture; policymaking structures; socio-economic conditions; level of development of
and changes in politico-administrative structures; and the position of the potential change
agents in the national policymaking structures. They also include short-term changes such as
changes in politics and systemic governing coalitions; changes in socio-economic conditions
and technology; and policy decisions and impacts from other subsystems like EU
harmonization, introduction of New Public Management, or evidence-based policy-making;
and intended purpose of indicators and the stage of policy process in which the indicators
operate or are expected to operate.
These indicators have different functions (or role) depending on the objective (e.g.,
identify problems, design policies, monitor policy performance, or enhance public awareness
of a problem). According to Lehtonen, the legitimization and mobilization phases can be
linked with the discursive-interpretive stage of the process and so, the role of indicators tends
to be conceptual. On the other hand, the formation and implementation of an action plan can
11
be done “in a rational problem-solving way or more ‘politically’ through bargaining, log-
rolling etc.” In this regard, the role of indicators tends to be political.
Finally there are issue characteristics, degree of uncertainty and value consensus –
which relate to the likelihood/chance of being in a rational policymaking mode, thus resulting
in direct, instrumental use of indicators when there is a public consensus on the definition of
the social problem; and the likely domination of political/strategic mode when the issue is
controversial or if powerful interests are present.
Lehtonen also looks at the dynamics of indicator design. This refers to processes of
dialogue and argumentation in indicator design and relates to the impact of the breadth and
depth of stakeholder participation in the process, and the degree of influence that different
parties have on final indicator design. Indicator factors relate to the quality of the indicators
themselves. These include performance criteria such as validity, reliability, data availability,
relevance, comprehensibility, and timeliness. As in the case of the dynamics of indicator
design, these factors also relate to the breadth and depth of stakeholder participation in the
process, and the degree of influence that different parties have on final indicator design. He
also highlights that the origin of the indicators (i.e., the way in which and by whom they were
designed and the way they were introduced to the policy process) is important.
Lehtonen’s Hypotheses Concerning Indicator Use and Influence
In sum, in Figure 1, the influence of indicators or indicator influence can be realized
as a result of the argumentative processes by which indicators are designed (i.e., indicator
design) or as a result of the processes wherein indicators are used as argumentative tools by
various policy advocates/supporters. In Figure 2, the processes/dynamics of indicator design
12
and in turn, the shape of the indicators (i.e., indicator factors) and policy influence of these
processes are shaped/conditioned by policy factors (i.e., relating to the political context) and
producer factors (i.e., relating to the characteristics of the participants). On the other hand, the
processes of indicator use are shaped/conditioned by policy factors, user factors (i.e., relating
to the characteristics of the participants), and indicator factors (i.e., characteristics of the
indicators). The influence of the indicator factors is determined by their salience, credibility,
and legitimacy, which are based on the perception of the actors involved in the process.
Based on the framework, Lehtonen (2009) formulates a number of preliminary
hypotheses on factors conditioning/shaping the influence of indicators in policymaking.
These include but are not limited to the following:
(H1) Political style: Indicators more easily gain a political role as compared to
“information that is not in the form of statistics (i.e., quantitative data).”
(H2) Political style: Indicators are more likely to have a conceptual influence as
compared to “information that is not in the form of statistics (i.e., quantitative data).”
(H3) Indicators are likely to have a greater influence (i.e., relative to “information that
is not in the form of statistics or quantitative data) as an elemental part of results-
based policymaking.
(H4) Impacts from decisions in other policy areas: “Imposed use” and legal
commitment behind an indicator enhances its weight in policymaking.
(H5) Adoption of NPM and evidence-based policy principles enhance the role of
indicators in policymaking.
(H6) Broad participation of intended users in designing the indicators enhances their
influence.
13
(H7) Indicators designed by the “user” organization are more influential than those
prepared by “outsiders.”
The Case of Water Policy Indicator Design and Use
Fundamental Principles and Concerns
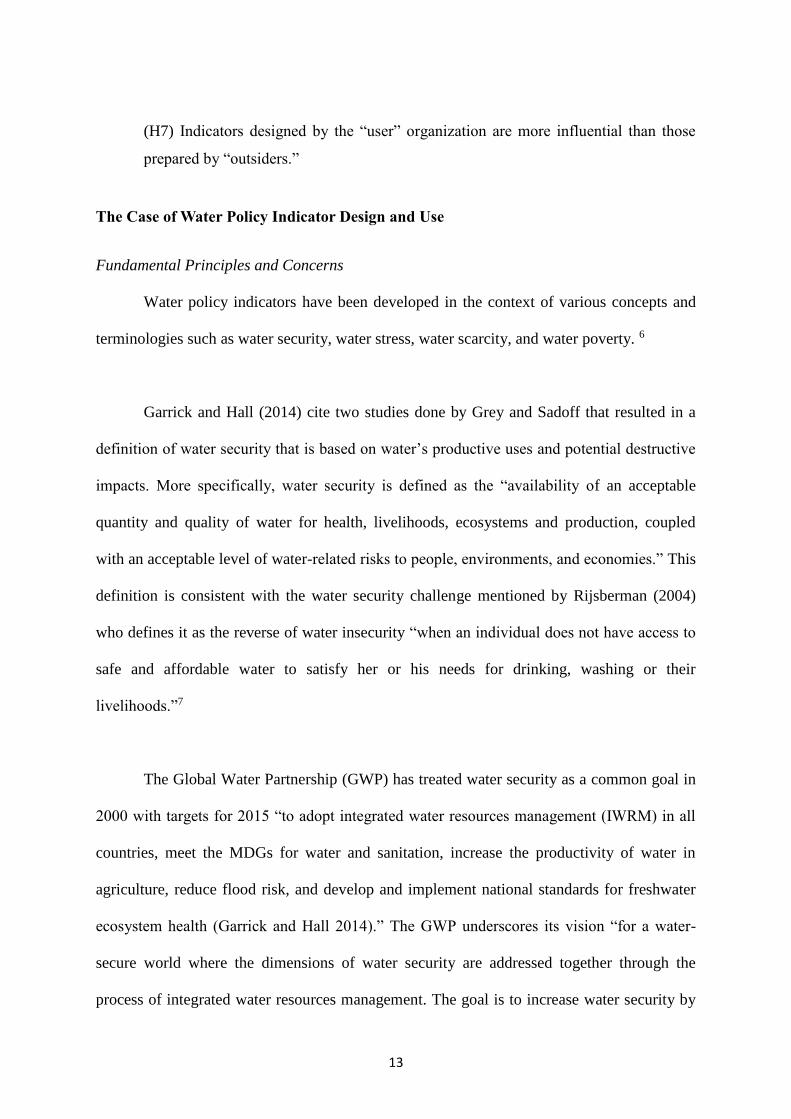
Water policy indicators have been developed in the context of various concepts and
terminologies such as water security, water stress, water scarcity, and water poverty. 6
Garrick and Hall (2014) cite two studies done by Grey and Sadoff that resulted in a
definition of water security that is based on water’s productive uses and potential destructive
impacts. More specifically, water security is defined as the “availability of an acceptable
quantity and quality of water for health, livelihoods, ecosystems and production, coupled
with an acceptable level of water-related risks to people, environments, and economies.” This
definition is consistent with the water security challenge mentioned by Rijsberman (2004)
who defines it as the reverse of water insecurity “when an individual does not have access to
safe and affordable water to satisfy her or his needs for drinking, washing or their
livelihoods.”7
The Global Water Partnership (GWP) has treated water security as a common goal in
2000 with targets for 2015 “to adopt integrated water resources management (IWRM) in all
countries, meet the MDGs for water and sanitation, increase the productivity of water in
agriculture, reduce flood risk, and develop and implement national standards for freshwater
ecosystem health (Garrick and Hall 2014).” The GWP underscores its vision “for a water-
secure world where the dimensions of water security are addressed together through the
process of integrated water resources management. The goal is to increase water security by
14
balancing societal requirements with the availability of natural water resources. This requires
long-term engagement of governments with private and civil society partners to address
usage and wastage, retention and pollution, and balancing today’s needs with those of future
generations (ADB 2013).” It also requires the establishment of measures and indicators to
judge improvements due to policy interventions.
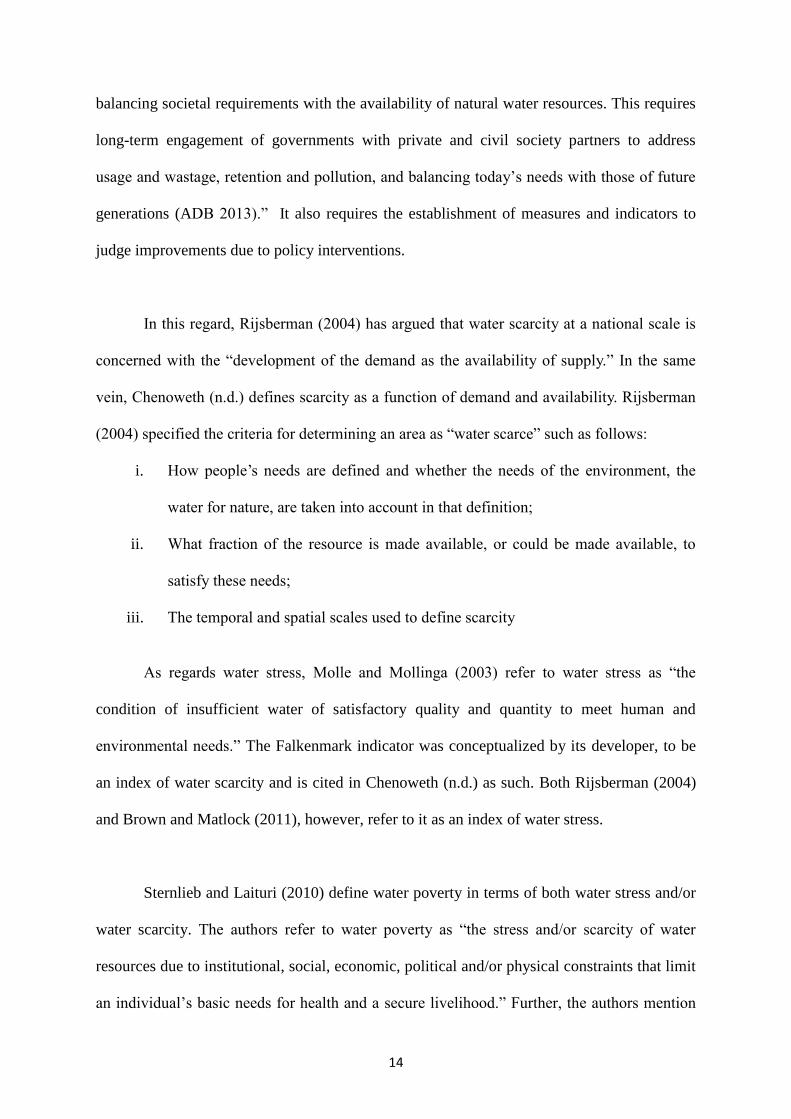
In this regard, Rijsberman (2004) has argued that water scarcity at a national scale is
concerned with the “development of the demand as the availability of supply.” In the same
vein, Chenoweth (n.d.) defines scarcity as a function of demand and availability. Rijsberman
(2004) specified the criteria for determining an area as “water scarce” such as follows:
i. How people’s needs are defined and whether the needs of the environment, the
water for nature, are taken into account in that definition;
ii. What fraction of the resource is made available, or could be made available, to
satisfy these needs;
iii. The temporal and spatial scales used to define scarcity
As regards water stress, Molle and Mollinga (2003) refer to water stress as “the
condition of insufficient water of satisfactory quality and quantity to meet human and
environmental needs.” The Falkenmark indicator was conceptualized by its developer, to be
an index of water scarcity and is cited in Chenoweth (n.d.) as such. Both Rijsberman (2004)
and Brown and Matlock (2011), however, refer to it as an index of water stress.
Sternlieb and Laituri (2010) define water poverty in terms of both water stress and/or
water scarcity. The authors refer to water poverty as “the stress and/or scarcity of water
resources due to institutional, social, economic, political and/or physical constraints that limit
an individual’s basic needs for health and a secure livelihood.” Further, the authors mention
15
that water poverty has multiple dimensions that include (i) safe drinking water; (ii) domestic
water; (iii) food security; (iv) economic production; and (v) ecosystem services. Molle and
Mollinga (2003) define water poverty as a “situation where a nation or region cannot afford
the cost of sustainable clean water to all people at all times.”
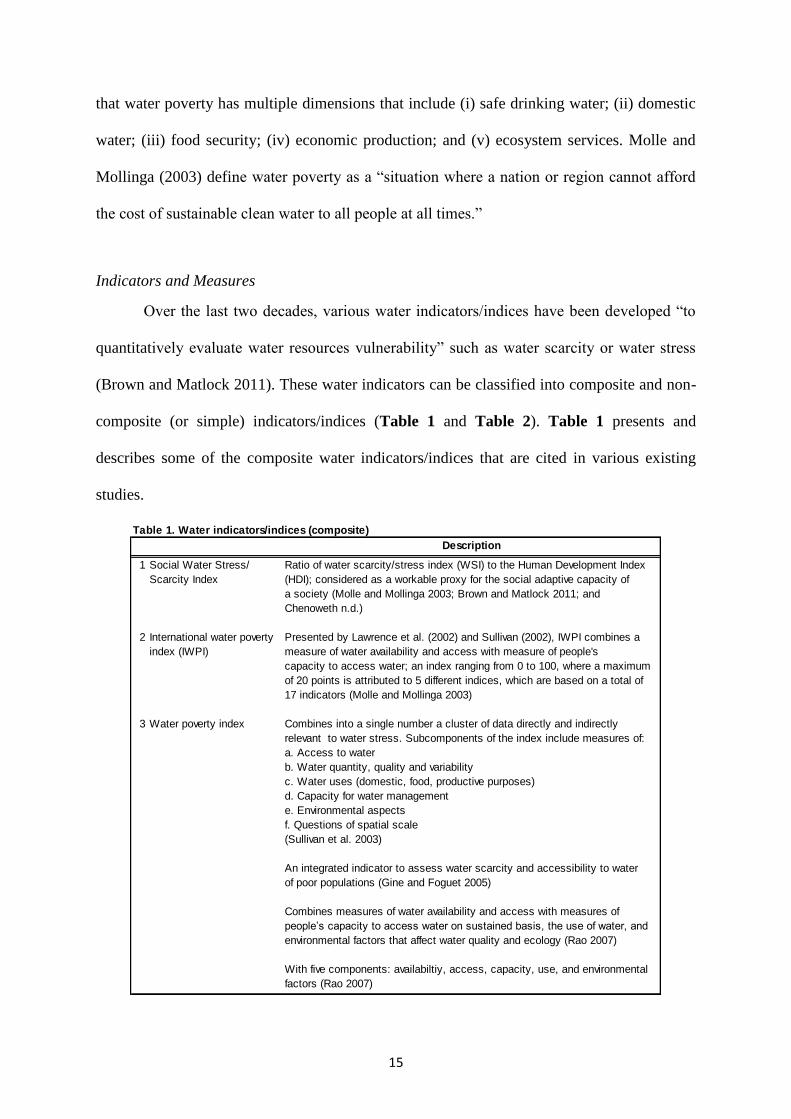
Indicators and Measures
Over the last two decades, various water indicators/indices have been developed “to
quantitatively evaluate water resources vulnerability” such as water scarcity or water stress
(Brown and Matlock 2011). These water indicators can be classified into composite and non-
composite (or simple) indicators/indices (Table 1 and Table 2). Table 1 presents and
describes some of the composite water indicators/indices that are cited in various existing
studies.
Table 1. Water indicators/indices (composite)
Description
1 Social Water Stress/ Ratio of water scarcity/stress index (WSI) to the Human Development Index
Scarcity Index (HDI); considered as a workable proxy for the social adaptive capacity of
a society (Molle and Mollinga 2003; Brown and Matlock 2011; and
Chenoweth n.d.)
2 International water poverty Presented by Lawrence et al. (2002) and Sullivan (2002), IWPI combines a
index (IWPI) measure of water availability and access with measure of people's
capacity to access water; an index ranging from 0 to 100, where a maximum
of 20 points is attributed to 5 different indices, which are based on a total of
17 indicators (Molle and Mollinga 2003)
3 Water poverty index Combines into a single number a cluster of data directly and indirectly
relevant to water stress. Subcomponents of the index include measures of:
a. Access to water
b. Water quantity, quality and variability
c. Water uses (domestic, food, productive purposes)
d. Capacity for water management
e. Environmental aspects
f. Questions of spatial scale
(Sullivan et al. 2003)
An integrated indicator to assess water scarcity and accessibility to water
of poor populations (Gine and Foguet 2005)
Combines measures of water availability and access with measures of
people’s capacity to access water on sustained basis, the use of water, and
environmental factors that affect water quality and ecology (Rao 2007)
With five components: availabiltiy, access, capacity, use, and environmental
factors (Rao 2007)
16
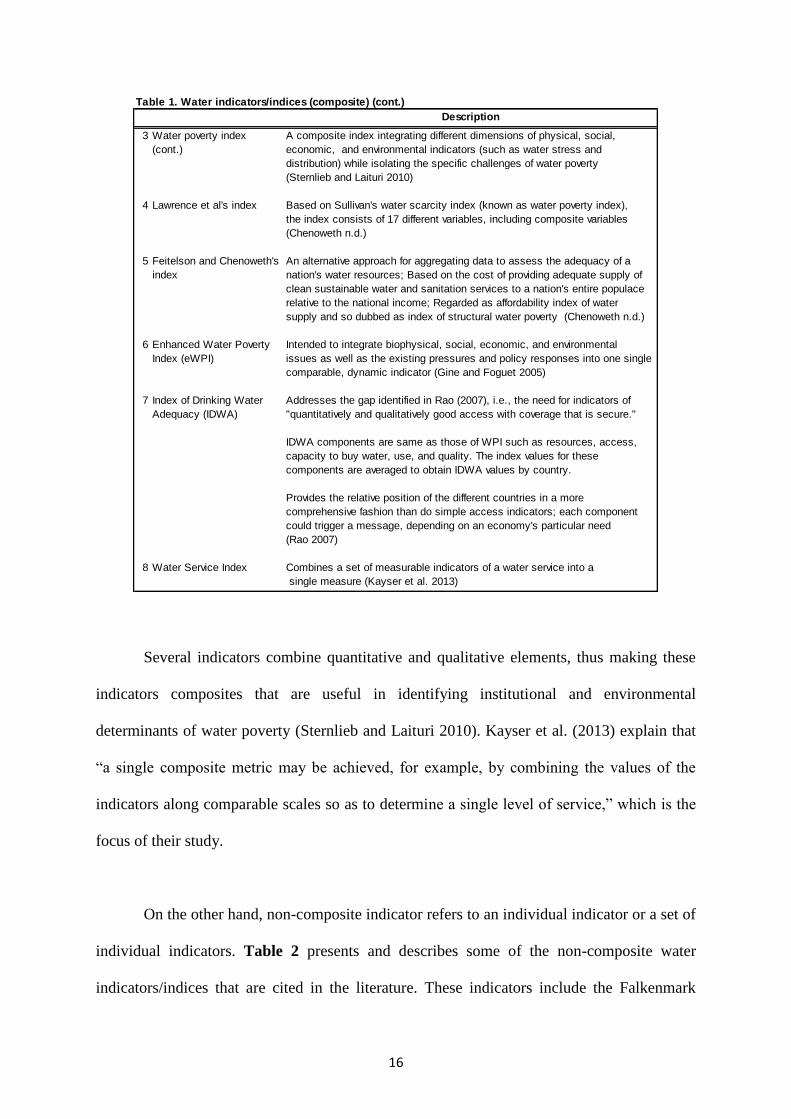
Several indicators combine quantitative and qualitative elements, thus making these
indicators composites that are useful in identifying institutional and environmental
determinants of water poverty (Sternlieb and Laituri 2010). Kayser et al. (2013) explain that
“a single composite metric may be achieved, for example, by combining the values of the
indicators along comparable scales so as to determine a single level of service,” which is the
focus of their study.
On the other hand, non-composite indicator refers to an individual indicator or a set of
individual indicators. Table 2 presents and describes some of the non-composite water
indicators/indices that are cited in the literature. These indicators include the Falkenmark
Table 1. Water indicators/indices (composite) (cont.)
Description
3 Water poverty index A composite index integrating different dimensions of physical, social,
(cont.) economic, and environmental indicators (such as water stress and
distribution) while isolating the specific challenges of water poverty
(Sternlieb and Laituri 2010)
4 Lawrence et al's index Based on Sullivan's water scarcity index (known as water poverty index),
the index consists of 17 different variables, including composite variables
(Chenoweth n.d.)
5 Feitelson and Chenoweth's An alternative approach for aggregating data to assess the adequacy of a
index nation's water resources; Based on the cost of providing adequate supply of
clean sustainable water and sanitation services to a nation's entire populace
relative to the national income; Regarded as affordability index of water
supply and so dubbed as index of structural water poverty (Chenoweth n.d.)
6 Enhanced Water Poverty Intended to integrate biophysical, social, economic, and environmental
Index (eWPI) issues as well as the existing pressures and policy responses into one single
comparable, dynamic indicator (Gine and Foguet 2005)
7 Index of Drinking Water Addresses the gap identified in Rao (2007), i.e., the need for indicators of
Adequacy (IDWA) "quantitatively and qualitatively good access with coverage that is secure."
IDWA components are same as those of WPI such as resources, access,
capacity to buy water, use, and quality. The index values for these
components are averaged to obtain IDWA values by country.
Provides the relative position of the different countries in a more
comprehensive fashion than do simple access indicators; each component
could trigger a message, depending on an economy's particular need
(Rao 2007)
8 Water Service Index Combines a set of measurable indicators of a water service into a
single measure (Kayser et al. 2013)
17
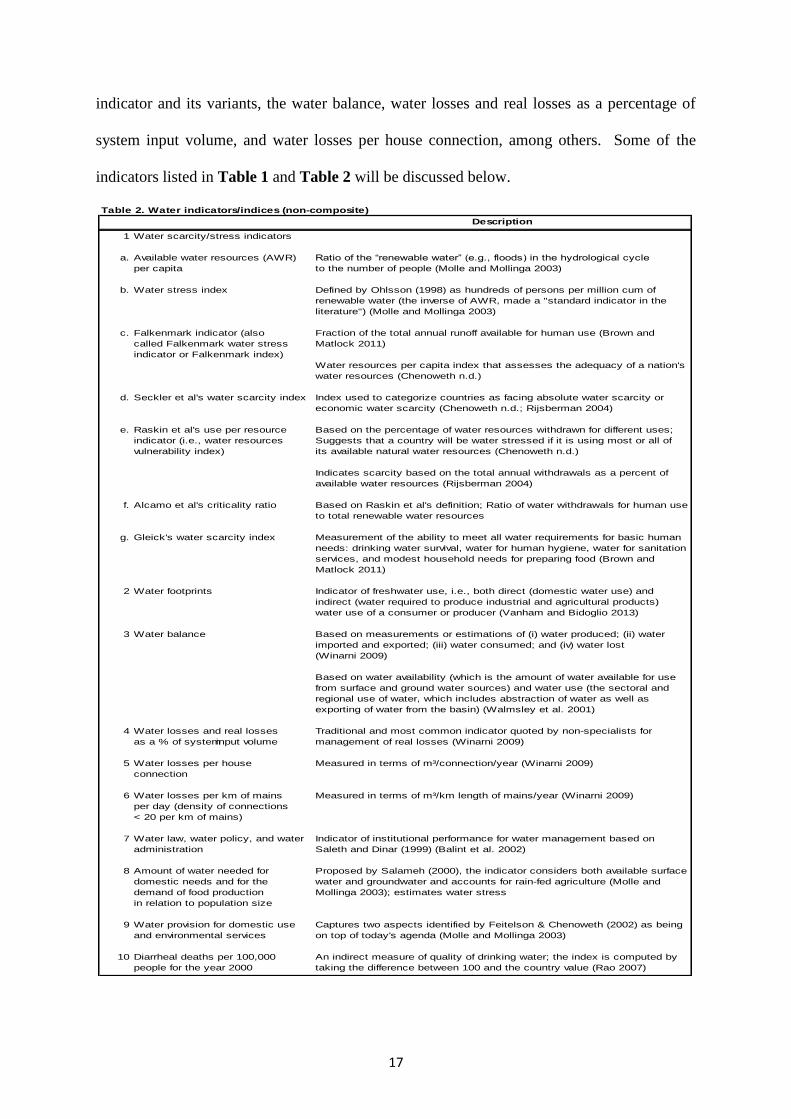
indicator and its variants, the water balance, water losses and real losses as a percentage of
system input volume, and water losses per house connection, among others. Some of the
indicators listed in Table 1 and Table 2 will be discussed below.
Table 2. Water indicators/indices (non-composite)
Description
1 Water scarcity/stress indicators
a. Available water resources (AWR) Ratio of the “renewable water” (e.g., floods) in the hydrological cycle
per capita to the number of people (Molle and Mollinga 2003)
b. Water stress index Defined by Ohlsson (1998) as hundreds of persons per million cum of
renewable water (the inverse of AWR, made a "standard indicator in the
literature") (Molle and Mollinga 2003)
c. Falkenmark indicator (also Fraction of the total annual runoff available for human use (Brown and
called Falkenmark water stress Matlock 2011)
indicator or Falkenmark index)
Water resources per capita index that assesses the adequacy of a nation's
water resources (Chenoweth n.d.)
d. Seckler et al's water scarcity index Index used to categorize countries as facing absolute water scarcity or
economic water scarcity (Chenoweth n.d.; Rijsberman 2004)
e. Raskin et al's use per resource Based on the percentage of water resources withdrawn for different uses;
indicator (i.e., water resources Suggests that a country will be water stressed if it is using most or all of
vulnerability index) its available natural water resources (Chenoweth n.d.)
Indicates scarcity based on the total annual withdrawals as a percent of
available water resources (Rijsberman 2004)
f. Alcamo et al's criticality ratio Based on Raskin et al's definition; Ratio of water withdrawals for human use
to total renewable water resources
g. Gleick's water scarcity index Measurement of the ability to meet all water requirements for basic human
needs: drinking water survival, water for human hygiene, water for sanitation
services, and modest household needs for preparing food (Brown and
Matlock 2011)
2 Water footprints Indicator of freshwater use, i.e., both direct (domestic water use) and
indirect (water required to produce industrial and agricultural products)
water use of a consumer or producer (Vanham and Bidoglio 2013)
3 Water balance Based on measurements or estimations of (i) water produced; (ii) water
imported and exported; (iii) water consumed; and (iv) water lost
(Winarni 2009)
Based on water availability (which is the amount of water available for use
from surface and ground water sources) and water use (the sectoral and
regional use of water, which includes abstraction of water as well as
exporting of water from the basin) (Walmsley et al. 2001)
4 Water losses and real losses Traditional and most common indicator quoted by non-specialists for
as a % of system input volume management of real losses (Winarni 2009)
5 Water losses per house Measured in terms of m³/connection/year (Winarni 2009)
connection
6 Water losses per km of mains Measured in terms of m³/km length of mains/year (Winarni 2009)
per day (density of connections
< 20 per km of mains)
7 Water law, water policy, and water Indicator of institutional performance for water management based on
administration Saleth and Dinar (1999) (Balint et al. 2002)
8 Amount of water needed for Proposed by Salameh (2000), the indicator considers both available surface
domestic needs and for the water and groundwater and accounts for rain-fed agriculture (Molle and
demand of food production Mollinga 2003); estimates water stress
in relation to population size
9 Water provision for domestic use Captures two aspects identified by Feitelson & Chenoweth (2002) as being
and environmental services on top of today's agenda (Molle and Mollinga 2003)
10 Diarrheal deaths per 100,000 An indirect measure of quality of drinking water; the index is computed by
people for the year 2000 taking the difference between 100 and the country value (Rao 2007)
18
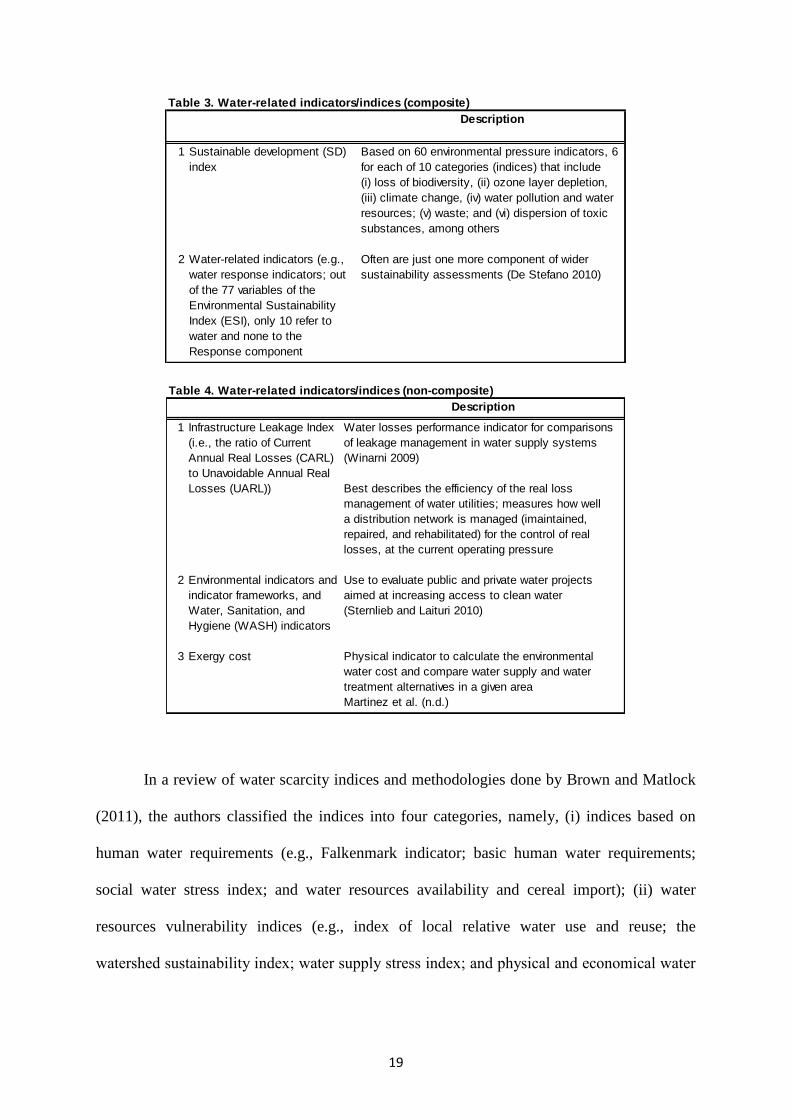
In addition to these water indicators, there are also indicators that form part of wider
sustainability frameworks which concern water. These are referred to in this paper as water-
related indicators, which can also be categorized into composite and non-composite
indicators/indices (Table 3 and Table 4). Nevertheless, the focus of most scholars concerned
on water issues is more on water indicators. The debate is more on which is better between
composite and non-composite indicators.
As emphasized in Rao (2007) and Molle and Mollinga (2003), “indices are useful in
focusing attention… They have a stronger impact on the mind and draw public attention more
powerfully than a long list of many indicators, combined with a qualitative discussion.” More
specifically, Rao (2007) opines that the index (i.e., IDWA) he proposed is better than simple
access indicators because it provides the relative position of countries in a more
comprehensive fashion. On the other hand, Molle and Mollinga (2003) point out that “the use
of multi-dimensional indices blurs meaning.” More specifically, they emphasize that while
the aggregate indices remain visible, the work done by experts remains invisible. In this
sense, there is loss of information in the process of aggregation or construction of composite
indices and so, these composite indices tend to become black boxes, thus making it difficult
for outsiders to decipher calculations, assumptions, and meanings.
19
In a review of water scarcity indices and methodologies done by Brown and Matlock
(2011), the authors classified the indices into four categories, namely, (i) indices based on
human water requirements (e.g., Falkenmark indicator; basic human water requirements;
social water stress index; and water resources availability and cereal import); (ii) water
resources vulnerability indices (e.g., index of local relative water use and reuse; the
watershed sustainability index; water supply stress index; and physical and economical water
Table 3. Water-related indicators/indices (composite)
Description
1 Sustainable development (SD) Based on 60 environmental pressure indicators, 6
index for each of 10 categories (indices) that include
(i) loss of biodiversity, (ii) ozone layer depletion,
(iii) climate change, (iv) water pollution and water
resources; (v) waste; and (vi) dispersion of toxic
substances, among others
2 Water-related indicators (e.g., Often are just one more component of wider
water response indicators; out sustainability assessments (De Stefano 2010)
of the 77 variables of the
Environmental Sustainability
Index (ESI), only 10 refer to
water and none to the
Response component
Table 4. Water-related indicators/indices (non-composite)
Description
1 Infrastructure Leakage Index Water losses performance indicator for comparisons
(i.e., the ratio of Current of leakage management in water supply systems
Annual Real Losses (CARL) (Winarni 2009)
to Unavoidable Annual Real
Losses (UARL)) Best describes the efficiency of the real loss
management of water utilities; measures how well
a distribution network is managed (imaintained,
repaired, and rehabilitated) for the control of real
losses, at the current operating pressure
2 Environmental indicators and Use to evaluate public and private water projects
indicator frameworks, and aimed at increasing access to clean water
Water, Sanitation, and (Sternlieb and Laituri 2010)
Hygiene (WASH) indicators
3 Exergy cost Physical indicator to calculate the environmental
water cost and compare water supply and water
treatment alternatives in a given area
Martinez et al. (n.d.)
20
scarcity); (iii) indices incorporating environmental water requirements (e.g., water scarcity
index and water stress indicator); and (iv) life cycle assessment (LCA) and water footprint.
With regard to the first category, Molle and Mollinga (2003) point out that the focus
of early water indicators is on the physical availability of water and how it relates to
population. Chenoweth (n.d.) refers to these indicators as Neo-Malthusian indicators, which
are anchored on the traditional neo-Malthusian view that while demand increases with
population, the resources are fixed. He explains that this standpoint is at the heart of the most
widely used indicator of water scarcity, i.e., an indicator which is based on renewable water
resources per capita (Chenoweth n.d.; Molle and Mollinga 2003). The first indicator of this
type is the Falkenmark indicator, which is defined as “the fraction of the total annual runoff
available for human use” and is regarded as the most widely used measure of water stress
(Rijsberman 2004; Brown and Matlock 2011; Chenoweth n.d.). After the name of its
developer, Falkenmark, this indicator was developed with focus on Sub-Sahaharan Africa
and the amount of water needed for food self-sufficiency. It has become a standard measure
of water scarcity (Chenoweth n.d.).
Chenoweth (n.d.) mentions that based on Falkenmark’s definition, per capita water
resources falling below 1,667 cubic meters per capita classifies a country as facing water
stress. When it is less than 1,000 cubic meters per capita, a country faces water scarcity,
which threatens “economic development and human health and well-being.” When it is less
than 500 cubic meters per capita, a country is confronted with absolute water scarcity. The
author argues that a country challenged with water scarcity and a growing population is
expected to face worsening scarcity with the rising population. On the other hand,
21
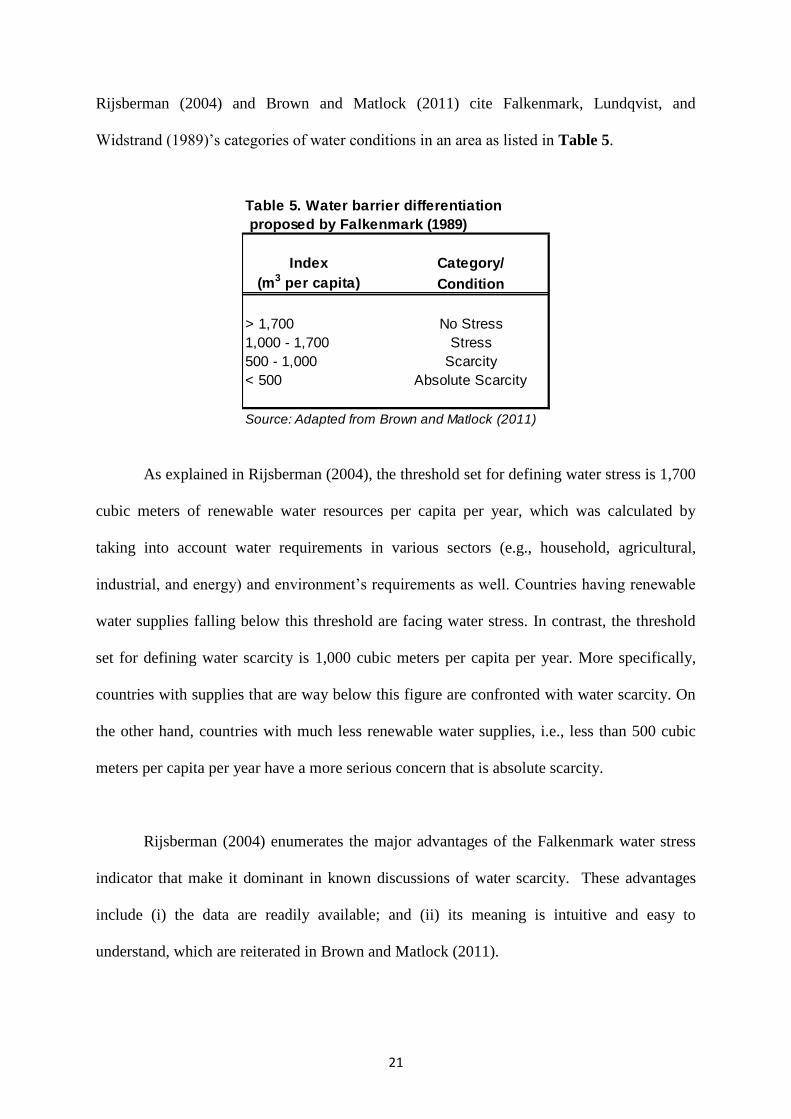
Rijsberman (2004) and Brown and Matlock (2011) cite Falkenmark, Lundqvist, and
Widstrand (1989)’s categories of water conditions in an area as listed in Table 5.
As explained in Rijsberman (2004), the threshold set for defining water stress is 1,700
cubic meters of renewable water resources per capita per year, which was calculated by
taking into account water requirements in various sectors (e.g., household, agricultural,
industrial, and energy) and environment’s requirements as well. Countries having renewable
water supplies falling below this threshold are facing water stress. In contrast, the threshold
set for defining water scarcity is 1,000 cubic meters per capita per year. More specifically,
countries with supplies that are way below this figure are confronted with water scarcity. On
the other hand, countries with much less renewable water supplies, i.e., less than 500 cubic
meters per capita per year have a more serious concern that is absolute scarcity.
Rijsberman (2004) enumerates the major advantages of the Falkenmark water stress
indicator that make it dominant in known discussions of water scarcity. These advantages
include (i) the data are readily available; and (ii) its meaning is intuitive and easy to
understand, which are reiterated in Brown and Matlock (2011).
Table 5. Water barrier differentiation
proposed by Falkenmark (1989)
Index Category/
(m3 per capita) Condition
> 1,700 No Stress
1,000 - 1,700 Stress
500 - 1,000 Scarcity
< 500 Absolute Scarcity
Source: Adapted from Brown and Matlock (2011)
22
Brown and Matlock (2011), however, point out that the Falkenmark water stress index
enables distinction between climate and human-induced water scarcity because it is based on
individual usage. The index is normally used in assessing water stress/scarcity on a country
scale. However, the authors caution on the use of national annual averages, which “obscure
important scarcity information at smaller scales.” They mention that “simple thresholds omit
important variations in demand among countries due to culture, lifestyle, climate, etc.” Such
a limitation is also highlighted in Rijsberman (2004) as one of the disadvantages of the
Falkenmark indicator that include the following:
i. The annual, national averages hide important scarcity at smaller scales;
ii. The indicator does not take into account the availability of infrastructure that
modifies that availability of water stress; and
iii. The simple thresholds do not reflect important variations in demand among
countries due to, for instance, lifestyle, climate, etc.
In addition, Molle and Mollinga (2003) argue that while indicators consider
resource/population ratio, these indicators disregard both virtual water and adaptations, which
is also discussed in Chenoweth (n.d.). The latter study refers to earlier studies that criticize
the Falkenmark indicator. Some of the criticisms thrown at this indicator include that of (i)
Raskin et al.’s, i.e., the indicator’s limitation in allowing for differences in water use patterns
between countries and multiple in-stream uses; (ii) Ohlsson’s, i.e., the indicator’s failure to
factor in a nation’s ability to adapt to reduced per capita water availability; (iii) Allan’s, i.e.,
the question on the existence of the link between water resources availability and food
security given the presence of a global food market, which allows countries with reduced per
capita water resources to import grains (i.e., virtual water) and so these countries are able to
meet their food requirements. 8
23
Other scholars proposed a more accurate assessment of the demand for water. To this
end, a team of researchers headed by Professor Igor Shiklomanov conducted global analyses
of water demand and availability. For instance, one of the team’s early work compared
national annual water availability with assessments of national water demand in the
agricultural, industrial, and domestic sectors (Rijsberman 2004). Based on Shiklomanov’s
basic data on water resource availability, another team of researchers headed by Raskin did a
global water assessment for the United Nations Commission on Sustainable Development.
However, the team replaced water demand with water withdrawals and defined scarcity as the
total annual withdrawals as a percent of available water resources, which is called Water
Resources Vulnerability Index. According to the team, a country having annual withdrawals
that are in the range of 20-40 percent of annual supply is water scarce while a country with
annual withdrawals more than 40% of annual supply is severely water scarce (Rijsberman
2004).
Another team of researchers led by Alcamo employed this definition in defining their
“criticality ratio,” which is the ratio of water withdrawals for human use to total renewable
water resources. Nevertheless, the criticality ratio and similar indicators have a share of
limitations as listed in Rijsberman (2004). To wit:
a. The data on water resources availability do not take into account how much of
it could be made available for human use;
b. The water withdrawal data do not take into account how much of it is
consumptively used (or evapotranspired) and how much could be available for
recycling, through return flows; and
c. The indicators do not take into account a society’s adaptive capacity to cope
with stress.
24
All these limitations are consistent with the issue on poor data availability that
Sternlieb and Laituri (2010) raise. In particular, “data on almost every subject related to water
issues is usually lacking, unreliable, incomplete or inconsistent.” The authors opine that this
is a cause for concern considering that the selection of indicators depends on the data.
Nevertheless, there had been attempts to address all these limitations. For instance, the
International Water Management Institute (IWMI) conducted an analysis that factored in the
share of the renewable water resources available for human needs by taking into account the
existing water infrastructure. The consumptive use (evapotranspiration) was used as basis for
the demands analysis while the remainder of water withdrawn was reckoned as return flows
(Rijsberman 2004).
Chenoweth (n.d.) points out that this water scarcity index, like the Falkenmark index,
“does not give due emphasis to varying ability of countries to effectively manage their water
resources and adapt their economies to changing circumstances.”9 In addition, this index is a
neo-Malthusian indicator, which reflects worsening condition as population increases.
Rijsberman (2004) emphasizes that the IWMI model has disadvantages that spring from its
intricacy and subsequent complexity of assessment. Also, it is not intuitive and so it is not
accessible to the wider public. In addition, it requires expert judgement as it is constrained by
data availability, which is critical in assessing all components of the indicators. Further, it is
at the aggregate, national scale and fails to examine availability of safe and affordable water
for individuals to meet their needs. To address this limitation, Sullivan et al. conceptualized a
disaggregated approach that assesses whether individuals are water secure at the household
and community level (Rijsberman 2004).
25
Sullivan developed an alternative index of water scarcity, which is known as water
poverty index (WPI). The WPI responds to the need for a simple, open, and transparent tool,
which is appealing to politicians and decision makers (Sullivan et al. 2003). It is based on
combined “indices that measure water availability, access to water resources and sanitation,
and the time and effort required to access adequate water for domestic use” (Chenoweth n.d.).
Rijsberman (2004) found that this reflects both the “physical availability of water, the degree
to which humans are served by that water and the maintenance of ecological integrity.” In
addition, it groups components into five dimensions such as (i) access to water; (ii) water
quantity, quality, and variability; (iii) water uses for domestic, food and productive purposes;
(iv) capacity for water management; and (v) environmental aspects.
Moreover, it is a comprehensive indicator that is described by Rijsberman (2004) as
“the all-inclusive, holistic” Water Poverty Index as it addresses all the limitations of the
Falkenmark indicator. Nonetheless, it is not without drawbacks. In particular, the WPI is
complex and lacks intuitive understanding just like other similar indices. Thus, Rijsberman
(2004) argues that it cannot replace the Falkenmark indicator, which is simple and easy to
understand. More specifically, he argues that the “Falkenmark indicator is simply too
important to be replaced by a complex dimensionless index.” 10
Just like Garriga and Foguet (2005), Lawrence et al. nevertheless built on and further
developed the water poverty index. In particular, they specified all the individual components
of the index and the methodology for measuring them which generated an index with 17
different variables, which include composite variables (Chenoweth n.d.). Chenoweth (n.d.)
mentions that this new index, just as the other composite quality of life indices, has
drawbacks that stem from the difficulty in drawing up a weighted index that is based on a
26
“scientifically defensible weighting, that is not amenable to manipulation or sensitive to the
values of those that participate in the weighting exercise.”
In addition, the Feitelson and Chenoweth’s index, is an alternative approach for
aggregating data that are needed in assessing the adequacy of a nation’s water resources. It is
considered an economic-based index of water scarcity because it is estimated by assessing the
cost of providing an adequate supply of clean sustainable water and sanitation services to a
nation’s entire populace and comparing this cost with the national income. Chenoweth (n.d.)
clarifies that the said index is basically an “affordability index of water supply” and so it is
dubbed as an index of structural water poverty. However, it requires considerable amount of
data, particularly on the full cost of providing sustainable water supply to the whole populace.
Unfortunately, these data are not readily available for most countries and so, this poses a big
challenge. Rao (2007) pointed out the need for “quantitatively and qualitatively good access
with coverage that is secure.” To overcome some of the limitations of the WPI, he developed
the Index of Drinking Water Adequacy (IDWA) for Asia, particularly for the 23 developing
member countries of the Asian Development Bank (ADB). The IDWA is an average of five
components as follows:
a. Access – refers to some access and is widely publicized under the Millennium
Development Goals (MDG)
b. Capacity to buy water – refers to a nation’s and/or its people’s capacity to
purchase water; measured in terms of per capita GDP in PPP US dollars
c. Quality
d. Resources – estimates of renewable internal fresh water resources per capita
from World Development Indicators (WDI) 2006, converted to a log scale
27
e. Use – refers to per capita water consumption by the domestic sector,
particularly “drinking water;” involves three alternative sets that were
computed and average for the final estimate such as:
i. WDI 2006 data for each country on annual freshwater withdrawal
ii. Set of estimates based on the data reported by World Resources
Institute for some year in the range 1987-1995
iii. Set of estimates based on the data reported by World Resources
Institute for the year 2000
Use of water policy indicators in planning, implementing and monitoring and
evaluating water policy
As we have seen, over the last two decades, a large number of water indicators have
been developed for various purposes. Not all have been widely used, however. The
Falkenmark indicator was developed with focus on Sub-Saharan Africa and the water
requirement for food self-sufficiency (Chenoweth n.d.) and it was used by the Food and
Agriculture Organization (FAO) as benchmark for identifying water scarce countries.
Brown and Matlock (2011) have noted the increasing popularity of the Falkenmark
water stress index, which is typically used in assessing water stress on a country scale. The
Fraser Basin Council (Canada) indicators focus on the need for sustainability, and are the best
reflection of Integrated Catchment Management in the true sense of the term. While the
Murray-Darling Basin Commission (Australia) indicators reflect a policy of integrated water
resource management and are based primarily on the management of the water resources,
rather than the integration of all resource. The Tennessee Valley Authority (USA) indicators
28
reflect mainly the anthropocentric needs, while the United States Environmental Protection
Agency (USEPA) indicators reflect their mandate to concentrate primarily on pollution
control and management, rather than integrated catchment management (Walmsley et al.
2001).
Garriga and Foguet (2005) tested the water poverty index (WPI) at local scale in
Bolivia, which led to the development of the enhanced WPI (eWPI) based on data obtained
from a comprehensive household questionnaire developed in 20 communities. Analysis of the
obtained eWPI values indicates that at least two communities need special attention.
Rao (2007) measured the index of drinking water adequacy (IDWA) for 23
developing member countries of the Asian Development Bank (ADB). The index is an
average of five components, namely, resource, access, capacity, use, and quality. According
to Rao (2007), it indicates the relative position of different countries and each of its
components suggests a message depending on an economy’s need.
Winarni (2009) introduced the Infrastructure Leakage Index (ILI) as water losses
indicator, which is a performance indicator used for comparing leakage management in water
supply systems. The ILI is the ratio of Current Annual Real Losses (CARL) to Unavoidable
Annual Real Losses (UARL). The author mentions that the ILI was developed and tested by
the International Water Association (IWA) Task Forces on Water Losses and Performance
Indicators. The ILI considers the fact that real losses are inevitable even if the distribution
system is well-managed. Winarni (2009) argues that it is the more appropriate approach than
the percentage of system input volume.
29
The ADB (2013) presents a comprehensive assessment framework for water security.
It mentions that “country-based findings, rankings, and key messages in the report indicate
directions and priorities for increased investment, improved governance, and expanded
capacity building.” The ADB used a quantitative measurement of water security in five
dimensions such as (i) household water security, (ii) economic water security, (iii) urban
water security, (iv) environmental water security, and (v) resilience to water-related disasters
is the foundation for measurement of progress in achieving water-secure future for the Asia
and the Pacific.
The concept of a ‘water footprint’ was also used extensively in differents settings.
Vanham and Bidoglio (2013) for example reviewed water footprint as indicator of freshwater
use i.e., both direct (domestic water use) and indirect (water required to produce industrial
and agricultural products) water use of a consumer or producer, particularly its applicability
to the EU28, i.e., EU27 and Croatia. Wichelns (2013) also examines the potential of water
footprints in meeting information requirements so as to serve as a policy-relevant analytical
construct. According to the author, water footprints gained power in policy circles in some
countries. More specifically, it is regarded and adopted as policy tools in national legislation.
The Three Roles of Water Policy Indicators
To examine the roles of water policy indicators, the paper adopts Baumgartner and
Jones (2009)’s methodology. This methodology involves taking stock of the different sources
of information that was used in creating various indicators in the said study, and coding of
these sources based on content analysis. For the purpose of the paper, a number of existing
studies are reviewed to identify the different uses or influences of water policy indicators in
30
policymaking, particularly in policy formulation. These different uses are categorized into
Lehtonen (2009)’s three roles of expert knowledge in policymaking, namely, instrumental
role, conceptual role, and political role by conducting document/content analysis.
As (2009) Lehtonen argued, the instrumental role of indicators means that information
is used for specific decisions or requested by decision-makers for specific projects. It
corresponds to the rational-positivist model, wherein policymaking is seen as a rational and
linear process of problem-solving. The conceptual or “enlightenment” role of indicators is
anchored on the view that “knowledge provides broad information base for decisions, by
providing conceptual frameworks and fostering different types of learning. It corresponds to
the discursive-interpretative model, wherein policymaking is perceived as a struggle over
definition, explanation and interpretation of public problems. The political role of indicators
involves “justifying or legitimizing policies, decisions and actors, or postponing actual
decisions.” It corresponds to the strategic model, wherein politics is pure competition
between private conflicting interests without necessary reference to a common good,
rationality or similar overarching principle.
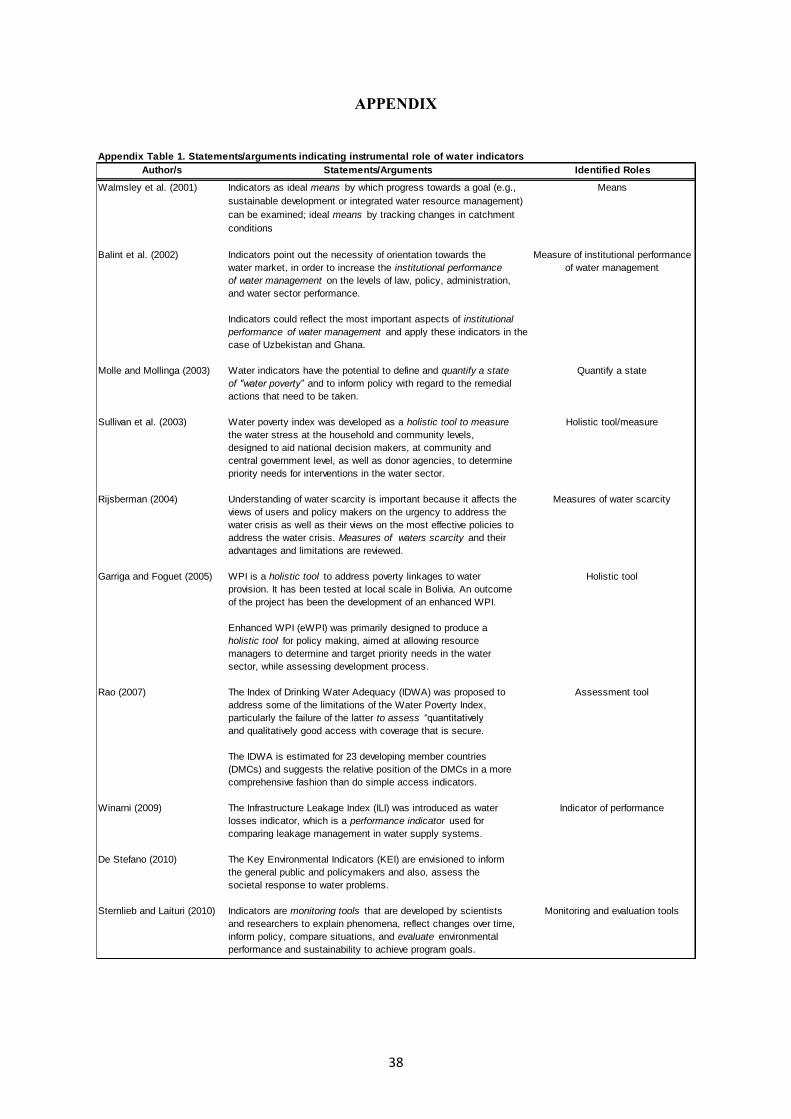
Based on the results of the content analysis, all the 22 studies covered in the literature
review suggest that water policy indicators have instrumental and conceptual role in policy
formulation. In particular, these studies indicate the instrumental role of indicators by
highlighting the role of indicator as a means; a measure or indicator of scarcity, progress,
ability or performance; a holistic tool for planning, monitoring, tracking, and evaluation; a
policy tool for national legislation; and a guide for policy formulation (Appendix Table 1).
31
Likewise, these studies imply the conceptual role of indicators as they emphasize the
dominant role of indicators in providing information and guidance; informing and orienting
policy-making; defining a state of water poverty; communicating complex issues, focusing
attention and simplifying problem; conveying viewpoints/messages; directing policy,
program, and project actions; explaining phenomena; raising awareness; and informing
management decisions, among others (Appendix Table 2).
In contrast, only five (5) of the 22 studies indicate the political role of indicators
(Appendix Table 3). To wit, Molle and Mollinga (2003) argue that indicators are political
tool. They point out that the quantitative nature of indicators gives a gloss of scientificity to
the message, which in turn helps legitimize “a viewpoint, an approach, or a decision that is
likely to be non-consensual.” In addition, indicators enable bureaucracies “to justify their
existence and budget and to deflect public pressure.” Moreover, “the purpose of an index is
political rather than statistical.” On the other hand, Sullivan et al. (2003) argue that the water
poverty index is a tool that “will appeal to politicians and decision-makers.” Similarly,
Kayser et al. (2013) underscore the role of water indicators in influencing policy debate and
policy decisions.
In this light, water policy indicators are very much involved in all the activities
undertaken in the policy formulation stage of policy-making, i.e., from appraising policy
relevant knowledge or evidence as quantified/summarized by water policy indicators,
engaging policymakers and analysts in dialogue about the nature of policy problems and
solutions, to identifying and assessing impacts of different policy options based on relevant
information that can be obtained by analyzing water policy indicators. In this sense, the
influence of water policy indicators on policy formulation cannot be underestimated.
32
Conclusion
At the start of the paper, the primary objective of the paper is specified and this is to
address the following questions: (i) Do water indicators influence policy formulation? (ii)
How do these indicators influence in policy formulation? and (iii) Under which
circumstances do these indicators influence policy formulation?
For the purpose of the paper, a literature review, was done wherein the intended and
actual uses of water/water policy indicators are identified. It is noteworthy that although only
two (i.e., Chenoweth n.d. and Kayser et al. 2013) of the studies covered in the literature
review explicitly mention the relationship of indicators and policy formulation, particularly
the role of indicators in policy formulation, thorough examination of the statements and/or
arguments in various existing studies (i.e., document/content analysis) reveals the three roles
of water/water policy indicators in policy formulation.
Knowledge of the activities (e.g., appraising policy relevant knowledge or evidence,
engaging policymakers and analysts in dialogue about the nature of policy problems and
solutions, and identifying and assessing impacts of different policy options) involved in
policy formulation helped in the said analysis. Results of analysis suggest that water/water
policy indicators indeed play critical roles in policymaking, particularly in policy
formulation. Consequently, these roles determine the influence of water indicators on policy
formulation.
As Lehtonen suggests, the different types of water policy indicator influence can be
associated with the three different roles of expert knowledge in decision-making (i.e.,
instrumental role, conceptual or “enlightenment” role, and political role) and the
33
corresponding conceptions of policymaking (i.e., rational-positivist model, discursive-
interpretative model, and strategic model).
Nevertheless, care must be taken in the use of water policy indicators in policy
formulation. As the above discussion has shown, indicators are generally prone to conceptual
and methodological issues. Garrick and Hall (2014) mention that these issues include (i)
problems with complexity and causality, (ii) difficulties constructing composite indicators
based on multiple components, and (iii) a lack of reliable and comparable data. Sternlieb and
Laituri (2010) highlight the third issue by quoting the disclosure made by the UN World
Water Development Reports, i.e., “data on almost every subject related to water issues is
usually lacking, unreliable, incomplete, or inconsistent.” The authors opine that this is a cause
for concern considering that “data drives the selection of indicators.”
Endnotes
1 A European Union (EU) 7th Framework Programme for Research and Technological
Development (FP7) Research Project that aims to explain the role of indicators in policy
processes and contexts 2 http://www.point-eufp7.info/objectives/ 3 As Lehtonen points out, these roles correspond to the three dominant conceptions of
policymaking as (1) the rational-positivist model - seeing policymaking essentially as a
rational and linear process of problem-solving; (2) the discursive-interpretative model -
perceives policymaking as a struggle over the definition, explanation and interpretation of
public problems; and (3) the strategic model – wherein politics is pure competition between
private conflicting interests without any necessary reference to a common good, rationality or
similar overarching principle. 4 Lehtonen (2009) enumerates a summary of the critiques against the term “use.” 5 According to Lehtonen (2013), “more sophisticated understanding of indicator roles seem to
be emerging among the research communities employing notions such as “boundary objects,”
“management by numbers,” and “governmentality.” Such notions are expected to “provide a
more nuanced understanding of the political roles of indicators...” 6 According to Garrick and Hall (2014), water security is rooted in “1940s postwar diplomacy
to redraw political boundaries of former colonial empires.” It has gained much interest due to
the United Nations (UN) Ministerial Declaration of The Hague on Water Security in the 21st
Century that was issued at the World Water Forum held in 2000. The said Declaration
explains that water security challenge entails “ensuring that … ecosystems are protected and
improved, that sustainable development and political stability are promoted, that every person
34
has access to enough safe water at an affordable cost to lead a healthy and productive life and
the vulnerable are protected from the risks of water-related hazards.” 7 Norman et al. (2013) adopted the definition of water security, which is “sustainable access,
on a watershed basis, of adequate quantities of water, of acceptable quality, to ensure human
and ecosystem health.” In contrast, water scarcity, water stress, and water poverty generally
relate to the availability of water resources. In particular, Molle and Mollinga (2003) describe
scarcity “as a reduction of the quantity of water used earlier and is then perceived as a stress
that generally induces adjustments and reduces output.” It relates to “how societies spread
over space, how their activities modify the environment and how this, in turn, impacts on
them, and with how different segments of these societies are able (unable) to mobilize
financial resources and power in order to shape the patterns of access to water within the
society.” They point out that water scarcity has multiple dimensions that include physical
scarcity, economic scarcity, managerial scarcity, institutional scarcity, and political scarcity. 8 Ohlsson proposed a modification of the Falkenmark indicator, which takes into account the
society’s adaptive capacity, particularly “to adapt to stress through economic, technological
or other means.” He adopted the UNDP’s Human Development Index in weighting the
Falkenmark’s indicator, which led to the development of the Social Water Stress Index
(Rijsberman 2004). Brown and Matlock (2011) explain that “the HDI functions as a weighted
measure of the Falkenmark indicator in order to account for the ability to adapt to water
stress.” In addition, the authors mention Ohlsson’s argument that “the capability of a society
to adapt to difficult scenarios is a function of the distribution of wealth, education
opportunities, and political participation.” Moreover, the HDI is an indicator that is widely
used to assess these societal variables. On the other hand, Chenoweth (n.d.) explains that this
index is a composite index based on combined water scarcity index and Human Development
Index. Aso, he points out that although Ohlsson’s index addresses issue on adaptive capacity
(i.e., the ability of a society to adapt to rising natural scarcity), it is not without limitations.
According to Chenoweth (n.d.), “it depends upon proxies rather than a causal connection for
measuring the ability of a country to deal adequately with water scarcity.” More specifically,
“the index lacks a direct means of measuring the ability of a country to deal effectively with
water scarcity through technological processes and infrastructural investment, or social
adaptation. It also fails to address water quality issues.” 9 Consequently, Seckler and other researchers did an analysis of the future adaptive capacity
on a national scale by assessing the potential development of infrastructure and by increasing
irrigation efficiency through better water management policies. Based on the estimated water
demands in 2025, Seckler et al. distinguish between “physically water scarce” and
“economically water scarce countries.” Rijsberman (2004) explains that countries that will be
unable to satisfy the estimated water demands in 2025 in spite of accounting for future
adaptive capacity are considered as “physically water scarce” while those that have enough
renewable resources but require significant investment in water infrastructure to ensure
people’s access to water are regarded as “economically water scarce” 10 Further, Garriga and Foguet (2005) point out that the framework used for the WPI “tends to
oversimplification and appears to be not very conducive to allow a comprehensive
understanding of the complex nature of water poverty.” According to them, a dynamic and
holistic process such as water resources management requires incorporation of cause-effect
relationships to capture the cross-cutting nature of water issues. This approach is expected to
“accommodate all the causal inter-relations between the parameters, providing policy
planners with a valuable tool to address water problems.” To address this drawback, the
authors proposed the enhanced WPI by building on the original WPI but this time integrating
the concept of causality. More specifically, the enhanced WPI is meant to “integrate
35
biophysical, social, economic, and environmental issues as well as the existing pressures and
policy responses into one single, comparable, dynamic indicator.”
36
References
ADB. 2013. Asian Water Development Outlook. Manila: Asian Development Bank.
Balint, Borbala E., I. Forkutsa, and A.C. Reis de Freitas. 2002. Indicators for the
Measurement of Institutional Performance Concerning Water Management: Application
for Uzbekistan and Ghana. Bonn: Center for Development Research.
Baumgartner, Frank and Bryan Jones. 2009. Agendas and Instability in American Politics.
The University of Chicago Press Book.
Brown, Amber and Marty Matlock. 2011. A Review of Water Scarcity Indices and
Methodologies. White Paper No. 106. The Sustainability Consortium, University of
Arkansas.
Chenoweth, Jonathan. n.d. A Re-Assessment of Indicators of National Water Security. Centre
for Environmental Strategy, University of Surrey.
Corkery, Joan, Anthony Land and Jean Bossuyt. 1995. The Process of Policy Formulation:
Institutional Path or Institutional Maze? European Centre for Development Policy
Management.
De Stefano, Lucia. 2010. International Initiatives for Water Policy Assessment: A Review.
Water Resource Manage 24:2449-2466.
Feldman, Martha. Order Without Design: Information Production and Policy Making. 1st ed.
Stanford University Press, 1989.
Frederiksen, Pia et al. n.d. Policy Influence of Indicators – POINT.
Garrick, Dustin and Jim Hall. 2014. Water Security and Society: Risks, Metrics, and
Pathways. Annual Review of Environment and Resources 39:611-639.
Garriga, Ricard G. and Agusti Foguet. 2005. The Water Poverty Index: Assessing Water
Scarcity at Different Scales. II Congrés UPC Sostenible 2015.
Head, Brian, Michele Ferguson, Adrian Cherney, and Paul Boreham. “Are Policy-Makers
Interested in Social Research? Exploring the Sources and Uses of Valued Information
among Public Servants in Australia.” Policy and Society, Contemporary Policy Work in
Subnational States and NGOs, 33, no. 2 (June 2014): 89–101.
doi:10.1016/j.polsoc.2014.04.004.
Howlett, Michael, M. Ramesh, and A. Perl. 2009. Studying Public Policy. Toronto: Oxford
University Press.
Kayser, Georgia et al. 2013. Domestic Water Service Delivery Indicators and Frameworks for
Monitoring, Evaluation, Policy and Planning: A Review. International Journal of
Environmental Research and Public Health 10:4812-4835.
Kingdon, J. W. Agendas, Alternatives, and Public Policies. Boston: Little Brown and
Company, 1984.
Landry, R., M. Lamari, and N. Amara. “The Extent and Determinants of the Utilization of
University Research in Government Agencies.” Public Adm.Rev. 63, no. 2 (2003): 192–
205.
Lehtonen, Markku. 2009. Indicators as an Appraisal Technology: Framework for Analysing
Policy Influence and Early Insights into Indicator Role in the UK Energy Sector. Paper
presented at the ECPR Joint Sessions of Workshops.
Lehtonen, Markku. 2013. Indicators as a Tool for Policy Formulation. Paper prepared for the
workshop on the role of analytical tools within the Policy Formulation Process, London,
April 18-19, 2013.
Martinez, Amaya et al. n.d. Searching Meaningful Indicators Within the Water World: How
Can Exergy Help? CIRCE Institute, University of Zaragoza, Spain.
Mirzai, M. 2014. Application of the Water Quality Index as Simple Indicator of Watershed
Pollution. Advances in Water Resource and Protection (AWRP) 2:42-46.
37
Molle, Francois and Peter Mollinga. 2003. Water Poverty Indicators: Conceptual Problems
and Policy Issues. Water Policy 5:529–544
Norman, Emma et al. 2013. Water Security Assessment: Integrating Governance and
Freshwater Indicators. Water Resources Management 27(2):535-551.
Nutley, Sandra M., Isabel Walter, and Huw T. O. Davies. Using Evidence: How Research
Can Inform Public Services. Bristol: Policy Press, 2007.
Pawson, R. “Evidence-Based Policy: In Search of a Method?” Evaluation 8, no. 2 (2002):
157–81.
Policy Research Initiative. n.d. Canadian Water Sustainability Index. Sustainable
Development Briefing Note. Government of Canada.
Rao, Bhanoji. 2007. Access to Drinking Water and Sanitation in Asia: Indicators and
Implications. Discussion Paper. Asian Water Development Outlook. Manila: Asian
Development Bank.
Rijsberman, Frank. 2004. Water Scarcity: Fact or Fiction? Proceedings of the 4th International
Crop Science Congress.
Sanderson, Ian. “Intelligent Policy Making for a Complex World: Pragmatism, Evidence and
Learning.” Political Studies 57 (2009): 699–719.
Sternlieb, Faith and Melinda Laituri . 2010. Water, Sanitation, and Hygiene (WASH)
Indicators: Measuring Hydrophilanthropic Quality. Journal of Contemporary Water
Research and Education 145:51-60.
Sullivan, C.A. et al. 2003. The Water Poverty Index: Development and Application at the
Community Scale. Natural Resources Forum 27:189-199.
Thambavani, D. Sarala and T.S.R. Uma Mageswari. 2014. Water Quality Indices as
Indicators for Potable Water. Desalination and Water Treatment 52:4772-4782.
Turnpenny, John et al. 2013. “Policy Appraisal.” In Routledge Handbook of Public Policy,
edited by E. Araral, S. Fritzen, M. Howlett, M. Ramesh, and X. Wu, 244-254. New
York: Routledge.
Vanham, Davy and Giovanni Bidoglio. 2013. A Review on the Indicator Water Footprint for
the EU28. Ecological Indicators 26:61–75.
Walmsley, Jay et al. 2001. Indicators of Sustainable Development for Catchment
Management in South Africa - Review of Indicators from Around the World.
Weiss, C. H. “Research for Policy’s Sake: The Enlightenment Function of Social Science
Research.” Policy Analysis 3, no. 4 (1977): 531–45.
Weiss, Carol H. “The Circuitry of Enlightenment: Diffusion of Social Science Research to
Policymakers.” Knowledge: Creation, Diffusion, Utilization 8, no. 2 (1986): 274–81.
Whiteman, David. “Reaffirming the Importance of Strategic Use: A Two-Dimensional
Perspective on Policy Analysis in Congress.” Knowledge: Creation, Diffusion,
Utilization 6, no. 3 (1985): 203–24.
Wichelns, Dennis. 2013. Water Footprints: Policy Relevant or One-Dimensional Indicators?
GWF Discussion Paper 1341. Canberra: Global Water Forum.
Winarni, W. 2009. Infrastructure Leakage Index (ILI) as Water Losses Indicator. Civil
Engineering Dimension 11(2):126-134.
38
APPENDIX
Appendix Table 1. Statements/arguments indicating instrumental role of water indicators
Author/s Statements/Arguments Identified Roles
Walmsley et al. (2001) Indicators as ideal means by which progress towards a goal (e.g., Means
sustainable development or integrated water resource management)
can be examined; ideal means by tracking changes in catchment
conditions
Balint et al. (2002) Indicators point out the necessity of orientation towards the Measure of institutional performance
water market, in order to increase the institutional performance of water management
of water management on the levels of law, policy, administration,
and water sector performance.
Indicators could reflect the most important aspects of institutional
performance of water management and apply these indicators in the
case of Uzbekistan and Ghana.
Molle and Mollinga (2003) Water indicators have the potential to define and quantify a state Quantify a state
of "water poverty” and to inform policy with regard to the remedial
actions that need to be taken.
Sullivan et al. (2003) Water poverty index was developed as a holistic tool to measure Holistic tool/measure
the water stress at the household and community levels,
designed to aid national decision makers, at community and
central government level, as well as donor agencies, to determine
priority needs for interventions in the water sector.
Rijsberman (2004) Understanding of water scarcity is important because it affects the Measures of water scarcity
views of users and policy makers on the urgency to address the
water crisis as well as their views on the most effective policies to
address the water crisis. Measures of waters scarcity and their
advantages and limitations are reviewed.
Garriga and Foguet (2005) WPI is a holistic tool to address poverty linkages to water Holistic tool
provision. It has been tested at local scale in Bolivia. An outcome
of the project has been the development of an enhanced WPI.
Enhanced WPI (eWPI) was primarily designed to produce a
holistic tool for policy making, aimed at allowing resource
managers to determine and target priority needs in the water
sector, while assessing development process.
Rao (2007) The Index of Drinking Water Adequacy (IDWA) was proposed to Assessment tool
address some of the limitations of the Water Poverty Index,
particularly the failure of the latter to assess “quantitatively
and qualitatively good access with coverage that is secure.
The IDWA is estimated for 23 developing member countries
(DMCs) and suggests the relative position of the DMCs in a more
comprehensive fashion than do simple access indicators.
Winarni (2009) The Infrastructure Leakage Index (ILI) was introduced as water Indicator of performance
losses indicator, which is a performance indicator used for
comparing leakage management in water supply systems.
De Stefano (2010) The Key Environmental Indicators (KEI) are envisioned to inform
the general public and policymakers and also, assess the
societal response to water problems.
Sternlieb and Laituri (2010) Indicators are monitoring tools that are developed by scientists Monitoring and evaluation tools
and researchers to explain phenomena, reflect changes over time,
inform policy, compare situations, and evaluate environmental
performance and sustainability to achieve program goals.
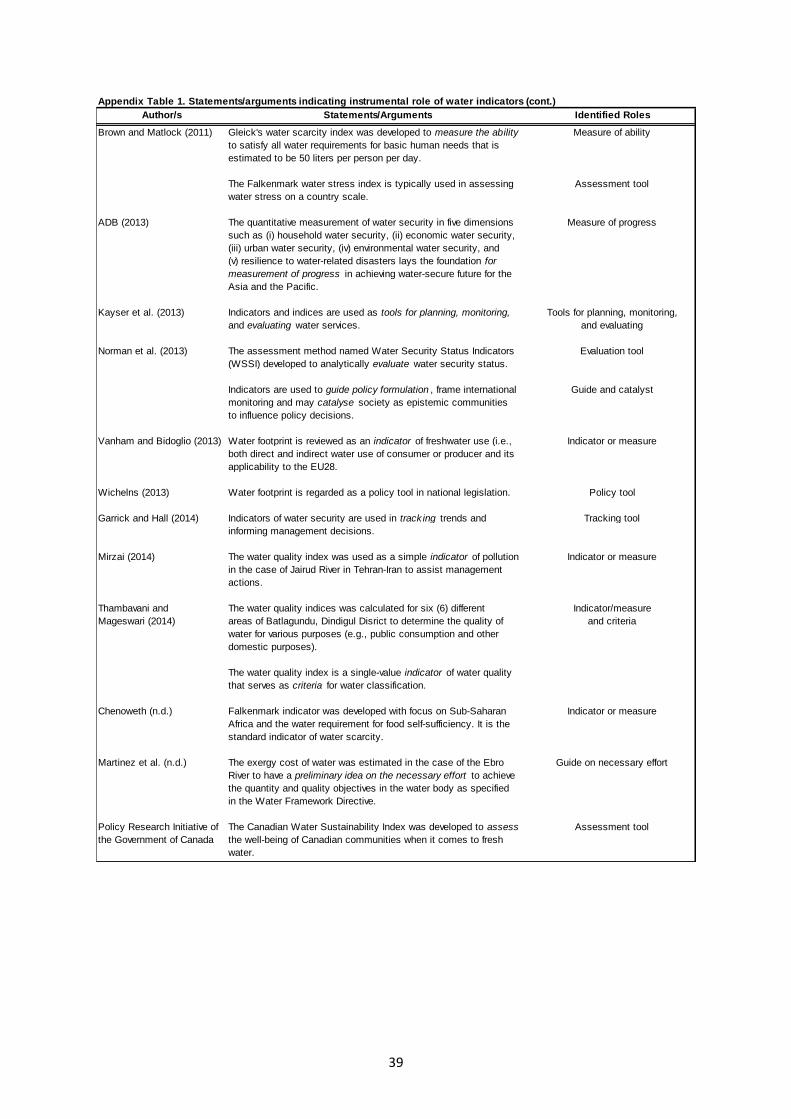
39
Appendix Table 1. Statements/arguments indicating instrumental role of water indicators (cont.)
Author/s Statements/Arguments Identified Roles
Brown and Matlock (2011) Gleick's water scarcity index was developed to measure the ability Measure of ability
to satisfy all water requirements for basic human needs that is
estimated to be 50 liters per person per day.
The Falkenmark water stress index is typically used in assessing Assessment tool
water stress on a country scale.
ADB (2013) The quantitative measurement of water security in five dimensions Measure of progress
such as (i) household water security, (ii) economic water security,
(iii) urban water security, (iv) environmental water security, and
(v) resilience to water-related disasters lays the foundation for
measurement of progress in achieving water-secure future for the
Asia and the Pacific.
Kayser et al. (2013) Indicators and indices are used as tools for planning, monitoring, Tools for planning, monitoring,
and evaluating water services. and evaluating
Norman et al. (2013) The assessment method named Water Security Status Indicators Evaluation tool
(WSSI) developed to analytically evaluate water security status.
Indicators are used to guide policy formulation , frame international Guide and catalyst
monitoring and may catalyse society as epistemic communities
to influence policy decisions.
Vanham and Bidoglio (2013) Water footprint is reviewed as an indicator of freshwater use (i.e., Indicator or measure
both direct and indirect water use of consumer or producer and its
applicability to the EU28.
Wichelns (2013) Water footprint is regarded as a policy tool in national legislation. Policy tool
Garrick and Hall (2014) Indicators of water security are used in track ing trends and Tracking tool
informing management decisions.
Mirzai (2014) The water quality index was used as a simple indicator of pollution Indicator or measure
in the case of Jairud River in Tehran-Iran to assist management
actions.
Thambavani and The water quality indices was calculated for six (6) different Indicator/measure
Mageswari (2014) areas of Batlagundu, Dindigul Disrict to determine the quality of and criteria
water for various purposes (e.g., public consumption and other
domestic purposes).
The water quality index is a single-value indicator of water quality
that serves as criteria for water classification.
Chenoweth (n.d.) Falkenmark indicator was developed with focus on Sub-Saharan Indicator or measure
Africa and the water requirement for food self-sufficiency. It is the
standard indicator of water scarcity.
Martinez et al. (n.d.) The exergy cost of water was estimated in the case of the Ebro Guide on necessary effort
River to have a preliminary idea on the necessary effort to achieve
the quantity and quality objectives in the water body as specified
in the Water Framework Directive.
Policy Research Initiative of The Canadian Water Sustainability Index was developed to assess Assessment tool
the Government of Canada the well-being of Canadian communities when it comes to fresh
water.
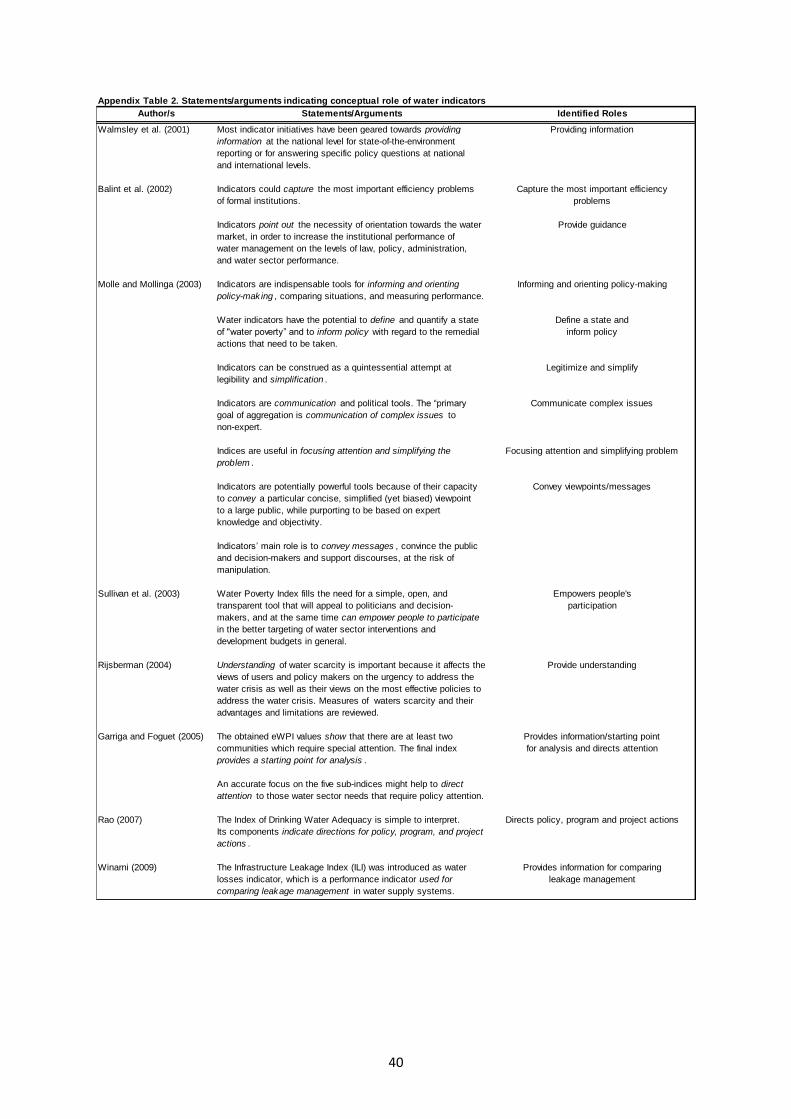
40
Appendix Table 2. Statements/arguments indicating conceptual role of water indicators
Author/s Statements/Arguments Identified Roles
Walmsley et al. (2001) Most indicator initiatives have been geared towards providing Providing information
information at the national level for state-of-the-environment
reporting or for answering specific policy questions at national
and international levels.
Balint et al. (2002) Indicators could capture the most important efficiency problems Capture the most important efficiency
of formal institutions. problems
Indicators point out the necessity of orientation towards the water Provide guidance
market, in order to increase the institutional performance of
water management on the levels of law, policy, administration,
and water sector performance.
Molle and Mollinga (2003) Indicators are indispensable tools for informing and orienting Informing and orienting policy-making
policy-making , comparing situations, and measuring performance.
Water indicators have the potential to define and quantify a state Define a state and
of "water poverty” and to inform policy with regard to the remedial inform policy
actions that need to be taken.
Indicators can be construed as a quintessential attempt at Legitimize and simplify
legibility and simplification .
Indicators are communication and political tools. The “primary Communicate complex issues
goal of aggregation is communication of complex issues to
non-expert.
Indices are useful in focusing attention and simplifying the Focusing attention and simplifying problem
problem .
Indicators are potentially powerful tools because of their capacity Convey viewpoints/messages
to convey a particular concise, simplified (yet biased) viewpoint
to a large public, while purporting to be based on expert
knowledge and objectivity.
Indicators’ main role is to convey messages , convince the public
and decision-makers and support discourses, at the risk of
manipulation.
Sullivan et al. (2003) Water Poverty Index fills the need for a simple, open, and Empowers people's
transparent tool that will appeal to politicians and decision- participation
makers, and at the same time can empower people to participate
in the better targeting of water sector interventions and
development budgets in general.
Rijsberman (2004) Understanding of water scarcity is important because it affects the Provide understanding
views of users and policy makers on the urgency to address the
water crisis as well as their views on the most effective policies to
address the water crisis. Measures of waters scarcity and their
advantages and limitations are reviewed.
Garriga and Foguet (2005) The obtained eWPI values show that there are at least two Provides information/starting point
communities which require special attention. The final index for analysis and directs attention
provides a starting point for analysis .
An accurate focus on the five sub-indices might help to direct
attention to those water sector needs that require policy attention.
Rao (2007) The Index of Drinking Water Adequacy is simple to interpret. Directs policy, program and project actions
Its components indicate directions for policy, program, and project
actions .
Winarni (2009) The Infrastructure Leakage Index (ILI) was introduced as water Provides information for comparing
losses indicator, which is a performance indicator used for leakage management
comparing leakage management in water supply systems.
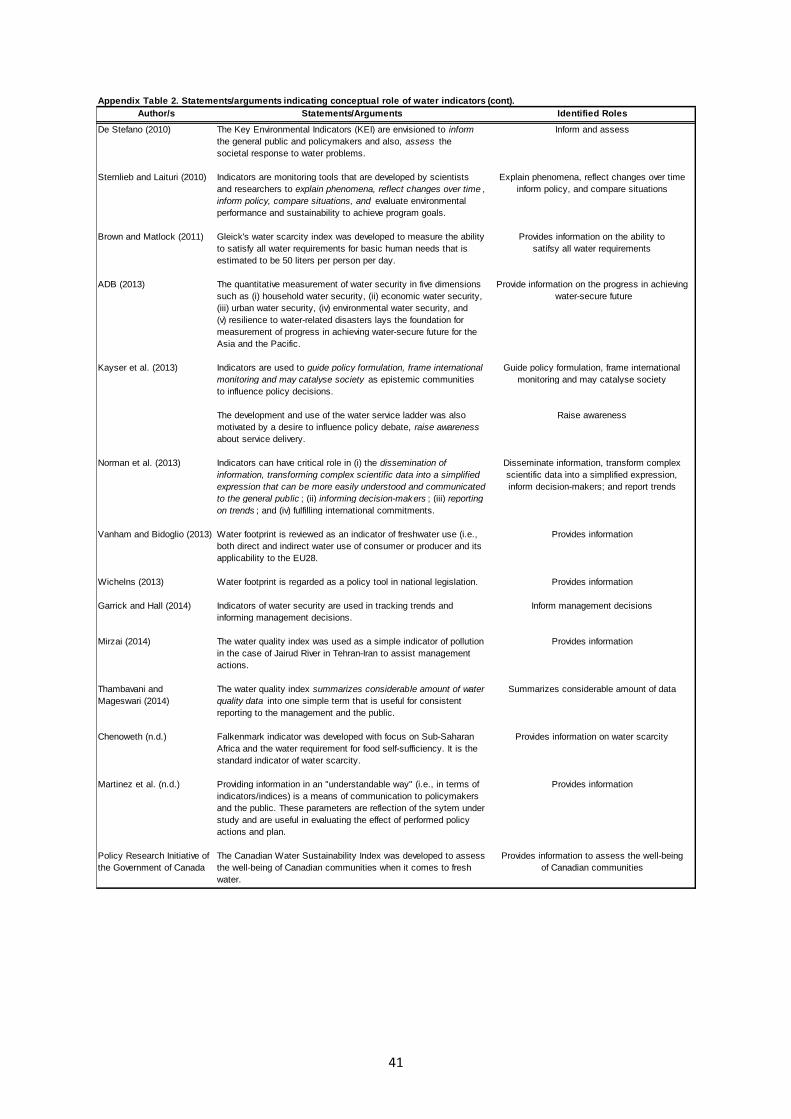
41
Appendix Table 2. Statements/arguments indicating conceptual role of water indicators (cont).
Author/s Statements/Arguments Identified Roles
De Stefano (2010) The Key Environmental Indicators (KEI) are envisioned to inform Inform and assess
the general public and policymakers and also, assess the
societal response to water problems.
Sternlieb and Laituri (2010) Indicators are monitoring tools that are developed by scientists Explain phenomena, reflect changes over time
and researchers to explain phenomena, reflect changes over time , inform policy, and compare situations
inform policy, compare situations, and evaluate environmental
performance and sustainability to achieve program goals.
Brown and Matlock (2011) Gleick's water scarcity index was developed to measure the ability Provides information on the ability to
to satisfy all water requirements for basic human needs that is satifsy all water requirements
estimated to be 50 liters per person per day.
ADB (2013) The quantitative measurement of water security in five dimensions Provide information on the progress in achieving
such as (i) household water security, (ii) economic water security, water-secure future
(iii) urban water security, (iv) environmental water security, and
(v) resilience to water-related disasters lays the foundation for
measurement of progress in achieving water-secure future for the
Asia and the Pacific.
Kayser et al. (2013) Indicators are used to guide policy formulation, frame international Guide policy formulation, frame international
monitoring and may catalyse society as epistemic communities monitoring and may catalyse society
to influence policy decisions.
The development and use of the water service ladder was also Raise awareness
motivated by a desire to influence policy debate, raise awareness
about service delivery.
Norman et al. (2013) Indicators can have critical role in (i) the dissemination of Disseminate information, transform complex
information, transforming complex scientific data into a simplified scientific data into a simplified expression,
expression that can be more easily understood and communicated inform decision-makers; and report trends
to the general public ; (ii) informing decision-makers ; (iii) reporting
on trends ; and (iv) fulfilling international commitments.
Vanham and Bidoglio (2013) Water footprint is reviewed as an indicator of freshwater use (i.e., Provides information
both direct and indirect water use of consumer or producer and its
applicability to the EU28.
Wichelns (2013) Water footprint is regarded as a policy tool in national legislation. Provides information
Garrick and Hall (2014) Indicators of water security are used in tracking trends and Inform management decisions
informing management decisions.
Mirzai (2014) The water quality index was used as a simple indicator of pollution Provides information
in the case of Jairud River in Tehran-Iran to assist management
actions.
Thambavani and The water quality index summarizes considerable amount of water Summarizes considerable amount of data
Mageswari (2014) quality data into one simple term that is useful for consistent
reporting to the management and the public.
Chenoweth (n.d.) Falkenmark indicator was developed with focus on Sub-Saharan Provides information on water scarcity
Africa and the water requirement for food self-sufficiency. It is the
standard indicator of water scarcity.
Martinez et al. (n.d.) Providing information in an "understandable way" (i.e., in terms of Provides information
indicators/indices) is a means of communication to policymakers
and the public. These parameters are reflection of the sytem under
study and are useful in evaluating the effect of performed policy
actions and plan.
Policy Research Initiative of The Canadian Water Sustainability Index was developed to assess Provides information to assess the well-being
the Government of Canada the well-being of Canadian communities when it comes to fresh of Canadian communities
water.
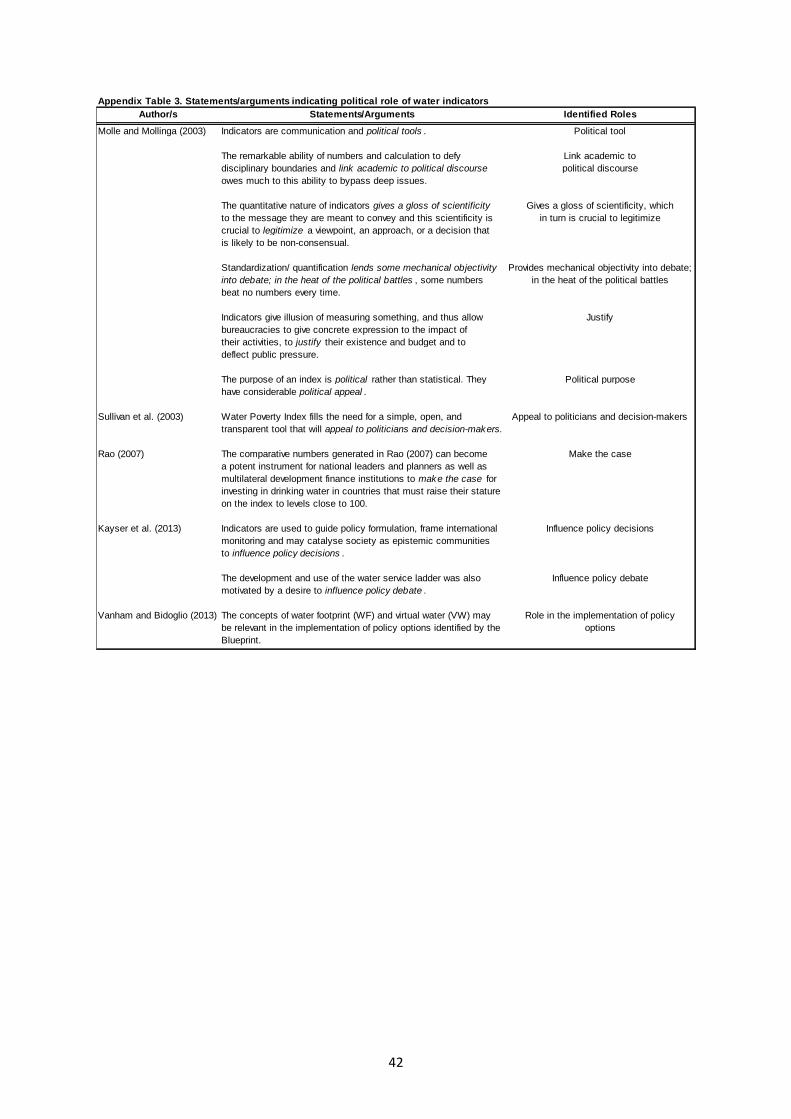
42
Appendix Table 3. Statements/arguments indicating political role of water indicators
Author/s Statements/Arguments Identified Roles
Molle and Mollinga (2003) Indicators are communication and political tools . Political tool
The remarkable ability of numbers and calculation to defy Link academic to
disciplinary boundaries and link academic to political discourse political discourse
owes much to this ability to bypass deep issues.
The quantitative nature of indicators gives a gloss of scientificity Gives a gloss of scientificity, which
to the message they are meant to convey and this scientificity is in turn is crucial to legitimize
crucial to legitimize a viewpoint, an approach, or a decision that
is likely to be non-consensual.
Standardization/ quantification lends some mechanical objectivity Provides mechanical objectivity into debate;
into debate; in the heat of the political battles , some numbers in the heat of the political battles
beat no numbers every time.
Indicators give illusion of measuring something, and thus allow Justify
bureaucracies to give concrete expression to the impact of
their activities, to justify their existence and budget and to
deflect public pressure.
The purpose of an index is political rather than statistical. They Political purpose
have considerable political appeal .
Sullivan et al. (2003) Water Poverty Index fills the need for a simple, open, and Appeal to politicians and decision-makers
transparent tool that will appeal to politicians and decision-makers.
Rao (2007) The comparative numbers generated in Rao (2007) can become Make the case
a potent instrument for national leaders and planners as well as
multilateral development finance institutions to make the case for
investing in drinking water in countries that must raise their stature
on the index to levels close to 100.
Kayser et al. (2013) Indicators are used to guide policy formulation, frame international Influence policy decisions
monitoring and may catalyse society as epistemic communities
to influence policy decisions .
The development and use of the water service ladder was also Influence policy debate
motivated by a desire to influence policy debate .
Vanham and Bidoglio (2013) The concepts of water footprint (WF) and virtual water (VW) may Role in the implementation of policy
be relevant in the implementation of policy options identified by the options
Blueprint.


