Embed Size (px)
Citation preview
infrastructures
Review
Pollutant Emissions in Ports: A Comprehensive Review
Salvatore Barberi 1,*, Mariacrocetta Sambito 2 , Larysa Neduzha 3 and Alessandro Severino 4
�����������������
Citation: Barberi, S.; Sambito, M.;
Neduzha, L.; Severino, A. Pollutant
Emissions in Ports: A Comprehensive
Review. Infrastructures 2021, 6, 114.
https://doi.org/10.3390/
infrastructures6080114
Academic Editors: Reza Haghani,
Rami Hawileh and Paolo S. Valvo
Received: 7 July 2021
Accepted: 4 August 2021
Published: 14 August 2021
Publisher’s Note: MDPI stays neutral
with regard to jurisdictional claims in
published maps and institutional affil-
iations.
Copyright: © 2021 by the authors.
Licensee MDPI, Basel, Switzerland.
This article is an open access article
distributed under the terms and
conditions of the Creative Commons
Attribution (CC BY) license (https://
creativecommons.org/licenses/by/
4.0/).
1 School of Engineering and Architecture, University of Enna “Kore”, 94100 Enna, Italy2 Department of Engineering, University of Palermo, Viale Delle Scienze, Ed. 8, 90100 Palermo, Italy;
[email protected] Department of Theoretical and Structural Mechanics, Dnipro National University of Railway Transport
Named after Academician V. Lazaryan, Lazaryan St. 2, 49010 Dnipro, Ukraine; [email protected] Department of Civil Engineering and Architecture, University of Catania, 95123 Catania, Italy;
[email protected]* Correspondence: [email protected]
Abstract: In recent decades, maritime transport demand has increased along with world populationand global trades. This is associated with higher pollution levels, including the emissions of GHGand other polluting gases. Ports are important elements within maritime transport and contributethemselves to pollutant emissions. This paper aims to offer a comprehensive yet technical reviewof the latest related technologies, explaining and covering aspects that link ports with emissions,i.e., analyzing, monitoring, assessing, and mitigating emissions in ports. This has been achievedthrough a robust scientific analysis of very recent and significant research studies, to offer an up-to-date and reliable overview. Results show the correlation between emissions and port infrastructures,and demonstrate how proper interventions can help with reducing pollutant emissions and financialcosts as well, in ports and for maritime transportation in general. Besides, this review also wishes topropose new ideas for future research: new future experimental studies might spin-off from it, andperhaps port Authorities might be inspired to experiment and implement dedicated technologies toimprove their impact on environment and sustainability.
Keywords: emissions; ports; maritime transport; CO2; renewable energies
1. About This Document and How to Consult It
This review goes through the recent state of art of port emissions, introducing thetopic first, and reporting then some of the most relevant technologies to assess and miti-gate polluting emissions. This paper will focus on ports, offering a general overview onthe subject and aiming to stimulate interest and new ideas for future scientific research.Although the topic requires long-term digressions due to its intrinsic nature (old industry),the chosen reference literature and sources will be as recent as possible. The adoptedmethodology consists of a systematic and selective review of the latest relevant scientificliterature (within the last five years from the current date, and preferably since 2019 when-ever available). Section 1 (current) introduces aims and methodology for this study, and itis also meant as a brief technical guide on how to approach and consult this text. After abrief introduction in Section 2 and background digression about the topic in Section 3, theprincipal types of emissions involved in ports and maritime transport will be describedin Section 4. Section 5 will present some of the most recent methodologies designed toestimate, detect, and monitor emissions in ports, mentioning several case studies carriedout for different scenarios and geographical locations. Section 6 will list some of the mostimportant systems and technologies aimed to manage maritime emissions focusing onports and their related maritime transport operations (i.e., hoteling maneuvers). Section 7will develop a discussion over the subject, also aiming to spark new ideas and inspirationsfor future research. Eventually, final conclusions will be made in Section 8.
Infrastructures 2021, 6, 114. https://doi.org/10.3390/infrastructures6080114 https://www.mdpi.com/journal/infrastructures
Infrastructures 2021, 6, 114 2 of 36
2. Introduction
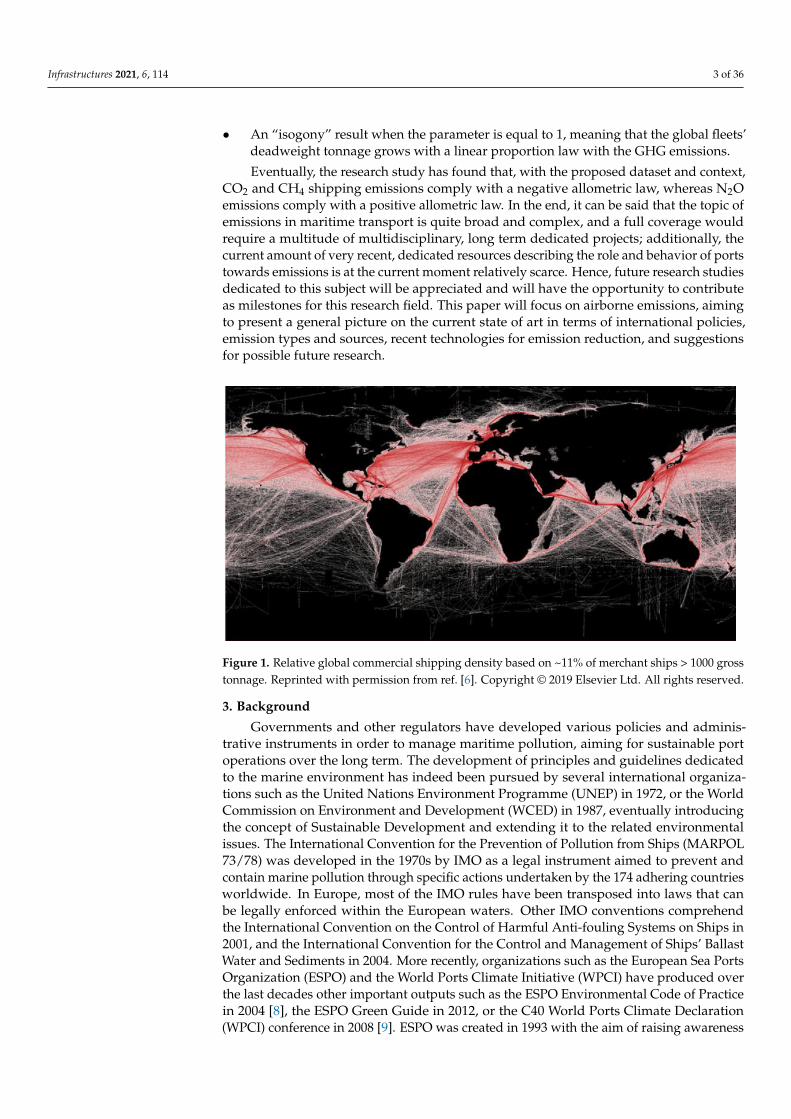
In the last decades, maritime transport has experienced a rapid and significant increasedue to the growth of international trades and commercial demands [1]. Besides, maritimetransport is, to date, the most cost-effective transport method for covering long distancesand moving large quantities of goods, with ports from all over the world handling themajority of the worldwide trading volume: it is estimated that over 80% of the world’straded goods are transported through maritime shipping [2]. The demand for new portshas hence increased and the existing infrastructure has had to go through developmentworks for expansion; the larger a port becomes, the higher is the correlated risk of pollutiondue to higher traffics and related operations. Although this aspect can be considered as anindicator of increasing economic wealth, the construction and expansion of ports, alongwith an increasing demand for maritime transportation, make a significant impact onthe environment which cannot be neglected, especially in the current era characterizedby deep sensitivity and awareness towards environmental aspects [3]. As an attemptto face environmental risks some ports have already implemented internal policies inorder to comply with national and international regulations by containing pollution levels,aiming to reduce emissions, and to implement energy saving measures. In fact, themaritime transport being a business of international breadth due to its intrinsic nature, theimplementation of environmental policies should not be confined to single countries ontheir own, and should involve instead a multitude of cooperating governments withina network of interacting stakeholders [4,5], and as it can be imagined, this is not alwayseasy or even possible. In this sense, one of the motivators to get the interested parties tointervene worldwide, remains perhaps the enhancement of economic and financial benefitsfor environment-related activities, i.e., tax reductions, grants, and funding, obtained forexample once a significant reduction in emissions is demonstrated. It must also be notedthat, due to the intrinsic nature of port infrastructures, maritime and coastal pollution canaffect different matrices such as air, ground, and water. Energy consumption, or EnergyEfficiency to use a more recent terminology, is another environmentally related aspectthat should be considered when dealing with ports, not to mention all those other issuesconnected to CO2 emissions and climate change. Other forms of pollution also includelight pollution, odors, and dust. Besides, ports are often built in proximity of urbanizedareas, therefore port pollution can also affect those communities living nearby with risksto human health, especially when associated with other neighboring polluting sourcessuch as production plants, transport hubs, and so on. This being said, it can be helpfulto visualize some data showing how the demand for maritime transport has increasedthrough time, and then analyze the relationship with emissions. Figure 1 below [6] showsthe relative global commercial shipping density (in red) based on the 11% circa of merchantships with over-1000 gross tonnage, between 2004 and 2005.
The relationship between the development of global maritime fleets and GreenhouseGases (GHG) emissions from shipping can be examined with “allometric” models. Allome-try can be intended as the disproportional growth relation between two correlated factors,and can be used to describe the disproportional growing relation between expandingmaritime fleets and the emission of Greenhouse Gases (GHG). A mathematical modelhas been elaborated [7] under the hypothesis of not implementing any GHG reductionsystems and based on a data set covering the years between 1990 and 2015, contributedby the International Maritime Organization (IMO), the International Council on CleanTransportation (ICCT), and the United Nations Conference on Trade and Development(UNCTD). This growth model calculates a mathematical parameter based on the ratiobetween the deadweight tonnage of global fleets and the maritime GHG emissions for anassumed time, returning three possible outputs:
• A “positive” allometric result when the parameter is greater than 1; this means thatthe global fleets’ deadweight tonnage grows faster than the GHG emissions.
• A “negative” result when the parameter is lesser than 1, meaning that the global fleets’deadweight tonnage grows slower than the GHG emissions.
Infrastructures 2021, 6, 114 3 of 36
• An “isogony” result when the parameter is equal to 1, meaning that the global fleets’deadweight tonnage grows with a linear proportion law with the GHG emissions.
Eventually, the research study has found that, with the proposed dataset and context,CO2 and CH4 shipping emissions comply with a negative allometric law, whereas N2Oemissions comply with a positive allometric law. In the end, it can be said that the topic ofemissions in maritime transport is quite broad and complex, and a full coverage wouldrequire a multitude of multidisciplinary, long term dedicated projects; additionally, thecurrent amount of very recent, dedicated resources describing the role and behavior of portstowards emissions is at the current moment relatively scarce. Hence, future research studiesdedicated to this subject will be appreciated and will have the opportunity to contributeas milestones for this research field. This paper will focus on airborne emissions, aimingto present a general picture on the current state of art in terms of international policies,emission types and sources, recent technologies for emission reduction, and suggestionsfor possible future research.
Infrastructures 2021, 6, x FOR PEER REVIEW 3 of 40
Figure 1. Relative global commercial shipping density based on ~11% of merchant ships > 1000 gross
tonnage. Reprinted with permission from ref. [6]. Copyright © 2019 Elsevier Ltd. All rights reserved.
The relationship between the development of global maritime fleets and Greenhouse
Gases (GHG) emissions from shipping can be examined with “allometric” models. Allom-
etry can be intended as the disproportional growth relation between two correlated fac-
tors, and can be used to describe the disproportional growing relation between expanding
maritime fleets and the emission of Greenhouse Gases (GHG). A mathematical model has
been elaborated [7] under the hypothesis of not implementing any GHG reduction sys-
tems and based on a data set covering the years between 1990 and 2015, contributed by
the International Maritime Organization (IMO), the International Council on Clean Trans-
portation (ICCT), and the United Nations Conference on Trade and Development
(UNCTD). This growth model calculates a mathematical parameter based on the ratio be-
tween the deadweight tonnage of global fleets and the maritime GHG emissions for an
assumed time, returning three possible outputs:
• A “positive” allometric result when the parameter is greater than 1; this means that
the global fleets’ deadweight tonnage grows faster than the GHG emissions.
• A “negative” result when the parameter is lesser than 1, meaning that the global
fleets’ deadweight tonnage grows slower than the GHG emissions.
• An “isogony” result when the parameter is equal to 1, meaning that the global fleets’
deadweight tonnage grows with a linear proportion law with the GHG emissions.
Eventually, the research study has found that, with the proposed dataset and context,
CO2 and CH4 shipping emissions comply with a negative allometric law, whereas N2O
emissions comply with a positive allometric law. In the end, it can be said that the topic
of emissions in maritime transport is quite broad and complex, and a full coverage would
require a multitude of multidisciplinary, long term dedicated projects; additionally, the
current amount of very recent, dedicated resources describing the role and behavior of
ports towards emissions is at the current moment relatively scarce. Hence, future research
studies dedicated to this subject will be appreciated and will have the opportunity to con-
tribute as milestones for this research field. This paper will focus on airborne emissions,
aiming to present a general picture on the current state of art in terms of international
policies, emission types and sources, recent technologies for emission reduction, and sug-
gestions for possible future research.
3. Background
Governments and other regulators have developed various policies and administra-
tive instruments in order to manage maritime pollution, aiming for sustainable port op-
erations over the long term. The development of principles and guidelines dedicated to
the marine environment has indeed been pursued by several international organizations
Figure 1. Relative global commercial shipping density based on ~11% of merchant ships > 1000 grosstonnage. Reprinted with permission from ref. [6]. Copyright © 2019 Elsevier Ltd. All rights reserved.
3. Background
Governments and other regulators have developed various policies and adminis-trative instruments in order to manage maritime pollution, aiming for sustainable portoperations over the long term. The development of principles and guidelines dedicatedto the marine environment has indeed been pursued by several international organiza-tions such as the United Nations Environment Programme (UNEP) in 1972, or the WorldCommission on Environment and Development (WCED) in 1987, eventually introducingthe concept of Sustainable Development and extending it to the related environmentalissues. The International Convention for the Prevention of Pollution from Ships (MARPOL73/78) was developed in the 1970s by IMO as a legal instrument aimed to prevent andcontain marine pollution through specific actions undertaken by the 174 adhering countriesworldwide. In Europe, most of the IMO rules have been transposed into laws that canbe legally enforced within the European waters. Other IMO conventions comprehendthe International Convention on the Control of Harmful Anti-fouling Systems on Ships in2001, and the International Convention for the Control and Management of Ships’ BallastWater and Sediments in 2004. More recently, organizations such as the European Sea PortsOrganization (ESPO) and the World Ports Climate Initiative (WPCI) have produced overthe last decades other important outputs such as the ESPO Environmental Code of Practicein 2004 [8], the ESPO Green Guide in 2012, or the C40 World Ports Climate Declaration(WPCI) conference in 2008 [9]. ESPO was created in 1993 with the aim of raising awareness
Infrastructures 2021, 6, 114 4 of 36
among European nations and intervening in public policies, in order to make the Euro-pean port industry safer, more efficient, and more environmentally sustainable. Its GreenGuide [10] introduces five actions that ports should undertake to respond to environmentalchallenges, represented with five words starting with E and therefore known as the “5-Es”;according to the Green Guide, these actions can be briefly summarized as below:
• Exemplifying: Each port should aim to achieve optimum environmental performance,setting a good example for the other ports within the network
• Enabling: Proper operational and infrastructural conditions should be implementedand working, so to enable port users and external elements to access and operatewithin the port area improving environmental performance
• Encouraging: Incentives should be given to those port users that contribute to improveenvironmental performance
• Engaging: Port users, authorities and other interested stakeholders should beinvolved altogether, making them engage with each other to share knowledgeand skills, with actions such as participating in common projects in order to chaseenvironmental performance
• Enforcing: Compliance and positive environmental behavior should be enforcedthrough the use of adequate instruments (e.g., fines or surveillance)
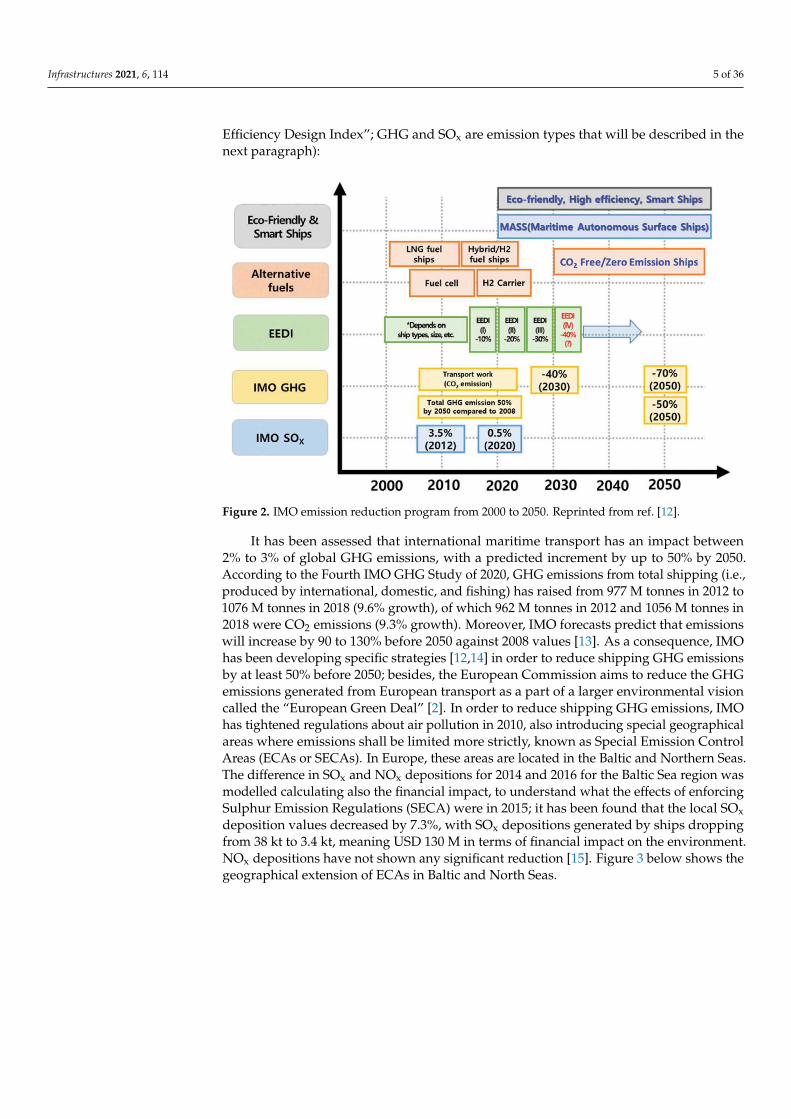
EcoPorts is an environmental initiative started in 1997 by the European Port Sector,consisting in a large network of ports collaborating with each other in order to contributeto environmental performance improvement, including the process of monitoring environ-mental parameters [9]. Since 2011, ESPO has incorporated EcoPorts within its structure.ESPO Environmental Reports, including the latest to date published in 2020, adopt variousenvironmental indicators to assess how ports have reacted to the implementation of theESPO Environmental Code of Practice. These indicators are distributed into four main cate-gories: Environmental Management, Environmental Monitoring, Top Ten EnvironmentalPriorities, and Green Services to Shipping. Environmental Management Indicators assesselements such as the existence of environmental policies, the definition of environmentalobjectives and targets for environmental improvement, the definition of environmentaltraining programs for port employees, transparency of information, and so on. It has beenobserved that in 2020, 96% of European ports were already implementing environmentalpolicies, and 88% had defined objectives and targets for environmental improvement;69% proceeded with the publication of environmental reports (i.e., transparency) and 55%provided dedicated environmental training for their staff. Moreover, 81% of Europeanports adopted environmental monitoring programs and 85% documented the environmen-tal responsibilities of their key personnel. Environmental Monitoring Indicators includeparameters such as Air Quality, Sediment Quality, Energy Efficiency, Water Quality, WaterConsumption, Noise, and so on. It is interesting to note that Air Quality has increasedfrom 2013 to 2020 of +15%, moving from 52% in 2013 to 67% in 2020, with a peak value of69% in 2018. Carbon Footprint had a +4%, constantly raising from 48% in 2013 to 52% in2020. Listing the top 10 environmental priorities for European ports in 2020, Air Quality isput at the first place, immediately followed by Climate Change (rising from 10th in 2017to 2nd in 2020) and then by Energy Efficiency; among other priorities are Noise, Dust,Dredging Operations, and Ship Waste. Green Services to Shipping parameters assess theefforts undertaken by port managing entities in order to pursue greener shipping, andare sub-divided into three smaller categories: provision of Onshore Power Supply (OPS),provision of Liquefied Natural Gas (LNG) bunkering facilities, and Environmentally Differ-entiated Port Fees [11]. More detailed data are of course available inside the ESPO reports,which are publicly available online, in line with the pursued objective of transparency.In the end, these approaches confirm how regulators are trying to intervene under manydiverse aspects, be it either costs or consideration of alternative marine fuel, to tacklemarine pollution and environmental challenges. Figure 2 [12] shows the progress andprogram from IMO to reduce emissions between 2000 and 2020 (EEDI stands for “Energy
Infrastructures 2021, 6, 114 5 of 36
Efficiency Design Index”; GHG and SOx are emission types that will be described in thenext paragraph):
Infrastructures 2021, 6, x FOR PEER REVIEW 5 of 40
Air Quality has increased from 2013 to 2020 of +15%, moving from 52% in 2013 to 67% in
2020, with a peak value of 69% in 2018. Carbon Footprint had a +4%, constantly raising
from 48% in 2013 to 52% in 2020. Listing the top 10 environmental priorities for European
ports in 2020, Air Quality is put at the first place, immediately followed by Climate
Change (rising from 10th in 2017 to 2nd in 2020) and then by Energy Efficiency; among
other priorities are Noise, Dust, Dredging Operations, and Ship Waste. Green Services to
Shipping parameters assess the efforts undertaken by port managing entities in order to
pursue greener shipping, and are sub-divided into three smaller categories: provision of
Onshore Power Supply (OPS), provision of Liquefied Natural Gas (LNG) bunkering facil-
ities, and Environmentally Differentiated Port Fees [11]. More detailed data are of course
available inside the ESPO reports, which are publicly available online, in line with the
pursued objective of transparency. In the end, these approaches confirm how regulators
are trying to intervene under many diverse aspects, be it either costs or consideration of
alternative marine fuel, to tackle marine pollution and environmental challenges. Figure
2 [12] shows the progress and program from IMO to reduce emissions between 2000 and
2020 (EEDI stands for “Energy Efficiency Design Index”; GHG and SOx are emission types
that will be described in the next paragraph):
Figure 2. IMO emission reduction program from 2000 to 2050. Reprinted from ref. [12].
It has been assessed that international maritime transport has an impact between 2%
to 3% of global GHG emissions, with a predicted increment by up to 50% by 2050. Accord-
ing to the Fourth IMO GHG Study of 2020, GHG emissions from total shipping (i.e., pro-
duced by international, domestic, and fishing) has raised from 977 M tonnes in 2012 to
1076 M tonnes in 2018 (9.6% growth), of which 962 M tonnes in 2012 and 1056 M tonnes
in 2018 were CO2 emissions (9.3% growth). Moreover, IMO forecasts predict that emis-
sions will increase by 90 to 130% before 2050 against 2008 values [13]. As a consequence,
IMO has been developing specific strategies [12,14] in order to reduce shipping GHG
emissions by at least 50% before 2050; besides, the European Commission aims to reduce
the GHG emissions generated from European transport as a part of a larger environmental
vision called the “European Green Deal” [2]. In order to reduce shipping GHG emissions,
IMO has tightened regulations about air pollution in 2010, also introducing special geo-
graphical areas where emissions shall be limited more strictly, known as Special Emission
Control Areas (ECAs or SECAs). In Europe, these areas are located in the Baltic and North-
ern Seas. The difference in SOx and NOx depositions for 2014 and 2016 for the Baltic Sea
region was modelled calculating also the financial impact, to understand what the effects
Figure 2. IMO emission reduction program from 2000 to 2050. Reprinted from ref. [12].
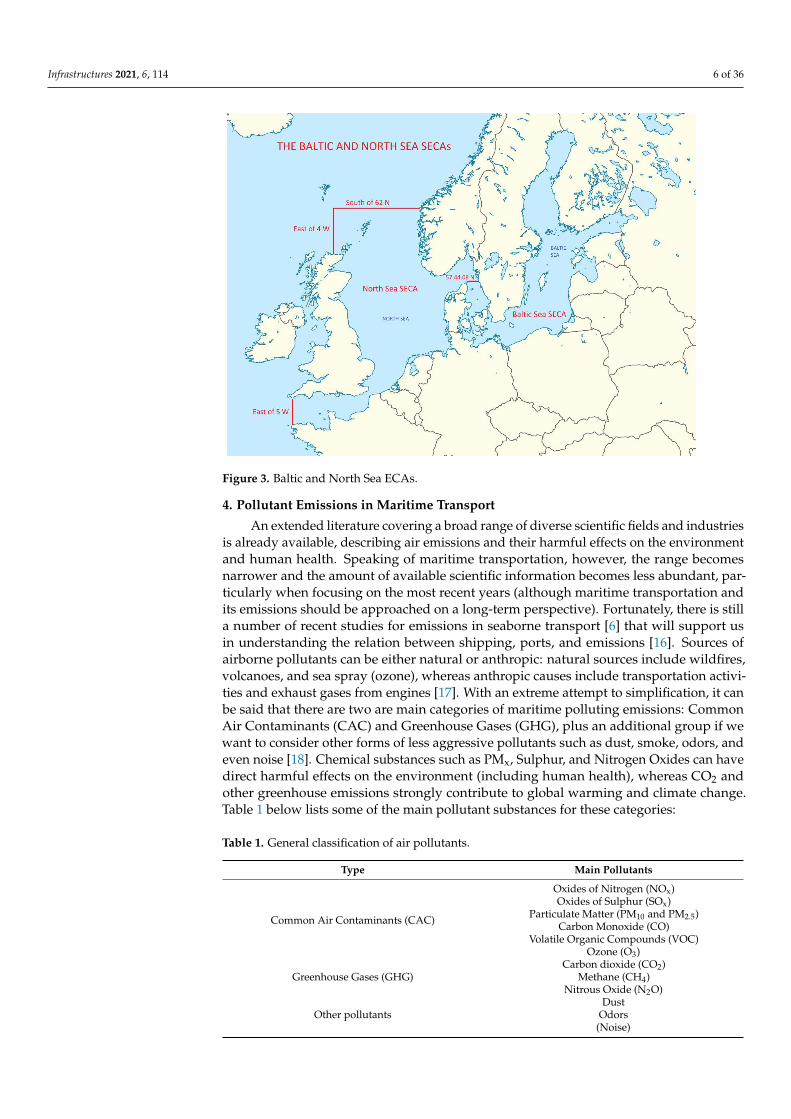
It has been assessed that international maritime transport has an impact between2% to 3% of global GHG emissions, with a predicted increment by up to 50% by 2050.According to the Fourth IMO GHG Study of 2020, GHG emissions from total shipping (i.e.,produced by international, domestic, and fishing) has raised from 977 M tonnes in 2012 to1076 M tonnes in 2018 (9.6% growth), of which 962 M tonnes in 2012 and 1056 M tonnes in2018 were CO2 emissions (9.3% growth). Moreover, IMO forecasts predict that emissionswill increase by 90 to 130% before 2050 against 2008 values [13]. As a consequence, IMOhas been developing specific strategies [12,14] in order to reduce shipping GHG emissionsby at least 50% before 2050; besides, the European Commission aims to reduce the GHGemissions generated from European transport as a part of a larger environmental visioncalled the “European Green Deal” [2]. In order to reduce shipping GHG emissions, IMOhas tightened regulations about air pollution in 2010, also introducing special geographicalareas where emissions shall be limited more strictly, known as Special Emission ControlAreas (ECAs or SECAs). In Europe, these areas are located in the Baltic and Northern Seas.The difference in SOx and NOx depositions for 2014 and 2016 for the Baltic Sea region wasmodelled calculating also the financial impact, to understand what the effects of enforcingSulphur Emission Regulations (SECA) were in 2015; it has been found that the local SOxdeposition values decreased by 7.3%, with SOx depositions generated by ships droppingfrom 38 kt to 3.4 kt, meaning USD 130 M in terms of financial impact on the environment.NOx depositions have not shown any significant reduction [15]. Figure 3 below shows thegeographical extension of ECAs in Baltic and North Seas.
Infrastructures 2021, 6, 114 6 of 36
Infrastructures 2021, 6, x FOR PEER REVIEW 6 of 40
of enforcing Sulphur Emission Regulations (SECA) were in 2015; it has been found that
the local SOx deposition values decreased by 7.3%, with SOx depositions generated by
ships dropping from 38 kt to 3.4 kt, meaning USD 130 M in terms of financial impact on
the environment. NOx depositions have not shown any significant reduction [15]. Figure
3 below shows the geographical extension of ECAs in Baltic and North Seas.
Figure 3. Baltic and North Sea ECAs.
4. Pollutant Emissions in Maritime Transport
An extended literature covering a broad range of diverse scientific fields and indus-
tries is already available, describing air emissions and their harmful effects on the envi-
ronment and human health. Speaking of maritime transportation, however, the range be-
comes narrower and the amount of available scientific information becomes less abun-
dant, particularly when focusing on the most recent years (although maritime transporta-
tion and its emissions should be approached on a long-term perspective). Fortunately,
there is still a number of recent studies for emissions in seaborne transport [6] that will
support us in understanding the relation between shipping, ports, and emissions [16].
Sources of airborne pollutants can be either natural or anthropic: natural sources include
wildfires, volcanoes, and sea spray (ozone), whereas anthropic causes include transporta-
tion activities and exhaust gases from engines [17]. With an extreme attempt to simplifi-
cation, it can be said that there are two are main categories of maritime polluting emis-
sions: Common Air Contaminants (CAC) and Greenhouse Gases (GHG), plus an addi-
tional group if we want to consider other forms of less aggressive pollutants such as dust,
smoke, odors, and even noise [18]. Chemical substances such as PMx, Sulphur, and Nitro-
gen Oxides can have direct harmful effects on the environment (including human health),
whereas CO2 and other greenhouse emissions strongly contribute to global warming and
climate change. Table 1 below lists some of the main pollutant substances for these cate-
gories:
Figure 3. Baltic and North Sea ECAs.
4. Pollutant Emissions in Maritime Transport
An extended literature covering a broad range of diverse scientific fields and industriesis already available, describing air emissions and their harmful effects on the environmentand human health. Speaking of maritime transportation, however, the range becomesnarrower and the amount of available scientific information becomes less abundant, par-ticularly when focusing on the most recent years (although maritime transportation andits emissions should be approached on a long-term perspective). Fortunately, there is stilla number of recent studies for emissions in seaborne transport [6] that will support usin understanding the relation between shipping, ports, and emissions [16]. Sources ofairborne pollutants can be either natural or anthropic: natural sources include wildfires,volcanoes, and sea spray (ozone), whereas anthropic causes include transportation activi-ties and exhaust gases from engines [17]. With an extreme attempt to simplification, it canbe said that there are two are main categories of maritime polluting emissions: CommonAir Contaminants (CAC) and Greenhouse Gases (GHG), plus an additional group if wewant to consider other forms of less aggressive pollutants such as dust, smoke, odors, andeven noise [18]. Chemical substances such as PMx, Sulphur, and Nitrogen Oxides can havedirect harmful effects on the environment (including human health), whereas CO2 andother greenhouse emissions strongly contribute to global warming and climate change.Table 1 below lists some of the main pollutant substances for these categories:
Table 1. General classification of air pollutants.
Type Main Pollutants
Common Air Contaminants (CAC)
Oxides of Nitrogen (NOx)Oxides of Sulphur (SOx)
Particulate Matter (PM10 and PM2.5)Carbon Monoxide (CO)
Volatile Organic Compounds (VOC)Ozone (O3)
Greenhouse Gases (GHG)Carbon dioxide (CO2)
Methane (CH4)Nitrous Oxide (N2O)
Other pollutantsDust
Odors(Noise)
Infrastructures 2021, 6, 114 7 of 36
4.1. Greenhouse Gases (GHG)
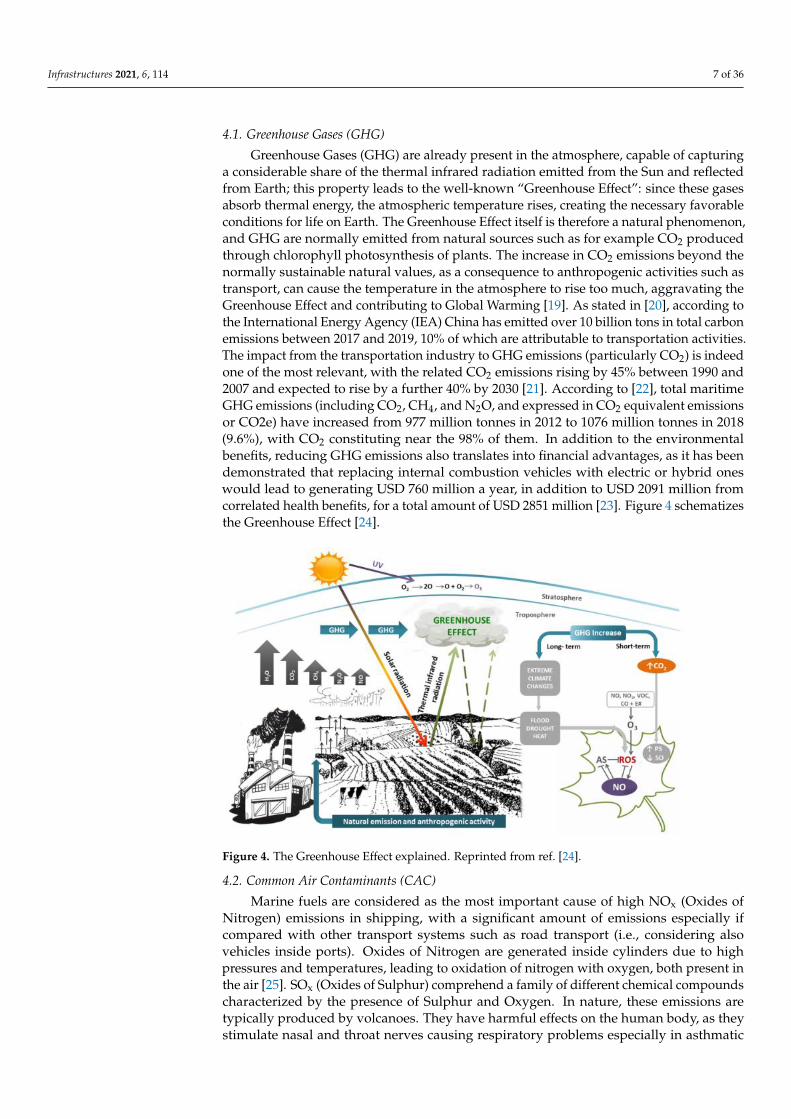
Greenhouse Gases (GHG) are already present in the atmosphere, capable of capturinga considerable share of the thermal infrared radiation emitted from the Sun and reflectedfrom Earth; this property leads to the well-known “Greenhouse Effect”: since these gasesabsorb thermal energy, the atmospheric temperature rises, creating the necessary favorableconditions for life on Earth. The Greenhouse Effect itself is therefore a natural phenomenon,and GHG are normally emitted from natural sources such as for example CO2 producedthrough chlorophyll photosynthesis of plants. The increase in CO2 emissions beyond thenormally sustainable natural values, as a consequence to anthropogenic activities such astransport, can cause the temperature in the atmosphere to rise too much, aggravating theGreenhouse Effect and contributing to Global Warming [19]. As stated in [20], according tothe International Energy Agency (IEA) China has emitted over 10 billion tons in total carbonemissions between 2017 and 2019, 10% of which are attributable to transportation activities.The impact from the transportation industry to GHG emissions (particularly CO2) is indeedone of the most relevant, with the related CO2 emissions rising by 45% between 1990 and2007 and expected to rise by a further 40% by 2030 [21]. According to [22], total maritimeGHG emissions (including CO2, CH4, and N2O, and expressed in CO2 equivalent emissionsor CO2e) have increased from 977 million tonnes in 2012 to 1076 million tonnes in 2018(9.6%), with CO2 constituting near the 98% of them. In addition to the environmentalbenefits, reducing GHG emissions also translates into financial advantages, as it has beendemonstrated that replacing internal combustion vehicles with electric or hybrid oneswould lead to generating USD 760 million a year, in addition to USD 2091 million fromcorrelated health benefits, for a total amount of USD 2851 million [23]. Figure 4 schematizesthe Greenhouse Effect [24].
Infrastructures 2021, 6, x FOR PEER REVIEW 8 of 40
Figure 4. The Greenhouse Effect explained. Reprinted from ref. [24].
4.2. Common Air Contaminants (CAC)
Marine fuels are considered as the most important cause of high NOx (Oxides of Ni-
trogen) emissions in shipping, with a significant amount of emissions especially if com-
pared with other transport systems such as road transport (i.e., considering also vehicles
inside ports). Oxides of Nitrogen are generated inside cylinders due to high pressures and
temperatures, leading to oxidation of nitrogen with oxygen, both present in the air [25].
SOx (Oxides of Sulphur) comprehend a family of different chemical compounds charac-
terized by the presence of Sulphur and Oxygen. In nature, these emissions are typically
produced by volcanoes. They have harmful effects on the human body, as they stimulate
nasal and throat nerves causing respiratory problems especially in asthmatic individuals
[26]. In maritime transportation, SOx emissions mainly originate from the combustion of
marine fossil fuels, with SO2 being the most predominant produced oxide. Considered
local and global pollutants at the same time, SOx emissions are dangerous to health be-
cause they can provoke respiratory problems; moreover, SOx gases can react with oxygen
in presence of NO2 resulting in sulfuric acid, which can eventually damage the environ-
ment through acid rains. SOx gases can raise the eutrophication potential, and can also
bring a cooling effect on the temperature and consequently to climate change [25]. Other
forms of fuel combustion by-products that constitute polluting threats include Volatile
Organic Compounds (VOC) [27,28] and Particulate Matter (PM) [29]; the latter consist in
fine aerosol particles classified by their diameter size, from which PMs are further labeled
into PM10 and PM2.5 if diameter d ≤ 10 μm and 2.5 μm, respectively. CACs contribute to
the formation of photochemical smog, in particular NO2 as a precursor to tropospheric
ozone (O3); CAC also contribute to the phenomenon of “acid rains” through the transfor-
mation of NO2 into nitric acid [30]. High concentrations of CAC can lead to breathing
problems especially on those who are already affected by respiratory diseases and ill-
nesses such as asthma; moreover, CACS are also harmful by undermining the immune
system, weakening the human body’s natural ability to defend itself against bacteria and
viruses [31]. Studies in literature show the correlation between CAC emissions and dis-
eases [32] such as bronchitis and asthma [33] and even with premature deaths, with over
400,000 premature deaths associated with PM2.5 and NOx across the 28 EU countries in
2016 [34]. The latest MARPOL indications set the SOx and PMs acceptable limits to 0.1%
for ECAs, and from 3.5% to 0.5% for areas outside ECAs. Eventually, IMO has banned the
carriage of non-compliant fuel on board for those ships not equipped with scrubbers (or
exhaust cleaning systems) from March 2020. IMO has indicated further thresholds and
Figure 4. The Greenhouse Effect explained. Reprinted from ref. [24].
4.2. Common Air Contaminants (CAC)
Marine fuels are considered as the most important cause of high NOx (Oxides ofNitrogen) emissions in shipping, with a significant amount of emissions especially ifcompared with other transport systems such as road transport (i.e., considering alsovehicles inside ports). Oxides of Nitrogen are generated inside cylinders due to highpressures and temperatures, leading to oxidation of nitrogen with oxygen, both present inthe air [25]. SOx (Oxides of Sulphur) comprehend a family of different chemical compoundscharacterized by the presence of Sulphur and Oxygen. In nature, these emissions aretypically produced by volcanoes. They have harmful effects on the human body, as theystimulate nasal and throat nerves causing respiratory problems especially in asthmatic
Infrastructures 2021, 6, 114 8 of 36
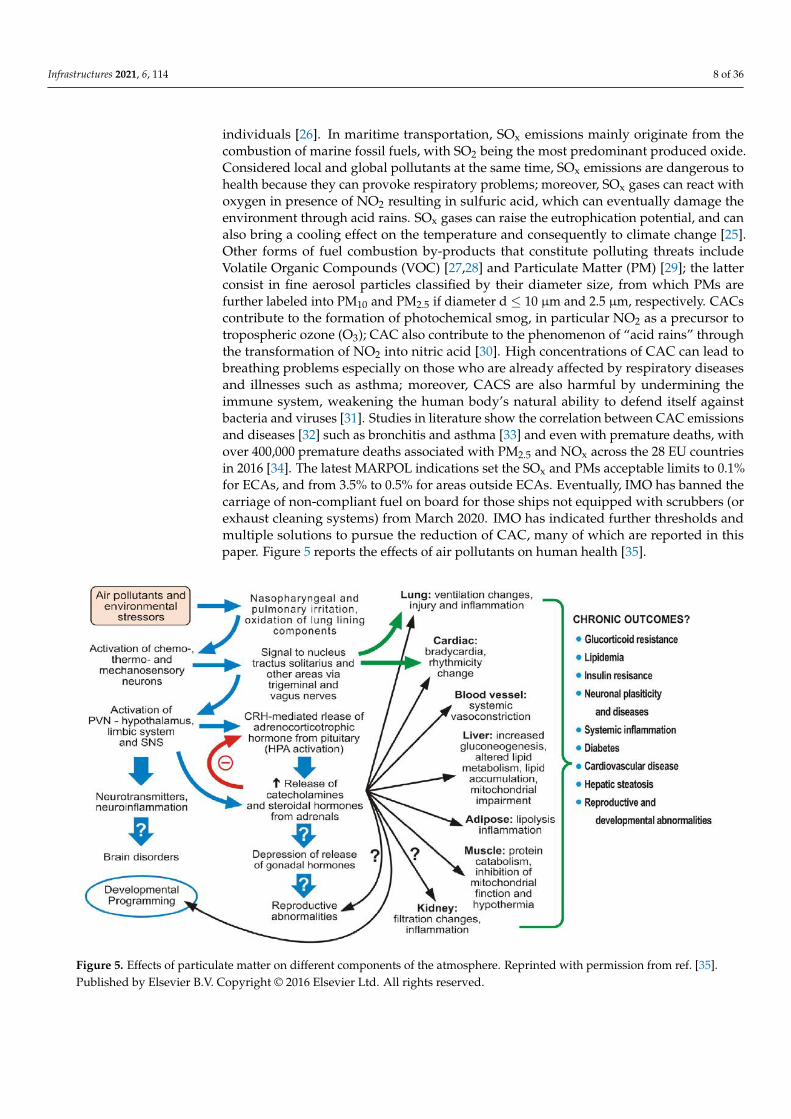
individuals [26]. In maritime transportation, SOx emissions mainly originate from thecombustion of marine fossil fuels, with SO2 being the most predominant produced oxide.Considered local and global pollutants at the same time, SOx emissions are dangerous tohealth because they can provoke respiratory problems; moreover, SOx gases can react withoxygen in presence of NO2 resulting in sulfuric acid, which can eventually damage theenvironment through acid rains. SOx gases can raise the eutrophication potential, and canalso bring a cooling effect on the temperature and consequently to climate change [25].Other forms of fuel combustion by-products that constitute polluting threats includeVolatile Organic Compounds (VOC) [27,28] and Particulate Matter (PM) [29]; the latterconsist in fine aerosol particles classified by their diameter size, from which PMs arefurther labeled into PM10 and PM2.5 if diameter d ≤ 10 µm and 2.5 µm, respectively. CACscontribute to the formation of photochemical smog, in particular NO2 as a precursor totropospheric ozone (O3); CAC also contribute to the phenomenon of “acid rains” throughthe transformation of NO2 into nitric acid [30]. High concentrations of CAC can lead tobreathing problems especially on those who are already affected by respiratory diseasesand illnesses such as asthma; moreover, CACS are also harmful by undermining theimmune system, weakening the human body’s natural ability to defend itself againstbacteria and viruses [31]. Studies in literature show the correlation between CAC emissionsand diseases [32] such as bronchitis and asthma [33] and even with premature deaths, withover 400,000 premature deaths associated with PM2.5 and NOx across the 28 EU countriesin 2016 [34]. The latest MARPOL indications set the SOx and PMs acceptable limits to 0.1%for ECAs, and from 3.5% to 0.5% for areas outside ECAs. Eventually, IMO has banned thecarriage of non-compliant fuel on board for those ships not equipped with scrubbers (orexhaust cleaning systems) from March 2020. IMO has indicated further thresholds andmultiple solutions to pursue the reduction of CAC, many of which are reported in thispaper. Figure 5 reports the effects of air pollutants on human health [35].
Infrastructures 2021, 6, x FOR PEER REVIEW 9 of 40
multiple solutions to pursue the reduction of CAC, many of which are reported in this
paper. Figure 5 reports the effects of air pollutants on human health [35].
Figure 5. Effects of particulate matter on different components of the atmosphere. Reprinted with permission from ref.
[35]. Published by Elsevier B.V. Copyright © 2016 Elsevier Ltd. All rights reserved.
4.3. Other Airborne Pollutants
Although dust and odors can constitute a hazard threatening human health and the
environment, authors believe that in the case of ports their contribution is generally low
enough and will not be discussed in this paper. Sandstorms may constitute a serious safety
and operational problem in dry areas that are frequently affected by this phenomenon,
however they will not be strictly considered as a form of pollution and will not be treated
here either. In addition, noise, an often understated form of pollution, can cause some
relevant discomfort to people working and living by ports in the long term, leading even
to hearing disturbances and hearing loss in the worst scenarios; however, the deepening
of this subject would require an extensive study about acoustics, construction techniques
and mechanical engineering which will not be undertaken here, as the authors wish to
focus their attention on CAC and GHG in this article.
5. Estimating, Detecting, and Monitoring Emissions in Ports
Ports are an ensemble of pollution sources, from their construction phase to their full
operation state, considering for example the use of environmentally hazardous materials
for construction and their disposal, the use of industrial equipment and machinery, or the
emissions produced by ships (usually propelled by diesel engines) [36]. A typical port
layout comprehends areas dedicated to diverse functions, spacing from offices, ware-
houses and storage yards, parking spaces, intermodal hub infrastructures, passenger
buildings, and piers and quays; all of these facilities can be seen as potential sources of
pollution, considering elements such as emissions from ships, cars, and other means of
transport, or the presence of large Heating Ventilation and Air Conditioning (HVAC) sys-
tems. Indeed, emission sources can be organized into two large groups: the first including
stationary sources such as warehouses, mechanical plants, offices, etc., and the latter in-
cluding mobile sources such as ships, cranes, vehicles, and so on [37]. Hence, the assess-
ment of the emissions level for ports must also take into account the combined contribu-
tion of various internal polluting agents, but also the potential interaction with external
nearby sources such as factories, urban areas, busy highways, and so on, not to mention
Figure 5. Effects of particulate matter on different components of the atmosphere. Reprinted with permission from ref. [35].Published by Elsevier B.V. Copyright © 2016 Elsevier Ltd. All rights reserved.
Infrastructures 2021, 6, 114 9 of 36
4.3. Other Airborne Pollutants
Although dust and odors can constitute a hazard threatening human health and theenvironment, authors believe that in the case of ports their contribution is generally lowenough and will not be discussed in this paper. Sandstorms may constitute a serious safetyand operational problem in dry areas that are frequently affected by this phenomenon,however they will not be strictly considered as a form of pollution and will not be treatedhere either. In addition, noise, an often understated form of pollution, can cause somerelevant discomfort to people working and living by ports in the long term, leading evento hearing disturbances and hearing loss in the worst scenarios; however, the deepening ofthis subject would require an extensive study about acoustics, construction techniques andmechanical engineering which will not be undertaken here, as the authors wish to focustheir attention on CAC and GHG in this article.
5. Estimating, Detecting, and Monitoring Emissions in Ports
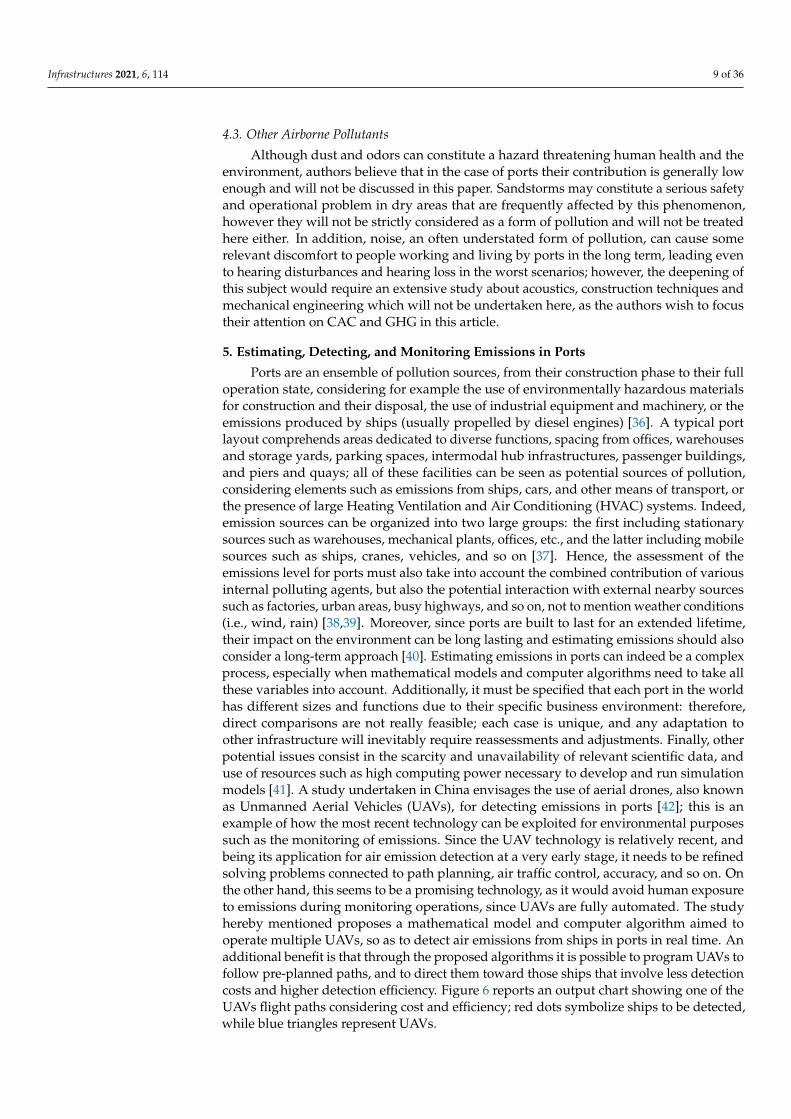
Ports are an ensemble of pollution sources, from their construction phase to their fulloperation state, considering for example the use of environmentally hazardous materialsfor construction and their disposal, the use of industrial equipment and machinery, or theemissions produced by ships (usually propelled by diesel engines) [36]. A typical portlayout comprehends areas dedicated to diverse functions, spacing from offices, warehousesand storage yards, parking spaces, intermodal hub infrastructures, passenger buildings,and piers and quays; all of these facilities can be seen as potential sources of pollution,considering elements such as emissions from ships, cars, and other means of transport, orthe presence of large Heating Ventilation and Air Conditioning (HVAC) systems. Indeed,emission sources can be organized into two large groups: the first including stationarysources such as warehouses, mechanical plants, offices, etc., and the latter including mobilesources such as ships, cranes, vehicles, and so on [37]. Hence, the assessment of theemissions level for ports must also take into account the combined contribution of variousinternal polluting agents, but also the potential interaction with external nearby sourcessuch as factories, urban areas, busy highways, and so on, not to mention weather conditions(i.e., wind, rain) [38,39]. Moreover, since ports are built to last for an extended lifetime,their impact on the environment can be long lasting and estimating emissions should alsoconsider a long-term approach [40]. Estimating emissions in ports can indeed be a complexprocess, especially when mathematical models and computer algorithms need to take allthese variables into account. Additionally, it must be specified that each port in the worldhas different sizes and functions due to their specific business environment: therefore,direct comparisons are not really feasible; each case is unique, and any adaptation toother infrastructure will inevitably require reassessments and adjustments. Finally, otherpotential issues consist in the scarcity and unavailability of relevant scientific data, anduse of resources such as high computing power necessary to develop and run simulationmodels [41]. A study undertaken in China envisages the use of aerial drones, also knownas Unmanned Aerial Vehicles (UAVs), for detecting emissions in ports [42]; this is anexample of how the most recent technology can be exploited for environmental purposessuch as the monitoring of emissions. Since the UAV technology is relatively recent, andbeing its application for air emission detection at a very early stage, it needs to be refinedsolving problems connected to path planning, air traffic control, accuracy, and so on. Onthe other hand, this seems to be a promising technology, as it would avoid human exposureto emissions during monitoring operations, since UAVs are fully automated. The studyhereby mentioned proposes a mathematical model and computer algorithm aimed tooperate multiple UAVs, so as to detect air emissions from ships in ports in real time. Anadditional benefit is that through the proposed algorithms it is possible to program UAVs tofollow pre-planned paths, and to direct them toward those ships that involve less detectioncosts and higher detection efficiency. Figure 6 reports an output chart showing one of theUAVs flight paths considering cost and efficiency; red dots symbolize ships to be detected,while blue triangles represent UAVs.
Infrastructures 2021, 6, 114 10 of 36
Infrastructures 2021, 6, x FOR PEER REVIEW 10 of 40
weather conditions (i.e., wind, rain) [38,39]. Moreover, since ports are built to last for an
extended lifetime, their impact on the environment can be long lasting and estimating
emissions should also consider a long-term approach [40]. Estimating emissions in ports
can indeed be a complex process, especially when mathematical models and computer
algorithms need to take all these variables into account. Additionally, it must be specified
that each port in the world has different sizes and functions due to their specific business
environment: therefore, direct comparisons are not really feasible; each case is unique, and
any adaptation to other infrastructure will inevitably require reassessments and adjust-
ments. Finally, other potential issues consist in the scarcity and unavailability of relevant
scientific data, and use of resources such as high computing power necessary to develop
and run simulation models [41]. A study undertaken in China envisages the use of aerial
drones, also known as Unmanned Aerial Vehicles (UAVs), for detecting emissions in ports
[42]; this is an example of how the most recent technology can be exploited for environ-
mental purposes such as the monitoring of emissions. Since the UAV technology is rela-
tively recent, and being its application for air emission detection at a very early stage, it
needs to be refined solving problems connected to path planning, air traffic control, accu-
racy, and so on. On the other hand, this seems to be a promising technology, as it would
avoid human exposure to emissions during monitoring operations, since UAVs are fully
automated. The study hereby mentioned proposes a mathematical model and computer
algorithm aimed to operate multiple UAVs, so as to detect air emissions from ships in
ports in real time. An additional benefit is that through the proposed algorithms it is pos-
sible to program UAVs to follow pre-planned paths, and to direct them toward those ships
that involve less detection costs and higher detection efficiency. Figure 6 reports an output
chart showing one of the UAVs flight paths considering cost and efficiency; red dots sym-
bolize ships to be detected, while blue triangles represent UAVs.
Figure 6. UAVs flight path chart considering cost and efficiency. Reprinted with permission from
ref. [42]. Published by Elsevier B.V. Copyright © 2020 Elsevier Ltd. All rights reserved.
An ensemble of case studies will be reported below to offer an idea of the possible
ways to estimate emissions in ports, considering also their interaction with the surround-
ing environment. Despite their commercial relevance, the following sample ports might
not currently hold a leadership position in terms of environmental practices; however,
authors see this as an evidence of the ever-increasing interest towards the environment
and sustainability among other ports. The selected ports are located in the Mediterranean
Sea, and have been chosen as the authors desire to focus on this area planning to proceed
with future research for other ports in the Mediterranean and Black Sea, where the sce-
narios could be slightly similar. It must be specified, however and as already mentioned
Figure 6. UAVs flight path chart considering cost and efficiency. Reprinted with permission fromref. [42]. Published by Elsevier B.V. Copyright © 2020 Elsevier Ltd. All rights reserved.
An ensemble of case studies will be reported below to offer an idea of the possibleways to estimate emissions in ports, considering also their interaction with the surroundingenvironment. Despite their commercial relevance, the following sample ports mightnot currently hold a leadership position in terms of environmental practices; however,authors see this as an evidence of the ever-increasing interest towards the environment andsustainability among other ports. The selected ports are located in the Mediterranean Sea,and have been chosen as the authors desire to focus on this area planning to proceed withfuture research for other ports in the Mediterranean and Black Sea, where the scenarioscould be slightly similar. It must be specified, however and as already mentioned before,that each port is unique, and the following cases should not be directly compared with eachother nor directly applied to other contexts, but rather seen as different attempts to facethe emission problem in ports. Although they could constitute a starting point for similarscenarios, reassessments and more or less heavy adjustments will inevitably be necessary.
5.1. Port of Volos, Greece (2018)
Road traffic interacting with ports can be made of vehicles used for both privateand commercial activities. Particularly, trucks are used to transport goods from largewarehouses and storage centers to external destinations scattered across extended areas forretail trade, eventually employing smaller light vehicles to reach minor sites in a capillarynetwork. Since ports can be considered as large storage areas and multimodal transport ex-change points, container trucks and Heavy Goods Vehicles (HGVs) are frequently involvedwith the commercial activities revolving around harbors, contributing to traffic volumesas they move in and out from ports. Port employees or passengers may have to accessand exit the port with their own vehicles as well. A research study conducted in 2018 hasassessed the effects deriving from the application of specific traffic and logistic measuresapplied to the port of Volos (Greece), examining the relation between port operations withthe transportation of containers and bulk shipments on the road network connected to theport. This has been done through a mathematical model obtained by the integration oftwo different simulation software with each other: AnyLogic and VISSIM [43]. The assess-ment has considered traffic data for a weekday in June, a day representing typical trafficconditions, and has been performed for two different circumstances: a base scenario withno measures implemented, and a scenario with specific measures implemented instead.Measures were chosen according to three key criteria: Soft measures (no structural inter-ventions), Intelligent Transport Systems (ITS) oriented, and low-cost implementation; thesemeasures were eventually implemented into the models by adjusting some parametersfor calibration:
Infrastructures 2021, 6, 114 11 of 36
• Real time online system for better monitoring: trucks can transport greater amountsof bulk shipments by increasing the HGVs load factor; this optimization can beachieved through the use of real-time online smart systems that communicate infoabout remaining shipment volumes, unexpected events, etc. This implementation canlead to an increase in HGV load factors up to 95%
• Green Fleet: increase the number of HGVs powered by alternative fuels, increasingCompressed Natural Gas vehicles from 2% to 4% and Electric vehicles from 20% to23%, while reducing the number of diesel-powered HGVs from 78% to 73%
• Local Traffic Management: implementation of Intelligent Transport Systems for trafficmanagement and control, such as intervening on the timing of intersection signals; thisleads to optimizing the acceleration and deceleration maneuvers for HGVs, thereforeimproving the traffic flow and allowing reduced noise, used fuel, and emissions.
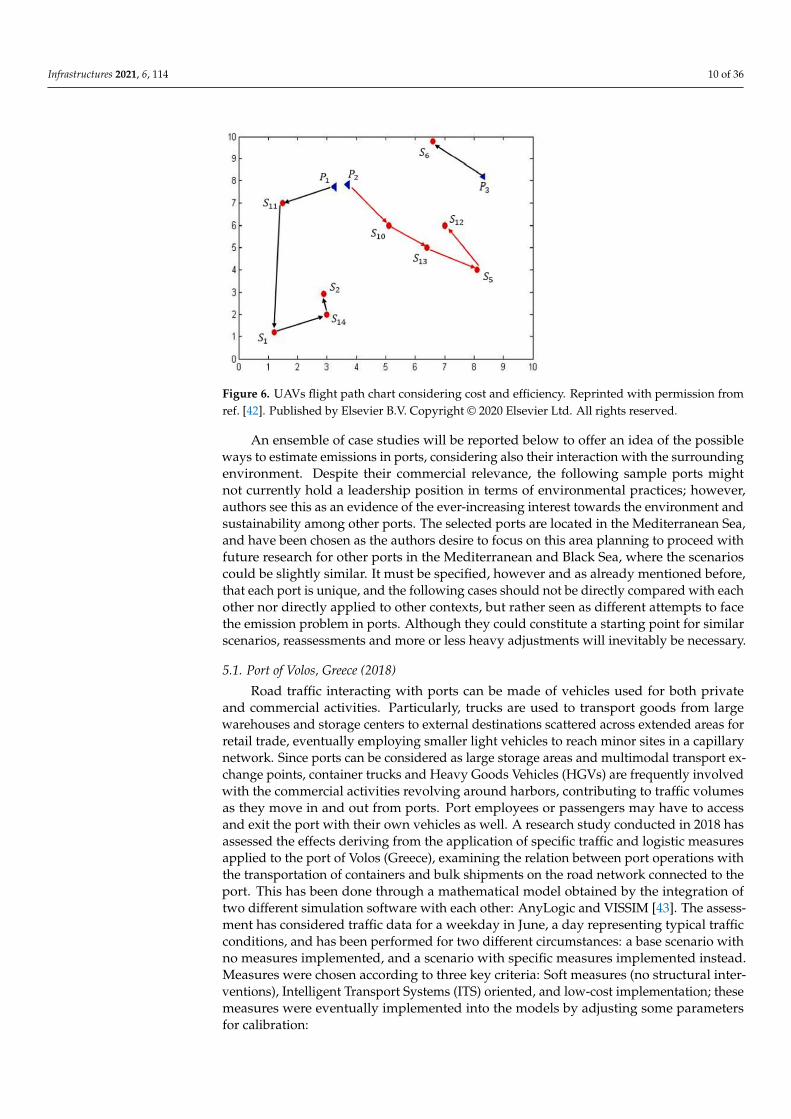
The study demonstrated that three calculated environmental indicators describinglevels of CO2, NOx, and PM10 showed lower values by circa 7% to 9% in favor of thesecond scenario (where transport management measures had been implemented), andone transport-related indicator representing the sum of delays was 26% lower as well.The Logistics Sustainability Index (LSI), a comprehensive index summarizing the otherindicators has been calculated with a multi-criteria decision-making tool; a raise in LSImeans a general improvement of the system, and in this case, LSI had an increase of circa21%. Figure 7 summarizes this info; more detailed data are available in the original study.Generally speaking, it can be said that a proper optimization of the road traffic interactingwith ports, thanks to the application of mathematical and computer models, can lead to asignificant reduction in emissions.
Infrastructures 2021, 6, x FOR PEER REVIEW 12 of 40
Figure 7. Percentage variation of environmental, delay, and LSI indicators. Reprinted from ref. [43].
5.2. Port of Barcelona, Spain (2020)
A case study for the Port of Barcelona carried out in 2020 [44] can be seen as another
example of interaction between the port area and the surrounding environment. This
study has shown an improvement in terms of emissions after the application of green
initiatives, within a number of 53 programs grouped into 7 categories, defined by the Port
of Barcelona. These seven categories are an example of what can be done to improve the
environmental performance in ports, and for reference they will be listed below:
• Investments into new infrastructure to encourage the use of alternative fuels (e.g.,
LNG);
• Provision of electric connection for marine vessels;
• Price discounts and port charge reductions as an incentive for virtuous shipping com-
panies that improve environmental performance;
• Replacement of diesel-powered land vehicles with electric or natural gas;
• Electrification and gasification of port terminal machinery;
• Investments in better infrastructure to improve the use of rail and Short Sea Shipping
(SSS) to reduce road transportation and traffic;
• Enhancement of collaboration with port customers and other external stakeholders
to promote sustainable mobility.
To assess the port emission activity, data for NO2, SO2, and PM, related to maritime
and road transport have been collected from surveying stations scattered all over the city
of Barcelona and in general across the urbanized area surrounding the port. The study
presents a correlation between port activities, their interaction with the surrounding en-
vironment, and the correlated effects in terms of emissions, demonstrating also that ac-
tions such as the introduction of intermodal means of transport, the improvement of rail
facilities, and the implementation of adequate policies has led to positive effects on reduc-
ing emissions over few years. Figure 8 below shows the area of study, whereas Figure 9
shows as an example the overall decreasing trend of PM2.5 emissions between 2007 and
2017.
Figure 7. Percentage variation of environmental, delay, and LSI indicators. Reprinted from ref. [43].
5.2. Port of Barcelona, Spain (2020)
A case study for the Port of Barcelona carried out in 2020 [44] can be seen as anotherexample of interaction between the port area and the surrounding environment. This studyhas shown an improvement in terms of emissions after the application of green initiatives,within a number of 53 programs grouped into 7 categories, defined by the Port of Barcelona.These seven categories are an example of what can be done to improve the environmentalperformance in ports, and for reference they will be listed below:
• Investments into new infrastructure to encourage the use of alternative fuels (e.g., LNG);• Provision of electric connection for marine vessels;• Price discounts and port charge reductions as an incentive for virtuous shipping
companies that improve environmental performance;• Replacement of diesel-powered land vehicles with electric or natural gas;• Electrification and gasification of port terminal machinery;• Investments in better infrastructure to improve the use of rail and Short Sea Shipping
(SSS) to reduce road transportation and traffic;• Enhancement of collaboration with port customers and other external stakeholders to
promote sustainable mobility.
Infrastructures 2021, 6, 114 12 of 36
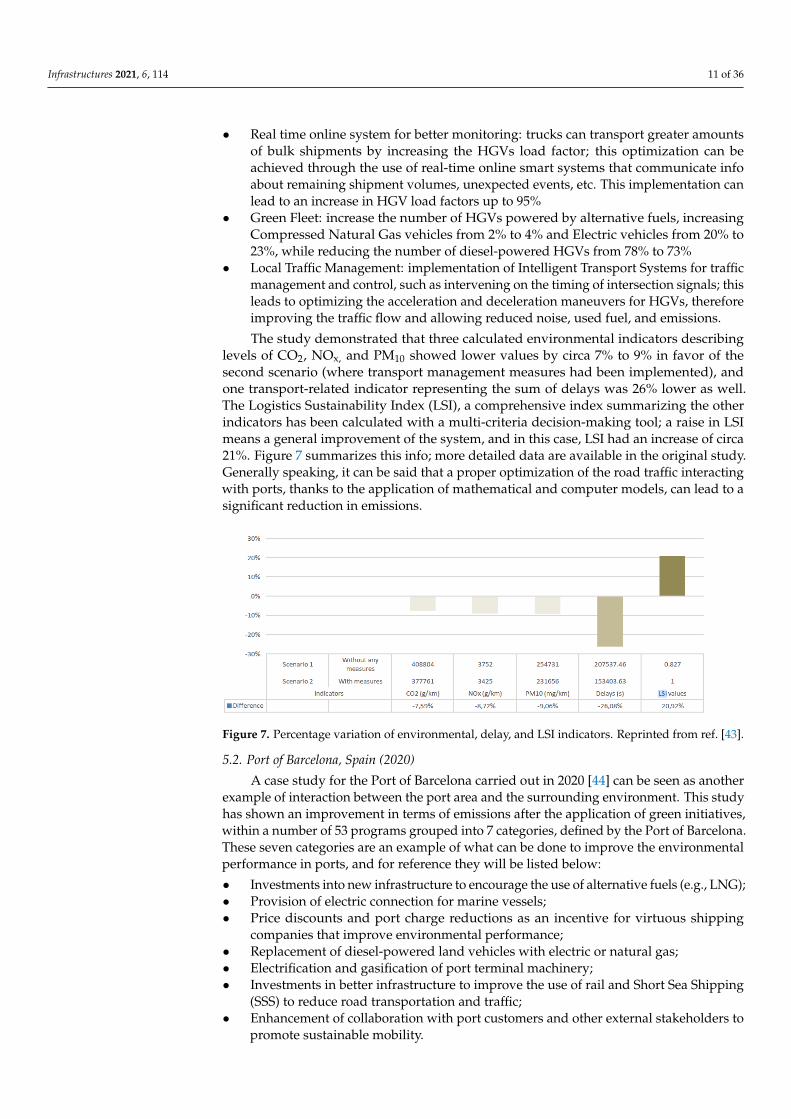
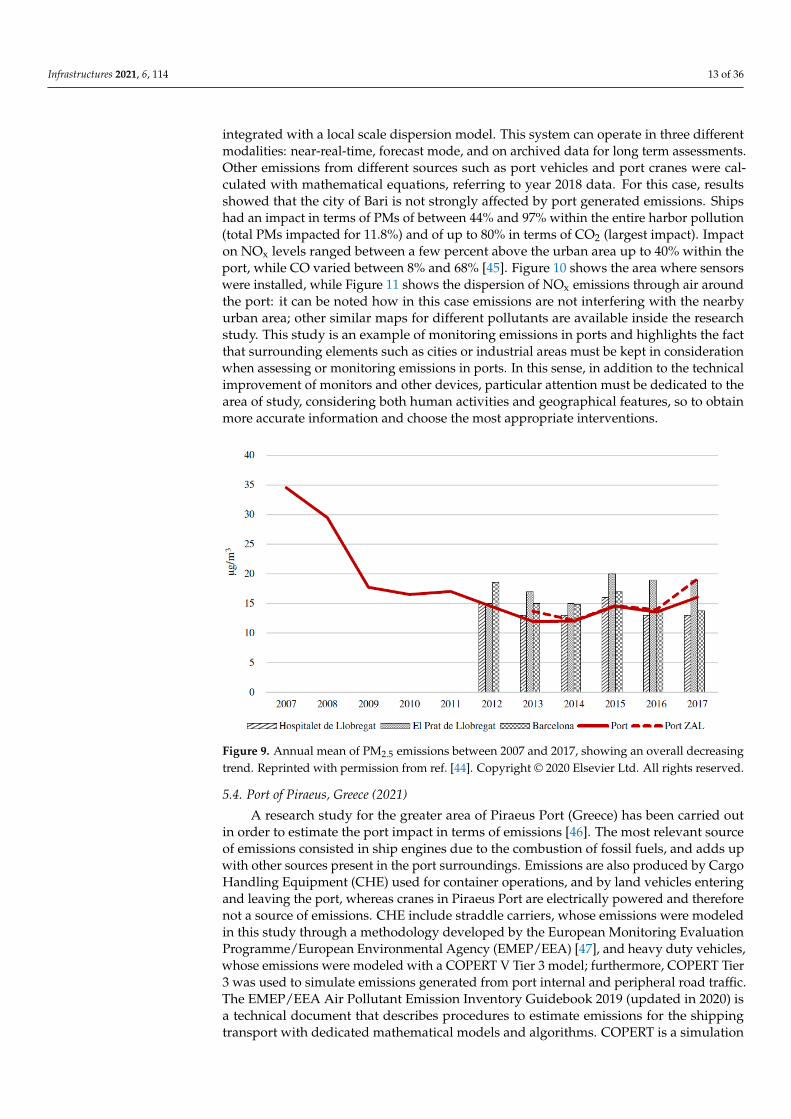
To assess the port emission activity, data for NO2, SO2, and PM, related to maritimeand road transport have been collected from surveying stations scattered all over thecity of Barcelona and in general across the urbanized area surrounding the port. Thestudy presents a correlation between port activities, their interaction with the surroundingenvironment, and the correlated effects in terms of emissions, demonstrating also thatactions such as the introduction of intermodal means of transport, the improvement ofrail facilities, and the implementation of adequate policies has led to positive effects onreducing emissions over few years. Figure 8 below shows the area of study, whereasFigure 9 shows as an example the overall decreasing trend of PM2.5 emissions between2007 and 2017.
Infrastructures 2021, 6, x FOR PEER REVIEW 13 of 40
Figure 8. Area of study around the port of Barcelona. Reprinted with permission from ref. [44].
Copyright © 2020 Elsevier Ltd. All rights reserved.
Figure 8. Area of study around the port of Barcelona. Reprinted with permission from ref. [44].Copyright © 2020 Elsevier Ltd. All rights reserved.
5.3. Port of Bari, Italy (2019)
An example of estimation model showing the interaction with the surrounding envi-ronment of a port has been developed for a research study, which was implemented as apilot test into the IT and Management software of the port of Bari in Italy. Emission datawere collected through a network of low-cost sensors connected to the internet and then
Infrastructures 2021, 6, 114 13 of 36
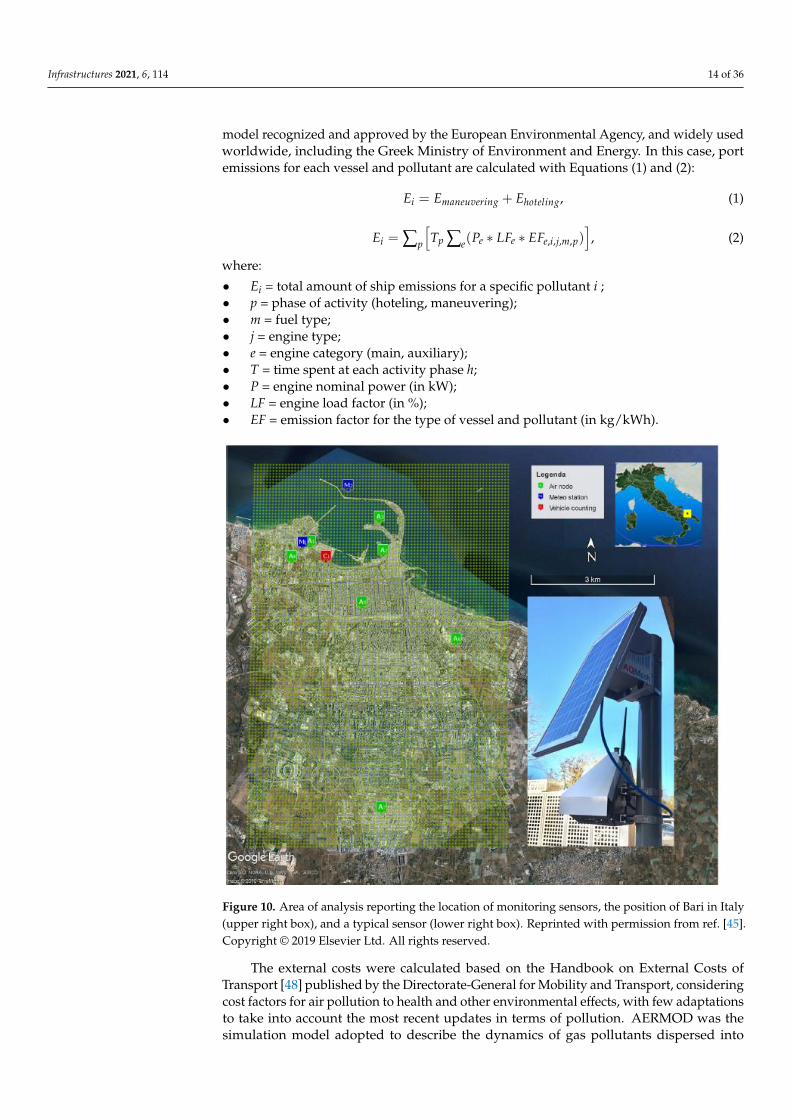
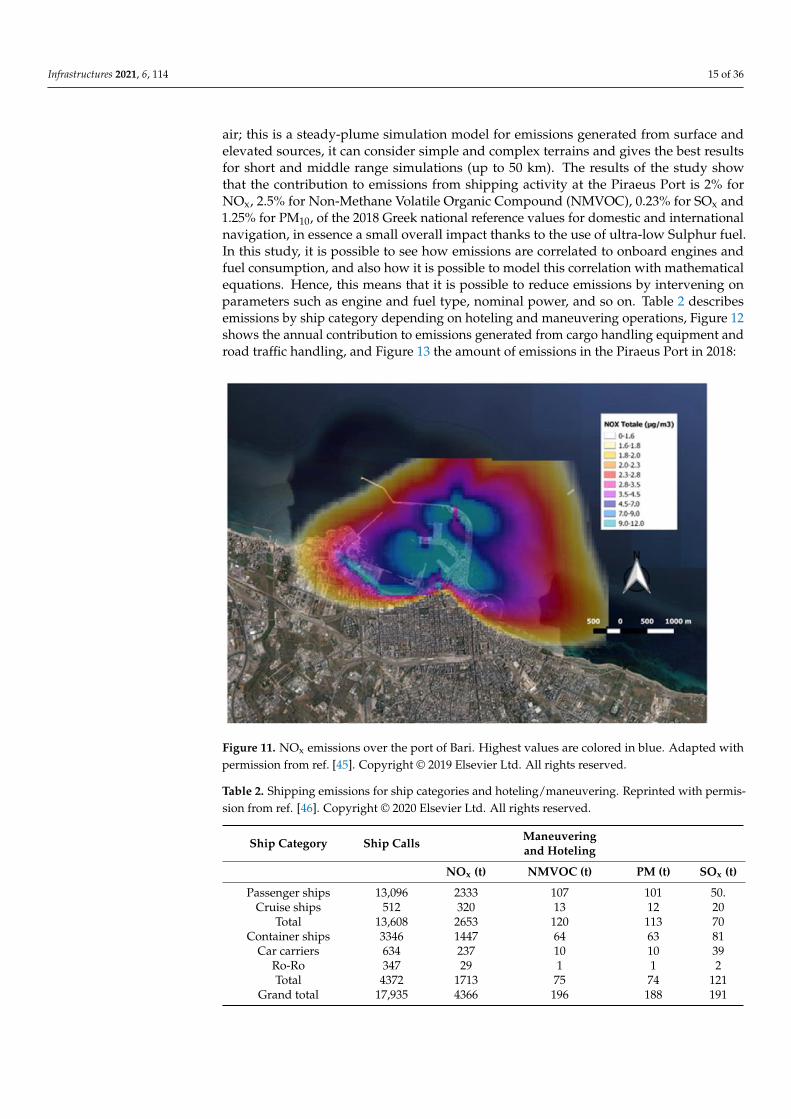
integrated with a local scale dispersion model. This system can operate in three differentmodalities: near-real-time, forecast mode, and on archived data for long term assessments.Other emissions from different sources such as port vehicles and port cranes were cal-culated with mathematical equations, referring to year 2018 data. For this case, resultsshowed that the city of Bari is not strongly affected by port generated emissions. Shipshad an impact in terms of PMs of between 44% and 97% within the entire harbor pollution(total PMs impacted for 11.8%) and of up to 80% in terms of CO2 (largest impact). Impacton NOx levels ranged between a few percent above the urban area up to 40% within theport, while CO varied between 8% and 68% [45]. Figure 10 shows the area where sensorswere installed, while Figure 11 shows the dispersion of NOx emissions through air aroundthe port: it can be noted how in this case emissions are not interfering with the nearbyurban area; other similar maps for different pollutants are available inside the researchstudy. This study is an example of monitoring emissions in ports and highlights the factthat surrounding elements such as cities or industrial areas must be kept in considerationwhen assessing or monitoring emissions in ports. In this sense, in addition to the technicalimprovement of monitors and other devices, particular attention must be dedicated to thearea of study, considering both human activities and geographical features, so to obtainmore accurate information and choose the most appropriate interventions.
Infrastructures 2021, 6, x FOR PEER REVIEW 14 of 40
Figure 9. Annual mean of PM2.5 emissions between 2007 and 2017, showing an overall decreasing
trend. Reprinted with permission from ref. [44]. Copyright © 2020 Elsevier Ltd. All rights reserved.
Figure 9. Annual mean of PM2.5 emissions between 2007 and 2017, showing an overall decreasingtrend. Reprinted with permission from ref. [44]. Copyright © 2020 Elsevier Ltd. All rights reserved.
5.4. Port of Piraeus, Greece (2021)
A research study for the greater area of Piraeus Port (Greece) has been carried outin order to estimate the port impact in terms of emissions [46]. The most relevant sourceof emissions consisted in ship engines due to the combustion of fossil fuels, and adds upwith other sources present in the port surroundings. Emissions are also produced by CargoHandling Equipment (CHE) used for container operations, and by land vehicles enteringand leaving the port, whereas cranes in Piraeus Port are electrically powered and thereforenot a source of emissions. CHE include straddle carriers, whose emissions were modeledin this study through a methodology developed by the European Monitoring EvaluationProgramme/European Environmental Agency (EMEP/EEA) [47], and heavy duty vehicles,whose emissions were modeled with a COPERT V Tier 3 model; furthermore, COPERT Tier3 was used to simulate emissions generated from port internal and peripheral road traffic.The EMEP/EEA Air Pollutant Emission Inventory Guidebook 2019 (updated in 2020) isa technical document that describes procedures to estimate emissions for the shippingtransport with dedicated mathematical models and algorithms. COPERT is a simulation
Infrastructures 2021, 6, 114 14 of 36
model recognized and approved by the European Environmental Agency, and widely usedworldwide, including the Greek Ministry of Environment and Energy. In this case, portemissions for each vessel and pollutant are calculated with Equations (1) and (2):
Ei = Emaneuvering + Ehoteling, (1)
Ei = ∑p
[Tp ∑e(Pe ∗ LFe ∗ EFe,i,j,m,p)
], (2)
where:
• Ei = total amount of ship emissions for a specific pollutant i ;• p = phase of activity (hoteling, maneuvering);• m = fuel type;• j = engine type;• e = engine category (main, auxiliary);• T = time spent at each activity phase h;• P = engine nominal power (in kW);• LF = engine load factor (in %);• EF = emission factor for the type of vessel and pollutant (in kg/kWh).
Infrastructures 2021, 6, x FOR PEER REVIEW 15 of 40
5.3. Port of Bari, Italy (2019)
An example of estimation model showing the interaction with the surrounding envi-
ronment of a port has been developed for a research study, which was implemented as a
pilot test into the IT and Management software of the port of Bari in Italy. Emission data
were collected through a network of low-cost sensors connected to the internet and then
integrated with a local scale dispersion model. This system can operate in three different
modalities: near-real-time, forecast mode, and on archived data for long term assessments.
Other emissions from different sources such as port vehicles and port cranes were calcu-
lated with mathematical equations, referring to year 2018 data. For this case, results
showed that the city of Bari is not strongly affected by port generated emissions. Ships
had an impact in terms of PMs of between 44% and 97% within the entire harbor pollution
(total PMs impacted for 11.8%) and of up to 80% in terms of CO2 (largest impact). Impact
on NOx levels ranged between a few percent above the urban area up to 40% within the
port, while CO varied between 8% and 68% [45]. Figure 10 shows the area where sensors
were installed, while Figure 11 shows the dispersion of NOx emissions through air around
the port: it can be noted how in this case emissions are not interfering with the nearby
urban area; other similar maps for different pollutants are available inside the research
study. This study is an example of monitoring emissions in ports and highlights the fact
that surrounding elements such as cities or industrial areas must be kept in consideration
when assessing or monitoring emissions in ports. In this sense, in addition to the technical
improvement of monitors and other devices, particular attention must be dedicated to the
area of study, considering both human activities and geographical features, so to obtain
more accurate information and choose the most appropriate interventions.
Figure 10. Area of analysis reporting the location of monitoring sensors, the position of Bari in Italy
(upper right box), and a typical sensor (lower right box). Reprinted with permission from ref. [45].
Copyright © 2019 Elsevier Ltd. All rights reserved.
Figure 10. Area of analysis reporting the location of monitoring sensors, the position of Bari in Italy(upper right box), and a typical sensor (lower right box). Reprinted with permission from ref. [45].Copyright © 2019 Elsevier Ltd. All rights reserved.
The external costs were calculated based on the Handbook on External Costs ofTransport [48] published by the Directorate-General for Mobility and Transport, consideringcost factors for air pollution to health and other environmental effects, with few adaptationsto take into account the most recent updates in terms of pollution. AERMOD was thesimulation model adopted to describe the dynamics of gas pollutants dispersed into
Infrastructures 2021, 6, 114 15 of 36
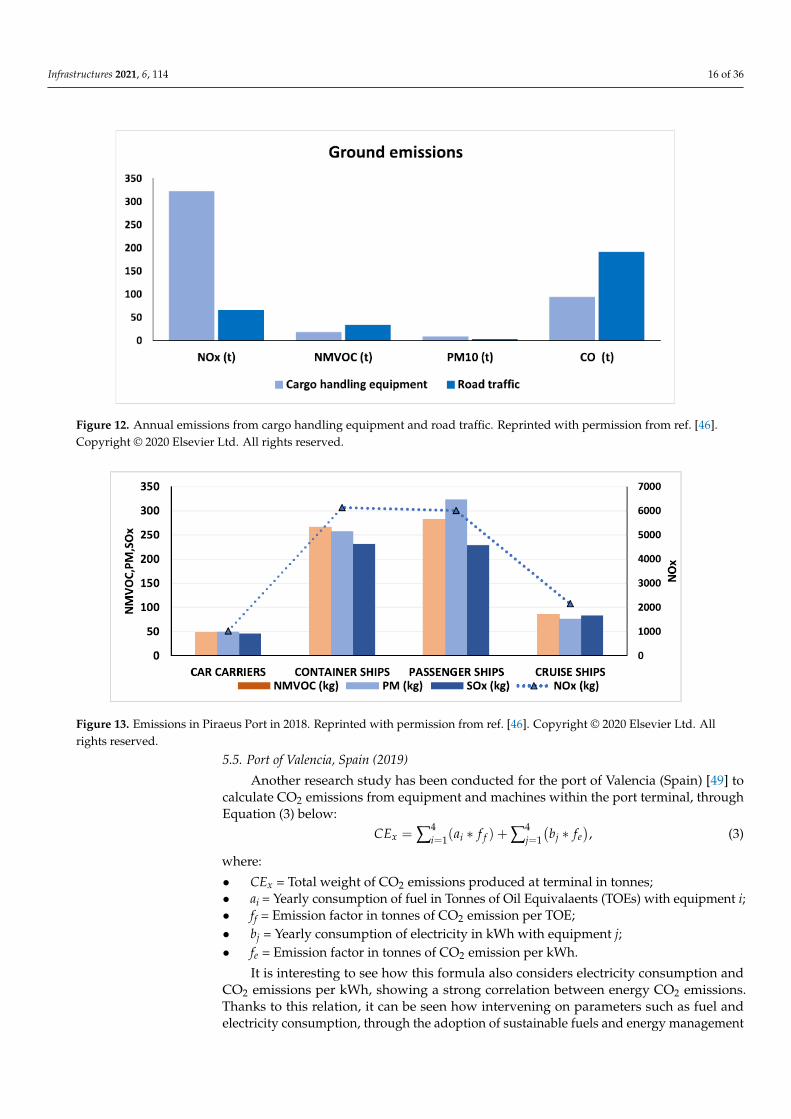
air; this is a steady-plume simulation model for emissions generated from surface andelevated sources, it can consider simple and complex terrains and gives the best resultsfor short and middle range simulations (up to 50 km). The results of the study showthat the contribution to emissions from shipping activity at the Piraeus Port is 2% forNOx, 2.5% for Non-Methane Volatile Organic Compound (NMVOC), 0.23% for SOx and1.25% for PM10, of the 2018 Greek national reference values for domestic and internationalnavigation, in essence a small overall impact thanks to the use of ultra-low Sulphur fuel.In this study, it is possible to see how emissions are correlated to onboard engines andfuel consumption, and also how it is possible to model this correlation with mathematicalequations. Hence, this means that it is possible to reduce emissions by intervening onparameters such as engine and fuel type, nominal power, and so on. Table 2 describesemissions by ship category depending on hoteling and maneuvering operations, Figure 12shows the annual contribution to emissions generated from cargo handling equipment androad traffic handling, and Figure 13 the amount of emissions in the Piraeus Port in 2018:
Infrastructures 2021, 6, x FOR PEER REVIEW 16 of 40
Figure 11. NOx emissions over the port of Bari. Highest values are colored in blue. Adapted with
permission from ref. [45]. Copyright © 2019 Elsevier Ltd. All rights reserved.
5.4. Port of Piraeus, Greece (2021)
A research study for the greater area of Piraeus Port (Greece) has been carried out in
order to estimate the port impact in terms of emissions [46]. The most relevant source of
emissions consisted in ship engines due to the combustion of fossil fuels, and adds up
with other sources present in the port surroundings. Emissions are also produced by
Cargo Handling Equipment (CHE) used for container operations, and by land vehicles
entering and leaving the port, whereas cranes in Piraeus Port are electrically powered and
therefore not a source of emissions. CHE include straddle carriers, whose emissions were
modeled in this study through a methodology developed by the European Monitoring
Evaluation Programme/European Environmental Agency (EMEP/EEA) [47], and heavy
duty vehicles, whose emissions were modeled with a COPERT V Tier 3 model; further-
more, COPERT Tier 3 was used to simulate emissions generated from port internal and
peripheral road traffic. The EMEP/EEA Air Pollutant Emission Inventory Guidebook 2019
(updated in 2020) is a technical document that describes procedures to estimate emissions
for the shipping transport with dedicated mathematical models and algorithms. COPERT
is a simulation model recognized and approved by the European Environmental Agency,
and widely used worldwide, including the Greek Ministry of Environment and Energy.
In this case, port emissions for each vessel and pollutant are calculated with Equations (1)
and (2):
𝐸𝑖 = 𝐸𝑚𝑎𝑛𝑒𝑢𝑣𝑒𝑟𝑖𝑛𝑔 + 𝐸ℎ𝑜𝑡𝑒𝑙𝑖𝑛𝑔, (1)
𝐸𝑖 = ∑ [𝑇𝑝 ∑ (𝑃𝑒 ∗ 𝐿𝐹𝑒𝑒𝑝 ∗ 𝐸𝐹𝑒,𝑖,𝑗,𝑚,𝑝)], (2)
where:
• Ei = total amount of ship emissions for a specific pollutant i ;
• p = phase of activity (hoteling, maneuvering);
• m = fuel type;
• j = engine type;
• e = engine category (main, auxiliary);
• T = time spent at each activity phase h;
Figure 11. NOx emissions over the port of Bari. Highest values are colored in blue. Adapted withpermission from ref. [45]. Copyright © 2019 Elsevier Ltd. All rights reserved.
Table 2. Shipping emissions for ship categories and hoteling/maneuvering. Reprinted with permis-sion from ref. [46]. Copyright © 2020 Elsevier Ltd. All rights reserved.
Ship Category Ship Calls Maneuveringand Hoteling
NOx (t) NMVOC (t) PM (t) SOx (t)
Passenger ships 13,096 2333 107 101 50.Cruise ships 512 320 13 12 20
Total 13,608 2653 120 113 70Container ships 3346 1447 64 63 81
Car carriers 634 237 10 10 39Ro-Ro 347 29 1 1 2Total 4372 1713 75 74 121
Grand total 17,935 4366 196 188 191
Infrastructures 2021, 6, 114 16 of 36Infrastructures 2021, 6, x FOR PEER REVIEW 18 of 40
Figure 12. Annual emissions from cargo handling equipment and road traffic. Reprinted with permission from ref. [46].
Copyright © 2020 Elsevier Ltd. All rights reserved.
Figure 12. Annual emissions from cargo handling equipment and road traffic. Reprinted with permission from ref. [46].Copyright © 2020 Elsevier Ltd. All rights reserved.
Infrastructures 2021, 6, x FOR PEER REVIEW 19 of 40
Figure 13. Emissions in Piraeus Port in 2018. Reprinted with permission from ref. [46]. Copyright © 2020 Elsevier Ltd. All
rights reserved.
5.5. Port of Valencia, Spain (2019)
Another research study has been conducted for the port of Valencia (Spain) [49] to
calculate CO2 emissions from equipment and machines within the port terminal, through
Equation (3) below:
𝐶𝐸𝑥 = ∑ (𝑎𝑖4𝑖=1 ∗ 𝑓𝑓) + ∑ (𝑏𝑗 ∗ 𝑓𝑒)4
𝑗=1 , (3)
where:
• CEx = Total weight of CO2 emissions produced at terminal in tonnes;
• ai = Yearly consumption of fuel in Tonnes of Oil Equivalaents (TOEs) with equipment
i;
• ff = Emission factor in tonnes of CO2 emission per TOE;
• bj = Yearly consumption of electricity in kWh with equipment j;
• fe = Emission factor in tonnes of CO2 emission per kWh.
It is interesting to see how this formula also considers electricity consumption and
CO2 emissions per kWh, showing a strong correlation between energy CO2 emissions.
Thanks to this relation, it can be seen how intervening on parameters such as fuel and
electricity consumption, through the adoption of sustainable fuels and energy manage-
ment systems, can lead to a reduction of emissions. Indeed, this study eventually proposes
technical measures to tackle the emissions problem, including replacing traditional fuels
such as diesel with more sustainable alternatives such as Liquid Natural Gas (LNG). These
topics will be discussed in the following paragraph; the highlight here is that it is possible
to estimate emissions in ports through mathematical models, despite all the previously
mentioned uncertainties and difficulties. This could be seen as a stimulus to scientific re-
search, so that even more refined and inclusive methodologies are developed in the fu-
ture.
6. Proposed Actions and Technologies to Manage Emissions in Ports
The following paragraphs will list and describe some of the most effective interven-
tions and technologies that can be adopted to manage the problem of emissions in ports.
Mitigation measures mainly translate into reducing the amount of emitted gases, thanks
for example to the adoption of alternative power sources, engines and fuels, or by in-
stalling on-board exhaust remediation systems; adaptation measures comprehend sys-
tems such as carbon capture technologies to collect and exploit the already emitted CO2
in atmosphere, and scrubbers.
Figure 13. Emissions in Piraeus Port in 2018. Reprinted with permission from ref. [46]. Copyright © 2020 Elsevier Ltd. Allrights reserved.
5.5. Port of Valencia, Spain (2019)
Another research study has been conducted for the port of Valencia (Spain) [49] tocalculate CO2 emissions from equipment and machines within the port terminal, throughEquation (3) below:
CEx = ∑4i=1(ai ∗ f f ) + ∑4
j=1
(bj ∗ fe
), (3)
where:
• CEx = Total weight of CO2 emissions produced at terminal in tonnes;• ai = Yearly consumption of fuel in Tonnes of Oil Equivalaents (TOEs) with equipment i;• ff = Emission factor in tonnes of CO2 emission per TOE;• bj = Yearly consumption of electricity in kWh with equipment j;• fe = Emission factor in tonnes of CO2 emission per kWh.
It is interesting to see how this formula also considers electricity consumption andCO2 emissions per kWh, showing a strong correlation between energy CO2 emissions.Thanks to this relation, it can be seen how intervening on parameters such as fuel andelectricity consumption, through the adoption of sustainable fuels and energy management
Infrastructures 2021, 6, 114 17 of 36
systems, can lead to a reduction of emissions. Indeed, this study eventually proposestechnical measures to tackle the emissions problem, including replacing traditional fuelssuch as diesel with more sustainable alternatives such as Liquid Natural Gas (LNG).These topics will be discussed in the following paragraph; the highlight here is that itis possible to estimate emissions in ports through mathematical models, despite all thepreviously mentioned uncertainties and difficulties. This could be seen as a stimulus toscientific research, so that even more refined and inclusive methodologies are developed inthe future.
6. Proposed Actions and Technologies to Manage Emissions in Ports
The following paragraphs will list and describe some of the most effective interven-tions and technologies that can be adopted to manage the problem of emissions in ports.Mitigation measures mainly translate into reducing the amount of emitted gases, thanks forexample to the adoption of alternative power sources, engines and fuels, or by installingon-board exhaust remediation systems; adaptation measures comprehend systems such ascarbon capture technologies to collect and exploit the already emitted CO2 in atmosphere,and scrubbers.
6.1. Power and Propulsion Systems
Thermal engines are heavy emitters of emissions, especially if burning fossil fuelssuch as diesel. The replacement of thermal engines with electric mitigates the problemof emissions, as the latter do not require the combustion of polluting fuels at all. Electricpropulsion systems for ships add up further benefits such as lesser vibrations, reduceddimensions, better energy management, and easier maneuvering operations for ships [50].The adoption of electrical engines can be thought both for vessels and land vehicles insidethe port area; in case of ships, it must consider elements such as available space andgeometry necessary for the installation, but also the length of navigation routes becauseelectric motors perform better depending on the type of navigation: electric motors formarine use have greater efficiency for low-range speeds, whereas diesel engines havevery high fuel consumptions. It is estimated that powering ships with electrical enginesleads to a reduction in fuel consumption by up to 7.66%, a reduction of SO2 and CO2emissions respectively by 16 kg and 5.2 t proportionally to the quantity of consumed fuel,a reduction of NOx emissions by 26.6%; some minor improvements on cost efficiencyalso noted, observing a difference in maintenance and operation costs by 1.9% in favorof electric systems [51]. Reduced NOx emissions can be also achieved thanks to Hybridpropulsion systems [52]: comparing a cruise ship with a 20 MW electrical propulsionpower and 5 diesel generators running at 720 rpm to another cruise ship with 20 MWmechanical propulsion plant per shaft and two main 20 MW engines at 500 rpm if four-stroke diesel engines or 80 rpm if two-strokes, the diesel generators in electrical propulsionwill produce 9.7 g/kWh, whereas diesel engines in mechanical propulsion will produce10.5 g/kWh and 14.4 g/kWh if four or two-strokes, respectively (cycle-averaged NOxproduction) [53]. With relation to traditional fuels such as diesel and with mechanicalcomponents of ship engines, in order to control CO2 emissions from shipping, in July 2011the IMO has imposed the mandatory compliance with Energy Efficiency Index Design(EEDI) for ships: this is an indicator that keeps in count those mechanical parametersthat can have an influence on CO2 emissions, thus suggesting areas of intervention toachieve higher efficiency levels. The focus of this paper is however into ports, thereforewe will not deepen into mechanical aspects such as hull design, travelling speed, or otherparameters involving vessel trips to reduce fuel consumption when travelling; emissionsproduced by vessels are here relevant when they are found inside the port area. EEDI canbe calculated [54] with Equation (4) below:
EEDI =Ep ∗ Fc ∗ CF
Dt ∗ v(gCO2/ton-mile), (4)
Infrastructures 2021, 6, 114 18 of 36
where:
• Ep = Engine power;• Fc = Specific fuel consumption;• CF = Carbon factor;• Dt = Deadweight tonnage;• v = Speed.
6.2. Alternative Fuels
Emissions produced by ships can be reduced by intervening with technical upgradesin terms of weight and displacement, as well as improving the shape of hulls for moreefficient hydrodynamics; engine optimization plays another role, aiming to achieve higherperformance, reduced fuel consumption, and energy recovery. The majority of ships arepowered by diesel engines, leading to high amounts of CO2 emissions. Along with theinstallation of filters, scrubbers, and other similar devices, switching to alternative marinefuels such as Liquefied Natural Gas (LNG) or methanol can help with the reduction ofengine emissions thanks to their superior environmental quality [38]. The implementationof alternative fuels could be extended as well to inland vehicles operating inside ports,reducing emissions further.
6.2.1. Liquid Natural Gas (LNG) and Liquid Propane Gas (LPG)
Liquid Natural Gas (LNG) is natural gas in liquid form. It is colorless, odorless, andnon-toxic and non-corrosive, and therefore environment friendly and can be employed insensitive and expensive equipment and machinery. It requires expensive cryogenic systemsfor liquefaction, therefore its infrastructure and operational costs might be challengingor even out of reach for some companies or countries [54,55]. On the other hand, LNGpowered systems offer better performance in terms of sustainability and environmentalimpact compared to diesel [56,57]. Liquid Propane Gas (LPG), a mix of liquid propane andbutane; due to their low density, their carriage requires larger tanks along with detectionsystems for vapors and leaks. LPG produces no SOx and reduced PMx but higher amountsof CO2. LPG gets liquefied through light pressures. Figure 14 [58] below shows thecumulative amount of LNG ships already built or being ordered before mid-2018, withthe exclusion of LNG carriers. Figure 15 [58] displays the life-cycle GHG emissions forcruise ship engines and by fuel type for a 100-year Global Warming Potential (GWP). BeingLNG composed of methane for the most part, the “methane slip” surplus consists in theunburned methane fraction escaping into the atmosphere during the combustion process.
Infrastructures 2021, 6, x FOR PEER REVIEW 21 of 40
6.2.1. Liquid Natural Gas (LNG) and Liquid Propane Gas (LPG)
Liquid Natural Gas (LNG) is natural gas in liquid form. It is colorless, odorless, and
non-toxic and non-corrosive, and therefore environment friendly and can be employed in
sensitive and expensive equipment and machinery. It requires expensive cryogenic sys-
tems for liquefaction, therefore its infrastructure and operational costs might be challeng-
ing or even out of reach for some companies or countries [54,55]. On the other hand, LNG
powered systems offer better performance in terms of sustainability and environmental
impact compared to diesel [56,57]. Liquid Propane Gas (LPG), a mix of liquid propane
and butane; due to their low density, their carriage requires larger tanks along with de-
tection systems for vapors and leaks. LPG produces no SOx and reduced PMx but higher
amounts of CO2. LPG gets liquefied through light pressures. Figure 14 [58] below shows
the cumulative amount of LNG ships already built or being ordered before mid-2018, with
the exclusion of LNG carriers. Figure 15 [58] displays the life-cycle GHG emissions for
cruise ship engines and by fuel type for a 100-year Global Warming Potential (GWP). Be-
ing LNG composed of methane for the most part, the “methane slip” surplus consists in
the unburned methane fraction escaping into the atmosphere during the combustion pro-
cess.
Figure 14. Number of ships build or ordered by mid-2018. Reprinted from ref. [58]. Figure 14. Number of ships build or ordered by mid-2018. Reprinted from ref. [58].
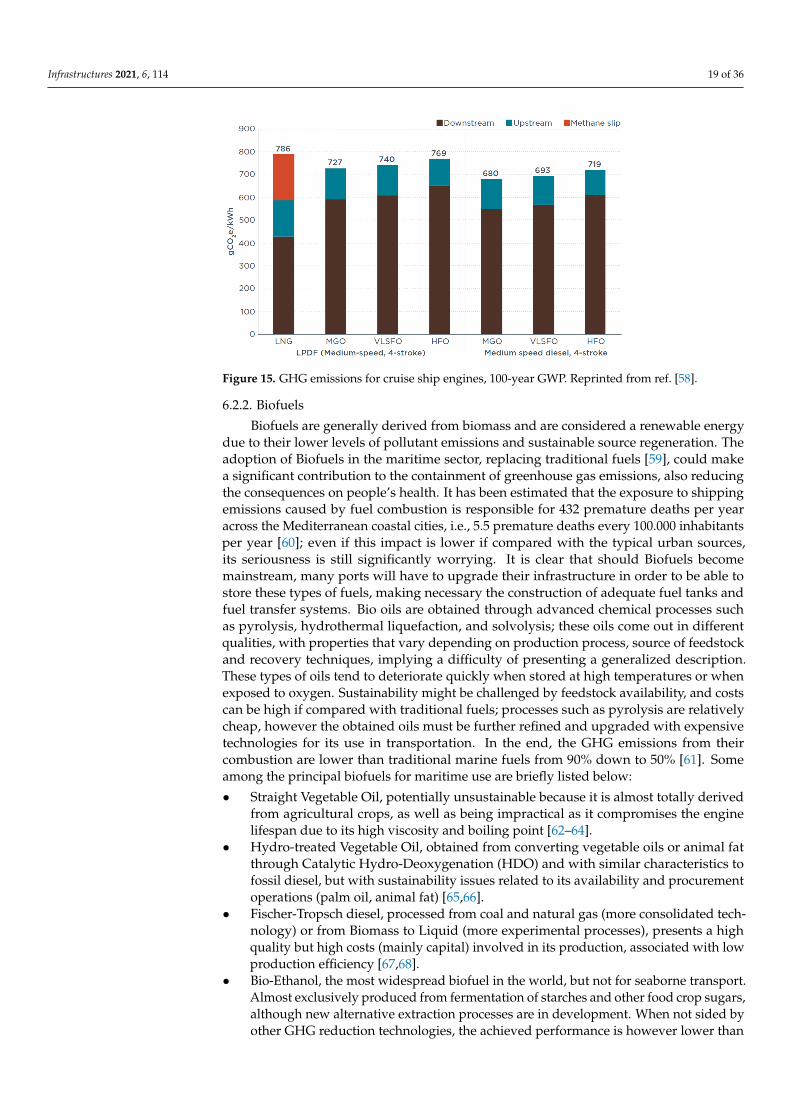
Infrastructures 2021, 6, 114 19 of 36Infrastructures 2021, 6, x FOR PEER REVIEW 22 of 40
Figure 15. GHG emissions for cruise ship engines, 100-year GWP. Reprinted from ref. [58].
6.2.2. Biofuels
Biofuels are generally derived from biomass and are considered a renewable energy
due to their lower levels of pollutant emissions and sustainable source regeneration. The
adoption of Biofuels in the maritime sector, replacing traditional fuels [59], could make a
significant contribution to the containment of greenhouse gas emissions, also reducing the
consequences on people’s health. It has been estimated that the exposure to shipping emis-
sions caused by fuel combustion is responsible for 432 premature deaths per year across
the Mediterranean coastal cities, i.e., 5.5 premature deaths every 100.000 inhabitants per
year [60]; even if this impact is lower if compared with the typical urban sources, its seri-
ousness is still significantly worrying. It is clear that should Biofuels become mainstream,
many ports will have to upgrade their infrastructure in order to be able to store these types
of fuels, making necessary the construction of adequate fuel tanks and fuel transfer sys-
tems. Bio oils are obtained through advanced chemical processes such as pyrolysis, hy-
drothermal liquefaction, and solvolysis; these oils come out in different qualities, with
properties that vary depending on production process, source of feedstock and recovery
techniques, implying a difficulty of presenting a generalized description. These types of
oils tend to deteriorate quickly when stored at high temperatures or when exposed to
oxygen. Sustainability might be challenged by feedstock availability, and costs can be high
if compared with traditional fuels; processes such as pyrolysis are relatively cheap, how-
ever the obtained oils must be further refined and upgraded with expensive technologies
for its use in transportation. In the end, the GHG emissions from their combustion are
lower than traditional marine fuels from 90% down to 50% [61]. Some among the principal
biofuels for maritime use are briefly listed below:
• Straight Vegetable Oil, potentially unsustainable because it is almost totally derived
from agricultural crops, as well as being impractical as it compromises the engine
lifespan due to its high viscosity and boiling point [62–64].
• Hydro-treated Vegetable Oil, obtained from converting vegetable oils or animal fat
through Catalytic Hydro-Deoxygenation (HDO) and with similar characteristics to
fossil diesel, but with sustainability issues related to its availability and procurement
operations (palm oil, animal fat) [65,66].
• Fischer-Tropsch diesel, processed from coal and natural gas (more consolidated tech-
nology) or from Biomass to Liquid (more experimental processes), presents a high
Figure 15. GHG emissions for cruise ship engines, 100-year GWP. Reprinted from ref. [58].
6.2.2. Biofuels
Biofuels are generally derived from biomass and are considered a renewable energydue to their lower levels of pollutant emissions and sustainable source regeneration. Theadoption of Biofuels in the maritime sector, replacing traditional fuels [59], could makea significant contribution to the containment of greenhouse gas emissions, also reducingthe consequences on people’s health. It has been estimated that the exposure to shippingemissions caused by fuel combustion is responsible for 432 premature deaths per yearacross the Mediterranean coastal cities, i.e., 5.5 premature deaths every 100.000 inhabitantsper year [60]; even if this impact is lower if compared with the typical urban sources,its seriousness is still significantly worrying. It is clear that should Biofuels becomemainstream, many ports will have to upgrade their infrastructure in order to be able tostore these types of fuels, making necessary the construction of adequate fuel tanks andfuel transfer systems. Bio oils are obtained through advanced chemical processes suchas pyrolysis, hydrothermal liquefaction, and solvolysis; these oils come out in differentqualities, with properties that vary depending on production process, source of feedstockand recovery techniques, implying a difficulty of presenting a generalized description.These types of oils tend to deteriorate quickly when stored at high temperatures or whenexposed to oxygen. Sustainability might be challenged by feedstock availability, and costscan be high if compared with traditional fuels; processes such as pyrolysis are relativelycheap, however the obtained oils must be further refined and upgraded with expensivetechnologies for its use in transportation. In the end, the GHG emissions from theircombustion are lower than traditional marine fuels from 90% down to 50% [61]. Someamong the principal biofuels for maritime use are briefly listed below:
• Straight Vegetable Oil, potentially unsustainable because it is almost totally derivedfrom agricultural crops, as well as being impractical as it compromises the enginelifespan due to its high viscosity and boiling point [62–64].
• Hydro-treated Vegetable Oil, obtained from converting vegetable oils or animal fatthrough Catalytic Hydro-Deoxygenation (HDO) and with similar characteristics tofossil diesel, but with sustainability issues related to its availability and procurementoperations (palm oil, animal fat) [65,66].
• Fischer-Tropsch diesel, processed from coal and natural gas (more consolidated tech-nology) or from Biomass to Liquid (more experimental processes), presents a highquality but high costs (mainly capital) involved in its production, associated with lowproduction efficiency [67,68].
• Bio-Ethanol, the most widespread biofuel in the world, but not for seaborne transport.Almost exclusively produced from fermentation of starches and other food crop sugars,although new alternative extraction processes are in development. When not sided byother GHG reduction technologies, the achieved performance is however lower than
Infrastructures 2021, 6, 114 20 of 36
for other biofuels such as Bio-Methanol. Its use for maritime transport is currentlyminimal, with few or no related projects at the moment [69,70].
• Bio-Methanol, produced from biomass instead of fossil fuels such as standard Methanol.The procurement of biomass can be challenging due to availability and logistic diffi-culties, eventually becoming an uneconomical process, in addition to production costs.Besides, biomass can also add a further impact upon GHG emissions on its own (forexample from feedstock); Bio-Methanol has already been tested and used as a dieselfuel for marine engines, which appear to require technical adjustments to cope withits corrosive nature and high auto-ignition temperature. The levels of GHG emissionsfrom Bio-Methanol are anyways lower when compared with common Heavy Fuel Oil(HFO) and Marine Gas Oil (MGO) [71,72].
• Bio-Dimethyl Ether, which can be a direct substitute of diesel fuels. It can be producedfrom processing Methanol with expensive production processes. It is hence derivedfrom fossil fuels, and its production processes hold similar pros and cons of those forMethanol. Having a similar behavior to Propane, the same storage and distributioninfrastructure can be used on ships and ports; it is more compatible than Methanolwith diesel engines, requiring minor adjustments, although presenting low viscosityand lubricity that does not facilitate engine movements. It is characterized by a cleancombustion and consequently by clean emissions [73,74].
• Bio-Liquid Natural Gas (Bio-LNG), and Liquefied Bio-Methane (LBM), obtained fromseveral complex production processes, have the disadvantage of a limited supply,having to rely on feedstock availability and transportation, considering that feedstockis also used for other competing industries, as well as its derivate fuels. LNG can leadto a phenomenon called “methane slip”, meaning that part of the methane, whichis a potentially hazardous GHG gas, can leak into the atmosphere during transferoperations or even during combustion. Bio-LNG is however a very attractive fuel formaritime transportation due to its clean emissions, considering for example the muchlower SOx emissions compared to low-Sulphur distillate marine fuel [75–78].
6.2.3. Other Green Fuels
• Ammonia (NH3), commonly used as a fertilizer, can also be used as a fuel bothby direct combustion and stored in fuel cells [79,80]. It is produced almost totallystarting from fossil fuels (natural gas) and a sustainable ecological production wouldrequire significant renewable resources. GHG Emissions from marine engines usinggeothermal-based ammonia as dual fuel can decrease up to 33.5% tonne/Km, and upto 69% if used as a unique type of fuel [81].
• Hydrogen (H2), for electric engines. Can be produced either from fossil fuels butalso from water electrolysis with green electricity, in this case meaning theoreticallyzero-emission ships. The required raw materials are only oxygen and nitrogen, andthe byproducts are just heath and water. Hydrogen as a fuel needs large storage tanksboth in liquid and gas forms, besides dedicated bunkering infrastructure currentlynot available [82,83].
6.3. CO2 and Carbon Capture Systems
Besides switching to green fuels and pursuing energy efficiency, Carbon CaptureSystems (CCS) are another solution to reduce CO2 emissions. This technology can beinstalled directly on-board, and there are three main types of CCS: pre-combustion andoxy-combustion systems, which would require invasive modifications on the engines,and post-combustion systems that do not require any engine adjustment but still requirethe installation of gas treatment hardware [84]. Once captured, CO2 must be stockedon-board; in its gaseous form, CO2 would occupy a large storage volume which is notavailable on vessels as space must be reserved for goods and facilities, therefore CO2 mustbe liquefied and stored inside tanks: this operation requires the installation of compressionand liquefaction systems. Besides, CO2 carrier tankers can directly inject and store liquid
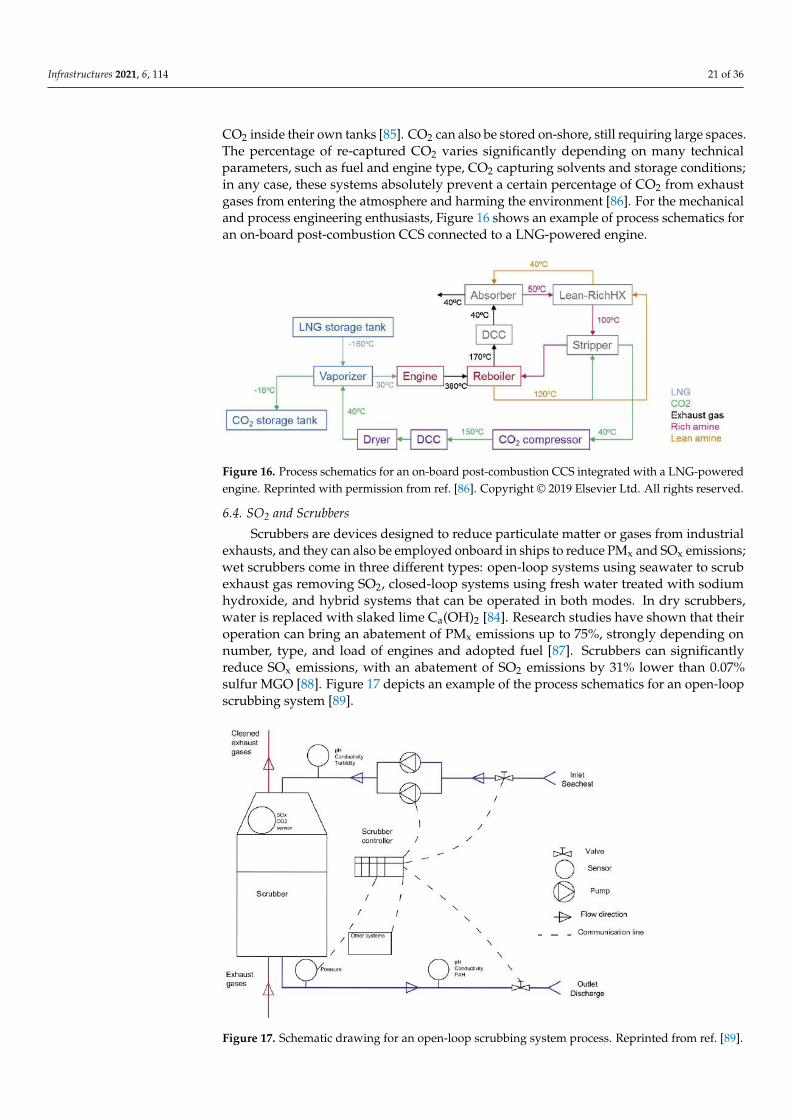
Infrastructures 2021, 6, 114 21 of 36
CO2 inside their own tanks [85]. CO2 can also be stored on-shore, still requiring large spaces.The percentage of re-captured CO2 varies significantly depending on many technicalparameters, such as fuel and engine type, CO2 capturing solvents and storage conditions;in any case, these systems absolutely prevent a certain percentage of CO2 from exhaustgases from entering the atmosphere and harming the environment [86]. For the mechanicaland process engineering enthusiasts, Figure 16 shows an example of process schematics foran on-board post-combustion CCS connected to a LNG-powered engine.
Infrastructures 2021, 6, x FOR PEER REVIEW 24 of 40
6.3. CO2 and Carbon Capture Systems
Besides switching to green fuels and pursuing energy efficiency, Carbon Capture
Systems (CCS) are another solution to reduce CO2 emissions. This technology can be in-
stalled directly on-board, and there are three main types of CCS: pre-combustion and oxy-
combustion systems, which would require invasive modifications on the engines, and
post-combustion systems that do not require any engine adjustment but still require the
installation of gas treatment hardware [84]. Once captured, CO2 must be stocked on-board;
in its gaseous form, CO2 would occupy a large storage volume which is not available on
vessels as space must be reserved for goods and facilities, therefore CO2 must be liquefied
and stored inside tanks: this operation requires the installation of compression and lique-
faction systems. Besides, CO2 carrier tankers can directly inject and store liquid CO2 inside
their own tanks [85]. CO2 can also be stored on-shore, still requiring large spaces. The per-
centage of re-captured CO2 varies significantly depending on many technical parameters,
such as fuel and engine type, CO2 capturing solvents and storage conditions; in any case,
these systems absolutely prevent a certain percentage of CO2 from exhaust gases from
entering the atmosphere and harming the environment [86]. For the mechanical and pro-
cess engineering enthusiasts, Figure 16 shows an example of process schematics for an on-
board post-combustion CCS connected to a LNG-powered engine.
Figure 16. Process schematics for an on-board post-combustion CCS integrated with a LNG-pow-
ered engine. Reprinted with permission from ref. [86]. Copyright © 2019 Elsevier Ltd. All rights
reserved.
6.4. SO2 and Scrubbers
Scrubbers are devices designed to reduce particulate matter or gases from industrial
exhausts, and they can also be employed onboard in ships to reduce PMx and SOx emis-
sions; wet scrubbers come in three different types: open-loop systems using seawater to
scrub exhaust gas removing SO2, closed-loop systems using fresh water treated with so-
dium hydroxide, and hybrid systems that can be operated in both modes. In dry scrub-
bers, water is replaced with slaked lime Ca(OH)2 [84]. Research studies have shown that
their operation can bring an abatement of PMx emissions up to 75%, strongly depending
on number, type, and load of engines and adopted fuel [87]. Scrubbers can significantly
reduce SOx emissions, with an abatement of SO2 emissions by 31% lower than 0.07% sulfur
MGO [88]. Figure 17 depicts an example of the process schematics for an open-loop scrub-
bing system [89].
Figure 16. Process schematics for an on-board post-combustion CCS integrated with a LNG-poweredengine. Reprinted with permission from ref. [86]. Copyright © 2019 Elsevier Ltd. All rights reserved.
6.4. SO2 and Scrubbers
Scrubbers are devices designed to reduce particulate matter or gases from industrialexhausts, and they can also be employed onboard in ships to reduce PMx and SOx emissions;wet scrubbers come in three different types: open-loop systems using seawater to scrubexhaust gas removing SO2, closed-loop systems using fresh water treated with sodiumhydroxide, and hybrid systems that can be operated in both modes. In dry scrubbers,water is replaced with slaked lime Ca(OH)2 [84]. Research studies have shown that theiroperation can bring an abatement of PMx emissions up to 75%, strongly depending onnumber, type, and load of engines and adopted fuel [87]. Scrubbers can significantlyreduce SOx emissions, with an abatement of SO2 emissions by 31% lower than 0.07%sulfur MGO [88]. Figure 17 depicts an example of the process schematics for an open-loopscrubbing system [89].
Infrastructures 2021, 6, x FOR PEER REVIEW 25 of 40
Figure 17. Schematic drawing for an open-loop scrubbing system process. Reprinted from ref. [89].
6.5. Renewable Energies: Photovoltaic, Wind, and Fuel Cells
Renewable energies are today part of a global energy transition scheme, aiming to
reduce the dependence on fossil fuels and using alternative green sources such as solar
and wind energy, biogas, and even tidal and wave energy. Since ports are connected to
the inland electrical network in order to provide electricity to machinery but also lighting,
air conditioning systems and so on, they do have an impact on electricity consumption
and thus on the deployment of fossil fuels and related polluting emissions from combus-
tion. Switching to sustainable green sources would lead to a general energetic relief, but
in this sense, ports could also be seen as standalone infrastructures with their own smart-
grids locally producing electricity from renewable sources. This can be imagined by plan-
ning to install photovoltaic panels on roofs, or wind turbine generators (perhaps off-shore
if financially convenient and not interfering with ship operations), biogas, or even from
fishing harbor waste or exploiting tidal and wave energy with the latest technology. Even
if not fully energetically autonomous, ports could benefit from these forms of energy pro-
duction of up to 60% of their daily requirements [90]. Photovoltaic and wind energy ap-
plied to maritime transport impact in terms of emissions by reducing CO2 up to 32% and
12% from photovoltaic and wind, respectively [54]. The role of wind has always been im-
portant within the maritime industry, as it was one of the most important forms of pro-
pulsion in the past, characterizing entire historical eras. Since this study wants to focus on
ports, the role of wind energy will be treated for inland infrastructure, leaving on purpose
to other research works the ship-related aspects. A research study conducted in Iran has
examined the possibility of using wind energy to produce hydrogen from sea water,
choosing various coastal cities on both coasts (Southern and Northern) for their case
study. The wind energy generation potential was evaluated with a statistical approach
(Weibull distribution), calculating how much energy could be generated by commercially
available wind turbines and the quantity of desalinated water and hydrogen could be
produced with this energy. Among the assessed locations, the port at city of Anzali on the
Northern coast was the location with the highest efficiency for producing electricity from
wind: a single EWT direct wind 52/900 turbine installed inside the port can generate an-
nual energy for 2315.53 MWh, meaning a net annual reduction of CO2 emissions of 1804
tons, and 439,950.7 m3 of treated water or 35,973.49 Kg of hydrogen produced in one year.
In the end, a wind farm with 55 turbines would be sufficient to produce enough hydrogen
Figure 17. Schematic drawing for an open-loop scrubbing system process. Reprinted from ref. [89].
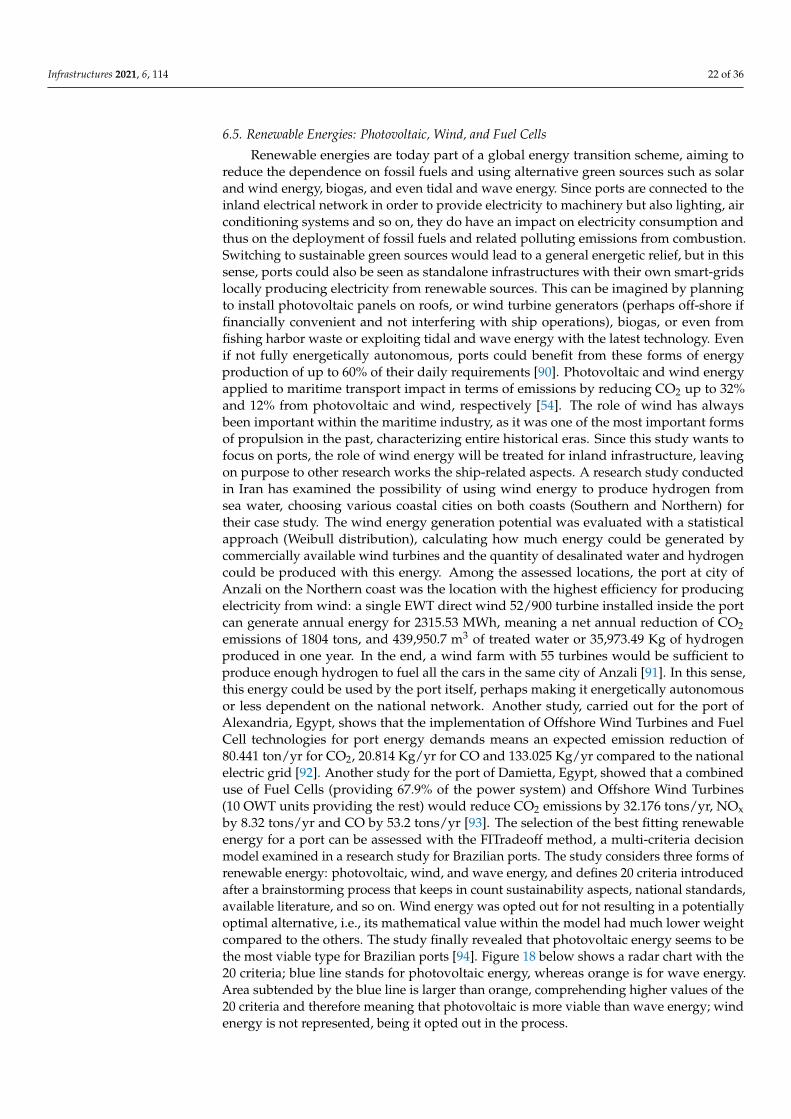
Infrastructures 2021, 6, 114 22 of 36
6.5. Renewable Energies: Photovoltaic, Wind, and Fuel Cells
Renewable energies are today part of a global energy transition scheme, aiming toreduce the dependence on fossil fuels and using alternative green sources such as solarand wind energy, biogas, and even tidal and wave energy. Since ports are connected to theinland electrical network in order to provide electricity to machinery but also lighting, airconditioning systems and so on, they do have an impact on electricity consumption andthus on the deployment of fossil fuels and related polluting emissions from combustion.Switching to sustainable green sources would lead to a general energetic relief, but in thissense, ports could also be seen as standalone infrastructures with their own smart-gridslocally producing electricity from renewable sources. This can be imagined by planningto install photovoltaic panels on roofs, or wind turbine generators (perhaps off-shore iffinancially convenient and not interfering with ship operations), biogas, or even fromfishing harbor waste or exploiting tidal and wave energy with the latest technology. Evenif not fully energetically autonomous, ports could benefit from these forms of energyproduction of up to 60% of their daily requirements [90]. Photovoltaic and wind energyapplied to maritime transport impact in terms of emissions by reducing CO2 up to 32%and 12% from photovoltaic and wind, respectively [54]. The role of wind has alwaysbeen important within the maritime industry, as it was one of the most important formsof propulsion in the past, characterizing entire historical eras. Since this study wants tofocus on ports, the role of wind energy will be treated for inland infrastructure, leavingon purpose to other research works the ship-related aspects. A research study conductedin Iran has examined the possibility of using wind energy to produce hydrogen fromsea water, choosing various coastal cities on both coasts (Southern and Northern) fortheir case study. The wind energy generation potential was evaluated with a statisticalapproach (Weibull distribution), calculating how much energy could be generated bycommercially available wind turbines and the quantity of desalinated water and hydrogencould be produced with this energy. Among the assessed locations, the port at city ofAnzali on the Northern coast was the location with the highest efficiency for producingelectricity from wind: a single EWT direct wind 52/900 turbine installed inside the portcan generate annual energy for 2315.53 MWh, meaning a net annual reduction of CO2emissions of 1804 tons, and 439,950.7 m3 of treated water or 35,973.49 Kg of hydrogenproduced in one year. In the end, a wind farm with 55 turbines would be sufficient toproduce enough hydrogen to fuel all the cars in the same city of Anzali [91]. In this sense,this energy could be used by the port itself, perhaps making it energetically autonomousor less dependent on the national network. Another study, carried out for the port ofAlexandria, Egypt, shows that the implementation of Offshore Wind Turbines and FuelCell technologies for port energy demands means an expected emission reduction of80.441 ton/yr for CO2, 20.814 Kg/yr for CO and 133.025 Kg/yr compared to the nationalelectric grid [92]. Another study for the port of Damietta, Egypt, showed that a combineduse of Fuel Cells (providing 67.9% of the power system) and Offshore Wind Turbines(10 OWT units providing the rest) would reduce CO2 emissions by 32.176 tons/yr, NOxby 8.32 tons/yr and CO by 53.2 tons/yr [93]. The selection of the best fitting renewableenergy for a port can be assessed with the FITradeoff method, a multi-criteria decisionmodel examined in a research study for Brazilian ports. The study considers three forms ofrenewable energy: photovoltaic, wind, and wave energy, and defines 20 criteria introducedafter a brainstorming process that keeps in count sustainability aspects, national standards,available literature, and so on. Wind energy was opted out for not resulting in a potentiallyoptimal alternative, i.e., its mathematical value within the model had much lower weightcompared to the others. The study finally revealed that photovoltaic energy seems to bethe most viable type for Brazilian ports [94]. Figure 18 below shows a radar chart with the20 criteria; blue line stands for photovoltaic energy, whereas orange is for wave energy.Area subtended by the blue line is larger than orange, comprehending higher values of the20 criteria and therefore meaning that photovoltaic is more viable than wave energy; windenergy is not represented, being it opted out in the process.
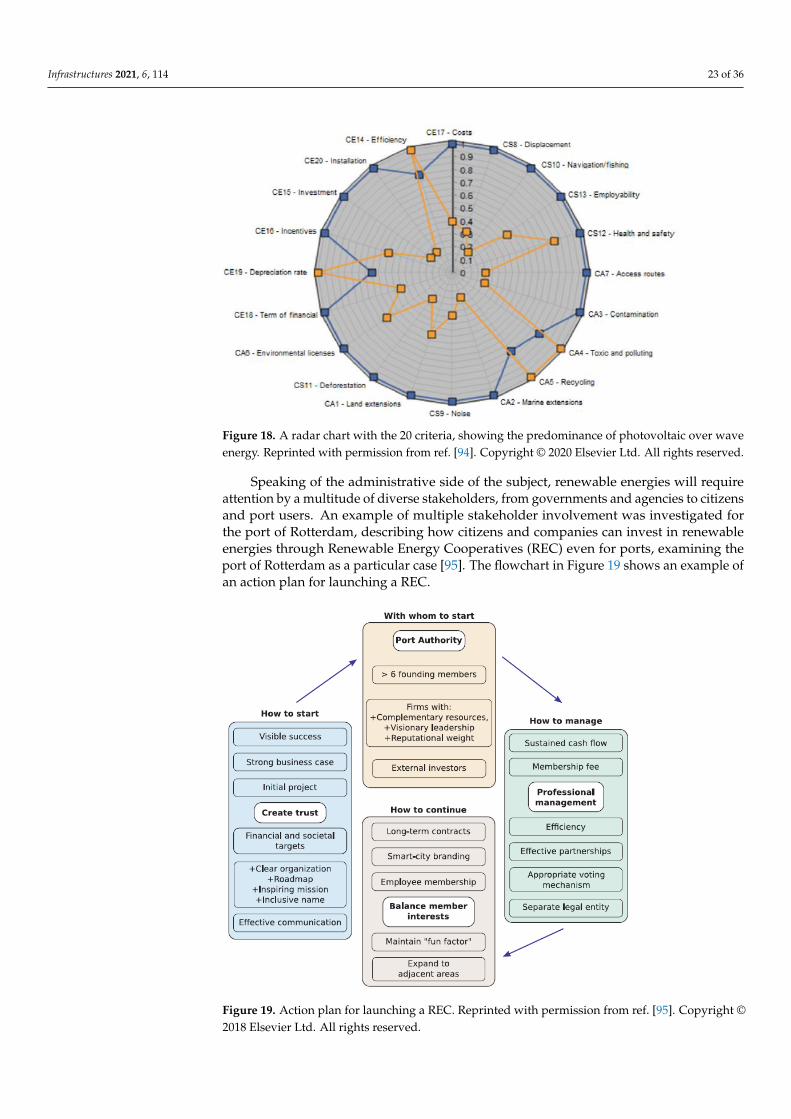
Infrastructures 2021, 6, 114 23 of 36
Infrastructures 2021, 6, x FOR PEER REVIEW 26 of 40
to fuel all the cars in the same city of Anzali [91]. In this sense, this energy could be used
by the port itself, perhaps making it energetically autonomous or less dependent on the
national network. Another study, carried out for the port of Alexandria, Egypt, shows that
the implementation of Offshore Wind Turbines and Fuel Cell technologies for port energy
demands means an expected emission reduction of 80.441 ton/yr for CO2, 20.814 Kg/yr for
CO and 133.025 Kg/yr compared to the national electric grid [92]. Another study for the
port of Damietta, Egypt, showed that a combined use of Fuel Cells (providing 67.9% of
the power system) and Offshore Wind Turbines (10 OWT units providing the rest) would
reduce CO2 emissions by 32.176 tons/yr, NOx by 8.32 tons/yr and CO by 53.2 tons/yr [93].
The selection of the best fitting renewable energy for a port can be assessed with the
FITradeoff method, a multi-criteria decision model examined in a research study for Bra-
zilian ports. The study considers three forms of renewable energy: photovoltaic, wind,
and wave energy, and defines 20 criteria introduced after a brainstorming process that
keeps in count sustainability aspects, national standards, available literature, and so on.
Wind energy was opted out for not resulting in a potentially optimal alternative, i.e., its
mathematical value within the model had much lower weight compared to the others.
The study finally revealed that photovoltaic energy seems to be the most viable type for
Brazilian ports [94]. Figure 18 below shows a radar chart with the 20 criteria; blue line
stands for photovoltaic energy, whereas orange is for wave energy. Area subtended by
the blue line is larger than orange, comprehending higher values of the 20 criteria and
therefore meaning that photovoltaic is more viable than wave energy; wind energy is not
represented, being it opted out in the process.
Figure 18. A radar chart with the 20 criteria, showing the predominance of photovoltaic over wave
energy. Reprinted with permission from ref. [94]. Copyright © 2020 Elsevier Ltd. All rights re-
served.
Speaking of the administrative side of the subject, renewable energies will require
attention by a multitude of diverse stakeholders, from governments and agencies to citi-
zens and port users. An example of multiple stakeholder involvement was investigated
for the port of Rotterdam, describing how citizens and companies can invest in renewable
energies through Renewable Energy Cooperatives (REC) even for ports, examining the
port of Rotterdam as a particular case [95]. The flowchart in Figure 19 shows an example
of an action plan for launching a REC.
Figure 18. A radar chart with the 20 criteria, showing the predominance of photovoltaic over waveenergy. Reprinted with permission from ref. [94]. Copyright © 2020 Elsevier Ltd. All rights reserved.
Speaking of the administrative side of the subject, renewable energies will requireattention by a multitude of diverse stakeholders, from governments and agencies to citizensand port users. An example of multiple stakeholder involvement was investigated forthe port of Rotterdam, describing how citizens and companies can invest in renewableenergies through Renewable Energy Cooperatives (REC) even for ports, examining theport of Rotterdam as a particular case [95]. The flowchart in Figure 19 shows an example ofan action plan for launching a REC.
Infrastructures 2021, 6, x FOR PEER REVIEW 27 of 40
Figure 19. Action plan for launching a REC. Reprinted with permission from ref. [95]. Copyright ©
2018 Elsevier Ltd. All rights reserved.
6.6. On-board Energy Management Systems
During their stay within the port area, ships must often keep their engines on, espe-
cially in order to guarantee the functioning of onboard machinery, lights, air conditioning
systems, and so on; this inevitably means an additional contribution to polluting emis-
sions in ports, as maritime engines are heavy emitters. Through the application of mathe-
matical and statistical models to seaborne technology, it is possible to optimize onboard
energetic processes on vessels by reducing for example fuel consumption and thus reduc-
ing pollutant emissions [96]. This can be achieved thanks to the application of statistical
models [97] and devices that intervene on the technical operations of onboard motors,
setting for example the optimum amount of injected fuel or the best start injection angle,
or acting on the ship electric distribution architecture, with calculations exploiting math-
ematical approaches such as fuzzy logic [98,99]; these statistical models allow the analysis
and comparison of results thanks to the calculation of specific indexes that describe energy
efficiency, fuel consumption or produced emissions. Other forms of energy management
may consider the impact of those elements related to navigational operations (for exam-
ple, weather conditions). Besides reducing emissions, another benefit deriving from the
application of energy management measures consists in a reduction of costs, since less
fuel is consumed [100]. A first action can be directed towards a rational and efficient se-
lection of the required onboard engines: choosing the proper motors can lead up to 2.4%
of energy savings; the application of Waste Heat Recovery systems exploiting a steam-
based Rankine cycle in cogeneration mode, a Rankine cycle optimized for maximum
power out and an organic Rankine cycle using ethanol leads to energy saving ratios of
3.5%, 4.8%, and 6.9%, respectively. The use of batteries can help with achieving a more
uniform engine distribution, flatten large load fluctuations and reducing peaks, so that
engines can operate closer and longer at their highest efficiency point: this can allow en-
ergy savings for up to 1.8% [101]. Thanks to installed WHR systems, it is possible to reduce
fuel consumption saving at least EUR 155 K per year and EUR 3.1 M over 20 years, with
systems using benzene allowing even larger savings for EUR 186 K per year and signifi-
Figure 19. Action plan for launching a REC. Reprinted with permission from ref. [95]. Copyright ©2018 Elsevier Ltd. All rights reserved.
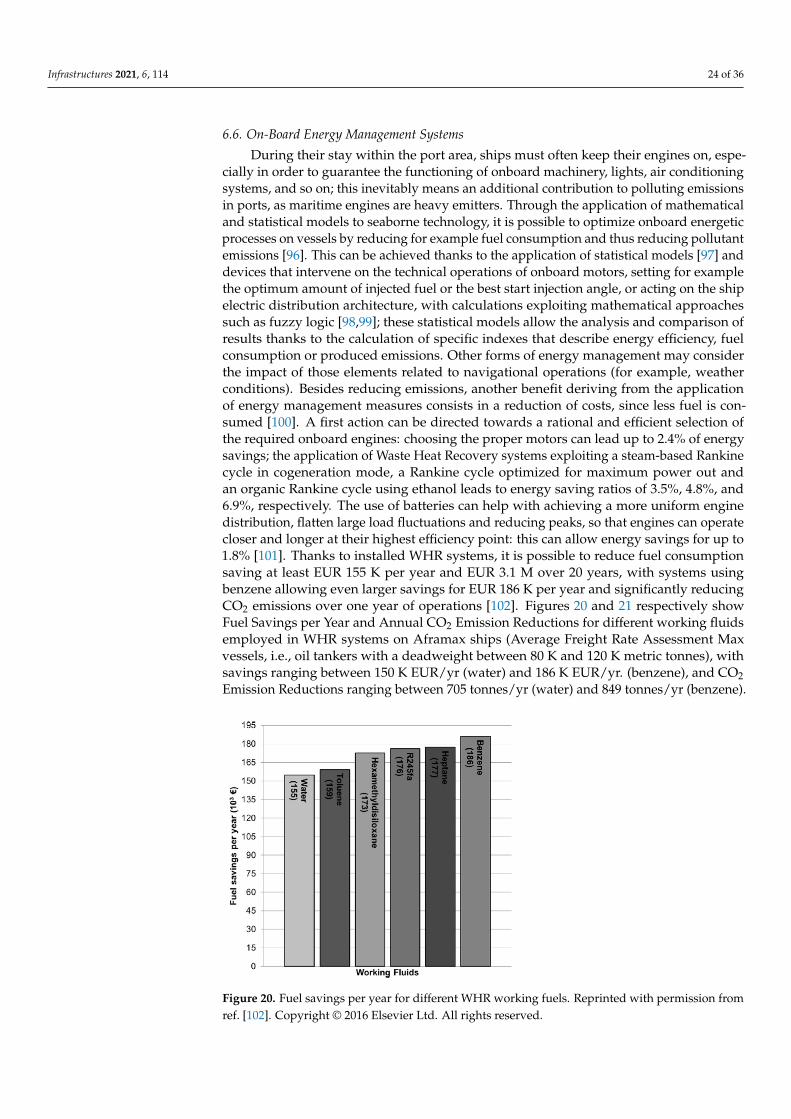
Infrastructures 2021, 6, 114 24 of 36
6.6. On-Board Energy Management Systems
During their stay within the port area, ships must often keep their engines on, espe-cially in order to guarantee the functioning of onboard machinery, lights, air conditioningsystems, and so on; this inevitably means an additional contribution to polluting emissionsin ports, as maritime engines are heavy emitters. Through the application of mathematicaland statistical models to seaborne technology, it is possible to optimize onboard energeticprocesses on vessels by reducing for example fuel consumption and thus reducing pollutantemissions [96]. This can be achieved thanks to the application of statistical models [97] anddevices that intervene on the technical operations of onboard motors, setting for examplethe optimum amount of injected fuel or the best start injection angle, or acting on the shipelectric distribution architecture, with calculations exploiting mathematical approachessuch as fuzzy logic [98,99]; these statistical models allow the analysis and comparison ofresults thanks to the calculation of specific indexes that describe energy efficiency, fuelconsumption or produced emissions. Other forms of energy management may considerthe impact of those elements related to navigational operations (for example, weatherconditions). Besides reducing emissions, another benefit deriving from the applicationof energy management measures consists in a reduction of costs, since less fuel is con-sumed [100]. A first action can be directed towards a rational and efficient selection ofthe required onboard engines: choosing the proper motors can lead up to 2.4% of energysavings; the application of Waste Heat Recovery systems exploiting a steam-based Rankinecycle in cogeneration mode, a Rankine cycle optimized for maximum power out andan organic Rankine cycle using ethanol leads to energy saving ratios of 3.5%, 4.8%, and6.9%, respectively. The use of batteries can help with achieving a more uniform enginedistribution, flatten large load fluctuations and reducing peaks, so that engines can operatecloser and longer at their highest efficiency point: this can allow energy savings for up to1.8% [101]. Thanks to installed WHR systems, it is possible to reduce fuel consumptionsaving at least EUR 155 K per year and EUR 3.1 M over 20 years, with systems usingbenzene allowing even larger savings for EUR 186 K per year and significantly reducingCO2 emissions over one year of operations [102]. Figures 20 and 21 respectively showFuel Savings per Year and Annual CO2 Emission Reductions for different working fluidsemployed in WHR systems on Aframax ships (Average Freight Rate Assessment Maxvessels, i.e., oil tankers with a deadweight between 80 K and 120 K metric tonnes), withsavings ranging between 150 K EUR/yr (water) and 186 K EUR/yr. (benzene), and CO2Emission Reductions ranging between 705 tonnes/yr (water) and 849 tonnes/yr (benzene).
Infrastructures 2021, 6, x FOR PEER REVIEW 28 of 40
cantly reducing CO2 emissions over one year of operations [102]. Figures 20 and 21 re-
spectively show Fuel Savings per Year and Annual CO2 Emission Reductions for different
working fluids employed in WHR systems on Aframax ships (Average Freight Rate As-
sessment Max vessels, i.e., oil tankers with a deadweight between 80 K and 120 K metric
tonnes), with savings ranging between 150 K EUR/yr (water) and 186 K EUR/yr. (ben-
zene), and CO2 Emission Reductions ranging between 705 tonnes/yr (water) and 849
tonnes/yr (benzene).
Figure 20. Fuel savings per year for different WHR working fuels. Reprinted with permission from
ref. [102]. Copyright © 2016 Elsevier Ltd. All rights reserved.
Figure 20. Fuel savings per year for different WHR working fuels. Reprinted with permission fromref. [102]. Copyright © 2016 Elsevier Ltd. All rights reserved.
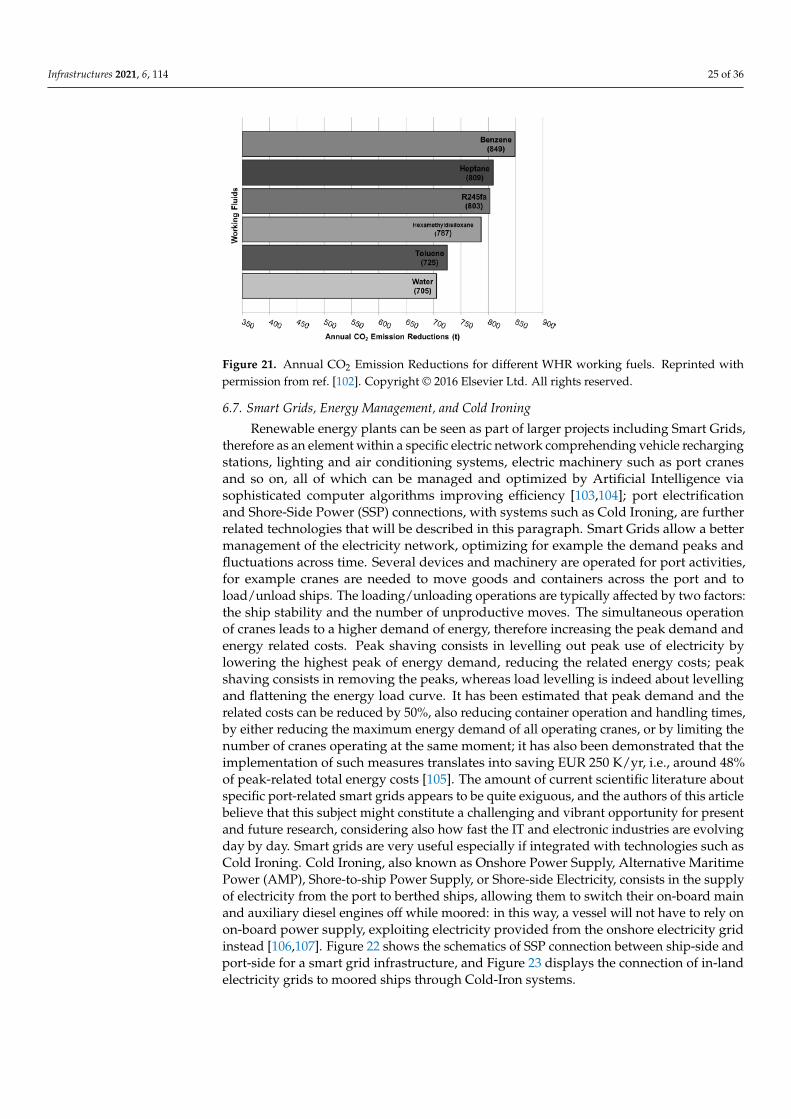
Infrastructures 2021, 6, 114 25 of 36
Infrastructures 2021, 6, x FOR PEER REVIEW 29 of 40
Figure 21. Annual CO2 Emission Reductions for different WHR working fuels. Reprinted with
permission from ref. [102]. Copyright © 2016 Elsevier Ltd. All rights reserved.
6.7. Smart Grids, Energy Management, and Cold Ironing
Renewable energy plants can be seen as part of larger projects including Smart Grids,
therefore as an element within a specific electric network comprehending vehicle recharg-
ing stations, lighting and air conditioning systems, electric machinery such as port cranes
and so on, all of which can be managed and optimized by Artificial Intelligence via so-
phisticated computer algorithms improving efficiency [103,104]; port electrification and
Shore-Side Power (SSP) connections, with systems such as Cold Ironing, are further re-
lated technologies that will be described in this paragraph. Smart Grids allow a better
management of the electricity network, optimizing for example the demand peaks and
fluctuations across time. Several devices and machinery are operated for port activities,
for example cranes are needed to move goods and containers across the port and to
load/unload ships. The loading/unloading operations are typically affected by two factors:
the ship stability and the number of unproductive moves. The simultaneous operation of
cranes leads to a higher demand of energy, therefore increasing the peak demand and
energy related costs. Peak shaving consists in levelling out peak use of electricity by low-
ering the highest peak of energy demand, reducing the related energy costs; peak shaving
consists in removing the peaks, whereas load levelling is indeed about levelling and flat-
tening the energy load curve. It has been estimated that peak demand and the related costs
can be reduced by 50%, also reducing container operation and handling times, by either
reducing the maximum energy demand of all operating cranes, or by limiting the number
of cranes operating at the same moment; it has also been demonstrated that the imple-
mentation of such measures translates into saving EUR 250 K/yr, i.e., around 48% of peak-
related total energy costs [105]. The amount of current scientific literature about specific
port-related smart grids appears to be quite exiguous, and the authors of this article be-
lieve that this subject might constitute a challenging and vibrant opportunity for present
and future research, considering also how fast the IT and electronic industries are evolv-
ing day by day. Smart grids are very useful especially if integrated with technologies such
as Cold Ironing. Cold Ironing, also known as Onshore Power Supply, Alternative Mari-
time Power (AMP), Shore-to-ship Power Supply, or Shore-side Electricity, consists in the
supply of electricity from the port to berthed ships, allowing them to switch their on-board
main and auxiliary diesel engines off while moored: in this way, a vessel will not have to
rely on on-board power supply, exploiting electricity provided from the onshore electric-
ity grid instead [106,107]. Figure 22 shows the schematics of SSP connection between ship-
side and port-side for a smart grid infrastructure, and Figure 23 displays the connection
of in-land electricity grids to moored ships through Cold-Iron systems.
Figure 21. Annual CO2 Emission Reductions for different WHR working fuels. Reprinted withpermission from ref. [102]. Copyright © 2016 Elsevier Ltd. All rights reserved.
6.7. Smart Grids, Energy Management, and Cold Ironing
Renewable energy plants can be seen as part of larger projects including Smart Grids,therefore as an element within a specific electric network comprehending vehicle rechargingstations, lighting and air conditioning systems, electric machinery such as port cranesand so on, all of which can be managed and optimized by Artificial Intelligence viasophisticated computer algorithms improving efficiency [103,104]; port electrificationand Shore-Side Power (SSP) connections, with systems such as Cold Ironing, are furtherrelated technologies that will be described in this paragraph. Smart Grids allow a bettermanagement of the electricity network, optimizing for example the demand peaks andfluctuations across time. Several devices and machinery are operated for port activities,for example cranes are needed to move goods and containers across the port and toload/unload ships. The loading/unloading operations are typically affected by two factors:the ship stability and the number of unproductive moves. The simultaneous operationof cranes leads to a higher demand of energy, therefore increasing the peak demand andenergy related costs. Peak shaving consists in levelling out peak use of electricity bylowering the highest peak of energy demand, reducing the related energy costs; peakshaving consists in removing the peaks, whereas load levelling is indeed about levellingand flattening the energy load curve. It has been estimated that peak demand and therelated costs can be reduced by 50%, also reducing container operation and handling times,by either reducing the maximum energy demand of all operating cranes, or by limiting thenumber of cranes operating at the same moment; it has also been demonstrated that theimplementation of such measures translates into saving EUR 250 K/yr, i.e., around 48%of peak-related total energy costs [105]. The amount of current scientific literature aboutspecific port-related smart grids appears to be quite exiguous, and the authors of this articlebelieve that this subject might constitute a challenging and vibrant opportunity for presentand future research, considering also how fast the IT and electronic industries are evolvingday by day. Smart grids are very useful especially if integrated with technologies such asCold Ironing. Cold Ironing, also known as Onshore Power Supply, Alternative MaritimePower (AMP), Shore-to-ship Power Supply, or Shore-side Electricity, consists in the supplyof electricity from the port to berthed ships, allowing them to switch their on-board mainand auxiliary diesel engines off while moored: in this way, a vessel will not have to rely onon-board power supply, exploiting electricity provided from the onshore electricity gridinstead [106,107]. Figure 22 shows the schematics of SSP connection between ship-side andport-side for a smart grid infrastructure, and Figure 23 displays the connection of in-landelectricity grids to moored ships through Cold-Iron systems.
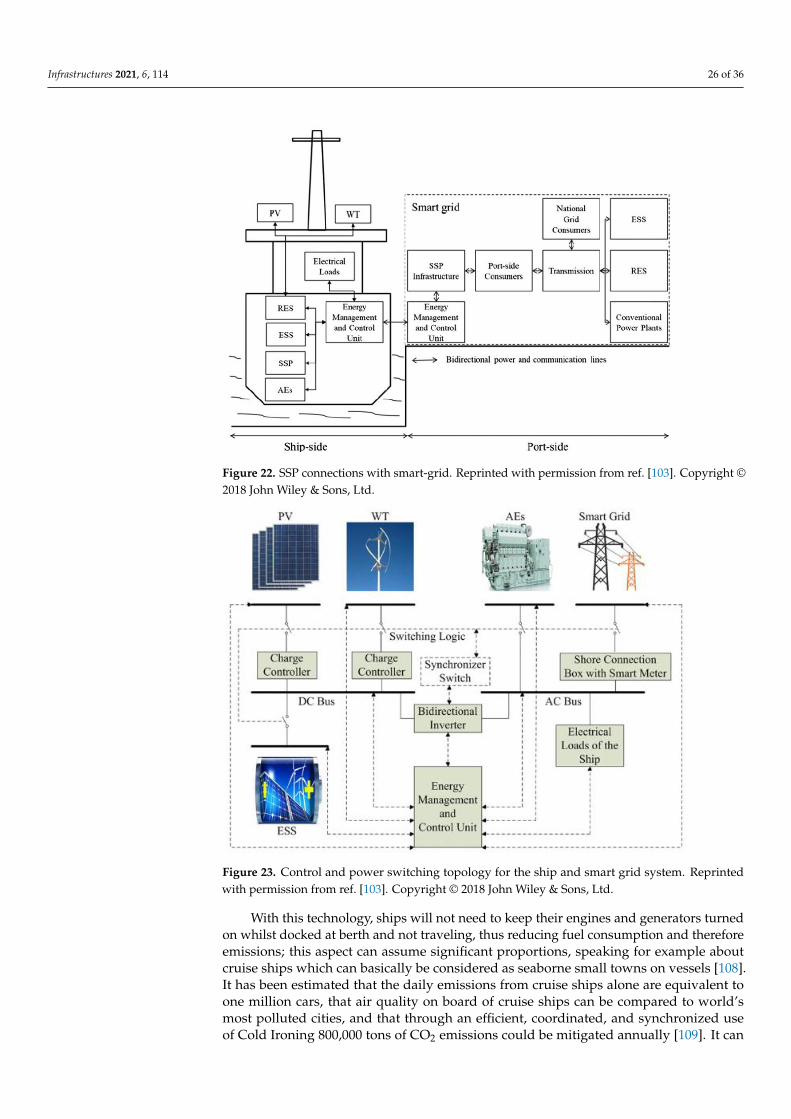
Infrastructures 2021, 6, 114 26 of 36Infrastructures 2021, 6, x FOR PEER REVIEW 30 of 40
Figure 22. SSP connections with smart-grid. Reprinted with permission from ref. [103]. Copyright
© 2018 John Wiley & Sons, Ltd.
Figure 22. SSP connections with smart-grid. Reprinted with permission from ref. [103]. Copyright ©2018 John Wiley & Sons, Ltd.
Infrastructures 2021, 6, x FOR PEER REVIEW 31 of 40
Figure 23. Control and power switching topology for the ship and smart grid system. Reprinted
with permission from ref. [103]. Copyright © 2018 John Wiley & Sons, Ltd.
With this technology, ships will not need to keep their engines and generators turned
on whilst docked at berth and not traveling, thus reducing fuel consumption and therefore
emissions; this aspect can assume significant proportions, speaking for example about
cruise ships which can basically be considered as seaborne small towns on vessels [108].
It has been estimated that the daily emissions from cruise ships alone are equivalent to
one million cars, that air quality on board of cruise ships can be compared to world’s most
polluted cities, and that through an efficient, coordinated, and synchronized use of Cold
Ironing 800,000 tons of CO2 emissions could be mitigated annually [109]. It can be stated
that Cold Ironing can achieve an abatement of local emissions by between 48% and 70%
for CO2, between up to 60% for SOx, and between 40% and 60% for NOx of a container
terminal ship emissions inventory [110]. Integrated systems of Cold Ironing and Cogen-
eration Power Plants can lead to the prevention of 110 tonnes of NOx, over 2 tonnes of
PM10 and over 4 tonnes of SOx per year; the best setups can even abate emissions by 98.58%
for NOx, 79.06% for PM10, and 100% for SOx [111]. Hoteling ships require indeed a certain
amount of energy to power up on-board temperature control systems (heating, cooling,
etc.), emergency equipment, lights, pumps, and other machinery; in order to estimate
emissions, fuel consumption at berth for each engine 𝑖 ∈ {𝑎, 𝑏} can be calculated [112]
through Equation (5) below:
𝐹𝐶𝐵,𝑘(𝑡𝑜𝑛) = ∑ 10−6 ∗ 9(𝑆𝐹𝑂𝐶𝑖,𝑏,𝐾 ∗ 𝐸𝐿𝑖,𝑏,𝐾
𝑖∈(𝑎,𝑏)
∗ 𝐸𝑃𝑖,𝐾) ∗ 𝑡𝐵,𝑘 (5)
where:
• SFOC = Specific Fuel Oil Consumption (g/kWh);
• EL = fractional load (%) of the nominal power EP;
• EP = Nominal Power (kW) of the auxiliary engines (a) and boilers (b);
• 𝑡𝐵,𝑘 = Duration of the ship at berth.
Cold Ironing systems are composed of three parts: the onshore power supply system,
a connecting system between shore and ship, and an on-board power receiving system
Figure 23. Control and power switching topology for the ship and smart grid system. Reprintedwith permission from ref. [103]. Copyright © 2018 John Wiley & Sons, Ltd.
With this technology, ships will not need to keep their engines and generators turnedon whilst docked at berth and not traveling, thus reducing fuel consumption and thereforeemissions; this aspect can assume significant proportions, speaking for example aboutcruise ships which can basically be considered as seaborne small towns on vessels [108].It has been estimated that the daily emissions from cruise ships alone are equivalent toone million cars, that air quality on board of cruise ships can be compared to world’smost polluted cities, and that through an efficient, coordinated, and synchronized useof Cold Ironing 800,000 tons of CO2 emissions could be mitigated annually [109]. It can
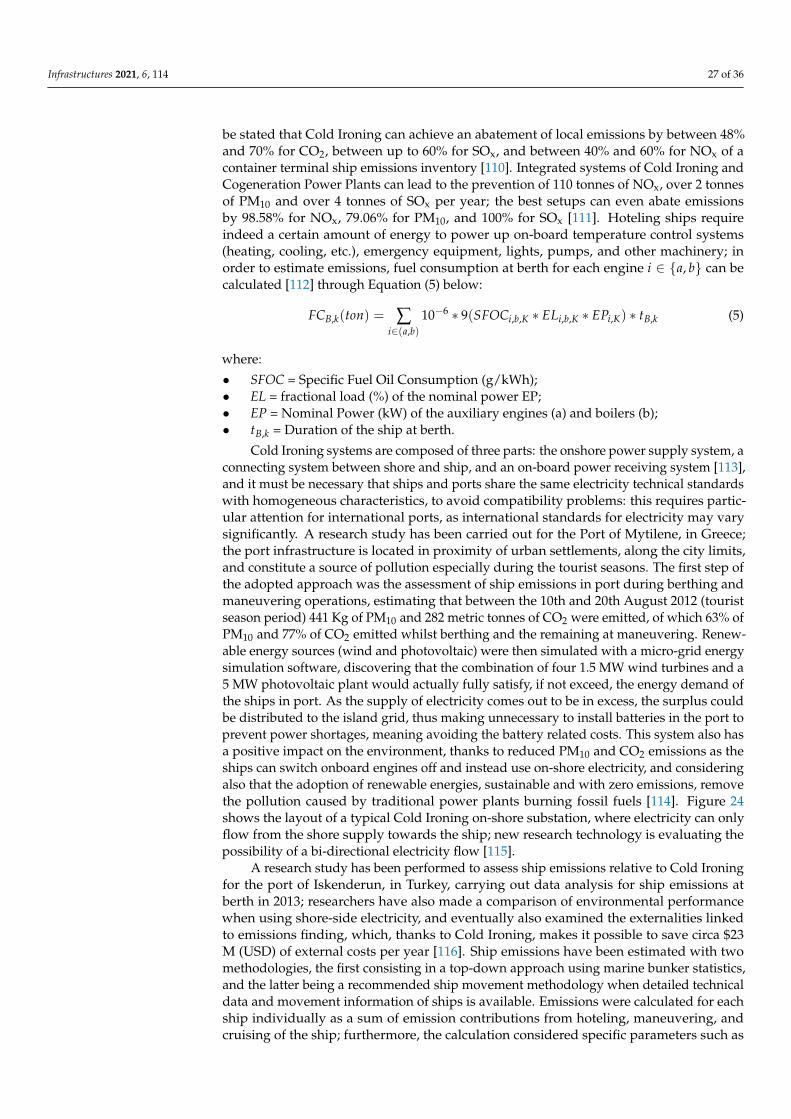
Infrastructures 2021, 6, 114 27 of 36
be stated that Cold Ironing can achieve an abatement of local emissions by between 48%and 70% for CO2, between up to 60% for SOx, and between 40% and 60% for NOx of acontainer terminal ship emissions inventory [110]. Integrated systems of Cold Ironing andCogeneration Power Plants can lead to the prevention of 110 tonnes of NOx, over 2 tonnesof PM10 and over 4 tonnes of SOx per year; the best setups can even abate emissionsby 98.58% for NOx, 79.06% for PM10, and 100% for SOx [111]. Hoteling ships requireindeed a certain amount of energy to power up on-board temperature control systems(heating, cooling, etc.), emergency equipment, lights, pumps, and other machinery; inorder to estimate emissions, fuel consumption at berth for each engine i ∈ {a, b} can becalculated [112] through Equation (5) below:
FCB,k(ton) = ∑i∈(a,b)
10−6 ∗ 9(SFOCi,b,K ∗ ELi,b,K ∗ EPi,K) ∗ tB,k (5)
where:
• SFOC = Specific Fuel Oil Consumption (g/kWh);• EL = fractional load (%) of the nominal power EP;• EP = Nominal Power (kW) of the auxiliary engines (a) and boilers (b);• tB,k = Duration of the ship at berth.
Cold Ironing systems are composed of three parts: the onshore power supply system, aconnecting system between shore and ship, and an on-board power receiving system [113],and it must be necessary that ships and ports share the same electricity technical standardswith homogeneous characteristics, to avoid compatibility problems: this requires partic-ular attention for international ports, as international standards for electricity may varysignificantly. A research study has been carried out for the Port of Mytilene, in Greece;the port infrastructure is located in proximity of urban settlements, along the city limits,and constitute a source of pollution especially during the tourist seasons. The first step ofthe adopted approach was the assessment of ship emissions in port during berthing andmaneuvering operations, estimating that between the 10th and 20th August 2012 (touristseason period) 441 Kg of PM10 and 282 metric tonnes of CO2 were emitted, of which 63% ofPM10 and 77% of CO2 emitted whilst berthing and the remaining at maneuvering. Renew-able energy sources (wind and photovoltaic) were then simulated with a micro-grid energysimulation software, discovering that the combination of four 1.5 MW wind turbines and a5 MW photovoltaic plant would actually fully satisfy, if not exceed, the energy demand ofthe ships in port. As the supply of electricity comes out to be in excess, the surplus couldbe distributed to the island grid, thus making unnecessary to install batteries in the port toprevent power shortages, meaning avoiding the battery related costs. This system also hasa positive impact on the environment, thanks to reduced PM10 and CO2 emissions as theships can switch onboard engines off and instead use on-shore electricity, and consideringalso that the adoption of renewable energies, sustainable and with zero emissions, removethe pollution caused by traditional power plants burning fossil fuels [114]. Figure 24shows the layout of a typical Cold Ironing on-shore substation, where electricity can onlyflow from the shore supply towards the ship; new research technology is evaluating thepossibility of a bi-directional electricity flow [115].
A research study has been performed to assess ship emissions relative to Cold Ironingfor the port of Iskenderun, in Turkey, carrying out data analysis for ship emissions atberth in 2013; researchers have also made a comparison of environmental performancewhen using shore-side electricity, and eventually also examined the externalities linkedto emissions finding, which, thanks to Cold Ironing, makes it possible to save circa $23M (USD) of external costs per year [116]. Ship emissions have been estimated with twomethodologies, the first consisting in a top-down approach using marine bunker statistics,and the latter being a recommended ship movement methodology when detailed technicaldata and movement information of ships is available. Emissions were calculated for eachship individually as a sum of emission contributions from hoteling, maneuvering, andcruising of the ship; furthermore, the calculation considered specific parameters such as
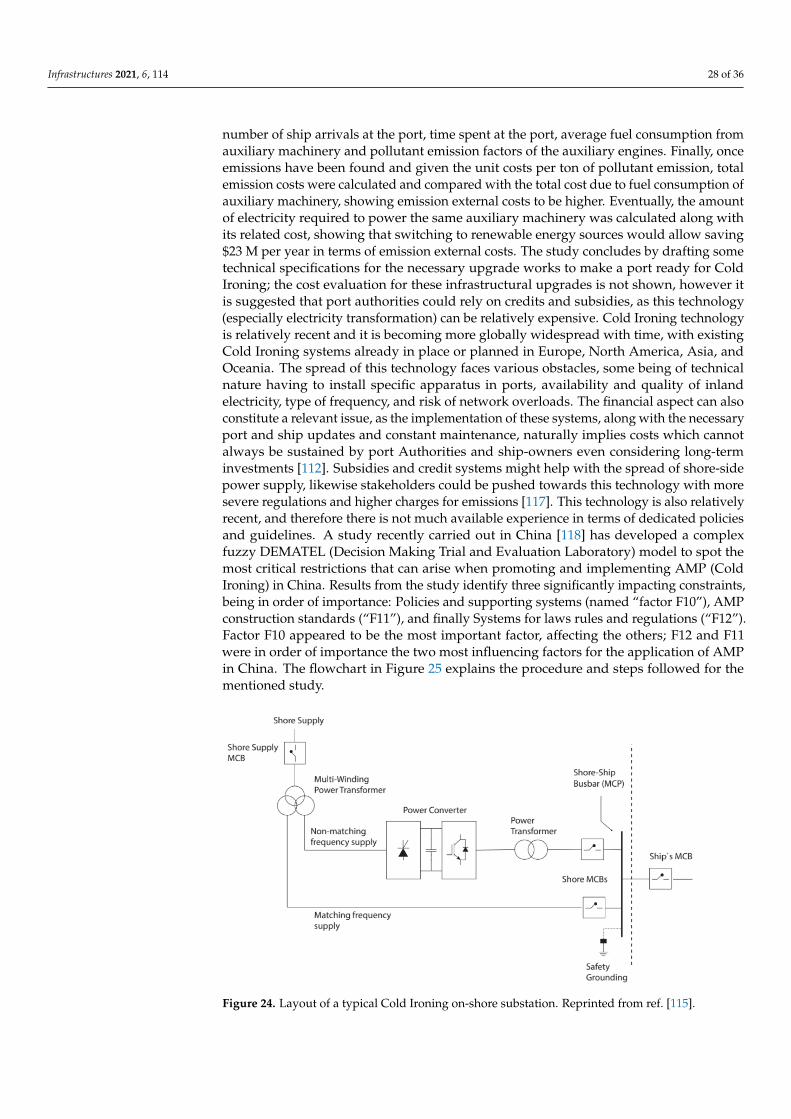
Infrastructures 2021, 6, 114 28 of 36
number of ship arrivals at the port, time spent at the port, average fuel consumption fromauxiliary machinery and pollutant emission factors of the auxiliary engines. Finally, onceemissions have been found and given the unit costs per ton of pollutant emission, totalemission costs were calculated and compared with the total cost due to fuel consumption ofauxiliary machinery, showing emission external costs to be higher. Eventually, the amountof electricity required to power the same auxiliary machinery was calculated along withits related cost, showing that switching to renewable energy sources would allow saving$23 M per year in terms of emission external costs. The study concludes by drafting sometechnical specifications for the necessary upgrade works to make a port ready for ColdIroning; the cost evaluation for these infrastructural upgrades is not shown, however itis suggested that port authorities could rely on credits and subsidies, as this technology(especially electricity transformation) can be relatively expensive. Cold Ironing technologyis relatively recent and it is becoming more globally widespread with time, with existingCold Ironing systems already in place or planned in Europe, North America, Asia, andOceania. The spread of this technology faces various obstacles, some being of technicalnature having to install specific apparatus in ports, availability and quality of inlandelectricity, type of frequency, and risk of network overloads. The financial aspect can alsoconstitute a relevant issue, as the implementation of these systems, along with the necessaryport and ship updates and constant maintenance, naturally implies costs which cannotalways be sustained by port Authorities and ship-owners even considering long-terminvestments [112]. Subsidies and credit systems might help with the spread of shore-sidepower supply, likewise stakeholders could be pushed towards this technology with moresevere regulations and higher charges for emissions [117]. This technology is also relativelyrecent, and therefore there is not much available experience in terms of dedicated policiesand guidelines. A study recently carried out in China [118] has developed a complexfuzzy DEMATEL (Decision Making Trial and Evaluation Laboratory) model to spot themost critical restrictions that can arise when promoting and implementing AMP (ColdIroning) in China. Results from the study identify three significantly impacting constraints,being in order of importance: Policies and supporting systems (named “factor F10”), AMPconstruction standards (“F11”), and finally Systems for laws rules and regulations (“F12”).Factor F10 appeared to be the most important factor, affecting the others; F12 and F11were in order of importance the two most influencing factors for the application of AMPin China. The flowchart in Figure 25 explains the procedure and steps followed for thementioned study.
Infrastructures 2021, 6, x FOR PEER REVIEW 32 of 40
[113], and it must be necessary that ships and ports share the same electricity technical
standards with homogeneous characteristics, to avoid compatibility problems: this re-
quires particular attention for international ports, as international standards for electricity
may vary significantly. A research study has been carried out for the Port of Mytilene, in
Greece; the port infrastructure is located in proximity of urban settlements, along the city
limits, and constitute a source of pollution especially during the tourist seasons. The first
step of the adopted approach was the assessment of ship emissions in port during berth-
ing and maneuvering operations, estimating that between the 10th and 20th August 2012
(tourist season period) 441 Kg of PM10 and 282 metric tonnes of CO2 were emitted, of
which 63% of PM10 and 77% of CO2 emitted whilst berthing and the remaining at maneu-
vering. Renewable energy sources (wind and photovoltaic) were then simulated with a
micro-grid energy simulation software, discovering that the combination of four 1.5 MW
wind turbines and a 5 MW photovoltaic plant would actually fully satisfy, if not exceed,
the energy demand of the ships in port. As the supply of electricity comes out to be in
excess, the surplus could be distributed to the island grid, thus making unnecessary to
install batteries in the port to prevent power shortages, meaning avoiding the battery re-
lated costs. This system also has a positive impact on the environment, thanks to reduced
PM10 and CO2 emissions as the ships can switch onboard engines off and instead use on-
shore electricity, and considering also that the adoption of renewable energies, sustainable
and with zero emissions, remove the pollution caused by traditional power plants burning
fossil fuels [114]. Figure 24 shows the layout of a typical Cold Ironing on-shore substation,
where electricity can only flow from the shore supply towards the ship; new research
technology is evaluating the possibility of a bi-directional electricity flow [115].
Figure 24. Layout of a typical Cold Ironing on-shore substation. Reprinted from ref. [115].
A research study has been performed to assess ship emissions relative to Cold Iron-
ing for the port of Iskenderun, in Turkey, carrying out data analysis for ship emissions at
berth in 2013; researchers have also made a comparison of environmental performance
when using shore-side electricity, and eventually also examined the externalities linked
to emissions finding, which, thanks to Cold Ironing, makes it possible to save circa $23 M
(USD) of external costs per year [116]. Ship emissions have been estimated with two meth-
odologies, the first consisting in a top-down approach using marine bunker statistics, and
the latter being a recommended ship movement methodology when detailed technical
data and movement information of ships is available. Emissions were calculated for each
ship individually as a sum of emission contributions from hoteling, maneuvering, and
cruising of the ship; furthermore, the calculation considered specific parameters such as
Figure 24. Layout of a typical Cold Ironing on-shore substation. Reprinted from ref. [115].
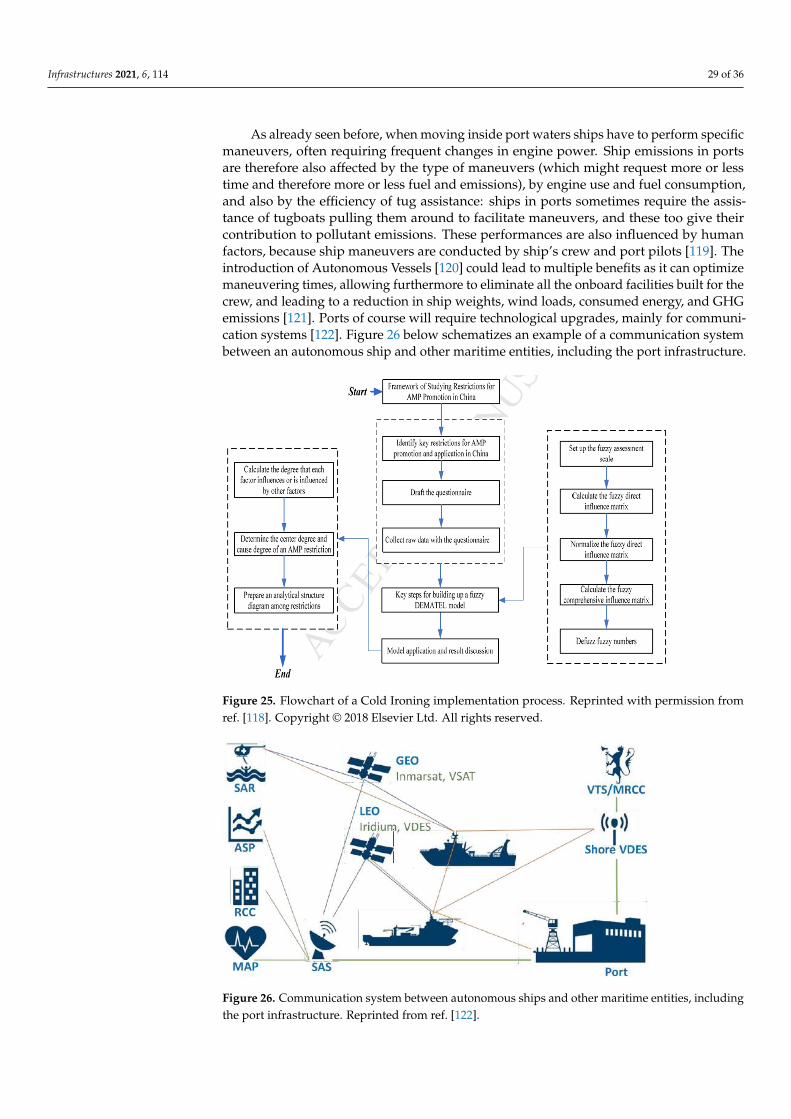
Infrastructures 2021, 6, 114 29 of 36
As already seen before, when moving inside port waters ships have to perform specificmaneuvers, often requiring frequent changes in engine power. Ship emissions in portsare therefore also affected by the type of maneuvers (which might request more or lesstime and therefore more or less fuel and emissions), by engine use and fuel consumption,and also by the efficiency of tug assistance: ships in ports sometimes require the assis-tance of tugboats pulling them around to facilitate maneuvers, and these too give theircontribution to pollutant emissions. These performances are also influenced by humanfactors, because ship maneuvers are conducted by ship’s crew and port pilots [119]. Theintroduction of Autonomous Vessels [120] could lead to multiple benefits as it can optimizemaneuvering times, allowing furthermore to eliminate all the onboard facilities built for thecrew, and leading to a reduction in ship weights, wind loads, consumed energy, and GHGemissions [121]. Ports of course will require technological upgrades, mainly for communi-cation systems [122]. Figure 26 below schematizes an example of a communication systembetween an autonomous ship and other maritime entities, including the port infrastructure.
Infrastructures 2021, 6, x FOR PEER REVIEW 30 of 37
auxiliary machinery and pollutant emission factors of the auxiliary engines. Finally, once emissions have been found and given the unit costs per ton of pollutant emission, total emission costs were calculated and compared with the total cost due to fuel consumption of auxiliary machinery, showing emission external costs to be higher. Eventually, the amount of electricity required to power the same auxiliary machinery was calculated along with its related cost, showing that switching to renewable energy sources would allow saving $23 M per year in terms of emission external costs. The study concludes by drafting some technical specifications for the necessary upgrade works to make a port ready for Cold Ironing; the cost evaluation for these infrastructural upgrades is not shown, however it is suggested that port authorities could rely on credits and subsidies, as this technology (especially electricity transformation) can be relatively expensive. Cold Iron-ing technology is relatively recent and it is becoming more globally widespread with time, with existing Cold Ironing systems already in place or planned in Europe, North America, Asia, and Oceania. The spread of this technology faces various obstacles, some being of technical nature having to install specific apparatus in ports, availability and quality of inland electricity, type of frequency, and risk of network overloads. The financial aspect can also constitute a relevant issue, as the implementation of these systems, along with the necessary port and ship updates and constant maintenance, naturally implies costs which cannot always be sustained by port Authorities and ship-owners even considering long-term investments [112]. Subsidies and credit systems might help with the spread of shore-side power supply, likewise stakeholders could be pushed towards this technology with more severe regulations and higher charges for emissions [117]. This technology is also relatively recent, and therefore there is not much available experience in terms of dedicated policies and guidelines. A study recently carried out in China [118] has devel-oped a complex fuzzy DEMATEL (Decision Making Trial and Evaluation Laboratory) model to spot the most critical restrictions that can arise when promoting and implement-ing AMP (Cold Ironing) in China. Results from the study identify three significantly im-pacting constraints, being in order of importance: Policies and supporting systems (named “factor F10”), AMP construction standards (“F11”), and finally Systems for laws rules and regulations (“F12”). Factor F10 appeared to be the most important factor, affecting the others; F12 and F11 were in order of importance the two most influencing factors for the application of AMP in China. The flowchart in Figure 25 explains the procedure and steps followed for the mentioned study.
Figure 25. Flowchart of a Cold Ironing implementation process. Reprinted with permission from ref. [118]. Copyright © 2018 Elsevier Ltd. All rights reserved. Figure 25. Flowchart of a Cold Ironing implementation process. Reprinted with permission fromref. [118]. Copyright © 2018 Elsevier Ltd. All rights reserved.
Infrastructures 2021, 6, x FOR PEER REVIEW 34 of 40
Figure 25. Flowchart of a Cold Ironing implementation process. Reprinted with permission from
ref. [118]. Copyright © 2018 Elsevier Ltd. All rights reserved.
As already seen before, when moving inside port waters ships have to perform spe-
cific maneuvers, often requiring frequent changes in engine power. Ship emissions in
ports are therefore also affected by the type of maneuvers (which might request more or
less time and therefore more or less fuel and emissions), by engine use and fuel consump-
tion, and also by the efficiency of tug assistance: ships in ports sometimes require the as-
sistance of tugboats pulling them around to facilitate maneuvers, and these too give their
contribution to pollutant emissions. These performances are also influenced by human
factors, because ship maneuvers are conducted by ship’s crew and port pilots [119]. The
introduction of Autonomous Vessels [120] could lead to multiple benefits as it can opti-
mize maneuvering times, allowing furthermore to eliminate all the onboard facilities built
for the crew, and leading to a reduction in ship weights, wind loads, consumed energy,
and GHG emissions [121]. Ports of course will require technological upgrades, mainly for
communication systems [122]. Figure 26 below schematizes an example of a communica-
tion system between an autonomous ship and other maritime entities, including the port
infrastructure.
Figure 26. Communication system between autonomous ships and other maritime entities, includ-
ing the port infrastructure. Reprinted from ref. [122].
7. Discussion
Maritime transport and ports have characterized the history of mankind since ancient
times, certainly for at least a few thousand years now. However, it is in the last decades,
specifically in the last century and in particular from its second half, that its environmental
impact has reached worrying levels for climate and sustainability and the related risks.
This is occurring mainly due to a rapid and massive increase in the world population,
which is corresponding to an equally significant increase in the demand for the transport
of goods and people; another correlated reason is to be found in the use of highly polluting
fossil fuels, both for inland port activities and for the propulsion of ships. Speaking of
ports, it has been seen in this paper how emissions are related to many different features
such as port geographical location, ship engines, inland machinery and activities, fuel
types and energy consumption, road traffic related to the port, and so on. All these pa-
rameters can be translated into mathematical models and then into computer algorithms,
making it possible to predict the impact on emissions after intervening on such parame-
ters. As seen in the previous chapters, a properly modelled port layout, along with fitting
algorithms, can help Authorities and private companies on deciding which technical so-
lution to implement in order to forecast and reduce emissions, thus improving their envi-
Figure 26. Communication system between autonomous ships and other maritime entities, includingthe port infrastructure. Reprinted from ref. [122].
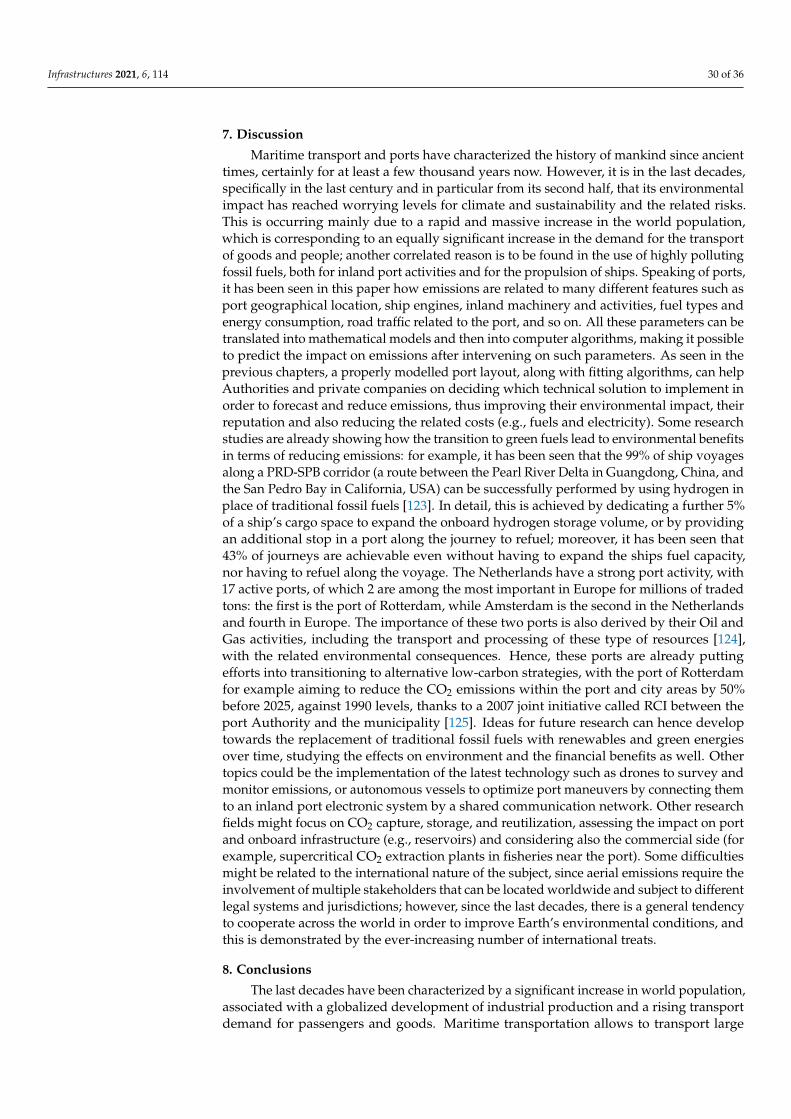
Infrastructures 2021, 6, 114 30 of 36
7. Discussion
Maritime transport and ports have characterized the history of mankind since ancienttimes, certainly for at least a few thousand years now. However, it is in the last decades,specifically in the last century and in particular from its second half, that its environmentalimpact has reached worrying levels for climate and sustainability and the related risks.This is occurring mainly due to a rapid and massive increase in the world population,which is corresponding to an equally significant increase in the demand for the transportof goods and people; another correlated reason is to be found in the use of highly pollutingfossil fuels, both for inland port activities and for the propulsion of ships. Speaking of ports,it has been seen in this paper how emissions are related to many different features such asport geographical location, ship engines, inland machinery and activities, fuel types andenergy consumption, road traffic related to the port, and so on. All these parameters can betranslated into mathematical models and then into computer algorithms, making it possibleto predict the impact on emissions after intervening on such parameters. As seen in theprevious chapters, a properly modelled port layout, along with fitting algorithms, can helpAuthorities and private companies on deciding which technical solution to implement inorder to forecast and reduce emissions, thus improving their environmental impact, theirreputation and also reducing the related costs (e.g., fuels and electricity). Some researchstudies are already showing how the transition to green fuels lead to environmental benefitsin terms of reducing emissions: for example, it has been seen that the 99% of ship voyagesalong a PRD-SPB corridor (a route between the Pearl River Delta in Guangdong, China, andthe San Pedro Bay in California, USA) can be successfully performed by using hydrogen inplace of traditional fossil fuels [123]. In detail, this is achieved by dedicating a further 5%of a ship’s cargo space to expand the onboard hydrogen storage volume, or by providingan additional stop in a port along the journey to refuel; moreover, it has been seen that43% of journeys are achievable even without having to expand the ships fuel capacity,nor having to refuel along the voyage. The Netherlands have a strong port activity, with17 active ports, of which 2 are among the most important in Europe for millions of tradedtons: the first is the port of Rotterdam, while Amsterdam is the second in the Netherlandsand fourth in Europe. The importance of these two ports is also derived by their Oil andGas activities, including the transport and processing of these type of resources [124],with the related environmental consequences. Hence, these ports are already puttingefforts into transitioning to alternative low-carbon strategies, with the port of Rotterdamfor example aiming to reduce the CO2 emissions within the port and city areas by 50%before 2025, against 1990 levels, thanks to a 2007 joint initiative called RCI between theport Authority and the municipality [125]. Ideas for future research can hence developtowards the replacement of traditional fossil fuels with renewables and green energiesover time, studying the effects on environment and the financial benefits as well. Othertopics could be the implementation of the latest technology such as drones to survey andmonitor emissions, or autonomous vessels to optimize port maneuvers by connecting themto an inland port electronic system by a shared communication network. Other researchfields might focus on CO2 capture, storage, and reutilization, assessing the impact on portand onboard infrastructure (e.g., reservoirs) and considering also the commercial side (forexample, supercritical CO2 extraction plants in fisheries near the port). Some difficultiesmight be related to the international nature of the subject, since aerial emissions require theinvolvement of multiple stakeholders that can be located worldwide and subject to differentlegal systems and jurisdictions; however, since the last decades, there is a general tendencyto cooperate across the world in order to improve Earth’s environmental conditions, andthis is demonstrated by the ever-increasing number of international treats.
8. Conclusions
The last decades have been characterized by a significant increase in world population,associated with a globalized development of industrial production and a rising transportdemand for passengers and goods. Maritime transportation allows to transport large
Infrastructures 2021, 6, 114 31 of 36
amounts of goods across the globe with relatively low expenses, and is often used tomove heavy goods around the world such as containers or heavy ore. Its effects on theenvironment comprehend a negative impact caused by polluting emissions (CAC, GHG,other air pollutants), generated not only by ships but also from the correlated marineinfrastructure such as ports. Indeed, emissions in ports are generated by maneuveringand hoteling ships, onshore operations using energy for cranes and other devices, portvehicle traffic (internal and in/out) due to cars and trucks, facility-related systems such aslighting and HVAC, and so on. Main approaches to tackle the emission problem tend toboth mitigate the cause and adapt to the existing consequences, the first done by tryingto reduce the quantity of emissions in the atmosphere, the latter trying to minimize theconsequences of emissions and to exploit gases such as CO2 for commercial purposes.Estimating emissions in ports can be tricky due to the multitude of co-existing sources andthe presence of surrounding interacting entities such as highways and cities; technologycomes however in hand, allowing to detect and monitor emission levels with sensors andrecently even drones, along with sophisticated computer algorithms. Technical devicessuch as scrubbers allow the treatment of emissions, whereas Cold Ironing and smartnetworks allow an optimized use of energy. From the governance side, many efforts havebeen put in the last decades from several worldwide Countries, implementing internationaltreaties and regulations, setting up threshold levels and good practice indications. Futureresearch can be directed towards this multitude of aspects, especially in our modern eracharacterized by an ever-growing environmental awareness.
Author Contributions: All authors equally contributed to the present research and to the preparationof the paper. All authors have read and agreed to the published version of the manuscript.
Funding: This research received no external funding.
Data Availability Statement: All data in this study are available in the documents referencedin bibliography.
Acknowledgments: There are no acknowledgments.
Conflicts of Interest: Authors declare no conflict of interest.
References1. Sardain, A.; Sardain, E.; Leung, B. Global Forecasts of Shipping Traffic and Biological Invasions to 2050. Nat. Sustain. 2019, 2,
274–282. [CrossRef]2. Pape, M. Decarbonising Maritime Transport: The EU Perspective. Eur. Parliam. Eur. Parliam. Res. Serv. (EPRS) 2020.
Available online: https://www.europarl.europa.eu/thinktank/en/document.html?reference=EPRS_BRI(2020)659296 (accessedon 4 August 2021).
3. Walsh, C.; Mander, S.; Larkin, A. Charting a Low Carbon Future for Shipping: A UK Perspective. Mar. Policy 2017, 82, 32–40.[CrossRef]
4. Halim, R.A.; Kirstein, L.; Merk, O.; Martinez, L.M. Decarbonization Pathways for International Maritime Transport: A Model-Based Policy Impact Assessment. Sustainability 2018, 10, 2243. [CrossRef]
5. Marino, L.; Pratelli, A.; Benenati, S.; Farina, A. A New Platform for the Management of Physical and Documental Flows at Italianand French Ligurian Ports. In Proceedings of the 2019 IEEE International Conference on Environment and Electrical Engineeringand 2019 IEEE Industrial and Commercial Power Systems Europe (EEEIC/I&CPS Europe), Genova, Italy, 11–14 June 2019; pp.1–7. [CrossRef]
6. Walker, T.; Adebambo, O.; Feijoo, M.; Elhaimer, E.; Hossain, T.; Edwards, S.; Morrison, C.; Romo, J.; Sharma, N.; Taylor, S.; et al.Environmental Effects of Marine Transportation. In World Seas: An Environmental Evaluation, 2nd ed.; Ecological Issues andEnvironmental Impacts; Elsevier Ltd.: Amsterdam, The Netherlands, 2019; Volume III, Chapter 27; pp. 505–530. [CrossRef]
7. Chen, J.; Fei, Y.; Wan, Z. The relationship between the development of global maritime fleets and GHG emissions from shipping.J. Environ. Manag. 2019, 242, 31–39. [CrossRef]
8. ESPO. Environmental Code of Practice; European Sea Ports Organization: Bruxelles, Belgium, 2004. Available online: http://www.espo.be/publications/espo-environmental-code-of-practice (accessed on 6 August 2021).
9. Covic Bajramajic, M.; Jelic-Mrcelic, G.; Belamaric, G.; Peric, T. Environmental Protection and Sustainable Ports. In Proceedings ofthe ICTS–19th International Conference on Transport Science, Portoroz, Slovenia, 17–18 September 2020.

Infrastructures 2021, 6, 114 32 of 36
10. ESPO. Green Guide. In Toward Excellence in Port Environmental Management and Sustainability; ESPO—European Sea PortsOrganization: Espo, Finland, 2012; p. 7. Available online: https://www.espo.be/publications/espo-green-guide-towards-excellence-in-port-enviro (accessed on 6 August 2021).
11. ESPO. Environmental Report 2020 Eco Ports in Sight; ESPO: Espo, Finland, 2020.12. Joung, T.H.; Kang, S.G.; Lee, J.K.; Ahn, J. The IMO Initial Strategy for Reducing Greenhouse Gas (GHG) Emissions, and Its
Follow-Up Actions towards 2050. J. Int. Marit. Saf. Environ. Aff. Shipp. 2020, 4, 1–7. [CrossRef]13. International Maritime Organization. Fourth IMO Greenhouse Gas Study 2020; International Maritime Organization: London, UK,
2020; Published in 2021 by the International Maritime Organization, 4 Albert Embankment, London (UK) SE1 7SR; Availableonline: www.imo.org (accessed on 6 August 2021).
14. Chircop, A. The IMO Initial Strategy for the Reduction of GHGs from International Shipping; a Commentary. Int. J. Mar. Coast.Law 2020, 34, 482–512. [CrossRef]
15. Repka, S.; Erkkila-Valimaki, A.; Eiof Jonson, J.; Posch, M.; Torronen, J.; Jalkanen, J.P. Assessing the Costs and EnvironmentalBenefits of IMO Regulations of Ship-Originated SOx and NOx Emissions in the Baltic Sea. Ambio 2021, 50, 1718–1730. [CrossRef][PubMed]
16. Nunes, R.A.O.; Alvim-Ferraz, M.C.M.; Martins, F.G.; Sousa, S.I.V. The Activity-Based Methodology to Assess Ship Emissions–AReview. Environ. Pollut. 2017, 231, 87–103. [CrossRef] [PubMed]
17. Van Fan, Y.; Perry, S.; Klemes, J.J.; Lee, C.T. A Review on Air Emissions Assessment: Transportation. J. Clean. Prod. 2018, 194,673–684. [CrossRef]
18. Zelenko, Y.; Zelenko, D.; Neduzha, L. Contemporary Principles for Solving the Problem in Noise Reduction from Railway RollingStock. IOP Conf. Ser. Mater. Sci. Eng. 2020, 985, 012015. [CrossRef]
19. Kweku Darkwah, W.; Odum, B.; Addae, M.; Koomson, D.; Kwakye Danso, B.; Oti-Mensah, E.; Quachie Asenso, T.; AdormaaBuanya, B. Greenhouse Effect: Greenhouse Gases and Their Impact on Global Warming. J. Sci. Res. Rep. 2018, 1–9. [CrossRef]
20. Gan, J.; Li, L.; Xiang, Q.; Ran, B. A Prediction Method of GHG Emissions for Urban Road Transportation Planning and ItsApplications. Sustainability 2020, 12, 10251. [CrossRef]
21. AlKheder, S. Promoting Public Transport as a Strategy to Reduce GHG Emissions from Private Vehicles in Kuwait. Environ. Chall.2021, 3, 100075. [CrossRef]
22. Psaraftis, H.N.; Kontovas, C.A. Decarbonization of Maritime Transport: Is There Light at the End of the Tunnel? Sustainability2021, 13, 237. [CrossRef]
23. Liou, J.L.; Wu, P.I. Monetary Health Co-Benefits and GHG Emissions Reduction Benefits: Contribution from Private On-the-RoadTransport. Int. J. Environ. Res. Public Health 2021, 18, 5537. [CrossRef]
24. Cassia, R.; Nocioni, M.; Correa-Aragunde, N.; Lamattina, L. Climate Change and the Impact of Greenhouse Gasses: CO2 and NO,Friends and Foes of Plant Oxidative Stress. Front. Plant Sci. 2018, 9, 273. [CrossRef]
25. Fridell, E. Chapter 2-Emissions and Fuel Use in the Shipping Sector. Green Ports 2019, 19–33. [CrossRef]26. Zis, T.P.V.; Cullinane, K. The Desulphurization of Shipping: Past, Present and the Future under a Global Cap. Transp. Res. Part. D
2020, 82. [CrossRef]27. Lou, H.; Hao, Y.; Zhang, W.; Su, P.; Zhang, F.; Chen, Y.; Feng, D.; Li, Y. Emissions of Intermediate Volatility Organic Compounds
from a Ship Main Engine Burning Heavy Fuel Oil. J. Environ. Sci. 2019, 84, 197–204. [CrossRef] [PubMed]28. Zhu, H.; Wang, H.; Jing, S.; Wang, Y.; Cheng, T.; Tao, S.; Lou, S.; Qiao, L.; Li, L.; Chen, J. Characteristics and Sources of
Atmospheric Volatile Organic Compounds (VOCs) Along the Mid-Lower Yangtze River in China. Atmos. Environ. 2018, 190,232–240. [CrossRef]
29. Lin, H.; Tao, J.; Qian, Z.M.; Ruan, Z.; Xu, Y.; Hang, J.; Xu, X.; Liu, T.; Guo, Y.; Zeng, W.; et al. Shipping Pollution EmissionAssociated with Increased Cardiovascular Mortality: A Time Series Study in Guangzhou, China. Environ. Pollut. 2018, 241,862–868. [CrossRef]
30. Grennfelt, P.; Engleryd, A.; Forsius, M.; Hov, O.; Rodhe, H.; Cowling, E. Acid Rain and Air Pollution: 50 Years of Progress inEnvironmental Science and Policy. Ambio 2019, 49, 849–864. [CrossRef]
31. Lubinski, W. Military Physician; Military Institute of Medicine: Warsaw, Poland, 2017.32. Soni, V.; Singh, P.; Shree, V.; Goel, V. Effects of VOCs on Human Health. Air Pollut. Control. 2018, 119–142. [CrossRef]33. Kowalska, M.; Skrzypek, M.; Kowalski, M.; Cyrys, J. Effect of NOx and NO2 Concentration Increase in Ambient Air to Daily
Bronchitis and Asthma Exacerbation, Silesian Voivodeship in Poland. Int. J. Environ. Res. Public Health 2020, 17, 754. [CrossRef][PubMed]
34. Jonson, J.E.; Borken-Kleefeld, J.; Simpson, D.; Nyiri, A.; Posch, M.; Heyes, C. Impact of Excess NOx Emissions from Diesel Carson Air Quality, Public Health and Eutrophication in Europe. Environ. Res. Lett. 2017, 12, 094017. [CrossRef]
35. Kodavanti, U.P. Stretching the stress boundary: Linking air pollution health effects to a neurohormonal stress response. Biochim.Biophys. Acta (BBA) Gen. Sub. 2016, 1860, 2880–2890. [CrossRef] [PubMed]
36. Woo, J.K.; Moon, D.S.H.; Siu Lee Ham, J. The Impact of Environmental Policy on Ports and the Associated Economic Opportunities.Transp. Res. Part. A Policy Pract. 2018, 110, 234–242. [CrossRef]
37. Zanne, M.; Twrdy, E. The Economic Analysis of Air Pollution Mitigation Measures in Smaller Ports. RFDS 2021, 33, 145–152.[CrossRef]
38. Ksiazkiewicz, D. Clean Air Policy in European Marine Ports. Sci. Pap. Sil. Univ. Technol. 2020, 149, 371–381. [CrossRef]
Infrastructures 2021, 6, 114 33 of 36
39. Zhu, S.; Sun, J.; Liu, Y.; Lu, M.; Liu, X. The Air Quality Index Trend Forecasting based on Improved Error Correction Model andData Preprocessing for 17 Port Cities in China. Chemosphere 2020, 252. [CrossRef]
40. Gobbi, G.P.; Di Liberto, L.; Barnaba, F. Impact of Port Emissions on EU-regulated and Non-regulated Air Quality Indicators: TheCase of Civitavecchia (Italy). Sci. Total. Environ. 2020, 719. [CrossRef] [PubMed]
41. Toscano, D.; Murena, F. Atmospheric Emissions in Ports: A Review. Correlation with Data of Ship Traffic. Atmos. Environ. X 2019, 4.[CrossRef]
42. Shen, L.; Wang, Y.; Liu, K.; Yang, Z.; Shi, X.; Yang, X.; Jing, K. Synergistic Path Planning of Multi-UAVs for Air Pollution Detectionof Ships in Ports. Transp. Res. Part. E 2020, 144. [CrossRef]
43. Karakikes, I.; Hofmann, W.; Mitropoulos, M.; Savrasovs, M. Evaluation of Freight Measures by Integrating Simulation Tools: TheCase of Volos Port, Greece. Transport Telecommun. J. 2018, 19, 224–232. [CrossRef]
44. Gonzalez-Aregall, M.; Bergqvist, R. Green Port Initiatives for a More Sustainable Port-City Interaction: The Case Study ofBarcelona. Marit. Transp. Reg. Sustain. 2020, 7, 109–132. [CrossRef]
45. Merico, E.; Dinoi, A.; Contini, D. Development of an Integrated Modelling-Measurement System for Near-Real-Time Estimates ofHarbor Activity Impact to the Atmospheric Pollution in Coastal Cities. Transp. Res. Part. D 2019, 73, 108–119. [CrossRef]
46. Progiou, A.G.; Bakeas, E.; Evangelidou, E.; Kontogiorgi, G.; Lagkadinou, E.; Sebos, I. Air Pollutant Emissions from Piraeus port:External Costs and Air Quality Levels. Transp. Res. Part. D Transport Environ. 2021, 91. [CrossRef]
47. EMEP/EEA Air Pollutant Emission Inventory Guidebook 2019; EEA (European Environment Agency), Publications Office of theEuropean Union: Luxembourg, 2019.
48. Handbook on External Costs of Transport—European Commission. Directorate-General for Mobility and Transport 2019; PublicationsOffice of the European Union: Luxemburg, 2019. [CrossRef]
49. Martinez-Moya, J.; Vazquez-Paja, B.; Jimenez Maldonado, J.A. Energy Efficiency and CO2 Emissions of Port Container TerminalEquipment: Evidence from the Port of Valencia. Energy Policy 2019, 131, 312–319. [CrossRef]
50. Bordianu, A.; Samoilescu, G. Electric and Hybrid Propulsion in the Naval Industry. In Proceedings of the 2019 11th InternationalSymposyum on Advanced Topics in Electrical Engineering (ATEE), Bucharest, Romania, 28–30 March 2019. [CrossRef]
51. Elgohary, M.M.; Seediek, I.S.; Al-Baity, O. Design Consideration and Eco-Environmental Assessment for Electric Propulsion Ships:Case Study–Cruise ship. In Proceedings of the IEK 27th International Annual Conference, Mombasa, Kenya, 24–27 November 2020.
52. Sui, C.; De Vos, P.; Stapersma, D.; Visser, K.; Ding, Y. Fuel Consumption and Emissions of Ocean-Going Cargo Ship with HybridPropulsion and Different Fuels over Voyage. J. Mar. Sci. Eng. 2020, 8, 588. [CrossRef]
53. Geertsma, R.D.; Negenborn, N.N.; Visser, K.; Hopman, J.J. Design and Control of Hybrid Power and Propulsion Systems forSmart Ships: A Review of Developments. Appl. Energy 2017, 194, 30–54. [CrossRef]
54. IRENA. Navigating to a Renewable Future: Solutions for Decarbonizing Shipping; Preliminary Findings; International RenewableEnergy: Abu Dhabi, United Arab Emirates, 2019.
55. Byeong-Yong, Y. Economic Assessment of Liquefied Natural Gas (LNG) as a Marine Fuel for CO2 Carriers Compared to MarineGas Oil (MGO). Energy 2017, 121, 772–780. [CrossRef]
56. Pfoser, S.; Schauer, O.; Costa, Y. Acceptance of LNG as an Alternative Fuel: Determinants and Policy Implications. Energy Policy2018, 120, 259–267. [CrossRef]
57. Iannacone, T.; Landucci, G.; Tugnoli, A.; Salzano, E.; Cozzani, V. Sustainability of Cruise Ship Fuel Systems: Comparison amongLNG and Diesel Technologies. J. Clean. Prod. 2020, 260, 121069. [CrossRef]
58. Pavlenko, N.; Comer, B.; Zhou, Y.; Clark, N.; Rutherford, D. The Climate Implications of Using LNG as a Marine Fuel–2020 InternationalCouncil on Clean Transportation (ICCT), Working Paper 2020-02; ICCT Online Publication: Berlin, Germany, 2020.
59. United Nations Framework Convention on Climate Change (UNFCCC). Shipping, World Trade and the Reduction of CO2Emissions. International Chamber of Shipping (ICS), London EC3A 8BH (UK). 2014. Available online: https://www.sciencedirect.com/science/article/pii/S258900422030955X (accessed on 6 August 2021).
60. Viana, M.; Rizza, V.; Tobias, A.; Carr, E.; Corbett, J.; Sofiev, M.; Karanasiou, A.; Buonanno, G.; Fann, N. Estimated Health Impactsfrom Maritime Transport in the Mediterranean Region and Benefits from The Use of Cleaner Fuels. Environ. Int. 2020, 138.[CrossRef] [PubMed]
61. Mukherjee, A.; Bruijnincx, P.; Junginger, M. A Perspective on Biofuels Use and CCS for GHG Mitigation in the Marine Sector.iScience 2020, 23. [CrossRef] [PubMed]
62. Sonthalia, A.; Kumar, N. Hydroprocessed Vegetable Oil as a Fuel for Transportation Sector: A Review. J. Energy Inst. 2019, 92,1–17. [CrossRef]
63. Sunnu, A.K.; Ayetor, G.K.; Gaye, J.M. Straight Vegetable Oil Fuel Performance and Exhaust Emissions under Turbocharged andNaturally Aspirated Conditions. Energy Sources Part. A Recovery Util. Environ. Eff. 2019. [CrossRef]
64. Mat, S.C.; Idroas, M.Y.; Hamid, M.F.; Zainal, Z.A. Performance and Emissions of Straight Vegetable Oils and Its Blends as a Fuelin Diesel Engine: A Review. Renew. Sustain. Energy Rev. 2018, 82, 808–823. [CrossRef]
65. Dimitriadis, A.; Natsios, I.; Dimaratos, A.; Katsaounis, D.; Samaras, Z.; Bezergianni, S.; Lehto, K. Evaluation of a HydrotreatedVegetable Oil (HVO) and Effects on Emissions of a Passenger Car Diesel Engine. Front. Mech. Eng. 2018. [CrossRef]
66. Rimkus, A.; Zaglinskis, J.; Stravinskas, S.; Rapalis, P.; Matijosius, J.; Berezky, A. Research on the Combustion, Energy and EmissionParameters of Various Concentration Blends of Hydrotreated Vegetable Oil Biofuel and Diesel Fuel in a Compression-IgnitionEngine. Energies 2019, 12, 2978. [CrossRef]
Infrastructures 2021, 6, 114 34 of 36
67. Shi, J.; Wang, T.; Zhao, Z.; Wu, Z.; Zhang, Z. Cycle to Cycle Variatioon of a Diesel Engine Fueled with Fischer-Tropsch FuelSynthesized from Coal. Appl. Sci. 2019, 9, 2032. [CrossRef]
68. Zang, G.; Sun, P.; Elgowainy, A.A.; Bafana, A.; Wang, M. Performance and Cost Analysis of Liquid Fuel Production from H2 andCO2 based on The Fischer-Tropsch Process. J. CO2 Util. 2021, 46, 101459. [CrossRef]
69. Mohanty, S.K.; Swain, M. Chapter 3–Bioethanol Production from Corn and Wheat: Food, Fuel, and Future. Bioethanol. Prod. FoodCrop. 2019, 45–99. [CrossRef]
70. Jiao, J.; Li, J.; Bai, Y. Ethanol as a Vehicle Fuel in China: A Review from the Perspectives of Raw Material Resource, Vehicle, andInfrastructure. J. Clean. Prod. 2018, 180, 832–845. [CrossRef]
71. Paulauskiene, T.; Bucas, M.; Laukinaite, A. Alternative Fuels for Marine Applications: Biomethanol-Biodiesel-Diesel Blends. Fuel2019, 248, 161–167. [CrossRef]
72. Wang, Z.; Paulauskiene, T.; Uebe, J.; Bucas, M. Characterization of Biomethanol-Biodiesel-Diesel Blends as Alternative Fuel forMarine Applications. J. Mar. Sci. Eng. 2020, 8, 730. [CrossRef]
73. Chen, H.; He, J.; Chen, Z.; Geng, L. A Comparative Study of Combustion and Emission Characteristics of Dual-Fuel EngineFueled with Diesel/Methanol and Diesel-Polyoxymethylene Dimethyl Ether Blend/Methanol. Process. Saf. Environ. Prot. 2021,147, 714–722. [CrossRef]
74. Lin, Q.; Tay, K.L.; Yu, W.; Zong, Y.; Yang, W.; Rivellini, L.H.; Ma, M.; King Yin Lee, A. Polyoxymethylene Dimethyl Ether 3(PODE3) as an Alternative Fuel to Reduce Aerosol Pollution. J. Clean. Prod. 2021, 285, 124857. [CrossRef]
75. Oumer, A.N.; Hasan, M.M.; Baheta, A.T.; Mamat, R.; Abdullah, A.A. Bio-based Liquid Fuels as a Source of Renewable Energy:A Review. Renew. Sustain. Energy Rev. 2018, 88, 82–98. [CrossRef]
76. Kesieme, U.; Pazouki, K.; Murphy, A.; Chrysanthou, A. Biofuel as an Alternative Shipping Fuel: Technological, Environmentaland Economic Assessment. Sustain. Energy Fuels 2019. [CrossRef]
77. Maggioni, L. Bio-LNG on its way forward: Case Italy. In Proceedings of the European Biomethane Conference, Berlin, Germany,2007; Available online: https://onlinelibrary.wiley.com/doi/abs/10.1002/adma.201805173 (accessed on 6 August 2021).
78. Shanmugam, K.; Tysklind, M.; Upadhyayula, V.K.K. Use of Liquefied Biomethane (LBM) as a Vehicle Fuel for Road FreightTransportation: A Case Study Evaluating Environmental Performance of Using LBM for Operation of Tractor Trailers. ProcediaCIRP 2018, 69, 517–522. [CrossRef]
79. Feng, J.; Xu, B. Electrochemical Ammonia Synthesis and Ammonia Fuel Cells. Adv. Mater. 2018, 1805173. [CrossRef]80. Yapicioglu, A.; Dincer, I. A Review on Clean Ammonia as a Potential Fuel for Power Generators. Renew. Sustain. Energy Rev. 2019,
103, 96–108. [CrossRef]81. Bicer, Y.; Dincer, I. Environmental Impact Categories of Hydrogen and Ammonia Driven Transoceanic Vehicles: A Comparative
Evaluation. Int. J. Hydrog. Energy 2018, 43, 4583–4596. [CrossRef]82. Manoharan, Y.; Hosseini, S.E.; Butler, B.; Alzhahrani, H.; Senior, B.T.F.; Ashuri, T.; Krohn, J. Hydrogen Fuel Cell Vehicles; Current
Status and Future Prospect. Appl. Sci. 2019, 9, 2296. [CrossRef]83. Tanc, B.; Arat, H.T.; Baltacioglu, E.; Aydin, K. Overview of the Next Quarter Century Vision of Hydrogen Fuel Cell Electric
Vehicles. Int. J. Hydrog. Energy 2019, 44, 10120–10128. [CrossRef]84. Awoyomi, A.; Patchigolla, K.; Anthony, E.J. CO2/SO2 Emission Reduction in CO2 Shipping Infrastructure. Int. J. Greenh. Gas.
Control. 2019, 88, 57–70. [CrossRef]85. Awoyomi, A.; Patchigolla, K.; Anthony, E.J. Process and Economic Evaluation of an Onboard Capture System for LNG-Fueled
CO2 Carriers. Ind. Eng. Chem. Res. 2020, 59, 6951–6960. [CrossRef]86. Feenstra, M.; Monteiro, J.; Van Den Akker, J.T.; Abu-Zahra, M.R.M.; Gilling, E.; Goetheer, E. Ship-based Carbon Capture Onboard
of Diesel or LNG-fueled Ships. Int. J. Greenh. Gas. Control. 2019, 85, 1–10. [CrossRef]87. Lehtoranta, K.; Aakko-Saksa, P.; Murtonen, T.; Vesala, H.; Ntziachristos, L.; Ronkko, T.; Karjalainen, P.; Kuittinen, N.; Timonen, H.
Particulate Mass and Nonvolatile Particle Number Emissions from Marine Engines Using Low-Sulfur Fuels, Natural Gas, orScrubbers. Environ. Sci. Technol. 2019, 53, 3315–3322. [CrossRef] [PubMed]
88. Comer, B.; Georgeff, E.; Osipova, L. Air Emissions and Water Pollution Discharges from Ships with Scrubbers. ICCT (InternationalCouncil on Clean Transportation) Consulting Report; ICCT Online Publication: Berlin, Germany, 2020.
89. Bolbot, V.; Theotokatos, G.; Boulougouris, E.; Psarros, G.; Hamann, R. A Novel Method for Safety Analysis of Cyber-PhysicalSystems–Application to a Ship Exhaust Gas Scrubber System. Safety 2020, 6, 26. [CrossRef]
90. Misra, A.; Venkataramani, G.; Gowrishankar, S.; Ayyasam, E.; Ramalingam, V. Renewable Energy Based Smart Microgrids–APathway to Green Port Development. Strateg. Plan. Energy Environ. 2017, 37, 17–32. [CrossRef]
91. Rezaei, M.; Mostafaeipour, A.; Qolipour, M.; Arabnia, H.R. Hydrogen Production using Wind Energy from Sea Water: A CaseStudy on Southern and Northern Coasts of Iran. Energy Environ. 2018, 29, 333–357. [CrossRef]
92. Sadek, I.; Elgohary, M. Assessment of Renewable Energy Supply for Green Ports with a Case Study. Environ. Sci. Pollut. Res. 2020,27, 5547–5558. [CrossRef] [PubMed]
93. Seddiek, I.S. Application of Renewable Energy Technologies for Eco-Friendly Sea Ports. Ships Offshore Struct. 2019, 15, 953–962.[CrossRef]
94. Fossile, D.K.; Frej, E.A.; Gouvea da Costa, S.; Pinheiro de Lima, E.; Teixeira de Almeida, A. Selecting the Most Viable RenewableEnergy Source for Brazilian Ports using the FITradeoff Method. J. Clean. Prod. 2020, 260, 121107. [CrossRef]
Infrastructures 2021, 6, 114 35 of 36
95. Hentschel, M.; Ketter, W.; Collins, J. Renewable Energy Cooperatives: Facilitating the Energy Transition at the Port of Rotterdam.Energy Policy 2018, 121, 61–69. [CrossRef]
96. Balcombe, P.; Brierley, J.; Lewis, C.; Skatvedt, L.; Speirs, J.; Hawkes, A.; Staffell, I. How to decarbonize international shipping:Options for fuels, technologies and policies. En. Con. Man. 2019, 182, 72–88. [CrossRef]
97. Banaei, M.; Boudjadar, J.; Khooban, M.H. Stochastic Model Predictive Energy Management in Hybrid Emission-Free ModernMaritime Vessels. IEEE Trans. Ind. Inform. 2021, 17, 5430–5440. [CrossRef]
98. Yuan, Y.; Zhang, T.; Shen, B.; Yan, X.; Long, T. A Fuzzy Logic Energy Management Strategy for a Photovoltaic/Diesel/BatteryHybrid Ship Based on Experimental Database. Energies 2018, 11, 2211. [CrossRef]
99. Zhang, Z.; Guan, C.; Liu, Z. Real-Time Optimization Energy Management Strategy for Fuel Cell Hybrid Ships Considering PowerSources Degradation. IEEE Access 2020, 8, 87046–87059. [CrossRef]
100. Cetin, O.; Ziya Sogut, M. A New Strategic Approach of Energy Management Onboard Ships Supported by Exergy and EconomicCriteria: A Case Study of a Cargo Ship. Ocean. Eng. 2019, 219, 108137. [CrossRef]
101. Baldi, F.; Marechal, F.; Tammi, K. Process Integration as a Tool for the Improvement of Cruise Ships Energy Efficiency. InProceedings of the Conference: Shipping in Changing Climates, London, UK, 2017. Available online: https://onlinelibrary.wiley.com/doi/abs/10.1002/er.4062 (accessed on 6 August 2021).
102. Suarez de la Fuente, S.; Roberge, D.; Greig, A.R. Safety and CO2 emissions: Implications of using organic fluids in a ship’s wasteheat recovery system. Mar. Policy 2017, 75, 191–203. [CrossRef]
103. Yigit, K.; Acarkan, B. A New Ship Energy Management Algorithm to the Smart Electricity Grid System. Int. J. Energy Res. 2018,42, 2741–2756. [CrossRef]
104. Amjad, Z.; Shah, M.A.; Maple, C.; Khattak, H.A.; Ameer, Z.; Asghar, M.N.; Mussadiq, S. Towards Energy Efficient Smart GridsUsing Bio-Inspired Scheduling Techniques. IEEE Access 2020, 8, 158947–158960. [CrossRef]
105. Geerlings, H.; Heji, R.; Van Duin, R. Opportunities for Peak Shaving the Energy Demand of Ship-to-Shore Quay Cranes atContainer Terminals. J. Shipp. Trd. 2018, 3, 3. [CrossRef]
106. Prousalidis, J.; Lyridis, D.; Dallas, S.; Soghomonian, Z.; Georgiou, V.; Spathis, D.; Kourmpelis, T.; Mitrou, P. Ship to Shore ElectricInterconnection: From Adolescence to Maturity. IEEE Electr. Ship Technol. Symp. 2017, 200–206. [CrossRef]
107. Binti Ahamad, N.B.; Guerrero, J.M.; Su, C.L.; Vasquez, J.C.; Zhaoxia, X. Microgrids Technologies in Future Seaports. In Proceedingsof the 2018 IEEE International Conference on Environment and Electrical Engineering and 2018 IEEE Industrial and CommercialPower Systems Europe (EEEIC/I&CPS Europe), Palermo, Italy, 12–15 June 2018; pp. 1–6. [CrossRef]
108. Monacelli, N. Applying Cold-Ironing Regulation in Southeast Asian Ports to Reduce Emissions. Asia-Pac. J. Ocean. Law Policy2017, 2, 296–316. [CrossRef]
109. Lind, M.; Bjorn-Andersen, N.; Watson, R.; Ward, R.; Bergmann, M.; Rylander, R.; Andersen, T.; Hagg, M.; Karlsson, M.; Zerem,A.; et al. The Potential Role of PortCDM in Cold Ironing. Sea Traffic Management (STM). Report number: Concept Note #20,Affiliation: RISE Research Institutes of Sweden, October 2018. Sea Traffic Management (STM), Published in cooperation withFathom.World; Co-financed by the European Union. Available online: https://www.researchgate.net/profile/Enrico-Mancinelli/publication/329119053_A_cogeneration_power_plant_to_integrate_cold_ironing_and_district_heating_and_cooling/links/5bfbced5458515a69e3beaf5/A-cogeneration-power-plant-to-integrate-cold-ironing-and-district-heating-and-cooling.pdf(accessed on 6 August 2021).
110. Zis, T.P.V. Green Ports. In Sustainable Shipping: A Cross-Disciplinary View Chapter 12; Psaraftis, H.N., Ed.; Springer Nature: Cham,Switzerland, 2019; pp. 407–432. ISBN 978-3-030-04329-2.
111. Esposito, F.; Mancinelli, E.; Morichetti, M.; Passerini, G.; Rizza, U. A Cogeneration Power Plant to Integrate Cold Ironing andDistrict Heating and Cooling. Int. J. Energy Prod. Manag. 2018, 3, 214–225. [CrossRef]
112. Zis, T.P.V. Prospects of Cold Ironing as an Emissions Reduction Option. Transp. Res. Part. A 2019, 119, 82–95. [CrossRef]113. Rolan, A.; Manteca, P.; Oktar, R.; Siano, P. Integration of Cold Ironing and Renewable Sources in the Barcelona Smart Port. IEEE
Trans. Ind. Appl. 2019, 5, 7198–7206. [CrossRef]114. Kotrikla, A.M.; Lilas, T.; Nikitakos, N. Abatement of Air Pollution at an Aegean Island Port Utilizing Shore Side Electricity and
Renewable Energy. Mar. Policy 2018, 75, 238–248. [CrossRef]115. Reusser, C.A.; Perez, J.R. Evaluation of the Emission Impact of Cold-Ironing Power Systems, Using a Bi-Directional Power Flow
Control Strategy. Sustainability 2021, 13, 334. [CrossRef]116. Kilic, A.; Yolcu, M.; Kilic, F.; Bilgili, L. Assessment of Ship Emissions through Cold Ironing Method for Iskendrum Port of Turkey.
Environ. Res. Technol. 2020, 3, 193–201.117. Martinez Lopez, A.; Romero-Filgueira, A.; Chica, M. Specific Environmental Charges to boost Cold Ironing use in the European
Short Sea Shipping. Transp. Res. Part. D Transport. Environ. 2021, 94, 102775. [CrossRef]118. Chen, J.; Zheng, T.; Garg, A.; Xu, L.; Li, S.; Fei, Y. Alternative Maritime Power Application as a Green Port Strategy: Barriers in
China. J. Clean. Prod. 2018, 213, 825–837. [CrossRef]119. Paulauskas, V.; Filina-Dawidowicz, L.; Paulaskas, D. The Method to Decrease Emissions from Ships in Port Areas. Sustainability
2020, 12, 4374. [CrossRef]120. Vojkovic, G.; Milenkovic, M. Autonomous Ships and Legal Authorities of the Ship Master. Case Stud. Transport. Policy 2020, 8,
333–340. [CrossRef]

Infrastructures 2021, 6, 114 36 of 36
121. Ait Allal, A.; Mansouri, K.; Youssfi, M.; Qbadou, M. toward Energy Saving and Environmental Protection by Implementationof Autonomous Ship. In Proceedings of the 19th IEEE Mediterranean Electrotechnical Conference (MELECON), Marrakech,Morocco, 2–7 May 2018; pp. 177–180. [CrossRef]
122. Rodseth, O.J.; Froystad, C.; Meland, P.H.; Bernsmed, K.; Nesheim, D.A. The Need for a Public Key Infrastructure for Automatedand Autonomous Ships. IOP Conf. Ser. Mater. Sci. Eng. 2020, 929, 012017. [CrossRef]
123. Mao, X.; Rutherford, D.; Osipova, L.; Comer, B. Refueling Assessment of a Zero-Emission Container Corridor between China and theUnited States: Could Hydrogen Replace Fossil Fuels? Working Paper; ICCT Online Publication: Berlin, Germany, 2020.
124. Wood, G.; Baker, K. Ports. In The Palgrave Handbook of Managing Fossil Fuels and Energy Transitions; Palgrave Macmillan: Cham,Switzerland, 2020; pp. 149–151.
125. Bosman, R.; Loorbach, D.; Rotmans, J.; Van Raak, R. Carbon Lock-Out: Leading the Fossil Port of Rotterdam into Transition.Sustainability 2018, 10, 2558. [CrossRef]


