Embed Size (px)
Citation preview
Materials Science and Engineering B 156 (2009) 73–78
Contents lists available at ScienceDirect
Materials Science and Engineering B
journa l homepage: www.e lsev ier .com/ locate /mseb
Polyspectral white light emission from Eu3+, Tb3+, Dy3+, Tm3+ co-doped
GdAl3(BO3)4 phosphors obtained by combustion synthesis
E.C. Fuchsa,∗,1, C. Sommerb, F.P. Wenzlb, B. Bitschnaua, A.H. Paulitschc,1, A. Mühlangera, K. Gatterera
a Institute of Physical and Theoretical Chemistry, Graz University of Technology, Rechbauerstrasse 12, 8010 Graz, Austriab Institute of Nanostructured Materials and Photonics, Joanneum Research Forschungsges.mbH, Franz-Pichler-Strasse 30, 8160 Weiz, Austriac Institute of Hygiene, Medical University of Graz, Universitätsplatz 4, 8010 Graz, Austria
a r t i c l e i n f o
Article history:
Received 11 July 2008
Received in revised form 4 November 2008
Accepted 21 November 2008
Keywords:
GAB
Gadolinium aluminium borate
White light emission
White phosphor
a b s t r a c t
Polycrystalline sub-micron-sized GdAl3(BO3)4 phosphors co-doped with Eu3+, Tb3+, Dy3+ and Tm3+ have
been prepared by combustion synthesis with urea. The phosphors have been characterised by X-ray
diffraction, scanning electron microscopy, excitation and emission spectroscopy. The chromaticity co-
ordinates and the colour temperatures of the fluorescence of the materials presented have been calculated
and analysed with Commission Internationale l’Eclairage (CIE) programs and diagrams. Depending on
the excitation wavelength, different colour temperatures of the light emitted can be achieved. Due to its
polyspectral nature, the emitted light reveals a high colour rendering index.
© 2008 Elsevier B.V. All rights reserved.
1. Introduction
Gadolinium aluminium borate (GAB), which is isostructural
and very similar in its physical properties to yttrium aluminum
borate (YAB), is a well-known host for rare-earth ions. Single crys-
tals of such materials exhibit interesting optical properties due
to their high non-linear optical coefficient, strong absorption in
the vacuum-UV, transparency in the near UV, high radiation dam-
age threshold, environment durability and chemical stability [1–6].
Trivalent rare earth ions replace gadolinium or yttrium in the crystal
structure. Recently, polycrystalline powders of Ce,Dy:GAB produced
by combustion synthesis were investigated for their white-light
emitting properties upon UV illumination [7,8]; the lumines-
cence properties of Eu:GAB/YAB, Tb:GAB/YAB and Eu,Tb:GAB/YAB
micropowders have been of interest as well [17–19]. In this paper,
we report a detailed study on the luminescence properties of
Dy,Tm:GAB, Dy,Tm, Eu:GAB, Dy,Tm,Tb:GAB, and Eu,Tb,Dy,Tm:GAB
and compare them to one of the materials presented in the litera-
ture [7,8].
∗ Corresponding author. Tel.: +31 58 2846398.
E-mail address: [email protected] (E.C. Fuchs).1 Present address: Wetsus Center of Excellence for Sustainable Water Technology,
Agora 1, 8900 CC Leeuwarden, The Netherlands.
2. Experimental
It has been shown by Yang et al. [8] that rare earth doped GAB
powders can be successfully prepared by the simple method of
combustion synthesis. Therefore, this method has been used to
prepare the materials listed in Table 1, starting from aqueous solu-
tion of the nitrates with their respective stoichiometry. An excess of
urea and the stoichiometric amount of boric acid were added under
vigorous stirring and boiling the solution until all components dis-
solved completely. Then, the beakers containing the solutions were
covered with finely woven steel mesh to avoid the spilling of prod-
uct in the course of the combustion process. The beakers were
put into an oven for 15 min at 500 ◦C. The generated precursor
powders were ground carefully in a TiC mortar and then sintered
at 1100 ◦C for 24 h. After cooling to room temperature, rare earth
doped GdAl3(BO3)4 sub-micrometer-sized powder phosphors were
obtained.
For comparison and in order to verify spectral assignments, sin-
gle crystals of Tm:YAB (1%), Tb:YAB (8%), Eu:YAB (10%) and Dy:YAB
(8%) (all mol%) were grown according to the procedure described
in Ref. [9].
The crystallinity as well as the microscopic and the macroscopic
homogeneity of the phosphors were monitored by X-ray diffraction
and by scanning electron microscopy (SEM), respectively. For SEM,
a sample of each powder was applied on a disc with a pipette were
it was fixed on double-faced adhesive tape. The investigation of the
samples was performed with a Philips XL30 SEM using the high
vacuum mode (emission electrons detection, acceleration voltage
0921-5107/$ – see front matter © 2008 Elsevier B.V. All rights reserved.
doi:10.1016/j.mseb.2008.11.024
74 E.C. Fuchs et al. / Materials Science and Engineering B 156 (2009) 73–78
Table 1Phosphors prepared with combustion synthesis, all contents are in mol%.
Short-cut notation Ce content Eu content Tb content Dy content Tm content
Ce,Dy:GAB(2,3) 2% – – 3% –
Ce,Dy:GAB(4,3) 4% – – 3% –
Ce,Dy,Tm:GAB(2,3,2) 2% – – 3% 2%
Dy,Tm:GAB(3,1) – – – 3% 1%
Dy,Tm:GAB(3,2) – – – 3% 2%
Dy,Tm:GAB(3,4) – – – 3% 4%
Eu,Dy,Tm:GAB(2,3,2) – 2% – 3% 2%
Tb,Dy,Tm:GAB(2,3,2) – – 2% 3% 2%
Eu,Tb,Dy,Tm:GAB (1,1,3,2) – 1% 1% 3% 2%
Eu,Tb,Dy,Tm:GAB (2,2,3,2) – 2% 2% 3% 2%
20 kV, operating distance 10 mm), which offered the best resolu-
tion. Pictures were taken using the software of the microscope.
The X-ray powder diffraction data were collected with a labo-
ratory powder diffractometer (Philips X-pert) from a flat sample
(Bragg–Brentano geometry) using Cu K� radiation. The measure-
ments were carried out with 15–95◦ 2�, stepwidth 0.02◦, constant
counting time of 15 s per step, and a K�2/K�1 ratio of 0.5. Rietveld
refinement was performed using FULLPROF [10,11]. The space group
is, according to YAB, hexagonal R32, the starting model for struc-
tural parameters were taken from Refs. [12,13]. A pseudo-Voigt
profile shape function was used. The background was refined with
a polynomial function. An amount of preferred orientation was cor-
rected by the March–Dollase function. For some of the samples, in
particular for those which were sintered for longer times, a small
fraction of a monoclinic modification was observable [14]. How-
ever, in the case of the most prominent phosphor presented in this
work, Eu,Tb,Dy,Tm:GAB(2,3,2,2), this amount is negligible, and the
crystallographic data for this phosphor is given in Table 2. The emis-
sion spectra were recorded with a Spectrofluorometer (Shimadzu
RF5301-PC with a Xe light source and an R3788 photomultiplier),
which was also used to record the excitation spectra; or alterna-
tively with an Omega-10 spectrometer (Bruins instruments) which
has been modified to record emission spectra using a Hönle Blue-
point 4 UV source (internal BP4 320–390 nm UV filter) with an
additional Schott UG 1 UV filter having a maximum transparency
at 390 nm, which is referred to as “390 nm excitation” hereafter.
In order to compare emission intensities, 150 mg of each phosphor
were applied as layers with constant diameter inside a horizontally
mounted quartz cuvette on top of the UG 1 UV filter which was
placed 2 cm above the end of the excitation light guide and cooled
by external ventilation. The emission was fed through a light guide
(Lumatec, 5 mm diameter), which was mounted 1 cm above the
phosphor layer on top of the cuvette, and recorded in the range from
400 to 700 nm with a slit width of 1.5 mm at the spectrometer. Each
spectrum was cumulated 50 times to increase the signal-to-noise
ratio.
Table 2Crystallographic data of Eu,Tb,Dy,Tm:GAB (2,2,3,2).
Atom (position) Lattice parameters (Å)
a 9.314(1) c 7.263(2)
x/a y/b z/c
Gd, Eu, Tb, Dy, Tm (3a) 0 0 0
Al (9d) 0.547(3) 0 0
B(1) (3b) 0 0 0.5
B(2) (9e) 0.43(1) 0 0.5
O(1) (9e) 0.850(8) 0 0.5
O(2) (9e) 0.589(7) 0 0.5
O(3) (18f) 0.449(3) 0.148(10) 0.515(3)
Occupation factor: Gd 0.91, Eu 0.02, Tb 0.02, Dy 0.03 and Tm 0.02.
The absorption spectra of the crystals were recorded with the
Omega-10 spectrometer above mentioned in absorption mode with
0.5 mm slit width and 400 cummulations.
The colour rendering index (Ra), the colour temperatures and
the chromaticity co-ordinates were calculated according to the
CIE Technical Report CIE 13.3-1995 with the software that comes
with the report. For the colour rendering index, the chromatic-
ity co-ordinates of 8 specified test colours were measured in the
CIE1978u‘v’ chromaticity plane under illumination by the emission
of the phosphors, and then compared with the chromaticity co-
ordinates of the same colours under daylight illumination, if their
colour temperature was above 5000 K, or with a black body radiator
if their colour temperature was below that. After inverting and nor-
malising these differences, eight separate colour rendering indices
(Ri) were obtained. A value of 100 means that there is no change in
colour rendering, whereas a value of 0 stands for the total inability
of the light source to render the specified colour. The general colour
rendering index (Ra) was obtained as the average of the 8 Ri values
[15,16].
3. Results and discussion
When comparing the emission properties of the phosphors
listed in Table 1, Ce,Dy:GAB(4,3) showed significantly higher total
emission than Ce,Dy:GAB(2,3); the lowest emission was seen
from the Ce,Dy,Tm:GAB(2,3,2) phosphor which is possibly due to
quenching by cross-relaxation between Ce3+ and Tm3+. In the case
of Eu,Tb,Dy,Tm:GAB, the increase of the Eu3+ and Tb3+ concentra-
tion from 1 to 2% lead to an increase of their emission while the Tm3+
and Dy3+ emissions were slightly reduced, resulting in an net emis-
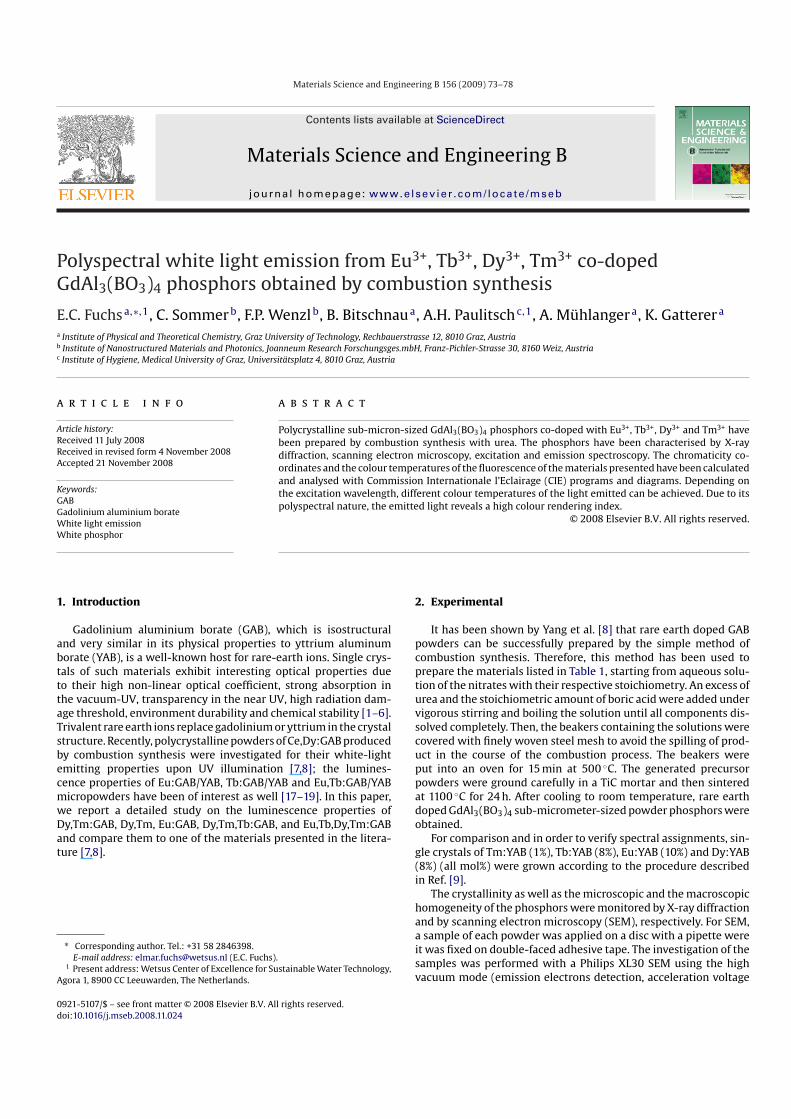
Fig. 1. Observed, calculated and difference profiles for the Eu,Tb,Dy,Tm:GAB(2,2,3,2)
compound (Rietveld refinement).
E.C. Fuchs et al. / Materials Science and Engineering B 156 (2009) 73–78 75
sion increase, however. Therefore, the Eu,Tb,Dy,Tm:GAB(2,2,3,2)
phosphor was chosen to be investigated more thoroughly in this
work using Rietveld refinement, SEM, and wavelength-depended
excitation spectra.
The Rietveld refinement shown for the sample Eu,Tb,Dy,
Tm:GAB(2,3,2,2) resulted in a reasonable agreement between mea-
sured and calculated patterns in hexagonal space group R32 (Fig. 1).
Positional parameters and isotropic thermal parameters for the
atoms were allowed to vary while the occupancy parameters for
the atoms were held constant during refinement. No crystal distor-
tion – within limits of errors – was observed compared to GAB (see
Table 2). A constraint refinement was chosen because of the pre-
dominant scattering of Gd and the other rare earths over the lighter
atoms. Lattice parameters show an increase of about 1% compared
to GAB.
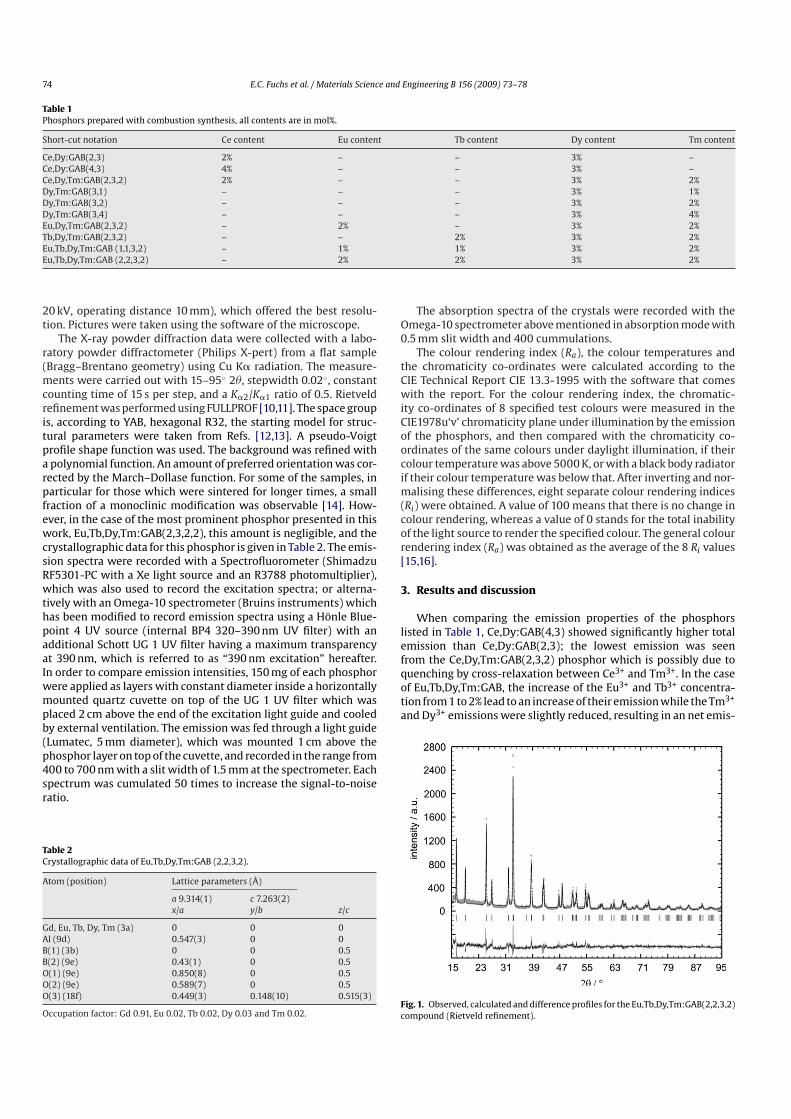
Fig. 2 shows SEM images of the Eu,Tb,Dy,Tm:GAB phosphor
as a representative example. The powder consisted of (sub)-
micrometer-sized particles (see Fig. 2b) that agglomerate to larger
lumps of material (see Fig. 2a). The average particle size was
between 0.5 and 2 �m, the average cluster size about 100 �m. The
morphology of the phosphor is typical for this type of synthesis
[7,8].
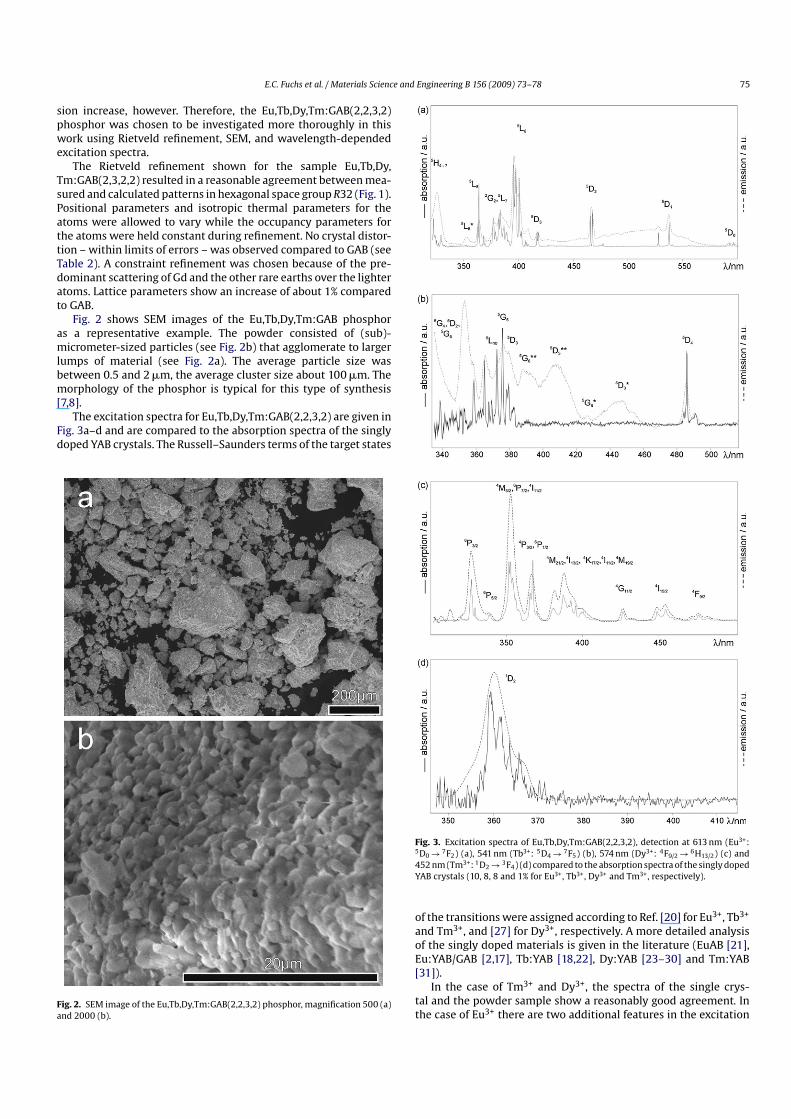
The excitation spectra for Eu,Tb,Dy,Tm:GAB(2,2,3,2) are given in
Fig. 3a–d and are compared to the absorption spectra of the singly
doped YAB crystals. The Russell–Saunders terms of the target states
Fig. 2. SEM image of the Eu,Tb,Dy,Tm:GAB(2,2,3,2) phosphor, magnification 500 (a)
and 2000 (b).
Fig. 3. Excitation spectra of Eu,Tb,Dy,Tm:GAB(2,2,3,2), detection at 613 nm (Eu3+:5D0 → 7F2) (a), 541 nm (Tb3+: 5D4 → 7F5) (b), 574 nm (Dy3+: 4F9/2 → 6H13/2) (c) and
452 nm (Tm3+: 1D2 → 3F4) (d) compared to the absorption spectra of the singly doped
YAB crystals (10, 8, 8 and 1% for Eu3+, Tb3+, Dy3+ and Tm3+, respectively).
of the transitions were assigned according to Ref. [20] for Eu3+, Tb3+
and Tm3+, and [27] for Dy3+, respectively. A more detailed analysis
of the singly doped materials is given in the literature (EuAB [21],
Eu:YAB/GAB [2,17], Tb:YAB [18,22], Dy:YAB [23–30] and Tm:YAB
[31]).
In the case of Tm3+ and Dy3+, the spectra of the single crys-
tal and the powder sample show a reasonably good agreement. In
the case of Eu3+ there are two additional features in the excitation
76 E.C. Fuchs et al. / Materials Science and Engineering B 156 (2009) 73–78
spectra of the powder: one broad band from 450 to 550 nm, and a
narrow one around 350 nm. The broad feature resembles a d-d tran-
sition and is probably due to an energy transfer from Fe3+ impurities
introduced by the steel mesh in course of the preparation. Similar
broad features were reported in Fe3+ and Eu3+ co-doped ceramic
materials [32]. The additional narrow band, however, has the typ-
ical half width of a rare-earth transition. More additional narrow
bands can be seen in the excitation spectra of the Tb3+ doped pow-
der sample (Fig. 3b). The position of these bands in the Eu3+ and
Tb3+ doped powder samples corroborates the following interpre-
tation. Low-lying excited states of Eu3+ and Tb3+ are populated
by emissions from the 5D0 and 4D4 states, respectively. In con-
trast to the bulk material, where the lifetimes of these low-lying
excited states is extremely short because of efficient radiationless
de-excitation pathways, their lifetimes are considerably longer in
the nano-structured powder materials, because the non-radiative
relaxation rates are modified in the case of small particles [33]. The
prolonged lifetimes allow for excited state absorption (ESA) from
the 7F2 level (ca. 1000 cm−1 above the ground state) in the case of
Eu3+, and from the 7F5 and 7F4 levels (ca. 2200 and 3400 cm−1 above
the ground state) in the case of Tb3+, respectively. In Fig. 3 these ESA
are identified by asterisks and the target states of the transitions are
indicated.
As can be seen, the four excitation spectra show a considerable
overlap between 350 and 370 nm. Therefore, by broad band exci-
tation in this region, all four ions can be excited simultaneously,
resulting in a multi-band emission which produces a white colour.
White light has already been obtained with similar materi-
als like Ce,Dy:GAB [7,8]. Exchanging Ce3+ with Tm3+ increases the
colour rendering of the emitted light, and a further addition of Tb3+
results in a greenish white, whereas an addition of Eu3+ leads to
a phosphor with a reddish white emission. When both Tb3+ and
Eu3+ are added, a polychromatic white phosphor can be obtained,
whose chromaticity co-ordinates are closest to the white point
whilst intensity and colour rendering index are highest (next to
Eu,Dy,Tm:GAB(2,3,2)) when compared to the other phosphors pre-
sented. The emission spectra of the phosphors described above are
given in Fig. 4, where the Russell–Saunders terms of the emission
bands were assigned according to Ref. [8] for Ce3+, Ref. [17] for Eu3+,
Ref. [18] for Tb3+, Refs. [8,27] for Dy3+ and Ref. [20] for Tm3+, respec-
tively. The CIE1931 xy chromaticity co-ordinates of the phosphors
under 390 nm excitation are depicted in Fig. 5, and a comparison of
their relative emission intensity and their colour rendering index is
given in Fig. 6.
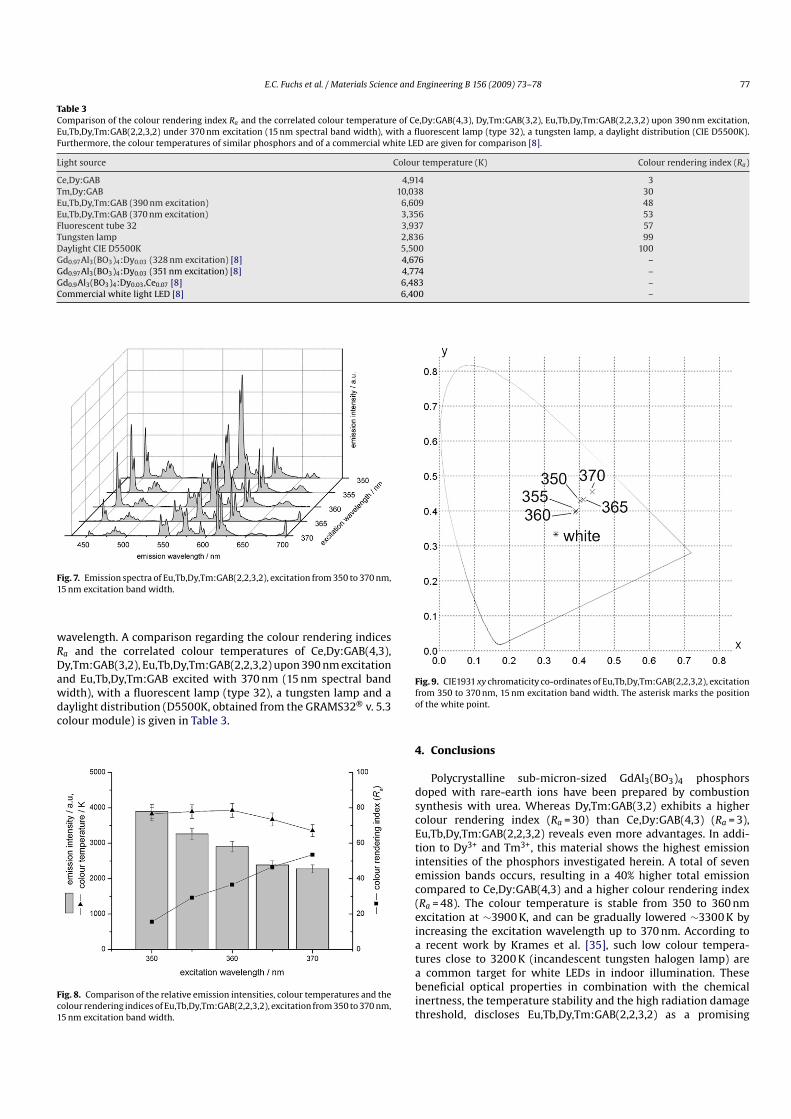
A series of emission spectra with excitation from 350 to 370 nm
is given in Fig. 7. In order to simulate a technical application like
Fig. 4. Emission spectra of Ce,Dy:GAB(4,2) (a), Dy,Tm:GAB(3,2) (b),
Eu,Dy,Tm:GAB(2,3,2) (c), Tb,Dy,Tm:GAB(2,3,2) (d) and Eu,Tb,Dy,Tm:GAB(2,2,3,2)
(e) upon 390 nm excitation. For this figure, the spectra were smoothed using the
method of Savitzky and Golay [34] (width 4.1 nm, second order polynomial).
Fig. 5. CIE1931 xy chromaticity co-ordinates of Ce,Dy:GAB(4,3) (a), Dy,Tm:GAB(3,2)
(b), Eu,Dy,Tm,GAB(2,3,2) (c), Tb,Dy,Tm:GAB(2,3,2) (d) and Eu,Tb,Dy,Tm:GAB(2,2,3,2)
(e) upon 390 nm excitation (all marked with an ×) as well as Gd0.97Al3(BO3)4:Dy0.03
(328 nm excitation) (1), Gd0.97Al3(BO3)4:Dy0.03 (351 nm excitation) (2),
Gd0.9Al3(BO3)4:Dy0.03,Ce0.07 (328 nm excitation) (3) and a commercial white
LED (4) (all marked with a +): (1)–(4) are taken from Ref. [8]. The asterisk marks the
position of the white point.
down-conversion for UV LEDs, the excitation was relatively broad
(15 nm spectral band width).
A comparison of the colour temperature, the relative emission
intensities and the colour rendering indices of these spectra is given
in Fig. 8. It should be noted here that the spectra with 350 and
355 nm excitation were cut off before at 670 and 680 nm, respec-
tively, because of the second order peak of the spectrometer grating.
Therefore, the Eu3+ emission at 700 nm (5D0→ 7F4) is not included
in these spectra. Hence, the presented values for Ra and the inten-
sity might be slightly too low and the colour temperature slightly
too high, however, this lies presumably within an estimated error
of 5%.
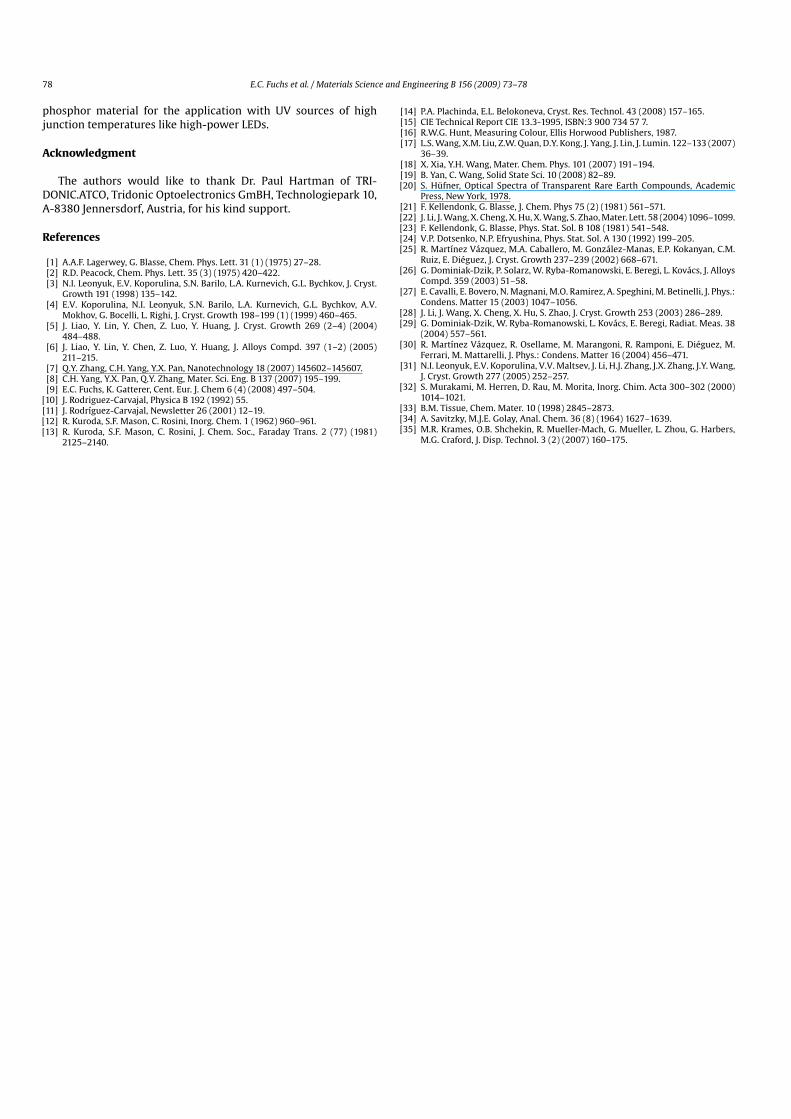
Fig. 9 shows the CIE1931 xy chromaticity co-ordinates of the
emission of Eu,Tb,Dy,Tm:GAB(2,2,3,2) as a function of the excitation
Fig. 6. Comparison of the emission intensities and the colour rendering
indices of Ce,Dy:GAB(4,3) (a) Dy,Tm:GAB(3,2) (b), Eu,Dy,Tm:GAB(2,3,2) (c),
Tb,Dy,Tm:GAB(2,3,2) (d) and Eu,Tb,Dy,Tm:GAB(2,2,3,2) (e) upon 390 nm excitation.
E.C. Fuchs et al. / Materials Science and Engineering B 156 (2009) 73–78 77
Table 3Comparison of the colour rendering index Ra and the correlated colour temperature of Ce,Dy:GAB(4,3), Dy,Tm:GAB(3,2), Eu,Tb,Dy,Tm:GAB(2,2,3,2) upon 390 nm excitation,
Eu,Tb,Dy,Tm:GAB(2,2,3,2) under 370 nm excitation (15 nm spectral band width), with a fluorescent lamp (type 32), a tungsten lamp, a daylight distribution (CIE D5500K).
Furthermore, the colour temperatures of similar phosphors and of a commercial white LED are given for comparison [8].
Light source Colour temperature (K) Colour rendering index (Ra)
Ce,Dy:GAB 4,914 3
Tm,Dy:GAB 10,038 30
Eu,Tb,Dy,Tm:GAB (390 nm excitation) 6,609 48
Eu,Tb,Dy,Tm:GAB (370 nm excitation) 3,356 53
Fluorescent tube 32 3,937 57
Tungsten lamp 2,836 99
Daylight CIE D5500K 5,500 100
Gd0.97Al3(BO3)4:Dy0.03 (328 nm excitation) [8] 4,676 –
Gd0.97Al3(BO3)4:Dy0.03 (351 nm excitation) [8] 4,774 –
Gd0.9Al3(BO3)4:Dy0.03,Ce0.07 [8] 6,483 –
Commercial white light LED [8] 6,400 –
Fig. 7. Emission spectra of Eu,Tb,Dy,Tm:GAB(2,2,3,2), excitation from 350 to 370 nm,
15 nm excitation band width.
wavelength. A comparison regarding the colour rendering indices
Ra and the correlated colour temperatures of Ce,Dy:GAB(4,3),
Dy,Tm:GAB(3,2), Eu,Tb,Dy,Tm:GAB(2,2,3,2) upon 390 nm excitation
and Eu,Tb,Dy,Tm:GAB excited with 370 nm (15 nm spectral band
width), with a fluorescent lamp (type 32), a tungsten lamp and a
daylight distribution (D5500K, obtained from the GRAMS32® v. 5.3
colour module) is given in Table 3.
Fig. 8. Comparison of the relative emission intensities, colour temperatures and the
colour rendering indices of Eu,Tb,Dy,Tm:GAB(2,2,3,2), excitation from 350 to 370 nm,
15 nm excitation band width.
Fig. 9. CIE1931 xy chromaticity co-ordinates of Eu,Tb,Dy,Tm:GAB(2,2,3,2), excitation
from 350 to 370 nm, 15 nm excitation band width. The asterisk marks the position
of the white point.
4. Conclusions
Polycrystalline sub-micron-sized GdAl3(BO3)4 phosphors
doped with rare-earth ions have been prepared by combustion
synthesis with urea. Whereas Dy,Tm:GAB(3,2) exhibits a higher
colour rendering index (Ra = 30) than Ce,Dy:GAB(4,3) (Ra = 3),
Eu,Tb,Dy,Tm:GAB(2,2,3,2) reveals even more advantages. In addi-
tion to Dy3+ and Tm3+, this material shows the highest emission
intensities of the phosphors investigated herein. A total of seven
emission bands occurs, resulting in a 40% higher total emission
compared to Ce,Dy:GAB(4,3) and a higher colour rendering index
(Ra = 48). The colour temperature is stable from 350 to 360 nm
excitation at ∼3900 K, and can be gradually lowered ∼3300 K by
increasing the excitation wavelength up to 370 nm. According to
a recent work by Krames et al. [35], such low colour tempera-
tures close to 3200 K (incandescent tungsten halogen lamp) are
a common target for white LEDs in indoor illumination. These
beneficial optical properties in combination with the chemical
inertness, the temperature stability and the high radiation damage
threshold, discloses Eu,Tb,Dy,Tm:GAB(2,2,3,2) as a promising
78 E.C. Fuchs et al. / Materials Science and Engineering B 156 (2009) 73–78
phosphor material for the application with UV sources of high
junction temperatures like high-power LEDs.
Acknowledgment
The authors would like to thank Dr. Paul Hartman of TRI-
DONIC.ATCO, Tridonic Optoelectronics GmBH, Technologiepark 10,
A-8380 Jennersdorf, Austria, for his kind support.
References
[1] A.A.F. Lagerwey, G. Blasse, Chem. Phys. Lett. 31 (1) (1975) 27–28.[2] R.D. Peacock, Chem. Phys. Lett. 35 (3) (1975) 420–422.[3] N.I. Leonyuk, E.V. Koporulina, S.N. Barilo, L.A. Kurnevich, G.L. Bychkov, J. Cryst.
Growth 191 (1998) 135–142.[4] E.V. Koporulina, N.I. Leonyuk, S.N. Barilo, L.A. Kurnevich, G.L. Bychkov, A.V.
Mokhov, G. Bocelli, L. Righi, J. Cryst. Growth 198–199 (1) (1999) 460–465.[5] J. Liao, Y. Lin, Y. Chen, Z. Luo, Y. Huang, J. Cryst. Growth 269 (2–4) (2004)
484–488.[6] J. Liao, Y. Lin, Y. Chen, Z. Luo, Y. Huang, J. Alloys Compd. 397 (1–2) (2005)
211–215.[7] Q.Y. Zhang, C.H. Yang, Y.X. Pan, Nanotechnology 18 (2007) 145602–145607.[8] C.H. Yang, Y.X. Pan, Q.Y. Zhang, Mater. Sci. Eng. B 137 (2007) 195–199.[9] E.C. Fuchs, K. Gatterer, Cent. Eur. J. Chem 6 (4) (2008) 497–504.
[10] J. Rodriguez-Carvajal, Physica B 192 (1992) 55.[11] J. Rodríguez-Carvajal, Newsletter 26 (2001) 12–19.[12] R. Kuroda, S.F. Mason, C. Rosini, Inorg. Chem. 1 (1962) 960–961.[13] R. Kuroda, S.F. Mason, C. Rosini, J. Chem. Soc., Faraday Trans. 2 (77) (1981)
2125–2140.
[14] P.A. Plachinda, E.L. Belokoneva, Cryst. Res. Technol. 43 (2008) 157–165.[15] CIE Technical Report CIE 13.3-1995, ISBN:3 900 734 57 7.[16] R.W.G. Hunt, Measuring Colour, Ellis Horwood Publishers, 1987.[17] L.S. Wang, X.M. Liu, Z.W. Quan, D.Y. Kong, J. Yang, J. Lin, J. Lumin. 122–133 (2007)
36–39.[18] X. Xia, Y.H. Wang, Mater. Chem. Phys. 101 (2007) 191–194.[19] B. Yan, C. Wang, Solid State Sci. 10 (2008) 82–89.[20] S. Hüfner, Optical Spectra of Transparent Rare Earth Compounds, Academic
Press, New York, 1978.[21] F. Kellendonk, G. Blasse, J. Chem. Phys 75 (2) (1981) 561–571.[22] J. Li, J. Wang, X. Cheng, X. Hu, X. Wang, S. Zhao, Mater. Lett. 58 (2004) 1096–1099.[23] F. Kellendonk, G. Blasse, Phys. Stat. Sol. B 108 (1981) 541–548.[24] V.P. Dotsenko, N.P. Efryushina, Phys. Stat. Sol. A 130 (1992) 199–205.[25] R. Martínez Vázquez, M.A. Caballero, M. González-Manas, E.P. Kokanyan, C.M.
Ruiz, E. Diéguez, J. Cryst. Growth 237–239 (2002) 668–671.[26] G. Dominiak-Dzik, P. Solarz, W. Ryba-Romanowski, E. Beregi, L. Kovács, J. Alloys
Compd. 359 (2003) 51–58.[27] E. Cavalli, E. Bovero, N. Magnani, M.O. Ramirez, A. Speghini, M. Betinelli, J. Phys.:
Condens. Matter 15 (2003) 1047–1056.[28] J. Li, J. Wang, X. Cheng, X. Hu, S. Zhao, J. Cryst. Growth 253 (2003) 286–289.[29] G. Dominiak-Dzik, W. Ryba-Romanowski, L. Kovács, E. Beregi, Radiat. Meas. 38
(2004) 557–561.[30] R. Martínez Vázquez, R. Osellame, M. Marangoni, R. Ramponi, E. Diéguez, M.
Ferrari, M. Mattarelli, J. Phys.: Condens. Matter 16 (2004) 456–471.[31] N.I. Leonyuk, E.V. Koporulina, V.V. Maltsev, J. Li, H.J. Zhang, J.X. Zhang, J.Y. Wang,
J. Cryst. Growth 277 (2005) 252–257.[32] S. Murakami, M. Herren, D. Rau, M. Morita, Inorg. Chim. Acta 300–302 (2000)
1014–1021.[33] B.M. Tissue, Chem. Mater. 10 (1998) 2845–2873.[34] A. Savitzky, M.J.E. Golay, Anal. Chem. 36 (8) (1964) 1627–1639.[35] M.R. Krames, O.B. Shchekin, R. Mueller-Mach, G. Mueller, L. Zhou, G. Harbers,
M.G. Craford, J. Disp. Technol. 3 (2) (2007) 160–175.


![9d Yc TYVVYSe\d d_ dXY^[ _V Q^_dXUb dY]U gXU^ dXU `eR](https://img.pdfslide.net/doc/110x75/632509df051fac18490d1089/9d-yc-tyvvysed-d-dxy-v-qdxub-dyu-gxu-dxu-er-.jpg)


