Embed Size (px)
Citation preview
ORIGINAL ARTICLE
Population biology and secondary production of theharvested clam Tivela mactroides (Born, 1778) (Bivalvia,Veneridae) in Southeastern BrazilAlexander Turra1, Marcelo Petracco1,3, Antonia Cec�ılia Z. Amaral2 & M�arcia R. Denadai2
1 Depto. de Oceanografia Biol�ogica, IO, USP, S~ao Paulo, SP, Brazil
2 Depto de Biologia Animal, IB, UNICAMP, Campinas, SP, Brazil
3 Faculdade de Oceanografia, Instituto de Geociencias, Universidade Federal do Par�a (UFPA). Rua Augusto Correa, s/n, Guam�a, Bel�em, Par�a,
Brazil. CEP 66075-110
Keywords
Population dynamic; sandy-beaches;
Veneridae.
Correspondence
Marcelo Petracco, Depto. de Oceanografia
Biol�ogica, IO, USP, Prac�a do Oceanogr�afico,
191, 05508-120 S~ao Paulo, SP, Brazil.
E-mail: [email protected]
Accepted: 3 December 2013
doi: 10.1111/maec.12137
Abstract
The population structure, growth and production of the trigonal clam Tivela
mactroides were investigated by monthly sampling between January 2003 and
October 2004 in two areas (southern and northern) of the intertidal and sub-
tidal zones of Caraguatatuba Bay, Southeastern Brazil. Intertidal sampling was
carried out in each area along eight transects perpendicular to the shoreline. In
the subtidal zone of both areas, one 50-m dredging was performed along five
sampling stations arranged on three transects perpendicular to the coast. The
intertidal abundance of T. mactroides was higher in the southern (more dissi-
pative conditions) than in the northern area. High abundances occurred in
February–March 2004 in the south and in September 2004 in the north. The
size structure showed that younger individuals dominated in the sublittoral,
indicating that recruitment occurs in this zone, followed by the migration of
these individuals to the intertidal, where they complete their life cycle. Tivela
mactroides showed continuous reproduction, with 26 cohorts detected in the
study period. The lower estimates for the growth index (/′ = 3.22), mortality
rate (Z = 2.10 year�1) and turnover rate (P/B = 1.21 year�1), and conversely
the longer life span (2.5 years) of T. mactroides in Caraguatatuba Bay (24°S)compared with Venezuelan populations (10°N) suggests a latitudinal pattern of
these life-history traits. The high production of T. mactroides in Caraguatatuba
Bay was due to continuous recruitment and rapid and continuous growth, and
demonstrates the importance of T. mactroides as a biological resource for many
marine species and for the local residents.
Introduction
Marine living resources are subject to different kinds of
impacts, from overexploitation to habitat degradation,
which are intensified in coastal areas. In particular,
sandy-beach macrofauna are faced with environmental
alterations resulting from global and local changes, and
the intensification of recreational, artisanal, and commer-
cial fisheries that has followed improved access to shore-
lines (Brown & McLachlan 2002; Schlacher et al. 2007;
Defeo et al. 2009). One example of organisms subjected
to such environmental and anthropic pressures are the
commercially important bivalves of sandy beaches
(McLachlan et al. 1996). The trigonal clam Tivela mactro-
ides is an important representative of this group and has
a wide distribution, occurring from Venezuela to Brazil
(Par�a to Santa Catarina State) and the West Indies (Rios
1994). This suspension feeder inhabits the intertidal and
subtidal zones of sandy beaches and is often the domi-
nant macrofaunal component in these environments
Marine Ecology (2014) 1–14 ª 2014 Blackwell Verlag GmbH 1
Marine Ecology. ISSN 0173-9565
(Narchi 1972; Tata & Prieto 1991; McLachlan et al. 1996;
Denadai et al. 2005; Herrera & Bone 2011). According to
McLachlan et al. (1996), T. mactroides is abundant near
river mouths, where organic matter and terrigenous parti-
cles accumulate, and is widely consumed by humans and
marine organisms, including several commercially impor-
tant fish species (Mendoza & Marcano 2000; Arrieche &
Prieto 2006). Given the ecological and socioeconomic
importance of this kind of resource, management efforts
are needed.
Several populations of T. mactroides have been studied
on Venezuelan sandy beaches, where this species is exten-
sively harvested (McLachlan et al. 1996; Mendoza & Mar-
cano 2000). These studies addressed the distribution,
reproductive aspects, population dynamics, and produc-
tion of this clam (Etchevers 1976; Prieto 1980; Tata &
Prieto 1991; Menzoza & Marcano 2000; Arrieche & Prieto
2006) and found that T. mactroides populations generally
show high density and biomass and rapid growth on
these tropical beaches.
Caraguatatuba Bay, situated in Southeastern Brazil, is
subject to impacts from oil and gas facilities, harbor
expansion, fisheries regulations, and rapid population
increases. In this region, T. mactroides is used as food
and a source of income by local fishermen, and is also an
important food for different marine species. This clam
inhabits the intertidal and subtidal zones up to a depth
of 5 m, with the smallest individuals occupying the sub-
tidal zone and the largest ones the intertidal zone (Dena-
dai et al. 2005). This kind of distribution was observed
by McLachlan et al. (1996) for other sandy-beach bivalves
of economic importance. These authors hypothesized that
such populations generally have long reproductive peri-
ods, early reproduction, high growth rates, and consider-
able fluctuations in density associated with recruitment
and/or mortality events, a characterization that should be
formally tested. Since population parameters may vary in
relation to latitude and beach morphodynamics (Defeo &
McLachlan 2005), best management practices should be
based on evaluations of the local population parameters,
to provide for the sustainable use of these marine
resources.
Studies on the population biology and secondary pro-
duction of harvested sandy-beach species are generally
lacking (McLachlan et al. 1996; Petracco et al. 2012a,
2013). This is particularly true for T. mactroides, since
studies on this species are generally restricted to beaches
on the Venezuelan coast, and there is little information
regarding the ecology of this species over its wide range
along the Brazilian coast (Denadai et al. 2005; Turra et al.
2013). This lack of information prevents macroecological
studies, thus limiting the knowledge and management of
sandy-beach resources. This study analyzed the popula-
tion biology of T. mactroides in Caraguatatuba Bay,
including spatio-temporal variations in abundance,
growth and mortality parameters, and secondary produc-
tion. Moreover, different from most existing studies, this
population of T. mactroides was evaluated considering
both it’s intertidal and subtidal distribution, which pro-
vided important information on its ecology.
Material and Methods
Study area
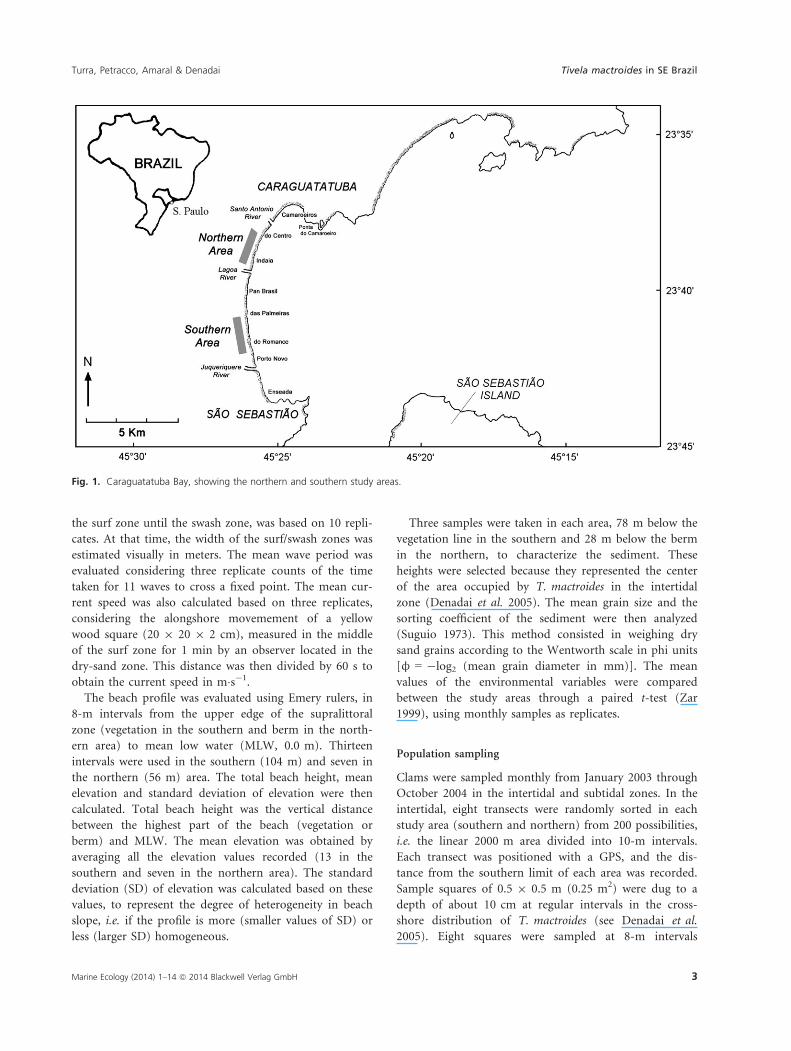
The coastline of Caraguatatuba Bay (23°37′ to 23°44′ Sand 45°24′ to 45°26′ W) is about 16 km long and
includes several sandy beaches (Enseada, Flecheiras, Porto
Novo, Romance, Palmeiras, Pan-Brasil, Indai�a, Centro
and Camaroeiros; Fig. 1). Enseada is a very wide tidal
flat. In the southern part of the bay, Flecheiras, Porto
Novo, Romance, Palmeiras and Pan-Brasil beaches have
flat and regular slopes, with well-sorted fine sand. In the
northern part, Indai�a, Centro and Camaroeiros beaches
have a steeper slope in the upper intertidal zone and a
flat tidal terrace in the lower levels, which is only appar-
ent at low tide. The sand of these beaches is also fine, but
poorly sorted.
A previous study on the spatial distribution of Tivela
mactroides in this area (Denadai et al. 2005) revealed
higher densities on Porto Novo and Centro beaches.
Therefore, two linear areas with 2 km each, homogeneous
but distinct from each other, were selected for this study
(Fig. 1). The first southern area extended from Porto
Novo to Palmeiras; and the northern area from Indai�a to
Centro beaches.
Physical characterization
The northern and southern study areas were compared
with respect to some physical characteristics. To charac-
terize these areas, mean values of wave heights, number
of wave breaks, wave periods, surf-swash zone width, and
current speed were recorded monthly using the method-
ology suggested by Perillo & Piccolo (1987). The beach
total elevation, mean elevation, and standard deviation of
elevation were also recorded. All these variables were
measured monthly at a fixed point in the center of each
study area during spring low-tide periods. These observa-
tions were made simultaneously in the two areas from
February 2003 through October 2004.
The wave height of 30 consecutive waves was mea-
sured, but only the height of the 10 highest waves was
included in the calculation of the monthly mean. The
mean number of wave breaks, calculated based on the
counts of successive wave breaks from the beginning of
2 Marine Ecology (2014) 1–14 ª 2014 Blackwell Verlag GmbH
Tivela mactroides in SE Brazil Turra, Petracco, Amaral & Denadai
the surf zone until the swash zone, was based on 10 repli-
cates. At that time, the width of the surf/swash zones was
estimated visually in meters. The mean wave period was
evaluated considering three replicate counts of the time
taken for 11 waves to cross a fixed point. The mean cur-
rent speed was also calculated based on three replicates,
considering the alongshore movemement of a yellow
wood square (20 9 20 9 2 cm), measured in the middle
of the surf zone for 1 min by an observer located in the
dry-sand zone. This distance was then divided by 60 s to
obtain the current speed in m�s�1.
The beach profile was evaluated using Emery rulers, in
8-m intervals from the upper edge of the supralittoral
zone (vegetation in the southern and berm in the north-
ern area) to mean low water (MLW, 0.0 m). Thirteen
intervals were used in the southern (104 m) and seven in
the northern (56 m) area. The total beach height, mean
elevation and standard deviation of elevation were then
calculated. Total beach height was the vertical distance
between the highest part of the beach (vegetation or
berm) and MLW. The mean elevation was obtained by
averaging all the elevation values recorded (13 in the
southern and seven in the northern area). The standard
deviation (SD) of elevation was calculated based on these
values, to represent the degree of heterogeneity in beach
slope, i.e. if the profile is more (smaller values of SD) or
less (larger SD) homogeneous.
Three samples were taken in each area, 78 m below the
vegetation line in the southern and 28 m below the berm
in the northern, to characterize the sediment. These
heights were selected because they represented the center
of the area occupied by T. mactroides in the intertidal
zone (Denadai et al. 2005). The mean grain size and the
sorting coefficient of the sediment were then analyzed
(Suguio 1973). This method consisted in weighing dry
sand grains according to the Wentworth scale in phi units
[φ = �log2 (mean grain diameter in mm)]. The mean
values of the environmental variables were compared
between the study areas through a paired t-test (Zar
1999), using monthly samples as replicates.
Population sampling
Clams were sampled monthly from January 2003 through
October 2004 in the intertidal and subtidal zones. In the
intertidal, eight transects were randomly sorted in each
study area (southern and northern) from 200 possibilities,
i.e. the linear 2000 m area divided into 10-m intervals.
Each transect was positioned with a GPS, and the dis-
tance from the southern limit of each area was recorded.
Sample squares of 0.5 9 0.5 m (0.25 m2) were dug to a
depth of about 10 cm at regular intervals in the cross-
shore distribution of T. mactroides (see Denadai et al.
2005). Eight squares were sampled at 8-m intervals
Fig. 1. Caraguatatuba Bay, showing the northern and southern study areas.
Marine Ecology (2014) 1–14 ª 2014 Blackwell Verlag GmbH 3
Turra, Petracco, Amaral & Denadai Tivela mactroides in SE Brazil
(56 m) in the southern area, and seven squares were sam-
pled at 6-m intervals (36 m) in the northern one. Thus, a
total of 64 squares (8 squares 9 8 transects) were sam-
pled monthly in the southern and 56 (7 9 8) in the
northern area, totaling 120 squares per month, or 30 m2.
In the subtidal zone, semi-quantitative sampling was
performed using three randomly sorted transects in each
study area. The sorting procedure was similar to that
used in the intertidal zone. The positions of each transect
were previously stored in a GPS at the mean low-water
line. Then, using a fishing boat, the points representing
400, 800, 1200, 1600 and 2000 m from MLW were
located perpendicular to the coast. One 50-m dredging
was performed at each distance, using a rectangular
dredge (70 9 25 cm) with 3.0 mm internal mesh size,
totaling 15 dredgings per month per area (3 tran-
sects 9 5 depths). The sediment was washed with seawa-
ter over a 3.0-mm-mesh sieve, using buckets. Clams were
collected, counted and measured for total length (in
mm). Almost all the individuals of T. mactroides, from
both intertidal and subtidal, were returned alive to the
sea after the measurements.
Abundance
The number of individuals in the intertidal was estimated
per strip transect (IST, see Defeo & Rueda 2002) and cal-
culated by linear interpolation as follows:
ISTr ¼Pni¼1
qi
nrwr
where q is the mean density (ind. m�2); n is the number of
samples from transect r (eight in the southern and seven in
the northern area); and w is the width of transect r that
corresponds to the across-shore distribution of Tivela mac-
troides as verified after pilot evaluations (56 m in the
southern and 36 in the northern area). The abundance
in the subtidal was expressed as the mean number of
individuals from each 50-m dredging. Two-way ANOVAs
were employed to test the null hypothesis that the abun-
dance of T. mactroides in the intertidal and in subtidal
zones was not influenced by areas (northern and southern)
or sampling months.
Intertidal across-shore distribution
Graphs showing the number of individuals in each sam-
pling level per month per area were constructed to illus-
trate the differences in the across-shore distribution of
Tivela mactroides between the areas, and also the varia-
tions during the study period.
Growth
Monthly length–frequency distributions obtained from all
individuals sampled (intertidal and subtidal individuals
pooled) were used to estimate growth parameters of the
Tivela mactroides population. The ELEFAN I (electronic
length frequency analysis) routine of the FISAT II package
(FAO-ICLARM Stock Assessment Tools) was employed to
perform the growth analysis. This approach assumes that
growth is described by the von Bertalanffy growth function
(VBGF) modified for seasonality (Pauly & Gaschutz 1979):
Lt ¼ L1 1� e�Kðt�t0Þ�ðCK=2pÞ sin 2pðt�WPþ0:5Þ�sin 2pðt0�WPþ0:5Þ½ �h i
where Lt is the length (mm) at age ‘t’; L∞ is the asymp-
totic length; K is the growth rate or the von Bertalanffy
curve parameter; to is the age when the length is zero,
and was estimated as 0.06 years, considering the time
between hatching of larvae and recruitment of T. mactro-
ides (Severeyn et al. 2000); C is the seasonal growth oscil-
lation constant; ts is the initial point of seasonal
oscillation in relation to t = 0 (ts = WP � 0.5), and WP
(winter-point) is the period in which the growth is mini-
mum (expressed in year fraction). The combination of
the growth parameters generates an adjustment index
termed Rn, which varies from 0 to 1 and represents the
exponential form of the ratio ESP/ASP:
Rn ¼ 10ðESP=ASPÞ=10
where ESP is the ‘explained sum of peaks’ in the curve
generated by the model, and ASP is the ‘available sum of
peaks’ in the frequency distribution. The growth parame-
ters (seeds) were varied until the best adjustment was
reached, i.e. that which results in the highest Rn value.
The growth index phi-prime (/′) was calculated to give
the growth performance (Pauly & Munro 1984):
/0 ¼ 2log10ðL1Þ þ log10K
The longevity was estimated using the length representing
the 99th percentile of the population (Sparre et al. 1989)
and also considering the maximum length as 95% of the
asymptotic length (King 1995). A modal progression
analysis was also performed, using the length–frequencydistribution according to the method of Bhattacharya
(1967). This enabled the separation of the modal compo-
nents into distinct cohorts. The length-converted catch
curve was employed to estimate the instantaneous mor-
tality rate (Z) by the decrease in numbers of the individ-
uals in the different age classes (Pauly 1983). For these
analyses, all individuals sampled (intertidal and subtidal
individuals pooled) were used.
4 Marine Ecology (2014) 1–14 ª 2014 Blackwell Verlag GmbH
Tivela mactroides in SE Brazil Turra, Petracco, Amaral & Denadai
Secondary production
Annual somatic production (P) was estimated by the
mass-specific growth rate method (Crisp 1984; Brey 2001)
from the length–frequency distribution obtained from all
intertidal pooled samples, the length–mass relationship,
and the von Bertalanffy growth function parameters. The
annual production is given by: P = ΣΣ Ni∙Mi∙Gi, where
Ni is the annual mean number of individuals in length
class i, Mi is the mean individual mass in length class i,
which is calculated from the mean length in length-class i,
and Gi is the mass-specific growth rate in length-class i,
obtained through the equation: Gi = b∙K∙[(L∞/Li) � 1],
where b is the exponent of the length–mass relationship
(AFDM(g) = 0.00003Length(mm)2.675: Turra et al. 2013), K
and L∞ are von Bertalanffy growth function parameters,
and Li is the mean length in length-class i. The P/B
ratio was calculated as the ratio between the annual
production (P) and the annual mean biomass (B). Since
the production and P/B ratios are strongly influenced by
the population size structure (Benke & Huryn 2006), and
the subtidal samples were semi-quantitative, these popula-
tion parameters were estimated only for the intertidal
zone.
Results
Physical characterization
The mean wave height, the mean wave period, and the
current speed were similar between the areas (Table 1).
The mean values of the number of wave breaks and the
width of the surf-swash zone were higher in the southern
area, which shows dissipative characteristics, than in the
northern area, which is more reflective. The current speed
did not show a clear seasonal pattern but was equivalent
between the study areas.
The mean sand-grain diameter and sorting coefficients
had opposite patterns in the two areas. The sand was
coarser and poorly sorted in the northern area, and finer
and better sorted in the southern area. The sand type var-
ied from fine to very fine in the northern area, and was
exclusively very fine in the southern. The total slope, the
mean slope, and its standard deviation were significantly
different between the study sites, always being higher in
the northern than in the southern area. These values
reflect the morphological differences between the areas.
In the northern area, the total elevation was higher, and
the mean elevation and standard deviation indicated a
steeper and discontinuous slope, in contrast to the
gentler, even slope of the southern area (Table 1).
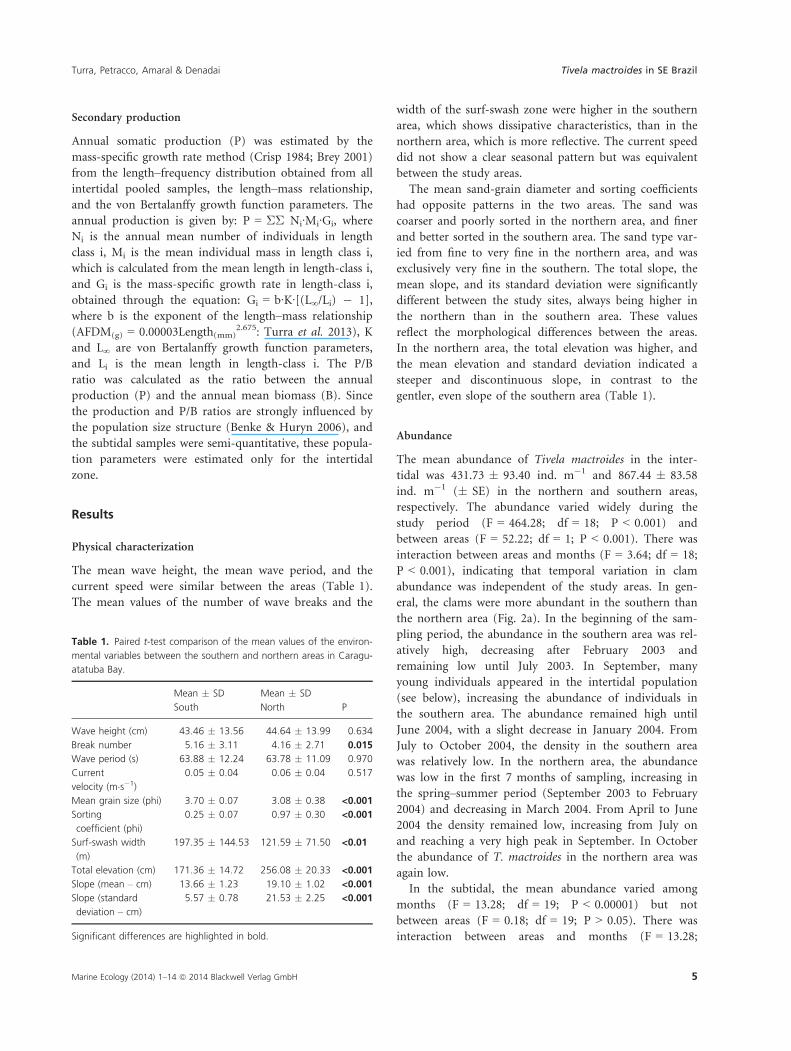
Abundance
The mean abundance of Tivela mactroides in the inter-
tidal was 431.73 � 93.40 ind. m�1 and 867.44 � 83.58
ind. m�1 (� SE) in the northern and southern areas,
respectively. The abundance varied widely during the
study period (F = 464.28; df = 18; P < 0.001) and
between areas (F = 52.22; df = 1; P < 0.001). There was
interaction between areas and months (F = 3.64; df = 18;
P < 0.001), indicating that temporal variation in clam
abundance was independent of the study areas. In gen-
eral, the clams were more abundant in the southern than
the northern area (Fig. 2a). In the beginning of the sam-
pling period, the abundance in the southern area was rel-
atively high, decreasing after February 2003 and
remaining low until July 2003. In September, many
young individuals appeared in the intertidal population
(see below), increasing the abundance of individuals in
the southern area. The abundance remained high until
June 2004, with a slight decrease in January 2004. From
July to October 2004, the density in the southern area
was relatively low. In the northern area, the abundance
was low in the first 7 months of sampling, increasing in
the spring–summer period (September 2003 to February
2004) and decreasing in March 2004. From April to June
2004 the density remained low, increasing from July on
and reaching a very high peak in September. In October
the abundance of T. mactroides in the northern area was
again low.
In the subtidal, the mean abundance varied among
months (F = 13.28; df = 19; P < 0.00001) but not
between areas (F = 0.18; df = 19; P > 0.05). There was
interaction between areas and months (F = 13.28;
Table 1. Paired t-test comparison of the mean values of the environ-
mental variables between the southern and northern areas in Caragu-
atatuba Bay.
Mean � SD
South
Mean � SD
North P
Wave height (cm) 43.46 � 13.56 44.64 � 13.99 0.634
Break number 5.16 � 3.11 4.16 � 2.71 0.015
Wave period (s) 63.88 � 12.24 63.78 � 11.09 0.970
Current
velocity (m�s�1)
0.05 � 0.04 0.06 � 0.04 0.517
Mean grain size (phi) 3.70 � 0.07 3.08 � 0.38 <0.001
Sorting
coefficient (phi)
0.25 � 0.07 0.97 � 0.30 <0.001
Surf-swash width
(m)
197.35 � 144.53 121.59 � 71.50 <0.01
Total elevation (cm) 171.36 � 14.72 256.08 � 20.33 <0.001
Slope (mean – cm) 13.66 � 1.23 19.10 � 1.02 <0.001
Slope (standard
deviation – cm)
5.57 � 0.78 21.53 � 2.25 <0.001
Significant differences are highlighted in bold.
Marine Ecology (2014) 1–14 ª 2014 Blackwell Verlag GmbH 5
Turra, Petracco, Amaral & Denadai Tivela mactroides in SE Brazil
df = 19; P < 0.001), with peaks of abundance in Decem-
ber 2003 and April 2004 in the two areas (Fig. 2b). The
high standard errors in months with high abundances
suggest a clumped distribution of T. mactroides individu-
als (Fig. 2a,b).
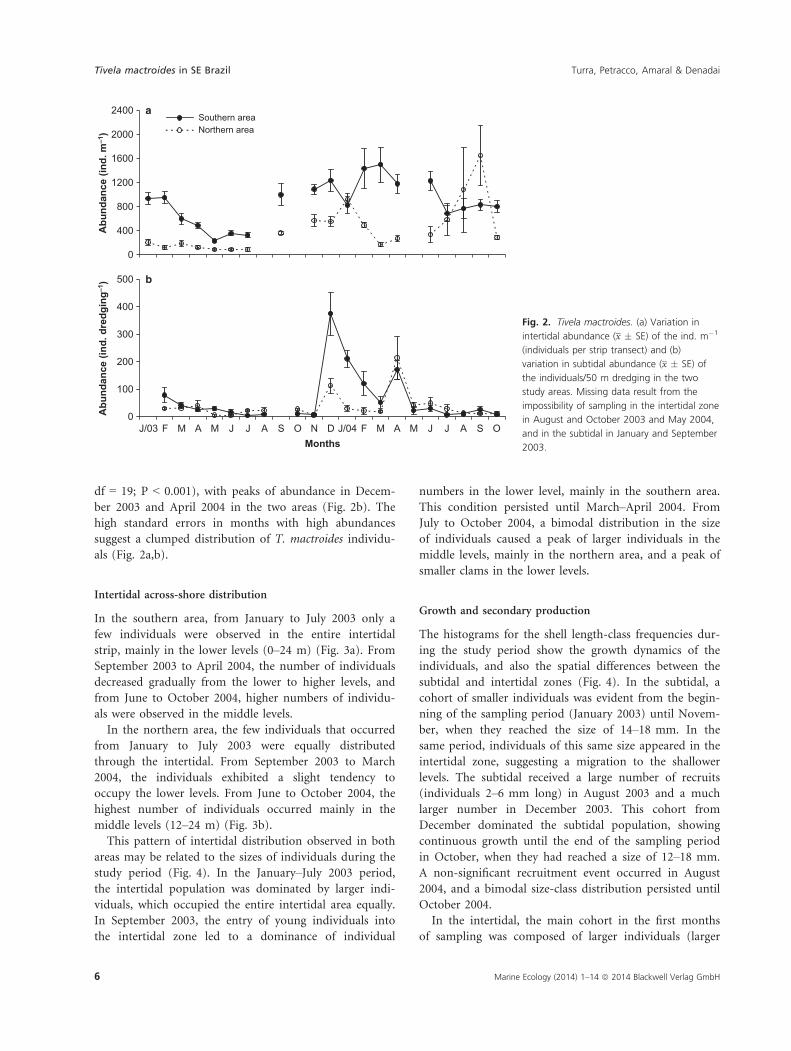
Intertidal across-shore distribution
In the southern area, from January to July 2003 only a
few individuals were observed in the entire intertidal
strip, mainly in the lower levels (0–24 m) (Fig. 3a). From
September 2003 to April 2004, the number of individuals
decreased gradually from the lower to higher levels, and
from June to October 2004, higher numbers of individu-
als were observed in the middle levels.
In the northern area, the few individuals that occurred
from January to July 2003 were equally distributed
through the intertidal. From September 2003 to March
2004, the individuals exhibited a slight tendency to
occupy the lower levels. From June to October 2004, the
highest number of individuals occurred mainly in the
middle levels (12–24 m) (Fig. 3b).
This pattern of intertidal distribution observed in both
areas may be related to the sizes of individuals during the
study period (Fig. 4). In the January–July 2003 period,
the intertidal population was dominated by larger indi-
viduals, which occupied the entire intertidal area equally.
In September 2003, the entry of young individuals into
the intertidal zone led to a dominance of individual
numbers in the lower level, mainly in the southern area.
This condition persisted until March–April 2004. From
July to October 2004, a bimodal distribution in the size
of individuals caused a peak of larger individuals in the
middle levels, mainly in the northern area, and a peak of
smaller clams in the lower levels.
Growth and secondary production
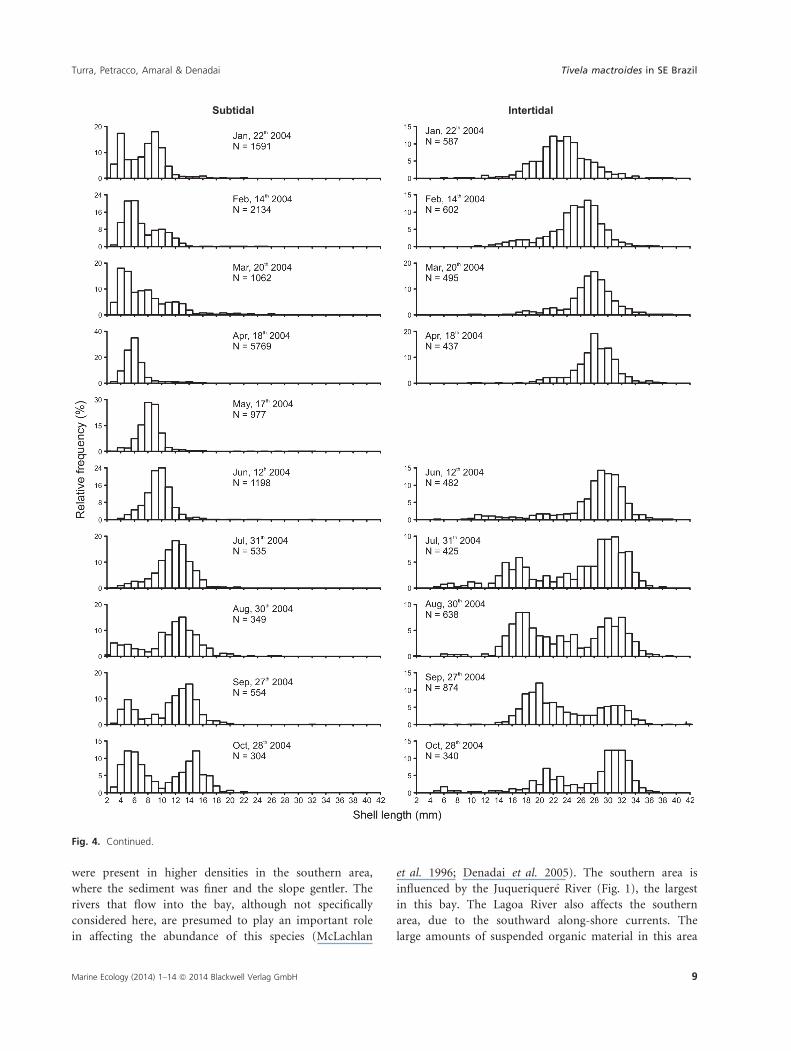
The histograms for the shell length-class frequencies dur-
ing the study period show the growth dynamics of the
individuals, and also the spatial differences between the
subtidal and intertidal zones (Fig. 4). In the subtidal, a
cohort of smaller individuals was evident from the begin-
ning of the sampling period (January 2003) until Novem-
ber, when they reached the size of 14–18 mm. In the
same period, individuals of this same size appeared in the
intertidal zone, suggesting a migration to the shallower
levels. The subtidal received a large number of recruits
(individuals 2–6 mm long) in August 2003 and a much
larger number in December 2003. This cohort from
December dominated the subtidal population, showing
continuous growth until the end of the sampling period
in October, when they had reached a size of 12–18 mm.
A non-significant recruitment event occurred in August
2004, and a bimodal size-class distribution persisted until
October 2004.
In the intertidal, the main cohort in the first months
of sampling was composed of larger individuals (larger
0
400
800
1200
1600
2000
2400A
bund
ance
(ind
. m–1
)Southern areaNorthern area
0
100
200
300
400
500
J/03 F M A M J J A S O N D J/04 F M A M J J A S OMonths
Abu
ndan
ce (i
nd. d
redg
ing–1
)a
b
Fig. 2. Tivela mactroides. (a) Variation in
intertidal abundance (x � SE) of the ind. m�1
(individuals per strip transect) and (b)
variation in subtidal abundance (x � SE) of
the individuals/50 m dredging in the two
study areas. Missing data result from the
impossibility of sampling in the intertidal zone
in August and October 2003 and May 2004,
and in the subtidal in January and September
2003.
6 Marine Ecology (2014) 1–14 ª 2014 Blackwell Verlag GmbH
Tivela mactroides in SE Brazil Turra, Petracco, Amaral & Denadai
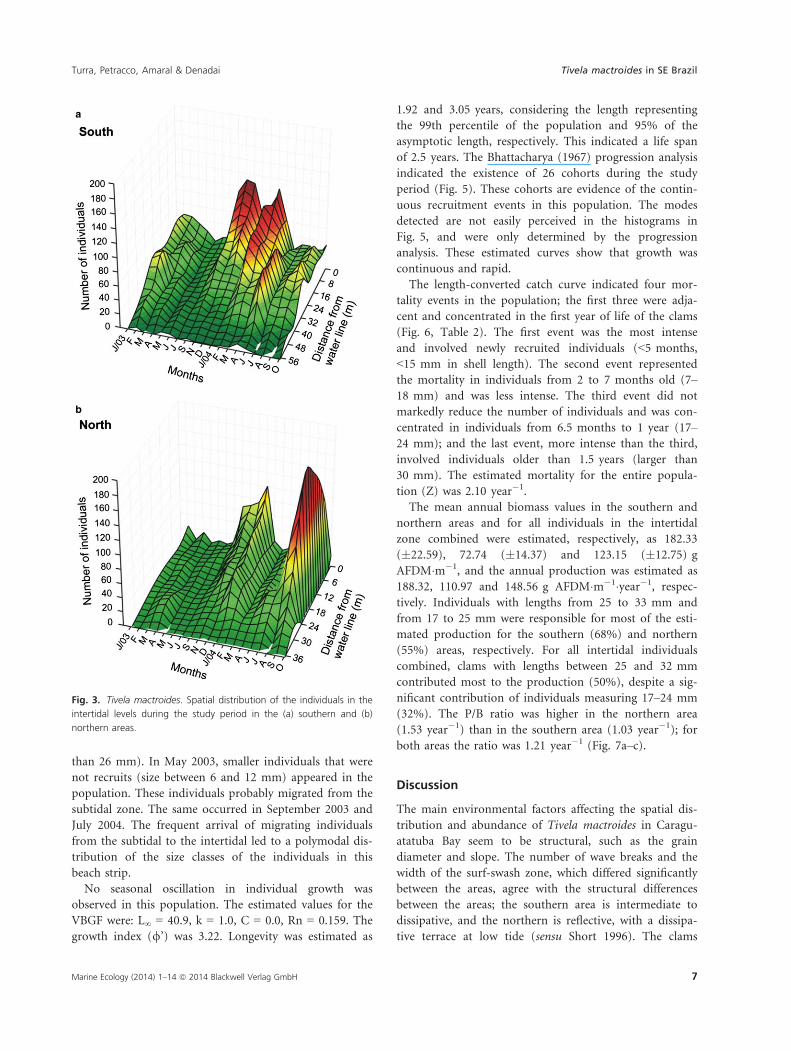
than 26 mm). In May 2003, smaller individuals that were
not recruits (size between 6 and 12 mm) appeared in the
population. These individuals probably migrated from the
subtidal zone. The same occurred in September 2003 and
July 2004. The frequent arrival of migrating individuals
from the subtidal to the intertidal led to a polymodal dis-
tribution of the size classes of the individuals in this
beach strip.
No seasonal oscillation in individual growth was
observed in this population. The estimated values for the
VBGF were: L∞ = 40.9, k = 1.0, C = 0.0, Rn = 0.159. The
growth index (/’) was 3.22. Longevity was estimated as
1.92 and 3.05 years, considering the length representing
the 99th percentile of the population and 95% of the
asymptotic length, respectively. This indicated a life span
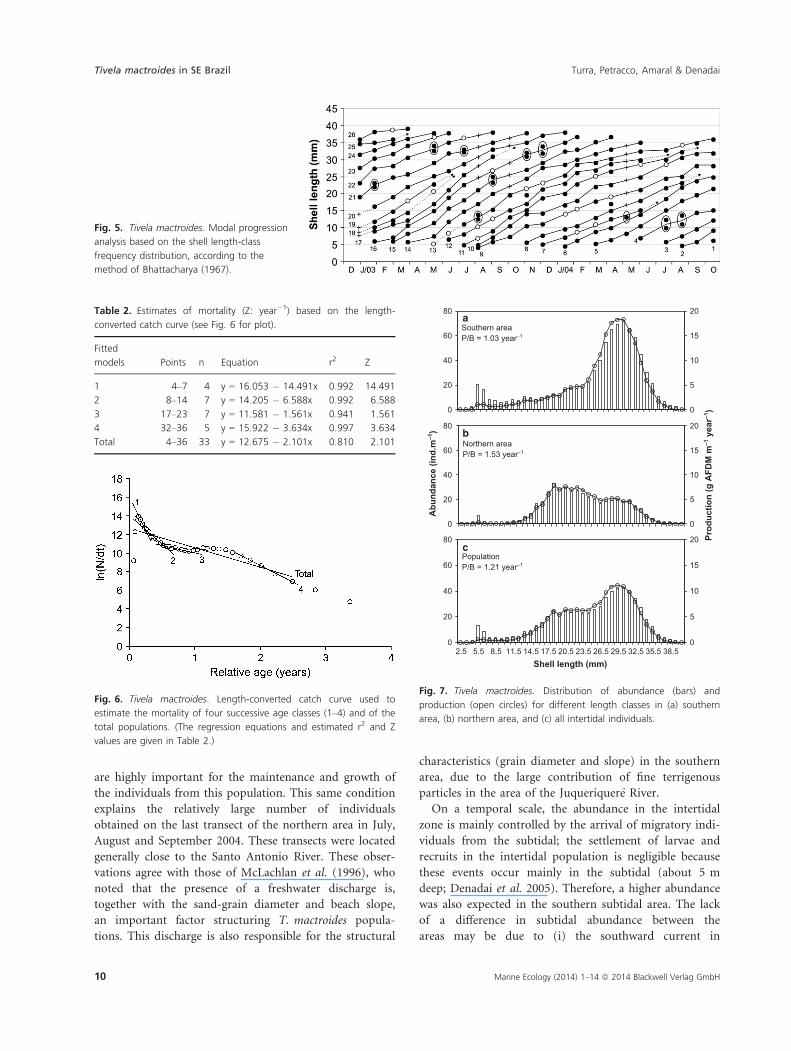
of 2.5 years. The Bhattacharya (1967) progression analysis
indicated the existence of 26 cohorts during the study
period (Fig. 5). These cohorts are evidence of the contin-
uous recruitment events in this population. The modes
detected are not easily perceived in the histograms in
Fig. 5, and were only determined by the progression
analysis. These estimated curves show that growth was
continuous and rapid.
The length-converted catch curve indicated four mor-
tality events in the population; the first three were adja-
cent and concentrated in the first year of life of the clams
(Fig. 6, Table 2). The first event was the most intense
and involved newly recruited individuals (<5 months,
<15 mm in shell length). The second event represented
the mortality in individuals from 2 to 7 months old (7–18 mm) and was less intense. The third event did not
markedly reduce the number of individuals and was con-
centrated in individuals from 6.5 months to 1 year (17–24 mm); and the last event, more intense than the third,
involved individuals older than 1.5 years (larger than
30 mm). The estimated mortality for the entire popula-
tion (Z) was 2.10 year�1.
The mean annual biomass values in the southern and
northern areas and for all individuals in the intertidal
zone combined were estimated, respectively, as 182.33
(�22.59), 72.74 (�14.37) and 123.15 (�12.75) g
AFDM�m�1, and the annual production was estimated as
188.32, 110.97 and 148.56 g AFDM�m�1�year�1, respec-
tively. Individuals with lengths from 25 to 33 mm and
from 17 to 25 mm were responsible for most of the esti-
mated production for the southern (68%) and northern
(55%) areas, respectively. For all intertidal individuals
combined, clams with lengths between 25 and 32 mm
contributed most to the production (50%), despite a sig-
nificant contribution of individuals measuring 17–24 mm
(32%). The P/B ratio was higher in the northern area
(1.53 year�1) than in the southern area (1.03 year�1); for
both areas the ratio was 1.21 year�1 (Fig. 7a–c).
Discussion
The main environmental factors affecting the spatial dis-
tribution and abundance of Tivela mactroides in Caragu-
atatuba Bay seem to be structural, such as the grain
diameter and slope. The number of wave breaks and the
width of the surf-swash zone, which differed significantly
between the areas, agree with the structural differences
between the areas; the southern area is intermediate to
dissipative, and the northern is reflective, with a dissipa-
tive terrace at low tide (sensu Short 1996). The clams
b
a
Fig. 3. Tivela mactroides. Spatial distribution of the individuals in the
intertidal levels during the study period in the (a) southern and (b)
northern areas.
Marine Ecology (2014) 1–14 ª 2014 Blackwell Verlag GmbH 7
Turra, Petracco, Amaral & Denadai Tivela mactroides in SE Brazil
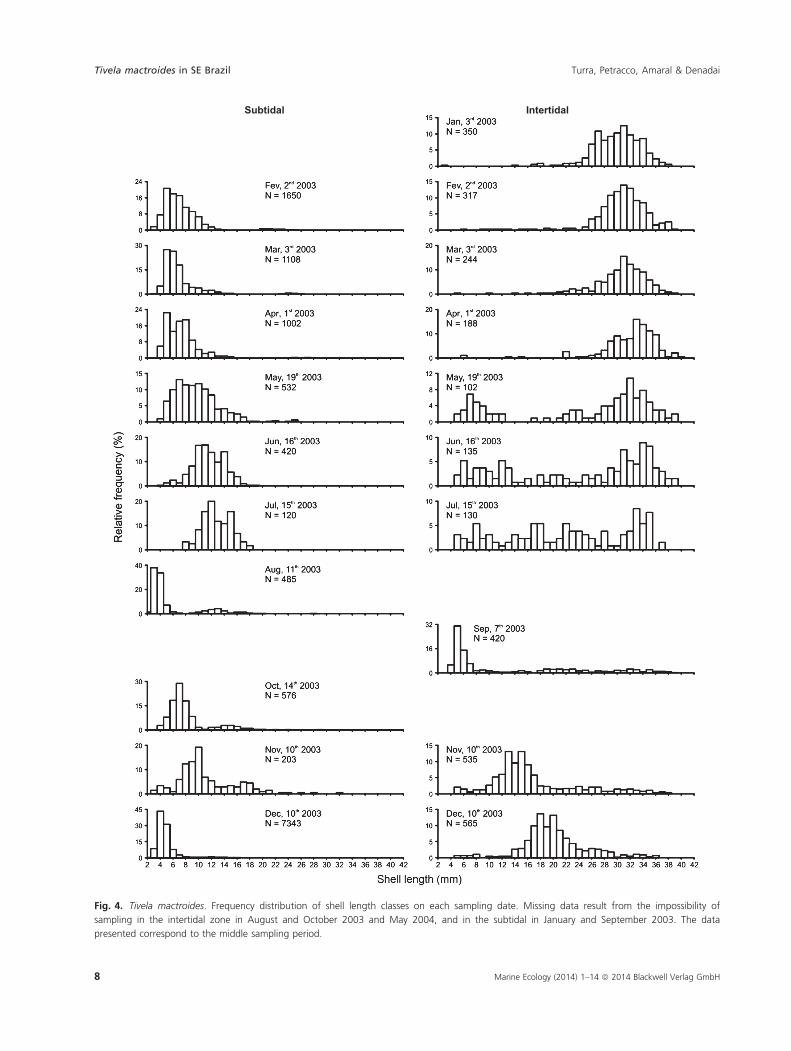
Intertidal Subtidal
Fig. 4. Tivela mactroides. Frequency distribution of shell length classes on each sampling date. Missing data result from the impossibility of
sampling in the intertidal zone in August and October 2003 and May 2004, and in the subtidal in January and September 2003. The data
presented correspond to the middle sampling period.
8 Marine Ecology (2014) 1–14 ª 2014 Blackwell Verlag GmbH
Tivela mactroides in SE Brazil Turra, Petracco, Amaral & Denadai
were present in higher densities in the southern area,
where the sediment was finer and the slope gentler. The
rivers that flow into the bay, although not specifically
considered here, are presumed to play an important role
in affecting the abundance of this species (McLachlan
et al. 1996; Denadai et al. 2005). The southern area is
influenced by the Juqueriquere River (Fig. 1), the largest
in this bay. The Lagoa River also affects the southern
area, due to the southward along-shore currents. The
large amounts of suspended organic material in this area
Intertidal Subtidal
Fig. 4. Continued.
Marine Ecology (2014) 1–14 ª 2014 Blackwell Verlag GmbH 9
Turra, Petracco, Amaral & Denadai Tivela mactroides in SE Brazil
are highly important for the maintenance and growth of
the individuals from this population. This same condition
explains the relatively large number of individuals
obtained on the last transect of the northern area in July,
August and September 2004. These transects were located
generally close to the Santo Antonio River. These obser-
vations agree with those of McLachlan et al. (1996), who
noted that the presence of a freshwater discharge is,
together with the sand-grain diameter and beach slope,
an important factor structuring T. mactroides popula-
tions. This discharge is also responsible for the structural
characteristics (grain diameter and slope) in the southern
area, due to the large contribution of fine terrigenous
particles in the area of the Juqueriquere River.
On a temporal scale, the abundance in the intertidal
zone is mainly controlled by the arrival of migratory indi-
viduals from the subtidal; the settlement of larvae and
recruits in the intertidal population is negligible because
these events occur mainly in the subtidal (about 5 m
deep; Denadai et al. 2005). Therefore, a higher abundance
was also expected in the southern subtidal area. The lack
of a difference in subtidal abundance between the
areas may be due to (i) the southward current in
Fig. 5. Tivela mactroides. Modal progression
analysis based on the shell length-class
frequency distribution, according to the
method of Bhattacharya (1967).
Table 2. Estimates of mortality (Z: year�1) based on the length-
converted catch curve (see Fig. 6 for plot).
Fitted
models Points n Equation r2 Z
1 4–7 4 y = 16.053 � 14.491x 0.992 14.491
2 8–14 7 y = 14.205 � 6.588x 0.992 6.588
3 17–23 7 y = 11.581 � 1.561x 0.941 1.561
4 32–36 5 y = 15.922 � 3.634x 0.997 3.634
Total 4–36 33 y = 12.675 � 2.101x 0.810 2.101
Fig. 6. Tivela mactroides. Length-converted catch curve used to
estimate the mortality of four successive age classes (1–4) and of the
total populations. (The regression equations and estimated r2 and Z
values are given in Table 2.)
0
20
40
60
80
0
5
10
15
20b Northern area P/B = 1.53 year–1
Prod
uctio
n (g
AFD
M m
–1 y
ear–1
)
Abu
ndan
ce (i
nd.m
–1)
0
20
40
60
80
2.5 5.5 8.5 11.5 14.5 17.5 20.5 23.5 26.5 29.5 32.5 35.5 38.5Shell length (mm)
0
5
10
15
20cPopulationP/B = 1.21 year–1
0
20
40
60
80
0
5
10
15
20aSouthern area P/B = 1.03 year–1
Fig. 7. Tivela mactroides. Distribution of abundance (bars) and
production (open circles) for different length classes in (a) southern
area, (b) northern area, and (c) all intertidal individuals.
10 Marine Ecology (2014) 1–14 ª 2014 Blackwell Verlag GmbH
Tivela mactroides in SE Brazil Turra, Petracco, Amaral & Denadai
Caraguatatuba Bay (Souza 1997) and (ii) the gentler slope
in the southern area. Both factors would facilitate the
migration of individuals from the subtidal to the inter-
tidal zones in the southern area. The higher abundance of
smaller individuals (<15 mm) in the southern intertidal
supports this idea (Fig. 4). However, the estimates of
subtidal abundance should be viewed with caution
because of the semi-quantitative sampling used in this
zone.
The mean density in the intertidal of Caraguatatuba
Bay (14 ind. m�2) is much lower than densities observed
in some sandy beaches in Venezuela: Playa Caicara,
53 ind. m�2 (Arrieche & Prieto 2006); Playa Gu�ıria,
485 ind. m�2 (Tata & Prieto 1991); Higuerote sandy bea-
ches, 3250 ind. m�2 (Herrera & Bone 2011) and La
Guardia, 12,000 ind. m�2 (Etchevers 1976). However, the
density is higher than in the S~ao Sebasti~ao Channel
(0.12–0.16 ind. m�2) in Southeastern Brazil (Arruda &
Amaral 2003). The density of T. mactroides tends to oscil-
late over unknown time intervals. In 2007–2008 on the
same sandy beach, Turra et al. (2013) found a density
150 times higher than that estimated in this study.
According to those authors, successive recruitments in
the subtidal with subsequent migration to the intertidal
led to this notable increase in density within a short time
period (about 30 months).
The zonation of individuals in the intertidal seems to
be strongly influenced by the size of the clams. In general,
the smaller clams occurred in the lower intertidal levels.
This is evidence of the migration of individuals from the
subtidal to the intertidal zone during their life span
(Denadai et al. 2005). The reasons for this migration are
still unknown, but the intertidal seems to be more favor-
able for the survival of this species (McLachlan et al.
1996). The spatial segregation according to size allows the
smaller individuals to inhabit a more stable environment
(subtidal zone) and may also minimize the risk of passive
filtration of the larvae by the adults in the intertidal zone.
In the data obtained here, a likely explanation for the
high abundance in the lower intertidal levels in the per-
iod from September 2003 to March–April 2004 is the
arrival of small individuals (4–8 mm) in the intertidal in
this period (see Figs 3 and 4).
The individual growth of T. mactroides in Caraguata-
tuba Bay was continuous, indicating the absence of limit-
ing factors such as temperature and food. The regional
temperatures and also the dry–wet seasons vary little and
are not sufficient to alter the metabolic rates of the clams,
a factor that may control growth (Vakily 1992). In addi-
tion, the river discharges provide unlimited food due to
the constant arrival of suspended organic material. Dena-
dai et al. (2005) found higher abundances of T. mactro-
ides in areas under the influence of the rivers, indicating
the success of this suspension-feeding mollusk close to
the river mouth, as also observed by McLachlan et al.
(1996). Other conditions in Caraguatatuba Bay contribute
to nutrient enrichment, such as the intense wastewater
runoff from the seaside residences, the residues from arti-
sanal fishing, and the rainy climate conditions. The con-
stant recruitment events (about eight per year) may also
be favored by the non-limiting food resource and stable
temperatures, allowing rapid gonad development (M.R.
Denadai, unpublished data) and the survival of plank-
tonic larvae and of just-established individuals.
These favorable conditions allow rapid recovery of the
stock of this T. mactroides population, despite the consid-
erable mortality rate estimated. The higher mortality
affects mainly the just-established individuals, as is the
natural tendency for marine populations; and also the
larger ones (shell length larger than 30 mm). In the case
of the larger individuals, two main factors may be reduc-
ing the stock: (i) harvesting by local people and tourists,
and (ii) density-dependent mass mortality events (Turra
et al. 2013). The medium-sized individuals, as well as the
smaller ones, are also consumed by a variety of predators,
such as sea-stars (Astropecten marginatus and Luidia sen-
egalensis), swimming-crabs (Callinectes danae) and some
fishes (Trachinotus carolinus, Cathorops spixii, Paralonchu-
rus brasiliensis, Aspistor luniscutis and Genidens genidens)
(M.R. Denadai unpublished data).
Although available information on the population
dynamics of T. mactroides is limited, some trends could
be observed by comparing the life-history traits of differ-
ent populations of this species. The higher growth perfor-
mance (/′) for T. mactroides on tropical beaches than in
the subtropical population of Caraguatatuba Bay is in
agreement with the positive relationship between /′ andtemperature observed for bivalve populations (Vakily
1992; Herrmann et al. 2009) (Table 3). The higher mor-
tality on the tropical beaches can also be attributed to the
increased metabolic rate at high temperatures, which is
reflected in the increase in the parameter K (Moreau
1987). Thus, the longer life span estimated for the sub-
tropical population of T. mactroides is expected, since life
span increases from tropical to subtropical beaches due
to the lower mortality in the latter (Defeo & McLachlan
2005). These differences in life-history traits between the
subtropical and tropical populations of T. mactroides are
in agreement with the latitudinal pattern observed for
many species of macrofauna of sandy beaches, such as
the bivalves Donax hanleyanus (Cardoso & Veloso 2003;
Herrmann et al. 2009) and Mesodesma mactroides (Herr-
mann et al. 2011), and the crustaceans Emerita brasiliensis
(Defeo & Cardoso 2002), Excirolana brasiliensis (Cardoso
& Defeo 2004) and E. armata (Petracco et al. 2010,
2012b).
Marine Ecology (2014) 1–14 ª 2014 Blackwell Verlag GmbH 11
Turra, Petracco, Amaral & Denadai Tivela mactroides in SE Brazil
The higher production in the southern than in the
northern intertidal area can be attributed to the high
abundance of larger individuals (26–30 mm), which were
responsible for most of the production in the former area
(42%) and for the intertidal zone as a whole (33%). This
higher production in the southern area implies that more
food is available for the clams, since production is an
estimate of the intensity of the utilization of a food
source (Benke, 1996). The production of T. mactroides in
Caraguatatuba Bay was much lower than production rates
estimated for this species in Venezuela (Tata & Prieto
1991), and closer to those estimated in Southeastern Bra-
zil for another venerid, Anomalocardia brasiliana (Salva-
dor 2001; Corte 2011; Mattos & Cardoso 2012)
(Table 4). However, the production of T. mactroides was
higher than the median of the estimates obtained for
sandy-beach bivalves (Petracco et al. 2012a, 2013).
Furthermore, the broad distribution of T. mactroides
across- and along-shore in Caraguatatuba Bay, including
the subtidal zone, suggests that the overall production of
this bivalve in the bay is high.
The lower P/B ratio of this subtropical population than
the tropical population at Guiria Beach, Venezuela, is
expected, and follows the latitudinal pattern observed for
other bivalve species (Cardoso & Veloso 2003; Herrmann
et al. 2009; Petracco et al. 2013). However, the P/B ratio
of the subtropical population is probably underestimated,
since the smaller individuals that live in the subtidal were
not included in the calculation of production, because of
the semi-quantitative sampling in the subtidal. When
these smaller individuals were included, the P/B ratio was
estimated at c. 2.30 year�1, which seems a more realistic
estimate considering the relationship of Allen (1971:
Z = P/B). This P/B ratio is generally higher than most
estimates calculated for other venerid populations
(Table 4) as well as for sandy-beach bivalve populations
as a whole (Petracco et al. 2012a, 2013). The high pro-
duction and P/B ratio of T. mactroides in Caraguatatuba
Bay were due to the continuous entry of recruits in the
population and the rapid and continuous growth of the
clams. These high values make T. mactroides an impor-
tant item in the food web of the beach-surf zone ecosys-
tem and a vital resource for local people, and reinforce
the idea that the stock is able to recover rapidly.
In summary, T. mactroides shows continuous repro-
duction, a short life span (2.5 years), and rapid and con-
tinuous growth in Caraguatatuba Bay. The higher
abundance and production in the southern intertidal area
was associated with the more dissipative conditions (gen-
tler slope, finer sand, and wider surf zone) and the pres-
ence of a relatively large river. The high production and
turnover rate of T. mactroides demonstrated the impor-
tance of this population as a biological resource for many
marine species and for the local people. Despite the lim-
ited information about T. mactroides, the life-history
traits of populations of this species seem to follow a lati-
tudinal pattern. Further studies on the range of distribu-
tion of T. mactroides should be performed to elucidate
aspects of macroecology of this important bivalve of
sandy beaches.
Acknowledgements
This work was partially financed by the Fundac�~ao de Am-
paro �a Pesquisa do Estado de S~ao Paulo (FAPESP) within
the Biota/FAPESP – The Biodiversity Virtual Institute
Program (www.biota.org.br). We also thank FAPESP for
the ‘Programa Jovem Pesquisador em Centro Emergente’
Table 4. Annual production (P: g AFDM�m�2�year�1), mean biomass
(B: g AFDM�m�2), turnover ratio (P/B: year�1) of venerid clams at dif-
ferent latitudes (Lat).
Species P B P/B Lat Source
Anomalocardia
brasiliana
11.60 9.14 1.27 22°56′S Mattos &
Cardoso
(2012)
Anomarlocardia
brasiliana
5.45 1.96 2.78 23°37′S Corte
(2011)
Tivela
mactroides
3.23 2.68 1.2-2.3 23°40′S This study
Anomarlocardia
brasiliana
1.47 0.79 1.85 23°45′S Salvador
(2001)
Anomarlocardia
brasiliana
0.59 0.66 0.89 23°45′S Corte
(2011)
Tivela
mactroides
136.64 67.68 2.20 10°40′N Tata &
Prieto
(1991)
Table 3. Growth parameters of the von Bertalanffy growth function [L∞ (mm) and K (year�1)], growth index phi prime (/′), instantaneous
mortality rate (Z, year�1) and life span (LS, years) of Tivela mactroides populations at different latitudes.
L∞ K /′ Z LS Latitude Source
39.10 1.80 3.44 3.60 10°05′N Mendonza & Marcano (2000)
44.32 1.98 3.59 2.41 1.50 10°10′N Arrieche & Prieto (2006)
2.88 1.50 10°40′N Tata & Prieto (1991)
31.80 1.70 3.24 1.98 1.50 10°40′N Prieto (1987)
40.90 1.00 3.22 2.10 2.50 23°40′S This study
12 Marine Ecology (2014) 1–14 ª 2014 Blackwell Verlag GmbH
Tivela mactroides in SE Brazil Turra, Petracco, Amaral & Denadai
grant offered to M.R.D. (Proc. No. 05/60041-6 and 06/
57575-1). Thanks also to Centro Universit�ario M�odulo
for the logistical resources and to Dr. Janet W. Reid, who
revised the English text.
References
Allen K.R. (1971) Relation between production and biomass.
Journal of the Fisheries Research Board of Canada, 28,
1573–1581.
Arrieche D., Prieto A. (2006) Par�ametros poblacionales del
guacuco Tivela mactroides (Bivalvia: Veneridae) de Playa
Caicara, Estado Anzo�ategui, Venezuela. Ciencias Marinas,
32, 285–296.
Arruda E.P., Amaral A.C.Z. (2003) Spatial distribution of
molluscs in the intertidal zone of sheltered beaches in
Southeastern Brazil. Revista Brasileira de Zoologia, 20, 291–300.
Benke A.C. (1996) Secondary production of
macroinvertebrates. In: Hauer F.T., Lamberti G.A. (Eds),
Methods in Stream Ecology. Academic Press, San Diego:
557–578.
Benke A.C., Huryn A.D. (2006) Secondary production of
macroinvertebrates. In: Hauer F.T., Lamberti G.A. (Eds),
Methods in Stream Ecology, 2nd edn. Academic Press,
Waltham: 691–710.
Bhattacharya C.G. (1967) A simple method of resolution of a
distribution into Gaussian components. Biometrics, 23,
115–135.
Brey T. (2001) Population dynamics in benthic invertebrates.
A virtual handbook. Version 1.2. Alfred Wegener Institute
for Polar and Marine Research, Germany. http://www.
thomas-brey.de/science/virtualhandbook.
Brown A.C., McLachlan A. (2002) Sandy shore ecosystems and
the threats facing them: some predictions for the year 2025.
Environmental Conservation, 29, 62–77.
Cardoso R.S., Defeo O. (2004) Biogeographical patterns in life
history traits of the Pan-American sandy beach isopod
Excirolana braziliensis. Estuarine, Coastal and Shelf Science,
61, 559–568.
Cardoso R.S., Veloso V.G. (2003) Population dynamics and
secondary production of the wedge clam Donax hanleyanus
(Bivalvia: Donacidae) on a high-energy, subtropical beach of
Brazil. Marine Biology, 142, 153–162.
Corte G.N. (2011) Biologia populacional e reprodutiva de
Anomalocardia brasiliana (Gmelin, 1791) (Bivalvia:
Veneridae). Dissertation, UNICAMP, Campinas, Brazil.
Crisp D.J. (1984) Energy flow measurements. In: Holme N.A.,
McIntyre A.D. (Eds), Methods for the Study of Marine
Benthos. IBP Handbook 16, Blackwell Scientific Publications,
Oxford: 284–372.
Defeo O., Cardoso R.S. (2002) Macroecology of population
dynamics and life history traits of the mole crab Emerita
brasiliensis in Atlantic sandy beaches of South America.
Marine Ecology Progress Series, 239, 169–179.
Defeo O., McLachlan A. (2005) Patterns, processes and
regulatory mechanisms in sandy beach macrofauna: a
multi-scale analysis. Marine Ecology Progress Series,
295, 1–20.
Defeo O., Rueda M. (2002) Spatial structure, sampling design
and abundance estimates in sandy beach macroinfauna:
some warnings and new perspectives. Marine Biology, 140,
1215–1225.
Defeo O., McLachlan A., Schoeman D.S., Schlacher T.A.,
Dugan J., Jones A., Lastra M., Scapini F. (2009) Threats to
sandy beaches ecosystems: a review. Estuarine, Coastal and
Shelf Science, 81, 1–12.
Denadai M.R., Amaral A.C.Z., Turra A. (2005) Along- and
across-shore components of the spatial distribution of the
clam Tivela mactroides (Born 1778) (Bivalvia, Veneridae).
Journal of Natural History, 39, 3275–3295.
Etchevers S.L. (1976) Notas ecol�ogicas e cuantificacion de la
poblacion de guacuco, Tivela mactroides (Born, 1778)
(Bivalvia – Veneridae), en la Ensenada de La Guardia, Isla
de Margarita, Venezuela. Bolet�ın del Instituto Oceanogr�afico,
Universidad de Oriente, 15, 57–64.
Herrera A., Bone D. (2011) Influence of riverine outputs on
sandy beaches of Higuerote, central coast of Venezuela.
Latin American Journal of Aquatic Research, 39, 56–70.
Herrmann M., Carstensen D., Fisher S., Laudien J.,
Penchaszadeh P.E., Arntz W.E. (2009) Population structure,
growth, and production of the wedge clam Donax hanleyanus
(Bivalvia: Donacidae) from Northern Argentinean beaches.
Journal of Shellfish Research, 28, 511–526.
Herrmann M., Alfaya J.E.F., Lepore M.L., Penchaszadeh P.E.,
Arntz W.E. (2011) Population structure, growth, and
production of the yellow clam Mesodesma mactroides
(Bivalvia: Mesodesmatidae) from a high-energy, temperate
beach in northern Argentina. Helgoland Marine Research,
65, 285–297.
King M. (1995) Fisheries Biology, Assessment and Managment.
Fishing News Books, Oxford: 331.
Mattos G., Cardoso R.S. (2012) Population dynamics of two
suspension-feeding bivalves on a sheltered beach in
Southeastern Brazil. Helgoland Marine Research, 66, 393–
400.
McLachlan A., Dugan J.E., Defeo O., Ansell A.D., Hubbard
D.M., Jaramillo E., Penchaszadeh P. (1996) Beach
clam fisheries. Oceanography and Marine Biology, 34,
163–232.
Mendonza J., Marcano J. (2000) Abundancia y evaluaci�on del
guacuco Tivela mactroides en la Ensenada La Guardia, Isla
de Margarita, Venezuela. Bolet�ın del Instituto Oceanogr�afico,
Universidad de Oriente, 39, 79–91.
Moreau J. (1987) Mathematical and biological expression of
growth in fishes: recent trends and further developments.
In: Summerfelt R.C., Hall G.E. (Eds), The Age and Growth
of Fish. The Iowa State University Press, Ames: 81–113.
Narchi W. (1972) Comparative study of the functional
morphology of Anomalocardia brasiliana (Gmelin, 1791)
Marine Ecology (2014) 1–14 ª 2014 Blackwell Verlag GmbH 13
Turra, Petracco, Amaral & Denadai Tivela mactroides in SE Brazil
and Tivela mactroides (Born, 1778) (Bivalvia, Veneridae).
Bulletin of Marine Science, 22, 643–670.
Pauly D. (1983) Length-converted catch curves: a powerful
tool for fisheries research in the tropics (part I). Fishbyte, 1,
9–13.
Pauly D., Gaschutz G. (1979) A simple method for fitting
oscillating length growth data, with a program for pocket
calculator. International Council Exploration of the Sea.
ICES/G, 26.
Pauly D., Munro J.L. (1984) Once more on the comparison of
growth in fish and invertebrates. Fishbyte, 2, 21.
Perillo G.M.E., Piccolo M.C. (1987) Programa de observaciones
costeras (POC), [S.l.], Instituto Argentino de Oceanografia. 17.
Petracco M., Cardoso R.S., Corbisier T.N. (2010) Population
biology of Excirolana armata (Dana, 1853) (Isopoda,
Cirolanidae) on an exposed sandy beach in Southeastern
Brazil. Marine Ecology, 31, 330–340.
Petracco M., Cardoso R.S., Corbisier T.N., Turra A. (2012a)
Production on Brazilian sandy beaches macrofauna: a
review. Brazilian Journal of Oceanography, 64, 473–484.
Petracco M., Cardoso R.S., Turra A., Corbisier T.N. (2012b)
Production of Excirolana armata (Dana, 1853) (Isopoda,
Cirolanidae) on an exposed sandy beach in Southeastern
Brazil. Helgoland Marine Research, 66, 265–274.
Petracco M., Cardoso R.S., Turra A. (2013) Patterns of
sandy-beach macrofauna production. Journal of the Marine
Biological Association of the United Kingdon, 93, 1717–1725.
Prieto A.S. (1980) Contribuci�on a la ecologia de Tivela
mactroides Born, 1778: aspectos reproductivos. Boletim do
Instituto Oceanogr�afico da Universidade de S~ao Paulo, 29,
323–328.
Prieto A.S. (1987) Ecolog�ıa de Tivela mactroides (Born, 1778)
(Mollusca: Bivalvia), crescimiento, mortalidad num�erica,
eliminacion y rendimiento em la localidad de Playa Guiria
(Sucre, Venezuela). Trabajo de Ascenso, Departamento de
Biolog�ıa, Universidad de Oriente, Cumana, Venezuela.
Rios E.C. (1994) Seashells of Brazil, 2th edn. Fundac�~aoUniversidade do Rio Grande, Rio Grande: 368pp.
Salvador L.B. (2001) Malacofauna da regi~ao entremar�es de
praias de areia com fragmentos de rocha:
Distribuic�~ao temporal e espacial; Dinamica populacional
e produc�~ao secund�aria de Anomalocardia brasiliana
(Gmelin, 1791) e Corbula cubaniana Orbigny,
1853. Ph.D. thesis, Universidade Estadual Paulista, Rio
Claro, Brazil.
Schlacher T.A., Dugan J., Schoeman D.S., Lastra M., Jones A.,
Scapini F., McLachlan A., Defeo O. (2007) Sandy beaches at
the brink. Diversity and Distributions, 13, 556–560.
Severeyn Y.G., Severeyn H., GrantW., Reverol Y. (2000) Effect of
water temperature on larval development of the bivalve
mollusk Tivela mactroides: evaluation in the laboratory and via
simulation. Ecological Modelling, 129, 143–151.
Short A.D. (1996) The role of wave weight, period, slope, tide
range and embaymentisation in beach classifications:
a review. Revista Chilena de Historia Natural, 69,
589–604.
Souza C.R. de G. (1997) As c�elulas de deriva litoranea e a
eros~ao nas praias do Estado de S~ao Paulo. S~ao Paulo. Ph.D.
thesis, Universidade de S~ao Paulo, S~ao Paulo, Brazil.
Sparre P., Ursin E., Venema S.C. (1989) Introduction to
Tropical Fish Assessment: Manual. FAO Fisheries Technical
Papers (306/1), FAO, Rome: 337pp.
Suguio K. (1973) Introduc�~ao a Sedimentologia. Edgard Bluche/
EDUSP, S~ao Paulo: 321.
Tata A., Prieto A.S. (1991) Producci�on secundaria em una
poblaci�on del bivalvo tropical Tivela mactroides (Veneridae)
en el Oriente de Venezuela. Caribbean Journal of Science, 22,
28–34.
Turra A., Petracco M., Amaral A.C.Z., Denadai M.R. (2013)
Temporal variation in lilfe-history traits of the clam Tivela
mactroides (Bivalvia:Veneridae): density-dependent
processes in sandy beaches. Estuarine, Coastal and Shelf
Science, doi:10.1016/j.ecss.2013.06.004
Vakily J.M. (1992) Determination and comparison of bivalve
growth, with emphasis on Thailand and other tropical areas.
ICLARM Tech. Rep. 36, 1–125.
Zar J.H. (1999) Biostatistical Analysis, 4th edn. Prentice-Hall
Inc., Upper Saddle River: 663.
14 Marine Ecology (2014) 1–14 ª 2014 Blackwell Verlag GmbH
Tivela mactroides in SE Brazil Turra, Petracco, Amaral & Denadai


