Embed Size (px)
Citation preview

1
Predicting Three-dimensional Patellofemoral Kinematics 1
from Static Imaging-Based Alignment Measures 2
3
Running Title: Predicting Patellofemoral Kinematics using Static Measures. 4
5
6
Benjamin R. Freedman and Frances T. Sheehan, Ph.D.
7
8
Functional and Applied Biomechanics, Department of Rehabilitation Medicine, NIH, Bethesda, 9
MD, USA 10
11
Published in: Journal of Orthopaedic Research 12
J Orthop Res. 2013 Mar;31(3):441-7. doi: 10.1002/jor.22246. Epub 2012 Oct 23. 13
14
15
Corresponding author: 16
Frances T. Sheehan, PhD 17
National Institutes of Health 18
Building 10 CRC RM 1-1469 19
10 Center Drive MSC 1604 20
Bethesda, MD 20892-1604 21
Tel: (301) 451-7585 22
E-mail: [email protected] 23
24
25

2
ABSTRACT 26
Patellofemoral pain syndrome causes significant discomfort and disability among much of the 27
general population. Despite recent breakthroughs in dynamic three-dimensional imaging 28
technologies to assess pathological patellofemoral motion, such tools remain costly for clinical 29
diagnostics applications. Thus, this study investigated whether three-dimensional patellofemoral 30
kinematics could be predicted from routine two-dimensional static measures of patellofemoral 31
joint alignment quantified from magnetic resonance imaging (MRI) data acquired in full knee 32
extension. Twenty-six volunteers clinically diagnosed with patellofemoral pain (19F/7M, 33
25.9±11.1 years) and twenty-six control subjects (19F/7M, 25.3±7.7 years) were included in this 34
IRB-approved study. Static three-dimensional sagittal T1-weighted gradient recall echo and 35
dynamic MRI scans were acquired. For the dynamic image acquisition, subjects cyclically flexed 36
and extended their knee (at 30 cycles/minute) while a full cine-phase contrast MRI set (24 times 37
frames of anatomic images and x, y, and z-velocity images) was acquired. From these data, static 38
measures of patellofemoral alignment and three-dimensional patellofemoral kinematics were 39
derived. Single and multiple regressions between static and kinematic variables were evaluated. 40
Although shown reliable, the static MRI measures could only partially predict patellofemoral 41
kinematics, with r2-values ranging from 16%-77%. This makes it imperitave that the current 42
precise, accurate, 3D, dynamic imaging techniques be translated into clinical tools. 43
44
INTRODUCTION 45
Patellofemoral pain syndrome (PFPS), defined as long-term idiopathic anterior knee pain, affects 46
approximately 14-17% of the young active population1. It is theorized to be caused by a force 47
imbalance at the knee2 and/or abnormal bone shape
3,4 that results in pathological patellofemoral 48
(PF) kinematics (pathomechanics)5,6
. It is believed that such pathomechanics ultimately lead to 49

3
increased PF joint stress and pain7,8
. Although PFPS is typically exacerbated by dynamic 50
activities requiring active quadriceps loading, clinical evaluation of the knee relies primarily on 51
2D static imaging-based alignment measures and other clinical markers, because in vivo 3D 52
dynamic PF kinematic measures, quantified during activities requiring active muscle control, are 53
not yet clinically available. 54
Imaging technologies have continuously evolved in order to more accurately and 55
quantitatively evaluate the PF joint (as well as other joints) under loaded dynamic conditions. 56
The first imaging studies evaluating PF alignment9,10
were limited to 2D static imaging of the 57
anterior aspect of the PF joint. The required flexed knee posture of roentgenographic imaging 58
resulted in high false negative rates9,11
. In the late 1980s, computed tomography (CT) and 59
magnetic resonance imaging (MRI) became available to study PF alignment in a fully-extended 60
position12-14
. These technologies confirmed that the femoral influence on the patella is lessened 61
as the knee enters terminal extension11
,, making malalignment most evident in this range15
. 62
Thus, for interventional decisions, particularly invasive ones, CT and MRI are often favored over 63
x-ray11,16,17
. Later, cine-MRI was used to quantify 2D PF kinematics during volitional leg 64
extension exercises6. The ability to image the PF joint during an activity requiring muscle 65
control7 allowed PF pathomechanics to be diagnosed that would have otherwise “been 66
overlooked with static examination techniques”6. Advances in imaging technologies have 67
enabled the 3D PF kinematics contractions to be quantified during either dynamic exercise 68
requiring quadriceps activity18,19
or statically with active quadriceps20
. These 3D studies added to 69
previous findings by documenting kinematic differences beyond the classic axial-plane 70
measures. For example, the results from the Sheehan et al.18
study supported the long standing 71
association between patella alta and PFPS21-23
, as well as introduced other kinematic variables 72
that may be key components in the development of PFPS, such as pathological PF valgus and 73

4
flexion19
. A recent 3D study24
demonstrated that PF flexion (measured during active extension) 74
could discriminate with 100% accuracy the presence of idiopathic long-term anterior knee pain 75
in a cohort of individuals diagnosed with cerebral palsy. 76
Many of these novel dynamic imaging methodologies have remained research tools, 77
leaving the simpler static 2D imaging-based measures as the primary methods for diagnosing PF 78
joint pathology9,10,25
; even though PF pain is typically experienced during dynamic events 79
requiring high quadriceps loading. The validity of predicting 3D PF kinematics from static, 2D, 80
imaging-based measures remains unestablished. Quantifying the relationship between the static 81
and dynamic states of the PF joint may offer improved diagnostics and eventual treatment of 82
suspected patellar maltracking26
. Thus, the purpose of this study was to determine if 3D PF 83
kinematics, acquired in vivo during a volitional leg extension exercise, could be predicted from 84
2D, static, image-based measures of PF alignment. A secondary aim was to evaluate the 85
reliability of these static measures. 86
87
METHODS 88
For this retrospective, IRB-approved study two cohorts were established from an existing 89
database (controls [n=90] and subjects diagnosed with PFPS [n=54]). Each subject signed 90
informed consent at the time of enrollment. To be included within the PFPS cohort the subject 91
had to be diagnosed with idiopathic anterior knee pain (> 6 months duration), have no history of 92
lower limb surgery, and have positive clinical signs of patellar maltracking5. Subjects included 93
within the control cohort had no current or past history of lower leg pain, injury, surgery, or 94
pathology. All included subjects had a previously acquired dynamic cine phase contrast (CPC) 95
MRI dataset and a 3D static sagittal-plane MRI acquisition with the knee in full extension. Static 96
full extension was defined using visual inspection of the clinical knee angle (created by lines 97

5
connecting the hip, knee, and ankle joint centers in the sagittal plane). As a check on this visual 98
alignment, the knee was only considered to be in static full extension if the knee angle, as 99
measured in the sagittal GRE images (Fig 1: the 2D acute angle between ty and fy), was within 100
two standard deviations a previous control cohort. For this previous cohort, subjects were placed 101
in full extension, using the same visual alignment procedure, prior to acquiring a sagittal plane 102
3D GRE image of the knee. If both knees qualified for the study, a single knee was randomly 103
selected (control) or the more impaired knee (PFPS cohort) was selected for inclusion. The final 104
study cohort consisted of 26 controls (19F/7M, 25.3±7.7 years, 166.1±9.3cm, 61.1±11.6kg) and 105
26 subjects diagnosed with PFPS (19F/7M, 25.9±11.1 years, 165.4±9.1cm, 62.2±10.6kg). 106
Subjects lay supine in an MRI scanner (1.5 T; GE Medical Systems, Milwaukee, WI; or 107
3.0 T; Philips Electronics, Eindhoven, The Netherlands) during static and dynamic image 108
acquisition. For static scanning, the knee and hip were fully extended with the mid-patella at the 109
center of a knee coil. The ankle was held in the anatomical neutral position using cushion blocks. 110
Subjects were instructed to keep their muscles relaxed while static 3D sagittal T1-weighted high 111
resolution (1mm3) gradient recall echo (GRE) images were acquired (TR=11, TE=5.1, 70-84 112
slices, Flip Angle = 15º). Image acquisition ranged from just distal to the tibial tuberosity to just 113
superior to the quadriceps’ tendon insertion into the rectus femoris (RF). During dynamic 114
scanning (Fig 1) the subject’s knee was placed over a cushioned wedge, slightly flexing the hip 115
and knee. Coupled-phased array coils were supported medial and lateral to the knee using a 116
custom-built coil holder. Subjects cyclically flexed and extended their knee (30 cycles/minute, to 117
the beat of an auditory metronome) while a full CPC image set (anatomic and x-, y-, and z-118
velocity images over 24 times frames) was acquired in a single sagittal plane. The CPC scanning 119
parameters varied slightly between the 3.0T27
and 1.5T28
scanners, but the overall temporal 120
resolution (61.2 msec on the 3T and 73.6msec on the 1.5T) was kept similar. Although the 121

6
images were acquired in a single plane, the 3D velocity enabled tracking of musculoskeletal 122
points of interest in all three dimensions. A 3-plane axial cine image set (anatomical images 123
only, 24 time frames) was acquired in order to establish anatomic coordinate systems28
. 124
Seven static measures of interest (Fig 2: patellar tilt angle (PTA), lateral patellar 125
displacement (LPD), anterior/posterior displacement (APS), inferior/superior displacement (SIS), 126
bisect offset (BO) , patellophyseal index (PPI), and the RF-Q-angle ) were quantified from the 127
3D GRE images. The subscript “S” denotes static. To quantify these measures, the 3D sagittal 128
GRE images were reconstructed into axial images. Femoral vectors and points of interest were 129
located in axial image at the level of the femoral epicondyle. Likewise, patellar vectors and 130
points of interest were located in mid-patellar axial image. The PTA was quantified as the acute 131
angle between the vectors defining the patellar posterior-lateral border and the femoral posterior 132
edge (Fig 2C). Next, the lateral, anterior, and superior distance from the patellar origin (Po, the 133
most posterior patellar point) to the femoral origin (Fo, the deepest point in the femoral sulcus) 134
was defined as the LPD, APS, and SIS displacement (Fig 2C,F). For the purpose of this study 135
medial, anterior, and superior were considered positive directions. The BO6 and the PPI
22 were 136
also measured (Fig 2B, E). Lastly, the RF-Q-angle was quantified as the acute angle between two 137
vectors defined by three points (the tibial tuberosity, the anterior-mid-patellar, and the center of 138
RF just superior to the myo-tendinous junction, Fig 2C,D,F). This measure was created 139
previously to be a more precise measure of the clinical Q-angle. The 2D PF alignment measures 140
were redefined relative to the static femoral coordinate system (Fig 2). This effectively rotated 141
all images such that the posterior edge of the femoral condyles (at the level of the epicondylar 142
width) and the vector bisecting the femoral shaft (in the sagittal plane) were aligned with the 143
image right-left and inferior-superior directions, respectively. This was done to reduce errors 144
from slight variations in subject alignment relative to the magnet25
. To account for size variations 145

7
across subjects, LPD, APS, and SIS were scaled by the ratio of the average epicondylar width 146
from a previous control cohort, 76.9 mm28
, to the subject-specific epicondylar width. 147
PF translation (MLK, APK, SIK) and rotation (tilt, flexion, and varus rotation) during 148
active extension, was analytically tracked through integration of the CPC data (Fig 1). The 149
accuracy of tracking skeletal kinematics using CPC data is less than 0.5 mm27,29
(average 150
absolute error). These six kinematic variables were expressed relative to the dynamic femoral 151
anatomical coordinate system (Fig 1)28
, which was defined similiary to its static counterpart. PF 152
orientation (Fig 1) was calculated using a body-fixed xyz-Cardan rotation sequence (flexion, tilt, 153
and varus)30
. All translations were scaled in an identical manner to the static measures. 154
Multiple regression analyses were used to establish predictive models for the PF 155
kinematics. To determine which static variables were appropriate as input to the multiple 156
regression analyses, individual linear regressions between each static and each dynamic variable 157
were evaluated. This was followed by a multiple regression analysis (Enter method, SPSS Inc, 158
Chicago, IL, v19), if multiple static variables demonstrated significant linear regressions to a 159
single dynamic variable. The multiple regression model used only those variables. Based on 160
guidelines for correlations31
, a model with an r2 value of greater than 0.60 was defined as being 161
strongly predictive. The numerous regression models were susceptible to type I error. Therefore, 162
regressions were reported only if they remained significant after their p-values were adjusted 163
using a Bonferroni-type false discovery rate procedure32
. Although the PF kinematics were 164
determined over a large range of motion, the regressions were focused on the PF kinematics from 165
two knee angles (10°, matching the static position, and 20°), both of which could capture the 166
more unstable PF kinematics near full extension. An a priori power analysis determined that 26 167
subjects per cohort were required to determine significant regression between the RF-Q-angle 168
8
and MLK (= 0.05 and =0.80), based on a previous study5. Intraclass correlation coefficients 169
(ICCs), using a two-way mixed effects model, were computed to evaluate intra- and inter-rater 170
repeatability of the static PF alignment measures across 25 knees (randomly selected from both 171
cohorts). The two raters were blinded to each others measures, as well as their original measures. 172
A p-value < 0.05 was considered as significant. 173
174
RESULTS 175
The majority of 3D PF kinematics could be predicted from static MRI measures, but static lateral 176
patellar tilt best predicted its dynamic counterpart (r²-value ranged from 0.59 to 0.69, Fig 3 and 177
Table 2). Multiple regression analyses tended to increase the r²-values (Table 3). This was 178
particularly true for SIK in the PFPS cohort, where r2 increased from 0.38 to 0.77 by adding LPD 179
and RF-Q-angle into the regression. LPD alone could explain 47% (p < 0.001) of the variability 180
(PFPS cohort) in MLK (dynamic lateral shift). This improved to 62% (p<0.001) upon advancing 181
to a multiple regression analysis using both LPD and RF-Q-angle. Varus rotation (PFPS and 182
control cohorts) along with MLK and APK (control cohort) could not be predicted by a single or 183
multiple static variables. 184
The regressions at 20° were typically weaker than at 10º and, thus were not reported. This 185
leads to the likley conclusion that the predictive values worsen with increasing variance between 186
the static and dynamic knee angles. 187
All static MRI measures showed excellent intra- and inter-rater repeatability, with ICCs 188
ranging from 0.95-0.99 (Table 1). The two cohorts were, on average, very well matched with no 189
significant differences in demographics found between cohorts. The MR based knee angle (10.6° 190

9
± 3.3° and 10.8° ± 4.2° in the control and PFPS cohorts, respectively) tended to overestimate the 191
clinical knee angle. 192
193
DISCUSSION 194
Recent breakthroughs in 3D dynamic imaging technologies19,29
have enabled the evaluation of 195
more subtle cases of maltracking6 and the testing of numerous underlying assumptions governing 196
modern PFPS diagnostics and interventions19; 28
. As these 3D dynamic imaging technologies 197
have not been clinically available, an often unstated assumption has been that static imaging can 198
be used as a surrogate for quantifying the dynamic state of the joint under active quadriceps 199
control. The current findings demonstrate that static measures of PF alignment, quantified in 2D 200
images acquired with the knee in full extension, can only predict a portion of the 3D PF 201
kinematics during a loaded volitional task. 202
Although significant linear regressions existed for most kinematic variables, the majority 203
of their variability could not be explained by a single static surrogate. This low predictability is 204
likely due to the fact that the forces on the patella from femoral sulcus begin to lessen as the knee 205
moves into terminal extension. This allows the overall dynamic state of the joint to be more 206
strongly influenced by passive soft tissue and active quadriceps forces in terminal 207
extension6,14,33
. The interaction between the contact, passive soft-tissue, and active quadriceps 208
forces varies across subjects, further reducing the predictability of the dynamic state. For 209
example, a large portion of the unexplained variance in SIK may be attributed to its dependence 210
on the nominal lengths and material properties of the patellar and quadriceps tendons, which can 211
vary greatly across subjects, particularly in PFPS18,34
. 212
The static PTA was the only variable that strongly predicted its dynamic counterpart. 213
This supports a previous study that found strong agreement between excessive lateral tilt 214

10
measured using a clinical exam and measured using 2D static MRI.13
The strong relationship 215
between the static PTA and PF dynamic lateral tilt may indicate that quadriceps activity has 216
minimal effect on patellar tilt during terminal extension. Thus, even though the femoral sulcus 217
influence diminishes in terminal extension, it may remain a controlling force for lateral patellar 218
tilt4. The regression was likely further strengthened by the large range of values for lateral tilt 219
across both cohorts. Yet, this range in value is the likely reason why none of the recent 3D PF 220
kinematics/alignment studies with active quadriceps reported significant differences in tilt 221
between the PFPS and control cohorts18-20
. 222
In a previous study McWalter and colleagues35
found that the value of a single measure 223
of PF joint alignment, acquired statically at 30º flexion with active isometric quadriceps 224
contraction, could not predict the slope (rate of change relative to knee angle) of 3D PF 225
alignment measures acquired statically at various knee flexion angles in a cohort of healthy 226
volunteers. This inability to predict the rate of change PF alignment may be due to the low 227
reliability (0.58-0.59) in measuring slope using the static methodology reported by McWalter 228
and colleagues20
. Although two previous studies18,20
have demonstrated significant differences in 229
the slope of PF alignment/kinematic variables when comparing cohorts of subjects with PF pain 230
to control cohorts, the clinical utility of evaluating slope has not been established. Thus, clinical 231
diagnosis of maltracking remains focused on the value (not slope) of PF aligment/kinematics in 232
terminal extension, as this is where the restraints of the femoral sulcus on the patella are weakest 233
and pathology is typically most evident6,18,36
. 234
Several studies have investigated static joint alignment measures, yet few studies17,37-41
235
have reported the reliability of these measures. The reliability measures from the current study 236
(0.94 – 0.99) were better than previous studies and satisfied the guidline for reasonable clinical 237
validity (ICC>0.90)38
. Only one previous study evaluating patella alta37,40,41
reported “good” 238

11
inter-rater reliabilities (ICC > 0.7538
). The studies measuring patellar tilt and BO reported good 239
reliabilities for measures acquired during active leg extensions (ICC = 0.9017
) and passively 240
(ICC=0.76 for BO and ICC=0.86 for PTA)39
. 241
The primary limitation of this study was that specific static counterparts for dynamic PF 242
flexion and varus rotation were not established, thus the predictability of these dynamic variables 243
remained low. Another possible limitation was that the exercise evaluated was open-chain, 244
whereas PF pain is most often thought to be exacerbated by weight-bearing (closed-chain) 245
activities. Yet, PF pain can be induced during free extension19
, as well as during long term 246
stationary sitting with flexed knees42
. Also, the exercise used in the current study emphasized the 247
conditions of joint instability by requiring a quadriceps force in terminal extension, where the 248
femoral constraints on the patella are at a minimum and pathomechanics are most evident. Based 249
on the work of Hungeford43
, this required quadriceps force in terminal extension was likely 250
greater than that required at or near full extension in previous studies evaluating PF kinematics 251
during free squats19,44
. Regardless, this study clearly demonstrated the robustness of using 252
specific static variables, such as the patellar tilt angle, to predict PF joint motion. Future studies 253
should examine additional static surrogates for improved prediction. 254
In conclusion, static PF joint assessment cannot fully represent the dynamic state of this 255
joint and using such static measures for diagnosis would likely produce false negative 256
diagnoses7,15,17
. This makes it imperitave that the current precise, accurate, 3D, dynamic imaging 257
techniques be . 258
259
ACKNOWLEDGEMENTS 260
This research was supported by Biomedical Engineering Summer Internship Program (BESIP), 261
the Intramural Research Program of the NIH, and the Clinical Center at the NIH. Special thanks 262

12
is given to S. Sadeghi, AJ Behnam, C. Zampieri-Gallagher, TJ Brindle, CY Shieh, B. Damaska, 263
and the Diagnostic Radiology Department at the NIH for their support and research time. 264
265
REFERENCES 266
1. Boling M, Padua D, Marshall S, et al. 2009. Gender differences in the incidence and 267
prevalence of patellofemoral pain syndrome. Scand J Med Sci Sports. 268
2. Amis AA. 2007. Current concepts on anatomy and biomechanics of patellar stability. Sports 269
Med Arthrosc 15: 48-56. 270
3. Keser S, Savranlar A, Bayar A, et al. 2008. Is there a relationship between anterior knee pain 271
and femoral trochlear dysplasia? Assessment of lateral trochlear inclination by magnetic 272
resonance imaging. Knee Surg Sports Traumatol Arthrosc 16: 911-915. 273
4. Harbaugh CM, Wilson NA, Sheehan FT. 2010. Correlating femoral shape with patellar 274
kinematics in patients with patellofemoral pain. J Orthop Res 28: 865-872. 275
5. Sheehan FT, Derasari A, Fine KM, et al. 2010. Q-angle and J-sign: indicative of maltracking 276
subgroups in patellofemoral pain. Clin Orthop Relat Res 468: 266-275. 277
6. Brossmann J, Muhle C, Schroder C, et al. 1993. Patellar tracking patterns during active and 278
passive knee extension: evaluation with motion-triggered cine MR imaging. Radiology 187: 279
205-212. 280
7. Biedert RM, Sanchis-Alfonso V. 2002. Sources of anterior knee pain. Clin Sports Med 21: 281
335-347, vii. 282
8. Farrokhi S, Keyak JH, Powers CM. 2011. Individuals with patellofemoral pain exhibit 283
greater patellofemoral joint stress: a finite element analysis study. Osteoarthritis Cartilage 19: 284
287-294. 285

13
9. Laurin CA, Levesque HP, Dussault R, et al. 1978. The abnormal lateral patellofemoral angle: 286
a diagnostic roentgenographic sign of recurrent patellar subluxation. J Bone Joint Surg Am 287
60: 55-60. 288
10. Merchant AC, Mercer RL, Jacobsen RH, Cool CR. 1974. Roentgenographic analysis of 289
patellofemoral congruence. J Bone Joint Surg Am 56: 1391-1396. 290
11. Walker C, Cassar-Pullicino VN, Vaisha R, McCall IW. 1993. The patello-femoral joint--a 291
critical appraisal of its geometric assessment utilizing conventional axial radiography and 292
computed arthro-tomography. Br J Radiol 66: 755-761. 293
12. Hunter DJ, Zhang YQ, Niu JB, et al. 2007. Patella malalignment, pain and patellofemoral 294
progression: the Health ABC Study. Osteoarthritis Cartilage 15: 1120-1127. 295
13. Grelsamer RP, Weinstein CH, Gould J, Dubey A. 2008. Patellar tilt: the physical 296
examination correlates with MR imaging. Knee 15: 3-8. 297
14. Sasaki T, Yagi T. 1986. Subluxation of the patella. Investigation by computerized 298
tomography. Int Orthop 10: 115-120. 299
15. Conway WF, Hayes CW, Loughran T, et al. 1991. Cross-sectional imaging of the 300
patellofemoral joint and surrounding structures. Radiographics 11: 195-217. 301
16. Stanford W, Phelan J, Kathol MH, et al. 1988. Patellofemoral joint motion: evaluation by 302
ultrafast computed tomography. Skeletal Radiol 17: 487-492. 303
17. Ward SR, Shellock FG, Terk MR, et al. 2002. Assessment of patellofemoral relationships 304
using kinematic MRI: comparison between qualitative and quantitative methods. J Magn 305
Reson Imaging 16: 69-74. 306
18. Sheehan FT, Derasari A, Brindle TJ, Alter KE. 2009. Understanding patellofemoral pain 307
with maltracking in the presence of joint laxity: complete 3D in vivo patellofemoral and 308
tibiofemoral kinematics. J Orthop Res 27: 561-570. 309

14
19. Wilson NA, Press JM, Koh JL, et al. 2009. In vivo noninvasive evaluation of abnormal 310
patellar tracking during squatting in patients with patellofemoral pain. J Bone Joint Surg Am 311
91: 558-566. 312
20. MacIntyre NJ, Hill NA, Fellows RA, et al. 2006. Patellofemoral joint kinematics in 313
individuals with and without patellofemoral pain syndrome. J Bone Joint Surg Am 88: 2596-314
2605. 315
21. Insall J, Goldberg V, Salvati E. 1972. Recurrent dislocation and the high-riding patella. Clin 316
Orthop Relat Res 88: 67-69. 317
22. Ali SA, Helmer R, Terk MR. 2009. Patella alta: lack of correlation between patellotrochlear 318
cartilage congruence and commonly used patellar height ratios. AJR Am J Roentgenol 193: 319
1361-1366. 320
23. Ward SR, Terk MR, Powers CM. 2007. Patella alta: association with patellofemoral 321
alignment and changes in contact area during weight-bearing. J Bone Joint Surg Am 89: 322
1749-1755. 323
24. Sheehan FT, Babushkina A, Alter KE. 2012. Kinematic determinants of anterior knee pain in 324
cerebral palsy: a case-control study. Arch Phys Med Rehabil 93: 1431-1440. 325
25. Shibanuma N, Sheehan FT, Stanhope SJ. 2005. Limb positioning is critical for defining 326
patellofemoral alignment and femoral shape. Clin Orthop Relat Res: 198-206. 327
26. Powers CM, Bolgla LA, Callaghan M, et al. 2012. Patellofemoral pain: proximal, distal, and 328
local factors, 2nd international research retreat. J Orthop Sports Phys Ther 42: A1-A54. 329
27. Behnam AJ, Herzka DA, Sheehan FT. 2011. Assessing the accuracy and precision of 330
musculoskeletal motion tracking using cine-PC MRI on a 3.0T platform. J Biomech 44: 193-331
197. 332

15
28. Seisler AR, Sheehan FT. 2007. Normative three-dimensional patellofemoral and tibiofemoral 333
kinematics: a dynamic, in vivo study. IEEE Trans Biomed Eng 54: 1333-1341. 334
29. Sheehan FT, Zajac FE, Drace JE. 1998. Using cine phase contrast magnetic resonance 335
imaging to non-invasively study in vivo knee dynamics. J Biomech 31: 21-26. 336
30. Sheehan FT, Mitiguy P. 1999. In regards to the "ISB recommendations for standardization in 337
the reporting of kinematic data". J Biomech 32: 1135-1136. 338
31. Hebel JR, McCarter RJ. 2012. Correlations. In, A study guide to epidemiology and 339
biostatistics, 7th ed. Sudbury, Mass.: Jones & Bartlett Learning, p. 90. 340
32. Benjamini Y, Hochber Y. 1995. Controlling the False Discovery Rate: a Practical and 341
Powerful Approach to Mulitple Testing 57: 289-300. 342
33. Guzzanti V, Gigante A, Di Lazzaro A, Fabbriciani C. 1994. Patellofemoral malalignment in 343
adolescents. Computerized tomographic assessment with or without quadriceps contraction. 344
Am J Sports Med 22: 55-60. 345
34. Witvrouw E, Lysens R, Bellemans J, et al. 2000. Intrinsic risk factors for the development of 346
anterior knee pain in an athletic population. A two-year prospective study. Am J Sports Med 347
28: 480-489. 348
35. McWalter EJ, Macintyre NJ, Cibere J, Wilson DR. 2010. A single measure of patellar 349
kinematics is an inadequate surrogate marker for patterns of three-dimensional kinematics in 350
healthy knees. Knee 17: 135-140. 351
36. Heegaard J, Leyvraz PF, Van Kampen A, et al. 1994. Influence of soft structures on patellar 352
three-dimensional tracking. Clin Orthop Relat Res: 235-243. 353
37. Biedert RM, Albrecht S. 2006. The patellotrochlear index: a new index for assessing patellar 354
height. Knee Surg Sports Traumatol Arthrosc 14: 707-712. 355

16
38. Portney L, Watkins M. 2009. Statistical Measures of Reliability. In, Foundations of Clinical 356
Research Applications to Practice. 357
39. Jan MH, Lin DH, Lin CH, et al. 2009. The effects of quadriceps contraction on different 358
patellofemoral alignment subtypes: an axial computed tomography study. J Orthop Sports 359
Phys Ther 39: 264-269. 360
40. Davies AP, Costa ML, Shepstone L, et al. 2000. The sulcus angle and malalignment of the 361
extensor mechanism of the knee. J Bone Joint Surg Br 82: 1162-1166. 362
41. Seil R, Muller B, Georg T, et al. 2000. Reliability and interobserver variability in 363
radiological patellar height ratios. Knee Surg Sports Traumatol Arthrosc 8: 231-236. 364
42. Kujala UM, Jaakkola LH, Koskinen SK, et al. 1993. Scoring of patellofemoral disorders. 365
Arthroscopy 9: 159-163. 366
43. Hungerford DS, Barry M. 1979. Biomechanics of the patellofemoral joint. Clin Orthop Relat 367
Res 144: 9-15. 368
44. Powers CM, Ward SR, Fredericson M, et al. 2003. Patellofemoral kinematics during weight-369
bearing and non-weight-bearing knee extension in persons with lateral subluxation of the 370
patella: a preliminary study. J Orthop Sports Phys Ther 33: 677-685. 371
45. Schutzer SF, Ramsby GR, Fulkerson JP. 1986. Computed tomographic classification of 372
patellofemoral pain patients. Orthop Clin North Am 17: 235-248. 373
374
375
376
17
FIGURE LEGENDS 377
378
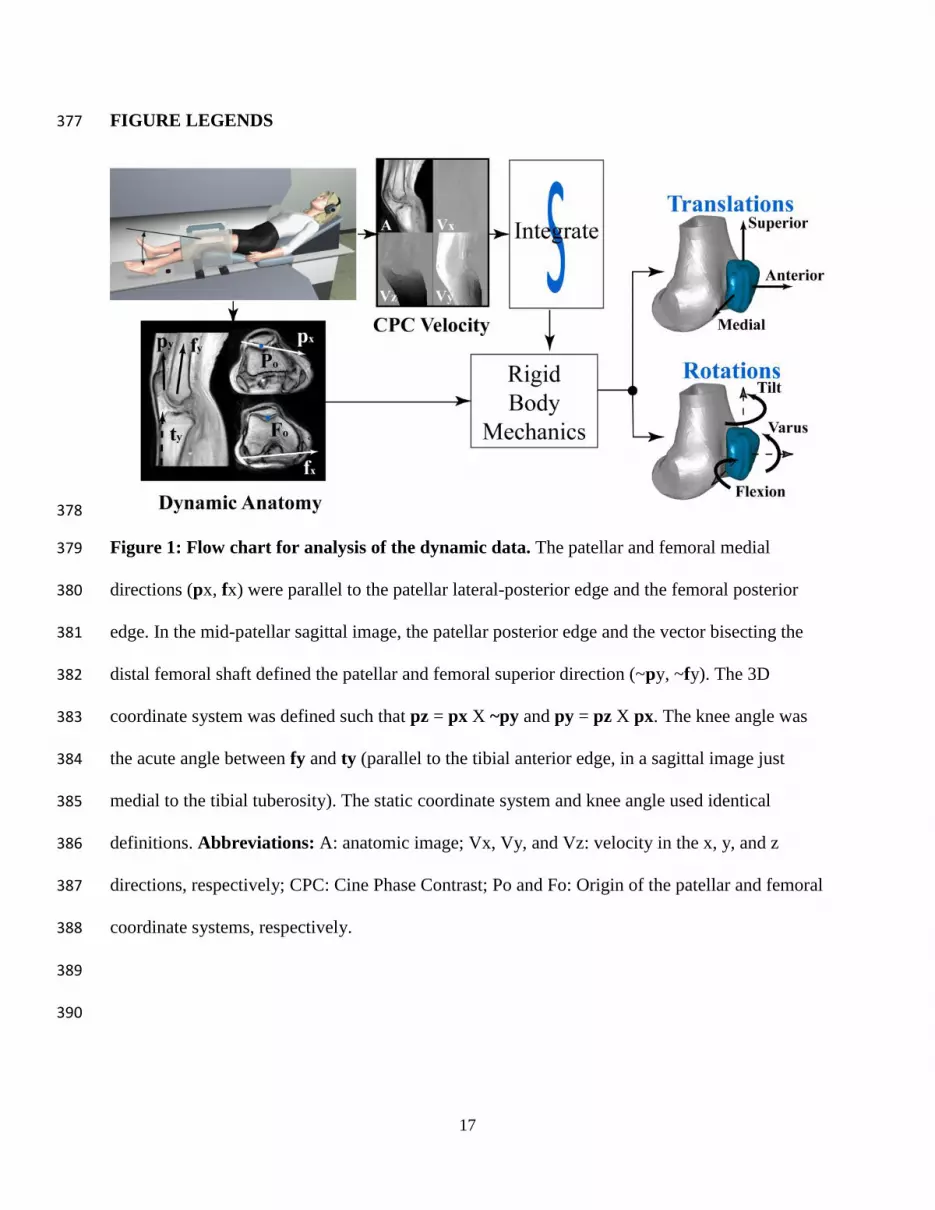
Figure 1: Flow chart for analysis of the dynamic data. The patellar and femoral medial 379
directions (px, fx) were parallel to the patellar lateral-posterior edge and the femoral posterior 380
edge. In the mid-patellar sagittal image, the patellar posterior edge and the vector bisecting the 381
distal femoral shaft defined the patellar and femoral superior direction (~py, ~fy). The 3D 382
coordinate system was defined such that pz = px X ~py and py = pz X px. The knee angle was 383
the acute angle between fy and ty (parallel to the tibial anterior edge, in a sagittal image just 384
medial to the tibial tuberosity). The static coordinate system and knee angle used identical 385
definitions. Abbreviations: A: anatomic image; Vx, Vy, and Vz: velocity in the x, y, and z 386
directions, respectively; CPC: Cine Phase Contrast; Po and Fo: Origin of the patellar and femoral 387
coordinate systems, respectively. 388
389
390

18
391
Figure 2: Static Magnetic Resonance Imaging-based Measures of Patellofemoral 392
Alignment. A) fx = the femoral medial direction, which was defined by the most posterior points 393
on the medial and lateral condyles at the level of the epicondylar width. B) BO = bisect offset; 394
fx* a representation of the femoral medial axis as defined in A; and = the shortest distance 395
from the most medial and lateral patellar points, respectively, to a line perpendicular to fx that 396
passes through Fo, propagated to the mid-patellar plane. C) PTA = patellar tilt angle; Po and Fo 397
= origin of the patellar and femoral coordinate systems; px = the patellar medial direction; Pa = 398
anterior patella. D) RF = rectus femoris. E) PPI = patellophyseal index; PC = length of patellar 399
articular cartilage; PHY = height of patella above anterior physeal line. F) AP = 400
anterior/posterior distance; SI = superior/inferior distance; Po* - a representation of Po, which is 401
defined in C; TT= tibial tuberosity. 402
403

19
404
Figure 3: Example Linear Regression Plots for the Patellofemoral Pain Syndrome Cohort. 405
Control averages for the dynamic variables are provided with a dotted line. Abbreviations: PTA: 406
patellar tilt angle; ML= the medial-lateral location of the patellar origin relative to the femoral 407
origin; LPD= lateral patellar displacement; deg= degree; mm= millimeter; r2= coefficients of 408
determination. 409
410

20
TABLES 411
Parameter PTA BO LPD SIs APs RF Q-angle
Inter 0.995 0.985 0.979 0.990 0.948 0.985
Intra 0.993 0.980 0.968 0.992 0.953 0.989
Table 1: Intraclass Correlation Coefficients for static Magnetic Resonance Imaging-based 412
Surrogates. 413
Abbreviations: PTA= patellar tilt angle; BO= Bisect Offset; LPD, APS and SIS= The medial-414
lateral, anterior-posterior, and superior-inferior location of the patellar origin relative to the 415
femoral origin (static); RF-Q angle= The rectus femoris quadriceps angle. 416
417

21
All C PFPS All C PFPS All C PFPS
Translations MLK SI K AP K
BO 0.27**
0.32
LPD 0.32**
0.47** 0.22**
0.43**
APS
0.18
SIS
0.43** 0.48** 0.38**
PPI
0.28** 0.36** 0.26**
PTA 0.23**
0.31
RF-Q 0.19
0.35
0.30
Rotations Flexion Tilt Varus
BO 0.49** 0.27 0.54**
LPD 0.23** 0.29
APS
SI S 0.26** 0.42*
PPI 0.23** 0.41*
PTA 0.69** 0.59** 0.68** 0.17
RF-Q 0.16 0.37
418
Table 2: Coefficients of determination (r2) for the control (C), patellofemoral pain 419
syndrome (PFPS), and combined (All) cohorts **Indicates p < 0.001, otherwise p < 0.05. 420
Nonsignificant regressions are not shown. For the full regression equations, see supplemental 421 material. Abbreviations: BO = Bisect Offset; LPD, APS, and SIS = The static medial-lateral, 422
anterior-posterior, and superior-inferior location of the patellar origin relative to the femoral 423 origin (static); PPI = patellophyseal index; PTA = patellar tilt angle; RF-Q angle = The rectus 424
femoris quadriceps angle; MLK, SIK, APK = The medial-lateral, superior-inferior, and anterior-425 posterior location of the patellar origin relative to the femoral origin, measured during active 426 extension at 10° knee angle. 427
428

22
429
430
431
Table 3: Multiple Regression Equations. Multiple Regressions listed if it increased the 432
predictability more than 5 percentage points from the linear regression. Abbreviations: MLK, 433 SIK, APK = The medial-lateral, superior-inferior, and anterior-posterior location of the patellar 434 origin relative to the femoral origin measured during active extension at 10° knee angle; LPD, 435
APS, and SIS = the static medial-lateral, anterior-posterior, and superior-inferior location of the 436 patellar origin relative to the femoral origin; PTA = patellar tilt angle; RF-Q angle = The rectus 437
femoris quadriceps angle. 438
Dynamic Variable Multiple Regressions R² p- value
All
MLK = -4.61 + 0.61*LPD -0.15*PTA 0.38 <0.001
SIK = 13.48 -0.62*SIS -0.38*LPD-0.14*RF_Q 0.53 <0.001
Flexion = 8.435 – 0.40*SIS -0.57*PAS 0.36 <0.001
PFPS Cohort
MLK = -4.14 + 1.52*LPD -0.13*RF_Q 0.62 <0.000
APK = 2.34 -0.50*APS -0.001*RF_Q 0.38 0.001
SIK = 16.80 + 0.51*SIS -1.45*LPD +0.15*RF_Q 0.77 <0.001
Flexion = 7.553 -0.307*SIS -0.540*APS 0.32 0.003
Control Cohort
Flexion = 20.816 -0.514*SIS -0.383*PTA 0.65 <0.001


