Embed Size (px)
Citation preview
Stratification of patellofemoral pain using clinical, biomechanical and imaging features
Benjamin Timothy Drew
Submitted in accordance with the requirements for the degree of
Doctor of Philosophy
Leeds Institute of Rheumatic and Musculoskeletal Medicine,
School of Medicine,
The University of Leeds
January 2018

ii
Intellectual Property and Publication Statements
The candidate confirms that the work submitted is his own, except where work which has
formed part of jointly authored publications has been included. The contribution of the
candidate and the other authors to this work has been explicitly indicated below. The
candidate confirms that appropriate credit has been given within the thesis where reference
has been made to the work of others.
This copy has been supplied on the understanding that it is copyright material and that no
quotation from the thesis may be published without proper acknowledgement.
The right of Benjamin Timothy Drew to be identified as Author of this work has been
asserted by him in accordance with the Copyright, Designs and Patents Act 1988.
© 2018 The University of Leeds and Benjamin Drew

iii
Acknowledgements
There are many people who have made this thesis possible. Firstly and foremost, I would
like to acknowledge the importance of my supervisors in undertaking this project. Both
Professor Philip Conaghan and Professor Anthony Redmond were invaluable in me securing
the research grant enabling me to complete my doctorate. Over the four years, they have
provided unwavering enthusiasm and dedication to my research. The time assisting me in
building collaborative relationships and passing on clinical research knowledge has been
priceless. Philip and Tony have not only been a first-rate team but have been great role
models for how to be a successful academic leader. I am eternally grateful for their support.
I would also particularly like to thank the following for their help in the academic development
of this work:
• Dr. Toby Smith for his guidance, support and expertise on the patellofemoral joint.
Without Toby’s early support in my academic career I would have never been in position
to secure such a prestigious research grant.
• Professor James Selfe for providing essential mentorship and knowledge on the subject
of patellofemoral pain.
• Dr. Michael Bowes and Imorphics ™ for developing the novel 3D measures and sharing
their technical expertise to make this possible.
• Dr. Elizabeth Hensor and Bright Dube for all their statistical support and expert input.
• Dr. David Lunn and Dr. Graham Chapman for their support and troubleshooting of all my
gait analysis work.
• National Institute for Health Research (NIHR) who funded all the projects through my
Clinical Doctoral Research Fellowship (CDRF) (CDRF-2013-04-044).
Finally I would like to thank the following people for their personal support of this work:
• My wife Rebecca, for her love, belief and patience in undertaking this thesis, particularly
during the birth of our beautiful son, Alastair, in the last year of my doctorate.
• My parents, Tim and Pauline, for their enduring confidence in me to succeed at anything
I put my mind to.

iv
Co-author contribution
This research has been carried out by a team with my own contributions and the
contributions of the other members explicitly indicated below:
Chapter 3 - Which patellofemoral joint imaging features are associated with patellofemoral pain? Systematic review and meta-analysis
BD carried out the conception and design of the study with supervision of AR, TS and PC.
BD and FP conducted the collection and assembly of the data with any discordance resolved
by TS. All the authors (BD, AR, FP, TS and PC) contributed to the analysis and
interpretation of the data. BD drafted the chapter and all the authors revised the chapter. BD
takes the responsibility for the integrity of the work as a whole from inception to the finished
chapter.
Chapter 4 - Patellofemoral joint morphology of middle aged people with patellofemoral pain measured using 3D MRI quantitative technology: data from the Osteoarthritis Initiative
BD, MB and PC conceived the idea and design of the study with support from AR, SK and
BDu. BD collected and assembled the data with statistical support from BDu and technical
support from MB. All authors (BD, MB, AR, BDu, SK and PC) contributed to the analysis and
interpretation of the data. BD drafted the chapter and all the authors revised the chapter. BD
takes the responsibility for the integrity of the work as a whole from inception to the finished
chapter.
Chapter 5 - The development of data-derived subgroups in patellofemoral pain using modifiable clinical, biomechanical and imaging features
BD, AR, TS, PC and JS all contributed to the conception and design of the study with
statistical support from EH and BDu. BD collected and assembled the data with statistical
support from EH and BDu and technical support from AG and AR. All authors (BD, AR JS,
TS, AG, EH, BDu, AG and PC) analysed and interpreted the data. BD drafted the chapter
with statistical support from EH and BDu and all the other authors (JS, TS, AG, AR and PC)
revised the chapter for content. BD takes the responsibility for the integrity of the work as a
whole from inception to the finished chapter.

v
Chapter 6 - The effect of targeted treatment on people with patellofemoral pain: a pragmatic randomised controlled feasibility study
The conception and design of the study was conducted by BD and AR with support from JS,
TS and PC. BD collected and assembled the data with support from AR and PC. All authors
(BD, PC, JS, TS and AR) analysed and interpreted the data. BD drafted the chapter and all
the authors revised the chapter. BD takes the responsibility for the integrity of the work as a
whole from inception to the finished chapter.
vi
List of publications / presentations arising from the thesis
Original articles
• Drew BT, Redmond AC, Smith TO, Penny F, Conaghan PG. (2015). Which
patellofemoral joint imaging features are associated with patellofemoral pain?
Systematic review and meta-analysis. Osteoarthritis and Cartilage. 24 (2), 224-236.
• Drew BT, Conaghan PG, Smith TO, Selfe J, Redmond AC. (2017). The effect of
targeted treatment on people with patellofemoral pain: a pragmatic, randomised
controlled feasibility study. BMC Musculoskeletal Disorders. 18 (1), 338.
• Drew BT, Bowes MA, Redmond AC, Dube B, Kingsbury S, Conaghan PG. (2017).
Patellofemoral morphology is not related to pain when using 3D quantitative analysis:
data from the Osteoarthritis Initiative. Rheumatology. 56 (12), 2135-2144.
Conference oral presentations
• Drew BT, Redmond AC, Smith TO, Penny F, Conaghan PG. Which patellofemoral
joint imaging features are associated with patellofemoral pain? Systematic review
and meta-analysis. International Patellofemoral Pain Research Retreat, September
2015.
• Drew BT, Redmond AC, Smith TO, Penny F, Conaghan PG. Which patellofemoral
joint imaging features are associated with patellofemoral pain? Systematic review
and meta-analysis. Physio UK 2015 Conference, October 2015.
• Drew BT, Redmond AC, Smith TO, Penny F, Conaghan PG. Which patellofemoral
joint imaging features are associated with patellofemoral pain? Systematic review
and meta-analysis. AR UK Sports, Exercise & Osteoarthritis Conference 2015,
December 2015 - Highly Commended Oral Presentation prize.
vii
Conference Poster presentations
• Drew BT, Redmond AC, Conaghan PG. StrOPP: Stratification of patellofemoral pain
using clinical, biomechanical and imaging features. AR UK Sports, Exercise &
Osteoarthritis Conference 2014, December 2014.
• Drew BT, Conaghan PG, Smith TO, Selfe J, Redmond AC. Targeted treatment for
young people with knee pain. NIHR Annual Trainee Conference 2016, December
2016.
• Drew BT, Conaghan PG, Smith TO, Selfe J, Redmond AC. Targeted treatment for
young people with knee pain. Annual Postgraduate Research Symposium, April
2017.
• Drew BT, Bowes MA, Redmond AC, Dube B, Kingsbury S, Conaghan PG.
Patellofemoral bone morphology is related to gender but not pain: 3D quantitative
data analysis from OAI. Osteoarthritis Research Society International (OARSI) 2017,
April 2017.
• Drew BT, Bowes MA, Redmond AC, Dube B, Kingsbury S, Conaghan PG.
Patellofemoral bone morphology is not associated to pain using 3D quantitative
analysis: data from the OAI. 4th British Association of Sport & Exercise Medicine
Annual Conference, October 2017.
viii
Abstract
Patellofemoral pain (PFP) is a common musculoskeletal complaint and the efficacy of
current therapies aimed at PFP is limited. The aetiology of PFP is widely considered to be
multifactorial and as a result the clinical presentation is often heterogeneous. In an attempt
to address this issue, an international PFP consensus statement, published in 2013,
highlighted the need to sub-group patients with PFP to enable more stratified interventions.
A multi-methodological approach was used in this thesis. A systematic review of the existing
imaging literature in PFP demonstrated that PFP is associated with a number of imaging
features in particular MRI bisect offset and CT congruence angle and that some of these
features should be modifiable with conservative treatment. A retrospective analysis
investigating the overall 3D shape and 3D equivalents of commonly used PFJ imaging
features demonstrated no differences between a group with and without PFP, challenging
the current perceptions on the structural associations to PFP. A cross-sectional cluster
analysis using modifiable clinical, biomechanical and imaging features identified four
subgroups that are present in PFP cohort with a Weak group showing the worst prognosis at
12 months. Lastly, a pragmatic randomised controlled feasibility study comparing matched
treatment to usual care management showed that matching treatment to a specific subgroup
is feasible in terms of adherence, retention and conversion to consent.
In summary, the findings of this thesis improves our understanding of the structural
associations to PFP; the subgroups that exist within the PFP population; the natural
prognosis of these PFP subgroups; and the feasibility of targeting treatment at PFP
subgroups within a clinical trial.
Benjamin Drew January 2018
ix
Table of Contents
Intellectual Property and Publication Statements ................................................ ii
Acknowledgements ................................................................................................ iii
List of publications / presentations arising from the thesis .............................. vi
Abstract ................................................................................................................. viii
Table of Contents ................................................................................................... ix
List of Tables ......................................................................................................... xv
List of Figures ...................................................................................................... xvii
List of Abbreviations ............................................................................................ xix
Chapter 1 - Introduction .......................................................................................... 1
1.1 Background ................................................................................................ 1
1.2 Aims & objectives ....................................................................................... 2
1.3 Thesis structure & overview ....................................................................... 3
Chapter 2 - Literature review .................................................................................. 5
2.1 Definition ..................................................................................................... 5
2.2 Terminology ................................................................................................ 6
2.3 Natural History/ Epidemiology .................................................................... 7
2.3.1 Natural history of PFP ...................................................................... 7
2.3.2 Link between PFP and PFOA .......................................................... 8
2.3.3 Prevalence and incidence of PFP .................................................... 8
2.3.4 Health economics ............................................................................. 9
2.3.5 Risk factors ..................................................................................... 10
2.4 Aetiology ................................................................................................... 13
2.4.1 Subchondral bone .......................................................................... 13
2.4.2 Homeostasis ................................................................................... 15
2.4.3 Lateral retinaculum ......................................................................... 16
2.4.4 Infrapatellar fat pad ........................................................................ 17
2.4.5 Synovium ........................................................................................ 18
2.4.6 Sensory dysfunction ....................................................................... 19
2.4.7 Vascular dysfunction ...................................................................... 20
2.4.8 Proprioceptive dysfunction ............................................................. 20
2.4.9 Psychosocial dysfunction ............................................................... 21
2.4.10 Link between PFP aetiology and stratification ................................ 22
x
2.5 Clinical examination .................................................................................. 23
2.5.1 Clinical history ................................................................................ 23
2.5.2 Objective examination .................................................................... 24
2.6 Patient reported outcome measures ........................................................ 25
2.7 Imaging ..................................................................................................... 29
2.7.1 Patella malalignment ...................................................................... 29
2.7.2 Patellofemoral joint stress .............................................................. 32
2.7.3 Patellofemoral contact area ............................................................ 35
2.7.4 Cartilage thickness ......................................................................... 36
2.7.5 Quantitative MRI ............................................................................. 37
2.7.6 Kinematic MRI ................................................................................ 37
2.7.7 Link between PFP imaging and stratification ................................. 38
2.8 Biomechanics ........................................................................................... 38
2.8.1 Hip biomechanics ........................................................................... 38
2.8.2 Knee biomechanics ........................................................................ 40
2.8.3 Foot & Ankle biomechanics ............................................................ 44
2.8.4 Link between PFP biomechanics and stratification ........................ 46
2.9 Interventions ............................................................................................. 47
2.9.1 Hip targeted interventions .............................................................. 47
2.9.2 Knee targeted interventions ........................................................... 49
2.9.3 Taping ............................................................................................ 52
2.9.4 Knee orthoses ................................................................................ 54
2.9.5 Foot orthoses ................................................................................. 56
2.9.6 Link between PFP interventions and stratification .......................... 58
2.10 Stratification & subgrouping ...................................................................... 59
2.10.1 Diagnostic subgroups ..................................................................... 62
2.10.2 Treatment effect modifier subgroups .............................................. 67
2.10.3 Prognostic factor subgroups ........................................................... 69
2.10.4 Which stratification approach? ....................................................... 69
2.10.5 Summary ........................................................................................ 70
Chapter 3 - Which patellofemoral joint imaging features are associated with patellofemoral pain? Systematic review and meta-analysis .................... 71
3.1 Introduction ............................................................................................... 71
3.2 Aims .......................................................................................................... 72
3.3 Methods .................................................................................................... 72
xi
3.3.1 Protocol and registration ................................................................ 72
3.3.2 Search strategy and study selection .............................................. 72
3.3.3 Eligibility criteria .............................................................................. 74
3.3.4 Quality assessment ........................................................................ 74
3.3.5 Data analysis .................................................................................. 77
3.4 Results ...................................................................................................... 78
3.4.1 Study selection ............................................................................... 78
3.4.2 Study characteristics ...................................................................... 80
3.4.3 Quality assessment ...................................................................... 106
3.4.4 Synthesis of results ...................................................................... 111
3.4.5 Magnetic Resonance Imaging ...................................................... 115
3.4.6 Ultrasound .................................................................................... 117
3.4.7 Computed Tomography ................................................................ 117
3.4.8 X-ray ............................................................................................. 117
3.4.9 Sensitivity analysis ....................................................................... 118
3.5 Discussion .............................................................................................. 120
3.6 Limitations of the current review ............................................................. 122
3.7 Conclusion .............................................................................................. 123
Chapter 4 - Patellofemoral joint morphology in middle-aged people with patellofemoral pain measured using 3D quantitative analysis: data from the Osteoarthritis Initiative ........................................................................ 124
4.1 Introduction ............................................................................................. 124
4.2 Aims ........................................................................................................ 125
4.3 Methods .................................................................................................. 126
4.3.1 Summary of the Osteoarthritis Initiative (OAI) .............................. 126
4.3.2 Setting .......................................................................................... 127
4.3.3 Participants ................................................................................... 127
4.3.4 An overview of Active Appearance Modelling .............................. 128
4.3.5 Data sources ................................................................................ 130
4.3.6 Variables ...................................................................................... 132
4.4 Statistical analysis .................................................................................. 138
4.4.1 Multiple testing ............................................................................. 138
4.4.2 Controlling for confounders .......................................................... 138
4.4.3 Logistic regression models ........................................................... 139
4.4.4 Linear discriminant analysis ......................................................... 144
xii
4.5 Results .................................................................................................... 145
4.5.1 Primary aim .................................................................................. 145
4.5.2 Secondary aim ............................................................................. 148
4.5.3 Assessing the accuracy of the model ........................................... 148
4.6 Discussion .............................................................................................. 149
4.6.1 Limitations .................................................................................... 151
4.7 Conclusion .............................................................................................. 152
Chapter 5 - The development of data-driven diagnostic subgroups for people with patellofemoral pain using modifiable clinical, biomechanical and imaging features ......................................................................................... 153
5.1 Introduction ............................................................................................. 153
5.2 Aims ........................................................................................................ 154
5.3 Methods .................................................................................................. 154
5.3.1 Study design ................................................................................. 154
5.3.2 Selection of the sample size ......................................................... 156
5.3.3 Setting .......................................................................................... 156
5.3.4 Participants ................................................................................... 156
5.3.5 Variables ...................................................................................... 157
5.3.6 Justification for selected variables ................................................ 157
5.3.7 Data sources ................................................................................ 165
5.3.8 Clinical assessment ...................................................................... 167
5.3.9 Biomechanical assessment .......................................................... 170
5.3.10 MRI assessment ........................................................................... 174
5.3.11 Statistical analysis ........................................................................ 175
5.3.12 Summary of the SPSSTwoStep cluster analysis .......................... 176
5.3.13 Multiple imputation ....................................................................... 181
5.4 Results .................................................................................................... 182
5.4.1 Participants ................................................................................... 182
5.4.2 Stability and profiling of the clusters ............................................. 183
5.4.3 Prognosis of subgroups ................................................................ 196
5.4.4 Determining a favourable outcome .............................................. 197
5.5 Discussion .............................................................................................. 198
5.5.1 Clinical Implications ...................................................................... 200
5.5.2 Limitations .................................................................................... 201
5.6 Conclusions ............................................................................................ 202
xiii
Chapter 6 - The effect of targeted treatment on people with patellofemoral pain: a pragmatic, randomised controlled feasibility study ................... 204
6.1 Introduction ............................................................................................. 204
6.2 Aims ........................................................................................................ 205
6.3 Methods .................................................................................................. 205
6.3.1 Study design ................................................................................. 205
6.3.2 Justification of feasibility methodology ......................................... 206
6.3.3 Participants ................................................................................... 207
6.3.4 Sample size .................................................................................. 208
6.3.5 Randomisation ............................................................................. 208
6.3.6 Blinding ......................................................................................... 208
6.3.7 Interventions ................................................................................. 208
6.3.8 Outcomes ..................................................................................... 212
6.3.9 Statistical methods ....................................................................... 215
6.4 Results .................................................................................................... 216
6.4.1 Feasibility outcomes ..................................................................... 216
6.4.2 Mechanistic outcomes .................................................................. 222
6.5 Discussion .............................................................................................. 225
6.5.1 Feasibility outcomes ..................................................................... 225
6.5.2 Mechanistic outcomes .................................................................. 226
6.5.3 Limitations .................................................................................... 228
6.6 Conclusion .............................................................................................. 230
Chapter 7 - Discussion, future directions and conclusions ............................ 231
7.1 Thesis synopsis ...................................................................................... 231
7.1.1 Overall summary .......................................................................... 233
7.2 Thesis discussion ................................................................................... 234
7.2.1 Imaging in PFP ............................................................................. 234
7.2.2 Subgrouping in PFP ..................................................................... 235
7.2.3 Prognosis of PFP subgroups ........................................................ 236
7.2.4 Stratifying treatment in PFP ......................................................... 237
7.2.5 Study design in PFP studies ........................................................ 238
7.3 Limitations of the current work ................................................................ 239
7.3.1 Sample size .................................................................................. 239
7.3.2 Treatment duration ....................................................................... 240
7.3.3 Non-weight bearing MRI ............................................................... 240
xiv
7.3.4 Marker based motion capture ....................................................... 241
7.4 Directions for Future Research ............................................................... 241
7.4.1 Imaging in PFP ............................................................................. 241
7.4.2 Link between PFP and PFOA ...................................................... 242
7.4.3 Subgrouping in PFP ..................................................................... 243
7.4.4 Mechanism of action for PFP interventions .................................. 243
7.4.5 Stratified PFP interventions .......................................................... 244
7.5 Addressing the central hypothesis .......................................................... 244
7.6 Conclusion .............................................................................................. 245
References ........................................................................................................... 246
xv
List of Tables
Table 2.1: Definitions of PFP .............................................................................. 5Table 2.2: Risk factors for the development of PFP ...................................... 11Table 2.3: Psychometric properties of patient reported outcomes .............. 27Table 2.4: Bisect offset assessment methods ................................................ 30Table 2.5: Patella tilt assessment methods .................................................... 31Table 2.6: Predictors of poor response to multimodal treatment ................. 51Table 2.7: Predictors of response to foot orthoses ....................................... 58Table 2.8: Definitions for stratified medicine .................................................. 60Table 2.9: Classification systems of PFP ........................................................ 64Table 3.1: An example search strategy from Medline .................................... 73Table 3.2: Modified Downs & Black Checklist ................................................ 76Table 3.3: Best Evidence Synthesis [396] ....................................................... 78Table 3.4: Sample sizes and population characteristics for each paper ..... 81Table 3.5: Imaging methods, outcome measures and results ...................... 85Table 3.6: Quality assessment ....................................................................... 107Table 3.7: Result of the meta-analysis .......................................................... 113Table 4.1: MRI sequences used in the OAI ................................................... 127Table 4.2: 3D imaging features ...................................................................... 134Table 4.3: Correlation of retained variables medial and lateral patella facet
area ................................................................................................. 143Table 4.4: Correlation of retained variables medial and lateral trochlear
inclination ....................................................................................... 143Table 4.5: The mean difference between PFP and No PFP groups ............ 146Table 4.6: The association between thirteen 3D imaging features and
patellofemoral pain ........................................................................ 147Table 5.1: A summary of supporting evidence ............................................. 165Table 5.2: How to score the foot posture index ............................................ 169Table 5.3: MRI sequences showing key imaging parameters ..................... 174Table 5.4: Strengths and weaknesses of data-driven statistical
techniques ...................................................................................... 175Table 5.5: Subgrouping variable mean (SD) and normative data or defined
thresholds ...................................................................................... 179Table 5.6: Predictors of Global Rating of Change Scale (GROC)
missingness ................................................................................... 182Table 5.7: Predictors of Treatment attendance missingness ..................... 182
xvi
Table 5.8: Participant characteristics and descriptors. Values are means (SD) unless stated otherwise ........................................................ 183
Table 5.9: TwoStep cluster solutions for flexibility domain ........................ 187Table 5.10: Hierarchical cluster solutions for flexibility domain ................ 187Table 5.11: TwoStep cluster solutions for strength domain ....................... 188Table 5.12: Hierarchical cluster solutions for strength domain ................. 188Table 5.13: TwoStep cluster solutions for movement domain .................... 189Table 5.14: Hierarchical cluster solutions for movement domain .............. 189Table 5.15: TwoStep cluster solutions for structural domain ..................... 190Table 5.16: Hierarchical cluster solutions for structural domain ............... 190Table 5.17: Mean values (SD) across the four subgroups .......................... 193Table 5.18: Mean values (SD) across the four subgroups generated by
hierarchical cluster analysis ......................................................... 195Table 5.19: Multiple logistic regression using original (non-imputed)
data ................................................................................................. 196Table 5.20: Multiple logistic regression exploring the association between
subgroups and likelihood of a favourable outcome at 12 months ............................................................................................ 196
Table 5.21 Cross tabulation of GROC and ‘AKP and VAS’ thresholds ...... 198Table 5.22 Cross tabulation of GROC and ‘AKP or VAS’ thresholds ......... 198Table 6.1: Participant eligibility criteria ......................................................... 208Table 6.2: Overview of the matched treatment programme ........................ 211Table 6.3: Feasibility outcomes* .................................................................... 212Table 6.4: Thresholds for feasibility outcomes ............................................ 216Table 6.5: Baseline characteristics. Values are means (SD) unless stated
otherwise ........................................................................................ 218Table 6.6: Adherence to treatment for MT group ......................................... 220Table 6.7: Clinical outcomes. Mean (SD) unless otherwise stated ............. 221Table 6.8: Mechanistic outcomes. Mean (SD) unless otherwise stated ..... 223
xvii
List of Figures
Figure 2.1: Factors which lead to increased subchondral bone stress ....... 14
Figure 2.2: A graph representing the envelope of function. ......................... 16
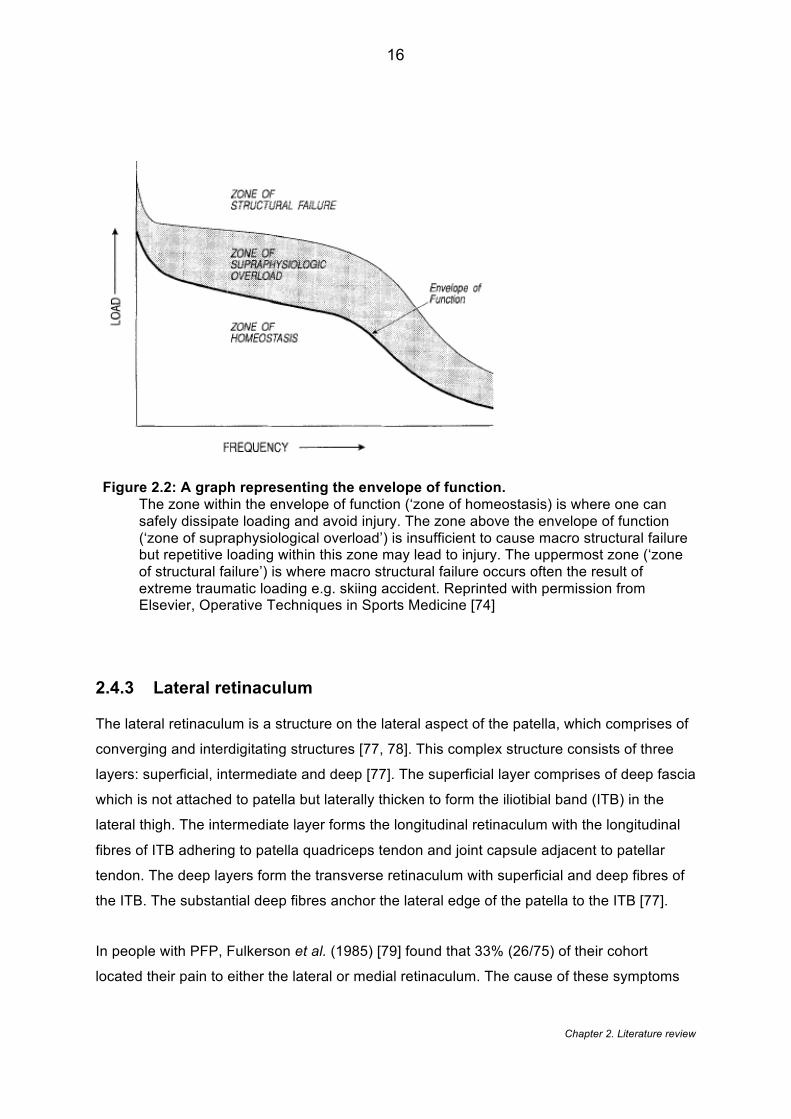
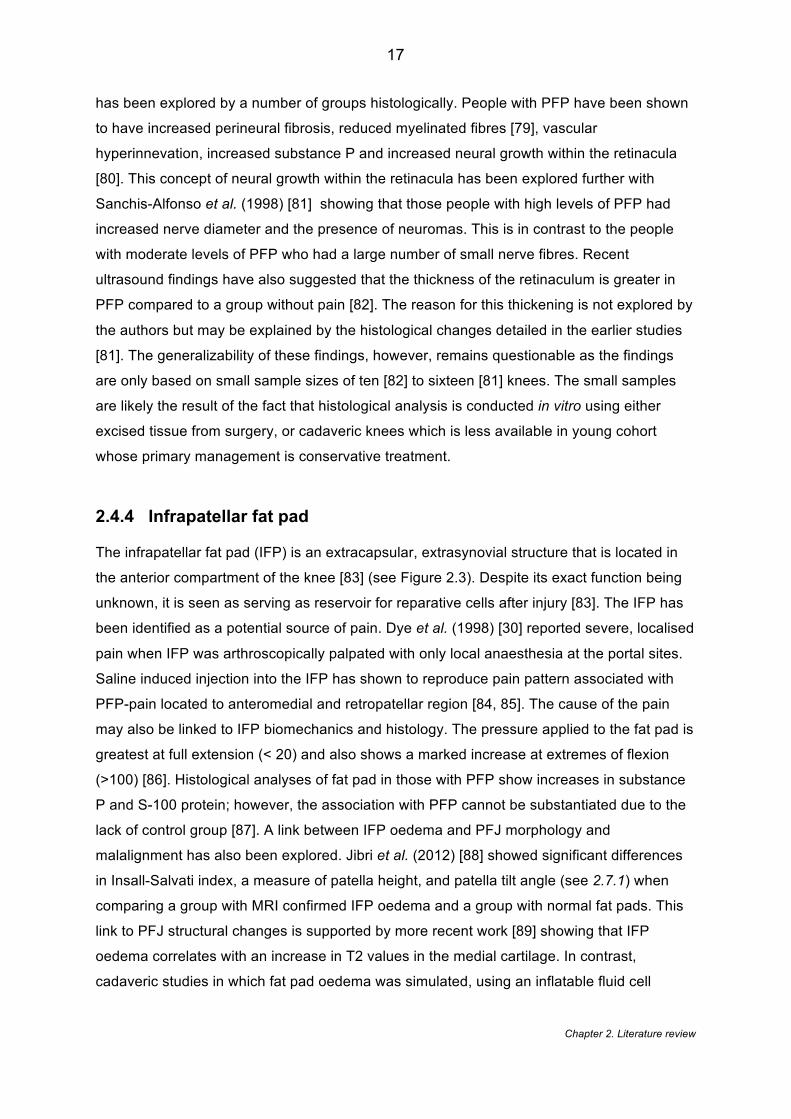
Figure 2.3: Anatomy of the infrapatellar fat pad ............................................. 18
Figure 2.4: Self-reported pain ........................................................................... 23
Figure 2.5: Relationship between contact area and joint reaction force ..... 33
Figure 2.6: Increases in cartilage stress in relation to femur rotation ......... 34
Figure 2.7: Eversion buffer. .............................................................................. 46
Figure 2.8: Distribution of the effects of treatment ........................................ 61
Figure 2.9: Clinical subgroups. ........................................................................ 67
Figure 3.1: Study selection flow diagram........................................................ 79
Figure 3.2. Measurement of patella alignment ............................................ 111
Figure 3.3: Forest plots ................................................................................... 116
Figure 3.4: Forest plots for full weight bearing studies. .............................. 119
Figure 4.1: The apparent shape of the patella after small translations and rotations ......................................................................................... 125
Figure 4.2: A schematic diagram of Active Appearance Modelling ........... 129
Figure 4.3: Coordinate frame and model extent, facet regions .................. 131
Figure 4.4: Directed acyclic graph to illustrate the relationship between trochlear morphological variables ............................................... 142
Figure 4.5: Directed acyclic graph to illustrate the relationship between patella cartilage variables ............................................................. 142
Figure 4.6: An orthogonal view of the gender difference ............................ 149
Figure 5.1: Conceptual stages of research into subgroups. ....................... 155
Figure 5.2: Forest plots of local variables .................................................... 159
Figure 5.3: Forest plots for distal variables .................................................. 160
Figure 5.4: Forest plots of proximal variables .............................................. 162
Figure 5.5: Forest plots of regional variables ............................................... 164
Figure 5.6: Assessment procedures for the selected variables ................. 166
Figure 5.7: Feedback loop mechanism controlling the angular velocity ... 171
Figure 5.8: Marker set up for stair descent ................................................... 172
Figure 5.9: Stair descent gait cycle ............................................................... 174
Figure 5.10: Duration of pain .......................................................................... 180
Figure 5.11: Two stage cluster approach ...................................................... 184

xviii
Figure 5.12: Clinical profile of the subgroups in terms of knee extensor and hip abductor strength. ................................................................... 201
Figure 6.1: Phases of Medical Research Council (MRC) complex intervention guidance ................................................................... 207
Figure 6.2: Stairs and platform....................................................................... 215
Figure 6.3: Flow of participants through the study ...................................... 217
Figure 6.4: Percentage change of total range of movement in kinematic outcomes (post intervention – baseline) ..................................... 224
xix
List of Abbreviations
2D Two-dimensional 3D Three-dimensional AAM Active appearance model AAR Active angle reproduction ADLS Activities of daily living AKP Anterior Knee Pain AKPS Anterior Knee Pain Score ANOVA Analysis of variance ASIS Anterior superior iliac spine ASM Active shape model BFR Blood flow restriction BMI Body Mass Index BSO Bisect offset BW Body weight CA Congruence angle CAST Calibrated anatomical systems technique CI Confidence intervals Cine PC Cine Phase Contrast CKC Closed kinetic chain COG Centre of gravity CONSORT Consolidated Standards of Reporting Trials CT Computed tomography DAG Directed acyclic graph dGEMRIC Delayed gadolinium enhanced MRI of cartilage EMG Electromyography FIQ Functional Index Questionnaire fMRI Functional magnetic resonance imaging FPI Foot Posture Index FWB Full weight bearing GAG Glycosaminoglycan GEE Generalised estimating equations GP General Practitioner GROC Global rating of change scale HCA Hierarchical cluster analysis ICC Intraclass correlation coefficient IFP Infrapatellar fat pad IKD Isokinetic dynamometer IKDC International Knee Documentation Committee IMMPACT Initiative on Methods, Measurement and Pain Assessment in Clinical Trials IRB Institutional review board
xx
ITB Iliotibial band kg/BW Kilograms per body weight KL Kellgren & Lawrence KOOS Knee injury and osteoarthritis outcome score LBP Lower back pain LDA Linear discriminant analysis LPA Lateral patellofemoral angle LR Likelihood ratio MAR Missing at random MCFIQ Modified functional index questionnaire MCID Minimal clinically important difference MD Mean difference MOAKS MRI Osteoarthritis Knee Score MP:LP ratio Medial patella : Lateral patella ratio MRC Medical Research Council MRI Magnetic resonance imaging MT Matched treatment group N/E Not examined NIHR National Institute for Health Research NOS Newcastle-Ottawa Scale Nm Newton metre NRS Numerical rating scale NWB Non weight-bearing OA Osteoarthritis OAI Osteoarthritis Initiative OKC Open kinetic chain OR Odds ratio PAR Passive angle reproduction PCA Principal component analysis PFJ Patellofemoral joint PFJRF Patellofemoral join reaction force PFOA Patellofemoral osteoarthritis PFP Patellofemoral pain PFPS Patellofemoral pain syndrome PPT Pain pressure threshold PROM Patient reported outcome measure PSIS Posterior superior iliac spine PTA Patella tilt angle RCT Randomised controlled trial RMS Root mean square ROM Range of movement RPE Rate of perceived exertion SA Sulcus angle SD Standard deviation
xxi
SEM Standard error of the mean SMD Standardised mean difference SSM Statistical shape models STROBE Strengthening the Reporting of Observational Studies in Epidemiology tAB Total area of subchondral bone TFJ Tibiofemoral joint TiDiER Template for Intervention Description and Replication TKR Total knee replacement TNJ Talonavicular joint TwoStep CA SPSS TwoStep cluster analysis UC Usual care group UK United Kingdom US Ultrasound UTD Unable to detect VAS Visual Analogue Score VAS-u Usual Visual Analogue Score VAS-w Worst Visual Analogue Score VL Vastus lateralis VMO Vastus medialis obliquus WB Weight bearing WOMAC Western Ontario and McMaster Universities Osteoarthritis Index WPAIQ Work Productivity and Activity Impairment Questionnaire X2 Chi squared test XR X-ray
1
Chapter 1 - Introduction
1.1 Background
Patellofemoral pain (PFP), is a term often used synonymously with anterior knee pain [1].
PFP is characterised by a gradual onset of pain related to changes to the patellofemoral joint
(PFJ) and not associated with any other knee condition [2]. It is often exclusively linked to
loaded activities such as stairs, running etc.[3] and is rarely reported with unloaded activities
except for reported pain with prolonged flexion [4]. Experts believe that PFP may be a
precursor to patellofemoral osteoarthritis [5] forming a disease continuum, however, this link
remains unsubstantiated at present [6].
The typical age range for people with PFP is from adolescence up to 40 years. A recent UK
epidemiological study estimates that one in six adults consulting their general practitioner for
knee pain will be diagnosed with PFP [7] and in adolescents the reported point prevalence of
PFP is 6% [8]. Given that UK population estimates show that the 15-39 age group equates
to over 26% of the whole population [9] and with longitudinal studies revealing that 77 to
91% of people with PFP will experience pain for over 10 years [10]; the potential societal
burden from PFP is of concern. People with PFP are known, as a result of the pain, to
reduce their physical activity [11] which instils negative beliefs toward physical activity and
may lead to a major impact on their future health [3].
A variety of theories on the origins of pain in PFP have been proposed. These include
patellar malalignment, abnormal tissue homeostasis, lateral retinacula hyper-innervation and
subchondral bone irritation [12, 13]. There is still, however, no consensus with regards to
pathogenesis of PFP. The cause of PFP is widely accepted to be multifactorial in nature and
an extensive number of associated factors have been identified [14]. These factors have
been classified as distal (e.g. foot), local (e.g. patellofemoral joint) and proximal (e.g. hip)
comprising of clinical, biomechanical and imaging features.
Consensus does exist, however, that non-surgical, conservative management is the primary
treatment of choice [15] . Multimodal treatment is widely considered best practice [16] which
can include combinations of interventions such as taping, knee orthoses , gait-retraining, foot
orthoses, muscle strengthening and muscle stretching [17, 18]. Despite this being the
accepted treatment approach, 62% of adolescents with PFP still report an unfavourable
outcome following treatment and 40% of young adults from pooled data (n=330) report a
2
similar unfavourable outcome one year following rehabilitation [19]. This shows that the
variability in treatment outcome remains considerable.
The inconsistency in treatment outcomes suggests sub-groups may exist within the PFP
population [14]. Currently, there is limited hard evidence to support the existence of sub-
groups or potential for stratification in treatment of PFP. This notion is however supported by
an international consensus statement, developed by international PFP experts, which states:
“identification of the subgroups remains the ‘holy grail’ for PFP research” [20]. There is a
paucity of research investigating the interrelationship between the local, distal and proximal
factors [20], which may refine potential subgroups further.
Stratified approaches to care for other musculoskeletal conditions have demonstrated
improved treatment outcomes [21]. With a widespread belief that separate, identifiable
subgroups exist within the PFP population [20, 22], then there is a clear need to attempt to
identify these sub-groups. Aligning imaging features to both clinical and biomechanical
features provides a greater holistic assessment of PFP and an opportunity to develop
definitive sub-groups. The modelling of outcomes may then allow stratified interventions to
be developed and limit the likely progression of pathology.
1.2 Aims & objectives
The central hypothesis underpinning this thesis is:
Improved subgrouping of people with PFP based on modifiable features will enable stratification and targeting of interventions
The overarching aim of the thesis is to identify PFP subgroups with modifiable features that
could be targeted with stratified treatment. To fulfil this aim the following objectives were
identified:
- To determine which imaging features are most associated with PFP
- To analyse the structure of the patellofemoral joint using commonly used imaging
features converted into their 3D quantitative equivalents

3
- To determine which diagnostic subgroups are present in a PFP cohort by combining
modifiable clinical, biomechanical and imaging features.
- To explore the prognosis of these data derived subgroups
- To explore the feasibility of a targeted intervention, matched to the characteristic of a
selected subgroup, compared to usual care management
1.3 Thesis structure & overview
Chapter Two: Narrative literature review This narrative literature review comprises of five main themes that underpin the thesis: i)
current clinical, biomechanical and imaging features associated with PFP; ii) current
interventions for treating PFP; iii) proposed mechanism of action for these interventions; iv)
predictors of response for these interventions; v) current stratification and classification
methods used for PFP. These themes are used to demonstrate the need for stratification in
PFP. This chapter also includes a detailed background to the natural history, pathogenesis,
risk factors and clinical examination of PFP thus providing context to this thesis.
Chapter Three - Which patellofemoral joint imaging features are associated with
patellofemoral pain? Systematic review and meta-analysis This is a systematic literature review and meta-analysis of the imaging features associated
with PFP. This review aims to control for confounding factors such as loading and knee
flexion angle in order to compare imaging features and their association to PFP. The
strengths and weakness of the current literature are discussed in terms of their
methodological quality and the impact of full weight bearing imaging is also analysed.
Chapter Four - Patellofemoral joint morphology of middle aged people with patellofemoral
pain measured using 3D MRI quantitative technology: data from the Osteoarthritis Initiative
This is a retrospective analysis of the Osteoarthritis Initiative database using 3D quantitative
technology. This chapter aims to investigate whether commonly reported imaging features
converted into their 3D quantitative equivalents differ between those with and without PFP,

4
and between genders. In this chapter, 13 PFP imaging features are investigated between an
older group (>45 years) with PFP but without osteoarthritis (KL grade =0) and a similar group
without PFP. Finally, the overall bone shape is explored between groups.
Chapter Five - The development of data-derived subgroups in patellofemoral pain using
modifiable clinical, biomechanical and imaging features This is a longitudinal cohort study with a cross-sectional analysis exploring the presence of
diagnostic subgroups in a PFP cohort by combining modifiable clinical, biomechanical and
imaging features. This chapter uses a SPSS TwoStep cluster analysis of ten features,
applied within a two-stage approach, to derive modifiable data driven subgroups from a PFP
cohort. Relevant patient characteristics such as age, gender BMI etc. are used as
descriptors within these groups to provide further context. Using a logistic regression,
adjusted for known confounders, the prognosis of these subgroups is assessed at 12 month
follow up.
Chapter Six - The effect of targeted treatment on people with patellofemoral pain: a
pragmatic, randomised controlled feasibility study
This is a feasibility study investigating targeted treatment in PFP. This chapter aims to
explore the feasibility of a targeted hip strengthening intervention, matched to a subgroup
with baseline hip weakness, compared to usual care management. In addition, the chapter
explores the mechanism of effect of the hip strengthening in a group defined as ‘weak’. This
chapter aims to inform a larger randomised controlled trial in the future as well as improving
our understanding of why hip strengthening may improve symptoms in people with PFP.
Chapter Seven: Discussion, future directions and conclusions This closing chapter discusses the main findings of the thesis with reference to any updated
literature, limitations of the thesis as a whole, the future directions for research and the
eventual conclusions that can be drawn.
Chapter 2. Literature review
5
Chapter 2 - Literature review
This literature review will aim to explore the need for stratification by showing that
patellofemoral pain (PFP) is a condition of: i) multifactorial aetiology; ii) with multiple relevant
targets for intervention; and iii) multiple treatment options with heterogeneous responses.
Each section of the literature review is summarised critically showing how it links to
stratification. The addition of sections devoted to terminology, epidemiology and outcomes
provide context to the review. This review includes literature published up until May 2016.
An update of the research from May 2016 to present is provided in Chapter 7.
2.1 Definition
There is no universally accepted definition of patellofemoral pain (PFP). Table 2.1 shows the
definitions used in the latest three Cochrane reviews published on the subject of PFP.
Despite these definitions being different, they do show common themes regarding: the
location of pain (e.g. pain in the patella region), functional limitations (e.g. pain with load
activities such as stairs etc.) and exclusion of other differential diagnosis (e.g. patellar
tendinopathy etc.). It has been suggested that PFP may in essence be a diagnosis by
exclusion [23].
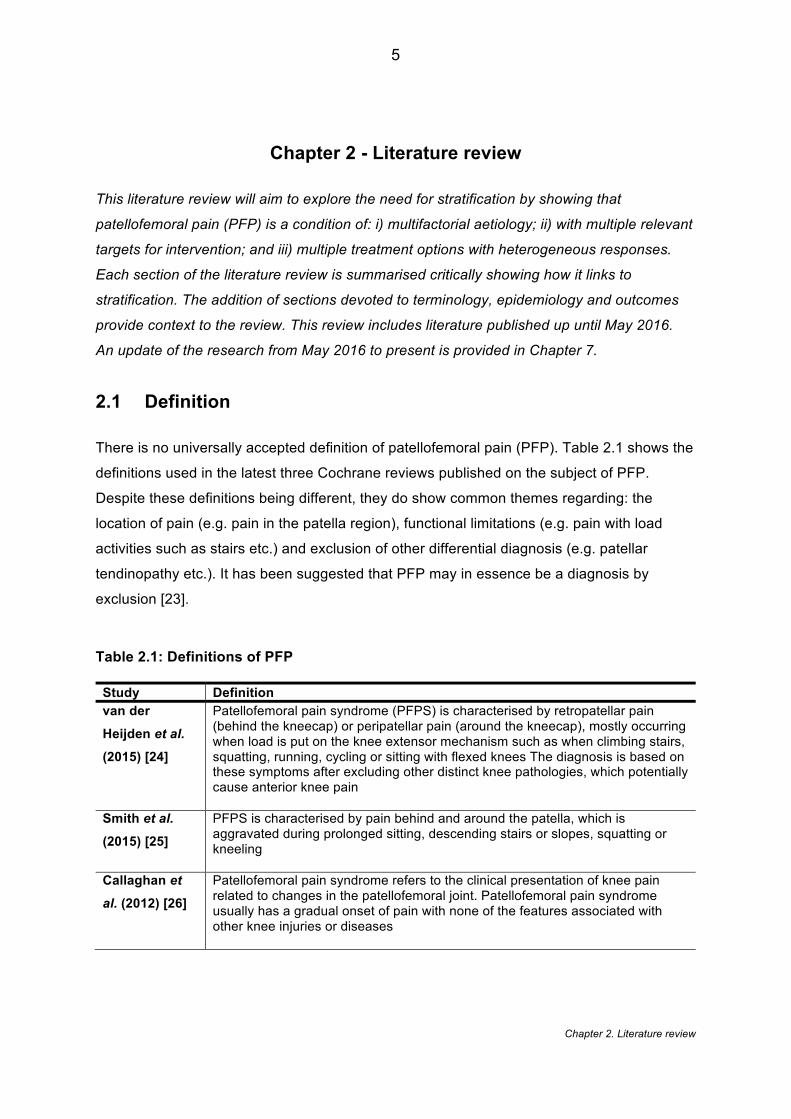
Table 2.1: Definitions of PFP
Study Definition van der Heijden et al. (2015) [24]
Patellofemoral pain syndrome (PFPS) is characterised by retropatellar pain (behind the kneecap) or peripatellar pain (around the kneecap), mostly occurring when load is put on the knee extensor mechanism such as when climbing stairs, squatting, running, cycling or sitting with flexed knees The diagnosis is based on these symptoms after excluding other distinct knee pathologies, which potentially cause anterior knee pain
Smith et al. (2015) [25]
PFPS is characterised by pain behind and around the patella, which is aggravated during prolonged sitting, descending stairs or slopes, squatting or kneeling
Callaghan et
al. (2012) [26] Patellofemoral pain syndrome refers to the clinical presentation of knee pain related to changes in the patellofemoral joint. Patellofemoral pain syndrome usually has a gradual onset of pain with none of the features associated with other knee injuries or diseases
Chapter 2. Literature review
6
2.2 Terminology
The terminology and nomenclature surrounding PFP is widely accepted as being ambiguous
[1].This poses a problem clinically as there are number of reported examples of
mismanagement in terms of surgery and conservative treatment [1]. The first published
description of the PFP clinical presentation we consider today used the term “internal
derangement of the knee”[27], however, in reality this encompassed both PFJ and
tibiofemoral joint (TFJ) conditions [28]. In the early 1900s, surgeons began to attribute
patellar chondral lesions as the source of pain following meniscal surgery. Slowly the term
“chondromalacia patellae’ was coined and began to be ascribed to the current PFP
presentation seen today [28]. The presence of chondromalacia patellae has repeatedly been
shown to be poorly correlated to pain [29] and notably Scott Dye allowed a colleague to
perform an arthroscopy under no anaesthesia in order to establish which knee structures are
symptomatic[30]. They found an absence of any sensation over the articular patella cartilage
suggesting the chondromalacia patellae is very unlikely to be the source of pain in PFP.
The movement away from using the term chondromalacia patellae meant that by the 1970s,
‘patella malalignment’ begun to be used to describe this clinical presentation [31] and this
resulted in other terms such as lateral patella pressure syndrome etc. However, due to the
fact that not all people presenting with PFP have malalignment and with the reported failure
of many alignment surgeries [31], the term lateral patella pressure syndrome is not currently
recognised, despite malalignment still being attributed as one of the primary causes for the
condition.
The terms anterior knee pain (AKP), patellofemoral pain syndrome and patellofemoral pain
have been used interchangeably. The International Patellofemoral Study Group, with a
membership of predominantly orthopaedic surgeons, currently advocates the term ‘anterior
knee pain’ [32]. Thomeé et al. (1999) [33] suggested that AKP encompasses a number of
distinct pathologies and once these have been excluded patellofemoral pain (syndrome) can
then be diagnosed. This in essence suggests that PFP is a diagnosis by exclusion. The
terms anterior knee pain syndrome and patellofemoral pain syndrome, Grelsamer et al.
(2009) [1] argues, are useless, nonspecific and potentially inappropriate as a syndrome is
collection of consistent clinical signs and symptoms [1], which due the multifactorial nature of
PFP, is a definition that PFP does not satisfy. Of particular note is the change in terminology
Chapter 2. Literature review
7
used in the International Patellofemoral Pain Research Retreat consensus documents[14,
20, 34], published biennially, in which the first consensus statement [34] used patellofemoral
pain syndrome whereas subsequent publications[14, 20] have dropped the term syndrome
potentially in reaction to the published views of Grelsamer et al. (2009) [1]. Currently, it
appears that the most widely accepted terminology to be patellofemoral pain with the
majority of publications on this condition choosing to use this nomenclature. Hereafter,
‘patellofemoral pain’ (PFP) will be the preferred term used in this thesis to encompass all
synonymous terms including patellofemoral pain syndrome, anterior knee pain and
chondromalacia patellae.
2.3 Natural History/ Epidemiology
2.3.1 Natural history of PFP
PFP was long considered a benign, self-limiting condition that would improve with time [10].
A number of longitudinal studies [10, 35-37] have refuted this, with data showing the
presence of pain persisting in the majority of cases at three to 16 years following diagnosis.
It was firstly shown [36, 37] that, at an average of four years follow up, 94% (51/54) people
still reported pain. Of these people, 54% reported the pain to be the same or worse and 52%
reported some activity restriction. At an average 5.7 years, Blond and Hansen (1998) [35]
found that 73% still complained of pain with 48% reporting pain worse or the same and 74%
reporting a reduction in athletic activity. At an 11 year follow-up following diagnosis,
Stathopulu and Baildam (2003) [10] reported that 91% (20/22) still had pain and that 45%
(10/22) reported that their daily life is affected. In the largest follow up conducted at 16 years
[36], 77% (38/49) people were found to still report pain.
These studies show that pain is still present in 73-94% of people up to 16 years follow-up,
which strongly rejects the view of PFP as a self-limiting condition. They demonstrate that
pain severity and functional restriction remain unchanged or increased in 48-54% and 45-
74% respectively, although this functional restriction varies in terms of expected demand e.g.
athletic ability versus daily life[37]. On the other hand, this would still suggest that over half
experience an improvement in pain over time and supports data which is often omitted in the
literature, that at 16 years follow up, 73% of the 38 patients with pain reported at least some
improvement in symptoms. This may explain how PFP was once considered self-limiting.
Chapter 2. Literature review
8
2.3.2 Link between PFP and PFOA
There is a concern that approximately 50% of PFP cases who report on-going pain and
functional limitation may develop future patellofemoral osteoarthritis (PFOA), with PFP
having been implicated as a potential precursor to PFOA [5]. A few studies have supported
this theory. Utting et al. (2005) [38] found that 22% of patients who had undergone an
arthroplasty for isolated PFOA reported experiencing PFP symptoms in adolescence and
early adulthood. This was supported by the results of Thorstensson et al. (2009) [39] who
showed in a cohort of people with chronic knee pain aged 35-54 years, that 32% (9/28)
developed isolated PFOA at seven year follow-up having shown no radiographic OA at
baseline. A comprehensive review of the literature [6] suggests most studies that support the
associations between PFP and PFOA were not primarily designed to answer this question
and conclude, despite expert opinion proposing this relationship [5], that current literature is
unable to substantiate a clear link between both conditions.
2.3.3 Prevalence and incidence of PFP
The prevalence data surrounding PFP has been widely criticised for its unrepresentative
sources and so the real-world prevalence remains unknown [40]. Prevalence is defined as
the number of cases of a particular condition at a single point in time [41]. Callaghan and
Selfe (2007) [40] conducted a review of the sources of prevalence data, finding that much of
the prevalence data cited is based on secondary or even tertiary referencing with some of
the source data considered unrepresentative. The current figures cited in the literature for
the adult population are typically based on athletes [42] and military personnel [43]. In these
studies the prevalence is cited to be between 14% and 25% of all knee injuries [42, 43]. In
the general public, Wood et al. (2011) [7] analysed 57,555 GP diagnostic codes annually in
the UK to show that ‘patellofemoral disorders’ comprised of 17% (303/1782) of all knee
consultations. This is comparable to data from the Netherlands [44] which showed that 11%
of GP diagnostic codes for knee pain was given as ‘patellofemoral pain syndrome’.
Incidence is defined as the number of new cases of a particular condition within the same
population during a set time period [41]. A review of the literature showed that the incidence
range was between 9% (over 12 weeks) and 17% (over two years) [45]. This comprised
almost solely of sporting and military participants, however, it is perhaps understandable
considering that increased physical activity is a risk factor for the development of PFP. In
contrast, Boling et al. (2010) [43] followed 1525 midshipman finding a significantly lower
Chapter 2. Literature review
9
incidence rate of 2.2% (over 2.5 years). It is unclear what may have contributed to this lower
figure, however, the same study does demonstrate that females were over twice as likely to
develop PFP compared to males suggesting that the female to male ratio of any cohort will
likely influence the overall incidence reported.
There is a tendency across the majority of epidemiological studies related to PFP to focus on
a group greater than 18 years old; a feature which may be the result of ethical restrictions
[46]. A few studies have explored age groups between 10 – 19 years old [8, 47-49]. Two
studies explored the prevalence of AKP (encompassing a range of conditions including PFP)
and two specifically focused on PFP [8, 49]. The studies focused on AKP show very similar
prevalence rates of 27% (183/688) [47] and 27% (331/1210) [48]. Foss et al. (2012) [47],
under the umbrella term of ‘anterior knee pain’, showed that the other specific conditions
such as patella tendinopathy, Osgood-Schlatter disease represented 11% of the overall
figure thus leaving 16% to account for the prevalence of PFP. In adolescent athletes, PFP
had a prevalence of 16% [49], which is comparable to the data from Foss et al. (2012) [47]
minus the other conditions e.g. Osgood- Schlatter etc. Mølgaard et al. (2011) [8], [49] only
found that PFP showed a younger population prevalence of 6%, based on Danish students.
As prevalence data is often compiled from large distinct populations, it is likely that an
athletes will present with different risk factors to the general student population [20].
Prevalence data recording is also reliant on people seeking treatment from a primary
clinician. Rathleff et al. (2013) [50] looked at the care seeking behaviour of adolescents with
PFP showing that 47% (163/344) with insidious knee pain had not sought treatment. The
reason for this figure is unknown but the authors did show that individuals were more likely
to seek treatment for traumatic rather than an insidious onset.
As well as the established prevalence of PFP within adolescents, Rathleff et al. (2016) [11]
has recently showed in a cohort aged 15-19 years (n=504) that compared to other knee
pathologies, people with PFP showed a significant reduction in both sports and leisure time
participation over a two year follow up period. As highlighted by the authors, this significant
reduction in activity for young people with PFP could lead to serious lifestyle consequences
and a more sedentary lifestyle [11].
2.3.4 Health economics
In terms of health economics, Tan et al. (2010) [51] provides the only cost-utility analysis of
exercise for PFP. Based on data from a high quality RCT [52] they showed that whilst direct
Chapter 2. Literature review
10
medical costs were significantly higher in an intervention group, likely as a result of the
additional physiotherapy intervention. The overall societal costs for the intervention group
(€1011) were significantly less than control group (€1166) because they included productivity
costs. Productivity costs were based on the cost of absenteeism and reduced efficiency at
work (presenteeism). This seems very pertinent considering the PFP population is typically a
working-age population. However, the results of this study cannot be extrapolated to UK
healthcare system where healthcare models and direct medical costs are likely to vary.
2.3.5 Risk factors
The potential risk factors for the development of PFP, taken from prospective cohorts, is
presented here, with the known associated factors discussed in later sections. The most
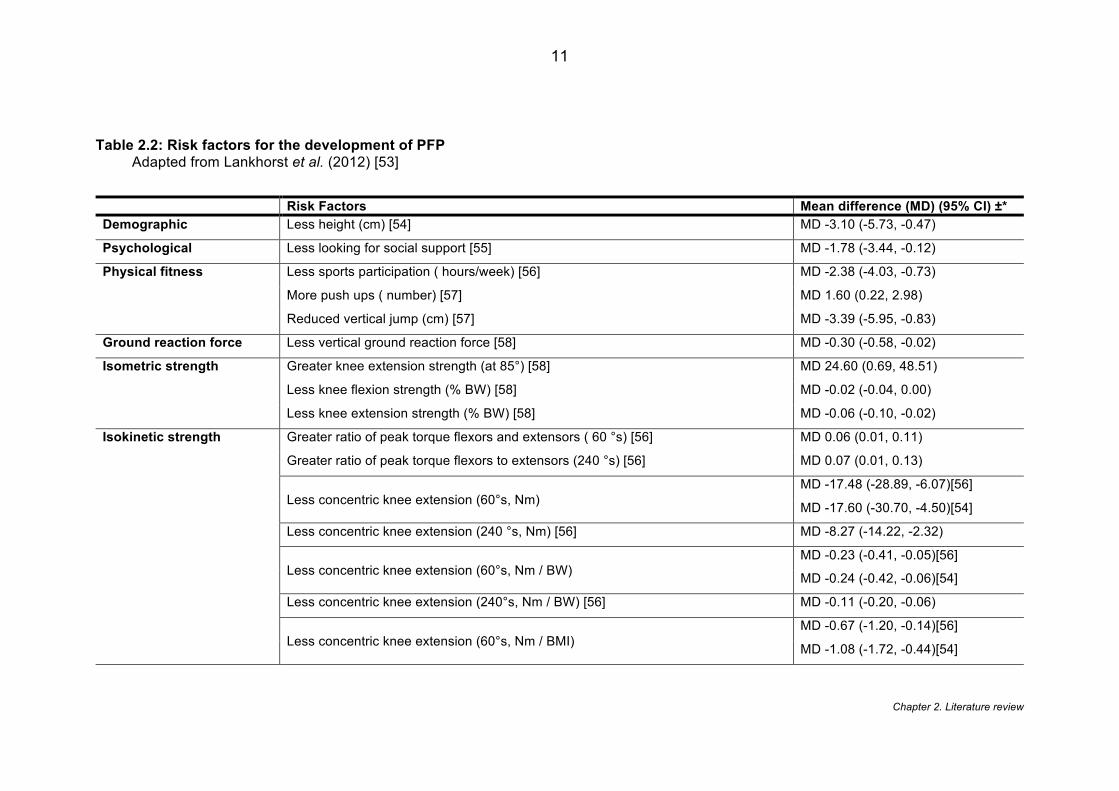
comprehensive work to date [53] systematically reviewed all known risk factors. Table 2.2
shows the risk factors that have shown significance in leading to the development of PFP.
Pooling of data was only possible for the following variables: height, weight, BMI, age, peak
knee extensor torque and peak knee flexor torque. Only reduced knee extensor strength
was significantly associated as a high risk for future PFP [53] based on variety of testing
procedures. The results of the review are based on only seven available studies however,
and as the authors highlight, the cohorts investigated include a disproportionate number of
military cohorts and so do not necessarily represent the general population [53].
Chapter 2. Literature review
11
Table 2.2: Risk factors for the development of PFP Adapted from Lankhorst et al. (2012) [53]
Risk Factors Mean difference (MD) (95% CI) ±* Demographic Less height (cm) [54] MD -3.10 (-5.73, -0.47)
Psychological Less looking for social support [55] MD -1.78 (-3.44, -0.12)
Physical fitness Less sports participation ( hours/week) [56] MD -2.38 (-4.03, -0.73)
More push ups ( number) [57] MD 1.60 (0.22, 2.98)
Reduced vertical jump (cm) [57] MD -3.39 (-5.95, -0.83)
Ground reaction force Less vertical ground reaction force [58] MD -0.30 (-0.58, -0.02)
Isometric strength Greater knee extension strength (at 85°) [58] MD 24.60 (0.69, 48.51)
Less knee flexion strength (% BW) [58] MD -0.02 (-0.04, 0.00)
Less knee extension strength (% BW) [58] MD -0.06 (-0.10, -0.02)
Isokinetic strength Greater ratio of peak torque flexors and extensors ( 60 °s) [56] MD 0.06 (0.01, 0.11)
Greater ratio of peak torque flexors to extensors (240 °s) [56] MD 0.07 (0.01, 0.13)
Less concentric knee extension (60°s, Nm) MD -17.48 (-28.89, -6.07)[56]
MD -17.60 (-30.70, -4.50)[54]
Less concentric knee extension (240 °s, Nm) [56] MD -8.27 (-14.22, -2.32)
Less concentric knee extension (60°s, Nm / BW) MD -0.23 (-0.41, -0.05)[56]
MD -0.24 (-0.42, -0.06)[54]
Less concentric knee extension (240°s, Nm / BW) [56] MD -0.11 (-0.20, -0.06)
Less concentric knee extension (60°s, Nm / BMI) MD -0.67 (-1.20, -0.14)[56]
MD -1.08 (-1.72, -0.44)[54]
Chapter 2. Literature review
12
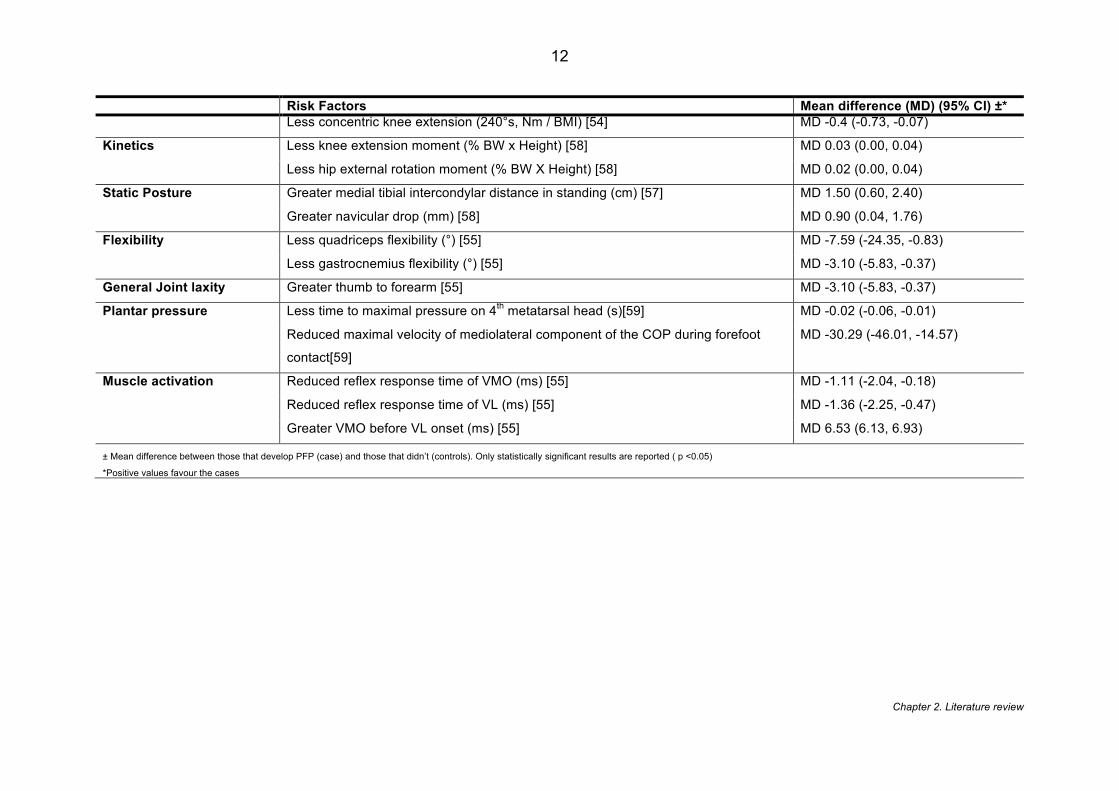
Risk Factors Mean difference (MD) (95% CI) ±* Less concentric knee extension (240°s, Nm / BMI) [54] MD -0.4 (-0.73, -0.07)
Kinetics Less knee extension moment (% BW x Height) [58] MD 0.03 (0.00, 0.04)
Less hip external rotation moment (% BW X Height) [58] MD 0.02 (0.00, 0.04)
Static Posture Greater medial tibial intercondylar distance in standing (cm) [57] MD 1.50 (0.60, 2.40)
Greater navicular drop (mm) [58] MD 0.90 (0.04, 1.76)
Flexibility Less quadriceps flexibility (°) [55] MD -7.59 (-24.35, -0.83)
Less gastrocnemius flexibility (°) [55] MD -3.10 (-5.83, -0.37)
General Joint laxity Greater thumb to forearm [55] MD -3.10 (-5.83, -0.37)
Plantar pressure Less time to maximal pressure on 4th metatarsal head (s)[59] MD -0.02 (-0.06, -0.01)
Reduced maximal velocity of mediolateral component of the COP during forefoot
contact[59]
MD -30.29 (-46.01, -14.57)
Muscle activation Reduced reflex response time of VMO (ms) [55] MD -1.11 (-2.04, -0.18)
Reduced reflex response time of VL (ms) [55] MD -1.36 (-2.25, -0.47)
Greater VMO before VL onset (ms) [55] MD 6.53 (6.13, 6.93)
± Mean difference between those that develop PFP (case) and those that didn’t (controls). Only statistically significant results are reported ( p <0.05)
*Positive values favour the cases
Chapter 2. Literature review
13
As expanded on in section 2.8.1, the association of hip dysfunction with PFP has been the
subject of increasing interest. Since the publishing of the Lankhorst et al. (2012) [53] review,
a number of studies have added to the literature. In contrast to current belief, recent
evidence in adolescent athletes has suggested that hip abduction strength [60] and
increased knee abduction moments [61] were risk factors for PFP, with the authors
proposing that this may represent an increased effort to control for knee valgus. The
available data does not allow for this explanation to be substantiated. The only systematic
review of the literature [62] to date that has explored hip strength as a risk factor for PFP,
found that despite cross-sectional studies showing that hip weakness is associated to PFP,
there is no evidence to suggest that a reduction of isometric hip strength leads to PFP. It is
worth considering however, that isometric strength is the most commonly used measure of
hip strength in these types of studies. It might be that other types of muscle contraction e.g.
concentric or eccentric may be more functionally relevant to PFP [62]
2.4 Aetiology
The aetiology of PFP is unknown [13]. Numerous theories have been proposed, although no
consensus has yet been reached [14]. Below provides an overview of the suspected
structures and causes of pain. These theories, however, should not be considered exclusive
and experts [63] believe they will likely overlap.
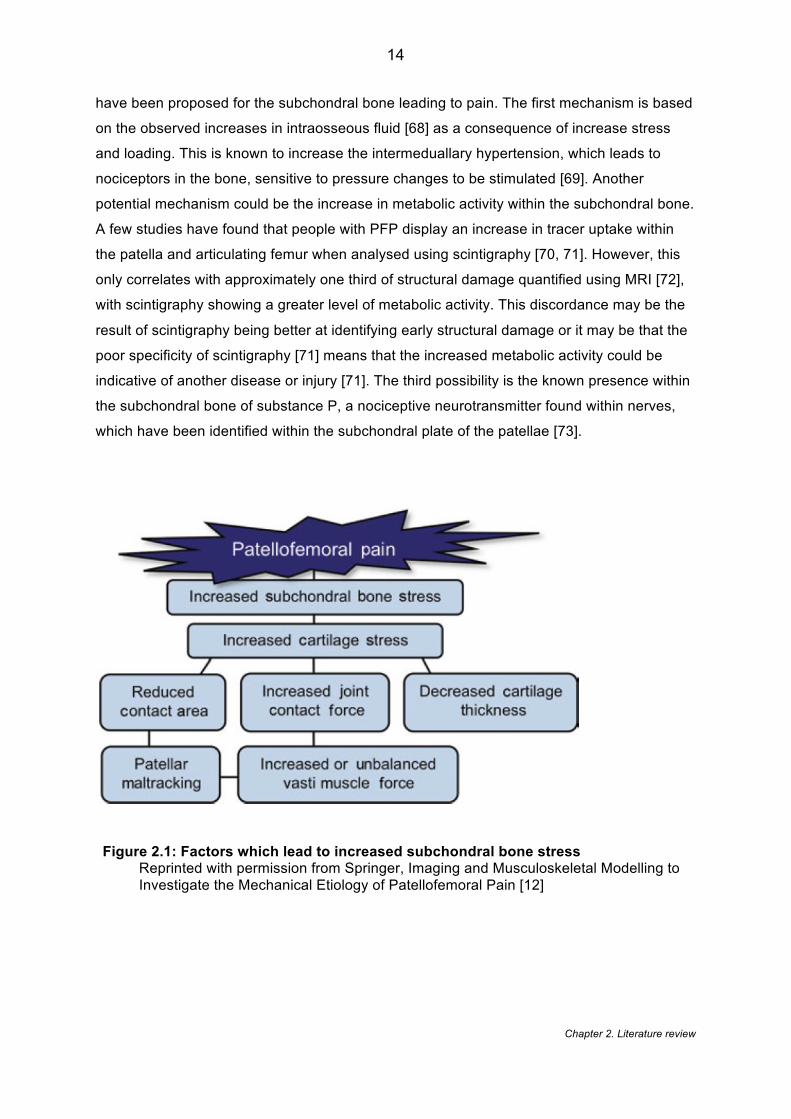
2.4.1 Subchondral bone
The localised stress transmitted through the PFJ is thought to be important in the
development of PFP and there is a growing support for the patellofemoral stress theory
shown in Figure 2.1 [12] . The term ‘stress’ is used to describe a loading force applied to an
object whereas ‘strain’ is the response and deformation of that object from the applied stress
[64]. It has been shown that people with PFP demonstrate greater PFJ stress [65, 66]. Ho et
al. (2014) [66] showed that a PFP group demonstrated a 67-118% increase in patellar bone
strain. Similarly, Farrokhi et al. (2011) [65] showed that PFP demonstrated a 35-66%
increase in octahedral shear stress (reflects the portion of the stress field that tends to distort
tissue [65]). It is agreed that articular cartilage is aneural so cannot be considered the source
of pain [30]. Conversely, subchondral bone, lying immediately beneath the calcified cartilage
[67] is highly innervated and a possible source of nociceptive pain [12]. Three mechanisms
Chapter 2. Literature review
14
have been proposed for the subchondral bone leading to pain. The first mechanism is based
on the observed increases in intraosseous fluid [68] as a consequence of increase stress
and loading. This is known to increase the intermeduallary hypertension, which leads to
nociceptors in the bone, sensitive to pressure changes to be stimulated [69]. Another
potential mechanism could be the increase in metabolic activity within the subchondral bone.
A few studies have found that people with PFP display an increase in tracer uptake within
the patella and articulating femur when analysed using scintigraphy [70, 71]. However, this
only correlates with approximately one third of structural damage quantified using MRI [72],
with scintigraphy showing a greater level of metabolic activity. This discordance may be the
result of scintigraphy being better at identifying early structural damage or it may be that the
poor specificity of scintigraphy [71] means that the increased metabolic activity could be
indicative of another disease or injury [71]. The third possibility is the known presence within
the subchondral bone of substance P, a nociceptive neurotransmitter found within nerves,
which have been identified within the subchondral plate of the patellae [73].
Figure 2.1: Factors which lead to increased subchondral bone stress Reprinted with permission from Springer, Imaging and Musculoskeletal Modelling to Investigate the Mechanical Etiology of Patellofemoral Pain [12]
Chapter 2. Literature review
15
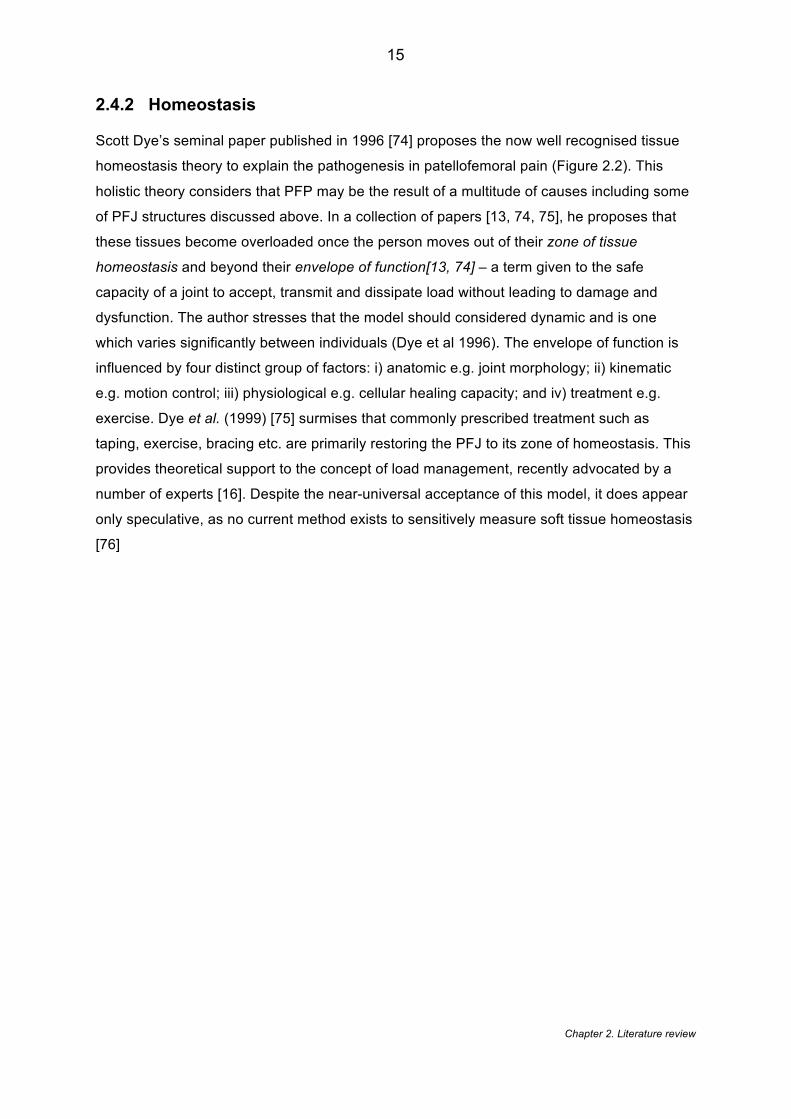
2.4.2 Homeostasis
Scott Dye’s seminal paper published in 1996 [74] proposes the now well recognised tissue
homeostasis theory to explain the pathogenesis in patellofemoral pain (Figure 2.2). This
holistic theory considers that PFP may be the result of a multitude of causes including some
of PFJ structures discussed above. In a collection of papers [13, 74, 75], he proposes that
these tissues become overloaded once the person moves out of their zone of tissue
homeostasis and beyond their envelope of function[13, 74] – a term given to the safe
capacity of a joint to accept, transmit and dissipate load without leading to damage and
dysfunction. The author stresses that the model should considered dynamic and is one
which varies significantly between individuals (Dye et al 1996). The envelope of function is
influenced by four distinct group of factors: i) anatomic e.g. joint morphology; ii) kinematic
e.g. motion control; iii) physiological e.g. cellular healing capacity; and iv) treatment e.g.
exercise. Dye et al. (1999) [75] surmises that commonly prescribed treatment such as
taping, exercise, bracing etc. are primarily restoring the PFJ to its zone of homeostasis. This
provides theoretical support to the concept of load management, recently advocated by a
number of experts [16]. Despite the near-universal acceptance of this model, it does appear
only speculative, as no current method exists to sensitively measure soft tissue homeostasis
[76]
Chapter 2. Literature review
16
Figure 2.2: A graph representing the envelope of function. The zone within the envelope of function (‘zone of homeostasis) is where one can safely dissipate loading and avoid injury. The zone above the envelope of function (‘zone of supraphysiological overload’) is insufficient to cause macro structural failure but repetitive loading within this zone may lead to injury. The uppermost zone (‘zone of structural failure’) is where macro structural failure occurs often the result of extreme traumatic loading e.g. skiing accident. Reprinted with permission from Elsevier, Operative Techniques in Sports Medicine [74]
2.4.3 Lateral retinaculum
The lateral retinaculum is a structure on the lateral aspect of the patella, which comprises of
converging and interdigitating structures [77, 78]. This complex structure consists of three
layers: superficial, intermediate and deep [77]. The superficial layer comprises of deep fascia
which is not attached to patella but laterally thicken to form the iliotibial band (ITB) in the
lateral thigh. The intermediate layer forms the longitudinal retinaculum with the longitudinal
fibres of ITB adhering to patella quadriceps tendon and joint capsule adjacent to patellar
tendon. The deep layers form the transverse retinaculum with superficial and deep fibres of
the ITB. The substantial deep fibres anchor the lateral edge of the patella to the ITB [77].
In people with PFP, Fulkerson et al. (1985) [79] found that 33% (26/75) of their cohort
located their pain to either the lateral or medial retinaculum. The cause of these symptoms
Chapter 2. Literature review
17
has been explored by a number of groups histologically. People with PFP have been shown
to have increased perineural fibrosis, reduced myelinated fibres [79], vascular
hyperinnevation, increased substance P and increased neural growth within the retinacula
[80]. This concept of neural growth within the retinacula has been explored further with
Sanchis-Alfonso et al. (1998) [81] showing that those people with high levels of PFP had
increased nerve diameter and the presence of neuromas. This is in contrast to the people
with moderate levels of PFP who had a large number of small nerve fibres. Recent
ultrasound findings have also suggested that the thickness of the retinaculum is greater in
PFP compared to a group without pain [82]. The reason for this thickening is not explored by
the authors but may be explained by the histological changes detailed in the earlier studies
[81]. The generalizability of these findings, however, remains questionable as the findings
are only based on small sample sizes of ten [82] to sixteen [81] knees. The small samples
are likely the result of the fact that histological analysis is conducted in vitro using either
excised tissue from surgery, or cadaveric knees which is less available in young cohort
whose primary management is conservative treatment.
2.4.4 Infrapatellar fat pad
The infrapatellar fat pad (IFP) is an extracapsular, extrasynovial structure that is located in
the anterior compartment of the knee [83] (see Figure 2.3). Despite its exact function being
unknown, it is seen as serving as reservoir for reparative cells after injury [83]. The IFP has
been identified as a potential source of pain. Dye et al. (1998) [30] reported severe, localised
pain when IFP was arthroscopically palpated with only local anaesthesia at the portal sites.
Saline induced injection into the IFP has shown to reproduce pain pattern associated with
PFP-pain located to anteromedial and retropatellar region [84, 85]. The cause of the pain
may also be linked to IFP biomechanics and histology. The pressure applied to the fat pad is
greatest at full extension (< 20) and also shows a marked increase at extremes of flexion
(>100) [86]. Histological analyses of fat pad in those with PFP show increases in substance
P and S-100 protein; however, the association with PFP cannot be substantiated due to the
lack of control group [87]. A link between IFP oedema and PFJ morphology and
malalignment has also been explored. Jibri et al. (2012) [88] showed significant differences
in Insall-Salvati index, a measure of patella height, and patella tilt angle (see 2.7.1) when
comparing a group with MRI confirmed IFP oedema and a group with normal fat pads. This
link to PFJ structural changes is supported by more recent work [89] showing that IFP
oedema correlates with an increase in T2 values in the medial cartilage. In contrast,
cadaveric studies in which fat pad oedema was simulated, using an inflatable fluid cell
Chapter 2. Literature review
18
positioned by ultrasound, showed no changes in lateral translation or lateral patellar tilt [87].
However, this cadaveric model did demonstrate a significant reduction in PFJ contact area at
near full extension (0-30) [87].
The basic science appears to support the premise that the fat pad may contribute to PFP;
however, the prevalence of IFP pathology in PFP has not been established.
Figure 2.3: Anatomy of the infrapatellar fat pad Reprinted with permission from Taylor & Francis, Physical Therapy Reviews [90]
2.4.5 Synovium
The synovial membrane of the knee is the largest in the body [91].The membrane attaches
to the upper border of the patella and forms a large pouch beneath the quadriceps femoris
on the distal anterior femur. Below the patella it is separated from the infrapatellar fat pad
before projecting downward, either side of the femur, to its point of attachment on the
menisci [91].The synovium is a semipermeable membrane that controls molecular traffic in
and out of the joint space, maintaining the composition of the synovial fluid which provides
Chapter 2. Literature review
19
nutrients and removes metabolic products for the health of the articular cartilage [92]. Similar
to the IFP, direct arthroscopic palpation of the synovium was reported as being moderately
to severely painful [30]. This may be explained by the level of substance P within the
synovium as it has shown to be higher in a AKP group compared to a group of people with
total knee replacements and a group of post-operative meniscectomy and anterior cruciate
ligament reconstructions [93]. This is supported by Bohnsack et al. (2009) [87] who observed
the same increase of substance P within the synovium of people with AKP as well as an
increase S-100 protein which is suggestive of a chronic inflammatory state [94].
2.4.6 Sensory dysfunction
Any tissue injury is thought to lead to some peripheral sensitisation and sensory change [95].
Sensory changes may also reflect the level of chronicity that his often found in individuals
with PFP [95]. Jensen et al. (2007) [96] were the first group to investigate this phenomenon
in PFP. They found quantitative sensory differences between PFP and healthy controls in
terms of tactile stimulation, detection threshold for warmth and detection threshold for cold.
Nevertheless, they were unable to observe any homogenous subgroups within a PFP
population of n=91 despite using a range of somatosensory testing variables. This work has
been expanded subsequently by Rathleff and colleagues in a collection of studies [95, 97]
that have focused on pain pressure threshold (PPT) measured using algometry. They found
that people with PFP have a lower PPT than healthy controls across both local sites (patella)
and distal site (tibialis anterior) [97]. PPT was found to correlate with the duration of
symptoms supporting algometry as a tool for measuring chronicity [97]. More recent work
investigated the efficiency of the diffuse noxious inhibition of the nervous system by
measuring the conditioned pain modulation [95]. It was found by applying pressure to the
elbow (the conditioned stimulus) and then the knee (the test stimulus) that people with PFP
have less increase in pain detection and tolerance thresholds[95]. An inability to increase
thresholds is seen as deficiency in the body’s pain modulatory and inhibitory system [95].
This emerging evidence may explain pain in subgroup of people PFP but the generalizability
are limited as most of these findings are based on all female cohorts many of which are
aged between 15-19 years [95, 97]. Age is considered a determinant of pain perception [98]
and thus these findings may not reflect the typical PFP aged group up to 40 years.
Chapter 2. Literature review
20
2.4.7 Vascular dysfunction
In a series of studies [99-101], Selfe and colleagues highlight the possibility of PFP
heterogeneity in terms of vascular and thermoregulatory function. They found that 18%
(14/77) of individuals with PFP answer ‘yes’ to the question: ‘Do your legs feel cold even in
warm surroundings?’ These people also demonstrated greater pain, less physical activity
and a worse response to exercise. Furthermore, they showed that individuals with
objectively cold knees (cold to palpation) had a lower activity levels and a worse Modified
Functional Index Questionnaire (MFIQ) score [101]. This reduced temperature may be linked
to vascular abnormalities that have been explored by Naslund et al. (2005) [71]. Using a
novel, non-invasive photoplethysmography, which assess blood volume changes in the
microvascular bed of tissue [102] they showed significant differences between a PFP and
healthy individuals in terms of pulsatile blood flow during a knee flexion arc. The explanation
for how this vascular dysfunction links to pain is unknown. However it has been proposed
that vascular bending or torsion, a mechanical disruption to the vascular supply, occurs
leading to episodes of ischemia [103]. This may then create a hypoxic environment, which
stimulates the production of numerous neurotransmitters within the local tissue, as
discussed above.
Despite a growing body of literature on this subject, the importance of the vascular system in
those with PFP still remains highly speculative. One of the biggest challenges is the
accessibility and validity of the equipment needed to measure these vascular features
clinically. These features may identify an important subgroup of PFP but future research
would need to link these vascular changes with more established features of PFP e.g. knee
strength etc. to demonstrate their clinical significance.
2.4.8 Proprioceptive dysfunction
Proprioception is the ability to sense the position and movement of limb segments [104]. It is
widely considered to be important with all knee injuries [104]. However the temporal
relationship between proprioception and pain is unclear. Callaghan (2011) [105] summarised
the commonly used measures of proprioception within knee pain research which includes:
active/passive joint position reproduction; detecting the initiation of passive movement;
detecting a sensation of vibration; measuring the delay of muscle contraction; reproducing a
muscle force; and postural sway. Specifically within PFP, the most commonly reported
Chapter 2. Literature review
21
measure of proprioception is active/ passive joint position reproduction. The studies using
this methodology [106-110] show contradictory results. Some studies show that differences
between a PFP group and asymptomatic control group exist [106, 107, 111] while others
show no difference [109, 110, 112] . Callaghan et al. (2008) [107] sub-classified his cohort
using the accuracy scores from the target angle, revealing subgroups of people with PFP
who demonstrate either good or poor proprioception. It is plausible that the contradiction in
the previous studies lies in the innate proprioceptive ability of the individuals recruited. Of
note, is the work of Selfe et al. (2006) [113] who investigated the optimum number of trials to
conduct during active/ passive joint position reproduction. They showed that five trials for
active angle reproduction and six trials for passive angle reproduction allowed the data to
achieve stabilisation. A subsequent review of the literature shows that the studies finding no
significant difference [109, 110] performed three repetitions [109], two repetitions [112] and
unclear the number of repetitions [110]. This is in contrast to the studies that found a
difference between groups, which performed the optimum number of trials: five trials [106],
six trials [111] and six trials [107]. The exact mechanism behind this alteration in
proprioception is unknown.
Proprioceptive dysfunction can also be improved by interventions such as strengthening
exercises [108] and taping [107, 114]. It has been suggested that taping may stimulate
cutaneous receptors on the skin, which contribute to proprioceptive information [107, 114].
Alternatively, the changes may lie within the brain, as suggested by a study of application of
patella tape to an asymptomatic group, which resulted in increased activity within the
cerebellum and decreased activation in the supplementary motor cortex [26, 105]. Improved
proprioception following strength training may be the result of either reducing the pain
inhibition or greater patella stability with less tissue stress [108].
The temporal relationship of proprioception remains unclear, thus it is not known whether
abnormal proprioception causes altered neuromuscular control and leads to the
development of PFP or whether the pain from PFP disrupts the central processes and
reduces proprioception [109].
2.4.9 Psychosocial dysfunction
The inconsistencies in treatment outcomes for PFP [115] as well as the inability to identify a
sole, organic cause for the pain; has led to a greater focus on psychosocial factors [116].
Catastrophizing, the belief that pain will worsen and nothing that can prevent that [117], has
Chapter 2. Literature review
22
been identified as one of the key psychological attributes associated with PFP. Doménech et
al. (2014) [118] showed that catastrophizing was the only variable that could be identified as
a predictor of PF pain. In their study [118], catastrophizing explained 19% variance for pain
and 28% for disability. This is supported by previous work [119] which has identified that
people with PFP had a significant reduction in their perception of health control, which will
contribute to the overall feeling of catastrophization. In a comparison between professional
and amateur athletes, both with PFP, it was shown that professional athletes demonstrated
a 44% greater perceived role limitation, which the authors [120] suggest might signify an
increased level of catastrophizing. This would imply that the expected level of performance/
function might make one more susceptible to catastrophization. Other psychosocial factors
that have been have been shown to be significantly associated with PFP include stress
[121], anxiety [122] and fear avoidance behaviour [122] . Hostility has also been recognised
as a potentially important personality trait in PFP. However, the direction of its effect is
contentious, with Witoński et al. (1998) [123] identifying an increase and Carlsson et al.
(1993) [121] finding a reduction in hostility. This may be result of Witoński et al. (1998) [123]
comparing against a group of ACL rupture patients rather than asymptomatic controls.
Despite this emerging evidence, there still remains a paucity of evidence supporting the role
of psychosocial factors in the development of PFP. The variety of constructs that have been
explored makes comparison challenging, limiting the adoption into clinical research at
present.
2.4.10 Link between PFP aetiology and stratification
This section shows that the aetiology of PFP is multifactorial, one of the first indications for
stratification [124]. Nine causes of PFP are presented here and many of these remain
speculative based on a small number of underpowered studies. As highlighted, these
proposed aetiologies are unlikely to be exclusive [63] and furthermore there is likely to be
differences in the causes of PFP along the age continuum e.g. adolescents vs. 40 years olds
[125]. These uncertainties would make stratifying based on aetiology very challenging and
therefore limits its inclusion within a stratified treatment approach.
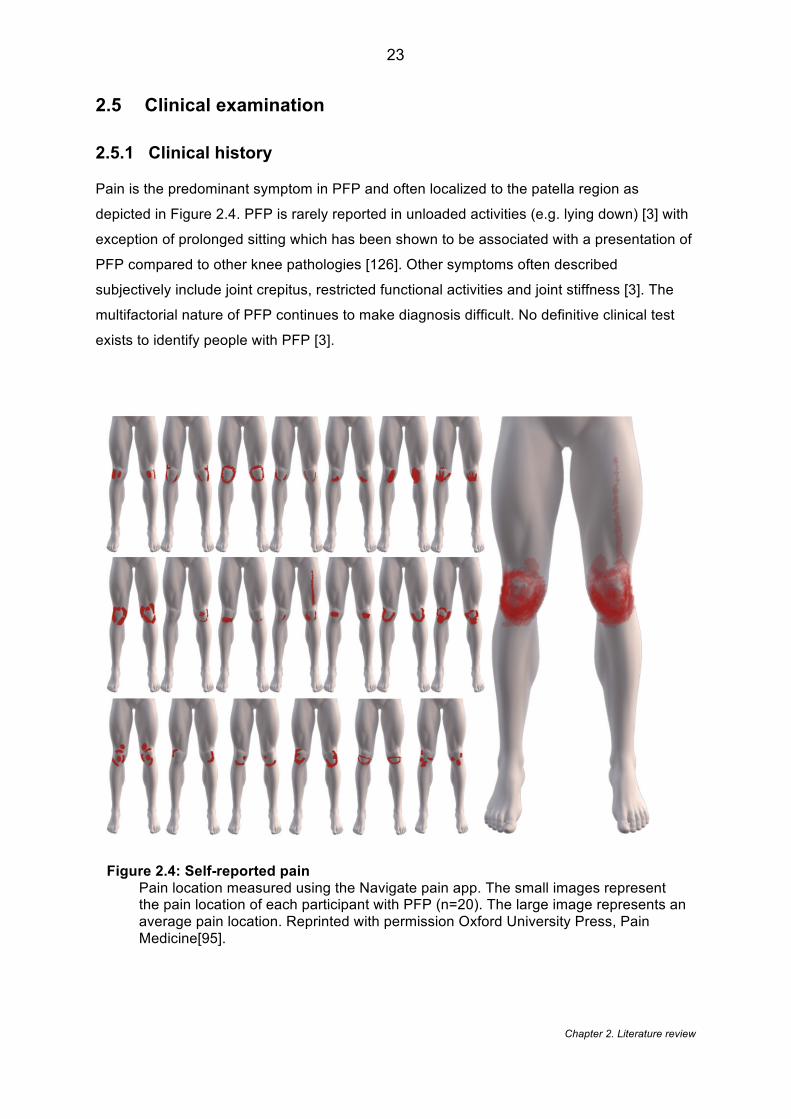
Chapter 2. Literature review
23
2.5 Clinical examination
2.5.1 Clinical history
Pain is the predominant symptom in PFP and often localized to the patella region as
depicted in Figure 2.4. PFP is rarely reported in unloaded activities (e.g. lying down) [3] with
exception of prolonged sitting which has been shown to be associated with a presentation of
PFP compared to other knee pathologies [126]. Other symptoms often described
subjectively include joint crepitus, restricted functional activities and joint stiffness [3]. The
multifactorial nature of PFP continues to make diagnosis difficult. No definitive clinical test
exists to identify people with PFP [3].
Figure 2.4: Self-reported pain Pain location measured using the Navigate pain app. The small images represent the pain location of each participant with PFP (n=20). The large image represents an average pain location. Reprinted with permission Oxford University Press, Pain Medicine[95].
Chapter 2. Literature review
24
2.5.2 Objective examination
A number of studies have investigated the diagnostic utility of musculoskeletal tests for PFP
[127-129] and two studies [23, 130] have reviewed the literature with the aim of selecting the
best clinical test to aid diagnosis. In the early 1980s, it was shown [128] that the ‘patella
friction test’ (synonymous with the Clarke test), considered at the time an important test for
diagnosing PFP, was still positive in 66% of a healthy cohort highlighting the poor diagnostic
accuracy of clinical tests in PFP. Further work has investigated the diagnostic test probability
of the following single tests [129]. Using positive likelihood ratios (LR+) (how much to
increase the probability of the disease if the test is positive) and negative likelihood ratios
(LR-) (how much to decrease the probability of the disease if the test is negative) the
following results were found: vastus medialis coordination test (LR+ 2.26; LR- 0.90); the
patellar apprehension test (LR+ 2.26; LR- 0.79); eccentric test (LR+ 2.34; LR- 0.71). All the
single tests showed a clinically relevant LR+ of > 2.0 but with no tests reached the <0.5 LR-
deemed clinically relevant by the authors [129]. It has been suggested that test accuracy
may be improved by combining tests [131].
The review by Cook et al. (2012) [23] focused on the diagnostic applicability of a
combination of tests. They showed that two of three of the following tests: pain with resisted
contraction; pain during squatting; and pain with medial or lateral patella palpation
demonstrated LR+ 4.0, LR- 0.5 and a post-test probability of 89%. This combination of tests
was challenged by the outcome of another review [130] which concluded that due to the LR-
0.2 yielded by the single lest of pain during squatting test, that the combination of tests was
not diagnostically superior to this single test. Both LR+ and LR- are important in determining
the accuracy of a diagnostic test. However, as PFP is widely considered a diagnosis of
exclusion [23] it could be suggested that greater importance be given to the LR+ as this is
ruling in the condition. This would mean that the LR+ 4.0 yielded by the combined pain with
resisted contraction; pains during squatting; and pain with medial or lateral patellar palpation
may be better to employ in clinical practice. The combined model also showed a greater
post-test probability compared to pain during squatting test (89% vs. 79%).
There are a number of difficulties with assessing diagnostic test accuracy in this population
[23]. Firstly, there is no agreed reference test available in which to compare the clinical test.
MRI and arthroscopy have been used in some studies [23, 132, 133] to rule out competing
pathology, however, MRI abnormalities have been shown to be highly prevalent with 89%
(631/710) of older adults without radiographic OA demonstrating MR findings, thus
questioning the specificity of MRI [134] . Consequently, most studies use the widely
Chapter 2. Literature review
25
accepted diagnostic algorithm which relates to pain reproduction with at least more than two
functional activities [3]. This system, however, has been questioned by Callaghan et al.
(2009) [126] who reported that there was no difference in reported pain for these activities
between a PFP group and group with other soft tissue knee problems. Another consideration
is that the case-control design does not accurately reflect true clinical practice when a level
of uncertainty exists which influences the decisions made [23]. This is made more
challenging by the fact that PFP is known to be heterogeneous in terms of its presentation
[3].
In summary, debate surrounds whether the combined tests are superior to the single test
(pain during squatting) when attempting to diagnose PFP. The comparison of post-test
probability values (above) would suggest that the combined tests should be considered
current best practice. However, if PFP continues to be considered a diagnosis by exclusion
then perhaps more emphasis should directed to improving the diagnostic accuracy of
differential diagnoses such as patella tendinopathy etc.
2.6 Patient reported outcome measures
A range of patient reported outcome measures (PROMs) have been applied to PFP.
Adapted from two systematic reviews[135, 136] , Table 2.3 details the description and
psychometric properties of the main outcomes used in both PFP research and in clinical
practice. Additional data is provided as a result of a further letter to editor [137] highlighting
the omission of the Modified Functional Index Questionnaire.
Published thresholds for intraclass correlation coefficients (ICC)[138], effect sizes [139] and
Cronbach alpha[140] were used to interpret the data in Table 2.3. It shows that all the
PROMs demonstrate an excellent test-rest reliability [138] except for the Visual Analogue
Scale (VAS) which shows only good reliability (ICC = 0.60). Using the effect size as measure
of responsiveness, Anterior Knee Pain scale (AKPS), Functional Index Questionnaire (FIQ),
VAS, worst VAS (VAS-w), International Knee Documentation (IKDC) and Activity of Daily
Living Scale (ADLs) all show good responsiveness [139]The Eng & Pierrynowski
questionnaire and usual VAS (VAS –u) show a moderate responsiveness. Internal
consistently has only been evaluated for five outcome measures using Cronbach alpha,
showing that both ADLs and IKDC have excellent [141] and MFIQ, AKP and FIQ have good
internal consistency. Concurrent validity was established based on looking at the outcome in
Chapter 2. Literature review
26
relation to other established measures. The Eng & Pierrowski questionnaire, Flandry
questionnaire, VAS-U and VAS-W demonstrate strong validity [139] and AKP, ADLs and
MFIQ demonstrated moderate validity.
In addition to the to the psychometric properties of the outcomes, Bennell et al. (2000) [142]
evaluated the questionnaires by asking people to rank the outcome measures in terms of the
easiest, the hardest, the most confusing, requires most explanation and best depicts
symptoms. The Flandry questionnaire was reported to be the most confusing (48.7%),
requires the most explanation (50%) but was considered to best depict symptoms (45.7%).
The FIQ was considered the easiest (38.3%) and Eng & Pierrynowski (39.5%) the hardest.
Based on the available data, the systematic review by Esculier et al. (2013) [135] concludes
that ADLs, AKPS and IKDC are the most recommended PROMs, however, the studies in the
final recommendation differ considerably from Green et al. (2014) [136] despite only a years
difference in the search completion ( August 2012 vs. August 2013). Only 6 of the 24 studies
used by Esculier et al. (2013) [135] were included by Green et al. (2014) [136]. This may be
result of Esculier et al. (2013) [135] including studies of mixed knee pain that included PFP
and other pathologies. This potentially affects the external validity of their findings and
recommendations. Overall, no consensus exists to which specific PROM should be used,
however, the latest consensus statement [20] suggests that a combination of PROMs to
capture pain, function and quality of life should be included.
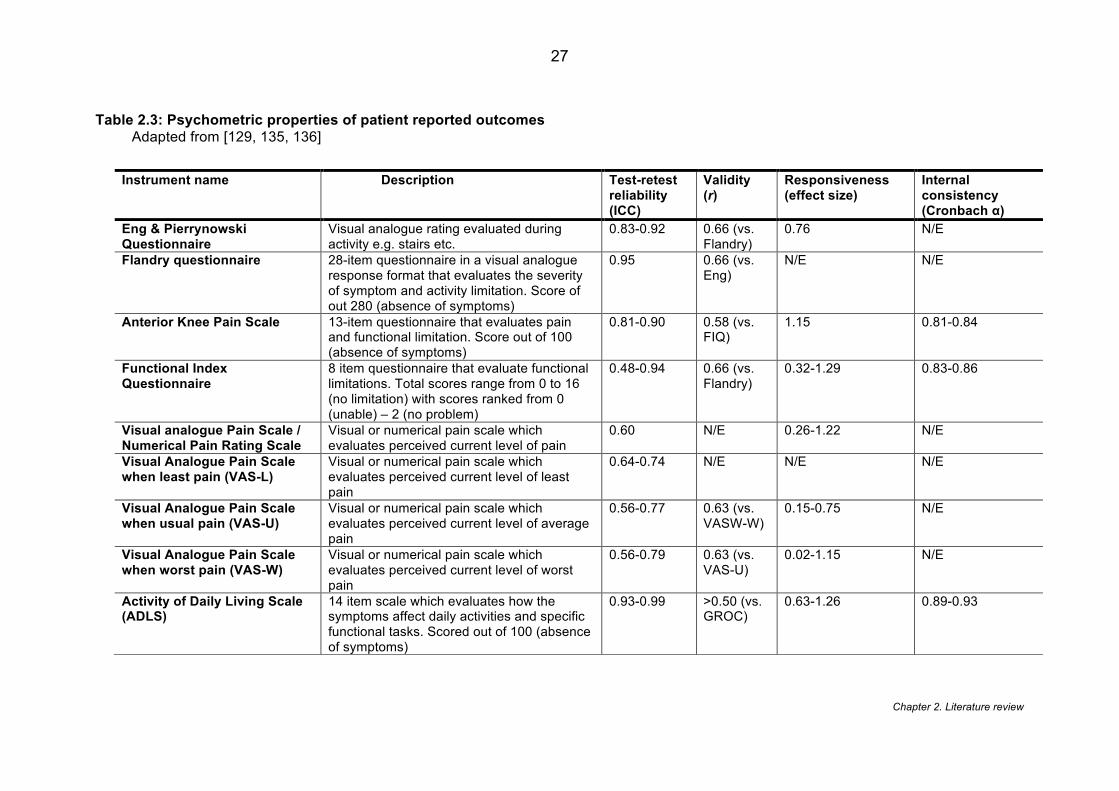
Chapter 2. Literature review
27
Table 2.3: Psychometric properties of patient reported outcomes Adapted from [129, 135, 136]
Instrument name Description Test-retest reliability (ICC)
Validity (r)
Responsiveness (effect size)
Internal consistency (Cronbach α)
Eng & Pierrynowski Questionnaire
Visual analogue rating evaluated during activity e.g. stairs etc.
0.83-0.92 0.66 (vs. Flandry)
0.76 N/E
Flandry questionnaire 28-item questionnaire in a visual analogue response format that evaluates the severity of symptom and activity limitation. Score of out 280 (absence of symptoms)
0.95 0.66 (vs. Eng)
N/E N/E
Anterior Knee Pain Scale 13-item questionnaire that evaluates pain and functional limitation. Score out of 100 (absence of symptoms)
0.81-0.90 0.58 (vs. FIQ)
1.15 0.81-0.84
Functional Index Questionnaire
8 item questionnaire that evaluate functional limitations. Total scores range from 0 to 16 (no limitation) with scores ranked from 0 (unable) – 2 (no problem)
0.48-0.94 0.66 (vs. Flandry)
0.32-1.29 0.83-0.86
Visual analogue Pain Scale / Numerical Pain Rating Scale
Visual or numerical pain scale which evaluates perceived current level of pain
0.60 N/E 0.26-1.22 N/E
Visual Analogue Pain Scale when least pain (VAS-L)
Visual or numerical pain scale which evaluates perceived current level of least pain
0.64-0.74 N/E N/E N/E
Visual Analogue Pain Scale when usual pain (VAS-U)
Visual or numerical pain scale which evaluates perceived current level of average pain
0.56-0.77 0.63 (vs. VASW-W)
0.15-0.75 N/E
Visual Analogue Pain Scale when worst pain (VAS-W)
Visual or numerical pain scale which evaluates perceived current level of worst pain
0.56-0.79 0.63 (vs. VAS-U)
0.02-1.15 N/E
Activity of Daily Living Scale (ADLS)
14 item scale which evaluates how the symptoms affect daily activities and specific functional tasks. Scored out of 100 (absence of symptoms)
0.93-0.99 >0.50 (vs. GROC)
0.63-1.26 0.89-0.93
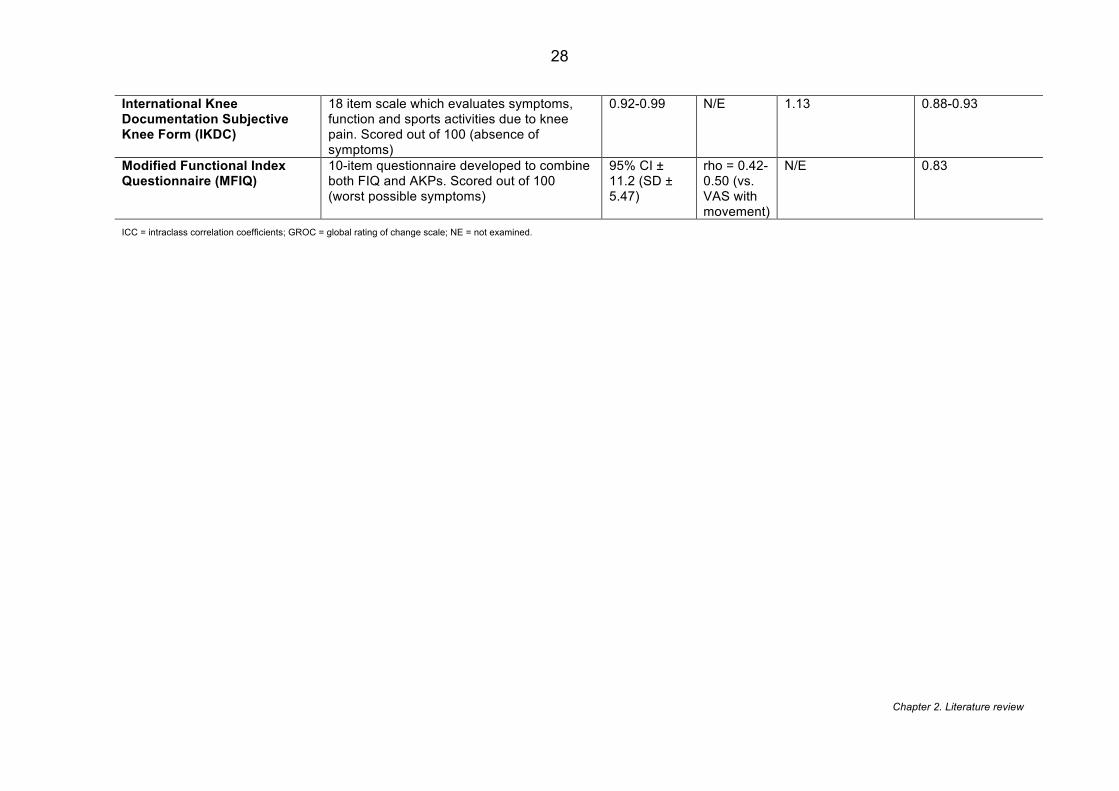
Chapter 2. Literature review
28
International Knee Documentation Subjective Knee Form (IKDC)
18 item scale which evaluates symptoms, function and sports activities due to knee pain. Scored out of 100 (absence of symptoms)
0.92-0.99 N/E 1.13 0.88-0.93
Modified Functional Index Questionnaire (MFIQ)
10-item questionnaire developed to combine both FIQ and AKPs. Scored out of 100 (worst possible symptoms)
95% CI ± 11.2 (SD ± 5.47)
rho = 0.42-0.50 (vs. VAS with movement)
N/E 0.83
ICC = intraclass correlation coefficients; GROC = global rating of change scale; NE = not examined.
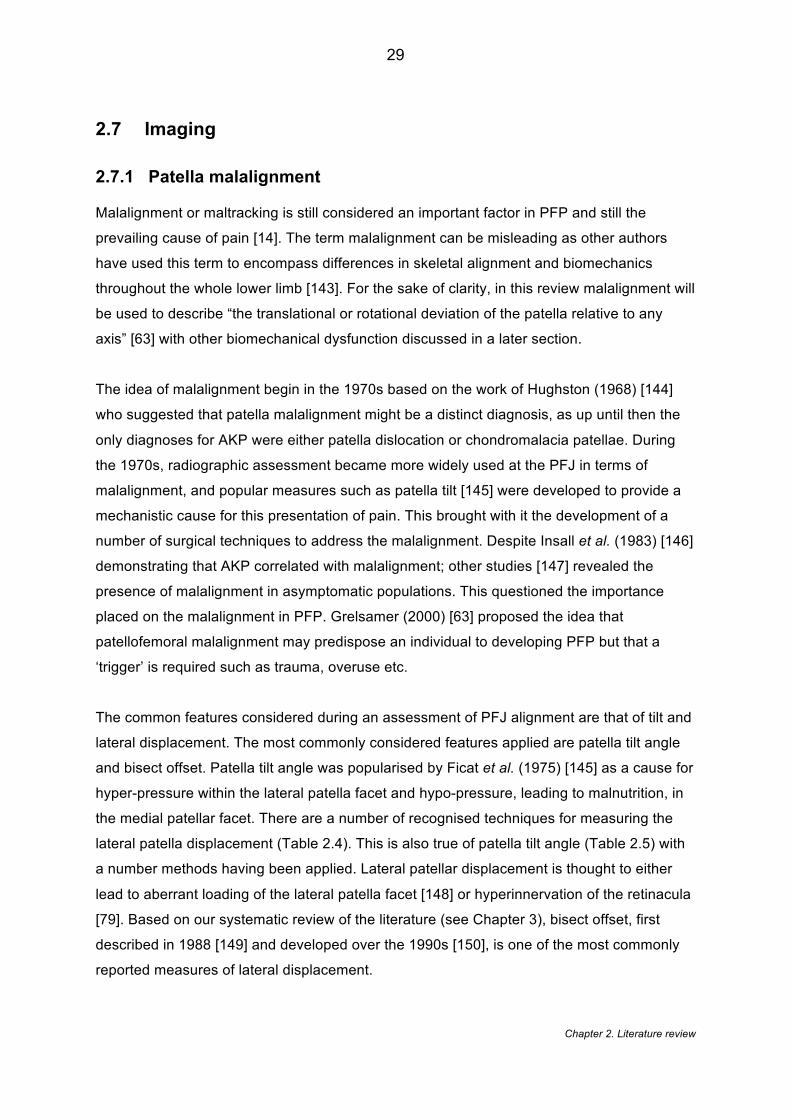
Chapter 2. Literature review
29
2.7 Imaging
2.7.1 Patella malalignment
Malalignment or maltracking is still considered an important factor in PFP and still the
prevailing cause of pain [14]. The term malalignment can be misleading as other authors
have used this term to encompass differences in skeletal alignment and biomechanics
throughout the whole lower limb [143]. For the sake of clarity, in this review malalignment will
be used to describe “the translational or rotational deviation of the patella relative to any
axis” [63] with other biomechanical dysfunction discussed in a later section.
The idea of malalignment begin in the 1970s based on the work of Hughston (1968) [144]
who suggested that patella malalignment might be a distinct diagnosis, as up until then the
only diagnoses for AKP were either patella dislocation or chondromalacia patellae. During
the 1970s, radiographic assessment became more widely used at the PFJ in terms of
malalignment, and popular measures such as patella tilt [145] were developed to provide a
mechanistic cause for this presentation of pain. This brought with it the development of a
number of surgical techniques to address the malalignment. Despite Insall et al. (1983) [146]
demonstrating that AKP correlated with malalignment; other studies [147] revealed the
presence of malalignment in asymptomatic populations. This questioned the importance
placed on the malalignment in PFP. Grelsamer (2000) [63] proposed the idea that
patellofemoral malalignment may predispose an individual to developing PFP but that a
‘trigger’ is required such as trauma, overuse etc.
The common features considered during an assessment of PFJ alignment are that of tilt and
lateral displacement. The most commonly considered features applied are patella tilt angle
and bisect offset. Patella tilt angle was popularised by Ficat et al. (1975) [145] as a cause for
hyper-pressure within the lateral patella facet and hypo-pressure, leading to malnutrition, in
the medial patellar facet. There are a number of recognised techniques for measuring the
lateral patella displacement (Table 2.4). This is also true of patella tilt angle (Table 2.5) with
a number methods having been applied. Lateral patellar displacement is thought to either
lead to aberrant loading of the lateral patella facet [148] or hyperinnervation of the retinacula
[79]. Based on our systematic review of the literature (see Chapter 3), bisect offset, first
described in 1988 [149] and developed over the 1990s [150], is one of the most commonly
reported measures of lateral displacement.
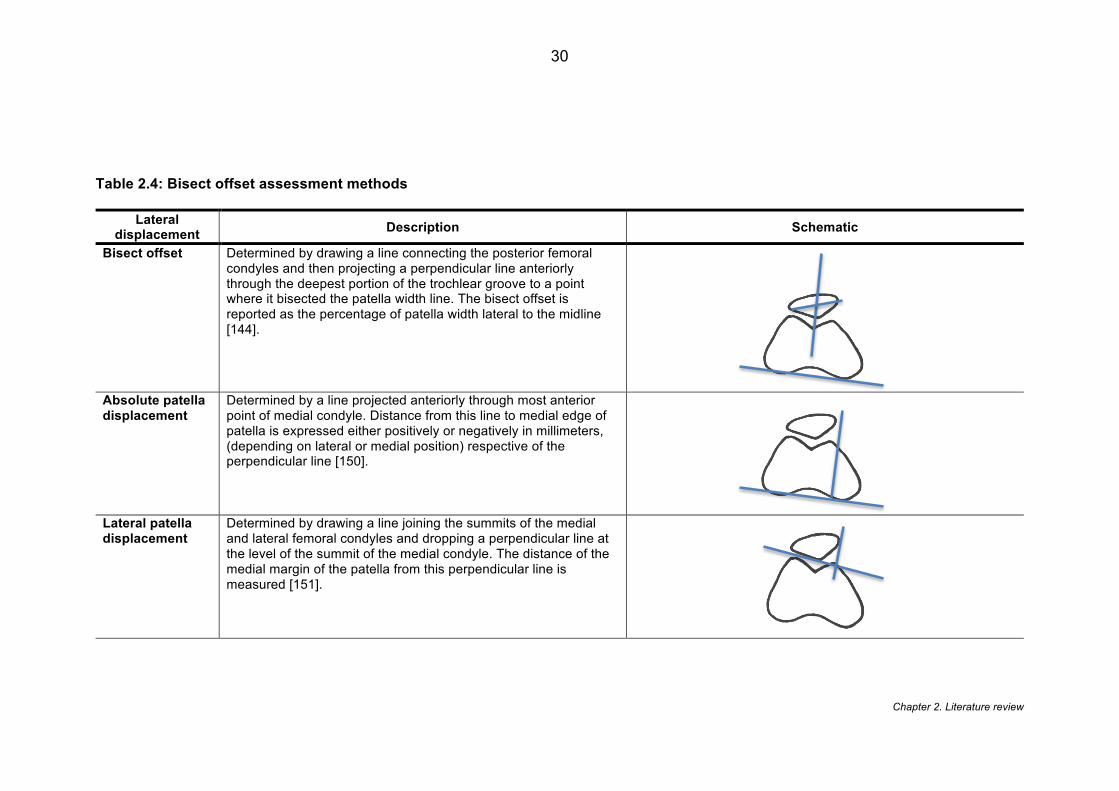
Chapter 2. Literature review
30
Table 2.4: Bisect offset assessment methods Lateral
displacement Description Schematic
Bisect offset Determined by drawing a line connecting the posterior femoral condyles and then projecting a perpendicular line anteriorly through the deepest portion of the trochlear groove to a point where it bisected the patella width line. The bisect offset is reported as the percentage of patella width lateral to the midline [144].
Absolute patella displacement
Determined by a line projected anteriorly through most anterior point of medial condyle. Distance from this line to medial edge of patella is expressed either positively or negatively in millimeters, (depending on lateral or medial position) respective of the perpendicular line [150].
Lateral patella displacement
Determined by drawing a line joining the summits of the medial and lateral femoral condyles and dropping a perpendicular line at the level of the summit of the medial condyle. The distance of the medial margin of the patella from this perpendicular line is measured [151].
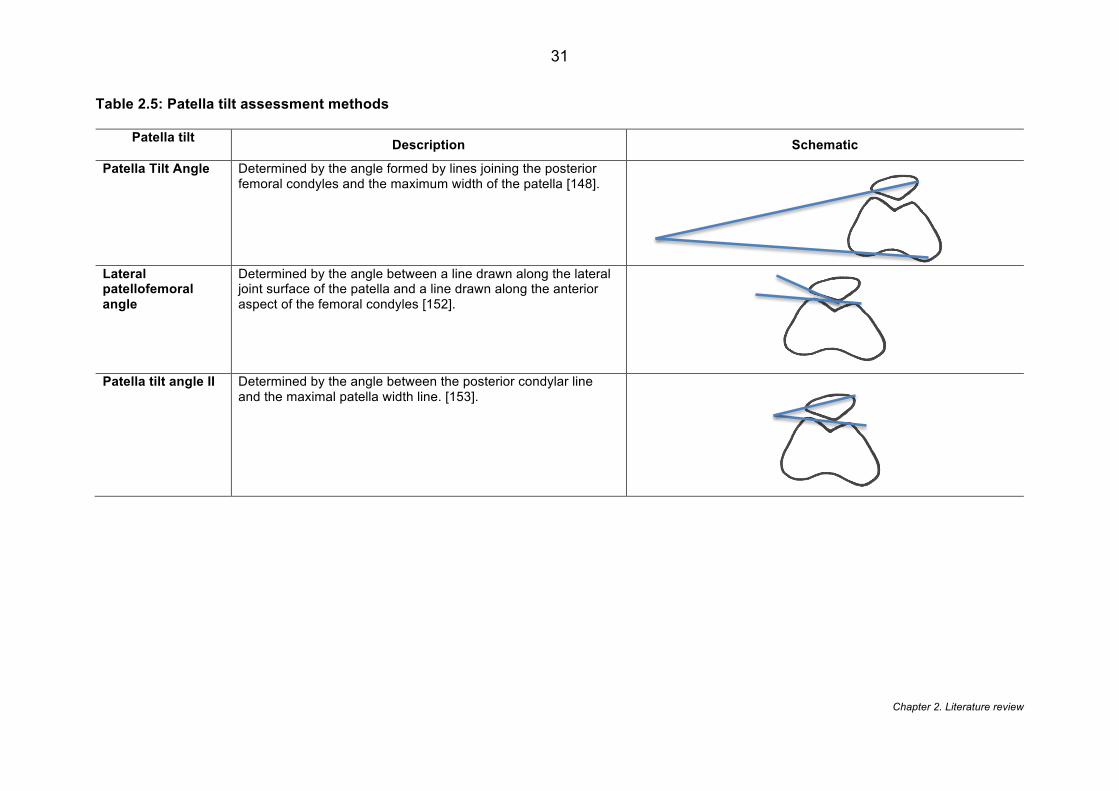
Chapter 2. Literature review
31
Table 2.5: Patella tilt assessment methods Patella tilt
Description Schematic
Patella Tilt Angle Determined by the angle formed by lines joining the posterior femoral condyles and the maximum width of the patella [148].
Lateral patellofemoral angle
Determined by the angle between a line drawn along the lateral joint surface of the patella and a line drawn along the anterior aspect of the femoral condyles [152].
Patella tilt angle II Determined by the angle between the posterior condylar line and the maximal patella width line. [153].
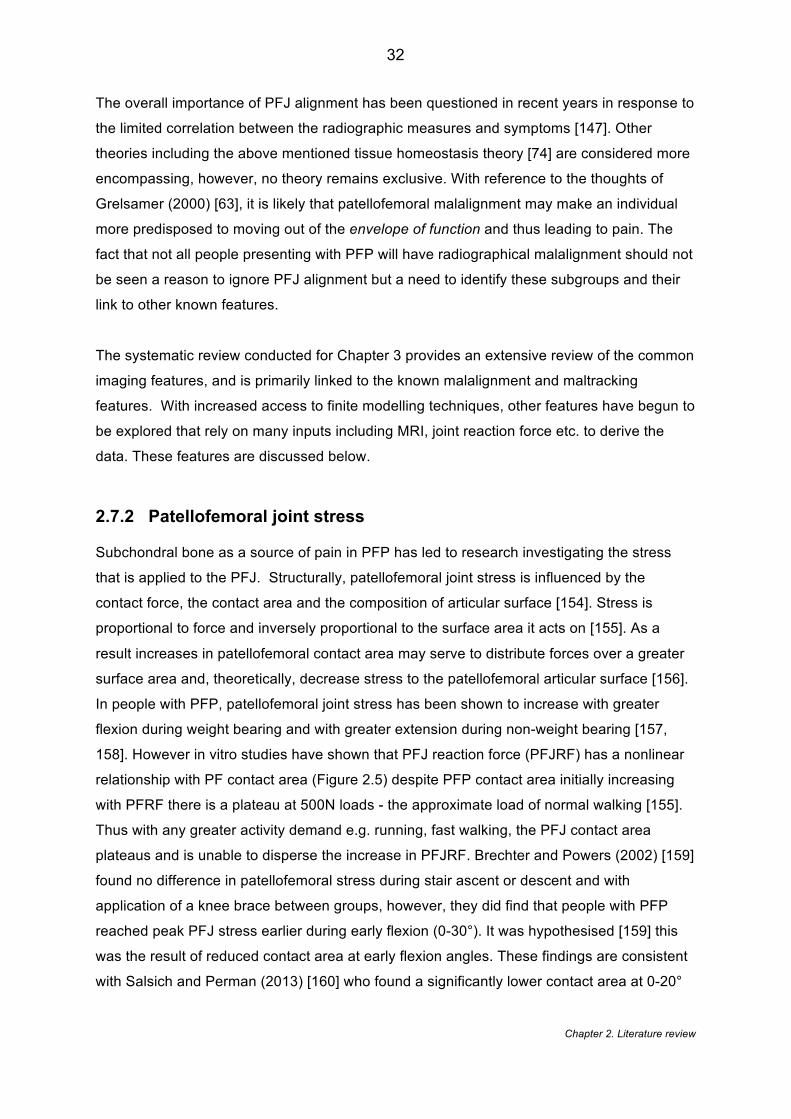
Chapter 2. Literature review
32
The overall importance of PFJ alignment has been questioned in recent years in response to
the limited correlation between the radiographic measures and symptoms [147]. Other
theories including the above mentioned tissue homeostasis theory [74] are considered more
encompassing, however, no theory remains exclusive. With reference to the thoughts of
Grelsamer (2000) [63], it is likely that patellofemoral malalignment may make an individual
more predisposed to moving out of the envelope of function and thus leading to pain. The
fact that not all people presenting with PFP will have radiographical malalignment should not
be seen a reason to ignore PFJ alignment but a need to identify these subgroups and their
link to other known features.
The systematic review conducted for Chapter 3 provides an extensive review of the common
imaging features, and is primarily linked to the known malalignment and maltracking
features. With increased access to finite modelling techniques, other features have begun to
be explored that rely on many inputs including MRI, joint reaction force etc. to derive the
data. These features are discussed below.
2.7.2 Patellofemoral joint stress
Subchondral bone as a source of pain in PFP has led to research investigating the stress
that is applied to the PFJ. Structurally, patellofemoral joint stress is influenced by the
contact force, the contact area and the composition of articular surface [154]. Stress is
proportional to force and inversely proportional to the surface area it acts on [155]. As a
result increases in patellofemoral contact area may serve to distribute forces over a greater
surface area and, theoretically, decrease stress to the patellofemoral articular surface [156].
In people with PFP, patellofemoral joint stress has been shown to increase with greater
flexion during weight bearing and with greater extension during non-weight bearing [157,
158]. However in vitro studies have shown that PFJ reaction force (PFJRF) has a nonlinear
relationship with PF contact area (Figure 2.5) despite PFP contact area initially increasing
with PFRF there is a plateau at 500N loads - the approximate load of normal walking [155].
Thus with any greater activity demand e.g. running, fast walking, the PFJ contact area
plateaus and is unable to disperse the increase in PFJRF. Brechter and Powers (2002) [159]
found no difference in patellofemoral stress during stair ascent or descent and with
application of a knee brace between groups, however, they did find that people with PFP
reached peak PFJ stress earlier during early flexion (0-30°). It was hypothesised [159] this
was the result of reduced contact area at early flexion angles. These findings are consistent
with Salsich and Perman (2013) [160] who found a significantly lower contact area at 0-20°
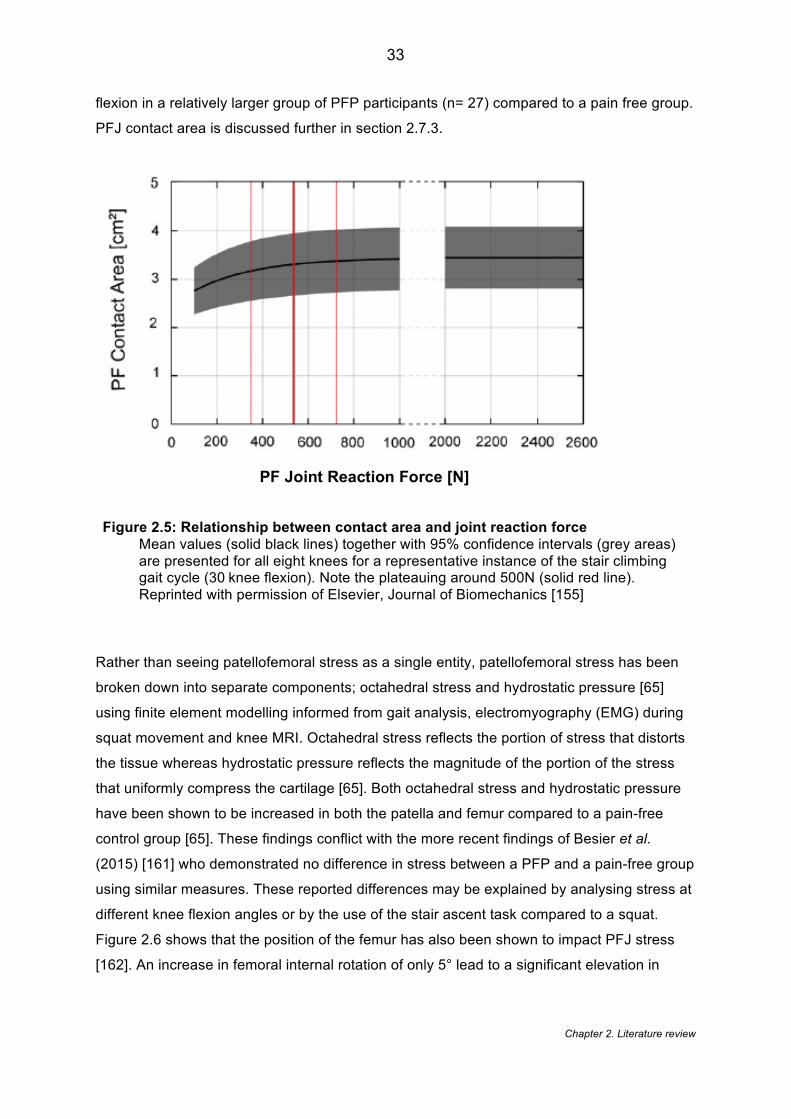
Chapter 2. Literature review
33
flexion in a relatively larger group of PFP participants (n= 27) compared to a pain free group.
PFJ contact area is discussed further in section 2.7.3.
Figure 2.5: Relationship between contact area and joint reaction force Mean values (solid black lines) together with 95% confidence intervals (grey areas) are presented for all eight knees for a representative instance of the stair climbing gait cycle (30knee flexion). Note the plateauing around 500N (solid red line). Reprinted with permission of Elsevier, Journal of Biomechanics [155]
Rather than seeing patellofemoral stress as a single entity, patellofemoral stress has been
broken down into separate components; octahedral stress and hydrostatic pressure [65]
using finite element modelling informed from gait analysis, electromyography (EMG) during
squat movement and knee MRI. Octahedral stress reflects the portion of stress that distorts
the tissue whereas hydrostatic pressure reflects the magnitude of the portion of the stress
that uniformly compress the cartilage [65]. Both octahedral stress and hydrostatic pressure
have been shown to be increased in both the patella and femur compared to a pain-free
control group [65]. These findings conflict with the more recent findings of Besier et al.
(2015) [161] who demonstrated no difference in stress between a PFP and a pain-free group
using similar measures. These reported differences may be explained by analysing stress at
different knee flexion angles or by the use of the stair ascent task compared to a squat.
Figure 2.6 shows that the position of the femur has also been shown to impact PFJ stress
[162]. An increase in femoral internal rotation of only 5° lead to a significant elevation in
PF Joint Reaction Force [N]
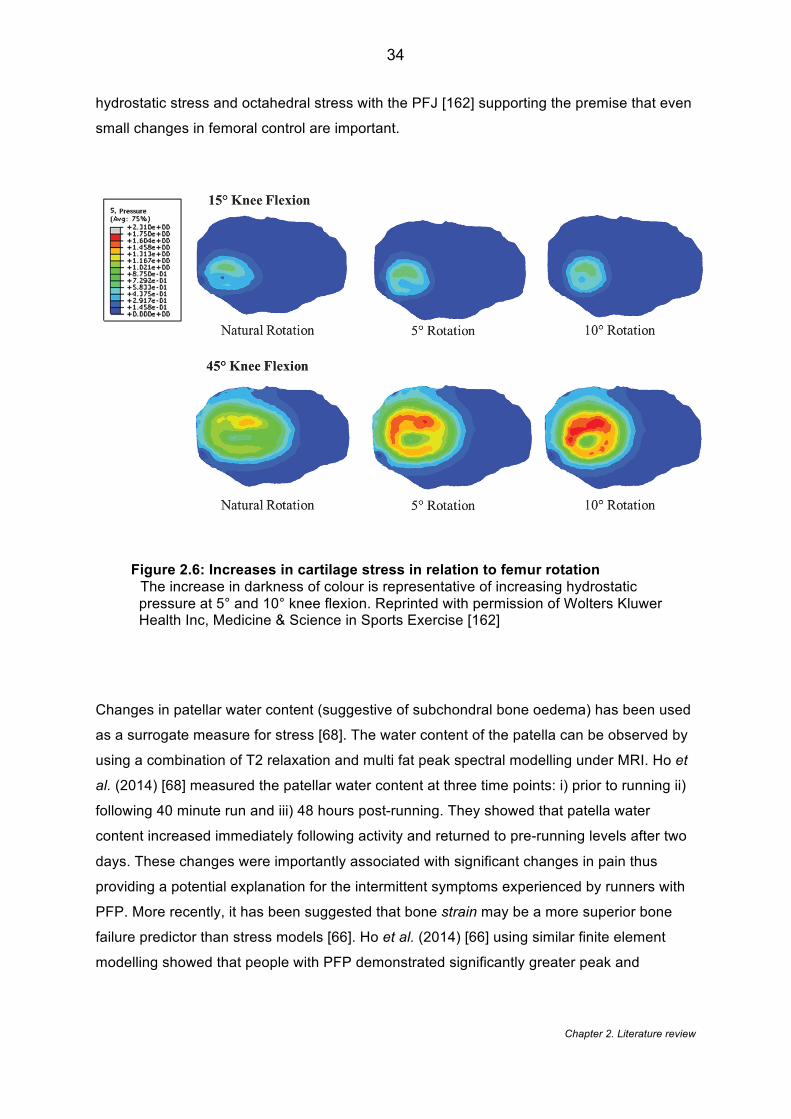
Chapter 2. Literature review
34
hydrostatic stress and octahedral stress with the PFJ [162] supporting the premise that even
small changes in femoral control are important.
Figure 2.6: Increases in cartilage stress in relation to femur rotation The increase in darkness of colour is representative of increasing hydrostatic pressure at 5° and 10° knee flexion. Reprinted with permission of Wolters Kluwer Health Inc, Medicine & Science in Sports Exercise [162]
Changes in patellar water content (suggestive of subchondral bone oedema) has been used
as a surrogate measure for stress [68]. The water content of the patella can be observed by
using a combination of T2 relaxation and multi fat peak spectral modelling under MRI. Ho et
al. (2014) [68] measured the patellar water content at three time points: i) prior to running ii)
following 40 minute run and iii) 48 hours post-running. They showed that patella water
content increased immediately following activity and returned to pre-running levels after two
days. These changes were importantly associated with significant changes in pain thus
providing a potential explanation for the intermittent symptoms experienced by runners with
PFP. More recently, it has been suggested that bone strain may be a more superior bone
failure predictor than stress models [66]. Ho et al. (2014) [66] using similar finite element
modelling showed that people with PFP demonstrated significantly greater peak and
Chapter 2. Literature review
35
average principal strain magnitudes in the patella region. Furthermore they demonstrated
that cartilage thickness appears negatively associated with peak strain.
2.7.3 Patellofemoral contact area
As mentioned previously, it has been suggested that people with PFP have a reduced
contact area during the early part of the flexion [159, 160]. However, these findings are
dependent upon the method of analysis and quantification. A number of the studies have
used biomechanical modelling to quantify the stress and contact area at the patellofemoral
joint [65, 159, 161, 163, 164]. Besier et al. (2005) [154] proposed that patellofemoral contact
area is influenced by the testing variables such as knee flexion position and physiological
weight bearing. They showed that the variation between unloaded and loaded conditions
can lead to an increase in anything between 10 -100% in contact area with an average of
24%. This suggests that any PFJ imaging data findings need to be interpreted with
consideration of loading and the knee flexion position. Whereas Besier et al. (2005) [154]
used a healthy cohort, Salsich and Perman (2007) [165] investigated which factors explained
patellofemoral contact area in people with PFP. They showed that patellar width and
tibiofemoral rotation explained 46% of the variation in contact area. The concept of patellar
width is also supported by Besier et al. (2005) [154] who found a difference between males
and females in terms of patellofemoral contact area but no difference was found once
normalised for patellar height and width. This highlights the importance of gender in the
interpretation of the findings. This gender difference is highlighted in Chapter 4. Due to the
differences in patellofemoral joint anatomy, data should only be interpreted using gender-
specific thresholds.
Observing a change in patellofemoral contact area is noteworthy; however, its importance
can only be considered in relation to the clinical symptoms. There is a paucity of literature
using contact area as an outcome of intervention and linking this to clinical symptoms. The
few studies that have explored the link [166, 167] do suggest a relationship between contact
area and pain. The application of a patellofemoral brace has been shown to increase
patellofemoral contact area in people PFP with an associated 56% reduction in pain [167]
thus demonstrating a potential link between structure and pain. Chiu et al. (2012) [166] also
investigated that effect of an intervention on patellofemoral joint contact area. Using a within
- group comparison they showed a significant change in contact area following an eight
week quadriceps strengthening intervention. The combined sample size from both studies of
people with PFP was relatively small (n =24) suggesting caution is advised when interpreting
Chapter 2. Literature review
36
these findings, however, this demonstrates a promising link between PFJ structure and the
mechanistic effect of treatment.
All these findings are in contrast to Connolly et al. (2009) [168] who demonstrated higher
contact area in PFP versus a control group at 15°. It may be that this inconsistency in
findings may simply be the result of small PFP sample size (n=10) and a type II error.
However, despite all studies using MRI, the analysis of the images varies greatly. Connolly
et al. (2009) [168] scored from a digitised image capturing the 3D nature of the
patellofemoral joint whereas the other studies [159, 167], despite using complex
biomechanical models to quantify the overall patellofemoral stress, quantify the contact area
based on only axial MR slices which fail to represent the 3D nature of the PFJ (see Chapter
4 for further details). This shows that measuring patellofemoral stress and contact area is
dependent upon a number of factors including MR assessment as well as gender,
physiological loading, and knee angle position [154]. As a result, a level of caution is
required when interpreting and generalising the results.
2.7.4 Cartilage thickness
The composition of articular surface is an important component of PFJ stress and as such
remains a feature of interest [154]. Cartilage thickness in patellofemoral pain was initially
explored by quantifying the cartilage thickness at three locations on the patella and femur.
Draper et al. (2006) [169] demonstrated that males with PFP had a significantly reduced
patellar cartilage thickness compared to a control group but that there was no difference in
femoral cartilage. Females demonstrated no difference between PFP and controls for either
patella or femoral cartilage. However, when results were adjusted for body mass there was
no difference in either group or gender. This pattern of results is consistent with the findings
of Connolly et al. (2009) [168] who showed no difference in patellar cartilage thickness
between a PFP and a healthy control group. In contrast, a number of more recent studies
[66, 170], both of which used all-female cohorts, found significantly reduced patella cartilage
thickness compared to pain free control groups. There may be a number of methodological
reasons for the contrast in findings. Draper et al. (2006) [169] used the modified Outerbridge
system which aims to classify joint cartilage breakdown. It is apparent that the author was
attempting to rule out the presence of degenerative change, however, it is also arguable that
using the Outerbridge classification as an inclusion criteria can introduce a selection bias as
the classification tool focuses on the loss of cartilage. Perhaps most importantly, both
Farrokhi et al. (2011) [170] and Ho et al. (2014) [66] used a matched control group that
Chapter 2. Literature review
37
controlled for known confounding factors such as age, body mass index and physical
activity. This level of adjustment may have led to the detection of differences in cartilage
thickness between groups.
2.7.5 Quantitative MRI
Quantitative MRI techniques have recently been explored to further understand the
composition of cartilage and to offer some link between PFP and PFOA [171]. A number of
quantitative techniques can be applied. T1 relaxation time detects the changes in
proteoglycan content of the cartilage [172]. Whereas T2 relaxation time detects the ability of
the free water protons to move within the cartilage matrix; a measure of cartilage integrity
[172]. Within PFP, a few studies have shown no difference between PFP and controls in
terms of T2 relaxation [170, 171]. Differences have been noted in T1 relaxation times in the
lateral facets with people with PFP demonstrating higher T1 values [173]; however, this is
not a consistent finding. van der Heijden et al. (2016) [171] found with a much larger sample
size no difference in T1 relaxation between a PFP and control group. They attribute this to
the adjustment made for known confounders such as physical activity level. However, in
contrast to the other variables they investigated T1 values in the lateral femur and patella
were consistently higher in PFP suggesting a trend towards an agreement with the previous
study [173]. van der Heijden et al. (2016) [171] also used the most validated method of
measuring cartilage composition, [174] delayed contrast-enhanced MRI of cartilage
(dGEMRIC) technique, which measures the change in glycosaminoglycans (GAGs). GAGs
are thought to precede the loss of cartilage in OA so are considered a suitable indicator of
early cartilage loss and degeneration [171, 172]. A intravenous contrast agent is given and
distributes in the cartilage with an inverse relationship to the negatively charged GAGs [175,
176]. The GAG content can be calculated by differences in T1 values. Despite it being
considered the most validated method, no differences were noted between groups for T1
values [171].
2.7.6 Kinematic MRI
The application of kinematic MRI for the patellofemoral joint appears to originate from the
early work of Shellock and colleagues [177]. As PFP is primarily considered to be related to
dynamic maltracking, the need to visualise tissue during movement seems important.
Kinematic MRI in its simplest form has been applied to people with patellofemoral pain, with
individuals positioned supine and the knee adjusted to a variety of angles and with low
resolution images captured [178, 179]. More recently, groups have begun to explore different
Chapter 2. Literature review
38
techniques. Cine phase contrast (Cine-PC) MR Imaging has been utilised to investigate
patellofemoral motion in vivo [180-182]. Cine-PC imaging combines two techniques to
generate tissue velocities in the x, y, and z planes. Cine PC MRI is considered very accurate
and precise [183], however to ensure this accuracy the procedures requires a number of
accurate repetitions which is challenging with a symptomatic patient, likely more prone to
fatigue [184]. The better variant to limit fatigue is Real Time MRI which only requires one
motion cycle [185]. Real-time imaging has been used by Draper et al. (2009) [148] with
patellofemoral pain during full weight. This technique is arguably more clinically accurate to
assess PFP in which pain is elicited in weight bearing [148]. Real time MRI has the added
advantage that the imaging plane can be continuously defined to track an object [185].
2.7.7 Link between PFP imaging and stratification
In summary, this section has identified a number of imaging features which could be
targeted with treatment - an indication for stratification. It clearly shows that there is a
growing interest in more complex PFJ imaging features. PFP has been shown to be
associated with: an increase in PFJ stress and strain; a reduction in PFJ contact area; and
an increase T1 relaxation times in the lateral patella. These features may have the potential
to be future treatment targets but currently there is a limited evidence to support
interventions that would elicit a clinical change in these measures. Patella malalignment
features e.g. bisect offset, patella tilt etc., in contrast, remain the most commonly
investigated measures within PFP and known to be modifiable with knee orthoses (see
section 2.9.4.2) and taping (see section 2.9.3.2). These features should therefore be
considered for future subgrouping. With a variety of imaging techniques in terms of knee
flexion position, weight bearing etc. a greater understanding of how these factors affect PFJ
imaging features and their association with PFP is also warranted.
2.8 Biomechanics
2.8.1 Hip biomechanics
2.8.1.1 Strength deficits
Over the last 10 years more attention has been paid to the role of the hip in PFP [186].
Research has sought to quantify and objectify the influence of the hip people with PFP and
establish hip-specific interventions. It is now well established in the literature that some
people with PFP demonstrate weakness in concentric [187]; isometric [186, 188-191] and
Chapter 2. Literature review
39
eccentric [192, 193] hip abduction. Furthermore, a recent meta-analysis showed that hip
abduction strength was a significantly associated to PFP [194]. Many academics and
clinicians alike support the idea that hip external rotation is also an associated deficit in
people with PFP [186, 188, 189, 191, 192], however, studies have found contrasting findings
[193, 195]. The exact reason for this inconsistency is unclear, however, variations in strength
testing procedures and measurements are likely to have had an influence on the eventual
findings. The concept of hip strength and activation deficits has been further explored by
investigating the effect of fatigue on hip kinematics. There is consistent evidence that these
muscle groups weaken following exertion and that people with PFP show a significantly
greater reduction than a control group [196, 197]. As highlighted clearly by Lack et al. (2015)
[198] there is a tendency for ‘strength’ to be used to be used to encompass all types muscle
contractions whilst these are likely to derive different results. A recent review [199] attempted
to investigate muscle endurance but was unable to pool the data from studies investigating
hip muscle endurance in PFP but did find conflicting evidence for differences in hip muscle
endurance. Souza and Powers (2009) [200] showed 49% and 40% less hip extension and
pelvic drop repetitions were performed respectively in females with PFP. Whereas
McMoreland et al. (2011) [201] showed no difference between groups using a isokinetic
dynamometer to measure total work (in joules) after 30 concentric contractions. The
influence of bilateral and unilateral pain on hip muscle strength has also been briefly
considered [202]. It has been shown that people with bilateral PFP have weakness in all hip
muscle groups compared to those with unilateral PFP who demonstrated no weakness in
their medial rotators and adductors [202]. The reason for this disparity is unknown yet
considering the fact that a typical cohort of PFP will include both unilateral and bilateral PFP
patients so this becomes an important consideration when planning interventions and
comparing groups.
2.8.1.2 Hip kinematics & kinetics
An array of tasks have been used to explore the presumed movement dysfunction in people
with PFP [20]. Running, jumping, stairs and walking have all been investigated, each
providing unique task demands [200]. Hip internal rotation and hip adduction angle
displacement are the common metrics investigated [203], however, other proximal features
might include pelvic obliquity and drop [204, 205]. Stair descent has been selected by a
number of studies as a task to explore hip kinematics [188, 200, 203, 206, 207] due to the
fact it is a commonly reported aggravating activity for people with PFP [3], creating a known
increase in joint load of up to eight times body weight compared to level walking [208].
Chapter 2. Literature review
40
Contrasting findings in hip kinematics during stair descent have been reported, with some
studies reporting significant differences in hip internal rotation [200, 207] and hip adduction
[207] with others finding no differences in either movement plane [188, 203]. Explanation of
these differences in unclear, however, one of the authors did normalise the hip joint angle to
zero based on their standing posture during the calibration phase whereas the other study
quantified hip joint angle regardless of standing posture [200]. The differences observed may
also reflect differences in baseline pain, step height, stepping duration [206] and possibly
baseline hip muscle strength.
2.8.1.3 Neuromuscular activity
Using EMG, authors have attempted to specifically identify the muscle activity that is
occurring at the hip joint. A number of studies have shown that the gluteus medius in people
with PFP, responsible for controlling the transverse and coronal plane of the lower limb, has
delayed activity and shorter duration in both stairs [195, 209, 210] and running [211]
compared to healthy controls. Despite being more recognised as a primary hip extensor,
gluteus maximus is also the primary external rotator of the hip [200]. There is evidence that
gluteus maximus activation is different between PFP and healthy controls [200] whereas
other studies have found no difference [211, 212]. These conflicting findings could be
explained by studying different points within the stance phase e.g. toe off, heel strike etc. It is
known, for instances, that the amount of stance phase will influence the amount of gluteus
maximus activation [213].
2.8.2 Knee biomechanics
2.8.2.1 Strength deficits
Quadriceps weakness remains one of the most recognised associated features of PFP. A
review of the literature shows that people with PFP display more quadriceps atrophy than
healthy controls [214] and quadriceps weakness is also the only risk factor for PFP that is
supported consistently across multiple studies [194].
2.8.2.2 Vastus Medialis Oblique
In 1986, McConnell published a seminal paper highlighting the importance of vastus medialis
oblique (VMO) strength in PFP [215]. Since then a number of studies [85, 216-221] have
supported this hypothesis suggesting that the VMO has a decreased and delayed activity
compared to the vastus lateralis (VL). In contrast, other studies [222-227] have disputed this
Chapter 2. Literature review
41
findings by finding no such delay in activity. With consideration of the anatomy, it has been
suggested that the VMO is most active at increased angles of knee flexion [31]. However,
the stabilising effect of VMO is less required at these angles when the patella has greater
containment within the trochlea [31]. In contrast, Jan et al. (2009) [228] showed using
ultrasound with mean measurement error of 0.22 º, that a PFP group (n=51) had a VMO with
a more proximal attachment on the patella and lower horizontal fibre angle suggesting a less
effective medial pull. Nonetheless the clinical meaningfulness of differences in fibre angle of
3.5 º and insertion attachment of 0.4 mm remains questionable. The clinical implications of
the findings are convoluted, as there is paucity of literature to support the minimal clinically
meaningful difference of the EMG readings. It has been suggested that differences in timing
lower than 5ms can lead to biomechanical difference in healthy male subjects [229], but this
may not then relate to a symptomatic, commonly female PFP population. It may also be that
the heterogeneous nature of the PFP population has led to inconsistencies in findings. A
recent study sub-categorised people into ‘maltrackers’ with excessive patella tilt and bisect
offset and found that this population had that largest correlation to VMO activation delay
[230] suggesting VMO might have a clinical effect on patella kinematics.
A few authors have considered the whole of the literature surrounding VMO in PFP. Chester
et al. (2008) [231] systematically reviewed the current literature and highlighted the on-going
discrepancy in findings. They suggested number of potential source of heterogeneity that
surrounds the methodology, population and procedural variations e.g. EMG electrode
placement, onset determination methods etc. Wong (2009) [232] in their literature review
categorised studies according to EMG procedural variations demonstrating a large variability
in the onset determination, with applied onset thresholds varying from one to five standard
deviations. These onset parameters are important, however, as long as studies standardise
these onset thresholds for both muscles (VL and VMO) and both groups then this is thought
to have little effect on the relative activation times and the between group differences
observed [231].
2.8.2.3 Knee kinematics & kinetics
One gait measure that has been shown to differ between PFP and healthy controls is the
amount of knee flexion in free walking [233-235] and stair use [159, 206, 210, 236, 237]. It
has been suggested that people with PFP show a reduced knee flexion during stance
phase. This finding, however, is not universally supported by all the literature [235] and may
be the result of small sample sizes leading to type II error. Increases in knee flexion have
Chapter 2. Literature review
42
been noted when pain is reduced by the application of tape [238]. This would suggest that
observed reduction in knee flexion in previous studies might be a pain avoiding strategy.
Reducing the knee flexion angle is thought to reduce the knee extensor moment thus
reducing the strength of the overall contraction required [234] . This is considered a common
strategy for an inhibited muscle group.
Joint coupling variability is an index of the inter-segment system variations necessary to
allow the movement system to adapt to changing constraints from one situation to the next
[239]. Joint coupling variability has been highlighted as important for maintaining a healthy
musculoskeletal system [240]. Lower variability in joint coordination (reduced ability to adapt
to movement perturbations) is purported to increase soft tissue loading and increase the
likelihood of pathology [241]. PFP is a condition long thought to be impacted by this reduced
joint coupling variability [240] in particular across the knee in three movement planes.
Nevertheless this is not a consistent finding. No differences were found between people with
and without PFP whilst running at a self-selected pace [242]. Furthermore, a more recent
study with a larger sample size showed that PFP demonstrated a greater joint coupling
variability [241] contradicting the historical view. This contrasting finding may be explained
by only including people with a greater baseline pain (three out of 10 VAS). The increase in
variability would lend itself to a pain avoiding strategy, reducing stress on inflamed tissue
[241]. It also conceivable that people with a higher baseline pain will have decreased motor
control and thus greater movement translation [243].
2.8.2.4 Flexibility
Stretching often forms a key component of most multimodal programmes used in
interventional research studies and reflects the widespread use in clinical practice [16]. The
muscles targeted for stretching in PFP interventions almost always comprise of muscles
around the knee joint, which include quadriceps, hamstrings and calf complex. Despite the
common prescription of such stretches, there are only a few studies to support the
association of muscle inflexibility and PFP [55, 244-247]. Quadriceps [55, 245, 246] and calf
(gastrocnemius and soleus) [55, 246] flexibility have been shown to be significantly worse in
people with PFP compared to asymptomatic controls. Hamstring flexibility is the subject of
conflicting evidence, with a few studies [244, 247], from the same research group,
demonstrating a significant difference in hamstring length for PFP, which conflicts with other
findings [55]. These differences may be the result of different testing procedures, with the
latter study [55] using the straight leg raise test and measuring the angle of the hip in
Chapter 2. Literature review
43
contrast to the popliteal angle used in the other studies. The popliteal angle has been
suggested to have a potential ceiling effect, with a number of people found to be able to
reach full knee extension [248]. The straight leg raise on the other hand has been criticised
for being difficult to stabilise the pelvis during testing and for the increased engagement of
sciatic nerve which may influence the specificity (hamstring length) of the test [249]. It is also
worth noting that Patil et al. (2010) [244] and White et al. (2009) [247] from the same
research group actually report the popliteal angle differently in PFP, with the former reporting
the angle from 0° ( full knee extension) despite arriving at the same conclusions. The effect
of testing procedure is highlighted by the study by Peeler and Anderson (2007) [245]. They
had patients undergo a three-week quadriceps programme and then assessed their pre
interventional changes in quadriceps length using three different testing procedures. For the
PFP group, significant differences were noted in the pre vs post results obtained using the
Kendall test (Mean difference [MD] 4º) but no differences noted using the Thomas (MD 0º)
or Elvey (MD 1º) tests despite all procedures intended to measure the same thing.
2.8.2.5 Joint mobility
Generalised hypermobility has long been associated with PFP [250] and is anecdotally
considered to be important factor in the development of PFP . It is surprising, therefore, that
a limited amount of evidence exists to support any association. Al-Rawi and Nessan (1997)
[250] compared 115 people with AKP compared to 110 controls finding significantly greater
hypermobility scores in the AKP group, based on the Beighton score. The understanding of
why people with hypermobility get PFP may lie in the fact that ligament laxity reduces the
joint constraints leading to malalignment and subsequent joint stress [181]. Conversely, Al-
Rawi and Nessan (1997) [250] also reveal that 44% of people diagnosed with AKP have
normal hypermobility scores (0-3) suggesting that subgroups of joint mobility exist. Witvrouw
et al. (2000) [55] explored whether general joint hypermobility, which included measures of
thumb apposition to the forearm and knee, elbow and little finger hyperextension
(components of the Beighton score) predicted the development of PFP. Of all these
measures, only a greater thumb to forearm was significant in developing PFP. This contrast
to the study by Al-Rawi and Nessan (1997) [250] would refute the causative nature of
general laxity in developing PFP.
The lateral and medial mobility of patella is known to vary within the patellofemoral
population with some people with excessive and others with limited mobility [251]. The effect
of patellar mobility is unknown but, in accordance to generalised hypermobility, when a
Chapter 2. Literature review
44
patella is deemed hypermobile there is a perceived loss of patella restraint integrity [252].
There are a number of methods to measure patellar mobility: lateral glide only [181]; medial
glide only [253]; medial and lateral displacement with Patella pusher ( a hand-held force
gauge) [252]; patellofemoral arthrometer [251] and medial, lateral and total displacement
with ruler [55, 254]. Witvrouw et al. (2000) [55] showed that baseline patella mobility was not
predictive of the development of PFP. This is supported by a case-control study [251] that
analysed patella mobility using a patellofemoral arthrometer showing no difference between
a group with and without PFP. However, recent statistical subgrouping of a PFP cohort [254]
has revealed that patella hypermobility was significantly associated with one of their three
subgroups highlighting its potential importance for the management of PFP.
2.8.3 Foot & Ankle biomechanics
2.8.3.1 Foot plantar pressure
The link between PFJRF and PFJ stress is discussed in section 2.7.2. showing how ground
reaction force of the foot has the potential to affect proximal structures i.e. knee, hip etc. It
has been shown that people with PFP display less ground reaction force during heel strike
[255]. Despite an overall lower resultant PFJRF, Chen and Powers (2014) [256] did find a
higher PFJRF in the lateral component of the PFJ. Prospectively, people who develop PFP
demonstrate a greater and more laterally directed foot pressure at initial contact [59] which
would support the larger lateral force vector within the PFJ. Focusing on the specific phases
of gait lateral directed force of the foot was also noted [257]. However, there is some
discrepancy with the latter study finding significant lateral directed force during the
propulsion phase rather than initial (heel) contact.
2.8.3.2 Static vs. Dynamic assessment
Excessive pronation has been widely considered to be associated with PFP [258] however,
there is an inconsistency in findings [259]. Static measures of foot posture offer clinically
viable tools that can be used to assess features such as pronation [259]. It has been
demonstrated that people with PFP are four times more likely than healthy controls to have a
larger difference between arch height in non-weight bearing compared to weight bearing
[259]. This measure is similar to navicular drop test, which has purported to be good
measure of pronation. However, despite the some reported high inter-rater reliability [248] is
susceptible to error if relying completely on navicular palpation [259]. Ideally assessment of
Chapter 2. Literature review
45
the foot and identification of possible pronation should be determined dynamically, which
represents real world function. More recently, static pronation determined by the foot posture
index (FPI), a six-point scoring criteria encompassing many single static measures [260],
has shown fair to moderate association with dynamic pronation for both peak angle of
forefoot abduction and earlier rear foot eversion timing in people with PFP [258]. This shows
some promise that a static tool can predict dynamic function, however, the associations are
likely muted by the interaction and potential relationship with other kinematic measures such
tibial or hip rotation. Understanding how the FPI interacts with whole limb kinematics
remains an important consideration especially when attempting to identify PFP subgroups.
Recently, a series of studies [261-263] provide contrast to previous biomechanical studies
for PFP by considering the ‘eversion buffer’. The eversion buffer is based on dynamic
excursion during movement expressed as the quantity of available passive eversion
(eversion buffer = passive eversion range of movement [ROM] – dynamic eversion ROM)
(Figure 2.7). This allows calculation of the amount of time the foot has to respond until
making contact (time to contact = eversion buffer / eversion velocity). Theoretically, this
appears a logical approach for combining static and dynamic measures by considering the
range of available movement and the motion control. They showed that runners with PFP
had a significantly shorter time to contact than healthy runners and this was mostly the result
of having less eversion ROM [263].The success of interventions such as orthoses may be
influencing the time to contact, however, based on these results the motion control appears
less important than the available eversion ROM that might be targeted with joint flexibility.
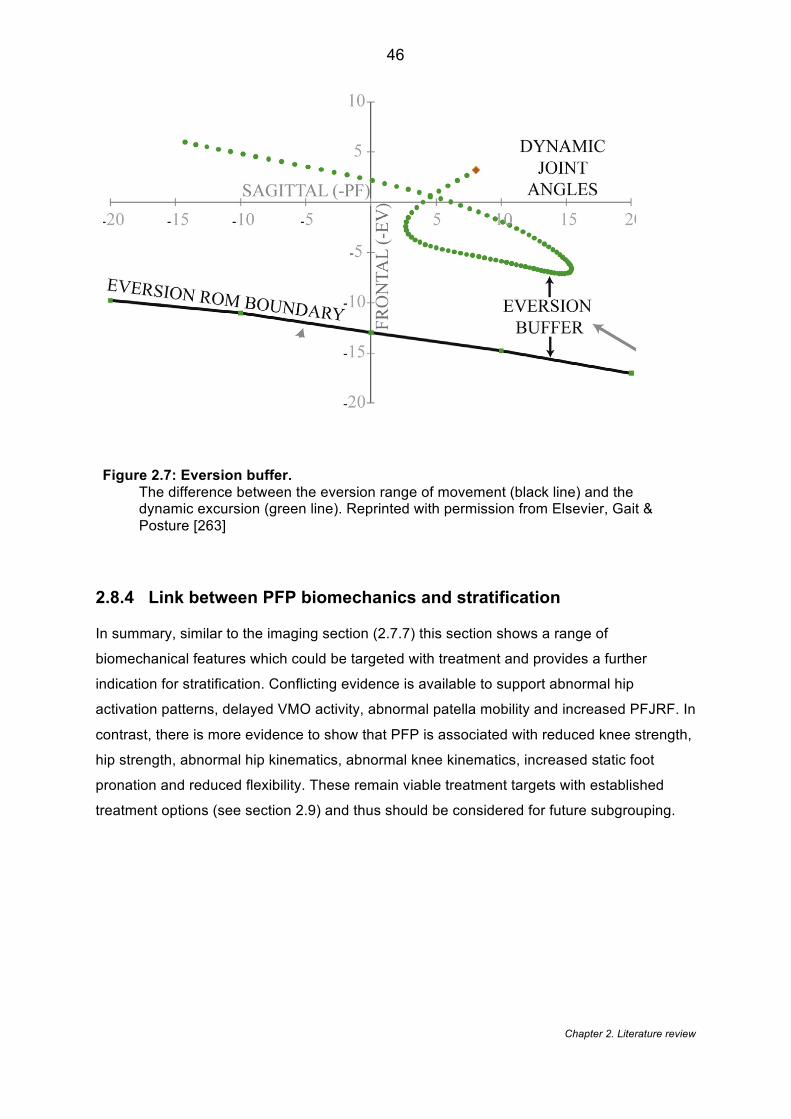
Chapter 2. Literature review
46
Figure 2.7: Eversion buffer. The difference between the eversion range of movement (black line) and the dynamic excursion (green line). Reprinted with permission from Elsevier, Gait & Posture [263]
2.8.4 Link between PFP biomechanics and stratification
In summary, similar to the imaging section (2.7.7) this section shows a range of
biomechanical features which could be targeted with treatment and provides a further
indication for stratification. Conflicting evidence is available to support abnormal hip
activation patterns, delayed VMO activity, abnormal patella mobility and increased PFJRF. In
contrast, there is more evidence to show that PFP is associated with reduced knee strength,
hip strength, abnormal hip kinematics, abnormal knee kinematics, increased static foot
pronation and reduced flexibility. These remain viable treatment targets with established
treatment options (see section 2.9) and thus should be considered for future subgrouping.
Chapter 2. Literature review
47
2.9 Interventions
2.9.1 Hip targeted interventions
2.9.1.1 Efficacy
Exercise is a common feature of almost all PFP treatment. Other adjunctive treatment
interventions have been explored in isolation that target the hip including bracing [264] and
trigger point release [190], however, exercise is the mainstay of treatment. This was first
demonstrated by a case series (n=2) [186] that a purely hip specific strengthening
programme performed over 14-weeks could improve pain and function. Subsequently,
further research has aimed at exploring hip specific interventions in a PFP population. These
positive findings has been supported by a RCT [265] and a case series [266] that have
shown hip strengthening alone will improve both pain and functional outcomes [265, 266].
Differences between a hip-strengthening and a knee strengthening programme have
supported the assertion that hip specific strengthening can show greater improvement at 4
weeks [267], 6 weeks [268], 6 months [269] and 2 years [270]. Despite these conclusions, it
is worth considering that in these studies there were improvements in pain and function for
both interventions suggesting both exercise types can be used or should be combined. This
probably explains why further research has explored the combination of knee and hip
exercises compared to knee exercises alone. Three RCTs [271-273] have shown that the
combined intervention has a greater improvement compared to knee exercise alone up to 12
months follow-up [271].
Whilst considering the favourable results for employing hip strengthening, it is worth noting a
recent systematic review [274] which actually calculated the correlation coefficient between
the percentage change in strength and the percentage change in VAS score. They found no
correlation between hip abductor strength change and pain change (R2= -0.010; p= 0.873) or
between hip lateral rotator strength change and pain change (R2 = 0.003; p = 0.935).
Furthermore, they along with a number of other recent reviews [198, 199] have highlighted
that a large variance exists in the number of treatment sessions (from 7 to 24 sessions),
which in practice is likely to influence the outcome. There is also the factor that exercise
interventions are largely dependent on the type and application of each exercise [198] ;
which again varied greatly between studies. This point is demonstrated by a recent RCT
[275], which compared functional stabilisation training to standard treatment. Functional
stabilisation training, in essence, shares many features of previous published hip
strengthening protocols, however, comparisons with hip strengthening would be difficult to
Chapter 2. Literature review
48
make due the different exercises utilised. Furthermore, with interventional-based studies
there is always a potential for publication bias, which preclude negative findings for
comparison.
A recent systematic review [276] has identified a number of case-control studies that have
looked at isolated gait and movement retraining as possible treatment strategies with PFP.
Prompts given during real-time running, that focus on hip and trunk position, have been
shown to demonstrate a marked improvement in both pain and function [204, 205]. In
running, a targeted intervention aimed at addressing gait retraining had a very significant
reduction in pain of 87% [204] and 91% [205] which are considerably greater reductions than
a previous reported studies [204]. This approach has been employed outside of running,
showing that during a single leg squat exercise prompts to correct hip movement and control
resulted in less pain being reported [277]. These findings strengthen the idea of
incorporating optimal movement education and instructions into treatment plans.
2.9.1.2 Mechanism of effect of interventions
People with PFP are thought to present with increased hip adduction and internal rotation
during movement tasks [278]. It is widely believed that altered kinematics may lead to
altered patellofemoral joint stress, initiating the first nociceptive input [12]. Subsequently,
correcting this movement is often seen as desired outcome in interventional studies and
maybe required to achieve long-term resolution of PFP [276]. Studies have shown that
following a hip-strengthening regime that significant changes in lower limb kinematics were
achieved [275, 279]. In contrast, however, a similar number of studies [266, 280] have found
that despite a significant improvement in strength that no significant differences were found
in hip and knee kinematics. The reason for these conflicting results is unknown, however,
there is a growing movement with the field suggesting that improvements in hip and proximal
strength are is not necessarily essential for changes in kinematics. With consideration of the
literature, it is worth noting that major differences exist between the studies. Ferber et al.
(2011) [280] utilised only a three week strengthening program despite the same author
suggesting that at least a six week program is required to achieve the desired treatment
effect [268]. Earl and Hoch (2011) [266] utilised an eight week strengthening program and
did not find any significant differences in in hip adduction, internal rotation, knee abduction,
or rear foot eversion ROM during running. However, closer inspection of the participants
shows that their baseline hip abduction strength was 33% kg/BW, which is much larger than
the values of 16-29% kg/BW used in other PFP studies [266]. It may be that different people
Chapter 2. Literature review
49
respond to different types of regime and possibly subgrouping could aid this understanding.
A recently described treatment paradigm [281] suggests that rehabilitation has three distinct
stages: muscle activation followed by muscle strengthening and finally movement control (
see 2.10.1 for further details). With consideration of this paradigm in relation to the Earl and
Hoch (2011) [266] paper, it may be that these individuals with optimal strength may have
benefited more from motor control, which may have led to significant changes in kinematics.
Being able identify groups would allow better selection of treatment and would improve the
understanding of which groups respond best to certain interventions. This stratification
approach is discussed further in Chapter 6.
The other potential mechanism surrounds the effect of hip strengthening protocols on knee
strength. Two RCTs [268, 275] that have recorded pre and post intervention strength
measures have demonstrated that hip strengthening also provides a significant increase in
strength for knee extensors [268] and knee flexors [275]. This is probably the result of the
closed chain nature of the exercises employed in the included studies [198, 275]. This
suggests that perhaps the mechanism of effect for hip strengthening shares similarities with
knee strengthening, as detailed in 2.9.2.2. Based on this evidence, future studies should
investigate mechanisms that are assumed in both approaches, which include lower limb
kinematics, lower limb kinetics and PFJ alignment changes.
2.9.2 Knee targeted interventions
2.9.2.1 Efficacy
It is well established in both clinical practice and current evidence that quadriceps
strengthening is effective in PFP management [282]. The precise method of delivery for
most effective quadriceps strengthening is not so clear. A number of RCTs have compared
open kinetic chain (OKC) to closed kinetic chain (CKC) with results showing no difference
between exercise intervention at six weeks [283] and three months [284]. In contrast, other
studies [285, 286] have showed significant differences in favour of CKC in terms of pain VAS
[285] and function [286] (e.g. step down test) at eight weeks. This difference may be the
result of type 1 error with these studies [285, 286] only using a relatively small sample (n <
24) compared to the other studies (n> 45). However, in the studies [283, 284] that show no
difference, on closer inspection there is a trend towards CKC showing a greater
improvement in terms of pain with functional activity. Furthermore, a few RCTs [287, 288]
have investigated whether VMO specific exercise produces a different affect to general
Chapter 2. Literature review
50
quads specific exercise. Both found no difference in terms of pain and disability between
groups at eight weeks [288] and six months [287].
2.9.2.2 Mechanism of effect
Despite quadriceps exercises being the mainstay of PFP rehabilitation, there is a paucity of
evidence detailing the mechanistic effect of stronger quadriceps on PFP symptoms. The
VMO was traditionally seen as cause of PFP and the VMO activity has been seen as a
potential mechanistic outcome following knee-targeted exercise despite recent work
questioning its mechanistic importance [289]. Generally the exercises that have utilised
predominantly knee targeted exercise have demonstrated no significant change in VMO
response time or changes in VL: VMO timing [285, 290, 291]. However, Ng et al. (2008)
[290] showed that in a group that used biofeedback in conjunction with the knee exercises
that a significant change occurred. This could, however, be simply explained by the fact that
biofeedback increases body awareness, allowing one to selectively activate specific muscle
groups e.g. VMO more independently [292].
New evidence has begun to further elucidate the mechanism through which knee
strengthening affects PFP. Chiu et al. (2012) [166] showed that following an eight week knee
strengthening protocol, significant changes were noted in PFJ contact area, analysed using
MRI. This was associated with significant reductions in pain and disability. No differences
were noted in patella tilt angle. This is in agreement with a recent study [293] that assessed
patella tilt and lateralisation using CT and found no difference following eight weeks of knee
strengthening. They unfortunately did not assess PFJ contact area so no comparisons can
be made. The findings of these studies provide a plausible relationship between knee
extensor strength and PFJ contact area but not with the other common PFJ imaging
features. Changes in patellofemoral contact area provide a potentially plausible mechanism
of effect, as this would theoretically mediate the patellofemoral joint stress as discussed in
section 2.7.3.
2.9.2.3 Predictors of response for multimodal treatment
Multimodal physiotherapy is widely considered the accepted standard of treatment for PFP
[16]. Quadriceps and hip strengthening remain a fundamental component of these
programmes [282] but whether all patients will benefit strengthening is unknown. The
importance of identifying predictors of this type of intervention is thus important. A number of
studies [19, 294-296] have investigated the factors that predict a response to multimodal
treatment and have identified a range of prognostic factors. It has been highlighted that there
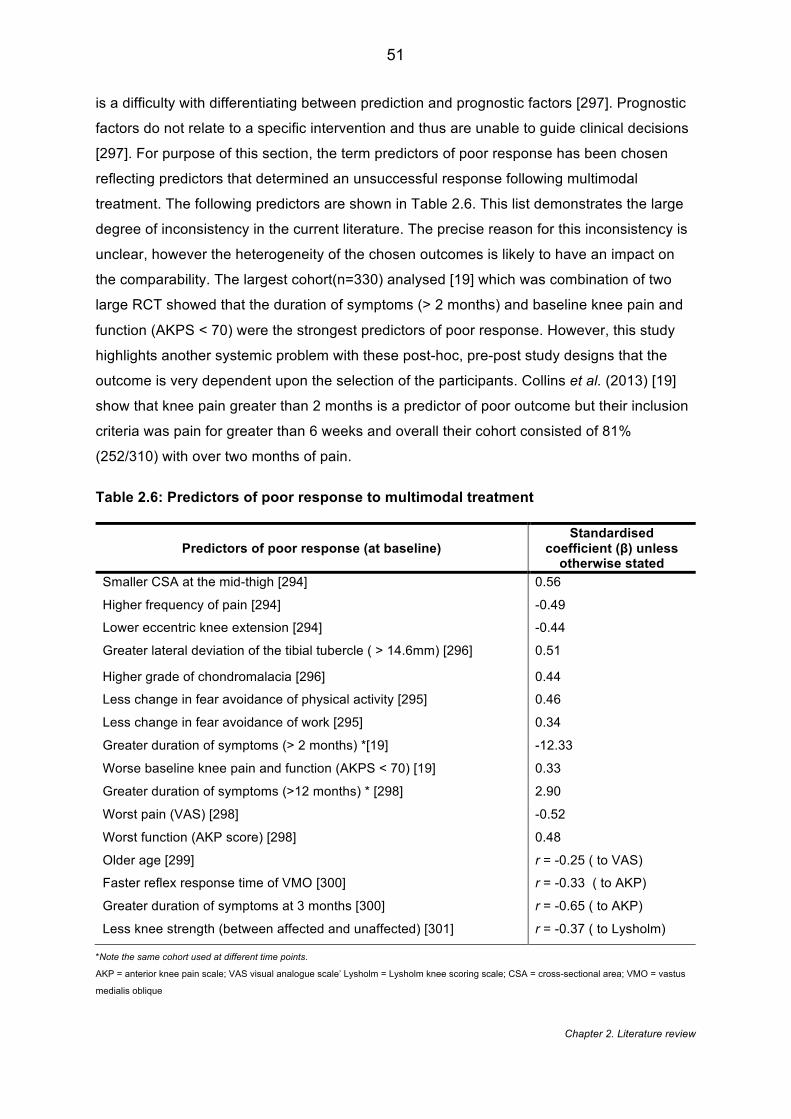
Chapter 2. Literature review
51
is a difficulty with differentiating between prediction and prognostic factors [297]. Prognostic
factors do not relate to a specific intervention and thus are unable to guide clinical decisions
[297]. For purpose of this section, the term predictors of poor response has been chosen
reflecting predictors that determined an unsuccessful response following multimodal
treatment. The following predictors are shown in Table 2.6. This list demonstrates the large
degree of inconsistency in the current literature. The precise reason for this inconsistency is
unclear, however the heterogeneity of the chosen outcomes is likely to have an impact on
the comparability. The largest cohort(n=330) analysed [19] which was combination of two
large RCT showed that the duration of symptoms (> 2 months) and baseline knee pain and
function (AKPS < 70) were the strongest predictors of poor response. However, this study
highlights another systemic problem with these post-hoc, pre-post study designs that the
outcome is very dependent upon the selection of the participants. Collins et al. (2013) [19]
show that knee pain greater than 2 months is a predictor of poor outcome but their inclusion
criteria was pain for greater than 6 weeks and overall their cohort consisted of 81%
(252/310) with over two months of pain.
Table 2.6: Predictors of poor response to multimodal treatment
Predictors of poor response (at baseline) Standardised
coefficient (β) unless otherwise stated
Smaller CSA at the mid-thigh [294] 0.56
Higher frequency of pain [294] -0.49
Lower eccentric knee extension [294] -0.44
Greater lateral deviation of the tibial tubercle ( > 14.6mm) [296] 0.51
Higher grade of chondromalacia [296] 0.44
Less change in fear avoidance of physical activity [295] 0.46
Less change in fear avoidance of work [295] 0.34
Greater duration of symptoms (> 2 months) *[19] -12.33
Worse baseline knee pain and function (AKPS < 70) [19] 0.33
Greater duration of symptoms (>12 months) * [298] 2.90
Worst pain (VAS) [298] -0.52
Worst function (AKP score) [298] 0.48
Older age [299] r = -0.25 ( to VAS)
Faster reflex response time of VMO [300] r = -0.33 ( to AKP)
Greater duration of symptoms at 3 months [300] r = -0.65 ( to AKP)
Less knee strength (between affected and unaffected) [301] r = -0.37 ( to Lysholm)
*Note the same cohort used at different time points.
AKP = anterior knee pain scale; VAS visual analogue scale’ Lysholm = Lysholm knee scoring scale; CSA = cross-sectional area; VMO = vastus
medialis oblique
Chapter 2. Literature review
52
2.9.3 Taping
2.9.3.1 Efficacy
In accordance with the prevailing theories around patellar maltracking, tape has been
commonly applied in a medial direction as means of counteracting the natural, lateral
movement of the patella and thus improving pain and function [215]. It has commonly been
applied in combination with exercise or used in isolation [213]. A number of systematic
reviews [2, 302-305] provide a clear state of the current evidence for the efficacy of tape.
Consistently there is evidence for tape reducing pain in the immediate to short term [302,
304, 305]. All the earlier reviews highlight the need for studies to include longer follow-up
periods, and show that a large variation exists in the taping application and techniques. This
variation in tape techniques supports a recent systematic review by Barton et al. (2014) [303]
who reviewed the literature in terms of tailored taping (individualised adjustment for patellar
spin, rotation and/or tilt) versus untailored taping. They showed that tailored taping appeared
to provide more pain reduction than the untailored (often medially directed) taping, however,
concluded similarly to previous reviews that the long-term effects are inconclusive. Of note in
this review is the inclusion of any study design that included a comparative group. A more
stringent study selection criterion was applied by a recent Cochrane review. [2] They
concluded that the current evidence for taping in PFP, based on five small RCTs, was of low
quality and insufficient to support the effectiveness of tape.
2.9.3.2 Mechanism of effect
The actual mechanism of effect of taping is still widely debated. The use of taping to improve
VMO activation has been explored. A number of studies [217, 218, 306-308] show that the
application of tape in a medial direction will improve the VMO: VL timing, with VMO
activating earlier than VL which was been noted prior to application. Interestingly, this
change in ratio of activation showed an increase in VMO activation [217] whilst another
study noted a decrease in activity but an earlier activation [306-308]. Collectively all these
studies showing a decrease in activity used a more demanding activity such as single legged
squats[306, 307] and exercising to fatigue [308], which may have accounted for the
difference.
A traditional justification for using taping has been to counteract the malalignment of the
patella. There is conflicting evidence around the effect of taping on the position of the patella
[305], however much of the conflict appears to arise from comparison of different outcomes,
Chapter 2. Literature review
53
procedures and even populations. Under static XR [292] and CT [309] no change in position
of the patella was found using a variety of malalignment radiographic outcomes after taping.
In contrast there are several studies that have demonstrated a change in patellar position
following tape [310-314]. These may have detected a change by using a larger variety of
knee flexion angles and better representing the dynamic nature of the PFJ [310, 314]. It is
also clear that all the studies that utilised MRI, rather than XR [315]and CT [309] detected a
change. This explanation is unclear as many of the imaging features are applied in exactly
the same way, regardless of imaging modality. Caution is also advised interpreting these
findings because what constitutes a ‘normal’ patellar position is unknown [314].
Tape has also been shown to have an influence on both lower limb kinematics and kinetics
[213]. It has been demonstrated [316, 317] that the application of patellar tape will increase
the knee extensor moment during a step-up and stair ambulation task respectively. These
studies have also shown [317] that tape leads to an increase in knee flexion angle during
stair ascent and descent. These improvements in kinetics and kinematics could be the result
of increased confidence during loading tasks in response to reduced pain or could be the
result of alterations in cortical activity. A few authors who have questioned the importance of
the direction of the applied taping [217] suggest that cutaneous stimulation and changes in
proprioception could be the more probable mechanism of effect. Callaghan et al. (2012) [26]
utilised functional magnetic resonance imaging (fMRI) of the brain and applied patella tape
to eight healthy participants. A comparison between the tape and untaped conditions
showed that application of the tape decreased the activity within the cingulated motor area
cerebellum (the regions of the brain concerned with the unconscious aspects of
proprioception). They interpreted this as the tape making the task easier to perform and thus
leading to less activity in these regions of the brain [26]. At this stage these conclusion are
only based on eight asymptomatic individuals so the generalisability of these findings is
limited.
2.9.3.3 Predictors of Response
The predictors of a likely successful outcome following taping have been investigated in 150
participants published across two studies [318, 319]. The following factors have been
identified: i) positive patellar tilt test; ii) tibial varum greater than 5° [319]; iii) lower BMI,
smaller LPA and iv) larger Q angle [318]. Both studies use a similar testing approach with
pain score given during a stepping task with and without tape. The consistency in testing
techniques does allow comparison and synthesis of the data; however, caution is advised
Chapter 2. Literature review
54
over the generalisation of these findings. Both studies have a relatively high age range of 20
to 60 years compared to the rest of the literature within this field. It is also worth noting that
Lesher et al. (2006) [319] shares the shame cohort with another study published [320], which
looked at the predictive factors that affected a lumbopelvic manipulation intervention. These
papers appear to share the same cohort and were likely conducted at a similar time. What is
not known is whether there was wash-out period between study interventions to prevent a
potential carry-over effect [321].
2.9.4 Knee orthoses
An expanded version of this review of the literature has been published as:
Smith TO, Drew BT, Meek TH, Clark AB. (2015). Knee orthoses for treating patellofemoral
pain syndrome. The Cochrane Library[25]
2.9.4.1 Efficacy
Knee orthoses, which include knee, braces, sleeves etc. can be used to treat PFP. The
typical orthosis often made of neoprene comprises of a patella hole with some additional
straps or buttresses [25]. Despite being considered a viable option for PFP treatment, there
is no consensus on the use of orthoses for patellofemoral and whether they should be used
as an adjunct to exercise or in isolation [322]. Our systematic review of the literature [25],
identified five trials [323-327] that have explored the efficacy of knee orthoses. Most of the
trials incorporated the addition of a home therapeutic exercise programme, with the
exception of Finestone et al. (1993) [324] whose participants continued with basic military
training. All the studies compared knee orthoses and exercise to an exercise only control
group showing that the addition of the orthoses did not provide any significant statistical or
clinical difference in pain or function. Only one study compared knee orthoses to exercise
alone [325] showing that both groups improved, however, there was no statistical or clinical
difference between groups.
Despite efforts to synthesise and pool data, there is notable heterogeneity in the studies,
which may limit the conclusions made. Five different orthoses were used across the five
studies all with slightly different proposed mechanism of effect and the outcomes used
varied greatly particularly for the measurement of function. Similar to the outcome of a
previous review [328], the overall effect of knee orthoses in PFP appears limited, however,
Chapter 2. Literature review
55
the ‘very low’ quality of the current literature does not allow a definitive conclusion to be
drawn.
2.9.4.2 Mechanism of effect
There is no consensus to the exact mechanism of the knee orthoses [329]. The design of
each orthoses will also have different intended mechanistic effects [330]. A number of
studies [148, 167, 314, 331] have shown that orthoses have a direct effect on the alignment
and kinematics of the patellofemoral joint. Most of these studies showed that the application
of a knee orthoses was able to change both the PTA and BSO although Powers et al. (2004)
[167] found no difference in PTA but a small significant change in BSO. Worrell et al. (1998)
[314] found significant effects only at 10° flexion. However, this study did not measure at full
extension, in contrast to the other studies, which appears to be the optimal angle to show the
most pronounced difference [148]. Powers et al. (2004) [167] also showed that application of
orthoses had a significant effect on the patellofemoral joint contact area. They showed that
both the ‘On Track’ brace and ‘Patella Tracking Orthosis’ demonstrated mean increases of
59.3 mm2 and 52 mm2 in patellofemoral contact area respectively, compared to no brace
conditions. This would lend itself to reducing the underlying patellofemoral joint stress (as
discussed in section 2.7.2). These findings are also supported by work based on cadaveric
studies showing significant reduction in peak and centre of pressure under brace conditions
[332]..
Outside the potential biomechanical effects, it is presumed that the enclosing nature of the
brace will provide a level of cutaneous and proprioceptive input [333]. This has been shown
in a number of studies applying an knee orthoses to an asymptomatic population [334, 335]
but never shown in PFP population. Selfe et al. (2011) [336] has probably shown the
strongest link between knee orthoses and potential proprioceptive effects in PFP patients.
They demonstrated that the application of a knee orthosis during a step descent procedure
resulted in a significant reduction in the total range of knee movement in both frontal and
transverse planes compared to both tape and no treatment condition. These authors
attribute these findings to the likely stimulation of cutaneous receptors, which may enhance
muscular activity leading to more effective limb control. However, as discussed in
section 2.4.8 other mechanisms of effect have also been proposed for observed increases in
proprioceptive function.
2.9.4.3 Predictors of response
Chapter 2. Literature review
56
There is paucity of data showing predictors of response to knee orthoses. Draper et al.
(2009) [148] highlighted the association between abnormal patella kinematics and the effect
of knee orthoses. They observed that a subset of patients with abnormal patellar kinematics
including BSO, PTA displayed a greater effect from the application of the orthoses. It may be
that the studies exploring the efficacy of knee orthoses may have unintentionally selected
participants with ‘normal’ baseline patellar kinematics thus reducing the potential for effect.
This provides some potential justification for subgrouping when applying orthoses.
2.9.5 Foot orthoses
2.9.5.1 Efficacy
The use of foot orthoses in the management of PFP is advocated by a systematic review of
reviews incorporating level 1 evidence with expert opinion [16]. Based on the current
evidence, two systematic reviews [337, 338] based predominantly on the same RCT [339]
have recommended that prefabricated orthoses are more effective in providing a subjective
global improvement score compared to flat inserts in the short term (six weeks). However,
this effect is not carried on to 12 or 52 weeks. Since these reviews were published, a further
RCT has shown that foot orthoses show greater improvements in a similar global
improvement scale when compared against a wait-see policy [340]. This RCT was also only
based on short-term follow up (6 weeks) thus the long-term effect of foot orthoses is
uncertain.
Using foot orthoses in conjunction with physiotherapy would seem appropriate considering
the evidence to support multimodal treatment. Nevertheless, conflicting evidence exists to
support addition of physiotherapy based on the current evidence from RCTs. Eng and
Pierrynowski (1993) [341] showed that an orthosis plus physiotherapy programme provided
a greater reduction in pain compared to physiotherapy alone at eight-week follow up,
whereas the greater-powered study by [339] found no difference at a short, moderate or long
term follow up. This difference may be explained by the Eng and Pierrynowski (1993) [341]
selecting only patients with pronated foot type (calcaneal or forefoot valgus >6 degrees).
This application of orthoses, based on selection of participants with more than nine degrees
calcaneal valgus, has been also been showed to be successful at three months [342]. This
suggests that tailoring your prescription of orthoses is essential to the overall efficacy of
using orthotics in combination with physiotherapy. Caution is advised, however, as to
establish the efficacy of any intervention a control condition is required. Although unclear
from most study reporting, Rodrigues et al. (2014) [263] highlights the point that some
Chapter 2. Literature review
57
‘healthy controls’ may be using specialist footwear that mimic a foot orthotic-type intervention
thus impacting on the conclusion that can be derived.
2.9.5.2 Mechanism of effect
Despite the promising efficacy of orthoses in treating people with PFP, the mechanism of
effect has not been demonstrated definitively. Authors suggest that the likely mechanism is
either mechanical, neuromotor or a combination of both [337]. Mechanically, the application
of an orthoses has been shown to control predominantly the frontal and transverse knee
motion [343]. Early research focused on the foot with data showing that orthoses reduced
the eversion of the foot [261, 343] and internal rotation of knee/ shank [343]. Further
research has shown that orthoses were also able to significantly reduce the hip adduction
movement during stair ascent [344]. These biomechanical alterations are likely to normalise
the patellofemoral joint stress by ensuring better alignment and equalising the force
distributions around the PFJ[341].
An abnormal change in neuromotor activity is another possible mechanistic effect [337]. Foot
orthoses have been shown to reduce the effort and activity of important muscle groups, with
one study showing a reduction in peak amplitude of gluteus medius during stair ascent [344].
Whilst in PFOA, the application of orthoses has been shown to cause a later onset of vastus
lateralis and lateral hamstring [345]. It may be that a reduction in activity of some muscles
such as quadriceps can reduce their potential fatigability. Alternatively, a reduction of other
muscles like hamstrings may be advantageous due to their known over-activity in PFP [346]
and their proposed impact on rotational tibial alignment and biomechanics [347].
A further consideration to both the mechanism and potential efficacy is simply the comfort of
the orthoses. Mills et al. (2012) [348] showed that a less comfortable orthosis resulted in a
more unfavourable relative increase in hip adduction and a significant increase in VL activity.
Furthermore, any intervention like orthoses requires an element of compliance. McPoil et al.
(2011) [349] found that both PFP and controls perceived a contoured orthoses to provide
greater support and comfort than flat inserts suggesting these would be preferred by
patients. No difference, however, was found in the number of hours each foot orthoses was
worn between groups. A clear association between foot orthosis comfort and compliance
has not been established in PFP.
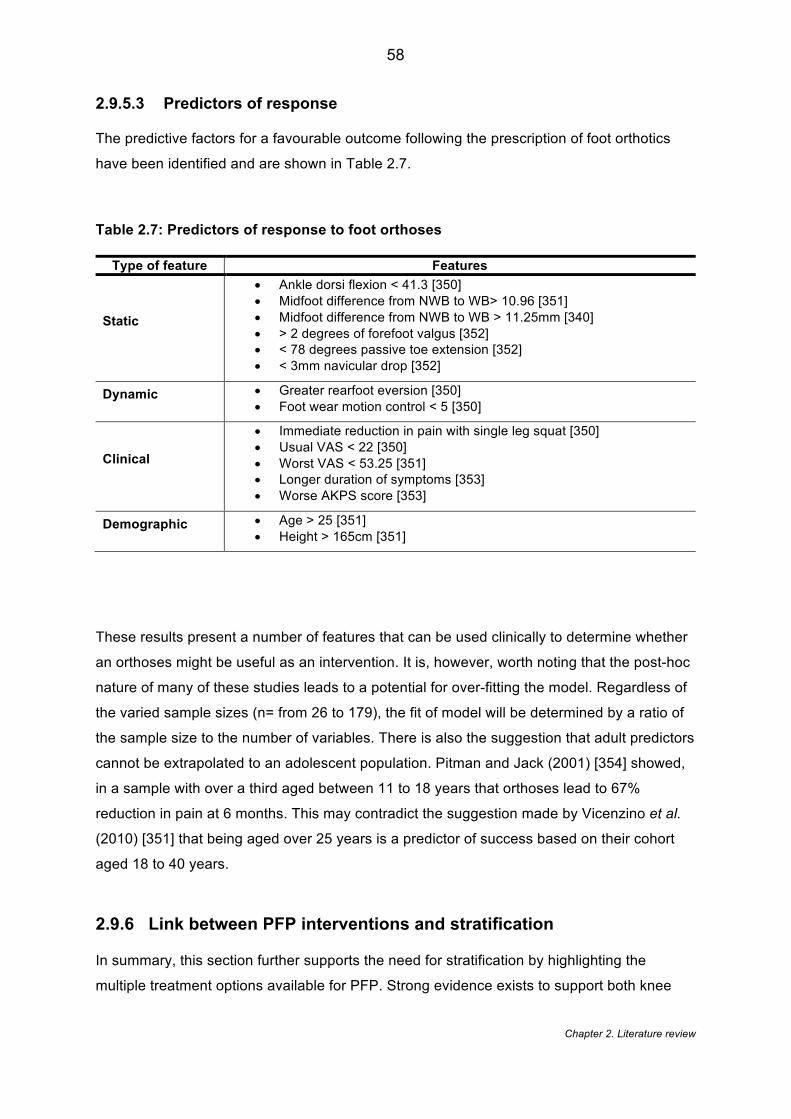
Chapter 2. Literature review
58
2.9.5.3 Predictors of response
The predictive factors for a favourable outcome following the prescription of foot orthotics
have been identified and are shown in Table 2.7.
Table 2.7: Predictors of response to foot orthoses
Type of feature Features
Static
• Ankle dorsi flexion < 41.3 [350] • Midfoot difference from NWB to WB> 10.96 [351] • Midfoot difference from NWB to WB > 11.25mm [340] • > 2 degrees of forefoot valgus [352] • < 78 degrees passive toe extension [352] • < 3mm navicular drop [352]
Dynamic
• Greater rearfoot eversion [350] • Foot wear motion control < 5 [350]
Clinical
• Immediate reduction in pain with single leg squat [350] • Usual VAS < 22 [350] • Worst VAS < 53.25 [351] • Longer duration of symptoms [353] • Worse AKPS score [353]
Demographic
• Age > 25 [351] • Height > 165cm [351]
These results present a number of features that can be used clinically to determine whether
an orthoses might be useful as an intervention. It is, however, worth noting that the post-hoc
nature of many of these studies leads to a potential for over-fitting the model. Regardless of
the varied sample sizes (n= from 26 to 179), the fit of model will be determined by a ratio of
the sample size to the number of variables. There is also the suggestion that adult predictors
cannot be extrapolated to an adolescent population. Pitman and Jack (2001) [354] showed,
in a sample with over a third aged between 11 to 18 years that orthoses lead to 67%
reduction in pain at 6 months. This may contradict the suggestion made by Vicenzino et al.
(2010) [351] that being aged over 25 years is a predictor of success based on their cohort
aged 18 to 40 years.
2.9.6 Link between PFP interventions and stratification
In summary, this section further supports the need for stratification by highlighting the
multiple treatment options available for PFP. Strong evidence exists to support both knee
Chapter 2. Literature review
59
and hip strengthening alone and in combination for the management of PFP. However, there
is conflicting evidence to support any difference in these strengthening regimes with some
evidence suggesting hip strengthening may achieve desired outcomes earlier. Despite a
paucity of evidence, the growing use of novel treatment options such as movement
retraining might be important when it is considered that some PFP cohorts show normal
strength at baseline and are thus unlikely to benefit from further strength training. Limited
evidence is available to support the use of both taping and knee orthoses but with some
evidence suggesting that tailored taping may be more effective than untailored taping.
Taping and bracing have been shown on MRI studies to consistently alter patella
malalignment features despite contrasting findings observed under different imaging
modalities. The other potential mechanisms which include improved proprioception and
cutaneous activity remain speculative at present due to being based on limited data.
Moderate evidence exists to support the use of foot orthoses in the short term with no effect
found at long term follow up. Foot orthoses also remains one intervention to have been used
within stratified approaches already and demonstrates promising findings, with 79% of
people with PFP reporting a favourable outcome. The predictors of response for all these
interventions cover a diverse range of structural, biomechanical, clinical, psychosocial and
demographic factors which could also explain the heterogeneous response to these
interventions.
2.10 Stratification & subgrouping
The presentation of the literature in the preceding sections of this review demonstrates that
PFP is a condition which: i) has a multifactorial aetiology; ii) likely demonstrates multiple
relevant targets for intervention; and iii) provides multiple treatment options with
heterogeneous responses. In this scenario the use of stratification is recommended [124].
The idea of stratified medicine was first proposed over 50 years ago [355] by American
Psychologist, Lee Cronbach[140], who advocated that “we should design treatments not to
fit the average person but to fit groups with particular aptitude patterns…on the assumption
that aptitude-treatment interactions exist”. A variety of definitions of stratified medicine are
shown in Table 2.8. The commons themes from these definitions are: the classification of
individuals into subgroups/ subpopulations; based on response to treatment or biological
characteristics; in order to target /tailor treatment; and to improve efficacy, safety and
economic outcomes.
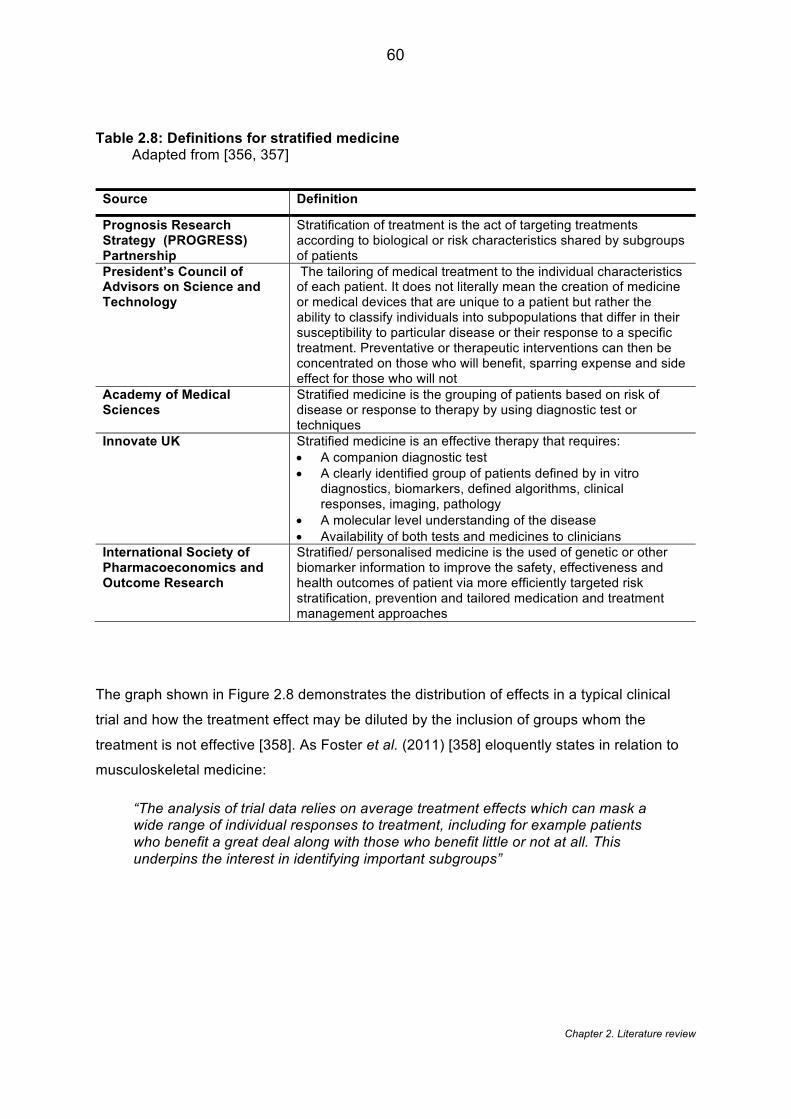
Chapter 2. Literature review
60
Table 2.8: Definitions for stratified medicine Adapted from [356, 357]
Source Definition
Prognosis Research Strategy (PROGRESS) Partnership
Stratification of treatment is the act of targeting treatments according to biological or risk characteristics shared by subgroups of patients
President’s Council of Advisors on Science and Technology
The tailoring of medical treatment to the individual characteristics of each patient. It does not literally mean the creation of medicine or medical devices that are unique to a patient but rather the ability to classify individuals into subpopulations that differ in their susceptibility to particular disease or their response to a specific treatment. Preventative or therapeutic interventions can then be concentrated on those who will benefit, sparring expense and side effect for those who will not
Academy of Medical Sciences
Stratified medicine is the grouping of patients based on risk of disease or response to therapy by using diagnostic test or techniques
Innovate UK Stratified medicine is an effective therapy that requires: • A companion diagnostic test • A clearly identified group of patients defined by in vitro
diagnostics, biomarkers, defined algorithms, clinical responses, imaging, pathology
• A molecular level understanding of the disease • Availability of both tests and medicines to clinicians
International Society of Pharmacoeconomics and Outcome Research
Stratified/ personalised medicine is the used of genetic or other biomarker information to improve the safety, effectiveness and health outcomes of patient via more efficiently targeted risk stratification, prevention and tailored medication and treatment management approaches
The graph shown in Figure 2.8 demonstrates the distribution of effects in a typical clinical
trial and how the treatment effect may be diluted by the inclusion of groups whom the
treatment is not effective [358]. As Foster et al. (2011) [358] eloquently states in relation to
musculoskeletal medicine:
“The analysis of trial data relies on average treatment effects which can mask a wide range of individual responses to treatment, including for example patients who benefit a great deal along with those who benefit little or not at all. This underpins the interest in identifying important subgroups”
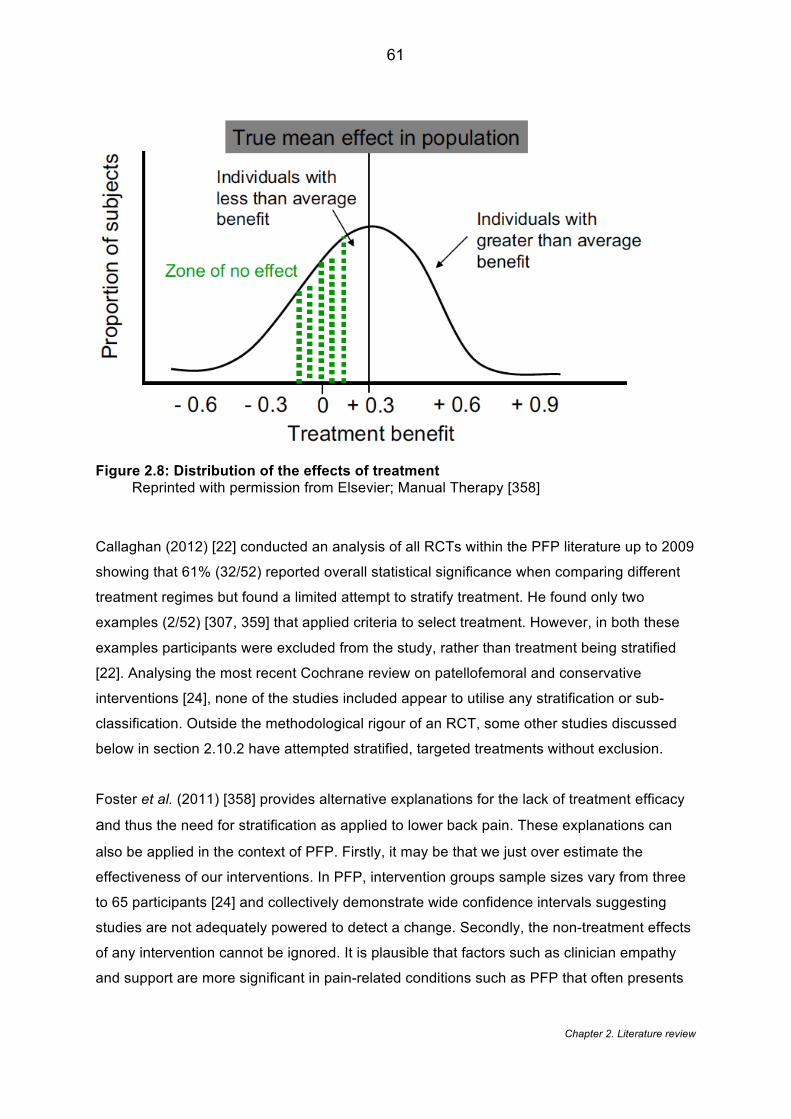
Chapter 2. Literature review
61
Figure 2.8: Distribution of the effects of treatment Reprinted with permission from Elsevier; Manual Therapy [358]
Callaghan (2012) [22] conducted an analysis of all RCTs within the PFP literature up to 2009
showing that 61% (32/52) reported overall statistical significance when comparing different
treatment regimes but found a limited attempt to stratify treatment. He found only two
examples (2/52) [307, 359] that applied criteria to select treatment. However, in both these
examples participants were excluded from the study, rather than treatment being stratified
[22]. Analysing the most recent Cochrane review on patellofemoral and conservative
interventions [24], none of the studies included appear to utilise any stratification or sub-
classification. Outside the methodological rigour of an RCT, some other studies discussed
below in section 2.10.2 have attempted stratified, targeted treatments without exclusion.
Foster et al. (2011) [358] provides alternative explanations for the lack of treatment efficacy
and thus the need for stratification as applied to lower back pain. These explanations can
also be applied in the context of PFP. Firstly, it may be that we just over estimate the
effectiveness of our interventions. In PFP, intervention groups sample sizes vary from three
to 65 participants [24] and collectively demonstrate wide confidence intervals suggesting
studies are not adequately powered to detect a change. Secondly, the non-treatment effects
of any intervention cannot be ignored. It is plausible that factors such as clinician empathy
and support are more significant in pain-related conditions such as PFP that often presents
Chapter 2. Literature review
62
to a treating clinician in chronic state. Doménech et al. (2014) [118] have shown recently that
individuals with PFP present with greater levels of catastrophization, which has been shown
to be modulated better in other populations, by interventions providing emotional support
and expectation management [360]. Finally, it has been postulated that those providing
treatment in the RCTs are not competent or that the treatment itself is not appropriate for the
desired outcome [361]. Lack et al. (2015) [198] highlight the inconsistencies within the
programme used to train the hip and proximal components for PFP. They demonstrate the
many studies employ inadequate treatment dosage in terms of the intensity and frequency of
the prescribed exercises and that a great deal of variation exists in the literature. To address
this discrepancy in exercise prescription parameters, Powers (2015) [281] recently
presented a treatment paradigm that aimed to clinically stratify hip strength training. Three
distinct phases have been identified anecdotally as: muscle activation, strengthening and
movement training. This forms an algorithmic approach where each component must be
considered and satisfied. This work, however, remains unpublished and is based purely on
anecdotal evidence. It does raise the possibility though that other stratification approaches
might be in use in current clinical practice without having been subject to the rigours of
research.
In support of future stratification, the last three International Patellofemoral Retreat
consensus statements [14, 20, 115] have highlighted the need for diagnostic sub-grouping
and subsequent treatment stratification within the overall PFP population. The belief is that
better sub-grouping will allow better targeting of interventions. Within musculoskeletal
medicine a number of sub-grouping method and designs can be employed. A series of
studies by Kent and colleagues [362-364] have highlighted the difference in approaches for
subgrouping in musculoskeletal medicine. The different approaches are detailed below in the
context of PFP.
2.10.1 Diagnostic subgroups
Diagnostic subgrouping aims to group individuals based on the pathoanatomical
characteristics and underlying mechanisms. Over the last 30 years, attempts have been
made to classify and subgroup the presentation of PFP. These diagnostic sub-groupings are
detailed in Table 2.9. Historically, classification focused more on patellofemoral disorders i.e.
any condition affecting the patellofemoral joint. These earlier classification systems were
primarily designed to guide surgical decisions and are often associated with recipe-like
prescriptive rehabilitation protocols [22]. It was not until 2005, that Witvrouw et al. (2005) [18]
Chapter 2. Literature review
63
began to consider variations in the associated soft tissue with particular consideration of
quadriceps activity and activation. More recently, groups have begun to propose
classifications based on a greater consideration of the multifactorial nature of PFP. Both
Smith et al. (2013) [365] and Keays et al. (2015) [366] have proposed broad classifications
which consider important features such age, abnormal kinematics, muscle flexibility and
psychosocial issues; with the latter even including patellofemoral osteoarthritis which,
although the link is unproven, is widely considered to form a continuum with PFP [5]. Four
recent studies have also begun to consider heterogeneity within single imaging feature such
as patella lateralisation and patella tilt [181, 367, 368] and kinematic factors [243].
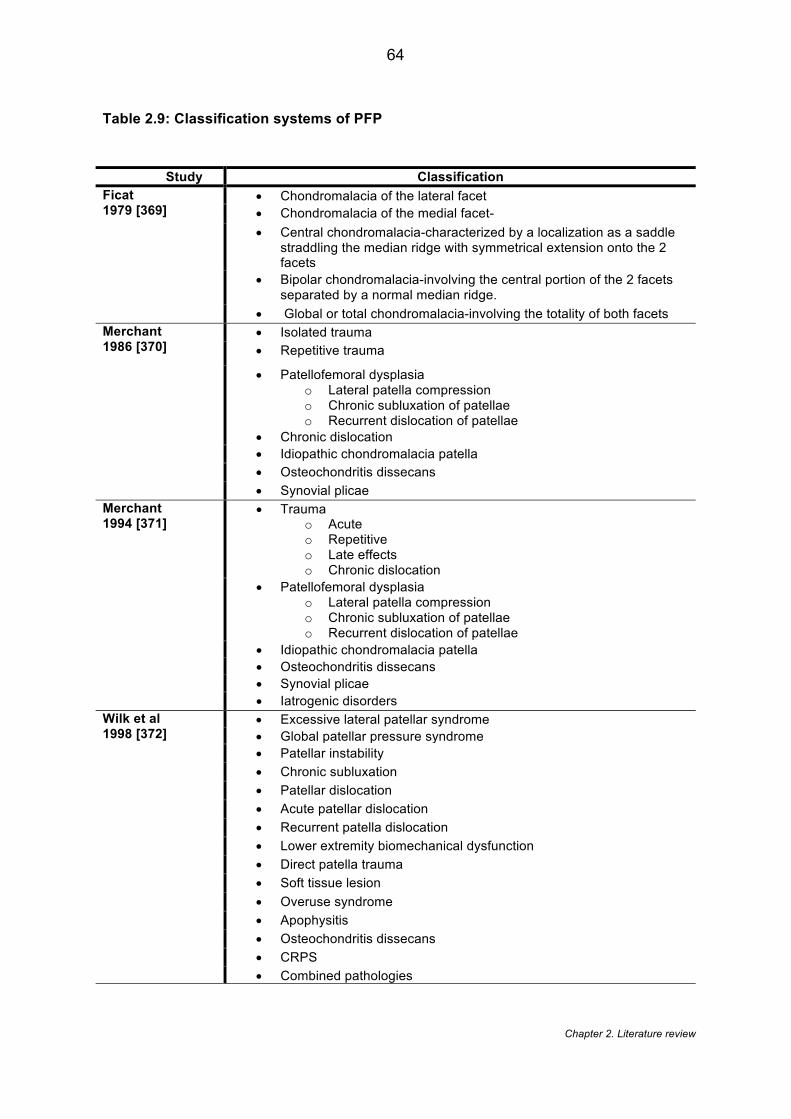
Chapter 2. Literature review
64
Table 2.9: Classification systems of PFP
Study Classification Ficat 1979 [369]
• Chondromalacia of the lateral facet • Chondromalacia of the medial facet- • Central chondromalacia-characterized by a localization as a saddle
straddling the median ridge with symmetrical extension onto the 2 facets
• Bipolar chondromalacia-involving the central portion of the 2 facets separated by a normal median ridge.
• Global or total chondromalacia-involving the totality of both facets Merchant 1986 [370]
• Isolated trauma
• Repetitive trauma
• Patellofemoral dysplasia o Lateral patella compression o Chronic subluxation of patellae o Recurrent dislocation of patellae
• Chronic dislocation
• Idiopathic chondromalacia patella
• Osteochondritis dissecans
• Synovial plicae Merchant 1994 [371]
• Trauma o Acute o Repetitive o Late effects o Chronic dislocation
• Patellofemoral dysplasia o Lateral patella compression o Chronic subluxation of patellae o Recurrent dislocation of patellae
• Idiopathic chondromalacia patella • Osteochondritis dissecans • Synovial plicae • Iatrogenic disorders
Wilk et al 1998 [372]
• Excessive lateral patellar syndrome • Global patellar pressure syndrome • Patellar instability • Chronic subluxation • Patellar dislocation • Acute patellar dislocation • Recurrent patella dislocation • Lower extremity biomechanical dysfunction • Direct patella trauma • Soft tissue lesion • Overuse syndrome • Apophysitis • Osteochondritis dissecans • CRPS • Combined pathologies
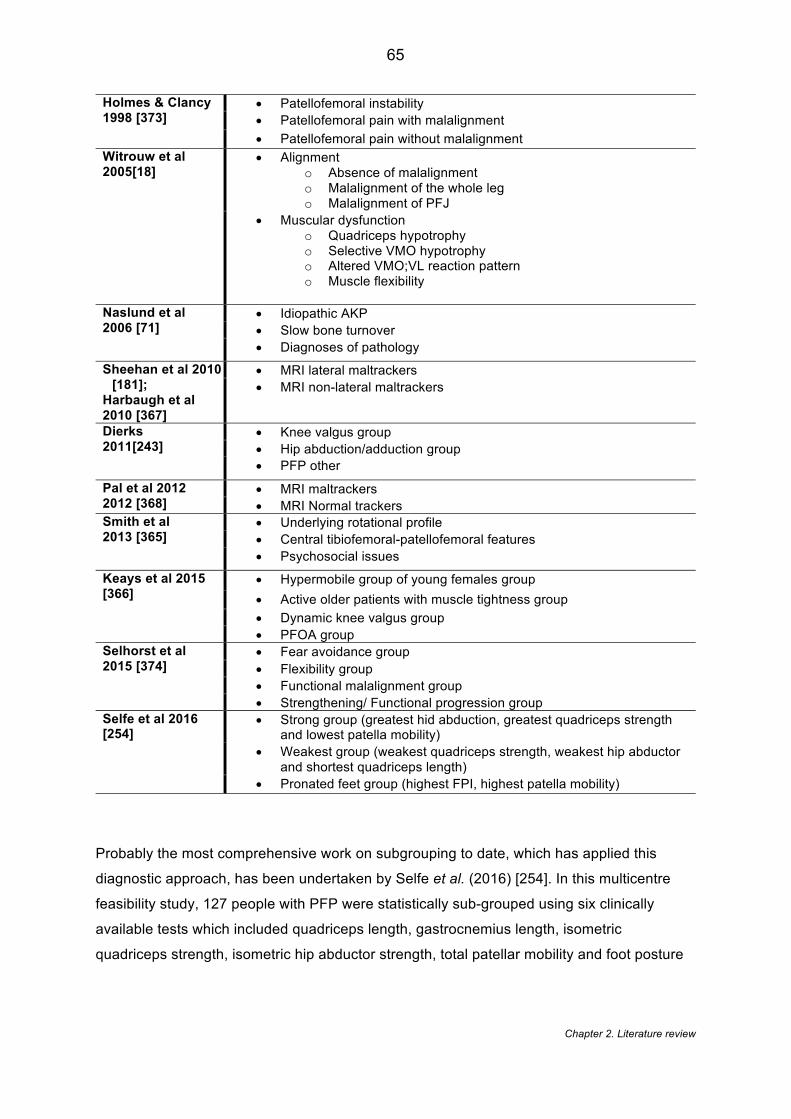
Chapter 2. Literature review
65
Probably the most comprehensive work on subgrouping to date, which has applied this
diagnostic approach, has been undertaken by Selfe et al. (2016) [254]. In this multicentre
feasibility study, 127 people with PFP were statistically sub-grouped using six clinically
available tests which included quadriceps length, gastrocnemius length, isometric
quadriceps strength, isometric hip abductor strength, total patellar mobility and foot posture
Holmes & Clancy 1998 [373]
• Patellofemoral instability • Patellofemoral pain with malalignment • Patellofemoral pain without malalignment
Witrouw et al 2005[18]
• Alignment o Absence of malalignment o Malalignment of the whole leg o Malalignment of PFJ
• Muscular dysfunction o Quadriceps hypotrophy o Selective VMO hypotrophy o Altered VMO;VL reaction pattern o Muscle flexibility
Naslund et al 2006 [71]
• Idiopathic AKP • Slow bone turnover • Diagnoses of pathology
Sheehan et al 2010 [181];
Harbaugh et al 2010 [367]
• MRI lateral maltrackers • MRI non-lateral maltrackers
Dierks 2011[243]
• Knee valgus group • Hip abduction/adduction group • PFP other
Pal et al 2012 2012 [368]
• MRI maltrackers • MRI Normal trackers
Smith et al 2013 [365]
• Underlying rotational profile • Central tibiofemoral-patellofemoral features • Psychosocial issues
Keays et al 2015 [366]
• Hypermobile group of young females group • Active older patients with muscle tightness group • Dynamic knee valgus group • PFOA group
Selhorst et al 2015 [374]
• Fear avoidance group • Flexibility group • Functional malalignment group • Strengthening/ Functional progression group
Selfe et al 2016 [254]
• Strong group (greatest hid abduction, greatest quadriceps strength and lowest patella mobility)
• Weakest group (weakest quadriceps strength, weakest hip abductor and shortest quadriceps length)
• Pronated feet group (highest FPI, highest patella mobility)
Chapter 2. Literature review
66
index. They identified three sub-groups: ‘strong’, ‘weak and tight’ and ‘weak and pronated’
(see
Figure 2.9). The identification of a ‘strong group’ is perhaps most surprising considering that
quadriceps weakness is accepted as both an associated [194] and a risk factor [53] for PFP .
This further justifies the need for subgrouping, as the concern is that current treatment
paradigms may have meant these people would have still received quadriceps strengthening
as this forms a core component of most multimodal treatment approaches. These diagnostic
groups are of high clinical utility, only requiring six simple clinical tests without the need for
expensive equipment. However, due to this intentional clinical utility these subgroups are
unable to consider factors related to patellofemoral structure [181, 367, 368] and kinematics
[243] which require expensive equipment such as MRI and 3D motion analysis systems. The
addition of structural and kinematic outcomes, however, may inform subsequent treatments,
improve the understanding of the mechanism within these groups and refine these existing
groups further. The imaging outcomes may also allow the identification of a group with
osteoarthritic changes. A group with these changes would be considered as having a risk of
developing future osteoarthritis and may lead to a shift in the focus of future trials.
The Selfe et al. (2016) [254] study also uses unsupervised statistical tests e.g. cluster
analysis and latent class analysis to identify their subgroups. Unsupervised tests, in contrast
to supervised tests, do not work backwards from a outcome but instead explore relationship
between characteristics using cross-sectional data [364]. This allows these subgroups to be
later studied against a number of treatment targets, which is the proposed plan for Chapter
5. However, because subgroups identified by unsupervised techniques are not derived from
a clinical outcome they have sometimes been criticised as having limited clinical relevance
[363]. This is because clinical interpretation is made post-hoc. Novel statistical methods
have been recently published [364] that use a two–stage clustering approach which aims to
address this problem and improve the clinical applicability. More detail is provided in Chapter
5.
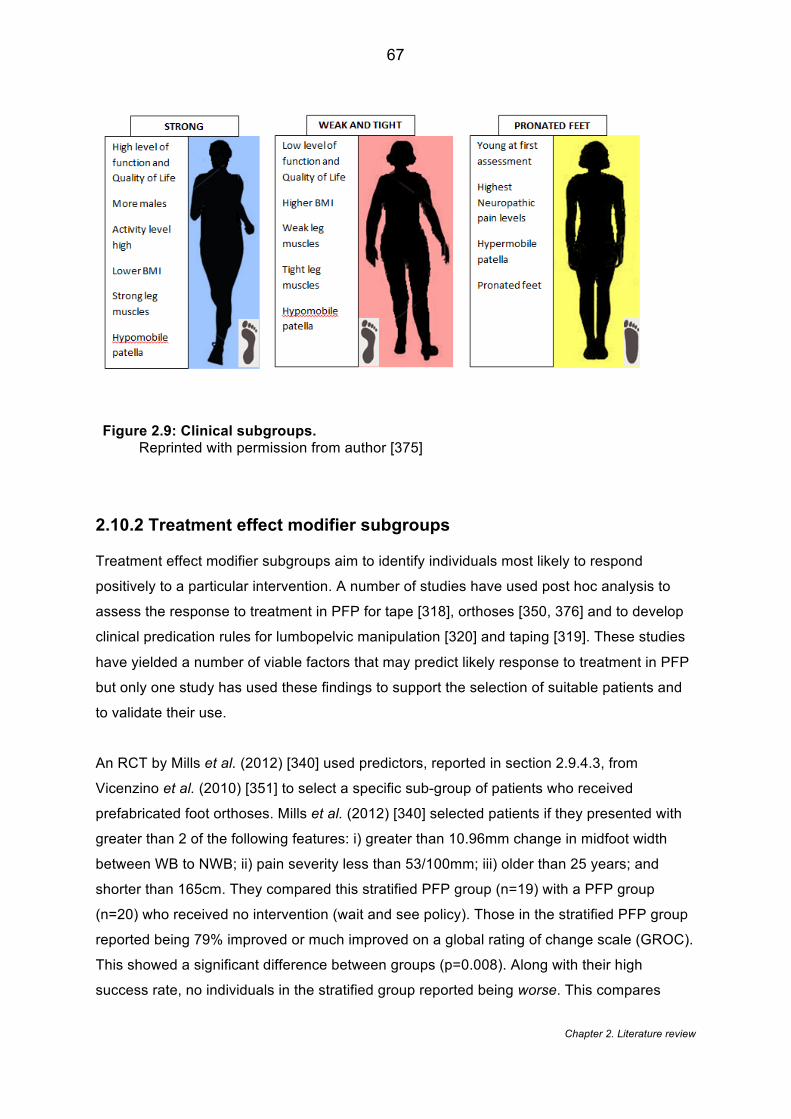
Chapter 2. Literature review
67
Figure 2.9: Clinical subgroups. Reprinted with permission from author [375]
2.10.2 Treatment effect modifier subgroups
Treatment effect modifier subgroups aim to identify individuals most likely to respond
positively to a particular intervention. A number of studies have used post hoc analysis to
assess the response to treatment in PFP for tape [318], orthoses [350, 376] and to develop
clinical predication rules for lumbopelvic manipulation [320] and taping [319]. These studies
have yielded a number of viable factors that may predict likely response to treatment in PFP
but only one study has used these findings to support the selection of suitable patients and
to validate their use.
An RCT by Mills et al. (2012) [340] used predictors, reported in section 2.9.4.3, from
Vicenzino et al. (2010) [351] to select a specific sub-group of patients who received
prefabricated foot orthoses. Mills et al. (2012) [340] selected patients if they presented with
greater than 2 of the following features: i) greater than 10.96mm change in midfoot width
between WB to NWB; ii) pain severity less than 53/100mm; iii) older than 25 years; and
shorter than 165cm. They compared this stratified PFP group (n=19) with a PFP group
(n=20) who received no intervention (wait and see policy). Those in the stratified PFP group
reported being 79% improved or much improved on a global rating of change scale (GROC).
This showed a significant difference between groups (p=0.008). Along with their high
success rate, no individuals in the stratified group reported being worse. This compares
Chapter 2. Literature review
68
positively to the unfavourable recovery (no improvement) of 40-62% reported from previous
RCTs in PFP without stratification [19, 377]. It does, however, depend on how success is
defined for a GROC scale.
Consideration of the interventional procedure in Mills et al. (2012) [340] does show,
however, that stratification was not only based on the predictors. The procedure for selecting
the orthoses was also determined by participants who based their decision on the level of
comfort of the orthotic during running. This means that the outcome cannot be entirely
attributed to stratifying based on predictors but may also be the result of self-stratifying for
comfort. Furthermore, the study used greater than two predictors. Two predictors in the
Vicenzino et al. (2010) [351] study was showed to have post-test probability of 60% ( for
reporting a ‘marked improvement’ on a five point Likert scale) whereas three predictors
showed a post-test probability of 85%. No justification is provided to why the greater number
of predictors (i.e. > 3) did not form the selection criteria and thus aiming for a better post-
intervention outcome. One can assume that recruitment becomes more challenging when
attempting to identify patients that satisfy at least three predictors.
Further evidence from two studies of one-group pre-test-post-test design have shown that
stratifying patients for gait retraining may optimise treatment outcomes. Both Noehren et al.
(2010) [204] and Willy and Davis (2013) [205] selected patients with PFP who demonstrated
abnormal hip mechanics. Both showed that a targeted intervention aimed at addressing gait
retraining resulted in a significant reduction in pain of 86.5% [204] and 90.5%[205] -
considerably greater than previous reported studies [278]. Critically this was only based on
total of 20 runners with PFP across both studies and only provides level 4 evidence,
however, they do demonstrate some positive signal and thus support the need for further
research into stratified PFP treatment.
Selhorst et al. (2015) [374] piloted a clinical-decision making algorithm within a similar one-
group pre-test-post-test design for the treatment of PFP that subgroups patients sequentially
based on fear avoidance, flexibility, functional malalignment and strengthening/ functional
progression. In essence, the algorithmic approach helps to control for individuals who are
classified into more than one subgroup. Their results show that all participants (n=21)
reported a clinically significant change from baseline to six week follow up in both AKPS and
GROC scales [374]. The concern is that the algorithmic approach is still fundamentally
multimodal in nature and thus may require an individual to adhere to long treatment
regimens and/or be prescribed extensive exercise programmes. This impacts on the
Chapter 2. Literature review
69
adoption of the approach into a real life clinical setting where patient adherence and
departmental economic pressures are known to be barriers [11]. Specifically, this clinical
algorithm places a large emphasis on flexibility and fear avoidance (1st and 2nd components)
neither of which, although considered anecdotally important, have strong evidence to
support their use over other factors. Furthermore the strengthening component is the last
component of the algorithm and determined by the limb symmetry index which may
inherently fail to capture weakness in those with bilateral symptoms, which is typically
reported as the most common presentation in PFP [254].
2.10.3 Prognostic factor subgroups
Prognostic factors subgroups are symptoms, signs or other characteristics that indicate a
subgroup outcome regardless of treatment [362, 363]. A number of prognostic analyses
have been conducted within the PFP literature [19, 55, 301, 353]. They have demonstrated a
number of factors that consistently influence future prognosis following predominantly
multimodal treatment. To date, none of these studies or this subsequent information has
been used to develop a classification system or to stratify treatment. This reason for this is
unclear, however, it might be due to that fact that many of the features that have been
identified e.g. duration of symptoms, baseline AKP etc. are non-modifiable so don’t translate
to known treatment interventions.
2.10.4 Which stratification approach?
The decision on which subgrouping approach to take is largely dependent on the desired
output; however, some important considerations should be made. Treatment effect modifier
and prognostic groups are typically based on the prediction of one single outcome often for
one single treatment [364]. Data from these types of design can be limited as predictors of
pain may not represent the same for function. Diagnostic sub-groups, on the other hand, are
determined from cross-sectional, baseline data and thus not dependant on outcome [364].
This approach lends itself for a range of treatments and outcomes to be targeted in later
studies [364]. Theoretically it can be considered a ‘pre-phase’ before a treatment modifier or
prognostic effects are investigated [363]. One concern with diagnostic groups is that they
don’t link directly to clinical efficacy and derived groups may have little clinical relevance or
clear treatment targets [364]. To ensure clinical relevance, it would appear appropriate that
the selection of factors/ variables need to be determined by current evidence to be both
Chapter 2. Literature review
70
clinically modifiable and have a recognised treatment target e.g. quadriceps weakness will
respond to strengthening regime etc.
2.10.5 Summary
Patellofemoral pain is a common musculoskeletal complaint in adolescents and young
adults, and thought to be a precursor to future knee osteoarthritis. Despite a range of
treatments being available, the current treatment paradigms appear limited, with over a third
of people continuing with symptoms into later life. It has been proposed that positive
treatment effects seen in some people with PFP are being cancelled out by negative effects
observed in others, suggesting a need to identify subgroups within this population. This
review shows that there is evidence to support a multitude of treatments for PFP and that
stratifying these treatments appears the optimal way to achieve the best treatment outcomes
for patients.
The concept of subgrouping and stratification has been hailed as the “holy grail” of PFP
research, however, the concept remains under-investigated. This review highlights some
potential approaches to PFP subgrouping although there remains a lack of understanding of
how the patellofemoral joint structure and lower limb kinematics may contribute to these
subgroups. Knowledge of the prognosis of these PFP subgroups is also not understood and
would help guide future research priorities. By aligning all known modifiable features
highlighted in this review to identify PFP subgroups it is hoped that it will inform the future
stratified treatment for people with PFP.
The central hypothesis of this thesis can be summarised as follows:
Improved subgrouping of people with PFP based on modifiable features will enable
stratification and targeting of interventions
Chapter 3. Systematic review
71
Chapter 3 - Which patellofemoral joint imaging features are associated with patellofemoral pain? Systematic review
and meta-analysis
This chapter describes a systematic review and meta-analysis of the imaging
literature in patellofemoral pain. By controlling for confounding factors such as
loading and knee flexion the chapter explores which imaging features are associated
with patellofemoral pain. The results of this chapter have been published as:
Drew BT, Redmond AC, Smith TO, Penny F, Conaghan PG. (2015). Which
patellofemoral joint imaging features are associated with patellofemoral pain?
Systematic review and meta-analysis. Osteoarthritis and Cartilage. 24(2), 224-236
[378].
3.1 Introduction
In section 2.7, the reported importance of the structure and the function of the
patellofemoral joint (PFJ) as an underlying cause of PFP has been described. PFP is
believed to be caused by abnormal tracking and alignment of the patellofemoral joint
(PFJ) leading to irritation of the subchondral bone, lateral retinaculum or
synovium[34]. Recently, the PFJ was established as the most common compartment
for knee OA [379, 380] and hence the structure of the PFJ has become the subject of
increased interest.
The PFJ has historically been visualised using X-rays in a static, non-weight bearing
position. Over the last 20 years, imaging has revolutionised the understanding of the
knee as a whole [381] with advances in structural visualisation, kinematic
applications and loading capabilities [382]. A variety of modern imaging modalities
have been used to assess PFJ structure [151], but no consensus exists on which of
these image modalities should be used or the key features to image.
Chapter 3. Systematic review
72
3.2 Aims
This chapter aimed to establish which PFJ imaging features using a range of
commonly available imaging modalities are associated with PFP compared to
asymptomatic individuals.
3.3 Methods
3.3.1 Protocol and registration
This systematic review was performed using a predetermined protocol in accordance
with the Preferred Reporting Items for Systematic Reviews and Meta-Analyses
(PRISMA) statement [383]. The study protocol was registered with PROSPERO,
registration number CRD 42014009503.
3.3.2 Search strategy and study selection
A systematic literature search of AMED, CiNAHL, Cochrane Central Register of
Controlled Trials (CENTRAL), MEDLINE, PEDro, EMBASE and SPORTDiscus was
undertaken from their inception to September 2014. This search also included a
secondary electronic search of unpublished and trial registry databases including
OpenGrey, the WHO International Clinical Trials Registry Platform, Current
Controlled Trials and the UK National Research Register Archive. The electronic
search was complemented by hand searching the references of the retrieved articles.
An example of the search terms used for Medline (also used for the other databases)
are in Table 3.1. The search terms used were based on terms used by two recent
Cochrane reviews [2, 24] with relevant terms added.
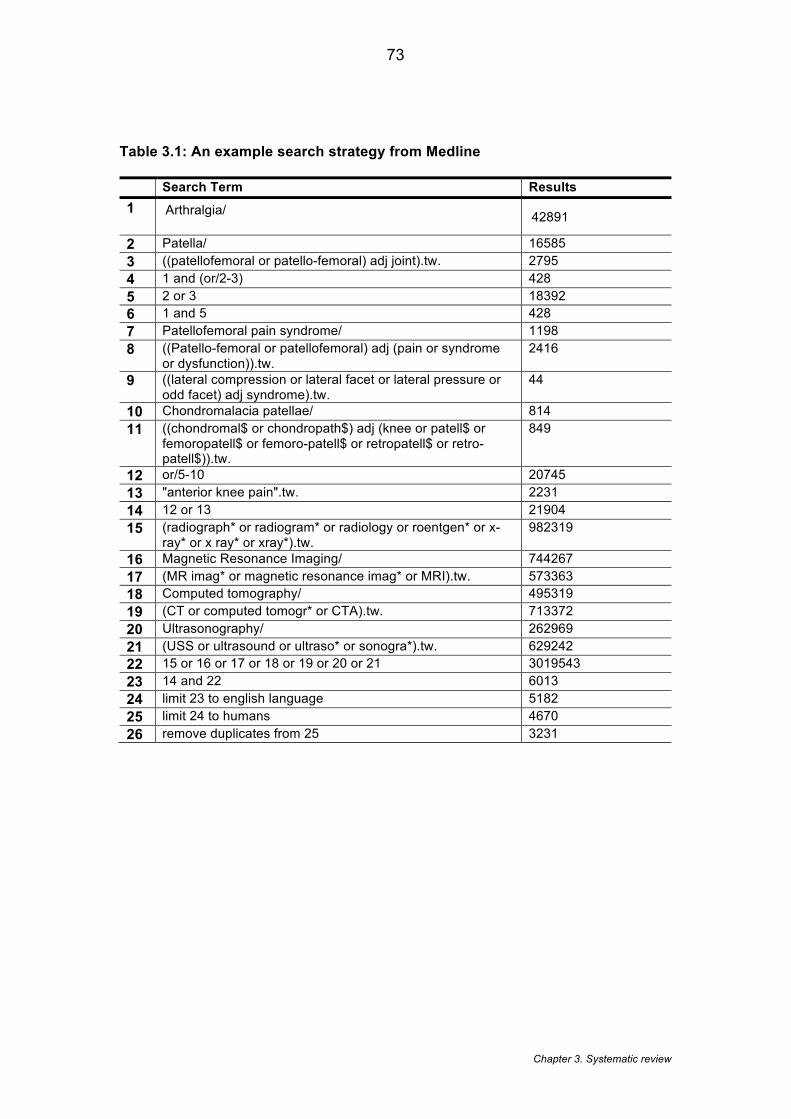
Chapter 3. Systematic review
73
Table 3.1: An example search strategy from Medline
Search Term Results 1 Arthralgia/
42891
2 Patella/ 16585 3 ((patellofemoral or patello-femoral) adj joint).tw. 2795 4 1 and (or/2-3) 428 5 2 or 3 18392 6 1 and 5 428 7 Patellofemoral pain syndrome/ 1198 8 ((Patello-femoral or patellofemoral) adj (pain or syndrome
or dysfunction)).tw. 2416
9 ((lateral compression or lateral facet or lateral pressure or odd facet) adj syndrome).tw.
44
10 Chondromalacia patellae/ 814 11 ((chondromal$ or chondropath$) adj (knee or patell$ or
femoropatell$ or femoro-patell$ or retropatell$ or retro-patell$)).tw.
849
12 or/5-10 20745 13 "anterior knee pain".tw. 2231 14 12 or 13 21904 15 (radiograph* or radiogram* or radiology or roentgen* or x-
ray* or x ray* or xray*).tw. 982319
16 Magnetic Resonance Imaging/ 744267 17 (MR imag* or magnetic resonance imag* or MRI).tw. 573363 18 Computed tomography/ 495319 19 (CT or computed tomogr* or CTA).tw. 713372 20 Ultrasonography/ 262969 21 (USS or ultrasound or ultraso* or sonogra*).tw. 629242 22 15 or 16 or 17 or 18 or 19 or 20 or 21 3019543 23 14 and 22 6013 24 limit 23 to english language 5182 25 limit 24 to humans 4670 26 remove duplicates from 25 3231
Chapter 3. Systematic review
74
3.3.3 Eligibility criteria
Studies were selected using the titles and abstracts, independently screened by two
reviewers (BD, FP). All potential studies had the full text retrieved and were screened
against the eligibility criteria. Studies were eligible if: 1) they included human
participants under 45 years diagnosed with PFP; 2) magnetic resonance imaging
(MRI), computed tomography (CT), ultrasound (US) or x-ray (XR) was used to image
the patellofemoral joint and local structures; 3) a comparison of PFP cases and a
healthy control group was provided; 4) they were published in English.
As discussed in section 2.2, the nomenclature around PFP remains ambiguous. PFP
was determined using published clinical criteria taken from a recent Cochrane review
[24]. Studies that included participants diagnosed with, but not restricted to, PFP,
anterior knee pain or chondromalacia patellae were all considered. Despite efforts to
standardise the terminology [14], chondromalacia patellae is still used
interchangeably with PFP. If a study included participants with arthroscopically
confirmed chondromalacia patellae outside the currently accepted clinical
presentation of PFP [24] then these studies were excluded. Studies that may come
under the umbrella term of anterior knee pain including conditions such patella
tendinopathy and patella dislocation were also excluded if the PFP could not be
analysed separately.
The extraction of data was initially piloted by two reviewers before the formal
extraction was undertaken. Two reviewers then used a standardised, piloted form to
extract data which included: a) study design and methodology; b) patient
demographics; c) imaging procedure; d) imaging outcomes; e) patient reported
outcomes; f) outcome date results. Discordance in opinion, regarding eligibility, data
extraction or quality assessment, was resolved by a third reviewer.
3.3.4 Quality assessment
The methodological quality of the included studies was assessed by the same two
reviewers. The Downs & Black Checklist [384] was selected as the preferred quality
assessment tool. The Downs & Black checklist has been highlighted as one of the
most comprehensive quality assessment tools for non-randomised studies [385].The
Chapter 3. Systematic review
75
tool has established high reliability and validity [384] and is considered relatively
user-friendly [385]. An alternative choice of tool, would have been the Newcastle-
Ottawa Scale (NOS) [386] which was recommended for cohort and case control
studies in a recent systematic review of all quality assessment tools [387]. However,
at the time of the conception of the review, there were concerns about the inter-rater
reliability of the NOS based on Hartling et al. (2013) [388] who reported only low
agreement between raters (k=0.29, 95% CI0.10, 0.47) .
The Downs & Black checklist was modified for this chapter in response to its criticism
that it is time consuming and that not all the criteria are applicable to case-control
studies [389]. The original 27 items were reduced to 17 items as described
previously [390] (Table 3.2). Items not applicable for non-interventional studies were
removed. During assessment, if it was unclear whether an item was satisfied then
UTD (unable to detect) was added to the form and that item was given a score of
zero. All included studies were classified using the following quality rating bandings
which have been used previously in conjunction with Downs & Black checklist [391]:
low (< 33.3%), moderate (33.4 -66.7%) and high (≥66.8%)[392].

Chapter 3. Systematic review
76
Table 3.2: Modified Downs & Black Checklist
Reporting Yes Partial No Score 1 Is the hypothesis /aim / objective of the study clearly described? 1 0 2 Are the main outcomes to be measured clearly described in the Introduction or Methods section? 1 0 3 Are the characteristics of the patients included in the study clearly described? 1 0 4 Are the interventions of interest clearly described? 1 0 5 Are the distributions of principal confounders in each group to be compared clearly described? 2 1 0 6 Are the main findings of the study clearly described? 1 0 7 Does the study provide estimates of the random variability in the data for the main outcomes? 1 0
8 Have the actual probability values been reported (e.g. 0.035 rather than <0.05) for the main outcomes except where the probability value is less than 0.001?
1 0
External validity
9 Were the subjects asked to participate in the study representative of the entire population from which they were recruited?
1 0
10 Were the subjects who were prepared to participate representative of the entire population from which they were recruited?
1 0
Internal validity 11 Was an attempt to blind those measuring the main outcome? 1 0 12 If any of the results of the study were based on “data dredging” was this made clear? 1 0 13 Were the statistical tests used for the main outcomes appropriate? 1 0 14 Were the main outcome measures used accurate (valid and reliable)? 1 0 15 Were the case and controls recruited from the same population? 1 0 16 Was there adequate adjustment for confounding in the analyses from which the main findings were drawn? 1 0 17 Did the study have sufficient power to detect a clinically important effect? 1 0 Total /18
Chapter 3. Systematic review
77
3.3.5 Data analysis
Using the extraction tables the heterogeneity of the included studies was assessed.
A pooled meta-analysis was conducted if there were no heterogeneity between
studies in relation to population, assessment procedure or outcome measurement
method. Meta-analyses compared case and control groups for each PFJ feature
calculating the standardised mean difference (SMD). SMD was categorised as small
(SMD ≥ 0.2), medium (SMD ≥ 0.5) and large (SMD ≥ 0.8) [139]. Statistical
heterogeneity was assessed using I-squared (I2) and Chi-squared tests (X2). When I2
was greater than 20% and X2 less than p=0.10, a random-effects model was used.
When I2 was less than 20% and X2 was greater than p=0.10, a fixed-effect model
was adopted. When substantial heterogeneity was present, a narrative synthesis of
the literature was presented. Both the narrative synthesis and the meta-analysis
were interpreted using a best evidence synthesis [393] (Table 3.3) determined by the
results of the risk-of-bias assessment and the methodological quality of the included
studies [394, 395].
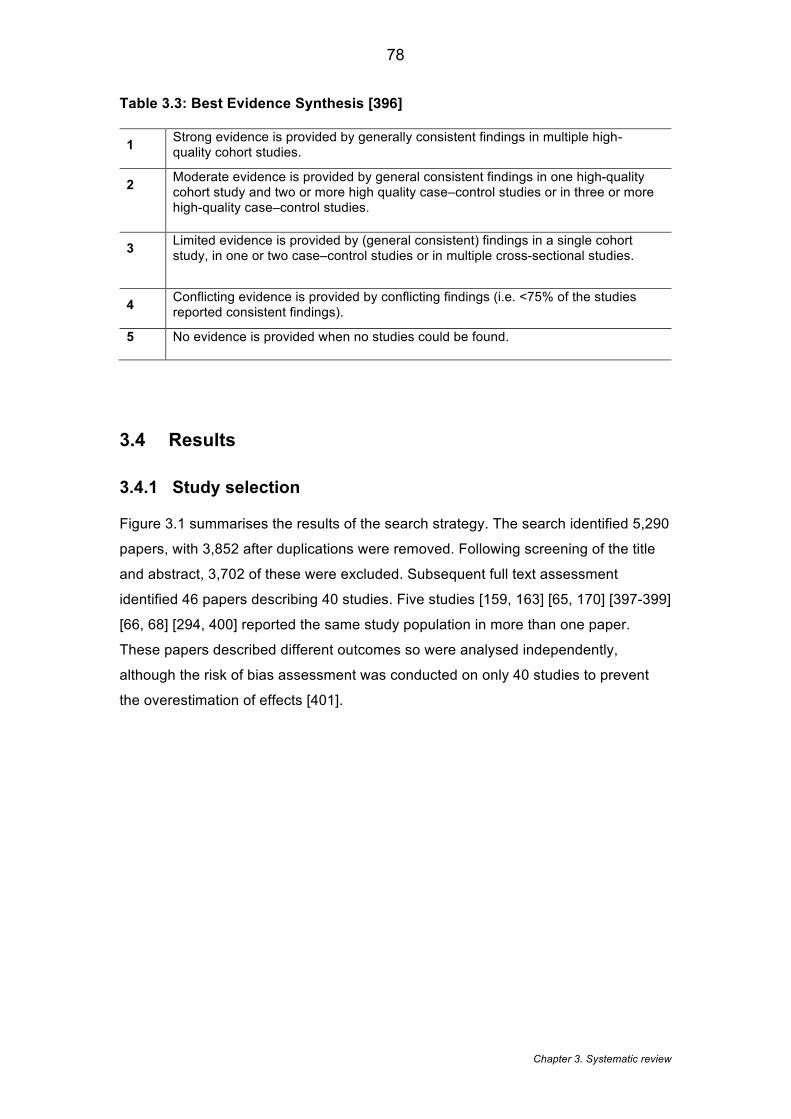
Chapter 3. Systematic review
78
Table 3.3: Best Evidence Synthesis [396]
1 Strong evidence is provided by generally consistent findings in multiple high-quality cohort studies.
2 Moderate evidence is provided by general consistent findings in one high-quality cohort study and two or more high quality case–control studies or in three or more high-quality case–control studies.
3 Limited evidence is provided by (general consistent) findings in a single cohort study, in one or two case–control studies or in multiple cross-sectional studies.
4 Conflicting evidence is provided by conflicting findings (i.e. <75% of the studies reported consistent findings).
5 No evidence is provided when no studies could be found.
3.4 Results
3.4.1 Study selection
Figure 3.1 summarises the results of the search strategy. The search identified 5,290
papers, with 3,852 after duplications were removed. Following screening of the title
and abstract, 3,702 of these were excluded. Subsequent full text assessment
identified 46 papers describing 40 studies. Five studies [159, 163] [65, 170] [397-399]
[66, 68] [294, 400] reported the same study population in more than one paper.
These papers described different outcomes so were analysed independently,
although the risk of bias assessment was conducted on only 40 studies to prevent
the overestimation of effects [401].
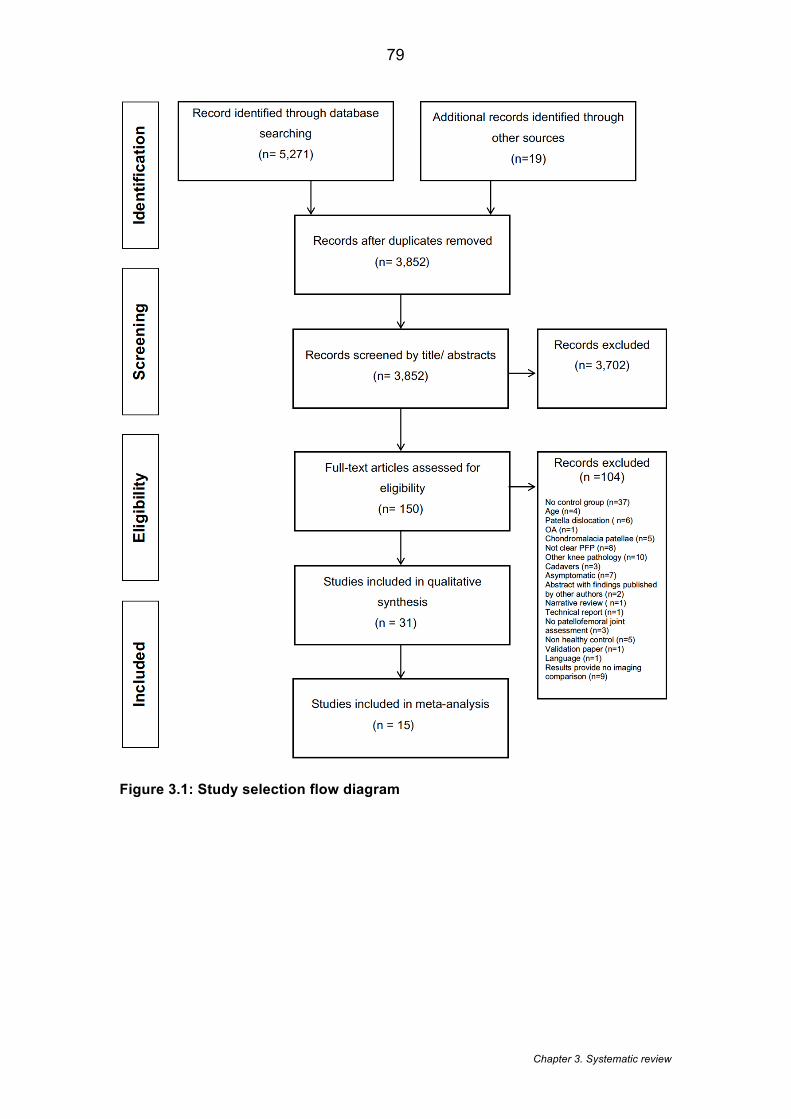
Chapter 3. Systematic review
79
Figure 3.1: Study selection flow diagram
Chapter 3. Systematic review
80
3.4.2 Study characteristics
Study characteristics are presented in Table 3.4. Of the 40 studies included, 22 used
MRI [65, 66, 68, 148, 159, 160, 163, 165, 166, 168-170, 173, 179, 256, 294, 397-
400, 402-409], of which five included kinematic MRI [148, 179, 404, 408, 409] , eight
used CT [410-417], six used US [82, 216, 228, 359, 418, 419] and five used XR
[413, 420-423]. The review included 1,043 PFP subjects and 839 control subjects.
The mean age was 27.0 years (range: 14 -40.7 years), with 74.3% women in the
case group and 69.0% in the control group. The duration of symptoms was reported
in only 10 of the 40 studies [65, 82, 160, 170, 294, 359, 400, 402, 408, 413, 416,
422] and ranged from two [160] to 168 months [416]. All except two studies
presented cross-sectional data [148, 166]. Pain was established in the PFP cohort
most commonly from reproducible pain in greater than two functional activities [65,
148, 159, 160, 163, 165, 168, 170, 179, 216, 256, 359, 397-400, 402, 404, 418, 419,
424]. This was further quantified by five studies that only recruited participants with a
Visual Analogue Scale (VAS) score greater than 3/10 on these provocation activities
[65, 160, 165, 170, 179, 256]. A further four studies used the Anterior Knee Pain
(also known as Kujala scale) score to quantify pain and dysfunction of their PFP
cohort [148, 169, 400, 402]. In ten studies it was unclear how pain was measured
[82, 173, 403, 407, 410, 411, 413, 415, 416, 421]. Imaging reliability data was
presented in 43% (20/46) of the included studies [68, 160, 165, 169, 170, 179, 359,
398-400, 402, 404, 406, 412, 418, 423-425] (Table 3.5) and most of these studies
used a single observer. Pooling of reported intraclass correlation coefficients (ICC)
data was available for MRI bisect offset, patella tilt, patellofemoral contact area,
Insall-Salvati ratio and sulcus angle showing mean ICCs of 0.92, 0.85, 0.90, 0.96,
0.82 respectively. Inter -observer reliability data was only presented in seven studies
[148, 166, 169, 400, 412, 420, 423].
At the time of writing this review (up to September 2014) the selection of studies
predominantly focused on malalignment. The update of the literature in section 7.2.1,
however, shows how semi-quantitative MRI outcomes are becoming more commonly
investigated.
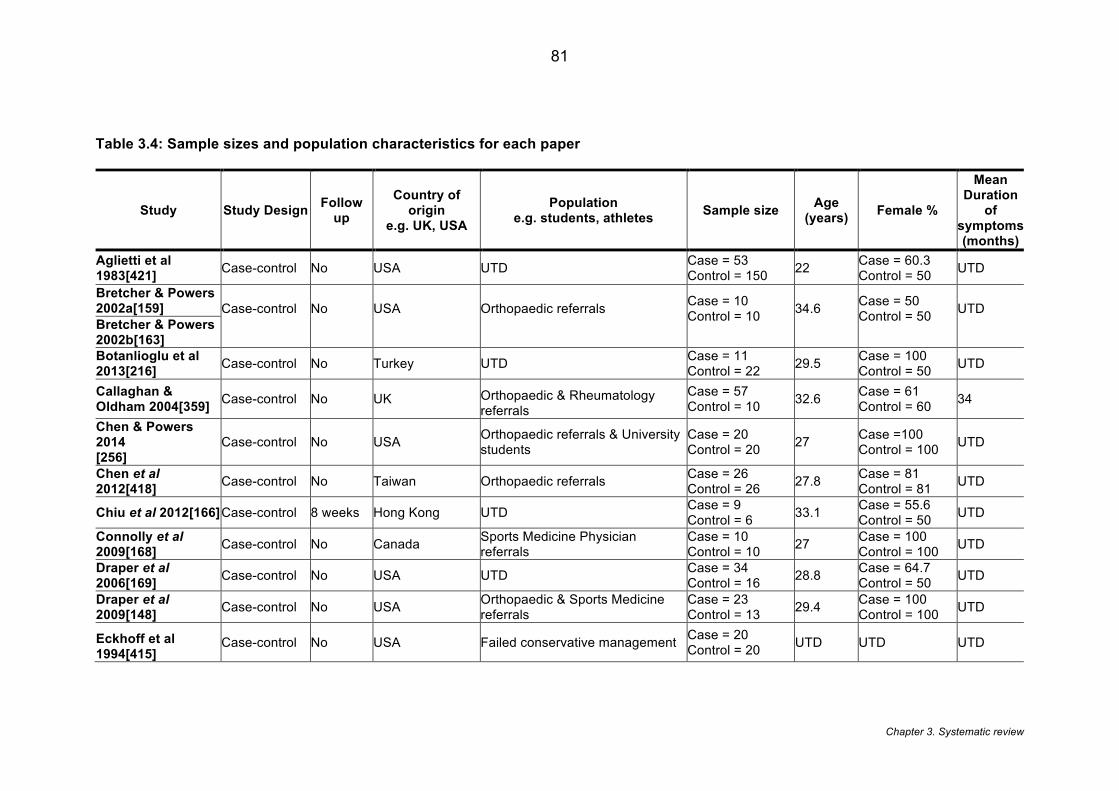
Chapter 3. Systematic review
81
Table 3.4: Sample sizes and population characteristics for each paper
Study Study Design Follow up
Country of origin
e.g. UK, USA Population
e.g. students, athletes Sample size Age (years) Female %
Mean Duration
of symptoms (months)
Aglietti et al 1983[421] Case-control No USA UTD Case = 53
Control = 150 22 Case = 60.3 Control = 50 UTD
Bretcher & Powers 2002a[159] Case-control
No
USA
Orthopaedic referrals
Case = 10 Control = 10
34.6
Case = 50 Control = 50
UTD Bretcher & Powers
2002b[163] Botanlioglu et al 2013[216] Case-control No Turkey UTD Case = 11
Control = 22 29.5 Case = 100 Control = 50 UTD
Callaghan & Oldham 2004[359] Case-control No UK Orthopaedic & Rheumatology
referrals Case = 57 Control = 10 32.6 Case = 61
Control = 60 34
Chen & Powers 2014 [256]
Case-control No USA Orthopaedic referrals & University students
Case = 20 Control = 20 27 Case =100
Control = 100 UTD
Chen et al 2012[418] Case-control No Taiwan Orthopaedic referrals Case = 26
Control = 26 27.8 Case = 81 Control = 81 UTD
Chiu et al 2012[166] Case-control 8 weeks Hong Kong UTD Case = 9 Control = 6 33.1 Case = 55.6
Control = 50 UTD
Connolly et al 2009[168] Case-control No Canada Sports Medicine Physician
referrals Case = 10 Control = 10 27 Case = 100
Control = 100 UTD
Draper et al 2006[169] Case-control No USA UTD Case = 34
Control = 16 28.8 Case = 64.7 Control = 50 UTD
Draper et al 2009[148] Case-control No USA Orthopaedic & Sports Medicine
referrals Case = 23 Control = 13 29.4 Case = 100
Control = 100 UTD
Eckhoff et al 1994[415]
Case-control No USA Failed conservative management Case = 20 Control = 20 UTD UTD UTD
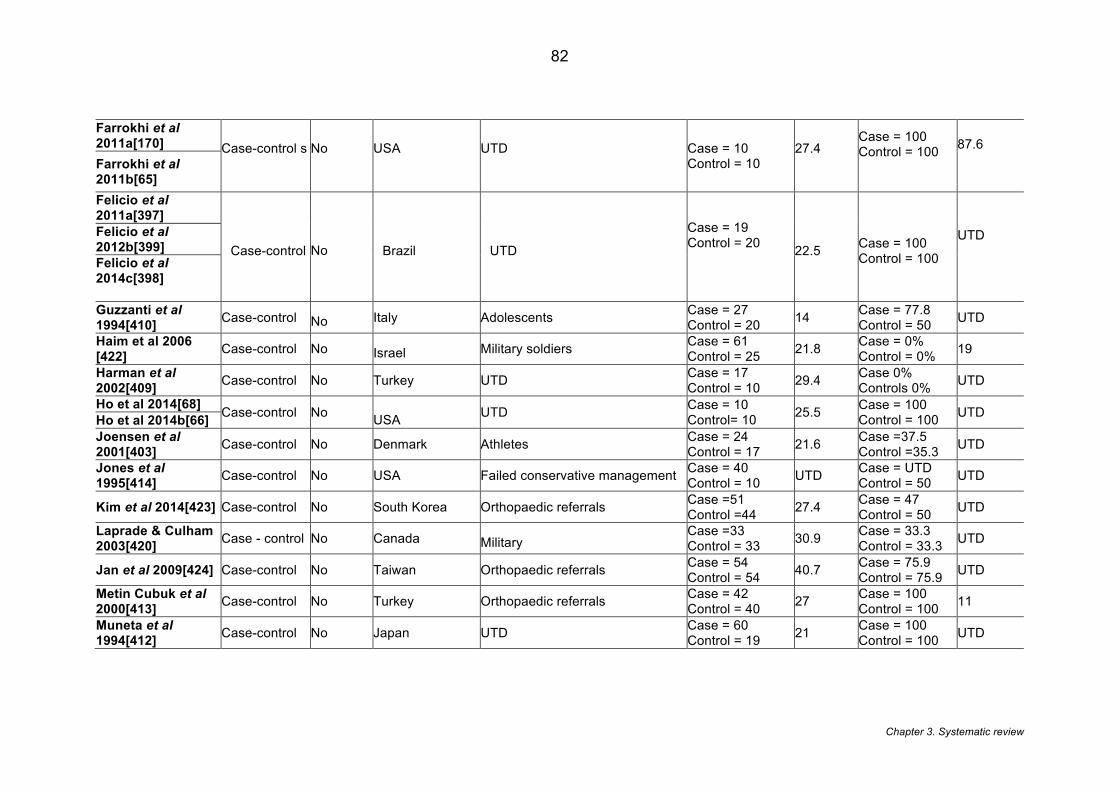
Chapter 3. Systematic review
82
Farrokhi et al 2011a[170] Case-control s
No
USA
UTD
Case = 10 Control = 10
27.4
Case = 100 Control = 100
87.6
Farrokhi et al 2011b[65] Felicio et al 2011a[397]
Case-control
No
Brazil UTD Case = 19 Control = 20
22.5 Case = 100
Control = 100 UTD
Felicio et al 2012b[399] Felicio et al 2014c[398] Guzzanti et al 1994[410] Case-control No Italy Adolescents Case = 27
Control = 20 14 Case = 77.8 Control = 50 UTD
Haim et al 2006 [422] Case-control No Israel Military soldiers Case = 61
Control = 25 21.8 Case = 0% Control = 0% 19
Harman et al 2002[409] Case-control No Turkey UTD Case = 17
Control = 10 29.4 Case 0% Controls 0% UTD
Ho et al 2014[68] Case-control No USA UTD Case = 10
Control= 10 25.5 Case = 100 Control = 100 UTD Ho et al 2014b[66]
Joensen et al 2001[403] Case-control No Denmark Athletes Case = 24
Control = 17 21.6 Case =37.5 Control =35.3 UTD
Jones et al 1995[414] Case-control No USA Failed conservative management Case = 40
Control = 10 UTD Case = UTD Control = 50 UTD
Kim et al 2014[423] Case-control No South Korea Orthopaedic referrals Case =51 Control =44 27.4 Case = 47
Control = 50 UTD
Laprade & Culham 2003[420] Case - control No Canada Military
Case =33 Control = 33 30.9 Case = 33.3
Control = 33.3 UTD
Jan et al 2009[424] Case-control No Taiwan Orthopaedic referrals Case = 54 Control = 54 40.7 Case = 75.9
Control = 75.9 UTD
Metin Cubuk et al 2000[413] Case-control No Turkey Orthopaedic referrals Case = 42
Control = 40 27 Case = 100 Control = 100 11
Muneta et al 1994[412] Case-control No Japan UTD Case = 60
Control = 19 21 Case = 100 Control = 100 UTD
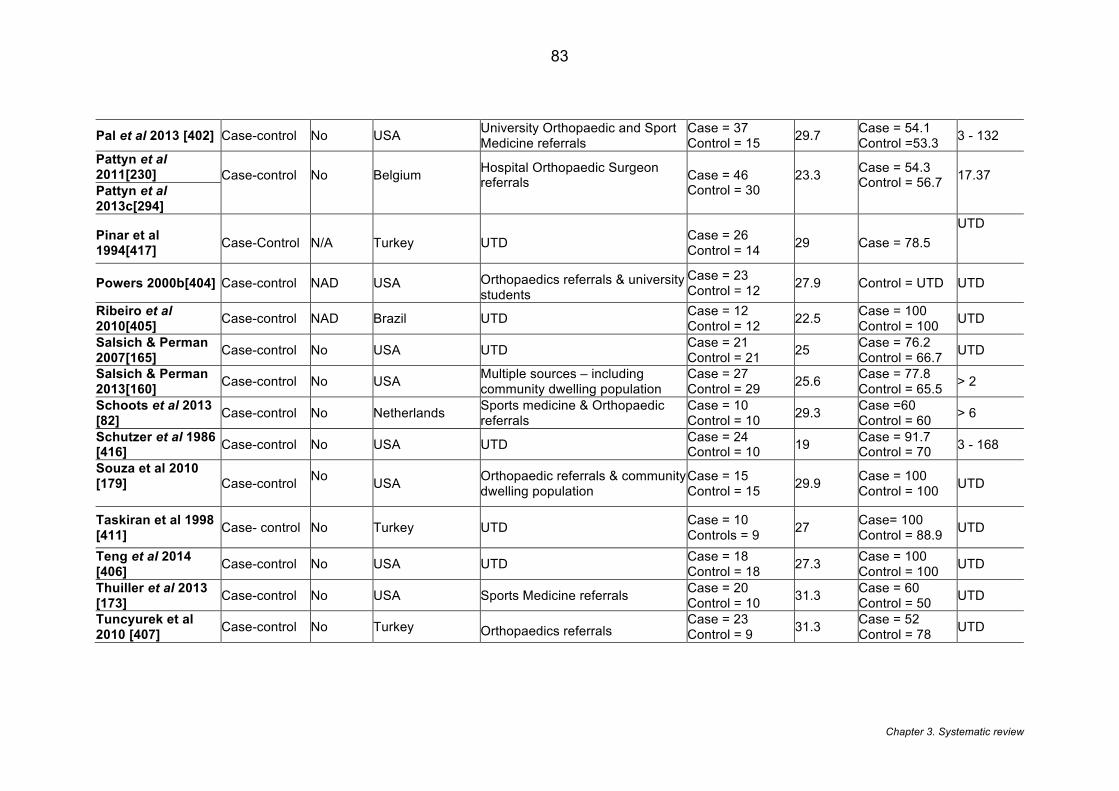
Chapter 3. Systematic review
83
Pal et al 2013 [402] Case-control No USA University Orthopaedic and Sport Medicine referrals
Case = 37 Control = 15 29.7 Case = 54.1
Control =53.3 3 - 132
Pattyn et al 2011[230] Case-control
No
Belgium
Hospital Orthopaedic Surgeon referrals
Case = 46 Control = 30
23.3
Case = 54.3 Control = 56.7
17.37 Pattyn et al
2013c[294]
Pinar et al 1994[417] Case-Control N/A Turkey UTD Case = 26
Control = 14 29 Case = 78.5 UTD
Powers 2000b[404] Case-control NAD USA Orthopaedics referrals & university students
Case = 23 Control = 12 27.9 Control = UTD UTD
Ribeiro et al 2010[405] Case-control NAD Brazil UTD Case = 12
Control = 12 22.5 Case = 100 Control = 100 UTD
Salsich & Perman 2007[165] Case-control No USA UTD Case = 21
Control = 21 25 Case = 76.2 Control = 66.7 UTD
Salsich & Perman 2013[160] Case-control No USA Multiple sources – including
community dwelling population Case = 27 Control = 29 25.6 Case = 77.8
Control = 65.5 > 2
Schoots et al 2013 [82] Case-control No Netherlands Sports medicine & Orthopaedic
referrals Case = 10 Control = 10 29.3 Case =60
Control = 60 > 6
Schutzer et al 1986 [416] Case-control No USA UTD Case = 24
Control = 10 19 Case = 91.7 Control = 70 3 - 168
Souza et al 2010 [179]
Case-control No USA Orthopaedic referrals & community
dwelling population Case = 15 Control = 15 29.9 Case = 100
Control = 100 UTD
Taskiran et al 1998 [411] Case- control No Turkey UTD Case = 10
Controls = 9 27 Case= 100 Control = 88.9 UTD
Teng et al 2014 [406] Case-control No USA UTD Case = 18
Control = 18 27.3 Case = 100 Control = 100 UTD
Thuiller et al 2013 [173] Case-control No USA Sports Medicine referrals Case = 20
Control = 10 31.3 Case = 60 Control = 50 UTD
Tuncyurek et al 2010 [407] Case-control No Turkey Orthopaedics referrals
Case = 23 Control = 9 31.3 Case = 52
Control = 78 UTD
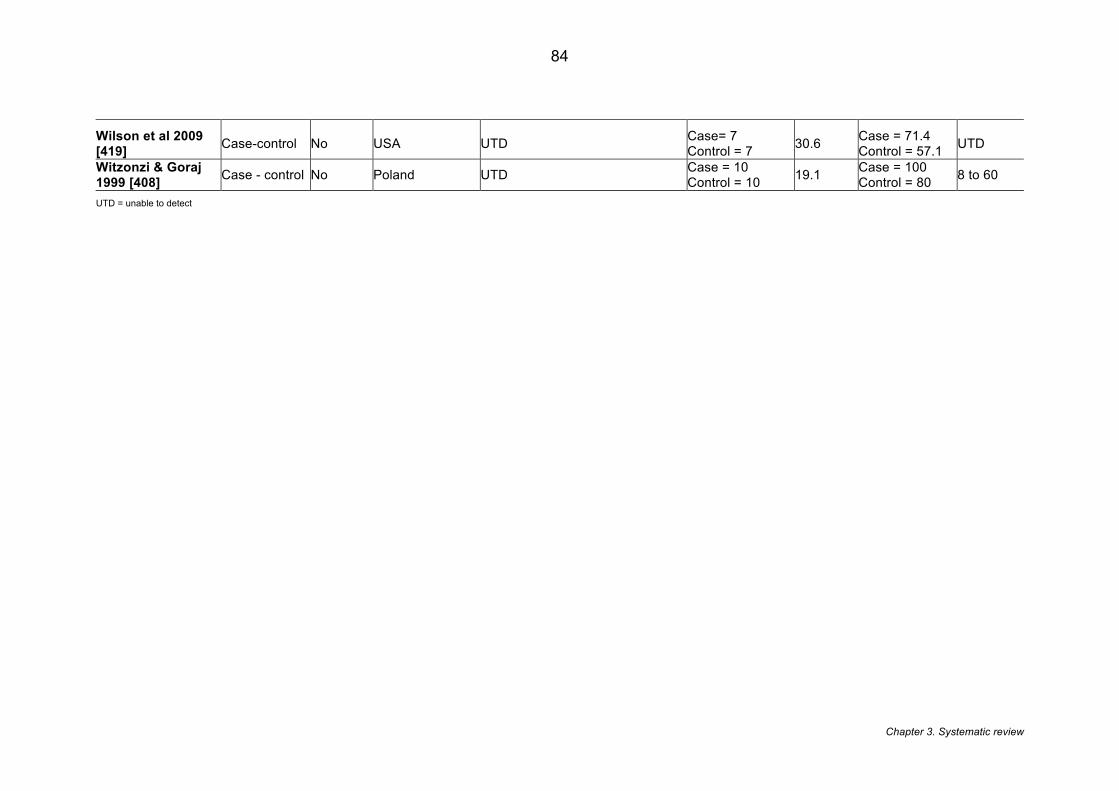
Chapter 3. Systematic review
84
Wilson et al 2009 [419] Case-control No USA UTD Case= 7
Control = 7 30.6 Case = 71.4 Control = 57.1 UTD
Witzonzi & Goraj 1999 [408] Case - control No Poland UTD Case = 10
Control = 10 19.1 Case = 100 Control = 80 8 to 60
UTD = unable to detect
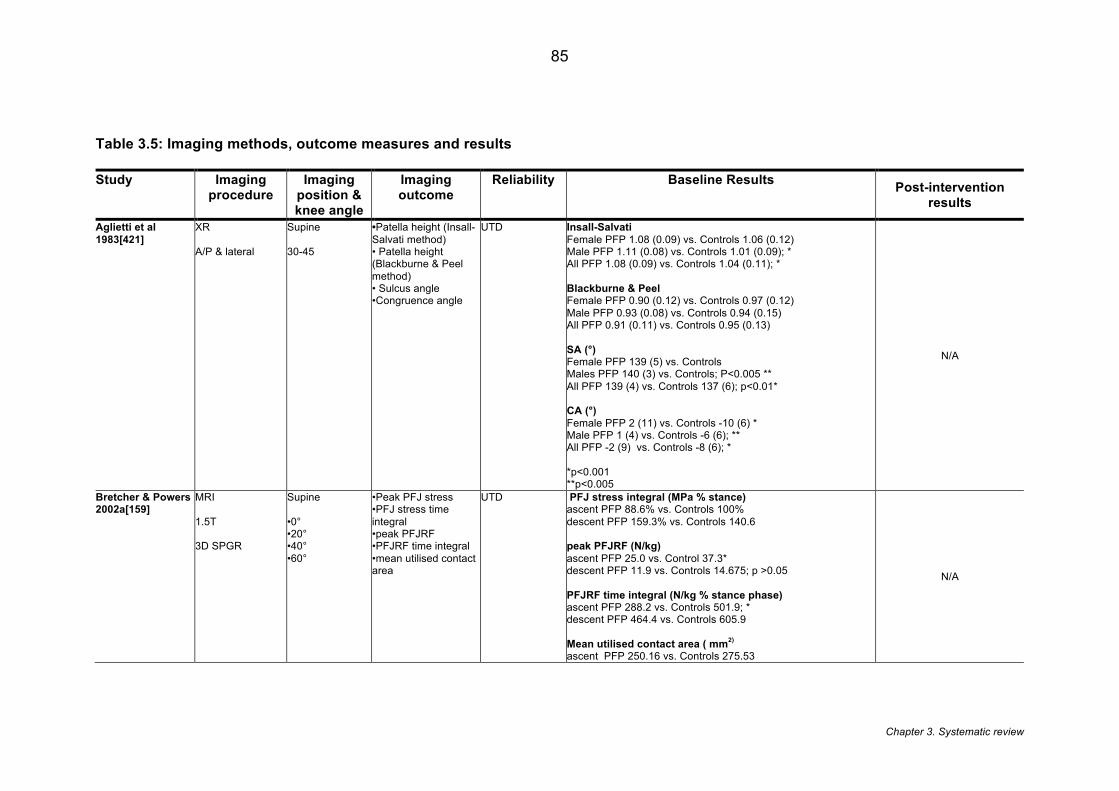
Chapter 3. Systematic review
85
Table 3.5: Imaging methods, outcome measures and results
Study Imaging procedure
Imaging position & knee angle
Imaging outcome
Reliability Baseline Results Post-intervention results
Aglietti et al 1983[421]
XR A/P & lateral
Supine 30-45
•Patella height (Insall-Salvati method) • Patella height (Blackburne & Peel method) • Sulcus angle •Congruence angle
UTD Insall-Salvati Female PFP 1.08 (0.09) vs. Controls 1.06 (0.12) Male PFP 1.11 (0.08) vs. Controls 1.01 (0.09); * All PFP 1.08 (0.09) vs. Controls 1.04 (0.11); * Blackburne & Peel Female PFP 0.90 (0.12) vs. Controls 0.97 (0.12) Male PFP 0.93 (0.08) vs. Controls 0.94 (0.15) All PFP 0.91 (0.11) vs. Controls 0.95 (0.13) SA (°) Female PFP 139 (5) vs. Controls Males PFP 140 (3) vs. Controls; P<0.005 ** All PFP 139 (4) vs. Controls 137 (6); p<0.01* CA (°) Female PFP 2 (11) vs. Controls -10 (6) * Male PFP 1 (4) vs. Controls -6 (6); ** All PFP -2 (9) vs. Controls -8 (6); * *p<0.001 **p<0.005
N/A
Bretcher & Powers 2002a[159]
MRI 1.5T 3D SPGR
Supine •0° •20° •40° •60°
•Peak PFJ stress •PFJ stress time integral •peak PFJRF •PFJRF time integral •mean utilised contact area
UTD PFJ stress integral (MPa % stance) ascent PFP 88.6% vs. Controls 100% descent PFP 159.3% vs. Controls 140.6 peak PFJRF (N/kg) ascent PFP 25.0 vs. Control 37.3* descent PFP 11.9 vs. Controls 14.675; p >0.05 PFJRF time integral (N/kg % stance phase) ascent PFP 288.2 vs. Controls 501.9; * descent PFP 464.4 vs. Controls 605.9 Mean utilised contact area ( mm2) ascent PFP 250.16 vs. Controls 275.53
N/A
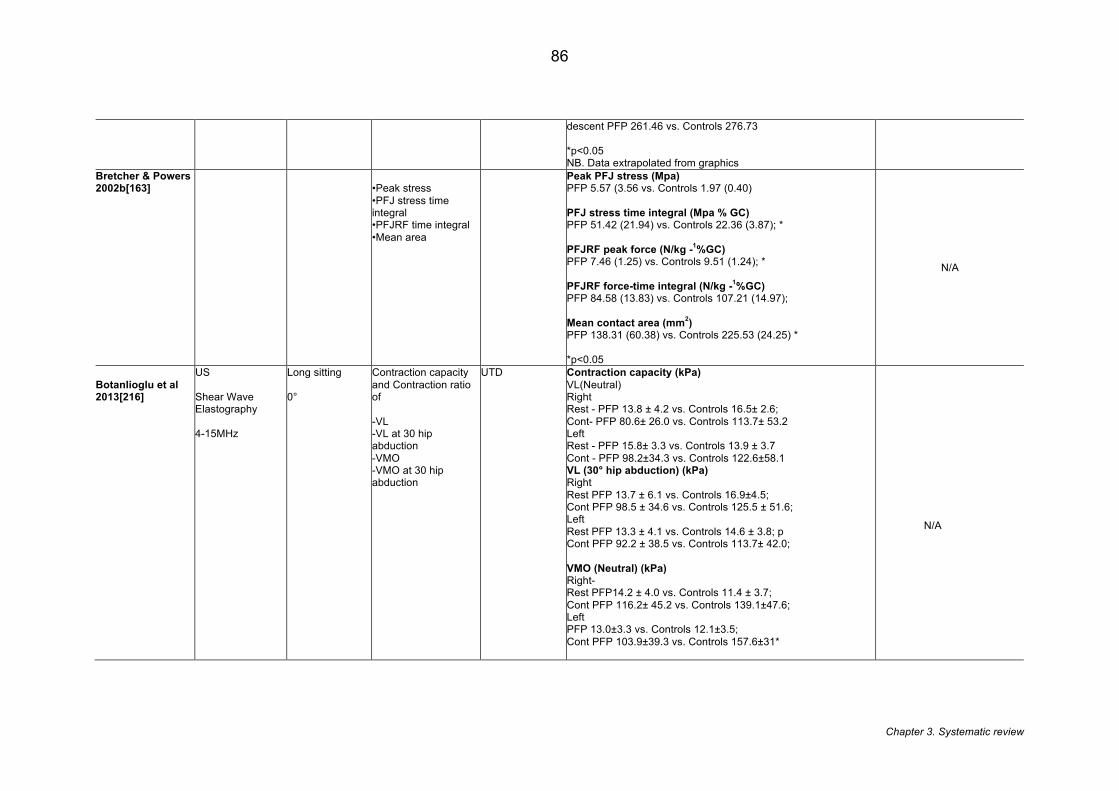
Chapter 3. Systematic review
86
descent PFP 261.46 vs. Controls 276.73 *p<0.05 NB. Data extrapolated from graphics
Bretcher & Powers 2002b[163]
•Peak stress •PFJ stress time integral •PFJRF time integral •Mean area
Peak PFJ stress (Mpa) PFP 5.57 (3.56 vs. Controls 1.97 (0.40) PFJ stress time integral (Mpa % GC) PFP 51.42 (21.94) vs. Controls 22.36 (3.87); * PFJRF peak force (N/kg -1%GC) PFP 7.46 (1.25) vs. Controls 9.51 (1.24); * PFJRF force-time integral (N/kg -1%GC) PFP 84.58 (13.83) vs. Controls 107.21 (14.97); Mean contact area (mm2) PFP 138.31 (60.38) vs. Controls 225.53 (24.25) * *p<0.05
N/A
Botanlioglu et al 2013[216]
US Shear Wave Elastography 4-15MHz
Long sitting 0°
Contraction capacity and Contraction ratio of -VL -VL at 30 hip abduction -VMO -VMO at 30 hip abduction
UTD Contraction capacity (kPa) VL(Neutral) Right Rest - PFP 13.8 ± 4.2 vs. Controls 16.5± 2.6; Cont- PFP 80.6± 26.0 vs. Controls 113.7± 53.2 Left Rest - PFP 15.8± 3.3 vs. Controls 13.9 ± 3.7 Cont - PFP 98.2±34.3 vs. Controls 122.6±58.1 VL (30° hip abduction) (kPa) Right Rest PFP 13.7 ± 6.1 vs. Controls 16.9±4.5; Cont PFP 98.5 ± 34.6 vs. Controls 125.5 ± 51.6; Left Rest PFP 13.3 ± 4.1 vs. Controls 14.6 ± 3.8; p Cont PFP 92.2 ± 38.5 vs. Controls 113.7± 42.0; VMO (Neutral) (kPa) Right- Rest PFP14.2 ± 4.0 vs. Controls 11.4 ± 3.7; Cont PFP 116.2± 45.2 vs. Controls 139.1±47.6; Left PFP 13.0±3.3 vs. Controls 12.1±3.5; Cont PFP 103.9±39.3 vs. Controls 157.6±31*
N/A
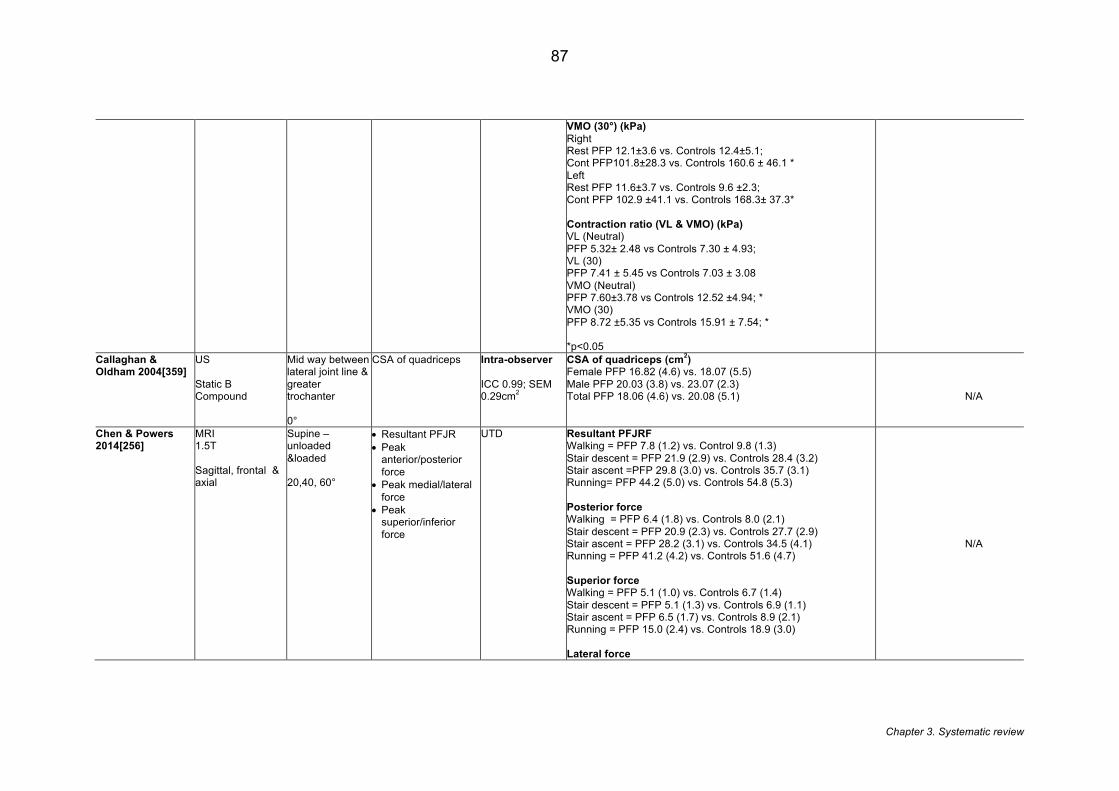
Chapter 3. Systematic review
87
VMO (30°) (kPa) Right Rest PFP 12.1±3.6 vs. Controls 12.4±5.1; Cont PFP101.8±28.3 vs. Controls 160.6 ± 46.1 * Left Rest PFP 11.6±3.7 vs. Controls 9.6 ±2.3; Cont PFP 102.9 ±41.1 vs. Controls 168.3± 37.3* Contraction ratio (VL & VMO) (kPa) VL (Neutral) PFP 5.32± 2.48 vs Controls 7.30 ± 4.93; VL (30) PFP 7.41 ± 5.45 vs Controls 7.03 ± 3.08 VMO (Neutral) PFP 7.60±3.78 vs Controls 12.52 ±4.94; * VMO (30) PFP 8.72 ±5.35 vs Controls 15.91 ± 7.54; * *p<0.05
Callaghan & Oldham 2004[359]
US Static B Compound
Mid way between lateral joint line & greater trochanter 0°
CSA of quadriceps Intra-observer ICC 0.99; SEM 0.29cm2
CSA of quadriceps (cm2) Female PFP 16.82 (4.6) vs. 18.07 (5.5) Male PFP 20.03 (3.8) vs. 23.07 (2.3) Total PFP 18.06 (4.6) vs. 20.08 (5.1)
N/A
Chen & Powers 2014[256]
MRI 1.5T Sagittal, frontal & axial
Supine – unloaded &loaded 20,40, 60°
• Resultant PFJR • Peak
anterior/posterior force
• Peak medial/lateral force
• Peak superior/inferior force
UTD Resultant PFJRF Walking = PFP 7.8 (1.2) vs. Control 9.8 (1.3) Stair descent = PFP 21.9 (2.9) vs. Controls 28.4 (3.2) Stair ascent =PFP 29.8 (3.0) vs. Controls 35.7 (3.1) Running= PFP 44.2 (5.0) vs. Controls 54.8 (5.3) Posterior force Walking = PFP 6.4 (1.8) vs. Controls 8.0 (2.1) Stair descent = PFP 20.9 (2.3) vs. Controls 27.7 (2.9) Stair ascent = PFP 28.2 (3.1) vs. Controls 34.5 (4.1) Running = PFP 41.2 (4.2) vs. Controls 51.6 (4.7) Superior force Walking = PFP 5.1 (1.0) vs. Controls 6.7 (1.4) Stair descent = PFP 5.1 (1.3) vs. Controls 6.9 (1.1) Stair ascent = PFP 6.5 (1.7) vs. Controls 8.9 (2.1) Running = PFP 15.0 (2.4) vs. Controls 18.9 (3.0) Lateral force
N/A
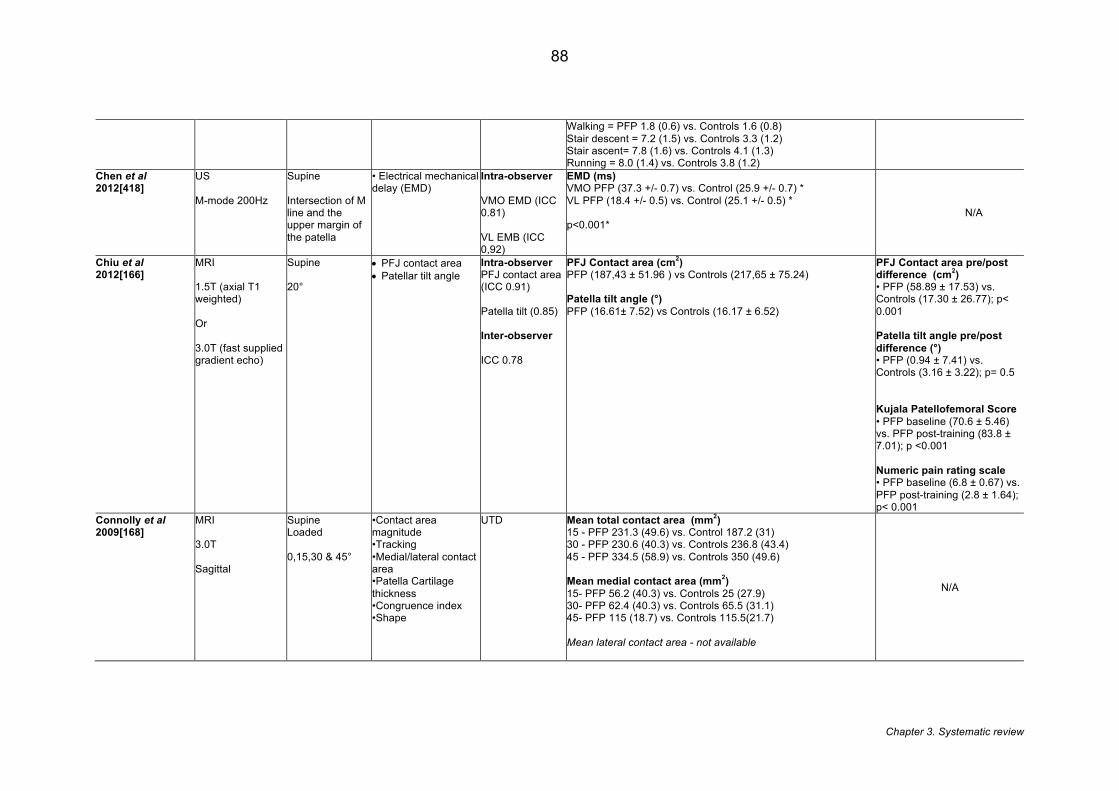
Chapter 3. Systematic review
88
Walking = PFP 1.8 (0.6) vs. Controls 1.6 (0.8) Stair descent = 7.2 (1.5) vs. Controls 3.3 (1.2) Stair ascent= 7.8 (1.6) vs. Controls 4.1 (1.3) Running = 8.0 (1.4) vs. Controls 3.8 (1.2)
Chen et al 2012[418]
US M-mode 200Hz
Supine Intersection of M line and the upper margin of the patella
• Electrical mechanical delay (EMD)
Intra-observer VMO EMD (ICC 0.81) VL EMB (ICC 0,92)
EMD (ms) VMO PFP (37.3 +/- 0.7) vs. Control (25.9 +/- 0.7) * VL PFP (18.4 +/- 0.5) vs. Control (25.1 +/- 0.5) * p<0.001*
N/A
Chiu et al 2012[166]
MRI 1.5T (axial T1 weighted) Or 3.0T (fast supplied gradient echo)
Supine 20°
• PFJ contact area • Patellar tilt angle
Intra-observer PFJ contact area (ICC 0.91) Patella tilt (0.85) Inter-observer ICC 0.78
PFJ Contact area (cm2) PFP (187,43 ± 51.96 ) vs Controls (217,65 ± 75.24) Patella tilt angle (°) PFP (16.61± 7.52) vs Controls (16.17 ± 6.52)
PFJ Contact area pre/post difference (cm2) • PFP (58.89 ± 17.53) vs. Controls (17.30 ± 26.77); p< 0.001 Patella tilt angle pre/post difference (°) • PFP (0.94 ± 7.41) vs. Controls (3.16 ± 3.22); p= 0.5 Kujala Patellofemoral Score • PFP baseline (70.6 ± 5.46) vs. PFP post-training (83.8 ± 7.01); p <0.001 Numeric pain rating scale • PFP baseline (6.8 ± 0.67) vs. PFP post-training (2.8 ± 1.64); p< 0.001
Connolly et al 2009[168]
MRI 3.0T Sagittal
Supine Loaded 0,15,30 & 45°
•Contact area magnitude •Tracking •Medial/lateral contact area •Patella Cartilage thickness •Congruence index •Shape
UTD Mean total contact area (mm2) 15 - PFP 231.3 (49.6) vs. Control 187.2 (31) 30 - PFP 230.6 (40.3) vs. Controls 236.8 (43.4) 45 - PFP 334.5 (58.9) vs. Controls 350 (49.6) Mean medial contact area (mm2) 15- PFP 56.2 (40.3) vs. Controls 25 (27.9) 30- PFP 62.4 (40.3) vs. Controls 65.5 (31.1) 45- PFP 115 (18.7) vs. Controls 115.5(21.7) Mean lateral contact area - not available
N/A
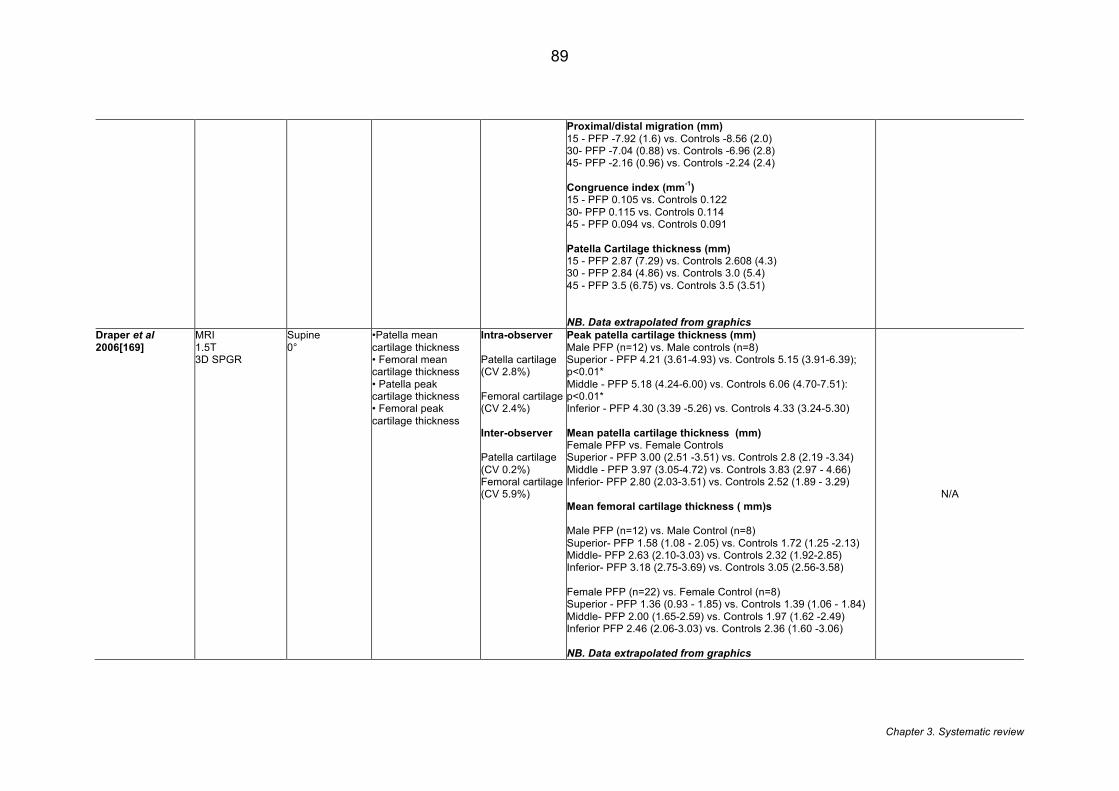
Chapter 3. Systematic review
89
Proximal/distal migration (mm) 15 - PFP -7.92 (1.6) vs. Controls -8.56 (2.0) 30- PFP -7.04 (0.88) vs. Controls -6.96 (2.8) 45- PFP -2.16 (0.96) vs. Controls -2.24 (2.4) Congruence index (mm-1) 15 - PFP 0.105 vs. Controls 0.122 30- PFP 0.115 vs. Controls 0.114 45 - PFP 0.094 vs. Controls 0.091 Patella Cartilage thickness (mm) 15 - PFP 2.87 (7.29) vs. Controls 2.608 (4.3) 30 - PFP 2.84 (4.86) vs. Controls 3.0 (5.4) 45 - PFP 3.5 (6.75) vs. Controls 3.5 (3.51) NB. Data extrapolated from graphics
Draper et al 2006[169]
MRI 1.5T 3D SPGR
Supine 0°
•Patella mean cartilage thickness • Femoral mean cartilage thickness • Patella peak cartilage thickness • Femoral peak cartilage thickness
Intra-observer Patella cartilage (CV 2.8%) Femoral cartilage (CV 2.4%) Inter-observer Patella cartilage (CV 0.2%) Femoral cartilage (CV 5.9%)
Peak patella cartilage thickness (mm) Male PFP (n=12) vs. Male controls (n=8) Superior - PFP 4.21 (3.61-4.93) vs. Controls 5.15 (3.91-6.39); p<0.01* Middle - PFP 5.18 (4.24-6.00) vs. Controls 6.06 (4.70-7.51): p<0.01* Inferior - PFP 4.30 (3.39 -5.26) vs. Controls 4.33 (3.24-5.30) Mean patella cartilage thickness (mm) Female PFP vs. Female Controls Superior - PFP 3.00 (2.51 -3.51) vs. Controls 2.8 (2.19 -3.34) Middle - PFP 3.97 (3.05-4.72) vs. Controls 3.83 (2.97 - 4.66) Inferior- PFP 2.80 (2.03-3.51) vs. Controls 2.52 (1.89 - 3.29) Mean femoral cartilage thickness ( mm)s Male PFP (n=12) vs. Male Control (n=8) Superior- PFP 1.58 (1.08 - 2.05) vs. Controls 1.72 (1.25 -2.13) Middle- PFP 2.63 (2.10-3.03) vs. Controls 2.32 (1.92-2.85) Inferior- PFP 3.18 (2.75-3.69) vs. Controls 3.05 (2.56-3.58) Female PFP (n=22) vs. Female Control (n=8) Superior - PFP 1.36 (0.93 - 1.85) vs. Controls 1.39 (1.06 - 1.84) Middle- PFP 2.00 (1.65-2.59) vs. Controls 1.97 (1.62 -2.49) Inferior PFP 2.46 (2.06-3.03) vs. Controls 2.36 (1.60 -3.06) NB. Data extrapolated from graphics
N/A
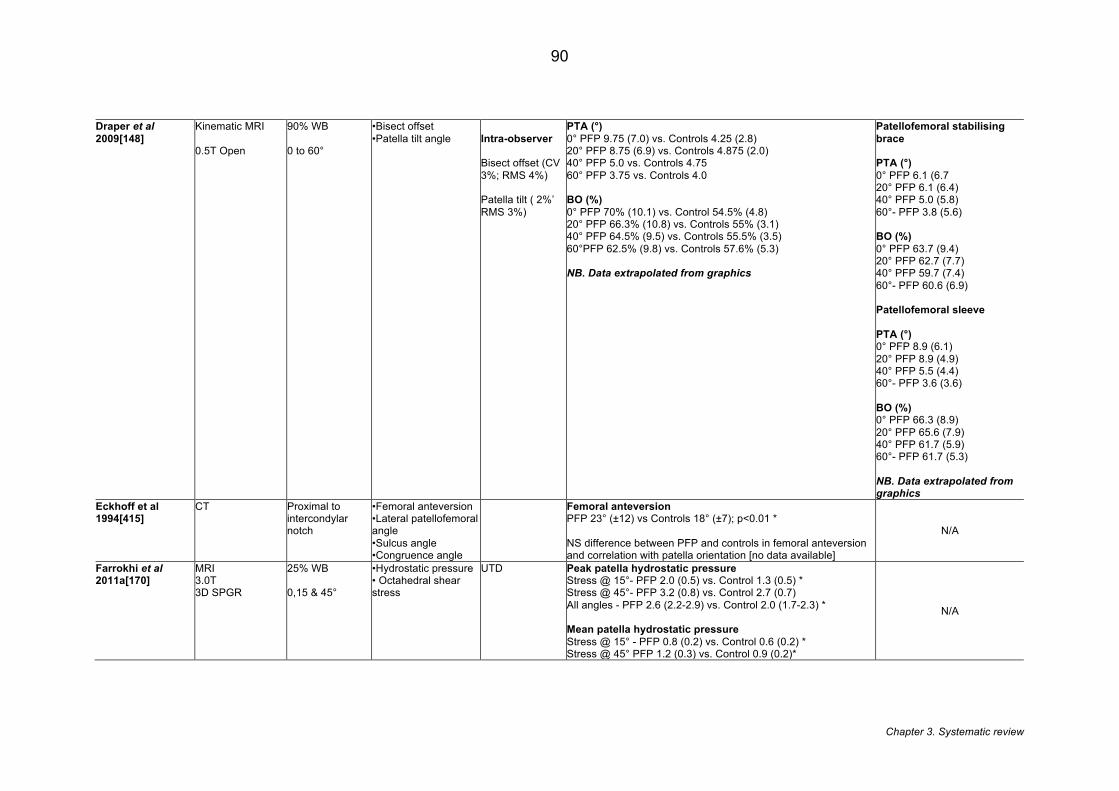
Chapter 3. Systematic review
90
Draper et al 2009[148]
Kinematic MRI 0.5T Open
90% WB 0 to 60°
•Bisect offset •Patella tilt angle
Intra-observer Bisect offset (CV 3%; RMS 4%) Patella tilt ( 2%’ RMS 3%)
PTA (°) 0° PFP 9.75 (7.0) vs. Controls 4.25 (2.8) 20° PFP 8.75 (6.9) vs. Controls 4.875 (2.0) 40° PFP 5.0 vs. Controls 4.75 60° PFP 3.75 vs. Controls 4.0 BO (%) 0° PFP 70% (10.1) vs. Control 54.5% (4.8) 20° PFP 66.3% (10.8) vs. Controls 55% (3.1) 40° PFP 64.5% (9.5) vs. Controls 55.5% (3.5) 60°PFP 62.5% (9.8) vs. Controls 57.6% (5.3) NB. Data extrapolated from graphics
Patellofemoral stabilising brace PTA (°) 0° PFP 6.1 (6.7 20° PFP 6.1 (6.4) 40° PFP 5.0 (5.8) 60°- PFP 3.8 (5.6) BO (%) 0° PFP 63.7 (9.4) 20° PFP 62.7 (7.7) 40° PFP 59.7 (7.4) 60°- PFP 60.6 (6.9) Patellofemoral sleeve PTA (°) 0° PFP 8.9 (6.1) 20° PFP 8.9 (4.9) 40° PFP 5.5 (4.4) 60°- PFP 3.6 (3.6) BO (%) 0° PFP 66.3 (8.9) 20° PFP 65.6 (7.9) 40° PFP 61.7 (5.9) 60°- PFP 61.7 (5.3) NB. Data extrapolated from graphics
Eckhoff et al 1994[415]
CT Proximal to intercondylar notch
•Femoral anteversion •Lateral patellofemoral angle •Sulcus angle •Congruence angle
Femoral anteversion PFP 23° (±12) vs Controls 18° (±7); p<0.01 * NS difference between PFP and controls in femoral anteversion and correlation with patella orientation [no data available]
N/A
Farrokhi et al 2011a[170]
MRI 3.0T 3D SPGR
25% WB 0,15 & 45°
•Hydrostatic pressure • Octahedral shear stress
UTD Peak patella hydrostatic pressure Stress @ 15°- PFP 2.0 (0.5) vs. Control 1.3 (0.5) * Stress @ 45°- PFP 3.2 (0.8) vs. Control 2.7 (0.7) All angles - PFP 2.6 (2.2-2.9) vs. Control 2.0 (1.7-2.3) * Mean patella hydrostatic pressure Stress @ 15° - PFP 0.8 (0.2) vs. Control 0.6 (0.2) * Stress @ 45° PFP 1.2 (0.3) vs. Control 0.9 (0.2)*
N/A
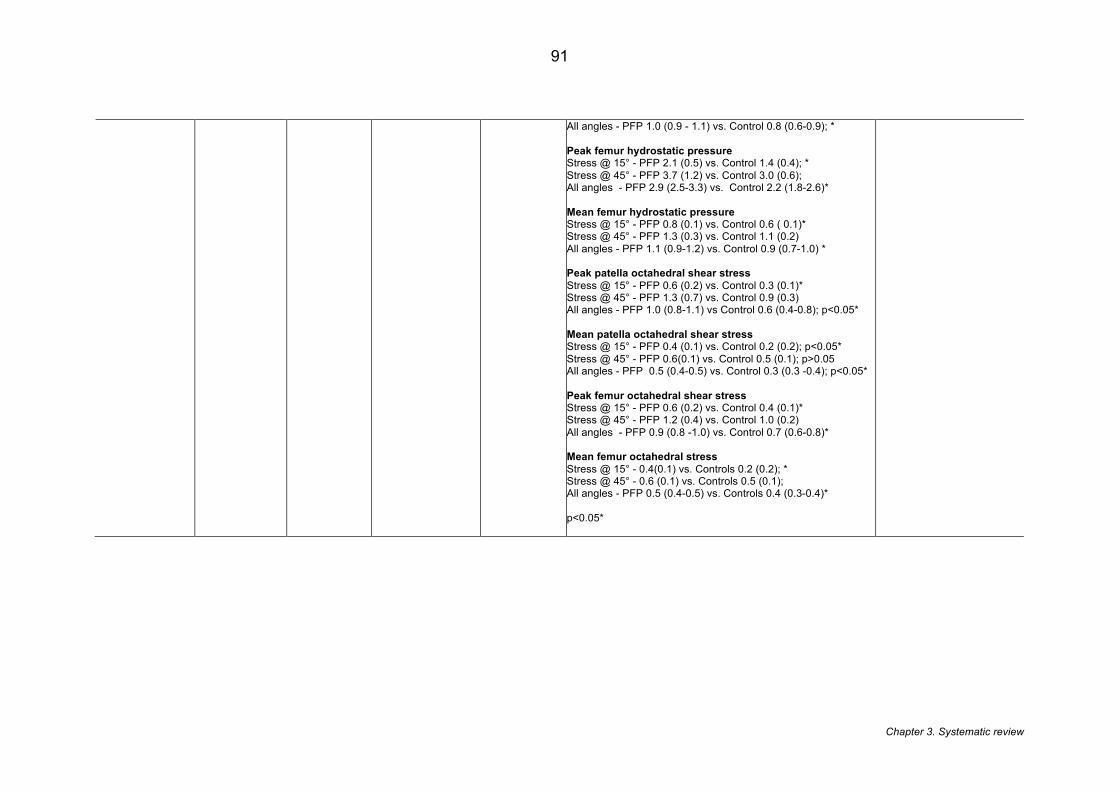
Chapter 3. Systematic review
91
All angles - PFP 1.0 (0.9 - 1.1) vs. Control 0.8 (0.6-0.9); * Peak femur hydrostatic pressure Stress @ 15° - PFP 2.1 (0.5) vs. Control 1.4 (0.4); * Stress @ 45° - PFP 3.7 (1.2) vs. Control 3.0 (0.6); All angles - PFP 2.9 (2.5-3.3) vs. Control 2.2 (1.8-2.6)* Mean femur hydrostatic pressure Stress @ 15° - PFP 0.8 (0.1) vs. Control 0.6 ( 0.1)* Stress @ 45° - PFP 1.3 (0.3) vs. Control 1.1 (0.2) All angles - PFP 1.1 (0.9-1.2) vs. Control 0.9 (0.7-1.0) * Peak patella octahedral shear stress Stress @ 15° - PFP 0.6 (0.2) vs. Control 0.3 (0.1)* Stress @ 45° - PFP 1.3 (0.7) vs. Control 0.9 (0.3) All angles - PFP 1.0 (0.8-1.1) vs Control 0.6 (0.4-0.8); p<0.05* Mean patella octahedral shear stress Stress @ 15° - PFP 0.4 (0.1) vs. Control 0.2 (0.2); p<0.05* Stress @ 45° - PFP 0.6(0.1) vs. Control 0.5 (0.1); p>0.05 All angles - PFP 0.5 (0.4-0.5) vs. Control 0.3 (0.3 -0.4); p<0.05* Peak femur octahedral shear stress Stress @ 15° - PFP 0.6 (0.2) vs. Control 0.4 (0.1)* Stress @ 45° - PFP 1.2 (0.4) vs. Control 1.0 (0.2) All angles - PFP 0.9 (0.8 -1.0) vs. Control 0.7 (0.6-0.8)* Mean femur octahedral stress Stress @ 15° - 0.4(0.1) vs. Controls 0.2 (0.2); * Stress @ 45° - 0.6 (0.1) vs. Controls 0.5 (0.1); All angles - PFP 0.5 (0.4-0.5) vs. Controls 0.4 (0.3-0.4)* p<0.05*
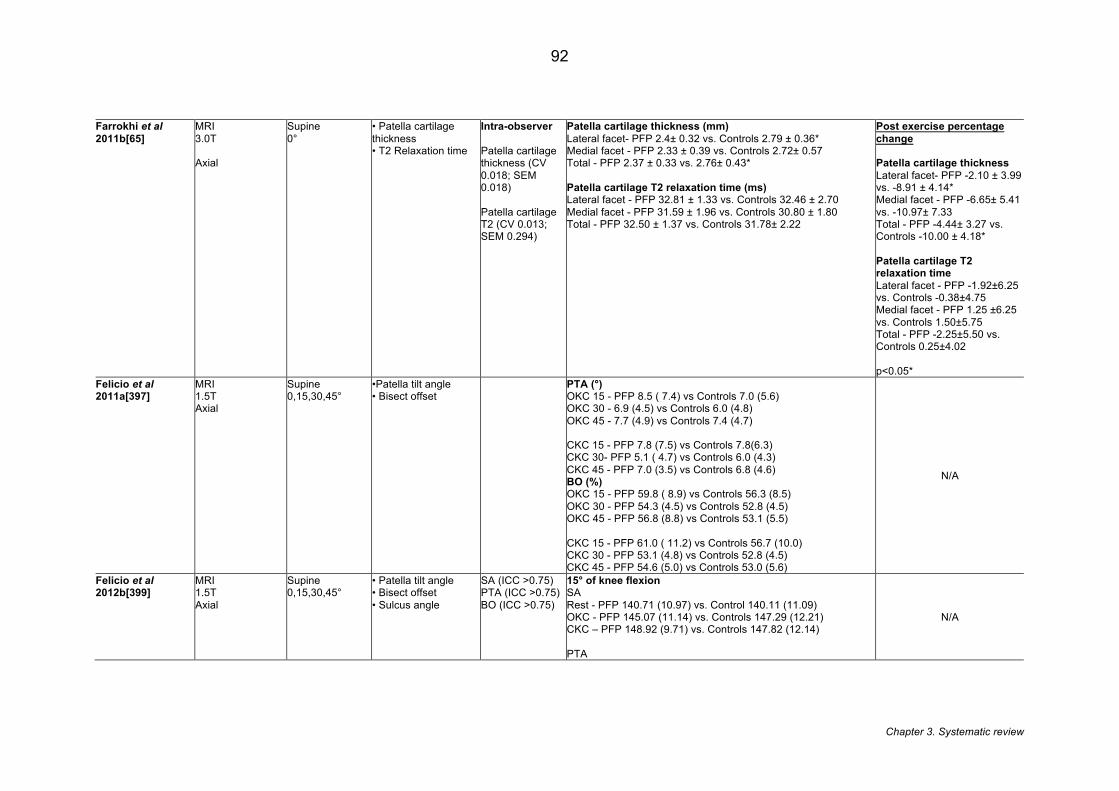
Chapter 3. Systematic review
92
Farrokhi et al 2011b[65]
MRI 3.0T Axial
Supine 0°
• Patella cartilage thickness • T2 Relaxation time
Intra-observer Patella cartilage thickness (CV 0.018; SEM 0.018) Patella cartilage T2 (CV 0.013; SEM 0.294)
Patella cartilage thickness (mm) Lateral facet- PFP 2.4± 0.32 vs. Controls 2.79 ± 0.36* Medial facet - PFP 2.33 ± 0.39 vs. Controls 2.72± 0.57 Total - PFP 2.37 ± 0.33 vs. 2.76± 0.43* Patella cartilage T2 relaxation time (ms) Lateral facet - PFP 32.81 ± 1.33 vs. Controls 32.46 ± 2.70 Medial facet - PFP 31.59 ± 1.96 vs. Controls 30.80 ± 1.80 Total - PFP 32.50 ± 1.37 vs. Controls 31.78± 2.22
Post exercise percentage change Patella cartilage thickness Lateral facet- PFP -2.10 ± 3.99 vs. -8.91 ± 4.14* Medial facet - PFP -6.65± 5.41 vs. -10.97± 7.33 Total - PFP -4.44± 3.27 vs. Controls -10.00 ± 4.18* Patella cartilage T2 relaxation time Lateral facet - PFP -1.92±6.25 vs. Controls -0.38±4.75 Medial facet - PFP 1.25 ±6.25 vs. Controls 1.50±5.75 Total - PFP -2.25±5.50 vs. Controls 0.25±4.02 p<0.05*
Felicio et al 2011a[397]
MRI 1.5T Axial
Supine 0,15,30,45°
•Patella tilt angle • Bisect offset
PTA (°) OKC 15 - PFP 8.5 ( 7.4) vs Controls 7.0 (5.6) OKC 30 - 6.9 (4.5) vs Controls 6.0 (4.8) OKC 45 - 7.7 (4.9) vs Controls 7.4 (4.7) CKC 15 - PFP 7.8 (7.5) vs Controls 7.8(6.3) CKC 30- PFP 5.1 ( 4.7) vs Controls 6.0 (4.3) CKC 45 - PFP 7.0 (3.5) vs Controls 6.8 (4.6) BO (%) OKC 15 - PFP 59.8 ( 8.9) vs Controls 56.3 (8.5) OKC 30 - PFP 54.3 (4.5) vs Controls 52.8 (4.5) OKC 45 - PFP 56.8 (8.8) vs Controls 53.1 (5.5) CKC 15 - PFP 61.0 ( 11.2) vs Controls 56.7 (10.0) CKC 30 - PFP 53.1 (4.8) vs Controls 52.8 (4.5) CKC 45 - PFP 54.6 (5.0) vs Controls 53.0 (5.6)
N/A
Felicio et al 2012b[399]
MRI 1.5T Axial
Supine 0,15,30,45°
• Patella tilt angle • Bisect offset • Sulcus angle
SA (ICC >0.75) PTA (ICC >0.75) BO (ICC >0.75)
15° of knee flexion SA Rest - PFP 140.71 (10.97) vs. Control 140.11 (11.09) OKC - PFP 145.07 (11.14) vs. Controls 147.29 (12.21) CKC – PFP 148.92 (9.71) vs. Controls 147.82 (12.14) PTA
N/A
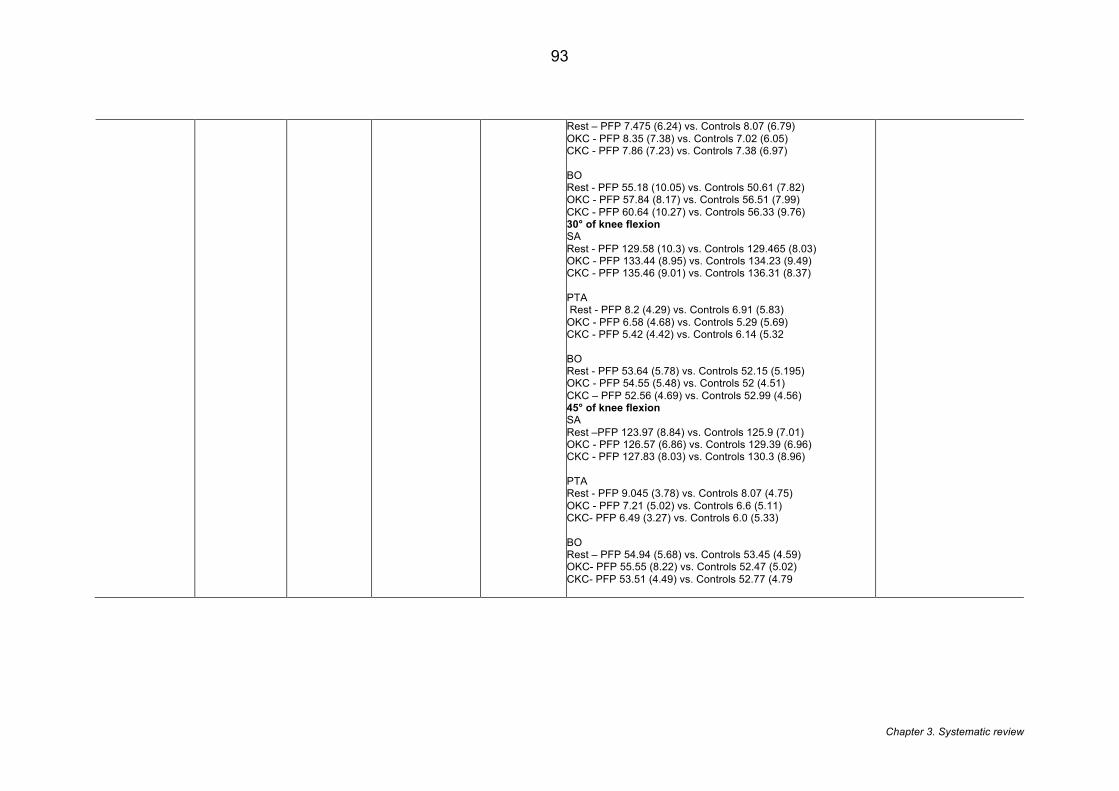
Chapter 3. Systematic review
93
Rest – PFP 7.475 (6.24) vs. Controls 8.07 (6.79) OKC - PFP 8.35 (7.38) vs. Controls 7.02 (6.05) CKC - PFP 7.86 (7.23) vs. Controls 7.38 (6.97) BO Rest - PFP 55.18 (10.05) vs. Controls 50.61 (7.82) OKC - PFP 57.84 (8.17) vs. Controls 56.51 (7.99) CKC - PFP 60.64 (10.27) vs. Controls 56.33 (9.76) 30° of knee flexion SA Rest - PFP 129.58 (10.3) vs. Controls 129.465 (8.03) OKC - PFP 133.44 (8.95) vs. Controls 134.23 (9.49) CKC - PFP 135.46 (9.01) vs. Controls 136.31 (8.37) PTA Rest - PFP 8.2 (4.29) vs. Controls 6.91 (5.83) OKC - PFP 6.58 (4.68) vs. Controls 5.29 (5.69) CKC - PFP 5.42 (4.42) vs. Controls 6.14 (5.32 BO Rest - PFP 53.64 (5.78) vs. Controls 52.15 (5.195) OKC - PFP 54.55 (5.48) vs. Controls 52 (4.51) CKC – PFP 52.56 (4.69) vs. Controls 52.99 (4.56) 45° of knee flexion SA Rest –PFP 123.97 (8.84) vs. Controls 125.9 (7.01) OKC - PFP 126.57 (6.86) vs. Controls 129.39 (6.96) CKC - PFP 127.83 (8.03) vs. Controls 130.3 (8.96) PTA Rest - PFP 9.045 (3.78) vs. Controls 8.07 (4.75) OKC - PFP 7.21 (5.02) vs. Controls 6.6 (5.11) CKC- PFP 6.49 (3.27) vs. Controls 6.0 (5.33) BO Rest – PFP 54.94 (5.68) vs. Controls 53.45 (4.59) OKC- PFP 55.55 (8.22) vs. Controls 52.47 (5.02) CKC- PFP 53.51 (4.49) vs. Controls 52.77 (4.79
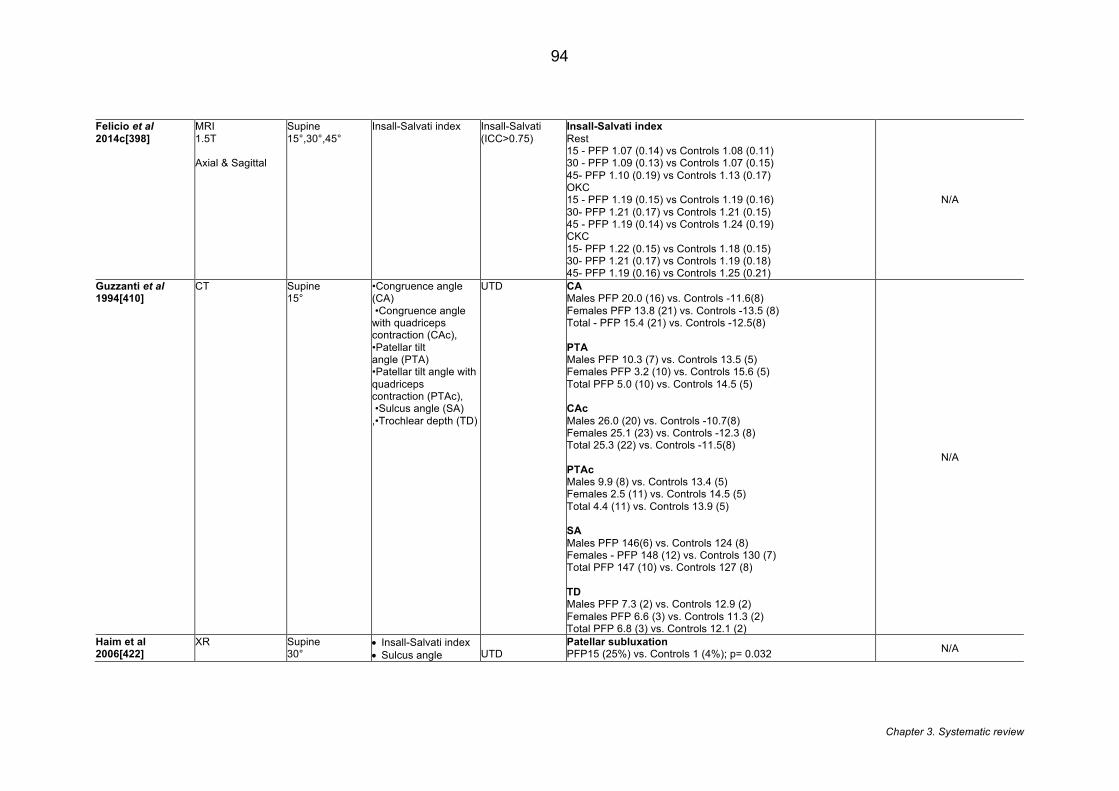
Chapter 3. Systematic review
94
Felicio et al 2014c[398]
MRI 1.5T Axial & Sagittal
Supine 15°,30°,45°
Insall-Salvati index Insall-Salvati (ICC>0.75)
Insall-Salvati index Rest 15 - PFP 1.07 (0.14) vs Controls 1.08 (0.11) 30 - PFP 1.09 (0.13) vs Controls 1.07 (0.15) 45- PFP 1.10 (0.19) vs Controls 1.13 (0.17) OKC 15 - PFP 1.19 (0.15) vs Controls 1.19 (0.16) 30- PFP 1.21 (0.17) vs Controls 1.21 (0.15) 45 - PFP 1.19 (0.14) vs Controls 1.24 (0.19) CKC 15- PFP 1.22 (0.15) vs Controls 1.18 (0.15) 30- PFP 1.21 (0.17) vs Controls 1.19 (0.18) 45- PFP 1.19 (0.16) vs Controls 1.25 (0.21)
N/A
Guzzanti et al 1994[410]
CT Supine 15°
•Congruence angle (CA) •Congruence angle with quadriceps contraction (CAc), •Patellar tilt angle (PTA) •Patellar tilt angle with quadriceps contraction (PTAc), •Sulcus angle (SA) ,•Trochlear depth (TD)
UTD CA Males PFP 20.0 (16) vs. Controls -11.6(8) Females PFP 13.8 (21) vs. Controls -13.5 (8) Total - PFP 15.4 (21) vs. Controls -12.5(8) PTA Males PFP 10.3 (7) vs. Controls 13.5 (5) Females PFP 3.2 (10) vs. Controls 15.6 (5) Total PFP 5.0 (10) vs. Controls 14.5 (5) CAc Males 26.0 (20) vs. Controls -10.7(8) Females 25.1 (23) vs. Controls -12.3 (8) Total 25.3 (22) vs. Controls -11.5(8) PTAc Males 9.9 (8) vs. Controls 13.4 (5) Females 2.5 (11) vs. Controls 14.5 (5) Total 4.4 (11) vs. Controls 13.9 (5) SA Males PFP 146(6) vs. Controls 124 (8) Females - PFP 148 (12) vs. Controls 130 (7) Total PFP 147 (10) vs. Controls 127 (8) TD Males PFP 7.3 (2) vs. Controls 12.9 (2) Females PFP 6.6 (3) vs. Controls 11.3 (2) Total PFP 6.8 (3) vs. Controls 12.1 (2)
N/A
Haim et al 2006[422]
XR
Supine 30°
• Insall-Salvati index • Sulcus angle
UTD
Patellar subluxation PFP15 (25%) vs. Controls 1 (4%); p= 0.032 N/A
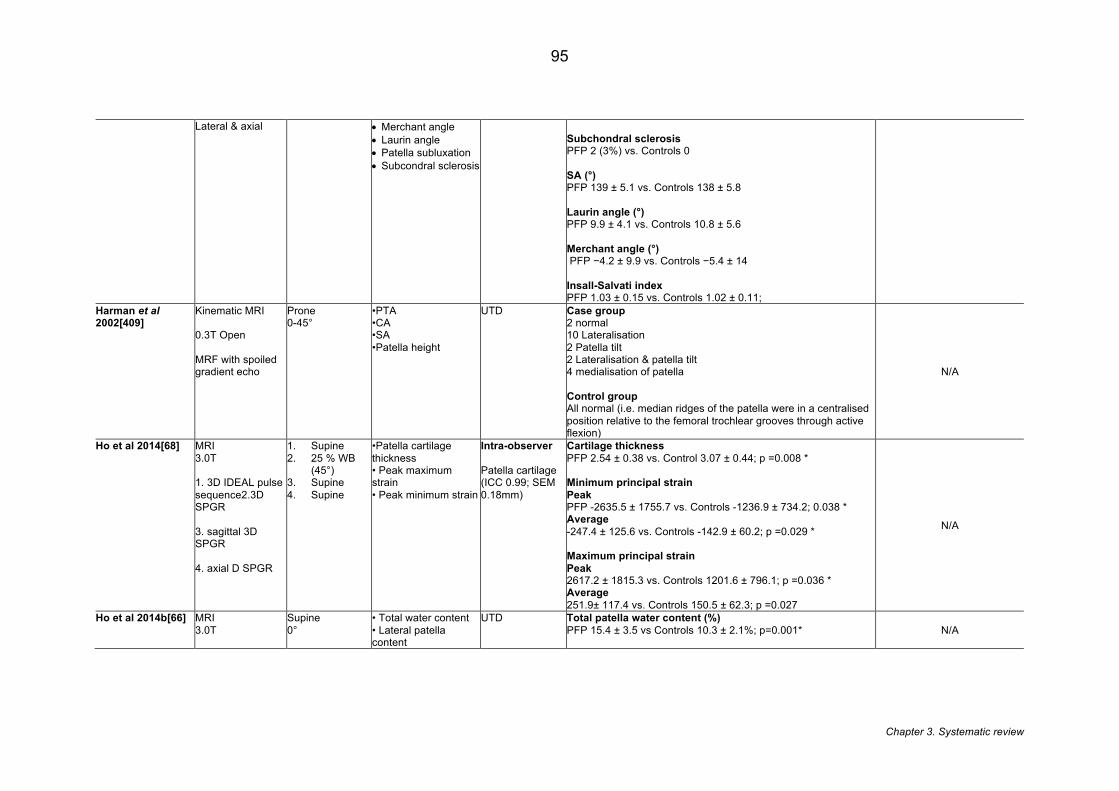
Chapter 3. Systematic review
95
Lateral & axial • Merchant angle • Laurin angle • Patella subluxation • Subcondral sclerosis
Subchondral sclerosis PFP 2 (3%) vs. Controls 0 SA (°) PFP 139 ± 5.1 vs. Controls 138 ± 5.8 Laurin angle (°) PFP 9.9 ± 4.1 vs. Controls 10.8 ± 5.6 Merchant angle (°) PFP −4.2 ± 9.9 vs. Controls −5.4 ± 14 Insall-Salvati index PFP 1.03 ± 0.15 vs. Controls 1.02 ± 0.11;
Harman et al 2002[409]
Kinematic MRI 0.3T Open MRF with spoiled gradient echo
Prone 0-45°
•PTA •CA •SA •Patella height
UTD Case group 2 normal 10 Lateralisation 2 Patella tilt 2 Lateralisation & patella tilt 4 medialisation of patella Control group All normal (i.e. median ridges of the patella were in a centralised position relative to the femoral trochlear grooves through active flexion)
N/A
Ho et al 2014[68] MRI 3.0T 1. 3D IDEAL pulse sequence2.3D SPGR 3. sagittal 3D SPGR 4. axial D SPGR
1. Supine 2. 25 % WB
(45°) 3. Supine 4. Supine
•Patella cartilage thickness • Peak maximum strain • Peak minimum strain
Intra-observer Patella cartilage (ICC 0.99; SEM 0.18mm)
Cartilage thickness PFP 2.54 ± 0.38 vs. Control 3.07 ± 0.44; p =0.008 * Minimum principal strain Peak PFP -2635.5 ± 1755.7 vs. Controls -1236.9 ± 734.2; 0.038 * Average -247.4 ± 125.6 vs. Controls -142.9 ± 60.2; p =0.029 * Maximum principal strain Peak 2617.2 ± 1815.3 vs. Controls 1201.6 ± 796.1; p =0.036 * Average 251.9± 117.4 vs. Controls 150.5 ± 62.3; p =0.027
N/A
Ho et al 2014b[66] MRI 3.0T
Supine 0°
• Total water content • Lateral patella content
UTD Total patella water content (%) PFP 15.4 ± 3.5 vs Controls 10.3 ± 2.1%; p=0.001*
N/A
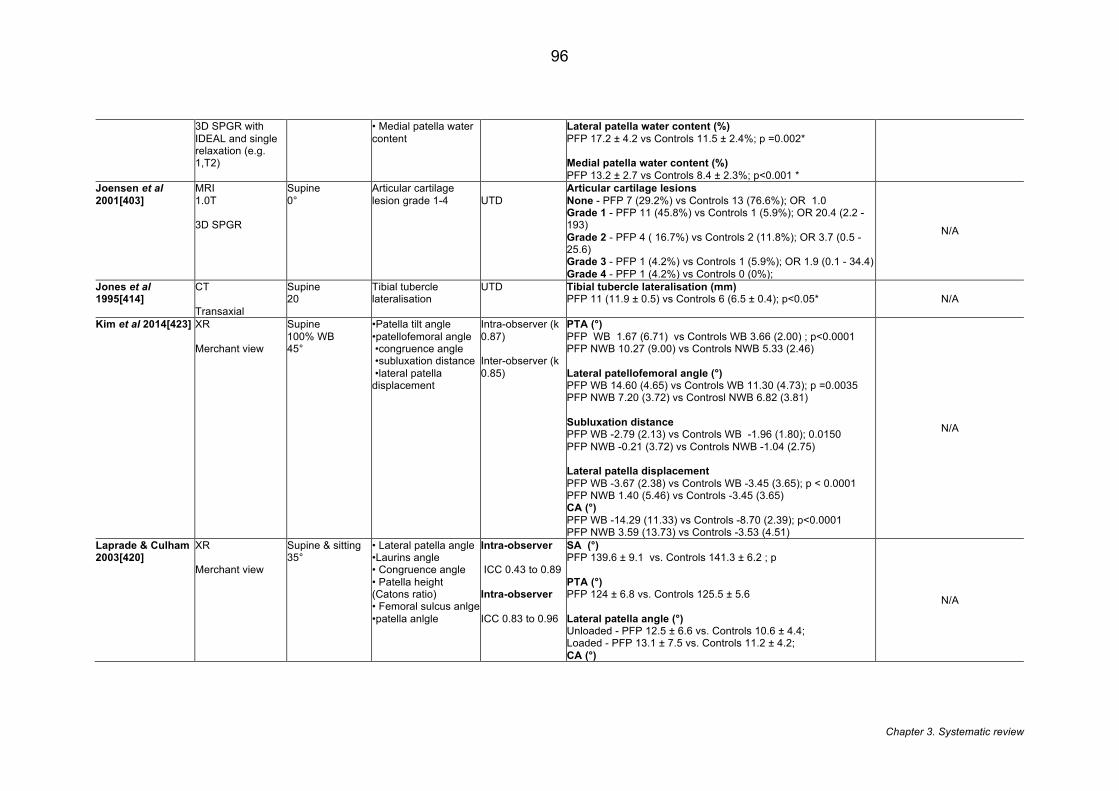
Chapter 3. Systematic review
96
3D SPGR with IDEAL and single relaxation (e.g. 1,T2)
• Medial patella water content
Lateral patella water content (%) PFP 17.2 ± 4.2 vs Controls 11.5 ± 2.4%; p =0.002* Medial patella water content (%) PFP 13.2 ± 2.7 vs Controls 8.4 ± 2.3%; p<0.001 *
Joensen et al 2001[403]
MRI 1.0T 3D SPGR
Supine 0°
Articular cartilage lesion grade 1-4
UTD
Articular cartilage lesions None - PFP 7 (29.2%) vs Controls 13 (76.6%); OR 1.0 Grade 1 - PFP 11 (45.8%) vs Controls 1 (5.9%); OR 20.4 (2.2 - 193) Grade 2 - PFP 4 ( 16.7%) vs Controls 2 (11.8%); OR 3.7 (0.5 - 25.6) Grade 3 - PFP 1 (4.2%) vs Controls 1 (5.9%); OR 1.9 (0.1 - 34.4) Grade 4 - PFP 1 (4.2%) vs Controls 0 (0%);
N/A
Jones et al 1995[414]
CT Transaxial
Supine 20
Tibial tubercle lateralisation
UTD Tibial tubercle lateralisation (mm) PFP 11 (11.9 ± 0.5) vs Controls 6 (6.5 ± 0.4); p<0.05* N/A
Kim et al 2014[423] XR Merchant view
Supine 100% WB 45°
•Patella tilt angle •patellofemoral angle •congruence angle •subluxation distance •lateral patella displacement
Intra-observer (k 0.87) Inter-observer (k 0.85)
PTA (°) PFP WB 1.67 (6.71) vs Controls WB 3.66 (2.00) ; p<0.0001 PFP NWB 10.27 (9.00) vs Controls NWB 5.33 (2.46) Lateral patellofemoral angle (°) PFP WB 14.60 (4.65) vs Controls WB 11.30 (4.73); p =0.0035 PFP NWB 7.20 (3.72) vs Controsl NWB 6.82 (3.81) Subluxation distance PFP WB -2.79 (2.13) vs Controls WB -1.96 (1.80); 0.0150 PFP NWB -0.21 (3.72) vs Controls NWB -1.04 (2.75) Lateral patella displacement PFP WB -3.67 (2.38) vs Controls WB -3.45 (3.65); p < 0.0001 PFP NWB 1.40 (5.46) vs Controls -3.45 (3.65) CA (°) PFP WB -14.29 (11.33) vs Controls -8.70 (2.39); p<0.0001 PFP NWB 3.59 (13.73) vs Controls -3.53 (4.51)
N/A
Laprade & Culham 2003[420]
XR Merchant view
Supine & sitting 35°
• Lateral patella angle •Laurins angle • Congruence angle • Patella height (Catons ratio) • Femoral sulcus anlge •patella anlgle
Intra-observer ICC 0.43 to 0.89 Intra-observer ICC 0.83 to 0.96
SA (°) PFP 139.6 ± 9.1 vs. Controls 141.3 ± 6.2 ; p PTA (°) PFP 124 ± 6.8 vs. Controls 125.5 ± 5.6 Lateral patella angle (°) Unloaded - PFP 12.5 ± 6.6 vs. Controls 10.6 ± 4.4; Loaded - PFP 13.1 ± 7.5 vs. Controls 11.2 ± 4.2; CA (°)
N/A
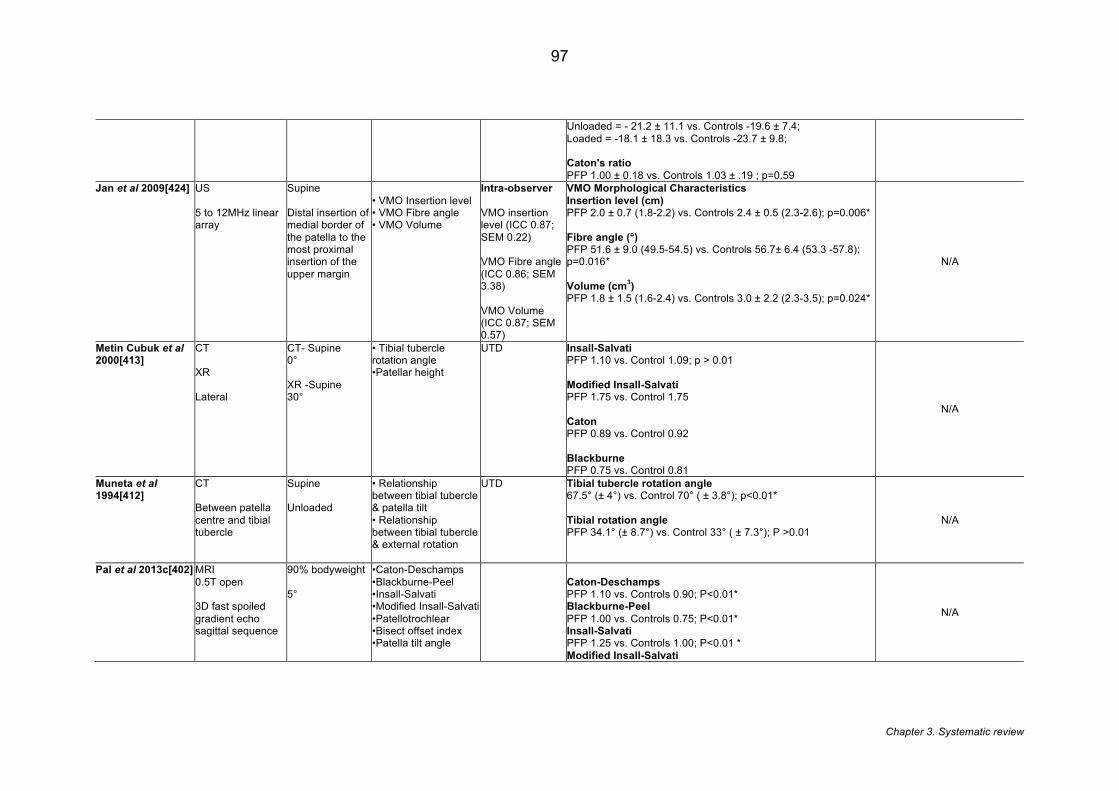
Chapter 3. Systematic review
97
Unloaded = - 21.2 ± 11.1 vs. Controls -19.6 ± 7.4; Loaded = -18.1 ± 18.3 vs. Controls -23.7 ± 9.8; Caton's ratio PFP 1.00 ± 0.18 vs. Controls 1.03 ± .19 ; p=0.59
Jan et al 2009[424] US 5 to 12MHz linear array
Supine Distal insertion of medial border of the patella to the most proximal insertion of the upper margin
• VMO Insertion level • VMO Fibre angle • VMO Volume
Intra-observer VMO insertion level (ICC 0.87; SEM 0.22) VMO Fibre angle (ICC 0.86; SEM 3.38) VMO Volume (ICC 0.87; SEM 0.57)
VMO Morphological Characteristics Insertion level (cm) PFP 2.0 ± 0.7 (1.8-2.2) vs. Controls 2.4 ± 0.5 (2.3-2.6); p=0.006* Fibre angle (°) PFP 51.6 ± 9.0 (49.5-54.5) vs. Controls 56.7± 6.4 (53.3 -57.8); p=0.016* Volume (cm3) PFP 1.8 ± 1.5 (1.6-2.4) vs. Controls 3.0 ± 2.2 (2.3-3.5); p=0.024*
N/A
Metin Cubuk et al 2000[413]
CT XR Lateral
CT- Supine 0° XR -Supine 30°
• Tibial tubercle rotation angle •Patellar height
UTD
Insall-Salvati PFP 1.10 vs. Control 1.09; p > 0.01 Modified Insall-Salvati PFP 1.75 vs. Control 1.75 Caton PFP 0.89 vs. Control 0.92 Blackburne PFP 0.75 vs. Control 0.81
N/A
Muneta et al 1994[412]
CT Between patella centre and tibial tubercle
Supine Unloaded
• Relationship between tibial tubercle & patella tilt • Relationship between tibial tubercle & external rotation
UTD Tibial tubercle rotation angle 67.5° (± 4°) vs. Control 70° ( ± 3.8°); p<0.01* Tibial rotation angle PFP 34.1° (± 8.7°) vs. Control 33° ( ± 7.3°); P >0.01
N/A
Pal et al 2013c[402] MRI 0.5T open 3D fast spoiled gradient echo sagittal sequence
90% bodyweight 5°
•Caton-Deschamps •Blackburne-Peel •Insall-Salvati •Modified Insall-Salvati •Patellotrochlear •Bisect offset index •Patella tilt angle
Caton-Deschamps PFP 1.10 vs. Controls 0.90; P<0.01* Blackburne-Peel PFP 1.00 vs. Controls 0.75; P<0.01* Insall-Salvati PFP 1.25 vs. Controls 1.00; P<0.01 * Modified Insall-Salvati
N/A
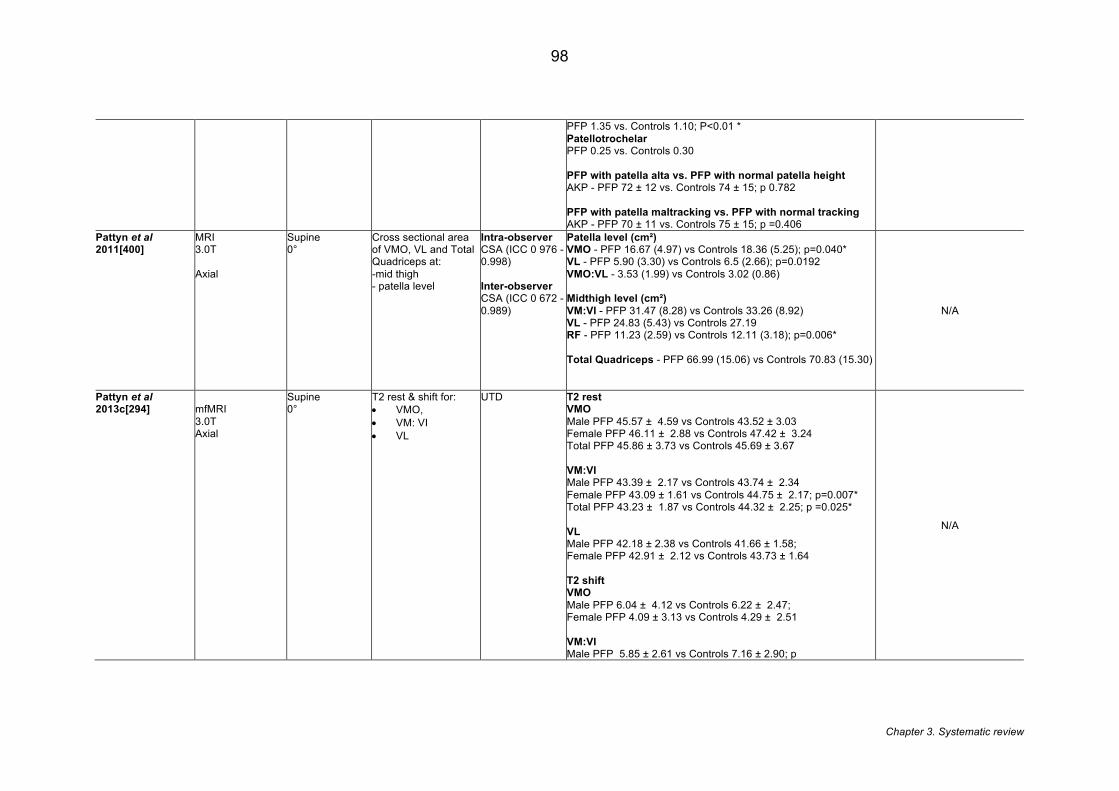
Chapter 3. Systematic review
98
PFP 1.35 vs. Controls 1.10; P<0.01 * Patellotrochelar PFP 0.25 vs. Controls 0.30 PFP with patella alta vs. PFP with normal patella height AKP - PFP 72 ± 12 vs. Controls 74 ± 15; p 0.782 PFP with patella maltracking vs. PFP with normal tracking AKP - PFP 70 ± 11 vs. Controls 75 ± 15; p =0.406
Pattyn et al 2011[400]
MRI 3.0T Axial
Supine 0°
Cross sectional area of VMO, VL and Total Quadriceps at: -mid thigh - patella level
Intra-observer CSA (ICC 0 976 -0.998) Inter-observer CSA (ICC 0 672 - 0.989)
Patella level (cm²) VMO - PFP 16.67 (4.97) vs Controls 18.36 (5.25); p=0.040* VL - PFP 5.90 (3.30) vs Controls 6.5 (2.66); p=0.0192 VMO:VL - 3.53 (1.99) vs Controls 3.02 (0.86) Midthigh level (cm²) VM:VI - PFP 31.47 (8.28) vs Controls 33.26 (8.92) VL - PFP 24.83 (5.43) vs Controls 27.19 RF - PFP 11.23 (2.59) vs Controls 12.11 (3.18); p=0.006* Total Quadriceps - PFP 66.99 (15.06) vs Controls 70.83 (15.30)
N/A
Pattyn et al 2013c[294]
mfMRI 3.0T Axial
Supine 0°
T2 rest & shift for: • VMO, • VM: VI • VL
UTD T2 rest VMO Male PFP 45.57 ± 4.59 vs Controls 43.52 ± 3.03 Female PFP 46.11 ± 2.88 vs Controls 47.42 ± 3.24 Total PFP 45.86 ± 3.73 vs Controls 45.69 ± 3.67 VM:VI Male PFP 43.39 ± 2.17 vs Controls 43.74 ± 2.34 Female PFP 43.09 ± 1.61 vs Controls 44.75 ± 2.17; p=0.007* Total PFP 43.23 ± 1.87 vs Controls 44.32 ± 2.25; p =0.025* VL Male PFP 42.18 ± 2.38 vs Controls 41.66 ± 1.58; Female PFP 42.91 ± 2.12 vs Controls 43.73 ± 1.64 T2 shift VMO Male PFP 6.04 ± 4.12 vs Controls 6.22 ± 2.47; Female PFP 4.09 ± 3.13 vs Controls 4.29 ± 2.51 VM:VI Male PFP 5.85 ± 2.61 vs Controls 7.16 ± 2.90; p
N/A
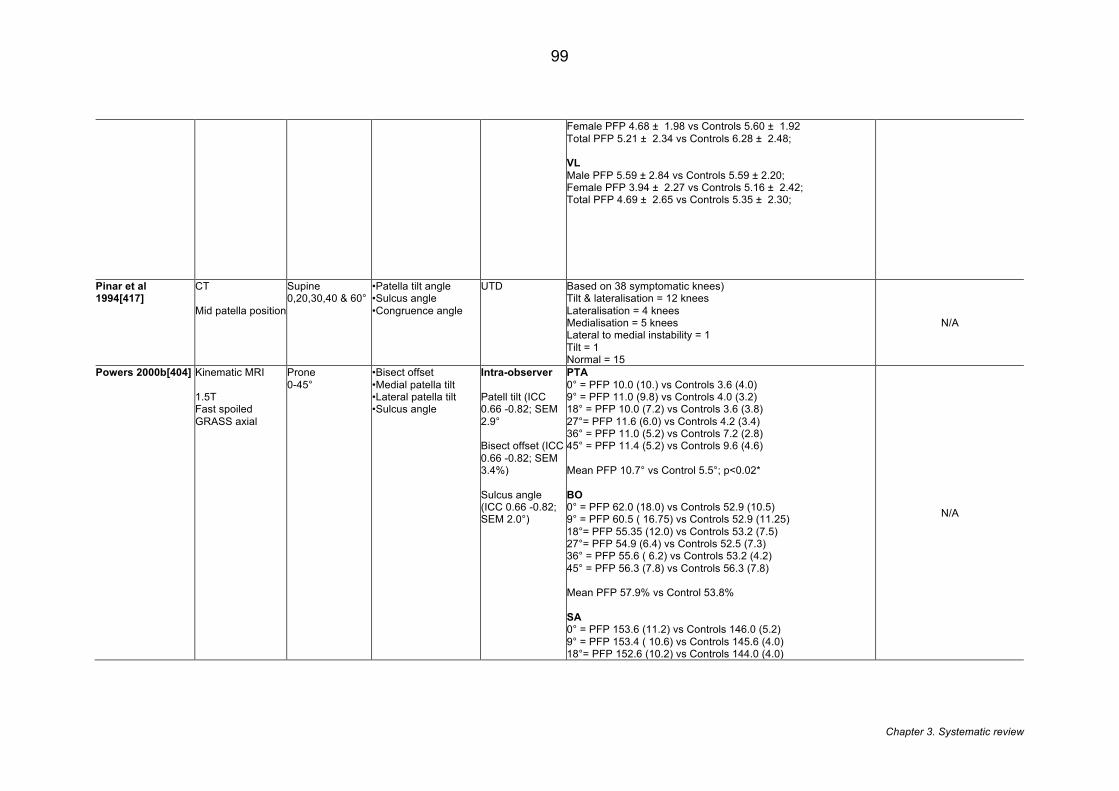
Chapter 3. Systematic review
99
Female PFP 4.68 ± 1.98 vs Controls 5.60 ± 1.92 Total PFP 5.21 ± 2.34 vs Controls 6.28 ± 2.48; VL Male PFP 5.59 ± 2.84 vs Controls 5.59 ± 2.20; Female PFP 3.94 ± 2.27 vs Controls 5.16 ± 2.42; Total PFP 4.69 ± 2.65 vs Controls 5.35 ± 2.30;
Pinar et al 1994[417]
CT Mid patella position
Supine 0,20,30,40 & 60°
•Patella tilt angle •Sulcus angle •Congruence angle
UTD Based on 38 symptomatic knees) Tilt & lateralisation = 12 knees Lateralisation = 4 knees Medialisation = 5 knees Lateral to medial instability = 1 Tilt = 1 Normal = 15
N/A
Powers 2000b[404] Kinematic MRI 1.5T Fast spoiled GRASS axial
Prone 0-45°
•Bisect offset •Medial patella tilt •Lateral patella tilt •Sulcus angle
Intra-observer Patell tilt (ICC 0.66 -0.82; SEM 2.9° Bisect offset (ICC 0.66 -0.82; SEM 3.4%) Sulcus angle (ICC 0.66 -0.82; SEM 2.0°)
PTA 0° = PFP 10.0 (10.) vs Controls 3.6 (4.0) 9° = PFP 11.0 (9.8) vs Controls 4.0 (3.2) 18° = PFP 10.0 (7.2) vs Controls 3.6 (3.8) 27°= PFP 11.6 (6.0) vs Controls 4.2 (3.4) 36° = PFP 11.0 (5.2) vs Controls 7.2 (2.8) 45° = PFP 11.4 (5.2) vs Controls 9.6 (4.6) Mean PFP 10.7° vs Control 5.5°; p<0.02* BO 0° = PFP 62.0 (18.0) vs Controls 52.9 (10.5) 9° = PFP 60.5 ( 16.75) vs Controls 52.9 (11.25) 18°= PFP 55.35 (12.0) vs Controls 53.2 (7.5) 27°= PFP 54.9 (6.4) vs Controls 52.5 (7.3) 36° = PFP 55.6 ( 6.2) vs Controls 53.2 (4.2) 45° = PFP 56.3 (7.8) vs Controls 56.3 (7.8) Mean PFP 57.9% vs Control 53.8% SA 0° = PFP 153.6 (11.2) vs Controls 146.0 (5.2) 9° = PFP 153.4 ( 10.6) vs Controls 145.6 (4.0) 18°= PFP 152.6 (10.2) vs Controls 144.0 (4.0)
N/A
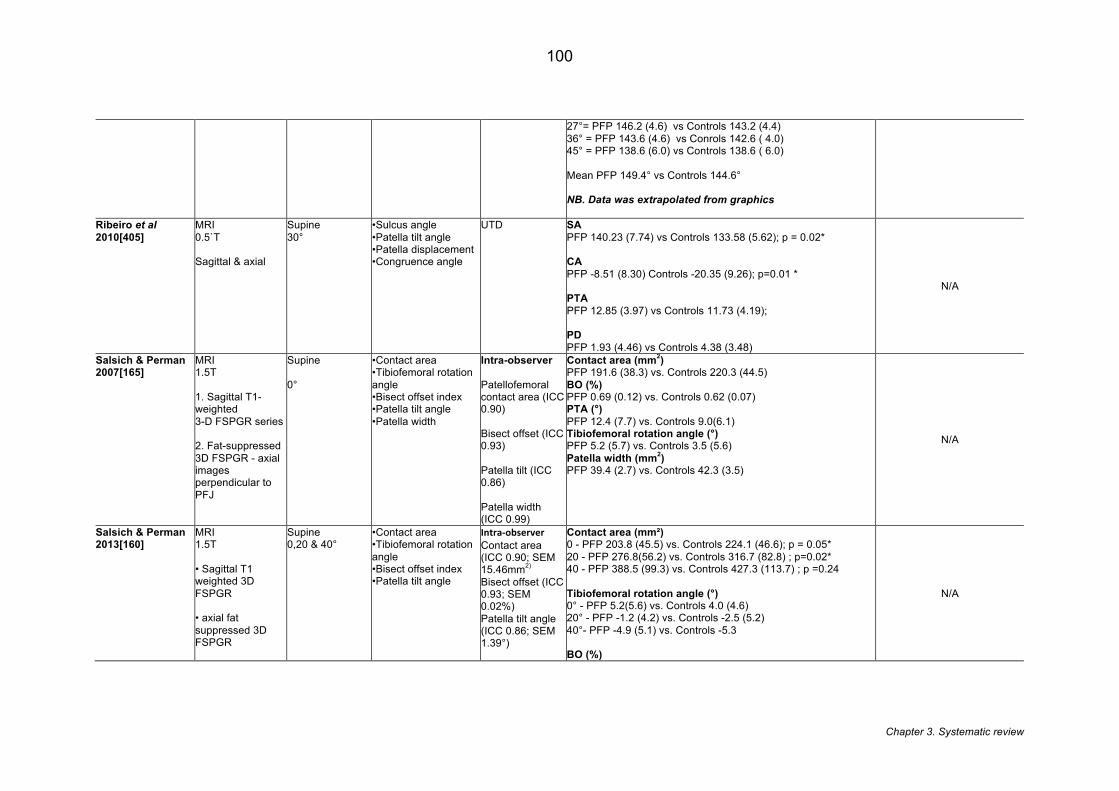
Chapter 3. Systematic review
100
27°= PFP 146.2 (4.6) vs Controls 143.2 (4.4) 36° = PFP 143.6 (4.6) vs Conrols 142.6 ( 4.0) 45° = PFP 138.6 (6.0) vs Controls 138.6 ( 6.0) Mean PFP 149.4° vs Controls 144.6° NB. Data was extrapolated from graphics
Ribeiro et al 2010[405]
MRI 0.5`T Sagittal & axial
Supine 30°
•Sulcus angle •Patella tilt angle •Patella displacement •Congruence angle
UTD SA PFP 140.23 (7.74) vs Controls 133.58 (5.62); p = 0.02* CA PFP -8.51 (8.30) Controls -20.35 (9.26); p=0.01 * PTA PFP 12.85 (3.97) vs Controls 11.73 (4.19); PD PFP 1.93 (4.46) vs Controls 4.38 (3.48)
N/A
Salsich & Perman 2007[165]
MRI 1.5T 1. Sagittal T1-weighted 3-D FSPGR series 2. Fat-suppressed 3D FSPGR - axial images perpendicular to PFJ
Supine 0°
•Contact area •Tibiofemoral rotation angle •Bisect offset index •Patella tilt angle •Patella width
Intra-observer Patellofemoral contact area (ICC 0.90) Bisect offset (ICC 0.93) Patella tilt (ICC 0.86) Patella width (ICC 0.99)
Contact area (mm2) PFP 191.6 (38.3) vs. Controls 220.3 (44.5) BO (%) PFP 0.69 (0.12) vs. Controls 0.62 (0.07) PTA (°) PFP 12.4 (7.7) vs. Controls 9.0(6.1) Tibiofemoral rotation angle (°) PFP 5.2 (5.7) vs. Controls 3.5 (5.6) Patella width (mm2) PFP 39.4 (2.7) vs. Controls 42.3 (3.5)
N/A
Salsich & Perman 2013[160]
MRI 1.5T • Sagittal T1 weighted 3D FSPGR • axial fat suppressed 3D FSPGR
Supine 0,20 & 40°
•Contact area •Tibiofemoral rotation angle •Bisect offset index •Patella tilt angle
Intra-observerContact area (ICC 0.90; SEM 15.46mm2) Bisect offset (ICC 0.93; SEM 0.02%) Patella tilt angle (ICC 0.86; SEM 1.39°)
Contact area (mm²) 0 - PFP 203.8 (45.5) vs. Controls 224.1 (46.6); p = 0.05* 20 - PFP 276.8(56.2) vs. Controls 316.7 (82.8) ; p=0.02* 40 - PFP 388.5 (99.3) vs. Controls 427.3 (113.7) ; p =0.24 Tibiofemoral rotation angle (°) 0° - PFP 5.2(5.6) vs. Controls 4.0 (4.6) 20° - PFP -1.2 (4.2) vs. Controls -2.5 (5.2) 40°- PFP -4.9 (5.1) vs. Controls -5.3 BO (%)
N/A
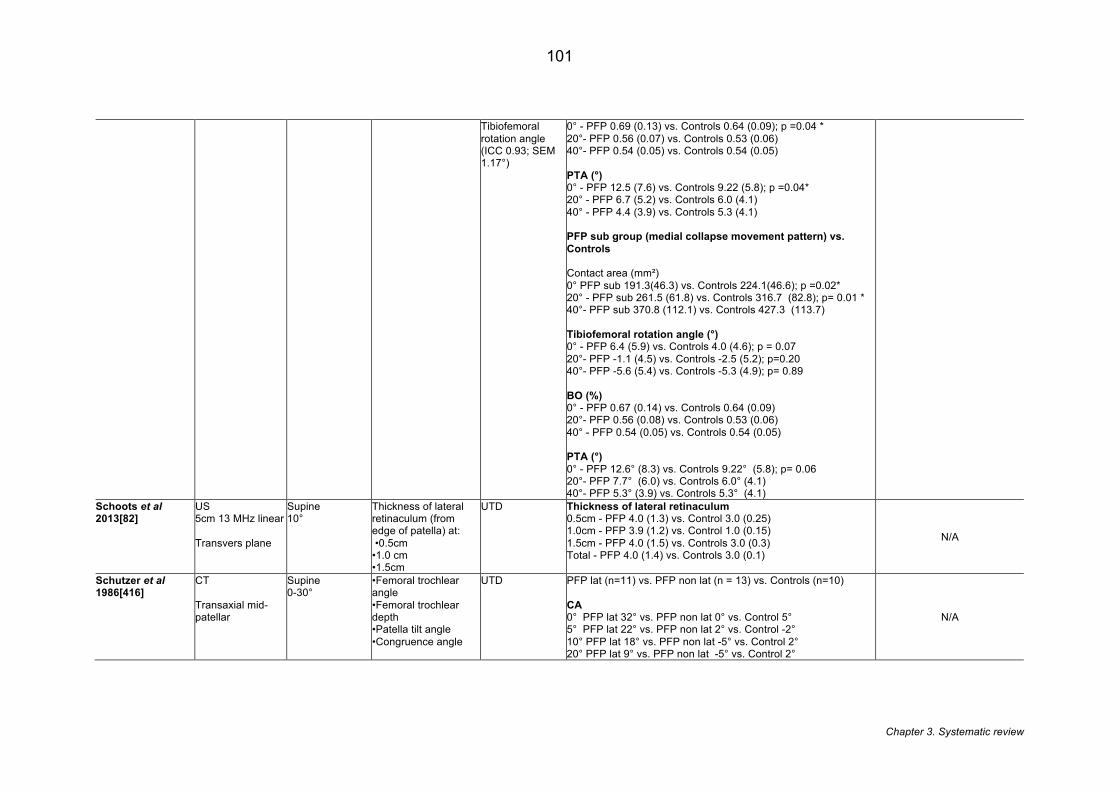
Chapter 3. Systematic review
101
Tibiofemoral rotation angle (ICC 0.93; SEM 1.17°)
0° - PFP 0.69 (0.13) vs. Controls 0.64 (0.09); p =0.04 * 20°- PFP 0.56 (0.07) vs. Controls 0.53 (0.06) 40°- PFP 0.54 (0.05) vs. Controls 0.54 (0.05) PTA (°) 0° - PFP 12.5 (7.6) vs. Controls 9.22 (5.8); p =0.04* 20° - PFP 6.7 (5.2) vs. Controls 6.0 (4.1) 40° - PFP 4.4 (3.9) vs. Controls 5.3 (4.1) PFP sub group (medial collapse movement pattern) vs. Controls Contact area (mm²) 0° PFP sub 191.3(46.3) vs. Controls 224.1(46.6); p =0.02* 20° - PFP sub 261.5 (61.8) vs. Controls 316.7 (82.8); p= 0.01 * 40°- PFP sub 370.8 (112.1) vs. Controls 427.3 (113.7) Tibiofemoral rotation angle (°) 0° - PFP 6.4 (5.9) vs. Controls 4.0 (4.6); p = 0.07 20°- PFP -1.1 (4.5) vs. Controls -2.5 (5.2); p=0.20 40°- PFP -5.6 (5.4) vs. Controls -5.3 (4.9); p= 0.89 BO (%) 0° - PFP 0.67 (0.14) vs. Controls 0.64 (0.09) 20°- PFP 0.56 (0.08) vs. Controls 0.53 (0.06) 40° - PFP 0.54 (0.05) vs. Controls 0.54 (0.05) PTA (°) 0° - PFP 12.6° (8.3) vs. Controls 9.22° (5.8); p= 0.06 20°- PFP 7.7° (6.0) vs. Controls 6.0° (4.1) 40°- PFP 5.3° (3.9) vs. Controls 5.3° (4.1)
Schoots et al 2013[82]
US 5cm 13 MHz linear Transvers plane
Supine 10°
Thickness of lateral retinaculum (from edge of patella) at: •0.5cm •1.0 cm •1.5cm
UTD Thickness of lateral retinaculum 0.5cm - PFP 4.0 (1.3) vs. Control 3.0 (0.25) 1.0cm - PFP 3.9 (1.2) vs. Control 1.0 (0.15) 1.5cm - PFP 4.0 (1.5) vs. Controls 3.0 (0.3) Total - PFP 4.0 (1.4) vs. Controls 3.0 (0.1)
N/A
Schutzer et al 1986[416]
CT Transaxial mid-patellar
Supine 0-30°
•Femoral trochlear angle •Femoral trochlear depth •Patella tilt angle •Congruence angle
UTD PFP lat (n=11) vs. PFP non lat (n = 13) vs. Controls (n=10) CA 0° PFP lat 32° vs. PFP non lat 0° vs. Control 5° 5° PFP lat 22° vs. PFP non lat 2° vs. Control -2° 10° PFP lat 18° vs. PFP non lat -5° vs. Control 2° 20° PFP lat 9° vs. PFP non lat -5° vs. Control 2°
N/A
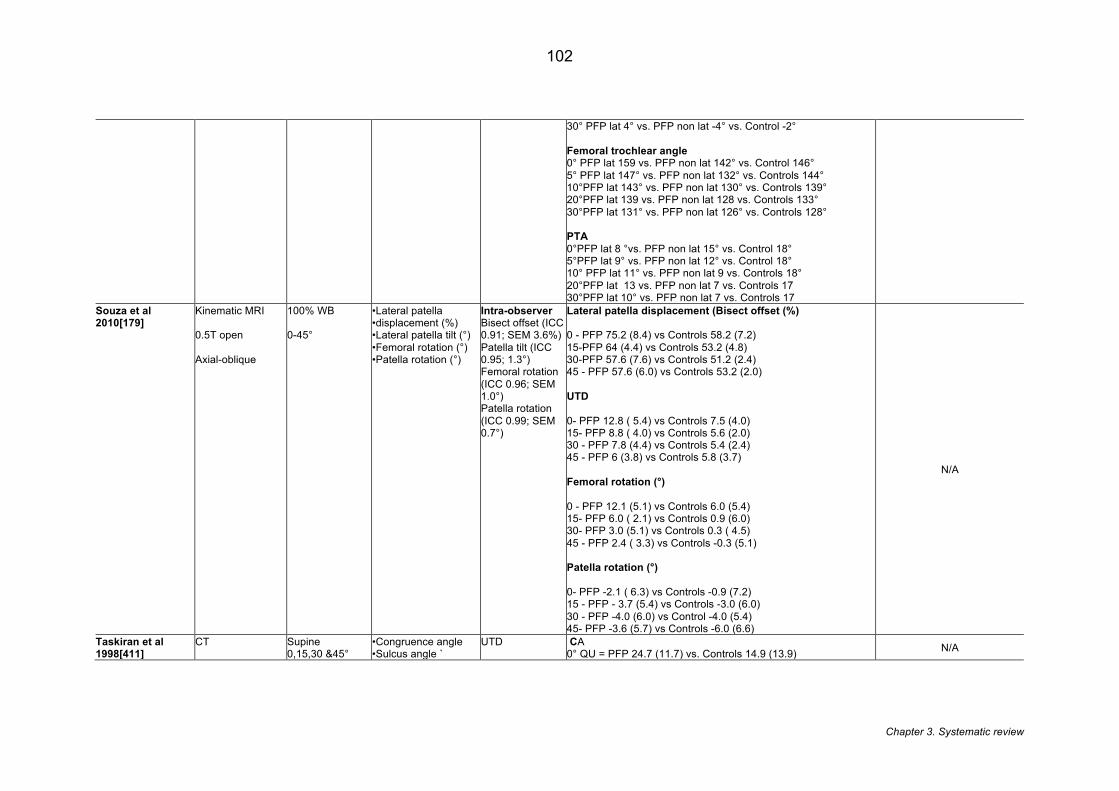
Chapter 3. Systematic review
102
30° PFP lat 4° vs. PFP non lat -4° vs. Control -2° Femoral trochlear angle 0° PFP lat 159 vs. PFP non lat 142° vs. Control 146° 5° PFP lat 147° vs. PFP non lat 132° vs. Controls 144° 10°PFP lat 143° vs. PFP non lat 130° vs. Controls 139° 20°PFP lat 139 vs. PFP non lat 128 vs. Controls 133° 30°PFP lat 131° vs. PFP non lat 126° vs. Controls 128° PTA 0°PFP lat 8 °vs. PFP non lat 15° vs. Control 18° 5°PFP lat 9° vs. PFP non lat 12° vs. Control 18° 10° PFP lat 11° vs. PFP non lat 9 vs. Controls 18° 20°PFP lat 13 vs. PFP non lat 7 vs. Controls 17 30°PFP lat 10° vs. PFP non lat 7 vs. Controls 17
Souza et al 2010[179]
Kinematic MRI 0.5T open Axial-oblique
100% WB 0-45°
•Lateral patella •displacement (%) •Lateral patella tilt (°) •Femoral rotation (°) •Patella rotation (°)
Intra-observer Bisect offset (ICC 0.91; SEM 3.6%) Patella tilt (ICC 0.95; 1.3°) Femoral rotation (ICC 0.96; SEM 1.0°) Patella rotation (ICC 0.99; SEM 0.7°)
Lateral patella displacement (Bisect offset (%) 0 - PFP 75.2 (8.4) vs Controls 58.2 (7.2) 15-PFP 64 (4.4) vs Controls 53.2 (4.8) 30-PFP 57.6 (7.6) vs Controls 51.2 (2.4) 45 - PFP 57.6 (6.0) vs Controls 53.2 (2.0) UTD 0- PFP 12.8 ( 5.4) vs Controls 7.5 (4.0) 15- PFP 8.8 ( 4.0) vs Controls 5.6 (2.0) 30 - PFP 7.8 (4.4) vs Controls 5.4 (2.4) 45 - PFP 6 (3.8) vs Controls 5.8 (3.7) Femoral rotation (°) 0 - PFP 12.1 (5.1) vs Controls 6.0 (5.4) 15- PFP 6.0 ( 2.1) vs Controls 0.9 (6.0) 30- PFP 3.0 (5.1) vs Controls 0.3 ( 4.5) 45 - PFP 2.4 ( 3.3) vs Controls -0.3 (5.1) Patella rotation (°) 0- PFP -2.1 ( 6.3) vs Controls -0.9 (7.2) 15 - PFP - 3.7 (5.4) vs Controls -3.0 (6.0) 30 - PFP -4.0 (6.0) vs Control -4.0 (5.4) 45- PFP -3.6 (5.7) vs Controls -6.0 (6.6)
N/A
Taskiran et al 1998[411]
CT
Supine 0,15,30 &45°
•Congruence angle •Sulcus angle `
UTD
CA 0° QU = PFP 24.7 (11.7) vs. Controls 14.9 (13.9) N/A

Chapter 3. Systematic review
103
Mid-patellar axial •Patella tilt angle
0° QC = PFP 37.2 (9.1) vs. `Controls 25.3 (17) 15° QU = PFP 23.8 (10) vs. Controls 8.1 (13.2) 15° QC = PFP 28.2 (12.9) vs. Controls 18 (15.9) 30° QU = PFP 8.9 (7.8) vs. Controls 1.0 (10.8) 30° QC = PFP 7.7 (9.6) vs. Controls 0.5 (11.7) 45° QU = PFP -6.2 (9.9) vs. Controls -5.8 (9.4) 45° QC = -10.3 (5.4) vs. Controls -8.9 (5.8) PTA 0° QU = 11.7 (5.1) vs. Controls 13.3 (5.3) 0° QC = 13.7 ( 6.3) vs. Controls 10.9 (5.1) 15° QU = 10.7 (4.7) vs. Controls 9.9 (4.1) 15° QC = 12.3 (7.2) vs. Controls 9.2 ( 4.1) 30° QU = 7.0 (3.9) vs. Controls 9.0 (5.7) 30° QC = 6.0 (4.3) vs. Controls 6.8 (3.9) 45° QU = 7.2 (4.4) vs. Controls 9.1 ( 5.2) 45° QC = 5.9 ( 3.6) vs. Controls 7.2 (3.4) QC - quadriceps contracted; QU = quadriceps uncontracted) Sulcus angle - not reported
Teng et al 2014[406]
MRI 1.5T FSPGR-axial
Supine 25%WB 0,20,40,60°
•Bisect offset •Patella tilt angle •Sulcus Angle •Lateral trochlear inclination •Insall-Salvati Ratio
Intra-observer Bisect offset (ICC 0.95-0.99) Patella tilt angle (ICC 0.95-0.99) Sulcus Angle (ICC 0.95-0.99) Lateral trochlear inclination (ICC 0.95-0.99) Insall-Salvati Ratio (ICC 0.95-0.99)
BO (%) 0 - PFP 71.7 (12) vs Controls 62.7 (10.9) 20- PFP 62.1 (11.3) vs Controls 55.9 (6.4) 40- PFP 60.9 (11.2) vs Controls 52.8 (6.9) 60- PFP 58.9 (10.0) vs Controls 55.3(4.8) PTA (°) 0- PFP 15.5 (7.0) vs Controls 12.9 (6.2) 20- PFP 15.1 (7.8) vs Controls 11.6 (5.0) 40- PFP 12.1 (7.1) vs Controls 8.9 (4.5) 60- PFP 8.5 (6.1) vs Controls 8.5 (4.1) SA (°) 0- PFP 168.5 (13.5) vs Controls 166.4 (13.7) 20- PFP 149.0 (6.5) vs Controls 149.8 (7.1) 40- PFP 138.4 (8.8) vs Controls 136.4 (8.8) 60-PFP 132.4 (7.1) vs Controls 129.9 (6.2) LTI 0 - PFP 14.9 (5.4) vs Controls 17.9 (8.3) 20- PFP 19.5 ( 6.2) vs Controls 22.9 (3.4) 40- PFP 22.6 (5.4) vs Controls 25.2 (4.7) 60-PFP 22.9 (3.7) vs Controls 24.1 (4.8)
N/A
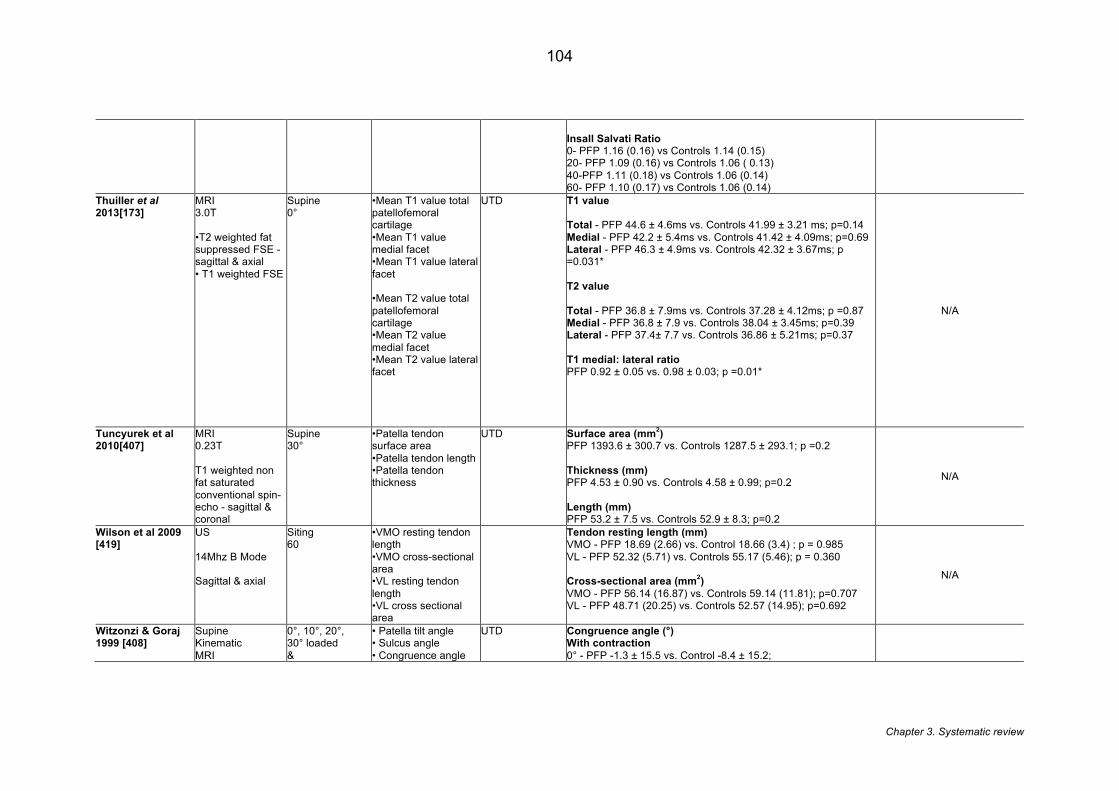
Chapter 3. Systematic review
104
Insall Salvati Ratio 0- PFP 1.16 (0.16) vs Controls 1.14 (0.15) 20- PFP 1.09 (0.16) vs Controls 1.06 ( 0.13) 40-PFP 1.11 (0.18) vs Controls 1.06 (0.14) 60- PFP 1.10 (0.17) vs Controls 1.06 (0.14)
Thuiller et al 2013[173]
MRI 3.0T •T2 weighted fat suppressed FSE - sagittal & axial • T1 weighted FSE
Supine 0°
•Mean T1 value total patellofemoral cartilage •Mean T1 value medial facet •Mean T1 value lateral facet •Mean T2 value total patellofemoral cartilage •Mean T2 value medial facet •Mean T2 value lateral facet
UTD T1 value Total - PFP 44.6 ± 4.6ms vs. Controls 41.99 ± 3.21 ms; p=0.14 Medial - PFP 42.2 ± 5.4ms vs. Controls 41.42 ± 4.09ms; p=0.69 Lateral - PFP 46.3 ± 4.9ms vs. Controls 42.32 ± 3.67ms; p =0.031* T2 value Total - PFP 36.8 ± 7.9ms vs. Controls 37.28 ± 4.12ms; p =0.87 Medial - PFP 36.8 ± 7.9 vs. Controls 38.04 ± 3.45ms; p=0.39 Lateral - PFP 37.4± 7.7 vs. Controls 36.86 ± 5.21ms; p=0.37 T1 medial: lateral ratio PFP 0.92 ± 0.05 vs. 0.98 ± 0.03; p =0.01*
N/A
Tuncyurek et al 2010[407]
MRI 0.23T T1 weighted non fat saturated conventional spin-echo - sagittal & coronal
Supine 30°
•Patella tendon surface area •Patella tendon length •Patella tendon thickness
UTD Surface area (mm2) PFP 1393.6 ± 300.7 vs. Controls 1287.5 ± 293.1; p =0.2 Thickness (mm) PFP 4.53 ± 0.90 vs. Controls 4.58 ± 0.99; p=0.2 Length (mm) PFP 53.2 ± 7.5 vs. Controls 52.9 ± 8.3; p=0.2
N/A
Wilson et al 2009 [419]
US 14Mhz B Mode Sagittal & axial
Siting 60
•VMO resting tendon length •VMO cross-sectional area •VL resting tendon length •VL cross sectional area
Tendon resting length (mm) VMO - PFP 18.69 (2.66) vs. Control 18.66 (3.4) ; p = 0.985 VL - PFP 52.32 (5.71) vs. Controls 55.17 (5.46); p = 0.360 Cross-sectional area (mm2) VMO - PFP 56.14 (16.87) vs. Controls 59.14 (11.81); p=0.707 VL - PFP 48.71 (20.25) vs. Controls 52.57 (14.95); p=0.692
N/A
Witzonzi & Goraj 1999 [408]
Supine Kinematic MRI
0°, 10°, 20°, 30° loaded &
• Patella tilt angle • Sulcus angle • Congruence angle
UTD Congruence angle (°) With contraction 0° - PFP -1.3 ± 15.5 vs. Control -8.4 ± 15.2;
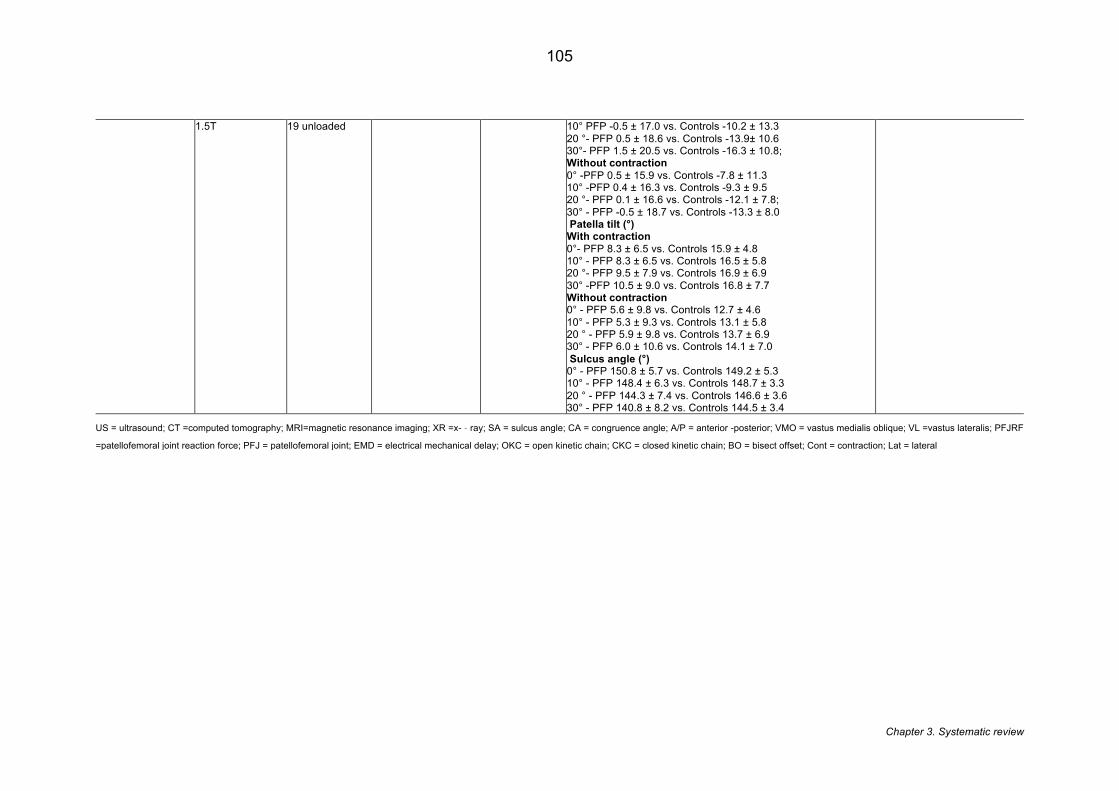
Chapter 3. Systematic review
105
1.5T
19 unloaded
10° PFP -0.5 ± 17.0 vs. Controls -10.2 ± 13.3 20 °- PFP 0.5 ± 18.6 vs. Controls -13.9± 10.6 30°- PFP 1.5 ± 20.5 vs. Controls -16.3 ± 10.8; Without contraction 0° -PFP 0.5 ± 15.9 vs. Controls -7.8 ± 11.3 10° -PFP 0.4 ± 16.3 vs. Controls -9.3 ± 9.5 20 °- PFP 0.1 ± 16.6 vs. Controls -12.1 ± 7.8; 30° - PFP -0.5 ± 18.7 vs. Controls -13.3 ± 8.0 Patella tilt (°) With contraction 0°- PFP 8.3 ± 6.5 vs. Controls 15.9 ± 4.8 10° - PFP 8.3 ± 6.5 vs. Controls 16.5 ± 5.8 20 °- PFP 9.5 ± 7.9 vs. Controls 16.9 ± 6.9 30° -PFP 10.5 ± 9.0 vs. Controls 16.8 ± 7.7 Without contraction 0° - PFP 5.6 ± 9.8 vs. Controls 12.7 ± 4.6 10° - PFP 5.3 ± 9.3 vs. Controls 13.1 ± 5.8 20 ° - PFP 5.9 ± 9.8 vs. Controls 13.7 ± 6.9 30° - PFP 6.0 ± 10.6 vs. Controls 14.1 ± 7.0 Sulcus angle (°) 0° - PFP 150.8 ± 5.7 vs. Controls 149.2 ± 5.3 10° - PFP 148.4 ± 6.3 vs. Controls 148.7 ± 3.3 20 ° - PFP 144.3 ± 7.4 vs. Controls 146.6 ± 3.6 30° - PFP 140.8 ± 8.2 vs. Controls 144.5 ± 3.4
US = ultrasound; CT =computed tomography; MRI=magnetic resonance imaging; XR =x-�ray; SA = sulcus angle; CA = congruence angle; A/P = anterior -posterior; VMO = vastus medialis oblique; VL =vastus lateralis; PFJRF
=patellofemoral joint reaction force; PFJ = patellofemoral joint; EMD = electrical mechanical delay; OKC = open kinetic chain; CKC = closed kinetic chain; BO = bisect offset; Cont = contraction; Lat = lateral
Chapter 3. Systematic review
106
3.4.3 Quality assessment
The results of the quality assessment are presented in Table 3.6. Based on the
categorisations used [392], 23 studies were judged as high quality [65, 66, 68, 82,
148, 160, 165, 166, 168-170, 173, 179, 228, 256, 294, 359, 397-400, 402-404, 418,
420, 422, 423], with the remaining 17 studies considered of moderate quality [159,
163, 216, 405-417, 419, 421]. The criteria of best performance using the modified
Downs & Black checklist were 1,2,3 and 4, which were satisfied by all the included
studies. The criteria that the included studies performed most poorly were 9, 10, 11,
15 and 17 (Table 3.2). Criteria 9, 10 and 15 pertained to the documentation of
population in which participants are recruited. Only half the studies clearly
documented from where their participants were recruited e.g. hospital, military etc.
Criterion 11 posed: was an attempt made to blind those measuring the outcome.
Only 17.5% (7/40) of the studies we were able to determine whether the person/s
interpreting the images were blinded to group allocation. Criterion 17 posed: did the
study have sufficient power to detect clinically important effect. Only 17.5% (7/40) of
studies [160, 173, 228, 256, 359, 402, 420] clearly documented how they calculated
their sample size.
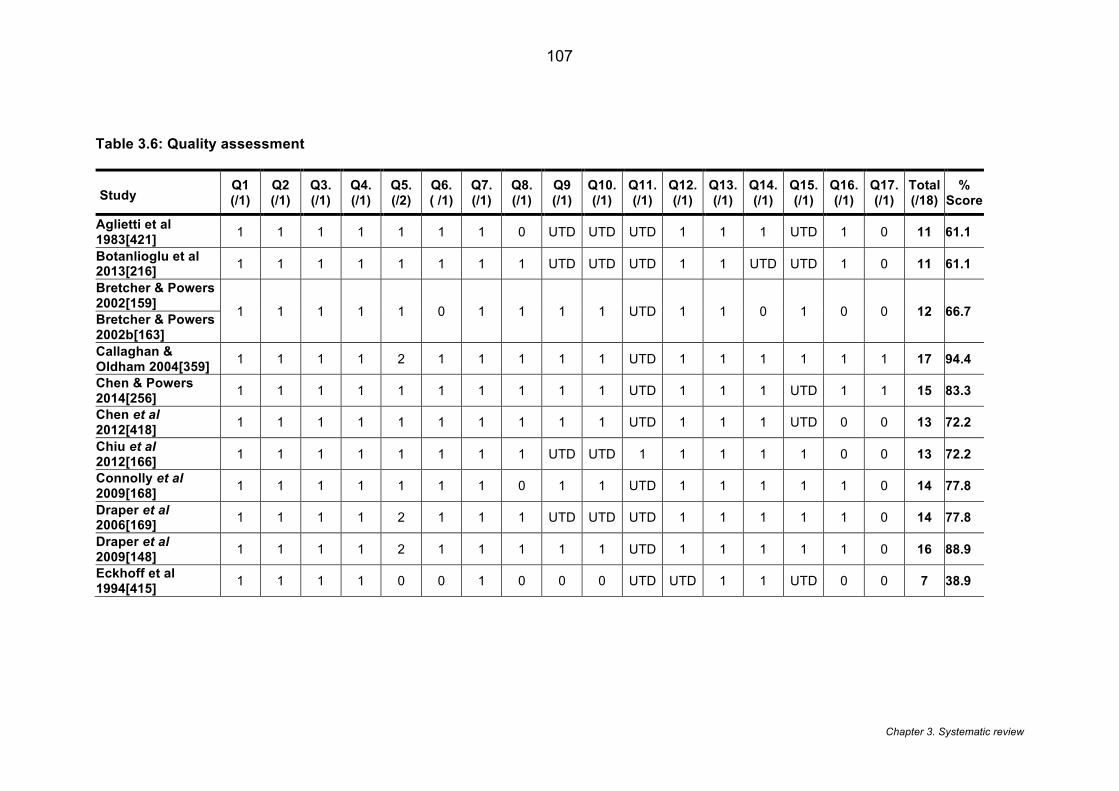
Chapter 3. Systematic review
107
Table 3.6: Quality assessment
Study
Q1 (/1)
Q2 (/1)
Q3. (/1)
Q4. (/1)
Q5. (/2)
Q6. ( /1)
Q7. (/1)
Q8. (/1)
Q9 (/1)
Q10. (/1)
Q11. (/1)
Q12. (/1)
Q13. (/1)
Q14. (/1)
Q15. (/1)
Q16. (/1)
Q17. (/1)
Total (/18)
% Score
Aglietti et al 1983[421] 1 1 1 1 1 1 1 0 UTD UTD UTD 1 1 1 UTD 1 0 11 61.1
Botanlioglu et al 2013[216] 1 1 1 1 1 1 1 1 UTD UTD UTD 1 1 UTD UTD 1 0 11 61.1
Bretcher & Powers 2002[159]
1 1 1 1 1 0 1 1 1 1 UTD 1 1 0 1 0 0 12 66.7 Bretcher & Powers 2002b[163] Callaghan & Oldham 2004[359] 1 1 1 1 2 1 1 1 1 1 UTD 1 1 1 1 1 1 17 94.4
Chen & Powers 2014[256] 1 1 1 1 1 1 1 1 1 1 UTD 1 1 1 UTD 1 1 15 83.3
Chen et al 2012[418] 1 1 1 1 1 1 1 1 1 1 UTD 1 1 1 UTD 0 0 13 72.2
Chiu et al 2012[166] 1 1 1 1 1 1 1 1 UTD UTD 1 1 1 1 1 0 0 13 72.2
Connolly et al 2009[168] 1 1 1 1 1 1 1 0 1 1 UTD 1 1 1 1 1 0 14 77.8
Draper et al 2006[169] 1 1 1 1 2 1 1 1 UTD UTD UTD 1 1 1 1 1 0 14 77.8
Draper et al 2009[148] 1 1 1 1 2 1 1 1 1 1 UTD 1 1 1 1 1 0 16 88.9
Eckhoff et al 1994[415] 1 1 1 1 0 0 1 0 0 0 UTD UTD 1 1 UTD 0 0 7 38.9
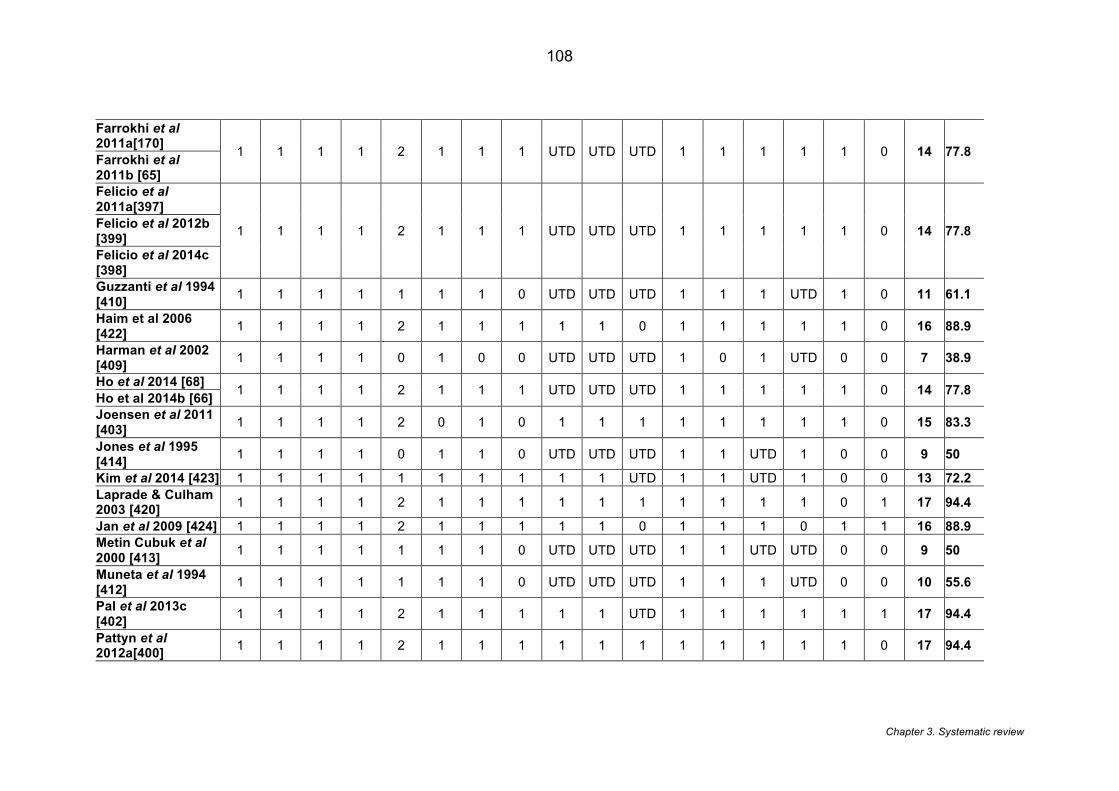
Chapter 3. Systematic review
108
Farrokhi et al 2011a[170]
1 1 1 1 2 1 1 1 UTD UTD UTD 1 1 1 1 1 0 14 77.8 Farrokhi et al 2011b [65] Felicio et al 2011a[397]
1 1 1 1 2 1 1 1 UTD UTD UTD 1 1 1 1 1 0 14 77.8 Felicio et al 2012b [399] Felicio et al 2014c [398] Guzzanti et al 1994 [410] 1 1 1 1 1 1 1 0 UTD UTD UTD 1 1 1 UTD 1 0 11 61.1
Haim et al 2006 [422] 1 1 1 1 2 1 1 1 1 1 0 1 1 1 1 1 0 16 88.9
Harman et al 2002 [409] 1 1 1 1 0 1 0 0 UTD UTD UTD 1 0 1 UTD 0 0 7 38.9
Ho et al 2014 [68] 1 1 1 1 2 1 1 1 UTD UTD UTD 1 1 1 1 1 0 14 77.8 Ho et al 2014b [66]
Joensen et al 2011 [403] 1 1 1 1 2 0 1 0 1 1 1 1 1 1 1 1 0 15 83.3
Jones et al 1995 [414] 1 1 1 1 0 1 1 0 UTD UTD UTD 1 1 UTD 1 0 0 9 50
Kim et al 2014 [423] 1 1 1 1 1 1 1 1 1 1 UTD 1 1 UTD 1 0 0 13 72.2 Laprade & Culham 2003 [420] 1 1 1 1 2 1 1 1 1 1 1 1 1 1 1 0 1 17 94.4
Jan et al 2009 [424] 1 1 1 1 2 1 1 1 1 1 0 1 1 1 0 1 1 16 88.9 Metin Cubuk et al 2000 [413] 1 1 1 1 1 1 1 0 UTD UTD UTD 1 1 UTD UTD 0 0 9 50
Muneta et al 1994 [412] 1 1 1 1 1 1 1 0 UTD UTD UTD 1 1 1 UTD 0 0 10 55.6
Pal et al 2013c [402] 1 1 1 1 2 1 1 1 1 1 UTD 1 1 1 1 1 1 17 94.4
Pattyn et al 2012a[400] 1 1 1 1 2 1 1 1 1 1 1 1 1 1 1 1 0 17 94.4
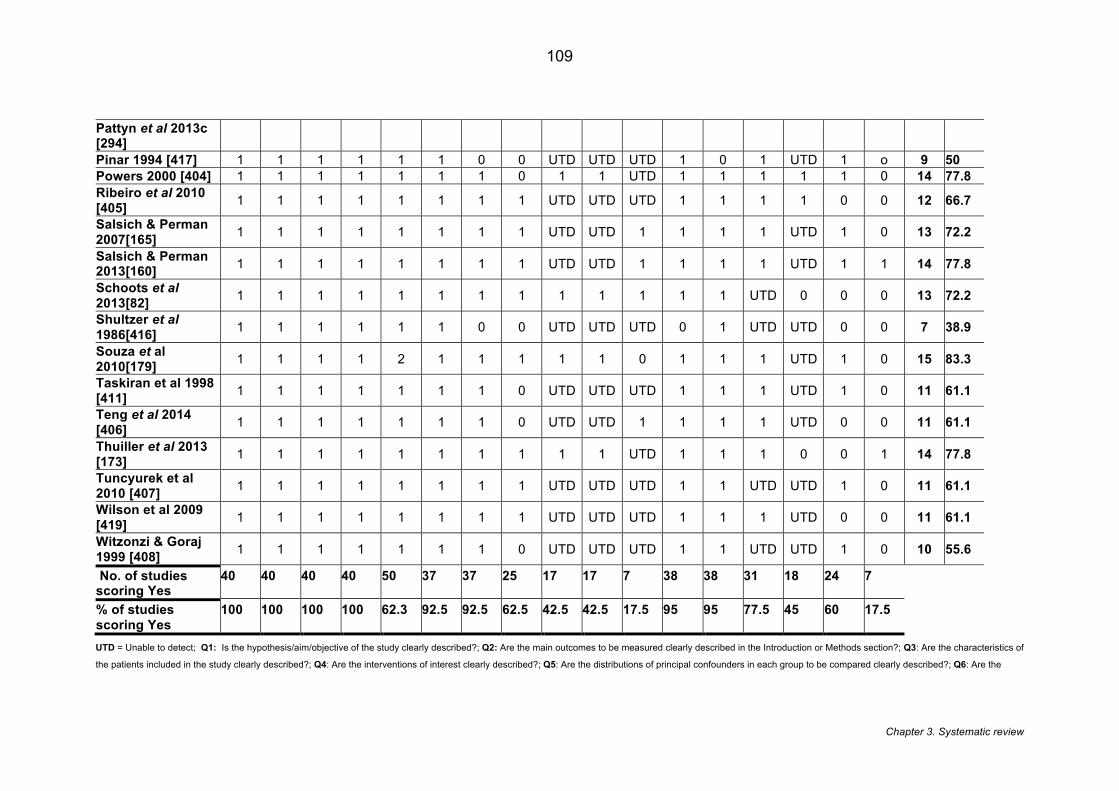
Chapter 3. Systematic review
109
Pattyn et al 2013c [294] Pinar 1994 [417] 1 1 1 1 1 1 0 0 UTD UTD UTD 1 0 1 UTD 1 o 9 50 Powers 2000 [404] 1 1 1 1 1 1 1 0 1 1 UTD 1 1 1 1 1 0 14 77.8 Ribeiro et al 2010 [405] 1 1 1 1 1 1 1 1 UTD UTD UTD 1 1 1 1 0 0 12 66.7
Salsich & Perman 2007[165] 1 1 1 1 1 1 1 1 UTD UTD 1 1 1 1 UTD 1 0 13 72.2
Salsich & Perman 2013[160] 1 1 1 1 1 1 1 1 UTD UTD 1 1 1 1 UTD 1 1 14 77.8
Schoots et al 2013[82] 1 1 1 1 1 1 1 1 1 1 1 1 1 UTD 0 0 0 13 72.2
Shultzer et al 1986[416] 1 1 1 1 1 1 0 0 UTD UTD UTD 0 1 UTD UTD 0 0 7 38.9
Souza et al 2010[179] 1 1 1 1 2 1 1 1 1 1 0 1 1 1 UTD 1 0 15 83.3
Taskiran et al 1998 [411] 1 1 1 1 1 1 1 0 UTD UTD UTD 1 1 1 UTD 1 0 11 61.1
Teng et al 2014 [406] 1 1 1 1 1 1 1 0 UTD UTD 1 1 1 1 UTD 0 0 11 61.1
Thuiller et al 2013 [173] 1 1 1 1 1 1 1 1 1 1 UTD 1 1 1 0 0 1 14 77.8
Tuncyurek et al 2010 [407] 1 1 1 1 1 1 1 1 UTD UTD UTD 1 1 UTD UTD 1 0 11 61.1
Wilson et al 2009 [419] 1 1 1 1 1 1 1 1 UTD UTD UTD 1 1 1 UTD 0 0 11 61.1
Witzonzi & Goraj 1999 [408] 1 1 1 1 1 1 1 0 UTD UTD UTD 1 1 UTD UTD 1 0 10 55.6
No. of studies scoring Yes
40 40 40 40 50 37 37 25 17 17 7 38 38 31 18 24 7
% of studies scoring Yes
100 100 100 100 62.3 92.5 92.5 62.5 42.5 42.5 17.5 95 95 77.5 45 60 17.5
UTD = Unable to detect; Q1: Is the hypothesis/aim/objective of the study clearly described?; Q2: Are the main outcomes to be measured clearly described in the Introduction or Methods section?; Q3: Are the characteristics of
the patients included in the study clearly described?; Q4: Are the interventions of interest clearly described?; Q5: Are the distributions of principal confounders in each group to be compared clearly described?; Q6: Are the
Chapter 3. Systematic review
110
main findings of the study clearly described?; Q7: Does the study provide estimates of the random variability in the data for the main outcomes?; Q8: Have the actual probability values been reported ( e.g. 0.035 rather than
<0.05) for the main outcomes except where the probability value is less than 0.001: Q9: Were the subjects asked to participate in the study representative of the entire population from which they were recruited?; Q10: Were
the subjects who were prepared to participate representative of the entire population from which they were recruited; Q11: Was an attempt to blind those measuring the main outcome?; Q12: If any of the results of the study
were based on “data dredging” was this made clear?; Q13: Were the statistical tests used for the main outcomes appropriate?; Q14: Were the main outcome measures used accurate (valid and reliable)?; Q15: Were the case
and controls recruited from the same population?; Q16: Was there adequate adjustment for confounding in the analyses from which the main findings were drawn?; Q17: Did the study have sufficient power to detect a clinically
important effect?
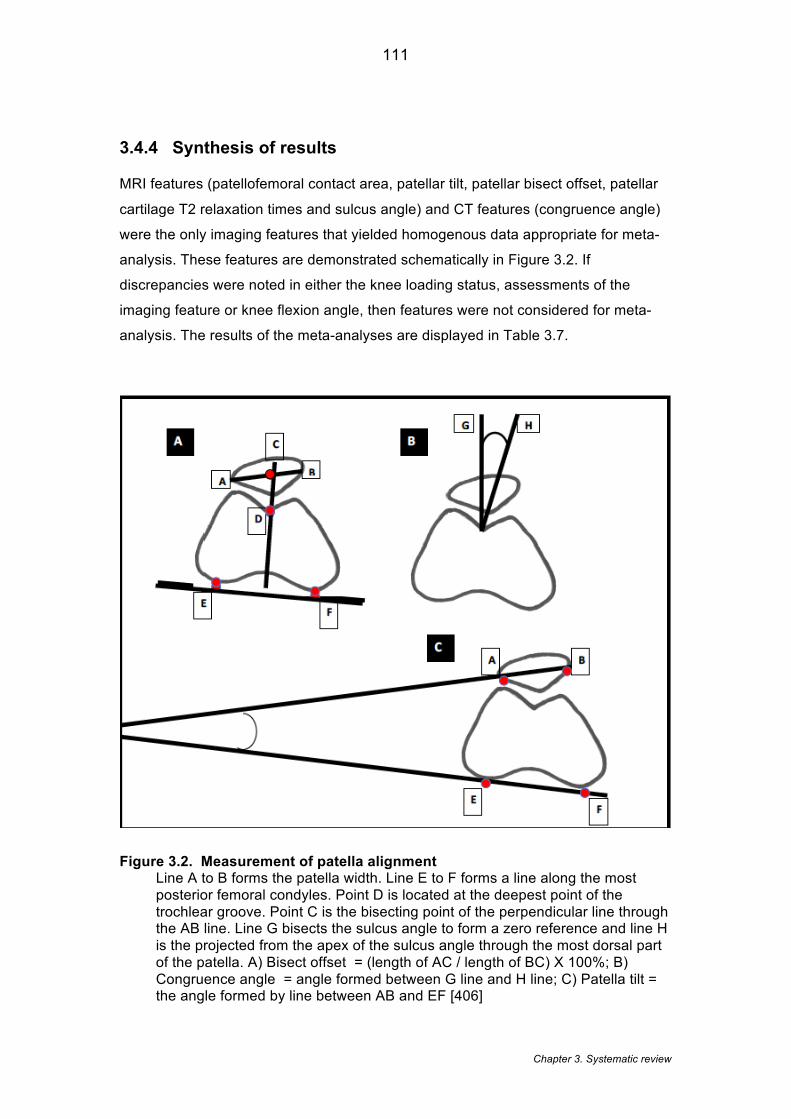
Chapter 3. Systematic review
111
3.4.4 Synthesis of results
MRI features (patellofemoral contact area, patellar tilt, patellar bisect offset, patellar
cartilage T2 relaxation times and sulcus angle) and CT features (congruence angle)
were the only imaging features that yielded homogenous data appropriate for meta-
analysis. These features are demonstrated schematically in Figure 3.2. If
discrepancies were noted in either the knee loading status, assessments of the
imaging feature or knee flexion angle, then features were not considered for meta-
analysis. The results of the meta-analyses are displayed in Table 3.7.
Figure 3.2. Measurement of patella alignment Line A to B forms the patella width. Line E to F forms a line along the most posterior femoral condyles. Point D is located at the deepest point of the trochlear groove. Point C is the bisecting point of the perpendicular line through the AB line. Line G bisects the sulcus angle to form a zero reference and line H is the projected from the apex of the sulcus angle through the most dorsal part of the patella. A) Bisect offset = (length of AC / length of BC) X 100%; B) Congruence angle = angle formed between G line and H line; C) Patella tilt = the angle formed by line between AB and EF [406]

Chapter 3. Systematic review
112
Funnel plots were considered to examine the bias in meta-analyses. A funnel plot is
a scatter plot of the treatment effects against the study precision. In the absence of
any bias the plot should resemble an inverted symmetrical funnel [426]. Typically
bias identified by funnel plots is attributed to publication bias, however, other sources
of biases including selective reporting and poor methodological design may be the
cause of funnel asymmetry [426]. Based on published guidelines [427], funnel plots
were not indicated as none of the meta-analyse conducted in this chapter included
more than 10 studies. Fewer than 10 studies reduces the power of identifying real
asymmetry [426] and increases the likelihood of a spurious result.
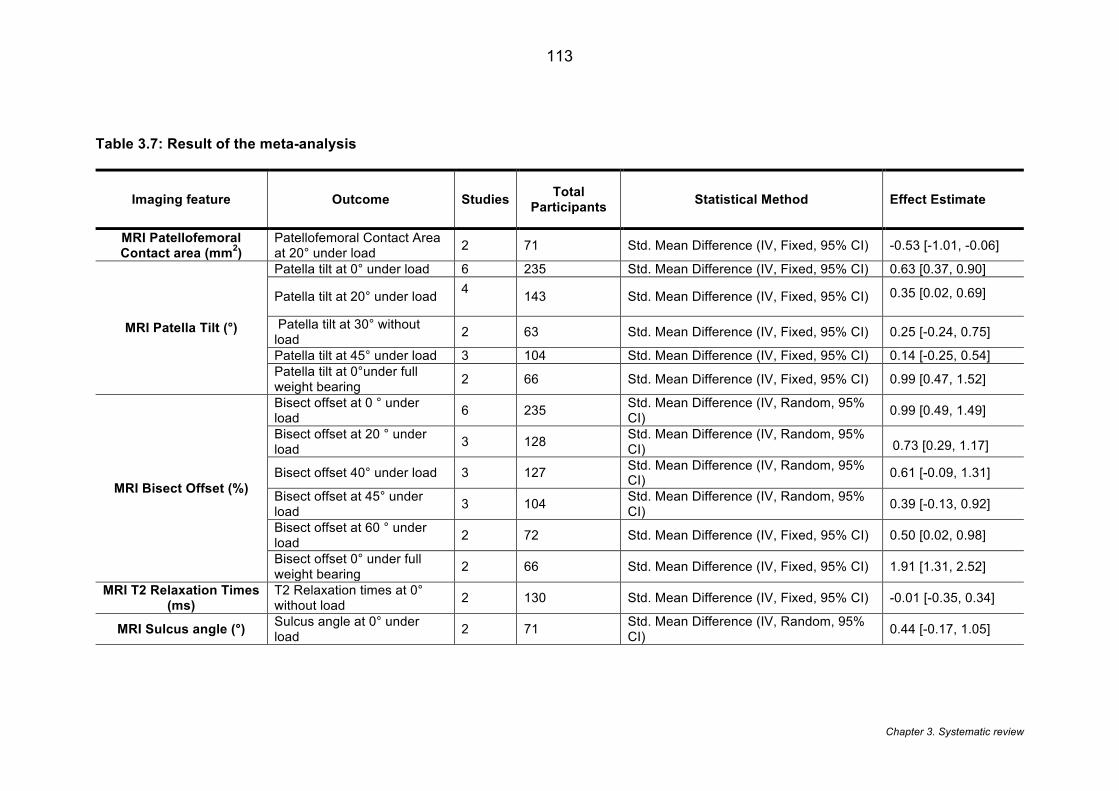
Chapter 3. Systematic review
113
Table 3.7: Result of the meta-analysis
Imaging feature Outcome Studies Total Participants Statistical Method Effect Estimate
MRI Patellofemoral Contact area (mm2)
Patellofemoral Contact Area at 20° under load 2 71 Std. Mean Difference (IV, Fixed, 95% CI) -0.53 [-1.01, -0.06]
MRI Patella Tilt (°)
Patella tilt at 0° under load 6 235 Std. Mean Difference (IV, Fixed, 95% CI) 0.63 [0.37, 0.90]
Patella tilt at 20° under load 4 143 Std. Mean Difference (IV, Fixed, 95% CI) 0.35 [0.02, 0.69]
Patella tilt at 30° without load 2 63 Std. Mean Difference (IV, Fixed, 95% CI) 0.25 [-0.24, 0.75]
Patella tilt at 45° under load 3 104 Std. Mean Difference (IV, Fixed, 95% CI) 0.14 [-0.25, 0.54] Patella tilt at 0°under full weight bearing 2 66 Std. Mean Difference (IV, Fixed, 95% CI) 0.99 [0.47, 1.52]
MRI Bisect Offset (%)
Bisect offset at 0 ° under load 6 235 Std. Mean Difference (IV, Random, 95%
CI) 0.99 [0.49, 1.49]
Bisect offset at 20 ° under load 3 128 Std. Mean Difference (IV, Random, 95%
CI) 0.73 [0.29, 1.17]
Bisect offset 40° under load 3 127 Std. Mean Difference (IV, Random, 95% CI) 0.61 [-0.09, 1.31]
Bisect offset at 45° under load 3 104 Std. Mean Difference (IV, Random, 95%
CI) 0.39 [-0.13, 0.92]
Bisect offset at 60 ° under load 2 72 Std. Mean Difference (IV, Fixed, 95% CI) 0.50 [0.02, 0.98]
Bisect offset 0° under full weight bearing 2 66 Std. Mean Difference (IV, Fixed, 95% CI) 1.91 [1.31, 2.52]
MRI T2 Relaxation Times (ms)
T2 Relaxation times at 0° without load 2 130 Std. Mean Difference (IV, Fixed, 95% CI) -0.01 [-0.35, 0.34]
MRI Sulcus angle (°) Sulcus angle at 0° under load 2 71 Std. Mean Difference (IV, Random, 95%
CI) 0.44 [-0.17, 1.05]
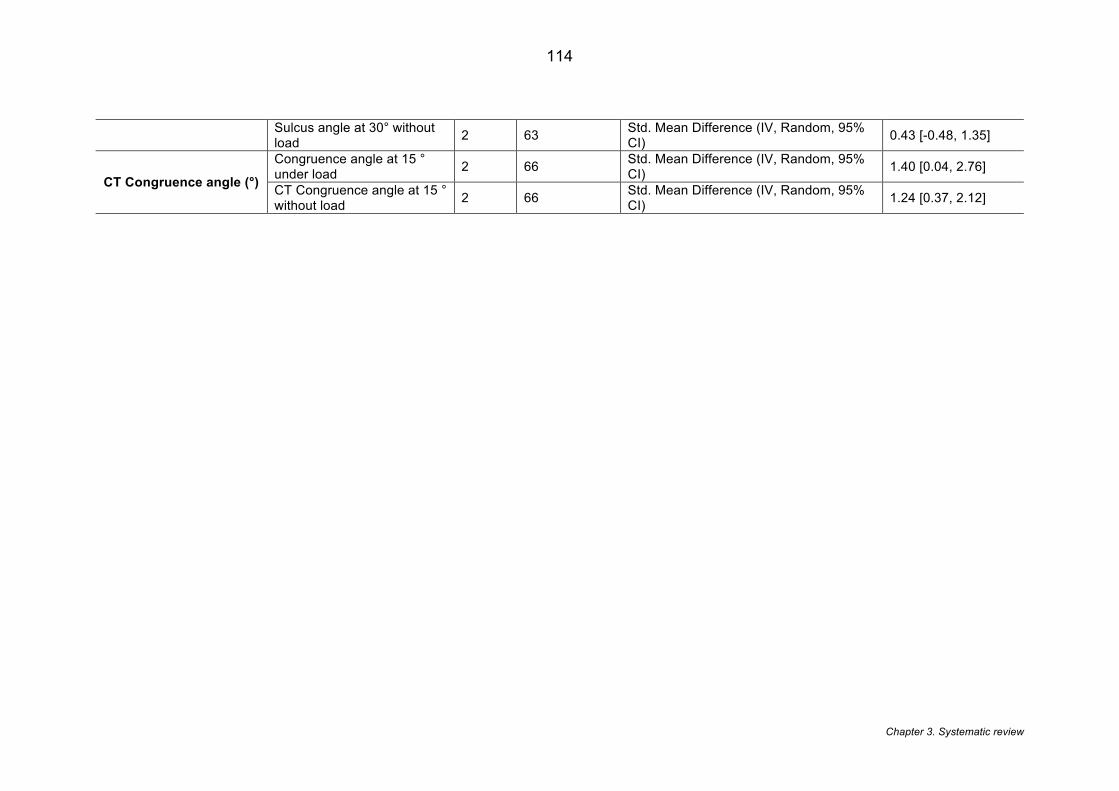
Chapter 3. Systematic review
114
Sulcus angle at 30° without load 2 63 Std. Mean Difference (IV, Random, 95%
CI) 0.43 [-0.48, 1.35]
CT Congruence angle (°)
Congruence angle at 15 ° under load 2 66 Std. Mean Difference (IV, Random, 95%
CI) 1.40 [0.04, 2.76]
CT Congruence angle at 15 ° without load 2 66 Std. Mean Difference (IV, Random, 95%
CI) 1.24 [0.37, 2.12]
Chapter 3. Systematic review
115
3.4.5 Magnetic Resonance Imaging
Of the twenty-two studies that used MRI, sixteen studies [65, 66, 68, 148, 160, 165,
166, 168-170, 173, 179, 256, 294, 397-400, 402-404, 428] were judged as high
quality. Controlling for the knee loading status, assessment of the imaging feature
and knee flexion angle, patella bisect offset at 0 degrees with load demonstrated the
largest SMD (0.99; 95% CI: 0.49, 1.49; moderate evidence) based on five high
quality and one moderate quality study (Figure 3.3).This was the only MRI feature
which presented with a large SMD [139]. Five other features demonstrated a medium
SMD [139].These included: patella bisect offset at 20 degrees with load (0.73; 95%
CI: 0.29, 1.17; limited evidence), patella tilt at 0 degrees with load (0.63: 95% CI:
0.37, 0.90; moderate evidence), patella bisect offset at 40 degrees with load (0.61;
95% CI:-0.09, 1.31; limited evidence), patellofemoral contact area at 20 degrees with
load (-0.53; 95% CI: -1.01,-0.06; limited evidence) and patella bisect offset at 60
degrees with load (0.50; 95% CI 0.02, 0.98; limited evidence).
A small SMD was found for the pooling of sulcus angle at 0° with load (0.44; 95% CI:
-0.17, 1.05; limited evidence), sulcus angle at 30° without load (0.43; 95% CI: -0.48,
1.35; limited evidence), patella tilt at 20° with load (0.35; 95% CI: 0.02,0.69;
moderate evidence), patella tilt at 30° without load (0.25; 95% CI: -0.24, 0.75; limited
evidence), T2 Relaxation time at 0° with without load (-0.01; 95% CI: -0.35,0.34;
limited evidence). The data for patellofemoral joint reaction force (PFJRF) was
considered inappropriate for pooling as its outputs were produced via computational
modelling, with imaging as only one component. For the data not amenable to
pooling, there was limited evidence to support a difference between PFP and a
control group with regards to: congruence angle at 20° [408]and 30° [405]without
load; T1 value of the lateral patellofemoral cartilage without load [173]; articular
lesions of the patella [403]; peak PFJRF; and patella cartilage thickness in males
[169]. There was conflicting evidence to support a difference in patella cartilage
thickness in women [66, 168-170] and no evidence to support differences in patella
tendon morphology [407].
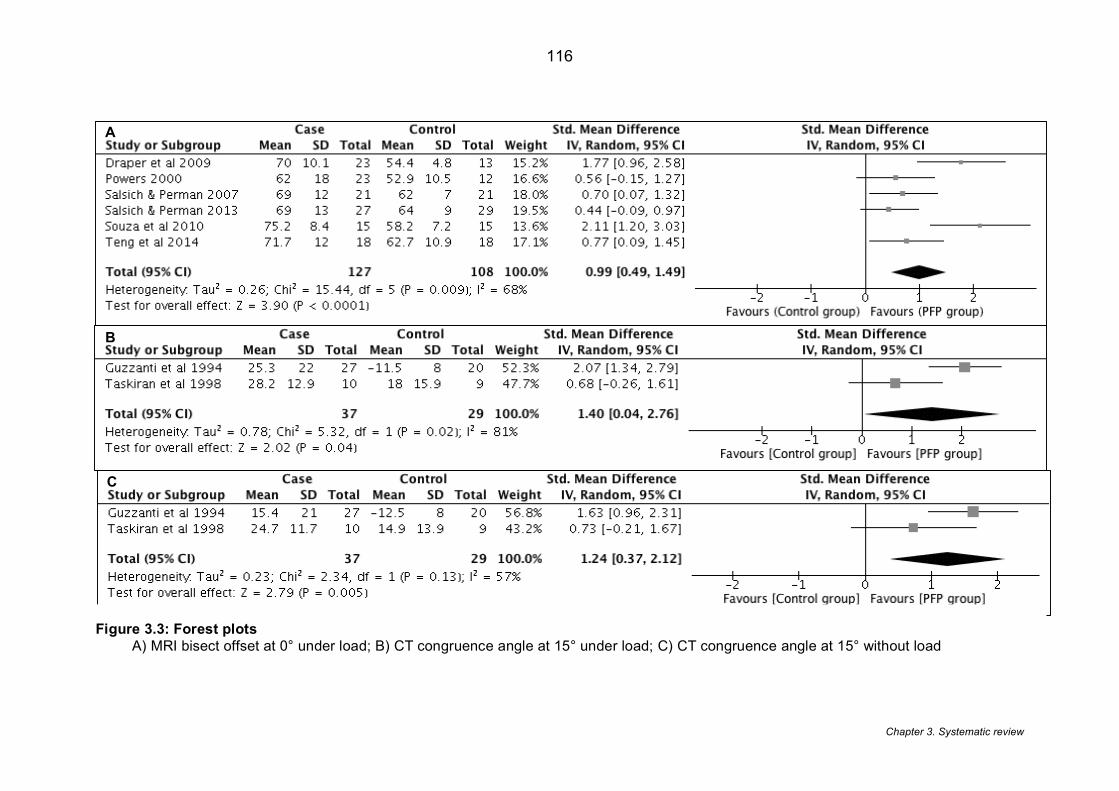
Chapter 3. Systematic review
116
A
B
C
Figure 3.3: Forest plots A) MRI bisect offset at 0° under load; B) CT congruence angle at 15° under load; C) CT congruence angle at 15° without load
Chapter 3. Systematic review
117
3.4.6 Ultrasound
US was used to assess PFP imaging features in four studies [82, 228, 359, 418].
These were all judged as high quality. Pooling of data was not appropriate due to the
variety of outcome features analysed and the different assessment techniques used.
For the data not amenable to pooling, there was limited evidence, from single
studies, to support a difference between PFP and control group in terms of: a
reduction in vastus medialis oblique (VMO) contraction ratio and capacity [216]; an
increase in VMO electrical mechanical delay and a reduction in vastus lateralis (VL)
delay[418]; and a difference in VMO fibre angle, insertion level and volume [228].
3.4.7 Computed Tomography
CT was employed in eight studies, all of which were judged as moderate quality.
Pooling of data was limited for congruence angle [410, 411, 416, 417]; patella tilt
angle [410, 411, 416, 417]; sulcus angle [410, 417] since studies either: did not
provide adequate data [417]; it was unclear whether their participants’ knee was
loaded or unloaded [416]; or they adopted different measurement techniques for
patella tilt angle [410]. Pooling was appropriate for congruence angle at 15 degrees
without load and congruence angle at 15 degrees under load. Both features
demonstrated a large SMD (1.24; 95% CI 0.37, 2.12; limited evidence) and (1.40
95% CI: 0.04, 2.76; limited evidence) respectively, based on two studies [410, 416]
(Figure 3.4). For the data not amenable to pooling there is limited evidence to
support a difference between PFP and a control group with regards to: congruence
angle at 15° without load [411]; tibial tubercle rotation angle at 0° without load [412,
413]; trochlear depth at 15° without load [410]. Conflicting evidence exists for patella
tilt at 15° with load [410, 411].
3.4.8 X-ray
XR features were assessed in five studies. Of these, three were judged as high
quality [420, 422, 423] and two as moderate quality [413, 421]. The following features
were considered for meta-analysis: sulcus angle [420-422], congruence angle [420-
422], Insall-Salvati index [421, 422] and lateral patellofemoral angle [420, 423]. It was
not possible to pool data for any of these XR features however, due to variations in
the knee flexion angle. For the data not amenable to pooling there was limited
evidence to support a difference between PFP and a control group with regards to:
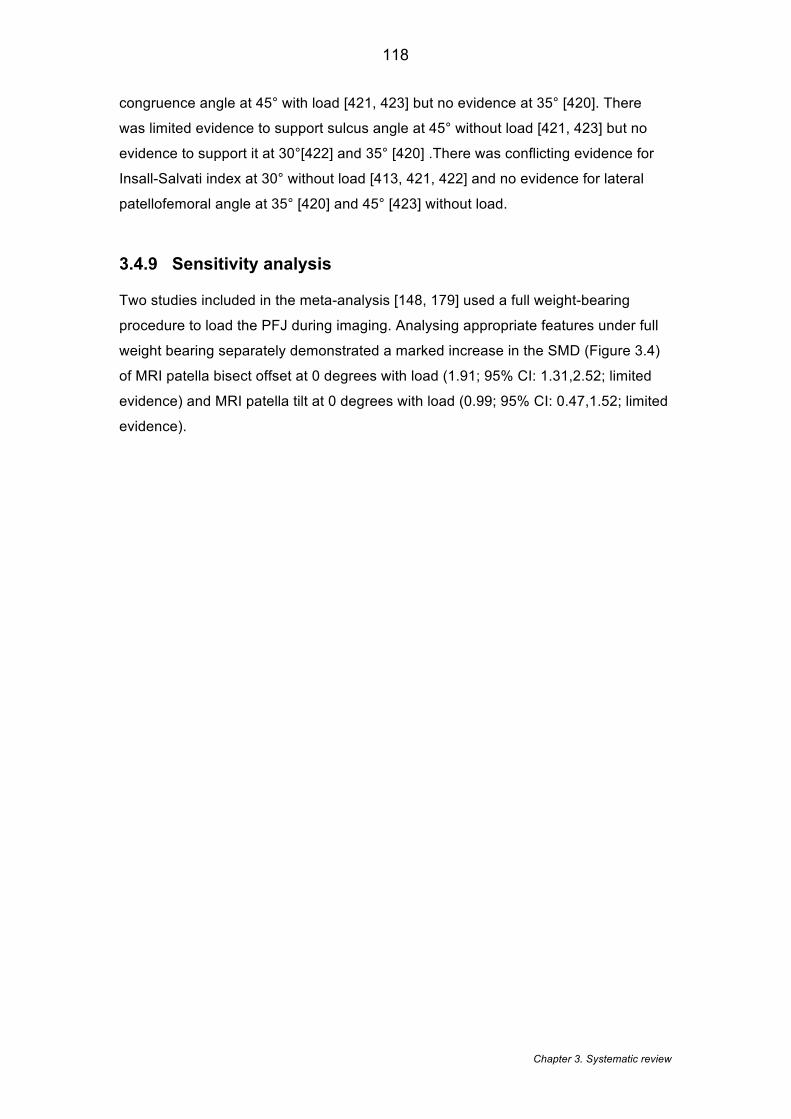
Chapter 3. Systematic review
118
congruence angle at 45° with load [421, 423] but no evidence at 35° [420]. There
was limited evidence to support sulcus angle at 45° without load [421, 423] but no
evidence to support it at 30°[422] and 35° [420] .There was conflicting evidence for
Insall-Salvati index at 30° without load [413, 421, 422] and no evidence for lateral
patellofemoral angle at 35° [420] and 45° [423] without load.
3.4.9 Sensitivity analysis
Two studies included in the meta-analysis [148, 179] used a full weight-bearing
procedure to load the PFJ during imaging. Analysing appropriate features under full
weight bearing separately demonstrated a marked increase in the SMD (Figure 3.4)
of MRI patella bisect offset at 0 degrees with load (1.91; 95% CI: 1.31,2.52; limited
evidence) and MRI patella tilt at 0 degrees with load (0.99; 95% CI: 0.47,1.52; limited
evidence).
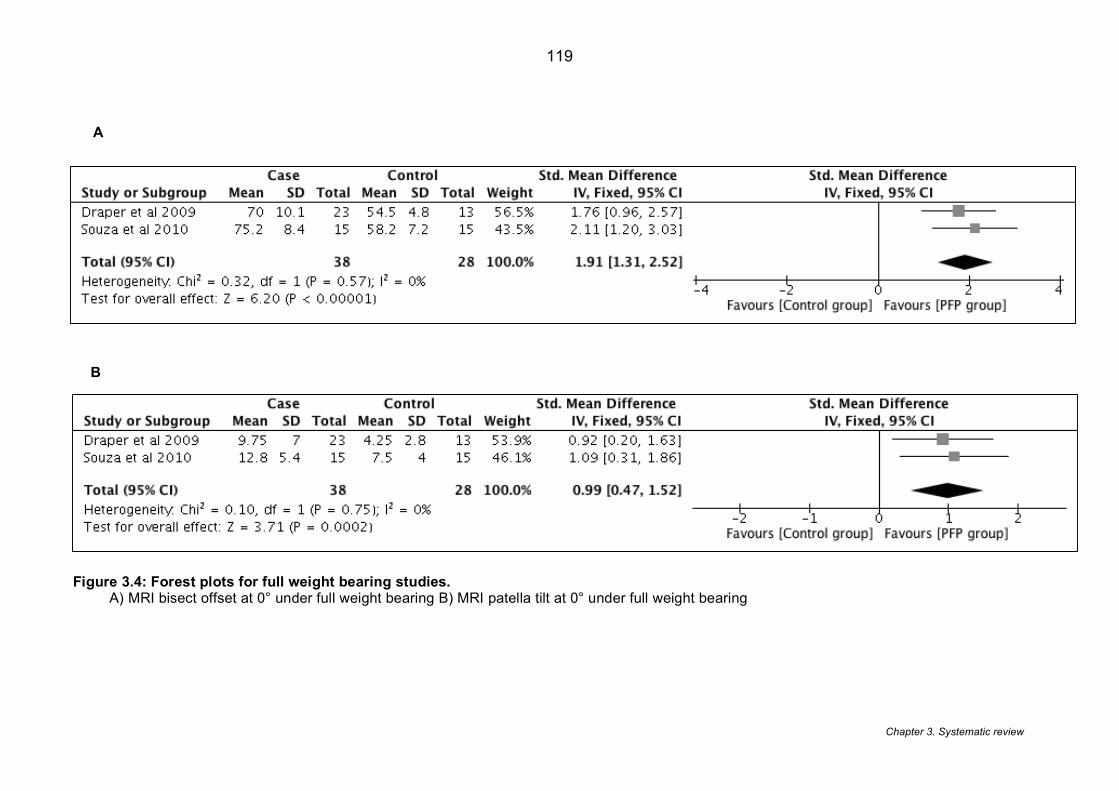
Chapter 3. Systematic review
119
A
B
Figure 3.4: Forest plots for full weight bearing studies. A) MRI bisect offset at 0° under full weight bearing B) MRI patella tilt at 0° under full weight bearing
Chapter 4. 3D imaging study
120
3.5 Discussion
This systematic review suggests that an increased MRI bisect offset at 0° knee
flexion under load and CT-derived congruence angle at 15° knee flexion with and
without load are both associated with PFP. This is based on a large SMD as
determined from moderate and limited evidence respectively. A medium SMD was
identified for the association between PFP and the following MRI features: patella tilt
and patellofemoral contact area. Limited evidence existed to support the association
of PFP with other features of MRI, US, CT and XR.
As highlighted in Chapter 2, Lankhorst et al. (2013) [194] provides a comprehensive
review into a broad range of factors associated with PFP (searched up to November
2010). Unlike Lankhorst et al. (2013) [194], the current analysis did not restrict
inclusion by sample size to improve inclusivity [429] and together with inclusion of
more recent studies, this resulted in over 70% of the current review studies being
different from Lankhorst et al. (2013) [194]. The present review also controlled for
variables such as imaging modality, knee flexion angle, and knee loading, known to
influence the homogeneity of the imaging outcomes [154].
Sufficient homogeneity was only demonstrated by MRI and CT studies and thus
deemed appropriate for meta-analysis. Bisect offset measured with MRI was most
amenable to pooling across a variety of knee flexion angles demonstrating medium
to large SMDs. This is notable as bisect offset has been shown to be the most
statistically significant feature in the progression of PFJ joint space narrowing over a
five-year period in adults with symptomatic knee pain aged 70-79 years [430].
Considerable clinical heterogeneity was present in the studies utilising XR and US.
Studies using XR reported outcomes with subtle variations in knee flexion angle or
assessment techniques that limited the pooling of data. The imaging features used in
US were distinctly different and so offered no potential for pooling.
The sensitivity analysis demonstrated an increase in SMD for both patella tilt and
bisect offset when MR images were acquired under upright full weight bearing. This
is in contrast to previous studies that have shown that bisect offset is more
pronounced in the supine position when investigating people with PFP under both
Chapter 4. 3D imaging study
121
supine-loaded and upright full weight bearing conditions [164, 425]. The reason for
this disparity is unclear, however, it may be explained by the fact that the previous
studies selected people with excessive patella lateralisation, whereas the studies
included in the current review likely contained a range of patella alignments. Another
possibility is that the control group in the current review demonstrated an average
reduction in bisect offset under full weight bearing, which may also explain the
increased SMD.
An on-going debate surrounds imaging under load [367]. The concept of ‘weight
bearing’ has been challenged by Harbaugh et al. (2010) [367] who suggest that
quadriceps activity is the primary determinant of patella position in PFP rather than
the axial loading. Studies that use full weight bearing in this chapter employed a 0.5
Tesla (T) open, upright scanner and the field strength of 0.5T may have affected
image quality [431, 432]. Full weight bearing conditions also have the potential to
elicit pain during the procedure [185]. In PFP, pain is recognised as having an
inhibitory effect on quadriceps [433]. Altering quadriceps activity may influence the
validity of the results by affecting patellar orientation [367].
A number of limitations in the literature were identified based on participant selection.
Firstly, a number of the included studies [65, 66, 68, 148, 168, 170, 179, 256, 397-
399, 404-406, 413] used all female cohorts, and of these studies only a few selected
a matched cohort. Controlling for gender, knee flexion angle and loading of the knee
has been advocated because these factors have been reported to influence the PFJ
mechanics and the comparisons made [154]. Furthermore, only half the studies
clearly stated the recruitment source of participants e.g. hospital, military etc.
Extrapolating results taken from a military or very physically active group and
applying them to a more sedentary community dwelling population is likely to affect
the external validity. Secondly, the quantification of pain in the PFP cohort was
inconsistent. Over two thirds of the included studies selected participants based on
reproducible pain with functional activities, however the number of provocative
activities required for diagnosis and inclusion varied from one [169, 406, 412, 417,
422, 423] to five [166, 408, 409]. The use of the VAS to quantify pain on provocation
activities was used in six studies [65, 160, 165, 170, 179, 256, 406] . The duration of
symptoms was also poorly reported, with fewer than a quarter of the included studies
documenting the duration of PFP, and in these studies the data was presented
differently (e.g. mean duration, range of duration). The duration of symptoms is
important, as this has been shown in PFP to be a predictor of poor long-term
Chapter 4. 3D imaging study
122
outcomes [19]. The effect of the duration of symptoms in relation to structural
imaging findings is unknown. It is known however, that long term pain will lead to
muscle inhibition [433] and thus there is a probability that a reduction in quadriceps
strength and activity could influence the PFJ structural features observed.
A number of limitations were identified in terms of the imaging assessment and
outcomes for the included studies. Fewer than a quarter of included studies clearly
recorded who interpreted the images [82, 160, 165, 166, 294, 400, 403, 406, 420]. A
person’s level of experience interpreting imaging has been demonstrated to affect
the accuracy of the analysis [434] and the level of confidence drawn from their
findings. Furthermore, only a few studies documented whether the person analysing
the images was blinded to group allocation. Blinding of allocation in this type of study
design should be achievable [435] and lack of blinding raises the concern of
confirmation bias [435]. The reliability of the imaging assessment was reported in
fewer than half the included studies. Generally, the ICCs showed a moderate to high
reliability for the MRI variables: bisect offset, patella tilt angle, patellofemoral contact
area, Insall-Salvati index and sulcus angle, supporting the use of these features in
future studies.
A recent international expert consensus group highlight the need for sub-grouping of
the PFP population [20]. The current review demonstrated a number of PFJ imaging
features associated with PFP suggesting that these features should be considered
as important components of future stratification. In addition, although most of the
included studies employed cross sectional analyses, two studies did employ an
interventional pre-post study design [148, 166]. These studies detected a significant
change in patellofemoral contact area following strengthening exercise [166] and
patellofemoral bisect offset and patella tilt following patella bracing [148]. As these
imaging features have been shown to be modifiable it highlights the opportunity of
using imaging features clinically as a treatment target
3.6 Limitations of the current review
Study selection remains challenging in terms of the PFP nomenclature and the fact
that historically, the condition has been referred to by a variety of other names [436].
In the present review, over 20% of the studies used terms differing from
Chapter 4. 3D imaging study
123
patellofemoral pain or patellofemoral pain syndrome. This makes study selection
challenging with selection of the studies based on the description of the condition
when more ambiguous terms are used. We attempted to minimise the potential bias
in this process by using two reviewers to select studies and a third independent
mediator.
From a study design perspective, the cross-sectional nature of the studies means the
results from the current review cannot imply causality. Furthermore, the small sample
sizes used in many of the included studies may influence the validity of the results.
However, meta-analyses were possible for a number of imaging features thus
increasing the overall sample size and improving statistical power [437].
With consideration of the methodology, determining whether an image was captured
under load was based on a dichotomised value (loaded/ unloaded) rather than
quantifying the exact load which may be important [367]. Only a few studies reported
the quantity of loading so a comparison between studies was not possible. It was
also apparent that some potential data for the review was the outcome of complex
modelling such as finite element modelling. Where possible these imaging features
were isolated and reported, however, the features that could not be isolated should
be considered for a separate, future review.
3.7 Conclusion
The analyses within this chapter suggests that PFP is associated with a number of
imaging features, in particular MRI bisect offset and CT congruence angle analysed
at 0° knee flexion and 15° knee flexion respectively. A degree of caution in
interpretation of this data is advised, however, due to the role of both features being
derived from only moderate and limited evidence respectively. The results of this
systematic review suggest that future studies need to clearly document the specific
population in which participants are recruited and to improve reporting of imaging-
related issues. The inclusion of two interventional studies demonstrates that imaging
features are potentially modifiable [148, 166] supporting their use in clinical
subgrouping as shown in Chapter 5 and the presence of twenty- two studies
reporting MRI features informs the investigation in Chapter 3. Limitations identified in
terms of participant selection and imaging assessment will be further addressed in
the following chapters.
Chapter 4. 3D imaging study
124
Chapter 4 - Patellofemoral joint morphology in middle-aged people with patellofemoral pain measured using 3D
quantitative analysis: data from the Osteoarthritis Initiative
This chapter describes a retrospective study which employed novel technology to
create 3D equivalents of commonly used patellofemoral joint imaging features and
overall 3D bone shape to investigate whether these features differed between people
with and without patellofemoral pain and between genders. The results from this
chapter have been published as: Drew BT, Bowes MA, Redmond AC, Dube B,
Kingsbury S, Conaghan PG. (2017). Patellofemoral morphology is not related to pain
when using 3D quantitative analysis: data from the Osteoarthritis Initiative.
Rheumatology. 56 (12), 2135-2144. [438].
4.1 Introduction
The findings of Chapter 3 show a number of MRI features associated with PFP [378].
Features such as patella medial-lateral position and patella tilt were shown to be
associated with PFP in small cohorts [378] (section 3.4.4). However, these findings
were predominantly based on radiographic methods that have inherent limitations
arising from their 2D methodology [439]. These studies typically used methods
originally designed for radiographs and applied them to single MRI slices [439]. This
type of ‘2D’ measurement is not optimal, as it does not control for the position of the
leg within the image. For example, a difference in patella alignment or shape may be
genuine or may be caused by the object’s pose, the combined relative position and
rotation of the bones [440, 441] (see Figure 4.1). From a practical perspective, these
manual assessment methods are also user-dependent and time-consuming, making
it difficult to analyse features for large datasets [442].
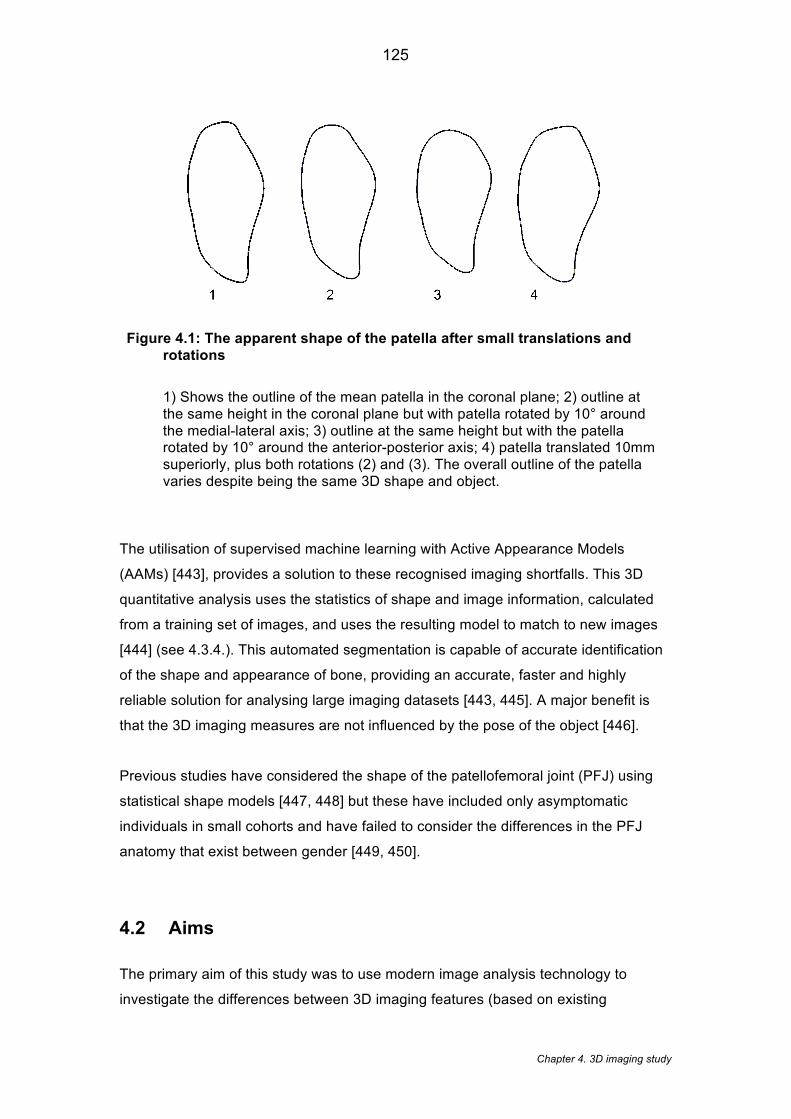
Chapter 4. 3D imaging study
125
Figure 4.1: The apparent shape of the patella after small translations and rotations
1) Shows the outline of the mean patella in the coronal plane; 2) outline at the same height in the coronal plane but with patella rotated by 10° around the medial-lateral axis; 3) outline at the same height but with the patella rotated by 10° around the anterior-posterior axis; 4) patella translated 10mm superiorly, plus both rotations (2) and (3). The overall outline of the patella varies despite being the same 3D shape and object.
The utilisation of supervised machine learning with Active Appearance Models
(AAMs) [443], provides a solution to these recognised imaging shortfalls. This 3D
quantitative analysis uses the statistics of shape and image information, calculated
from a training set of images, and uses the resulting model to match to new images
[444] (see 4.3.4.). This automated segmentation is capable of accurate identification
of the shape and appearance of bone, providing an accurate, faster and highly
reliable solution for analysing large imaging datasets [443, 445]. A major benefit is
that the 3D imaging measures are not influenced by the pose of the object [446].
Previous studies have considered the shape of the patellofemoral joint (PFJ) using
statistical shape models [447, 448] but these have included only asymptomatic
individuals in small cohorts and have failed to consider the differences in the PFJ
anatomy that exist between gender [449, 450].
4.2 Aims
The primary aim of this study was to use modern image analysis technology to
investigate the differences between 3D imaging features (based on existing
Chapter 4. 3D imaging study
126
radiographic measures) and overall bone shape for people with and without PFP in a
large cohort; and to investigate whether any single 3D imaging feature, or
combination of features, was associated with the presence of pain. As evidence
suggests there are differences in PFJ morphology between genders [449-451], the
secondary aim was to validate the measures used by exploring whether these
features could significantly discriminate men and women.
4.3 Methods
The data used in this chapter was taken from the publically available Osteoarthritis
Initiative (OAI) database.
4.3.1 Summary of the Osteoarthritis Initiative (OAI)
The Osteoarthritis Initiative (OAI) is a multicentre longitudinal, observational study
[452] comprising of those with knee osteoarthritis (OA) and those at risk of knee OA
aged between 45-79 years. The study database includes 4796 participants with an
extensive range of patient reported, clinical and imaging data publically available.
The overall recruitment aim of the OAI was to enrol equal numbers of males and
females of which at least 23% were from ethnic minorities with or at risk of
symptomatic tibiofemoral OA [452]. Scans were performed bilaterally using 3.0 T
MRI and the following MRI sequences were employed (see Table 4.1). Bilateral
radiographs were used to determine the Kellgren & Lawrence (KL) grade using
posterior-anterior views in a fixed flexion standing position.
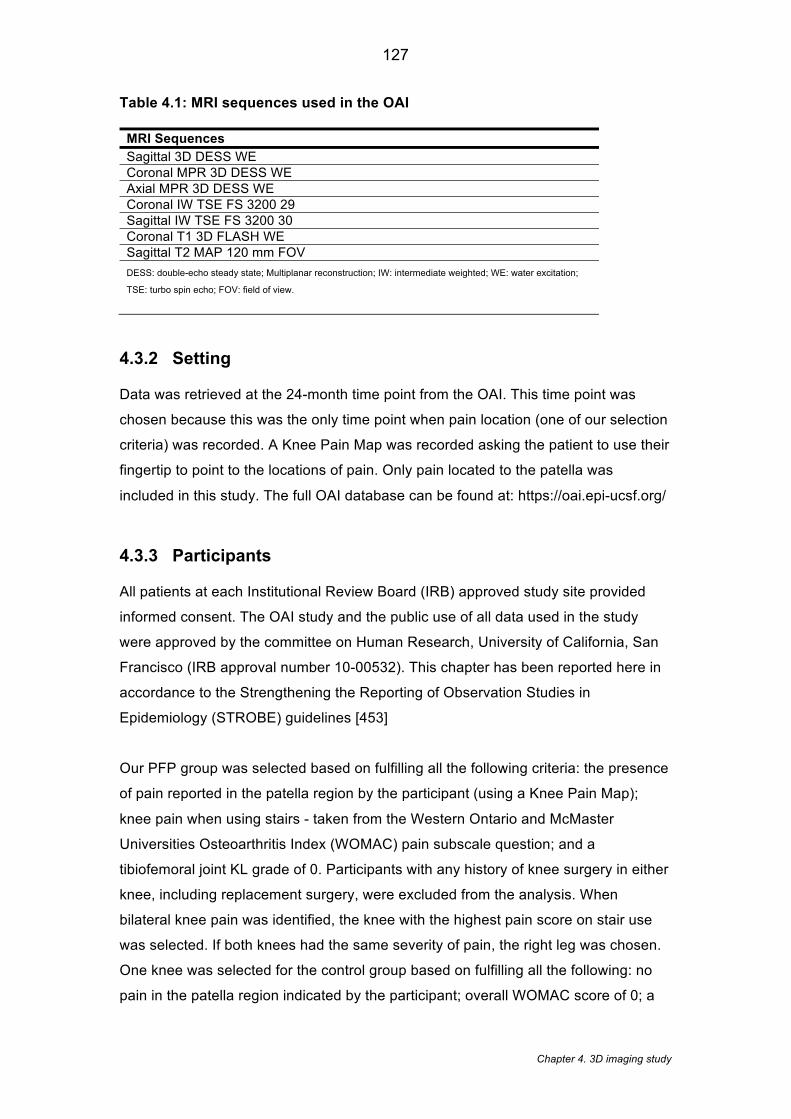
Chapter 4. 3D imaging study
127
Table 4.1: MRI sequences used in the OAI
MRI Sequences Sagittal 3D DESS WE Coronal MPR 3D DESS WE Axial MPR 3D DESS WE Coronal IW TSE FS 3200 29 Sagittal IW TSE FS 3200 30 Coronal T1 3D FLASH WE Sagittal T2 MAP 120 mm FOV DESS: double-echo steady state; Multiplanar reconstruction; IW: intermediate weighted; WE: water excitation;
TSE: turbo spin echo; FOV: field of view.
4.3.2 Setting
Data was retrieved at the 24-month time point from the OAI. This time point was
chosen because this was the only time point when pain location (one of our selection
criteria) was recorded. A Knee Pain Map was recorded asking the patient to use their
fingertip to point to the locations of pain. Only pain located to the patella was
included in this study. The full OAI database can be found at: https://oai.epi-ucsf.org/
4.3.3 Participants
All patients at each Institutional Review Board (IRB) approved study site provided
informed consent. The OAI study and the public use of all data used in the study
were approved by the committee on Human Research, University of California, San
Francisco (IRB approval number 10-00532). This chapter has been reported here in
accordance to the Strengthening the Reporting of Observation Studies in
Epidemiology (STROBE) guidelines [453]
Our PFP group was selected based on fulfilling all the following criteria: the presence
of pain reported in the patella region by the participant (using a Knee Pain Map);
knee pain when using stairs - taken from the Western Ontario and McMaster
Universities Osteoarthritis Index (WOMAC) pain subscale question; and a
tibiofemoral joint KL grade of 0. Participants with any history of knee surgery in either
knee, including replacement surgery, were excluded from the analysis. When
bilateral knee pain was identified, the knee with the highest pain score on stair use
was selected. If both knees had the same severity of pain, the right leg was chosen.
One knee was selected for the control group based on fulfilling all the following: no
pain in the patella region indicated by the participant; overall WOMAC score of 0; a
Chapter 4. 3D imaging study
128
numerical rating scale (NRS) score of 0; KL grade of 0; and no history of surgery.
Matching was considered but not applied in order to optimise the sample size for this
high dimensional data set i.e. a large number of potential correspondences are
required to specify a specific point (see 4.4.2 for further details). The MRI data and
associated clinical data was gathered from the selected participants and the MRIs
then analysed using AAMs (see 4.3.5)
4.3.4 An overview of Active Appearance Modelling
The 3D quantitative analysis used is based on the Active Appearance Models
developed by Cootes et al. (2001) [443]. Modern applications of AAMs include
treatment planning in cardiology [454], neurology[455] as well as its recognised use
in facial recognition [456]. Active appearance modelling is a specific form of statistical
shape modelling (SSM). SSM can provide 3D morphological data that could be used
to understand pathophysiology, non-invasively in vivo [457]. Historically, joint shape
is reliant on manual segmentation, the process of dividing an image into different
regions and performed on individual MRI slices. This is particularly used for
quantitative imaging measures as described in Chapter 3. Clearly these measures
are labour intensive and not feasible for large datasets without many months of
manual segmentation [444, 445]. If the geometrical shape is manually segmented
enough from a representative population then a segmented region of interest can be
analysed by statistics in order to allow the application of SSM. The process involves
identifying a large number of anatomical equivalent landmarks (correspondences) on
a mean shape, which allows for automated recognition in a target image - similar to
face recognition software. The statistics behind this SSM uses principal component
analysis (PCA) in which the correspondences are data points. These data points are
constructed into eigenvalues (how much variance of data in a particular direction)
and eigenvectors (the direction the line of data). The PCA finds the line that explains
the most variation with the fewest axes possible –often the eigenvector with the
highest eigenvalue. PCA is also able to reduce the dimensionality of the data by
stripping the data down to its basic components, which is essential for analysing
complex 3D data. This ‘trained SSM’ is then able to recognise the same object or
part of an object in any target image it encounters allowing for accurate, automated
segmentation [457]
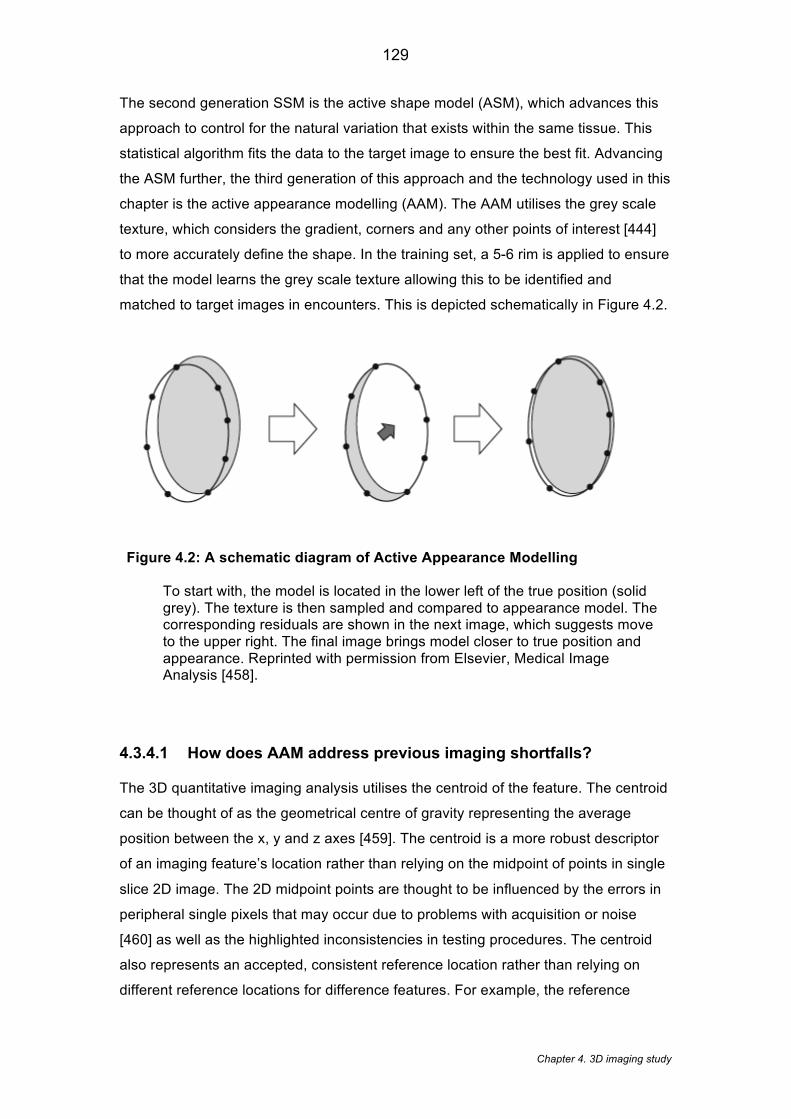
Chapter 4. 3D imaging study
129
The second generation SSM is the active shape model (ASM), which advances this
approach to control for the natural variation that exists within the same tissue. This
statistical algorithm fits the data to the target image to ensure the best fit. Advancing
the ASM further, the third generation of this approach and the technology used in this
chapter is the active appearance modelling (AAM). The AAM utilises the grey scale
texture, which considers the gradient, corners and any other points of interest [444]
to more accurately define the shape. In the training set, a 5-6 rim is applied to ensure
that the model learns the grey scale texture allowing this to be identified and
matched to target images in encounters. This is depicted schematically in Figure 4.2.
Figure 4.2: A schematic diagram of Active Appearance Modelling To start with, the model is located in the lower left of the true position (solid grey). The texture is then sampled and compared to appearance model. The corresponding residuals are shown in the next image, which suggests move to the upper right. The final image brings model closer to true position and appearance. Reprinted with permission from Elsevier, Medical Image Analysis [458].
4.3.4.1 How does AAM address previous imaging shortfalls?
The 3D quantitative imaging analysis utilises the centroid of the feature. The centroid
can be thought of as the geometrical centre of gravity representing the average
position between the x, y and z axes [459]. The centroid is a more robust descriptor
of an imaging feature’s location rather than relying on the midpoint of points in single
slice 2D image. The 2D midpoint points are thought to be influenced by the errors in
peripheral single pixels that may occur due to problems with acquisition or noise
[460] as well as the highlighted inconsistencies in testing procedures. The centroid
also represents an accepted, consistent reference location rather than relying on
different reference locations for difference features. For example, the reference
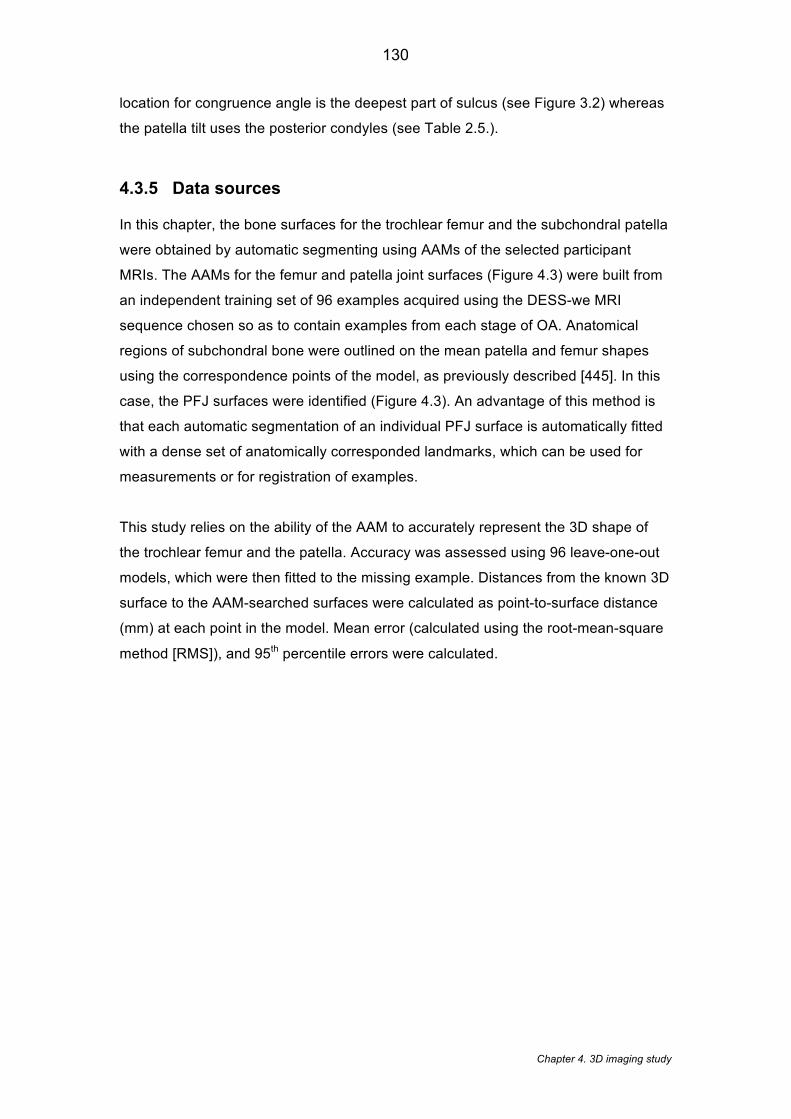
Chapter 4. 3D imaging study
130
location for congruence angle is the deepest part of sulcus (see Figure 3.2) whereas
the patella tilt uses the posterior condyles (see Table 2.5.).
4.3.5 Data sources
In this chapter, the bone surfaces for the trochlear femur and the subchondral patella
were obtained by automatic segmenting using AAMs of the selected participant
MRIs. The AAMs for the femur and patella joint surfaces (Figure 4.3) were built from
an independent training set of 96 examples acquired using the DESS-we MRI
sequence chosen so as to contain examples from each stage of OA. Anatomical
regions of subchondral bone were outlined on the mean patella and femur shapes
using the correspondence points of the model, as previously described [445]. In this
case, the PFJ surfaces were identified (Figure 4.3). An advantage of this method is
that each automatic segmentation of an individual PFJ surface is automatically fitted
with a dense set of anatomically corresponded landmarks, which can be used for
measurements or for registration of examples.
This study relies on the ability of the AAM to accurately represent the 3D shape of
the trochlear femur and the patella. Accuracy was assessed using 96 leave-one-out
models, which were then fitted to the missing example. Distances from the known 3D
surface to the AAM-searched surfaces were calculated as point-to-surface distance
(mm) at each point in the model. Mean error (calculated using the root-mean-square
method [RMS]), and 95th percentile errors were calculated.
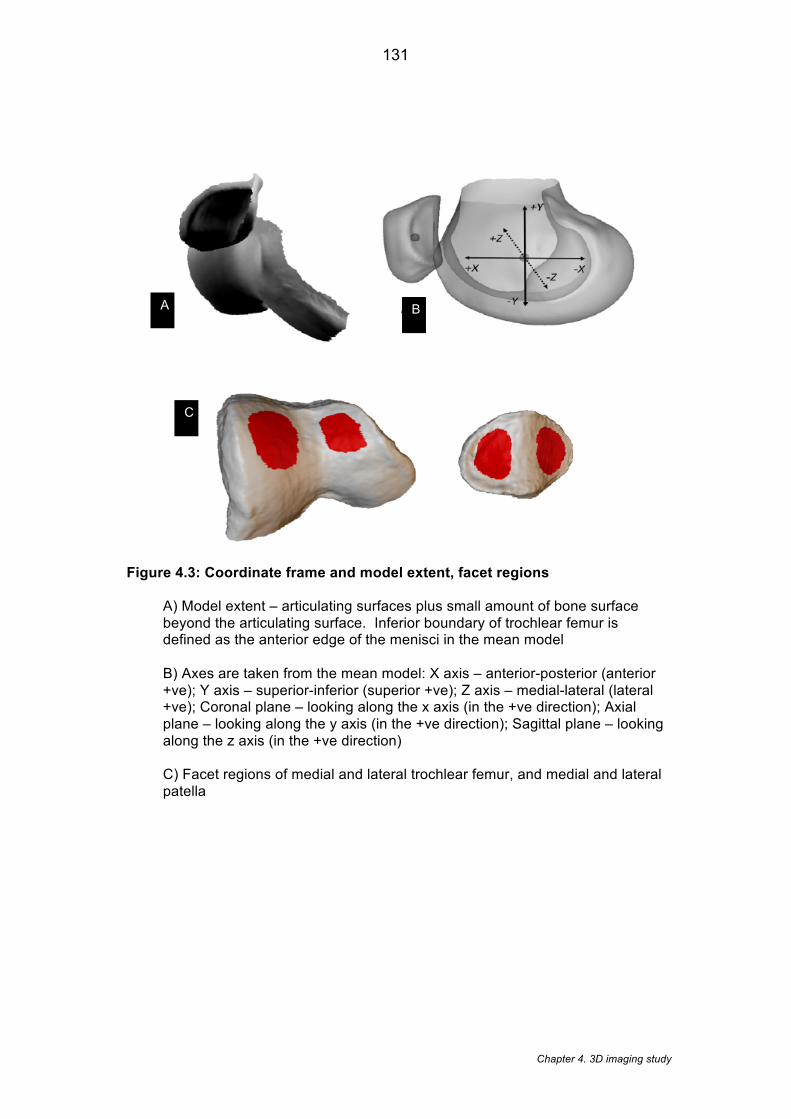
Chapter 4. 3D imaging study
131
Figure 4.3: Coordinate frame and model extent, facet regions A) Model extent – articulating surfaces plus small amount of bone surface beyond the articulating surface. Inferior boundary of trochlear femur is defined as the anterior edge of the menisci in the mean model B) Axes are taken from the mean model: X axis – anterior-posterior (anterior +ve); Y axis – superior-inferior (superior +ve); Z axis – medial-lateral (lateral +ve); Coronal plane – looking along the x axis (in the +ve direction); Axial plane – looking along the y axis (in the +ve direction); Sagittal plane – looking along the z axis (in the +ve direction) C) Facet regions of medial and lateral trochlear femur, and medial and lateral patella
A B
C
Chapter 4. 3D imaging study
132
The patella sub-region was defined as the subchondral area of the patella, together
with a ‘halo’ of approximately 10mm around the subchondral plate. The femoral sub-
region was defined as the trochlear subchondral region of the femur, using the
anterior edge of the menisci as the boundary of this region, plus a similar halo
around the region. These two regions were combined into a single shape model,
describing 95% of the variance in the shape, and the principal components for each
individual PFJ surface were recorded.
4.3.6 Variables
We evaluated whether there were between-group differences in terms of the
following thirteen 3D imaging features: patella medial-lateral position (mm), patella
inferior-superior position (mm), patella anterior-posterior position (mm), medial
patella facet area (mm2), lateral patella facet area (mm2), medial to lateral patella
facet area (ratio), sulcus angle (°) [461], congruence angle (°) [461], medial trochlear
inclination (°) [406], lateral trochlear inclination (°) [406], patella medial-lateral tilt (°),
patella rotational alignment (°) and patellofemoral contact area (ratio). These 3D
imaging features were converted from a range of standard MRI features derived from
the systematic review in Chapter 3.
An outline of the methods used to assess the imaging features, using the surfaces
shown in Figure 4.3 are shown in Table 4.2. All PFJ surfaces were rigidly aligned
with the mean shape, using a least squares fitting method, which fitted only the femur
region. The x, y and z-axes were defined as anterior-posterior, superior-inferior and
medial-lateral respectively (coordinate frame Figure 4.3). The geometrical centre of
gravity (COG) was calculated for patella and femur surfaces of each knee separately.
To determine the translation of the patella relative to the femur position, differences
between the patella and femoral COGs were calculated along the x, y and z-axes.
Angles between the medial and lateral facets of the patella and femur were
calculated as follows: correspondence points within the facets were identified in the
model as previously described (Figure 4.3) [445], and these masks were used to
consistently identify these facets in each knee. For each knee bone surface, a plane
was fitted to each of the medial patella, lateral patella, medial trochlea and lateral
Chapter 4. 3D imaging study
133
trochlea facets, and the angle calculated between the pairs of planes projected onto
the x, y and z-axes.
Patella contact area was defined as the area of patella surface, which intersects with
vectors normal to the trochlear femur at each correspondence point (based on the
mean model Figure 4.3), and expressed as a ratio of the total patella surface area.
The sulcus angle, congruence angle and both the medial and lateral trochlear
inclination angles were measured using planes established in the mean model
(Table 4.2). The relationship between the area of the medial and lateral facets was
expressed as a ratio (MP: LP ratio). Patella tilt and rotational alignment was
established by rigidly aligning each individual patella with the mean patella, and
recording the rotation from the mean patella. For the direction of patella tilt and
rotational alignment see Table 1.
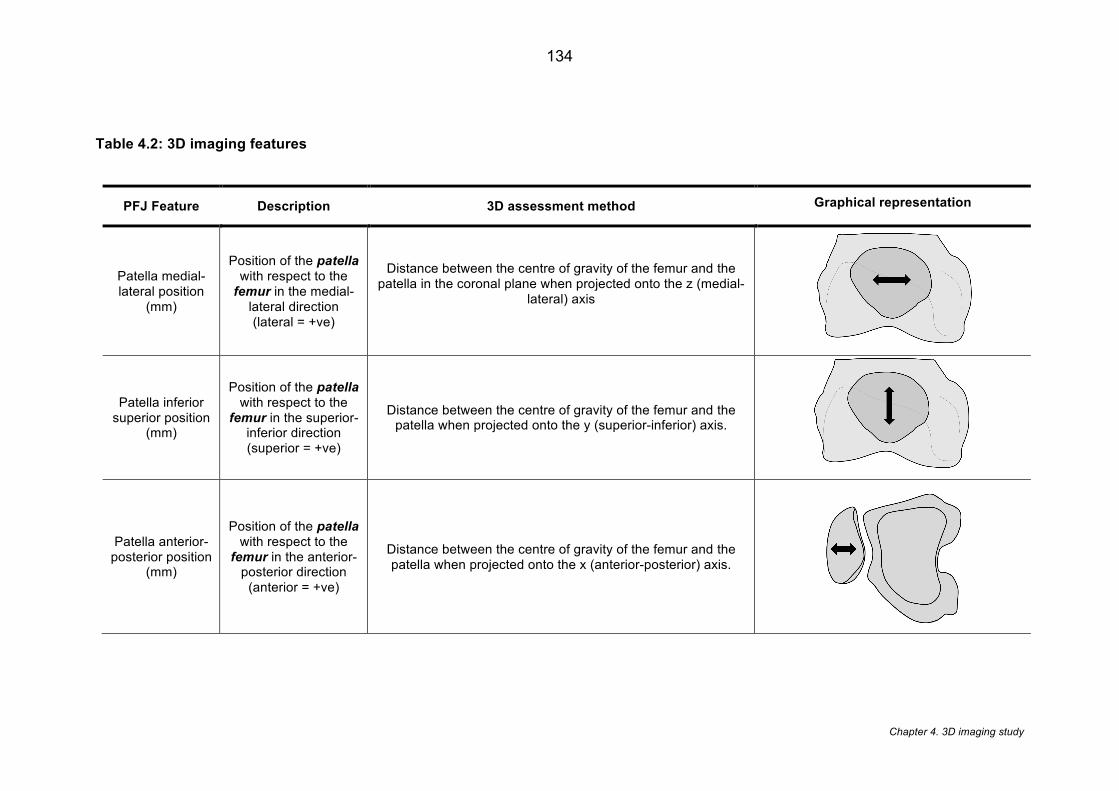
Chapter 4. 3D imaging study
134
Table 4.2: 3D imaging features
PFJ Feature Description 3D assessment method Graphical representation
Patella medial-lateral position
(mm)
Position of the patella with respect to the femur in the medial-
lateral direction (lateral = +ve)
Distance between the centre of gravity of the femur and the patella in the coronal plane when projected onto the z (medial-
lateral) axis
Patella inferior superior position
(mm)
Position of the patella with respect to the
femur in the superior-inferior direction (superior = +ve)
Distance between the centre of gravity of the femur and the patella when projected onto the y (superior-inferior) axis.
Patella anterior-posterior position
(mm)
Position of the patella with respect to the femur in the anterior-
posterior direction (anterior = +ve)
Distance between the centre of gravity of the femur and the patella when projected onto the x (anterior-posterior) axis.
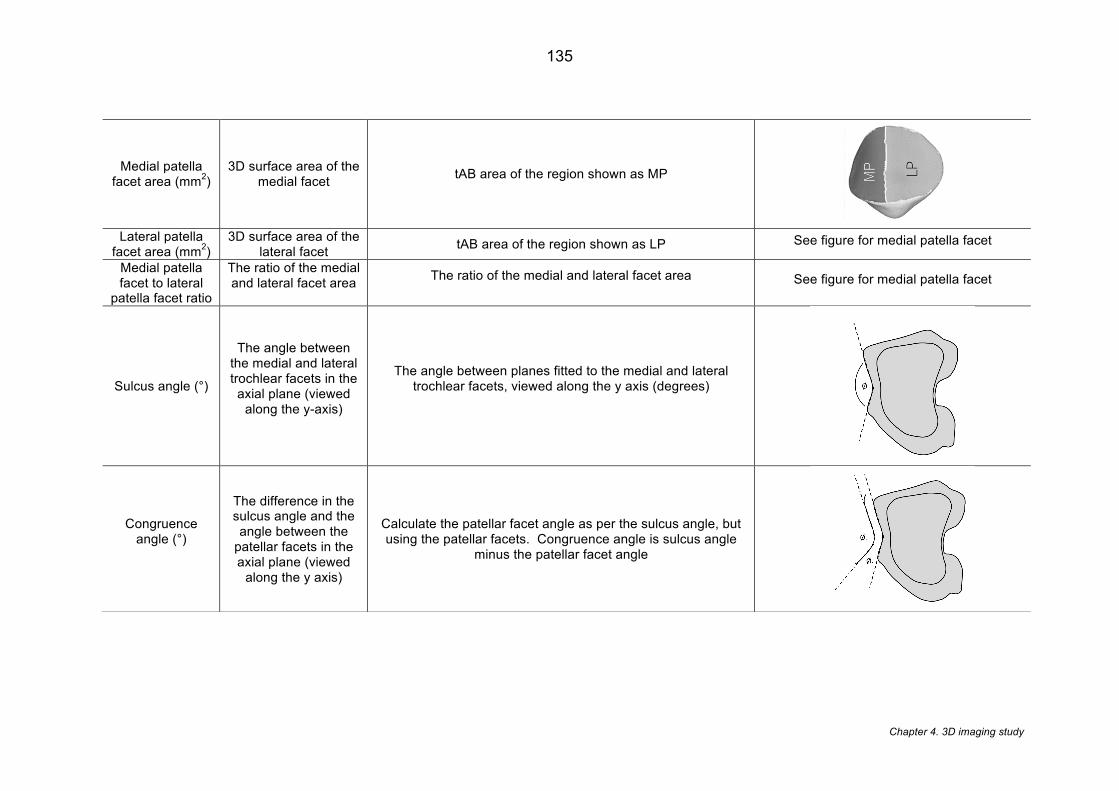
Chapter 4. 3D imaging study
135
Medial patella facet area (mm2)
3D surface area of the medial facet tAB area of the region shown as MP
Lateral patella
facet area (mm2) 3D surface area of the
lateral facet tAB area of the region shown as LP See figure for medial patella facet
Medial patella facet to lateral
patella facet ratio
The ratio of the medial and lateral facet area
The ratio of the medial and lateral facet area
See figure for medial patella facet
Sulcus angle (°)
The angle between the medial and lateral trochlear facets in the axial plane (viewed
along the y-axis)
The angle between planes fitted to the medial and lateral trochlear facets, viewed along the y axis (degrees)
Congruence angle (°)
The difference in the sulcus angle and the angle between the
patellar facets in the axial plane (viewed
along the y axis)
Calculate the patellar facet angle as per the sulcus angle, but using the patellar facets. Congruence angle is sulcus angle
minus the patellar facet angle
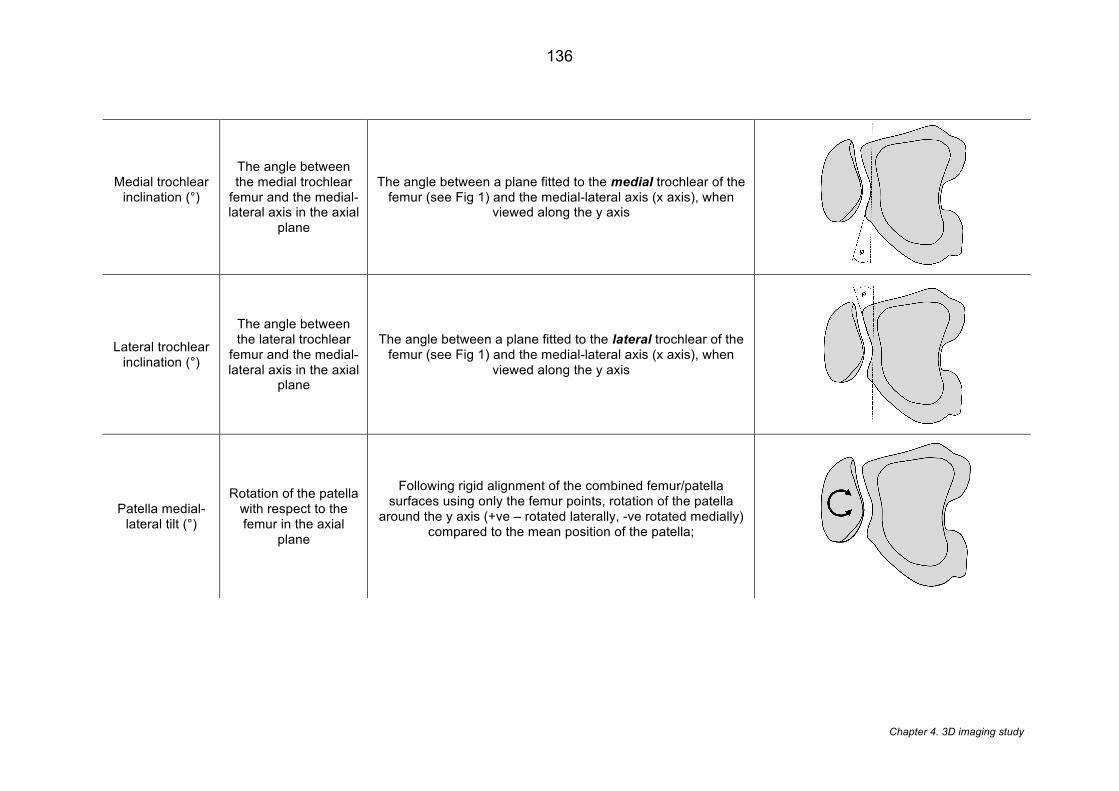
Chapter 4. 3D imaging study
136
Medial trochlear inclination (°)
The angle between the medial trochlear
femur and the medial-lateral axis in the axial
plane
The angle between a plane fitted to the medial trochlear of the femur (see Fig 1) and the medial-lateral axis (x axis), when
viewed along the y axis
Lateral trochlear inclination (°)
The angle between the lateral trochlear
femur and the medial-lateral axis in the axial
plane
The angle between a plane fitted to the lateral trochlear of the femur (see Fig 1) and the medial-lateral axis (x axis), when
viewed along the y axis
Patella medial-lateral tilt (°)
Rotation of the patella with respect to the femur in the axial
plane
Following rigid alignment of the combined femur/patella surfaces using only the femur points, rotation of the patella
around the y axis (+ve – rotated laterally, -ve rotated medially) compared to the mean position of the patella;
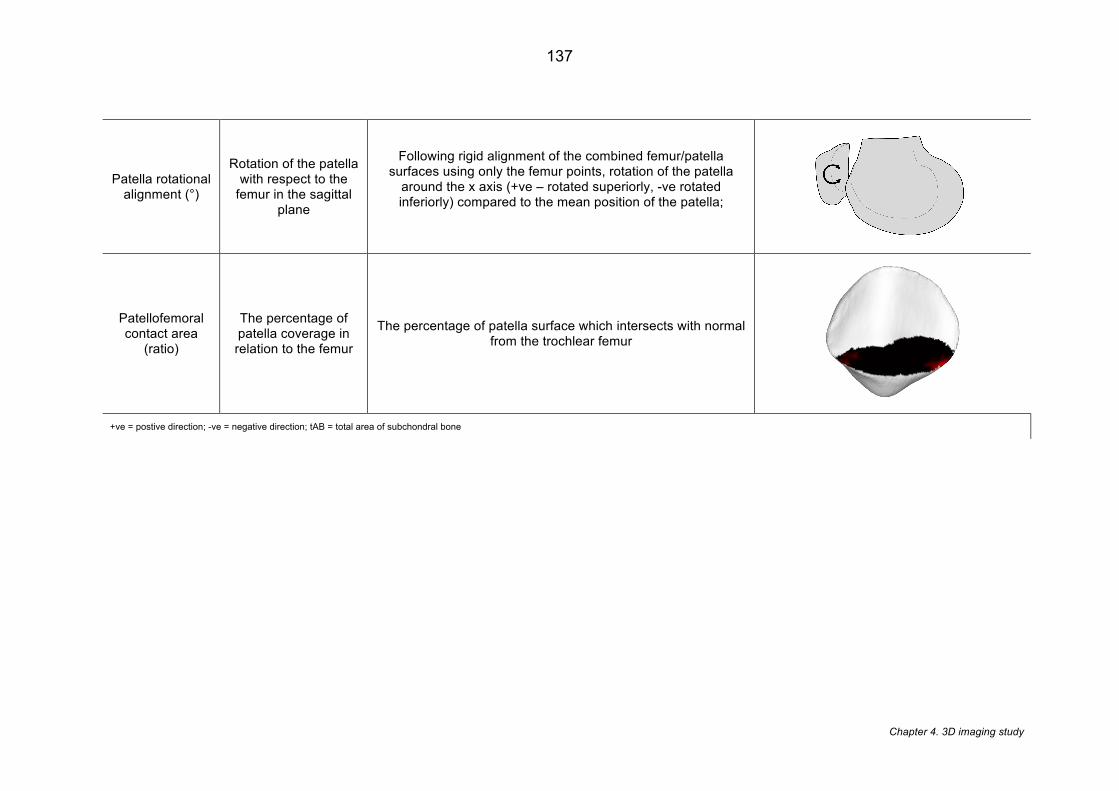
Chapter 4. 3D imaging study
137
Patella rotational alignment (°)
Rotation of the patella with respect to the
femur in the sagittal plane
Following rigid alignment of the combined femur/patella surfaces using only the femur points, rotation of the patella
around the x axis (+ve – rotated superiorly, -ve rotated inferiorly) compared to the mean position of the patella;
Patellofemoral contact area
(ratio)
The percentage of patella coverage in relation to the femur
The percentage of patella surface which intersects with normal from the trochlear femur
+ve = postive direction; -ve = negative direction; tAB = total area of subchondral bone
Chapter 4. 3D imaging study
138
4.4 Statistical analysis
Statistical analysis was carried out in SPSS software, version 21.0 (Armonk, NY: IBM
Corp). Descriptive statistics were used to describe the main characteristics of the
study population and were presented as mean (SD) where appropriate for
continuous variables, and frequency and percentages for categorical variables. For
simple comparison between groups, independent sample t-tests were used to
compare the mean differences for all the thirteen 3D imaging features. Graphical
exploration of the data was performed to ensure that assumptions of normality were
valid prior to performing the t-tests.
4.4.1 Multiple testing
Repeated statistical testing leads to multiple testing and thus increases the chances
of a type 1 error [462]. As a rule, adjusting the significance level is recommended
and commonly a Bonferroni correction is applied, however, there are situations when
the Bonferroni is too conservative [463]. Armstrong (2014) [463] suggests that
Bonferroni corrections are not indicated when multiple t-tests are applied and the
individual tests are important. This could be considered the case with this chapter. In
contrast, they also suggest Bonferroni should be applied when a large number of
tests are carried out without a pre-planned hypotheses in an attempt to find any
results that are significant [463]. Although a clear aim was stated (see 4.2), no
specific features were hypothesised and thirteen different features were investigated.
A decision was made to apply a Bonferroni correction to minimise the effect of an
experiment wise error and the level of significance set at α = 0.004 (0.05/13).
4.4.2 Controlling for confounders
Gender has been highlighted as an important confounder in PFJ structure [12]. There
are number of data-analytical techniques that can be applied to control for
confounders. These can be broadly classified into: non-model based techniques
(stratification and matching) and model based techniques (regressional analyses)
4.4.2.1.1 Non-model based techniques
Chapter 4. 3D imaging study
139
Non-model based adjustment techniques are conducted without underlying model
assumptions. Stratification involves the dividing participants into categories based on
a confounding factor [464]. Matching involves the selection of patients with similar
values of a confounding factor in both groups [464]. The advantages and limitations
of the stratification and matching are typically similar [465]. The advantages of both
these methods is that they allow clear interpretation of the results and do not have to
comply to any model assumptions about the outcome and covariates [465]. The
major limitation is that multiple covariates are difficult to deal with leading to potential
empty strata or mismatches of cases during matching. Furthermore, in the context of
Chapter 3, both these approaches also reduce the available sample size. For
example, stratifying by gender reduces the size of the PFP group to 67 female and
48 males.
4.4.2.1.2 Model based techniques
Multivariable statistical techniques offer the ability to reduce bias by including a
number of covariate factors in order to adjust the effect. Multivariable techniques
have the advantage of optimising sample size and retaining the original sample. One
of the recognised drawbacks of adjustment through modelling occurs if there is a lack
of covariate overlap between groups that can lead to increased bias and variance
[466]. Matching provides warnings of this problem, whereas this is not highlighted
during multivariable modelling. In the context of Chapter 3, however, the gender
covariate is equally distributed across both groups thus the problem does not apply
in this scenario.
4.4.2.1.3 Preferred method for controlling for confounders
As only one covariate (gender) was considered for this analysis then stratification or
matching would appear to be viable approaches. However, as a result of the high
dimensionality of data in 3D shape there was a need to optimise the sample size as
much as possible. So, in order to retain the sample size, a decision was made to use
a gender-adjusted multivariable regression model.
4.4.3 Logistic regression models
Logistic regression models were used to identify whether any of the 3D imaging
features, or a combination of features, were associated with PFP. Firstly, univariable
Chapter 4. 3D imaging study
140
models were performed on all thirteen features to establish their individual
association with PFP. For the two ratio variables (medial patella facet area to lateral
patella facet and patellofemoral contact area) values were categorised based on the
median value into lower than median and higher than median. This was then
followed by multivariable models adjusted for gender.
4.4.3.1 Directed acyclic graph (DAGs)
To achieve parsimony and also mitigate the effects of collinearity, the relationship of
a selected number of 3D imaging features was considered for the multiple logistic
models. As recommended by Zuur et al. (2010) [467], biological knowledge and
clinical understanding was used for variable selection to ensure a pragmatic model.
The variable selection was based on the directed acyclic graph approach [468],
which has been employed in other studies [442] to allow appropriate model
specification. A DAG is graphical representation of causal effects and an approach
for understanding relationships of variables [468]. Effectively, the DAG aims to
identify the ancestor (a direct cause or indirect cause of a particular variable) and the
descendent (a direct effect or indirect effect of a particular variable). Figure 4.4 and
Figure 4.5 show a simplified version of the DAGs used for the trochlear variables
(medial trochlear inclination, lateral trochlear inclination, sulcus angle and
congruence angle) and cartilage variables (lateral patella facet area, medial patella
facet area, patellofemoral contact area and medial patella facet and lateral patella
facet ratio). In the scenario when an ancestor and descendant are identified then the
ancestor is retained and the descendant omitted [468].
This approach results in parsimonious models being chosen without the risk of over
adjustment; although causality was not explicitly assumed from our models. An
imaging feature was thus excluded from the model if one or more of the other
imaging features were required for its formation and thus highly correlated.
Accordingly, the medial patella facet to lateral patella facet ratio and patellofemoral
contact area were omitted, as they are derived using both the medial and lateral
patella facet area. The congruence angle and sulcus angle were omitted, as they are
both built from the medial and lateral trochlear inclination.
In addition to the DAG, a correlation matrix was computed to investigate the
dependence between the variables retained and to ratify my clinical decisions. Both

Chapter 4. 3D imaging study
141
lateral patella facet area and medial patella facet area (r=0.99) (Table 4.3) and
medial trochlear inclination and lateral trochlear inclination (r =-0.49) (Table 4.4)
demonstrate significant association, however, in the absence of any clinical hierarchy
for these variables neither could be removed based on clinical grounds. Based on
guidance from Field (2013) [469], as there are no statistical grounds for omitting one
variable over another then its suggested that the only solution is to acknowledge
these background interactions in the eventual model
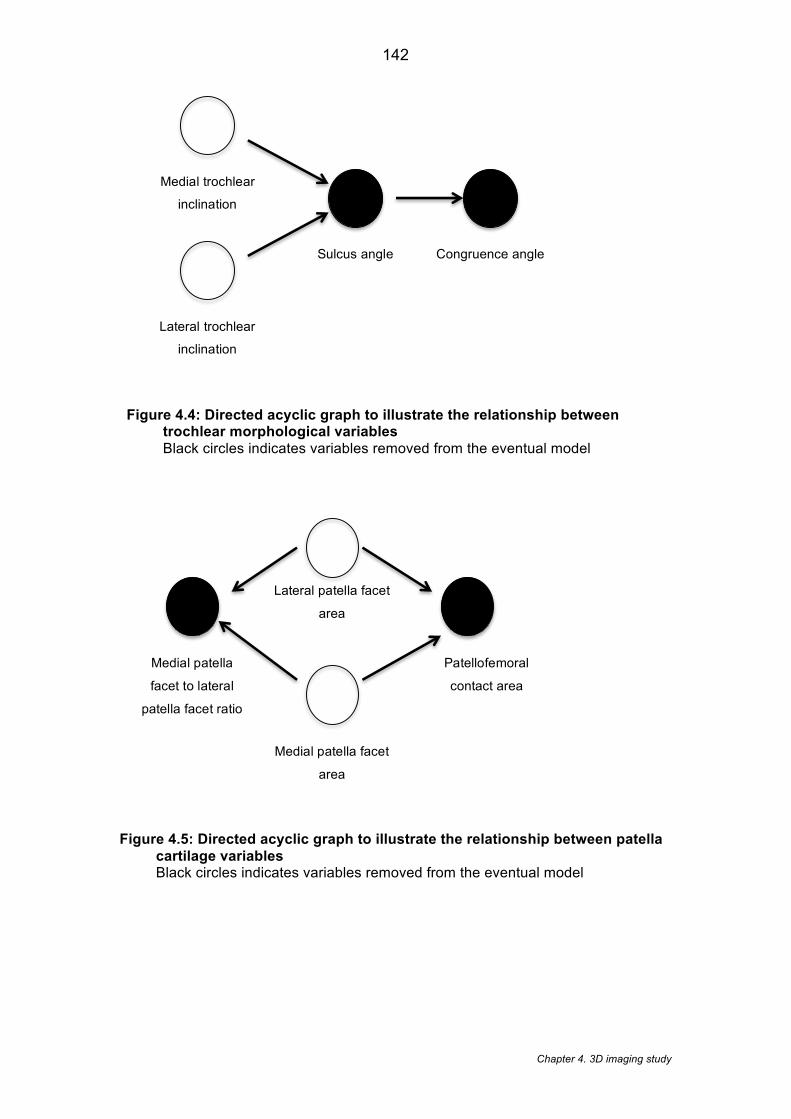
Chapter 4. 3D imaging study
142
Figure 4.4: Directed acyclic graph to illustrate the relationship between trochlear morphological variables Black circles indicates variables removed from the eventual model
Figure 4.5: Directed acyclic graph to illustrate the relationship between patella cartilage variables Black circles indicates variables removed from the eventual model
Medial trochlear
inclination
Sulcus angle
Congruence angle
Lateral trochlear
inclination
Lateral patella facet
area
Patellofemoral
contact area
Medial patella
facet to lateral
patella facet ratio
Medial patella facet
area
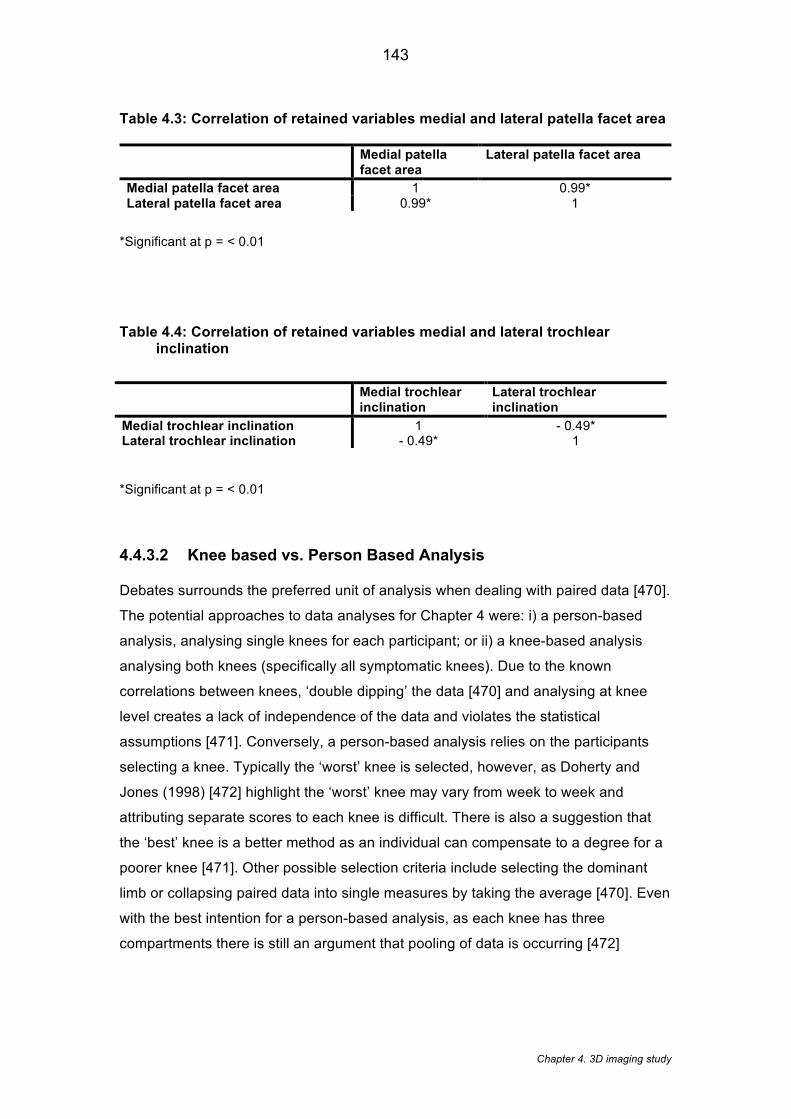
Chapter 4. 3D imaging study
143
Table 4.3: Correlation of retained variables medial and lateral patella facet area
Medial patella facet area
Lateral patella facet area
Medial patella facet area 1 0.99* Lateral patella facet area 0.99* 1
*Significant at p = < 0.01
Table 4.4: Correlation of retained variables medial and lateral trochlear inclination
*Significant at p = < 0.01
4.4.3.2 Knee based vs. Person Based Analysis
Debates surrounds the preferred unit of analysis when dealing with paired data [470].
The potential approaches to data analyses for Chapter 4 were: i) a person-based
analysis, analysing single knees for each participant; or ii) a knee-based analysis
analysing both knees (specifically all symptomatic knees). Due to the known
correlations between knees, ‘double dipping’ the data [470] and analysing at knee
level creates a lack of independence of the data and violates the statistical
assumptions [471]. Conversely, a person-based analysis relies on the participants
selecting a knee. Typically the ‘worst’ knee is selected, however, as Doherty and
Jones (1998) [472] highlight the ‘worst’ knee may vary from week to week and
attributing separate scores to each knee is difficult. There is also a suggestion that
the ‘best’ knee is a better method as an individual can compensate to a degree for a
poorer knee [471]. Other possible selection criteria include selecting the dominant
limb or collapsing paired data into single measures by taking the average [470]. Even
with the best intention for a person-based analysis, as each knee has three
compartments there is still an argument that pooling of data is occurring [472]
Medial trochlear inclination
Lateral trochlear inclination
Medial trochlear inclination 1 - 0.49* Lateral trochlear inclination - 0.49* 1
Chapter 4. 3D imaging study
144
If a knee-based analysis is used, the statistical plan needs to be evaluated in order to
conform to statistical assumptions. Possible solutions include spreading the analyses
and analysing each side separately, however, this has the effect of reducing
statistical power and makes results difficult to interpret especially if results are
different [471]. For Chapter 4, consideration was made to using both approaches.
Ancillary analysis of those participants within the PFP group with two knees, which
satisfied the inclusion criteria, showed only 19 additional knees. It was deemed that
these additional knees would have limited impact on the statistical power and thus
did not justify the introduction of the more advanced statistical techniques e.g.
generalised estimating equations (GEE). Furthermore, conceptually this chapter
investigates whether any of these 3D structural features predict pain. If the outcome
was solely structural progression this would justify a knee-based analysis [470],
however, as pain is multidimensional construct [473] then person based factors may
play a significant role. These reasons justify the use of a person-based analysis with
the ‘worst’ knee selected from highest pain score (WOMAC score) given during
stairs.
4.4.4 Linear discriminant analysis
Linear discriminant analysis (LDA) of 3D shape explored whether any overall 3D
shape or spatial position of the bones could discriminate between those with and
without PFP, irrespective of the pre-selected thirteen imaging features. Linear
Discriminant analysis (LDA) is indicated when evaluating the ability of variables to
linearly discriminate between any groupings. LDA has been used previously as a
statistical means of investigating gender recognition [474, 475]. The validity of this
approach was examined by assessing if the method could discriminate between men
and women, who are known to have different bone shapes [450]. Using the masks in
Figure 4.3, the bone surface of the trochlear femur, and the subchondral patellar
were extracted from each knee (533 knees). These corresponded points were used
to build a shape model of the isolated PF joint, which accounted for 98% of the
shape variance. This resulted in 40 principal components. Subsequently, individual
PF joints were represented as a series of principal components, which taken together
provide an accurate representation of the 3D shape of the two bones, and includes
the position and articulation of the femur and patella.
LDA of two groups expressed as 40 principal components is expected to find at least
one hyper-plane capable of separating out the groups (expressed as the distance
Chapter 4. 3D imaging study
145
between the two means of the groups projected onto the LDA hyperplane). A Monte
Carlo experiment was used to assess whether the separation achieved by LDA of the
groups was better than that expected by chance [476]. Monte Carlo experiments are
statistical analyses using random samples. The Monte Carlo experiment mimics the
important elements of the experiment and replicates these at random to solve a
deterministic problem [476]. Sawilowsky (2003) [476] identified that Monte Carlo
experiments could be used in applied statistics to: i) compare smaller samples under
realistic data conditions; ii) implementation of hypothesis testing that is more efficient
than permutation testing when there is too many possible data combinations. This
justifies the use of Monte Carlo in Chapter 4, as the sample is relatively small in
terms of the high level of dimensionality of the data and the stochastic nature of the
data correspondences. For 10,000 repeats, each knee was randomly assigned a
label in the same proportions as the dataset. A pseudo p-value is calculated from
the number of repeats, which provides a better segmentation than the actual
labelling.
4.5 Results
Based on our inclusion criteria we included 115 in the PFP group and 438 in the
control group. The mean age was 59.7 years (SD 8.78) for the PFP group and 63.6
years (SD 9.14) for the control group, with 58.2% and 52.9% women in the PFP and
control groups respectively. The mean BMI was 27.5kg/m2 (SD 5.29) for the PFP
group and 26.9 kg/m2 (SD 4.52) for the control group.
4.5.1 Primary aim
Overall group comparison showed no statistically significant differences between
people with and without PFP for any of the thirteen 3D imaging features (all p >
0.004) (Table 4.5). In addition, the sensitivity analysis similarly showed no statistically
significant differences for any of the 3D imaging features (results not shown).
Univariable models showed no association between the individual 3D imaging
features and PFP (Table 4.6). Results from the multivariable models revealed that
combining 3D imaging features also showed no significant association with PFP (p >
0.05) and all the odds ratios remain close to the value of 1 indicating a lack of
relationship to pain having adjusted for gender (Table 4.6).
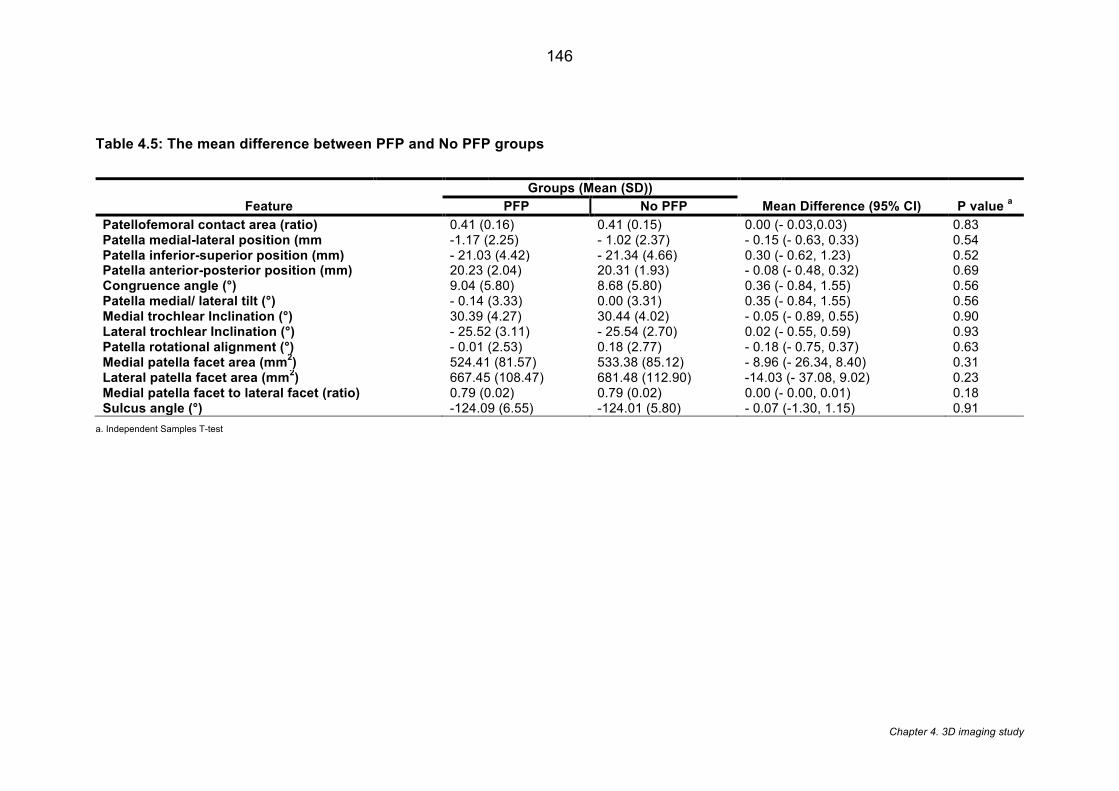
Chapter 4. 3D imaging study
146
Table 4.5: The mean difference between PFP and No PFP groups
Feature
Groups (Mean (SD))
Mean Difference (95% CI) P value a PFP No PFP
Patellofemoral contact area (ratio) 0.41 (0.16) 0.41 (0.15) 0.00 (- 0.03,0.03) 0.83 Patella medial-lateral position (mm -1.17 (2.25) - 1.02 (2.37) - 0.15 (- 0.63, 0.33) 0.54 Patella inferior-superior position (mm) - 21.03 (4.42) - 21.34 (4.66) 0.30 (- 0.62, 1.23) 0.52 Patella anterior-posterior position (mm) 20.23 (2.04) 20.31 (1.93) - 0.08 (- 0.48, 0.32) 0.69 Congruence angle (°) 9.04 (5.80) 8.68 (5.80) 0.36 (- 0.84, 1.55) 0.56 Patella medial/ lateral tilt (°) - 0.14 (3.33) 0.00 (3.31) 0.35 (- 0.84, 1.55) 0.56 Medial trochlear Inclination (°) 30.39 (4.27) 30.44 (4.02) - 0.05 (- 0.89, 0.55) 0.90 Lateral trochlear Inclination (°) - 25.52 (3.11) - 25.54 (2.70) 0.02 (- 0.55, 0.59) 0.93 Patella rotational alignment (°) - 0.01 (2.53) 0.18 (2.77) - 0.18 (- 0.75, 0.37) 0.63 Medial patella facet area (mm
2) 524.41 (81.57) 533.38 (85.12) - 8.96 (- 26.34, 8.40) 0.31
Lateral patella facet area (mm2) 667.45 (108.47) 681.48 (112.90) -14.03 (- 37.08, 9.02) 0.23
Medial patella facet to lateral facet (ratio) 0.79 (0.02) 0.79 (0.02) 0.00 (- 0.00, 0.01) 0.18 Sulcus angle (°) -124.09 (6.55) -124.01 (5.80) - 0.07 (-1.30, 1.15) 0.91
a. Independent Samples T-test
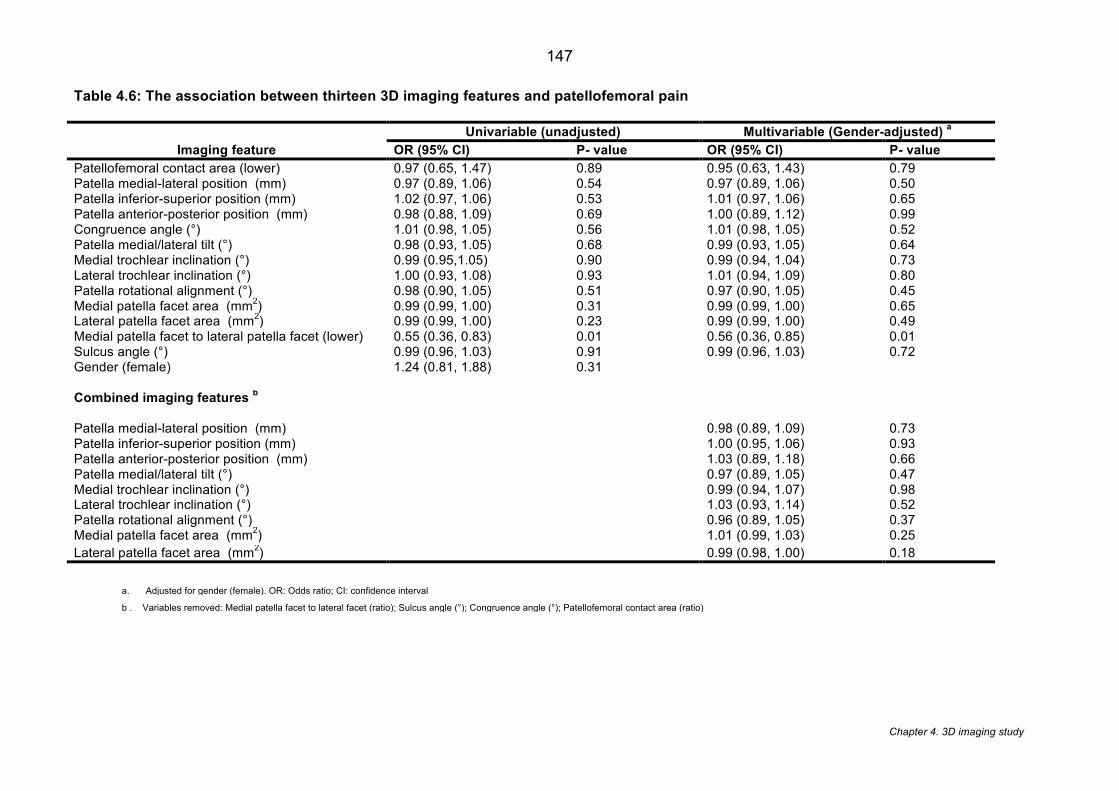
Chapter 4. 3D imaging study
147
Table 4.6: The association between thirteen 3D imaging features and patellofemoral pain
Imaging feature
Univariable (unadjusted) Multivariable (Gender-adjusted) a
OR (95% CI) P- value OR (95% CI) P- value
Patellofemoral contact area (lower) 0.97 (0.65, 1.47) 0.89 0.95 (0.63, 1.43) 0.79 Patella medial-lateral position (mm) 0.97 (0.89, 1.06) 0.54 0.97 (0.89, 1.06) 0.50 Patella inferior-superior position (mm) 1.02 (0.97, 1.06) 0.53 1.01 (0.97, 1.06) 0.65 Patella anterior-posterior position (mm) 0.98 (0.88, 1.09) 0.69 1.00 (0.89, 1.12) 0.99 Congruence angle (°) 1.01 (0.98, 1.05) 0.56 1.01 (0.98, 1.05) 0.52 Patella medial/lateral tilt (°) 0.98 (0.93, 1.05) 0.68 0.99 (0.93, 1.05) 0.64 Medial trochlear inclination (°) 0.99 (0.95,1.05) 0.90 0.99 (0.94, 1.04) 0.73 Lateral trochlear inclination (°) 1.00 (0.93, 1.08) 0.93 1.01 (0.94, 1.09) 0.80 Patella rotational alignment (°) 0.98 (0.90, 1.05) 0.51 0.97 (0.90, 1.05) 0.45 Medial patella facet area (mm2) 0.99 (0.99, 1.00) 0.31 0.99 (0.99, 1.00) 0.65 Lateral patella facet area (mm2) 0.99 (0.99, 1.00) 0.23 0.99 (0.99, 1.00) 0.49 Medial patella facet to lateral patella facet (lower) 0.55 (0.36, 0.83) 0.01 0.56 (0.36, 0.85) 0.01 Sulcus angle (°) 0.99 (0.96, 1.03) 0.91 0.99 (0.96, 1.03) 0.72 Gender (female) 1.24 (0.81, 1.88) 0.31
Combined imaging features b
Patella medial-lateral position (mm) 0.98 (0.89, 1.09) 0.73 Patella inferior-superior position (mm) 1.00 (0.95, 1.06) 0.93 Patella anterior-posterior position (mm) 1.03 (0.89, 1.18) 0.66 Patella medial/lateral tilt (°) 0.97 (0.89, 1.05) 0.47 Medial trochlear inclination (°) 0.99 (0.94, 1.07) 0.98 Lateral trochlear inclination (°) 1.03 (0.93, 1.14) 0.52 Patella rotational alignment (°) 0.96 (0.89, 1.05) 0.37 Medial patella facet area (mm2) 1.01 (0.99, 1.03) 0.25 Lateral patella facet area (mm2) 0.99 (0.98, 1.00) 0.18
a. Adjusted for gender (female). OR: Odds ratio; CI: confidence interval
b . Variables removed: Medial patella facet to lateral facet (ratio); Sulcus angle (°); Congruence angle (°); Patellofemoral contact area (ratio)
Chapter 4. 3D imaging study
148
4.5.2 Secondary aim
The results of the LDA showed that the overall 3D shape was unable to significantly
discriminate between groups with and without PFP showing a classification of 55.5%.
The pseudo p-value from the Monte Carlo experiment was p=0.79, indicating that the
PFP/without PFP labeling separated out the groups no better than random chance.
In contrast, the overall 3D shape was able to significantly discriminate between men
and women with a classification of 90.6%. The pseudo p-value from the Monte Carlo
experiment was (p < 0.0001), indicating that it is unlikely that there is any labeling
that separates the groups out better than gender. An orthogonal projection of the
gender differences is shown in Figure 4.6.
4.5.3 Assessing the accuracy of the model
The accuracy of the model was conducted using root mean squared (RMS) error.
RMS is calculated by firstly obtaining the total squared error expressed as the sum of
the individual squared errors. The total squared error is then divided by the sample
size and then the square root of this mean square error forms the RMS [477]. The
advantaged of the RMS is that it is expressed in the units of interest thus improving
the interpretation of the error [477]. RMS mean point-surface accuracy of the femur
and patella AAMs was 0.12mm, 95th percentile 0.38mm. The voxel sizes were 0.36 x
0.36 x 0.7mm in size. This demonstrates that the model is accurate at almost all
points to within one pixel on the MRI image.
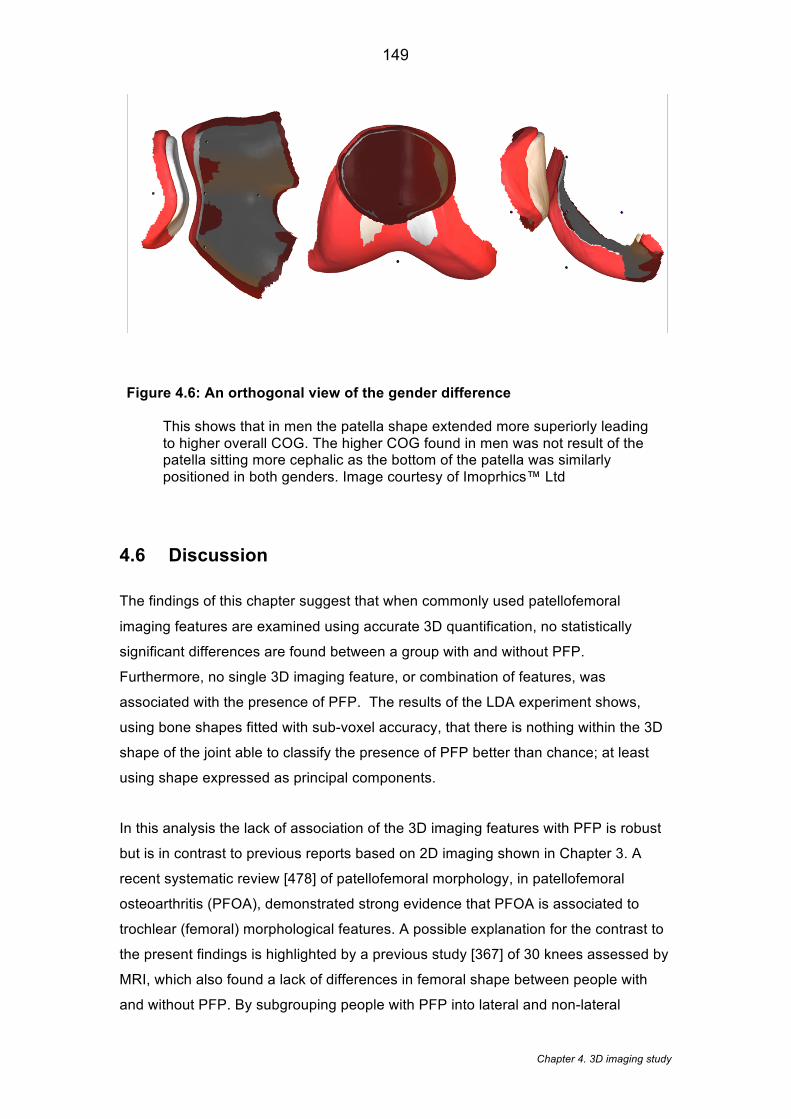
Chapter 4. 3D imaging study
149
Figure 4.6: An orthogonal view of the gender difference This shows that in men the patella shape extended more superiorly leading to higher overall COG. The higher COG found in men was not result of the patella sitting more cephalic as the bottom of the patella was similarly positioned in both genders. Image courtesy of Imoprhics™ Ltd
4.6 Discussion
The findings of this chapter suggest that when commonly used patellofemoral
imaging features are examined using accurate 3D quantification, no statistically
significant differences are found between a group with and without PFP.
Furthermore, no single 3D imaging feature, or combination of features, was
associated with the presence of PFP. The results of the LDA experiment shows,
using bone shapes fitted with sub-voxel accuracy, that there is nothing within the 3D
shape of the joint able to classify the presence of PFP better than chance; at least
using shape expressed as principal components.
In this analysis the lack of association of the 3D imaging features with PFP is robust
but is in contrast to previous reports based on 2D imaging shown in Chapter 3. A
recent systematic review [478] of patellofemoral morphology, in patellofemoral
osteoarthritis (PFOA), demonstrated strong evidence that PFOA is associated to
trochlear (femoral) morphological features. A possible explanation for the contrast to
the present findings is highlighted by a previous study [367] of 30 knees assessed by
MRI, which also found a lack of differences in femoral shape between people with
and without PFP. By subgrouping people with PFP into lateral and non-lateral
Chapter 4. 3D imaging study
150
maltracking groups, Harbaugh et al. (2010) [367] found that these subgroups lie on
opposite sides of the healthy average, suggesting that underlying subgroups may be
masking the differences between people with and without PFP[367]. A lack of
established thresholds to define PFJ imaging feature subgroups did not allow this to
be verified in the current chapter but strengthens the case for subgrouping as
addressed in Chapter 5.
These findings further contrast with a MRI study of 240 knees [479], which showed
that a medially inclined patella (similar to medial patella tilt in this analysis) was
associated with less pain. This disparity may be because the assessments were
performed on a single MR slice at the mid-point of the patella in the sagittal plane,
and as noted previously, these methods may be open to measurement error by not
controlling for relative limb position and orientation. Shibanuma et al. (2005) [441]
showed that alterations in limb position led to statistically significant differences in the
PFJ features recorded for both men and women. Patella alignment values including
medial-lateral position and tilt have been shown to be influenced by the relative tibial
and femoral rotation and varus angulation [440]; whilst single slices along one plane
are known to misrepresent the true anatomy of the PFJ [480] ( see Figure 4.1).
The PFJ imaging features used to inform the development of the 3D features in the
current chapter have been published previously [164, 170, 406, 479]. Our findings
are comparable to a previous study that analysed trochlear morphology in 881
middle-aged knees using MRI [481]. Stefanik et al. (2012) [481] reported similar
values for sulcus, lateral trochlear inclination and medial inclination angles of 130.9°,
25° and 24.4° respectively, though the novel assessment methods used here
preclude direct comparison with Stefanik et al. (2012) [481]. This is because, in
contrast to traditional methods, the geometrical centre of gravity was used here as a
more representative reference point for 3D shape (see Section 4.3.4.1). The use of
statistical shape models has also been applied previously in the PFJ [447], however,
this is the first time these methods have been employed on a large, symptomatic
group with a comprehensive range of traditional features converted into their 3D
equivalents.
Gender is widely considered to influence PFJ imaging features [449-451]. Validation
of these new 3D imaging features was achieved by using the shape data from the 3D
imaging features, coded as principal components, showing that gender was
classified at a 90% level of accuracy. This is similar to the classification of 93.5% in
Chapter 4. 3D imaging study
151
sex determination using 3D computed tomography features of the patella in vitro
[450]. Our model expands on this work by applying 3D MR imaging features from
both the patella and femoral trochlea in vivo. Given that there are significant
differences by gender for PFJ imaging features, it seems likely that previous studies
have been affected by a mix of genders within their sample. Subsequent review of
Chapter 3 (systematic review) showed that, of studies including mixed gender
cohorts, 80% failed to report women and men separately. Therefore previous studies
may simply have been describing differences related to their gender mix. As a result,
it is recommended that future studies follow the lead of recent studies [294] by
reporting gender separately or conducting single gender analyses.
4.6.1 Limitations
This chapter presents with a number of limitations with regards to the sample and
methodology
Sample. This analysis was conducted on a sample older than a typical PFP patient
and thus caution is advised when extrapolating these findings to a younger
population. Furthermore, all selected patients had KL grade 0 within the tibiofemoral
joint but there were no lateral or skyline x-rays available to view the PFJ
radiographically. Without lateral or skyline x-ray we cannot assert that all participants
were without radiographic PFOA, however previous studies have suggested that in
the absence of OA in the tibiofemoral joint, approximately 75% of this age cohort will
have no other compartmental OA [380, 482]. Despite being a large sample size
compared to previous literature, the sample size is probably still small considering
the high dimensionality of the data, which may have limited the power of the
analyses to detect differences.
Methodology. The features were based on MRI images taken in non-weight bearing
with no knee flexion. As highlighted in Chapter 3, weight bearing and knee flexion are
known to influence the features observed [12, 378] and may have impacted on the
overall findings. In this chapter, PFP was determined at a single time point (24
months) and pain based on dichotomised value (pain/no pain) rather than a graded
severity scale. It is possible that a relationship between imaging and pain is more
likely when the pain outcome is more sensitive with a greater number of grading
levels [395]. Our analysis included a range of quantitative 3D measures, together
with an examination of the principal components from the associated shape model.
Chapter 4. 3D imaging study
152
The use of principal component analysis for one of the measures may have resulted
in the loss of some 3D information, and it is possible that other advance methods of
shape analysis and machine learning could reveal a relationship that our methods
cannot.
4.7 Conclusion
The analysis within this chapter shows using 3D quantitative analysis that no
statistically significant differences were found between people with and without PFP.
These 3D findings are in contrast to the current perception, which has relied on
studies using what are effectively 2D measurements applied with a lack of consistent
joint positioning. Analyses of the overall 3D shape in relation to gender validates
these novel 3D measures and also suggests that future PFP cohort analyses should
be stratified for gender. Further work is needed to assess whether 3D quantitative
analysis can discriminate shape differences related to PFP in a younger population,
more representative of the real-world PFP population.
Chapter 5. PFP subgrouping
153
Chapter 5 - The development of data-driven diagnostic
subgroups for people with patellofemoral pain using
modifiable clinical, biomechanical and imaging features
This chapter describes a longitudinal cohort study with a cross-sectional analysis
which identifies subgroups within a PFP cohort using clinical, biomechanical and
imaging features. By following up participants at 12-months, the chapter also
describes the prognosis of these subgroups.
5.1 Introduction
As highlighted in Chapter 2, unfavourable outcomes for patients with PFP have been
attributed to the belief that subgroups within the PFP population respond differently
to treatment [20]. However, a paucity of evidence currently exists for subgrouping
and subsequent stratification of care.
Recommendations for subgrouping research suggests that prior to testing the effect
of subgrouping, a hypothesis-setting stage is required which attempts to identify
clinically important subgroups and explore the prognostic effect attributed to
subgroup membership [363] (Figure 5.1). Data-driven diagnostic subgroups are
advantageous as they can later be studied against a range of treatments [364, 483]
rather than groups being based on the response to only one treatment (i.e. treatment
effect modifiers). Diagnostic PFP subgroups have been suggested by a number of
studies based on single factors [180, 230, 243, 367]. However, only a few studies
[254, 366, 374] have identified diagnostic subgroups comprising of multiple factors
from multiple domains. Of these studies, only Selfe et al. (2016) [254] derived
subgroups from rigorous statistical methods. The three diagnostic subgroups they
identified are of high clinical utility, requiring only six simple clinical tests. However,
these subgroups are unable to incorporate PFJ structure [180, 230] and
biomechanics, testing of which requires complex equipment and evaluation [243,
484]. Overall, the prognostic value of these subgroups remains unknown [485].
Chapter 5. PFP subgrouping
154
5.2 Aims
The primary aim of this chapter was to combine modifiable clinical, biomechanical
and imaging features to identify data-driven diagnostic subgroups within a PFP
cohort. Based on data from a 12-month follow-up, the secondary aim was to explore
the prognosis of these data driven subgroups.
5.3 Methods
5.3.1 Study design
This longitudinal cohort study comprised of a cross-sectional analysis and a 12-
month follow-up. Figure 5.1 shows the conceptual stages of research into
subgrouping [363] in which the stages considered in Chapter 5 are highlighted in
grey. This chapter will consider the hypothesis setting stage whereby the aim to is
identify clinical important subgroups from a range of characteristics and generate a
hypotheses in terms of prognostic factors [362]. Ethical approval was obtained
(14/NE/1131) and all participants completed written informed consent prior to
entering the study.
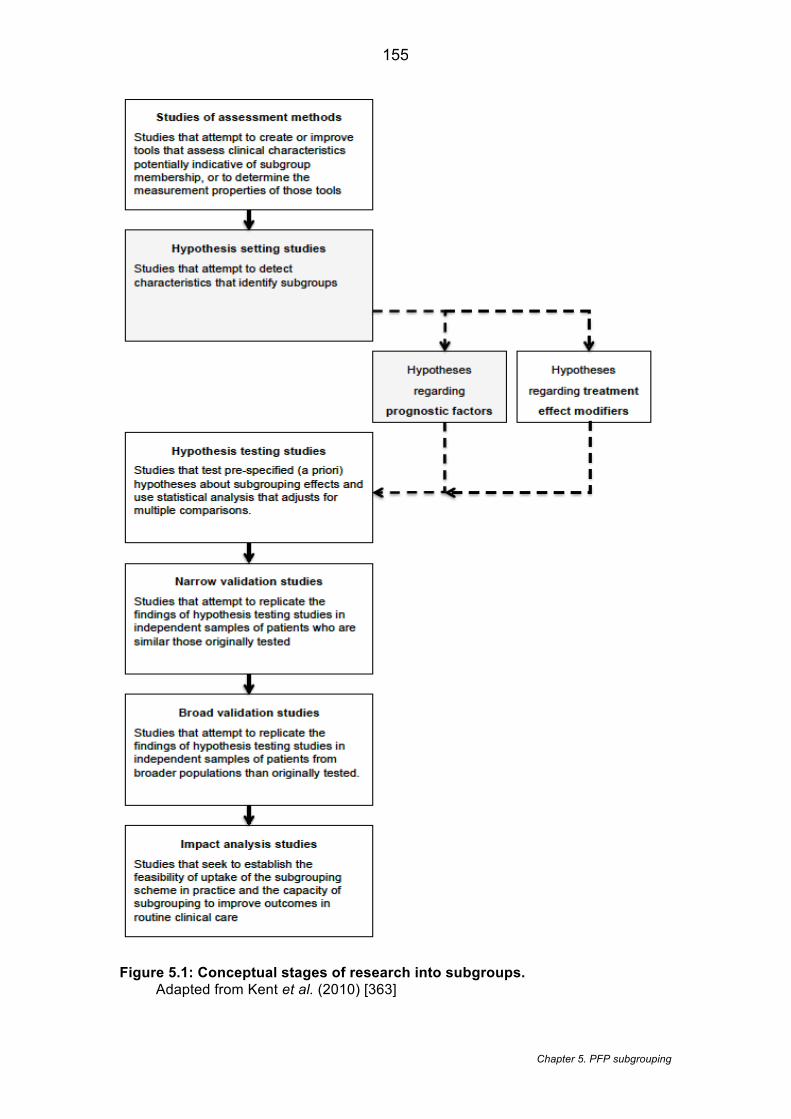
Chapter 5. PFP subgrouping
155
Figure 5.1: Conceptual stages of research into subgroups. Adapted from Kent et al. (2010) [363]
Chapter 5. PFP subgrouping
156
5.3.2 Selection of the sample size
The sample size was based on the recommended rule of thumb for cluster analyses
of n =2k (whereby k is the number of variables) [486]. For our model, variables were
analysed within selected health domains: strength impairment, flexibility impairment,
movement impairment and structural impairment. We allowed at most 6 variables (k),
representing the selected domains and thus requiring a minimum of 64 participants
(26). To account for a potential 20% drop-out rate, we aimed to recruit 77
participants. This chapter was reported in accordance with the Strengthening the
Reporting of Observational studies in Epidemiology (STROBE) guidelines [453].
5.3.3 Setting
All assessments were conducted at a UK teaching hospital from November 2014 to
April 2016. Participants from the general population were recruited from a local
National Health Service (NHS) musculoskeletal service via clinician referral, posters
in local sports clubs and university alumni. Further electronic searches of the local
NHS musculoskeletal database were also made for patients previously diagnosed
with either ‘anterior knee pain’ or ‘patellofemoral pain’.
5.3.4 Participants
Participant eligibility was based on: i) being aged 18-40 years; ii) with an insidious
onset of anterior or retropatellar knee pain; and iii) pain on two or more of the
following activities: prolonged sitting, kneeling, squatting, running, patellar palpation,
hopping, stair walking, stepping down or isometric quadriceps contraction [115].
Participants were excluded if: i) clinical examination showed another cause of knee
pain such as, but not restricted to: meniscal pathologies, quadriceps tendon injuries,
patella tendinopathy, tibial tubercle apophysitis; bursitis; ii) any history of significant
knee surgery; iii) any competing pathology identified on the MRI report [127]; iv) any
contraindication to MRI ; and v) any physiotherapy or podiatric treatment within the
last three months. Previously published recommendations made by Cook et al.
(2010) [127] were applied using available MRI reports. The MRI results were not
used to confirm PFP but to exclude participants with competing diagnoses.
Competing diagnoses included, the same conditions considered during clinical
examination, such as patella tendinopathy, meniscal tears etc. Despite the
recognised debate around the association between symptoms and imaging features,
Chapter 5. PFP subgrouping
157
the use of this an extra layer of eligibility criteria was seen to improve the likelihood of
a more accurate diagnosis of PFP [127].
5.3.5 Variables
In order to select appropriate, clinically relevant variables for analysis, consideration
was made to using directed acrylic graphs (DAGs) [487], as used in Chapter 4.
However, for the DAG to be constructed it relies on the identification of an outcome
variable (Y) e.g. relationship X on Y [468]. During this cross-sectional analysis, no
outcome variable is present with all variables considered exclusive.
To capture the multifactorial nature of PFP; a range of features were considered to
inform the diagnostic subgrouping. Variables were derived from systematic reviews
which identified features associated with PFP [194, 378, 488] and from analyses
conducted for this thesis (see 5.3.6) informed from Chapter 2 (literature review).
Variables were selected if they satisfied all the following criteria:
i) supported association with PFP from at least two or more studies;
ii) published thresholds and/or normative data that can be used to clinically
interpret findings;
iii) considered clinically modifiable with conservative treatment.
5.3.6 Justification for selected variables
The justification for the variables selected for the cluster analyses is presented
below. Forest plots were created to support the interpretation and to justify the
selection of variables using published guidance [489]. Variables are presented within
local (e.g. knee), distal (e.g. ankle) and proximal (e.g. hip) regions as applied
previously [14].
5.3.6.1 Local variables
5.3.6.1.1 Local clinical features
Patella mobility was considered for inclusion as this was one of the clinical test
utilised by Selfe et al. (2016) [254]. Figure 5.2 shows that neither the pooled
estimates of patella lateral (MD -0.03 [-0.94, 0.88]; Z = 0.07; p= 0.94) (Figure 5.2a),
patella medial (MD 0.22 [-0.76, 1.21]; Z = 0.44; p= 0.66) (Figure 5.2b) or total patella
mobility (MD -0.15 [-1.26, 0.97]; Z = 0.26; p = 0.79) (Figure 5.2c) showed an
Chapter 5. PFP subgrouping
158
association with PFP. Based on our selection criteria this was not included but total
patella mobility was collected and reported descriptively across the subsequent
subgroups.
5.3.6.1.2 Local biomechanical features
Peak knee flexion angle was included despite a number of single studies showing no
significant difference between PFP and controls. Figure 5.2d shows a meta-analysis
of five studies measuring peak knee flexion angle. The inclusion was justified
because when data is pooled, due to Crossley et al. (2004) [236] contributing a
relatively larger sample size and 32.7% weight of the overall pooled sample, it shows
that reduced peak knee flexion angle is significantly associated to PFP (MD -0.35 [-
0.67, -0.03]; Z = 2.14; p = 0.03).The selection of knee extensor strength is supported
by the meta-analysis by Lankhorst et al. (2013) [194] (MD -37.47 [-71.75, -3.20]; Z
=2.14; p=0.03).
5.3.6.1.3 Local imaging features
The meta-analyses in Table 3.7 support the inclusion of MRI bisect offset and MRI
patella tilt. Despite the findings in Table 3.7, MRI patellofemoral contact area has no
published thresholds and limited normative data to allow interpretation of clusters
and MRI sulcus angle has not been shown to be modifiable with conservative
interventions so was not considered
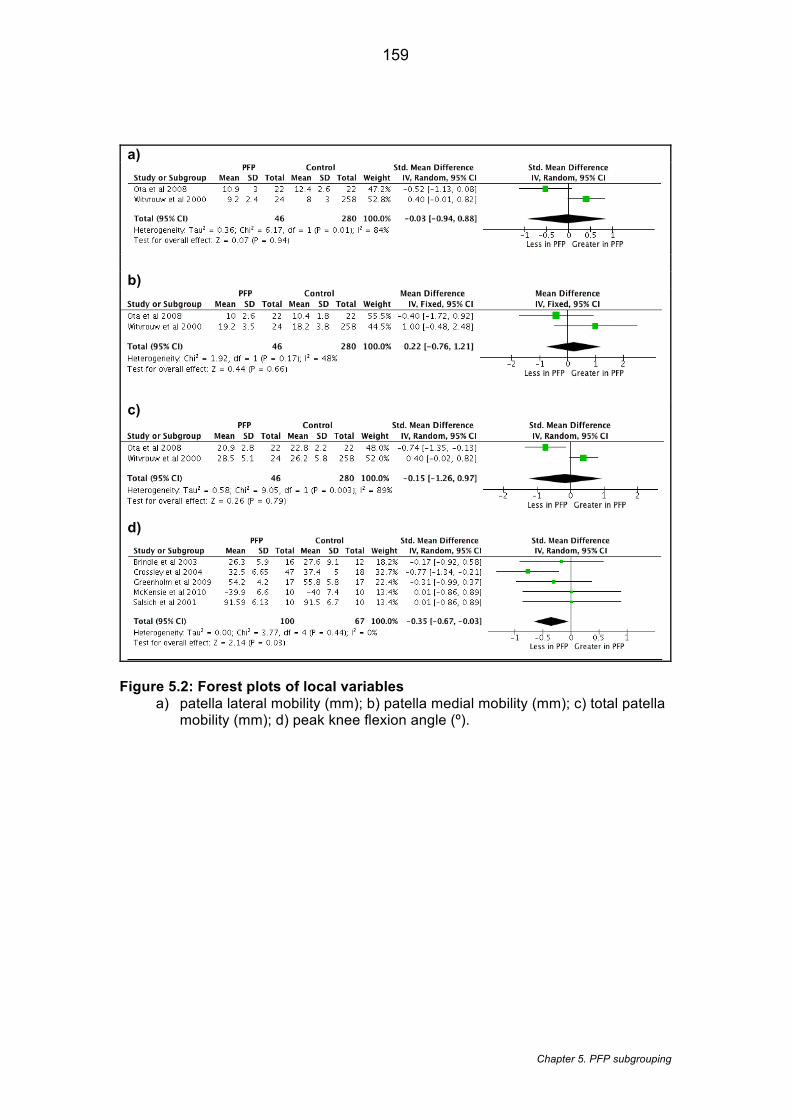
Chapter 5. PFP subgrouping
159
a)
b)
c)
d)
Figure 5.2: Forest plots of local variables a) patella lateral mobility (mm); b) patella medial mobility (mm); c) total patella
mobility (mm); d) peak knee flexion angle (º).
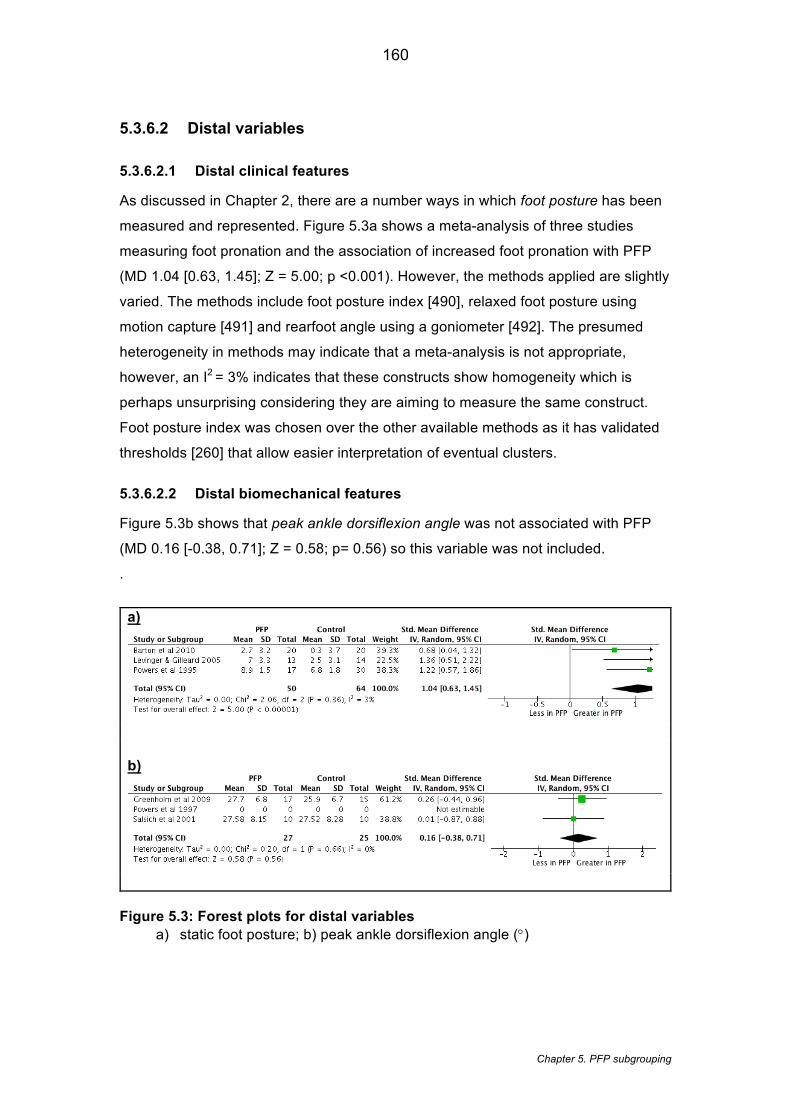
Chapter 5. PFP subgrouping
160
5.3.6.2 Distal variables
5.3.6.2.1 Distal clinical features
As discussed in Chapter 2, there are a number ways in which foot posture has been
measured and represented. Figure 5.3a shows a meta-analysis of three studies
measuring foot pronation and the association of increased foot pronation with PFP
(MD 1.04 [0.63, 1.45]; Z = 5.00; p <0.001). However, the methods applied are slightly
varied. The methods include foot posture index [490], relaxed foot posture using
motion capture [491] and rearfoot angle using a goniometer [492]. The presumed
heterogeneity in methods may indicate that a meta-analysis is not appropriate,
however, an I2 = 3% indicates that these constructs show homogeneity which is
perhaps unsurprising considering they are aiming to measure the same construct.
Foot posture index was chosen over the other available methods as it has validated
thresholds [260] that allow easier interpretation of eventual clusters.
5.3.6.2.2 Distal biomechanical features
Figure 5.3b shows that peak ankle dorsiflexion angle was not associated with PFP
(MD 0.16 [-0.38, 0.71]; Z = 0.58; p= 0.56) so this variable was not included.
.
a)
b)
Figure 5.3: Forest plots for distal variables a) static foot posture; b) peak ankle dorsiflexion angle (°)
Chapter 5. PFP subgrouping
161
5.3.6.3 Proximal variables
5.3.6.3.1 Proximal clinical features
Static Q-angle was not included despite being shown to be associated with PFP
[194] (MD 2.08 [0.64, 3.53]; Z =2.83; p=0.005) based on nine separate studies. It is
widely debated whether static Q-angle is clinically modifiable with conservative
interventions [194] thus this feature did not meet the selection criteria.
5.3.6.3.2 Proximal biomechanical features
In terms of hip strength, both hip abductor strength (MD -3.30 [-5.60, -1.00]; Z =2.81;
p=0.005) and hip external rotation strength (MD -1.43 [-2.71, -0.16]; Z = 2.21;
p=0.03) are supported by the meta-analyses by Lankhorst et al. (2013) [194]. Based
on measurements taken on 501 athletes, hip abduction strength and hip external
rotation strength have been shown to be highly correlated (r=0.66; p <0.01) [493].
Due to the fact that hip internal rotation angle kinematics were also included, a
decision was made to select only the hip abductor angle in order to represent frontal
plane movement and to prevent collinearity of variables (between hip abductor and
external rotation strength).
In terms of kinematics, the pooled estimates of hip internal rotation angle during stair
descent (Figure 5.4a) demonstrates that a greater hip internal rotation angle is
associated with PFP (MD 1.01 [0.42, 1.61]; Z =3.33; p = <0.001). Figure 5.4b and
Figure 5.4c show that hip adduction angle (MD 0.51 [-0.26, 1.28]; Z = 1.31; p = 0.19)
and hip flexion angle (MD 0.31 [-0.39, 1.01]; Z=0.88; p = 0.38) during stair descent
has no association with PFP so these variables were not included.
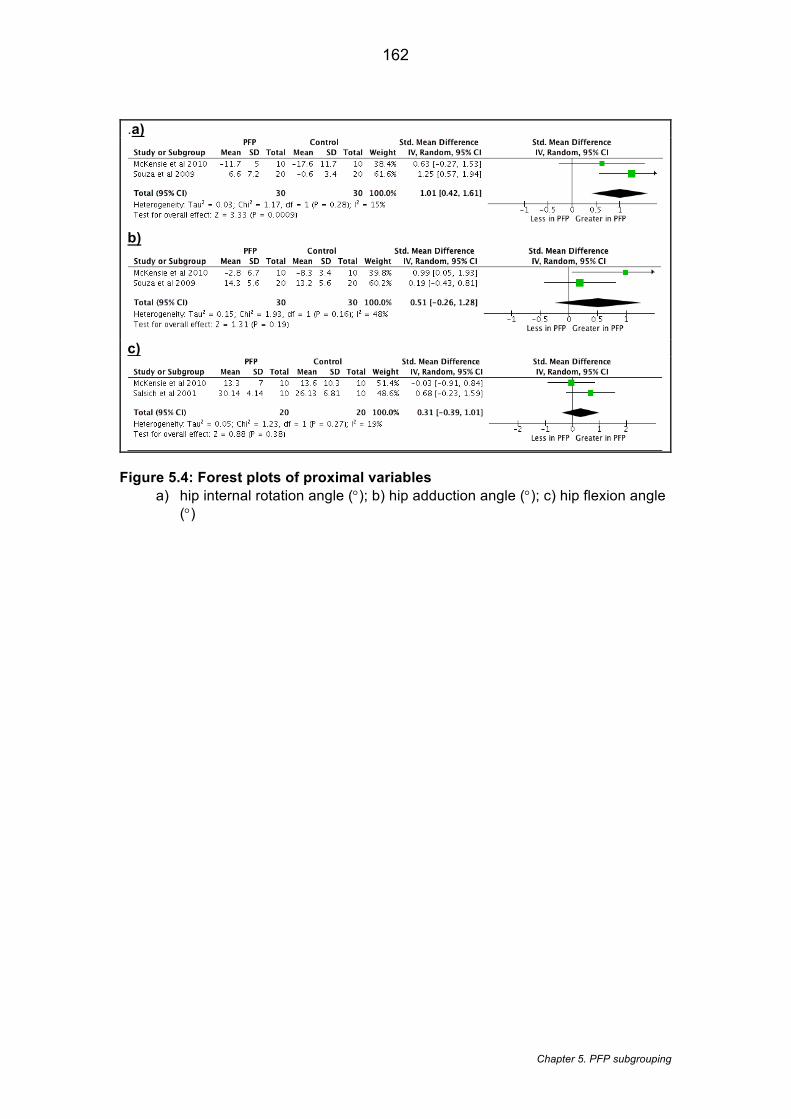
Chapter 5. PFP subgrouping
162
.a)
b)
c)
Figure 5.4: Forest plots of proximal variables a) hip internal rotation angle (°); b) hip adduction angle (°); c) hip flexion angle
(°)
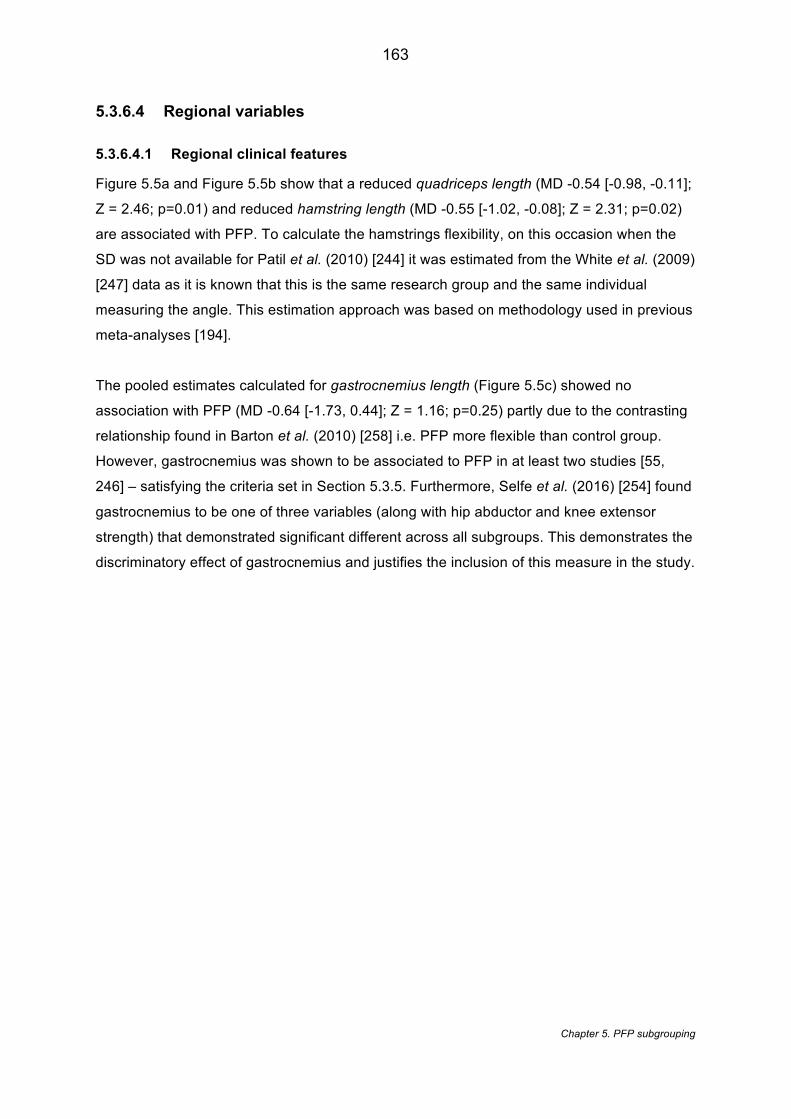
163
Chapter 5. PFP subgrouping
5.3.6.4 Regional variables
5.3.6.4.1 Regional clinical features
Figure 5.5a and Figure 5.5b show that a reduced quadriceps length (MD -0.54 [-0.98, -0.11];
Z = 2.46; p=0.01) and reduced hamstring length (MD -0.55 [-1.02, -0.08]; Z = 2.31; p=0.02)
are associated with PFP. To calculate the hamstrings flexibility, on this occasion when the
SD was not available for Patil et al. (2010) [244] it was estimated from the White et al. (2009)
[247] data as it is known that this is the same research group and the same individual
measuring the angle. This estimation approach was based on methodology used in previous
meta-analyses [194].
The pooled estimates calculated for gastrocnemius length (Figure 5.5c) showed no
association with PFP (MD -0.64 [-1.73, 0.44]; Z = 1.16; p=0.25) partly due to the contrasting
relationship found in Barton et al. (2010) [258] i.e. PFP more flexible than control group.
However, gastrocnemius was shown to be associated to PFP in at least two studies [55,
246] – satisfying the criteria set in Section 5.3.5. Furthermore, Selfe et al. (2016) [254] found
gastrocnemius to be one of three variables (along with hip abductor and knee extensor
strength) that demonstrated significant different across all subgroups. This demonstrates the
discriminatory effect of gastrocnemius and justifies the inclusion of this measure in the study.
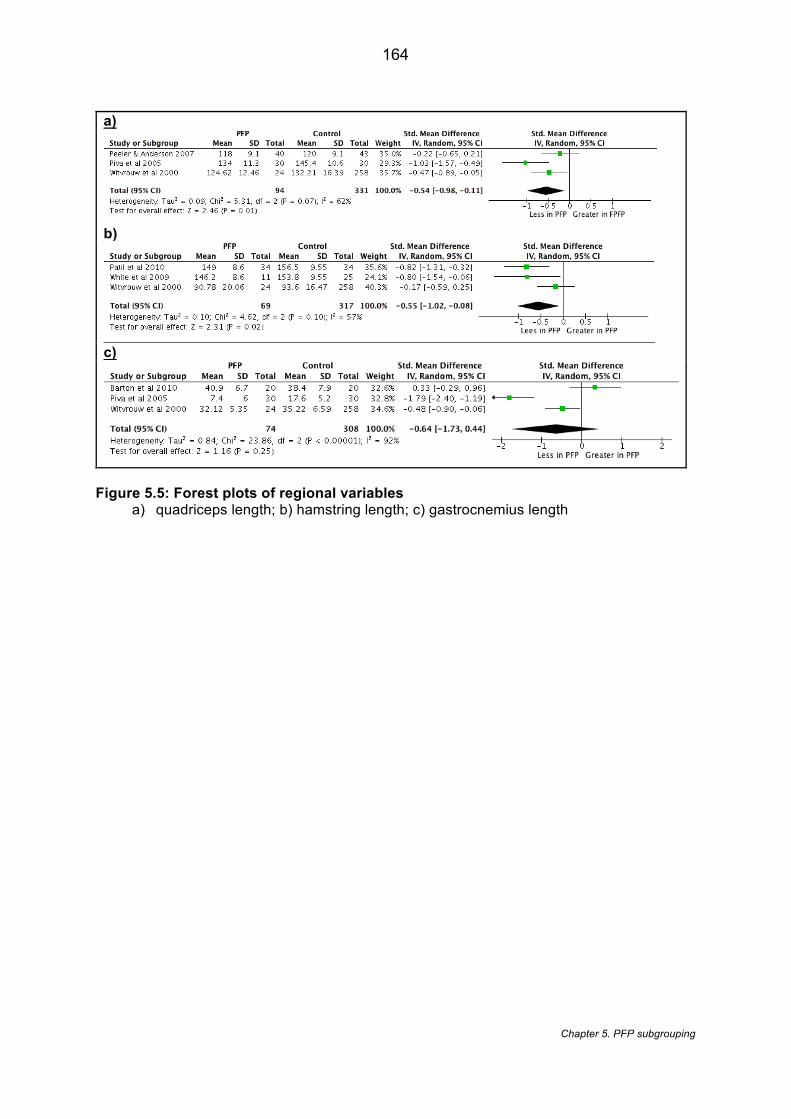
164
Chapter 5. PFP subgrouping
a)
b)
c)
Figure 5.5: Forest plots of regional variables a) quadriceps length; b) hamstring length; c) gastrocnemius length
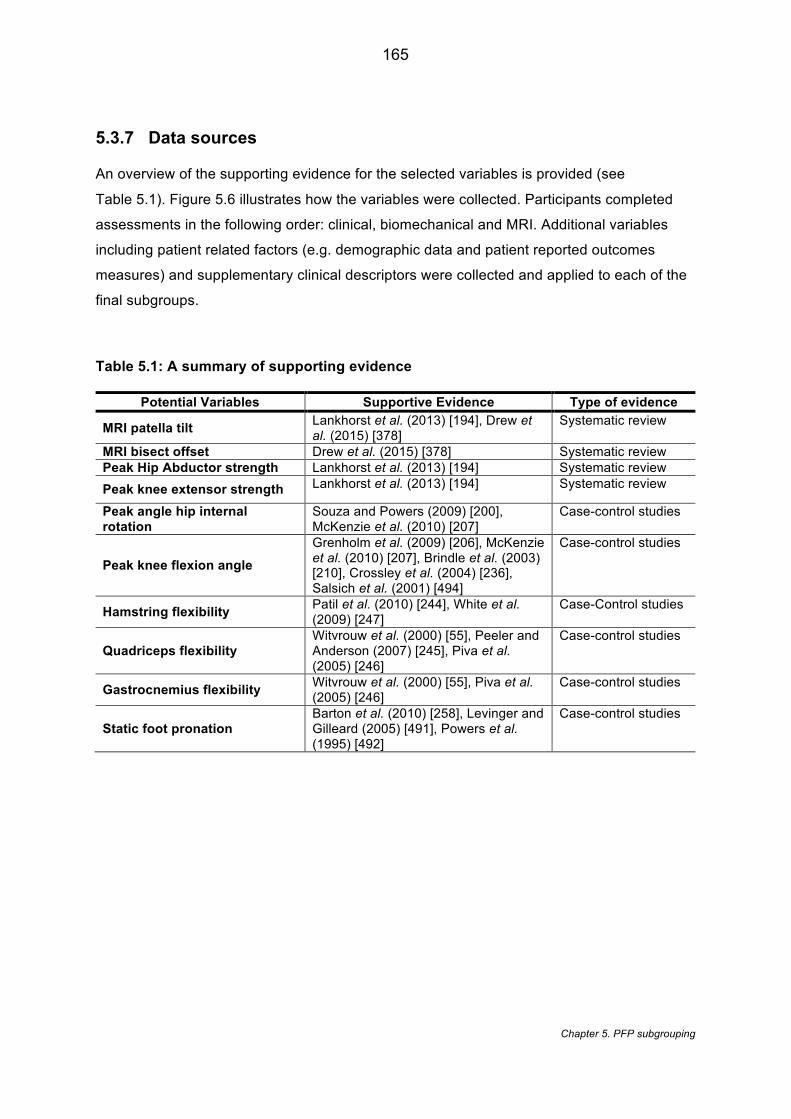
165
Chapter 5. PFP subgrouping
5.3.7 Data sources
An overview of the supporting evidence for the selected variables is provided (see
Table 5.1). Figure 5.6 illustrates how the variables were collected. Participants completed
assessments in the following order: clinical, biomechanical and MRI. Additional variables
including patient related factors (e.g. demographic data and patient reported outcomes
measures) and supplementary clinical descriptors were collected and applied to each of the
final subgroups.
Table 5.1: A summary of supporting evidence
Potential Variables Supportive Evidence Type of evidence
MRI patella tilt Lankhorst et al. (2013) [194], Drew et al. (2015) [378]
Systematic review
MRI bisect offset Drew et al. (2015) [378] Systematic review Peak Hip Abductor strength Lankhorst et al. (2013) [194] Systematic review
Peak knee extensor strength Lankhorst et al. (2013) [194] Systematic review
Peak angle hip internal rotation
Souza and Powers (2009) [200], McKenzie et al. (2010) [207]
Case-control studies
Peak knee flexion angle
Grenholm et al. (2009) [206], McKenzie et al. (2010) [207], Brindle et al. (2003) [210], Crossley et al. (2004) [236], Salsich et al. (2001) [494]
Case-control studies
Hamstring flexibility Patil et al. (2010) [244], White et al. (2009) [247]
Case-Control studies
Quadriceps flexibility Witvrouw et al. (2000) [55], Peeler and Anderson (2007) [245], Piva et al. (2005) [246]
Case-control studies
Gastrocnemius flexibility Witvrouw et al. (2000) [55], Piva et al. (2005) [246]
Case-control studies
Static foot pronation Barton et al. (2010) [258], Levinger and Gilleard (2005) [491], Powers et al. (1995) [492]
Case-control studies
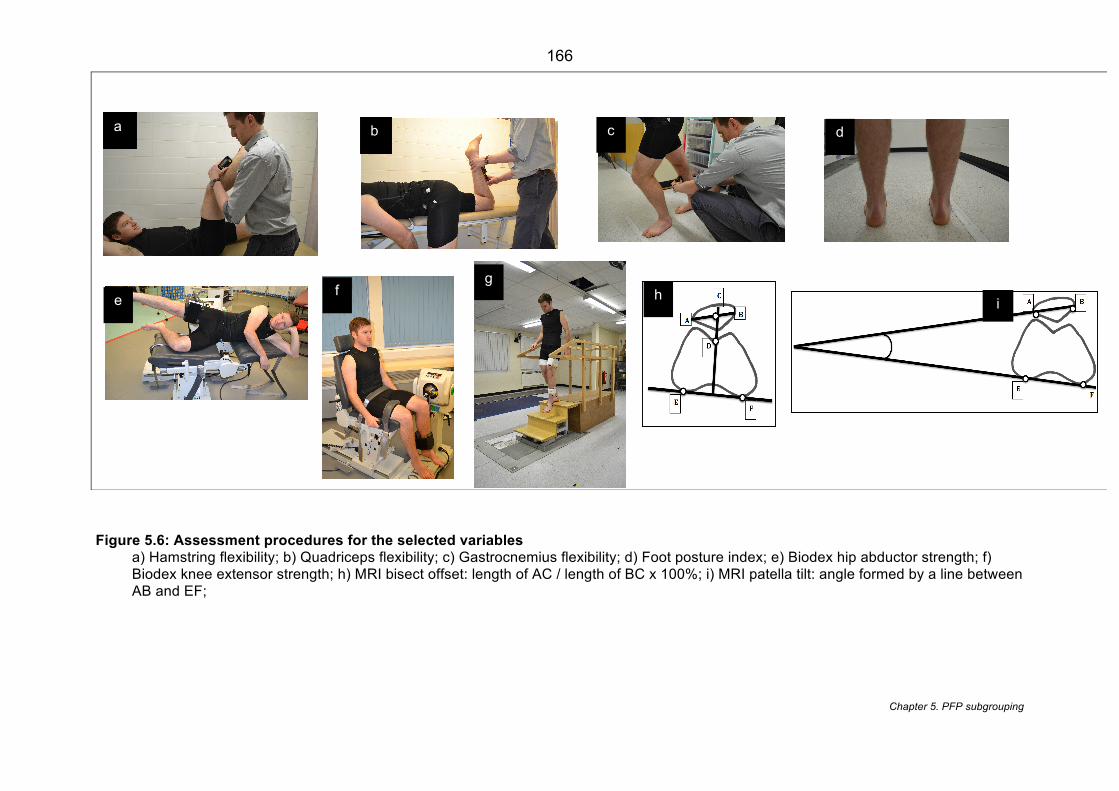
166
Chapter 5. PFP subgrouping
Figure 5.6: Assessment procedures for the selected variables a) Hamstring flexibility; b) Quadriceps flexibility; c) Gastrocnemius flexibility; d) Foot posture index; e) Biodex hip abductor strength; f) Biodex knee extensor strength; h) MRI bisect offset: length of AC / length of BC x 100%; i) MRI patella tilt: angle formed by a line between AB and EF;
a b d c
h i
g
f
e
167
Chapter 5. PFP subgrouping
5.3.8 Clinical assessment
The hamstrings (Figure 5.6a), quadriceps (Figure 5.6b) and gastrocnemius (Figure 5.6c)
flexibility were measured using a digital inclinometer in accordance with previously published
methods [495]. The static foot posture (Figure 5.6d) was measured using the Foot Posture
Index (FPI)(Table 5.2) [496].
Digital inclinometers have shown intraclass correlation coefficients (ICCs) of 0.53-0.98 for
the knee [497] and 0.91-0.97 for the ankle [498] range of movement. Compared to the
universal two-arm goniometer, digital inclinometer do not rely on exact anatomical
positioning of both lever arms thus on for a PFP population known to vary in body mass
profile [254] there is less likelihood for human error [497]. Caution has also been advised
about using both methods interchangeably due to the limits of agreement up to 20 degrees
[499] so in this thesis only digital inclinometers were used.
5.3.8.1 Hamstring flexibility
Figure 5.6a shows how hamstring flexibility was measured. The passive knee extension test
was chosen instead of the straight leg raise test which measures the angle of the hip [55].
The passive knee extension test has been shown to be associated to PFP [244, 246, 247]
and shown to have excellent reliability [500]. With the participant supine, the digital
inclinometer was used to ensure the thigh was positioned at 90 degrees at the hip. The leg
was then passively extended to the point of firm resistance to the movement [247] whilst the
other hand supported the thigh. The digital inclinometer was placed on a mid-point of the
tibia and the angle recorded. Three measurements were taken and a mean value recorded.
5.3.8.2 Quadriceps flexibility
Figure 5.6b shows how quadriceps flexibility was assessed. The passive prone knee bend
was selected in accordance with previous studies in PFP [55, 495]. This method was
selected instead of the Elvey test [245] that has been used in other PFP studies [245, 246]
because it is thought that the planted foot of the contralateral limb would help prevent
compensatory posterior pelvic rotation. The participant was placed in prone towards the
edge of the plinth. The contralateral leg was placed on the floor at 90 degrees hip range of
movement. The leg was passively flexed to the point of firm resistance and the digital
168
Chapter 5. PFP subgrouping
inclinometer placed on the mid tibia where the angle was recorded. Three measurements
were taken and a mean value recorded.
5.3.8.3 Gastrocnemius flexibility
Figure 5.6c shows the gastrocnemius flexibility was measured. The weight bearing (WB)
ankle dorsiflexion test was chosen as this has been used in previous studies for PFP [55,
344] and has shown an association to PFP [55]. Other studies assessing the gastrocnemius
flexibility in PFP have used measures in prone lying [246] and supine lying [501].WB and
NWB measures have only showed moderate correlation [502] so using these measures
interchangeably is not advised and WB has been shown to produce more than twice than
that of NWB [502]. Using the WB test in this thesis will produce a greater ROM and a value
that most represents true length. A 0.6m line was marked on floor and the participant was
advised to lean against the wall with the tested limb behind the contralateral limb and both
toes pointing anteriorly. The participants were asked to keep the tested limb extended at the
knee and attempt to maximally flex the ankle whilst keeping the heel on floor [55, 495]. The
mid tibia angle was measured using the digital inclinometer. Three measurements were
taken and a mean value recorded.
5.3.8.4 Foot posture index
The Foot posture index is a six item clinical tool that quantifies the static foot position with
the criteria shown in Table 5.2 [503]. Participants stood in double limb support in a relaxed
stance (Figure 5.6d). They were advised to march on the spot for few seconds in order to
adopt a comfortable stance [503]. Each item of the FPI derives a score from -2 to +2
depending on item description. The values are tallied, with large positive values indicating a
pronated foot posture [503].
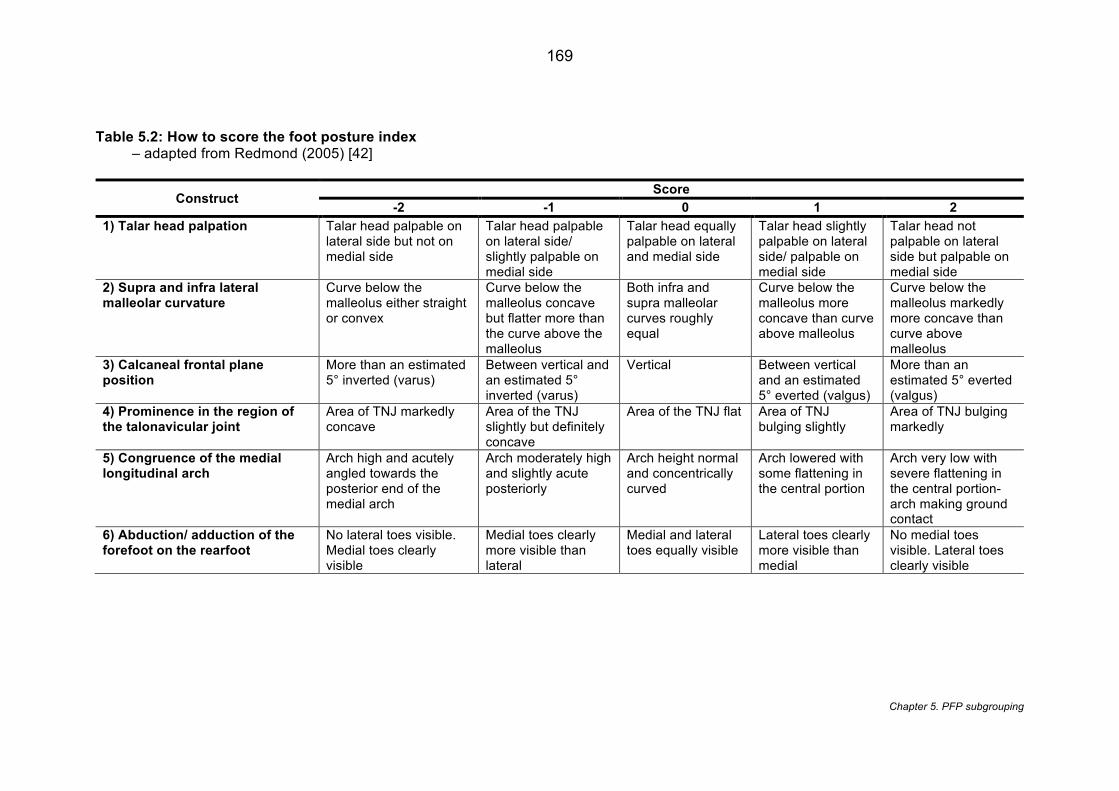
169
Chapter 5. PFP subgrouping
Table 5.2: How to score the foot posture index – adapted from Redmond (2005) [42]
Construct Score
-2 -1 0 1 2 1) Talar head palpation Talar head palpable on
lateral side but not on medial side
Talar head palpable on lateral side/ slightly palpable on medial side
Talar head equally palpable on lateral and medial side
Talar head slightly palpable on lateral side/ palpable on medial side
Talar head not palpable on lateral side but palpable on medial side
2) Supra and infra lateral malleolar curvature
Curve below the malleolus either straight or convex
Curve below the malleolus concave but flatter more than the curve above the malleolus
Both infra and supra malleolar curves roughly equal
Curve below the malleolus more concave than curve above malleolus
Curve below the malleolus markedly more concave than curve above malleolus
3) Calcaneal frontal plane position
More than an estimated 5° inverted (varus)
Between vertical and an estimated 5° inverted (varus)
Vertical Between vertical and an estimated 5° everted (valgus)
More than an estimated 5° everted (valgus)
4) Prominence in the region of the talonavicular joint
Area of TNJ markedly concave
Area of the TNJ slightly but definitely concave
Area of the TNJ flat Area of TNJ bulging slightly
Area of TNJ bulging markedly
5) Congruence of the medial longitudinal arch
Arch high and acutely angled towards the posterior end of the medial arch
Arch moderately high and slightly acute posteriorly
Arch height normal and concentrically curved
Arch lowered with some flattening in the central portion
Arch very low with severe flattening in the central portion- arch making ground contact
6) Abduction/ adduction of the forefoot on the rearfoot
No lateral toes visible. Medial toes clearly visible
Medial toes clearly more visible than lateral
Medial and lateral toes equally visible
Lateral toes clearly more visible than medial
No medial toes visible. Lateral toes clearly visible
170
Chapter 5. PFP subgrouping
5.3.9 Biomechanical assessment
5.3.9.1 Strength testing
The Biodex isokinetic system 4 (IRPS Mediquipe, UK) was used to assess muscle strength.
Data was collected by Biodex Advantage Software (IRPS Mediquipe, UK). Biodex has
shown test- retest reliability of 0.95 ICC for knee extensor strength [504] and 0.81-0.95 ICC
for hip abduction strength [192]. The testing procedure for both hip abduction and knee
extensor strength commenced with practice testing on the contralateral limb before moving
onto the index limb. Testing the index limb second minimises any learning-effect variability
[505]. Weighing of the limb was completed prior to each testing to allow for automatic gravity
correction for all torque data [506]. For the assessment of hip abduction strength, the
participant was positioned in a side-lying position and the symptomatic side superior in a
neutral angle (0° flexion, abduction, rotation) (Figure 5.6h). This positional procedure is in
accordance with previously published literature [200].
For the assessment of knee extensor strength, the angle of testing was set at 60°/s which is
considered safer and better tolerated by people with knee pain [507] (Figure 5.6i). The same
testing protocol was used for both hip and knee strength and included three sub-maximal
practice movements, similar to previous strength testing protocols used in PFP [508].
Participants were then asked to perform five maximal effort movements. During testing, the
participant was verbally encouraged to push away and towards the pad during testing [509].
The concentric strength measures of interest were: i) peak hip abduction torque based on
the maximum hip abduction torque across five repetitions; (ii) peak knee extension torque
based on the maximum knee extension torque across five repetitions. These strength
measures were normalised to body weight (Nm/kg).
5.3.9.2 An overview of isokinetic dynamometers
An isokinetic dynamometer i.e. Biodex is a rotation device with a fixed axis of rotation which
can apply a constant, user selected angular velocity [510] – the rate of change in angular
displacement. Figure 5.7 shows how the angular velocity is monitored continuously at
approximately 1,000 times per second as the individual applies force to the arm. This
represents a closed feedback loop mechanism in which the actual velocity is constantly
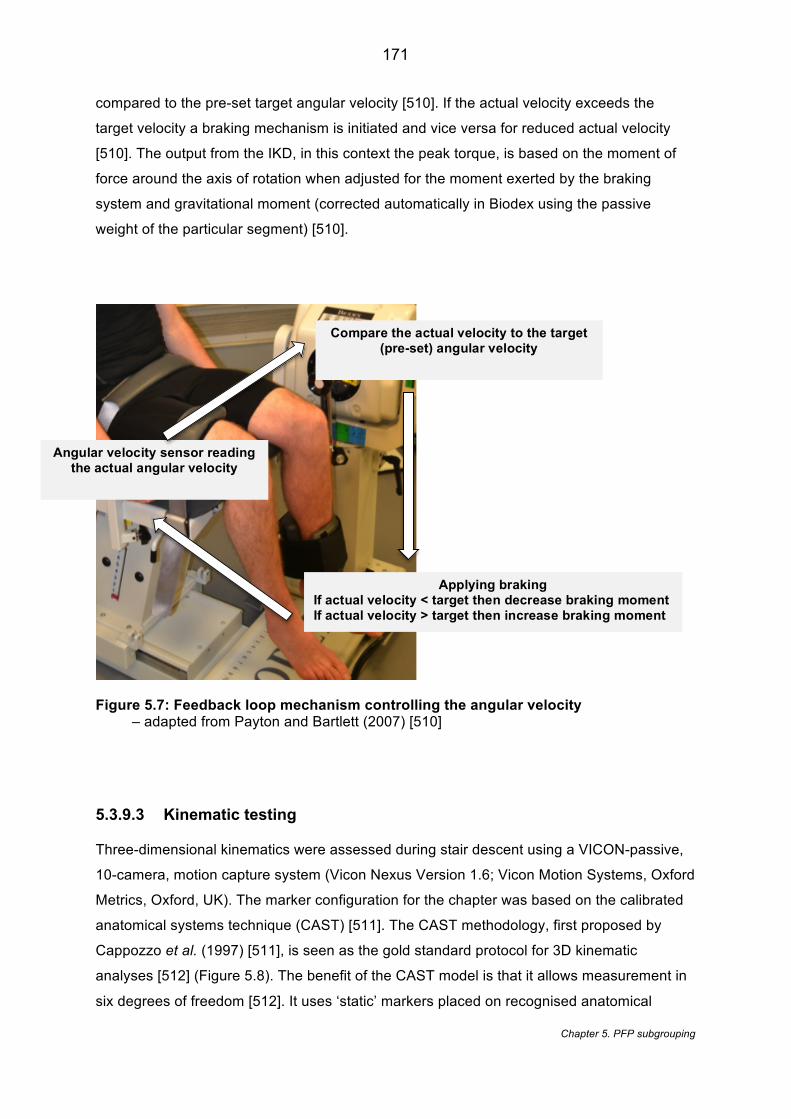
171
Chapter 5. PFP subgrouping
compared to the pre-set target angular velocity [510]. If the actual velocity exceeds the
target velocity a braking mechanism is initiated and vice versa for reduced actual velocity
[510]. The output from the IKD, in this context the peak torque, is based on the moment of
force around the axis of rotation when adjusted for the moment exerted by the braking
system and gravitational moment (corrected automatically in Biodex using the passive
weight of the particular segment) [510].
Figure 5.7: Feedback loop mechanism controlling the angular velocity – adapted from Payton and Bartlett (2007) [510]
5.3.9.3 Kinematic testing
Three-dimensional kinematics were assessed during stair descent using a VICON-passive,
10-camera, motion capture system (Vicon Nexus Version 1.6; Vicon Motion Systems, Oxford
Metrics, Oxford, UK). The marker configuration for the chapter was based on the calibrated
anatomical systems technique (CAST) [511]. The CAST methodology, first proposed by
Cappozzo et al. (1997) [511], is seen as the gold standard protocol for 3D kinematic
analyses [512] (Figure 5.8). The benefit of the CAST model is that it allows measurement in
six degrees of freedom [512]. It uses ‘static’ markers placed on recognised anatomical
Applying braking If actual velocity < target then decrease braking moment If actual velocity > target then increase braking moment
Angular velocity sensor reading the actual angular velocity
Compare the actual velocity to the target (pre-set) angular velocity
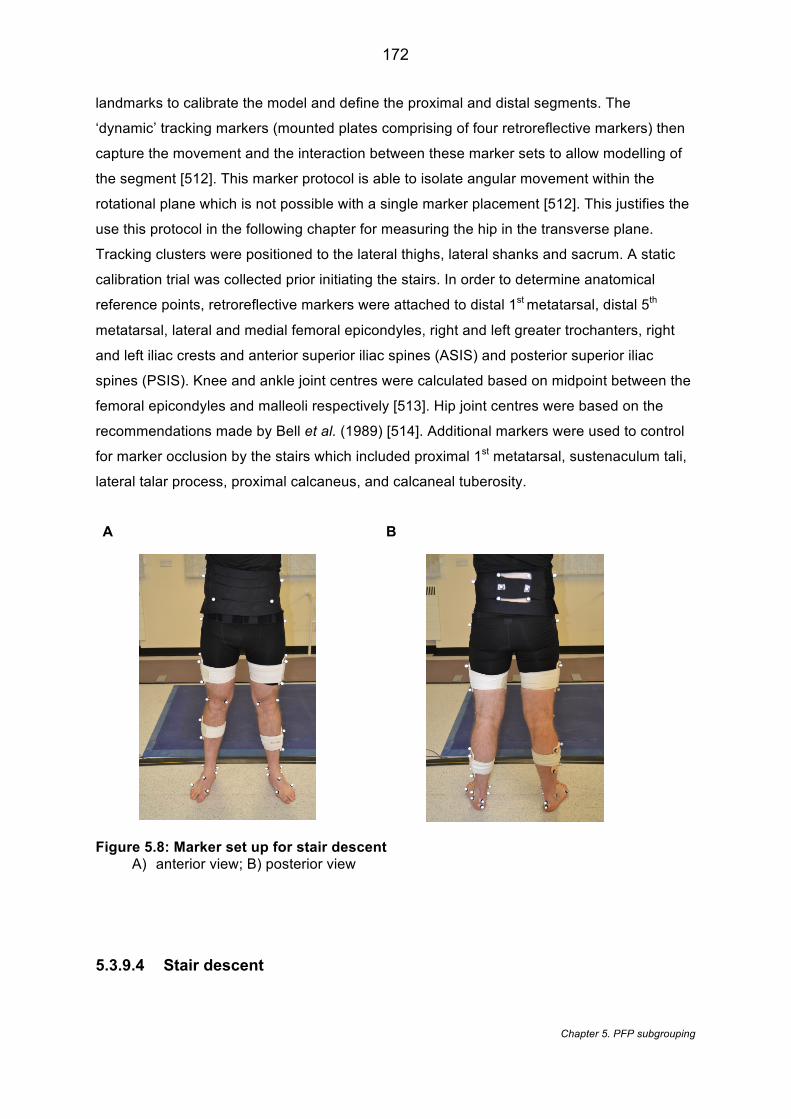
172
Chapter 5. PFP subgrouping
landmarks to calibrate the model and define the proximal and distal segments. The
‘dynamic’ tracking markers (mounted plates comprising of four retroreflective markers) then
capture the movement and the interaction between these marker sets to allow modelling of
the segment [512]. This marker protocol is able to isolate angular movement within the
rotational plane which is not possible with a single marker placement [512]. This justifies the
use this protocol in the following chapter for measuring the hip in the transverse plane.
Tracking clusters were positioned to the lateral thighs, lateral shanks and sacrum. A static
calibration trial was collected prior initiating the stairs. In order to determine anatomical
reference points, retroreflective markers were attached to distal 1st metatarsal, distal 5th
metatarsal, lateral and medial femoral epicondyles, right and left greater trochanters, right
and left iliac crests and anterior superior iliac spines (ASIS) and posterior superior iliac
spines (PSIS). Knee and ankle joint centres were calculated based on midpoint between the
femoral epicondyles and malleoli respectively [513]. Hip joint centres were based on the
recommendations made by Bell et al. (1989) [514]. Additional markers were used to control
for marker occlusion by the stairs which included proximal 1st metatarsal, sustenaculum tali,
lateral talar process, proximal calcaneus, and calcaneal tuberosity.
A B
Figure 5.8: Marker set up for stair descent A) anterior view; B) posterior view
5.3.9.4 Stair descent
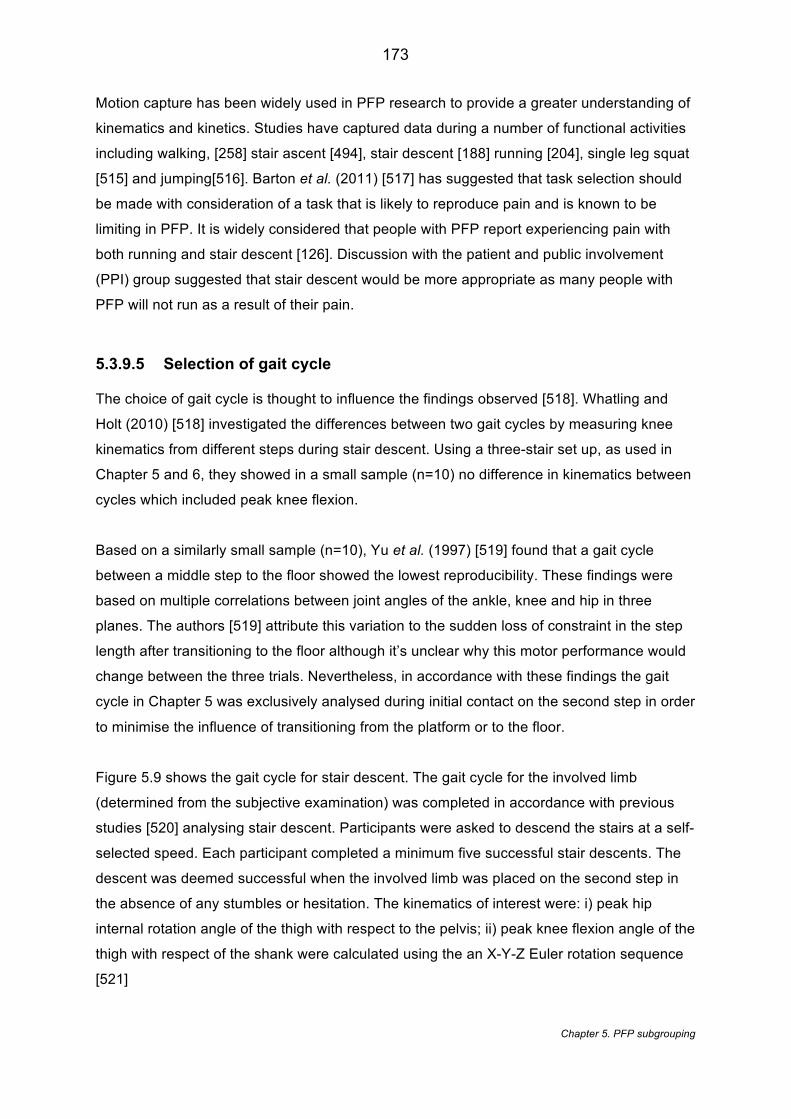
173
Chapter 5. PFP subgrouping
Motion capture has been widely used in PFP research to provide a greater understanding of
kinematics and kinetics. Studies have captured data during a number of functional activities
including walking, [258] stair ascent [494], stair descent [188] running [204], single leg squat
[515] and jumping[516]. Barton et al. (2011) [517] has suggested that task selection should
be made with consideration of a task that is likely to reproduce pain and is known to be
limiting in PFP. It is widely considered that people with PFP report experiencing pain with
both running and stair descent [126]. Discussion with the patient and public involvement
(PPI) group suggested that stair descent would be more appropriate as many people with
PFP will not run as a result of their pain.
5.3.9.5 Selection of gait cycle
The choice of gait cycle is thought to influence the findings observed [518]. Whatling and
Holt (2010) [518] investigated the differences between two gait cycles by measuring knee
kinematics from different steps during stair descent. Using a three-stair set up, as used in
Chapter 5 and 6, they showed in a small sample (n=10) no difference in kinematics between
cycles which included peak knee flexion.
Based on a similarly small sample (n=10), Yu et al. (1997) [519] found that a gait cycle
between a middle step to the floor showed the lowest reproducibility. These findings were
based on multiple correlations between joint angles of the ankle, knee and hip in three
planes. The authors [519] attribute this variation to the sudden loss of constraint in the step
length after transitioning to the floor although it’s unclear why this motor performance would
change between the three trials. Nevertheless, in accordance with these findings the gait
cycle in Chapter 5 was exclusively analysed during initial contact on the second step in order
to minimise the influence of transitioning from the platform or to the floor.
Figure 5.9 shows the gait cycle for stair descent. The gait cycle for the involved limb
(determined from the subjective examination) was completed in accordance with previous
studies [520] analysing stair descent. Participants were asked to descend the stairs at a self-
selected speed. Each participant completed a minimum five successful stair descents. The
descent was deemed successful when the involved limb was placed on the second step in
the absence of any stumbles or hesitation. The kinematics of interest were: i) peak hip
internal rotation angle of the thigh with respect to the pelvis; ii) peak knee flexion angle of the
thigh with respect of the shank were calculated using the an X-Y-Z Euler rotation sequence
[521]
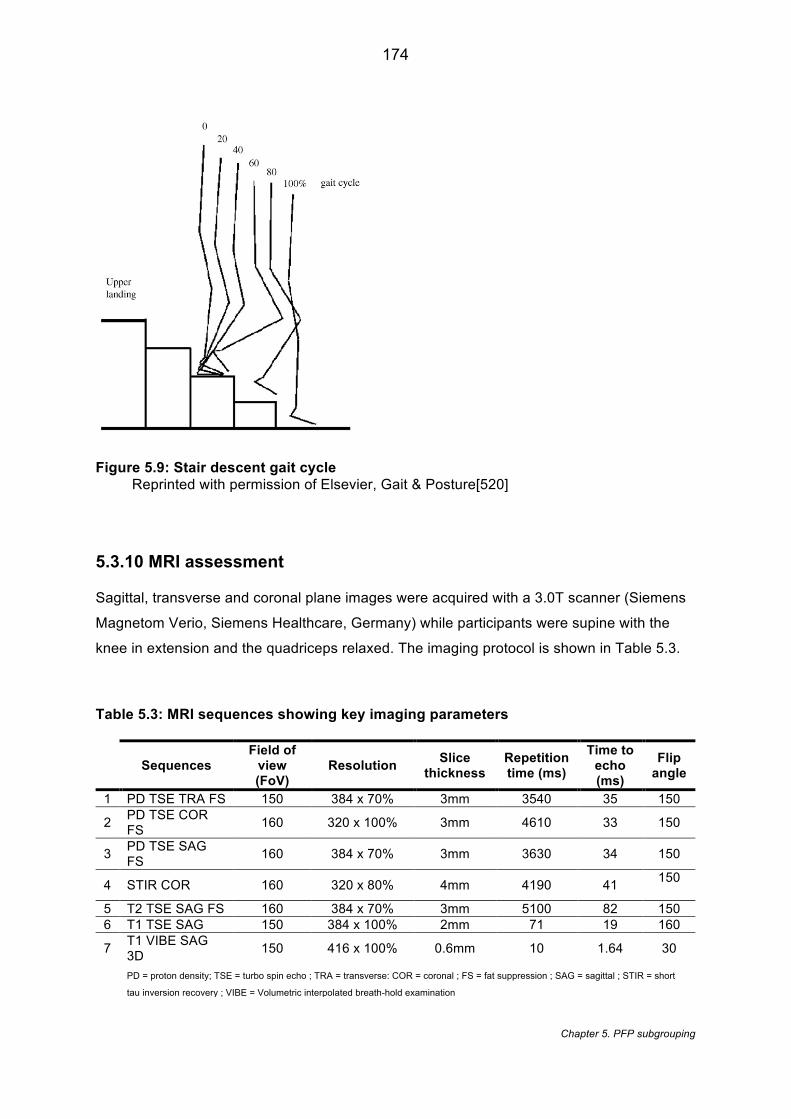
174
Chapter 5. PFP subgrouping
Figure 5.9: Stair descent gait cycle Reprinted with permission of Elsevier, Gait & Posture[520]
5.3.10 MRI assessment
Sagittal, transverse and coronal plane images were acquired with a 3.0T scanner (Siemens
Magnetom Verio, Siemens Healthcare, Germany) while participants were supine with the
knee in extension and the quadriceps relaxed. The imaging protocol is shown in Table 5.3.
Table 5.3: MRI sequences showing key imaging parameters
Sequences Field of
view (FoV)
Resolution Slice thickness
Repetition time (ms)
Time to echo (ms)
Flip angle
1 PD TSE TRA FS 150 384 x 70% 3mm 3540 35 150
2 PD TSE COR FS 160 320 x 100% 3mm 4610 33 150
3 PD TSE SAG FS 160 384 x 70% 3mm 3630 34 150
4 STIR COR 160 320 x 80% 4mm 4190 41 150
5 T2 TSE SAG FS 160 384 x 70% 3mm 5100 82 150 6 T1 TSE SAG 150 384 x 100% 2mm 71 19 160
7 T1 VIBE SAG 3D 150 416 x 100% 0.6mm 10 1.64 30
PD = proton density; TSE = turbo spin echo ; TRA = transverse: COR = coronal ; FS = fat suppression ; SAG = sagittal ; STIR = short
tau inversion recovery ; VIBE = Volumetric interpolated breath-hold examination
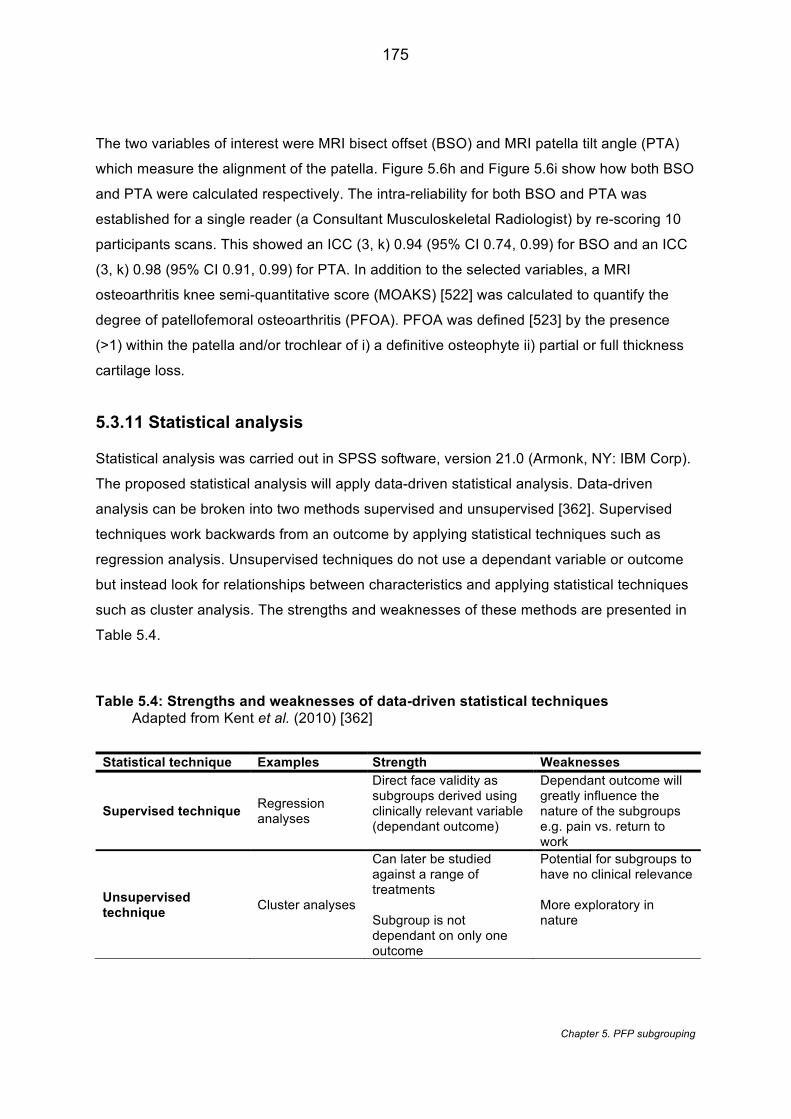
175
Chapter 5. PFP subgrouping
The two variables of interest were MRI bisect offset (BSO) and MRI patella tilt angle (PTA)
which measure the alignment of the patella. Figure 5.6h and Figure 5.6i show how both BSO
and PTA were calculated respectively. The intra-reliability for both BSO and PTA was
established for a single reader (a Consultant Musculoskeletal Radiologist) by re-scoring 10
participants scans. This showed an ICC (3, k) 0.94 (95% CI 0.74, 0.99) for BSO and an ICC
(3, k) 0.98 (95% CI 0.91, 0.99) for PTA. In addition to the selected variables, a MRI
osteoarthritis knee semi-quantitative score (MOAKS) [522] was calculated to quantify the
degree of patellofemoral osteoarthritis (PFOA). PFOA was defined [523] by the presence
(>1) within the patella and/or trochlear of i) a definitive osteophyte ii) partial or full thickness
cartilage loss.
5.3.11 Statistical analysis
Statistical analysis was carried out in SPSS software, version 21.0 (Armonk, NY: IBM Corp).
The proposed statistical analysis will apply data-driven statistical analysis. Data-driven
analysis can be broken into two methods supervised and unsupervised [362]. Supervised
techniques work backwards from an outcome by applying statistical techniques such as
regression analysis. Unsupervised techniques do not use a dependant variable or outcome
but instead look for relationships between characteristics and applying statistical techniques
such as cluster analysis. The strengths and weaknesses of these methods are presented in
Table 5.4.
Table 5.4: Strengths and weaknesses of data-driven statistical techniques Adapted from Kent et al. (2010) [362]
Statistical technique Examples Strength Weaknesses
Supervised technique Regression analyses
Direct face validity as subgroups derived using clinically relevant variable (dependant outcome)
Dependant outcome will greatly influence the nature of the subgroups e.g. pain vs. return to work
Unsupervised technique Cluster analyses
Can later be studied against a range of treatments Subgroup is not dependant on only one outcome
Potential for subgroups to have no clinical relevance More exploratory in nature
176
Chapter 5. PFP subgrouping
The reliance on solely data-driven cluster analysis can lead to subgroups being difficult to
interpret and apply clinically [364]. As a result, a two-stage approach advocated by Kent et
al. (2015) [364] was applied using the SPSS TwoStep cluster analysis (TwoStep CA). This
approach requires variables to be classified into health domains. Guidance for this
classification process was based on a previous classification for PFP [18] with domain
names revised to reflect modern understanding. The 10 selected variables were classified
into the health domains by the candidate and a clinical expert supporting this chapter with
five and 30 years of specialist interest in PFP respectively.
5.3.12 Summary of the SPSSTwoStep cluster analysis
The TwoStep CA, first introduced by Chiu et al. (2001) [524], was developed to address the
shortfall of traditional cluster analysis approaches. The algorithm allows the handling of
mixed data types (both continuous and categorical), automatic selection of cluster numbers
(using either Schwarz Bayesian information criterion [BIC] or Akaike information criterion
[AIC] ) and more efficient handling of large datasets [524]. The TwoStep CA is made of two
components (‘steps’) that are computed together automatically. Step one is the pre-
clustering stage where data is allocated to coarse set of sub clusters and step two uses
agglomerative hierarchical cluster techniques [524]. In comparison with other traditional
hierarchical cluster algorithms, Gelbard et al. (2007) [525] showed the TwoStep CA was the
best performing compared to eleven other algorithms in terms of matching to original
clusters of established datasets. Conversely, one drawback highlighted by a few authors
[526, 527] is that despite being able to handle mixed data types there is problem with how
this is represented. TwoStep gives different weighting to categorical and continuous
variables with categorical variables implicitly given a greater weighting. Subsequently, a
cluster profile will be influenced by the different combinations of categorical and continuous
variables [526]. Kent et al. (2014) [527] recently compared TwoStep CA, Latent Class
Analysis and SNOB with the Latent Class shown to outperform TwoStep CA in terms of
higher cluster sensitivity and better handling of mixed data. However, for the purposes of
Chapter 5, the data at each stage will not include mixed data types; continuous at stage one
and categorical at stage two. Kent et al. (2014) [527] also showed that the sensitivity of
cluster detection for TwoStep CA is markedly less than the other cluster analysis methods
showing a difference of 4 -37 clusters across four datasets. Nevertheless, Selfe et al. (2016)
[254] points out that the cluster solution should be feasible to implement into clinical practice.
Clearly a 37-cluster solution is not feasible and the average solution number for the Latent
Class was 8.5 (across four datasets), which is still likely to lack feasibility and clinical
177
Chapter 5. PFP subgrouping
applicability. As clinical applicability and interpretation will determine the number of cluster
solutions then a software’s cluster detection sensitivity should have limited impact.
5.3.12.1 First stage of clustering
The first stage of clustering, of the two-stage approach, was performed only within each
health domain. This was conducted using the TwoStep CA analysis using a log-likelihood
similarity measure. One of its benefits over hierarchical cluster analysis (HCA) is that it is
capable of dealing with binary outcomes. According to the developers of the statistical
software [528], clustering binary outcomes using hierarchical cluster analysis should be
avoided. Binary variables were expected so a TwoStep CA chosen instead. A HCA was,
however, applied as a means of validating the eventual stability of the clusters.
The optimal number of cluster solutions was derived using the Schwartz Bayesian
Information Criterion (BIC). Prior to performing the cluster analysis, data variance, normality
and outliers were checked. After completing the first stage of clustering, cross tabulation
was used to observe how the variables were distributed across the clusters within each
domain. Variables were compared between clusters to inform cluster interpretation, at two-
tailed significance (p<0.05). Independent samples t-tests (for two clusters) and ANOVA (for
greater than two clusters) with Tukey post-hoc tests were performed for continuous
variables. Chi-squared tests with Bonferroni-adjusted pairwise multiple comparisons were
calculated for categorical variables. Labeling the clusters (hereafter referred to as groups)
was guided predominantly by statistical differences and normative means derived from
published literature (Table 5.5) to form the domains (categorical variables). For both BSO
and PTA, previous thresholds have been established under a full weight bearing protocol
[230] but only BSO shown to differ under non-weight bearing [425]. To account for these
procedural differences, an extra 5% was added to the published thresholds for BSO.
The stability of cluster solutions from both stages was examined against a hierarchical HCA
performed using Wards methods, with a squared Euclidean distance similarity measure and
standardized to Z scores. For the HCA, the agglomeration schedule was used to identify
coefficients of the cluster procedures. Tables were constructed for each domain showing the
coefficient change at each cluster stage. This allows identification of large changes (or
‘jumps’) in coefficient, which indicates the preferred number of groups. Kappa coefficients
were calculated to quantify the stability between TwoStep CA and HCA methods and
interpreted using recognised criteria [529].

178
Chapter 5. PFP subgrouping
5.3.12.2 Second stage of clustering
Using the first stage domains and the same methodology, a second stage clustering was
performed to identify groups across all domains. TwoStep CA is also known to be sensitive
to the order of cases [527] so a random number generated order was computed and kappa
coefficients (k) calculated to compare with the original order. Similar to the first stage, the
groups were cross tabulated and compared clinically and statistically between groups.
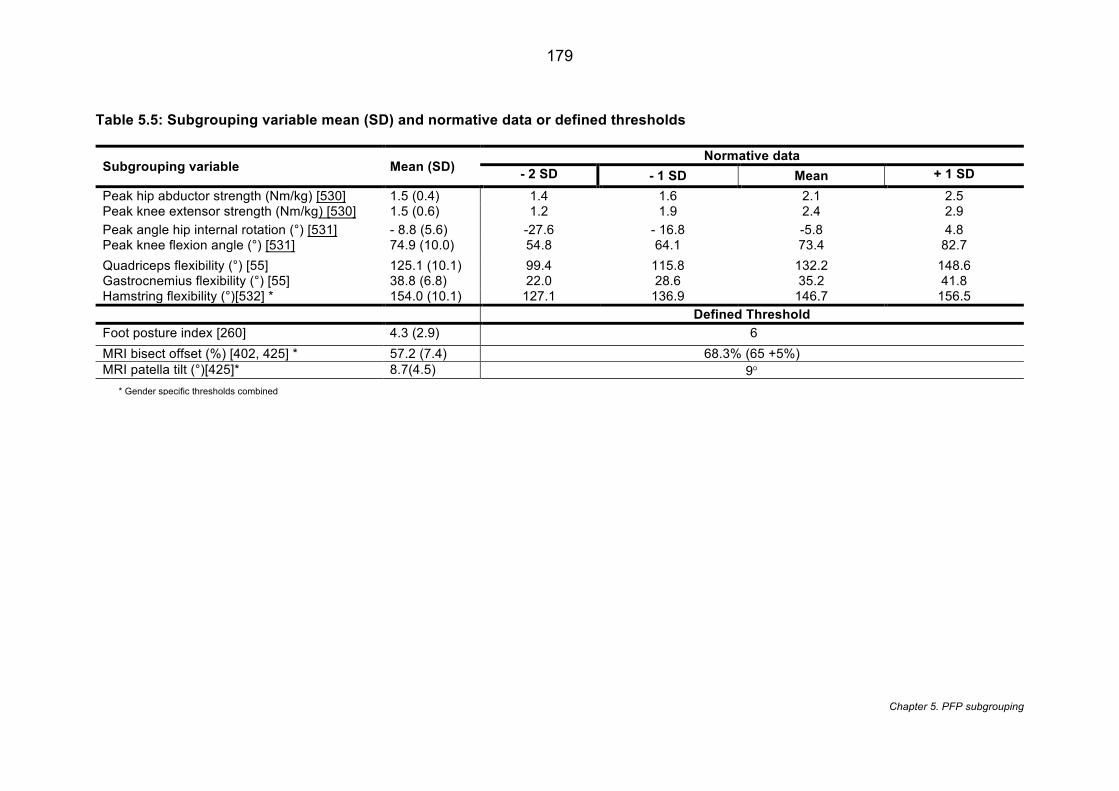
179
Chapter 5. PFP subgrouping
Table 5.5: Subgrouping variable mean (SD) and normative data or defined thresholds
Subgrouping variable Mean (SD) Normative data
- 2 SD - 1 SD Mean + 1 SD Peak hip abductor strength (Nm/kg) [530] 1.5 (0.4) 1.4 1.6 2.1 2.5 Peak knee extensor strength (Nm/kg) [530] 1.5 (0.6) 1.2 1.9 2.4 2.9 Peak angle hip internal rotation (°) [531] - 8.8 (5.6) -27.6 - 16.8 -5.8 4.8 Peak knee flexion angle (°) [531] 74.9 (10.0) 54.8 64.1 73.4 82.7 Quadriceps flexibility (°) [55] 125.1 (10.1) 99.4 115.8 132.2 148.6 Gastrocnemius flexibility (°) [55] 38.8 (6.8) 22.0 28.6 35.2 41.8 Hamstring flexibility (°)[532] * 154.0 (10.1) 127.1 136.9 146.7 156.5 Defined Threshold Foot posture index [260] 4.3 (2.9) 6 MRI bisect offset (%) [402, 425] * 57.2 (7.4) 68.3% (65 +5%) MRI patella tilt (°)[425]* 8.7(4.5) 9° * Gender specific thresholds combined
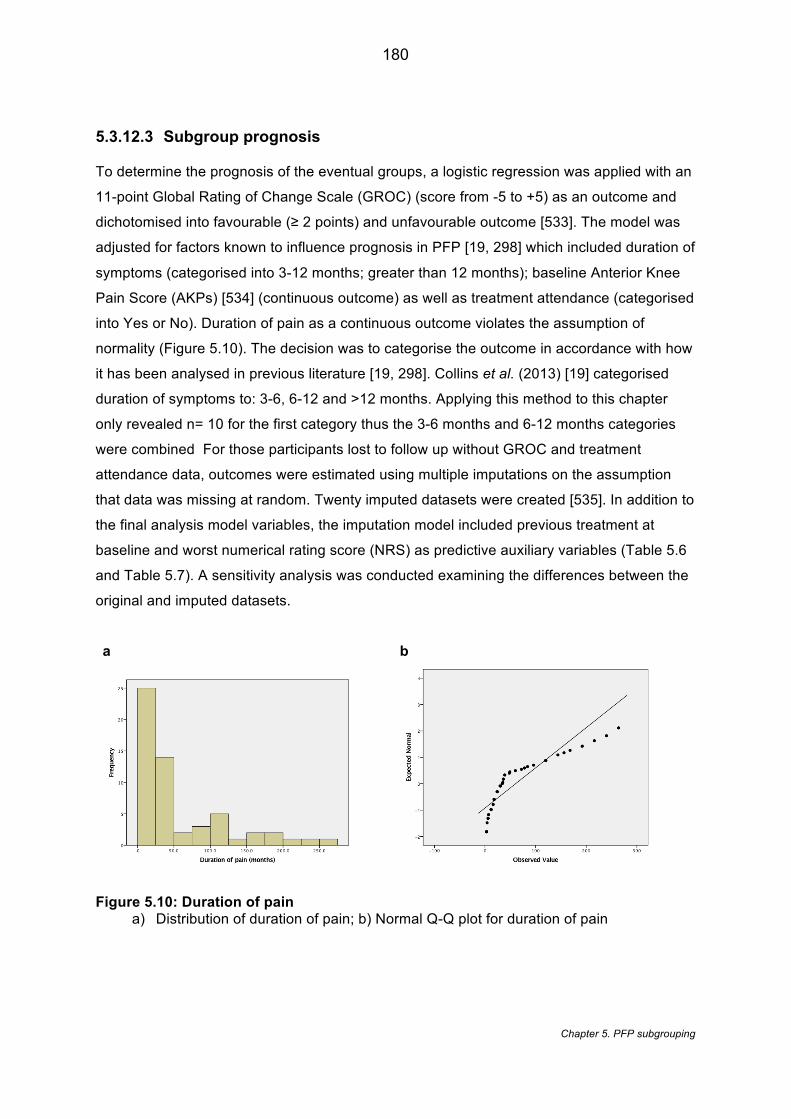
180
Chapter 5. PFP subgrouping
5.3.12.3 Subgroup prognosis
To determine the prognosis of the eventual groups, a logistic regression was applied with an
11-point Global Rating of Change Scale (GROC) (score from -5 to +5) as an outcome and
dichotomised into favourable (≥ 2 points) and unfavourable outcome [533]. The model was
adjusted for factors known to influence prognosis in PFP [19, 298] which included duration of
symptoms (categorised into 3-12 months; greater than 12 months); baseline Anterior Knee
Pain Score (AKPs) [534] (continuous outcome) as well as treatment attendance (categorised
into Yes or No). Duration of pain as a continuous outcome violates the assumption of
normality (Figure 5.10). The decision was to categorise the outcome in accordance with how
it has been analysed in previous literature [19, 298]. Collins et al. (2013) [19] categorised
duration of symptoms to: 3-6, 6-12 and >12 months. Applying this method to this chapter
only revealed n= 10 for the first category thus the 3-6 months and 6-12 months categories
were combined For those participants lost to follow up without GROC and treatment
attendance data, outcomes were estimated using multiple imputations on the assumption
that data was missing at random. Twenty imputed datasets were created [535]. In addition to
the final analysis model variables, the imputation model included previous treatment at
baseline and worst numerical rating score (NRS) as predictive auxiliary variables (Table 5.6
and Table 5.7). A sensitivity analysis was conducted examining the differences between the
original and imputed datasets.
a b
Figure 5.10: Duration of pain a) Distribution of duration of pain; b) Normal Q-Q plot for duration of pain
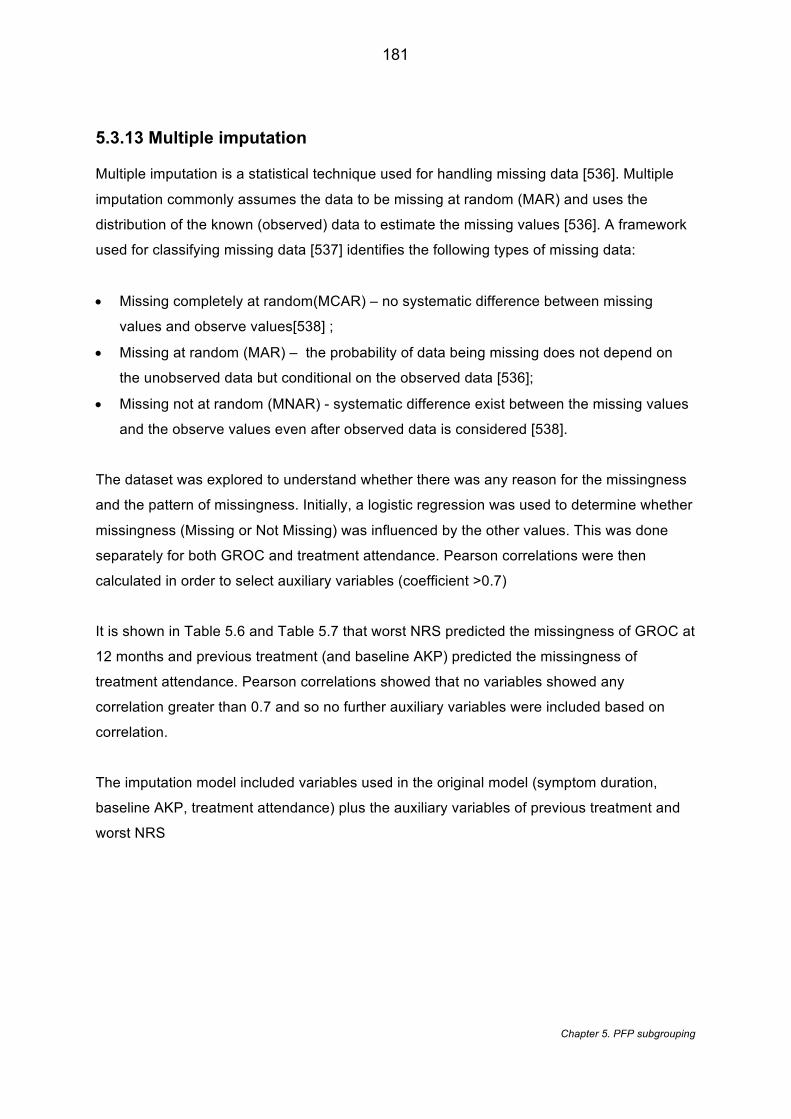
181
Chapter 5. PFP subgrouping
5.3.13 Multiple imputation
Multiple imputation is a statistical technique used for handling missing data [536]. Multiple
imputation commonly assumes the data to be missing at random (MAR) and uses the
distribution of the known (observed) data to estimate the missing values [536]. A framework
used for classifying missing data [537] identifies the following types of missing data:
• Missing completely at random(MCAR) – no systematic difference between missing
values and observe values[538] ;
• Missing at random (MAR) – the probability of data being missing does not depend on
the unobserved data but conditional on the observed data [536];
• Missing not at random (MNAR) - systematic difference exist between the missing values
and the observe values even after observed data is considered [538].
The dataset was explored to understand whether there was any reason for the missingness
and the pattern of missingness. Initially, a logistic regression was used to determine whether
missingness (Missing or Not Missing) was influenced by the other values. This was done
separately for both GROC and treatment attendance. Pearson correlations were then
calculated in order to select auxiliary variables (coefficient >0.7)
It is shown in Table 5.6 and Table 5.7 that worst NRS predicted the missingness of GROC at
12 months and previous treatment (and baseline AKP) predicted the missingness of
treatment attendance. Pearson correlations showed that no variables showed any
correlation greater than 0.7 and so no further auxiliary variables were included based on
correlation.
The imputation model included variables used in the original model (symptom duration,
baseline AKP, treatment attendance) plus the auxiliary variables of previous treatment and
worst NRS
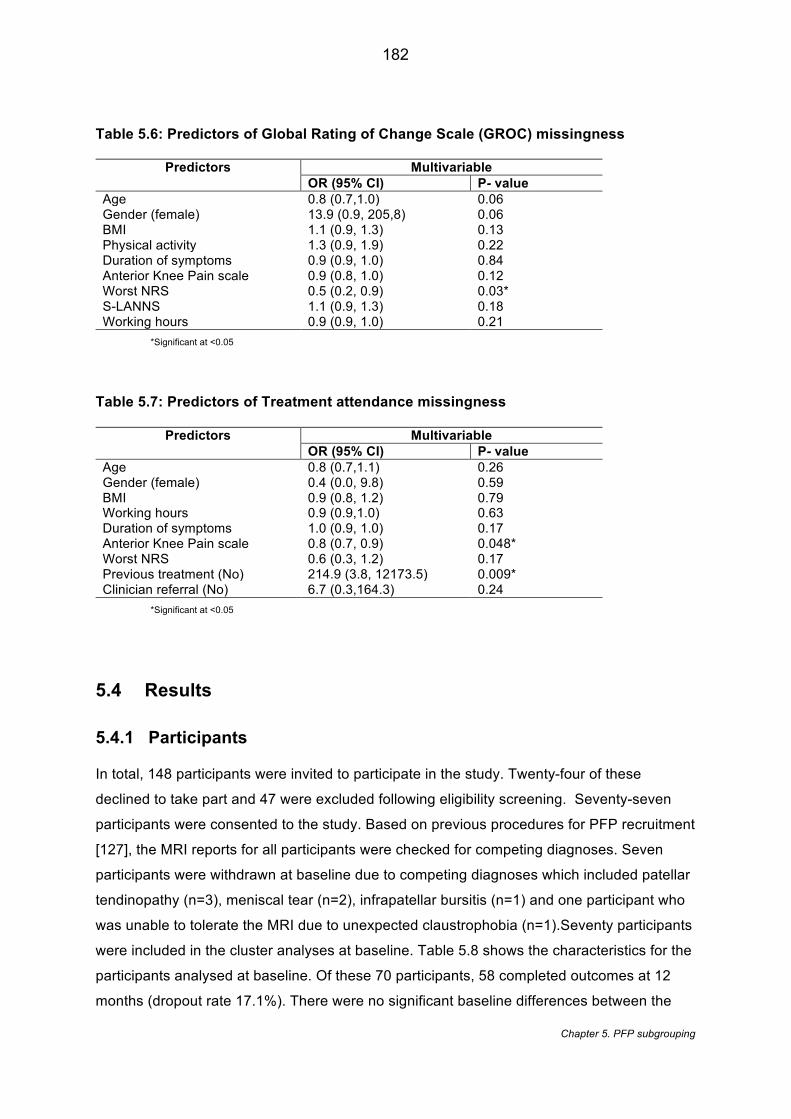
182
Chapter 5. PFP subgrouping
Table 5.6: Predictors of Global Rating of Change Scale (GROC) missingness
Predictors Multivariable OR (95% CI) P- value
Age 0.8 (0.7,1.0) 0.06 Gender (female) 13.9 (0.9, 205,8) 0.06 BMI 1.1 (0.9, 1.3) 0.13 Physical activity 1.3 (0.9, 1.9) 0.22 Duration of symptoms 0.9 (0.9, 1.0) 0.84 Anterior Knee Pain scale 0.9 (0.8, 1.0) 0.12 Worst NRS 0.5 (0.2, 0.9) 0.03* S-LANNS 1.1 (0.9, 1.3) 0.18 Working hours 0.9 (0.9, 1.0) 0.21
*Significant at <0.05
Table 5.7: Predictors of Treatment attendance missingness
Predictors Multivariable OR (95% CI) P- value
Age 0.8 (0.7,1.1) 0.26 Gender (female) 0.4 (0.0, 9.8) 0.59 BMI 0.9 (0.8, 1.2) 0.79 Working hours 0.9 (0.9,1.0) 0.63 Duration of symptoms 1.0 (0.9, 1.0) 0.17 Anterior Knee Pain scale 0.8 (0.7, 0.9) 0.048* Worst NRS 0.6 (0.3, 1.2) 0.17 Previous treatment (No) 214.9 (3.8, 12173.5) 0.009* Clinician referral (No) 6.7 (0.3,164.3) 0.24
*Significant at <0.05
5.4 Results
5.4.1 Participants
In total, 148 participants were invited to participate in the study. Twenty-four of these
declined to take part and 47 were excluded following eligibility screening. Seventy-seven
participants were consented to the study. Based on previous procedures for PFP recruitment
[127], the MRI reports for all participants were checked for competing diagnoses. Seven
participants were withdrawn at baseline due to competing diagnoses which included patellar
tendinopathy (n=3), meniscal tear (n=2), infrapatellar bursitis (n=1) and one participant who
was unable to tolerate the MRI due to unexpected claustrophobia (n=1).Seventy participants
were included in the cluster analyses at baseline. Table 5.8 shows the characteristics for the
participants analysed at baseline. Of these 70 participants, 58 completed outcomes at 12
months (dropout rate 17.1%). There were no significant baseline differences between the
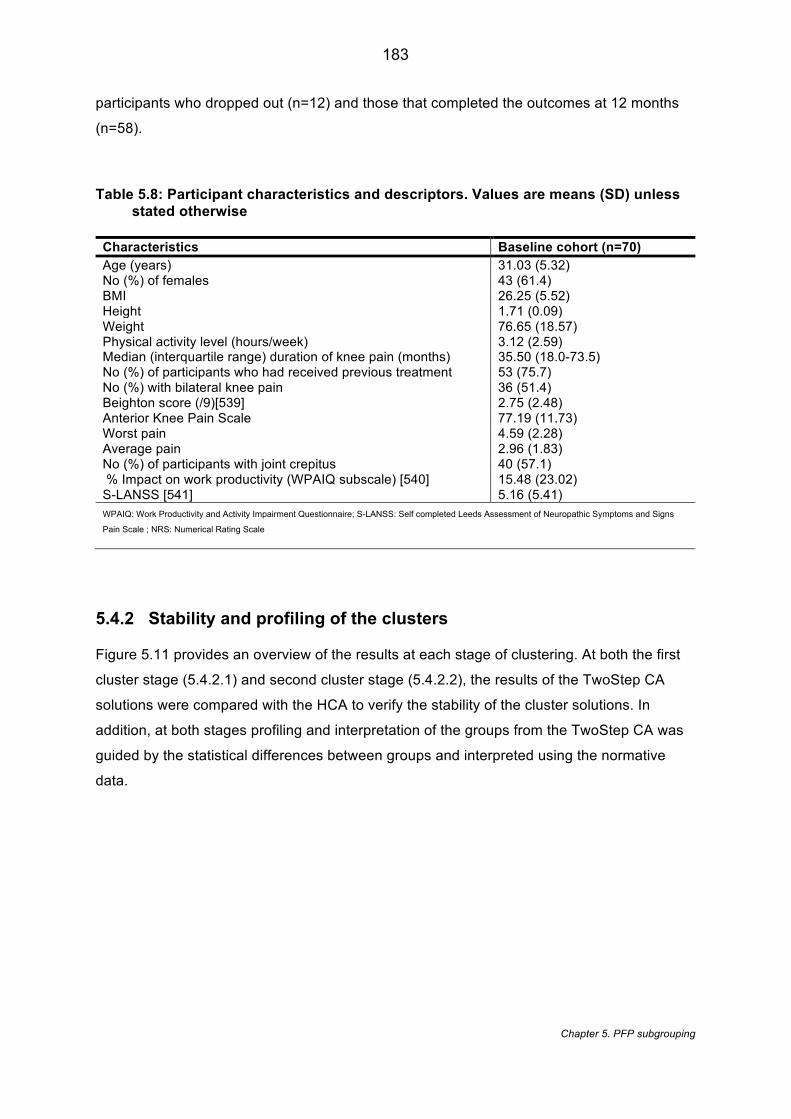
183
Chapter 5. PFP subgrouping
participants who dropped out (n=12) and those that completed the outcomes at 12 months
(n=58).
Table 5.8: Participant characteristics and descriptors. Values are means (SD) unless stated otherwise
Characteristics Baseline cohort (n=70) Age (years) 31.03 (5.32) No (%) of females 43 (61.4) BMI 26.25 (5.52) Height 1.71 (0.09) Weight 76.65 (18.57) Physical activity level (hours/week) 3.12 (2.59) Median (interquartile range) duration of knee pain (months) 35.50 (18.0-73.5) No (%) of participants who had received previous treatment 53 (75.7) No (%) with bilateral knee pain 36 (51.4) Beighton score (/9)[539] 2.75 (2.48) Anterior Knee Pain Scale 77.19 (11.73) Worst pain 4.59 (2.28) Average pain 2.96 (1.83) No (%) of participants with joint crepitus 40 (57.1) % Impact on work productivity (WPAIQ subscale) [540] 15.48 (23.02) S-LANSS [541] 5.16 (5.41) WPAIQ: Work Productivity and Activity Impairment Questionnaire; S-LANSS: Self completed Leeds Assessment of Neuropathic Symptoms and Signs
Pain Scale ; NRS: Numerical Rating Scale
5.4.2 Stability and profiling of the clusters
Figure 5.11 provides an overview of the results at each stage of clustering. At both the first
cluster stage (5.4.2.1) and second cluster stage (5.4.2.2), the results of the TwoStep CA
solutions were compared with the HCA to verify the stability of the cluster solutions. In
addition, at both stages profiling and interpretation of the groups from the TwoStep CA was
guided by the statistical differences between groups and interpreted using the normative
data.
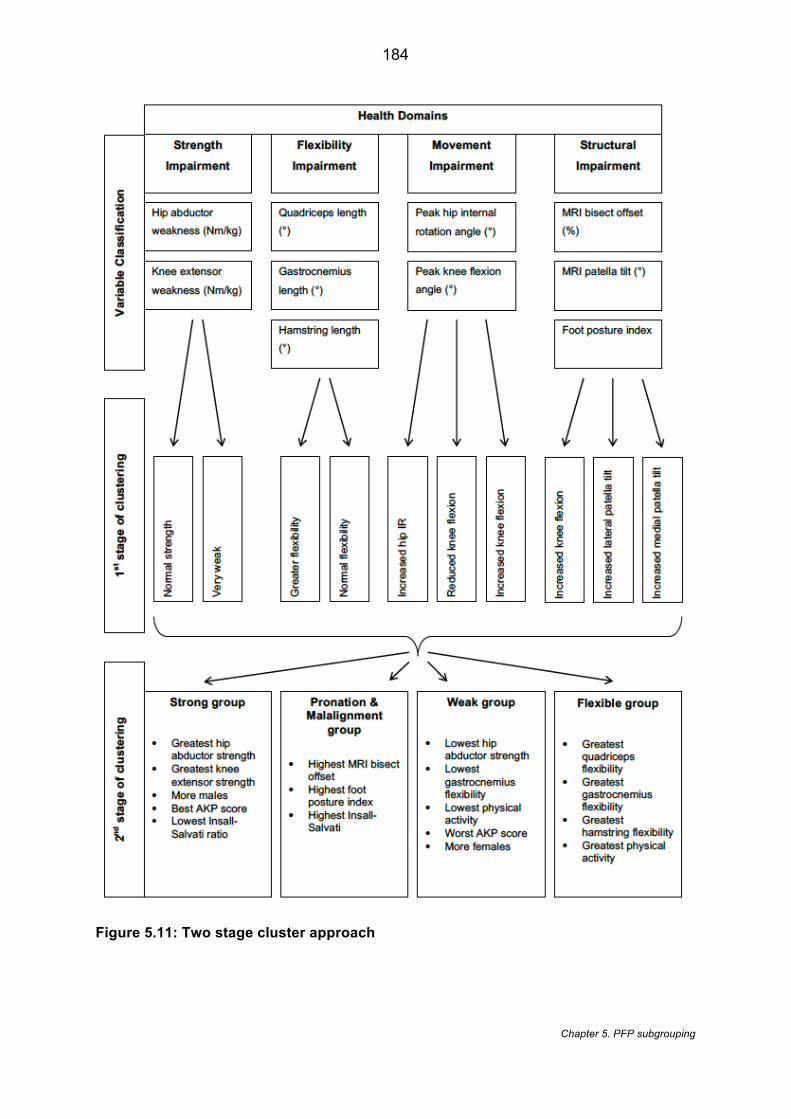
184
Chapter 5. PFP subgrouping
Figure 5.11: Two stage cluster approach
185
Chapter 5. PFP subgrouping
5.4.2.1 First cluster stage
5.4.2.1.1 Flexibility domain
The TwoStep CA identified a two cluster solution (Table 5.9) and the HCA a three cluster
solution (Table 5.10).The HCA proposed three clusters to account for the differences in
gastrocnemius and hamstring length. Being able to distinguish between a flexible hamstring
and flexible gastrocnemius group is unlikely to be clinically useful. Therefore, collapsing
down to a two-cluster solution appears preferential. The TwoStep CA shows that, statistically
all the variables in Group 1 were significantly greater than Group 2 despite the clinical profile
only indicating greater hamstring flexibility. Based on the TwoStep CA findings, Group 1 was
labelled ‘Greater Flexibility’ and Group 2 ‘Normal Flexibility’.
5.4.2.1.2 Strength domain
The TwoStep (Table 5.11) and HCA (Table 5.12) proposed the same number of clusters and
yielded the same clinical and statistical profiles. The TwoStep provides a more equal
distribution across the two groups. The clinical and statistical profile mimic each other with
the clinical profile providing context to the results suggesting the Group 1 is ‘Normal
strength’ and Group 2 is ‘Very weak’.
5.4.2.1.3 Movement domain
Both cluster methods proposed a three cluster solution (Table 5.13 and Table 5.14). Group 1
from the TwoStep CA is similar to Group 3 from the HCA. Both show a statistically significant
increase in hip internal rotation angle without it being considered to have clinically increased.
The TwoStep CA, shows that Group 1 differed statistically from each of the other two groups
in terms of peak knee flexion and peak hip internal rotation. Group 2 is similar in both cluster
methods except that the findings of the HCA showed no statistical difference for peak knee
flexion angle. In terms of the TwoStep CA, Group 2 differed statistically from each of the
other two groups in terms of peak knee flexion and based on the normative data it’s also
borderline (+1SD) in terms of showing an increase in peak knee flexion. Group 3 is similar to
Group 1 from HCA. Both showed a statistical and clinical reduction in knee flexion. Based on
all these findings, Group 1 was labelled ‘Increased hip internal rotation’, Group 2 labelled
‘Increased knee flexion’ and Group 3 labelled ‘Reduced knee flexion.
186
Chapter 5. PFP subgrouping
5.4.2.1.4 Structural domain
The TwoStep CA proposed a three-cluster solution (Table 5.15) whereas the HCA
(Table 5.16) proposed two cluster solution. By applying a three-cluster solution, a third
cluster (Group 3) represents individuals with a PTA value indicating more medial bias which
is lost if the solution is constrained to only two clusters. Using the TwoStep CA solution,
Group 1 was statistically different to all other groups for BSO and FPI and the clinical profile
suggests excessive scores for all variables based on the defined thresholds. Group 2
clinically has increased patella tilt angle but the mean value was very similar to Group 1
(10.7º vs 10.3º). Group 3 shows an increased medial tilt which was statistically significant
but no clinical thresholds exists for medial bias so labelling was led solely by the statistics.
Based on these findings, Group 1 was labelled ‘Increased BSO and FPI’, Group 2 labelled
‘Normal’ and Group 3 labelled ‘Increased medial PTA’.
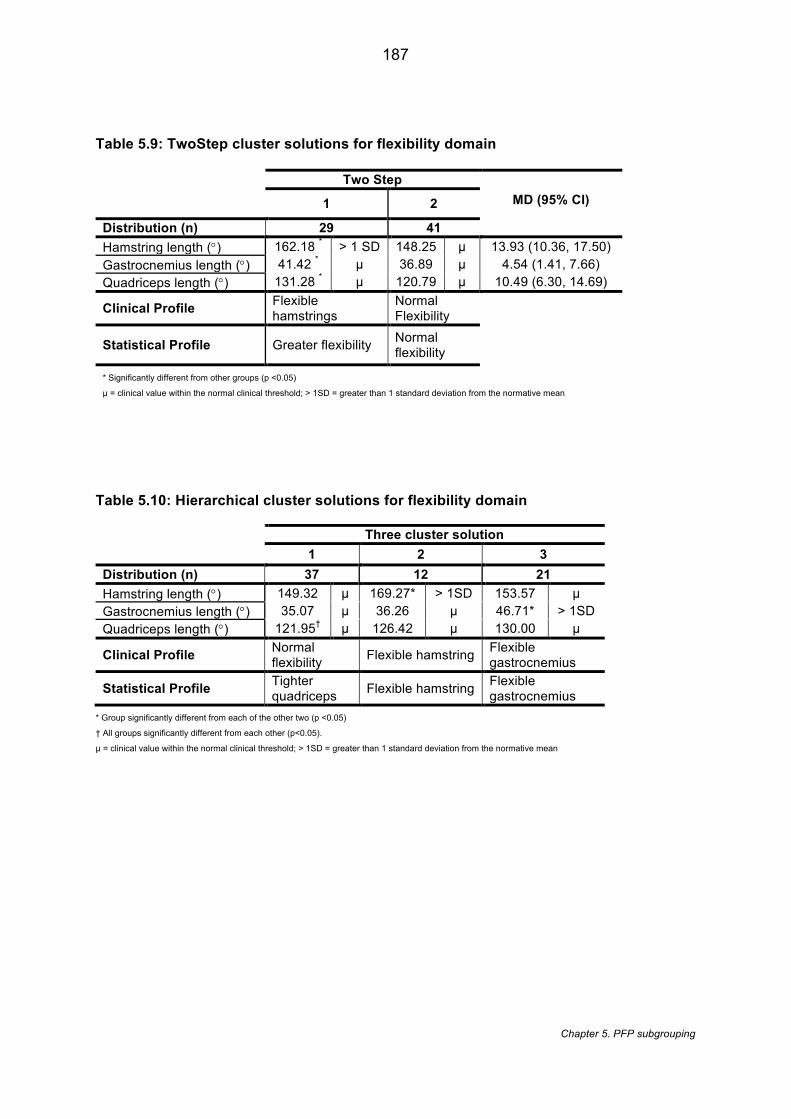
187
Chapter 5. PFP subgrouping
Table 5.9: TwoStep cluster solutions for flexibility domain
Two Step MD (95% CI) 1 2
Distribution (n) 29 41 Hamstring length (°) 162.18 * > 1 SD 148.25 µ 13.93 (10.36, 17.50) Gastrocnemius length (°) 41.42 * µ 36.89 µ 4.54 (1.41, 7.66) Quadriceps length (°) 131.28 * µ 120.79 µ 10.49 (6.30, 14.69)
Clinical Profile Flexible hamstrings
Normal Flexibility
Statistical Profile Greater flexibility Normal flexibility
* Significantly different from other groups (p <0.05)
µ = clinical value within the normal clinical threshold; > 1SD = greater than 1 standard deviation from the normative mean
Table 5.10: Hierarchical cluster solutions for flexibility domain Three cluster solution 1 2 3
Distribution (n) 37 12 21 Hamstring length (°) 149.32 µ 169.27* > 1SD 153.57 µ Gastrocnemius length (°) 35.07 µ 36.26 µ 46.71* > 1SD Quadriceps length (°) 121.95† µ 126.42 µ 130.00 µ
Clinical Profile Normal flexibility Flexible hamstring Flexible
gastrocnemius
Statistical Profile Tighter quadriceps Flexible hamstring Flexible
gastrocnemius * Group significantly different from each of the other two (p <0.05)
† All groups significantly different from each other (p<0.05). µ = clinical value within the normal clinical threshold; > 1SD = greater than 1 standard deviation from the normative mean
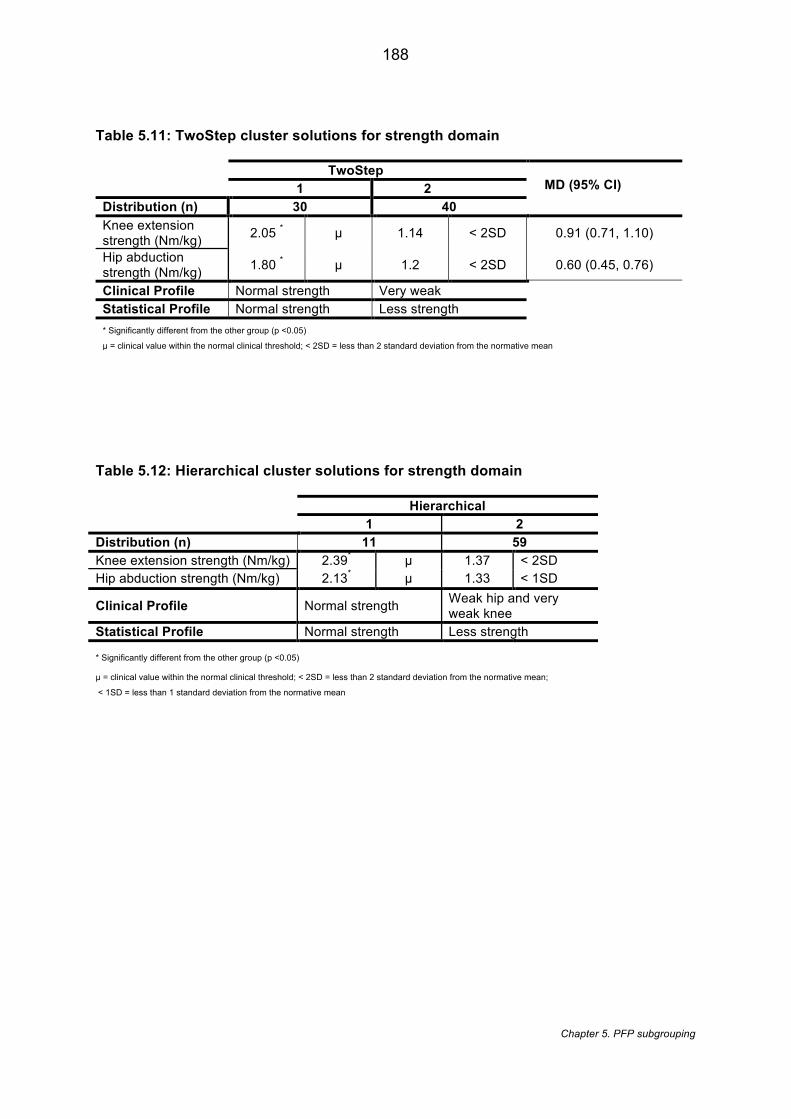
188
Chapter 5. PFP subgrouping
Table 5.11: TwoStep cluster solutions for strength domain
TwoStep MD (95% CI) 1 2
Distribution (n) 30 40 Knee extension strength (Nm/kg) 2.05 * µ 1.14 < 2SD 0.91 (0.71, 1.10)
Hip abduction strength (Nm/kg) 1.80 * µ 1.2 < 2SD 0.60 (0.45, 0.76)
Clinical Profile Normal strength Very weak Statistical Profile Normal strength Less strength * Significantly different from the other group (p <0.05)
µ = clinical value within the normal clinical threshold; < 2SD = less than 2 standard deviation from the normative mean
Table 5.12: Hierarchical cluster solutions for strength domain
Hierarchical 1 2
Distribution (n) 11 59 Knee extension strength (Nm/kg) 2.39* µ 1.37 < 2SD Hip abduction strength (Nm/kg) 2.13* µ 1.33 < 1SD
Clinical Profile Normal strength Weak hip and very weak knee
Statistical Profile Normal strength Less strength
* Significantly different from the other group (p <0.05) µ = clinical value within the normal clinical threshold; < 2SD = less than 2 standard deviation from the normative mean;
< 1SD = less than 1 standard deviation from the normative mean
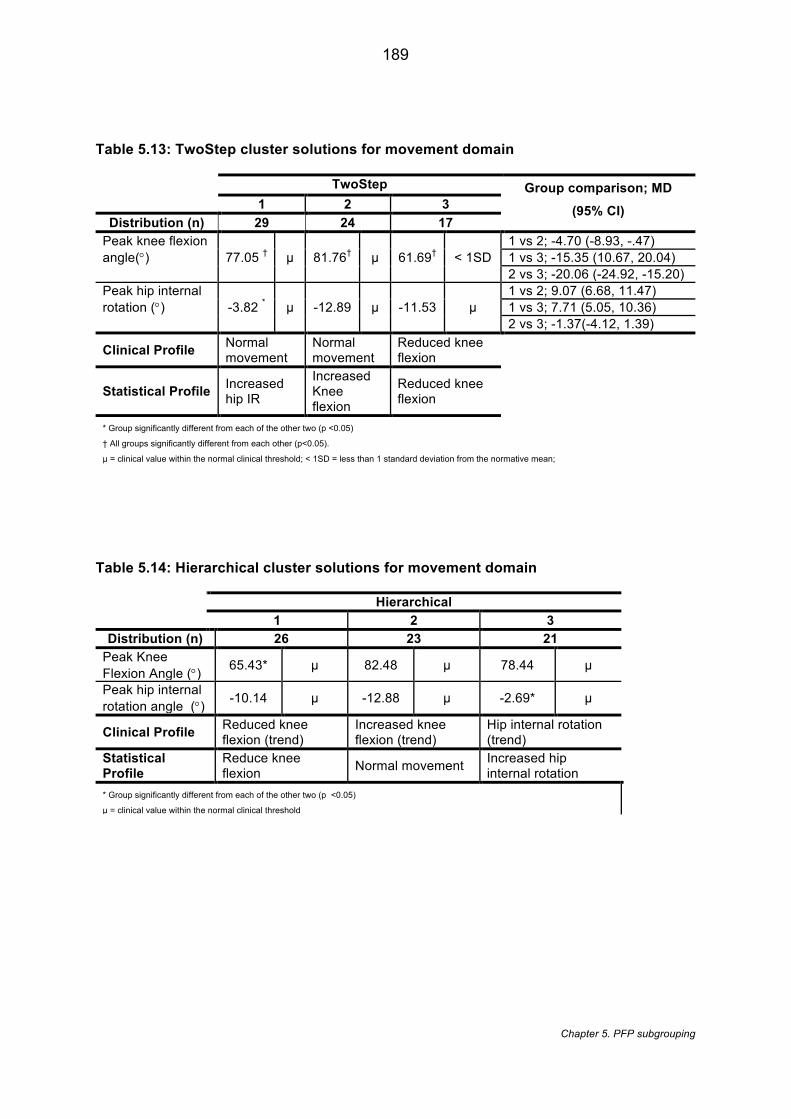
189
Chapter 5. PFP subgrouping
Table 5.13: TwoStep cluster solutions for movement domain
TwoStep Group comparison; MD
(95% CI) 1 2 3 Distribution (n) 29 24 17
Peak knee flexion angle(°) 77.05 † µ 81.76† µ 61.69† < 1SD
1 vs 2; -4.70 (-8.93, -.47) 1 vs 3; -15.35 (10.67, 20.04) 2 vs 3; -20.06 (-24.92, -15.20)
Peak hip internal rotation (°) -3.82 * µ -12.89 µ -11.53 µ
1 vs 2; 9.07 (6.68, 11.47) 1 vs 3; 7.71 (5.05, 10.36) 2 vs 3; -1.37(-4.12, 1.39)
Clinical Profile Normal movement
Normal movement
Reduced knee flexion
Statistical Profile Increased hip IR
Increased Knee flexion
Reduced knee flexion
* Group significantly different from each of the other two (p <0.05) † All groups significantly different from each other (p<0.05).
µ = clinical value within the normal clinical threshold; < 1SD = less than 1 standard deviation from the normative mean;
Table 5.14: Hierarchical cluster solutions for movement domain
Hierarchical 1 2 3
Distribution (n) 26 23 21 Peak Knee Flexion Angle (°) 65.43* µ 82.48 µ 78.44 µ
Peak hip internal rotation angle (°) -10.14 µ -12.88 µ -2.69* µ
Clinical Profile Reduced knee flexion (trend)
Increased knee flexion (trend)
Hip internal rotation (trend)
Statistical Profile
Reduce knee flexion Normal movement Increased hip
internal rotation * Group significantly different from each of the other two (p <0.05)
µ = clinical value within the normal clinical threshold
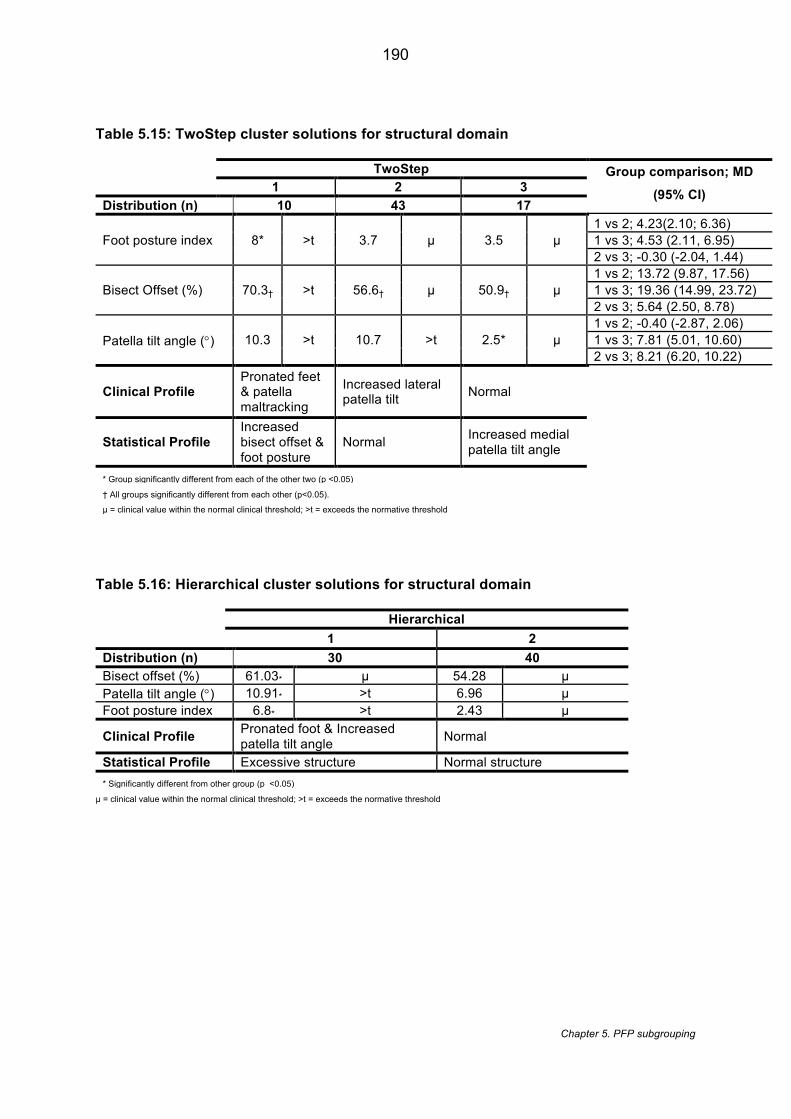
190
Chapter 5. PFP subgrouping
Table 5.15: TwoStep cluster solutions for structural domain
TwoStep Group comparison; MD
(95% CI) 1 2 3 Distribution (n) 10 43 17
Foot posture index 8* >t 3.7 µ 3.5 µ 1 vs 2; 4.23(2.10; 6.36) 1 vs 3; 4.53 (2.11, 6.95) 2 vs 3; -0.30 (-2.04, 1.44)
Bisect Offset (%) 70.3† >t 56.6† µ 50.9† µ 1 vs 2; 13.72 (9.87, 17.56) 1 vs 3; 19.36 (14.99, 23.72) 2 vs 3; 5.64 (2.50, 8.78)
Patella tilt angle (°) 10.3 >t 10.7 >t 2.5* µ 1 vs 2; -0.40 (-2.87, 2.06) 1 vs 3; 7.81 (5.01, 10.60) 2 vs 3; 8.21 (6.20, 10.22)
Clinical Profile Pronated feet & patella maltracking
Increased lateral patella tilt Normal
Statistical Profile Increased bisect offset & foot posture
Normal Increased medial patella tilt angle
* Group significantly different from each of the other two (p <0.05)
† All groups significantly different from each other (p<0.05).
µ = clinical value within the normal clinical threshold; >t = exceeds the normative threshold
Table 5.16: Hierarchical cluster solutions for structural domain
Hierarchical 1 2
Distribution (n) 30 40 Bisect offset (%) 61.03* µ 54.28 µ Patella tilt angle (°) 10.91* >t 6.96 µ Foot posture index 6.8* >t 2.43 µ
Clinical Profile Pronated foot & Increased patella tilt angle Normal
Statistical Profile Excessive structure Normal structure * Significantly different from other group (p <0.05)
µ = clinical value within the normal clinical threshold; >t = exceeds the normative threshold
191
Chapter 5. PFP subgrouping
5.4.2.2 Second cluster stage
During the second cluster stage, four groups were identified from the cluster patterns
(Table 5.17). This cluster solution was compared to the random case ordering showing a
substantial agreement [529] between orders, k = 0.68 ( p< 0.001, 95% Confidence Intervals
[CI] 0.55, 0.81). Comparison with the output from the HCA cluster solution (Table 5.18)
showed a moderate agreement, k = 0.59 (p < 0.001, 95% CI 0.46, 0.73). Profiling of the
clusters identified the following groups:
5.4.2.2.1 Strong group
The Strong group showed a significantly greater hip abductor (1.8 Nm/kg) and knee
extensor strength (2.1 Nm/kg) compared to each of the other groups. Their gastrocnemius
flexibility was also significantly greater compared to the Weak group (40.5 ° vs 35.0°). Based
on the clinical thresholds, this group demonstrated all variables within normal limits including
the strength measures. This group had significantly more males (59.3% vs 9.1%) and
significantly less functional disability (i.e. higher AKP) compared to the Weak group (82.4 vs
73). They also had a significantly smaller Insall-Salvati ratio compared to the Pronation &
Malalignment group (1.2 vs 1.4) and the greatest patellofemoral contact area (154.1 mm2)
(non-significant).
5.4.2.2.2 Pronation & Malalignment group
The Pronation & Malalignment group showed the largest BSO (73.6%) and FPI (8.0) which
was statistically significant compared to each of the other groups. Based on the clinical
thresholds, this group showed a mean BSO and FPI value that exceeded the defined
thresholds suggesting increased patella malalignment and foot pronation. In addition,
clinically they exceeded the defined normative threshold for PTA (10.3°) and demonstrated
marked weakness in hip abductor strength (< 2 SD) and moderate weakness in knee
extensor strength (< 1 SD). This group showed the highest BMI (29.4 kg/m2) and duration of
symptoms (73.9 months) but neither was statistically significant across groups. They showed
the highest Insall-Salvati ratio which was significantly greater than the Strong group and the
lowest patellofemoral contact area (109.5 mm2) (non-significant). Within this group, 30% and
40% of the group had MRI defined osteophytes and PFOA respectively. Compared to all
other groups, both these variables showed a p-value of 0.02 but this was not considered
statistically significant based on Bonferroni adjustment (p <0.008).
192
Chapter 5. PFP subgrouping
5.4.2.2.3 Weak group
The Weak group demonstrated the least hip abductor strength (1.1 Nm/kg) and knee
extensor strength (1.0 Nm/kg) but with only the hip abductor strength showing statistical
significance between the Flexible and Strong group This group also demonstrated the least
gastrocnemius flexibility which was significantly lower compared to the Strong group. Based
on the clinical thresholds, this group demonstrated marked weakness for both hip abductor
(< 2 SD) and knee extensor strength (<2 SD) with all other variables within normal limits.
This group comprised of a significant number of females (90.9%), with the lowest AKPS
compared to the Strong group. They also demonstrated significantly lower physical activity
compared to the Flexible group (1.7 vs 4.9 hours/ week).
5.4.2.2.4 Flexible group
The Flexible group demonstrated the greatest quadriceps (135.7°), gastrocnemius (43.4°)
and hamstring flexibility (158.0°) with quadriceps being statistically different to each of the
other groups and gastrocnemius and hamstring statistically different to the Weak group.
Based on the clinical thresholds, this group demonstrated greater flexibility for
gastrocnemius (> 1 SD) and hamstrings (> 1 SD) in addition to a moderate weakness in hip
abductor strength (< 1 SD) and knee extensor strength (< 1 SD). All the other variables were
within normal limits including quadriceps flexibility. This group was significantly more
physically active compared to the Weak group.
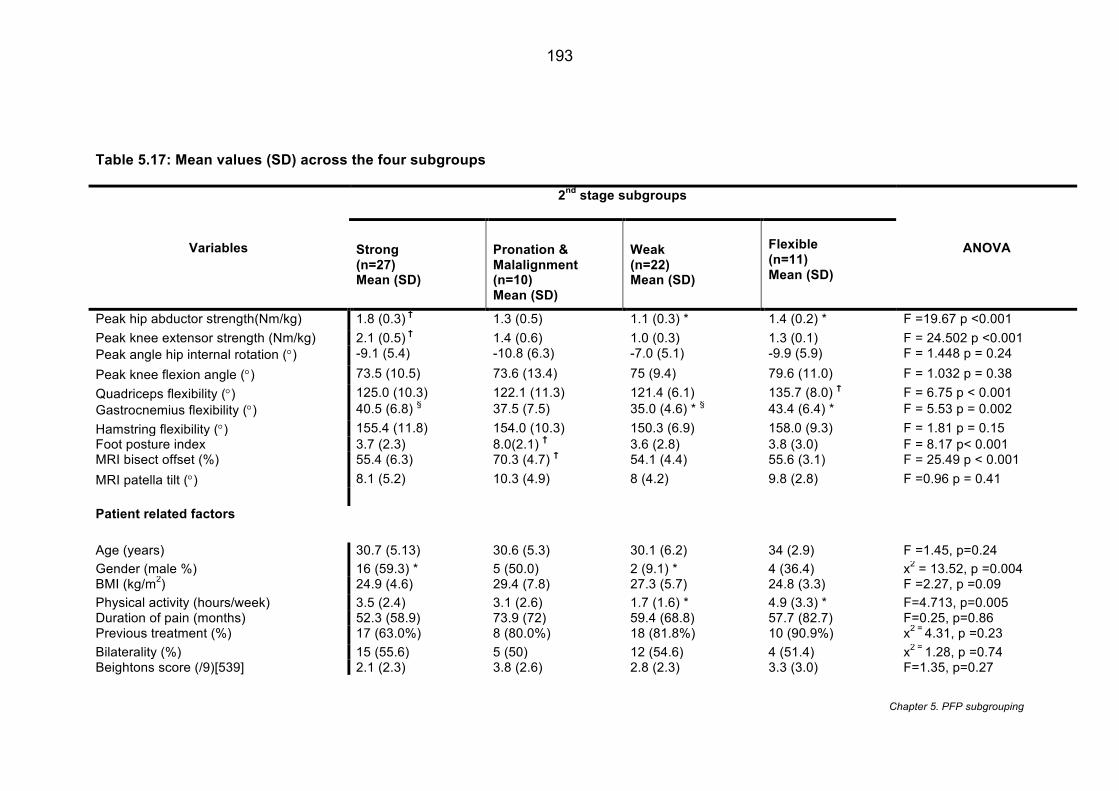
193
Chapter 5. PFP subgrouping
Table 5.17: Mean values (SD) across the four subgroups
Variables
2nd stage subgroups
ANOVA Strong (n=27) Mean (SD)
Pronation & Malalignment (n=10) Mean (SD)
Weak (n=22) Mean (SD)
Flexible (n=11) Mean (SD)
Peak hip abductor strength(Nm/kg) 1.8 (0.3) † 1.3 (0.5) 1.1 (0.3) * 1.4 (0.2) * F =19.67 p <0.001 Peak knee extensor strength (Nm/kg) 2.1 (0.5) † 1.4 (0.6) 1.0 (0.3) 1.3 (0.1) F = 24.502 p <0.001 Peak angle hip internal rotation (°) -9.1 (5.4) -10.8 (6.3) -7.0 (5.1) -9.9 (5.9) F = 1.448 p = 0.24 Peak knee flexion angle (°) 73.5 (10.5) 73.6 (13.4) 75 (9.4) 79.6 (11.0) F = 1.032 p = 0.38 Quadriceps flexibility (°) 125.0 (10.3) 122.1 (11.3) 121.4 (6.1) 135.7 (8.0) † F = 6.75 p < 0.001 Gastrocnemius flexibility (°) 40.5 (6.8) § 37.5 (7.5) 35.0 (4.6) * § 43.4 (6.4) * F = 5.53 p = 0.002 Hamstring flexibility (°) 155.4 (11.8) 154.0 (10.3) 150.3 (6.9) 158.0 (9.3) F = 1.81 p = 0.15 Foot posture index 3.7 (2.3) 8.0(2.1) † 3.6 (2.8) 3.8 (3.0) F = 8.17 p< 0.001 MRI bisect offset (%) 55.4 (6.3) 70.3 (4.7) † 54.1 (4.4) 55.6 (3.1) F = 25.49 p < 0.001 MRI patella tilt (°) 8.1 (5.2) 10.3 (4.9) 8 (4.2) 9.8 (2.8) F =0.96 p = 0.41 Patient related factors Age (years) 30.7 (5.13) 30.6 (5.3) 30.1 (6.2) 34 (2.9) F =1.45, p=0.24 Gender (male %) 16 (59.3) * 5 (50.0) 2 (9.1) * 4 (36.4) x2 = 13.52, p =0.004 BMI (kg/m2) 24.9 (4.6) 29.4 (7.8) 27.3 (5.7) 24.8 (3.3) F =2.27, p =0.09 Physical activity (hours/week) 3.5 (2.4) 3.1 (2.6) 1.7 (1.6) * 4.9 (3.3) * F=4.713, p=0.005 Duration of pain (months) 52.3 (58.9) 73.9 (72) 59.4 (68.8) 57.7 (82.7) F=0.25, p=0.86 Previous treatment (%) 17 (63.0%) 8 (80.0%) 18 (81.8%) 10 (90.9%) x2 = 4.31, p =0.23 Bilaterality (%) 15 (55.6) 5 (50) 12 (54.6) 4 (51.4) x2 = 1.28, p =0.74 Beightons score (/9)[539] 2.1 (2.3) 3.8 (2.6) 2.8 (2.3) 3.3 (3.0) F=1.35, p=0.27
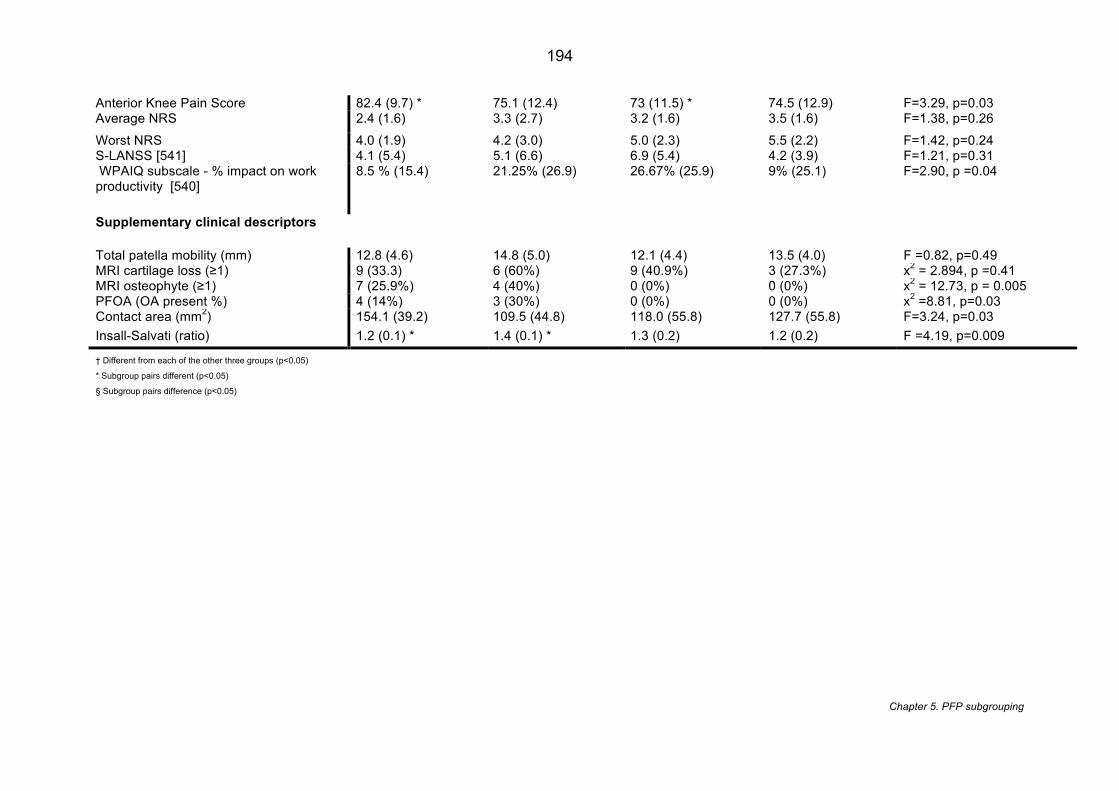
194
Chapter 5. PFP subgrouping
Anterior Knee Pain Score 82.4 (9.7) * 75.1 (12.4) 73 (11.5) * 74.5 (12.9) F=3.29, p=0.03 Average NRS 2.4 (1.6) 3.3 (2.7) 3.2 (1.6) 3.5 (1.6) F=1.38, p=0.26 Worst NRS 4.0 (1.9) 4.2 (3.0) 5.0 (2.3) 5.5 (2.2) F=1.42, p=0.24 S-LANSS [541] 4.1 (5.4) 5.1 (6.6) 6.9 (5.4) 4.2 (3.9) F=1.21, p=0.31 WPAIQ subscale - % impact on work productivity [540]
8.5 % (15.4) 21.25% (26.9) 26.67% (25.9) 9% (25.1) F=2.90, p =0.04
Supplementary clinical descriptors Total patella mobility (mm) 12.8 (4.6) 14.8 (5.0) 12.1 (4.4) 13.5 (4.0) F =0.82, p=0.49 MRI cartilage loss (≥1) 9 (33.3) 6 (60%) 9 (40.9%) 3 (27.3%) x2 = 2.894, p =0.41 MRI osteophyte (≥1) 7 (25.9%) 4 (40%) 0 (0%) 0 (0%) x2 = 12.73, p = 0.005 PFOA (OA present %) 4 (14%) 3 (30%) 0 (0%) 0 (0%) x2 =8.81, p=0.03 Contact area (mm2) 154.1 (39.2) 109.5 (44.8) 118.0 (55.8) 127.7 (55.8) F=3.24, p=0.03 Insall-Salvati (ratio) 1.2 (0.1) * 1.4 (0.1) * 1.3 (0.2) 1.2 (0.2) F =4.19, p=0.009
† Different from each of the other three groups (p<0.05)
* Subgroup pairs different (p<0.05)
§ Subgroup pairs difference (p<0.05)
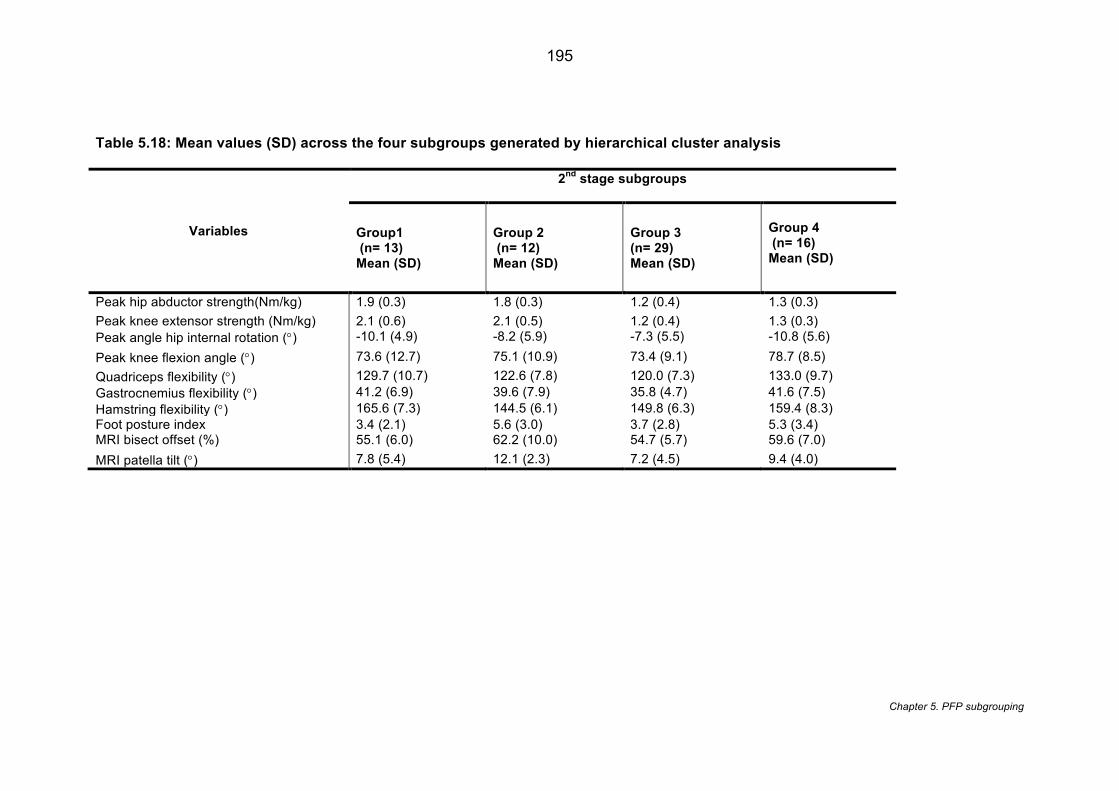
195
Chapter 5. PFP subgrouping
Table 5.18: Mean values (SD) across the four subgroups generated by hierarchical cluster analysis
Variables
2nd stage subgroups
Group1 (n= 13) Mean (SD)
Group 2 (n= 12) Mean (SD)
Group 3 (n= 29) Mean (SD)
Group 4 (n= 16) Mean (SD)
Peak hip abductor strength(Nm/kg) 1.9 (0.3) 1.8 (0.3) 1.2 (0.4) 1.3 (0.3) Peak knee extensor strength (Nm/kg) 2.1 (0.6) 2.1 (0.5) 1.2 (0.4) 1.3 (0.3) Peak angle hip internal rotation (°) -10.1 (4.9) -8.2 (5.9) -7.3 (5.5) -10.8 (5.6) Peak knee flexion angle (°) 73.6 (12.7) 75.1 (10.9) 73.4 (9.1) 78.7 (8.5) Quadriceps flexibility (°) 129.7 (10.7) 122.6 (7.8) 120.0 (7.3) 133.0 (9.7) Gastrocnemius flexibility (°) 41.2 (6.9) 39.6 (7.9) 35.8 (4.7) 41.6 (7.5) Hamstring flexibility (°) 165.6 (7.3) 144.5 (6.1) 149.8 (6.3) 159.4 (8.3) Foot posture index 3.4 (2.1) 5.6 (3.0) 3.7 (2.8) 5.3 (3.4) MRI bisect offset (%) 55.1 (6.0) 62.2 (10.0) 54.7 (5.7) 59.6 (7.0) MRI patella tilt (°) 7.8 (5.4) 12.1 (2.3) 7.2 (4.5) 9.4 (4.0)
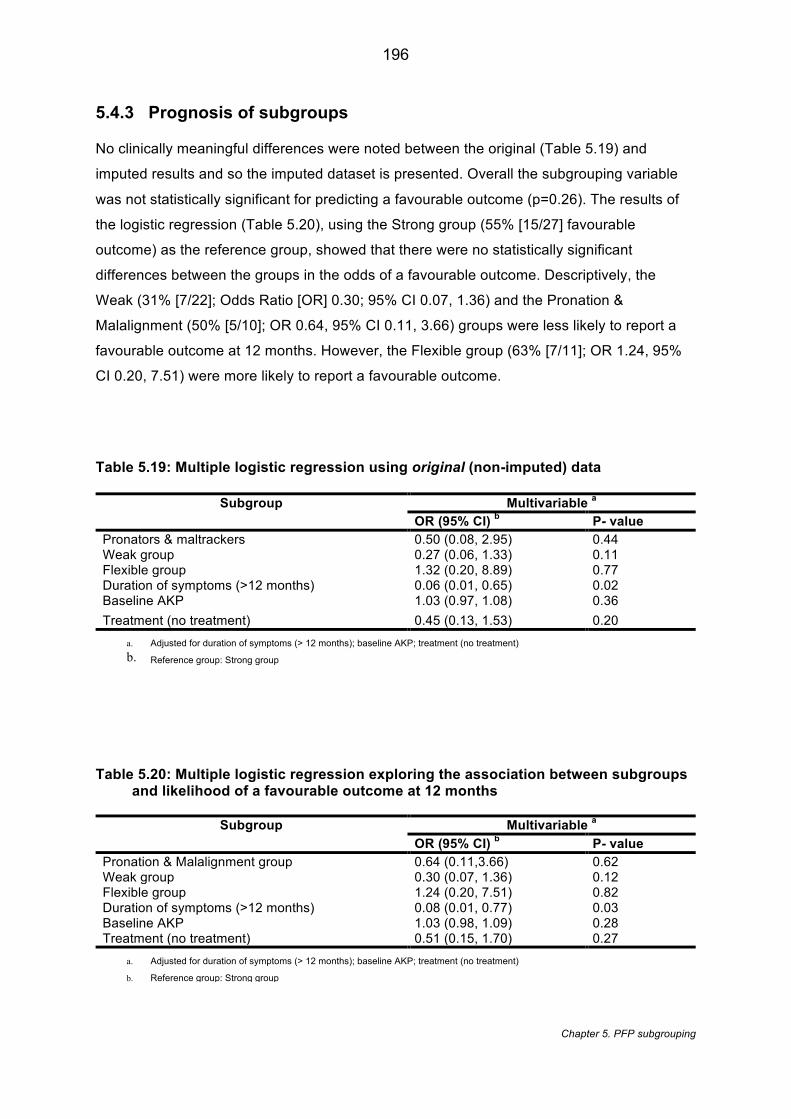
196
Chapter 5. PFP subgrouping
5.4.3 Prognosis of subgroups
No clinically meaningful differences were noted between the original (Table 5.19) and
imputed results and so the imputed dataset is presented. Overall the subgrouping variable
was not statistically significant for predicting a favourable outcome (p=0.26). The results of
the logistic regression (Table 5.20), using the Strong group (55% [15/27] favourable
outcome) as the reference group, showed that there were no statistically significant
differences between the groups in the odds of a favourable outcome. Descriptively, the
Weak (31% [7/22]; Odds Ratio [OR] 0.30; 95% CI 0.07, 1.36) and the Pronation &
Malalignment (50% [5/10]; OR 0.64, 95% CI 0.11, 3.66) groups were less likely to report a
favourable outcome at 12 months. However, the Flexible group (63% [7/11]; OR 1.24, 95%
CI 0.20, 7.51) were more likely to report a favourable outcome.
Table 5.19: Multiple logistic regression using original (non-imputed) data
Subgroup Multivariable a
OR (95% CI) b P- value
Pronators & maltrackers 0.50 (0.08, 2.95) 0.44 Weak group 0.27 (0.06, 1.33) 0.11 Flexible group 1.32 (0.20, 8.89) 0.77 Duration of symptoms (>12 months) 0.06 (0.01, 0.65) 0.02 Baseline AKP 1.03 (0.97, 1.08) 0.36 Treatment (no treatment) 0.45 (0.13, 1.53) 0.20
a. Adjusted for duration of symptoms (> 12 months); baseline AKP; treatment (no treatment) b. Reference group: Strong group
Table 5.20: Multiple logistic regression exploring the association between subgroups and likelihood of a favourable outcome at 12 months
Subgroup Multivariable a
OR (95% CI) b P- value
Pronation & Malalignment group 0.64 (0.11,3.66) 0.62 Weak group 0.30 (0.07, 1.36) 0.12 Flexible group 1.24 (0.20, 7.51) 0.82 Duration of symptoms (>12 months) 0.08 (0.01, 0.77) 0.03 Baseline AKP 1.03 (0.98, 1.09) 0.28 Treatment (no treatment) 0.51 (0.15, 1.70) 0.27
a. Adjusted for duration of symptoms (> 12 months); baseline AKP; treatment (no treatment)
b. Reference group: Strong group
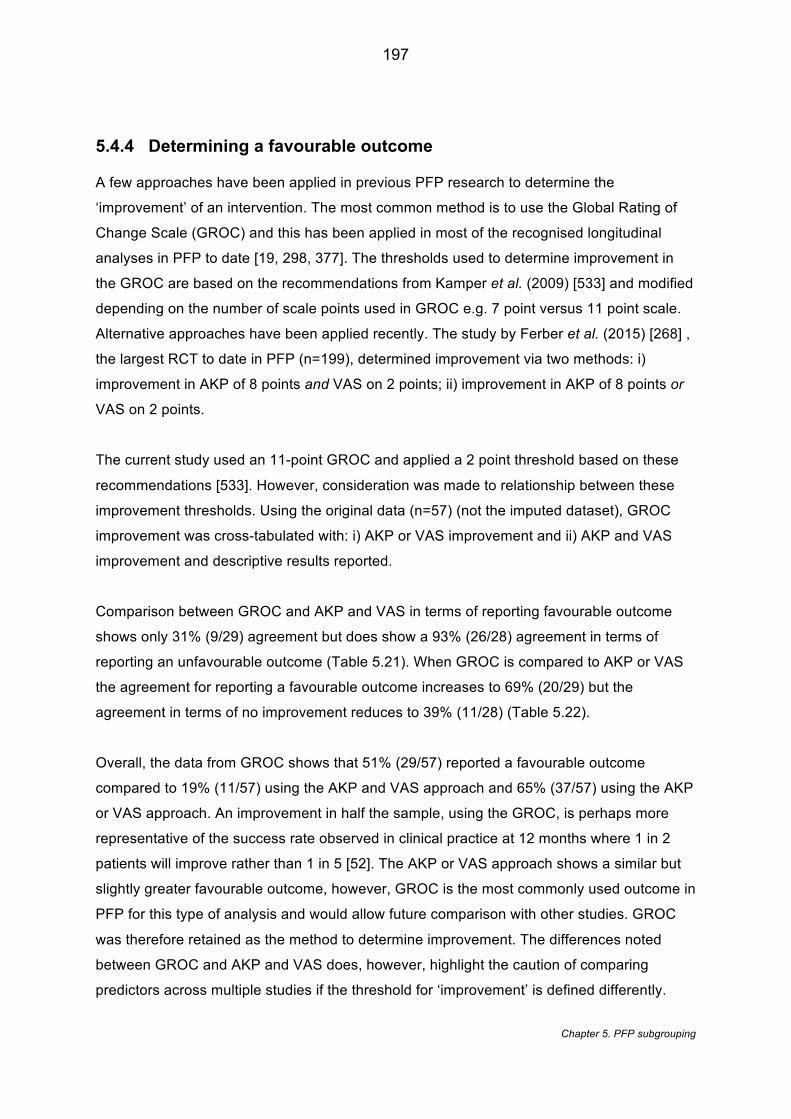
197
Chapter 5. PFP subgrouping
5.4.4 Determining a favourable outcome
A few approaches have been applied in previous PFP research to determine the
‘improvement’ of an intervention. The most common method is to use the Global Rating of
Change Scale (GROC) and this has been applied in most of the recognised longitudinal
analyses in PFP to date [19, 298, 377]. The thresholds used to determine improvement in
the GROC are based on the recommendations from Kamper et al. (2009) [533] and modified
depending on the number of scale points used in GROC e.g. 7 point versus 11 point scale.
Alternative approaches have been applied recently. The study by Ferber et al. (2015) [268] ,
the largest RCT to date in PFP (n=199), determined improvement via two methods: i)
improvement in AKP of 8 points and VAS on 2 points; ii) improvement in AKP of 8 points or
VAS on 2 points.
The current study used an 11-point GROC and applied a 2 point threshold based on these
recommendations [533]. However, consideration was made to relationship between these
improvement thresholds. Using the original data (n=57) (not the imputed dataset), GROC
improvement was cross-tabulated with: i) AKP or VAS improvement and ii) AKP and VAS
improvement and descriptive results reported.
Comparison between GROC and AKP and VAS in terms of reporting favourable outcome
shows only 31% (9/29) agreement but does show a 93% (26/28) agreement in terms of
reporting an unfavourable outcome (Table 5.21). When GROC is compared to AKP or VAS
the agreement for reporting a favourable outcome increases to 69% (20/29) but the
agreement in terms of no improvement reduces to 39% (11/28) (Table 5.22).
Overall, the data from GROC shows that 51% (29/57) reported a favourable outcome
compared to 19% (11/57) using the AKP and VAS approach and 65% (37/57) using the AKP
or VAS approach. An improvement in half the sample, using the GROC, is perhaps more
representative of the success rate observed in clinical practice at 12 months where 1 in 2
patients will improve rather than 1 in 5 [52]. The AKP or VAS approach shows a similar but
slightly greater favourable outcome, however, GROC is the most commonly used outcome in
PFP for this type of analysis and would allow future comparison with other studies. GROC
was therefore retained as the method to determine improvement. The differences noted
between GROC and AKP and VAS does, however, highlight the caution of comparing
predictors across multiple studies if the threshold for ‘improvement’ is defined differently.
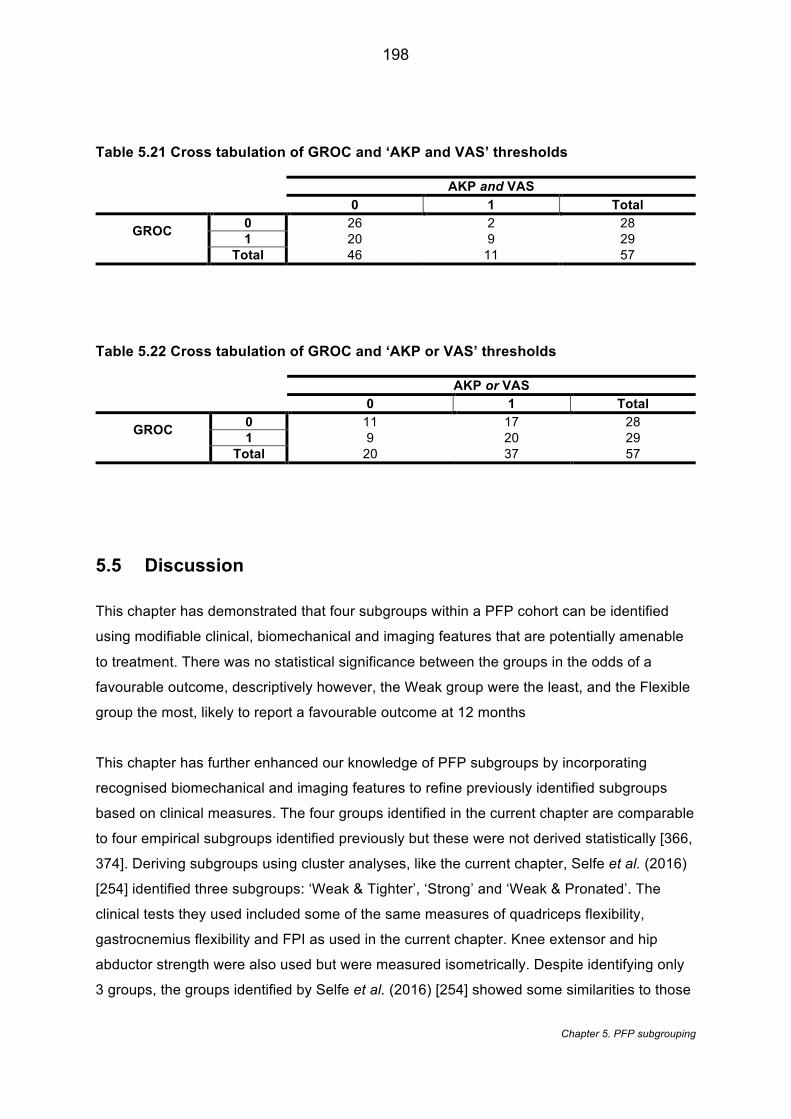
198
Chapter 5. PFP subgrouping
Table 5.21 Cross tabulation of GROC and ‘AKP and VAS’ thresholds AKP and VAS
0 1 Total
GROC 0 26 2 28 1 20 9 29
Total 46 11 57
Table 5.22 Cross tabulation of GROC and ‘AKP or VAS’ thresholds
AKP or VAS
0 1 Total
GROC 0 11 17 28 1 9 20 29
Total 20 37 57
5.5 Discussion
This chapter has demonstrated that four subgroups within a PFP cohort can be identified
using modifiable clinical, biomechanical and imaging features that are potentially amenable
to treatment. There was no statistical significance between the groups in the odds of a
favourable outcome, descriptively however, the Weak group were the least, and the Flexible
group the most, likely to report a favourable outcome at 12 months
This chapter has further enhanced our knowledge of PFP subgroups by incorporating
recognised biomechanical and imaging features to refine previously identified subgroups
based on clinical measures. The four groups identified in the current chapter are comparable
to four empirical subgroups identified previously but these were not derived statistically [366,
374]. Deriving subgroups using cluster analyses, like the current chapter, Selfe et al. (2016)
[254] identified three subgroups: ‘Weak & Tighter’, ‘Strong’ and ‘Weak & Pronated’. The
clinical tests they used included some of the same measures of quadriceps flexibility,
gastrocnemius flexibility and FPI as used in the current chapter. Knee extensor and hip
abductor strength were also used but were measured isometrically. Despite identifying only
3 groups, the groups identified by Selfe et al. (2016) [254] showed some similarities to those
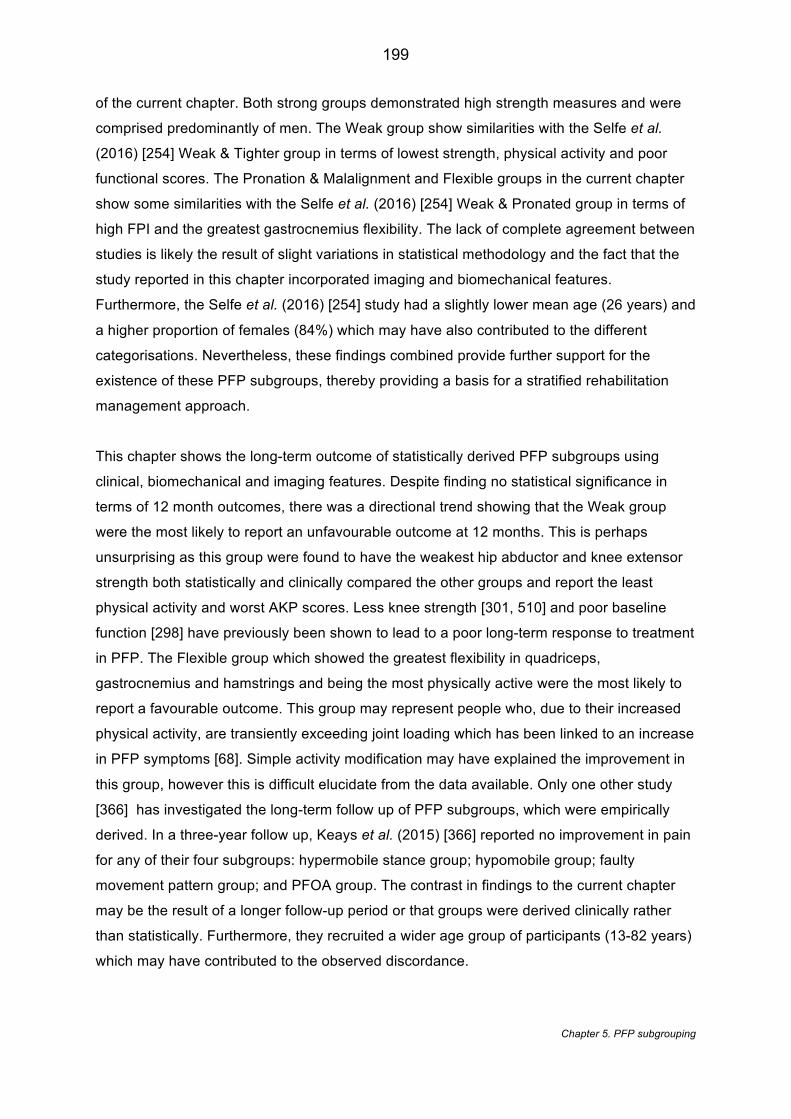
199
Chapter 5. PFP subgrouping
of the current chapter. Both strong groups demonstrated high strength measures and were
comprised predominantly of men. The Weak group show similarities with the Selfe et al.
(2016) [254] Weak & Tighter group in terms of lowest strength, physical activity and poor
functional scores. The Pronation & Malalignment and Flexible groups in the current chapter
show some similarities with the Selfe et al. (2016) [254] Weak & Pronated group in terms of
high FPI and the greatest gastrocnemius flexibility. The lack of complete agreement between
studies is likely the result of slight variations in statistical methodology and the fact that the
study reported in this chapter incorporated imaging and biomechanical features.
Furthermore, the Selfe et al. (2016) [254] study had a slightly lower mean age (26 years) and
a higher proportion of females (84%) which may have also contributed to the different
categorisations. Nevertheless, these findings combined provide further support for the
existence of these PFP subgroups, thereby providing a basis for a stratified rehabilitation
management approach.
This chapter shows the long-term outcome of statistically derived PFP subgroups using
clinical, biomechanical and imaging features. Despite finding no statistical significance in
terms of 12 month outcomes, there was a directional trend showing that the Weak group
were the most likely to report an unfavourable outcome at 12 months. This is perhaps
unsurprising as this group were found to have the weakest hip abductor and knee extensor
strength both statistically and clinically compared the other groups and report the least
physical activity and worst AKP scores. Less knee strength [301, 510] and poor baseline
function [298] have previously been shown to lead to a poor long-term response to treatment
in PFP. The Flexible group which showed the greatest flexibility in quadriceps,
gastrocnemius and hamstrings and being the most physically active were the most likely to
report a favourable outcome. This group may represent people who, due to their increased
physical activity, are transiently exceeding joint loading which has been linked to an increase
in PFP symptoms [68]. Simple activity modification may have explained the improvement in
this group, however this is difficult elucidate from the data available. Only one other study
[366] has investigated the long-term follow up of PFP subgroups, which were empirically
derived. In a three-year follow up, Keays et al. (2015) [366] reported no improvement in pain
for any of their four subgroups: hypermobile stance group; hypomobile group; faulty
movement pattern group; and PFOA group. The contrast in findings to the current chapter
may be the result of a longer follow-up period or that groups were derived clinically rather
than statistically. Furthermore, they recruited a wider age group of participants (13-82 years)
which may have contributed to the observed discordance.
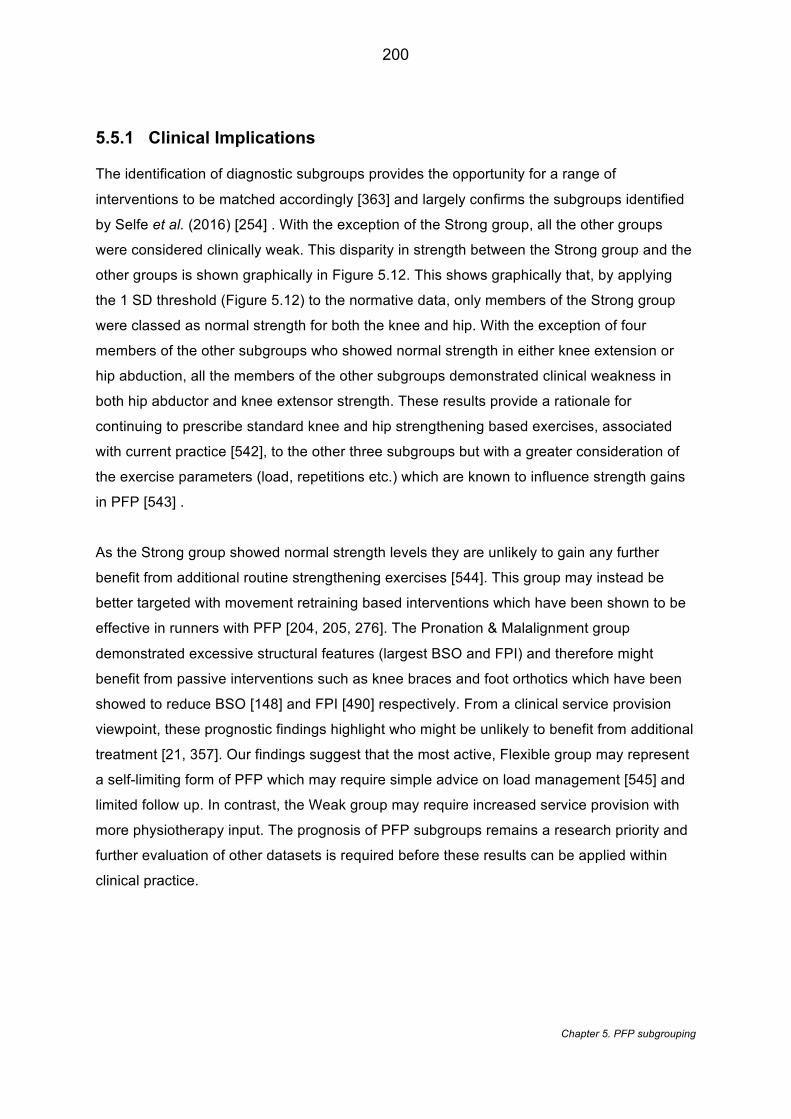
200
Chapter 5. PFP subgrouping
5.5.1 Clinical Implications
The identification of diagnostic subgroups provides the opportunity for a range of
interventions to be matched accordingly [363] and largely confirms the subgroups identified
by Selfe et al. (2016) [254] . With the exception of the Strong group, all the other groups
were considered clinically weak. This disparity in strength between the Strong group and the
other groups is shown graphically in Figure 5.12. This shows graphically that, by applying
the 1 SD threshold (Figure 5.12) to the normative data, only members of the Strong group
were classed as normal strength for both the knee and hip. With the exception of four
members of the other subgroups who showed normal strength in either knee extension or
hip abduction, all the members of the other subgroups demonstrated clinical weakness in
both hip abductor and knee extensor strength. These results provide a rationale for
continuing to prescribe standard knee and hip strengthening based exercises, associated
with current practice [542], to the other three subgroups but with a greater consideration of
the exercise parameters (load, repetitions etc.) which are known to influence strength gains
in PFP [543] .
As the Strong group showed normal strength levels they are unlikely to gain any further
benefit from additional routine strengthening exercises [544]. This group may instead be
better targeted with movement retraining based interventions which have been shown to be
effective in runners with PFP [204, 205, 276]. The Pronation & Malalignment group
demonstrated excessive structural features (largest BSO and FPI) and therefore might
benefit from passive interventions such as knee braces and foot orthotics which have been
showed to reduce BSO [148] and FPI [490] respectively. From a clinical service provision
viewpoint, these prognostic findings highlight who might be unlikely to benefit from additional
treatment [21, 357]. Our findings suggest that the most active, Flexible group may represent
a self-limiting form of PFP which may require simple advice on load management [545] and
limited follow up. In contrast, the Weak group may require increased service provision with
more physiotherapy input. The prognosis of PFP subgroups remains a research priority and
further evaluation of other datasets is required before these results can be applied within
clinical practice.
201
Chapter 5. PFP subgrouping
Figure 5.12: Clinical profile of the subgroups in terms of knee extensor and hip abductor strength. Line represents < 1 SD
5.5.2 Limitations
Sample size. These chapter findings are based on a relatively small cohort, however, the
use of a rule of thumb [486] for cluster analysis was intended to minimise the over fitting of
data. Dolnicar (2002) [546] conducted a review into 248 studies that utilised data-driven
cluster analysis which was not specific to medicine and instead related to business
administration but demonstrates that sample sizes vary between 10 to 20 000 with a mean
of 698. The number of variables used varied between 10-66 with a mean of 17. This author
suggested that whilst no rules exist, consideration should be made to the question: is the
dimensionality of the variables too high for the cases to be grouped? In response to this
concept of dimensionality and absence of any other recommendations, Dolnicar (2002) [546]
supports the rule of thumb (n=2k) advocated by Formann (1984) [486] an authority on latent
class analysis and used in this chapter. Furthermore, consideration was made to the fact
that the prevalence of PFP has been shown to be just over 10% in the general public [7, 44]
and up to 25% in more active populations such as athletes or military [42]. Recruiting to a
single site, predominantly from the National Health service (NHS) has been acknowledged
as being challenging [375]. Consideration was made to the feasibility of achieving
202
Chapter 5. PFP subgrouping
recruitment within a 24-month period. Despite, the benefit of identifying patients via the
SystmOne database (see 5.3.3), these people are of working age with likely dependants e.g.
children and/or elderly relatives competing for their time.
Assessment. Strict criteria were used for the selection of variables and in particular to the
selection of movement domain variables which were related to the assessment task i.e. stair
descent. It is known that other kinematic variables would have satisfied selection criteria
based on other tasks such as running. Stair descent was selected in consultation with a
patient and public involvement group and is considered to be achievable for both active and
sedentary individuals thus identified subgroups are likely to represent the wider population.
Prognostic homogeneity. One of the concerns with using a cross-sectional subgrouping
approach is that causal homogeneity does not necessarily imply prognostic homogeneity
[358]. For example, individuals that are grouped together based on baseline features may
still demonstrate a different symptom course over time or respond differently to the same
treatment. This is demonstrated by the Weak group who collectively showed a reduced odds
of favourable outcome (0.30 [0.07, 1.36]) but still had 46% (7/15) of members that did show
a favourable outcome and two members of the group that reported a GROC score of 4.
There is no pattern in the data to explain these elevated scores.
Cluster profiling. To support the interpretation and clinical profiling of the groups normative
data was used. For the MRI bisect offset and MR patella tilt gender-specific thresholds were
combined as the complexity of the statistics did not allow for this additional factor. The
findings of Chapter 4 (3D imaging study) suggested this not good practice due to the known
differences in joint shape for males and females. Nevertheless, group profiling was
predominantly driven by the statistical profile and informed using the normative data (which
incorporated the thresholds) so the effect of combining data should have been minimised.
5.6 Conclusions
The data presented in this chapter suggests that using modifiable clinical, biomechanical
and imaging features that four data-driven diagnostic subgroups can be identified. These
PFP subgroups provide the opportunity for a range of interventions to be matched
accordingly. Furthermore, an improved understanding of the prognosis of subgroups could
inform future service provision suggesting increased investment in the management of the

203
Chapter 5. PFP subgrouping
Weak group and potential disinvestment in the Flexible group, however, this warrants further
investigation. Further research is required to explore whether these subgroups can be
replicated in larger PFP data sets and whether treatment can be matched to the respective
subgroups. Despite the likely clinical implications, this study design does not allow us to
conclude that a stratified treatment approach would be effective; this will be explored within
the next chapter.
Chapter 6. Feasibility study
204
Chapter 6 - The effect of targeted treatment on people with
patellofemoral pain: a pragmatic, randomised controlled
feasibility study
This chapter describes a randomised controlled feasibility study investigating a
targeted hip strengthening intervention, matched to a subgroup with baseline hip
weakness and compared to usual care management. The chapter also explores the
mechanism of action for hip strengthening in a subgroup defined as ‘weak’. The
results from this chapter have been published as: Drew BT, Conaghan PG, Smith
TO, Selfe J, Redmond AC. (2017). The effect of targeted treatment on people with
patellofemoral pain: a pragmatic, randomised controlled feasibility study. BMC
Musculoskeletal Disorders. 18 (1), 338. [544].
6.1 Introduction
In Chapter 5, four diagnostic subgroups were identified, in parallel to this chapter, by
combining clinical, biomechanical and imaging features. It is thought that subgroups
of people with PFP will benefit from being stratified and matched to specific
interventions [22]. Despite successive international consensus papers since 2011
recommending subgrouping [14, 20, 34, 547], very little literature has focused on
targeted therapy.
As highlighted in the literature review (Chapter 2), reduced hip muscle strength is
considered an important associated feature of PFP [62]. Previous studies have
reported promising clinical outcomes after prescribing hip strengthening exercises
[265, 268, 271, 273, 275]. Individuals with PFP typically present with a propensity
towards increased hip adduction and internal rotation during dynamic movement
[548]. These kinematics have been shown to be significant predictors of PFP [549],
thought to be linked to increasing patellofemoral joint contact stress [162]. Correcting
this altered movement pattern is often seen as a desired outcome in interventional
studies [198].
Chapter 6. Feasibility study
205
Conflicting findings surround the mechanistic effect of hip strengthening in PFP [198].
Some studies have demonstrated a post-interventional change in kinematics [275,
279], whilst others have reported no change [266, 280]. The explanation for the
conflict in findings is unclear, however, the previous studies showing no kinematic
change [266, 280] have included athletic cohorts and with one of the cohorts [266]
clearly showing a higher than normal baseline strength. As expanded on in Chapter
2, recently PFP has been classified into three subgroups: ‘strong’, ‘weak and tighter’
and ‘weak and pronated foot’ [254]. Of these subgroups, 22% were classified into the
‘strong’ subgroup with higher knee extension and hip abduction strength. This group
is unlikely to gain anything from a treatment approach based on strengthening. A
strengthening intervention would likely have the greatest effect on the kinematics of
those with baseline weakness.
6.2 Aims
Based on the evidence, there is a need to explore stratified treatment approaches for
PFP in large trials. To ensure the success and effectiveness of such trials however, a
number of feasibility questions need to be answered. The primary aim of this chapter
was therefore to explore the feasibility of providing treatment matched to the specific
clinical criteria of a selected subgroup compared to usual care (UC) management to
inform a future stratified approach to PFP treatment. The a priori selection of a
subgroup with a specific characteristic such as hip abductor weakness also provides
the opportunity, as a secondary aim, to explore the mechanism of effect recently
advocated for trials of physical interventions [550].
6.3 Methods
6.3.1 Study design
This chapter reports a pragmatic, randomised controlled feasibility study in which
participants were selected from the 70 PFP participants in Chapter 5. Twenty-six
participants were identified from the larger group (n=70) on the basis of having hip
abductor weakness at clinical examination and were randomised into receiving either
a matched treatment (MT) or UC in a 1:1 ratio. Ethical approval was obtained prior to
commencement of the study (14/NE/1131). All participants completed written
Chapter 6. Feasibility study
206
informed consent prior to entering the study. The chapter has been reported in
accordance with Consolidate Standard of Reporting Trials (CONSORT) [551] and
Template for Intervention Description and Replication guidelines. (TiDieR) [552]. It
was also registered on the ISRCTN registry (ISRCTN74560952).
6.3.2 Justification of feasibility methodology
The Medical Research Council (MRC) complex interventions guidance [553] provides
a framework for developing and evaluating interventions like the stratified approach
to PFP (Figure 6.1). This thesis is broadly based on the on the first three stages of
the MRC complex interventions [553]. The pre-clinical phase is satisfied by Chapter 2
(literature review) and Chapter 3 (systematic review) whist Chapter 5 (PFP
subgrouping) satisfies the modelling phase. The Exploratory trial phase is exploring
the feasibility of a stratified intervention and forms the work in this chapter.
A debate surrounds the terms ‘pilot’ and ‘feasibility’ and how they affect the actual
design [554]. The National Institute for Health Research (NIHR) separates these two
designs by suggesting that the feasibility study is a piece of research done before a
main study to answer ‘ Can this study be done?’ whereas the pilot study is miniature
version of the main study. Eldridge et al. (2016) [554] suggests that, despite this
clear differentiation, feasibility still remains the overarching concept of both designs
and that a pilot study is often considered a subset of feasibility. The work undertaken
in this chapter is reported as a feasibility study because, as advised by Lancaster et
al. (2004) [555], rate of recruitment, acceptability, outcomes measures etc. were the
primary outcomes. Furthermore, the selected subgroup (hip abductor weakness) was
chosen as this could be easily identified clinically, however, this group has been
further refined from the parallel work in Chapter 5. As a result, the findings of this
chapter could be not be seen as miniature version of the main study but ultimately as
a means of establishing the feasibility of targeted treatment in PFP.
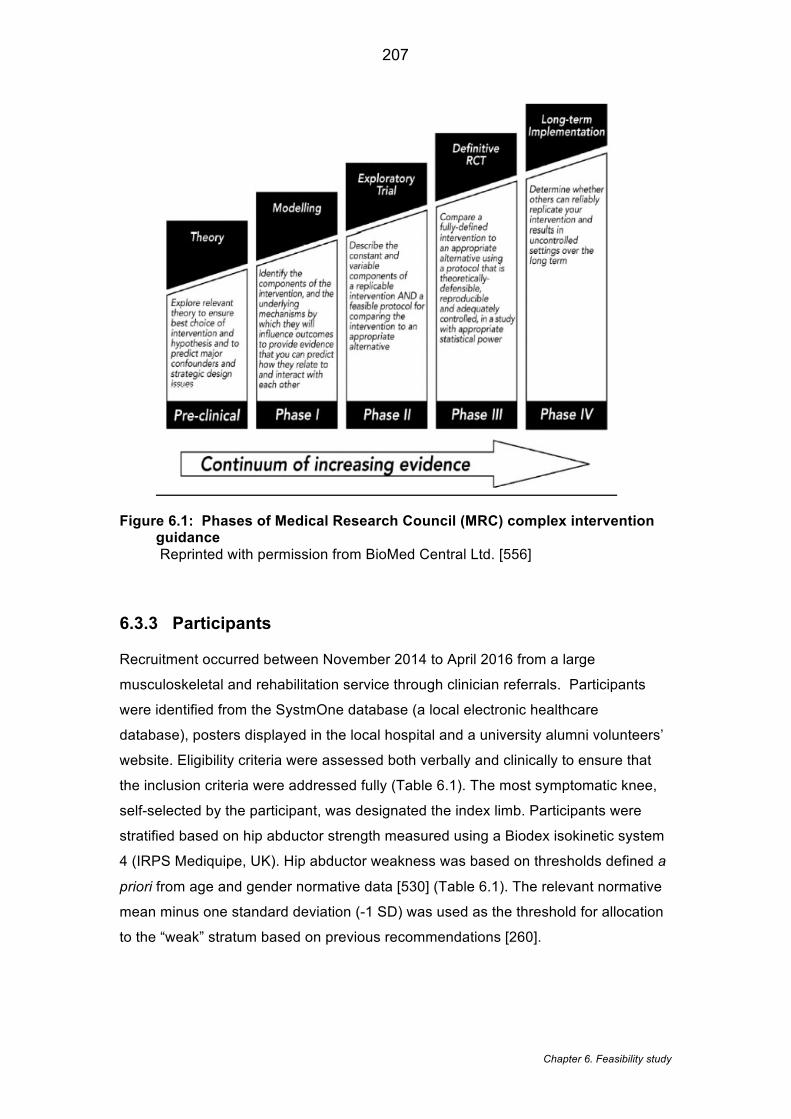
Chapter 6. Feasibility study
207
Figure 6.1: Phases of Medical Research Council (MRC) complex intervention guidance Reprinted with permission from BioMed Central Ltd. [556]
6.3.3 Participants
Recruitment occurred between November 2014 to April 2016 from a large
musculoskeletal and rehabilitation service through clinician referrals. Participants
were identified from the SystmOne database (a local electronic healthcare
database), posters displayed in the local hospital and a university alumni volunteers’
website. Eligibility criteria were assessed both verbally and clinically to ensure that
the inclusion criteria were addressed fully (Table 6.1). The most symptomatic knee,
self-selected by the participant, was designated the index limb. Participants were
stratified based on hip abductor strength measured using a Biodex isokinetic system
4 (IRPS Mediquipe, UK). Hip abductor weakness was based on thresholds defined a
priori from age and gender normative data [530] (Table 6.1). The relevant normative
mean minus one standard deviation (-1 SD) was used as the threshold for allocation
to the “weak” stratum based on previous recommendations [260].
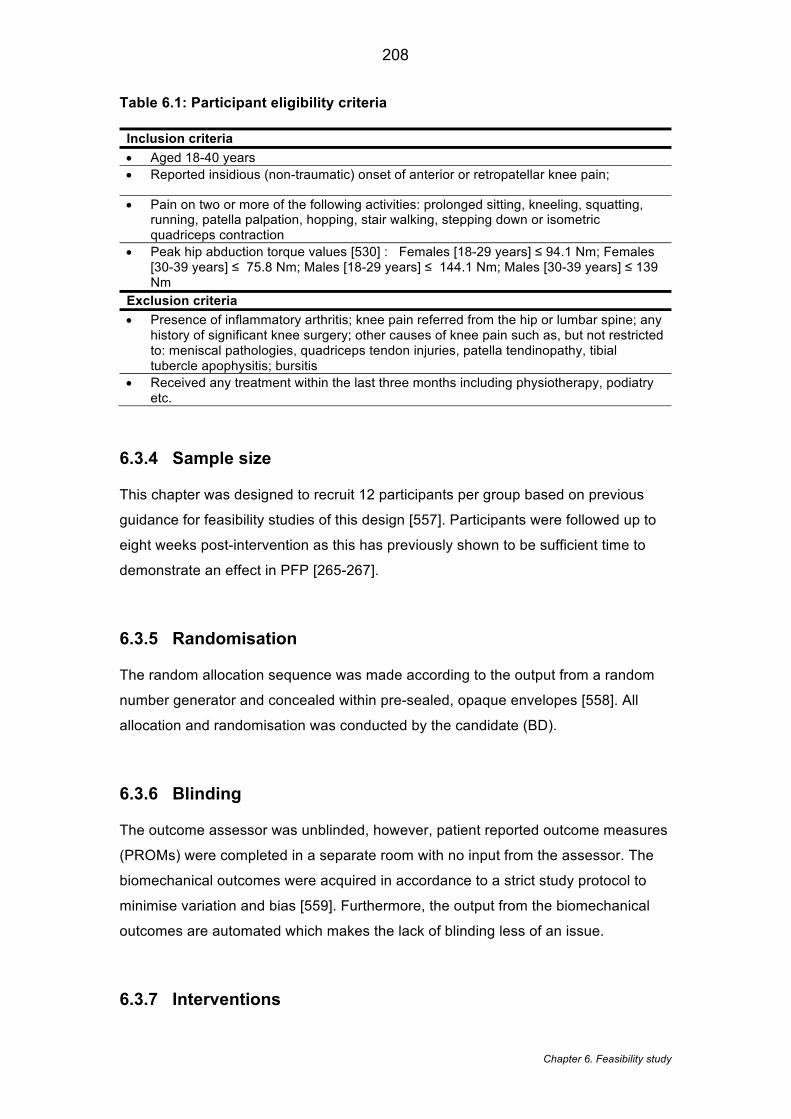
Chapter 6. Feasibility study
208
Table 6.1: Participant eligibility criteria
Inclusion criteria
• Aged 18-40 years • Reported insidious (non-traumatic) onset of anterior or retropatellar knee pain;
• Pain on two or more of the following activities: prolonged sitting, kneeling, squatting, running, patella palpation, hopping, stair walking, stepping down or isometric quadriceps contraction
• Peak hip abduction torque values [530] : Females [18-29 years] ≤ 94.1 Nm; Females [30-39 years] ≤ 75.8 Nm; Males [18-29 years] ≤ 144.1 Nm; Males [30-39 years] ≤ 139 Nm
Exclusion criteria
• Presence of inflammatory arthritis; knee pain referred from the hip or lumbar spine; any history of significant knee surgery; other causes of knee pain such as, but not restricted to: meniscal pathologies, quadriceps tendon injuries, patella tendinopathy, tibial tubercle apophysitis; bursitis
• Received any treatment within the last three months including physiotherapy, podiatry etc.
6.3.4 Sample size
This chapter was designed to recruit 12 participants per group based on previous
guidance for feasibility studies of this design [557]. Participants were followed up to
eight weeks post-intervention as this has previously shown to be sufficient time to
demonstrate an effect in PFP [265-267].
6.3.5 Randomisation
The random allocation sequence was made according to the output from a random
number generator and concealed within pre-sealed, opaque envelopes [558]. All
allocation and randomisation was conducted by the candidate (BD).
6.3.6 Blinding
The outcome assessor was unblinded, however, patient reported outcome measures
(PROMs) were completed in a separate room with no input from the assessor. The
biomechanical outcomes were acquired in accordance to a strict study protocol to
minimise variation and bias [559]. Furthermore, the output from the biomechanical
outcomes are automated which makes the lack of blinding less of an issue.
6.3.7 Interventions
Chapter 6. Feasibility study
209
Participants randomised to the MT group were asked to attend six supervised
sessions of approximately 30 minutes in duration once per week for six weeks at a
local hospital. Each week they also performed two additional sessions on non-
consecutive days independently at home, with the intervening days allowing
adequate rest [560]. The intervention comprised of three exercises aimed at targeting
coronal, sagittal and transverse strength of the hip using resistance bands (see
Table 6.2). The choice of exercises was informed from previous RCTs using hip
strengthening in PFP [265, 271], discussion with clinical experts and with
consideration of the exercises shown to provide the greatest isolated gluteal activity
[561, 562]. The order of exercises was compiled based on the clinical experience of
the candidate and advice from clinical experts supporting this chapter. Consideration
was made to the recommended determinants of resistance exercise [563] when
developing the intervention. The intervention aimed to gradually progress participants
over six-weeks from non-weight bearing exercises to dynamic full weight bearing
whilst minimising the amount of quadriceps activity to ensure that the hip strength
was being targeted. The inclusion of isometric exercises was in accordance with
previous hip strengthening regimes in PFP [273, 564] and recommendations from the
clinical experts supporting this chapter. An exercise diary issued to participants each
week provided pictures and descriptions of the prescribed exercises.
The sessions were face to face, 1:1 sessions provided by the candidate, a senior
musculoskeletal physiotherapist with over nine years of clinical experience. During
these sessions, participants were given education and justification of the treatment to
support adherence. Each week at least one of the exercises would change with the
aim of providing variation and minimising tedium [565]. The supervision sessions
served as a means of ensuring both treatment fidelity and tailoring. Fidelity was
ensured by checking the exercise technique and making corrections to performance
prior to these being performed independently at home. Subsequent visits ensured
this instruction had been correctly applied or not. Tailoring the intervention based on
progressive loading was in line with current recommendations [198]. Participants
were issued yellow (least resistance), red or green (most resistance) resistance
tubing (66fit Ltd ™) and were allowed to take it home. To progress the load and
resistance, a Borg Rate of Perceived Exertion scale (RPE) [566] was used based on
the recommendations when using resistance band [567]. A RPE of >6 was
considered desirable [560] and participants were monitored after a few repetitions to
ensure this was what was being achieved. As participants were stratified for
strength, the intervention required participants to perform ten repetitions within three
Chapter 6. Feasibility study
210
sets as recommended for strength training [560]. Participants were advised to ensure
the time under tension was eight seconds (three seconds concentric, two seconds
isometric hold and three seconds eccentric contraction). The selection of the hold
times for the isometric exercises were chosen to cause a significant fatigue (a RPE
of >6) by the end of the second set which has been suggested to be an appropriate
level of stimulus for muscle strengthening [568]. Strengthening was performed on
each leg alternatively providing a standardised rest between sets. Exercise diaries,
issued to participants, provided a reminder of the exercises and allowed a measure
of adherence. Participants were asked to document each time each exercise was
performed on their diary sheet and return these at each visit.
Participants randomised to the UC group continued with the same management of
their condition as they were planning to receive prior to the commencement of the
study. This included planned physiotherapy, podiatry or no intervention, depending
upon participant preference. The type of management and number of sessions was
recorded for the UC group at follow-up.
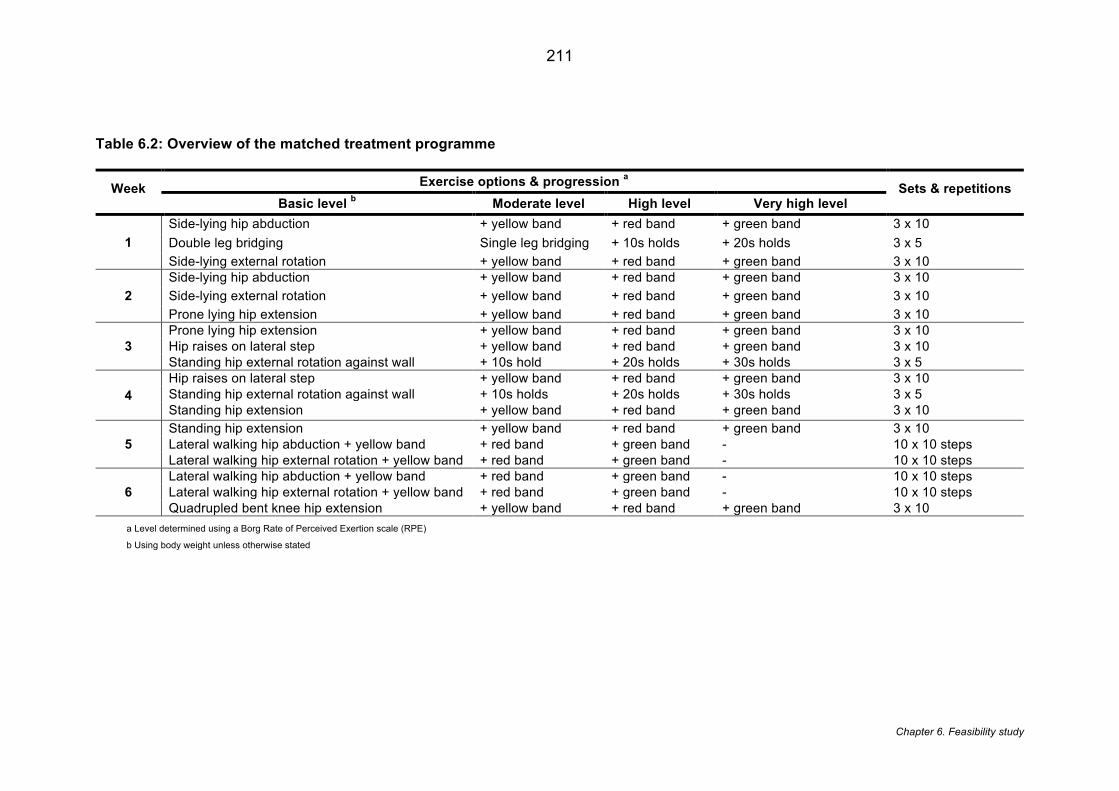
211
Chapter 6. Feasibility study
Table 6.2: Overview of the matched treatment programme
Week Exercise options & progression a Sets & repetitions Basic level b Moderate level High level Very high level
1 Side-lying hip abduction + yellow band + red band + green band 3 x 10 Double leg bridging Single leg bridging + 10s holds + 20s holds 3 x 5 Side-lying external rotation + yellow band + red band + green band 3 x 10
2 Side-lying hip abduction + yellow band + red band + green band 3 x 10 Side-lying external rotation + yellow band + red band + green band 3 x 10 Prone lying hip extension + yellow band + red band + green band 3 x 10
3 Prone lying hip extension + yellow band + red band + green band 3 x 10 Hip raises on lateral step + yellow band + red band + green band 3 x 10 Standing hip external rotation against wall + 10s hold + 20s holds + 30s holds 3 x 5
4 Hip raises on lateral step + yellow band + red band + green band 3 x 10 Standing hip external rotation against wall + 10s holds + 20s holds + 30s holds 3 x 5 Standing hip extension + yellow band + red band + green band 3 x 10
5 Standing hip extension + yellow band + red band + green band 3 x 10 Lateral walking hip abduction + yellow band + red band + green band - 10 x 10 steps Lateral walking hip external rotation + yellow band + red band + green band - 10 x 10 steps
6 Lateral walking hip abduction + yellow band + red band + green band - 10 x 10 steps Lateral walking hip external rotation + yellow band + red band + green band - 10 x 10 steps Quadrupled bent knee hip extension + yellow band + red band + green band 3 x 10
a Level determined using a Borg Rate of Perceived Exertion scale (RPE)
b Using body weight unless otherwise stated

212
Chapter 6. Feasibility study
6.3.8 Outcomes
There is a lack of agreed guidelines for outcomes in feasibility studies [555].
Therefore the primary feasibility outcomes were adapted from recommendations
made by Bugge et al. (2013) [569] and Shanyinde et al. (2011) [570]. The questions
posed by Bugge et al. (2013) [569] (
Table 6.3 ) offered a structure in which to analyse the feasibility comprehensively.
These questions satisfied the important broad groups of feasibility: process (key
aspects of the study e.g. recruitment rates), resources (time and resource problems
during the study), management (human and data management problems) and
scientific value (treatment safety and effect) [571].
Table 6.3: Feasibility outcomes*
Methodological issues
1. Did the feasibility/pilot study allow a sample size calculation for the main trial? 2. What factors influenced eligibility and what proportions of those approached were
eligible? 3. Was recruitment successful 4. Did eligible participants consent? 5. Were participants successfully randomized and did randomization yield equality in
groups? 6. Were blinding procedures adequate? 7. Did participants adhere to the intervention? 8. Was the intervention acceptable to the participants? 9. Was it possible to calculate intervention costs and duration? 10. Were outcome assessments completed? 11. Were outcome measured those that were the most appropriate outcomes? 12. Was retention to the study good? 13. Were the logistics of running a multicenter trial assessed? 14. Did all components of the protocol work together?
*adapted from Bugge et al. (2013) [569]
213
Chapter 6. Feasibility study
6.3.8.1 Feasibility outcomes
6.3.8.1.1 Recruitment and eligibility:
Recruitment and eligibility was assessed using the rate of eligibility (%), the
conversion of eligible to consent (%) and a breakdown of recruitment sources.
6.3.8.1.2 Randomisation & blinding:
The success of randomisation was assessed based on any problems being
highlighted and whether the randomisation process yielded broad equality in both
groups based on the difference in baseline characteristics. Intervention blinding is not
possible for a physiotherapeutic intervention of this nature [572] and thus this could
not be measured.
6.3.8.1.3 Adherence & acceptability:
Adherence was assessed by the adherence rate to treatment (%) using exercise
diaries and adherence to appointments (%) based on the number of ‘unable to
attends’ (UTAs). The acceptability was assessed by the attrition rate (%).
6.3.8.1.4 Outcome measures:
The outcome data was assessed based on the amount of missing data (%) found in
each case report form.
6.3.8.1.5 Resources & study management:
The study management was assessed qualitatively by the candidate in terms of the
logistics of running the study and the safety of all study components.
6.3.8.1.6 Treatment efficacy:
PROMs provided assessments of the efficacy for the chapter in terms of
improvements in pain and disability at eight-week follow-up. The following outcomes
were selected based on current Initiative on Methods, Measurement and Pain
Assessment in Clinical Trials(IMMPACT) guidelines [573]:
• Pain was assessed using two numerical rating scales (NRS) with a 11-point scale
for: i) the average pain in the knee over the last week ii) the worst pain in the
knee over the last week.
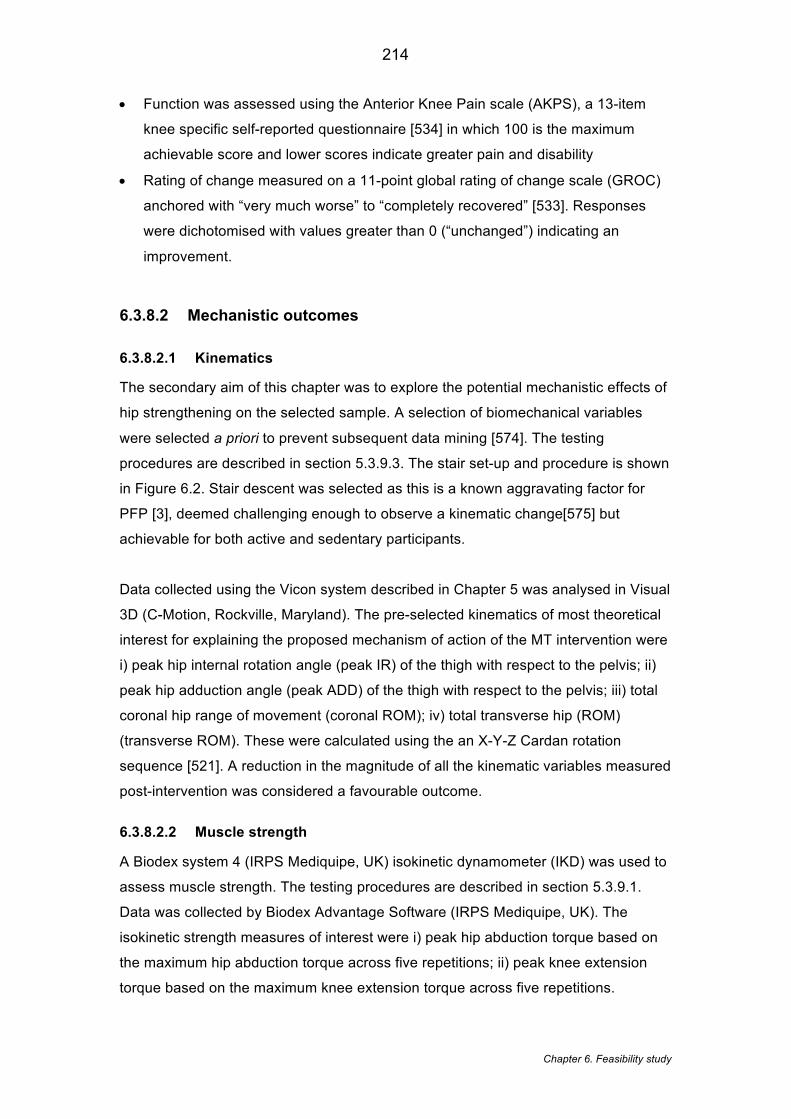
214
Chapter 6. Feasibility study
• Function was assessed using the Anterior Knee Pain scale (AKPS), a 13-item
knee specific self-reported questionnaire [534] in which 100 is the maximum
achievable score and lower scores indicate greater pain and disability
• Rating of change measured on a 11-point global rating of change scale (GROC)
anchored with “very much worse” to “completely recovered” [533]. Responses
were dichotomised with values greater than 0 (“unchanged”) indicating an
improvement.
6.3.8.2 Mechanistic outcomes
6.3.8.2.1 Kinematics
The secondary aim of this chapter was to explore the potential mechanistic effects of
hip strengthening on the selected sample. A selection of biomechanical variables
were selected a priori to prevent subsequent data mining [574]. The testing
procedures are described in section 5.3.9.3. The stair set-up and procedure is shown
in Figure 6.2. Stair descent was selected as this is a known aggravating factor for
PFP [3], deemed challenging enough to observe a kinematic change[575] but
achievable for both active and sedentary participants.
Data collected using the Vicon system described in Chapter 5 was analysed in Visual
3D (C-Motion, Rockville, Maryland). The pre-selected kinematics of most theoretical
interest for explaining the proposed mechanism of action of the MT intervention were
i) peak hip internal rotation angle (peak IR) of the thigh with respect to the pelvis; ii)
peak hip adduction angle (peak ADD) of the thigh with respect to the pelvis; iii) total
coronal hip range of movement (coronal ROM); iv) total transverse hip (ROM)
(transverse ROM). These were calculated using the an X-Y-Z Cardan rotation
sequence [521]. A reduction in the magnitude of all the kinematic variables measured
post-intervention was considered a favourable outcome.
6.3.8.2.2 Muscle strength
A Biodex system 4 (IRPS Mediquipe, UK) isokinetic dynamometer (IKD) was used to
assess muscle strength. The testing procedures are described in section 5.3.9.1.
Data was collected by Biodex Advantage Software (IRPS Mediquipe, UK). The
isokinetic strength measures of interest were i) peak hip abduction torque based on
the maximum hip abduction torque across five repetitions; ii) peak knee extension
torque based on the maximum knee extension torque across five repetitions.
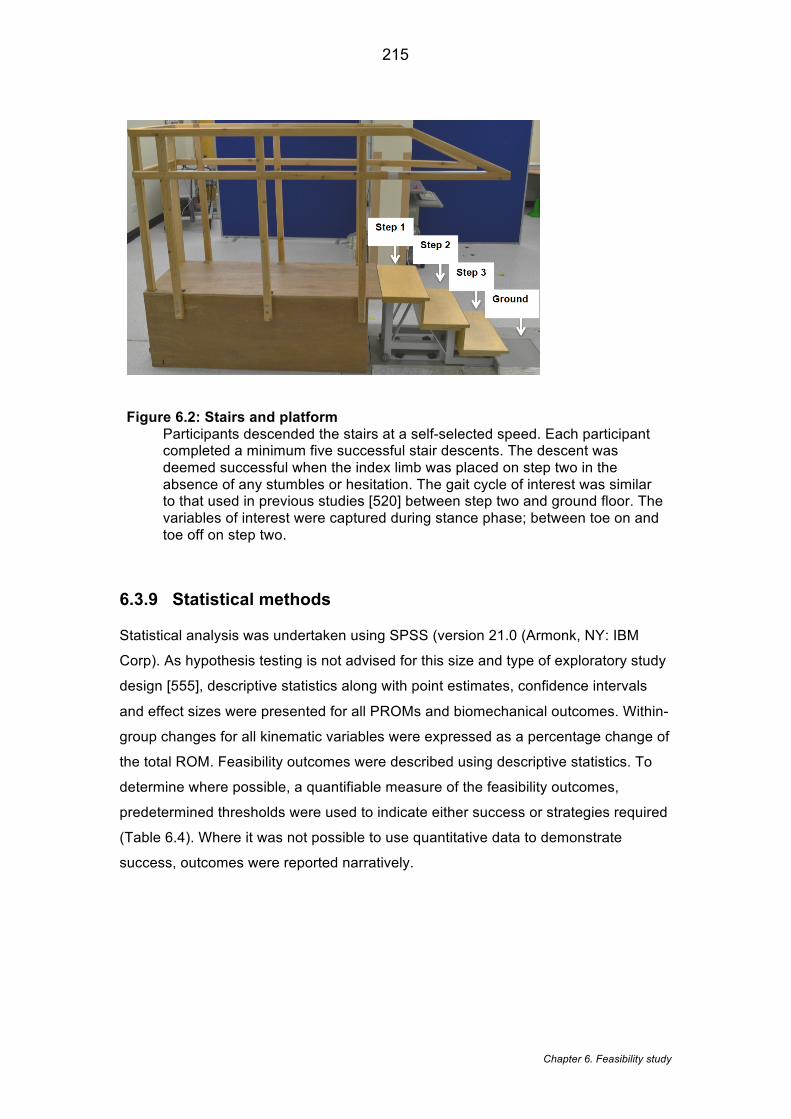
215
Chapter 6. Feasibility study
Figure 6.2: Stairs and platform Participants descended the stairs at a self-selected speed. Each participant completed a minimum five successful stair descents. The descent was deemed successful when the index limb was placed on step two in the absence of any stumbles or hesitation. The gait cycle of interest was similar to that used in previous studies [520] between step two and ground floor. The variables of interest were captured during stance phase; between toe on and toe off on step two.
6.3.9 Statistical methods
Statistical analysis was undertaken using SPSS (version 21.0 (Armonk, NY: IBM
Corp). As hypothesis testing is not advised for this size and type of exploratory study
design [555], descriptive statistics along with point estimates, confidence intervals
and effect sizes were presented for all PROMs and biomechanical outcomes. Within-
group changes for all kinematic variables were expressed as a percentage change of
the total ROM. Feasibility outcomes were described using descriptive statistics. To
determine where possible, a quantifiable measure of the feasibility outcomes,
predetermined thresholds were used to indicate either success or strategies required
(Table 6.4). Where it was not possible to use quantitative data to demonstrate
success, outcomes were reported narratively.
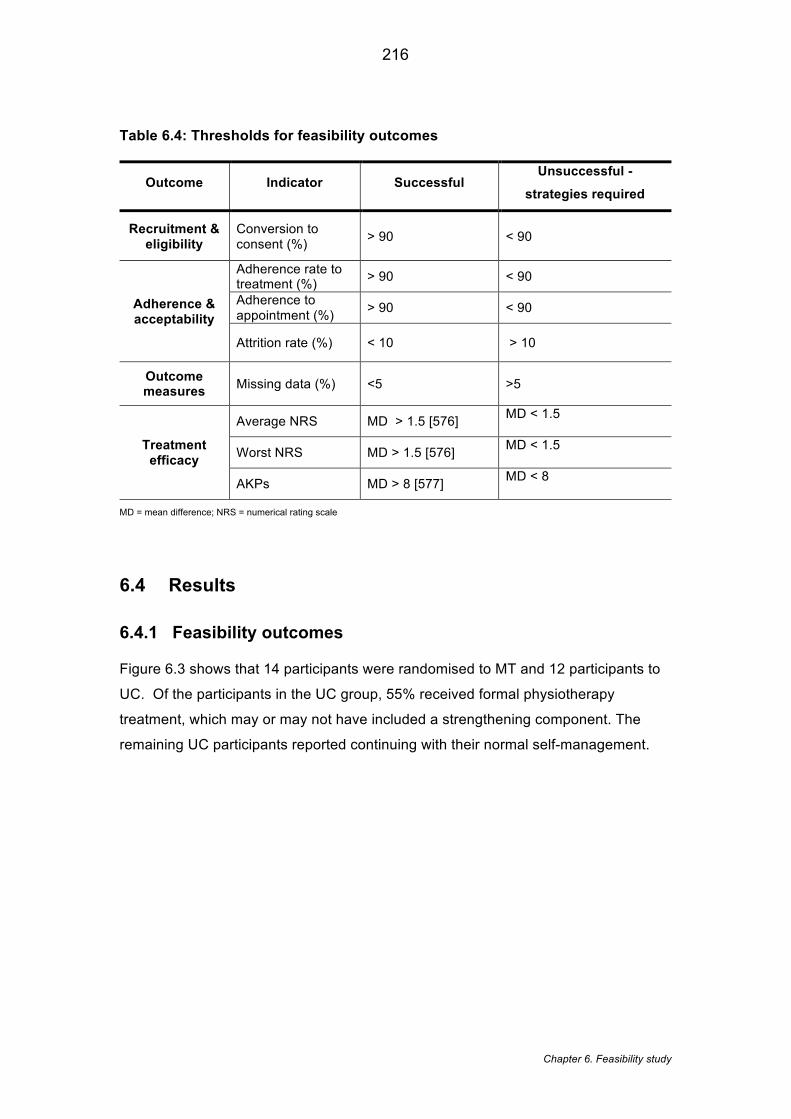
216
Chapter 6. Feasibility study
Table 6.4: Thresholds for feasibility outcomes
Outcome Indicator Successful Unsuccessful -
strategies required
Recruitment & eligibility
Conversion to consent (%) > 90 < 90
Adherence & acceptability
Adherence rate to treatment (%) > 90 < 90
Adherence to appointment (%) > 90 < 90
Attrition rate (%) < 10 > 10
Outcome measures Missing data (%) <5 >5
Treatment efficacy
Average NRS MD > 1.5 [576] MD < 1.5
Worst NRS MD > 1.5 [576] MD < 1.5
AKPs MD > 8 [577] MD < 8
MD = mean difference; NRS = numerical rating scale
6.4 Results
6.4.1 Feasibility outcomes
Figure 6.3 shows that 14 participants were randomised to MT and 12 participants to
UC. Of the participants in the UC group, 55% received formal physiotherapy
treatment, which may or may not have included a strengthening component. The
remaining UC participants reported continuing with their normal self-management.

217
Chapter 6. Feasibility study
Figure 6.3: Flow of participants through the study
6.4.1.1 Recruitment and eligibility
Over 15 months, of the 70 who were screened, 26 were eligible based on hip
weakness; an eligibility rate of 37.1%. All 26 eligible participants consented to the
study (100% conversion to consent). Recruitment was predominantly from the
SystmOne database 54% (14/26). Direct clinician referrals 15% (4/26), posters 23%
Assessed for eligibility (n= 70)
Randomised (n= 26)
• Allocated to matched
treatment (n= 14)
• Received allocated
• Allocated to usual care (n=
12)
• Received treatment (n= 5)
• Lost to follow up (n=0)
• Discontinuation of
intervention (n=1)
• Lost to follow up (n=1)
Reason: Work commitments
• Analysed (n= 13)
None excluded from analysis
• Analysed (n= 11)
None excluded from analysis
Allocation
Follow up
Analysis
Enrolment
Normal hip abductor strength
(n=44)
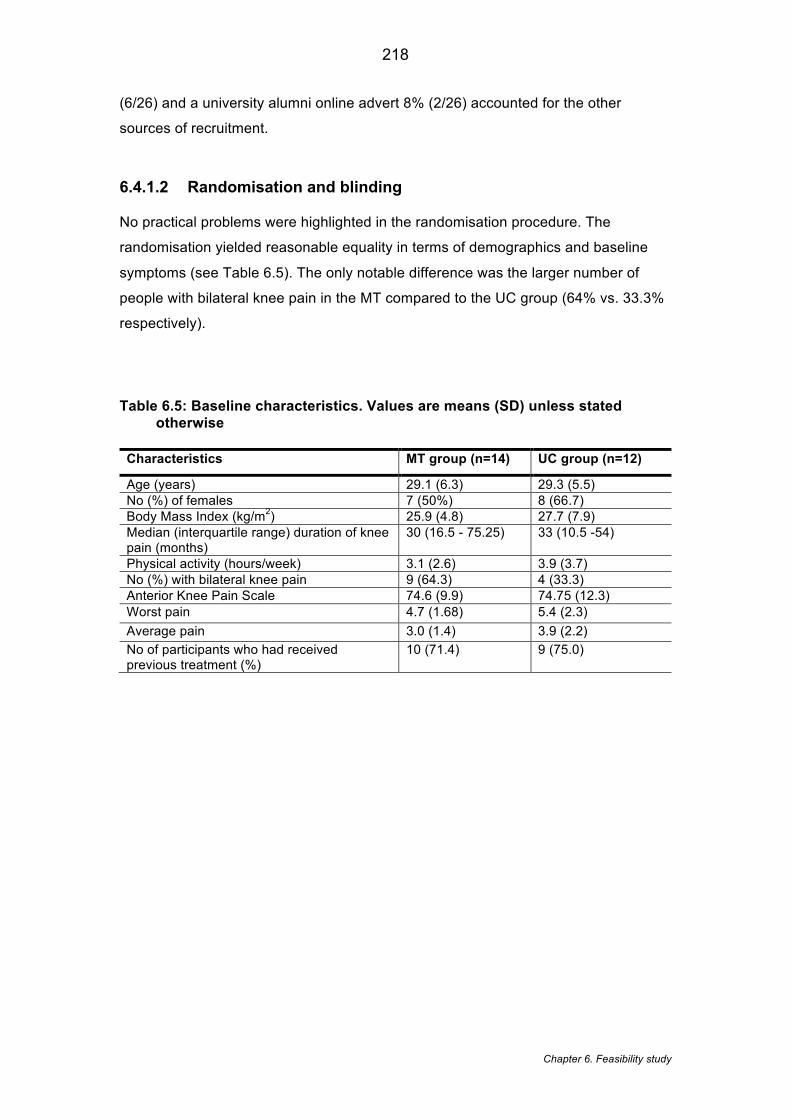
218
Chapter 6. Feasibility study
(6/26) and a university alumni online advert 8% (2/26) accounted for the other
sources of recruitment.
6.4.1.2 Randomisation and blinding
No practical problems were highlighted in the randomisation procedure. The
randomisation yielded reasonable equality in terms of demographics and baseline
symptoms (see Table 6.5). The only notable difference was the larger number of
people with bilateral knee pain in the MT compared to the UC group (64% vs. 33.3%
respectively).
Table 6.5: Baseline characteristics. Values are means (SD) unless stated otherwise
Characteristics MT group (n=14) UC group (n=12)
Age (years) 29.1 (6.3) 29.3 (5.5) No (%) of females 7 (50%) 8 (66.7) Body Mass Index (kg/m2) 25.9 (4.8) 27.7 (7.9) Median (interquartile range) duration of knee pain (months)
30 (16.5 - 75.25) 33 (10.5 -54)
Physical activity (hours/week) 3.1 (2.6) 3.9 (3.7) No (%) with bilateral knee pain 9 (64.3) 4 (33.3) Anterior Knee Pain Scale 74.6 (9.9) 74.75 (12.3) Worst pain 4.7 (1.68) 5.4 (2.3) Average pain 3.0 (1.4) 3.9 (2.2) No of participants who had received previous treatment (%)
10 (71.4) 9 (75.0)
219
Chapter 6. Feasibility study
6.4.1.3 Adherence and acceptability
At post-treatment (8 weeks) follow-up, two participants did not complete the study, an
attrition rate of 8%. In the MT group, one participant did not attend their second
treatment session and was then lost to follow up. In the UC group, one participant
was unable to complete the post-treatment analysis due to work commitments.
Table 6.6, illustrates that in the MT group, five participants reported a 100%
adherence to treatment with an overall average adherence to treatment of 94%.
Treatment sessions required rearranging on seven occasions; three times for illness,
three times for work commitments and once for childcare. This shows an adherence
to appointment rate of 92%. Data on adherence to treatment and appointments was
not collected in the UC group.
6.4.1.4 Outcome measures
All questionnaires were completed fully without any missing data yielding a missing
data indicator of 0%.
6.4.1.5 Treatment efficacy
Based on the GROC, overall the MT group demonstrated a larger improvement
compared to UC group (61.54% vs. 9.09% respectively). The MT group
demonstrated a greater improvement in AKP score compared to UC group (Mean
Difference (MD) -6.41, 95% CI: 14.23, 1.41) with a medium effect size (d=0.70) (see
Table 6.7). Both worst pain NRS (-0.41; 95% CI: -1.93, 1.12) and average pain NRS
(-0.02, 95% CI: -1.01, 0.96) demonstrated no difference between groups.
6.4.1.6 Resources and study management
The 9% of appointments that needed rescheduling required time to make these
changes. No safety issues were reported.
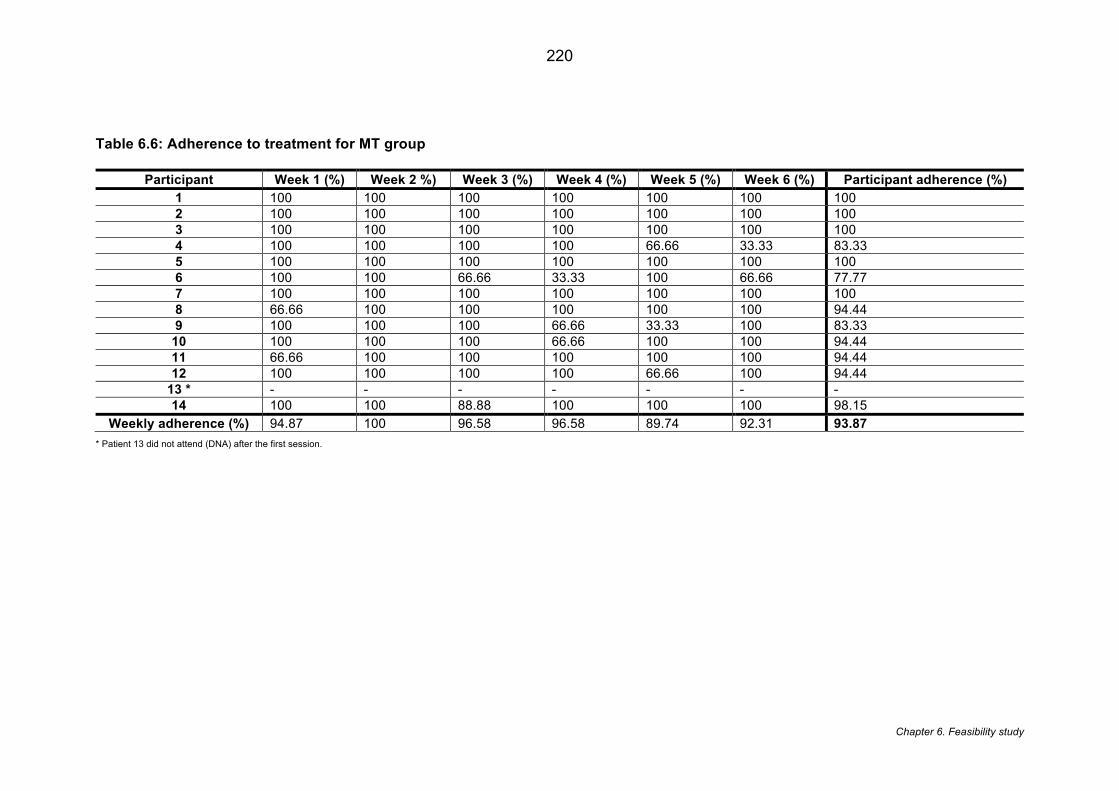
220
Chapter 6. Feasibility study
Table 6.6: Adherence to treatment for MT group
Participant Week 1 (%) Week 2 %) Week 3 (%) Week 4 (%) Week 5 (%) Week 6 (%) Participant adherence (%)
1 100 100 100 100 100 100 100 2 100 100 100 100 100 100 100 3 100 100 100 100 100 100 100 4 100 100 100 100 66.66 33.33 83.33 5 100 100 100 100 100 100 100 6 100 100 66.66 33.33 100 66.66 77.77 7 100 100 100 100 100 100 100 8 66.66 100 100 100 100 100 94.44 9 100 100 100 66.66 33.33 100 83.33
10 100 100 100 66.66 100 100 94.44 11 66.66 100 100 100 100 100 94.44 12 100 100 100 100 66.66 100 94.44
13 * - - - - - - - 14 100 100 88.88 100 100 100 98.15
Weekly adherence (%) 94.87 100 96.58 96.58 89.74 92.31 93.87
* Patient 13 did not attend (DNA) after the first session.
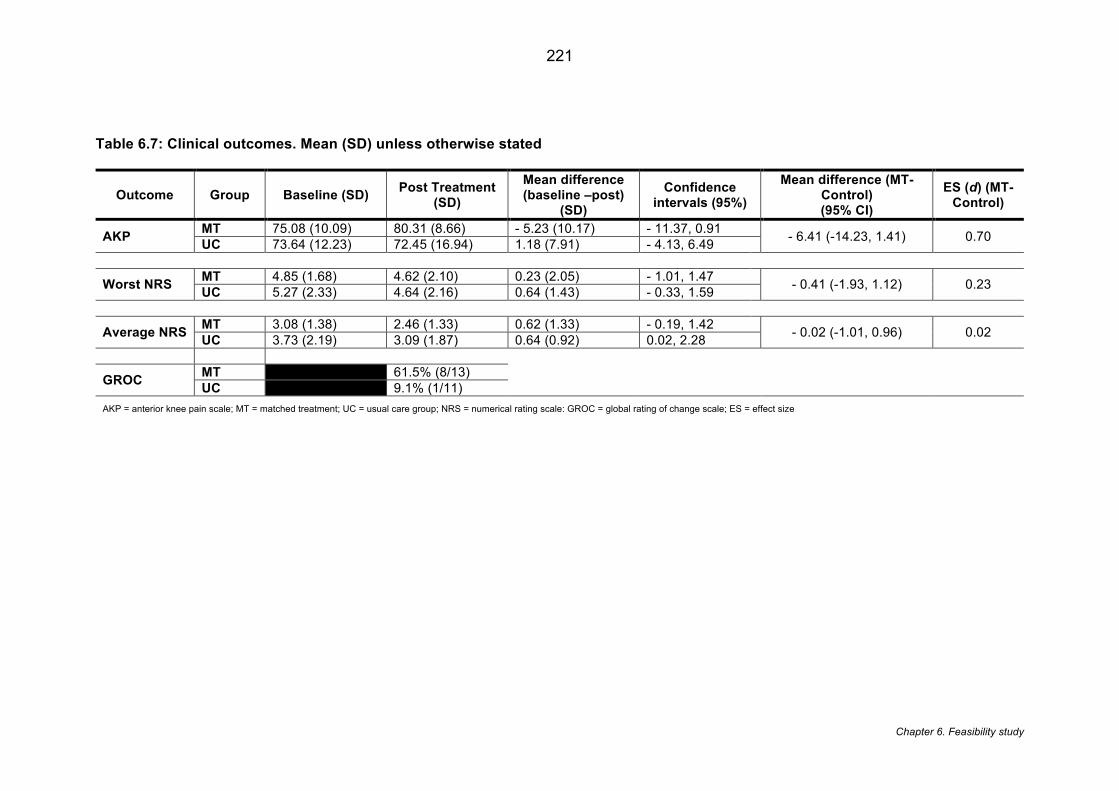
221
Chapter 6. Feasibility study
Table 6.7: Clinical outcomes. Mean (SD) unless otherwise stated
Outcome Group Baseline (SD) Post Treatment
(SD)
Mean difference (baseline –post)
(SD)
Confidence intervals (95%)
Mean difference (MT-Control) (95% CI)
ES (d) (MT- Control)
AKP MT 75.08 (10.09) 80.31 (8.66) - 5.23 (10.17) - 11.37, 0.91 - 6.41 (-14.23, 1.41) 0.70 UC 73.64 (12.23) 72.45 (16.94) 1.18 (7.91) - 4.13, 6.49
Worst NRS MT 4.85 (1.68) 4.62 (2.10) 0.23 (2.05) - 1.01, 1.47 - 0.41 (-1.93, 1.12) 0.23 UC 5.27 (2.33) 4.64 (2.16) 0.64 (1.43) - 0.33, 1.59
Average NRS MT 3.08 (1.38) 2.46 (1.33) 0.62 (1.33) - 0.19, 1.42 - 0.02 (-1.01, 0.96) 0.02 UC 3.73 (2.19) 3.09 (1.87) 0.64 (0.92) 0.02, 2.28
GROC MT 61.5% (8/13) UC 9.1% (1/11)
AKP = anterior knee pain scale; MT = matched treatment; UC = usual care group; NRS = numerical rating scale: GROC = global rating of change scale; ES = effect size
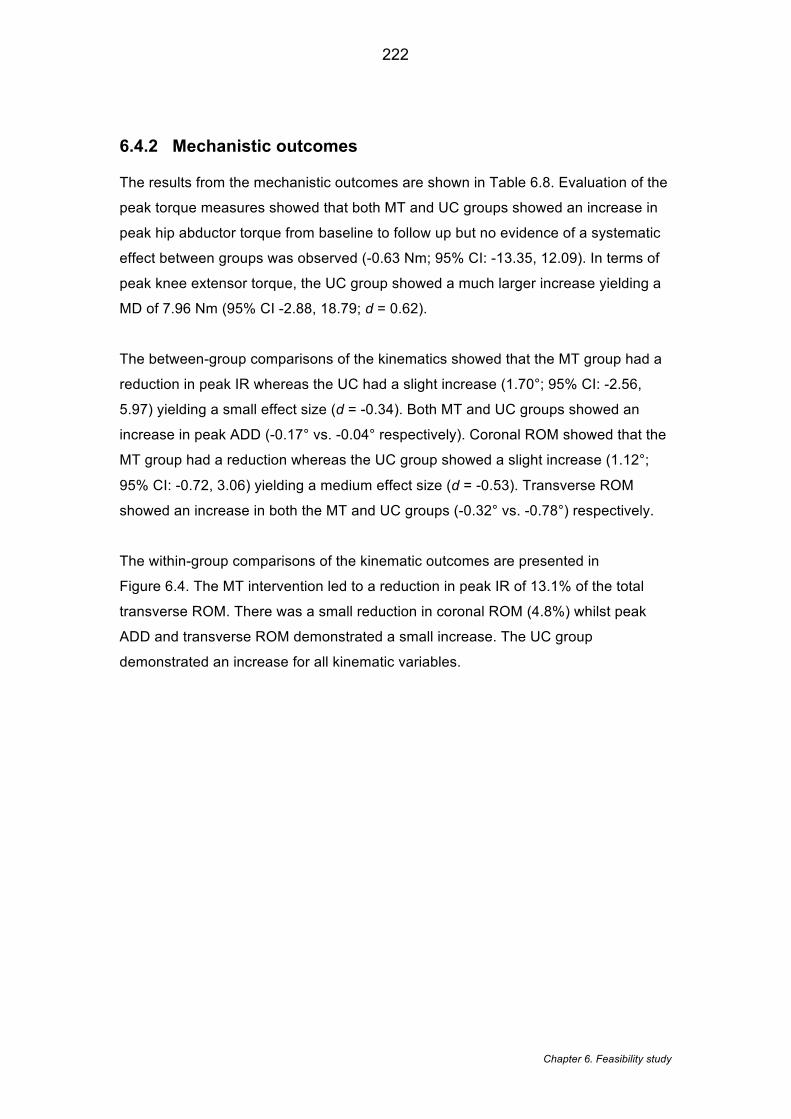
222
Chapter 6. Feasibility study
6.4.2 Mechanistic outcomes
The results from the mechanistic outcomes are shown in Table 6.8. Evaluation of the
peak torque measures showed that both MT and UC groups showed an increase in
peak hip abductor torque from baseline to follow up but no evidence of a systematic
effect between groups was observed (-0.63 Nm; 95% CI: -13.35, 12.09). In terms of
peak knee extensor torque, the UC group showed a much larger increase yielding a
MD of 7.96 Nm (95% CI -2.88, 18.79; d = 0.62).
The between-group comparisons of the kinematics showed that the MT group had a
reduction in peak IR whereas the UC had a slight increase (1.70°; 95% CI: -2.56,
5.97) yielding a small effect size (d = -0.34). Both MT and UC groups showed an
increase in peak ADD (-0.17° vs. -0.04° respectively). Coronal ROM showed that the
MT group had a reduction whereas the UC group showed a slight increase (1.12°;
95% CI: -0.72, 3.06) yielding a medium effect size (d = -0.53). Transverse ROM
showed an increase in both the MT and UC groups (-0.32° vs. -0.78°) respectively.
The within-group comparisons of the kinematic outcomes are presented in
Figure 6.4. The MT intervention led to a reduction in peak IR of 13.1% of the total
transverse ROM. There was a small reduction in coronal ROM (4.8%) whilst peak
ADD and transverse ROM demonstrated a small increase. The UC group
demonstrated an increase for all kinematic variables.
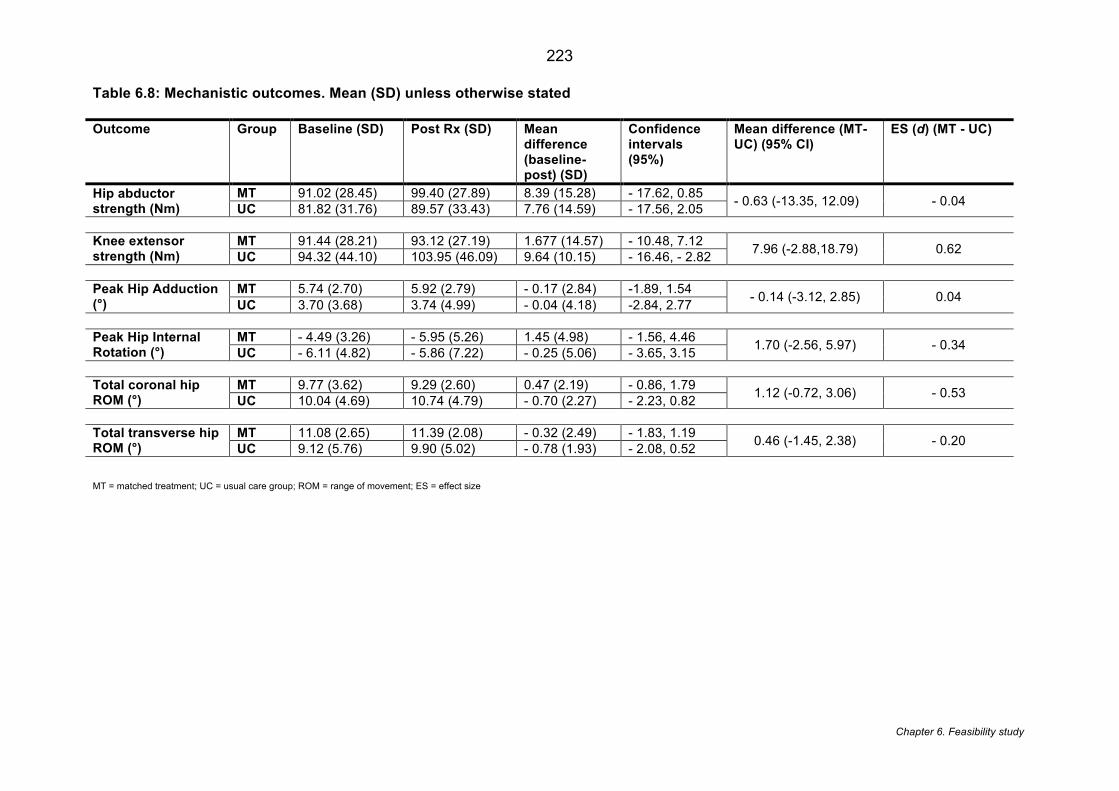
223
Chapter 6. Feasibility study
Table 6.8: Mechanistic outcomes. Mean (SD) unless otherwise stated
Outcome Group Baseline (SD) Post Rx (SD) Mean difference (baseline-post) (SD)
Confidence intervals (95%)
Mean difference (MT-UC) (95% CI)
ES (d) (MT - UC)
Hip abductor strength (Nm)
MT 91.02 (28.45) 99.40 (27.89) 8.39 (15.28) - 17.62, 0.85 - 0.63 (-13.35, 12.09) - 0.04 UC 81.82 (31.76) 89.57 (33.43) 7.76 (14.59) - 17.56, 2.05 Knee extensor strength (Nm)
MT 91.44 (28.21) 93.12 (27.19) 1.677 (14.57) - 10.48, 7.12 7.96 (-2.88,18.79) 0.62 UC 94.32 (44.10) 103.95 (46.09) 9.64 (10.15) - 16.46, - 2.82 Peak Hip Adduction (°)
MT 5.74 (2.70) 5.92 (2.79) - 0.17 (2.84) -1.89, 1.54 - 0.14 (-3.12, 2.85) 0.04 UC 3.70 (3.68) 3.74 (4.99) - 0.04 (4.18) -2.84, 2.77 Peak Hip Internal Rotation (°)
MT - 4.49 (3.26) - 5.95 (5.26) 1.45 (4.98) - 1.56, 4.46 1.70 (-2.56, 5.97) - 0.34 UC - 6.11 (4.82) - 5.86 (7.22) - 0.25 (5.06) - 3.65, 3.15 Total coronal hip ROM (°)
MT 9.77 (3.62) 9.29 (2.60) 0.47 (2.19) - 0.86, 1.79 1.12 (-0.72, 3.06) - 0.53 UC 10.04 (4.69) 10.74 (4.79) - 0.70 (2.27) - 2.23, 0.82 Total transverse hip ROM (°)
MT 11.08 (2.65) 11.39 (2.08) - 0.32 (2.49) - 1.83, 1.19 0.46 (-1.45, 2.38) - 0.20 UC 9.12 (5.76) 9.90 (5.02) - 0.78 (1.93) - 2.08, 0.52 MT = matched treatment; UC = usual care group; ROM = range of movement; ES = effect size
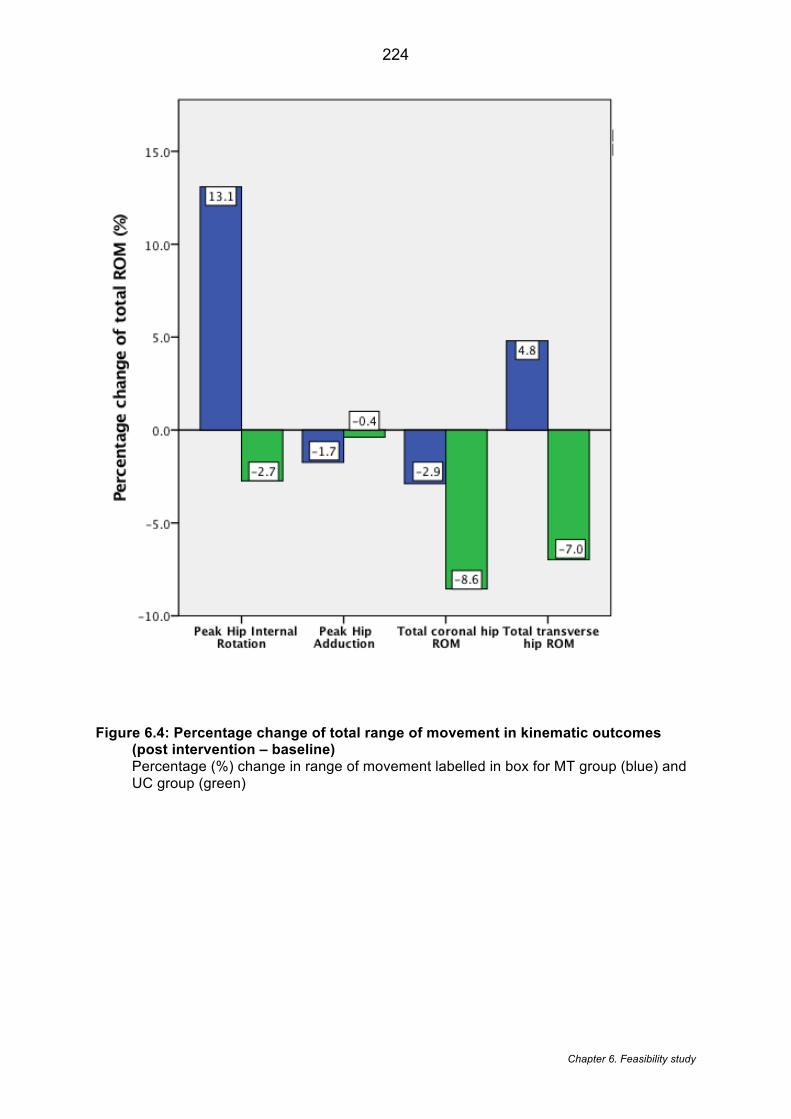
224
Chapter 6. Feasibility study
Figure 6.4: Percentage change of total range of movement in kinematic outcomes
(post intervention – baseline)
Percentage (%) change in range of movement labelled in box for MT group (blue) and UC group (green)
225
Chapter 6. Feasibility study
6.5 Discussion
This chapter aimed to: i) determine the feasibility of treatment matched to the specific
characteristics of selected PFP sub group and ii) explore the proposed mechanism of effect
of employing strengthening in a subgroup with baseline hip weakness. A definitive
randomised controlled trial (RCT) appears achievable in terms of adherence, attrition,
eligibility and outcome data. Some consideration is required to develop strategies to
enhance the ability to quantify clinical differences between groups. In terms of the potential
mechanism of effect for hip strengthening, an improvement was shown for peak hip internal
rotation angle following matched treatment.
6.5.1 Feasibility outcomes
Using our eligibility thresholds for selecting a ‘weak’ hip group, we predetermined that for
feasibility; eligibility should reach or exceed 32%. Our observed eligibility rate of 37%
provides reassurance. This eligibility rate for hip weakness is less than the 88% (at 1SD)
reported by Selfe et al. (2016) [254] but may be explained by the current chapter measuring
an isokinetic contraction rather than an isometric contraction and as a consequence the
different strength thresholds applied. In order to minimise potential bias, future multicentre
RCTs would also need to ensure cross-site calibration of the isokinetic systems and site
visits to monitor fidelity of the strength assessment procedures.
A greater adherence to treatment has been associated with an increased probability of better
outcomes in people with PFP [11]. An adherence to treatment and adherence to
appointments over 90% is promising. Approximately 30% (4/13) achieved complete
adherence to all treatment sessions and only 9% of appointments required rearranging. The
adherence rate in this chapter is comparable to a larger RCT [268] which had a 80.3%
adherence rate for a six week hip strengthening in PFP. It is anticipated that rearranging
appointments for participants would be more challenging for a larger sample over multiple
sites. Consequently, strategies to enhance adherence with the use of activity monitoring
technology and reminder services need to be considered [578]. Unfortunately, two
systematic reviews [578, 579] provide no conclusive strategies for enhancing the adherence
in physiotherapy interventions. The novel use of the BandCizer™ has been explored
recently in PFP [580], which is a sensor applied to the theraband that measures the stretch
226
Chapter 6. Feasibility study
and thus load applied. Employing an activity monitoring technology like this provides an
objective measure of treatment adherence but also measures whether the quantity of the
loading is sufficient [581].
Between group differences showed no differences for either the average or worst NRS
values. This might be explained by the difference in almost a score of one in average
baseline NRS, a feature that would likely be minimised in a larger full-scale trial. Previous
RCTs [268, 339] have also used eligibility criteria requiring a minimum NRS score of three
out of 10 pain score. Setting a minimum pain score as part of the inclusion criteria e.g. at
least 3 out of 10 on a visual analogues scale, is suggested for a future RCT.
The outcome measures were fully completed with no missing data. Equality between groups
was only clearly different in terms of the proportion of participants with bilateral knee pain.
This is notable as bilateral knee pain has been suggested to indicate poorer prognosis [301]
and may influence the clinical outcomes seen. Consideration of matching to confounding
variables such as bilaterality should be considered.
The AKP score did not reach the predetermined minimal clinically important difference
(MCID) of eight points [577] between groups, although there was a trend (mean difference
6.4 points) towards a meaningful benefit. AKP score evaluates functional limitations as a
result of PFP and, despite the strength gains, the motor skill development needed for
functional gains may require a longer intervention duration [582]. Our findings are similar
however, to the only other RCT [340] to have stratified a PFP cohort which investigated a
foot orthotic intervention over six weeks. Mills et al. (2012) [340] selected their participants
based on predictors shown to predict success with foot orthotics, which included age, height,
baseline pain severity and a static foot measure. They also found a significant difference
between groups in terms of GROC with no differences in AKP score or VAS pain. They
suggest that GROC is able to capture the multidimensional nature of PFP (characterised by
pain, disability and functional limitation) compared to AKP score and VAS pain which are
more one dimensional [340].
6.5.2 Mechanistic outcomes
The group receiving the matched treatment (MT) showed a reduction of approximately 13%
for peak IR. This is important considering that an increase peak IR has been associated with
PFP during stair descent [200, 207]. This reduction in peak IR occurred with a slight increase
of their transverse ROM suggesting that following treatment, people in the MT group were
227
Chapter 6. Feasibility study
initiating stance phase in a more desirable externally rotated hip position. A reduction in
peak IR and a slight increase in peak ADD are perhaps surprising considering that
participants were stratified for hip abductor weakness. However, recent strength measures
conducted on 501 healthy athletes [493] have shown that hip abductor and hip external
rotation strength are highly correlated (r=0.66) indicating this subgroup were likely to have
also demonstrated weakness into both hip abduction and external rotation. Measuring hip
external rotation in addition to hip abduction strength should be considered for future clinical
trials to further understand the mechanism of effect.
Both groups demonstrated similar increase in hip strength, which is likely the result of over a
third of participants in the UC group being engaged in physiotherapy. Post-hoc analysis of
those participants in the UC group who received no treatment show an increase of only 3.9
Nm in hip abductor strength. This is almost less than half the increase shown by the whole
UC group (mean 7.76 Nm). In the MT group the change in hip strength was 9%, which is a
comparable improvement to previous hip strengthening programmes over a similar training
duration [266, 273]. There is some discrepancy around the expected gains from a hip
strengthening programme [274]. This may be the result of known differences in strength
gains between untrained and trained individuals [565]. PFP is recognised as being present in
both very active and sedentary people [3]. In the current chapter, self-reported physical
activity (hours/week) varied from as much as 0 to 10 hours per week in the MT group, which
may reflect an individual’s level of training. Muscular strength increases are reported to be
approximately 40% in untrained to 16% in trained individuals over a four week to two year
period [565].
With reference to the delivery of this intervention within a multicenter RCT, one challenge
with using strength as a selection feature across multiple sites is that different IKDs devices
may give varied results due to differences in calibration, testing procedures, personal and
verbal feedback. In terms of the testing procedures and verbal feedback, a standard
operating procedure would need to be used in order to standardise the procedures and site
visits would need to be scheduled to ensure assessment fidelity. In terms of the IKD
calibration, regular calibration before use would be enforced, however, no guidance exists
for cross-site calibration. Cross-site calibration processes have been applied previously for
other medical equipment used in research [583]. In line with procedural checks used at
single sites, a set weight (provided with the IKD) could be taken to each site prior to
beginning of the study and be checked along with the scheduled fidelity visits.
228
Chapter 6. Feasibility study
The increase in strength for both groups, but with only kinematic improvements seen in the
MT group, might suggest that strength, on its own, cannot explain the improvement seen in
peak IR. Direct comparison with previous studies [266, 275, 279, 280] remains difficult due
to the differences in assessment tasks (e.g. running, stairs etc.) and the specific kinematic
outcomes (e.g. peak, average angles etc.) investigated. Previous studies [266, 280] that
have observed the effect of hip strengthening on running kinematics in people with PFP
found no change in kinematics despite increases in hip abductor strength. Only Baldon et al.
(2014) [275] reported changes in kinematics, during a single leg squat, following a hip
strengthening programme. Yet, this training programme, did include constant feedback on
lower limb alignment which suggests a more movement retraining approach[276] rather than
pure strength training. It remains possible that the improvements observed in peak IR in the
current chapter were the result of using progressive loading within a tailored treatment
regime and selecting participants who were most likely to benefit from strengthening.
6.5.3 Limitations
This chapter presents with several limitations related to the study design, outcomes and
intervention.
Study design: Firstly, in relation to the study design, the study was performed in a single
centre. Future RCTs would be required to be multicentre to improve generalisability, which is
anticipated to introduce new feasibility issues. The findings of the current chapter would,
however, inform the documentation of standard operating procedures in terms of
recruitment; data collection and intervention provision to ensure any future study could be
operationalised across different geographical locations.
Outcomes: In terms of outcomes, any kinematic changes are very dependent upon the task
used [575]. In the current chapter we used stairs descent which may not demanding enough
to utilise these strength increases and elicit large changes in the frontal and transverse plane
[584]. Stairs were chosen based on recommendations from the patient and public
involvement group involved in the programme of work.
With regards to measuring strength, consideration was made to normalising strength to body
weight as is done in Chapter 5. Normalising strength measurements is recognised as
particularly important when comparing between different body sizes e.g. males vs. females
[585]. The normative data was, stratified for age and gender thus there was some natural
229
Chapter 6. Feasibility study
anthropometric control. In this context, with the aim of identifying weakness, failing to
normalise to body weight may lead to recruiting smaller people. Bazett-Jones et al. (2011)
[585] highlights strength is commonly normalised by body mass but that this may wrongly
assume a proportional relationship [586] . Instead, to reflect this variable relationship an
allometric scaling component can be applied to body mass [586] informed from an allometric
scaling analyses. This process may be more accurate, however, practically the complex
analysis involved would have prevented participants being identified and then randomised at
the same visit. Delays in randomisation may have had a detrimental impact on recruitment
and retention.
In this chapter, the collective BMI, height and weight of both groups were 26.8 kg/m2, height
1.7m, 75.9 kg respectively. As mentioned, these participants were recruited from a larger
group of 70 PFP cases analysed in Chapter 5. A sensitivity analysis of the other PFP
patients (n=44) whose hip strength was not weak enough to be included in this chapter show
that their collective BMI, height and weight was 26.1 kg/m2, 1.7m, 76.5kg. This reassuringly
shows that the participants are representative of the wider PFP population and that, in this
case, not normalising strength to body weight does not appear to have led to the recruitment
of smaller participants.
The current chapter did not blind assessors to group allocation, which could lead to potential
bias [587]. Every effort was made for participants to complete PROMs in isolation and
objective biomechanical outcomes were acquired in accordance with strict protocols with
little chance of introducing bias. Future RCTs should make every effort to introduce outcome
assessor blinding and consider measuring the level of this outcome assessor blinding [588]
Intervention: Lastly, limitations related to the intervention concern the nature of the UC
group. The use of a UC group was intended to represent the heterogeneity of management
available in real, daily practice and thus improve the external validity [589]. For the purposes
of exploring the mechanism of hip strengthening, however, the fact that over half of the UC
group received physiotherapy input potentially dilutes the between-group findings.
Comparison with a control group receiving no active intervention would remedy this issue.
230
Chapter 6. Feasibility study
6.6 Conclusion
The potential benefits associated with stratification and subgrouping within PFP have been
advocated since the first International Patellofemoral Pain Retreat Consensus statement
[34]. This chapter suggests that targeted treatment for hip abductor weakness in people with
PFP provides a greater improvement in overall function and self-reported improvement in
comparison to usual care. Additionally, the improvements seen in peak IR following MT
suggest this may be a plausible mechanism of effect for hip strengthening when treatment is
matched to an appropriate subgroup. Strategies to enhance the ability to detect clinical
difference should be considered and might be improved by selection of participants with a
minimum pain score. Ultimately, a pragmatic, multicentre RCT with a sufficiently powered
cohort appears achievable and should be conducted to determine the clinical and cost-
effectiveness of a stratified treatment approach versus usual care for people with PFP.
231
Chapter 7. Discussion
Chapter 7 - Discussion, future directions and conclusions
7.1 Thesis synopsis
This thesis is concerned with the stratification of PFP and specifically describes: the
structural associations to PFP; the subgroups that exist within PFP; the natural prognosis of
these PFP subgroups; and the feasibility of targeting PFP subgroups within a clinical trial.
The observations made in this thesis in Chapters 3, 4, 5 and 6 are summarised as follows:
Chapter 3 - Which patellofemoral joint imaging features are associated with
patellofemoral pain? Systematic review and meta-analysis
The aim of this chapter was to establish which PFJ imaging features are associated with
PFP compared to those without PFP. Forty studies describing 1043 people with PFP and
839 controls were included.
• This systematic review demonstrated that PFP is associated with a number of PFJ
imaging features, in particular, MRI bisect offset and CT congruence angle.
Furthermore, some of the features identified, including MRI bisect offset and MRI
patella tilt, have been shown to be modifiable with conservative interventions.
• A sensitivity analysis showed the effect of full weight bearing (FWB) on imaging
outcomes and demonstrated that under FWB, differences between a PFP and a
healthy control group increased.
• Limitations within the literature were found in terms of the participant selection and
outcome assessment. Poor reporting of the recruitment source and failure to report
the reliability of the imaging assessment were considered largely responsible for
these conclusions.

232
Chapter 7. Discussion
Chapter 4 - Patellofemoral joint morphology of middle aged people with
patellofemoral pain measured using 3D MRI quantitative technology: data from the
Osteoarthritis Initiative
The aim of this chapter was to investigate whether 3D equivalents of commonly used PFJ
imaging features and overall 3D bone shape differ between people with and without PFP
and to explore whether the overall 3D bone shape differed between genders. This analyses
included 115 people with PFP and 438 without PFP.
• This cross-sectional analysis from a large cohort demonstrated that no single or
combined differences were found between a group with and without PFP for either
the overall 3D shape or thirteen 3D imaging features.
• However, significant differences were found between men and women, with the
overall 3D shape able to classify gender with a 90% level of accuracy.
• None of the 3D PFJ imaging features could be used to inform Chapter 5, however,
this study highlights the importance of gender when interpreting imaging data.
• The findings suggest that previous outcomes using 2D methods may have been the
result of mixed gender cohorts and thus future studies should ensure that
adjustments are made for gender and that this is considered when interpreting
findings.
Chapter 5 - The development of data-derived subgroups in patellofemoral pain using
modifiable clinical, biomechanical and imaging features
The aim of this chapter was to identify diagnostic subgroups within PFP cohort using
modifiable clinical, biomechanical and imaging features and to explore the prognosis of
these subgroups at 12 months follow up. This longitudinal cohort study with cross-sectional
analysis included 70 people with PFP.
• This two-stage, SPSS TwoStep cluster analysis identified four subgroups: Strong
group, Pronation & Malalignment group, Weak group and Flexible group.
• The prognosis of these subgroups at 12 months showed, with reference to the Strong
group, that the Weak group was the least likely to report a favourable outcome and
the Flexible most likely. However, there were no statistical significance between
groups in odds of a favourable outcome.
233
Chapter 7. Discussion
• Targeting treatment by matching interventions according to the subgroup baseline
characteristics should be explored.
• Further research is required to see if subgroups can be replicated in larger PFP data
sets and whether these subgroups can show different long-term outcomes.
Chapter 6 - The effect of targeted treatment on people with patellofemoral pain: a
pragmatic randomised controlled feasibility study
The aim of this pragmatic randomised controlled feasibility study was to explore the
feasibility of treatment matched to a specific clinical characteristic of a selected PFP
subgroup compared to usual care (UC) management and to explore the mechanism of
action for hip strengthening when targeted to a group defined as ‘weak’. This study included
26 people with PFP; 14 in the matched treatment (MT) group and 12 in the UC group.
• The finding from the feasibility study indicates that a larger study is achievable in
terms of high rates of adherence, retention and conversion to consent.
• Treatment efficacy showed promising findings in terms of self-reported improvement
(using a GROC scale); however, strategies to enhance the ability to detect clinical
differences are indicated.
• The mechanism of action for hip strengthening when targeting a group with defined
hip weakness appears to be related to improvements in peak hip internal rotation.
7.1.1 Overall summary
In summary, this thesis has demonstrated that imaging features, in particular MRI features
(measured in 2D) may be associated with PFP. Once converted into their 3D equivalents,
however, the same differences were not observed in a large, older group with PFP. Using
this knowledge of imaging features combined with clinical and biomechanical features four
subgroups were identified in the PFP population with the Weak group the least likely to
report a favourable recovery at long term follow up. The feasibility of targeting PFP
subgroups has shown positive outcomes in terms of conversion to consent, missing data,
attrition and adherence to both treatment and appointments whilst also highlighting the need
for strategies to enhance the ability to detect clinical differences. On the whole, this indicates
that a future multicentre RCT focusing on the stratification of PFP is achievable.
234
Chapter 7. Discussion
7.2 Thesis discussion
The findings derived from this thesis are supplemented below by an update of the extant
literature since Chapter 2 was written. This has been presented within themes that have
arisen from the overall findings of this thesis: imaging in PFP; subgrouping in PFP, prognosis
of PFP subgroups and stratifying treatment in PFP. Details regarding the study design are
included to offer methodological guidance to pre-existing shortfalls in the current literature.
7.2.1 Imaging in PFP
The findings of this thesis (Chapter 3) indicate that when loading status and flexion angle are
controlled for, a number of MRI features are associated with PFP. In contrast, the study in
Chapter 4 which converted common MRI features into their 3D equivalent found no
difference between groups with and without PFP.
The apparent contrasting findings within this thesis could be the result of the 3D features
providing greater accuracy in Chapter 4 (using the centroid as the reference point). This
would suggest that all previous studies (and those included in the systematic review in
Chapter 3) may have been influenced by inconsistencies in joint positioning or lack a
standard reference point [438]. Alternatively, it may be because the findings of Chapter 4
were obtained in an older population and therefore may not reflect the results of younger
population more synonymous with PFP.
The thesis findings are primarily based on malalignment-type features. None of the identified
studies in the systematic review in Chapter 3 (which subsequently informed the measures in
Chapter 4) investigated semi-quantitative MRI features. Semi-quantitative features focus
more on structural abnormalities of the PFJ and have been proposed to be potentially
important in PFP [590]. However, the few recent studies [590, 591] to have investigated
semi-quantitative features have shown only minimal differences between groups with and
without PFP. The only differences to have been noted are in the extensor mechanism and
medial plica [591] but these findings from this recent study could simply be result of including
a broader AKP group or the lack of covariate adjustment. As suggested recently [590], the
failure to detect differences may lie in the fact that other clinical or biomechanical features
e.g. kinematic, strength factors etc. might need to be present in order for the imaging
features to cause pain [590].
235
Chapter 7. Discussion
Overall, based on the findings of this thesis imaging features, in particular MRI measures,
should be considered for future clinical trials and utilised more in clinical practice as they
have been demonstrated to be associated to PFP (Chapter 3), highlighted as being
potentially modifiable (Chapter 2 and 3) and shown to differ across PFP subgroups (Chapter
5). However, it is recommended that these conclusions should be re-evaluated once further
research has investigated the 3D features in a younger PFP population.
7.2.2 Subgrouping in PFP
Work has begun to explore subgrouping and stratification within PFP [254, 366, 374] but the
findings of this thesis represent the first time that clinical features have been integrated with
modifiable biomechanical and modifiable imaging features to identify PFP subgroups. The
findings of this thesis show that four subgroups can be identified from a PFP cohort: ‘Strong’,
Pronation & Malalignment’, ‘Weak’ and ‘Flexible’ subgroups.
These subgroups show many similarities to the subgroups identified by Selfe et al. (2016)
[254]. The addition of the imaging features, in particular MRI bisect offset, was an important
factor for determining the ‘Pronation & Malalignment’ subgroup whereas the kinematic
features showed no statistical difference across subgroups and thus appear a less important
factor. Both the findings of the work described in this thesis and the Selfe et al. (2016) [254]
study identified a ‘Strong’ group which supports the theory that a PFP subgroup exists with
normal strength. This challenges current practice with a recent survey of UK
physiotherapists [542] highlighting that 98% of physiotherapists prescribe closed chain
strengthening exercise. This ‘Strong’ subgroup is unlikely to benefit from further
strengthening and probably requires alternative interventions.
A recent editorial on stratification in musculoskeletal pathology [485] suggest that the overall
aim of stratification should be to focus on cross-domain combinations. This is essentially the
outcome of Chapter 5, however, due to the lack of supporting evidence for their inclusion,
psychological and lifestyle factors were not included in the cluster analysis although were
reported descriptively. A recent systematic review [592] on the psychological features
present in PFP suggest that catastrophizing, anxiety and depression are correlated to
physical function. However, correlation can only provide a strength of the linear relationship
and is unable to account for the latent constructs involved in these complex relationships
236
Chapter 7. Discussion
[469]. It is also still clear that there is a lack of consistency in the psychological constructs
investigated both in terms of the nomenclature and the outcome measures used. This would
still limit the inclusion of these constructs in Chapter 5 (PFP subgrouping). In terms of
lifestyle factors, body mass index (BMI), not directly investigated before in PFP, has recently
been shown to be higher in PFP compared to healthy controls [593]. With reference to the
subgroups in Chapter 5, the potential for overweight PFP subgroups is demonstrated with
two of the subgroups the Pronation & Malalignment group and the Weak group showing
mean BMI values that would be classed as overweight (> 25 kg/m2). BMI remains a viable
treatment target for future studies in PFP as weight reduction programmes have significantly
improved those with knee OA [594].
Overall the subgroups identified in this thesis represent groups derived statistically using a
unique combination of biomechanical, clinical and imaging features. Being intentionally
based on modifiable features has ensured that subgroups are more likely to have clear
treatment targets e.g. the Weak group is likely to respond to strengthening exercises etc.
Based on recent evidence more consideration should be given to including psychological
and lifestyle factors as these subgroups are investigated in larger data sets.
7.2.3 Prognosis of PFP subgroups
The prognostic analyses in this thesis (Chapter 5) suggests that despite finding no formal
statistical difference, there was a trend towards the Weak subgroup being the least likely and
the Flexible subgroup most likely to report a favourable outcome. It is speculated that the
Weak subgroup who also report the most disability showed less improvement because both
reduced knee strength and poor baseline function are known to lead to a poor long-term
response to treatment in PFP [298, 301, 510]. Alternatively, the Flexible subgroup who had
the highest physical activity might represent a group transiently exceeding joint loading and
who are able to improve with simple rest and load management [595].
Only one other study has explored the long-term prognosis of PFP subgroups [596]. Similar
to Chapter 5, Keays et al. (2016) [596] also found no statistical difference between PFP
subgroups for pain and disability at follow up. These results and the thesis findings suggest
that there are minimal differences in the long-term outcomes for PFP subgroups. It is worth
noting however, that the unorthodox study design and the inclusion of participants with a
237
Chapter 7. Discussion
mean age of 45 years ( range 13-82 years) in the Keays et al. (2016) [596] study precludes a
direct comparison with the findings of the prognostic analysis in this thesis. Furthermore,
both findings are based on low statistical power due to the relatively small sample sizes used
and thus the prognostic outcomes of PFP subgroups remains inconclusive. Prognostic
outcomes also remain largely the selection of covariates for statistical testing [597]. A recent
systematic review [483] examined all the studies which investigated prognostic factors in
PFP found that the only prognostic factor which was consistently identified was ‘duration of
symptoms’ [483] thus supporting the selection of covariates used in Chapter 5.
Overall, the differences in long-term outcomes for PFP subgroups remain equivocal,
although the inclusion of recognised covariates for the prognostic analyses in this thesis
strengthens the conclusions that can be drawn from the findings. The trends towards an
unfavourable outcome would suggest that more attention should be made to identifying the
Weak group and research prioritised to identify the best management for this subgroup.
7.2.4 Stratifying treatment in PFP
The most recent International PFP consensus statement [115] again highlights the
importance of stratification and targeted treatment. The results of this thesis demonstrated
that in people with PFP selected for hip abductor weakness and targeted with progressive,
isolated hip strengthening exercises, nearly two thirds reported an improvement at 8 weeks
compared to fewer than ten percent of people receiving usual care. This improvement
appears related to changes in lower limb kinematics (a reduction in peak internal rotation
angle).
The few previous studies stratifying treatment are highlighted within this thesis but recently
another study has been published [598] which uses similar methodology to Chapter 6
(feasibility study). Mølgaard et al. (2017) [598] investigated the effect of foot-targeted
exercise and orthoses when patients were selected for an increased calcaneal valgus angle.
Their findings also show that targeted treatment led to a significant improvement in pain (at
four months) but no difference between groups at 12 months. Mølgaard et al. (2017) [598]
selected covariates for analysis according to any baseline differences. Adjusting for baseline
differences is discouraged by current guidelines [551] because what is important is the
magnitude of the effect on the outcome, rather than the significance between groups [599].
238
Chapter 7. Discussion
Ill-informed adjustments may weaken the conclusions from this recent study [598] but their
findings do corroborate the effectiveness of this treatment approach.
Overall, the positive outcomes shown by the feasibility study in this thesis and the similar
outcomes observed by previous [340] and recent studies [598] supports the benefit of
stratified treatment in PFP. Taken together these findings highlight the need for a future
definitive multicentre RCT on targeted treatment in PFP and the need to ensure that
improvements are maintained long term (≥ 12 months).
7.2.5 Study design in PFP studies
Since writing the narrative literature review in Chapter 2, the latest patellofemoral pain
consensus statement [115, 547] has been published following the biennial International
Patellofemoral Pain Research Retreat in 2015. This statement has, for the first time, clearly
defined PFP as “ pain around or behind the patella, which is aggravated by at least one
activity that loads the patellofemoral joint during weight bearing on a flexed knee (e.g.
squatting, stairs, running, jumping)” [115]. This is important as the findings of Chapter 2 & 3
show that eligibility criteria vary in terms of the number of activities that need to reproduce
pain; potentially limiting the comparison between cohorts. The PFP cohort used in Chapter 5
& 6 recruited participants which were aggravated by two activities. Theoretically, using a less
strict definition of one aggravating activity should make recruitment easier. However, post
hoc analysis of the potential participants that failed screening (n=47) in Chapter 5 suggests
that none of these failed due to the number of aggravating activities (i.e. only reporting one
activity). This suggests that people with PFP are typically affected by more than one
aggravating activity. Ultimately, this more recently accepted definition will provide consensus
for future eligibility criteria in PFP research and strengthen any future comparisons between
studies.
The feasibility of targeted treatment in PFP was the focus of Chapter 6. The intervention
duration of six weeks was based on previous literature and usual care, and not standardised
in order to be pragmatic. Pragmatic trials aim to investigate interventions that will be useful
within an everyday clinical setting, to maximise applicability [600]. Based on a recent survey
into current UK practice of PFP [542], there may be some iterative improvements needed for
the methods used in Chapter 6. In this survey of UK based physiotherapists [542], the
majority of respondents would see their patients for 3-6 sessions; similar to the 6 sessions
239
Chapter 7. Discussion
used in Chapter 6. However, the result of this survey [542] show that a large variation exists
for the typical length of treatment from 3 weeks to 6 months. The weekly sessions used in
Chapter 6 may represent a more intense physiotherapy intervention compared to standard
UK clinical practice. Careful consideration needs to be made of this detail when designing
future interventional studies that are intended not only to reflect current clinical practice but
also to be implemented successfully.
The improvement seen in Chapter 6 was made using a six week treatment period so there
remains the possibility that a longer treatment period may have led to more people reporting
a favourable outcome. The targeted treatment delivered by the Mølgaard et al. (2017) [598]
study employed double the treatment period (3 sessions per week during a 12 week period)
compared to Chapter 6 (3 sessions per week during a 6 week period) but despite this they
only showed an successful outcome in 60% (12/20) ( versus 67% in Chapter 6) receiving
their matched treatment. This could contradict the theory that a longer treatment period in
Chapter 6 would have led to more people reporting a favourable outcome. Instead, in
addition to the hip strength, targeting the other characteristics of the subgroup (e.g. knee
strength or physical activity) refined in Chapter 5 might improve the number of favourable
outcomes reported.
The encouraging feasibility outcomes shown in Chapter 6 supports the future design of a
definitive randomised controlled trial focused on stratified treatment in PFP. Based on the
evidence above, this could be enhanced by: careful consideration of the clinical eligibility and
the use of the current recommended criteria [115, 547]; allowing a more pragmatic approach
to the length of the treatment period which reflects current practice; and targeting more
refined subgroups ( based on more than one characteristic) – as identified in Chapter 5 (PFP
subgrouping).
7.3 Limitations of the current work
The limitations of each chapter have been discussed in detail in the relevant chapters. To
contextualise the main findings of the thesis an overview of the thesis limitations concerning
the research design and outcome measures is provided here.
7.3.1 Sample size
240
Chapter 7. Discussion
The sample sizes of the preceding chapters within this thesis varied considerably. The
sample size used in Chapter 4 benefited from a pre-existing data set in which to select
relatively large comparative groups and the sample size used in Chapter 6 was deemed
appropriate for a feasibility design. Chapter 5 relied on a recruitment of an age group 18-40
years old. Prior consideration was made to the difficulties with recruitment and retention of
this ‘emerging adulthood’ group [601] following discussion with experts. This age group are
known to be experiencing many life changes including graduating, entering the job market,
having children, moving house etc. [601] which may limit their recruitment availability. As a
result, a realistic recruitment target of n = 77 was considered achievable for a single-centre
site for patient with PFP. A larger sample size would enable more substantial clusters and
reduce the potential for spurious groupings [602]. An attempt to address this issue was
made by using a two-stage clustering process which is considered a dimensionality
reduction technique [364] as described in Chapter 5. The impact that the sample size has on
the final clusters will only become apparent once validation of these subgroups are made on
other cohorts of people with PFP [254, 364] as suggested in Chapter 5.
7.3.2 Treatment duration
A treatment duration of 6 weeks was used in Chapter 6 based on previous literature. The
intention in this chapter was to explore the feasibility in terms of recruitment, adherence and
retention. As a result, a standardised treatment duration was selected in order not to
introduce another independent variable. It is plausible that both clinical and mechanistic
outcomes might require a longer duration for these outcomes to show a greater effect. One
of the potential issues for a longer treatment duration, however, could be its deleterious
effect on adherence [603] and the increase in resources e.g. staff costs, time etc.
7.3.3 Non-weight bearing MRI
As mentioned in the preceding chapters, the MRI data used in Chapter 4 and 5 were based
on supine, non-weight bearing scan MRI protocols. The sensitivity analysis, shown in
Chapter 3, demonstrates that this will have an impact on imaging outcomes including bisect
offset and patella tilt. Weight bearing and loaded scans were not used in this thesis as a
weight bearing MRI scanner was not available and no protocols existed within the
department to safely load the knee. Consideration was made to this potential issue when
understanding the findings in Chapter 4 and adjustments were made to the normative MRI
241
Chapter 7. Discussion
data for interpretation of the subgroups in Chapter 5. These adjustments should have
minimised the impact of procedural variation.
7.3.4 Marker based motion capture
One of the inherent problems with marker-based motion capture analysis is the likely
systematic error introduced by skin artefact and the test-retest reliability of such data [604].
The industry standard CAST marker set up was applied, which has previously shown high
test-rest reliability [605, 606]. A systematic review of three dimensional kinematic gait
measurements [607] suggest that the reliability of sagittal and coronal kinematic measures
are on average greater than 0.7 (coefficients of multiple correlations or interclass correlation
coefficients). This would suggest that the peak knee flexion angle used in Chapter 5 and the
peak hip abduction angle and total coronal hip ROM used in Chapter 6 are adequately
reliable measures. Caution is advised, however, when interpreting the peak hip rotation
angle results in both Chapter 5 and 6 as the same review showed that overall hip transverse
rotation demonstrated the lowest reliability and the widest variation, compared to other
planes. Nonetheless, they [607] did identify at least five studies that showed a small error
indicating that a greater reliability value for hip transverse measurement is achievable. [607].
Previous literature shows that hip transverse plane kinematics during stair descent for PFP
patients yields an promising between-day reliability of ICC 0.75 with a SEM of 4°[188]. One
of the potential factors influencing the retest reliability is the known discordance between
skin markers and the movement actually occurring in the underlying bone [604]. A
comparison of skin markers with surgical attached bone-pin markers demonstrated this
discrepancy [604] and highlights the need to consider this fact when interpreting these
findings clinically. Nevertheless, the alternative bone–pin markers are not a viable option for
any of the experiments conducted in thesis due to their invasive nature.
7.4 Directions for Future Research
7.4.1 Imaging in PFP
Imaging in PFP appears to be important as structural differences have been reported in this
thesis to exist between those with and without pain. However, the contrast in findings
between the extant literature using 2D measures (Chapter 3) and careful 3D analysis
(Chapter 4) which removes many projectional problems which confound this area adds
242
Chapter 7. Discussion
substantially to the debate on the importance of imaging in PFP. To address these issues,
firstly the 3D PFJ features developed in Chapter 4 need to be explored in a younger
population with PFP and investigated longitudinally to see whether changes in pain and
disability are related to changes in shape. Likewise, if followed up for long enough these 3D
PFJ features could provide a useful biomarker for elucidating the potential link between PFP
and PFOA. Finally, the effect of conservative interventions such as hip strengthening or foot
orthoses on structural features should be explored, similar to the investigation by Chiu et al.
(2012) [166] which has been discussed in the preceding chapters.
7.4.2 Link between PFP and PFOA
Experts believe that PFP may represent a precursor to the development of PFOA [5]. In the
subgrouping in Chapter 5, the only published MRI definition for PFOA [523] was applied, and
thus osteophytes were scored accordingly. This definition was developed from a Delphi
consensus panel [523] that considered the presence of an osteophyte important enough to
be one of the two components of their agreed definition (a definite osteophyte and partial or
full thickness cartilage loss). A recent systematic review [608] including 85 studies on the
prevalence of PFOA concluded that the prevalence of BML and cartilage defect was 32%
and 52% respectively in two symptomatic populations, one over and one under 50 years.
This was based on cartilage and BMLs only as the osteophyte component was omitted and
thus the prevalence of PFOA may be overestimated in this review [608]. In support of this
osteophyte omission, the original Delphi study [523] does state that what constitutes a
‘definite osteophyte’ within the PFJ needs to be further delineated. Therefore future research
is required to explore the characterisation of a PFJ osteophyte and agree on the exact
definition of PFOA.
The findings from Chapter 5 suggest that the Pronation & Malalignment group showed the
most MRI features (osteophytes & cartilage loss) associated with PFOA. Understanding the
possible link between PFP and future PFOA continues to be of great importance to the PFP
research community [5] and, as highlighted in section 7.4.1, recent studies are beginning to
develop suitable outcomes and biomarkers to identify this relationship. A recent study
showed that those that reported having adolescent AKP were 7.5 times more likely to
develop symptomatic PFOA later in life [609] which supports previous findings [38] . One of
the major problems with these retrospective designs is the approximately 50 years of recall
needed. Ultimately, this question will only be answered by prospective longitudinal studies
243
Chapter 7. Discussion
with data captured from individuals at regular time points from adolescence to late
adulthood. Ancillary research is also essential to ensure that appropriate techniques and
biomarkers e.g. imaging features are available to identify the potentially subtle transition into
an osteoarthritic state [610].
7.4.3 Subgrouping in PFP
While this thesis used robust methods to identify subgroups, consideration should be given
to including additional features for which evidence has developed since the conception of
the thesis. As discussed, there was a paucity of research on psychosocial factors and thus
none of these factors satisfied the variable selection criteria. Firstly, future research should
consider refining subgroups using variables such as catastrophizing, fear avoidance etc.
Emerging evidence around somatosensory function has also indicated that both adults [611-
613] and adolescents [614, 615] with PFP have significantly reduced pain pressure threshold
(PPT). As a result, future research is warranted to see how pain pressure thresholds might
relate to the subgroups identified from this thesis
Investigating the prognosis of the subgroups suggested in Chapter 5 is a key strength of this
thesis. Crepitus is a commonly reported feature of PFP [3] which has previously been under
investigated in terms of its effect on patient outcomes. A recent qualitative investigation [616]
on the effect of crepitus on health beliefs highlighted that crepitus may ultimately lead to fear
avoidance behaviour which as noted by the author “are in direct conflict with the usual aims
of a physiotherapy intervention” [616]. Therefore it remains possible that the presence and/or
negative beliefs held about crepitus may be confounding the prognostic outcomes seen.
Further research is required to investigate the impact of crepitus on physiotherapy outcome
and consideration should be made to adjusting for presence of crepitus during analyses.
7.4.4 Mechanism of action for PFP interventions
Without the knowledge of how exercise enhances pain and function in PFP, then future
therapeutic interventions cannot be optimised [617]. Future PFP interventions should be
required to consider the task and function they aim to improve. During even more
demanding tasks such as running and stairs descent, the range of hip movement is minimal
with the muscles instead required to provide a quick, efficient stabilising function [618].
Accordingly, one novel mechanism recently explored the rate of force development (RFD)
[618]. It has been shown in people with PFP that impairments in RFD exist during hip
244
Chapter 7. Discussion
abduction and hip extension but vary between the levels of torque. These results suggest
that future research should explore the effect of a more explosive, power based rehabilitation
on clinical outcomes and subsequent kinematics.
The effect of education on patient outcomes is relatively under investigated in PFP [377].
Education did form part of the first session of the intervention in Chapter 6, however, this
included more a justification of the proposed treatment rather than formal education on
managing PFP. A recent RCT [545] investigating runners with PFP demonstrated that
education alone provided significant improvement in all pain outcomes (VAS during running,
at worst and usual) and the addition of either gait retraining or exercise provided no
additional benefit. As expected, education alone resulted in no differences in mechanical
outcome including strength measures and running mechanics. This raises the question of
what the mechanism of action might be for education in this group. To answer this question
qualitative research is needed to understand how people with PFP are benefiting from
education. Additionally, this concept of education alone needs to be explored within the
general population with PFP as the content and the delivery is likely to differ from runners.
7.4.5 Stratified PFP interventions
The findings of this thesis have shown that targeting treatment in PFP is feasible. This
provides an important foundation for designing a future definitive multicentre RCT to
investigate the clinical and cost effectiveness of targeted treatment in PFP. Further research
should be directed towards discovering interventions that match to the novel subgroups
identified in this thesis and thus allowing each subgroup to be individually targeted, in
particular those subgroups less likely to improve with standard treatment. In these future
studies, outcomes need to be measured at short, medium and long term time points. They
also need to include a mechanistic assessment to provide knowledge on the mechanism of
effect and allow the subsequent refinement of the matched interventions.
7.5 Addressing the central hypothesis
The central hypothesis of this thesis was that “improved subgrouping of people with PFP
based on modifiable features will enable stratification and targeting of interventions”.
The programme of work within this thesis used a set of linked research projects designed to
245
Chapter 7. Discussion
examine and address the gaps within the current literature and inform the development of
subgroups within the PFP population using modifiable features. The subsequent feasibility
study (Chapter 6) demonstrated the potential success of target treatment and supports the
future evaluation of stratified treatment, utilising these PFP subgroups, beyond this PhD
thesis. Overall this would suggest that the findings of the thesis support the central
hypothesis.
7.6 Conclusion
PFP is a multifactorial condition with inconsistent treatment outcomes and is considered by
many to be a potential precursor to future PFOA. Subgroups are thought to exist in PFP but
currently this theory remains under-investigated. The work described in this thesis has
improved the understanding of the PFJ structure and identifies a number of features
associated with PFP. The advanced 3D quantitative imaging analysis highlights the impact
that inconsistent imaging position and mixed gender analysis may be having on these
morphological findings. Aligning this structural knowledge to existing biomechanical and
clinical features enabled the identification of four subgroups: ‘Strong’,’ Pronation &
Malalignment’, ‘Weak’ and ‘Flexible’. At 12 months follow up, these subgroups showed a
trend towards different odds of reporting a favourable outcome. This suggests that attention
should be focused on identifying and targeting treatment at the subgroups less likely to
improve or subgroups more amenable to a specific intervention. Targeting PFP subgroups
as demonstrated in this work appears to be feasible in terms of conversion to consent,
missing data, attrition and adherence. Now that novel subgroups have been identified and
targeted treatment shown to be conceptually feasible; future research should aim to
investigate this stratified approach within adequately powered multicentre clinical trials.
246
References
References
1. GrelsamerR.,MossG.,EeG.,etal.Thepatellofemoralsyndrome;thesameproblemasthe
LochNessMonster?TheKnee,2009.16(5):p.301-302.2. CallaghanM.J.andSelfeJ.Patellartapingforpatellofemoralpainsyndromeinadults.
CochraneDatabaseSystRev,2012.4:p.CD006717.3. CrossleyK.M.,CallaghanM.J.vanLinschotenR.Patellofemoralpain.BritishJournalofSports
Medicine,2016.50(4):p.247-250.4. CollinsN.J.,VicenzinoB.,VanDerHeijdenR.A.,etal.PainDuringProlongedSittingIsa
CommonProbleminPersonsWithPatellofemoralPain.JournalofOrthopaedicandSportsPhysicalTherapy,2016.46(8):p.658-663.
5. CrossleyK.M.Ispatellofemoralosteoarthritisacommonsequelaofpatellofemoralpain?BrJSportsMed,2014.48(6):p.409-10.
6. ThomasM.J.,WoodL.,SelfeJ.,etal.Anteriorkneepaininyoungeradultsasaprecursortosubsequentpatellofemoralosteoarthritis:asystematicreview.BMCMusculoskeletDisord,2010.11:p.201.
7. WoodL.,MullerS.PeatG.Theepidemiologyofpatellofemoraldisordersinadulthood:a
reviewofroutinegeneralpracticemorbidityrecording.PrimHealthCareResDev,2011.12(2):p.157-64.
8. MølgaardC.,RathleffM.S.SimonsenO.Patellofemoralpainsyndromeanditsassociationwith
hip,ankle,andfootfunctionin16-to18-year-oldhighschoolstudents:asingle-blindcase-
controlstudy.JournaloftheAmericanPodiatricMedicalAssociation,2011.101(3):p.215-222.
9. StatisticsN.OfficeforNationalStatistics.2012,December.10. StathopuluE.andBaildamE.Anteriorkneepain:along-termfollow-up.Rheumatology
(Oxford),2003.42(2):p.380-2.11. RathleffM.S.,RathleffC.R.,OlesenJ.L.,etal.Iskneepainduringadolescenceaself-limiting
condition?Prognosisofpatellofemoralpainandothertypesofkneepain.AmericanJournalofSportsMedicine,2016:p.0363546515622456.
12. BesierT.F.,DraperC.,PalS.,etal.ImagingandMusculoskeletalModelingtoInvestigatethe
MechanicalEtiologyofPatellofemoralPain.2011:p.269-286.13. DyeS.F.Thepathophysiologyofpatellofemoralpain:atissuehomeostasisperspective.
ClinicalOrthopaedicsandRelatedResearch2005.436:p.100-110.14. PowersC.M.,BolglaL.A.,CallaghanM.J.,etal.Patellofemoralpain:proximal,distal,andlocal
factors,2ndInternationalResearchRetreat.JOrthopSportsPhysTher,2012.42(6):p.A1-54.15. CollinsN.J.,BissetL.M.,CrossleyK.M.,etal.Efficacyofnonsurgicalinterventionsforanterior
kneepain.SportsMedicine,2012.42(1):p.31-49.16. BartonC.J.,LackS.,HemmingsS.,etal.The'BestPracticeGuidetoConservativeManagement
ofPatellofemoralPain':incorporatinglevel1evidencewithexpertclinicalreasoning.BrJSportsMed,2015.
17. BolglaL.A.andBolingM.C.Anupdatefortheconservativemanagementofpatellofemoral
painsyndrome:asystematicreviewoftheliteraturefrom2000to2010.InternationalJournalofSportsPhysicalTherapy,2011.6(2):p.112.
18. WitvrouwE.,WernerS.,MikkelsenC.,etal.Clinicalclassificationofpatellofemoralpain
syndrome:guidelinesfornon-operativetreatment.KneeSurgery,SportsTraumatology,Arthroscopy,2005.13(2):p.122-130.
247
References
19. CollinsN.J.,Bierma-ZeinstraS.M.,CrossleyK.M.,etal.Prognosticfactorsforpatellofemoral
pain:amulticentreobservationalanalysis.BrJSportsMed,2013.47(4):p.227-33.20. WitvrouwE.,CallaghanM.J.,StefanikJ.J.,etal.Patellofemoralpain:consensusstatement
fromthe3rdInternationalPatellofemoralPainResearchRetreatheldinVancouver,
September2013.BrJSportsMed,2014.48(6):p.411-4.21. HillJ.C.,WhitehurstD.G.,LewisM.,etal.Comparisonofstratifiedprimarycaremanagement
forlowbackpainwithcurrentbestpractice(STarTBack):arandomisedcontrolledtrial.TheLancet,2011.378(9802):p.1560-1571.
22. CallaghanM.J.WillSub-classificationofPatellofemoralPainImprovePhysiotherapy
Treatment?,inSportsInjuries.2012,Springer.p.571-577.23. CookC.,MabryL.,ReimanM.P.,etal.Besttests/clinicalfindingsforscreeninganddiagnosis
ofpatellofemoralpainsyndrome:asystematicreview.Physiotherapy,2012.98(2):p.93-100.24. vanderHeijdenR.A.,LankhorstN.E.,vanLinschotenR.,etal.Exercisefortreating
patellofemoralpainsyndrome.CochraneDatabaseSystRev,2015.1:p.CD010387.25. SmithT.O.,DrewB.T.,MeekT.H.,etal.Kneeorthosesfortreatingpatellofemoralpain
syndrome.CochraneDatabaseSystRev,2015(12).26. CallaghanM.J.,McKieS.,RichardsonP.,etal.Effectsofpatellartapingonbrainactivityduring
kneejointproprioceptiontestsusingfunctionalmagneticresonanceimaging.PhysicalTherapy,2012.92(6):p.821-30.
27. HeyW.Oninternalderangementoftheknee.PracticalObservationsinSurgery,1803.28. FithianD.C.Ahistoricalperspectiveofanteriorkneepain.SportsMedicineandArthroscopy
Review,2001.9(4):p.273-281.29. RoyleS.,NobleJ.,DaviesD.,etal.Thesignificanceofchondromalacicchangesonthepatella.
Arthroscopy:TheJournalofArthroscopic&RelatedSurgery,1991.7(2):p.158-160.30. DyeS.F.,VaupelG.L.DyeC.C.Consciousneurosensorymappingoftheinternalstructuresof
thehumankneewithoutintraarticularanesthesia.AmericanJournalofSportsMedicine,1998.26(6):p.773-7.
31. Sanchis-AlfonsoV.Anteriorkneepainandpatellarinstability.2011:SpringerScience&BusinessMedia.
32. PostW.R.Patellofemoralsyndrome—atermtobeavoided:lettertotheeditor.AmericanJournalofSportsMedicine,2016.44(5):p.NP22-NP22.
33. ThomeéR.,AugustssonJ.KarlssonJ.Patellofemoralpainsyndrome.SportsMedicine,1999.28(4):p.245-262.
34. DavisI.S.andPowersC.PatellofemoralPainSyndrome:Proximal,Distal,andLocalFactors—
InternationalResearchRetreat,April30–May2,2009,Baltimore,Maryland.JournalofOrthopaedic&SportsPhysicalTherapy,2010.40(3):p.A1-A48.
35. BlondL.andHansenL.Patellofemoralpainsyndromeinathletes:a5.7-yearretrospective
follow-upstudyof250athletes.ActaOrthopaedicaBelgica,1998.64(4):p.393-400.36. NimonG.,MurrayD.,SandowM.,etal.Naturalhistoryofanteriorkneepain:a14-to20-year
follow-upofnonoperativemanagement.JPediatrOrthop,1998.18(1):p.118-22.37. SandowM.andGoodfellowJ.Thenaturalhistoryofanteriorkneepaininadolescents.
JournalofBone&JointSurgery,BritishVolume,1985.67(1):p.36-38.38. UttingM.,DaviesG.NewmanJ.Isanteriorkneepainapredisposingfactortopatellofemoral
osteoarthritis?TheKnee,2005.12(5):p.362-365.39. ThorstenssonC.A.,AnderssonM.L.,JönssonH.,etal.Naturalcourseofkneeosteoarthritisin
middle-agedsubjectswithkneepain:12-yearfollow-upusingclinicalandradiographic
criteria.AnnalsoftheRheumaticDiseases,2009.68(12):p.1890-1893.
248
References
40. CallaghanM.J.andSelfeJ.Hastheincidenceorprevalenceofpatellofemoralpaininthe
generalpopulationintheUnitedKingdombeenproperlyevaluated?PhysicalTherapyinSport,2007.8(1):p.37-43.
41. ShieldsL.andTwycrossA.Thedifferencebetweenincidenceandprevalence.PaediatricNursing,2003.15(7):p.50.
42. DevereauxM.andLachmannS.Patello-femoralarthralgiainathletesattendingaSports
InjuryClinic.BritishJournalofSportsMedicine,1984.18(1):p.18-21.43. BolingM.,PaduaD.,MarshallS.,etal.Genderdifferencesintheincidenceandprevalenceof
patellofemoralpainsyndrome.ScandinavianJournalofMedicineandScienceinSports,2010.20(5):p.725-730.
44. VanMiddelkoopM.,VanLinschotenR.,BergerM.Y.,etal.Kneecomplaintsseeningeneral
practice:activesportparticipantsversusnon-sportparticipants.BMCMusculoskeletalDisorders,2008.9(1):p.36.
45. OakesJ.L.,McCandlessP.SelfeJ.Explorationofthecurrentevidencebasefortheincidenceandprevalenceofpatellofemoralpainsyndrome.PhysicalTherapyReviews,2009.14(6):p.382-387.
46. LambJ.,PuskarK.R.Tusaie-MumfordK.Adolescentresearchrecruitmentissuesand
strategies:applicationinaruralschoolsetting.JournalofPediatricNursing,2001.16(1):p.43-52.
47. FossK.D.B.,MyerG.D.,ChenS.S.,etal.Expectedprevalencefromthedifferentialdiagnosisof
anteriorkneepaininadolescentfemaleathletesduringpreparticipationscreening.JournalofAthleticTraining,2012.47(5):p.519-524.
48. PhillipsJ.andCoetseeM.Incidenceofnon-traumaticanteriorkneepainamong11-17-years-
olds.SouthAfricanJournalofSportsMedicine,2007.19(2):p.60-64.49. MyerG.D.,FordK.R.,FossK.D.B.,etal.Theincidenceandpotentialpathomechanicsof
patellofemoralpaininfemaleathletes.ClinicalBiomechanics,2010.25(7):p.700-707.50. RathleffM.S.,SkuldbølS.K.,RaschM.N.,etal.Care-seekingbehaviourofadolescentswith
kneepain:apopulation-basedstudyamong504adolescents.BMCMusculoskeletalDisorders,2013.14(1):p.225.
51. TanS.S.,VanLinschotenR.,VanMiddelkoopM.,etal.Cost-utilityofexercisetherapyinadolescentsandyoungadultssufferingfromthepatellofemoralpainsyndrome.ScandinavianJournalofMedicineandScienceinSports,2010.20(4):p.568-579.
52. vanLinschotenR.,vanMiddelkoopM.,BergerM.Y.,etal.Supervisedexercisetherapyversususualcareforpatellofemoralpainsyndrome:anopenlabelrandomisedcontrolledtrial.BMJ,2009.339:p.b4074.
53. LankhorstN.E.,Bierma-ZeinstraS.M.vanMiddelkoopM.Riskfactorsforpatellofemoralpain
syndrome:asystematicreview.JOrthopSportsPhysTher,2012.42(2):p.81-94.54. VanTiggelenD.,WitvrouwE.,CoorevitsP.,etal.Analysisofisokineticparametersinthe
developmentofanteriorkneepainsyndrome:aprospectivestudyinamilitarysetting.IsokineticsandExerciseScience,2004.12(4):p.223-228.
55. WitvrouwE.,LysensR.,BellemansJ.,etal.Intrinsicriskfactorsforthedevelopmentof
anteriorkneepaininanathleticpopulationatwo-yearprospectivestudy.TheAmericanJournalofSportsMedicine,2000.28(4):p.480-489.
56. DuvigneaudN.,BernardE.,StevensV.,etal.Isokineticassessmentofpatellofemoralpain
syndrome:aprospectivestudyinfemalerecruits.IsokineticsandExerciseScience,2008.16(4):p.213-219.
57. MilgromC.,FinestoneA.,EldadA.,etal.Patellofemoralpaincausedbyoveractivity.A
prospectivestudyofriskfactorsininfantryrecruits.TheJournalofBone&JointSurgery,1991.73(7):p.1041-1043.
249
References
58. BolingM.C.,PaduaD.A.,MarshallS.W.,etal.Aprospectiveinvestigationofbiomechanicalrisk
factorsforpatellofemoralpainsyndromethejointundertakingtomonitorandpreventACL
injury(JUMP-ACL)cohort.AmericanJournalofSportsMedicine,2009.37(11):p.2108-2116.59. ThijsY.,VanTiggelenD.,RoosenP.,etal.Aprospectivestudyongait-relatedintrinsicrisk
factorsforpatellofemoralpain.Clinicaljournalofsportmedicine,2007.17(6):p.437-445.60. HerbstK.A.,FossK.D.B.,FaderL.,etal.Hipstrengthisgreaterinathleteswhosubsequently
developpatellofemoralpain.TheAmericanJournalofSportsMedicine,2015:p.0363546515599628.
61. MyerG.D.,FordK.R.,DiStasiS.L.,etal.Highkneeabductionmomentsarecommonrisk
factorsforpatellofemoralpain(PFP)andanteriorcruciateligament(ACL)injuryingirls:is
PFPitselfapredictorforsubsequentACLinjury?BritishJournalofSportsMedicine,2015.49(2):p.118-122.
62. RathleffM.,RathleffC.,CrossleyK.,etal.Ishipstrengthariskfactorforpatellofemoralpain?
Asystematicreviewandmeta-analysis.BritishJournalofSportsMedicine,2014:p.bjsports-2013-093305.
63. GrelsamerR.P.PatellarMalalignment*.JBoneJointSurgAm,2000.82(11):p.1639-1639.64. FenechC.andKeavenyT.Acellularsolidcriterionforpredictingtheaxial-shearfailure
propertiesofbovinetrabecularbone.TRANSACTIONS-AMERICANSOCIETYOFMECHANICALENGINEERSJOURNALOFBIOMECHANICALENGINEERING,1999.121:p.414-422.
65. FarrokhiS.,KeyakJ.H.PowersC.M.Individualswithpatellofemoralpainexhibitgreater
patellofemoraljointstress:afiniteelementanalysisstudy.OsteoarthritisCartilage,2011.19(3):p.287-94.
66. HoK.Y.,KeyakJ.H.PowersC.M.Comparisonofpatellabonestrainbetweenfemaleswithand
withoutpatellofemoralpain:afiniteelementanalysisstudy.JBiomech,2014.47(1):p.230-6.
67. LiG.,YinJ.,GaoJ.,etal.Subchondralboneinosteoarthritis:insightintoriskfactorsandmicrostructuralchanges.ArthritisResTher,2013.15(6):p.223.
68. HoK.Y.,HuH.H.,CollettiP.M.,etal.Recreationalrunnerswithpatellofemoralpainexhibit
elevatedpatellawatercontent.MagnResonImaging,2014.32(7):p.965-8.69. HejgaardN.andArnoldiC.C.Osteotomyofthepatellainthepatellofemoralpainsyndrome.
Thesignificanceofincreasedintraosseouspressureduringsustainedkneeflexion.IntOrthop,1984.8(3):p.189-94.
70. DraperC.E.,QuonA.,FredericsonM.,etal.ComparisonofMRIand(1)(8)F-NaFPET/CTin
patientswithpatellofemoralpain.JMagnResonImaging,2012.36(4):p.928-32.71. NaslundJ.E.,OdenbringS.,NaslundU.B.,etal.Diffuselyincreasedbonescintigraphicuptake
inpatellofemoralpainsyndrome.BrJSportsMed,2005.39(3):p.162-5.72. DraperC.E.,FredericsonM.,GoldG.E.,etal.Patientswithpatellofemoralpainexhibit
elevatedbonemetabolicactivityatthepatellofemoraljoint.JOrthopRes,2012.30(2):p.209-13.
73. WojtysE.M.,BeamanD.N.,GloverR.A.,etal.Innervationofthehumankneejointby
substance-Pfibers.Arthroscopy:TheJournalofArthroscopic&RelatedSurgery,1990.6(4):p.254-263.
74. DyeS.F.Thekneeasabiologictransmissionwithanenvelopeoffunction:atheory.Clinicalorthopaedicsandrelatedresearch,1996.325:p.10-18.
75. DyeS.F.,StäubliH.U.,BiedertR.M.,etal.Themosaicofpathophysiologycausing
patellofemoralpain:Therapeuticimplications.OperativeTechniquesinSportsMedicine,1999.7(2):p.46-54.
76. Sanchis-AlfonsoV.Pathophysiologyofanteriorkneepain,inPatellofemoralpain,instability,
andarthritis.2010,Springer.p.1-16.
250
References
77. MericanA.M.andAmisA.A.Anatomyofthelateralretinaculumoftheknee.JBoneJointSurgBr,2008.90(4):p.527-34.
78. FulkersonJ.P.andGosslingH.R.Anatomyofthekneejointlateralretinaculum.ClinOrthopRelatRes,1980(153):p.183-8.
79. FulkersonJ.P.,TennantR.,JaivinJ.S.,etal.Histologicevidenceofretinacularnerveinjuryassociatedwithpatellofemoralmalalignment.ClinOrthopRelatRes,1985(197):p.196-205.
80. Sanchis-AlfonsoV.andRosello-SastreE.Immunohistochemicalanalysisforneuralmarkersof
thelateralretinaculuminpatientswithisolatedsymptomaticpatellofemoralmalalignment.
Aneuroanatomicbasisforanteriorkneepainintheactiveyoungpatient.AmJSportsMed,2000.28(5):p.725-31.
81. Sanchis-AlfonsoV.,Rosello-SastreE.,Monteagudo-CastroC.,etal.Quantitativeanalysisofnervechangesinthelateralretinaculuminpatientswithisolatedsymptomatic
patellofemoralmalalignment.Apreliminarystudy.AmJSportsMed,1998.26(5):p.703-9.82. SchootsE.J.,TakI.J.,VeenstraB.J.,etal.Ultrasoundcharacteristicsofthelateralretinaculum
in10patientswithpatellofemoralpainsyndromecomparedtohealthycontrols.JBodywMovTher,2013.17(4):p.523-9.
83. DragooJ.L.,JohnsonC.McConnellJ.Evaluationandtreatmentofdisordersoftheinfrapatellar
fatpad.SportsMed,2012.42(1):p.51-67.84. BennellK.,HodgesP.,MellorR.,etal.Thenatureofanteriorkneepainfollowinginjectionof
hypertonicsalineintotheinfrapatellarfatpad.JournalofOrthopaedicResearch,2004.22(1):p.116-21.
85. HodgesP.W.,MellorR.,CrossleyK.,etal.Paininducedbyinjectionofhypertonicsalineintotheinfrapatellarfatpadandeffectoncoordinationofthequadricepsmuscles.ArthritisRheum,2009.61(1):p.70-7.
86. BohnsackM.,HurschlerC.,DemirtasT.,etal.Infrapatellarfatpadpressureandvolume
changesoftheanteriorcompartmentduringkneemotion:possibleclinicalconsequencesto
theanteriorkneepainsyndrome.KneeSurgery,SportsTraumatology,Arthroscopy,2005.13(2):p.135-41.
87. BohnsackM.,KlagesP.,HurschlerC.,etal.Influenceofaninfrapatellarfatpadedemaon
patellofemoralbiomechanicsandkneekinematics:apossiblerelationtotheanteriorknee
painsyndrome.ArchivesofOrthopaedicandTraumaSurgery,2009.129(8):p.1025-30.88. JibriZ.,MartinD.,MansourR.,etal.Theassociationofinfrapatellarfatpadoedemawith
patellarmaltracking:acase-controlstudy.SkeletalRadiol,2012.41(8):p.925-31.89. SubhawongT.K.,ThakkarR.S.,PaduaA.,etal.Patellofemoralfrictionsyndrome:magnetic
resonanceimagingcorrelationofmorphologicandT2cartilageimaging.JComputAssistTomogr,2014.38(2):p.308-12.
90. EivaziM.andSelfeJ.Infrapatellarfatpadlesions:theoreticalconsiderationsandpracticalimplications.PhysicalTherapyReviews,2008.13(1):p.11-16.
91. GrayH.Gray'sanatomyofthehumanbody.1985:Lea&Febiger.92. ScanzelloC.R.andGoldringS.R.Theroleofsynovitisinosteoarthritispathogenesis.Bone,
2012.51(2):p.249-57.93. WitonskiD.andWagrowska-DanielewiczM.Distributionofsubstance-Pnervefibersinthe
kneejointinpatientswithanteriorkneepainsyndrome.Apreliminaryreport.KneeSurgSportsTraumatolArthrosc,1999.7(3):p.177-83.
94. BohnsackM.,MeierF.,WalterG.F.,etal.Distributionofsubstance-Pnervesinsidetheinfrapatellarfatpadandtheadjacentsynovialtissue:aneurohistologicalapproachto
anteriorkneepainsyndrome.ArchivesofOrthopaedicandTraumaSurgery,2005.125(9):p.592-7.
251
References
95. RathleffM.S.,PetersenK.K.,Arendt-NielsenL.,etal.Impairedconditionedpainmodulationin
youngfemaleadultswithlong-standingpatellofemoralpain:asingleblindedcross-sectional
study.PainMedicine,2015:p.pnv017.96. JensenR.,HystadT.,KvaleA.,etal.Quantitativesensorytestingofpatientswithlonglasting
patellofemoralpainsyndrome.EuropeanJournalofPain,2007.11(6):p.665-676.97. RathleffM.S.,RoosE.M.,OlesenJ.L.,etal.Lowermechanicalpressurepainthresholdsin
femaleadolescentswithpatellofemoralpainsyndrome.JournalofOrthopaedic&SportsPhysicalTherapy,2013.43(6):p.414-421.
98. DeLalouvièreL.L.H.,IoannouY.FitzgeraldM.Neuralmechanismsunderlyingthepainof
juvenileidiopathicarthritis.NatureReviewsRheumatology,2014.10(4):p.205-211.99. SelfeJ.,HardakerN.,ThewlisD.,etal.Anaccurateandreliablemethodofthermaldata
analysisinthermalimagingoftheanteriorkneeforuseincryotherapyresearch.ArchivesofPhysicalMedicineandRehabilitation,2006.87(12):p.1630-1635.
100. SelfeJ.,HarperL.,PedersenI.,etal.Coldlegs:apotentialindicatorofnegativeoutcomeinthe
rehabilitationofpatientswithpatellofemoralpainsyndrome.TheKnee,2003.10(2):p.139-143.
101. SelfeJ.,SuttonC.,HardakerN.J.,etal.Anteriorkneepainandcoldknees:Apossibleassociationinwomen.TheKnee,2010.17(5):p.319-323.
102. AllenJ.Photoplethysmographyanditsapplicationinclinicalphysiologicalmeasurement.PhysiologicalMeasurement,2007.28(3):p.R1.
103. Sanchis-AlfonsoV.,Roselló-SastreE.,Saus-MasJ.,etal.BiologicalCausesofAnteriorKneePain,inAnteriorKneePainandPatellarInstability.2011,Springer.p.33-49.
104. BennellK.,WeeE.,CrossleyK.,etal.Effectsofexperimentally-inducedanteriorkneepainon
kneejointpositionsenseinhealthyindividuals.JournalofOrthopaedicResearch,2005.23(1):p.46-53.
105. CallaghanM.J.Whatdoesproprioceptiontestingtellusaboutpatellofemoralpain?ManTher,2011.16(1):p.46-7.
106. BakerV.,BennellK.,StillmanB.,etal.Abnormalkneejointpositionsenseinindividualswith
patellofemoralpainsyndrome.JournalofOrthopaedicResearch,2002.20(2):p.208-14.107. CallaghanM.J.,SelfeJ.,McHenryA.,etal.Effectsofpatellartapingonkneejoint
proprioceptioninpatientswithpatellofemoralpainsyndrome.ManTher,2008.13(3):p.192-9.
108. HazneciB.,YildizY.,SekirU.,etal.Efficacyofisokineticexerciseonjointpositionsenseandmusclestrengthinpatellofemoralpainsyndrome.AmJPhysMedRehabil,2005.84(7):p.521-7.
109. NaseriN.andPourkazemiF.Differenceinkneejointpositionsenseinathleteswithandwithoutpatellofemoralpainsyndrome.KneeSurgSportsTraumatolArthrosc,2012.20(10):p.2071-76.
110. YosmaogluH.B.,KayaD.,GuneyH.,etal.Istherearelationshipbetweentrackingability,jointpositionsense,andfunctionallevelinpatellofemoralpainsyndrome?KneeSurgSportsTraumatolArthrosc,2013.21(11):p.2564-71.
111. AksekiD.,AkkayaG.,ErduranM.,etal.[Proprioceptionofthekneejointinpatellofemoral
painsyndrome].ActaOrthopTraumatolTurc,2008.42(5):p.316-21.112. KramerJ.,HandfieldT.,KieferG.,etal.Comparisonsofweight-bearingandnon-weight-
bearingtestsofkneeproprioceptionperformedbypatientswithpatello-femoralpain
syndromeandasymptomaticindividuals.ClinicalJournalofSportMedicine,1997.7(2):p.113-118.
252
References
113. SelfeJ.,CallaghanM.,McHenryA.,etal.Aninvestigationintotheeffectofnumberoftrials
duringproprioceptivetestinginpatientswithpatellofemoralpainsyndrome.JOrthopRes,2006.24(6):p.1218-24.
114. MokhtariniaH.R.E.-T.,Salavati,M,Goharpay,S.KhosraviA.Theeffectofpatellartapingonkneejointproprioceptioninpatientswithpatellofemoralpain.ActaMedicaIranica,2008.46(3):p.183-190.
115. CrossleyK.M.,StefanikJ.J.,SelfeJ.,etal.2016Patellofemoralpainconsensusstatementfrom
the4thInternationalPatellofemoralPainResearchRetreat,Manchester.Part1:
Terminology,definitions,clinicalexamination,naturalhistory,patellofemoralosteoarthritis
andpatient-reportedoutcomemeasures.BritishJournalofSportsMedicine,2016.116. SmithB.E.,RathleffM.S.,SelfeJ.,etal.Patellofemoralpain:isittimeforarethink?WithTide,
2015:p.13-18.117. Sanchis-AlfonsoV.Holisticapproachtounderstandinganteriorkneepain.Clinical
implications.KneeSurgSportsTraumatolArthrosc,2014.22(10):p.2275-85.118. DoménechJ.,Sanchis-AlfonsoV.EspejoB.Changesincatastrophizingandkinesiophobiaare
predictiveofchangesindisabilityandpainaftertreatmentinpatientswithanteriorknee
pain.KneeSurgery,SportsTraumatology,Arthroscopy,2014.22(10):p.2295-2300.119. JensenR.,HystadT.BaerheimA.Kneefunctionandpainrelatedtopsychologicalvariablesin
patientswithlong-termpatellofemoralpainsyndrome.JournalofOrthopaedic&SportsPhysicalTherapy,2005.35(9):p.594-600.
120. CheungR.T.,ZhangZ.NgaiS.P.Differentrelationshipsbetweenthelevelofpatellofemoral
painandqualityoflifeinprofessionalandamateurathletes.PM&R,2013.5(7):p.568-572.121. CarlssonA.,WernerS.,MattlarC.-E.,etal.Personalityinpatientswithlong-term
patellofemoralpainsyndrome.Kneesurgery,SportsTraumatology,Arthroscopy,1993.1(3-4):p.178-183.
122. PivaS.R.,FitzgeraldG.K.,IrrgangJ.J.,etal.Associatesofphysicalfunctionandpaininpatientswithpatellofemoralpainsyndrome.ArchivesofPhysicalMedicineandRehabilitation,2009.90(2):p.285-295.
123. WitońskiD.,KarlińskaI.MusiałA.Personalitycharacteristicsinpatientswiththeanteriorkneepainsyndrome.MedSciMonit,1998.4(6):p.1019-1023.
124. TrusheimM.R.,BerndtE.R.DouglasF.L.Stratifiedmedicine:strategicandeconomic
implicationsofcombiningdrugsandclinicalbiomarkers.NatureReviewsDrugDiscovery,2007.6(4):p.287-293.
125. RathleffM.S.,VicenzinoB.,MiddelkoopM.,etal.Patellofemoralpaininadolescenceand
adulthood:samesame,butdifferent?SportsMedicine,2015.45(11):p.1489-1495.126. CallaghanM.,SelfeJ.DeyP.Activity-associatedpaininpatellofemoralpainsyndrome:how
doesitinformresearchandpractice?Physiotherapy,2009.95(4):p.321-2.127. CookC.,HegedusE.,HawkinsR.,etal.Diagnosticaccuracyandassociationtodisabilityof
clinicaltestfindingsassociatedwithpatellofemoralpainsyndrome.PhysiotherCan,2010.62(1):p.17-24.
128. LivingstoneB.N.Clinicaltestsforchondromalaciapatellae.Lancet,1982.2(8291):p.210.129. NijsJ.,VanGeelC.,VanderauweraC.,etal.Diagnosticvalueoffiveclinicaltestsin
patellofemoralpainsyndrome.ManTher,2006.11(1):p.69-77.130. NunesG.S.,StapaitE.L.,KirstenM.H.,etal.Clinicaltestfordiagnosisofpatellofemoralpain
syndrome:Systematicreviewwithmeta-analysis.PhysTherSport,2013.14(1):p.54-9.131. FredericsonM.andYoonK.Physicalexaminationandpatellofemoralpainsyndrome.AmJ
PhysMedRehabil,2006.85(3):p.234-43.132. DobersteinS.T.,RomeynR.L.ReinekeD.M.ThediagnosticvalueoftheClarkesigninassessing
chondromalaciapatella.JournalofAthleticTraining,2008.43(2):p.190.
253
References
133. PihlajamäkiH.K.,KuikkaP.-I.,LeppänenV.-V.,etal.Reliabilityofclinicalfindingsandmagnetic
resonanceimagingforthediagnosisofchondromalaciapatellae.TheJournalofBone&JointSurgery,2010.92(4):p.927-934.
134. GuermaziA.,NiuJ.,HayashiD.,etal.PrevalenceofabnormalitiesinkneesdetectedbyMRIin
adultswithoutkneeosteoarthritis:populationbasedobservationalstudy(Framingham
OsteoarthritisStudy).2012.135. EsculierJ.-F.,RoyJ.-S.BouyerL.J.Psychometricevidenceofself-reportedquestionnairesfor
patellofemoralpainsyndrome:asystematicreview.DisabilityandRehabilitation,2013.35(26):p.2181-2190.
136. GreenA.,LilesC.,RushtonA.,etal.Measurementpropertiesofpatient-reportedoutcome
measures(PROMS)inPatellofemoralPainSyndrome:asystematicreview.ManualTherapy,2014.19(6):p.517-526.
137. SelfeJ.“Measurementpropertiesofpatient-reportedoutcomemeasures(PROMS)in
patellofemoralpainsyndrome:Asystematicreview”.Greenetal.(inpresscorrectedproof).ManualTherapy,2015.2(20):p.e6.
138. CicchettiD.V.Guidelines,criteria,andrulesofthumbforevaluatingnormedand
standardizedassessmentinstrumentsinpsychology.PsychologicalAssessment,1994.6(4):p.284.
139. CohenJ.Statisticalpoweranalysisforthebehavioralsciences.1969,NewYork,:AcademicPress.xv,415p.
140. CronbachL.J.Thetwodisciplinesofscientificpsychology.AmericanPsychologist,1957.12(11):p.671.
141. StreinerD.L.Startingatthebeginning:anintroductiontocoefficientalphaandinternalconsistency.JournalofPersonalityAssessment,2003.80(1):p.99-103.
142. BennellK.,BartamS.,CrossleyK.,etal.Outcomemeasuresinpatellofemoralpainsyndrome:
testretestreliabilityandinter-relationships.PhysicalTherapyinSport,2000.1(2):p.32-41.143. TeitgeR.A.andTorga-SpakR.Skeletalmalalignmentandanteriorkneepain:rationale,
diagnosis,andmanagement,inAnteriorkneepainandpatellarinstability.2011,Springer.p.209-221.
144. HughstonJ.C.Subluxationofthepatella.TheJournalofBone&JointSurgery,1968.50(5):p.1003-1026.
145. FicatP.,FicatC.BailleuxA.Syndromed'hyperpressionexternedelarotule(SHPE).RevChirOrthop,1975.61:p.39-59.
146. InsallJ.N.,AgliettiP.TriaJRA.J.PatellarPainandIncongruence.ClinicalOrthopaedicsandRelatedResearch,1983.176:p.225-232.
147. JohnsonL.L.,vanDykG.E.,GreenJ.,etal.Clinicalassessmentofasymptomaticknees:
comparisonofmenandwomen.Arthroscopy:TheJournalofArthroscopic&RelatedSurgery,1998.14(4):p.347-359.
148. DraperC.E.,BesierT.F.,SantosJ.M.,etal.Usingreal-timeMRItoquantifyalteredjoint
kinematicsinsubjectswithpatellofemoralpainandtoevaluatetheeffectsofapatellar
braceorsleeveonjointmotion.JOrthopRes,2009.27(5):p.571-7.149. StanfordW.,PhelanJ.,KatholM.H.,etal.Patellofemoraljointmotion:evaluationbyultrafast
computedtomography.SkeletalRadiology,1988.17(7):p.487-492.150. BrossmannJ.,MuhleC.,BüllC.,etal.Evaluationofpatellartrackinginpatientswith
suspectedpatellarmalalignment:cineMRimagingvsarthroscopy.AJR.AmericanJournalofRoentgenology,1994.162(2):p.361-367.
151. EliasD.A.andWhiteL.M.Imagingofpatellofemoraldisorders.ClinRadiol,2004.59(7):p.543-57.
254
References
152. DiederichsG.,IsseverA.S.SchefflerS.MRImagingofPatellarInstability:InjuryPatternsand
AssessmentofRiskFactors1.Radiographics,2010.30(4):p.961-981.153. StefanikJ.J.,ZumwaltA.C.,SegalN.A.,etal.Associationbetweenmeasuresofpatellaheight,
morphologicfeaturesofthetrochlea,andpatellofemoraljointalignment:theMOSTstudy.ClinOrthopRelatRes,2013.471(8):p.2641-8.
154. BesierT.F.,DraperC.E.,GoldG.E.,etal.Patellofemoraljointcontactareaincreaseswithknee
flexionandweight-bearing.JOrthopRes,2005.23(2):p.345-50.155. GoudakosI.G.,KonigC.,SchottleP.B.,etal.Regulationofthepatellofemoralcontactarea:an
essentialmechanisminpatellofemoraljointmechanics?JBiomech,2010.43(16):p.3237-9.156. ChewK.T.,LewH.L.,DateE.,etal.Currentevidenceandclinicalapplicationsoftherapeutic
kneebraces.AmericanJournalofPhysicalMedicine&Rehabilitation,2007.86(8):p.678-686.
157. PowersC.M.,HoK.-Y.,ChenY.-J.,etal.Patellofemoraljointstressduringweight-bearingand
non-weight-bearingquadricepsexercises.JOrthopSportsPhysTher,2014.44(5):p.320-327.158. SteinkampL.A.,DillinghamM.F.,MarkelM.D.,etal.Biomechanicalconsiderationsin
patellofemoraljointrehabilitation.TheAmericanJournalofSportsMedicine,1993.21(3):p.438-444.
159. BrechterJ.H.andPowersC.M.Patellofemoraljointstressduringstairascentanddescentin
personswithandwithoutpatellofemoralpain.GaitPosture,2002.16(2):p.115-23.160. SalsichG.B.andPermanW.H.Tibiofemoralandpatellofemoralmechanicsarealteredat
smallkneeflexionanglesinpeoplewithpatellofemoralpain.JSciMedSport,2013.16(1):p.13-7.
161. BesierT.F.,PalS.,DraperC.E.,etal.TheRoleofCartilageStressinPatellofemoralPain.MedSciSportsExerc,2015.
162. LiaoT.-C.,YangN.,HoK.-Y.,etal.FemurRotationIncreasesPatellaCartilageStressinFemales
withPatellofemoralPain.MedicineandScienceinSportsandExercise,2015.47(9):p.1775-1780.
163. HeinoBrechterJ.andPowersC.M.Patellofemoralstressduringwalkinginpersonswithand
withoutpatellofemoralpain.MedSciSportsExerc,2002.34(10):p.1582-93.164. PowersC.M.,WardS.R.,FredericsonM.,etal.Patellofemoralkinematicsduringweight-
bearingandnon-weight-bearingkneeextensioninpersonswithlateralsubluxationofthe
patella:apreliminarystudy.JOrthopSportsPhysTher,2003.33(11):p.677-85.165. SalsichG.B.andPermanW.H.Patellofemoraljointcontactareaisinfluencedbytibiofemoral
rotationalignmentinindividualswhohavepatellofemoralpain.JOrthopSportsPhysTher,2007.37(9):p.521-8.
166. ChiuJ.K.,WongY.-m.,YungP.S.,etal.Theeffectsofquadricepsstrengtheningonpain,function,andpatellofemoraljointcontactareainpersonswithpatellofemoralpain.AmericanJournalofPhysicalMedicine&Rehabilitation,2012.91(2):p.98-106.
167. PowersC.M.,WardS.R.,ChanL.-D.,etal.Theeffectofbracingonpatellaalignmentand
patellofemoraljointcontactarea.MedicineandScienceinSportsandExercises.,2004.36(7):p.1226-1232.
168. ConnollyK.D.,RonskyJ.L.,WestoverL.M.,etal.Differencesinpatellofemoralcontact
mechanicsassociatedwithpatellofemoralpainsyndrome.JBiomech,2009.42(16):p.2802-7.
169. DraperC.E.,BesierT.F.,GoldG.E.,etal.Iscartilagethicknessdifferentinyoungsubjectswithandwithoutpatellofemoralpain?OsteoarthritisCartilage,2006.14(9):p.931-7.
170. FarrokhiS.,CollettiP.M.PowersC.M.Differencesinpatellarcartilagethickness,transverserelaxationtime,anddeformationalbehavior:acomparisonofyoungwomenwithand
withoutpatellofemoralpain.AmJSportsMed,2011.39(2):p.384-91.
255
References
171. vanderHeijdenR.A.,OeiE.H.,BronE.E.,etal.Nodifferenceonquantitativemagnetic
resonanceimaginginpatellofemoralcartilagecompositionbetweenpatientswith
patellofemoralpainandhealthycontrols.TheAmericanJournalofSportsMedicine,2016:p.0363546516632507.
172. PrasadA.,NardoL.,SchoolerJ.,etal.T1ρandT2relaxationtimespredictprogressionofknee
osteoarthritis.OsteoarthritisandCartilage,2013.21(1):p.69-76.173. ThuillierD.U.,SouzaR.B.,WuS.,etal.T1rhoimagingdemonstratesearlychangesinthe
lateralpatellainpatientswithpatellofemoralpainandmaltracking.AmJSportsMed,2013.41(8):p.1813-8.
174. OeiE.H.,TielJ.,RobinsonW.H.,etal.QuantitativeRadiologicImagingTechniquesforArticular
CartilageComposition:TowardEarlyDiagnosisandDevelopmentofDisease-Modifying
TherapeuticsforOsteoarthritis.ArthritisCare&Research,2014.66(8):p.1129-1141.175. EricssonY.,TjörnstrandJ.,TideriusC.J.,etal.Relationshipbetweencartilage
glycosaminoglycancontent(assessedwithdGEMRIC)andOAriskfactorsinmeniscectomized
patients.OsteoarthritisandCartilage,2009.17(5):p.565-570.176. TideriusC.J.,OlssonL.E.,LeanderP.,etal.Delayedgadolinium-enhancedMRIofcartilage
(dGEMRIC)inearlykneeosteoarthritis.MagneticResonanceinMedicine,2003.49(3):p.488-492.
177. ShellockF.G.Patellofemoraljointabnormalitiesinathletes:evaluationbykinematic
magneticresonanceimaging.TopMagnResonImaging,1991.3(4):p.71-95.178. MacIntyreN.J.,HillN.A.,FellowsR.A.,etal.Patellofemoraljointkinematicsinindividualswith
andwithoutpatellofemoralpainsyndrome.JBoneJointSurgAm,2006.88(12):p.2596-605.179. SouzaR.B.,DraperC.E.,FredericsonM.,etal.Femurrotationandpatellofemoraljoint
kinematics:aweight-bearingmagneticresonanceimaginganalysis.JOrthopSportsPhysTher,2010.40(5):p.277-85.
180. SheehanF.T.,DerasariA.,BrindleT.J.,etal.Understandingpatellofemoralpainwith
maltrackinginthepresenceofjointlaxity:complete3Dinvivopatellofemoraland
tibiofemoralkinematics.JOrthopRes,2009.27(5):p.561-70.181. SheehanF.T.,DerasariA.,FineK.M.,etal.Q-angleandJ-sign:indicativeofmaltracking
subgroupsinpatellofemoralpain.ClinOrthopRelatRes,2010.468(1):p.266-75.182. BorotikarB.S.,SipprellW.H.,3rd,WibleE.E.,etal.Amethodologytoaccuratelyquantify
patellofemoralcartilagecontactkinematicsbycombining3Dimageshaperegistrationand
cine-PCMRIvelocitydata.JournalofBiomechanics,2012.45(6):p.1117-22.183. BehnamA.J.,HerzkaD.A.SheehanF.T.Assessingtheaccuracyandprecisionof
musculoskeletalmotiontrackingusingcine-PCMRIona3.0Tplatform.JournalofBiomechanics2011.44(1):p.193-7.
184. ShapiroL.,HarishM.,HargreavesB.,etal.AdvancesinmusculoskeletalMRI:technical
considerations.JMagnResonImaging,2012.36(4):p.775-87.185. ShapiroL.M.andGoldG.E.MRIofweightbearingandmovement.OsteoarthritisCartilage,
2012.20(2):p.69-78.186. IrelandM.L.,WillsonJ.D.,BallantyneB.T.,etal.Hipstrengthinfemaleswithandwithout
patellofemoralpain.JournalofOrthopaedicandSportsPhysicalTherapy,2003.33(11):p.671-676.
187. PrinsM.R.andVanDerWurffP.Femaleswithpatellofemoralpainsyndromehaveweakhip
muscles:asystematicreview.AustralianJournalofPhysiotherapy,2009.55(1):p.9-15.188. BolglaL.A.,MaloneT.R.,UmbergerB.R.,etal.Hipstrengthandhipandkneekinematics
duringstairdescentinfemaleswithandwithoutpatellofemoralpainsyndrome.JournalofOrthopaedic&SportsPhysicalTherapy,2008.38(1):p.12-18.
256
References
189. CichanowskiH.R.,SchmittJ.S.,JohnsonR.J.,etal.Hipstrengthincollegiatefemaleathletes
withpatellofemoralpain.Medicineandscienceinsportsandexercise,2007.39(8):p.1227.190. RoachS.,SorensonE.,HeadleyB.,etal.Prevalenceofmyofascialtriggerpointsinthehipin
patellofemoralpain.ArchivesofPhysicalMedicineandRehabilitation,2013.94(3):p.522-526.
191. RobinsonR.L.andNeeR.J.Analysisofhipstrengthinfemalesseekingphysicaltherapy
treatmentforunilateralpatellofemoralpainsyndrome.JournalofOrthopaedic&SportsPhysicalTherapy,2007.37(5):p.232-238.
192. BolingM.C.,PaduaD.A.AlexanderCreightonR.Concentricandeccentrictorqueofthehipmusculatureinindividualswithandwithoutpatellofemoralpain.JournalofAthleticTraining,2009.44(1):p.7-13.
193. deMarcheBaldonR.,NakagawaT.H.MunizT.B.Eccentrichipmusclefunctioninfemaleswith
andwithoutpatellofemoralpainsyndrome.JournalofAthleticTraining,2009.44(5):p.490.194. LankhorstN.E.,Bierma-ZeinstraS.M.vanMiddelkoopM.Factorsassociatedwith
patellofemoralpainsyndrome:asystematicreview.BrJSportsMed,2013.47(4):p.193-206.195. CowanS.M.,CrossleyK.M.BennellK.L.Alteredhipandtrunkmusclefunctioninindividuals
withpatellofemoralpain.BritishJournalofSportsMedicine,2009.43(8):p.584-588.196. Bazett-JonesD.M.,CobbS.C.,HuddlestonW.E.,etal.Effectofpatellofemoralpainonstrength
andmechanicsafteranexhaustiverun.Medicine&ScienceinSports&Exercise2013.45(7):p.1331-1339.
197. DierksT.A.,ManalK.T.,HamillJ.,etal.Proximalanddistalinfluencesonhipandknee
kinematicsinrunnerswithpatellofemoralpainduringaprolongedrun.JournalofOrthopaedic&SportsPhysicalTherapy,2008.38(8):p.448-456.
198. LackS.,BartonC.,SohanO.,etal.Proximalmusclerehabilitationiseffectivefor
patellofemoralpain:asystematicreviewwithmeta-analysis.BritishJournalofSportsMedicine,2015:p.bjsports-2015-094723.
199. VanCantJ.,PineuxC.,PitanceL.,etal.HIPMUSCLESTRENGTHANDENDURANCEINFEMALES
WITHPATELLOFEMORALPAIN:ASYSTEMATICREVIEWWITHMETA-ANALYSIS.InternationalJournalofSportsPhysicalTherapy,2014.9(5):p.564.
200. SouzaR.B.andPowersC.M.Differencesinhipkinematics,musclestrength,andmuscle
activationbetweensubjectswithandwithoutpatellofemoralpain.JOrthopSportsPhysTher,2009.39(1):p.12-9.
201. McMorelandA.,O'SullivanK.,SainsburyD.,etal.Nodeficitinhipisometricstrengthor
concentricenduranceinyoungfemaleswithmildpatellofemoralpain.IsokineticsandExerciseScience,2011.19(2):p.117-125.
202. MagalhãEsE.,FukudaT.Y.,SacramentoS.N.,etal.Acomparisonofhipstrengthbetween
sedentaryfemaleswithandwithoutpatellofemoralpainsyndrome.JournalofOrthopaedic&SportsPhysicalTherapy,2010.40(10):p.641-647.
203. SchwaneB.G.,GoergerB.M.,GotoS.,etal.Trunkandlowerextremitykinematicsduringstair
descentinwomenwithorwithoutpatellofemoralpain.JournalofAthleticTraining,2015.50(7):p.704-712.
204. NoehrenB.,ScholzJ.DavisI.Theeffectofreal-timegaitretrainingonhipkinematics,painand
functioninsubjectswithpatellofemoralpainsyndrome.BritishJournalofSportsMedicine,2010:p.bjsports69112.
205. WillyR.W.andDavisI.S.Variedresponsetomirrorgaitretrainingofgluteusmediuscontrol,
hipkinematics,pain,andfunctionin2femalerunnerswithpatellofemoralpain.JournalofOrthopaedic&SportsPhysicalTherapy,2013.43(12):p.864-874.
206. GrenholmA.,StensdotterA.-K.Häger-RossC.Kinematicanalysesduringstairdescentin
youngwomenwithpatellofemoralpain.ClinicalBiomechanics,2009.24(1):p.88-94.
257
References
207. McKenzieK.,GaleaV.,WesselJ.,etal.Lowerextremitykinematicsoffemaleswith
patellofemoralpainsyndromewhilestairstepping.JournalofOrthopaedic&SportsPhysicalTherapy,2010.40(10):p.625-632.
208. CostiganP.A.,DeluzioK.J.WyssU.P.Kneeandhipkineticsduringnormalstairclimbing.Gait&Posture,2002.16(1):p.31-37.
209. AminakaN.,PietrosimoneB.G.,ArmstrongC.W.,etal.Patellofemoralpainsyndromealters
neuromuscularcontrolandkineticsduringstairambulation.JournalofElectromyographyandKinesiology,2011.21(4):p.645-651.
210. BrindleT.J.,MattacolaC.McCroryJ.Electromyographicchangesinthegluteusmediusduring
stairascentanddescentinsubjectswithanteriorkneepain.KneeSurgery,SportsTraumatology,Arthroscopy,2003.11(4):p.244-251.
211. WillsonJ.D.,KernozekT.W.,ArndtR.L.,etal.Glutealmuscleactivationduringrunningin
femaleswithandwithoutpatellofemoralpainsyndrome.ClinicalBiomechanics,2011.26(7):p.735-740.
212. WillsonJ.D.andDavisI.S.Lowerextremitymechanicsoffemaleswithandwithout
patellofemoralpainacrossactivitieswithprogressivelygreatertaskdemands.ClinicalBiomechanics,2008.23(2):p.203-211.
213. BartonC.J.,LackS.,MalliarasP.,etal.Glutealmuscleactivityandpatellofemoralpain
syndrome:asystematicreview.BrJSportsMed,2013.47(4):p.207-14.214. GilesL.S.,WebsterK.E.,McClellandJ.A.,etal.AtrophyoftheQuadricepsIsNotIsolatedtothe
VastusMedialisObliqueinIndividualsWithPatellofemoralPain.JournalofOrthopaedic&SportsPhysicalTherapy,2015.45(8):p.613-619.
215. McConnellJ.TheManagementofChondromalaciaPatellae:ALongTermSolution.1986.216. BotanliogluH.,KantarciF.,KaynakG.,etal.Shearwaveelastographypropertiesofvastus
lateralisandvastusmedialisobliquusmusclesinnormalsubjectsandfemalepatientswith
patellofemoralpainsyndrome.SkeletalRadiol,2013.42(5):p.659-66.217. ChristouE.A.Patellartapingincreasesvastusmedialisobliqueactivityinthepresenceof
patellofemoralpain.JournalofElectromyographyandKinesiology,2004.14(4):p.495-504.218. CowanS.M.,BennellK.L.HodgesP.W.Therapeuticpatellartapingchangesthetimingofvasti
muscleactivationinpeoplewithpatellofemoralpainsyndrome.ClinicalJournalofSportMedicine,2002.12(6):p.339-347.
219. CowanS.M.,BennellK.L.,HodgesP.W.,etal.Delayedonsetofelectromyographicactivityof
vastusmedialisobliquusrelativetovastuslateralisinsubjectswithpatellofemoralpain
syndrome.ArchivesofPhysicalMedicineandRehabilitation,2001.82(2):p.183-189.220. KimH.andSongC.H.ComparisonoftheVMO/VLEMGratioandonsettimingofVMO
relativetoVLinsubjectswithandwithoutpatellofemoralpainsyndrome.JournalofPhysicalTherapyScience,2012.24(12):p.1315-1317.
221. SouzaD.R.andGrossM.T.Comparisonofvastusmedialisobliquus:vastuslateralismuscle
integratedelectromyographicratiosbetweenhealthysubjectsandpatientswith
patellofemoralpain.PhysicalTherapy,1991.71(4):p.310-316.222. CallaghanM.J.,McCarthyC.J.OldhamJ.A.Electromyographicfatiguecharacteristicsofthe
quadricepsinpatellofemoralpainsyndrome.ManTher,2001.6(1):p.27-33.223. CavazzutiL.,MerloA.,OrlandiF.,etal.Delayedonsetofelectromyographicactivityofvastus
medialisobliquusrelativetovastuslateralisinsubjectswithpatellofemoralpainsyndrome.GaitandPosture,2010.32(3):p.290-295.
224. KarstG.M.andWillettG.M.Onsettimingofelectromyographicactivityinthevastusmedialis
obliqueandvastuslateralismusclesinsubjectswithandwithoutpatellofemoralpain
syndrome.PhysicalTherapy,1995.75(9):p.813-823.
258
References
225. LapradeJ.,CulhamE.BrouwerB.Comparisonoffiveisometricexercisesintherecruitmentof
thevastusmedialisobliqueinpersonswithandwithoutpatellofemoralpainsyndrome.JournalofOrthopaedic&SportsPhysicalTherapy,1998.27(3):p.197-204.
226. McClintonS.,DonatellG.,WeirJ.,etal.Influenceofstepheightonquadricepsonsettiming
andactivationduringstairascentinindividualswithpatellofemoralpainsyndrome.JournalofOrthopaedic&SportsPhysicalTherapy,2007.37(5):p.239-244.
227. StensdotterA.-K.,HodgesP.,ÖhbergF.,etal.QuadricepsEMGinopenandclosedkinetic
chaintasksinwomenwithpatellofemoralpain.JournalofMotorBehavior,2007.39(3):p.194-202.
228. JanM.H.,LinD.H.,LinJ.J.,etal.Differencesinsonographiccharacteristicsofthevastusmedialisobliquusbetweenpatientswithpatellofemoralpainsyndromeandhealthyadults.AmJSportsMed,2009.37(9):p.1743-9.
229. NeptuneR.,WrightI.vandenBogertA.J.Theinfluenceoforthoticdevicesandvastusmedialis
strengthandtimingonpatellofemoralloadsduringrunning.ClinicalBiomechanics,2000.15(8):p.611-618.
230. PalS.,DraperC.E.,FredericsonM.,etal.Patellarmaltrackingcorrelateswithvastusmedialis
activationdelayinpatellofemoralpainpatients.AmJSportsMed,2011.39(3):p.590-8.231. ChesterR.,SmithT.O.,SweetingD.,etal.TherelativetimingofVMOandVLintheaetiology
ofanteriorkneepain:asystematicreviewandmeta-analysis.BMCMusculoskeletDisord,2008.9:p.64.
232. WongY.M.Recordingthevastiimuscleonsettimingasadiagnosticparameterfor
patellofemoralpainsyndrome:factorfad?PhysTherSport,2009.10(2):p.71-4.233. DillonP.Z.,UpdykeW.F.AllenW.C.Gaitanalysiswithreferencetochondromalaciapatellae.
JournalofOrthopaedic&SportsPhysicalTherapy,1983.5(3):p.127-131.234. NadeauS.,GravelD.,HébertL.J.,etal.Gaitstudyofpatientswithpatellofemoralpain
syndrome.Gait&Posture,1997.5(1):p.21-27.235. PowersC.M.,HeinoJ.G.,RaoS.,etal.Theinfluenceofpatellofemoralpainonlowerlimb
loadingduringgait.ClinBiomech(Bristol,Avon),1999.14(10):p.722-8.236. CrossleyK.M.,CowanS.M.,BennellK.L.,etal.Kneeflexionduringstairambulationisaltered
inindividualswithpatellofemoralpain.JournalofOrthopaedicResearch,2004.22(2):p.267-274.
237. GreenwaldA.E.,BagleyA.M.,FranceE.P.,etal.Abiomechanicalandclinicalevaluationofa
patellofemoralkneebrace.ClinicalOrthopaedicsandRelatedResearch,1996.324:p.187-195.
238. PowersC.M.,LandelR.,SosnickT.,etal.Theeffectsofpatellartapingonstridecharacteristicsandjointmotioninsubjectswithpatellofemoralpain.JOrthopSportsPhysTher,1997.26(6):p.286-91.
239. MaulderP.,HumeP.BradshawE.Jointcouplingvariabilitycanlikelyindicatelowerextremity
injuryoccurrence.2008.240. HamillJ.,vanEmmerikR.E.,HeiderscheitB.C.,etal.Adynamicalsystemsapproachtolower
extremityrunninginjuries.ClinicalBiomechanics,1999.14(5):p.297-308.241. CunninghamT.J.,MullineauxD.R.,NoehrenB.,etal.Couplinganglevariabilityinhealthyand
patellofemoralpainrunners.ClinicalBiomechanics,2014.29(3):p.317-322.242. HeiderscheitB.C.VariabilityofStrideCharacteristicsandjointCoordinationAmong
Individuals.JournalofAppliedBiomechanics,2002.18:p.110-121.243. DierksT.A.,ManalK.T.,HamillJ.,etal.Lowerextremitykinematicsinrunnerswith
patellofemoralpainduringaprolongedrun.MedicineandScienceinSportsandExercise,2011.43(4):p.693-700.
259
References
244. PatilS.,WhiteL.,JonesA.,etal.IdiopathicanteriorkneepainintheyoungAprospectivecontrolledtrial.ActaOrthopædicaBelgica,2010.76(3):p.356.
245. PeelerJ.andAndersonJ.E.Effectivenessofstaticquadricepsstretchinginindividualswithpatellofemoraljointpain.ClinicalJournalofSportMedicine,2007.17(4):p.234-241.
246. PivaS.R.,GoodniteE.A.ChildsJ.D.Strengtharoundthehipandflexibilityofsofttissuesinindividualswithandwithoutpatellofemoralpainsyndrome.JournalofOrthopaedic&SportsPhysicalTherapy,2005.35(12):p.793-801.
247. WhiteL.C.,DolphinP.DixonJ.Hamstringlengthinpatellofemoralpainsyndrome.Physiotherapy,2009.95(1):p.24-28.
248. PivaS.R.,FitzgeraldK.,IrrgangJ.J.,etal.Reliabilityofmeasuresofimpairmentsassociated
withpatellofemoralpainsyndrome.BMCMusculoskeletalDisorders,2006.7(1):p.1.249. ChambersH.G.Thestraightlegraisetestforhamstringcontractures:whatisthe
contributionofsciaticnerveirritation?DevelopmentalMedicine&ChildNeurology,2016.58(2):p.116-117.
250. Al-RawiZ.andNessanA.Jointhypermobilityinpatientswithchondromalaciapatellae.Rheumatology,1997.36(12):p.1324-1327.
251. OtaS.,NakashimaT.,MorisakaA.,etal.Comparisonofpatellarmobilityinfemaleadultswith
andwithoutpatellofemoralpain.JournalofOrthopaedic&SportsPhysicalTherapy,2008.38(7):p.396-402.
252. SkalleyT.C.,TerryG.C.TeitgeR.A.Thequantitativemeasurementofnormalpassivemedial
andlateralpatellarmotionlimits.TheAmericanJournalofSportsMedicine,1993.21(5):p.728-732.
253. PunielloM.S.Iliotibialbandtightnessandmedialpatellarglideinpatientswith
patellofemoraldysfunction.JournalofOrthopaedic&SportsPhysicalTherapy,1993.17(3):p.144-148.
254. SelfeJ.,JanssenJ.,CallaghanM.,etal.Aretherethreemainsubgroupswithinthe
patellofemoralpainpopulation?Adetailedcharacterisationstudyof127patientstohelp
developtargetedintervention(TIPPs).BritishJournalofSportsMedicine,2016:p.bjsports-2015-094792.
255. LevingerP.andGilleardW.Theheelstriketransientduringwalkinginsubjectswithpatellofemoralpainsyndrome.PhysicalTherapyinSport,2005.6(2):p.83-88.
256. ChenY.J.andPowersC.M.Comparisonofthree-dimensionalpatellofemoraljointreaction
forcesinpersonswithandwithoutpatellofemoralpain.JApplBiomech,2014.30(4):p.493-500.
257. AlibertiS.,CostaM.d.S.,PassaroA.d.C.,etal.Influenceofpatellofemoralpainsyndromeon
plantarpressureinthefootrolloverprocessduringgait.Clinics,2011.66(3):p.367-372.258. BartonC.J.,BonannoD.,LevingerP.,etal.Footandanklecharacteristicsinpatellofemoral
painsyndrome:acasecontrolandreliabilitystudy.JOrthopSportsPhysTher,2010.40(5):p.286-96.
259. McPoilT.G.,WarrenM.,VicenzinoB.,etal.Variationsinfootpostureandmobilitybetween
individualswithpatellofemoralpainandthoseinacontrolgroup.JournaloftheAmericanPodiatricMedicalAssociation,2011.101(4):p.289-296.
260. RedmondA.C.,CraneY.Z.MenzH.B.Normativevaluesforthefootpostureindex.JournalofFootandAnkleResearch,2008.1(1):p.1.
261. RodriguesP.,ChangR.,TenBroekT.,etal.Mediallypostedinsolesconsistentlyinfluencefoot
pronationinrunnerswithandwithoutanteriorkneepain.Gait&Posture,2013.37(4):p.526-31.
262. RodriguesP.,TenBroekT.HamillJ.Runnerswithanteriorkneepainuseagreaterpercentageoftheiravailablepronationrangeofmotion.JApplBiomech,2013.29(141):p.e6.
260
References
263. RodriguesP.,TenBroekT.,VanEmmerikR.,etal.Evaluatingrunnerswithandwithoutanteriorkneepainusingthetimetocontacttheanklejointcomplexes’rangeofmotion
boundary.Gait&Posture,2014.39(1):p.48-53.264. LeeS.-P.,SouzaR.B.PowersC.M.Theinfluenceofhipabductormuscleperformanceon
dynamicposturalstabilityinfemaleswithpatellofemoralpain.Gait&Posture,2012.36(3):p.425-429.
265. KhayambashiK.,MohammadkhaniZ.,GhaznaviK.,etal.Theeffectsofisolatedhipabductorandexternalrotatormusclestrengtheningonpain,healthstatus,andhipstrengthinfemales
withpatellofemoralpain:arandomizedcontrolledtrial.JOrthopSportsPhysTher,2012.42(1):p.22-9.
266. EarlJ.E.andHochA.Z.Aproximalstrengtheningprogramimprovespain,function,and
biomechanicsinwomenwithpatellofemoralpainsyndrome.TheAmericanJournalofSportsMedicine,2011.39(1):p.154-163.
267. DolakK.L.,SilkmanC.,McKeonJ.M.,etal.Hipstrengtheningpriortofunctionalexercisesreducespainsoonerthanquadricepsstrengtheninginfemaleswithpatellofemoralpain
syndrome:arandomizedclinicaltrial.JournalofOrthopaedicandSportsPhysicalTherapy,2011.41(8):p.560-570.
268. FerberR.,BolglaL.,Earl-BoehmJ.E.,etal.Strengtheningofthehipandcoreversuskneemusclesforthetreatmentofpatellofemoralpain:amulticenterrandomizedcontrolledtrial.JournalofAthleticTraining,2015.50(4):p.366-377.
269. KhayambashiK.,FallahA.,MovahediA.,etal.Posterolateralhipmusclestrengtheningversus
quadricepsstrengtheningforpatellofemoralpain:acomparativecontroltrial.ArchPhysMedRehabil,2014.95(5):p.900-7.
270. Hamstra-WrightK.,AydemirB.,Earl-BoehmJ.,etal.Patient-ReportedOutcomesRemain
Improved6-MonthsPostPatellofemoralPainRehabilitation.JournalofSportRehabilitation,2016.
271. FukudaT.Y.,MeloW.P.,ZaffalonB.M.,etal.Hipposterolateralmusculaturestrengtheningin
sedentarywomenwithpatellofemoralpainsyndrome:arandomizedcontrolledclinicaltrial
with1-yearfollow-up.JournalofOrthopaedic&SportsPhysicalTherapy,2012.42(10):p.823-830.
272. IsmailM.,GamaleldeinM.HassaK.Closedkineticchainexerciseswithorwithoutadditionalhipstrengtheningexercisesinmanagementofpatellofemoralpainsyndrome:arandomized
controlledtrial.EuropeanJournalofPhysicalandRehabilitationMedicine,2013.49(5):p.687-698.
273. NakagawaT.H.,MunizT.B.,deMarcheBaldonR.,etal.Theeffectofadditionalstrengtheningofhipabductorandlateralrotatormusclesinpatellofemoralpainsyndrome:arandomized
controlledpilotstudy.Clinicalrehabilitation,2008.22(12):p.1051-1060.274. DoreyC.andWilliamsJ.M.Strengtheningthehipmusclesinindividualswithpatellofemoral
pain:whatcanbelearnedfromtheliterature?PhysicalTherapyReviews,2015.20(2):p.63-72.
275. BaldonR.D.M.,SerrãoF.V.,ScattoneSilvaR.,etal.Effectsoffunctionalstabilizationtrainingonpain,function,andlowerextremitybiomechanicsinwomenwithpatellofemoralpain:a
randomizedclinicaltrial.JournalofOrthopaedicandSportsPhysicalTherapy,2014.44(4):p.240-A8.
276. NealB.S.,BartonC.J.,GallieR.,etal.Runnerswithpatellofemoralpainhavealtered
biomechanicswhichtargetedinterventionscanmodify:Asystematicreviewandmeta-
analysis.Gait&Posture,2016.45:p.69-82.277. GraciV.andSalsichG.B.Trunkandlowerextremitysegmentkinematicsandtheir
relationshiptopainfollowingmovementinstructionduringasingle-legsquatinfemaleswith
261
References
dynamickneevalgusandpatellofemoralpain.JournalofScienceandMedicineinSport,2015.18(3):p.343-347.
278. NoehrenB.,PohlM.B.,SanchezZ.,etal.Proximalanddistalkinematicsinfemalerunnerswith
patellofemoralpain.ClinicalBiomechanics,2012.27(4):p.366-371.279. MascalC.L.,LandelR.PowersC.Managementofpatellofemoralpaintargetinghip,pelvis,and
trunkmusclefunction:2casereports.JOrthopSportsPhysTher,2003.33(11):p.647-60.280. FerberR.,KendallK.D.FarrL.Changesinkneebiomechanicsafterahip-abductor
strengtheningprotocolforrunnerswithpatellofemoralpainsyndrome.JournalofAthleticTraining,2011.46(2):p.142-149.
281. PowersC.FunctionalRehabilitationforPatellofemoralJointDysfunction:aproximal
approach[Lecture],inPFPClinicalSymposium.2015:UniversityofCentralLancashire282. KooikerL.,VanDePortI.G.,WeirA.,etal.EffectsofPhysicalTherapist–GuidedQuadriceps-
StrengtheningExercisesfortheTreatmentofPatellofemoralPainSyndrome:ASystematic
Review.JournalofOrthopaedic&SportsPhysicalTherapy,2014.44(6):p.391-B1.283. HerringtonL.andAl-SherhiA.Acontrolledtrialofweight-bearingversusnon—weight-
bearingexercisesforpatellofemoralpain.JournalofOrthopaedic&SportsPhysicalTherapy,2007.37(12):p.155-160.
284. WitvrouwE.,LysensR.,BellemansJ.,etal.Openversusclosedkineticchainexercisesforpatellofemoralpainaprospective,randomizedstudy.TheAmericanJournalofSportsMedicine,2000.28(5):p.687-694.
285. FehrG.L.,CliquetJuniorA.,CachoÊ.W.A.,etal.Effectivenessoftheopenandclosedkineticchainexercisesinthetreatmentofthepatellofemoralpainsyndrome.RevistaBrasileiradeMedicinadoEsporte,2006.12(2):p.66-70.
286. StieneH.A.,BroskyT.,ReinkingM.F.,etal.Acomparisonofclosedkineticchainandisokinetic
jointisolationexerciseinpatientswithpatellofemoraldysfunction.JournalofOrthopaedic&SportsPhysicalTherapy,1996.24(3):p.136-141.
287. BennellK.,DuncanM.,CowanS.,etal.Effectsofvastusmedialisobliqueretrainingversus
generalquadricepsstrengtheningonvastionset.Medicine&ScienceinSports&Exercise,2010.42(5):p.856-864.
288. SymeG.,RoweP.,MartinD.,etal.Disabilityinpatientswithchronicpatellofemoralpain
syndrome:arandomisedcontrolledtrialofVMOselectivetrainingversusgeneralquadriceps
strengthening.ManTher,2009.14(3):p.252-63.289. ToumiH.,BestT.,PintiA.,etal.Theroleofmusclestrength&activationpatternsin
patellofemoralpain.ClinicalBiomechanics,2013.28(5):p.544-548.290. NgG.,ZhangA.LiC.BiofeedbackexerciseimprovedtheEMGactivityratioofthemedialand
lateralvastimusclesinsubjectswithpatellofemoralpainsyndrome.JournalofElectromyographyandKinesiology,2008.18(1):p.128-133.
291. WitvrouwE.,CambierD.,DanneelsL.,etal.Theeffectofexerciseregimensonreflexresponse
timeofthevastimusclesinpatientswithanteriorkneepain:aprospectiverandomized
interventionstudy.ScandinavianJournalofMedicine&ScienceinSports,2003.13(4):p.251-258.
292. LevittR.,DeisingerJ.A.,WallJ.R.,etal.EMGfeedback-assistedpostoperativerehabilitationof
minorarthroscopickneesurgeries.JournalofSportsMedicineandPhysicalFitness,1995.35(3):p.218-223.
293. PengH.-T.andSongC.-Y.Effectoflegpresstrainingonpatellarrealignmentinpatientswith
patellofemoralpain.JournalofPhysicalTherapyScience,2015.27(12):p.3873.294. PattynE.,MahieuN.,SelfeJ.,etal.Whatpredictsfunctionaloutcomeaftertreatmentfor
patellofemoralpain?MedSciSportsExerc,2012.44(10):p.1827-33.
262
References
295. PivaS.R.,FitzgeraldG.K.,WisniewskiS.,etal.Predictorsofpainandfunctionoutcomeafter
rehabilitationinpatientswithpatellofemoralpainsyndrome.JournalofRehabilitationMedicine,2009.41(8):p.604-612.
296. WittsteinJ.R.,O’BrienS.D.,VinsonE.N.,etal.MRIevaluationofanteriorkneepain:predicting
responsetononoperativetreatment.SkeletalRadiology,2009.38(9):p.895-901.297. LackS.,BartonC.,VicenzinoB.,etal.Outcomepredictorsforconservativepatellofemoralpain
management:asystematicreviewandmeta-analysis.SportsMed,2014.44(12):p.1703-16.298. LankhorstN.,vanMiddelkoopM.,CrossleyK.,etal.Factorsthatpredictapooroutcome5–8
yearsafterthediagnosisofpatellofemoralpain:amulticentreobservationalanalysis.BritishJournalofSportsMedicine,2015:p.bjsports-2015-094664.
299. KannusP.,AhoH.,JärvinenM.,etal.Computerizedrecordingofvisitstoanoutpatientsports
clinic.AmericanJournalofSportsMedicine,1987.15(1):p.79-85.300. WitvrouwE.,LysensR.,BellemansJ.,etal.Whichfactorspredictoutcomeinthetreatment
programofanteriorkneepain?ScandinavianJournalofMedicineandScienceinSports,2002.12(1):p.40-46.
301. NatriA.,KannusP.JärvinenM.Whichfactorspredictthelong-termoutcomeinchronic
patellofemoralpainsyndrome?A7-yrprospectivefollow-upstudy.Medicine&ScienceinSports&Exercise,1998.
302. AminakaN.andGribbleP.A.Asystematicreviewoftheeffectsoftherapeutictapingon
patellofemoralpainsyndrome.JournalofAthletictraining,2005.40(4):p.341.303. BartonC.,BalachandarV.,LackS.,etal.Patellartapingforpatellofemoralpain:asystematic
reviewandmeta-analysistoevaluateclinicaloutcomesandbiomechanicalmechanisms.BrJSportsMed,2014.48(6):p.417-24.
304. WardenS.J.,HinmanR.S.,WatsonM.A.,etal.Patellartapingandbracingforthetreatmentof
chronickneepain:Asystematicreviewandmeta-analysis.ArthritisCare&Research,2008.59(1):p.73-83.
305. OveringtonM.,GoddardD.HingW.Acriticalappraisalandliteraturecritiqueontheeffectofpatellartaping–ispatellartapingeffectiveinthetreatmentofpatellofemoralpain
syndrome?NZJournalofPhysiotherapy,2006.34(2):p.66.306. MostamandJ.,BaderD.L.HudsonZ.TheeffectofpatellartapingonEMGactivityofvasti
musclesduringsquattinginindividualswithpatellofemoralpainsyndrome.JSportsSci,2011.29(2):p.197-205.
307. NgG.Y.andChengJ.M.Theeffectsofpatellartapingonpainandneuromuscular
performanceinsubjectswithpatellofemoralpainsyndrome.ClinRehabil,2002.16(8):p.821-7.
308. NgG.Y.andWongP.Y.Patellartapingaffectsvastusmedialisobliquusactivationinsubjects
withpatellofemoralpainbeforeandafterquadricepsmusclefatigue.ClinicalRehabilitation,2009.23(8):p.705-713.
309. GiganteA.,PasquinelliF.M.,PaladiniP.,etal.Theeffectsofpatellartapingonpatellofemoral
incongruence.Acomputedtomographystudy.AmJSportsMed,2001.29(1):p.88-92.310. DerasariA.,BrindleT.J.,AlterK.E.,etal.McConnelltapingshiftsthepatellainferiorlyin
patientswithpatellofemoralpain:adynamicmagneticresonanceimagingstudy.PhysicalTherapy,2010.90(3):p.411-419.
311. HerringtonL.TheeffectofcorrectivetapingofthepatellaonpatellapositionasdefinedbyMRI.ResearchinSportsMedicine,2006.14(3):p.215-223.
312. LarsenB.,AndreasenE.,UrferA.,etal.Patellartaping:aradiographicexaminationofthe
medialglidetechnique.TheAmericanJournalofSportsMedicine,1995.23(4):p.465-471.313. PfeifferR.P.,DeBelisoM.,SheaK.G.,etal.KinematicMRIassessmentofMcConnelltaping
beforeandafterexercise.TheAmericanJournalofSportsMedicine,2004.32(3):p.621-628.
263
References
314. WorrellT.,IngersollC.D.,Bockrath-PuglieseK.,etal.EffectofpatellartapingandbracingonpatellarpositionasdeterminedbyMRIinpatientswithpatellofemoralpain.JAthlTrain,1998.33(1):p.16-20.
315. BockrathK.,WoodenC.,WorrellT.,etal.Effectsofpatellatapingonpatellapositionandperceivedpain.Medicine&ScienceinSports&Exercise,1993.25(9):p.989-992.
316. ErnstG.P.,KawaguchiJ.SalibaE.Effectofpatellartapingonkneekineticsofpatientswithpatellofemoralpainsyndrome.JOrthopSportsPhysTher,1999.29(11):p.661-7.
317. SalsichG.B.,BrechterJ.H.,FarwellD.,etal.Theeffectsofpatellartapingonkneekinetics,kinematics,andvastuslateralismuscleactivityduringstairambulationinindividualswith
patellofemoralpain.JOrthopSportsPhysTher,2002.32(1):p.3-10.318. LanT.-Y.,LinW.-P.,JiangC.-C.,etal.ImmediateEffectandPredictorsofEffectivenessof
TapingforPatellofemoralPainSyndromeAProspectiveCohortStudy.TheAmericanJournalofSportsMedicine,2010.38(8):p.1626-1630.
319. LesherJ.D.,SutliveT.G.,MillerG.A.,etal.Developmentofaclinicalpredictionrulefor
classifyingpatientswithpatellofemoralpainsyndromewhorespondtopatellartaping.JournalofOrthopaedic&SportsPhysicalTherapy,2006.36(11):p.854-866.
320. IversonC.A.,SutliveT.G.,CrowellM.S.,etal.Lumbopelvicmanipulationforthetreatmentof
patientswithpatellofemoralpainsyndrome:developmentofaclinicalpredictionrule.JournalofOrthopaedic&SportsPhysicalTherapy,2008.38(6):p.297-312.
321. SennS.Isthe‘simplecarry-over’modeluseful?Statisticsinmedicine,1992.11(6):p.715-726.322. DixitS.,DifioriJ.P.,BurtonM.,etal.Managementofpatellofemoralpainsyndrome.AmFam
Physician,2007.75(2):p.194-202.323. EvcikD.,KuruI.,AyS.,etal.Home-basedexerciseandpatellarbraciginthetreatmentof
patellofemoralpainsyndrome/Patellofemoralagrisendromutedavisindeevegzersiz
programivepatellarbreyskullanimi.TurkishJournalofPhysicalMedicineandRehabilitation,2010.56(3):p.100-105.
324. FinestoneA.,RadinE.,LevB.,etal.Treatmentofoverusepatellofemoralpain.Prospective
randomizedcontrolledclinicaltrialinamilitarysetting.ClinicalOrthopaedicsandRelatedResearch,1993(293):p.208-210.
325. LunV.M.,WileyJ.P.,MeeuwisseW.H.,etal.Effectivenessofpatellarbracingfortreatmentof
patellofemoralpainsyndrome.ClinicalJournalofSportMedicine,2005.15(4):p.235-240.326. MillerM.D.,HinkinD.T.WisnowskiJ.W.Theefficacyoforthoticsforanteriorkneepainin
militarytrainees.Apreliminaryreport.TheAmericanJournalofKneeSurgery,1996.10(1):p.10-13.
327. MøllerB.andKrebsB.Dynamickneebraceinthetreatmentofpatellofemoraldisorders.ArchivesofOrthopaedicandTraumaticSurgery,1986.104(6):p.377-379.
328. SwartN.M.,vanLinschotenR.,Bierma-ZeinstraS.M.,etal.Theadditionaleffectoforthoticdevicesonexercisetherapyforpatientswithpatellofemoralpainsyndrome:asystematic
review.BrJSportsMed,2012.46(8):p.570-7.329. SelfeJ.,RichardsJ.,ThewlisD.,etal.Thebiomechanicsofstepdescentunderdifferent
treatmentmodalitiesusedinpatellofemoralpain.Gait&Posture,2008.27(2):p.258-263.330. SolinskyR.,BeaupreG.S.FredericsonM.Variablecriteriaforpatellofemoralbracingamong
sportsmedicineprofessionals.PM&R,2014.6(6):p.498-505.331. ShellockF.G.,MullinM.,StoneK.R.,etal.Kinematicmagneticresonanceimagingoftheeffect
ofbracingonpatellarposition:qualitativeassessmentusinganextremitymagnetic
resonancesystem.JournalofAthleticTraining,2000.35(1):p.44.332. WilsonN.A.,MazaheryB.T.,KohJ.L.,etal.Effectofbracingondynamicpatellofemoral
contactmechanics.JournalofRehabilitationResearchandDevelopment,2010.47(6):p.531.
264
References
333. VanTiggelenD.,WitvrouwE.,RogetP.,etal.Effectofbracingonthepreventionofanteriorkneepain—aprospectiverandomizedstudy.KneeSurgery,SportsTraumatology,Arthroscopy,2004.12(5):p.434-439.
334. BirminghamT.,KramerJ.,KirkleyA.,etal.Kneebracingformedialcompartment
osteoarthritis:effectsonproprioceptionandposturalcontrol.Rheumatology,2001.40(3):p.285-289.
335. PerlauR.,FrankC.FickG.Theeffectofelasticbandagesonhumankneeproprioceptioninthe
uninjuredpopulation.TheAmericanJournalofSportsMedicine,1995.23(2):p.251-255.336. SelfeJ.,ThewlisD.,HillS.,etal.Aclinicalstudyofthebiomechanicsofstepdescentusing
differenttreatmentmodalitiesforpatellofemoralpain.Gait&Posture,2011.34(1):p.92-96.337. BartonC.J.,MunteanuS.E.,MenzH.B.,etal.Theefficacyoffootorthosesinthetreatmentof
individualswithpatellofemoralpainsyndrome:asystematicreview.SportsMed,2010.40(5):p.377-95.
338. HossainM.,AlexanderP.,BurlsA.,etal.Footorthosesforpatellofemoralpaininadults.CochraneDatabaseSystRev,2011(1):p.CD008402.
339. CollinsN.,CrossleyK.,BellerE.,etal.Footorthosesandphysiotherapyinthetreatmentof
patellofemoralpainsyndrome:randomisedclinicaltrial.BrJSportsMed,2009.43(3):p.169-71.
340. MillsK.,BlanchP.,DevP.,etal.Arandomisedcontroltrialofshorttermefficacyofin-shoe
footorthosescomparedwithawaitandseepolicyforanteriorkneepainandtheroleoffoot
mobility.BrJSportsMed,2012.46(4):p.247-52.341. EngJ.J.andPierrynowskiM.R.Evaluationofsoftfootorthoticsinthetreatmentof
patellofemoralpainsyndrome.PhysTher,1993.73(2):p.62-8;discussion68-70.342. JohnstonL.B.andGrossM.T.Effectsoffootorthosesonqualityoflifeforindividualswith
patellofemoralpainsyndrome.JOrthopSportsPhysTher,2004.34(8):p.440-8.343. EngJ.J.andPierrynowskiM.R.Theeffectofsoftfootorthoticsonthree-dimensionallower-
limbkinematicsduringwalkingandrunning.PhysTher,1994.74(9):p.836-44.344. LackS.,BartonC.,WoledgeR.,etal.Theimmediateeffectsoffootorthosesonhipandknee
kinematicsandmuscleactivityduringafunctionalstep-uptaskinindividualswith
patellofemoralpain.ClinBiomech(Bristol,Avon),2014.29(9):p.1056-62.345. WyndowN.,CrossleyK.,HodgesP.,etal.Theimmediateeffectsoffootorthosesonlower
limbneuromotorcontrolinpatellofemoraljointosteoarthritis:Apilotstudy.JournalofScienceandMedicineinSport,2014.18:p.e110.
346. PatilS.,DixonJ.,WhiteL.C.,etal.Anelectromyographicexploratorystudycomparingthe
differenceintheonsetofhamstringandquadricepscontractioninpatientswithanterior
kneepain.TheKnee,2011.18(5):p.329-332.347. EliasJ.J.,KirkpatrickM.S.,SaranathanA.,etal.Hamstringsloadingcontributestolateral
patellofemoralmalalignmentandelevatedcartilagepressures:aninvitrostudy.ClinicalBiomechanics,2011.26(8):p.841-846.
348. MillsK.,BlanchP.VicenzinoB.Comfortandmidfootmobilityratherthanorthosishardnessor
contouringinfluencetheirimmediateeffectsonlowerlimbfunctioninpatientswithanterior
kneepain.ClinicalBiomechanics,2012.27(2):p.202-208.349. McPoilT.G.,VicenzinoB.CornwallM.W.Effectoffootorthosescontouronpainperceptionin
individualswithpatellofemoralpain.JournaloftheAmericanPodiatricMedicalAssociation,2011.101(1):p.7-16.
350. BartonC.J.,MenzH.B.CrossleyK.M.Clinicalpredictorsoffootorthosesefficacyinindividualswithpatellofemoralpain.MedSciSportsExerc,2011.43(9):p.1603-10.
265
References
351. VicenzinoB.,CollinsN.,ClelandJ.,etal.Aclinicalpredictionruleforidentifyingpatientswithpatellofemoralpainwhoarelikelytobenefitfromfootorthoses:apreliminary
determination.BrJSportsMed,2010.44(12):p.862-6.352. SutliveT.G.,MitchellS.D.,MaxfieldS.N.,etal.Identificationofindividualswithpatellofemoral
painwhosesymptomsimprovedafteracombinedprogramoffootorthosisuseandmodified
activity:apreliminaryinvestigation.PhysTher,2004.84(1):p.49-61.353. CollinsN.J.,CrossleyK.M.,DarnellR.,etal.Predictorsofshortandlongtermoutcomein
patellofemoralpainsyndrome:aprospectivelongitudinalstudy.BMCMusculoskeletDisord,2010.11:p.11.
354. PitmanD.andJackD.AClinicalInvestigationtoDeterminetheEffectivenessof
BiomechanicalFootOrthosesasInitialTreatmentforPatellofemoralPainSyndrome.JPO:JournalofProstheticsandOrthotics,2001.12(4):p.110-116.
355. FosterN.E.,HillJ.C.,O'SullivanP.,etal.Stratifiedmodelsofcare.BestPractice&ResearchClinicalRheumatology,2013.27(5):p.649-661.
356. HingoraniA.D.,vanderWindtD.A.,RileyR.D.,etal.Prognosisresearchstrategy(PROGRESS)4:stratifiedmedicineresearch.BMJ,2013.346:p.e5793.
357. IndustryA.o.t.B.P.StratifiedmedicineintheNHS:Anassessmentofthecurrentlandscape
andimplementationchallengesfornon-cancerapplications.2014:UnitedKingdom.358. FosterN.E.,HillJ.C.HayE.M.Subgroupingpatientswithlowbackpaininprimarycare:arewe
gettinganybetteratit?ManualTherapy,2011.16(1):p.3-8.359. CallaghanM.J.andOldhamJ.A.Quadricepsatrophy:towhatextentdoesitexistin
patellofemoralpainsyndrome?BrJSportsMed,2004.38(3):p.295-9.360. GoubertL.,CraigK.D.,VervoortT.,etal.Facingothersinpain:theeffectsofempathy.Pain,
2005.118(3):p.285-288.361. WandB.M.andO'ConnellN.E.Chronicnon-specificlowbackpain–sub-groupsorasingle
mechanism?BMCMusculoskeletalDisorders,2008.9(1):p.1.362. KentP.,HancockM.,PetersenD.H.,etal.Clinimetricscorner:choosingappropriatestudy
designsforparticularquestionsabouttreatmentsubgroups.JournalofManual&ManipulativeTherapy,2010.18(3):p.147-152.
363. KentP.,KeatingJ.L.Leboeuf-YdeC.Researchmethodsforsubgroupinglowbackpain.BMCMedicalResearchMethodology,2010.10(1):p.1.
364. KentP.,StochkendahlM.J.,ChristensenH.W.,etal.Couldtheclinicalinterpretabilityofsubgroupsdetectedusingclusteringmethodsbeimprovedbyusinganoveltwo-stage
approach?Chiropractic&ManualTherapies,2015.23(1):p.1.365. SmithT.O.,McNamaraI.DonellS.T.Thecontemporarymanagementofanteriorkneepain
andpatellofemoralinstability.TheKnee,2013.20:p.S3-S15.366. KeaysS.L.,MasonM.NewcombeP.A.Individualizedphysiotherapyinthetreatmentof
patellofemoralpain.PhysiotherapyResearchInternational,2015.20(1):p.22-36.367. HarbaughC.M.,WilsonN.A.SheehanF.T.Correlatingfemoralshapewithpatellarkinematics
inpatientswithpatellofemoralpain.JOrthopRes,2010.28(7):p.865-72.368. PalS.,BesierT.F.,DraperC.E.,etal.Patellartiltcorrelateswithvastuslateralis:vastus
medialisactivationratioinmaltrackingpatellofemoralpainpatients.JOrthopRes,2012.30(6):p.927-33.
369. FicatR.,PhilippeJ.HungerfordD.S.Chondromalaciapatellae:asystemofclassification.ClinicalOrthopaedicsandRelatedResearch,1979.144:p.55-62.
370. MerchantA.C.AProposedClassificationofPatellofemoralDisorders.TheIowaOrthopaedicJournal,1986.6:p.90.
371. MerchantA.C.ClinicalClassificationofPatellofemoralDisorders.SportsMedicineandArthroscopyReview,1994.2(3):p.211-219.
266
References
372. WilkK.E.,DaviesG.J.,MangineR.E.,etal.Patellofemoraldisorders:aclassificationsystemand
clinicalguidelinesfornonoperativerehabilitation.JournalofOrthopaedic&SportsPhysicalTherapy,1998.28(5):p.307-322.
373. HolmesJrS.W.andClancyJrW.G.Clinicalclassificationofpatellofemoralpainand
dysfunction.JournalofOrthopaedic&SportsPhysicalTherapy,1998.28(5):p.299-306.374. SelhorstM.,RiceW.,DegenhartT.,etal.EVALUATIONOFATREATMENTALGORITHMFOR
PATIENTSWITHPATELLOFEMORALPAINSYNDROME:APILOTSTUDY.InternationalJournalofSportsPhysicalTherapy,2015.10(2):p.178.
375. SelfeJ.TIPPsfeasibilitystudy,inArthritisResearchMusculoskeletalPainClinicalStudies
Group.2014:KeeleUniversity,Staffordshire.376. BartonC.J.,MenzH.B.CrossleyK.M.Theimmediateeffectsoffootorthosesonfunctional
performanceinindividualswithpatellofemoralpainsyndrome.BrJSportsMed,2011.45(3):p.193-7.
377. RathleffM.S.,RoosE.,OlesenJ.,etal.Exerciseduringschoolhourswhenaddedtopatienteducationimprovesoutcomefor2yearsinadolescentpatellofemoralpain:acluster
randomisedtrial.BrJSportsMed,2015.49(6):p.406-412.378. DrewB.T.,RedmondA.C.,SmithT.O.,etal.Whichpatellofemoraljointimagingfeaturesare
associatedwithpatellofemoralpain?Systematicreviewandmeta-analysis.OsteoarthritisandCartilage,2015.
379. DuncanR.C.,HayE.M.,SaklatvalaJ.,etal.Prevalenceofradiographicosteoarthritis--italldependsonyourpointofview.Rheumatology(Oxford),2006.45(6):p.757-60.
380. HinmanR.S.,LentzosJ.,VicenzinoB.,etal.Ispatellofemoralosteoarthritiscommoninmiddle-
agedpeoplewithchronicpatellofemoralpain?ArthritisCareRes(Hoboken),2014.66(8):p.1252-7.
381. EcksteinF.,MosherT.HunterD.Imagingofkneeosteoarthritis:databeyondthebeauty.CurrOpinRheumatol,2007.19(5):p.435-43.
382. WenhamC.Y.andConaghanP.G.Imagingthepainfulosteoarthritickneejoint:whathavewe
learned?NatClinPractRheumatol,2009.5(3):p.149-58.383. MoherD.,LiberatiA.,TetzlaffJ.,etal.Reprint--preferredreportingitemsforsystematic
reviewsandmeta-analyses:thePRISMAstatement.PhysTher,2009.89(9):p.873-80.384. DownsS.H.andBlackN.Thefeasibilityofcreatingachecklistfortheassessmentofthe
methodologicalqualitybothofrandomisedandnon-randomisedstudiesofhealthcare
interventions.JEpidemiolCommunityHealth,1998.52(6):p.377-84.385. DeeksJ.,DinnesJ.,D'amicoR.,etal.Evaluatingnon-randomisedinterventionstudies.Health
technologyassessment(Winchester,England),2003.7(27):p.iii-x,1-173.386. WellsG.,SheaB.,O’connellD.,etal.TheNewcastle-OttawaScale(NOS)forassessingthe
qualityofnonrandomisedstudiesinmeta-analyses.2000.387. ZengX.,ZhangY.,KwongJ.S.,etal.Themethodologicalqualityassessmenttoolsforpreclinical
andclinicalstudies,systematicreviewandmeta-analysis,andclinicalpracticeguideline:a
systematicreview.JournalofEvidence-BasedMedicine,2015.8(1):p.2-10.388. HartlingL.,MilneA.,HammM.P.,etal.TestingtheNewcastleOttawaScaleshowedlow
reliabilitybetweenindividualreviewers.JournalofClinicalEpidemiology,2013.66(9):p.982-993.
389. MacLehoseR.,ReevesB.,HarveyI.,etal.Asystematicreviewofcomparisonsofeffectsizes
derivedfromrandomisedandnon-randomisedstudies.HealthTechnologyAssessment(Winchester,England),1999.4(34):p.1-154.
390. KempJ.L.,MacDonaldD.,CollinsN.J.,etal.HipArthroscopyintheSettingofHipOsteoarthritis:SystematicReviewofOutcomesandProgressiontoHipArthroplasty.ClinOrthopRelatRes,2014.
267
References
391. RatcliffeE.,PickeringS.,McLeanS.,etal.Istherearelationshipbetweensubacromial
impingementsyndromeandscapularorientation?Asystematicreview.BrJSportsMed,2014.48(16):p.1251-6.
392. HootmanJ.M.,DribanJ.B.,SitlerM.R.,etal.Reliabilityandvalidityofthreequalityratinginstrumentsforsystematicreviewsofobservationalstudies.ResearchSynthesisMethods,2011.2(2):p.110-118.
393. vanTulderM.,FurlanA.,BombardierC.,etal.Updatedmethodguidelinesforsystematic
reviewsinthecochranecollaborationbackreviewgroup.Spine(PhilaPa1976),2003.28(12):p.1290-9.
394. YusufE.,KortekaasM.C.,WattI.,etal.DokneeabnormalitiesvisualisedonMRIexplainknee
paininkneeosteoarthritis?Asystematicreview.AnnRheumDis,2011.70(1):p.60-7.395. DrewB.T.,SmithT.O.,LittlewoodC.,etal.Dostructuralchanges(eg,collagen/matrix)explain
theresponsetotherapeuticexercisesintendinopathy:asystematicreview.BrJSportsMed,2014.48(12):p.966-72.
396. LievenseA.M.,Bierma-ZeinstraS.M.,VerhagenA.P.,etal.Influenceofobesityonthedevelopmentofosteoarthritisofthehip:asystematicreview.Rheumatology(Oxford),2002.41(10):p.1155-62.
397. FelicioL.R.,BaffaAdoP.,LiporacciR.F.,etal.Analysisofpatellarstabilizersmusclesand
patellarkinematicsinanteriorkneepainsubjects.JElectromyogrKinesiol,2011.21(1):p.148-53.
398. FelicioL.R.,CamargoA.C.,BaffaAdoP.,etal.Influenceofexercisesonpatellarheightinwomenwithpatellofemoralpainsyndrome.ActaOrtopBras,2014.22(2):p.82-5.
399. FelicioL.R.,SaadM.C.,LiporaciR.F.,etal.Correlationbetweentrochleargroovedepthandpatellarpositionduringopenandclosedkineticchainexercisesinsubjectswithanteriorknee
pain.JApplBiomech,2012.28(3):p.335-42.400. PattynE.,VerdonkP.,SteyaertA.,etal.Vastusmedialisobliquusatrophy:doesitexistin
patellofemoralpainsyndrome?AmJSportsMed,2011.39(7):p.1450-5.401. TramerM.R.,ReynoldsD.J.,MooreR.A.,etal.Impactofcovertduplicatepublicationonmeta-
analysis:acasestudy.BMJ,1997.315(7109):p.635-40.402. PalS.,BesierT.F.,BeaupreG.S.,etal.Patellarmaltrackingisprevalentamongpatellofemoral
painsubjectswithpatellaalta:anupright,weightbearingMRIstudy.JOrthopRes,2013.31(3):p.448-57.
403. JoensenA.M.,HahnT.,GelineckJ.,etal.Articularcartilagelesionsandanteriorkneepain.ScandJMedSciSports,2001.11(2):p.115-9.
404. PowersC.M.Patellarkinematics,partII:theinfluenceofthedepthofthetrochleargroovein
subjectswithandwithoutpatellofemoralpain.PhysTher,2000.80(10):p.965-78.405. RibeiroAdeC.,GrossiD.B.,FoersterB.,etal.Electromyographicandmagneticresonance
imagingevaluationsofindividualswithpatellofemoralpainsyndrome.RevBrasFisioter,2010.14(3):p.221-8.
406. TengH.L.,ChenY.J.PowersC.M.Predictorsofpatellaralignmentduringweightbearing:an
examinationofpatellarheightandtrochleargeometry.Knee,2014.21(1):p.142-6.407. TuncyurekO.,OzkolM.,OzicU.,etal.Theroleofpatellartendonmorphometryonanterior
kneepain.SurgRadiolAnat,2010.32(6):p.539-43.408. WitonskiD.andGorajB.Patellarmotionanalyzedbykinematicanddynamicaxialmagnetic
resonanceimaginginpatientswithanteriorkneepainsyndrome.ArchOrthopTraumaSurg,1999.119(1-2):p.46-9.
409. HarmanM.,DoganA.,ArslanH.,etal.Evaluationofthepatellofemoraljointwithkinematic
MRfluoroscopy.ClinImaging,2002.26(2):p.136-9.
268
References
410. GuzzantiV.,GiganteA.,DiLazzaroA.,etal.Patellofemoralmalalignmentinadolescents.
Computerizedtomographicassessmentwithorwithoutquadricepscontraction.AmJSportsMed,1994.22(1):p.55-60.
411. TaskiranE.,DinedurgaZ.,YagizA.,etal.Effectofthevastusmedialisobliquusonthe
patellofemoraljoint.KneeSurgSportsTraumatolArthrosc,1998.6(3):p.173-80.412. MunetaT.,YamamotoH.,IshibashiT.,etal.Computerizedtomographicanalysisoftibial
tuberclepositioninthepainfulfemalepatellofemoraljoint.AmJSportsMed,1994.22(1):p.67-71.
413. MetinCubukS.,SindelM.,KaraaliK.,etal.Tibialtuberclepositionandpatellarheightasindicatorsofmalalignmentinwomenwithanteriorkneepain.ClinAnat,2000.13(3):p.199-203.
414. JonesR.B.,BarlettE.C.,VainrightJ.R.,etal.CTdeterminationoftibialtuberclelateralizationin
patientspresentingwithanteriorkneepain.SkeletalRadiol,1995.24(7):p.505-9.415. EckhoffD.G.,MontgomeryW.K.,KilcoyneR.F.,etal.Femoralmorphometryandanteriorknee
pain.ClinOrthopRelatRes,1994(302):p.64-8.416. SchutzerS.F.,RamsbyG.R.FulkersonJ.P.Theevaluationofpatellofemoralpainusing
computerizedtomography.Apreliminarystudy.ClinOrthopRelatRes,1986(204):p.286-93.417. PinarH.,AksekiD.,KaraoglanO.,etal.Kinematicanddynamicaxialcomputedtomographyof
thepatello-femoraljointinpatientswithanteriorkneepain.KneeSurgSportsTraumatolArthrosc,1994.2(3):p.170-3.
418. ChenH.Y.,ChienC.C.,WuS.K.,etal.Electromechanicaldelayofthevastusmedialisobliquus
andvastuslateralisinindividualswithpatellofemoralpainsyndrome.JOrthopSportsPhysTher,2012.42(9):p.791-6.
419. WilsonN.A.,PressJ.M.ZhangL.Q.Invivostrainofthemedialvs.lateralquadricepstendonin
patellofemoralpainsyndrome.JApplPhysiol(1985),2009.107(2):p.422-8.420. LapradeJ.andCulhamE.Radiographicmeasuresinsubjectswhoareasymptomaticand
subjectswithpatellofemoralpainsyndrome.ClinOrthopRelatRes,2003(414):p.172-82.421. AgliettiP.,InsallJ.N.CerulliG.Patellarpainandincongruence.I:Measurementsof
incongruence.ClinOrthopRelatRes,1983(176):p.217-24.422. HaimA.,YanivM.,DekelS.,etal.Patellofemoralpainsyndrome:validityofclinicaland
radiologicalfeatures.ClinOrthopRelatRes,2006.451:p.223-8.423. KimT.H.,SobtiA.,LeeS.H.,etal.Theeffectsofweight-bearingconditionsonpatellofemoral
indicesinindividualswithoutandwithpatellofemoralpainsyndrome.SkeletalRadiol,2014.43(2):p.157-64.
424. JanM.H.,LinD.H.,LinC.H.,etal.Theeffectsofquadricepscontractionondifferentpatellofemoralalignmentsubtypes:anaxialcomputedtomographystudy.JOrthopSportsPhysTher,2009.39(4):p.264-9.
425. DraperC.E.,BesierT.F.,FredericsonM.,etal.Differencesinpatellofemoralkinematics
betweenweight-bearingandnon-weight-bearingconditionsinpatientswithpatellofemoral
pain.JOrthopRes,2011.29(3):p.312-7.426. SterneJ.A.,SuttonA.J.,IoannidisJ.P.,etal.Recommendationsforexaminingandinterpreting
funnelplotasymmetryinmeta-analysesofrandomisedcontrolledtrials.BMJ,2011.343:p.d4002.
427. HigginsJ.P.T.,GreenS.CochraneCollaboration.Cochranehandbookforsystematicreviewsof
interventions.Cochranebookseries.2008,Chichester,England;Hoboken,NJ:Wiley-Blackwell.xxi,649p.
428. Feministmethodologiesforcriticalresearchers:bridgingdifferences.Choice:CurrentReviewsforAcademicLibraries,2006.43(9):p.1864-1864.
269
References
429. SmithT.O.andHingC.B."Garbagein,garbageout"-theimportanceofdetailing
methodologicalreasoninginorthopaedicmeta-analysis.InternationalOrthopaedics,2011.35(2):p.301-302.
430. HunterD.J.,ZhangY.Q.,NiuJ.B.,etal.Patellamalalignment,painandpatellofemoral
progression:theHealthABCStudy.Osteoarthritis&Cartilage,2007.15(10):p.1120-7.431. CosmusT.C.andParizhM.AdvacnesinWhole-BodyMRIMagnets.IEEE/CSC&ESAS
EuropeanSuperconductivityNewsForum(ESNF),2010.14(October).432. GoldG.E.,BesierT.F.,DraperC.E.,etal.Weight-bearingMRIofpatellofemoraljointcartilage
contactarea.JMagnResonImaging,2004.20(3):p.526-30.433. HartJ.M.,PietrosimoneB.,HertelJ.,etal.Quadricepsactivationfollowingkneeinjuries:a
systematicreview.JAthlTrain,2010.45(1):p.87-97.434. WhiteL.M.,SchweitzerM.E.,DeelyD.M.,etal.Theeffectoftrainingandexperienceonthe
magneticresonanceimaginginterpretationofmeniscaltears.Arthroscopy,1997.13(2):p.224-8.
435. MedinaL.S.,BlackmoreC.C.ApplegateK.Evidence-BasedImaging-ImprovingtheQualityof
ImaginginPatientCare.2011:Springer.436. GrelsamerR.P.Patellarnomenclature:theTowerofBabelrevisited.ClinOrthopRelatRes,
2005(436):p.60-5.437. AkobengA.K.Understandingsystematicreviewsandmeta-analysis.ArchDisChild,2005.
90(8):p.845-8.438. DrewB.T.,BowesM.A.,RedmondA.C.,etal.Patellofemoralmorphologyisnotrelatedtopain
usingthree-dimensionalquantitativeanalysisinanolderpopulation:datafromthe
OsteoarthritisInitiative.Rheumatology,2017.439. WilsonT.Themeasurementofpatellaralignmentinpatellofemoralpainsyndrome:arewe
confusingassumptionswithevidence?JOrthopSportsPhysTher,2007.37(6):p.330-41.440. KatchburianM.V.,BullA.M.,ShihY.F.,etal.Measurementofpatellartracking:assessment
andanalysisoftheliterature.ClinOrthopRelatRes,2003(412):p.241-59.441. ShibanumaN.,SheehanF.T.StanhopeS.J.Limbpositioningiscriticalfordefining
patellofemoralalignmentandfemoralshape.ClinOrthopRelatRes,2005(434):p.198-206.442. BarrA.J.,DubeB.,HensorE.M.,etal.Therelationshipbetweenclinicalcharacteristics,
radiographicosteoarthritisand3Dbonearea:datafromtheOsteoarthritisInitiative.Osteoarthritis&Cartilage,2014.22(10):p.1703-9.
443. CootesT.F.,EdwardsG.J.TaylorC.J.ActiveApperanceModels.IEEETransactionsOnPatternAnalysisandMachineIntelligence,2001.23(6):p.681-685.
444. VincentG.,WolstenholmeC.,ScottI.,etal.Fullyautomaticsegmentationofthekneejoint
usingactiveappearancemodels.MedicalImageAnalysisfortheClinic:AGrandChallenge,2010:p.224-230.
445. BowesM.A.,VincentG.R.,WolstenholmeC.B.,etal.Anovelmethodforbonearea
measurementprovidesnewinsightsintoosteoarthritisanditsprogression.AnnRheumDis,2015.74(3):p.519-25.
446. WilliamsT.G.,VincentG.,BowesM.A.,etal.Automaticsegmentationofbonesandinter-
imageanatomicalcorrespondencebyvolumetricstatisticalmodellingofkneeMRI.BiomedicalImaging:FromNanotoMacro,2010IEEEInternationalSymposium,2010:p.432-435.
447. FitzpatrickC.K.,BaldwinM.A.,LazP.J.,etal.Developmentofastatisticalshapemodelofthe
patellofemoraljointforinvestigatingrelationshipsbetweenshapeandfunction.JBiomech,2011.44(13):p.2446-52.
270
References
448. FitzpatrickC.K.,BaldwinM.A.,RullkoetterP.J.,etal.Combinedprobabilisticandprincipal
componentanalysisapproachformultivariatesensitivityevaluationandapplicationto
implantedpatellofemoralmechanics.JBiomech,2011.44(1):p.13-21.449. FaberS.C.,EcksteinF.,LukaszS.,etal.Genderdifferencesinkneejointcartilagethickness,
volumeandarticularsurfaceareas:assessmentwithquantitativethree-dimensionalMR
imaging.SkeletalRadiol,2001.30(3):p.144-50.450. MahfouzM.,BadawiA.,MerklB.,etal.Patellasexdeterminationby3Dstatisticalshape
modelsandnonlinearclassifiers.ForensicScienceInternational,2007.173(2):p.161-170.451. CsintalanR.P.,SchulzM.M.,WooJ.,etal.Genderdifferencesinpatellofemoraljoint
biomechanics.ClinicalOrthopaedicsandRelatedResearch,2002.402:p.260-269.452. NevittM.,FelsonD.LesterG.TheOsteoarthritisInitiative:protocolforthecohortstudy.2006.
URL:http://oai.epi-ucsf.org/datarelease/docs/StudyDesignProtocol.pdf,2016.453. VonElmE.,AltmanD.G.,EggerM.,etal.TheStrengtheningtheReportingofObservational
StudiesinEpidemiology(STROBE)statement:guidelinesforreportingobservationalstudies.PreventiveMedicine,2007.45(4):p.247-251.
454. MitchellS.C.,BoschJ.G.,LelieveldtB.P.,etal.3-Dactiveappearancemodels:segmentationof
cardiacMRandultrasoundimages.IEEETransMedImaging,2002.21(9):p.1167-78.455. BabalolaK.O.,CootesT.F.,TwiningC.J.,etal.3Dbrainsegmentationusingactiveappearance
modelsandlocalregressors.inInternationalConferenceonMedicalImageComputingand
Computer-AssistedIntervention.2008.Springer.456. EdwardsG.J.,TaylorC.J.CootesT.F.Interpretingfaceimagesusingactiveappearancemodels.
inAutomaticFaceandGestureRecognition,1998.Proceedings.ThirdIEEEInternational
Conferenceon.1998.IEEE.457. BarrA.J.Theroleofsubchondralboneinosteoarthritis.2016,UniversityofLeeds.458. HeimannT.andMeinzerH.-P.Statisticalshapemodelsfor3Dmedicalimagesegmentation:
areview.MedicalImageAnalysis,2009.13(4):p.543-563.459. KlingenbergC.P.Size,shape,andform:conceptsofallometryingeometricmorphometrics.
DevelopmentGenesandEvolution,2016.226(3):p.113-137.460. RussJ.C.Theimageprocessinghandbook.2016:CRCpress.461. ThomeeR.,RenströmP.,KarlssonJ.,etal.Patellofemoralpainsyndromeinyoungwomen.
ScandinavianJournalofMedicine&ScienceinSports,1995.5(4):p.245-251.462. BenderR.andLangeS.Adjustingformultipletesting—whenandhow?JournalofClinical
Epidemiology,2001.54(4):p.343-349.463. ArmstrongR.A.WhentousetheBonferronicorrection.OphthalmicandPhysiologicalOptics,
2014.34(5):p.502-508.464. HigginsJ.P.andGreenS.Cochranehandbookforsystematicreviewsofinterventions.Vol.4.
2011:JohnWiley&Sons.465. MartensE.P.Methodstoadjustforconfounding:propensityscoresandinstrumental
variables.2007:UtrechtUniversity.466. CrumpR.K.,HotzV.J.,ImbensG.W.,etal.Dealingwithlimitedoverlapinestimationof
averagetreatmenteffects.Biometrika,2009.96(1):p.187-199.467. ZuurA.F.,IenoE.N.ElphickC.S.Aprotocolfordataexplorationtoavoidcommonstatistical
problems.MethodsinEcologyandEvolution,2010.1(1):p.3-14.468. ShrierI.andPlattR.W.Reducingbiasthroughdirectedacyclicgraphs.BMCMedicalResearch
Methodology,2008.8(1):p.70.469. FieldA.DiscoveringstatisticsusingIBMSPSSstatistics.2013:Sage.470. MenzH.B.Twofeet,oroneperson?Problemsassociatedwithstatisticalanalysisofpaired
datainfootandanklemedicine.TheFoot,2004.14(1):p.2-5.
271
References
471. SuttonA.J.,MuirK.R.JonesA.C.Twokneesoroneperson:dataanalysisstrategiesforpairedjointsororgans.AnnalsoftheRheumaticDiseases,1997.56(7):p.401-402.
472. DohertyM.andJonesA.Designofclinicaltrialsinkneeosteoarthritis:practicalissuesfordebate.OsteoarthritisandCartilage,1998.6(6):p.371-373.
473. TurkD.C.,DworkinR.H.,BurkeL.B.,etal.Developingpatient-reportedoutcomemeasuresfor
painclinicaltrials:IMMPACTrecommendations.Pain,2006.125(3):p.208-215.474. EtemadK.andChellappaR.Discriminantanalysisforrecognitionofhumanfaceimages.
JOSAA,1997.14(8):p.1724-1733.475. JainA.andHuangJ.Integratingindependentcomponentsandlineardiscriminantanalysisfor
genderclassification.inAutomaticFaceandGestureRecognition,2004.Proceedings.Sixth
IEEEInternationalConferenceon.2004.IEEE.476. SawilowskyS.S.Youthinkyou’vegottrivials?JournalofModernAppliedStatisticalMethods,
2003.2(1):p.21.477. WillmottC.J.andMatsuuraK.Advantagesofthemeanabsoluteerror(MAE)overtheroot
meansquareerror(RMSE)inassessingaveragemodelperformance.ClimateResearch,2005.30(1):p.79-82.
478. MacriE.M.,StefanikJ.J.,KhanK.M.,etal.Istibiofemoralorpatellofemoralalignmentor
trochlearmorphologyassociatedwithpatellofemoralosteoarthritis?Asystematicreview.ArthritisCare&Research,2016.
479. TanamasS.K.,TeichtahlA.J.,WlukaA.E.,etal.Theassociationsbetweenindicesofpatellofemoralgeometryandkneepainandpatellacartilagevolume:across-sectionalstudy.BMCMusculoskeletDisord,2010.11:p.87.
480. StaubliH.U.,DurrenmattU.,PorcelliniB.,etal.Anatomyandsurfacegeometryofthe
patellofemoraljointintheaxialplane.JBoneJointSurgBr,1999.81(3):p.452-8.481. StefanikJ.J.,RoemerF.W.,ZumwaltA.C.,etal.Associationbetweenmeasuresoftrochlear
morphologyandstructuralfeaturesofpatellofemoraljointosteoarthritisonMRI:theMOST
study.JOrthopRes,2012.30(1):p.1-8.482. PeatG.,DuncanR.C.,WoodL.R.,etal.Clinicalfeaturesofsymptomaticpatellofemoraljoint
osteoarthritis.ArthritisResTher,2012.14(2):p.R63.483. MatthewsM.,RathleffM.,ClausA.,etal.Canwepredicttheoutcomeforpeoplewith
patellofemoralpain?Asystematicreviewonprognosticfactorsandtreatmenteffect
modifiers.BritishJournalofSportsMedicine,2016:p.bjsports-2016-096545.484. WatariR.,KobsarD.,PhinyomarkA.,etal.Determinationofpatellofemoralpainsub-groups
anddevelopmentofamethodforpredictingtreatmentoutcomeusingrunninggait
kinematics.ClinicalBiomechanics,2016.38:p.13-21.485. O'sullivanK.,O'sullivanP.,FersumK.V.,etal.Bettertargetingcareforindividualswithlow
backpain:opportunitiesandobstacles.2016,BMJPublishingGroupLtdandBritishAssociationofSportandExerciseMedicine.
486. FormannA.K.Dielatent-class-analyse:EinführunginTheorieundAnwendung.1984:Beltz.487. FleischerN.andRouxA.D.Usingdirectedacyclicgraphstoguideanalysesofneighbourhood
healtheffects:anintroduction.JournalofEpidemiologyandCommunityHealth,2008.62(9):p.842-846.
488. BartonC.J.,LevingerP.,MenzH.B.,etal.Kinematicgaitcharacteristicsassociatedwith
patellofemoralpainsyndrome:asystematicreview.Gait&Posture,2009.30(4):p.405-416.489. FreemantleN.andGeddesJ.Understandingandinterpretingsystematicreviewsandmeta-
analyses.Part2:meta-analyses.Evidence-BasedMentalHealth,1998.1(4):p.102-104.490. BartonC.J.,LevingerP.,CrossleyK.M.,etal.RelationshipsbetweentheFootPostureIndexand
footkinematicsduringgaitinindividualswithandwithoutpatellofemoralpainsyndrome.JFootAnkleRes,2011.4:p.10.
272
References
491. LevingerP.andGilleardW.Aninvestigationofareferencepostureusedindetermining
rearfootkinematicsforbothhealthyandpatellofemoralpainsyndromeindividuals.JournalofSportsScience&Medicine,2005.4(3):p.332.
492. PowersC.M.,MaffucciR.HamptonS.Rearfootpostureinsubjectswithpatellofemoralpain.JOrthopSportsPhysTher,1995.22(4):p.155-60.
493. KhayambashiK.,GhoddosiN.,StraubR.K.,etal.HipMuscleStrengthPredictsNoncontact
AnteriorCruciateLigamentInjuryinMaleandFemaleAthletesAProspectiveStudy.AmericanJournalofSportsMedicine,2016.44(2):p.355-361.
494. SalsichG.B.,BrechterJ.H.PowersC.M.Lowerextremitykineticsduringstairambulationin
patientswithandwithoutpatellofemoralpain.ClinBiomech(Bristol,Avon),2001.16(10):p.906-12.
495. SelfeJ.,CallaghanM.,WitvrouwE.,etal.Targetedinterventionsforpatellofemoralpain
syndrome(TIPPS):classificationofclinicalsubgroups.BMJOpen,2013.3(9):p.e003795.496. RedmondA.TheFootPostureIndex:userguideandmanual.RetrievedSeptember,2005.30:
p.2008.497. SantosC.M.d.,FerreiraG.,MalaccoP.L.,etal.Intraandinterexaminerreliabilityand
measurementerrorofgoniometeranddigitalinclinometeruse.RevistaBrasileiradeMedicinadoEsporte,2012.18(1):p.38-41.
498. VenturniC.,AndréA.,AguilarB.P.,etal.Reliabilityoftwoevaluationmethodsofactiverange
ofmotionintheankleofhealthyindividuals.ActaFisiátrica,2016.13(1):p.39-43.499. KolberM.J.,VegaJrF.,WidmayerK.,etal.Thereliabilityandminimaldetectablechangeof
shouldermobilitymeasurementsusingadigitalinclinometer.PhysiotherapyTheoryandPractice,2011.27(2):p.176-184.
500. ReurinkG.,GoudswaardG.J.,OomenH.G.,etal.Reliabilityoftheactiveandpassivekneeextensiontestinacutehamstringinjuries.TheAmericanJournalofSportsMedicine,2013.41(8):p.1757-1761.
501. MessierS.P.andPittalaK.A.Etiologicfactorsassociatedwithselectedrunninginjuries.MedicineandScienceinSportsandExercise,1988.20(5):p.501-505.
502. RabinA.andKozolZ.Weightbearingandnonweightbearingankledorsiflexionrangeof
motion:arewemeasuringthesamething?JournaloftheAmericanPodiatricMedicalAssociation,2012.102(5):p.406-411.
503. RedmondA.C.,CrosbieJ.OuvrierR.A.Developmentandvalidationofanovelratingsystem
forscoringstandingfootposture:theFootPostureIndex.ClinicalBiomechanics,2006.21(1):p.89-98.
504. FeiringD.C.,EllenbeckerT.S.DerscheidG.L.Test-retestreliabilityoftheBiodexisokineticdynamometer.JournalofOrthopaedic&SportsPhysicalTherapy,1990.11(7):p.298-300.
505. LundH.,SøndergaardK.,ZachariassenT.,etal.Learningeffectofisokineticmeasurementsin
healthysubjects,andreliabilityandcomparabilityofBiodexandLidodynamometers.ClinicalPhysiologyandFunctionalImaging,2005.25(2):p.75-82.
506. BembenM.G.andJohnsonD.A.ReliabilityoftheBiodexB-2000isokineticdynamometerand
theevaluationofasport-specificdeterminationfortheangleofpeaktorqueduringknee
extension.IsokineticsandExerciseScience,1993.3(3):p.164-168.507. StefanikJ.J.,GuermaziA.,ZhuY.,etal.Quadricepsweakness,patellaalta,andstructural
featuresofpatellofemoralosteoarthritis.ArthritisCare&Research,2011.63(10):p.1391-1397.
508. BolingM.andPaduaD.RELATIONSHIPBETWEENHIPSTRENGTHANDTRUNK,HIP,ANDKNEE
KINEMATICSDURINGAJUMP-LANDINGTASKININDIVIDUALSWITHPATELLOFEMORALPAIN.InternationalJournalofSportsPhysicalTherapy,2013.8(5):p.661.
273
References
509. MarchantD.C.,GreigM.ScottC.Attentionalfocusinginstructionsinfluenceforceproductionandmuscularactivityduringisokineticelbowflexions.JournalofStrengthandConditioningResearch,2009.23(8):p.2358-2366.
510. PaytonC.andBartlettR.Biomechanicalevaluationofmovementinsportandexercise:the
BritishAssociationofSportandExerciseSciencesguide.2007:Routledge.511. CappozzoA.,CappelloA.,CroceU.D.,etal.Surface-markerclusterdesigncriteriafor3-Dbone
movementreconstruction.BiomedicalEngineering,IEEETransactionson,1997.44(12):p.1165-1174.
512. RichardsJ.BiomechanicsinClinicandResearch:Aninteractiveteachingandlearningcourse,
ChurchillLivingstone.2008,Elsevier.513. ChapmanG.J.,ParkesM.J.,ForsytheL.,etal.Anklemotioninfluencestheexternalknee
adductionmomentandmaypredictwhowillrespondtolateralwedgeinsoles?:anancillary
analysisfromtheSILKtrial.OsteoarthritisandCartilage,2015.23(8):p.1316-1322.514. BellA.L.,BrandR.A.PedersenD.R.Predictionofhipjointcentrelocationfromexternal
landmarks.HumanMovementScience,1989.8(1):p.3-16.515. HerringtonL.Kneevalgusangleduringsinglelegsquatandlandinginpatellofemoralpain
patientsandcontrols.TheKnee,2014.21(2):p.514-517.516. WillsonJ.D.andDavisI.S.Lowerextremitystrengthandmechanicsduringjumpinginwomen
withpatellofemoralpain.JournalofSportRehabilitation,2009.18(1):p.76-90.517. BartonC.J.,LevingerP.,WebsterK.E.,etal.Walkingkinematicsinindividualswith
patellofemoralpainsyndrome:acase-controlstudy.Gait&Posture,2011.33(2):p.286-91.518. WhatlingG.andHoltC.Doesthechoiceofstairgaitcycleaffectresultingkneejoint
kinematicsandmoments?ProceedingsoftheInstitutionofMechanicalEngineers,PartH:JournalofEngineeringinMedicine,2010.224(9):p.1085-1093.
519. YuB.,KienbacherT.,GrowneyE.S.,etal.Reproducibilityofthekinematicsandkineticsofthe
lowerextremityduringnormalstair-climbing.JournalofOrthopaedicResearch,1997.15(3):p.348-352.
520. MianO.S.,ThomJ.M.,NariciM.V.,etal.Kinematicsofstairdescentinyoungandolderadults
andtheimpactofexercisetraining.Gait&Posture,2007.25(1):p.9-17.521. GroodE.S.andSuntayW.J.Ajointcoordinatesystemfortheclinicaldescriptionofthree-
dimensionalmotions:applicationtotheknee.JournalofBiomechanicalEngineering,1983.105(2):p.136-144.
522. HunterD.J.,GuermaziA.,LoG.H.,etal.Evolutionofsemi-quantitativewholejointassessment
ofkneeOA:MOAKS(MRIOsteoarthritisKneeScore).OsteoarthritisandCartilage,2011.19(8):p.990-1002.
523. HunterD.,ArdenN.,ConaghanP.,etal.DefinitionofosteoarthritisonMRI:resultsofaDelphi
exercise.OsteoarthritisandCartilage,2011.19(8):p.963-969.524. ChiuT.,FangD.,ChenJ.,etal.Arobustandscalableclusteringalgorithmformixedtype
attributesinlargedatabaseenvironment.inProceedingsoftheseventhACMSIGKDD
internationalconferenceonknowledgediscoveryanddatamining.2001.ACM.525. GelbardR.,GoldmanO.SpieglerI.Investigatingdiversityofclusteringmethods:Anempirical
comparison.Data&KnowledgeEngineering,2007.63(1):p.155-166.526. BacherJ.,WenzigK.VoglerM.SPSSTwoStepCluster-afirstevaluation.2004.527. KentP.,JensenR.K.KongstedA.Acomparisonofthreeclusteringmethodsforfinding
subgroupsinMRI,SMSorclinicaldata:SPSSTwoStepClusteranalysis,LatentGoldand
SNOB.BMCMedicalResearchMethodology,2014.14(1):p.113.528. IBM.Clusteringbinarydata(shouldbeavoided)..Technote(troubleshooting)2012;
Availablefrom:http://www-01.ibm.com/support/docview.wss?uid=swg21476716.
274
References
529. LandisJ.R.andKochG.G.Themeasurementofobserveragreementforcategoricaldata.Biometrics,1977:p.159-174.
530. Danneskiold-SamsøeB.,BartelsE.,BülowP.,etal.Isokineticandisometricmusclestrengthin
ahealthypopulationwithspecialreferencetoageandgender.ActaPhysiologica,2009.197(s673):p.1-68.
531. BoviG.,RabuffettiM.,MazzoleniP.,etal.Amultiple-taskgaitanalysisapproach:kinematic,
kineticandEMGreferencedataforhealthyyoungandadultsubjects.Gait&Posture,2011.33(1):p.6-13.
532. YoudasJ.W.,KrauseD.A.,HollmanJ.H.,etal.Theinfluenceofgenderandageonhamstring
musclelengthinhealthyadults.JournalofOrthopaedic&SportsPhysicalTherapy,2005.35(4):p.246-252.
533. KamperS.J.,MaherC.G.MackayG.Globalratingofchangescales:areviewofstrengthsandweaknessesandconsiderationsfordesign.JournalofManual&ManipulativeTherapy,2009.17(3):p.163-170.
534. KujalaU.M.,JaakkolaL.H.,KoskinenS.K.,etal.Scoringofpatellofemoraldisorders.Arthroscopy:TheJournalofArthroscopic&RelatedSurgery,1993.9(2):p.159-163.
535. GrahamJ.W.,OlchowskiA.E.GilreathT.D.Howmanyimputationsarereallyneeded?Some
practicalclarificationsofmultipleimputationtheory.PreventionScience,2007.8(3):p.206-213.
536. WhiteI.R.,RoystonP.WoodA.M.Multipleimputationusingchainedequations:issuesand
guidanceforpractice.StatisticsinMedicine,2011.30(4):p.377-399.537. LittleR.J.andRubinD.B.Statisticalanalysiswithmissingdata.2014:JohnWiley&Sons.538. SterneJ.A.,WhiteI.R.,CarlinJ.B.,etal.Multipleimputationformissingdatain
epidemiologicalandclinicalresearch:potentialandpitfalls.BMJ,2009.338:p.b2393.539. Smits-EngelsmanB.,KlerksM.KirbyA.Beightonscore:avalidmeasureforgeneralized
hypermobilityinchildren.TheJournalofPediatrics,2011.158(1):p.119-123.e4.540. ReillyM.C.,ZbrozekA.S.DukesE.M.Thevalidityandreproducibilityofaworkproductivityand
activityimpairmentinstrument.Pharmacoeconomics,1993.4(5):p.353-365.541. BennettM.I.,SmithB.H.,TorranceN.,etal.TheS-LANSSscoreforidentifyingpainof
predominantlyneuropathicorigin:validationforuseinclinicalandpostalresearch.TheJournalofPain,2005.6(3):p.149-158.
542. SmithB.E.,HendrickP.,BatemanM.,etal.Currentmanagementstrategiesforpatellofemoral
pain:anonlinesurveyof99practisingUKphysiotherapists.BMCMusculoskeletalDisorders,2017.18(1):p.181.
543. RielH.,MatthewsM.,VicenzinoB.,etal.FeedbackLeadstoBetterExerciseQualityinAdolescentswithPatellofemoralPain.Medicine&ScienceinSports&Exercise,2017.
544. DrewB.T.,ConaghanP.G.,SmithT.O.,etal.Theeffectoftargetedtreatmentonpeoplewith
patellofemoralpain:apragmatic,randomisedcontrolledfeasibilitystudy.BMCMusculoskeletalDisorders,2017.18(1):p.338.
545. EsculierJ.-F.,BouyerL.J.,DuboisB.,etal.Iscombininggaitretrainingoranexercise
programmewitheducationbetterthaneducationaloneintreatingrunnerswith
patellofemoralpain?Arandomisedclinicaltrial.BrJSportsMed,2017:p.bjsports-2016-096988.
546. DolnicarS.Areviewofunquestionedstandardsinusingclusteranalysisfordata-drivenmarketsegmentation.2002.
547. CrossleyK.M.,vanMiddelkoopM.,CallaghanM.J.,etal.2016Patellofemoralpainconsensus
statementfromthe4thInternationalPatellofemoralPainResearchRetreat,Manchester.
Part2:recommendedphysicalinterventions(exercise,taping,bracing,footorthosesand
combinedinterventions).BritishJournalofSportsMedicine,2016:p.bjsports-2016-096268.
275
References
548. NoehrenB.,HamillJ.DavisI.Prospectiveevidenceforahipetiologyinpatellofemoralpain.MedicineandScienceinSportsandExercise,2013.45(6):p.1120-1124.
549. NakagawaT.,SerrãoF.,MacielC.,etal.Hipandkneekinematicsareassociatedwithpainand
self-reportedfunctionalstatusinmalesandfemaleswithpatellofemoralpain.InternationalJournalofSportsMedicine,2013.34(11):p.997-1002.
550. FelsonD.T.,RedmondA.C.,ChapmanG.J.,etal.Recommendationsfortheconductofefficacy
trialsoftreatmentdevicesforosteoarthritis:areportfromaworkinggroupoftheArthritis
ResearchUKOsteoarthritisandCrystalDiseasesClinicalStudiesGroup.Rheumatology,2016.55(2):p.320-326.
551. SchulzK.F.,AltmanD.G.MoherD.CONSORT2010statement:updatedguidelinesforreporting
parallelgrouprandomisedtrials.BMCMedicine,2010.8(1):p.1.552. HoffmannT.C.,GlasziouP.P.,BoutronI.,etal.Betterreportingofinterventions:templatefor
interventiondescriptionandreplication(TIDieR)checklistandguide.BMJ,2014.348:p.g1687.
553. CraigP.,DieppeP.,MacintyreS.,etal.Developingandevaluatingcomplexinterventions:the
newMedicalResearchCouncilguidance.BMJ,2008.337:p.a1655.554. EldridgeS.M.,LancasterG.A.,CampbellM.J.,etal.Definingfeasibilityandpilotstudiesin
preparationforrandomisedcontrolledtrials:developmentofaconceptualframework.PLoSOne,2016.11(3):p.e0150205.
555. LancasterG.A.,DoddS.WilliamsonP.R.Designandanalysisofpilotstudies:recommendations
forgoodpractice.JournalofEvaluationinClinicalPractice,2004.10(2):p.307-312.556. LovellK.,BowerP.,RichardsD.,etal.Developingguidedself-helpfordepressionusingthe
MedicalResearchCouncilcomplexinterventionsframework:adescriptionofthemodelling
phaseandresultsofanexploratoryrandomisedcontrolledtrial.BMCPsychiatry,2008.8(1):p.91.
557. JuliousS.A.Samplesizeof12pergroupruleofthumbforapilotstudy.PharmStat,2005.4(4):p.287-291.
558. TorgersonD.J.andRobertsC.Randomisationmethods:concealment.BMJ,1999.319(7206):p.375-376.
559. KahanB.C.,CroS.,DoréC.J.,etal.Reducingbiasinopen-labeltrialswhereblindedoutcome
assessmentisnotfeasible:strategiesfromtworandomisedtrials.Trials,2014.15(1):p.1.560. RatamessN.,AlvarB.,EvetochT.,etal.Progressionmodelsinresistancetrainingforhealthy
adults[ACSMpositionstand].MedSciSportsExerc,2009.41(3):p.687-708.561. ReimanM.P.,BolglaL.A.LoudonJ.K.Aliteraturereviewofstudiesevaluatinggluteusmaximus
andgluteusmediusactivationduringrehabilitationexercises.PhysiotherapyTheoryandPractice,2012.
562. SelkowitzD.M.,BeneckG.J.PowersC.M.Whichexercisestargettheglutealmuscleswhile
minimizingactivationofthetensorfascialata?Electromyographicassessmentusingfine-
wireelectrodes.JournalofOrthopaedic&SportsPhysicalTherapy,2013.43(2):p.54-64.563. ToigoM.andBoutellierU.Newfundamentalresistanceexercisedeterminantsofmolecular
andcellularmuscleadaptations.EuropeanJournalofAppliedPhysiology,2006.97(6):p.643-663.
564. WillyR.W.andDavisI.S.Theeffectofahip-strengtheningprogramonmechanicsduring
runningandduringasingle-legsquat.JournalofOrthopaedic&SportsPhysicalTherapy,2011.41(9):p.625-632.
565. KraemerW.J.andRatamessN.A.Fundamentalsofresistancetraining:progressionand
exerciseprescription.MedicineandScienceinSportsandExercise,2004.36(4):p.674-688.
276
References
566. DayM.L.,McGuiganM.R.,BriceG.,etal.Monitoringexerciseintensityduringresistance
trainingusingthesessionRPEscale.JournalofStrengthandConditioningResearch,2004.18(2):p.353-358.
567. WaryaszG.R.andMcDermottA.Y.Patellofemoralpainsyndrome(PFPS):asystematicreview
ofanatomyandpotentialriskfactors.DynamicMedicine,2008.7(1):p.9.568. MedicineA.C.o.S.ACSM'sguidelinesforexercisetestingandprescription.2013:Lippincott
Williams&Wilkins.569. BuggeC.,WilliamsB.,HagenS.,etal.AprocessforDecision-makingafterPilotandfeasibility
Trials(ADePT):developmentfollowingafeasibilitystudyofacomplexinterventionforpelvic
organprolapse.Trials,2013.14(1):p.1.570. ShanyindeM.,PickeringR.M.WeatherallM.Questionsaskedandansweredinpilotand
feasibilityrandomizedcontrolledtrials.BMCMedicalResearchMethodology,2011.11(1):p.1.
571. ThabaneL.,MaJ.,ChuR.,etal.Atutorialonpilotstudies:thewhat,whyandhow.BMCMedicalResearchMethodology,2010.10(1):p.1.
572. RushtonA.,CalvertM.,WrightC.,etal.Physiotherapytrialsforthe21stcentury–timetoraise
thebar?JournaloftheRoyalSocietyofMedicine,2011.104(11):p.437-441.573. DworkinR.H.,TurkD.C.,FarrarJ.T.,etal.Coreoutcomemeasuresforchronicpainclinical
trials:IMMPACTrecommendations.Pain,2005.113(1-2):p.9-19.574. SmithG.D.andEbrahimS.Datadredging,bias,orconfounding.BMJ,2002.325(7378):p.
1437-1438.575. BartonC.J.,LevingerP.,CrossleyK.M.,etal.Therelationshipbetweenrearfoot,tibialandhip
kinematicsinindividualswithpatellofemoralpainsyndrome.ClinBiomech(Bristol,Avon),2012.27(7):p.702-5.
576. SalaffiF.,StancatiA.,SilvestriC.A.,etal.Minimalclinicallyimportantchangesinchronic
musculoskeletalpainintensitymeasuredonanumericalratingscale.EuropeanJournalofPain(London,England),2004.8(4):p.283-291.
577. CrossleyK.M.,BennellK.L.,CowanS.M.,etal.Analysisofoutcomemeasuresforpersonswith
patellofemoralpain:whicharereliableandvalid?ArchivesofPhysicalMedicineandRehabilitation,2004.85(5):p.815-822.
578. McLeanS.M.,BurtonM.,BradleyL.,etal.Interventionsforenhancingadherencewithphysiotherapy:asystematicreview.ManualTherapy,2010.15(6):p.514-521.
579. PeekK.,Sanson-FisherR.,MackenzieL.,etal.Interventionstoaidpatientadherencetophysiotherapistprescribedself-managementstrategies:asystematicreview.Physiotherapy,2016.102(2):p.127-135.
580. RathleffM.S.,BandholmT.,McGirrK.A.,etal.Newexercise-integratedtechnologycanmonitorthedosageandqualityofexerciseperformedagainstanelasticresistancebandby
adolescentswithpatellofemoralpain:anobservationalstudy.JournalofPhysiotherapy,2016.62(3):p.159-163.
581. KoltG.S.,BrewerB.W.,PizzariT.,etal.TheSportInjuryRehabilitationAdherenceScale:areliablescaleforuseinclinicalphysiotherapy.Physiotherapy,2007.93(1):p.17-22.
582. SmithR.andLeeT.Motorcontrolandlearning:abehaviouralemphasis.Champaign:HumanKinetics,1998.
583. GeworskiL.,KnoopB.O.,deWitM.,etal.Multicentercomparisonofcalibrationandcross
calibrationofPETscanners.JournalofNuclearMedicine,2002.43(5):p.635-639.584. PatrekM.F.,KernozekT.W.,WillsonJ.D.,etal.Hip-abductorfatigueandsingle-leglanding
mechanicsinwomenathletes.JournalofAthleticTraining,2011.46(1):p.31-42.
277
References
585. Bazett-JonesD.M.,CobbS.C.,JoshiM.N.,etal.Normalizinghipmusclestrength:establishing
body-size-independentmeasurements.ArchivesofPhysicalMedicineandRehabilitation,2011.92(1):p.76-82.
586. JaricS.Musclestrengthtesting.SportsMedicine,2002.32(10):p.615-631.587. KaranicolasP.J.Practicaltipsforsurgicalresearch:blinding:who,what,when,why,how?
CanadianJournalofSurgery,2010.53(5):p.345.588. LoweC.M.,WilsonM.,SackleyC.,etal.Blindoutcomeassessment:thedevelopmentanduse
ofprocedurestomaintainanddescribeblindinginapragmaticphysiotherapyrehabilitation
trial.ClinicalRehabilitation,2011.25(3):p.264-274.589. SmeltA.F.,vanderWeeleG.M.,BlomJ.W.,etal.Howusualisusualcareinpragmatic
interventionstudiesinprimarycare?Anoverviewofrecenttrials.BrJGenPract,2010.60(576):p.e305-e318.
590. vanderHeijdenR.A.,deKanterJ.L.,Bierma-ZeinstraS.M.,etal.StructuralAbnormalitieson
MagneticResonanceImaginginPatientsWithPatellofemoralPainACross-sectionalCase-
ControlStudy.TheAmericanJournalofSportsMedicine,2016:p.0363546516646107.591. KangS.,ParkJ.,KangS.B.,etal.MRIfindingsofyoungmalesoldierswithatraumaticanterior
kneepain.ScandinavianJournalofMedicine&ScienceinSports,2015.592. MaclachlanL.R.,CollinsN.J.,MatthewsM.L.,etal.Thepsychologicalfeaturesof
patellofemoralpain:asystematicreview.BrJSportsMed,2017:p.bjsports-2016-096705.593. HartH.F.,BartonC.J.,KhanK.M.,etal.Isbodymassindexassociatedwithpatellofemoralpain
andpatellofemoralosteoarthritis?Asystematicreviewandmeta-regressionandanalysis.BritishJournalofSportsMedicine,2016:p.bjsports-2016-096768.
594. ChristensenR.,BartelsE.M.,AstrupA.,etal.Effectofweightreductioninobesepatientsdiagnosedwithkneeosteoarthritis:asystematicreviewandmeta-analysis.AnnalsoftheRheumaticDiseases,2007.66(4):p.433-439.
595. BartonC.ManagingRISKwhentreatingtheinjuredrunnerwithrunningretraining,load
managementandexercisetherapy.PhysicalTherapyinSport:officialjournaloftheAssociationofCharteredPhysiotherapistsinSportsMedicine,2017.
596. KeaysS.L.,MasonM.NewcombeP.A.Three-YearOutcomeAftera1-MonthPhysiotherapy
ProgramofLocalandIndividualizedGlobalTreatmentforPatellofemoralPainFollowedby
Self-Management.ClinicalJournalofSportMedicine,2016.26(3):p.190-198.597. EgbewaleB.E.Statisticalissuesinrandomisedcontrolledtrials:anarrativesynthesis.Asian
PacificJournalofTropicalBiomedicine,2015.5(5):p.354-359.598. MølgaardC.M.,RathleffM.S.,AndreasenJ.,etal.Footexercisesandfootorthosesaremore
effectivethankneefocusedexercisesinindividualswithpatellofemoralpain.JournalofScienceandMedicineinSport,2017.
599. deBoerM.R.,WaterlanderW.E.,KuijperL.D.,etal.Testingforbaselinedifferencesinrandomizedcontrolledtrials:anunhealthyresearchbehaviorthatishardtoeradicate.InternationalJournalofBehavioralNutritionandPhysicalActivity,2015.12(1):p.4.
600. PatsopoulosN.A.Apragmaticviewonpragmatictrials.DialoguesinClinicalNeuroscience,2011.13(2):p.217.
601. HannaK.M.,ScottL.L.SchmidtK.K.Retentionstrategiesinlongitudinalstudieswithemerging
adults.ClinicalNurseSpecialistCNS,2014.28(1):p.41.602. EmeryC.A.Consideringclusteranalysisinsportmedicineandinjurypreventionresearch.
ClinicalJournalofSportMedicine,2007.17(3):p.211-214.603. JinJ.,SklarG.E.,OhV.M.S.,etal.Factorsaffectingtherapeuticcompliance:Areviewfromthe
patient'sperspective.TherapeuticsandClinicalRiskManagement,2008.4(1):p.269.
278
References
604. BenoitD.L.,RamseyD.K.,LamontagneM.,etal.Effectofskinmovementartifactonknee
kinematicsduringgaitandcuttingmotionsmeasuredinvivo.Gait&Posture,2006.24(2):p.152-164.
605. BorhaniM.,McGregorA.H.BullA.M.Analternativetechnicalmarkersetforthepelvisismore
repeatablethanthestandardpelvicmarkerset.Gait&Posture,2013.38(4):p.1032-1037.606. SinclairJ.,TaylorP.J.,GreenhalghA.,etal.Thetest-retestreliabilityofanatomicalco-ordinate
axesdefinitionforthequantificationoflowerextremitykinematicsduringrunning.JournalofHumanKinetics,2012.35(1):p.15-25.
607. McGinleyJ.L.,BakerR.,WolfeR.,etal.Thereliabilityofthree-dimensionalkinematicgait
measurements:asystematicreview.Gait&Posture,2009.29(3):p.360-369.608. HartH.F.,StefanikJ.J.,WyndowN.,etal.TheprevalenceofradiographicandMRI-defined
patellofemoralosteoarthritisandstructuralpathology:asystematicreviewandmeta-
analysis.BrJSportsMed,2017:p.bjsports-2017-097515.609. ConchieH.,ClarkD.,MetcalfeA.,etal.Adolescentkneepainandpatellardislocationsare
associatedwithpatellofemoralosteoarthritisinadulthood:Acasecontrolstudy.TheKnee,2016.
610. ChuC.R.,WilliamsA.A.,CoyleC.H.,etal.Earlydiagnosistoenableearlytreatmentofpre-
osteoarthritis.ArthritisResearch&Therapy,2012.14(3):p.1.611. NoehrenB.,ShupingL.,JonesA.,etal.SomatosensoryandBiomechanicalAbnormalitiesin
FemaleswithPatellofemoralPain.TheClinicalJournalofPain,2015.612. PazzinattoM.F.,deOliveiraSilvaD.,BartonC.,etal.Femaleadultswithpatellofemoralpain
arecharacterizedbywidespreadhyperalgesia,whichisnotaffectedimmediatelyby
patellofemoraljointloading.PainMedicine,2016:p.pnw068.613. PazzinattoM.F.,deOliveiraSilvaD.,PradelaJ.,etal.Localandwidespreadhyperalgesiain
femalerunnerswithpatellofemoralpainareinfluencedbyrunningvolume.JournalofScienceandMedicineinSport,2017.20(4):p.362-367.
614. RathleffM.S.,RoosE.M.,OlesenJ.L.,etal.Self-reportedRecoveryisAssociatedWith
ImprovementinLocalizedHyperalgesiaAmongAdolescentFemalesWithPatellofemoral
Pain:ResultsFromaClusterRandomizedTrial.TheClinicalJournalofPain,2016.32(5):p.428-434.
615. vanderHeijdenR.A.,RijndertseM.M.,Bierma-ZeinstraS.,etal.LowerPressurePainThresholdsinPatellofemoralPainPatients,EspeciallyinFemalePatients:ACross-Sectional
Case-ControlStudy.PainMedicine(Malden,Mass.),2017.616. RobertsonC.J.,HurleyM.JonesF.People'sbeliefsaboutthemeaningofcrepitusin
patellofemoralpainandtheimpactofthesebeliefsontheirbehaviour:Aqualitativestudy.MusculoskeletalScienceandPractice,2017.
617. RunhaarJ.,LuijsterburgP.,DekkerJ.,etal.Identifyingpotentialworkingmechanismsbehind
thepositiveeffectsofexercisetherapyonpainandfunctioninosteoarthritis;asystematic
review.OsteoarthritisandCartilage,2015.23(7):p.1071-1082.618. NunesG.S.,BartonC.J.SerrãoF.V.Hiprateofforcedevelopmentandstrengthareimpairedin
femaleswithpatellofemoralpainwithoutsignsofalteredgluteusmediusandmaximus
morphology.JournalofScienceandMedicineinSport,2017.