Embed Size (px)
Citation preview

Pc
Sa
Db
a
ARR1A
KWCDAABE
1
accoHs
s(iasb
0d
Industrial Crops and Products 31 (2010) 321–326
Contents lists available at ScienceDirect
Industrial Crops and Products
journa l homepage: www.e lsev ier .com/ locate / indcrop
rediction of the degradability and ash content of wheat straw from differentultivars using near infrared spectroscopy
ander Bruuna,∗, Jacob Wagner Jensena, Jakob Magida, Jane Lindedama, Søren Balling Engelsenb
Plant and Soil Science Laboratory, Department of Agriculture and Ecology, Faculty of Life Sciences, University of Copenhagen, Thorvaldsensvej 40,K-1871 Frederiksberg C, DenmarkQuality and Technology, Department of Food Science, Faculty of Life Sciences, University of Copenhagen, Rolighedsvej 30, DK-1958 Frederiksberg C, Denmark
r t i c l e i n f o
rticle history:eceived 25 August 2009eceived in revised form8 November 2009ccepted 21 November 2009
eywords:heat straw
ultivarsegradability
a b s t r a c t
Degradability of straw is important in connection with the fermentation process for bioethanol produc-tion, while the ash content is important for its suitability for incineration. Therefore, a fast method forassessment of straw quality could be very useful in determining the price and in helping choose betweendifferent applications for specific straw batches, such as fermentation for ethanol production, inciner-ation or animal feed. This study investigated the ability of near infrared (NIR) spectroscopy to predictthe degradability and ash content of 106 cultivars of wheat straw grown at two different sites. In gen-eral, calibrations based on NIR spectra recorded on air-dried samples performed better than those onoven-dried samples. A partial least squares (PLS) calibration based on the spectra of the air-dried sam-ples predicted degradability with r2 = 0.72 and RMSECV = 1.4% with 3 components using samples fromthe two different sites. The ash content was well predicted with r2 = 0.99 and RMSECV = 0.195% using a
sh contentnimal feedioenergyFOS
complex 15-component PLS model validated using repeated random segmented cross-validation. How-ever, this model proved to be sensitive to site in a validation using the two sites as segments, wherethe accuracy of ash content prediction decreased to r2 = 0.91 and RMSECV = 0.691% using a 9-componentPLS model. NIR spectroscopy proved useful for predicting degradability and ash content of wheat strawfrom different wheat cultivars. However, when developing predictive models of ash content based onNIR spectra, it should be ensured that the models are transferable to locations other than those used for
model calibration.. Introduction
During recent decades, biomass has increasingly been seen asresource that can replace fossil fuels in the energy sector and
hemical industry. Wheat (Triticum aestivum L.) is one of the majorrops in the world, resulting in the production of large amountsf wheat straw, which can potentially be used for these purposes.owever, there are also a number of traditional uses of cereal straw,
uch as animal feed and bedding.There are large differences in degradability between wheat
traw produced at different locations and from different cultivarsKernan et al., 1984; Tan et al., 1995; Jensen et al., submitted). Thiss important both in terms of the value of the straw as a feedstuff
nd for some of the biological processes for bio-fuel production,uch as enzymatic saccharification and fermentation to produceioethanol.∗ Corresponding author. Tel.: +45 35333481; fax: +45 35333460.E-mail address: [email protected] (S. Bruun).
926-6690/$ – see front matter © 2009 Elsevier B.V. All rights reserved.oi:10.1016/j.indcrop.2009.11.011
© 2009 Elsevier B.V. All rights reserved.
A range of different degradability assays have been developedto assess different aspects of degradability of different organicmatter samples. These assays are designed to assess degradabilityunder standardised conditions so that the results can be comparedbetween laboratories, but they are expensive and laborious. There-fore, near infrared (NIR) spectroscopy has been suggested as a rapidand non-destructive method to replace these reference methods.For straw from different cultivars of the same crop, calibrationsbetween degradability and NIR spectra have been established formaize stover (Melchinger et al., 1986; Zimmer et al., 1990) and forgrass (Nordheim et al., 2007; Ohlsson et al., 2007), while calibra-tions between NIR spectra and chemical composition have beenestablished for rice straw and maize stover (Pordesimo et al., 2005;Jin and Chen, 2007). For barley, a NIR calibration predicting poten-tial degradability of the straw was presented by Mathison et al.(1999), but to our knowledge no previous attempts have been made
to relate the NIR spectra of straw from different wheat cultivars totheir degradability.The ash content is also important for the usefulness of the straw.A high content of alkali metals associated with the ash causes prob-lems with corrosion, slagging and fouling during incineration and

3 ps and
oewuapafvo
tctae2bc
wtroa
2
2
t9mdog
bsfi
2
ueamabawwwfwtflb
2
s
The straw cultivars exhibited much variation in degradability,as reflected by EFOS values ranging from 25.8% to 40.7% (Table 1).The degradability of the straw from Sejet was higher, with a meanEFOS value of 33.8% compared with 31.6% for Abed. The ash con-
Table 1EFOS values and ash content of 106 cultivars collected at two different experimentalsites, Sejet and Abed. SD: standard deviation; n: number of samples; SDRef: standarddeviation of reference methods based on laboratory replicates.
Sejet (n = 106) Abed (n = 106) Both sites (n = 212)
EFOS (%) Ash (%) EFOS (%) Ash (%) EFOS (%) Ash (%)
22 S. Bruun et al. / Industrial Cro
ther processes for energy extraction from the straw (Michelsent al., 1998). After incineration, the ash can serve as a fertilizer,hereas it may constitute a waste product for disposal if it containsndesirable elements (Mozaffari et al., 2000). NIR spectroscopy haslready proven its potential for determination of the ash content oflant materials (Vázquez de Aldana et al., 1996; Ruano-Ramos etl., 1999) and animal feeds (Dahl et al., 2000). A similar calibrationor rapid determination of the ash content of wheat straw could beery useful for determination of the quality and the potential usef the straw.
After straw has been collected in the field and stored, it still con-ains some water depending on the weather, storage conditions andharacteristics of the straw. The water bands found in the NIR spec-ra are a composite of the different hydrogen-bonded subspeciesnd therefore the degree of hydrogen bonding influences the appar-nt position of the water bands in the NIR spectrum (Shenk et al.,001). Oven-drying the samples before NIR analysis may thereforee advantageous because it reduces and ideally equalises the waterontent of the samples.
The main objective of the current paper was to investigatehether NIR spectroscopy can be used as a fast and cheap method
o assess the degradability and ash content of straw from a wideange of current Northern European wheat cultivars. A secondarybjective was to test whether oven-drying the straw before NIRnalysis improved the calibrations compared with air-drying.
. Materials and methods
.1. Collection of straw
Wheat straw was collected straw from 106 cultivars atwo different sites near the towns of Sejet (55◦49′12.43′′N and◦55′21.82′′E) and Abed (54◦49′40.05′′N and 11◦19′30.62′′E) in Den-ark. Both sites are part of a series of official field trials comparing
ifferent cultivars of winter wheat. The cultivars included a rangef different commonly grown and new cultivars adapted to therowing conditions of north-west Europe.
Approximately 80 g of straw DM were sampled from each ploty taking four to five handfuls from different places in the plots. Thetraw was ground on a cyclone mill (President, Holbæk, Denmark)tted with a 1 mm screen.
.2. EFOS assay
Degradability of the straw was assessed with the EFOS assay,sing a modified version of the method described by de Boevert al. (1986). The assay was carried out as described by Weisbjergnd Hvelplund (1993) but modified by replacing the original Gam-anase and Novozym 188 with Novozym 51454. A subsample of
pproximately 0.5 g of each of the milled straw samples was incu-ated in a filter crucible with 30 ml pepsin–HCl solution for 24 h in40 ◦C water bath. The crucibles were then transferred to an 80 ◦Cater bath and incubated for 45 min. After this, the samples wereashed twice with 20 ml of de-mineralised water and incubatedith 30 ml of enzyme acetate buffer at 40 ◦C for 24 h and at 60 ◦C
or 19 h. After the last incubation the samples were washed twiceith 20 ml of boiling water and twice with 20 ml of acetone. Finally,
he crucible was dried at 103 ◦C for 12 h, weighed, ashed at 525 ◦Cor 6 h and weighed. The soluble fraction was determined as theoss of dry weight in the material divided by the dry weight at theeginning corrected for ash content.
.3. NIR spectroscopy
Two sets of subsamples were taken from each of the milled strawamples. One set was not dried any further (i.e. air-dried), while the
Products 31 (2010) 321–326
other was oven-dried at 80 ◦C. The air-dried samples contained onaverage 6.16% (w/w) water with a standard deviation of 0.75%.
Spectra of all samples were recorded on a NIRSystem 6500(FOSS Tecator, Copenhagen, Denmark) spectrometer running inreflectance mode. The spectral range of the instrument is from 400to 2500 nm at 2 nm intervals. The spectrophotometer uses a splitdetector system with a silicon detector between 400 and 1100 nmand a lead sulphide (PbS) detector from 1100 to 2500 nm. It uses atungsten halogen lamp and has an internal ceramic standard. Thelight falls on the sample at an angle of 90◦ and here the NIR/VISspectra were measured in reflectance mode at an angle of 45◦. TheNIR/VIS reflection spectra were recorded using a rotating 36 mmØ sample cup with a quartz window. Sixteen spectra collectedfrom different sections of the cup were averaged and convertedto log10(R−1) units.
2.4. NIR calibration
In order to explore the variation in the spectroscopic data, aprincipal component analysis (PCA) was carried out. Subsequently,partial least square (PLS) regressions predicting the ash content andEFOS values from the NIR spectra of both the air-dried and oven-dried samples were performed using the LatentiX software (version2.0, Latent5, Copenhagen, Denmark, www.latentix.com). For thecurrent samples, the visible range from 400 to 1100 nm appearednoisy and only the spectral range from 1100 to 2500 nm was usedfor all calibrations. A range of different methods for transform-ing the spectra were tested, including multiple scatter correction(Martens et al., 1983), standard normal variate (Barnes et al., 1989),Extended Inverse Multiplicative Signal Correction (Martens et al.,2003) and second order Savitzky–Golay derivatives (Savitzky andGolay, 1964). Different levels of smoothening using moving averageand larger segment and gap sizes of the Savitzky–Golay derivativeswere also tested.
All PLS models were validated using two different cross-validation schemes: repeated random cross-validation (RRCV)using 5 segments and 20 drawings, and site-segmented cross-validation (SSCV) using two segments defined by the two growingsites. The latter validation scheme was applied in order to assess thetransferability of the calibration models from one site to another.The validation was used to determine the optimal number of com-ponents to be included in the PLS model and assessed the qualityof the calibrations. Only validated performances of PCA and PLSare reported and PLS performance are given in the fraction of theexplained variance (r2) and the root mean square error of cross-validation (RMSECV).
3. Results and discussion
Mean 33.8 7.06 31.6 4.20 32.7 5.63SD 2.4 1.01 2.6 0.40 2.7 1.63Min 29.1 5.58 25.8 3.08 25.8 3.08Max 40.7 11.42 38.1 5.30 40.7 11.42SDRef 0.56 0.0882

S. Bruun et al. / Industrial Crops and Products 31 (2010) 321–326 323
Fa
tchpti
airwtTadtcC
sswltts
Fft
ig. 1. Plot of ash content versus degradability as assessed by the reference EFOSssay of the samples from Sejet (open circles) and Abed (closed circles).
ent was significantly higher at Sejet, with a mean value of 7.06%ompared with 4.20% at Abed. In particular, five samples at Sejetad high ash content (all values above 9%). Fig. 1 shows a scatterlot of ash versus degradability, which revealed no strong correla-ion. However the difference in ash content between the two sitess evident.
The average spectra recorded on air-dried samples from Sejetnd Abed are shown in Fig. 2. There was only a significant offsetn the spectra from the two growing sites in the shortwave NIRegion. The first overtone of water and hydroxyl groups from cellall polysaccharides is situated around 1450 nm, but this is hard
o discern as a difference between the two average spectra in Fig. 2.he first overtone of the C–H stretches, which reside between 1600nd 1800 nm, could be indicative of dry matter content but here too,ifferences were difficult to discern by visual inspection. Howeverhe different spectra revealed some structure in this region. In theombination tone region from 1900 to 2500 nm in particular, the–H stretching region near 2350 nm displayed significant structure.
The PCA score-plot of the NIR spectra is displayed in Fig. 3. Thecore-plot, which is plotted as a function of PC1 and PC2, repre-ented 96% of the total variation in the data set. The sample setas obviously quite homogeneous and only a few samples to the
eft can be characterised as extreme. These samples proved to behose with very high ash content and it was decided to retainhese samples throughout the data analysis. Finally, the score-plothows that the two sites which were non-overlapping in ash con-
ig. 2. Average log(R−1) transformed reflectance spectra of wheat straw cultivarsrom Sejet (dashed line) and Abed (full line) and difference spectrum between thewo sites (dotted line).
Fig. 3. Score-plot showing the first two principal components of the NIR spectrarecorded on 212 samples of wheat straw from the two sites Sejet (open circles) andAbed (closed circles).
tent in the spectroscopic data tended to be segregated, but notentirely.
During the development of the PLS regressions predicting theash content and degradability from the NIR spectra, no samplesseemed to have an unduly high influence on the model so nooutliers was removed from the calibration set. Smoothing progres-sively decreased model performance and therefore only the resultsof the calibrations using a minimum of smoothening are reported.All efforts to simplify the models and to select the most impor-tant intervals through interval PLS (Nørgaard et al., 2000) provedunfruitful, so only the complex but very consistent full spectral NIRPLS calibrations are reported. The calibrations developed to predictthe degradability and ash content of the straw samples were gener-ally better when they were based on air-dried samples rather thanoven-dried and thus only the results of air-dried calibrations arereported.
The resulting calibrations predicting the ash and EFOS values areshown in Table 2, which also compares the different pre-processingmethods of the NIR spectra, as well as the two different validationmethods. Most interestingly, Table 2 shows that the PLS calibra-tions based on the raw spectra were practically as good as thepre-transformed models. The model complexity was quite large,using up to 21 PLS components for the ash prediction and 9 forthe EFOS prediction. In fact the different pre-processing methodsMSC, SNV and EISC did not significantly improve calibration perfor-mance or model complexity and only the second derivative spectraprovided an improvement in model performance, in particular areduction in model complexity. For ash, the model performancewas slightly improved with a 15 PLS component model comparedwith the 21-component raw model. For the EFOS calibration a sim-ilar pattern was observed, but in this case only the model simplicitywas improved, with the number of PLS components being reducedto three.
For the EFOS predictions, we observed very little differencebetween the two validation methods (RRCV and SSCV), which isindicative of a robust and transferable model. The EFOS calibra-tion model based on second derivate spectra and SSCV used only3 PLS and predicted 0.72 of the variance in the EFOS values withRMSECV = 1.4%. This RMSECV value has to be compared with thestandard deviation of the reference method based on the laboratoryreplicates of 0.56% (Table 1), so the uncertainty of the NIR estimates
was 2.5 times that of the reference method. The results of the vali-dation are shown in the predicted versus measured plot in Fig. 4a,which is very representative of all the EFOS models. Despite thelow model complexity, the PLS loadings shown in Fig. 4b reveal
324 S. Bruun et al. / Industrial Crops and
Table 2Results of the cross-validation of PLS regressions used to predict the ash and thedegradability of straw (EFOS) from NIR spectra of air-dried samples using differ-ent pre-processings of the spectra. The two different cross-validation schemes are:repeated random cross-validation (RRCV) using 5 segments and 20 drawings, andsite-segmented cross-validation (SSCV) using two segments defined by the twogrowing sites. MSC is multiplicative signal correction, SNV is standard normal vari-ate, EISC is extended inverse multiplicative signal correction and NIR 2nd is secondderivative spectra using a segment size of 5 and a gap of 3.
Ash (%) EFOS (%)
RRCVa SSCV RRCVa SSCV
NIR RAW#PC 21 13 9 9r2 0.9835 0.9076 0.7665 0.7227RMSECV 0.2083 0.8411 1.314 1.498
NIR MSC#PC 24 10 7 8r2 0.9866 0.8735 0.7567 0.7058RMSECV 0.1883 0.8888 1.342 1.476
NIR SNV#PC 25 12 7 8r2 0.9870 0.9232 0.7483 0.7247RMSECV 0.1852 0.7834 1.367 1.443
NIR EISC#PC 23 26 9 7r2 0.9867 0.9109 0.7675 0.7272RMSECV 0.1873 0.7491 1.313 1.616
NIR 2nd#PC 15 9 5 3r2 0.9856 0.9135 0.7560 0.7322RMSECV 0.1945 0.6911 1.343 1.419
r
astpMl(maNaRoabtt
sslphadBtapTosa
reference method. However, although the performance of the SSCV-validated model appeared poorer than that of the RRCV-validatedmodel, the SSCV model may predict new samples from a third sitebetter.
Fig. 4. (a) Comparison of predicted and measured values of straw degradabilityof 212 samples of straw as assessed by the EFOS assay with the regression modelselected as the best. The straw came from two different sites, Sejet (open circles)
a Numbers in this column for r2 and RMSECV are average values for the 20 randomepeats.
quite complex pattern of underlying features and indicate thatmall shifts in the spectra are important. This was also confirmed byhe fact that more smoothing progressively deteriorated the modelerformance. In comparison with our r2 = 0.72 and RMSECV = 1.4%,athison et al. (1999) predicted potential degradability of bar-
ey straw and achieved r2 = 0.69 and standard error of predictionSEP) = 3.64%, while Zimmer et al. (1990) assessed degradability of
aize stover by an in vitro digestible organic matter assay and wasble to predict these values with r2 = 0.88 and SEP = 2.24% from theIR spectra. Ohlsson et al. (2007) developed a calibration of degrad-bility of different cultivars and species of grass with r2 = 0.92 andMSECV = 1.8%. Finally, Bruun et al. (2005) predicted degradabilityf a wide range of different crops residues in soil with r2 = 0.958nd SEP = 5.44%. The calibrations presented here had poorer r2 andetter SEP/RMSECV than in most of those studies, reflecting the facthat the variation in degradability of the calibration set was lowerhan in most of those studies.
The reason for the higher predictability with the air-driedamples may be that oven-drying was unable to equalise theamples with respect to water content, or there may have beenosses of volatiles and some nitrogenous compounds. In com-arison, silages are usually analysed after drying because of theigh water content of these forages, but to reduce the workssociated with sample preparation, a number of authors haveeveloped satisfactory calibrations on wet samples (Reeves andlosser, 1991; Park et al., 1998). Liu and Han (2006) comparedhe ability of NIR to predict the chemical composition of driednd non-dried samples of straw silage and found that dried sam-les performed better for most variables except volatile substances.
he reason why we did not observe the same improvement uponven-drying may be because the water content of our air-driedamples (mean 6.16%, standard deviation 0.75%) was already lownd less variable before oven-drying than that of the silage sam-Products 31 (2010) 321–326
ples used by Liu and Han (2006) (mean 25.6%, standard deviation6.1%).
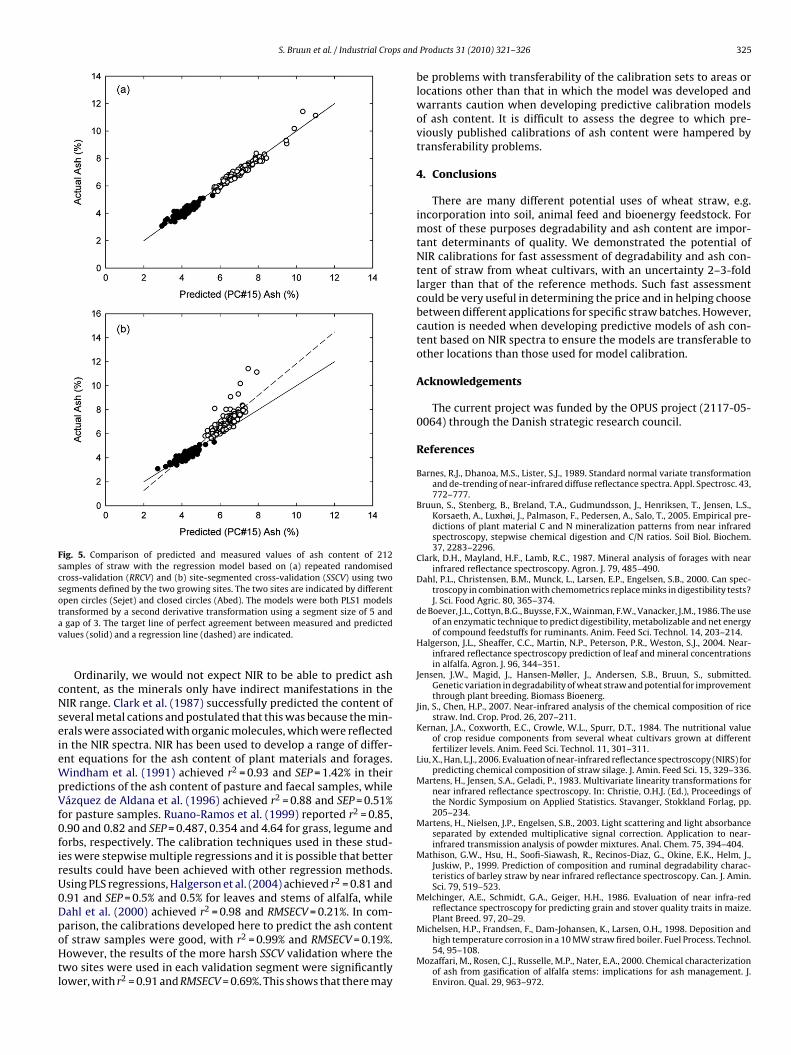
The best prediction of the ash content based on RRCV validationwas the calibration using the second derivative spectrum, whichresulted in r2 = 0.99 and RMSECV = 0.195% using 15 components(Table 2). The predictions of the model are shown in Fig. 5a. Thestandard deviation of difference based on the laboratory replicateswas 0.0882%, so the uncertainty of the NIR estimates was 2.2-foldgreater than that of the reference method. Curiously, for the ashpredictions we observed a large difference in the calibration per-formance between the two different validation methods, RRCV andSSCV. Irrespective of pre-transformation method, the RMSECV was3–5-fold greater when using the site SSCV validation. This indicatesthat there are problems with the transfer of the RRCV-based cal-ibration models from site to site and therefore also outside thecalibration set. The predictions of the calibration model based onSSCV validation are shown in Fig. 5b. The SSCV model predicted0.913 of the variance in the ash values with RMSECV = 0.69%. Sincethe standard deviation for the reference method was 0.0882%, theuncertainty of this calibration was 7.8-fold greater than that of the
and Abed (closed circles). The model was a PLS1 model transformed by a secondderivative transformation using a segment size of 5 and a gap of 3. The target lineof perfect agreement between measured and predicted values (solid) and a regres-sion line (dashed) are indicated; (b) scores of the PLS component 1 (full line) PLScomponent 2 (dashed) and PLS component 3 (dotted) used in the PLS regression.
S. Bruun et al. / Industrial Crops and
Fig. 5. Comparison of predicted and measured values of ash content of 212samples of straw with the regression model based on (a) repeated randomisedcross-validation (RRCV) and (b) site-segmented cross-validation (SSCV) using twosegments defined by the two growing sites. The two sites are indicated by differentopen circles (Sejet) and closed circles (Abed). The models were both PLS1 modelstav
cNseieWpVf0firU0DpoHtl
Michelsen, H.P., Frandsen, F., Dam-Johansen, K., Larsen, O.H., 1998. Deposition and
ransformed by a second derivative transformation using a segment size of 5 andgap of 3. The target line of perfect agreement between measured and predicted
alues (solid) and a regression line (dashed) are indicated.
Ordinarily, we would not expect NIR to be able to predict ashontent, as the minerals only have indirect manifestations in theIR range. Clark et al. (1987) successfully predicted the content of
everal metal cations and postulated that this was because the min-rals were associated with organic molecules, which were reflectedn the NIR spectra. NIR has been used to develop a range of differ-nt equations for the ash content of plant materials and forages.indham et al. (1991) achieved r2 = 0.93 and SEP = 1.42% in their
redictions of the ash content of pasture and faecal samples, whileázquez de Aldana et al. (1996) achieved r2 = 0.88 and SEP = 0.51%
or pasture samples. Ruano-Ramos et al. (1999) reported r2 = 0.85,.90 and 0.82 and SEP = 0.487, 0.354 and 4.64 for grass, legume andorbs, respectively. The calibration techniques used in these stud-es were stepwise multiple regressions and it is possible that betteresults could have been achieved with other regression methods.sing PLS regressions, Halgerson et al. (2004) achieved r2 = 0.81 and.91 and SEP = 0.5% and 0.5% for leaves and stems of alfalfa, whileahl et al. (2000) achieved r2 = 0.98 and RMSECV = 0.21%. In com-arison, the calibrations developed here to predict the ash content
f straw samples were good, with r2 = 0.99% and RMSECV = 0.19%.owever, the results of the more harsh SSCV validation where thewo sites were used in each validation segment were significantlyower, with r2 = 0.91 and RMSECV = 0.69%. This shows that there may
Products 31 (2010) 321–326 325
be problems with transferability of the calibration sets to areas orlocations other than that in which the model was developed andwarrants caution when developing predictive calibration modelsof ash content. It is difficult to assess the degree to which pre-viously published calibrations of ash content were hampered bytransferability problems.
4. Conclusions
There are many different potential uses of wheat straw, e.g.incorporation into soil, animal feed and bioenergy feedstock. Formost of these purposes degradability and ash content are impor-tant determinants of quality. We demonstrated the potential ofNIR calibrations for fast assessment of degradability and ash con-tent of straw from wheat cultivars, with an uncertainty 2–3-foldlarger than that of the reference methods. Such fast assessmentcould be very useful in determining the price and in helping choosebetween different applications for specific straw batches. However,caution is needed when developing predictive models of ash con-tent based on NIR spectra to ensure the models are transferable toother locations than those used for model calibration.
Acknowledgements
The current project was funded by the OPUS project (2117-05-0064) through the Danish strategic research council.
References
Barnes, R.J., Dhanoa, M.S., Lister, S.J., 1989. Standard normal variate transformationand de-trending of near-infrared diffuse reflectance spectra. Appl. Spectrosc. 43,772–777.
Bruun, S., Stenberg, B., Breland, T.A., Gudmundsson, J., Henriksen, T., Jensen, L.S.,Korsaeth, A., Luxhøi, J., Palmason, F., Pedersen, A., Salo, T., 2005. Empirical pre-dictions of plant material C and N mineralization patterns from near infraredspectroscopy, stepwise chemical digestion and C/N ratios. Soil Biol. Biochem.37, 2283–2296.
Clark, D.H., Mayland, H.F., Lamb, R.C., 1987. Mineral analysis of forages with nearinfrared reflectance spectroscopy. Agron. J. 79, 485–490.
Dahl, P.L., Christensen, B.M., Munck, L., Larsen, E.P., Engelsen, S.B., 2000. Can spec-troscopy in combination with chemometrics replace minks in digestibility tests?J. Sci. Food Agric. 80, 365–374.
de Boever, J.L., Cottyn, B.G., Buysse, F.X., Wainman, F.W., Vanacker, J.M., 1986. The useof an enzymatic technique to predict digestibility, metabolizable and net energyof compound feedstuffs for ruminants. Anim. Feed Sci. Technol. 14, 203–214.
Halgerson, J.L., Sheaffer, C.C., Martin, N.P., Peterson, P.R., Weston, S.J., 2004. Near-infrared reflectance spectroscopy prediction of leaf and mineral concentrationsin alfalfa. Agron. J. 96, 344–351.
Jensen, J.W., Magid, J., Hansen-Møller, J., Andersen, S.B., Bruun, S., submitted.Genetic variation in degradability of wheat straw and potential for improvementthrough plant breeding. Biomass Bioenerg.
Jin, S., Chen, H.P., 2007. Near-infrared analysis of the chemical composition of ricestraw. Ind. Crop. Prod. 26, 207–211.
Kernan, J.A., Coxworth, E.C., Crowle, W.L., Spurr, D.T., 1984. The nutritional valueof crop residue components from several wheat cultivars grown at differentfertilizer levels. Anim. Feed Sci. Technol. 11, 301–311.
Liu, X., Han, L.J., 2006. Evaluation of near-infrared reflectance spectroscopy (NIRS) forpredicting chemical composition of straw silage. J. Amin. Feed Sci. 15, 329–336.
Martens, H., Jensen, S.A., Geladi, P., 1983. Multivariate linearity transformations fornear infrared reflectance spectroscopy. In: Christie, O.H.J. (Ed.), Proceedings ofthe Nordic Symposium on Applied Statistics. Stavanger, Stokkland Forlag, pp.205–234.
Martens, H., Nielsen, J.P., Engelsen, S.B., 2003. Light scattering and light absorbanceseparated by extended multiplicative signal correction. Application to near-infrared transmission analysis of powder mixtures. Anal. Chem. 75, 394–404.
Mathison, G.W., Hsu, H., Soofi-Siawash, R., Recinos-Diaz, G., Okine, E.K., Helm, J.,Juskiw, P., 1999. Prediction of composition and ruminal degradability charac-teristics of barley straw by near infrared reflectance spectroscopy. Can. J. Amin.Sci. 79, 519–523.
Melchinger, A.E., Schmidt, G.A., Geiger, H.H., 1986. Evaluation of near infra-redreflectance spectroscopy for predicting grain and stover quality traits in maize.Plant Breed. 97, 20–29.
high temperature corrosion in a 10 MW straw fired boiler. Fuel Process. Technol.54, 95–108.
Mozaffari, M., Rosen, C.J., Russelle, M.P., Nater, E.A., 2000. Chemical characterizationof ash from gasification of alfalfa stems: implications for ash management. J.Environ. Qual. 29, 963–972.

3 ps and
N
N
O
P
P
R
26 S. Bruun et al. / Industrial Cro
ordheim, H., Volden, H., Fystro, G., Lunnan, T., 2007. Prediction of in situ degrada-tion characteristics of neutral detergent fibre (aNDF) in temperate grasses andred clover using near-infrared reflectance spectroscopy (NIRS). Anim. Feed Sci.Technol. 139, 92–108.
ørgaard, L., Saudland, A., Wagner, J., Nielsen, J.P., Munck, L., Engelsen, S.B., 2000.Interval partial least-squares regression (iPLS): a comparative chemometricstudy with an example from near-infrared spectroscopy. Appl. Spectrosc. 54,413–419.
hlsson, C., Houmøller, L.P., Weisbjerg, M.R., Lund, P., Hvelplund, T., 2007. Effectiverumen degradation of dry matter, crude protein and neutral detergent fibre inforage determined by near infrared reflectance spectroscopy. J. Anim. Physiol.Anim. Nutr. 91, 498–507.
ark, R.S., Agnew, R.E., Gordon, F.J., Steen, R.W.J., 1998. The use of near infraredreflectance spectroscopy (NIRS) on undried samples of grass silage to predictchemical composition and digestibility parameters. Anim. Feed Sci. Technol. 72,155–167.
ordesimo, L.O., Hames, B.R., Sokhansanj, S., Edens, W.C., 2005. Variation in cornstover composition and energy content with crop maturity. Biomass Bioenerg.28, 366–374.
eeves, J.B., Blosser, T.H., 1991. Near-infrared spectroscopic analysis of undriedsilages as influenced by sample grind, presentation method, and spectral region.J. Dairy Sci. 74, 882–895.
Products 31 (2010) 321–326
Ruano-Ramos, A., García-Ciudad, A., García-Criado, B., 1999. Determination of nitro-gen and ash contents in total herbage and botanical components of grasslandsystems with near infra-red spectroscopy. J. Sci. Food Agric. 79, 137–143.
Savitzky, A., Golay, M., 1964. Smoothing and differentiation of data by simplifiedleast squares procedures. Anal. Chem. 36, 1627–1639.
Shenk, J.S., Workman, J.J., Westerhaus, M.O., 2001. Application of NIR spectroscopyto agricultural products. In: Burns, D.A., Ciurczak, E.W. (Eds.), Handbook of Near-infrared Analysis. Marcel Dekker, Inc., pp. 419–473.
Tan, Z.L., Chen, H.P., He, L.H., Fang, R.J., Xing, T.X., 1995. Variation in the nutritionalcharacteristics of wheat straw. Anim. Feed Sci. Technol. 53, 337–344.
Vázquez de Aldana, B.R., García-Criado, B., García-Ciudad, A., Pérez-Corona, M.E.,1996. Non-destructive method for determining ash content in pasture samples:application of near infrared reflectance spectroscopy. Commun. Soil Sci. PlantAnal. 27, 795–802.
Weisbjerg, M.R., Hvelplund, T., 1993. Estimation of Net Energy Content (FU) in Feedsfor Cattle. National Institute of Animal Science, Denmark.
Windham, W.R., Hill, N.S., Stuedemann, J.A., 1991. Ash in forage, esophageal, andfecal samples analyzed using near-infrared reflectance spectroscopy. Crop Sci.31, 1345–1349.
Zimmer, E., Gurrath, P.A., Paul, C., Dhillon, B.S., Pollmer, W.G., Klein, D., 1990. Nearinfrared reflectance spectroscopy analysis of digestibility traits of maize stover.Euphytica 48, 73–81.


![[Murray Hollis] Practical Straw Bale Building(Bookos org)](https://img.pdfslide.net/doc/110x75/631325a15cba183dbf06f7fb/murray-hollis-practical-straw-bale-buildingbookos-org.jpg)


