Embed Size (px)
Citation preview
08Environmental Science,Forestry & Wildlife

Proceedings of 22nd Kerala Science Congress
496
Proceedings of 22nd Kerala Science Congress
497
Assessing higher taxon surrogacy in biodiversity monitoring and conservation
P. Mujeeb RahmanDepartment of Forest Entomology, Kerala Forest Research Institute, Peechi 680 653 Thrissur, KeralaE-mail: [email protected]
INTRODUCTION
Soil contains a highly diverse community of organisms with a range of ecological functions (Giller et al., 1997).Out of the 1,500,000 described living species, 23 per cent (i.e. ~360,000) are represented by soil animals (DecaÎnset al., 2006). Landuse change is considered a prime drive of biodiversity change (Sala et al., 2000). Due to theirlimited mobility, soil-dwelling invertebrates are likely to be affected more badly by landuse intensification andhabitat fragmentation compared to those invertebrates that live above-ground (Dupouey et al., 2002). Soilinvertebrates living in and on the ground have proved to be effective in assessing various kinds of human disturbances(Paoletti and Bressan, 1996). But identification at the species level represents a major obstacle to the use ofinvertebrates as indicators (Oliver and Beattie, 1996), however, higher-taxon indicators of soil invertebrates oftenshow a performance similar to that of species-level indicators and thus can be potential surrogates for soil invertebratesin practical conservation. Furthermore, such approach can greatly reduce the money, time and labour for surveys(Balmford et al., 1996). In this study, possibility of investigating soil invertebrates at supra-specific level as anenvironmental indicator of landuse change was examined and validated.
MATERIALS AND METHODS
Study area
The detailed study was conducted in the Karakkode micro-watershed (between 11015íN and 110 27íN; between76017íE and 76024íE) of Chaliyar River in the Kerala part of Nilgiri Biosphere Reserve in India. The study area wasdivided into 200 m x 200 m grid and the grid intersection points were marked using a GPS. In total 15 differentlanduse systems (4 plot for each and 4 replicates) were recognized in the study area, which covered into four mainecosystems namely agricultural, agroforestry, plantation and forest ecosystems.
Soil faunal sampling
For the sampling of soil fauna, protocols suggested by TSBF were followed (Swift and Bignell, 2001). Soil macrofaunawere hand sorted to higher taxonomic resolution and specimens were preserved in alcohol. Three faunal assemblages(ants, earthworms and termites) were identified to species level, in order to test whether fine scale taxonomicresolution of soil fauna community was performing as good as higher taxonomic resolution.
Statistical analysis
A principal component analysis (PCA) and single lineage cluster analyses was conducted to distinguish betweenlanduse systems based on the abundance of the macrofauna. Counts were averaged across plots and replicates togive mean abundance for each land-use. The data collected were expressed as (1) the number of supra-specific taxaper monolith, (2) abundance of each order, and (3) abundance of all macrofauna (the total count of individuals of alltaxa per monolith). The mean number of taxa (e.g. number of orders) per monolith was used as an index of taxonomicrichness. All counts were analysed using generalized linear models (GLMs). Correlation between higher taxonomic
Proceedings of 22nd Kerala Science Congress, 28-31 January 2010, KFRI, Peechi, pp. 497-499© KSCSTE 2010
08-01
Proceedings of 22nd Kerala Science Congress
498
group and number of species of ants, termites and earthworms (cross-taxon correlation) were tested separately inorder to gain information on the consensual change of soil organism at both taxonomic resolutions.
RESULTS AND CONCLUSIONS
Categorizing of landuse systems
The cluster analysis clearly grouped the landuse systems to corresponding ecosystems and there were a cleardemarcation of ecosystems viz., forest ecosystems, agroforestry practices, plantations and annual cropping systems.In the principal component analysis, the first two axes accounted for 60 per cent of the overall variance. Thus thesewere used to create bi-plots, which separated land-use systems based on overall abundance macrofauna.
Variation in richness and abundance of higher taxon with ecosystems
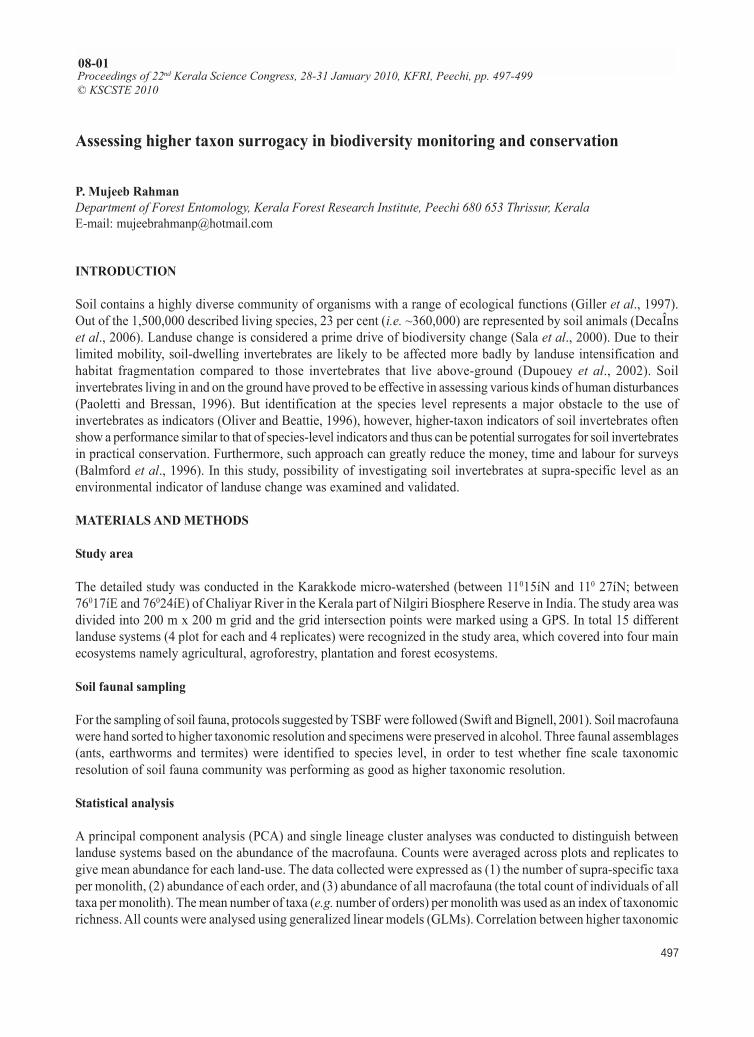
In total, 17 higher taxonomic groups of soil invertebrates were identified from four ecosystems. Taxonomic richness(number of higher taxa per monolith) significantly varied (x2 = 79.1, P<0.0001) across ecosystems (Fig. 1).
The total number of individuals (all taxa combined) per monolith was significantly higher (x2 = 195.4, P<0.0001)in forest ecosystems than all other ecosystems. Annual crop fields had the lowest, while agroforestry practices andplantations were comparable but significantly higher than annual crop fields (Fig. 1). Individual group of macrofaunashow significant variation among ecosystems.
Figure 1. Mean number of higher taxa and total number of all individuals per monolith recorded in various ecosystems. Error bars aremodel-based standard errors of means.
Variation in diversity of ants, termites and earthworms with ecosystems
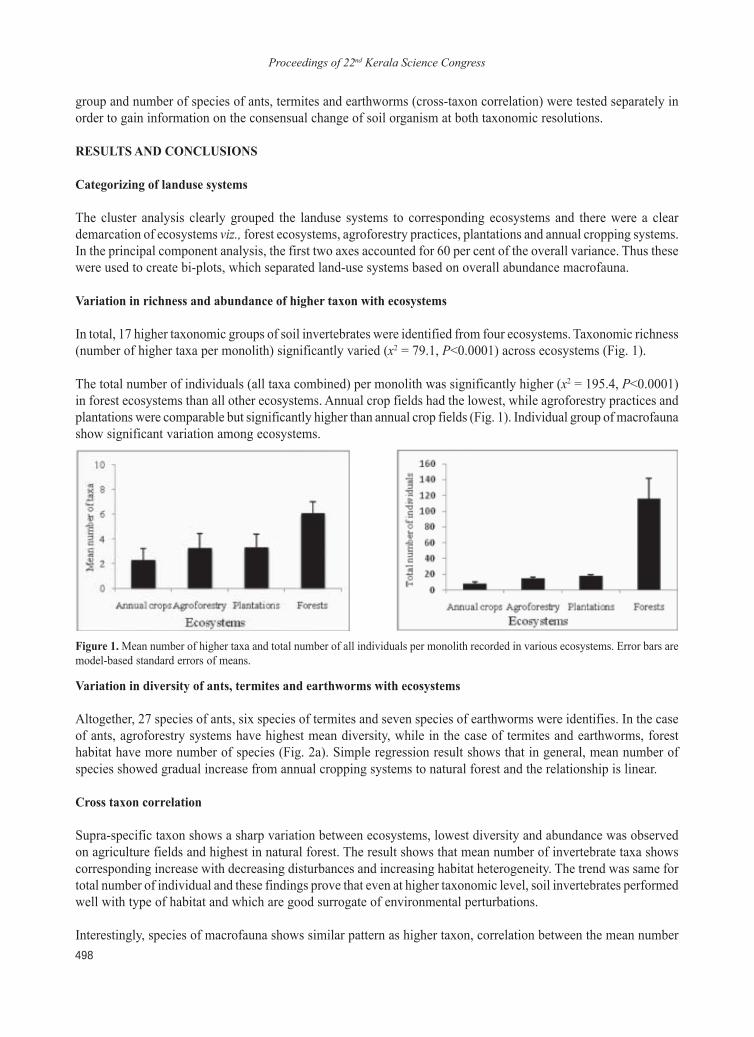
Altogether, 27 species of ants, six species of termites and seven species of earthworms were identifies. In the caseof ants, agroforestry systems have highest mean diversity, while in the case of termites and earthworms, foresthabitat have more number of species (Fig. 2a). Simple regression result shows that in general, mean number ofspecies showed gradual increase from annual cropping systems to natural forest and the relationship is linear.
Cross taxon correlation
Supra-specific taxon shows a sharp variation between ecosystems, lowest diversity and abundance was observedon agriculture fields and highest in natural forest. The result shows that mean number of invertebrate taxa showscorresponding increase with decreasing disturbances and increasing habitat heterogeneity. The trend was same fortotal number of individual and these findings prove that even at higher taxonomic level, soil invertebrates performedwell with type of habitat and which are good surrogate of environmental perturbations.
Interestingly, species of macrofauna shows similar pattern as higher taxon, correlation between the mean number
Proceedings of 22nd Kerala Science Congress
499
of taxa (higher taxonomic order recorded from each habitat) and mean number of species of ants, termites andearthworms shows (Fig. 2b), is positive. These findings gave new highlights that these groups can serve as surrogatefor the diversity of the entire soil macrofauna.
Figure 2. Mean number of species (a) and correlation between higher taxon and each of ants, termites and earthworms (b).
Conservation planning relies fundamentally on spatial information about the distribution of biodiversity (Margulesand Pressey, 2000). Non-availability of adequate data is one of the major limiting factors of conservation planningas most of strategies are developed within short time duration (Prendergast et al., 1999). Conservation planning istherefore necessarily based on those surrogates for which data can be obtained. One very positive implication forconservation planning emerging from this work is that potential higher taxonomic group of soil invertebrates indiscriminating different habitat of varying land management practice. In addition, this implication has been bettersupported by diversity pattern of ìecosystem engineerî fauna, viz., ants, termite and earthworms. This approach isstable in regions where available resources are severely limited.
REFERENCES
Balmford, A., Green, M.J.B. and Murray, M.G. 1996. Using higher-taxon richness as a surrogate for species richness: I. regional tests.Proc. Royal Soc. London, Series B 263: 1267-1274.
DecaÎns, T., JimÈnez, J.J., Gioia, C., Measey, G.J. and Lavelle, P. 2006. The value of soil animals for conservation biology. Eur. J. SoilBiol. 42: 23-38.
Dupouey, J.L., Dambrine, E., Laffite, J.D. and Moares, C. 2002. Irreversible impact of past land use on forest soils and biodiversity.Ecology 83: 2978ñ2984.
Giller, K.E., Beare, M.H., Lavelle, P., Izac, A.M.N. and Swift, M.J. 1997. Agricultural intensification, soil biodiversity and agroecosystemfunction. Appl. Soil Ecol. 6: 3-16.
Margules, C.R. and Pressey, R.L. 2000. Systematic conservation planning. Nature 405: 243-253.Oliver, I. and Beattie, A.J. 1996. Invertebrate morphospecies as surrogates for species: a case study. Conserv. Biol. 10: 99-109.Paoletti, M.G. and Bressan, M. 1996. Soil invertebrates as bioindicators of human disturbance. Cr. Rev. Plant Sci. 15: 21-62.Prendergast, J.R., Quinn, R.M. and Lawton, J.H. 1999. The gaps between theory and practice in selecting nature reserves. Conserv.
Biol. 13: 484-492.Sala, O.E., Chapin, F.S., Armesto, J.J., Berlow, E., Bloomfield, J., Dirzo, R., Huber-Sanwald, E., Huenneke, L.F., Jackson, R.B.,
Kinzig, A., Leemans, R., Lodge, D.M., Mooney, H.A., Oesterheld, M., Poff, N.L., Sykes, M.T., Walker, B.H., Walker, M. and Wall,D.H. 2000. Global biodiversity scenarios for the year 2100. Science 287: 1770-1774.
Swift, M. and Bignell, D. 2001. Standard Methods for Assessment of Soil Biodiversity and Land Use Practice. International Centre forResearch in Agroforestry, Indonesia: 40p.
Proceedings of 22nd Kerala Science Congress
500
Survival response of enteropathogenic Escherichia coli and Salmonella to salinity changesin Kumarakom region of Vembanadu Lake
P. S. Suson, Abhirosh Chandran and A. P. ThomasSchool of Environmental Sciences, Mahatma Gandhi University, Priyadarsini Hills, Kottayam 686 560 Kerala
INTRODUCTION
Vembanad Lake is the largest lake in the state of Kerala that lies 0.6-2.2 m below m.s.l with a permanent connectionwith the Arabian Sea at the barmouth region. Over 1.6 million people live on the banks of the Vembanad Lake andare directly or indirectly dependent on it for their livelihood. The unique characteristic of the Vembanadu Lake isthe construction of a salt water regulator (Thannneermukom barrage) at Thannneermukom region to prevent thesaline incursion from the Arabian Sea. It divides the lake into a freshwater region on the southern part and a salinelagoon on the northern part. As a result, during the closure and opening of the regulator, the water quality on bothregions of the regulator may change in terms of its salinity concentration. Being allochthonous (foreign), how longenteric pathogens could survive in this water is a real public health problem. Therefore the present study has beencarried out to evaluate the survival response of two human pathogenic organisms such as enteropathogenic Escherichiacoli (EPEC) and Salmonella Newport to salinity changes in Kumarakom region of Vembanadu Lake using microcosmexperiments.
MATERIALS AND METHODS
Test microorganisms
Enteropathogenic E. coli, and Samonella Newport isolated (Abhirosh et al., 2008) from the Vembanadu lake wereused for this study.
Preparation of inocula
Washed cell suspension of E. coli/Salmonella at a concentration of 106-9 CFU/ ml was prepared as previouslydescribed by Abhirosh and Hatha (2005). From this final suspension 1 ml was inoculated into 250 ml Erlenmeyerflask with 100 ml test solution.
Survival experiments
Test solutions
Filter sterilised fresh lake water: When Thanneermukkom barrage is closed, the saline intrusion from northern part isprevented and the water on the southern part becomes fresh (0ppt). Therefore, to imitate the actual condition on thesouthern part of the lake, this test solution was used to study the survival of the test organisms at 0 ppt salinity.
Filter sterilised mixed lake water: This test solution was used to study the survival of the test organisms duringmixing of water from northern and southern part of the Vembanadu lake at the time of opening of the barrage.
Survival at different salinity concentration
When Thanneermukkom barrage is closed, the salinity concentration of the Northern part is normally increased
Proceedings of 22nd Kerala Science Congress, 28-31 January 2010, KFRI, Peechi, pp. 500-502© KSCSTE 2010
08-02
Proceedings of 22nd Kerala Science Congress
501
over time due to the saline intrusion from the Arabian Sea and the salinity may vary during different seasons.Therefore, survival experiments were conducted in lake water at different saline concentration such as 5,10,15,20and 25 ppt. The test solutions of desired saline concentrations were prepared using the fresh lake water (0ppt).
Enumeration techniques: Enumeration of bacteria from the test solutions were done after 2, 4, 6, 8, 10, 13, 16, 22,28 and 34 days using spread plate technique on TSA agar plates and the CFU were counted and expressed per ml(Abhirosh and Hatha, 2005).
Statistical analysis: The difference in the survival of the test organisms in the test solution having different salinityconcentration was analysed using two way analysis of variance (ANOVA).
RESULTS AND CONCLUSIONS
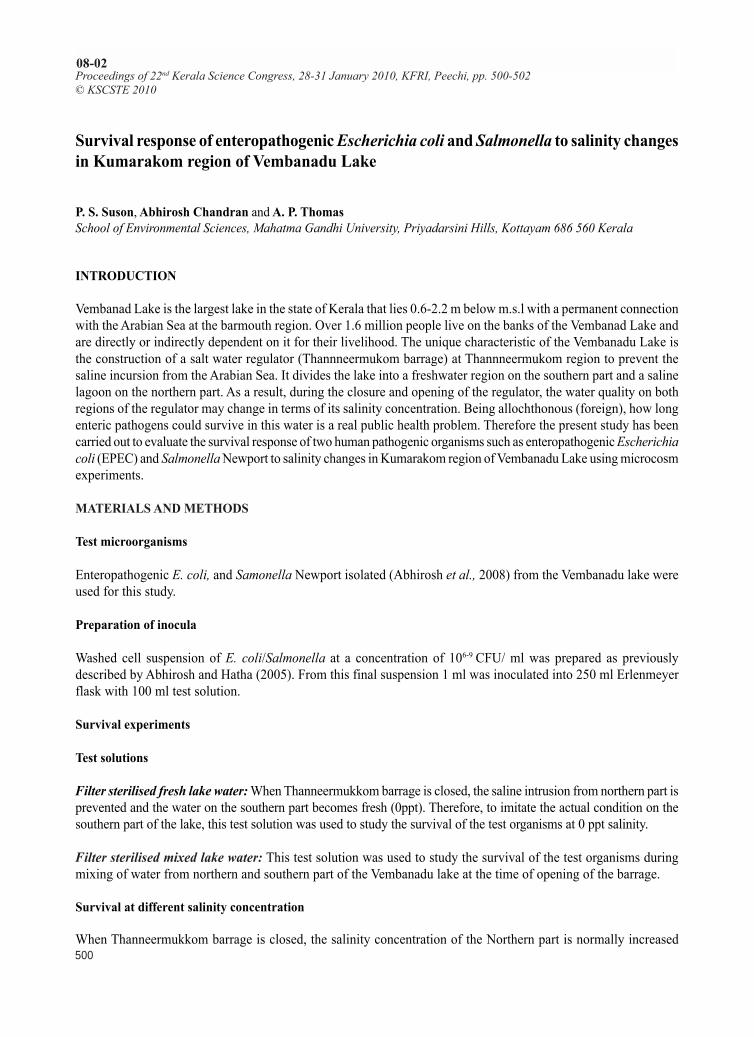
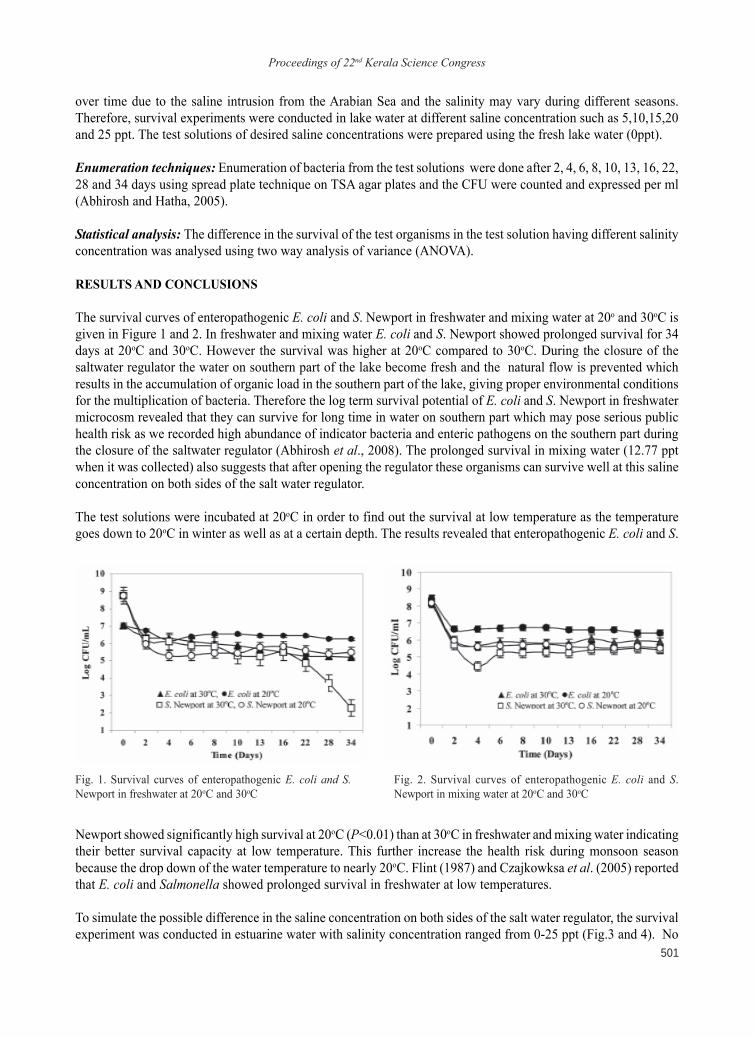
The survival curves of enteropathogenic E. coli and S. Newport in freshwater and mixing water at 20o and 30oC isgiven in Figure 1 and 2. In freshwater and mixing water E. coli and S. Newport showed prolonged survival for 34days at 20oC and 30oC. However the survival was higher at 20oC compared to 30oC. During the closure of thesaltwater regulator the water on southern part of the lake become fresh and the natural flow is prevented whichresults in the accumulation of organic load in the southern part of the lake, giving proper environmental conditionsfor the multiplication of bacteria. Therefore the log term survival potential of E. coli and S. Newport in freshwatermicrocosm revealed that they can survive for long time in water on southern part which may pose serious publichealth risk as we recorded high abundance of indicator bacteria and enteric pathogens on the southern part duringthe closure of the saltwater regulator (Abhirosh et al., 2008). The prolonged survival in mixing water (12.77 pptwhen it was collected) also suggests that after opening the regulator these organisms can survive well at this salineconcentration on both sides of the salt water regulator.
The test solutions were incubated at 20oC in order to find out the survival at low temperature as the temperaturegoes down to 20oC in winter as well as at a certain depth. The results revealed that enteropathogenic E. coli and S.
Newport showed significantly high survival at 20oC (P<0.01) than at 30oC in freshwater and mixing water indicatingtheir better survival capacity at low temperature. This further increase the health risk during monsoon seasonbecause the drop down of the water temperature to nearly 20oC. Flint (1987) and Czajkowksa et al. (2005) reportedthat E. coli and Salmonella showed prolonged survival in freshwater at low temperatures.
To simulate the possible difference in the saline concentration on both sides of the salt water regulator, the survivalexperiment was conducted in estuarine water with salinity concentration ranged from 0-25 ppt (Fig.3 and 4). No
Fig. 1. Survival curves of enteropathogenic E. coli and S.Newport in freshwater at 20oC and 30oC
Fig. 2. Survival curves of enteropathogenic E. coli and S.Newport in mixing water at 20oC and 30oC
Proceedings of 22nd Kerala Science Congress
502
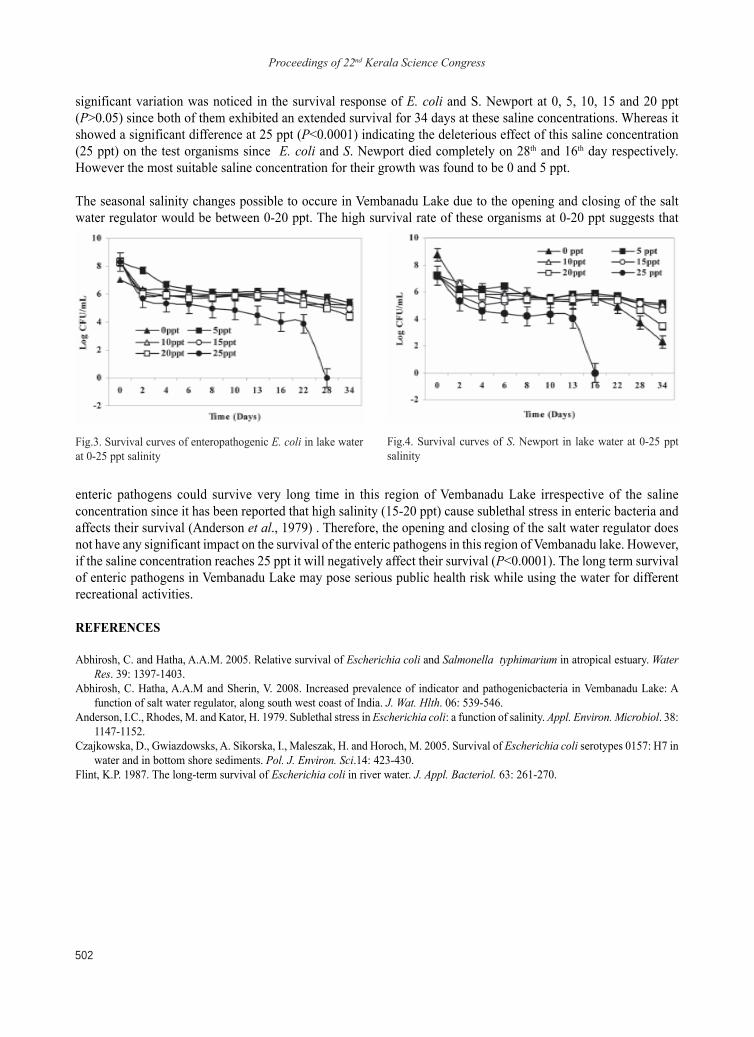
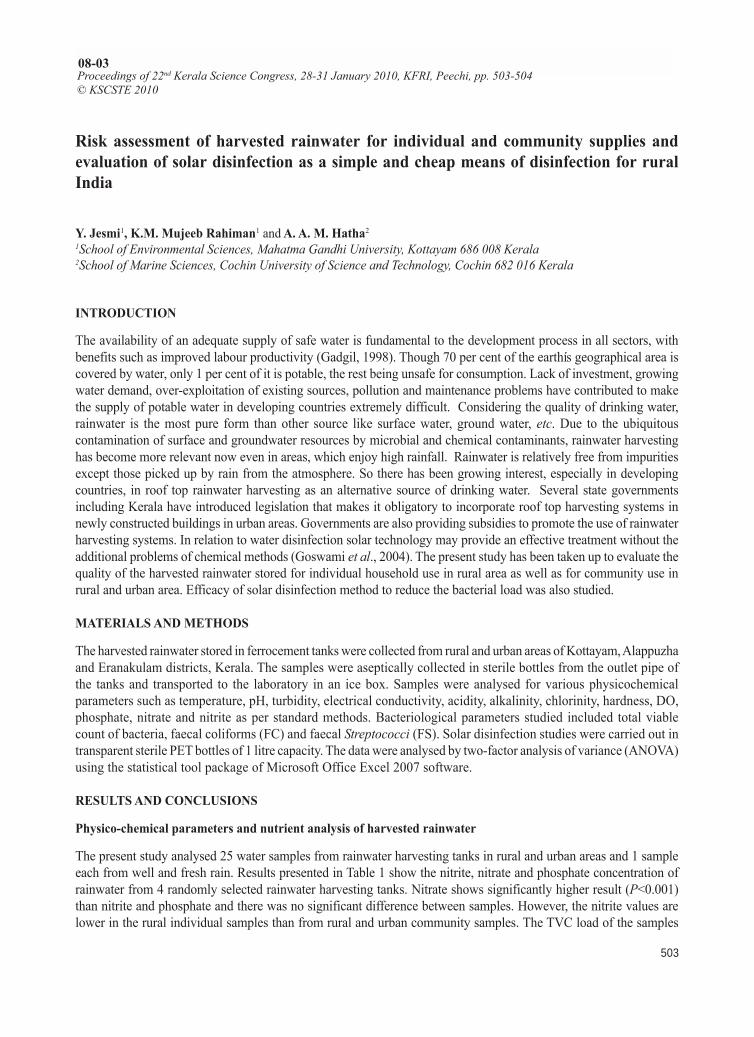
significant variation was noticed in the survival response of E. coli and S. Newport at 0, 5, 10, 15 and 20 ppt(P>0.05) since both of them exhibited an extended survival for 34 days at these saline concentrations. Whereas itshowed a significant difference at 25 ppt (P<0.0001) indicating the deleterious effect of this saline concentration(25 ppt) on the test organisms since E. coli and S. Newport died completely on 28th and 16th day respectively.However the most suitable saline concentration for their growth was found to be 0 and 5 ppt.
The seasonal salinity changes possible to occure in Vembanadu Lake due to the opening and closing of the saltwater regulator would be between 0-20 ppt. The high survival rate of these organisms at 0-20 ppt suggests that
Fig.3. Survival curves of enteropathogenic E. coli in lake waterat 0-25 ppt salinity
Fig.4. Survival curves of S. Newport in lake water at 0-25 pptsalinity
enteric pathogens could survive very long time in this region of Vembanadu Lake irrespective of the salineconcentration since it has been reported that high salinity (15-20 ppt) cause sublethal stress in enteric bacteria andaffects their survival (Anderson et al., 1979) . Therefore, the opening and closing of the salt water regulator doesnot have any significant impact on the survival of the enteric pathogens in this region of Vembanadu lake. However,if the saline concentration reaches 25 ppt it will negatively affect their survival (P<0.0001). The long term survivalof enteric pathogens in Vembanadu Lake may pose serious public health risk while using the water for differentrecreational activities.
REFERENCES
Abhirosh, C. and Hatha, A.A.M. 2005. Relative survival of Escherichia coli and Salmonella typhimarium in atropical estuary. WaterRes. 39: 1397-1403.
Abhirosh, C. Hatha, A.A.M and Sherin, V. 2008. Increased prevalence of indicator and pathogenicbacteria in Vembanadu Lake: Afunction of salt water regulator, along south west coast of India. J. Wat. Hlth. 06: 539-546.
Anderson, I.C., Rhodes, M. and Kator, H. 1979. Sublethal stress in Escherichia coli: a function of salinity. Appl. Environ. Microbiol. 38:1147-1152.
Czajkowska, D., Gwiazdowsks, A. Sikorska, I., Maleszak, H. and Horoch, M. 2005. Survival of Escherichia coli serotypes 0157: H7 inwater and in bottom shore sediments. Pol. J. Environ. Sci.14: 423-430.
Flint, K.P. 1987. The long-term survival of Escherichia coli in river water. J. Appl. Bacteriol. 63: 261-270.
Proceedings of 22nd Kerala Science Congress
503
Risk assessment of harvested rainwater for individual and community supplies andevaluation of solar disinfection as a simple and cheap means of disinfection for ruralIndia
Y. Jesmi1, K.M. Mujeeb Rahiman1 and A. A. M. Hatha21School of Environmental Sciences, Mahatma Gandhi University, Kottayam 686 008 Kerala2School of Marine Sciences, Cochin University of Science and Technology, Cochin 682 016 Kerala
INTRODUCTION
The availability of an adequate supply of safe water is fundamental to the development process in all sectors, withbenefits such as improved labour productivity (Gadgil, 1998). Though 70 per cent of the earthís geographical area iscovered by water, only 1 per cent of it is potable, the rest being unsafe for consumption. Lack of investment, growingwater demand, over-exploitation of existing sources, pollution and maintenance problems have contributed to makethe supply of potable water in developing countries extremely difficult. Considering the quality of drinking water,rainwater is the most pure form than other source like surface water, ground water, etc. Due to the ubiquitouscontamination of surface and groundwater resources by microbial and chemical contaminants, rainwater harvestinghas become more relevant now even in areas, which enjoy high rainfall. Rainwater is relatively free from impuritiesexcept those picked up by rain from the atmosphere. So there has been growing interest, especially in developingcountries, in roof top rainwater harvesting as an alternative source of drinking water. Several state governmentsincluding Kerala have introduced legislation that makes it obligatory to incorporate roof top harvesting systems innewly constructed buildings in urban areas. Governments are also providing subsidies to promote the use of rainwaterharvesting systems. In relation to water disinfection solar technology may provide an effective treatment without theadditional problems of chemical methods (Goswami et al., 2004). The present study has been taken up to evaluate thequality of the harvested rainwater stored for individual household use in rural area as well as for community use inrural and urban area. Efficacy of solar disinfection method to reduce the bacterial load was also studied.
MATERIALS AND METHODS
The harvested rainwater stored in ferrocement tanks were collected from rural and urban areas of Kottayam, Alappuzhaand Eranakulam districts, Kerala. The samples were aseptically collected in sterile bottles from the outlet pipe ofthe tanks and transported to the laboratory in an ice box. Samples were analysed for various physicochemicalparameters such as temperature, pH, turbidity, electrical conductivity, acidity, alkalinity, chlorinity, hardness, DO,phosphate, nitrate and nitrite as per standard methods. Bacteriological parameters studied included total viablecount of bacteria, faecal coliforms (FC) and faecal Streptococci (FS). Solar disinfection studies were carried out intransparent sterile PET bottles of 1 litre capacity. The data were analysed by two-factor analysis of variance (ANOVA)using the statistical tool package of Microsoft Office Excel 2007 software.
RESULTS AND CONCLUSIONS
Physico-chemical parameters and nutrient analysis of harvested rainwater
The present study analysed 25 water samples from rainwater harvesting tanks in rural and urban areas and 1 sampleeach from well and fresh rain. Results presented in Table 1 show the nitrite, nitrate and phosphate concentration ofrainwater from 4 randomly selected rainwater harvesting tanks. Nitrate shows significantly higher result (P<0.001)than nitrite and phosphate and there was no significant difference between samples. However, the nitrite values arelower in the rural individual samples than from rural and urban community samples. The TVC load of the samples
Proceedings of 22nd Kerala Science Congress, 28-31 January 2010, KFRI, Peechi, pp. 503-504© KSCSTE 2010
08-03
Proceedings of 22nd Kerala Science Congress
504
analysed in the present study were much lower than those reported in earlier studies (Uba and Aghogho, 2000; Simmonset al., 2001). Results revealed that the physico-chemical parameters such as pH, conductivity, TDS, alkalinity, chloride,salinity and hardness are varying widely among the harvested and stored rainwater collected. Analysis showed that allthe harvested rainwater samples are highly alkaline in nature with pH up to 11.32. The storage tanks are made offerrocement, which has been reported to cause alkalinity of stored rainwater (Simmons et al., 2001).Table 1. Quality parameters of the harvested rainwater and per cent reduction of TVC bacteria after solar disinfection
Category Nitrite Nitrate Phosphate TVC FC FS FC/FS % EC % Reduction(µm/L) (µm/L) (µm/L) (cfu/ml) (cfu/100 ml) (cfu/100 ml) ratio detection of TVC after SODIS#
RI* 0.050 22.885 0.269 1.97 x 10⁴ 2.11 x 10² 2.92 x 10² 0.12 22.22 NDRC** 1.607 25.153 0.147 6.87 x 10³ 8.76 x 101 2.05 x 10² 0.99 50.00 95.66UC*** 0.717 13.993 0.245 2.20 x 10⁴ 8.76 x 101 2.05 x 10² 1.60 50.00 98.71
*Rural individual, **Rural community, ***Urban community, #Solar disinfection, ND ñ Not done
Solar disinfection (SODIS) of harvested and stored rainwater
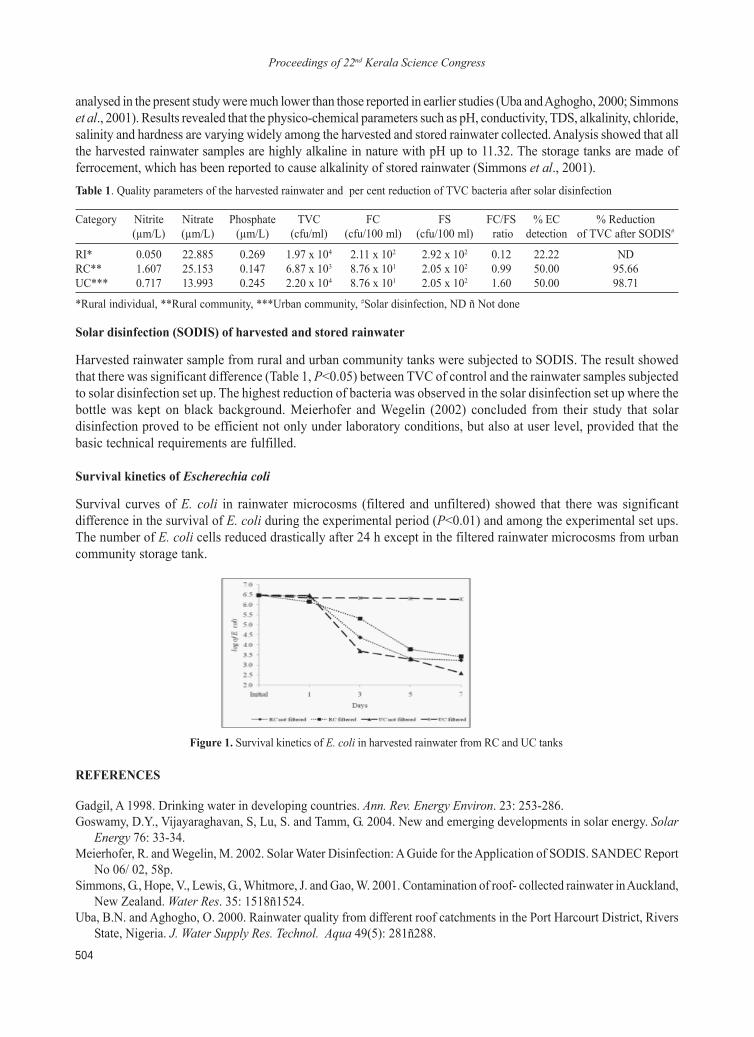
Harvested rainwater sample from rural and urban community tanks were subjected to SODIS. The result showedthat there was significant difference (Table 1, P<0.05) between TVC of control and the rainwater samples subjectedto solar disinfection set up. The highest reduction of bacteria was observed in the solar disinfection set up where thebottle was kept on black background. Meierhofer and Wegelin (2002) concluded from their study that solardisinfection proved to be efficient not only under laboratory conditions, but also at user level, provided that thebasic technical requirements are fulfilled.
Survival kinetics of Escherechia coli
Survival curves of E. coli in rainwater microcosms (filtered and unfiltered) showed that there was significantdifference in the survival of E. coli during the experimental period (P<0.01) and among the experimental set ups.The number of E. coli cells reduced drastically after 24 h except in the filtered rainwater microcosms from urbancommunity storage tank.
REFERENCES
Gadgil, A 1998. Drinking water in developing countries. Ann. Rev. Energy Environ. 23: 253-286.Goswamy, D.Y., Vijayaraghavan, S, Lu, S. and Tamm, G. 2004. New and emerging developments in solar energy. SolarEnergy 76: 33-34.
Meierhofer, R. and Wegelin, M. 2002. Solar Water Disinfection: A Guide for the Application of SODIS. SANDEC ReportNo 06/ 02, 58p.
Simmons, G., Hope, V., Lewis, G., Whitmore, J. and Gao, W. 2001. Contamination of roof- collected rainwater in Auckland,New Zealand. Water Res. 35: 1518ñ1524.
Uba, B.N. and Aghogho, O. 2000. Rainwater quality from different roof catchments in the Port Harcourt District, RiversState, Nigeria. J. Water Supply Res. Technol. Aqua 49(5): 281ñ288.
Figure 1. Survival kinetics of E. coli in harvested rainwater from RC and UC tanks
Proceedings of 22nd Kerala Science Congress
505
Proceedings of 22nd Kerala Science Congress, 28-31 January 2010, KFRI, Peechi, pp. 505-507© KSCSTE 2010
08-04
Biological treatment of feather with special emphasis on Bacillus cereus
M. Kadeeja Beevi, T. V. Shibin and M. LalithambikaIntegrated Rural Technology Centre, Mundur, Palakkad 678 592Kerala
INTRODUCTION
Feathers are produced in large amounts as waste in poultry processing, leading to severe environmental and hygienicproblems. Feathers represent 5-7per cent of the total weight of mature birds, and hence involve huge quantities,where large-scale processing is done. Current methods of scientific disposal of feather waste include landfill andburning. But these are expensive and can cause contamination of air, soil and water. Hence biological degradationresulting in the production of some useful organic product is an attractive alternative. Feathers consist of almostpure keratin protein, which is made up of amino acids. Traditional ways to degrade feathers such as alkali hydrolysisand steam pressure-cooking may not only destroy the amino acids and consume large amount of energy (Cai et al.,2008). Keratin hydrolysis by microbial enzymes has been studied (Shih, 1993). The same author has reported thatkeratinolytic bacteria are present in soil and poultry compost. A biological approach could be advantageous overthe thermal and chemical methods, since it is more environment friendly, less energy intensive and also the productcould have higher nutritional value as a protein feed. Keratin, the insoluble protein of feathers, is known for its highstability. The development of a biological approach to chicken feather decomposition is the main aim of this study.The decomposition process is to be accelerated by inoculating the feather waste with keratinolytic species ofbacillus, isolated from soil containing poultry waste. The specific objectives are: To isolate feather-degradingbacteria and to apply them for feather treatment; to compare feather degradation efficiency of chicken droppings,organic wastewater (produced from rubber sheet), and Bacillus cereus and to determine and compare chemical andphysical characteristics of raw feather and degraded feather.
METHODOLOGY
Isolation and identification of microorganism
Soil sample was collected from a local poultry industry. Bacteria was selected and identified based on morphologicaland biochemical tests. Morphological and physiological characteristics of the isolated bacteria were compared tothe data from Bergeyís Manual of Systematic Bacteriology, by using Gram staining, Spore staining, Motility test,Catalase test (Cappuccino and Sherman, 2004).
Characterization of the isolate using biochemical assay
Microscopic observation and additional morphological, physiological and biochemical tests were conducted(Cappuccino and Sherman, 2004).
Physical and chemical characterization
The pH was checked by the use of a pH -meter. Dry matter was determined by oven drying method. Ash wasdetermined by incineration at 550∞C for 6 hrs. Non-protein nitrogen was determined by the Kjeldahl method describedby the APHA (1989). Protein concentration was determined by Lowryís method (Lowry et al., 1951).To characterisethe degradation of keratin-containing substrates, feather was filtered and washed twice by distilled water. JEOL-JSM-5600LV, Scanning Electron Microscope.
Proceedings of 22nd Kerala Science Congress
506
RESULTS AND CONCLUSIONS
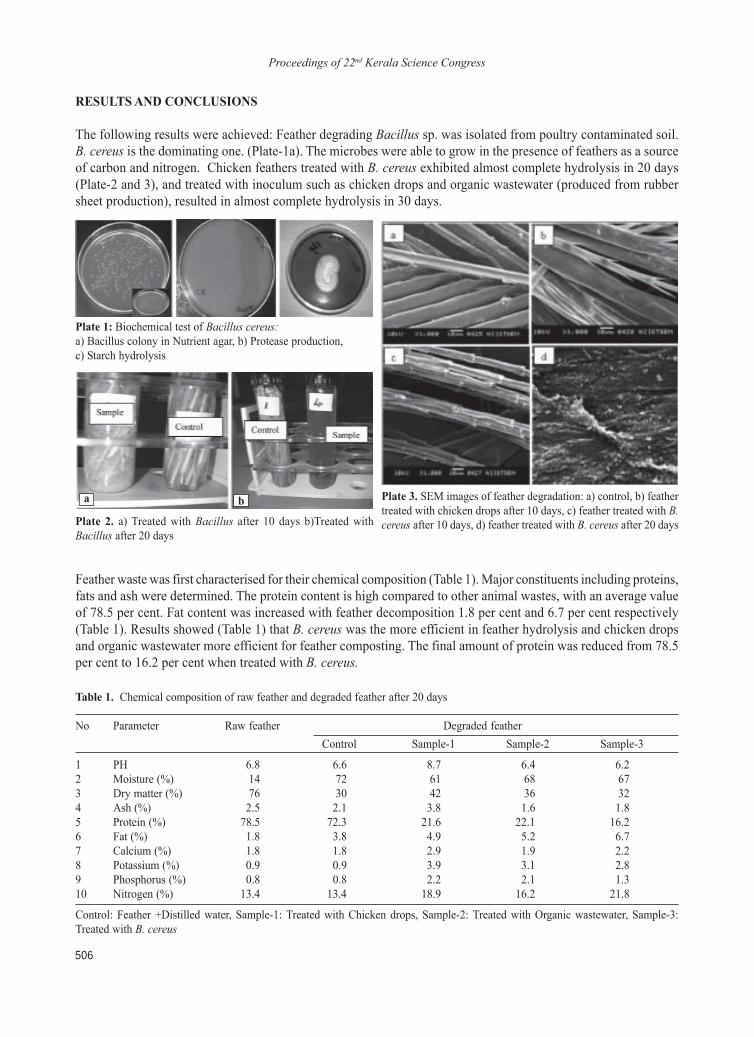
The following results were achieved: Feather degrading Bacillus sp. was isolated from poultry contaminated soil.B. cereus is the dominating one. (Plate-1a). The microbes were able to grow in the presence of feathers as a sourceof carbon and nitrogen. Chicken feathers treated with B. cereus exhibited almost complete hydrolysis in 20 days(Plate-2 and 3), and treated with inoculum such as chicken drops and organic wastewater (produced from rubbersheet production), resulted in almost complete hydrolysis in 30 days.
Feather waste was first characterised for their chemical composition (Table 1). Major constituents including proteins,fats and ash were determined. The protein content is high compared to other animal wastes, with an average valueof 78.5 per cent. Fat content was increased with feather decomposition 1.8 per cent and 6.7 per cent respectively(Table 1). Results showed (Table 1) that B. cereus was the more efficient in feather hydrolysis and chicken dropsand organic wastewater more efficient for feather composting. The final amount of protein was reduced from 78.5per cent to 16.2 per cent when treated with B. cereus.
Plate 1: Biochemical test of Bacillus cereus:a) Bacillus colony in Nutrient agar, b) Protease production,c) Starch hydrolysis
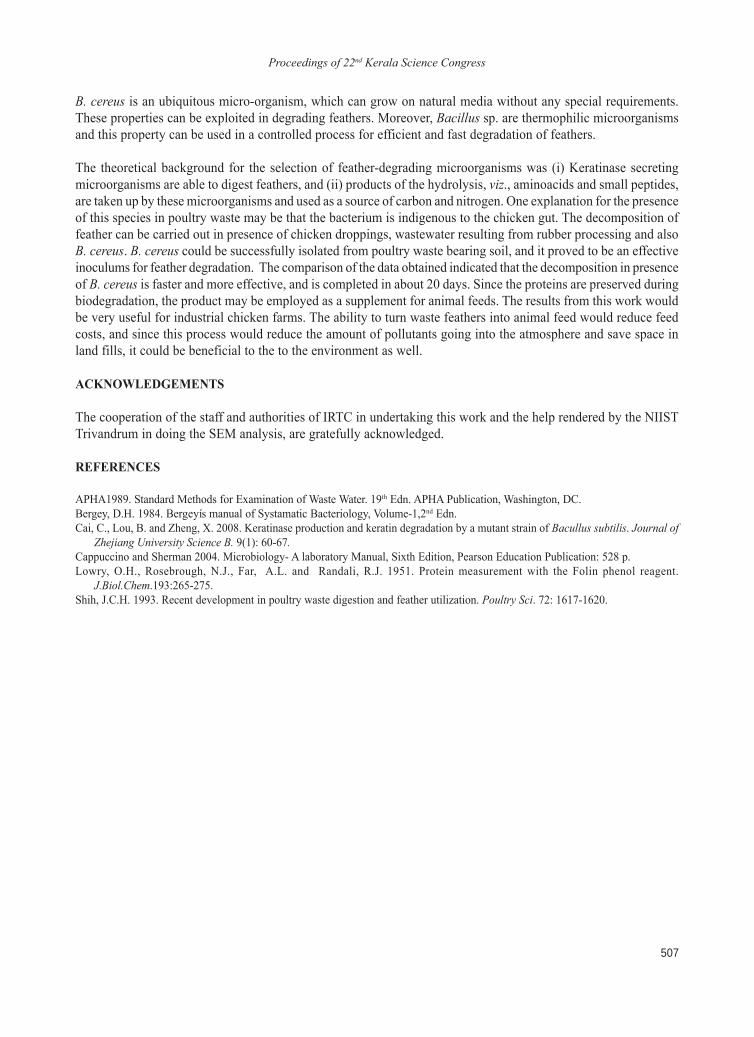
Plate 3. SEM images of feather degradation: a) control, b) feathertreated with chicken drops after 10 days, c) feather treated with B.cereus after 10 days, d) feather treated with B. cereus after 20 daysPlate 2. a) Treated with Bacillus after 10 days b)Treated with
Bacillus after 20 days
a
Table 1. Chemical composition of raw feather and degraded feather after 20 days
No Parameter Raw feather Degraded featherControl Sample-1 Sample-2 Sample-3
1 PH 6.8 6.6 8.7 6.4 6.22 Moisture (%) 14 72 61 68 673 Dry matter (%) 76 30 42 36 324 Ash (%) 2.5 2.1 3.8 1.6 1.85 Protein (%) 78.5 72.3 21.6 22.1 16.26 Fat (%) 1.8 3.8 4.9 5.2 6.77 Calcium (%) 1.8 1.8 2.9 1.9 2.28 Potassium (%) 0.9 0.9 3.9 3.1 2.89 Phosphorus (%) 0.8 0.8 2.2 2.1 1.310 Nitrogen (%) 13.4 13.4 18.9 16.2 21.8
Control: Feather +Distilled water, Sample-1: Treated with Chicken drops, Sample-2: Treated with Organic wastewater, Sample-3:Treated with B. cereus
b
Proceedings of 22nd Kerala Science Congress
507
B. cereus is an ubiquitous micro-organism, which can grow on natural media without any special requirements.These properties can be exploited in degrading feathers. Moreover, Bacillus sp. are thermophilic microorganismsand this property can be used in a controlled process for efficient and fast degradation of feathers.
The theoretical background for the selection of feather-degrading microorganisms was (i) Keratinase secretingmicroorganisms are able to digest feathers, and (ii) products of the hydrolysis, viz., aminoacids and small peptides,are taken up by these microorganisms and used as a source of carbon and nitrogen. One explanation for the presenceof this species in poultry waste may be that the bacterium is indigenous to the chicken gut. The decomposition offeather can be carried out in presence of chicken droppings, wastewater resulting from rubber processing and alsoB. cereus. B. cereus could be successfully isolated from poultry waste bearing soil, and it proved to be an effectiveinoculums for feather degradation. The comparison of the data obtained indicated that the decomposition in presenceof B. cereus is faster and more effective, and is completed in about 20 days. Since the proteins are preserved duringbiodegradation, the product may be employed as a supplement for animal feeds. The results from this work wouldbe very useful for industrial chicken farms. The ability to turn waste feathers into animal feed would reduce feedcosts, and since this process would reduce the amount of pollutants going into the atmosphere and save space inland fills, it could be beneficial to the to the environment as well.
ACKNOWLEDGEMENTS
The cooperation of the staff and authorities of IRTC in undertaking this work and the help rendered by the NIISTTrivandrum in doing the SEM analysis, are gratefully acknowledged.
REFERENCES
APHA1989. Standard Methods for Examination of Waste Water. 19th Edn. APHA Publication, Washington, DC.Bergey, D.H. 1984. Bergeyís manual of Systamatic Bacteriology, Volume-1,2nd Edn.Cai, C., Lou, B. and Zheng, X. 2008. Keratinase production and keratin degradation by a mutant strain of Bacullus subtilis. Journal of
Zhejiang University Science B. 9(1): 60-67.Cappuccino and Sherman 2004. Microbiology- A laboratory Manual, Sixth Edition, Pearson Education Publication: 528 p.Lowry, O.H., Rosebrough, N.J., Far, A.L. and Randali, R.J. 1951. Protein measurement with the Folin phenol reagent.
J.Biol.Chem.193:265-275.Shih, J.C.H. 1993. Recent development in poultry waste digestion and feather utilization. Poultry Sci. 72: 1617-1620.
Proceedings of 22nd Kerala Science Congress
508
Proceedings of 22nd Kerala Science Congress, 28-31 January 2010, KFRI, Peechi, pp. 508-509© KSCSTE 2010
08-05
Treatment of roof-harvested rainwater by electrocoagulation using aluminium electrodes
P. S. Anupama and V. MeeraDepartment of Civil Engineering, Government Engineering College, Thrissur, Kerala
INTRODUCTION
Shortage of safe drinking-water is a major problem faced by people especially in developing world. Electrocoagulation(EC), one of the modern technologies is receiving attention in the field of water and wastewater treatment (WHO/UNICEF 2000). The present work evaluated the efficiency of this method in the removal of biocolloids (coliform)from roof-harvested rainwater. The study was conducted at a voltage of 18V and a current in the range 5-15mAusing DC power supply. The electrodes used were Aluminium. The rate of coliform reduction for 3 different influentconcentrations (93, 460, 1100 MPN/100 mL) revealed that Al electrodes were effective in the complete removal ofcoliforms. The study also revealed that an electrolysis time of 22 minutes is required for Al electrodes for thecomplete removal of coliforms in the range of values tested which is usually found in roof-harvested rainwater.Electrocoagulation can thus be an appropriate household/small scale treatment method for the production ofmicrobiologically safe water from roof-harvested rainwater..MATERIALS AND METHODS
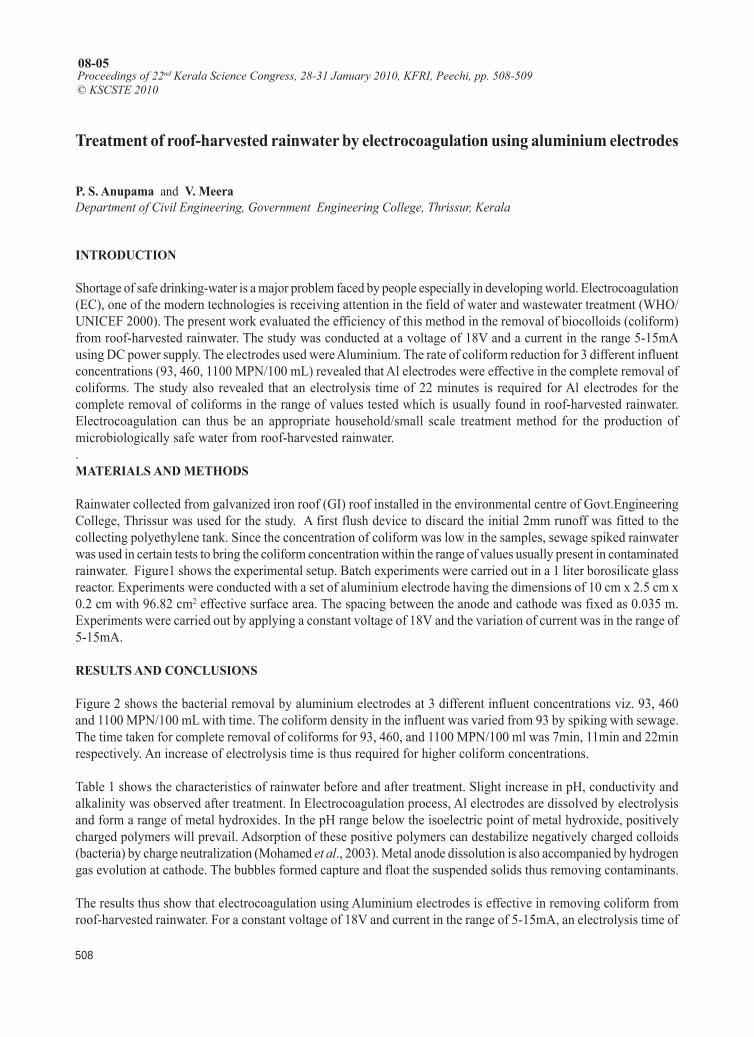
Rainwater collected from galvanized iron roof (GI) roof installed in the environmental centre of Govt.EngineeringCollege, Thrissur was used for the study. A first flush device to discard the initial 2mm runoff was fitted to thecollecting polyethylene tank. Since the concentration of coliform was low in the samples, sewage spiked rainwaterwas used in certain tests to bring the coliform concentration within the range of values usually present in contaminatedrainwater. Figure1 shows the experimental setup. Batch experiments were carried out in a 1 liter borosilicate glassreactor. Experiments were conducted with a set of aluminium electrode having the dimensions of 10 cm x 2.5 cm x0.2 cm with 96.82 cm2 effective surface area. The spacing between the anode and cathode was fixed as 0.035 m.Experiments were carried out by applying a constant voltage of 18V and the variation of current was in the range of5-15mA.
RESULTS AND CONCLUSIONS
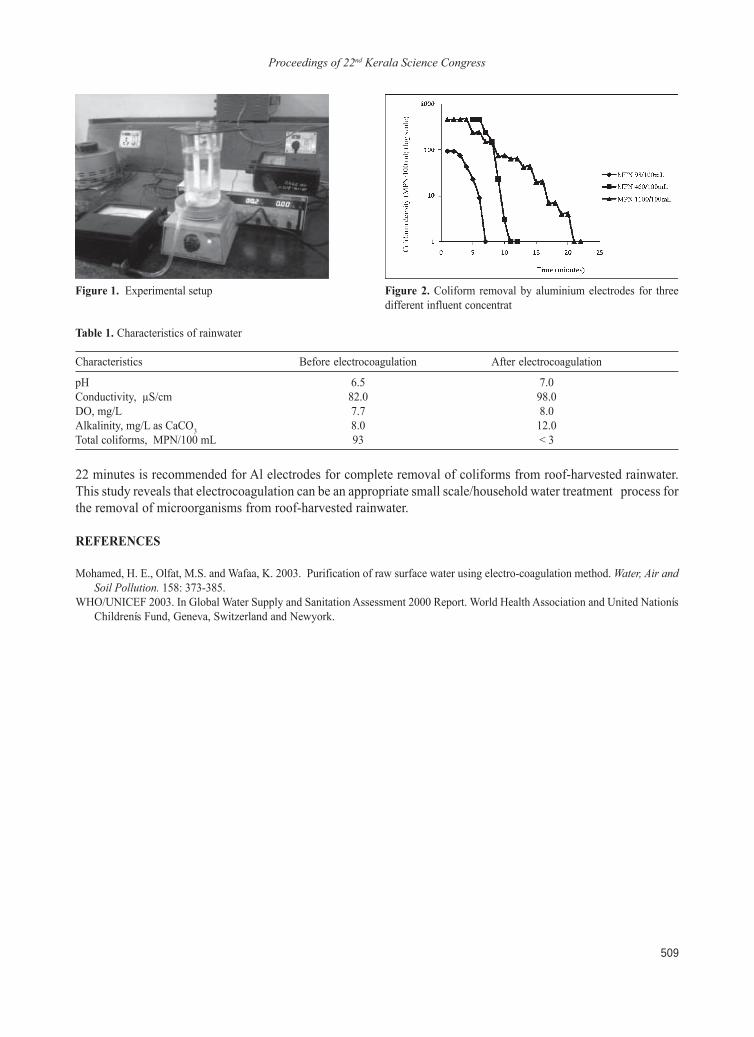
Figure 2 shows the bacterial removal by aluminium electrodes at 3 different influent concentrations viz. 93, 460and 1100 MPN/100 mL with time. The coliform density in the influent was varied from 93 by spiking with sewage.The time taken for complete removal of coliforms for 93, 460, and 1100 MPN/100 ml was 7min, 11min and 22minrespectively. An increase of electrolysis time is thus required for higher coliform concentrations.
Table 1 shows the characteristics of rainwater before and after treatment. Slight increase in pH, conductivity andalkalinity was observed after treatment. In Electrocoagulation process, Al electrodes are dissolved by electrolysisand form a range of metal hydroxides. In the pH range below the isoelectric point of metal hydroxide, positivelycharged polymers will prevail. Adsorption of these positive polymers can destabilize negatively charged colloids(bacteria) by charge neutralization (Mohamed et al., 2003). Metal anode dissolution is also accompanied by hydrogengas evolution at cathode. The bubbles formed capture and float the suspended solids thus removing contaminants.
The results thus show that electrocoagulation using Aluminium electrodes is effective in removing coliform fromroof-harvested rainwater. For a constant voltage of 18V and current in the range of 5-15mA, an electrolysis time of
Proceedings of 22nd Kerala Science Congress
509
22 minutes is recommended for Al electrodes for complete removal of coliforms from roof-harvested rainwater.This study reveals that electrocoagulation can be an appropriate small scale/household water treatment process forthe removal of microorganisms from roof-harvested rainwater.
REFERENCES
Mohamed, H. E., Olfat, M.S. and Wafaa, K. 2003. Purification of raw surface water using electro-coagulation method. Water, Air andSoil Pollution. 158: 373-385.
WHO/UNICEF 2003. In Global Water Supply and Sanitation Assessment 2000 Report. World Health Association and United NationísChildrenís Fund, Geneva, Switzerland and Newyork.
Figure 2. Coliform removal by aluminium electrodes for threedifferent influent concentrat
Figure 1. Experimental setup
Table 1. Characteristics of rainwater
Characteristics Before electrocoagulation After electrocoagulation
pH 6.5 7.0Conductivity, µS/cm 82.0 98.0DO, mg/L 7.7 8.0Alkalinity, mg/L as CaCO3 8.0 12.0Total coliforms, MPN/100 mL 93 < 3
Proceedings of 22nd Kerala Science Congress
510
Proceedings of 22nd Kerala Science Congress, 28-31 January 2010, KFRI, Peechi, pp. 510-512© KSCSTE 2010
08-06
Distribution and conservation status of owls in the Southern Western Ghats, India
S. Babu, E.A. Jayson and M. SivaramKerala Forest Research Institute, Peechi 680 653 Thrissur, Kerala
INTRODUCTION
Owls are nocturnal avian predators, which possess large home range and occupy multifaceted habitats to conquerlife history characteristics. Thirty three species of owls are found in India and around 50 (16 species) per cent isdistributed in the southern Western Ghats. Knowledge on the distribution pattern and population status of owlsremains as anecdotal notes and there is no comprehensive study on forest owls of the Western Ghats. An attemptwas made to find out the distribution pattern, population status and to construct spatially explicit models for theconservation of owls in the southern Western Ghats of India.
MATERIALS AND METHODS
Survey of owls was carried out in Kerala and Tamil Nadu portions of the Southern Western Ghats. Dusk watch,initial quiet listening, call playback and spot lights were employed for surveying owls (Loyn et al., 2001). Altitude,slope, vegetation types and anthropogenic disturbance were arbitrarily classified to elucidate the distribution patternof owls. Based on the encounter rate in survey points, the population status of owls was assessed. Two modellingapproaches including presence-only (MAXENT- Phillips et al., 2006) and presence-absence modelling (Classificationtree) were applied for assessing the geographic and field scale distribution of Jungle owlet (Glaucidium radiatumTickell, 1833). At field level six variables (Altitude, slope, vegetation types, rainfall and anthropogenic disturbance)were considered for developing classification tree model using CHAID algorithm. Ten environmental variablesconsisting of climatic (Isothermality, Mean diurnal temperature range, precipitation seasonality, precipitation ofdriest quarter and precipitation of wettest month), vegetation (MODIS tree cover and bare cover) and topographicvariables (Altitude, aspect and slope) were included for predicting geographic distribution of Jungle owlet (JO) andall variables were obtained from world climatic data sources. The predictive performances of the both models wereevaluated based on the ROC curve (Fielding and Bell, 1997).
RESULTS
Distribution pattern and population status
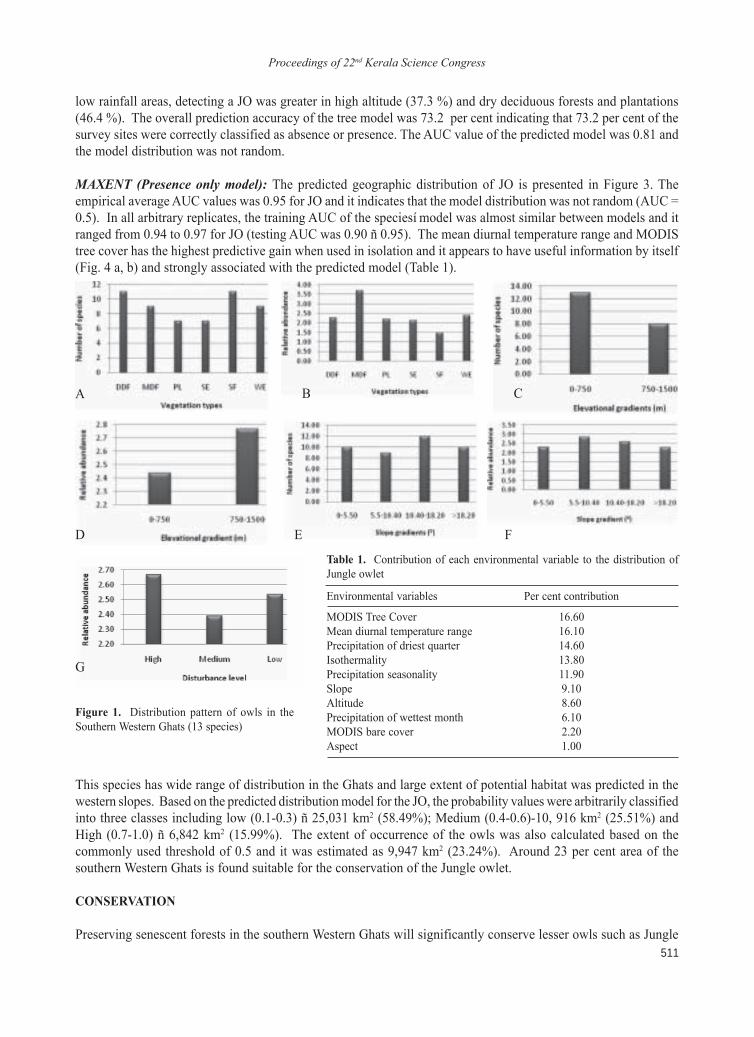
Thirteen species of owls were recorded (12 species in both Tamil Nadu and Kerala) from southern Western Ghats.Low altitude (13), scrub and dry deciduous (11), mid sloppy (12) and highly disturbed areas (13) were high speciesrich zones for owls (Fig. 1). Mid altitude, moist deciduous, mid sloppy and highly disturbed areas were high abundantzones for owls. Status of lesser owls ranged from common to uncommon but larger owls were uncommon to rare.
Distribution modelling of Jungle owlet
Classification tree (Presence-absence model): A classification tree model with twenty nodes including ten terminalnodes was built and it indicated that there were ten possible patterns of habitats available for JO (Fig. 2). Rainfallis the best predictor of habitat use, because it emerged as the root node of the tree. The detection percentage wasgreater in high rainfall area (66.4%) than the low rainfall area (27.8%). Within the high rainfall area, the high levelof anthropogenic disturbance (69.8%) and low altitude (77.4%) areas had higher chances to detect the owlet. In
Proceedings of 22nd Kerala Science Congress
511
low rainfall areas, detecting a JO was greater in high altitude (37.3 %) and dry deciduous forests and plantations(46.4 %). The overall prediction accuracy of the tree model was 73.2 per cent indicating that 73.2 per cent of thesurvey sites were correctly classified as absence or presence. The AUC value of the predicted model was 0.81 andthe model distribution was not random.
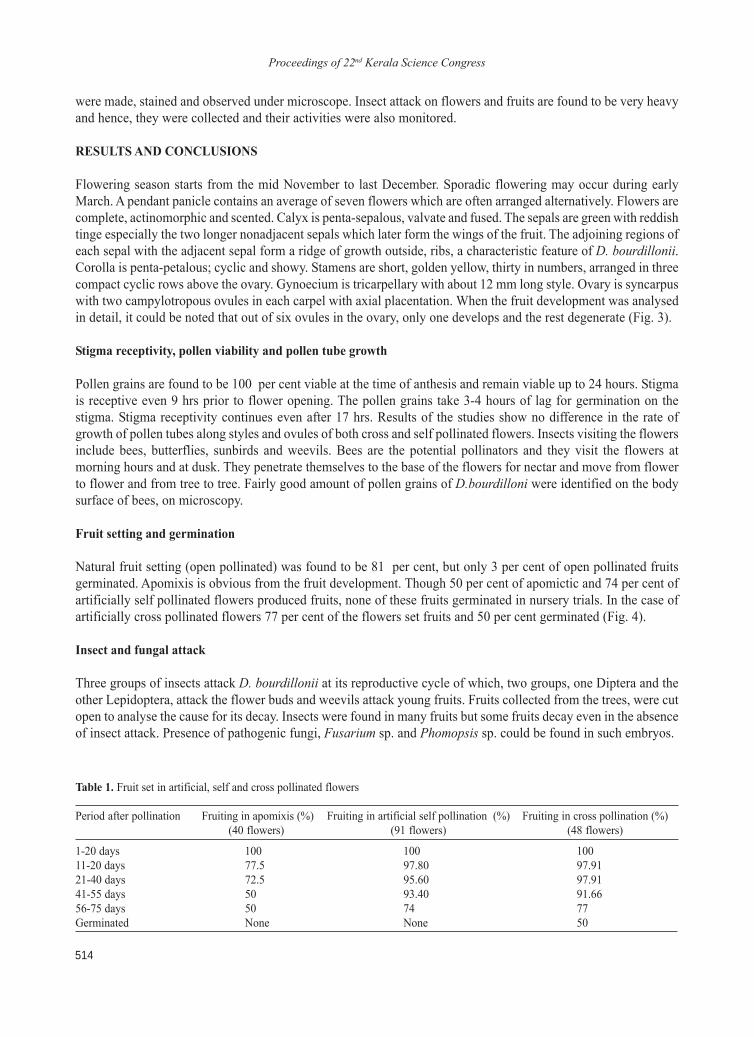
MAXENT (Presence only model): The predicted geographic distribution of JO is presented in Figure 3. Theempirical average AUC values was 0.95 for JO and it indicates that the model distribution was not random (AUC =0.5). In all arbitrary replicates, the training AUC of the speciesí model was almost similar between models and itranged from 0.94 to 0.97 for JO (testing AUC was 0.90 ñ 0.95). The mean diurnal temperature range and MODIStree cover has the highest predictive gain when used in isolation and it appears to have useful information by itself(Fig. 4 a, b) and strongly associated with the predicted model (Table 1).
Figure 1. Distribution pattern of owls in theSouthern Western Ghats (13 species)
A B C
D E F
G
Table 1. Contribution of each environmental variable to the distribution ofJungle owlet
Environmental variables Per cent contribution
MODIS Tree Cover 16.60Mean diurnal temperature range 16.10Precipitation of driest quarter 14.60Isothermality 13.80Precipitation seasonality 11.90Slope 9.10Altitude 8.60Precipitation of wettest month 6.10MODIS bare cover 2.20Aspect 1.00
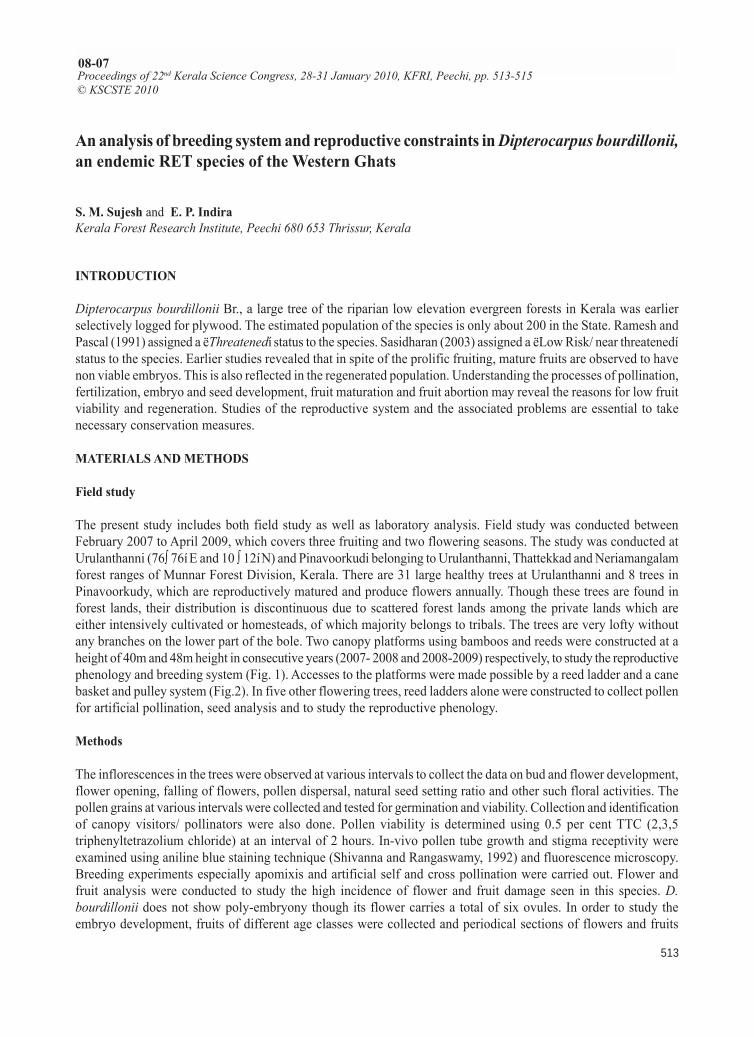
This species has wide range of distribution in the Ghats and large extent of potential habitat was predicted in thewestern slopes. Based on the predicted distribution model for the JO, the probability values were arbitrarily classifiedinto three classes including low (0.1-0.3) ñ 25,031 km2 (58.49%); Medium (0.4-0.6)-10, 916 km2 (25.51%) andHigh (0.7-1.0) ñ 6,842 km2 (15.99%). The extent of occurrence of the owls was also calculated based on thecommonly used threshold of 0.5 and it was estimated as 9,947 km2 (23.24%). Around 23 per cent area of thesouthern Western Ghats is found suitable for the conservation of the Jungle owlet.
CONSERVATION
Preserving senescent forests in the southern Western Ghats will significantly conserve lesser owls such as Jungle
Proceedings of 22nd Kerala Science Congress
512
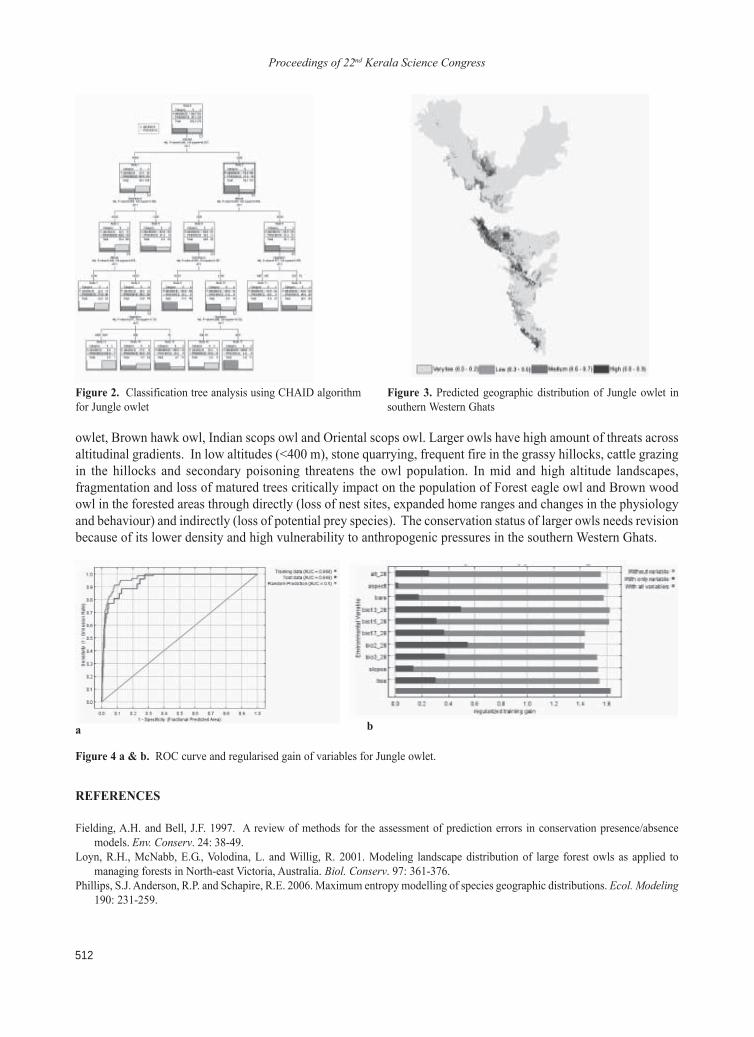
Figure 2. Classification tree analysis using CHAID algorithmfor Jungle owlet
owlet, Brown hawk owl, Indian scops owl and Oriental scops owl. Larger owls have high amount of threats acrossaltitudinal gradients. In low altitudes (<400 m), stone quarrying, frequent fire in the grassy hillocks, cattle grazingin the hillocks and secondary poisoning threatens the owl population. In mid and high altitude landscapes,fragmentation and loss of matured trees critically impact on the population of Forest eagle owl and Brown woodowl in the forested areas through directly (loss of nest sites, expanded home ranges and changes in the physiologyand behaviour) and indirectly (loss of potential prey species). The conservation status of larger owls needs revisionbecause of its lower density and high vulnerability to anthropogenic pressures in the southern Western Ghats.
Figure 3. Predicted geographic distribution of Jungle owlet insouthern Western Ghats
REFERENCES
Fielding, A.H. and Bell, J.F. 1997. A review of methods for the assessment of prediction errors in conservation presence/absencemodels. Env. Conserv. 24: 38-49.
Loyn, R.H., McNabb, E.G., Volodina, L. and Willig, R. 2001. Modeling landscape distribution of large forest owls as applied tomanaging forests in North-east Victoria, Australia. Biol. Conserv. 97: 361-376.
Phillips, S.J. Anderson, R.P. and Schapire, R.E. 2006. Maximum entropy modelling of species geographic distributions. Ecol. Modeling190: 231-259.
Figure 4 a & b. ROC curve and regularised gain of variables for Jungle owlet.
a b
Proceedings of 22nd Kerala Science Congress
513
An analysis of breeding system and reproductive constraints in Dipterocarpus bourdillonii,an endemic RET species of the Western Ghats
S. M. Sujesh and E. P. IndiraKerala Forest Research Institute, Peechi 680 653 Thrissur, Kerala
INTRODUCTION
Dipterocarpus bourdillonii Br., a large tree of the riparian low elevation evergreen forests in Kerala was earlierselectively logged for plywood. The estimated population of the species is only about 200 in the State. Ramesh andPascal (1991) assigned a ëThreatenedí status to the species. Sasidharan (2003) assigned a ëLow Risk/ near threatenedístatus to the species. Earlier studies revealed that in spite of the prolific fruiting, mature fruits are observed to havenon viable embryos. This is also reflected in the regenerated population. Understanding the processes of pollination,fertilization, embryo and seed development, fruit maturation and fruit abortion may reveal the reasons for low fruitviability and regeneration. Studies of the reproductive system and the associated problems are essential to takenecessary conservation measures.
MATERIALS AND METHODS
Field study
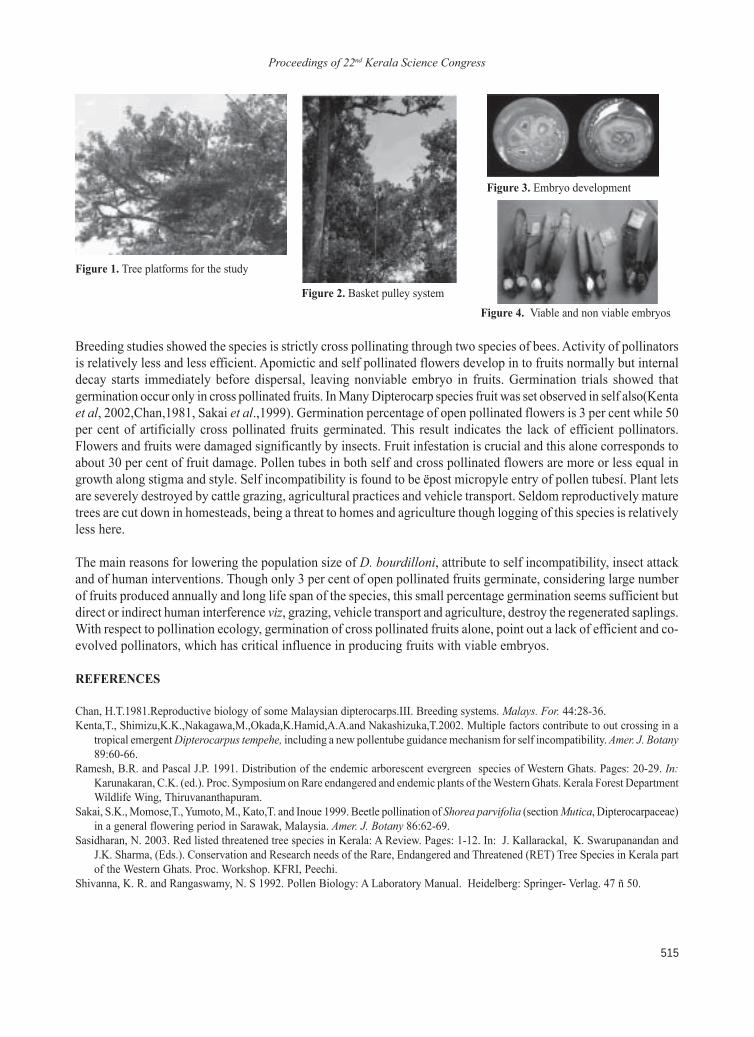
The present study includes both field study as well as laboratory analysis. Field study was conducted betweenFebruary 2007 to April 2009, which covers three fruiting and two flowering seasons. The study was conducted atUrulanthanni (76∫ 76í E and 10 ∫ 12í N) and Pinavoorkudi belonging to Urulanthanni, Thattekkad and Neriamangalamforest ranges of Munnar Forest Division, Kerala. There are 31 large healthy trees at Urulanthanni and 8 trees inPinavoorkudy, which are reproductively matured and produce flowers annually. Though these trees are found inforest lands, their distribution is discontinuous due to scattered forest lands among the private lands which areeither intensively cultivated or homesteads, of which majority belongs to tribals. The trees are very lofty withoutany branches on the lower part of the bole. Two canopy platforms using bamboos and reeds were constructed at aheight of 40m and 48m height in consecutive years (2007- 2008 and 2008-2009) respectively, to study the reproductivephenology and breeding system (Fig. 1). Accesses to the platforms were made possible by a reed ladder and a canebasket and pulley system (Fig.2). In five other flowering trees, reed ladders alone were constructed to collect pollenfor artificial pollination, seed analysis and to study the reproductive phenology.
Methods
The inflorescences in the trees were observed at various intervals to collect the data on bud and flower development,flower opening, falling of flowers, pollen dispersal, natural seed setting ratio and other such floral activities. Thepollen grains at various intervals were collected and tested for germination and viability. Collection and identificationof canopy visitors/ pollinators were also done. Pollen viability is determined using 0.5 per cent TTC (2,3,5triphenyltetrazolium chloride) at an interval of 2 hours. In-vivo pollen tube growth and stigma receptivity wereexamined using aniline blue staining technique (Shivanna and Rangaswamy, 1992) and fluorescence microscopy.Breeding experiments especially apomixis and artificial self and cross pollination were carried out. Flower andfruit analysis were conducted to study the high incidence of flower and fruit damage seen in this species. D.bourdillonii does not show poly-embryony though its flower carries a total of six ovules. In order to study theembryo development, fruits of different age classes were collected and periodical sections of flowers and fruits
Proceedings of 22nd Kerala Science Congress, 28-31 January 2010, KFRI, Peechi, pp. 513-515© KSCSTE 2010
08-07
Proceedings of 22nd Kerala Science Congress
514
were made, stained and observed under microscope. Insect attack on flowers and fruits are found to be very heavyand hence, they were collected and their activities were also monitored.
RESULTS AND CONCLUSIONS
Flowering season starts from the mid November to last December. Sporadic flowering may occur during earlyMarch. A pendant panicle contains an average of seven flowers which are often arranged alternatively. Flowers arecomplete, actinomorphic and scented. Calyx is penta-sepalous, valvate and fused. The sepals are green with reddishtinge especially the two longer nonadjacent sepals which later form the wings of the fruit. The adjoining regions ofeach sepal with the adjacent sepal form a ridge of growth outside, ribs, a characteristic feature of D. bourdillonii.Corolla is penta-petalous; cyclic and showy. Stamens are short, golden yellow, thirty in numbers, arranged in threecompact cyclic rows above the ovary. Gynoecium is tricarpellary with about 12 mm long style. Ovary is syncarpuswith two campylotropous ovules in each carpel with axial placentation. When the fruit development was analysedin detail, it could be noted that out of six ovules in the ovary, only one develops and the rest degenerate (Fig. 3).
Stigma receptivity, pollen viability and pollen tube growth
Pollen grains are found to be 100 per cent viable at the time of anthesis and remain viable up to 24 hours. Stigmais receptive even 9 hrs prior to flower opening. The pollen grains take 3-4 hours of lag for germination on thestigma. Stigma receptivity continues even after 17 hrs. Results of the studies show no difference in the rate ofgrowth of pollen tubes along styles and ovules of both cross and self pollinated flowers. Insects visiting the flowersinclude bees, butterflies, sunbirds and weevils. Bees are the potential pollinators and they visit the flowers atmorning hours and at dusk. They penetrate themselves to the base of the flowers for nectar and move from flowerto flower and from tree to tree. Fairly good amount of pollen grains of D.bourdilloni were identified on the bodysurface of bees, on microscopy.
Fruit setting and germination
Natural fruit setting (open pollinated) was found to be 81 per cent, but only 3 per cent of open pollinated fruitsgerminated. Apomixis is obvious from the fruit development. Though 50 per cent of apomictic and 74 per cent ofartificially self pollinated flowers produced fruits, none of these fruits germinated in nursery trials. In the case ofartificially cross pollinated flowers 77 per cent of the flowers set fruits and 50 per cent germinated (Fig. 4).
Insect and fungal attack
Three groups of insects attack D. bourdillonii at its reproductive cycle of which, two groups, one Diptera and theother Lepidoptera, attack the flower buds and weevils attack young fruits. Fruits collected from the trees, were cutopen to analyse the cause for its decay. Insects were found in many fruits but some fruits decay even in the absenceof insect attack. Presence of pathogenic fungi, Fusarium sp. and Phomopsis sp. could be found in such embryos.
Table 1. Fruit set in artificial, self and cross pollinated flowers
Period after pollination Fruiting in apomixis (%) Fruiting in artificial self pollination (%) Fruiting in cross pollination (%)(40 flowers) (91 flowers) (48 flowers)
1-20 days 100 100 10011-20 days 77.5 97.80 97.9121-40 days 72.5 95.60 97.9141-55 days 50 93.40 91.6656-75 days 50 74 77Germinated None None 50
Proceedings of 22nd Kerala Science Congress
515
Breeding studies showed the species is strictly cross pollinating through two species of bees. Activity of pollinatorsis relatively less and less efficient. Apomictic and self pollinated flowers develop in to fruits normally but internaldecay starts immediately before dispersal, leaving nonviable embryo in fruits. Germination trials showed thatgermination occur only in cross pollinated fruits. In Many Dipterocarp species fruit was set observed in self also(Kentaet al, 2002,Chan,1981, Sakai et al.,1999). Germination percentage of open pollinated flowers is 3 per cent while 50per cent of artificially cross pollinated fruits germinated. This result indicates the lack of efficient pollinators.Flowers and fruits were damaged significantly by insects. Fruit infestation is crucial and this alone corresponds toabout 30 per cent of fruit damage. Pollen tubes in both self and cross pollinated flowers are more or less equal ingrowth along stigma and style. Self incompatibility is found to be ëpost micropyle entry of pollen tubesí. Plant letsare severely destroyed by cattle grazing, agricultural practices and vehicle transport. Seldom reproductively maturetrees are cut down in homesteads, being a threat to homes and agriculture though logging of this species is relativelyless here.
The main reasons for lowering the population size of D. bourdilloni, attribute to self incompatibility, insect attackand of human interventions. Though only 3 per cent of open pollinated fruits germinate, considering large numberof fruits produced annually and long life span of the species, this small percentage germination seems sufficient butdirect or indirect human interference viz, grazing, vehicle transport and agriculture, destroy the regenerated saplings.With respect to pollination ecology, germination of cross pollinated fruits alone, point out a lack of efficient and co-evolved pollinators, which has critical influence in producing fruits with viable embryos.
REFERENCES
Chan, H.T.1981.Reproductive biology of some Malaysian dipterocarps.III. Breeding systems. Malays. For. 44:28-36.Kenta,T., Shimizu,K.K.,Nakagawa,M.,Okada,K.Hamid,A.A.and Nakashizuka,T.2002. Multiple factors contribute to out crossing in a
tropical emergent Dipterocarpus tempehe, including a new pollentube guidance mechanism for self incompatibility. Amer. J. Botany89:60-66.
Ramesh, B.R. and Pascal J.P. 1991. Distribution of the endemic arborescent evergreen species of Western Ghats. Pages: 20-29. In:Karunakaran, C.K. (ed.). Proc. Symposium on Rare endangered and endemic plants of the Western Ghats. Kerala Forest DepartmentWildlife Wing, Thiruvananthapuram.
Sakai, S.K., Momose,T., Yumoto, M., Kato,T. and Inoue 1999. Beetle pollination of Shorea parvifolia (section Mutica, Dipterocarpaceae)in a general flowering period in Sarawak, Malaysia. Amer. J. Botany 86:62-69.
Sasidharan, N. 2003. Red listed threatened tree species in Kerala: A Review. Pages: 1-12. In: J. Kallarackal, K. Swarupanandan andJ.K. Sharma, (Eds.). Conservation and Research needs of the Rare, Endangered and Threatened (RET) Tree Species in Kerala partof the Western Ghats. Proc. Workshop. KFRI, Peechi.
Shivanna, K. R. and Rangaswamy, N. S 1992. Pollen Biology: A Laboratory Manual. Heidelberg: Springer- Verlag. 47 ñ 50.
Figure 1. Tree platforms for the study
Figure 2. Basket pulley system
Figure 3. Embryo development
Figure 4. Viable and non viable embryos
Proceedings of 22nd Kerala Science Congress
516
Proceedings of 22nd Kerala Science Congress, 28-31 January 2010, KFRI, Peechi, pp. 516-517© KSCSTE 2010
08-08
Development of a hybrid anaerobic bioreactor for treatment and energy conversion ofrice mill effluent
Joe Joe L. Bovas1 and P. Shaji James21Kelappaji College of Agricultural Engineering and Technology, Kerala Agricultural University, Tavanur 679 5732Krishi Vigyan Kendra, Kerala Agricultural University, Pattambi 679 306 Kerala
INTRODUCTION
Parboiling of paddy results in the production of a highly organic effluent. Rice Mill Effluent (RME) is often notproperly treated and results in air and water pollution. At the same time, thermal energy produced from fire woodis used for drying moist parboiled paddy to bring down its moisture content before milling. The anaerobic treatmentof organic effluents has the twin advantages of pollution control and production of energy as biogas. As highvolume low strength liquid wastes can be treated only by the use of high-rate anaerobic bioreactors, it was attemptedto develop an environmentally benign bioreactor for RME treatment.
MATERIALS AND METHODS
The characteristics of RME which are relevant for anaerobic digestion viz. total solids (TS), Biochemical OxygenDemand (BOD), Chemical Oxygen Demand (COD) and pH were determined by standard procedures out≠lined byAPHA (1989). Available nitrogen was estimated by micro-k≠jeldahl method. The biogas volumes were measuredusing water displacement method and the methane content estimated using a Sacharometer. The biomethanationcharacteristics of RME and the compatibility of the different media to be used for cell immobilization viz. rubberseed inner shell, coconut shell and rubber seed outer shell were carried out with 12 treatments in 10 litre plasticdigesters attached with 3 litre capacity water displacement meters.
Eight Up-flow Anaerobic Hybrid Reactors (UAHR) for a design Hydraulic Retention Time (HRT) of 1 day, withmedia on the upper half of the reactor was designed and fabricated. The evaluation comprised of 4 treatments viz.reactors R1, R2 and R4 with rubber seed outer shell as media, and R3 having polyurethene rings (inert media), eachreplicated twice. The inoculum was cow dung in reactors R1 (volume 20%) as well as R3 and R4 (volume 50%).Sludge from semi-continuous digesters was used as inoculum in R2 (volume 20%). A computer controlled peristalticpump was used for feeding at different HRTs. The UAHRs were evaluated from the volume and methane content ofbiogas as well as pH, TS, BOD and COD of influent and effluent by operating them at different Organic LoadingRates (OLR) and Hydraulic Loading Rates (HLR) corresponding to HRTs of 10, 5, 3, 2, 1 and 0.8 day.
RESULTS AND CONCLUSION
RME was observed to be an acidic organic waste water having TS, BOD and COD values 3090, 3599 and 4100 mg/l respectively with a pH of 3.7. The carbon: nitrogen (C:N) ratio was 22.4:1 with a BOD:COD ratio of 0.88 whichindicated good biodegradability and suitability for anaerobic digestion. On observing the start-up characteristics of12 treatments, the treatment with 50 per cent cow dung inoculum having rubber seed outer shell as media showedthe peak value of 1.5 l biogas on the 11th day. The treatment with rubber seed outer shells performed better than theother two media, in not only attaining the peak value fast but also in the quantity of biogas as well as specific gasproduction. Hence this media was selected for use in UAHRs. The eight lab scale UAHRs designed and fabricatedhad a total height of 60 cm and a diameter of 20 cm. The media was placed at the upper half of the reactor, retained
Proceedings of 22nd Kerala Science Congress
517
at the proper position by dispersion plates and had a height of 29.5 cm for the media filled portion. The sludge bedzone consisted of the bottom 29.5 cm height of the reactors.
The start-up characteristics revealed that 25 days were required for the startup. The effluent characteristics of all thereactors with respect to TS, BOD and pH reached steady state in this period showing good stability of the reactors.The HLR of the reactors during 10 day HRT period was 100 l/m3 with an OLR of 0.164 kg TS/m3.d. All the reactorsshowed good gas production performance and the highest specific gas production of 1299 l/kg TS and 591 l/kgBOD were observed in the UAHR with rubber seed outer shell as media. The performance of the reactors withrespect to TS and BOD reductions were in the range of 58.5 to 61.1 and 81.7 to 82.9 % respectively. The evaluationof the reactors conducted by operating them at HRTs 10 day, 5 day, 4 day, 3 day, 2 day, 1 day and 0.8 day furtherconfirmed the stability of operation and high performance of the UAHRs. The effluent pH values were in the range7.0 ñ 8.6 during the entire period of operation even though the influent had a low pH in the range 3.8 ñ 3.9. Theeffluent TS and BOD were found to increase with the reduction of HRT for all reactors. The methane content ofbiogas reached the peak value of 75 % at 4 day HRT in Reactor 1. The OLRs during steady state periods of 10 dayto 0.8 day HRT progressively increased to reach the peak values of 2.2 kg TS/m3.d and 4.4 kg BOD/m3.d for all thereactors at 0.8 day HRT. The HLRs also increased in a similar way from 100 to 1250 l/m3.d. The specific gasproductions in terms of TS and BOD for all reactors were found to decrease with the reduction of HRT. The biogasproductivity (l/l of RME fed) also followed a similar trend of specific gas production. The volumetric gas productionincreased with the decrease of HRT in all reactors. The maximum production of 854.9 l/m3 was observed in R1 at0.8 day HRT while the lowest production (122 l/m3) was observed by R3 at 10 day HRT. The TS and BOD reductionsfollowed a decreasing trend with shortening of HRT.
The maximum reductions were 61.1 % TS by R1 and 82.9 % BOD for R4, respectively, both at 10 day HRT. Theminimum values were observed at 0.8 day HRT ie. 34.1 % TS (R4) and 77.1 % BOD (all reactors). The highperformance of the developed bioreactors could be accounted to the high degree of cell immobilisation obtained bythe hybrid design which incorporated the sludge blanket concept along with media peaking. The reactor withrubber seed outer shell media was found to perform better than the reactor with poly urethane media, possibly dueto the more favorable micro structure of rubber seed shell surface which facilitated biomass attachment. Further, itbecame evident the over all cost of installation of UAHRs can be reduced by the use of rubber seed outer shells asmedia for cell immobilization.
REFERENCES
APHA. 1989. Standard Methods for the Examination of Water and Waste Water. American Public Health Association, Washington.James, P. S. and Kamaraj, S. 2002. Immobilised cell anaerobic bioreactors for energy production from agro-industrial waste waters ñ
An introduction. Bioenergy News 6 (3): 10-15.
Proceedings of 22nd Kerala Science Congress
518
Conservation and monitoring of Great Hornbill (Buceros bicornis) and Malabar PiedHornbill (Anthracoceros coronatus) with the involvement of endemic Kadar tribe in theVazhachal Forest Division, Anamalai part of Southern Western Ghats, Kerala, India
K.H. Amitha BachanWestern Ghats Hornbill Foundation, Aranyak, Mathilakam 680 685 Thrissur, Kerala
INTRODUCTION
Hornbills are generally frugivorous, arboreal, and secondary cavity-nesters and important agents of seed dispersalin tropical forests (Kemp, 1995). They require natural hollows of large canopy trees and usually use the samenesting trees for many years. Historically, hornbills have also been subjected to hunting all over their range in Asia,adding to their vulnerability (Bennett et al., 1997). Of the nine species of hornbills in India, four occur in southIndia: the Great hornbill (Buceros bicornis), Malabar Pied hornbill (Anthracoceros coronatus), Indian Grey Hornbill(Ocyceros birostris) and Malabar Grey hornbill (Ocyceros griseus).
The forests of Vazhachal Forest Division occupy a central and pivotal position in the Anamalai landscape and linkall the important forest areas in the vicinity. In the Western Ghats region highest numbers of Great Hornbills occurhere (Mudappa and Raman, 2009). Three species, Great Hornbill, Malabar Pied Hornbill and Malabar Gray Hornbillsympatrically nest in the low elevation riparian areas of Vazhachal forests (Bachan, 2006). Earlier studies in variousparts of the Anamalai landscape indicated hunting by the endemic ëKadarsí as a major threat. Many have suggestedneed of continuous monitoring and protection against hunting of squabs as an important conservation measure(Kannan and James, 1998; Datta, 1998; Bachan, 2006). The Kadars are a primitive, seasonally nomadic, forestdwelling community endemic to the Anamalai hills of the Western Ghats. The majority of population (50%) livesin the Vazhachal Forest Division.
MATERIALS AND METHODS
A preliminary hornbill survey was conducted between November 2004 and May 2005 with field support of theKadars. It was incorporated as a programme of the Vana Samrakshana Samithy (VSS) ñ a community organizationof the tribe under the Forest Department. Tribesmen were selected based on their interest and experience in interiorforest dwelling, many of them were poachers of hornbill squabs. The selected tribesmen were trained in the field tomonitor nests during the nesting season and also for general surveys. Sheets were prepared in the local language(Malayalam) to record and monitor nests. The selected hornbill guards perambulated each area during the nestingseasons, recording nest activities and protecting trees from forest fire and poaching. We accompanied each grouponce a month, verified their findings, ensured that they followed directions, documented their perceptions andslowly empowered them for scientific monitoring. Details regarding nesting trees were recorded during the process.At the very least, nest activities recorded were entry of females, hatching of chicks, existence of female inside, andfledging of chicks. For each nest six threat factors were recorded as positive or negative. Basic statistics of therelative threat values were used for comparison of threat factors for different regions and also for the success of theconservation programme.
RESULTS AND CONCLUSIONS
During the preliminary survey (2004-05) 25 nests (23 Great Hornbill and 2 Malabar Pied Hornbill) nests were
Proceedings of 22nd Kerala Science Congress, 28-31 January 2010, KFRI, Peechi, pp. 518-519© KSCSTE 2010
08-09
Proceedings of 22nd Kerala Science Congress
519
located. There was gradual increase in the number of nesting trees discovered (24-25%) each year. After the projectstarted, 57 Great Hornbill and four Malabar Pied Hornbill nests were located during the four years of intensivesearch and all except one (which fell down in a storm) were found successful last year. Failure in nesting attemptswas less (8-5%) during the time. Two previously abandoned nests were reoccupied during 2005-06, four during2006-07 and five 2007-08. Among these eight were Great Hornbill Nests and remaining three were that of theMalabar Pied Hornbill. Great Hornbills here found to nest on trees greater than 2 m gbh (average 4.3 m) and treeheight ranged 24-40 m with an average of 31 m. Great Hornbills were found to nest on 18 species of trees. Mostnests were located on Terminalia bellirica. Out of the four Malabar Pied Hornbill nests three were on Tetramelesnudiflora and one on T. bellirica.
About 30 people from all the six Kadar tribal VSS of the Forest Division participated in the programme. It becamepart of the regular Joint Forest Management ñ monitoring programme of the Forest Department and VSS.Incorporating the programme through the VSS and the Forest Department and making it part of their regularactivities ensured the continuity of the process. The programme provided a means of sustenance to the people whilepreserving their traditional forest dwelling habits. After the implementation of the conservation programme during2004-05 and up to the last nesting season (2007-08), threat factors reduced markedly. Among the six threat factors,hunting became non-existent and forest fire (85% to 5%) and human disturbance (24% to 5%) also reduced. Threatdue to degradation of forest (85% to 47%) reduced although persisted, and the threat of flow fluctuation by dams(21%) remained a strong threat factor.
The gradual increase in reoccupation of abandoned nests was probably due to the effects of the participatoryconservation programme. The increase of Malabar Pied Hornbill nests from a single active nest (2004-05) to fouractive nests (2007-08) was critical to rescue the species from local extinction in their only available nesting habitatin Kerala. Increase in the nest encounter, nesting success, reestablishment of abandoned nests and the increase inparticipation of tribesmen in the programme and decrease in the intensity of threat factors could be attributed to thisconservation programme. Now the programme has got wide acceptance, MoEF has supported this year for thecontinuity of the programme and other research initiatives like artificial nest installation, habitat monitoring andmanagement have been started here as a long term measure.
REFERENCES
Kemp, A.C. 1995. The Hornbills. Oxford University Press, Oxford, England.Bennett, E.L., Nyaoi, A.J. and Sompud, J. 1997. Hornbills Buceros spp. and culture in Northern Borneo: can they continueto co-exist? Biol. Conserv. 82: 41-46.
Mudappa, D. and Raman, T.R.S. 2009. A conservation status survey of hornbills (Bucerotidae) in the Western Ghats,India. Indian Birds 5 (4): 90ñ102.
Kannan, R. 1994. Ecology and conservation of Great Pied Hornbill (Buceros bicornis) in the Western Ghats of SouthernIndia. Fayetteville, Arkansas: unpublished Ph.D. Thesis, University of Arkansas.
Kaimal S., Kaimal B., Gopalan M. B. and Grippo R. S. 2007. Hornbill population dynamics in south India. ñ An ecologicalrisk assessment approach. Poster presentation. Arkansas State University.
Bachan, A.K.H. 2006. The Hornbill Haven. Sanctuary Asia 25(6): 46-49.Datta, A. 1998. Hornbill abundance in unlogged forest, selectively logged forest and a forest plantation in ArunachalPradesh, India. Oryx 32 : 285-294.
Proceedings of 22nd Kerala Science Congress
520
Proceedings of 22nd Kerala Science Congress, 28-31 January 2010, KFRI, Peechi, pp. 520-521© KSCSTE 2010
08-10
Rapid bioassessment protocol for river health assessment based on entomologicalindicator species : A case study of river achencovil
S. Nandakumar* and M. G. SanalkumarDepartment of Zoology, N.S.S. College, Pandalam 689 501 Kerala
INTRODUCTION
Kerala, the land of 44 rivers is now being threatened with increasing industrialization, urbanization and inappropriateusage of chemicals negatively influencing the water quality. With the development of true concept of RapidBioassessment Protocol, crucial factors such as collection, compilation, analysis and interpretations of environmentdata could be done rapidly to facilitate management decisions and mitigation of impairment. Aquatic insects havebeen given priority for biomonitoring since they are sensitive to wide range of pollutants and they are resident formof biota with longer life cycles than sampling schedule (Bass, 1995). An effort has been made here to apply RapidBioassessment Protocol associated with aquatic insects as a model approach to monitor the water quality of one ofthe major rivers in Kerala - River Achencovil.
MATERIALS AND METHODS
Indicator organisms
Aquatic insects and their larvae were used for biomonitoring and were identified up to family level with the help ofsuitable key (Morse et al.,, 1994). Pandalam segment in Pathanamthitta district and Veeyapuram segment inAlappuzha district were selected as study sites along the river. Reference sites selected were 1000m ahead of eachtest site. Sampling was done during the post monsoon period and succeeding premonsoon period in the year 2008-ë09. Multi-habitat, composite sample method was adopted using Kick net and D-frame dip net with mesh size600µ. Kick stationary samples and 15-20 jabs were taken within a 100 m reach for fixed duration of two hours foreach site. Live insects picked up using brush or forceps were preserved in 90 per cent ethanol for identificationpurposes.
Benthic metrices and analysis
Taxa richness, measures of composition, tolerance/intolerance, feeding, habit and Family-level Biotic Index were calculated.The benthic metrices calculated were analysed and interpreted by determining the value of each metric comparing to thepredetermined value for predicted response of aquatic insects to increasing perturbation (Barbour et al., 1999). All resultswere analysed for significant level of pollution using Hilsenhoffís Biotic Index (Hilsenhoff, 1988).
RESULTS AND CONCLUSIONS
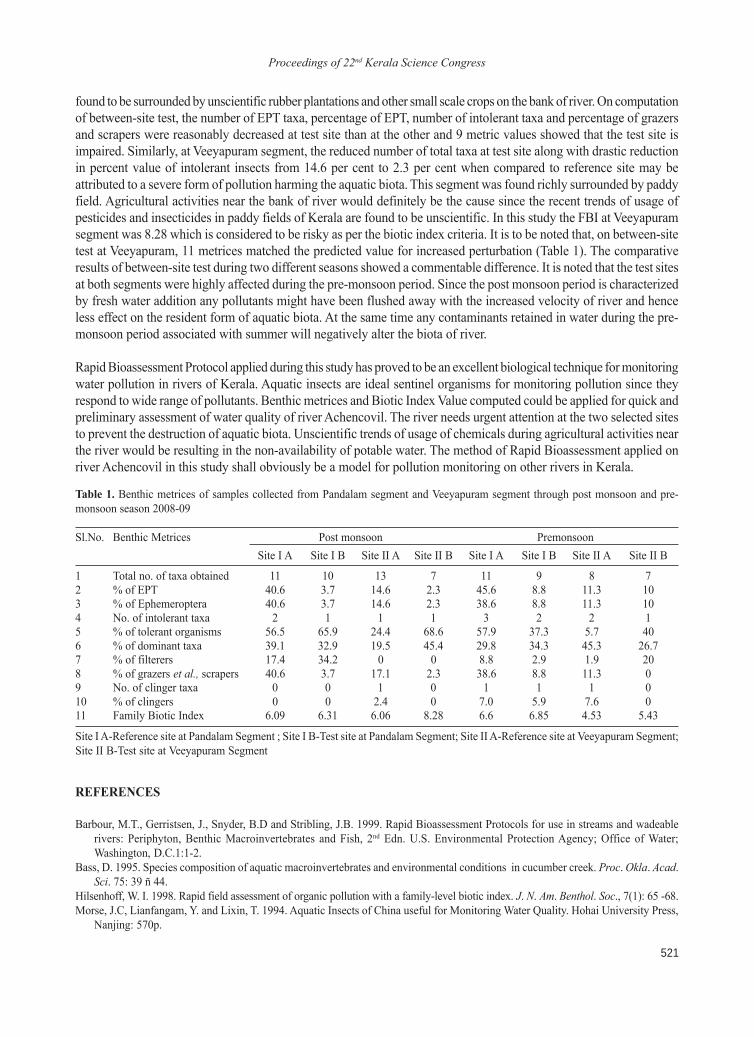
Benthic metrices calculated for insects collected from Pandalam segment showed a rise in the Family Biotic Indexfrom 6.09 at reference site to 6.31 at test site (Table 1). Insects under Ephemeroptera, Plecoptera and Trichoptera(EPT) reduced commentably due to increased perturbation (Morse et al., 1994) and the percent value of tolerant taxaraised from 56.5 per cent at reference site to 65.9 per cent at test site. On calculating taxa richness, insects fromCaenidae under order Ephemeroptera dominated at reference site and while Chironomidae under order Diptera dominatedat test site. Species capable of surviving in low dissolved oxygen conditions exploit their competitive advantage, whendissolved oxygen become low, increasing in numbers as less tolerant competitive disappears. Pandalam segment was
Proceedings of 22nd Kerala Science Congress
521
found to be surrounded by unscientific rubber plantations and other small scale crops on the bank of river. On computationof between-site test, the number of EPT taxa, percentage of EPT, number of intolerant taxa and percentage of grazersand scrapers were reasonably decreased at test site than at the other and 9 metric values showed that the test site isimpaired. Similarly, at Veeyapuram segment, the reduced number of total taxa at test site along with drastic reductionin percent value of intolerant insects from 14.6 per cent to 2.3 per cent when compared to reference site may beattributed to a severe form of pollution harming the aquatic biota. This segment was found richly surrounded by paddyfield. Agricultural activities near the bank of river would definitely be the cause since the recent trends of usage ofpesticides and insecticides in paddy fields of Kerala are found to be unscientific. In this study the FBI at Veeyapuramsegment was 8.28 which is considered to be risky as per the biotic index criteria. It is to be noted that, on between-sitetest at Veeyapuram, 11 metrices matched the predicted value for increased perturbation (Table 1). The comparativeresults of between-site test during two different seasons showed a commentable difference. It is noted that the test sitesat both segments were highly affected during the pre-monsoon period. Since the post monsoon period is characterizedby fresh water addition any pollutants might have been flushed away with the increased velocity of river and henceless effect on the resident form of aquatic biota. At the same time any contaminants retained in water during the pre-monsoon period associated with summer will negatively alter the biota of river.
Rapid Bioassessment Protocol applied during this study has proved to be an excellent biological technique for monitoringwater pollution in rivers of Kerala. Aquatic insects are ideal sentinel organisms for monitoring pollution since theyrespond to wide range of pollutants. Benthic metrices and Biotic Index Value computed could be applied for quick andpreliminary assessment of water quality of river Achencovil. The river needs urgent attention at the two selected sitesto prevent the destruction of aquatic biota. Unscientific trends of usage of chemicals during agricultural activities nearthe river would be resulting in the non-availability of potable water. The method of Rapid Bioassessment applied onriver Achencovil in this study shall obviously be a model for pollution monitoring on other rivers in Kerala.
Table 1. Benthic metrices of samples collected from Pandalam segment and Veeyapuram segment through post monsoon and pre-monsoon season 2008-09
Sl.No. Benthic Metrices Post monsoon PremonsoonSite I A Site I B Site II A Site II B Site I A Site I B Site II A Site II B
1 Total no. of taxa obtained 11 10 13 7 11 9 8 72 % of EPT 40.6 3.7 14.6 2.3 45.6 8.8 11.3 103 % of Ephemeroptera 40.6 3.7 14.6 2.3 38.6 8.8 11.3 104 No. of intolerant taxa 2 1 1 1 3 2 2 15 % of tolerant organisms 56.5 65.9 24.4 68.6 57.9 37.3 5.7 406 % of dominant taxa 39.1 32.9 19.5 45.4 29.8 34.3 45.3 26.77 % of filterers 17.4 34.2 0 0 8.8 2.9 1.9 208 % of grazers et al., scrapers 40.6 3.7 17.1 2.3 38.6 8.8 11.3 09 No. of clinger taxa 0 0 1 0 1 1 1 010 % of clingers 0 0 2.4 0 7.0 5.9 7.6 011 Family Biotic Index 6.09 6.31 6.06 8.28 6.6 6.85 4.53 5.43
Site I A-Reference site at Pandalam Segment ; Site I B-Test site at Pandalam Segment; Site II A-Reference site at Veeyapuram Segment;Site II B-Test site at Veeyapuram Segment
REFERENCES
Barbour, M.T., Gerristsen, J., Snyder, B.D and Stribling, J.B. 1999. Rapid Bioassessment Protocols for use in streams and wadeablerivers: Periphyton, Benthic Macroinvertebrates and Fish, 2nd Edn. U.S. Environmental Protection Agency; Office of Water;Washington, D.C.1:1-2.
Bass, D. 1995. Species composition of aquatic macroinvertebrates and environmental conditions in cucumber creek. Proc. Okla. Acad.Sci. 75: 39 ñ 44.
Hilsenhoff, W. I. 1998. Rapid field assessment of organic pollution with a family-level biotic index. J. N. Am. Benthol. Soc., 7(1): 65 -68.Morse, J.C, Lianfangam, Y. and Lixin, T. 1994. Aquatic Insects of China useful for Monitoring Water Quality. Hohai University Press,
Nanjing: 570p.
Proceedings of 22nd Kerala Science Congress
522
Genetic polymorphism, protein profile and ecophysiological studies in Avicennia albaBlume. under different habitat conditions
S. R. Harish, S. S. Sunukumar and K. MuruganPlant Biochemistry and Molecular Biology Lab, Department of Botany, University College, Thiruvananthapuram 695034Kerala
INTRODUCTION
The amount of genetic variability in natural populations has been an important focus in the study of populationgenetics, especially its relationship with the microevolutionary forces acting in these populations. Significantenvironmental challenges, including the genetic and physiological effects of environmental pollutants, the rapidspread of diseases and invasive species, the release of transgenic organisms and global climate change, affect ourdaily lives and the sustainability of ecosystems. Managing these environmental problems will require new approachesthat span the biology of genes, organisms, populations, communities and ecosystems. Therefore, the main objectiveof this study is to get a preliminary knowledge of the physiological, biochemical and molecular diversity of Avicenniaalba growing under different mangrove habitats in Kerala.
MATERIAL AND METHODS
Samples of A. alba were collected from three habitats; riverine mangrove(site I): Kumbalam (Kochi), basin mangrove(site II): Ayiramthengu (Kollam), and tide dominated (site III): Kallayi (Calicut) at the northern extension of theArabian Sea coast in Kerala. Photosynthetic pigments, amino acids, carbohydrates, protein and DNA were studiedin the perennial mangrove, A. alba under the influence of different habitat conditions using standard methodologies.The reactive oxygen species (ROS) such as H2O2 and O2
.- were quantified (Gallate and Pracht, 1985 ; Doke N1983). The antioxidant enzymes (AOX) like ascorbate peroxidase (APX), catalase (CAT), glutathione reductase(GR), monodehydro ascorbate reductase (MDHAR) and guaiacol peroxidase (GPX) were isolated and assayed(Vaidyanathan et al.,, 2003). SDS- polyacrylamide gel electrophoresis (SDS-PAGE) was performed for total proteinsaccording to the method of Laemmli (1970). Genomic DNA was extracted and purified from the leaf samples byCTAB method (Doyle and Doyle, 1987). 20 decamer primers were used for RAPD analysis.
RESULTS AND CONCLUSIONS
The difference in biochemical and molecular profile of the species in different habitats are a function of the edaphicfactors. The soil texture differed widely among the habitats, which could be related to the variation of soil material.The total soluble salt (TSS) showed the highest value (12654 ppm) in the soil of habitat (III) and lowest (3869ppm) in site (I). Na+ and Cl- represents the highest cation and anion respectively.
Aminoacids showed interspecific and locational variations. The higher accumulation of total soluble salts in A.alba at site III was associated with appreciable quantities of certain amino acids such as aspartic acid, glutamicacid, lysine, proline, tyrosine, phenyl alanine and amino butyric acid. The photosynthetic pigments, carbohydratesand crude protein attained their higher levels in the species growing Kallayi region (Calicut). The lignin contentalso differed remarkably between the samples of A. alba growing at different habitats (Table 1). 19 protein bandswere detected in total all of which were not necessarily detected in each habitat. Four monomorphic ones withapproximate molecular weights of 48, 45, 31, and 16 KDa were recorded in all populations which could be consideredadaptive proteins to stress tolerance mechanism (Fig 1) Also, four unique bands with mass 100 (site I); 20 (site II);
Proceedings of 22nd Kerala Science Congress, 28-31 January 2010, KFRI, Peechi, pp. 522-523© KSCSTE 2010
08-11
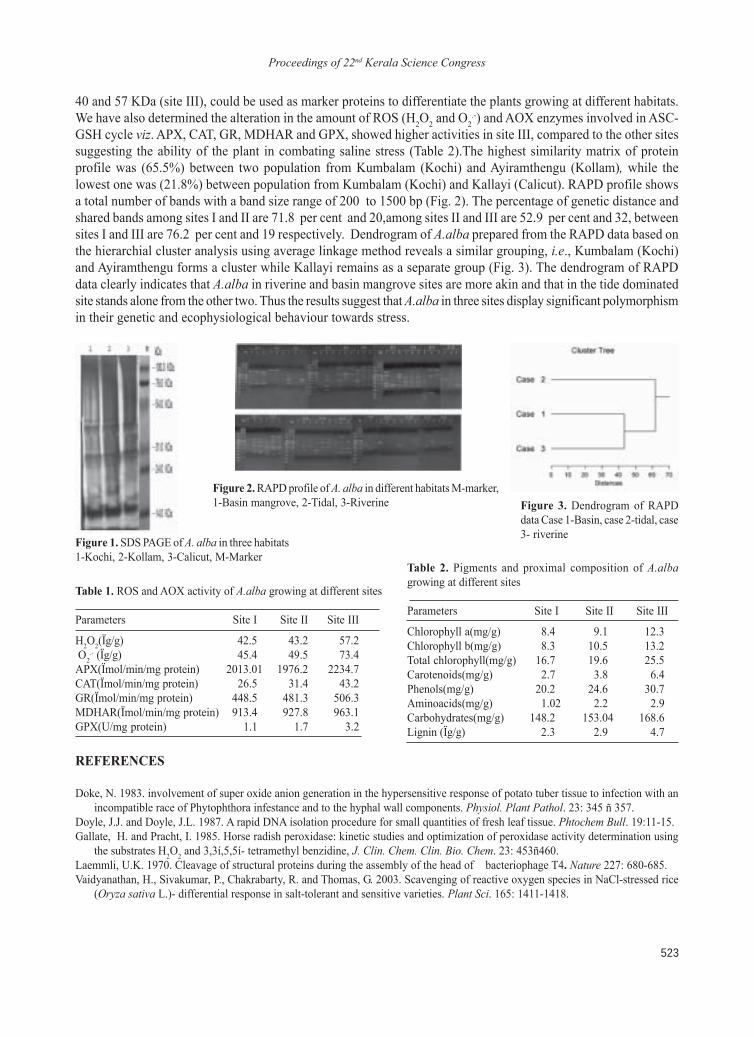
Proceedings of 22nd Kerala Science Congress
523
40 and 57 KDa (site III), could be used as marker proteins to differentiate the plants growing at different habitats.We have also determined the alteration in the amount of ROS (H2O2 and O2
.-) and AOX enzymes involved in ASC-GSH cycle viz. APX, CAT, GR, MDHAR and GPX, showed higher activities in site III, compared to the other sitessuggesting the ability of the plant in combating saline stress (Table 2).The highest similarity matrix of proteinprofile was (65.5%) between two population from Kumbalam (Kochi) and Ayiramthengu (Kollam), while thelowest one was (21.8%) between population from Kumbalam (Kochi) and Kallayi (Calicut). RAPD profile showsa total number of bands with a band size range of 200 to 1500 bp (Fig. 2). The percentage of genetic distance andshared bands among sites I and II are 71.8 per cent and 20,among sites II and III are 52.9 per cent and 32, betweensites I and III are 76.2 per cent and 19 respectively. Dendrogram of A.alba prepared from the RAPD data based onthe hierarchial cluster analysis using average linkage method reveals a similar grouping, i.e., Kumbalam (Kochi)and Ayiramthengu forms a cluster while Kallayi remains as a separate group (Fig. 3). The dendrogram of RAPDdata clearly indicates that A.alba in riverine and basin mangrove sites are more akin and that in the tide dominatedsite stands alone from the other two. Thus the results suggest that A.alba in three sites display significant polymorphismin their genetic and ecophysiological behaviour towards stress.
Figure 3. Dendrogram of RAPDdata Case 1-Basin, case 2-tidal, case3- riverine
Figure 2. RAPD profile of A. alba in different habitats M-marker,1-Basin mangrove, 2-Tidal, 3-Riverine
Figure 1. SDS PAGE of A. alba in three habitats1-Kochi, 2-Kollam, 3-Calicut, M-Marker
Table 1. ROS and AOX activity of A.alba growing at different sites
Parameters Site I Site II Site III
H2O2(Ïg/g) 42.5 43.2 57.2 O2
.- (Ïg/g) 45.4 49.5 73.4APX(Ïmol/min/mg protein) 2013.01 1976.2 2234.7CAT(Ïmol/min/mg protein) 26.5 31.4 43.2GR(Ïmol/min/mg protein) 448.5 481.3 506.3MDHAR(Ïmol/min/mg protein) 913.4 927.8 963.1GPX(U/mg protein) 1.1 1.7 3.2
Table 2. Pigments and proximal composition of A.albagrowing at different sites
Parameters Site I Site II Site III
Chlorophyll a(mg/g) 8.4 9.1 12.3Chlorophyll b(mg/g) 8.3 10.5 13.2Total chlorophyll(mg/g) 16.7 19.6 25.5Carotenoids(mg/g) 2.7 3.8 6.4Phenols(mg/g) 20.2 24.6 30.7Aminoacids(mg/g) 1.02 2.2 2.9Carbohydrates(mg/g) 148.2 153.04 168.6Lignin (Ïg/g) 2.3 2.9 4.7
REFERENCES
Doke, N. 1983. involvement of super oxide anion generation in the hypersensitive response of potato tuber tissue to infection with anincompatible race of Phytophthora infestance and to the hyphal wall components. Physiol. Plant Pathol. 23: 345 ñ 357.
Doyle, J.J. and Doyle, J.L. 1987. A rapid DNA isolation procedure for small quantities of fresh leaf tissue. Phtochem Bull. 19:11-15.Gallate, H. and Pracht, I. 1985. Horse radish peroxidase: kinetic studies and optimization of peroxidase activity determination using
the substrates H2O2 and 3,3í,5,5í- tetramethyl benzidine, J. Clin. Chem. Clin. Bio. Chem. 23: 453ñ460.Laemmli, U.K. 1970. Cleavage of structural proteins during the assembly of the head of bacteriophage T4. Nature 227: 680-685.Vaidyanathan, H., Sivakumar, P., Chakrabarty, R. and Thomas, G. 2003. Scavenging of reactive oxygen species in NaCl-stressed rice
(Oryza sativa L.)- differential response in salt-tolerant and sensitive varieties. Plant Sci. 165: 1411-1418.
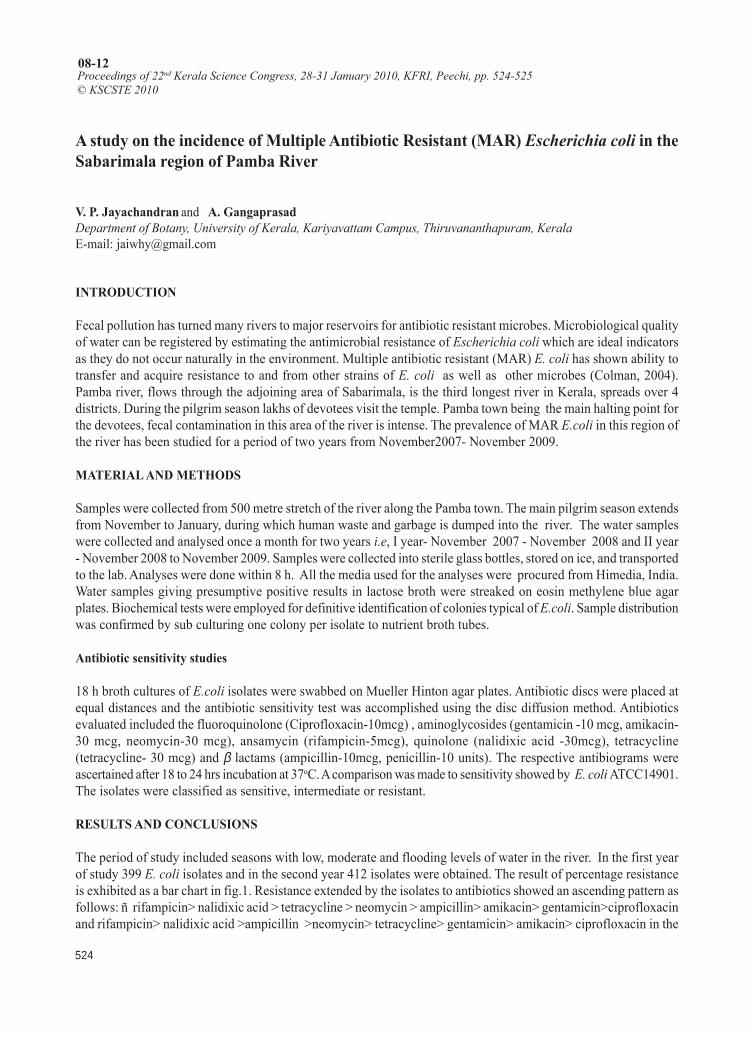
Proceedings of 22nd Kerala Science Congress
524
A study on the incidence of Multiple Antibiotic Resistant (MAR) Escherichia coli in theSabarimala region of Pamba River
V. P. Jayachandran and A. GangaprasadDepartment of Botany, University of Kerala, Kariyavattam Campus, Thiruvananthapuram, KeralaE-mail: [email protected]
INTRODUCTION
Fecal pollution has turned many rivers to major reservoirs for antibiotic resistant microbes. Microbiological qualityof water can be registered by estimating the antimicrobial resistance of Escherichia coli which are ideal indicatorsas they do not occur naturally in the environment. Multiple antibiotic resistant (MAR) E. coli has shown ability totransfer and acquire resistance to and from other strains of E. coli as well as other microbes (Colman, 2004).Pamba river, flows through the adjoining area of Sabarimala, is the third longest river in Kerala, spreads over 4districts. During the pilgrim season lakhs of devotees visit the temple. Pamba town being the main halting point forthe devotees, fecal contamination in this area of the river is intense. The prevalence of MAR E.coli in this region ofthe river has been studied for a period of two years from November2007- November 2009.
MATERIAL AND METHODS
Samples were collected from 500 metre stretch of the river along the Pamba town. The main pilgrim season extendsfrom November to January, during which human waste and garbage is dumped into the river. The water sampleswere collected and analysed once a month for two years i.e, I year- November 2007 - November 2008 and II year- November 2008 to November 2009. Samples were collected into sterile glass bottles, stored on ice, and transportedto the lab. Analyses were done within 8 h. All the media used for the analyses were procured from Himedia, India.Water samples giving presumptive positive results in lactose broth were streaked on eosin methylene blue agarplates. Biochemical tests were employed for definitive identification of colonies typical of E.coli. Sample distributionwas confirmed by sub culturing one colony per isolate to nutrient broth tubes.
Antibiotic sensitivity studies
18 h broth cultures of E.coli isolates were swabbed on Mueller Hinton agar plates. Antibiotic discs were placed atequal distances and the antibiotic sensitivity test was accomplished using the disc diffusion method. Antibioticsevaluated included the fluoroquinolone (Ciprofloxacin-10mcg) , aminoglycosides (gentamicin -10 mcg, amikacin-30 mcg, neomycin-30 mcg), ansamycin (rifampicin-5mcg), quinolone (nalidixic acid -30mcg), tetracycline(tetracycline- 30 mcg) and β lactams (ampicillin-10mcg, penicillin-10 units). The respective antibiograms wereascertained after 18 to 24 hrs incubation at 37oC. A comparison was made to sensitivity showed by E. coli ATCC14901.The isolates were classified as sensitive, intermediate or resistant.
RESULTS AND CONCLUSIONS
The period of study included seasons with low, moderate and flooding levels of water in the river. In the first yearof study 399 E. coli isolates and in the second year 412 isolates were obtained. The result of percentage resistanceis exhibited as a bar chart in fig.1. Resistance extended by the isolates to antibiotics showed an ascending pattern asfollows: ñ rifampicin> nalidixic acid > tetracycline > neomycin > ampicillin> amikacin> gentamicin>ciprofloxacinand rifampicin> nalidixic acid >ampicillin >neomycin> tetracycline> gentamicin> amikacin> ciprofloxacin in the
Proceedings of 22nd Kerala Science Congress, 28-31 January 2010, KFRI, Peechi, pp. 524-525© KSCSTE 2010
08-12
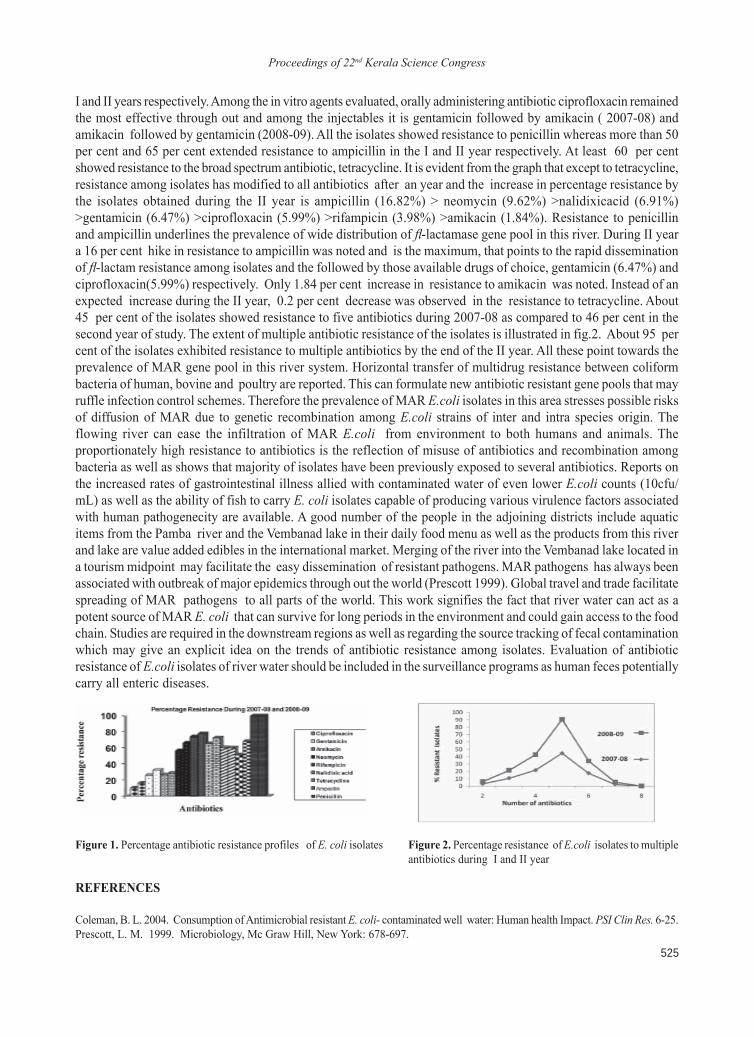
Proceedings of 22nd Kerala Science Congress
525
I and II years respectively. Among the in vitro agents evaluated, orally administering antibiotic ciprofloxacin remainedthe most effective through out and among the injectables it is gentamicin followed by amikacin ( 2007-08) andamikacin followed by gentamicin (2008-09). All the isolates showed resistance to penicillin whereas more than 50per cent and 65 per cent extended resistance to ampicillin in the I and II year respectively. At least 60 per centshowed resistance to the broad spectrum antibiotic, tetracycline. It is evident from the graph that except to tetracycline,resistance among isolates has modified to all antibiotics after an year and the increase in percentage resistance bythe isolates obtained during the II year is ampicillin (16.82%) > neomycin (9.62%) >nalidixicacid (6.91%)>gentamicin (6.47%) >ciprofloxacin (5.99%) >rifampicin (3.98%) >amikacin (1.84%). Resistance to penicillinand ampicillin underlines the prevalence of wide distribution of ß-lactamase gene pool in this river. During II yeara 16 per cent hike in resistance to ampicillin was noted and is the maximum, that points to the rapid disseminationof ß-lactam resistance among isolates and the followed by those available drugs of choice, gentamicin (6.47%) andciprofloxacin(5.99%) respectively. Only 1.84 per cent increase in resistance to amikacin was noted. Instead of anexpected increase during the II year, 0.2 per cent decrease was observed in the resistance to tetracycline. About45 per cent of the isolates showed resistance to five antibiotics during 2007-08 as compared to 46 per cent in thesecond year of study. The extent of multiple antibiotic resistance of the isolates is illustrated in fig.2. About 95 percent of the isolates exhibited resistance to multiple antibiotics by the end of the II year. All these point towards theprevalence of MAR gene pool in this river system. Horizontal transfer of multidrug resistance between coliformbacteria of human, bovine and poultry are reported. This can formulate new antibiotic resistant gene pools that mayruffle infection control schemes. Therefore the prevalence of MAR E.coli isolates in this area stresses possible risksof diffusion of MAR due to genetic recombination among E.coli strains of inter and intra species origin. Theflowing river can ease the infiltration of MAR E.coli from environment to both humans and animals. Theproportionately high resistance to antibiotics is the reflection of misuse of antibiotics and recombination amongbacteria as well as shows that majority of isolates have been previously exposed to several antibiotics. Reports onthe increased rates of gastrointestinal illness allied with contaminated water of even lower E.coli counts (10cfu/mL) as well as the ability of fish to carry E. coli isolates capable of producing various virulence factors associatedwith human pathogenecity are available. A good number of the people in the adjoining districts include aquaticitems from the Pamba river and the Vembanad lake in their daily food menu as well as the products from this riverand lake are value added edibles in the international market. Merging of the river into the Vembanad lake located ina tourism midpoint may facilitate the easy dissemination of resistant pathogens. MAR pathogens has always beenassociated with outbreak of major epidemics through out the world (Prescott 1999). Global travel and trade facilitatespreading of MAR pathogens to all parts of the world. This work signifies the fact that river water can act as apotent source of MAR E. coli that can survive for long periods in the environment and could gain access to the foodchain. Studies are required in the downstream regions as well as regarding the source tracking of fecal contaminationwhich may give an explicit idea on the trends of antibiotic resistance among isolates. Evaluation of antibioticresistance of E.coli isolates of river water should be included in the surveillance programs as human feces potentiallycarry all enteric diseases.
REFERENCES
Coleman, B. L. 2004. Consumption of Antimicrobial resistant E. coli- contaminated well water: Human health Impact. PSI Clin Res. 6-25.Prescott, L. M. 1999. Microbiology, Mc Graw Hill, New York: 678-697.
Figure 1. Percentage antibiotic resistance profiles of E. coli isolates Figure 2. Percentage resistance of E.coli isolates to multipleantibiotics during I and II year
Proceedings of 22nd Kerala Science Congress
526
Proceedings of 22nd Kerala Science Congress, 28-31 January 2010, KFRI, Peechi, pp. 526-527© KSCSTE 2010
08-13
Molecules that invite defoliator outbreak in teak plantations
Bindu Jose, V. V. Sudheendrakumar and T.V. SajeevEntomology Department, Kerala Forest Research Institute, Peechi 680 653 Thrissur, Kerala
INTRODUCTION
Outbreak of the caterpillar Hyblaea puera Cramer (Teak defoliator) is a major threat to teak plantations (Beeson,1941). Defoliation causes an average loss of 44 per cent of the potential volume increment (Nair et al., 1985). With alife span of nearly three weeks, teak defoliator can theoretically complete 14 generations in one year in teak plantations.But, not all generations cause widespread defoliation in plantations. In the case of teak plantations in Nilambur, thisinsect is copious from April to June, just after the monsoon shower and some times during August to September(Beeson, 1941). In fact, it is hard to predict the exact time and place of this insect outburst in teak plantations(Chandrasekhar et al., 2004). Several studies had done on the population dynamics of Hyblaea in the past decades. Thestudy of Nair and Sudheendrakumar indicate the migration of moth population (Nair and Sudheendrakumar, 1986).They put forward an implication of habitual, short range, gypsy type movements of emerging moth populations,suggesting that these populations spread to large and larger areas, generation by generation upsetting the entire teakplantations (Nair and Sudheendrakumar, 1986). Another study on population dynamics specified that out breaks beginin small epicenters and spread step wise to larger and larger areas during the monsoon season (Nair and Mohanadas,1996). Based on these two studies to understand the relationship between the epicenter and out break population ascreening of nuclear DNA and mitochondrial polymorphism using RAGEP was carried out. This study clearly suggeststhat the endemic insects are not involved in causing the out break and supports the idea of immigration of moths fromneighboring regions (Chandrasekhar et al., 2004). It has been recognized that the most important prerequisite for theinitiation of teak defoliator infestation in a teak stand is the availability of tender foliage. The neonate larvae of teakdefoliator need the tender foliage to survive, while the later larval stages can survive even on mature leaves. Thefemale moth exclusively lay eggs on the under surface of tender teak leaves. The current study attempted to identifythe chemical profile of the tender leaves as opposed to that of the mature leaf so as to identify the cue detected bythe female moth to identify tender teak leaves. This is expected help develop a trapping mechanism by whichgravid females can be collected and large scale outbreaks averted.
MATERIAL AND METHOD
Samples for volatile analysis
Fresh leaves of tender and mature leaves of teak were collected between 11 and 11.30 am from lower branches ofa single tree growing in the campus of Cashew Export and Promotion Council of Kollam. The leaves were clippedfrom the petioles and placed in glass bottles with rubber caps. Which were sealed and transported immediately tothe laboratory. The material in the bottle was heated to 450C and the gas evolved at the top was collected using asyringe and subjected to volatile analysis using Head Space GCMS Varian MS #1. The column used was VF5MS.The carrier gas was He with a split ratio of 100. The injection pot temperature was 1200C. The initial oven temperaturewas 500C and the final oven temperature was2000C.
Samples for biochemical analysis
The mature and tender teak leaves were collected and dried in a hot air oven at 550C for 48 hours. Then it waspowdered and utilized to different tests such as carbohydrate (Anthrone method), protein (Lowryís method), totalsugar (glucose oxidize method), reducing sugar (Dinitrosalicylic acid method), total oil (extraction with petroleumether), crude fiber (acid alkali treatment), nitrogen (Micro-Kjeldahl method), moisture content and PH.
Proceedings of 22nd Kerala Science Congress
527
RESULTS AND CONCLUSIONS
It was observed that the tender leaves had six volatiles while the mature leaf had only two. The missing componentsfrom the mature leaf were found to be insect attractants. The volatile composition is listed in Table 1. The biochemicalcontents are also markedly different in mature and tender leaves. The tested components are having high dietaryvalue and vital for Lepidopteran growth (Table 2).
From the obtained volatiles alpha pinene, beta phyllandrene, sabinene and beta carophyllene have profound effectin the behavioral pattern of Lepidoptera (Grant et al.,2007) . They act as attractant, allomones and augment ovipositionrate. In the tender teak leaf the content of alpha pinene is outstandingly higher than in the mature leaf. Alpha pinenepromotes oviposition (Grant et al., 2007) act as attractant in Lepidoptera (Bruce et al., 2005). The volatiles play amajor role in recognizing host plants at a distance. Biochemical content of the tender leaf also helps the defoliatorfor their proper growth. All Lepidopteran insects need high content of protein and carbohydrate in their diet. Moisturecontent of the diet is also a crucial factor for the development of Lepidoptera. The new foliage buildup whichhappens in teak stands along with the pre-monsoon showers would increase the amount of volatiles in the air whichwould attract the teak defoliator moths in flight to descend and lay eggs. Elucidating the precise combination of theleaf volatiles and the quantity at which it can work as attractant would help is developing chemical baits which cantrap gravid females.
REFERENCES
Anne, C. Gaskett, Elena Conti. and Florian P. Schiest. 2005. Floral odor variation in two heterostylous species of Primula. Journalof Cchemical Ecology 31(5):�1223-1228.�
Beeson, C.F.C. 1941. The Ecology and Control of the Forest Insects of India and Neighboring Countries. Reprint 1961.Govt. of IndiaPublication, 767.
Chandrasekhar, N., Sudheendrakumar, V. V. and Moinak Banerjee 2004. A study on the population dynamics of the Teak defoliator inNilambur Teak plantation: A novel approach using RAGEP. Proceedings of Sixteenth Kerala Science Congress, 412-417.
Gary, G. Grant., Jian Guo., Linda MacDonald and Melanie D. Coppens 2007. Oviposition response of spruce budworm (Lepidoptera:Tortricidae) to host terpenes and green-leaf volatiles. The Canadian Entomologist 139(4):564-575.
Nair, K .S .S., Sudheendrakumar, V. V., Varma, R. V. and Chacko, K.C. 1985. Volume increment of teak, KFRI Research Report No. 30,Kerala Forest Research Institute, 78p.
Nair, K.S.S. and Mohandas 1996. Early events in the out break of the teak caterpillar, Hyblaea puera. International Journal of Ecologyand Environmental Sciences 22: 271-279.
Table 1. Volatile content of tender and mature teak leaf
Tender leaf Mature leafSl No. Compound name RT amount Sl No. Compound name RT amount
1 Ethanol,2-methoxy- 1.391 4.074% 1 Ethanol,2-methoxy- 1.393 85.8482 1R-.alpha.-Pinene 8.411 93.557% 2 1R-.alpha.-Pinene 8.413 14.1523 beta.-Phellandrene 10.105 0.551%4 Sabinene 10.301 0.955%5 Caryophyllene 21.448 0.732%6 alpha.-Caryophyllene 21.819 0.131
RT ñretention time
Table 2. Biochemical content of mature and tender teak leaves
Sl No. Parameters Mature Tender
1 carbohydrate 28.7% 88.3%2 protein 8.7% 16.3%3 Total sugar 6.7% 7.7%4 Reducing sugar 1% 1%5 Total oil 4.7% 4.9%6 Crude fibre 17.8% 9.1%7 nitrogen 1.4% 2.6%8 moisture 20.8% 71.1%9 PH 6% 5%
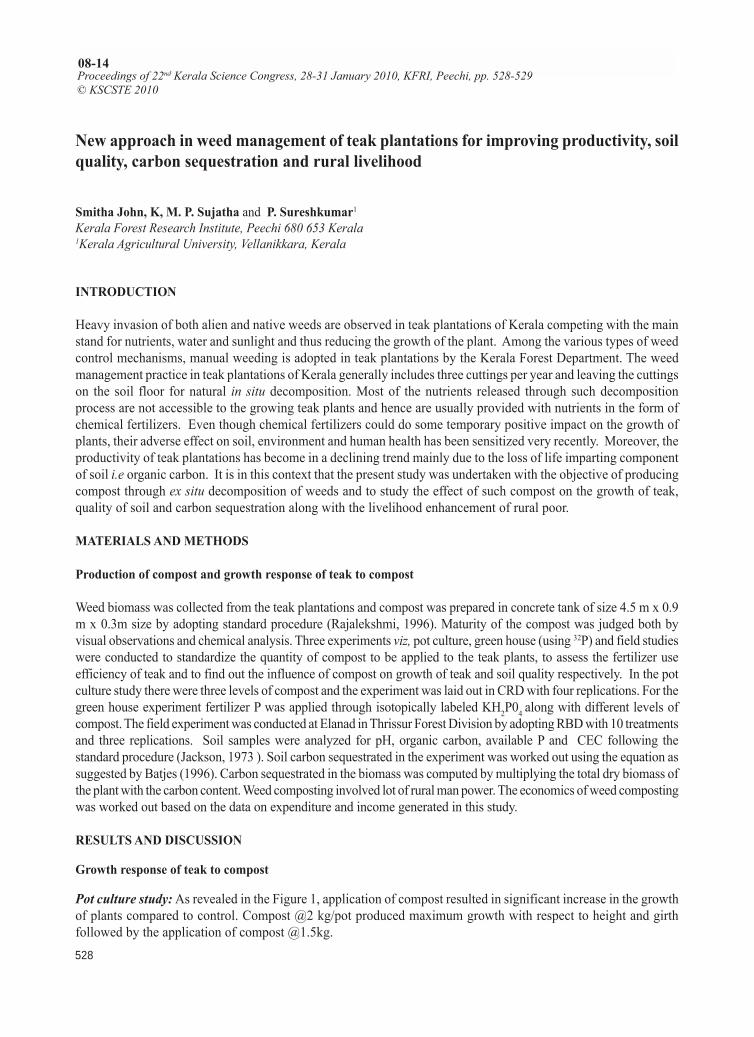
Proceedings of 22nd Kerala Science Congress
528
New approach in weed management of teak plantations for improving productivity, soilquality, carbon sequestration and rural livelihood
Smitha John, K, M. P. Sujatha and P. Sureshkumar1Kerala Forest Research Institute, Peechi 680 653 Kerala1Kerala Agricultural University, Vellanikkara, Kerala
INTRODUCTION
Heavy invasion of both alien and native weeds are observed in teak plantations of Kerala competing with the mainstand for nutrients, water and sunlight and thus reducing the growth of the plant. Among the various types of weedcontrol mechanisms, manual weeding is adopted in teak plantations by the Kerala Forest Department. The weedmanagement practice in teak plantations of Kerala generally includes three cuttings per year and leaving the cuttingson the soil floor for natural in situ decomposition. Most of the nutrients released through such decompositionprocess are not accessible to the growing teak plants and hence are usually provided with nutrients in the form ofchemical fertilizers. Even though chemical fertilizers could do some temporary positive impact on the growth ofplants, their adverse effect on soil, environment and human health has been sensitized very recently. Moreover, theproductivity of teak plantations has become in a declining trend mainly due to the loss of life imparting componentof soil i.e organic carbon. It is in this context that the present study was undertaken with the objective of producingcompost through ex situ decomposition of weeds and to study the effect of such compost on the growth of teak,quality of soil and carbon sequestration along with the livelihood enhancement of rural poor.
MATERIALS AND METHODS
Production of compost and growth response of teak to compost
Weed biomass was collected from the teak plantations and compost was prepared in concrete tank of size 4.5 m x 0.9m x 0.3m size by adopting standard procedure (Rajalekshmi, 1996). Maturity of the compost was judged both byvisual observations and chemical analysis. Three experiments viz, pot culture, green house (using 32P) and field studieswere conducted to standardize the quantity of compost to be applied to the teak plants, to assess the fertilizer useefficiency of teak and to find out the influence of compost on growth of teak and soil quality respectively. In the potculture study there were three levels of compost and the experiment was laid out in CRD with four replications. For thegreen house experiment fertilizer P was applied through isotopically labeled KH2P04 along with different levels ofcompost. The field experiment was conducted at Elanad in Thrissur Forest Division by adopting RBD with 10 treatmentsand three replications. Soil samples were analyzed for pH, organic carbon, available P and CEC following thestandard procedure (Jackson, 1973 ). Soil carbon sequestrated in the experiment was worked out using the equation assuggested by Batjes (1996). Carbon sequestrated in the biomass was computed by multiplying the total dry biomass ofthe plant with the carbon content. Weed composting involved lot of rural man power. The economics of weed compostingwas worked out based on the data on expenditure and income generated in this study.
RESULTS AND DISCUSSION
Growth response of teak to compost
Pot culture study: As revealed in the Figure 1, application of compost resulted in significant increase in the growthof plants compared to control. Compost @2 kg/pot produced maximum growth with respect to height and girthfollowed by the application of compost @1.5kg.
Proceedings of 22nd Kerala Science Congress, 28-31 January 2010, KFRI, Peechi, pp. 528-529© KSCSTE 2010
08-14
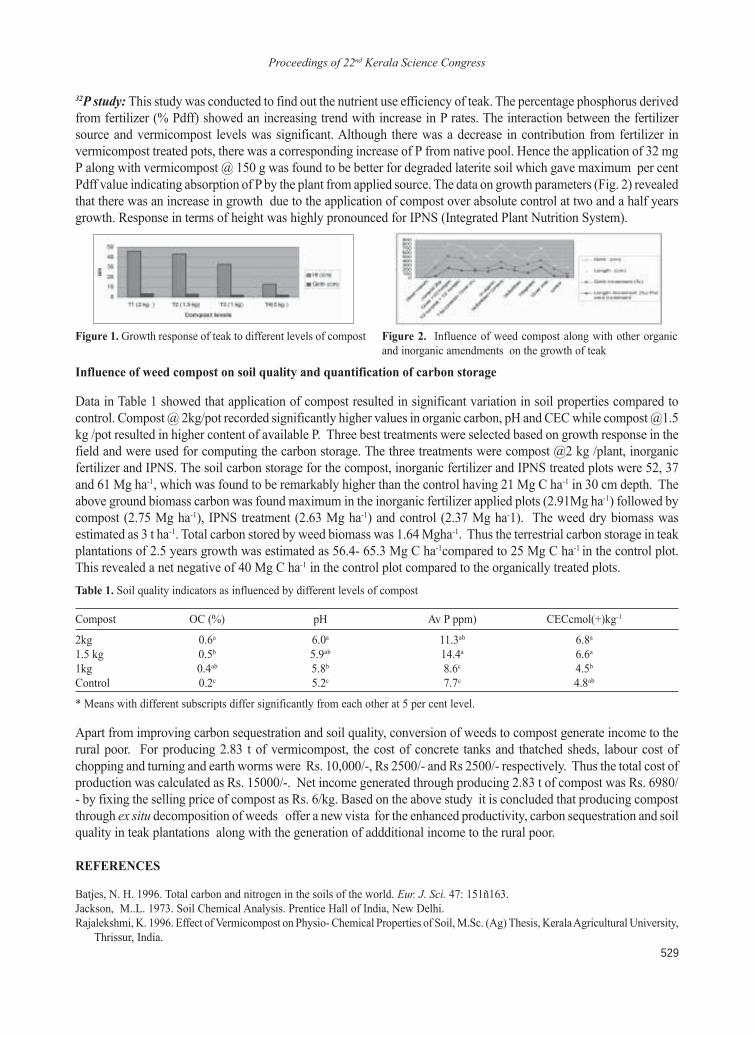
Proceedings of 22nd Kerala Science Congress
529
32P study: This study was conducted to find out the nutrient use efficiency of teak. The percentage phosphorus derivedfrom fertilizer (% Pdff) showed an increasing trend with increase in P rates. The interaction between the fertilizersource and vermicompost levels was significant. Although there was a decrease in contribution from fertilizer invermicompost treated pots, there was a corresponding increase of P from native pool. Hence the application of 32 mgP along with vermicompost @ 150 g was found to be better for degraded laterite soil which gave maximum per centPdff value indicating absorption of P by the plant from applied source. The data on growth parameters (Fig. 2) revealedthat there was an increase in growth due to the application of compost over absolute control at two and a half yearsgrowth. Response in terms of height was highly pronounced for IPNS (Integrated Plant Nutrition System).
Figure 2. Influence of weed compost along with other organicand inorganic amendments on the growth of teak
Table 1. Soil quality indicators as influenced by different levels of compost
Compost OC (%) pH Av P ppm) CECcmol(+)kg-1
2kg 0.6a 6.0a 11.3ab 6.8a1.5 kg 0.5b 5.9ab 14.4a 6.6a1kg 0.4ab 5.8b 8.6c 4.5bControl 0.2c 5.2c 7.7c 4.8ab
* Means with different subscripts differ significantly from each other at 5 per cent level.
Figure 1. Growth response of teak to different levels of compost
Influence of weed compost on soil quality and quantification of carbon storage
Data in Table 1 showed that application of compost resulted in significant variation in soil properties compared tocontrol. Compost @ 2kg/pot recorded significantly higher values in organic carbon, pH and CEC while compost @1.5kg /pot resulted in higher content of available P. Three best treatments were selected based on growth response in thefield and were used for computing the carbon storage. The three treatments were compost @2 kg /plant, inorganicfertilizer and IPNS. The soil carbon storage for the compost, inorganic fertilizer and IPNS treated plots were 52, 37and 61 Mg ha-1, which was found to be remarkably higher than the control having 21 Mg C ha-1 in 30 cm depth. Theabove ground biomass carbon was found maximum in the inorganic fertilizer applied plots (2.91Mg ha-1) followed bycompost (2.75 Mg ha-1), IPNS treatment (2.63 Mg ha-1) and control (2.37 Mg ha-1). The weed dry biomass wasestimated as 3 t ha-1. Total carbon stored by weed biomass was 1.64 Mgha-1. Thus the terrestrial carbon storage in teakplantations of 2.5 years growth was estimated as 56.4- 65.3 Mg C ha-1compared to 25 Mg C ha-1 in the control plot.This revealed a net negative of 40 Mg C ha-1 in the control plot compared to the organically treated plots.
Apart from improving carbon sequestration and soil quality, conversion of weeds to compost generate income to therural poor. For producing 2.83 t of vermicompost, the cost of concrete tanks and thatched sheds, labour cost ofchopping and turning and earth worms were Rs. 10,000/-, Rs 2500/- and Rs 2500/- respectively. Thus the total cost ofproduction was calculated as Rs. 15000/-. Net income generated through producing 2.83 t of compost was Rs. 6980/- by fixing the selling price of compost as Rs. 6/kg. Based on the above study it is concluded that producing compostthrough ex situ decomposition of weeds offer a new vista for the enhanced productivity, carbon sequestration and soilquality in teak plantations along with the generation of addditional income to the rural poor.
REFERENCES
Batjes, N. H. 1996. Total carbon and nitrogen in the soils of the world. Eur. J. Sci. 47: 151ñ163.Jackson, M..L. 1973. Soil Chemical Analysis. Prentice Hall of India, New Delhi.Rajalekshmi, K. 1996. Effect of Vermicompost on Physio- Chemical Properties of Soil, M.Sc. (Ag) Thesis, Kerala Agricultural University,
Thrissur, India.
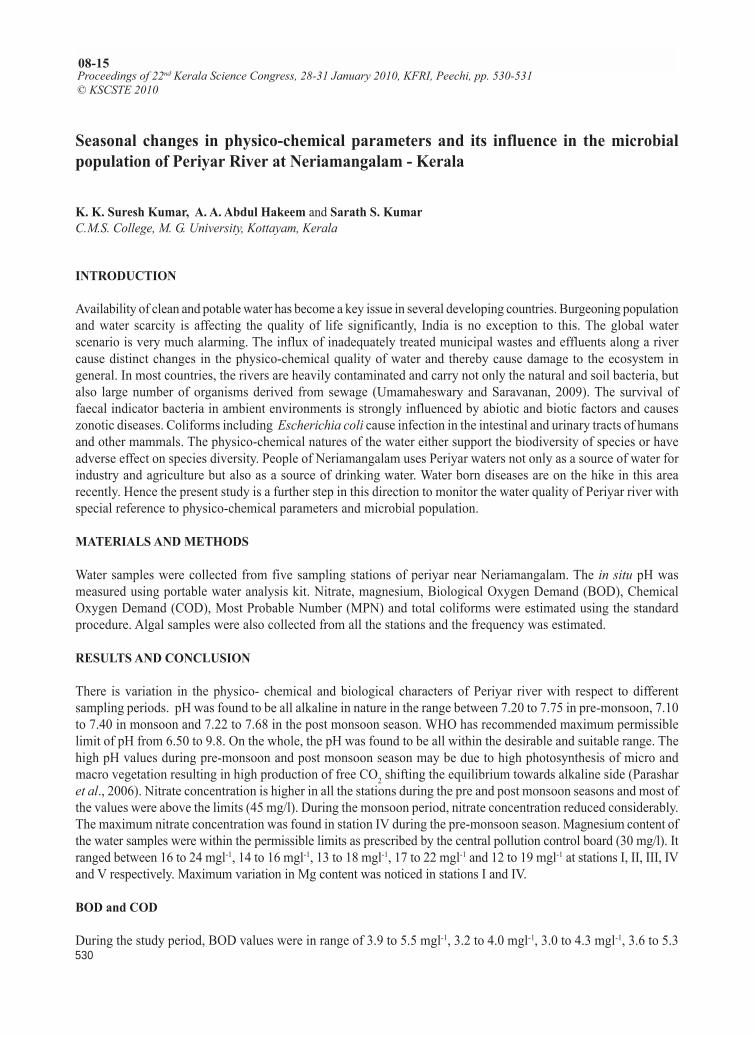
Proceedings of 22nd Kerala Science Congress
530
Proceedings of 22nd Kerala Science Congress, 28-31 January 2010, KFRI, Peechi, pp. 530-531© KSCSTE 2010
08-15
Seasonal changes in physico-chemical parameters and its influence in the microbialpopulation of Periyar River at Neriamangalam - Kerala
K. K. Suresh Kumar, A. A. Abdul Hakeem and Sarath S. KumarC.M.S. College, M. G. University, Kottayam, Kerala
INTRODUCTION
Availability of clean and potable water has become a key issue in several developing countries. Burgeoning populationand water scarcity is affecting the quality of life significantly, India is no exception to this. The global waterscenario is very much alarming. The influx of inadequately treated municipal wastes and effluents along a rivercause distinct changes in the physico-chemical quality of water and thereby cause damage to the ecosystem ingeneral. In most countries, the rivers are heavily contaminated and carry not only the natural and soil bacteria, butalso large number of organisms derived from sewage (Umamaheswary and Saravanan, 2009). The survival offaecal indicator bacteria in ambient environments is strongly influenced by abiotic and biotic factors and causeszonotic diseases. Coliforms including Escherichia coli cause infection in the intestinal and urinary tracts of humansand other mammals. The physico-chemical natures of the water either support the biodiversity of species or haveadverse effect on species diversity. People of Neriamangalam uses Periyar waters not only as a source of water forindustry and agriculture but also as a source of drinking water. Water born diseases are on the hike in this arearecently. Hence the present study is a further step in this direction to monitor the water quality of Periyar river withspecial reference to physico-chemical parameters and microbial population.
MATERIALS AND METHODS
Water samples were collected from five sampling stations of periyar near Neriamangalam. The in situ pH wasmeasured using portable water analysis kit. Nitrate, magnesium, Biological Oxygen Demand (BOD), ChemicalOxygen Demand (COD), Most Probable Number (MPN) and total coliforms were estimated using the standardprocedure. Algal samples were also collected from all the stations and the frequency was estimated.
RESULTS AND CONCLUSION
There is variation in the physico- chemical and biological characters of Periyar river with respect to differentsampling periods. pH was found to be all alkaline in nature in the range between 7.20 to 7.75 in pre-monsoon, 7.10to 7.40 in monsoon and 7.22 to 7.68 in the post monsoon season. WHO has recommended maximum permissiblelimit of pH from 6.50 to 9.8. On the whole, the pH was found to be all within the desirable and suitable range. Thehigh pH values during pre-monsoon and post monsoon season may be due to high photosynthesis of micro andmacro vegetation resulting in high production of free CO2 shifting the equilibrium towards alkaline side (Parasharet al., 2006). Nitrate concentration is higher in all the stations during the pre and post monsoon seasons and most ofthe values were above the limits (45 mg/l). During the monsoon period, nitrate concentration reduced considerably.The maximum nitrate concentration was found in station IV during the pre-monsoon season. Magnesium content ofthe water samples were within the permissible limits as prescribed by the central pollution control board (30 mg/l). Itranged between 16 to 24 mgl-1, 14 to 16 mgl-1, 13 to 18 mgl-1, 17 to 22 mgl-1 and 12 to 19 mgl-1 at stations I, II, III, IVand V respectively. Maximum variation in Mg content was noticed in stations I and IV.
BOD and COD
During the study period, BOD values were in range of 3.9 to 5.5 mgl-1, 3.2 to 4.0 mgl-1, 3.0 to 4.3 mgl-1, 3.6 to 5.3
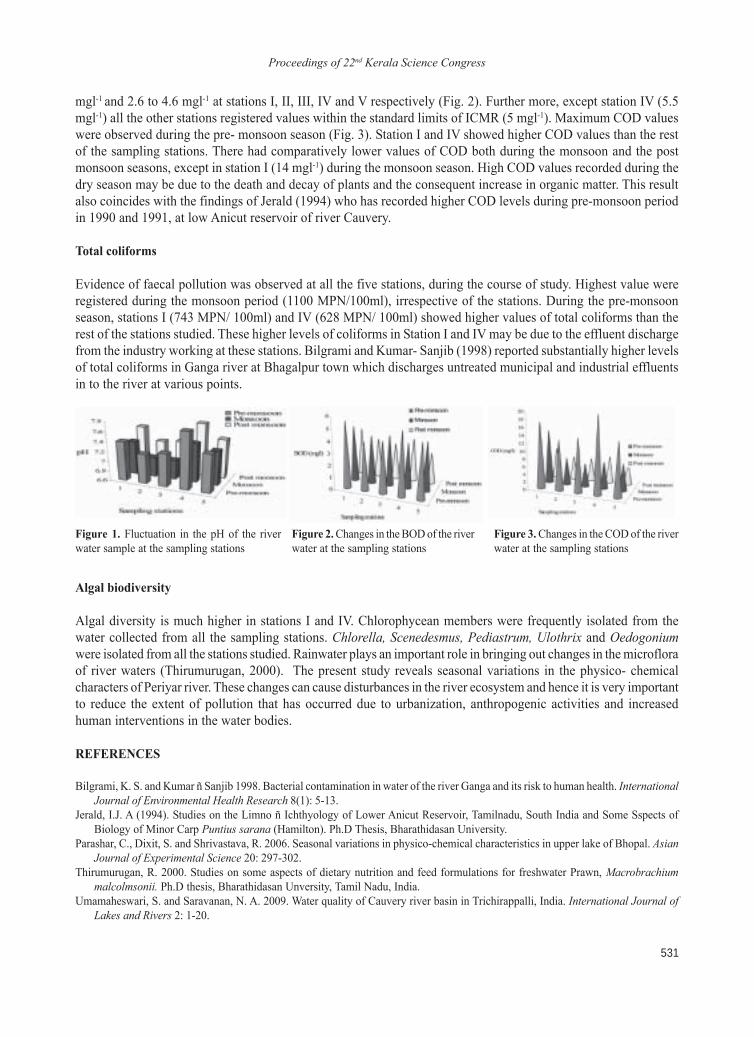
Proceedings of 22nd Kerala Science Congress
531
mgl-1 and 2.6 to 4.6 mgl-1 at stations I, II, III, IV and V respectively (Fig. 2). Further more, except station IV (5.5mgl-1) all the other stations registered values within the standard limits of ICMR (5 mgl-1). Maximum COD valueswere observed during the pre- monsoon season (Fig. 3). Station I and IV showed higher COD values than the restof the sampling stations. There had comparatively lower values of COD both during the monsoon and the postmonsoon seasons, except in station I (14 mgl-1) during the monsoon season. High COD values recorded during thedry season may be due to the death and decay of plants and the consequent increase in organic matter. This resultalso coincides with the findings of Jerald (1994) who has recorded higher COD levels during pre-monsoon periodin 1990 and 1991, at low Anicut reservoir of river Cauvery.
Total coliforms
Evidence of faecal pollution was observed at all the five stations, during the course of study. Highest value wereregistered during the monsoon period (1100 MPN/100ml), irrespective of the stations. During the pre-monsoonseason, stations I (743 MPN/ 100ml) and IV (628 MPN/ 100ml) showed higher values of total coliforms than therest of the stations studied. These higher levels of coliforms in Station I and IV may be due to the effluent dischargefrom the industry working at these stations. Bilgrami and Kumar- Sanjib (1998) reported substantially higher levelsof total coliforms in Ganga river at Bhagalpur town which discharges untreated municipal and industrial effluentsin to the river at various points.
Figure 1. Fluctuation in the pH of the riverwater sample at the sampling stations
Figure 3. Changes in the COD of the riverwater at the sampling stations
Figure 2. Changes in the BOD of the riverwater at the sampling stations
Algal biodiversity
Algal diversity is much higher in stations I and IV. Chlorophycean members were frequently isolated from thewater collected from all the sampling stations. Chlorella, Scenedesmus, Pediastrum, Ulothrix and Oedogoniumwere isolated from all the stations studied. Rainwater plays an important role in bringing out changes in the microfloraof river waters (Thirumurugan, 2000). The present study reveals seasonal variations in the physico- chemicalcharacters of Periyar river. These changes can cause disturbances in the river ecosystem and hence it is very importantto reduce the extent of pollution that has occurred due to urbanization, anthropogenic activities and increasedhuman interventions in the water bodies.
REFERENCES
Bilgrami, K. S. and Kumar ñ Sanjib 1998. Bacterial contamination in water of the river Ganga and its risk to human health. InternationalJournal of Environmental Health Research 8(1): 5-13.
Jerald, I.J. A (1994). Studies on the Limno ñ Ichthyology of Lower Anicut Reservoir, Tamilnadu, South India and Some Sspects ofBiology of Minor Carp Puntius sarana (Hamilton). Ph.D Thesis, Bharathidasan University.
Parashar, C., Dixit, S. and Shrivastava, R. 2006. Seasonal variations in physico-chemical characteristics in upper lake of Bhopal. AsianJournal of Experimental Science 20: 297-302.
Thirumurugan, R. 2000. Studies on some aspects of dietary nutrition and feed formulations for freshwater Prawn, Macrobrachiummalcolmsonii. Ph.D thesis, Bharathidasan Unversity, Tamil Nadu, India.
Umamaheswari, S. and Saravanan, N. A. 2009. Water quality of Cauvery river basin in Trichirappalli, India. International Journal ofLakes and Rivers 2: 1-20.
Proceedings of 22nd Kerala Science Congress
532
Spatio-temporal dynamics of forest degradation of Attapady landscape, Western Ghats
K. Anitha1 E.V. Ramasamy1 and S. Narendra Prasad 21School of Environmental Sciences, Mahatma Gandhi University, Kottayam 686 560 Kerala2Division of Landscape Ecology, Salim Ali Centre for Ornithology and Natural History, Anaikatty 641 108 Tamil NaduE-mail: [email protected]
INTRODUCTION
Attapady landscape falls on the foothills of Western Ghats biodiversity hotspot, has undergone rapid changes inland cover in the last few decades. The immigration of human population from other areas with cumulative impactsfrom socio-economic backwardness of the native tribes resulted the evolution of current landscape. Hence thepresent paper intends to map the current land cover in the Attapady landscape, and to assess the land cover changesoccurred during the last three decades.
MATERIALS AND METHODS
We have used Landsat Multi Spectral Scanner (MSS, dated 10th February 1973), Landsat Thematic Mapper (TM,dated 14th January 1992) and Landsat Enhanced Thematic Mapper (ETM, dated 03rd March 2001) which were availablethrough Global Land Cover Facility (GLCF) (http://glcf.umd.edu) and the U.S. Geological Survey (USGS) Center forEarth Resources Observation and Science (EROS) (http://glovis.usgs.gov). An IRS P6 LISS III image dated 8thFebruary, 2005 was acquired from National Remote Sensing Agency (NRSA) Data Center, Hyderabad, India. Wehave prepared the vegetation type map based on supervised classification of LISS III data. Based on the knowledgeof the data and ground truth information, we have identified nine different land use / land cover classes. Parametricsignatures have used to train a statistically based (e.g. mean and covariance matrix) classifier to define the classes.The locations of the training sites have been digitized from maps with the Erdas Imagine AOI tools. After thesignatures have defined, the pixels of the image were sorted into classes based on maximum likelihood parametricrule. The classified output thoroughly checked and recoded wherever doubts existed. An Accuracy AssessmentCellArray has been created to compare the classified image with reference data, collected at 286 sample pointsduring field survey. For change detection, we used post-classification techniques. A post-classification changematrix function was applied between 1973-1992, 1973-2001, 1973-2005, 1992-2001,1992-2005 and 2001-2005classification results.
RESULTS AND CONCLUSION
Vegetation and land cover type mapping using the IRS P6 LISS III data of 2005 showed that the area is predominantlycovered by thorny scrubland (17%) and agriculture/plantations (15%). The nine land cover classes, area statisticsand estimated classification accuracies are given in Table 1. The forest categories are approximately constituted 65per cent of the area. Thorny scrubland is considered as a degraded forest type (Champion and Seth, 1967) and isincluded in the forest categories. Among the other forest types, dry deciduous forest covers 14 per cent, moistdeciduous 13 per cent, semievergreen forest 13 per cent and evergreen forest 9 per cent. Non forest categories suchas agriculture/plantations and barren/settlement areas cover approximately 30 per cent of the total area. The remaining5 per cent is occupied by grasslands. The overall classification accuracy was 76 per cent. The accuracy of waterbodies was 100 per cent due to its distinctive spectral difference. The lowest producerís accuracy was observed forthorny scrub forest (60%) followed by dry deciduous forest (69%). In case of userís accuracy, the lowest is reportedfor semievergreen forest (64%) followed by barren/settlement areas (67%).
Proceedings of 22nd Kerala Science Congress, 28-31 January 2010, KFRI, Peechi, pp. 532-533© KSCSTE 2010
08-16
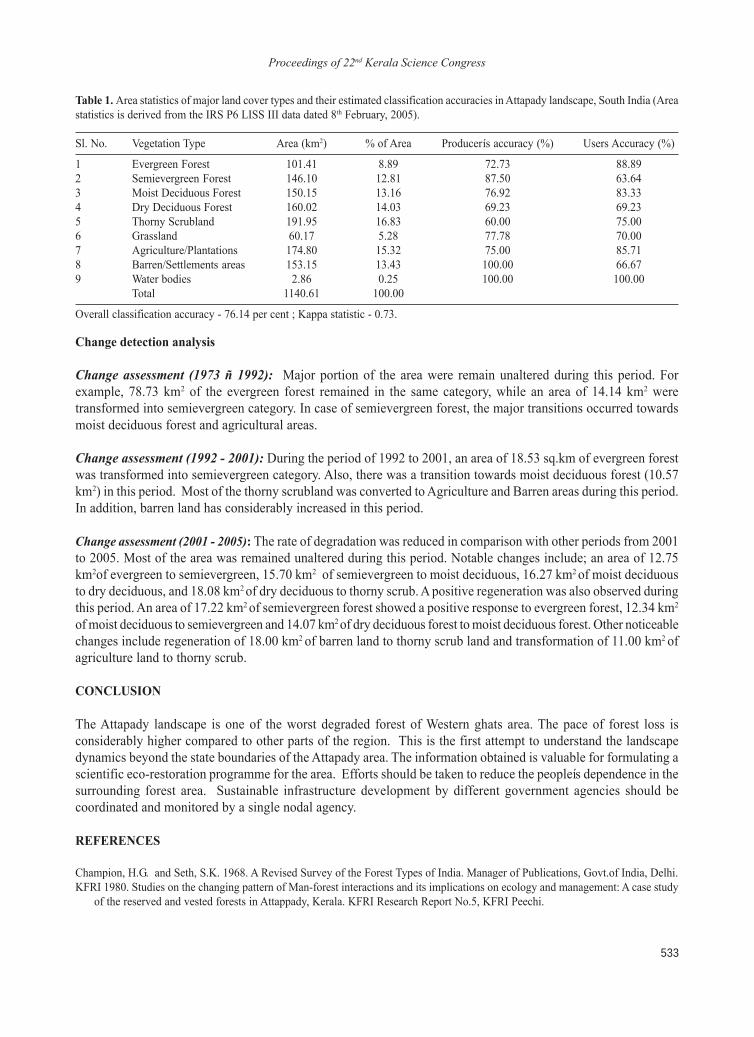
Proceedings of 22nd Kerala Science Congress
533
Table 1. Area statistics of major land cover types and their estimated classification accuracies in Attapady landscape, South India (Areastatistics is derived from the IRS P6 LISS III data dated 8th February, 2005).
Sl. No. Vegetation Type Area (km2) % of Area Producerís accuracy (%) Users Accuracy (%)
1 Evergreen Forest 101.41 8.89 72.73 88.892 Semievergreen Forest 146.10 12.81 87.50 63.643 Moist Deciduous Forest 150.15 13.16 76.92 83.334 Dry Deciduous Forest 160.02 14.03 69.23 69.235 Thorny Scrubland 191.95 16.83 60.00 75.006 Grassland 60.17 5.28 77.78 70.007 Agriculture/Plantations 174.80 15.32 75.00 85.718 Barren/Settlements areas 153.15 13.43 100.00 66.679 Water bodies 2.86 0.25 100.00 100.00
Total 1140.61 100.00
Overall classification accuracy - 76.14 per cent ; Kappa statistic - 0.73.
Change detection analysis
Change assessment (1973 ñ 1992): Major portion of the area were remain unaltered during this period. Forexample, 78.73 km2 of the evergreen forest remained in the same category, while an area of 14.14 km2 weretransformed into semievergreen category. In case of semievergreen forest, the major transitions occurred towardsmoist deciduous forest and agricultural areas.
Change assessment (1992 - 2001): During the period of 1992 to 2001, an area of 18.53 sq.km of evergreen forestwas transformed into semievergreen category. Also, there was a transition towards moist deciduous forest (10.57km2) in this period. Most of the thorny scrubland was converted to Agriculture and Barren areas during this period.In addition, barren land has considerably increased in this period.
Change assessment (2001 - 2005): The rate of degradation was reduced in comparison with other periods from 2001to 2005. Most of the area was remained unaltered during this period. Notable changes include; an area of 12.75km2of evergreen to semievergreen, 15.70 km2 of semievergreen to moist deciduous, 16.27 km2 of moist deciduousto dry deciduous, and 18.08 km2 of dry deciduous to thorny scrub. A positive regeneration was also observed duringthis period. An area of 17.22 km2 of semievergreen forest showed a positive response to evergreen forest, 12.34 km2
of moist deciduous to semievergreen and 14.07 km2 of dry deciduous forest to moist deciduous forest. Other noticeablechanges include regeneration of 18.00 km2 of barren land to thorny scrub land and transformation of 11.00 km2 ofagriculture land to thorny scrub.
CONCLUSION
The Attapady landscape is one of the worst degraded forest of Western ghats area. The pace of forest loss isconsiderably higher compared to other parts of the region. This is the first attempt to understand the landscapedynamics beyond the state boundaries of the Attapady area. The information obtained is valuable for formulating ascientific eco-restoration programme for the area. Efforts should be taken to reduce the peopleís dependence in thesurrounding forest area. Sustainable infrastructure development by different government agencies should becoordinated and monitored by a single nodal agency.
REFERENCES
Champion, H.G. and Seth, S.K. 1968. A Revised Survey of the Forest Types of India. Manager of Publications, Govt.of India, Delhi.KFRI 1980. Studies on the changing pattern of Man-forest interactions and its implications on ecology and management: A case study
of the reserved and vested forests in Attappady, Kerala. KFRI Research Report No.5, KFRI Peechi.
Proceedings of 22nd Kerala Science Congress
534
Performance of an anaerobic hybrid system with polyurethane filter media
S. Sumi and Lea MathewDepartment of Civil Engineering, College of Engineering, Trivandrum 695016 Kerala
INTRODUCTION
Anaerobic bacteria are natureís methods to break down organic compounds to the base elements. This work dealswith the performance of an Up-flow Anaerobic Hybrid Reactor (UAHR) that combines an Up-flow AnaerobicSludge Blanket Reactor (UASBR) with an Anaerobic Filter (AF). A laboratory scale UAHR was evaluated throughits ability to remove organic matter from synthetic domestic wastewater. The performance efficiency of the reactor,with Polyurethane Foam (PUF) as support material, was evaluated at different Hydraulic Retention Times (HRT)while treating synthetic wastewater, for different filter volumes. UAHR combines a UASB in the lower part withan AF in the upper part. Anaerobic filter has a significant role and effect in UAHR for treating various wastewaters(Lew et al., 2004). UAHR capitalizes on the high treatment performance of the lower UASB section, and improvesthe stability and tolerance to shock loading by the inserted upper biofilter (Amit Kumar et al., 2008). As far as theoptimal amount of support material to be placed in UAHR is concerned; suitable economical depth that allows thereactor to enough remove pollutant at different HRT must be determined (Wang et al., 2005). The performance orthe effect of a biological filter mostly depends on the type of filter media used (Joo-Hwa et al., 1996)
MATERIALS AND METHODS
Reactor and Filter media
In this study, an acrylic reactor with a working volume (excluding the volume provided for gas collection) of 12litres was used. The reactor was designed for up-flow operation and was fitted with two sampling ports, one in thesludge bed zone and the other one, in the anaerobic filter zone. Fig. 1 shows the Experimental set-up. The filtermedia consisted of PUF blocks, each having size, 2.5cm x 2.4 cm x 2.3cm. Scrap PUF sheets (Brand name ñ UFoam Pvt. Ltd.) were cut into blocks and fed into the reactor. The properties of filter media are: density 0.03866 g/cc and Porosity 85 per cent.
Experimental procedure
The synthetic wastewater whose strength corresponds to medium strength municipal wastewater was prepareddaily and was introduced continuously via a horizontal inlet at the base of the reactor. The study consisted of fiveexperimental phases (filter volumes corresponding to 20, 25, 30, 35 and 40% of reactor volume) during which theHRT was decreased from 48 h to 12 h, for each phase. Once stable-state conditions were reached for each experimentalphase, the next decrease in HRT was implemented. The system was monitored on a regular basis according tostandard methods (Standard Methods, 1985) by measurement of COD and pH. The performance of reactor wasalso evaluated at optimum condition using raw wastewater.
RESULTS AND CONCLUSION
Determination of optimum HRT and filter volume for the reactor
The synthetic wastewater had the following parameters: pH-7.50, turbidity-280 NTU, temperature-29.5oC, BOD5-312
Proceedings of 22nd Kerala Science Congress, 28-31 January 2010, KFRI, Peechi, pp. 534-535© KSCSTE 2010
08-17
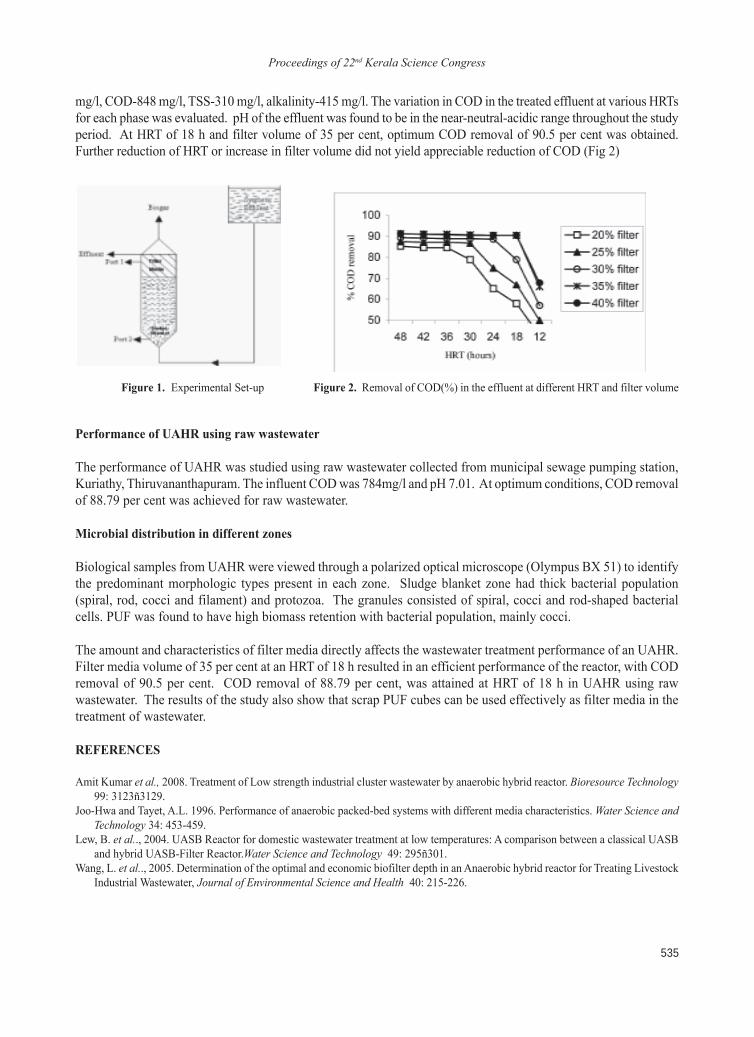
Proceedings of 22nd Kerala Science Congress
535
mg/l, COD-848 mg/l, TSS-310 mg/l, alkalinity-415 mg/l. The variation in COD in the treated effluent at various HRTsfor each phase was evaluated. pH of the effluent was found to be in the near-neutral-acidic range throughout the studyperiod. At HRT of 18 h and filter volume of 35 per cent, optimum COD removal of 90.5 per cent was obtained.Further reduction of HRT or increase in filter volume did not yield appreciable reduction of COD (Fig 2)
Figure 2. Removal of COD(%) in the effluent at different HRT and filter volumeFigure 1. Experimental Set-up
Performance of UAHR using raw wastewater
The performance of UAHR was studied using raw wastewater collected from municipal sewage pumping station,Kuriathy, Thiruvananthapuram. The influent COD was 784mg/l and pH 7.01. At optimum conditions, COD removalof 88.79 per cent was achieved for raw wastewater.
Microbial distribution in different zones
Biological samples from UAHR were viewed through a polarized optical microscope (Olympus BX 51) to identifythe predominant morphologic types present in each zone. Sludge blanket zone had thick bacterial population(spiral, rod, cocci and filament) and protozoa. The granules consisted of spiral, cocci and rod-shaped bacterialcells. PUF was found to have high biomass retention with bacterial population, mainly cocci.
The amount and characteristics of filter media directly affects the wastewater treatment performance of an UAHR.Filter media volume of 35 per cent at an HRT of 18 h resulted in an efficient performance of the reactor, with CODremoval of 90.5 per cent. COD removal of 88.79 per cent, was attained at HRT of 18 h in UAHR using rawwastewater. The results of the study also show that scrap PUF cubes can be used effectively as filter media in thetreatment of wastewater.
REFERENCES
Amit Kumar et al., 2008. Treatment of Low strength industrial cluster wastewater by anaerobic hybrid reactor. Bioresource Technology99: 3123ñ3129.
Joo-Hwa and Tayet, A.L. 1996. Performance of anaerobic packed-bed systems with different media characteristics. Water Science andTechnology 34: 453-459.
Lew, B. et al.., 2004. UASB Reactor for domestic wastewater treatment at low temperatures: A comparison between a classical UASBand hybrid UASB-Filter Reactor.Water Science and Technology 49: 295ñ301.
Wang, L. et al.., 2005. Determination of the optimal and economic biofilter depth in an Anaerobic hybrid reactor for Treating LivestockIndustrial Wastewater, Journal of Environmental Science and Health 40: 215-226.
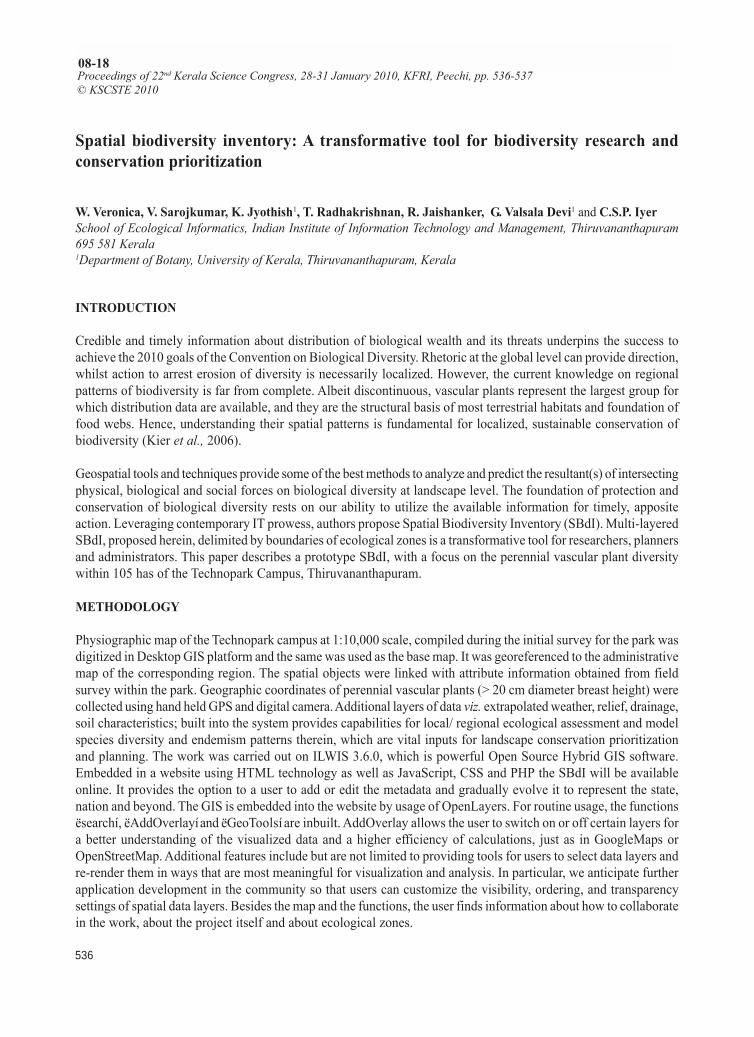
Proceedings of 22nd Kerala Science Congress
536
Spatial biodiversity inventory: A transformative tool for biodiversity research andconservation prioritization
W. Veronica, V. Sarojkumar, K. Jyothish1, T. Radhakrishnan, R. Jaishanker, G. Valsala Devi1 and C.S.P. IyerSchool of Ecological Informatics, Indian Institute of Information Technology and Management, Thiruvananthapuram695 581 Kerala1Department of Botany, University of Kerala, Thiruvananthapuram, Kerala
INTRODUCTION
Credible and timely information about distribution of biological wealth and its threats underpins the success toachieve the 2010 goals of the Convention on Biological Diversity. Rhetoric at the global level can provide direction,whilst action to arrest erosion of diversity is necessarily localized. However, the current knowledge on regionalpatterns of biodiversity is far from complete. Albeit discontinuous, vascular plants represent the largest group forwhich distribution data are available, and they are the structural basis of most terrestrial habitats and foundation offood webs. Hence, understanding their spatial patterns is fundamental for localized, sustainable conservation ofbiodiversity (Kier et al., 2006).
Geospatial tools and techniques provide some of the best methods to analyze and predict the resultant(s) of intersectingphysical, biological and social forces on biological diversity at landscape level. The foundation of protection andconservation of biological diversity rests on our ability to utilize the available information for timely, appositeaction. Leveraging contemporary IT prowess, authors propose Spatial Biodiversity Inventory (SBdI). Multi-layeredSBdI, proposed herein, delimited by boundaries of ecological zones is a transformative tool for researchers, plannersand administrators. This paper describes a prototype SBdI, with a focus on the perennial vascular plant diversitywithin 105 has of the Technopark Campus, Thiruvananthapuram.
METHODOLOGY
Physiographic map of the Technopark campus at 1:10,000 scale, compiled during the initial survey for the park wasdigitized in Desktop GIS platform and the same was used as the base map. It was georeferenced to the administrativemap of the corresponding region. The spatial objects were linked with attribute information obtained from fieldsurvey within the park. Geographic coordinates of perennial vascular plants (> 20 cm diameter breast height) werecollected using hand held GPS and digital camera. Additional layers of data viz. extrapolated weather, relief, drainage,soil characteristics; built into the system provides capabilities for local/ regional ecological assessment and modelspecies diversity and endemism patterns therein, which are vital inputs for landscape conservation prioritizationand planning. The work was carried out on ILWIS 3.6.0, which is powerful Open Source Hybrid GIS software.Embedded in a website using HTML technology as well as JavaScript, CSS and PHP the SBdI will be availableonline. It provides the option to a user to add or edit the metadata and gradually evolve it to represent the state,nation and beyond. The GIS is embedded into the website by usage of OpenLayers. For routine usage, the functionsësearchí, ëAddOverlayí and ëGeoToolsí are inbuilt. AddOverlay allows the user to switch on or off certain layers fora better understanding of the visualized data and a higher efficiency of calculations, just as in GoogleMaps orOpenStreetMap. Additional features include but are not limited to providing tools for users to select data layers andre-render them in ways that are most meaningful for visualization and analysis. In particular, we anticipate furtherapplication development in the community so that users can customize the visibility, ordering, and transparencysettings of spatial data layers. Besides the map and the functions, the user finds information about how to collaboratein the work, about the project itself and about ecological zones.
Proceedings of 22nd Kerala Science Congress, 28-31 January 2010, KFRI, Peechi, pp. 536-537© KSCSTE 2010
08-18
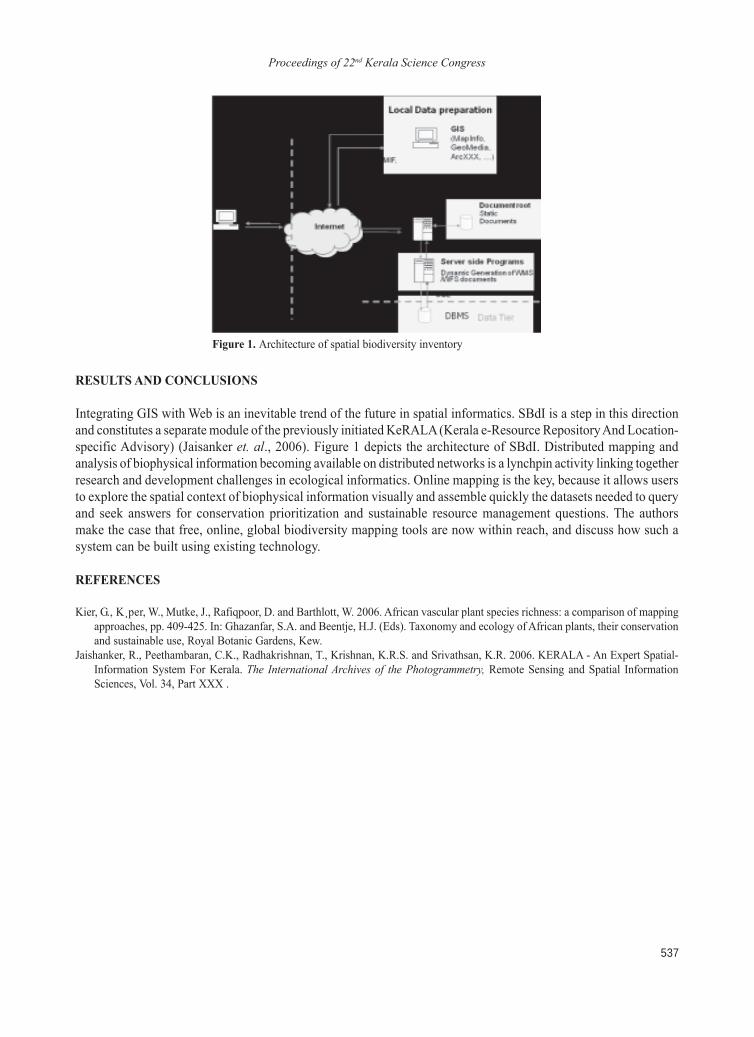
Proceedings of 22nd Kerala Science Congress
537
RESULTS AND CONCLUSIONS
Integrating GIS with Web is an inevitable trend of the future in spatial informatics. SBdI is a step in this directionand constitutes a separate module of the previously initiated KeRALA (Kerala e-Resource Repository And Location-specific Advisory) (Jaisanker et. al., 2006). Figure 1 depicts the architecture of SBdI. Distributed mapping andanalysis of biophysical information becoming available on distributed networks is a lynchpin activity linking togetherresearch and development challenges in ecological informatics. Online mapping is the key, because it allows usersto explore the spatial context of biophysical information visually and assemble quickly the datasets needed to queryand seek answers for conservation prioritization and sustainable resource management questions. The authorsmake the case that free, online, global biodiversity mapping tools are now within reach, and discuss how such asystem can be built using existing technology.
REFERENCES
Kier, G., K¸per, W., Mutke, J., Rafiqpoor, D. and Barthlott, W. 2006. African vascular plant species richness: a comparison of mappingapproaches, pp. 409-425. In: Ghazanfar, S.A. and Beentje, H.J. (Eds). Taxonomy and ecology of African plants, their conservationand sustainable use, Royal Botanic Gardens, Kew.
Jaishanker, R., Peethambaran, C.K., Radhakrishnan, T., Krishnan, K.R.S. and Srivathsan, K.R. 2006. KERALA - An Expert Spatial-Information System For Kerala. The International Archives of the Photogrammetry, Remote Sensing and Spatial InformationSciences, Vol. 34, Part XXX .
Figure 1. Architecture of spatial biodiversity inventory
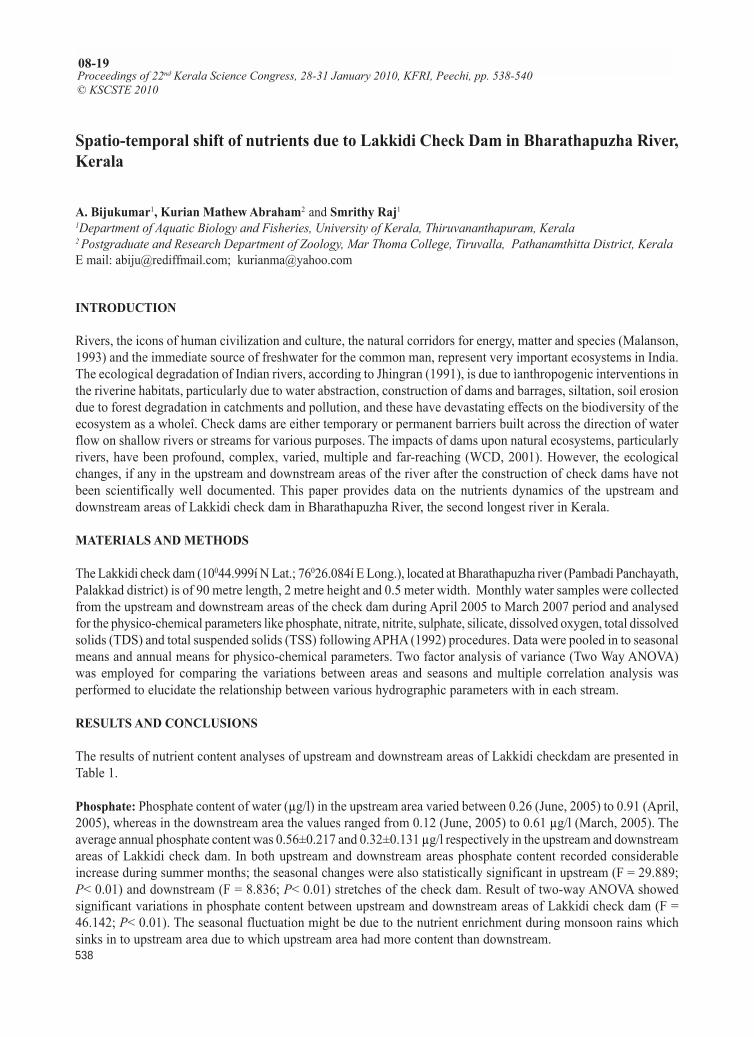
Proceedings of 22nd Kerala Science Congress
538
Proceedings of 22nd Kerala Science Congress, 28-31 January 2010, KFRI, Peechi, pp. 538-540© KSCSTE 2010
08-19
Spatio-temporal shift of nutrients due to Lakkidi Check Dam in Bharathapuzha River,Kerala
A. Bijukumar1, Kurian Mathew Abraham2 and Smrithy Raj11Department of Aquatic Biology and Fisheries, University of Kerala, Thiruvananthapuram, Kerala2 Postgraduate and Research Department of Zoology, Mar Thoma College, Tiruvalla, Pathanamthitta District, KeralaE mail: [email protected]; [email protected]
INTRODUCTION
Rivers, the icons of human civilization and culture, the natural corridors for energy, matter and species (Malanson,1993) and the immediate source of freshwater for the common man, represent very important ecosystems in India.The ecological degradation of Indian rivers, according to Jhingran (1991), is due to ìanthropogenic interventions inthe riverine habitats, particularly due to water abstraction, construction of dams and barrages, siltation, soil erosiondue to forest degradation in catchments and pollution, and these have devastating effects on the biodiversity of theecosystem as a wholeî. Check dams are either temporary or permanent barriers built across the direction of waterflow on shallow rivers or streams for various purposes. The impacts of dams upon natural ecosystems, particularlyrivers, have been profound, complex, varied, multiple and far-reaching (WCD, 2001). However, the ecologicalchanges, if any in the upstream and downstream areas of the river after the construction of check dams have notbeen scientifically well documented. This paper provides data on the nutrients dynamics of the upstream anddownstream areas of Lakkidi check dam in Bharathapuzha River, the second longest river in Kerala.
MATERIALS AND METHODS
The Lakkidi check dam (10044.999í N Lat.; 76026.084í E Long.), located at Bharathapuzha river (Pambadi Panchayath,Palakkad district) is of 90 metre length, 2 metre height and 0.5 meter width. Monthly water samples were collectedfrom the upstream and downstream areas of the check dam during April 2005 to March 2007 period and analysedfor the physico-chemical parameters like phosphate, nitrate, nitrite, sulphate, silicate, dissolved oxygen, total dissolvedsolids (TDS) and total suspended solids (TSS) following APHA (1992) procedures. Data were pooled in to seasonalmeans and annual means for physico-chemical parameters. Two factor analysis of variance (Two Way ANOVA)was employed for comparing the variations between areas and seasons and multiple correlation analysis wasperformed to elucidate the relationship between various hydrographic parameters with in each stream.
RESULTS AND CONCLUSIONS
The results of nutrient content analyses of upstream and downstream areas of Lakkidi checkdam are presented inTable 1.
Phosphate: Phosphate content of water (µg/l) in the upstream area varied between 0.26 (June, 2005) to 0.91 (April,2005), whereas in the downstream area the values ranged from 0.12 (June, 2005) to 0.61 µg/l (March, 2005). Theaverage annual phosphate content was 0.56±0.217 and 0.32±0.131 µg/l respectively in the upstream and downstreamareas of Lakkidi check dam. In both upstream and downstream areas phosphate content recorded considerableincrease during summer months; the seasonal changes were also statistically significant in upstream (F = 29.889;P< 0.01) and downstream (F = 8.836; P< 0.01) stretches of the check dam. Result of two-way ANOVA showedsignificant variations in phosphate content between upstream and downstream areas of Lakkidi check dam (F =46.142; P< 0.01). The seasonal fluctuation might be due to the nutrient enrichment during monsoon rains whichsinks in to upstream area due to which upstream area had more content than downstream.
Proceedings of 22nd Kerala Science Congress
539
Nitrate: Nitrate content of water (µg/l) in both upstream and downstream areas of Lakkidi check dam recorded awell-defined monthly pattern, with peaks during October and minimum during July. The annual average was28.79±19.547 in the upstream area, while 27.59±17.245 in the downstream area. The seasonal variation was alsomuch apparent in both the streams, with maximum values during post-monsoon period; the nitrate content differedsignificantly between seasons in the upstream (F = 7.132; P< 0.05) and downstream (F = 8.285; P< 0.01) areas.Seasonal variations in nitrate content could be due to phytoplankton excretion, oxidation of ammonia and reductionof nitrate in addition to the decomposition of planktonic organisms. The increase in nitrate content during monsoonand post-monsoon seasons may be due to the influence of terrigenous matter carried by flood water as well asexcess decomposition activity in the river.
Nitrite: The nitrite content of water also recorded more or less similar patterns of monthly variations in bothupstream and downstream areas of Lakkidi check dam. In both the areas the minimum value recorded was 0.16 µg/l, and the maximum values, 0.31 and 0. 33 µg/l respectively. The annual average of nitrite content was 0.23±0.04 inthe upstream area and 0.24±0.051 in the upper and lower reaches. The seasonal variations in nitrite values werestatistically significant in both upstream (F = 16.045; P< 0.01) and downstream (F = 4.709; P< 0.05) areas.
Sulphate: Sulphate concentration in both upstream and downstream areas showed wide fluctuations in both upstreamand downstream areas; the variations were from 6.25 to 35.5 ppm and 6.26 to 31.26 ppm, respectively. The annualaverage of phosphate in upstream area was 19.84±9.248 and that in downstream, 17.73±7.212. The seasonalvariations, however, were not significant between seasons and streams.
Silicate: The silicate content of water, in general, followed similar trends in both upstream (45.65 to 103.6 µg/l) anddownstream (43.24 to 99.85 µg/l) areas. Higher values were recorded during post-monsoon and pre-monsoonperiods; the seasonal variations in silicate content were significant in upstream area (F = 8.321; P<0.01) anddownstream area (F = 8.127; P<0.05). According to Silva et al. (2002) large number of reservoirs may increasesilica fluxes in the river system and silicate leaching is primarily determined by the annual precipitation, dischargevolume, climatic factors and catchment geochemistry. Presence of nine large dams in the upper reaches ofBharathapuzha would augment leaching of silicate to river water.
Dissolved oxygen: The dissolved oxygen (mg/l) content of water did not record any definite pattern of monthly variationsin both upstream and downstream areas of the check dam. The concentration of dissolved oxygen varied from 7.0 to8.1; the annual average in the upstream area was 7.44±0.317 and that of downstream area, 7.69±0.345. The seasonalvariations were not statistically significant. High values of dissolved oxygen in upstream and downstream areas ofcheck dams may be due to increased vegetation taking part in photosynthesis and release of oxygen.
Total Dissolved Solids (TDS): In the upstream area of Lakkidi check dam the amount of TDS varied from 155 to229 (annual average = 184±27.429), whereas in lower reaches the variation was between 89 and 198 (annualaverage = 154.67±33.443). In both the streams relatively higher values of TDS were recorded during pre-monsoonseason; the variations were also statistically significant in up and downstream areas (F = 13.805 and 9.805 respectively;P<0.01). Results of two way ANOVA showed that the total TDS content differed significantly (F = 15.739; P<0.01)in both upstream and downstream areas of Lakkidi check dam. Primary sources for TDS in receiving waters areagricultural runoff, leaching of soil contamination and point source water pollution discharge from industrial orsewage treatment plants. In the present case increased TDS content of water may be due to agricultural run off fromthe surrounding fields.
Total Suspended Solids (TSS): In both upstream and downstream areas of Lakkidi check dam TSS registered moreor less similar trends; the values ranged from 2.8 to 7.2 and 2.5-7.5, respectively. The annual average was 5.15±1.607in the upstream and 5.68±1.731 in the downstream area of the check dam. TSS was higher during the monsoonseasons in both the streams. Results of one way ANOVA showed that the seasonal variations of TSS were statisticallysignificant in upstream (F = 11.775; P<0.01) as well as downstream (F = 5.68; P<0.01) areas of the check dam. .Long term studies are recommended to realise the impact of check dams on the sediment flow, nutrient flow and
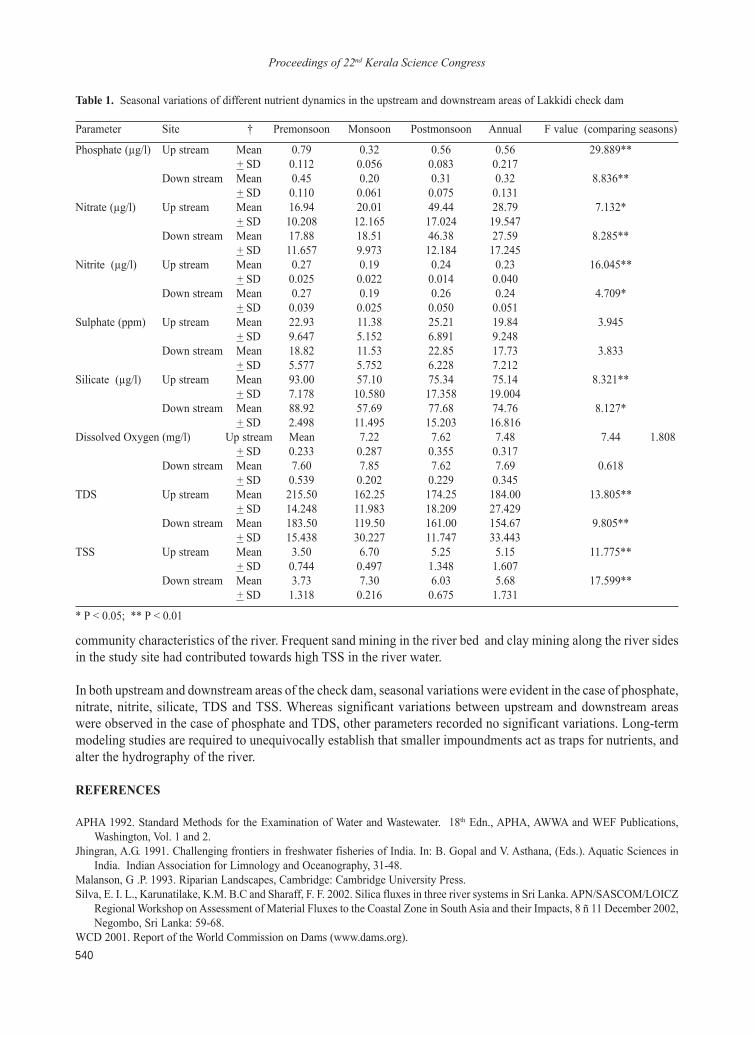
Proceedings of 22nd Kerala Science Congress
540
community characteristics of the river. Frequent sand mining in the river bed and clay mining along the river sidesin the study site had contributed towards high TSS in the river water.
In both upstream and downstream areas of the check dam, seasonal variations were evident in the case of phosphate,nitrate, nitrite, silicate, TDS and TSS. Whereas significant variations between upstream and downstream areaswere observed in the case of phosphate and TDS, other parameters recorded no significant variations. Long-termmodeling studies are required to unequivocally establish that smaller impoundments act as traps for nutrients, andalter the hydrography of the river.
REFERENCES
APHA 1992. Standard Methods for the Examination of Water and Wastewater. 18th Edn., APHA, AWWA and WEF Publications,Washington, Vol. 1 and 2.
Jhingran, A.G. 1991. Challenging frontiers in freshwater fisheries of India. In: B. Gopal and V. Asthana, (Eds.). Aquatic Sciences inIndia. Indian Association for Limnology and Oceanography, 31-48.
Malanson, G .P. 1993. Riparian Landscapes, Cambridge: Cambridge University Press.Silva, E. I. L., Karunatilake, K.M. B.C and Sharaff, F. F. 2002. Silica fluxes in three river systems in Sri Lanka. APN/SASCOM/LOICZ
Regional Workshop on Assessment of Material Fluxes to the Coastal Zone in South Asia and their Impacts, 8 ñ 11 December 2002,Negombo, Sri Lanka: 59-68.
WCD 2001. Report of the World Commission on Dams (www.dams.org).
Table 1. Seasonal variations of different nutrient dynamics in the upstream and downstream areas of Lakkidi check dam
Parameter Site � Premonsoon Monsoon Postmonsoon Annual F value (comparing seasons)
Phosphate (µg/l) Up stream Mean 0.79 0.32 0.56 0.56 29.889**+ SD 0.112 0.056 0.083 0.217
Down stream Mean 0.45 0.20 0.31 0.32 8.836**+ SD 0.110 0.061 0.075 0.131
Nitrate (µg/l) Up stream Mean 16.94 20.01 49.44 28.79 7.132*+ SD 10.208 12.165 17.024 19.547
Down stream Mean 17.88 18.51 46.38 27.59 8.285**+ SD 11.657 9.973 12.184 17.245
Nitrite (µg/l) Up stream Mean 0.27 0.19 0.24 0.23 16.045**+ SD 0.025 0.022 0.014 0.040
Down stream Mean 0.27 0.19 0.26 0.24 4.709*+ SD 0.039 0.025 0.050 0.051
Sulphate (ppm) Up stream Mean 22.93 11.38 25.21 19.84 3.945+ SD 9.647 5.152 6.891 9.248
Down stream Mean 18.82 11.53 22.85 17.73 3.833+ SD 5.577 5.752 6.228 7.212
Silicate (µg/l) Up stream Mean 93.00 57.10 75.34 75.14 8.321**+ SD 7.178 10.580 17.358 19.004
Down stream Mean 88.92 57.69 77.68 74.76 8.127*+ SD 2.498 11.495 15.203 16.816
Dissolved Oxygen (mg/l) Up stream Mean 7.22 7.62 7.48 7.44 1.808+ SD 0.233 0.287 0.355 0.317
Down stream Mean 7.60 7.85 7.62 7.69 0.618+ SD 0.539 0.202 0.229 0.345
TDS Up stream Mean 215.50 162.25 174.25 184.00 13.805**+ SD 14.248 11.983 18.209 27.429
Down stream Mean 183.50 119.50 161.00 154.67 9.805**+ SD 15.438 30.227 11.747 33.443
TSS Up stream Mean 3.50 6.70 5.25 5.15 11.775**+ SD 0.744 0.497 1.348 1.607
Down stream Mean 3.73 7.30 6.03 5.68 17.599**+ SD 1.318 0.216 0.675 1.731
* P < 0.05; ** P < 0.01
Proceedings of 22nd Kerala Science Congress
541
Landuse impact on soil carbon sequestration and pool vulnerability from a globalwarming perspective
N.P. Sreekanth, P. Babu, V. Shanthiprabha, A. P. Thomas and A. K. UshaSchool of Environmental Sciences, M.G University, Kottayam 686560 Kerala
INTRODUCTION
Global climate change is the most serious environmental problem of the twenty first centaury (IPCC, 2001). Thecarbon cycle plays a significant role in global climate change both in its causes and in its remediation. Soil is thelargest pool of terrestrial organic carbon. The soil carbon sequestration is a part of terrestrial carbon cycling and islinked to parameters like soil organic carbon (SOC), microbial biomass carbon (MBC) and potential carbonmineralization (PCM). Landuse change and management can convert a soil system from a sink to a source ofcarbon (C) by interfering the soil carbon pools.
MATERIALS AND METHODS
Site description, sampling and analysis
The study area is Kottayam district, which lies between 9o 23í- 9o 52í N latitude and 76o 21í-77 o E longitude andsprawls over a total area of 2208 sq km with a humid tropical climatic regime. The study transect covers differentland use falling under the multiple land use categories prescribed by IPCC for carbon inventory. Annual averagerainfall is 2591.0mm and the mean annual temperature is 27.40 degree C. The area is characterized by topographicvariations ranging from the lowest point (below msl) to a considerable elevation (+1195 m above msl). Measurementmethods for assessing soil carbon are done as per the methods prescribed by IPCC (2006). In order to implementthe method on a regional level, the guidelines for Land Use Land Use Change and Forestry (LULUCF) is downscaledto a plot level. The total study transect is compartmentalized in to desirable grid size and number so as to obtain anideal representation of soil series Vs landuse combination. Soil samples were collected from 0 -20 cm depth afterremoving the residue from the soil surfaces of multiple landuse categories. The Walkley and Black procedure wasconsidered adequate for determining SOC content of the soils under study. Potential Carbon Mineralization (PCM)in air dried soil was determined through the method modified by Haney et. al (2004). For determining the MBCsubstrate induced respiration (SIR) method of Anderson and Joergensen (1997) was employed.
RESULT AND CONCLUSIONS
Source strength status of different soil series
The mean average values of soil organic carbon content of five soil series fluctuated from 2.29 to 4.46 per cent withthe highest average in Paippara series and the lowest in Manjoor series. During the study it is found that this seriesis extensively subjected to continuous reclamation and landuse changes, there by altering the soil carbon pool. ThePotential Carbon Mineralization (PCM) values ranges from 11.42 to 13.8 mg /CO2/m
2/h in the following mannerbetween the series. Parampuzha (13.82)> Paippara (13.61)> Kottapuram (13.4)> manjoor (12.71)> Nellapara (11.39).Microbial Biomass Carbon (MBC) bears almost direct correlation with the SOC content. The mean average resultsreveals that Paippara series is high (3.24 mg /CO2/m
2/h) in MBC. Even though the Nellapara series is high in SOCcontent, the MBC values are low (2.5 mg /CO2/m
2/h).The C/N ratio is found to be high in Paippara series (14.6) andlow in Manjoor series (10.14).
Proceedings of 22nd Kerala Science Congress, 28-31 January 2010, KFRI, Peechi, pp. 541-542© KSCSTE 2010
08-20
Proceedings of 22nd Kerala Science Congress
542
Soil series of study areaLocation map of study area
Soil carbon accruals of multiple landuse categories
The SOC content of the grass land is comparatively higher (5.86%). Paddy cultivation shows the next highest value(4.33%) followed by mixed land (3.81%), and plantation (2.74%). The mean average values of other parameters likePCM, MBC, and C/N ratio are found to be higher in grassland and these values shows a direct correlation with theSOC content. The rate of PCM and MBC are higher in grass land and paddy fields hence the condition of sinksaturation cannot be ruled out. Mixed land also shows healthy investment of C concentrations. In plantations the SOCand MBC values are comparatively less. The source / sink capacity of the different land use is in the range of Grassland>Paddy>mixed > plantation. SOC content is directly proportional to the land utilization and management aspects.Teak plantation and forest shows highest SOC content (5%) showing that sequestration capacity of these two land usesis more. But the mineralization potential is more in teak plantation than forest making it more vulnerable towardsloosing sequestered C. the forest regions despite of increased interference also shows an increased potential forstoring C in the soil and this can be attributed to increased turnover rate of C in this land and also reduced mineralizationpotential. The low SOC values in other plantations may be due to low decomposition rate and reduced C turn over. Thepotential of C mineralization is also high and making them vulnerable C pools. Landuse management activities inflictednotable changes in the source strength capacity of soil C pools irrespective of soil series characteristics. Highest soilsequestration capacity is found in grass and paddy soils but they are subjected to sink decline at present owing toimproper land utilization. This C source component will further diminish the net gains of C sinks and could evendiminish the sink strength beyond zero, thereby moving from being C sink to source. In plantations especially Pine,Tea and Acacia the chance for SOC pool degradation will be high since the PCM values are high in correlation withMBC values. Hence the chance or risk of sink saturation of these land uses is more. It can be inferred that they arevulnerable C pools which can add more CO2 into the atmosphere if not managed carefully.
REFERENCES
FAO 2000. Carbon Sequesteration Options Under The Clean Development Mechanisms to Address Land Degradation. World SoilResources Reports 92. FAO and IFAD, Rome.
Guo LB and Gifford RM 2002. Soil carbon stocks and land use change: a meta analysis. Global Change Biol. 8: 345- 360.IPCC 2000. Special report on land use, land use change and Forestry. Cambridge University Press, Cambridge, UK.
Table 1. Carbon accrual status of different plantations
SOC (%) PCM (mg of C02/m2/h) MBC (mg of C02/m
2/h) Total Nitrogen (%) C/N ratio (%)
Accacia 3.78 13.09 2.53 0.36 10.32Mangium 2.85 15.62 2.42 0.39 7.27Forest 5.5 12.32 1.54 0.47 11.55Teak 5.5 14.08 2.2 0.33 16.36Tea 3.27 16.72 3.52 0.47 6.87Cardomom 2.72 14.3 1.54 0.33 8.11Pine 1.09 15.4 3.3 0.16 6.49Rubber 3.02 12.57 2.38 0.22 13.59
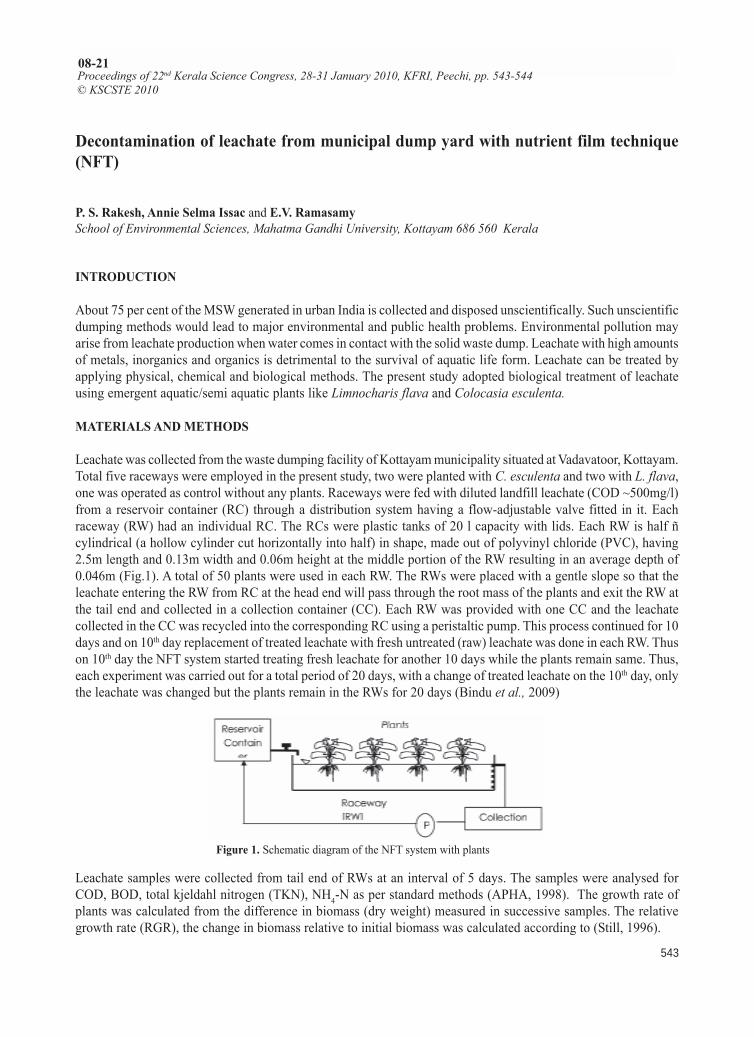
Proceedings of 22nd Kerala Science Congress
543
Decontamination of leachate from municipal dump yard with nutrient film technique(NFT)
P. S. Rakesh, Annie Selma Issac and E.V. RamasamySchool of Environmental Sciences, Mahatma Gandhi University, Kottayam 686 560 Kerala
INTRODUCTION
About 75 per cent of the MSW generated in urban India is collected and disposed unscientifically. Such unscientificdumping methods would lead to major environmental and public health problems. Environmental pollution mayarise from leachate production when water comes in contact with the solid waste dump. Leachate with high amountsof metals, inorganics and organics is detrimental to the survival of aquatic life form. Leachate can be treated byapplying physical, chemical and biological methods. The present study adopted biological treatment of leachateusing emergent aquatic/semi aquatic plants like Limnocharis flava and Colocasia esculenta.
MATERIALS AND METHODS
Leachate was collected from the waste dumping facility of Kottayam municipality situated at Vadavatoor, Kottayam.Total five raceways were employed in the present study, two were planted with C. esculenta and two with L. flava,one was operated as control without any plants. Raceways were fed with diluted landfill leachate (COD ~500mg/l)from a reservoir container (RC) through a distribution system having a flow-adjustable valve fitted in it. Eachraceway (RW) had an individual RC. The RCs were plastic tanks of 20 l capacity with lids. Each RW is half ñcylindrical (a hollow cylinder cut horizontally into half) in shape, made out of polyvinyl chloride (PVC), having2.5m length and 0.13m width and 0.06m height at the middle portion of the RW resulting in an average depth of0.046m (Fig.1). A total of 50 plants were used in each RW. The RWs were placed with a gentle slope so that theleachate entering the RW from RC at the head end will pass through the root mass of the plants and exit the RW atthe tail end and collected in a collection container (CC). Each RW was provided with one CC and the leachatecollected in the CC was recycled into the corresponding RC using a peristaltic pump. This process continued for 10days and on 10th day replacement of treated leachate with fresh untreated (raw) leachate was done in each RW. Thuson 10th day the NFT system started treating fresh leachate for another 10 days while the plants remain same. Thus,each experiment was carried out for a total period of 20 days, with a change of treated leachate on the 10th day, onlythe leachate was changed but the plants remain in the RWs for 20 days (Bindu et al., 2009)
Proceedings of 22nd Kerala Science Congress, 28-31 January 2010, KFRI, Peechi, pp. 543-544© KSCSTE 2010
08-21
Figure 1. Schematic diagram of the NFT system with plants
Leachate samples were collected from tail end of RWs at an interval of 5 days. The samples were analysed forCOD, BOD, total kjeldahl nitrogen (TKN), NH4-N as per standard methods (APHA, 1998). The growth rate ofplants was calculated from the difference in biomass (dry weight) measured in successive samples. The relativegrowth rate (RGR), the change in biomass relative to initial biomass was calculated according to (Still, 1996).
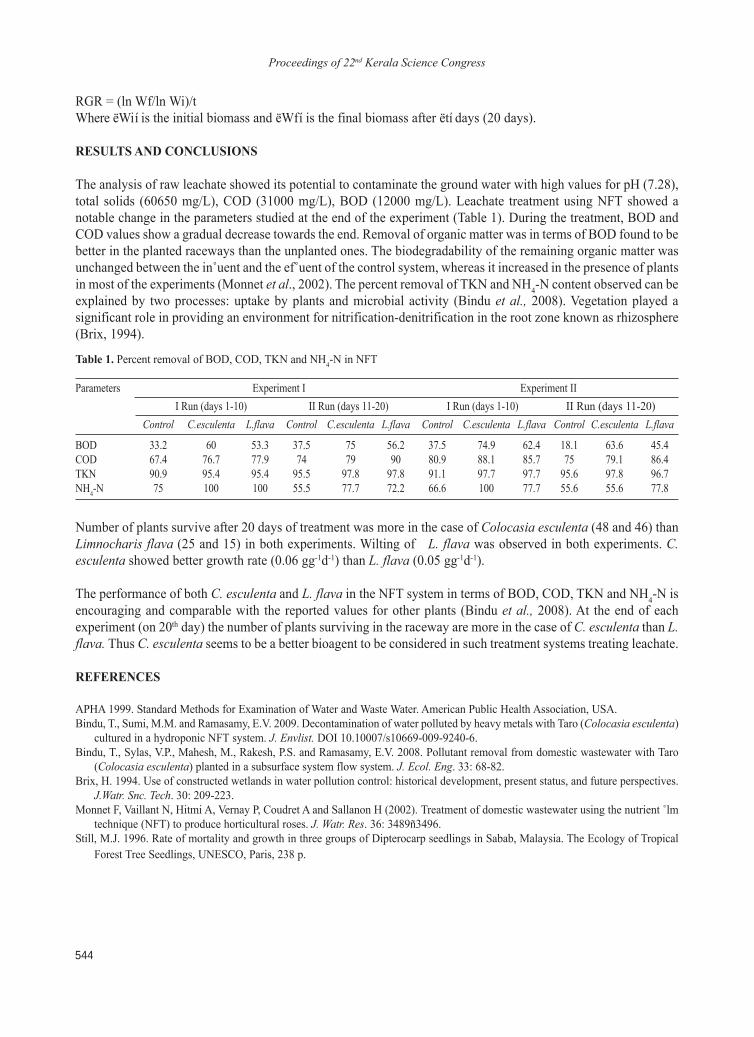
Proceedings of 22nd Kerala Science Congress
544
RGR = (ln Wf/ln Wi)/tWhere ëWií is the initial biomass and ëWfí is the final biomass after ëtí days (20 days).
RESULTS AND CONCLUSIONS
The analysis of raw leachate showed its potential to contaminate the ground water with high values for pH (7.28),total solids (60650 mg/L), COD (31000 mg/L), BOD (12000 mg/L). Leachate treatment using NFT showed anotable change in the parameters studied at the end of the experiment (Table 1). During the treatment, BOD andCOD values show a gradual decrease towards the end. Removal of organic matter was in terms of BOD found to bebetter in the planted raceways than the unplanted ones. The biodegradability of the remaining organic matter wasunchanged between the inûuent and the efûuent of the control system, whereas it increased in the presence of plantsin most of the experiments (Monnet et al., 2002). The percent removal of TKN and NH4-N content observed can beexplained by two processes: uptake by plants and microbial activity (Bindu et al., 2008). Vegetation played asignificant role in providing an environment for nitrification-denitrification in the root zone known as rhizosphere(Brix, 1994).
Table 1. Percent removal of BOD, COD, TKN and NH4-N in NFT
Parameters Experiment I Experiment III Run (days 1-10) II Run (days 11-20) I Run (days 1-10) II Run (days 11-20)
Control C.esculenta L.flava Control C.esculenta L.flava Control C.esculenta L.flava Control C.esculenta L.flava
BOD 33.2 60 53.3 37.5 75 56.2 37.5 74.9 62.4 18.1 63.6 45.4COD 67.4 76.7 77.9 74 79 90 80.9 88.1 85.7 75 79.1 86.4TKN 90.9 95.4 95.4 95.5 97.8 97.8 91.1 97.7 97.7 95.6 97.8 96.7NH4-N 75 100 100 55.5 77.7 72.2 66.6 100 77.7 55.6 55.6 77.8
Number of plants survive after 20 days of treatment was more in the case of Colocasia esculenta (48 and 46) thanLimnocharis flava (25 and 15) in both experiments. Wilting of L. flava was observed in both experiments. C.esculenta showed better growth rate (0.06 gg-1d-1) than L. flava (0.05 gg-1d-1).
The performance of both C. esculenta and L. flava in the NFT system in terms of BOD, COD, TKN and NH4-N isencouraging and comparable with the reported values for other plants (Bindu et al., 2008). At the end of eachexperiment (on 20th day) the number of plants surviving in the raceway are more in the case of C. esculenta than L.flava. Thus C. esculenta seems to be a better bioagent to be considered in such treatment systems treating leachate.
REFERENCES
APHA 1999. Standard Methods for Examination of Water and Waste Water. American Public Health Association, USA.Bindu, T., Sumi, M.M. and Ramasamy, E.V. 2009. Decontamination of water polluted by heavy metals with Taro (Colocasia esculenta)
cultured in a hydroponic NFT system. J. Envlist. DOI 10.10007/s10669-009-9240-6.Bindu, T., Sylas, V.P., Mahesh, M., Rakesh, P.S. and Ramasamy, E.V. 2008. Pollutant removal from domestic wastewater with Taro
(Colocasia esculenta) planted in a subsurface system flow system. J. Ecol. Eng. 33: 68-82.Brix, H. 1994. Use of constructed wetlands in water pollution control: historical development, present status, and future perspectives.
J.Watr. Snc. Tech. 30: 209-223.Monnet F, Vaillant N, Hitmi A, Vernay P, Coudret A and Sallanon H (2002). Treatment of domestic wastewater using the nutrient ûlm
technique (NFT) to produce horticultural roses. J. Watr. Res. 36: 3489ñ3496.Still, M.J. 1996. Rate of mortality and growth in three groups of Dipterocarp seedlings in Sabab, Malaysia. The Ecology of Tropical
Forest Tree Seedlings, UNESCO, Paris, 238 p.
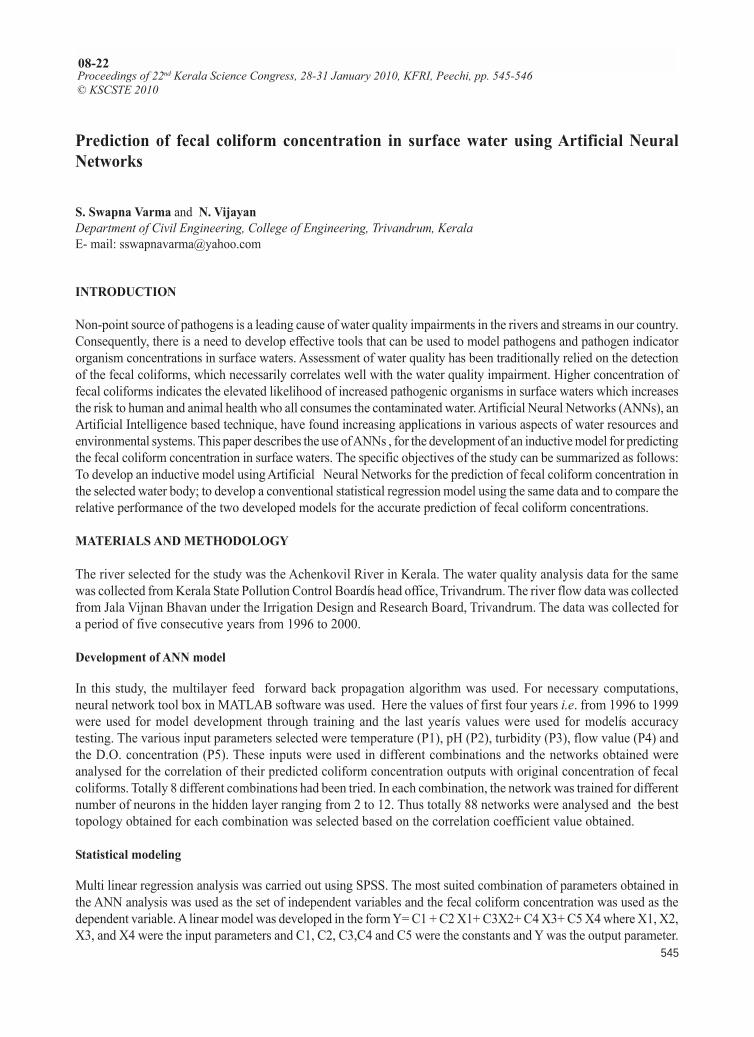
Proceedings of 22nd Kerala Science Congress
545
Prediction of fecal coliform concentration in surface water using Artificial NeuralNetworks
S. Swapna Varma and N. VijayanDepartment of Civil Engineering, College of Engineering, Trivandrum, KeralaE- mail: [email protected]
INTRODUCTION
Non-point source of pathogens is a leading cause of water quality impairments in the rivers and streams in our country.Consequently, there is a need to develop effective tools that can be used to model pathogens and pathogen indicatororganism concentrations in surface waters. Assessment of water quality has been traditionally relied on the detectionof the fecal coliforms, which necessarily correlates well with the water quality impairment. Higher concentration offecal coliforms indicates the elevated likelihood of increased pathogenic organisms in surface waters which increasesthe risk to human and animal health who all consumes the contaminated water. Artificial Neural Networks (ANNs), anArtificial Intelligence based technique, have found increasing applications in various aspects of water resources andenvironmental systems. This paper describes the use of ANNs , for the development of an inductive model for predictingthe fecal coliform concentration in surface waters. The specific objectives of the study can be summarized as follows:To develop an inductive model using Artificial Neural Networks for the prediction of fecal coliform concentration inthe selected water body; to develop a conventional statistical regression model using the same data and to compare therelative performance of the two developed models for the accurate prediction of fecal coliform concentrations.
MATERIALS AND METHODOLOGY
The river selected for the study was the Achenkovil River in Kerala. The water quality analysis data for the samewas collected from Kerala State Pollution Control Boardís head office, Trivandrum. The river flow data was collectedfrom Jala Vijnan Bhavan under the Irrigation Design and Research Board, Trivandrum. The data was collected fora period of five consecutive years from 1996 to 2000.
Development of ANN model
In this study, the multilayer feed forward back propagation algorithm was used. For necessary computations,neural network tool box in MATLAB software was used. Here the values of first four years i.e. from 1996 to 1999were used for model development through training and the last yearís values were used for modelís accuracytesting. The various input parameters selected were temperature (P1), pH (P2), turbidity (P3), flow value (P4) andthe D.O. concentration (P5). These inputs were used in different combinations and the networks obtained wereanalysed for the correlation of their predicted coliform concentration outputs with original concentration of fecalcoliforms. Totally 8 different combinations had been tried. In each combination, the network was trained for differentnumber of neurons in the hidden layer ranging from 2 to 12. Thus totally 88 networks were analysed and the besttopology obtained for each combination was selected based on the correlation coefficient value obtained.
Statistical modeling
Multi linear regression analysis was carried out using SPSS. The most suited combination of parameters obtained inthe ANN analysis was used as the set of independent variables and the fecal coliform concentration was used as thedependent variable. A linear model was developed in the form Y= C1 + C2 X1+ C3X2+ C4 X3+ C5 X4 where X1, X2,X3, and X4 were the input parameters and C1, C2, C3,C4 and C5 were the constants and Y was the output parameter.
Proceedings of 22nd Kerala Science Congress, 28-31 January 2010, KFRI, Peechi, pp. 545-546© KSCSTE 2010
08-22
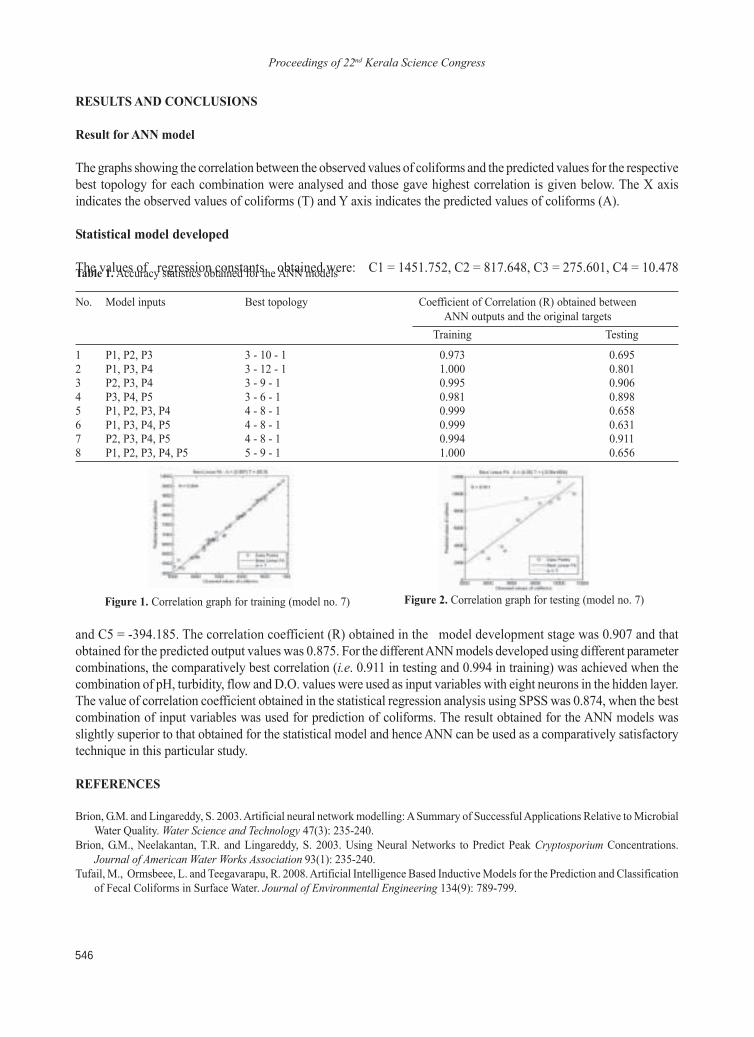
Proceedings of 22nd Kerala Science Congress
546
RESULTS AND CONCLUSIONS
Result for ANN model
The graphs showing the correlation between the observed values of coliforms and the predicted values for the respectivebest topology for each combination were analysed and those gave highest correlation is given below. The X axisindicates the observed values of coliforms (T) and Y axis indicates the predicted values of coliforms (A).
Statistical model developed
The values of regression constants obtained were: C1 = 1451.752, C2 = 817.648, C3 = 275.601, C4 = 10.478Table 1. Accuracy statistics obtained for the ANN models
No. Model inputs Best topology Coefficient of Correlation (R) obtained betweenANN outputs and the original targets
Training Testing
1 P1, P2, P3 3 - 10 - 1 0.973 0.6952 P1, P3, P4 3 - 12 - 1 1.000 0.8013 P2, P3, P4 3 - 9 - 1 0.995 0.9064 P3, P4, P5 3 - 6 - 1 0.981 0.8985 P1, P2, P3, P4 4 - 8 - 1 0.999 0.6586 P1, P3, P4, P5 4 - 8 - 1 0.999 0.6317 P2, P3, P4, P5 4 - 8 - 1 0.994 0.9118 P1, P2, P3, P4, P5 5 - 9 - 1 1.000 0.656
and C5 = -394.185. The correlation coefficient (R) obtained in the model development stage was 0.907 and thatobtained for the predicted output values was 0.875. For the different ANN models developed using different parametercombinations, the comparatively best correlation (i.e. 0.911 in testing and 0.994 in training) was achieved when thecombination of pH, turbidity, flow and D.O. values were used as input variables with eight neurons in the hidden layer.The value of correlation coefficient obtained in the statistical regression analysis using SPSS was 0.874, when the bestcombination of input variables was used for prediction of coliforms. The result obtained for the ANN models wasslightly superior to that obtained for the statistical model and hence ANN can be used as a comparatively satisfactorytechnique in this particular study.
REFERENCES
Brion, G.M. and Lingareddy, S. 2003. Artificial neural network modelling: A Summary of Successful Applications Relative to MicrobialWater Quality. Water Science and Technology 47(3): 235-240.
Brion, G.M., Neelakantan, T.R. and Lingareddy, S. 2003. Using Neural Networks to Predict Peak Cryptosporium Concentrations.Journal of American Water Works Association 93(1): 235-240.
Tufail, M., Ormsbeee, L. and Teegavarapu, R. 2008. Artificial Intelligence Based Inductive Models for the Prediction and Classificationof Fecal Coliforms in Surface Water. Journal of Environmental Engineering 134(9): 789-799.
Figure 2. Correlation graph for testing (model no. 7)Figure 1. Correlation graph for training (model no. 7)
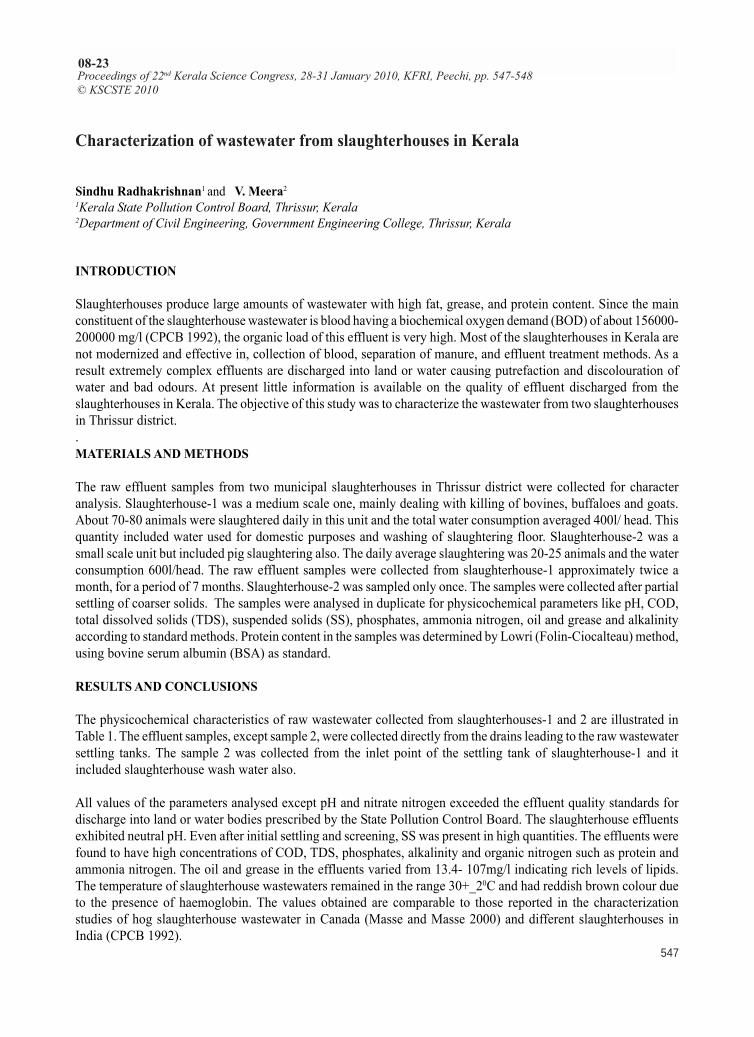
Proceedings of 22nd Kerala Science Congress
547
Proceedings of 22nd Kerala Science Congress, 28-31 January 2010, KFRI, Peechi, pp. 547-548© KSCSTE 2010
08-23
Characterization of wastewater from slaughterhouses in Kerala
Sindhu Radhakrishnan1 and V. Meera21Kerala State Pollution Control Board, Thrissur, Kerala2Department of Civil Engineering, Government Engineering College, Thrissur, Kerala
INTRODUCTION
Slaughterhouses produce large amounts of wastewater with high fat, grease, and protein content. Since the mainconstituent of the slaughterhouse wastewater is blood having a biochemical oxygen demand (BOD) of about 156000-200000 mg/l (CPCB 1992), the organic load of this effluent is very high. Most of the slaughterhouses in Kerala arenot modernized and effective in, collection of blood, separation of manure, and effluent treatment methods. As aresult extremely complex effluents are discharged into land or water causing putrefaction and discolouration ofwater and bad odours. At present little information is available on the quality of effluent discharged from theslaughterhouses in Kerala. The objective of this study was to characterize the wastewater from two slaughterhousesin Thrissur district..MATERIALS AND METHODS
The raw effluent samples from two municipal slaughterhouses in Thrissur district were collected for characteranalysis. Slaughterhouse-1 was a medium scale one, mainly dealing with killing of bovines, buffaloes and goats.About 70-80 animals were slaughtered daily in this unit and the total water consumption averaged 400l/ head. Thisquantity included water used for domestic purposes and washing of slaughtering floor. Slaughterhouse-2 was asmall scale unit but included pig slaughtering also. The daily average slaughtering was 20-25 animals and the waterconsumption 600l/head. The raw effluent samples were collected from slaughterhouse-1 approximately twice amonth, for a period of 7 months. Slaughterhouse-2 was sampled only once. The samples were collected after partialsettling of coarser solids. The samples were analysed in duplicate for physicochemical parameters like pH, COD,total dissolved solids (TDS), suspended solids (SS), phosphates, ammonia nitrogen, oil and grease and alkalinityaccording to standard methods. Protein content in the samples was determined by Lowri (Folin-Ciocalteau) method,using bovine serum albumin (BSA) as standard.
RESULTS AND CONCLUSIONS
The physicochemical characteristics of raw wastewater collected from slaughterhouses-1 and 2 are illustrated inTable 1. The effluent samples, except sample 2, were collected directly from the drains leading to the raw wastewatersettling tanks. The sample 2 was collected from the inlet point of the settling tank of slaughterhouse-1 and itincluded slaughterhouse wash water also.
All values of the parameters analysed except pH and nitrate nitrogen exceeded the effluent quality standards fordischarge into land or water bodies prescribed by the State Pollution Control Board. The slaughterhouse effluentsexhibited neutral pH. Even after initial settling and screening, SS was present in high quantities. The effluents werefound to have high concentrations of COD, TDS, phosphates, alkalinity and organic nitrogen such as protein andammonia nitrogen. The oil and grease in the effluents varied from 13.4- 107mg/l indicating rich levels of lipids.The temperature of slaughterhouse wastewaters remained in the range 30+_20C and had reddish brown colour dueto the presence of haemoglobin. The values obtained are comparable to those reported in the characterizationstudies of hog slaughterhouse wastewater in Canada (Masse and Masse 2000) and different slaughterhouses inIndia (CPCB 1992).
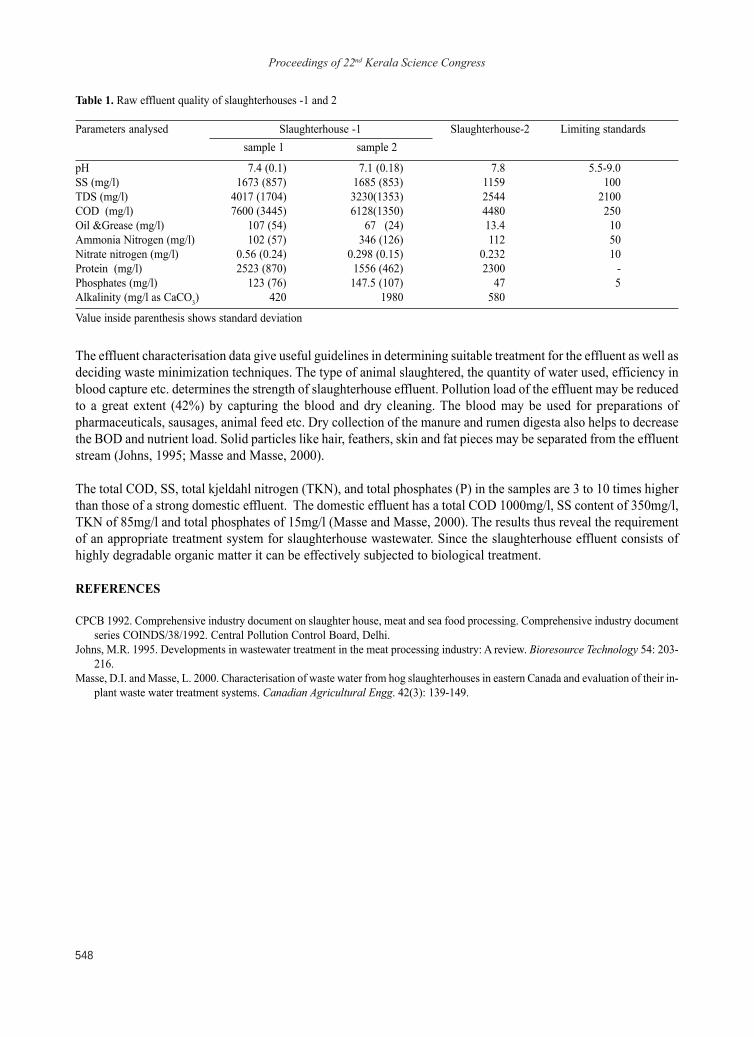
Proceedings of 22nd Kerala Science Congress
548
The effluent characterisation data give useful guidelines in determining suitable treatment for the effluent as well asdeciding waste minimization techniques. The type of animal slaughtered, the quantity of water used, efficiency inblood capture etc. determines the strength of slaughterhouse effluent. Pollution load of the effluent may be reducedto a great extent (42%) by capturing the blood and dry cleaning. The blood may be used for preparations ofpharmaceuticals, sausages, animal feed etc. Dry collection of the manure and rumen digesta also helps to decreasethe BOD and nutrient load. Solid particles like hair, feathers, skin and fat pieces may be separated from the effluentstream (Johns, 1995; Masse and Masse, 2000).
The total COD, SS, total kjeldahl nitrogen (TKN), and total phosphates (P) in the samples are 3 to 10 times higherthan those of a strong domestic effluent. The domestic effluent has a total COD 1000mg/l, SS content of 350mg/l,TKN of 85mg/l and total phosphates of 15mg/l (Masse and Masse, 2000). The results thus reveal the requirementof an appropriate treatment system for slaughterhouse wastewater. Since the slaughterhouse effluent consists ofhighly degradable organic matter it can be effectively subjected to biological treatment.
REFERENCES
CPCB 1992. Comprehensive industry document on slaughter house, meat and sea food processing. Comprehensive industry documentseries COINDS/38/1992. Central Pollution Control Board, Delhi.
Johns, M.R. 1995. Developments in wastewater treatment in the meat processing industry: A review. Bioresource Technology 54: 203-216.
Masse, D.I. and Masse, L. 2000. Characterisation of waste water from hog slaughterhouses in eastern Canada and evaluation of their in-plant waste water treatment systems. Canadian Agricultural Engg. 42(3): 139-149.
Table 1. Raw effluent quality of slaughterhouses -1 and 2
Parameters analysed Slaughterhouse -1 Slaughterhouse-2 Limiting standardssample 1 sample 2
pH 7.4 (0.1) 7.1 (0.18) 7.8 5.5-9.0SS (mg/l) 1673 (857) 1685 (853) 1159 100TDS (mg/l) 4017 (1704) 3230(1353) 2544 2100COD (mg/l) 7600 (3445) 6128(1350) 4480 250Oil &Grease (mg/l) 107 (54) 67 (24) 13.4 10Ammonia Nitrogen (mg/l) 102 (57) 346 (126) 112 50Nitrate nitrogen (mg/l) 0.56 (0.24) 0.298 (0.15) 0.232 10Protein (mg/l) 2523 (870) 1556 (462) 2300 -Phosphates (mg/l) 123 (76) 147.5 (107) 47 5Alkalinity (mg/l as CaCO3) 420 1980 580
Value inside parenthesis shows standard deviation
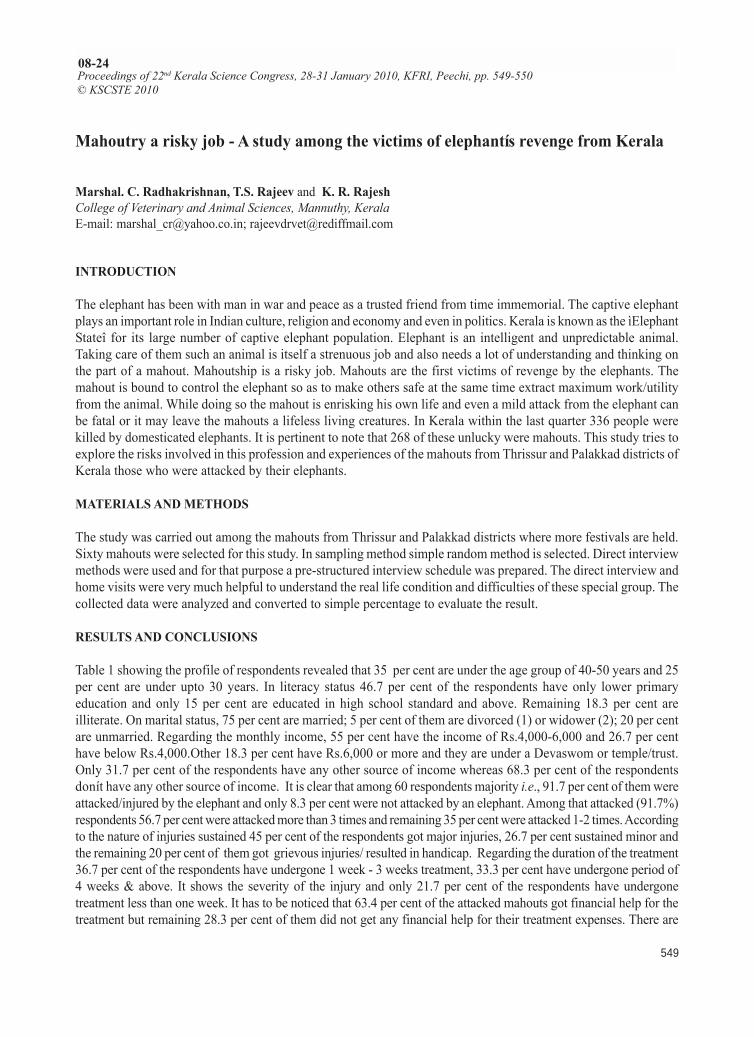
Proceedings of 22nd Kerala Science Congress
549
Proceedings of 22nd Kerala Science Congress, 28-31 January 2010, KFRI, Peechi, pp. 549-550© KSCSTE 2010
08-24
Mahoutry a risky job - A study among the victims of elephantís revenge from Kerala
Marshal. C. Radhakrishnan, T.S. Rajeev and K. R. RajeshCollege of Veterinary and Animal Sciences, Mannuthy, KeralaE-mail: [email protected]; [email protected]
INTRODUCTION
The elephant has been with man in war and peace as a trusted friend from time immemorial. The captive elephantplays an important role in Indian culture, religion and economy and even in politics. Kerala is known as the ìElephantStateî for its large number of captive elephant population. Elephant is an intelligent and unpredictable animal.Taking care of them such an animal is itself a strenuous job and also needs a lot of understanding and thinking onthe part of a mahout. Mahoutship is a risky job. Mahouts are the first victims of revenge by the elephants. Themahout is bound to control the elephant so as to make others safe at the same time extract maximum work/utilityfrom the animal. While doing so the mahout is enrisking his own life and even a mild attack from the elephant canbe fatal or it may leave the mahouts a lifeless living creatures. In Kerala within the last quarter 336 people werekilled by domesticated elephants. It is pertinent to note that 268 of these unlucky were mahouts. This study tries toexplore the risks involved in this profession and experiences of the mahouts from Thrissur and Palakkad districts ofKerala those who were attacked by their elephants.
MATERIALS AND METHODS
The study was carried out among the mahouts from Thrissur and Palakkad districts where more festivals are held.Sixty mahouts were selected for this study. In sampling method simple random method is selected. Direct interviewmethods were used and for that purpose a pre-structured interview schedule was prepared. The direct interview andhome visits were very much helpful to understand the real life condition and difficulties of these special group. Thecollected data were analyzed and converted to simple percentage to evaluate the result.
RESULTS AND CONCLUSIONS
Table 1 showing the profile of respondents revealed that 35 per cent are under the age group of 40-50 years and 25per cent are under upto 30 years. In literacy status 46.7 per cent of the respondents have only lower primaryeducation and only 15 per cent are educated in high school standard and above. Remaining 18.3 per cent areilliterate. On marital status, 75 per cent are married; 5 per cent of them are divorced (1) or widower (2); 20 per centare unmarried. Regarding the monthly income, 55 per cent have the income of Rs.4,000-6,000 and 26.7 per centhave below Rs.4,000.Other 18.3 per cent have Rs.6,000 or more and they are under a Devaswom or temple/trust.Only 31.7 per cent of the respondents have any other source of income whereas 68.3 per cent of the respondentsdonít have any other source of income. It is clear that among 60 respondents majority i.e., 91.7 per cent of them wereattacked/injured by the elephant and only 8.3 per cent were not attacked by an elephant. Among that attacked (91.7%)respondents 56.7 per cent were attacked more than 3 times and remaining 35 per cent were attacked 1-2 times. Accordingto the nature of injuries sustained 45 per cent of the respondents got major injuries, 26.7 per cent sustained minor andthe remaining 20 per cent of them got grievous injuries/ resulted in handicap. Regarding the duration of the treatment36.7 per cent of the respondents have undergone 1 week - 3 weeks treatment, 33.3 per cent have undergone period of4 weeks & above. It shows the severity of the injury and only 21.7 per cent of the respondents have undergonetreatment less than one week. It has to be noticed that 63.4 per cent of the attacked mahouts got financial help for thetreatment but remaining 28.3 per cent of them did not get any financial help for their treatment expenses. There are
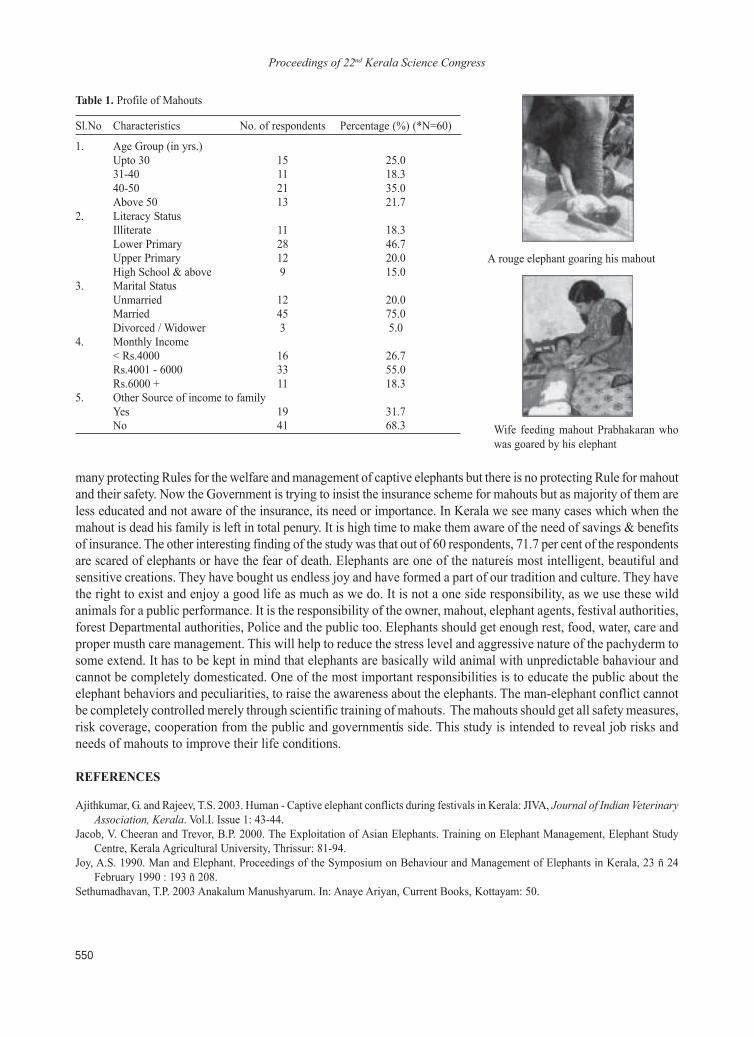
Proceedings of 22nd Kerala Science Congress
550
many protecting Rules for the welfare and management of captive elephants but there is no protecting Rule for mahoutand their safety. Now the Government is trying to insist the insurance scheme for mahouts but as majority of them areless educated and not aware of the insurance, its need or importance. In Kerala we see many cases which when themahout is dead his family is left in total penury. It is high time to make them aware of the need of savings & benefitsof insurance. The other interesting finding of the study was that out of 60 respondents, 71.7 per cent of the respondentsare scared of elephants or have the fear of death. Elephants are one of the natureís most intelligent, beautiful andsensitive creations. They have bought us endless joy and have formed a part of our tradition and culture. They havethe right to exist and enjoy a good life as much as we do. It is not a one side responsibility, as we use these wildanimals for a public performance. It is the responsibility of the owner, mahout, elephant agents, festival authorities,forest Departmental authorities, Police and the public too. Elephants should get enough rest, food, water, care andproper musth care management. This will help to reduce the stress level and aggressive nature of the pachyderm tosome extend. It has to be kept in mind that elephants are basically wild animal with unpredictable bahaviour andcannot be completely domesticated. One of the most important responsibilities is to educate the public about theelephant behaviors and peculiarities, to raise the awareness about the elephants. The man-elephant conflict cannotbe completely controlled merely through scientific training of mahouts. The mahouts should get all safety measures,risk coverage, cooperation from the public and governmentís side. This study is intended to reveal job risks andneeds of mahouts to improve their life conditions.
REFERENCES
Ajithkumar, G. and Rajeev, T.S. 2003. Human - Captive elephant conflicts during festivals in Kerala: JIVA, Journal of Indian VeterinaryAssociation, Kerala. Vol.I. Issue 1: 43-44.
Jacob, V. Cheeran and Trevor, B.P. 2000. The Exploitation of Asian Elephants. Training on Elephant Management, Elephant StudyCentre, Kerala Agricultural University, Thrissur: 81-94.
Joy, A.S. 1990. Man and Elephant. Proceedings of the Symposium on Behaviour and Management of Elephants in Kerala, 23 ñ 24February 1990 : 193 ñ 208.
Sethumadhavan, T.P. 2003 Anakalum Manushyarum. In: Anaye Ariyan, Current Books, Kottayam: 50.
Table 1. Profile of Mahouts
Sl.No Characteristics No. of respondents Percentage (%) (*N=60)
1. Age Group (in yrs.)Upto 30 15 25.031-40 11 18.340-50 21 35.0Above 50 13 21.7
2. Literacy StatusIlliterate 11 18.3Lower Primary 28 46.7Upper Primary 12 20.0High School & above 9 15.0
3. Marital StatusUnmarried 12 20.0Married 45 75.0Divorced / Widower 3 5.0
4. Monthly Income< Rs.4000 16 26.7Rs.4001 - 6000 33 55.0Rs.6000 + 11 18.3
5. Other Source of income to familyYes 19 31.7No 41 68.3 Wife feeding mahout Prabhakaran who
was goared by his elephant
A rouge elephant goaring his mahout
Proceedings of 22nd Kerala Science Congress
551
Development of cost functions and economic evaluation for the construction of sewagetreatment plant in Kerala
C. Sajeev*, K. Shibu and M. Sreekumar1College of Engineering, Thiruvananthapuram1Kerala Water AuthorityE- mail: [email protected];[email protected]; [email protected]
INTRODUCTION
Sewage generated from the urban area of Kerala is estimated to be about 1115 million liters per day (MLD). Morethan 95 per cent of the sewage generated is disposed without any treatment and it necessitates effective sewagedisposal facilities. Since budgetary provisions for sewage treatment plants (STPs) are to be made without detaileddesign, it is necessary that a simple and rapid technique for cost estimation is available. Development of costfunctions will help in a realistic assessment of the cost without detailed design during the planning stage itself thusleading to a better cost proposal. At present no rational method is available for the cost estimation and land requirementof STPs in Kerala. The objectives of this study are Developing Cost Functions and Land Requirement equations forthe preparation of preliminary estimate for STPs, Comparison of cost and land requirement of same capacity STPsby evaluation of Net Present Worth of investment (NPW) with different treatment processes
MATERIALS AND METHODS
Three treatment options used in this study were Activated Sludge Process with Extended Aeration (ASP), UpflowAnaerobic Sludge Blanket with Polishing Pond (UASB) and Moving Bed Bio Reactor (MBBR). After designingthe different units for capacities from 5 to 50MLD, civil construction costs were estimated as per the currentschedule of rates (2009) of Government of Kerala. Estimates for Electrical and Mechanical items were taken basedon current market rates. Cost functions for Capital Cost and Operation and Maintenance Cost were developed afterestimating cost for the three methods of treatments for different sizes. Cost functions were developed in terms ofcapacity of plants in MLD. Land requirement curve was also generated by computing the footprint of each unit fordifferent capacities.
RESULTS AND CONCLUSIONS
The Cost Curves (Figs.1,2) and corresponding cost functions for Capital Cost and Operation and MaintenanceCost were developed for three methods of treatment viz., Activate Sludge with Extended Aeration, Up flow AnaerobicSludge Blanket with Polishing Pond and Moving Bed Bio Reactor. The cost functions developed for Total CapitalCost and Operation and Maintenance Cost for ASP, UASB and MBBR respectively are:
C= 108.74Q0.7012 and M=17.247 Q0.8074, C= 67.572Q0.7849and M=8.6454 Q0.6091 andC= 103.66 Q0.6955 and M=16.345 Q0.7914 where ëQí is the capacity of plant in MLD. ëCí total capital cost Rs in lakhsand ëMí is the Operation and Maintenance Cost Rs in lakhs. The total capital cost is minimum for UASB .Operationand Maintenance Cost is also minimum for UASB Process. Unit capital cost for all the processes were found to bedecreasing with the capacity of plant. Land requirement curves (Fig.3) were also developed and the functions forthe three processes ASP, UASB and MBBR are obtained as L=0.235Q0.655, L=0.208Q0.847 and L=0.170Q0.618respectively. (ëLí is the land requirement in hectares). Land requirement is minimum for MBBR Process and maximumfor UASB with PP Process. The land requirement is minimum for MBBR Process and maximum for UASB.
Proceedings of 22nd Kerala Science Congress, 28-31 January 2010, KFRI, Peechi, pp. 551-552© KSCSTE 2010
08-25
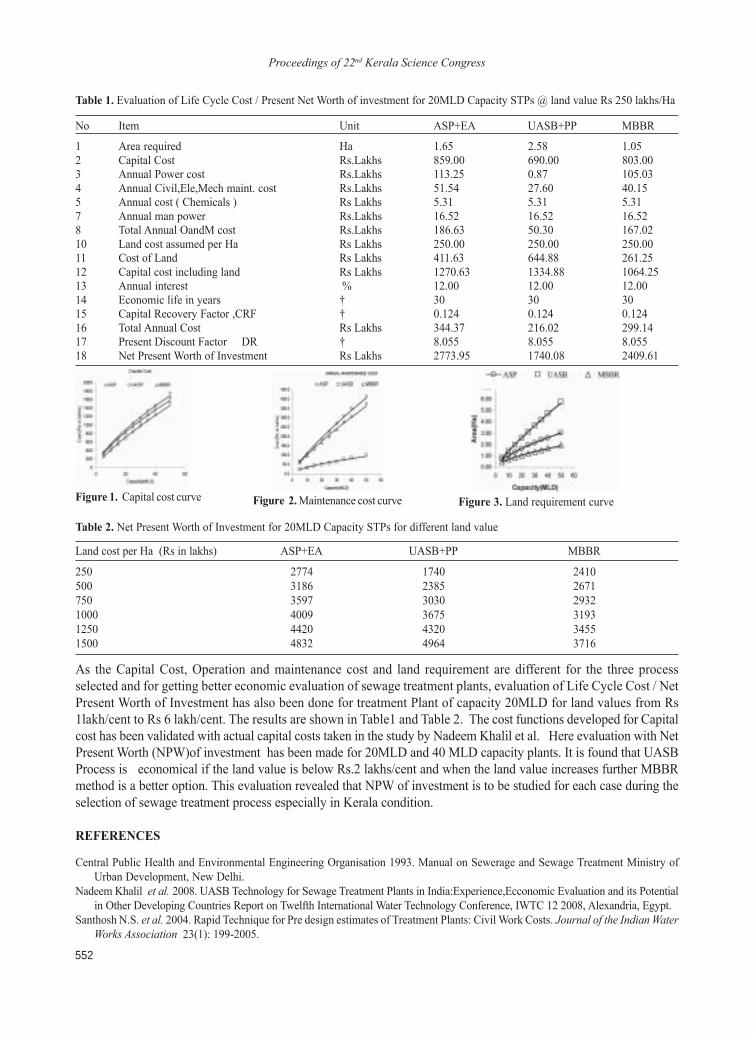
Proceedings of 22nd Kerala Science Congress
552
As the Capital Cost, Operation and maintenance cost and land requirement are different for the three processselected and for getting better economic evaluation of sewage treatment plants, evaluation of Life Cycle Cost / NetPresent Worth of Investment has also been done for treatment Plant of capacity 20MLD for land values from Rs1lakh/cent to Rs 6 lakh/cent. The results are shown in Table1 and Table 2. The cost functions developed for Capitalcost has been validated with actual capital costs taken in the study by Nadeem Khalil et al. Here evaluation with NetPresent Worth (NPW)of investment has been made for 20MLD and 40 MLD capacity plants. It is found that UASBProcess is economical if the land value is below Rs.2 lakhs/cent and when the land value increases further MBBRmethod is a better option. This evaluation revealed that NPW of investment is to be studied for each case during theselection of sewage treatment process especially in Kerala condition.
REFERENCES
Central Public Health and Environmental Engineering Organisation 1993. Manual on Sewerage and Sewage Treatment Ministry ofUrban Development, New Delhi.
Nadeem Khalil et al. 2008. UASB Technology for Sewage Treatment Plants in India:Experience,Ecconomic Evaluation and its Potentialin Other Developing Countries Report on Twelfth International Water Technology Conference, IWTC 12 2008, Alexandria, Egypt.
Santhosh N.S. et al. 2004. Rapid Technique for Pre design estimates of Treatment Plants: Civil Work Costs. Journal of the Indian WaterWorks Association 23(1): 199-2005.
Table 1. Evaluation of Life Cycle Cost / Present Net Worth of investment for 20MLD Capacity STPs @ land value Rs 250 lakhs/Ha
No Item Unit ASP+EA UASB+PP MBBR
1 Area required Ha 1.65 2.58 1.052 Capital Cost Rs.Lakhs 859.00 690.00 803.003 Annual Power cost Rs.Lakhs 113.25 0.87 105.034 Annual Civil,Ele,Mech maint. cost Rs.Lakhs 51.54 27.60 40.155 Annual cost ( Chemicals ) Rs Lakhs 5.31 5.31 5.317 Annual man power Rs.Lakhs 16.52 16.52 16.528 Total Annual OandM cost Rs.Lakhs 186.63 50.30 167.0210 Land cost assumed per Ha Rs Lakhs 250.00 250.00 250.0011 Cost of Land Rs Lakhs 411.63 644.88 261.2512 Capital cost including land Rs Lakhs 1270.63 1334.88 1064.2513 Annual interest % 12.00 12.00 12.0014 Economic life in years � 30 30 3015 Capital Recovery Factor ,CRF � 0.124 0.124 0.12416 Total Annual Cost Rs Lakhs 344.37 216.02 299.1417 Present Discount Factor DR � 8.055 8.055 8.05518 Net Present Worth of Investment Rs Lakhs 2773.95 1740.08 2409.61
Figure 1. Capital cost curve Figure 2. Maintenance cost curve Figure 3. Land requirement curve
Table 2. Net Present Worth of Investment for 20MLD Capacity STPs for different land value
Land cost per Ha (Rs in lakhs) ASP+EA UASB+PP MBBR
250 2774 1740 2410500 3186 2385 2671750 3597 3030 29321000 4009 3675 31931250 4420 4320 34551500 4832 4964 3716
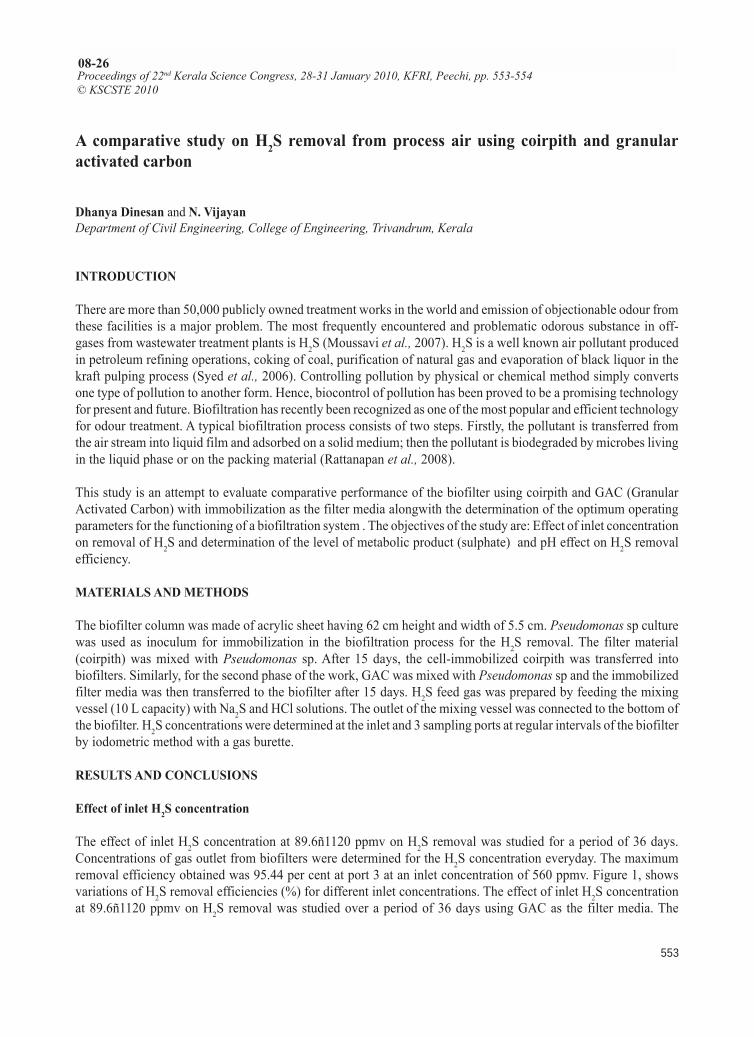
Proceedings of 22nd Kerala Science Congress
553
A comparative study on H2S removal from process air using coirpith and granularactivated carbon
Dhanya Dinesan and N. VijayanDepartment of Civil Engineering, College of Engineering, Trivandrum, Kerala
INTRODUCTION
There are more than 50,000 publicly owned treatment works in the world and emission of objectionable odour fromthese facilities is a major problem. The most frequently encountered and problematic odorous substance in off-gases from wastewater treatment plants is H2S (Moussavi et al., 2007). H2S is a well known air pollutant producedin petroleum refining operations, coking of coal, purification of natural gas and evaporation of black liquor in thekraft pulping process (Syed et al., 2006). Controlling pollution by physical or chemical method simply convertsone type of pollution to another form. Hence, biocontrol of pollution has been proved to be a promising technologyfor present and future. Biofiltration has recently been recognized as one of the most popular and efficient technologyfor odour treatment. A typical biofiltration process consists of two steps. Firstly, the pollutant is transferred fromthe air stream into liquid film and adsorbed on a solid medium; then the pollutant is biodegraded by microbes livingin the liquid phase or on the packing material (Rattanapan et al., 2008).
This study is an attempt to evaluate comparative performance of the biofilter using coirpith and GAC (GranularActivated Carbon) with immobilization as the filter media alongwith the determination of the optimum operatingparameters for the functioning of a biofiltration system . The objectives of the study are: Effect of inlet concentrationon removal of H2S and determination of the level of metabolic product (sulphate) and pH effect on H2S removalefficiency.
MATERIALS AND METHODS
The biofilter column was made of acrylic sheet having 62 cm height and width of 5.5 cm. Pseudomonas sp culturewas used as inoculum for immobilization in the biofiltration process for the H2S removal. The filter material(coirpith) was mixed with Pseudomonas sp. After 15 days, the cell-immobilized coirpith was transferred intobiofilters. Similarly, for the second phase of the work, GAC was mixed with Pseudomonas sp and the immobilizedfilter media was then transferred to the biofilter after 15 days. H2S feed gas was prepared by feeding the mixingvessel (10 L capacity) with Na2S and HCl solutions. The outlet of the mixing vessel was connected to the bottom ofthe biofilter. H2S concentrations were determined at the inlet and 3 sampling ports at regular intervals of the biofilterby iodometric method with a gas burette.
RESULTS AND CONCLUSIONS
Effect of inlet H2S concentration
The effect of inlet H2S concentration at 89.6ñ1120 ppmv on H2S removal was studied for a period of 36 days.Concentrations of gas outlet from biofilters were determined for the H2S concentration everyday. The maximumremoval efficiency obtained was 95.44 per cent at port 3 at an inlet concentration of 560 ppmv. Figure 1, showsvariations of H2S removal efficiencies (%) for different inlet concentrations. The effect of inlet H2S concentrationat 89.6ñ1120 ppmv on H2S removal was studied over a period of 36 days using GAC as the filter media. The
Proceedings of 22nd Kerala Science Congress, 28-31 January 2010, KFRI, Peechi, pp. 553-554© KSCSTE 2010
08-26
Proceedings of 22nd Kerala Science Congress
554
efficiency of H2S removal was 95.89 per cent at an inlet concentration of 560 ppmv. Figure 2 shows variations ofmaximum removal efficiencies for different inlet concentrations.
Figure 2. Variations of Maximum H2S Removal Efficienciesat Different Inlet Concentrations (Immobilized GAC)
Figure1. Variations of Maximum H2S Removal Efficienciesat Different Inlet Concentrations (Immobilized Coirpith)
Determination of metabolic products and effect of pH
Acidification and metabolic products are significant parameters for acid gas treatment. The major metabolic productin H2S treatment is sulphate. In this study, the level of sulphate in the biofiltration system for H2S removal wereconsidered as a part of the functions of biofiltration. It was found that sulphate concentration increased to 22 mg/L of immobilized coirpith in biofilter. During the 36-days operation pH in biofiltration was determined at regularintervals. It was found that pH decreased from 6.2 to 3.05. However, the variations of pH were not influenced on theefficiency of H2S removal. pH decreased from 6.19 to 3.45 when immobilized coirpith was used as filter media. Inthe case of immobilized GAC, the sulphate concentration increased to 17.8 mg/L. pH was decreased from8.52 to3.50. Variations of pH had negligible effect on the efficiency of H2S removal.
REFERENCES
Moussavi, G.,.Naddafi, K., Mesdaghinia, A. and Deshusses, A.M. 2007. The Removal of H2S from Process Air by Diffusion intoActivated Sludge. Journal of Environmental Technology 28: 987- 993.
Rattanapan, C., Boonsawang, P. and Kantachote, D. 2008. Removal of H2S in Down- Flow GAC Biofiltration System Using SulphideOxidizing Bacteria from Concentrated Latex Wastewater. Journal of Bioresource Technology 100:125-130.
Syed, M., Soreanu, G., Falletta, P. and Beland, M. 2006. Removal of H2S from Gas Streams using Biological Processes- A Review.Wastewater Technology 48:2.1- 2.14
Proceedings of 22nd Kerala Science Congress
555
Upflow Anaerobic and Aerobic Fixed Bed (UA-AFB) reactor for simultaneous COD andnitrogen removal
S. L. Jayaraj and P. LathaCollege of Engineering, Thiruvananthapuram, Kerala
INTRODUCTION
The most important adverse environmental impacts associated with improper discharge of municipal wastewaterhaving significant amounts of organic matter (COD), Nitrogen and Phosphorous include promotion of Eutrophication,toxicity to aquatic organisms and depletion of dissolved oxygen receiving streams. Due to these adverse impacts,completed treatment of municipal wastewater before discharge has been increasingly needed. The aim of the projectis to design and construct upflow aerobic and anaerobic fixed bed reactors in which anaerobic and aerobic zonescould run in separate reactors to study simultaneously COD and Nitrogen removal from municipal wastewater.
MATERIALS AND METHODS
The anaerobic and aerobic reactors were made from acrylic plastic. The reactors were filled with corrugated plastictubes as a media for attaching the biofilm. The biofilm development was achieved using a medium, three times asconcentrated as the characteristic of prepared synthetic wastewater and running the reactor first for 10 days in thebatch mode and then over to the continuous mode for 5 days using synthetic wastewater. The effluent were analysedto check whether a stable COD removal is achieved. The reactors were connected serially to make an UpflowAnaerobic-Aerobic Fixed Bed (UA-AFB) reactor.
RESULTS AND CONCLUSIONS
The characteristics of synthetic wastewater was COD- 600 mg/L, pHñ 7.5, Alkalinityñ100 mg/L, Turbidityñ160NTU, NH3 ñ Nñ20.3 mg/L and NO3
- - Nñ 11.8 mg/L. The synthetic wastewater having influent COD of 600 mg/Lwas fed to the connected reactors. Table 3 tabulates the per centCOD removal on the separate anaerobic, aerobicreactors and on the combination of both. According to the Figure 1, most of COD removal occured in the aerobicreactor, compared to anaerobic reactor. This may be because aerobic bacteria are dominate in the reactor havinghigher organic biodegradation rate.
Nitrification
Synthetic wastewater having influent NH3-N value 20.3 mg/L was fed to the combined reactor. Table 4 showsnitrification efficiency data in anaerobic, aerobic and combined reactors. As indicated in the table, percent ofammonia nitrogen removal in the anaerobic reactor is very low, in which the removed ammonia have been consumedfor cell synthesis. Table 6 shows that as the HRT have been increased in range of 4 to 9 h, nitrification increasedfrom 66 to 92 per cent.
Denitrification
The wastewater having nitrate concentration of 10.8 mg/L was fed through the anaerobic part of the system. Table5 shows the denitrification efficiency in anaerobic, aerobic and combined reactor at different HRT. It should beemphasis that a very small amount of denitrification was occurred in the aerobic zone.
Proceedings of 22nd Kerala Science Congress, 28-31 January 2010, KFRI, Peechi, pp. 555-556© KSCSTE 2010
08-27
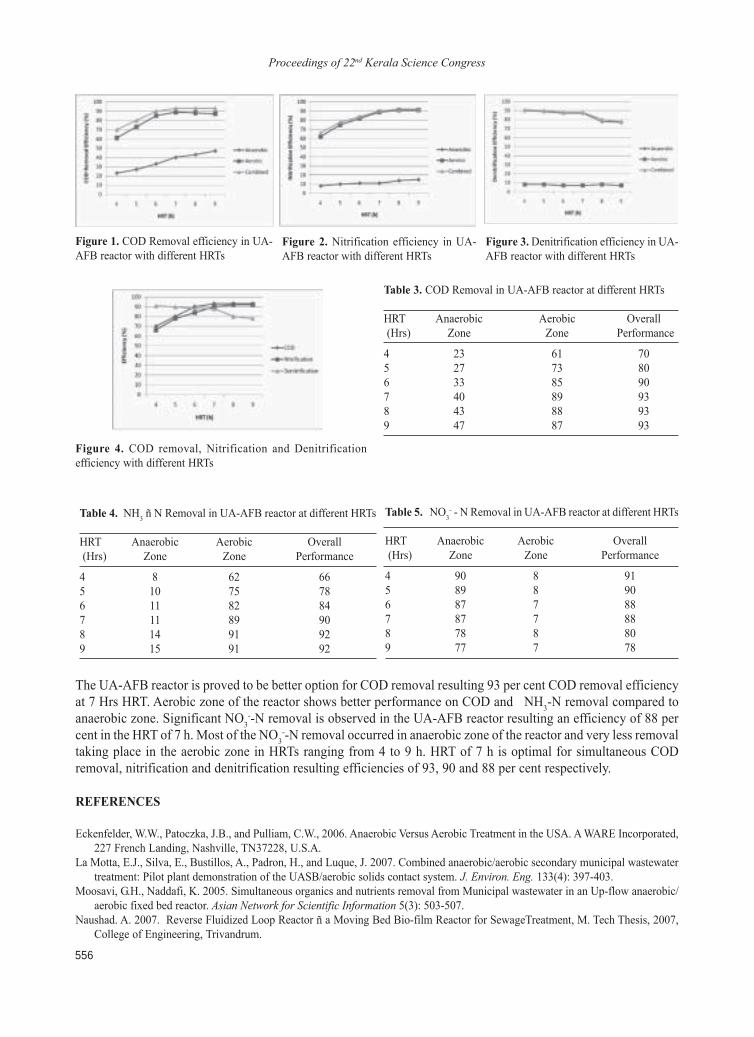
Proceedings of 22nd Kerala Science Congress
556
The UA-AFB reactor is proved to be better option for COD removal resulting 93 per cent COD removal efficiencyat 7 Hrs HRT. Aerobic zone of the reactor shows better performance on COD and NH3-N removal compared toanaerobic zone. Significant NO3
--N removal is observed in the UA-AFB reactor resulting an efficiency of 88 percent in the HRT of 7 h. Most of the NO3
--N removal occurred in anaerobic zone of the reactor and very less removaltaking place in the aerobic zone in HRTs ranging from 4 to 9 h. HRT of 7 h is optimal for simultaneous CODremoval, nitrification and denitrification resulting efficiencies of 93, 90 and 88 per cent respectively.
REFERENCES
Eckenfelder, W.W., Patoczka, J.B., and Pulliam, C.W., 2006. Anaerobic Versus Aerobic Treatment in the USA. A WARE Incorporated,227 French Landing, Nashville, TN37228, U.S.A.
La Motta, E.J., Silva, E., Bustillos, A., Padron, H., and Luque, J. 2007. Combined anaerobic/aerobic secondary municipal wastewatertreatment: Pilot plant demonstration of the UASB/aerobic solids contact system. J. Environ. Eng. 133(4): 397-403.
Moosavi, G.H., Naddafi, K. 2005. Simultaneous organics and nutrients removal from Municipal wastewater in an Up-flow anaerobic/aerobic fixed bed reactor. Asian Network for Scientific Information 5(3): 503-507.
Naushad. A. 2007. Reverse Fluidized Loop Reactor ñ a Moving Bed Bio-film Reactor for SewageTreatment, M. Tech Thesis, 2007,College of Engineering, Trivandrum.
Table 3. COD Removal in UA-AFB reactor at different HRTs
HRT Anaerobic Aerobic Overall (Hrs) Zone Zone Performance
4 23 61 705 27 73 806 33 85 907 40 89 938 43 88 939 47 87 93
Table 4. NH3 ñ N Removal in UA-AFB reactor at different HRTs
HRT Anaerobic Aerobic Overall (Hrs) Zone Zone Performance
4 8 62 665 10 75 786 11 82 847 11 89 908 14 91 929 15 91 92
Figure 4. COD removal, Nitrification and Denitrificationefficiency with different HRTs
Figure 1. COD Removal efficiency in UA-AFB reactor with different HRTs
Figure 2. Nitrification efficiency in UA-AFB reactor with different HRTs
Figure 3. Denitrification efficiency in UA-AFB reactor with different HRTs
Table 5. NO3- - N Removal in UA-AFB reactor at different HRTs
HRT Anaerobic Aerobic Overall (Hrs) Zone Zone Performance
4 90 8 915 89 8 906 87 7 887 87 7 888 78 8 809 77 7 78
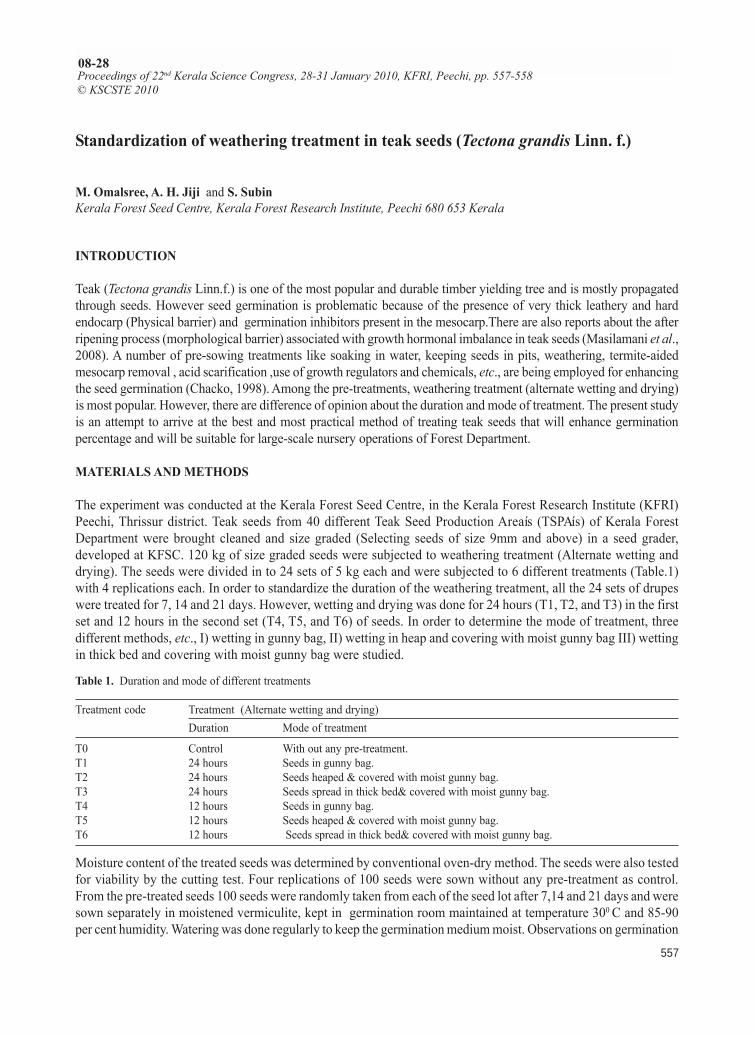
Proceedings of 22nd Kerala Science Congress
557
Standardization of weathering treatment in teak seeds (Tectona grandis Linn. f.)
M. Omalsree, A. H. Jiji and S. SubinKerala Forest Seed Centre, Kerala Forest Research Institute, Peechi 680 653 Kerala
INTRODUCTION
Teak (Tectona grandis Linn.f.) is one of the most popular and durable timber yielding tree and is mostly propagatedthrough seeds. However seed germination is problematic because of the presence of very thick leathery and hardendocarp (Physical barrier) and germination inhibitors present in the mesocarp.There are also reports about the afterripening process (morphological barrier) associated with growth hormonal imbalance in teak seeds (Masilamani et al.,2008). A number of pre-sowing treatments like soaking in water, keeping seeds in pits, weathering, termite-aidedmesocarp removal , acid scarification ,use of growth regulators and chemicals, etc., are being employed for enhancingthe seed germination (Chacko, 1998). Among the pre-treatments, weathering treatment (alternate wetting and drying)is most popular. However, there are difference of opinion about the duration and mode of treatment. The present studyis an attempt to arrive at the best and most practical method of treating teak seeds that will enhance germinationpercentage and will be suitable for large-scale nursery operations of Forest Department.
MATERIALS AND METHODS
The experiment was conducted at the Kerala Forest Seed Centre, in the Kerala Forest Research Institute (KFRI)Peechi, Thrissur district. Teak seeds from 40 different Teak Seed Production Areaís (TSPAís) of Kerala ForestDepartment were brought cleaned and size graded (Selecting seeds of size 9mm and above) in a seed grader,developed at KFSC. 120 kg of size graded seeds were subjected to weathering treatment (Alternate wetting anddrying). The seeds were divided in to 24 sets of 5 kg each and were subjected to 6 different treatments (Table.1)with 4 replications each. In order to standardize the duration of the weathering treatment, all the 24 sets of drupeswere treated for 7, 14 and 21 days. However, wetting and drying was done for 24 hours (T1, T2, and T3) in the firstset and 12 hours in the second set (T4, T5, and T6) of seeds. In order to determine the mode of treatment, threedifferent methods, etc., I) wetting in gunny bag, II) wetting in heap and covering with moist gunny bag III) wettingin thick bed and covering with moist gunny bag were studied.
Proceedings of 22nd Kerala Science Congress, 28-31 January 2010, KFRI, Peechi, pp. 557-558© KSCSTE 2010
08-28
Table 1. Duration and mode of different treatments
Treatment code Treatment (Alternate wetting and drying)Duration Mode of treatment
T0 Control With out any pre-treatment.T1 24 hours Seeds in gunny bag.T2 24 hours Seeds heaped & covered with moist gunny bag.T3 24 hours Seeds spread in thick bed& covered with moist gunny bag.T4 12 hours Seeds in gunny bag.T5 12 hours Seeds heaped & covered with moist gunny bag.T6 12 hours Seeds spread in thick bed& covered with moist gunny bag.
Moisture content of the treated seeds was determined by conventional oven-dry method. The seeds were also testedfor viability by the cutting test. Four replications of 100 seeds were sown without any pre-treatment as control.From the pre-treated seeds 100 seeds were randomly taken from each of the seed lot after 7,14 and 21 days and weresown separately in moistened vermiculite, kept in germination room maintained at temperature 300 C and 85-90per cent humidity. Watering was done regularly to keep the germination medium moist. Observations on germination
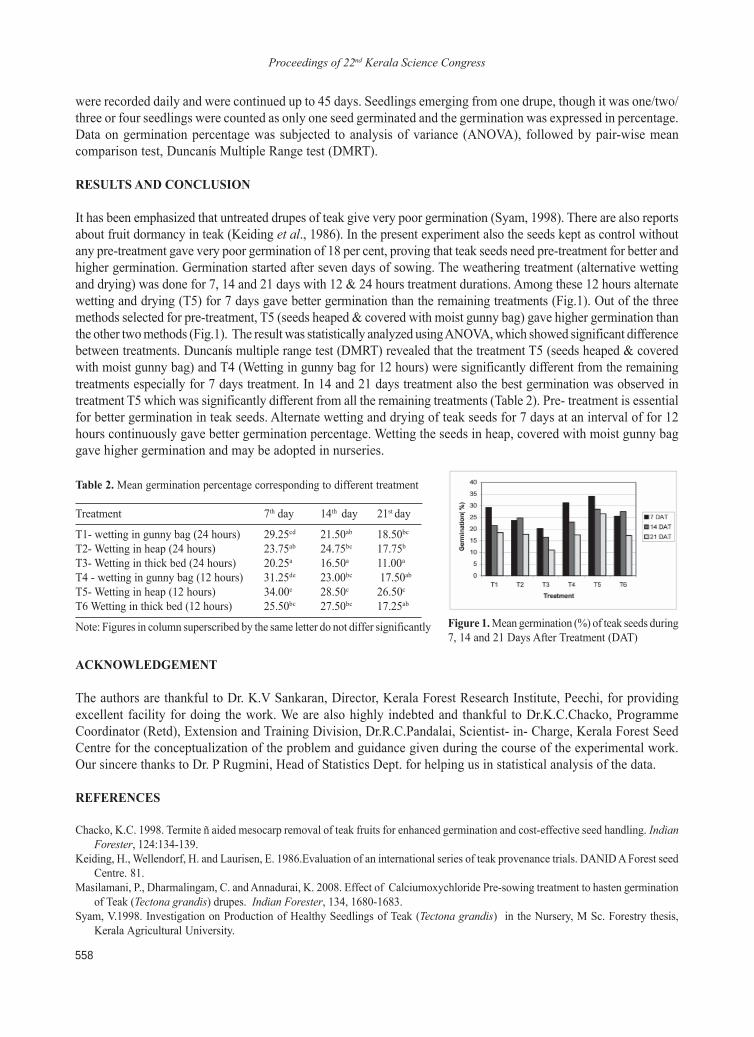
Proceedings of 22nd Kerala Science Congress
558
Table 2. Mean germination percentage corresponding to different treatment
Treatment 7th day 14th day 21st day
T1- wetting in gunny bag (24 hours) 29.25cd 21.50ab 18.50bcT2- Wetting in heap (24 hours) 23.75ab 24.75bc 17.75bT3- Wetting in thick bed (24 hours) 20.25a 16.50a 11.00aT4 - wetting in gunny bag (12 hours) 31.25de 23.00bc 17.50abT5- Wetting in heap (12 hours) 34.00e 28.50c 26.50cT6 Wetting in thick bed (12 hours) 25.50bc 27.50bc 17.25ab
Note: Figures in column superscribed by the same letter do not differ significantly
were recorded daily and were continued up to 45 days. Seedlings emerging from one drupe, though it was one/two/three or four seedlings were counted as only one seed germinated and the germination was expressed in percentage.Data on germination percentage was subjected to analysis of variance (ANOVA), followed by pair-wise meancomparison test, Duncanís Multiple Range test (DMRT).
RESULTS AND CONCLUSION
It has been emphasized that untreated drupes of teak give very poor germination (Syam, 1998). There are also reportsabout fruit dormancy in teak (Keiding et al., 1986). In the present experiment also the seeds kept as control withoutany pre-treatment gave very poor germination of 18 per cent, proving that teak seeds need pre-treatment for better andhigher germination. Germination started after seven days of sowing. The weathering treatment (alternative wettingand drying) was done for 7, 14 and 21 days with 12 & 24 hours treatment durations. Among these 12 hours alternatewetting and drying (T5) for 7 days gave better germination than the remaining treatments (Fig.1). Out of the threemethods selected for pre-treatment, T5 (seeds heaped & covered with moist gunny bag) gave higher germination thanthe other two methods (Fig.1). The result was statistically analyzed using ANOVA, which showed significant differencebetween treatments. Duncanís multiple range test (DMRT) revealed that the treatment T5 (seeds heaped & coveredwith moist gunny bag) and T4 (Wetting in gunny bag for 12 hours) were significantly different from the remainingtreatments especially for 7 days treatment. In 14 and 21 days treatment also the best germination was observed intreatment T5 which was significantly different from all the remaining treatments (Table 2). Pre- treatment is essentialfor better germination in teak seeds. Alternate wetting and drying of teak seeds for 7 days at an interval of for 12hours continuously gave better germination percentage. Wetting the seeds in heap, covered with moist gunny baggave higher germination and may be adopted in nurseries.
Figure 1. Mean germination (%) of teak seeds during7, 14 and 21 Days After Treatment (DAT)
ACKNOWLEDGEMENT
The authors are thankful to Dr. K.V Sankaran, Director, Kerala Forest Research Institute, Peechi, for providingexcellent facility for doing the work. We are also highly indebted and thankful to Dr.K.C.Chacko, ProgrammeCoordinator (Retd), Extension and Training Division, Dr.R.C.Pandalai, Scientist- in- Charge, Kerala Forest SeedCentre for the conceptualization of the problem and guidance given during the course of the experimental work.Our sincere thanks to Dr. P Rugmini, Head of Statistics Dept. for helping us in statistical analysis of the data.
REFERENCES
Chacko, K.C. 1998. Termite ñ aided mesocarp removal of teak fruits for enhanced germination and cost-effective seed handling. IndianForester, 124:134-139.
Keiding, H., Wellendorf, H. and Laurisen, E. 1986.Evaluation of an international series of teak provenance trials. DANID A Forest seedCentre. 81.
Masilamani, P., Dharmalingam, C. and Annadurai, K. 2008. Effect of Calciumoxychloride Pre-sowing treatment to hasten germinationof Teak (Tectona grandis) drupes. Indian Forester, 134, 1680-1683.
Syam, V.1998. Investigation on Production of Healthy Seedlings of Teak (Tectona grandis) in the Nursery, M Sc. Forestry thesis,Kerala Agricultural University.
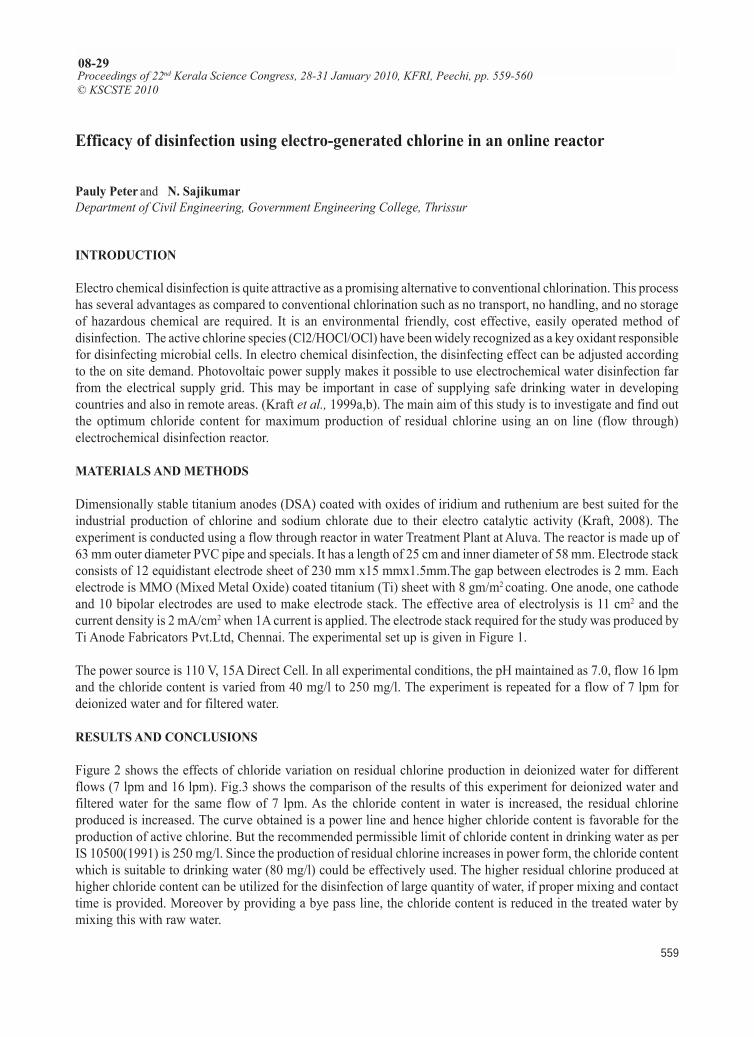
Proceedings of 22nd Kerala Science Congress
559
Efficacy of disinfection using electro-generated chlorine in an online reactor
Pauly Peter and N. SajikumarDepartment of Civil Engineering, Government Engineering College, Thrissur
INTRODUCTION
Electro chemical disinfection is quite attractive as a promising alternative to conventional chlorination. This processhas several advantages as compared to conventional chlorination such as no transport, no handling, and no storageof hazardous chemical are required. It is an environmental friendly, cost effective, easily operated method ofdisinfection. The active chlorine species (Cl2/HOCl/OCl) have been widely recognized as a key oxidant responsiblefor disinfecting microbial cells. In electro chemical disinfection, the disinfecting effect can be adjusted accordingto the on site demand. Photovoltaic power supply makes it possible to use electrochemical water disinfection farfrom the electrical supply grid. This may be important in case of supplying safe drinking water in developingcountries and also in remote areas. (Kraft et al., 1999a,b). The main aim of this study is to investigate and find outthe optimum chloride content for maximum production of residual chlorine using an on line (flow through)electrochemical disinfection reactor.
MATERIALS AND METHODS
Dimensionally stable titanium anodes (DSA) coated with oxides of iridium and ruthenium are best suited for theindustrial production of chlorine and sodium chlorate due to their electro catalytic activity (Kraft, 2008). Theexperiment is conducted using a flow through reactor in water Treatment Plant at Aluva. The reactor is made up of63 mm outer diameter PVC pipe and specials. It has a length of 25 cm and inner diameter of 58 mm. Electrode stackconsists of 12 equidistant electrode sheet of 230 mm x15 mmx1.5mm.The gap between electrodes is 2 mm. Eachelectrode is MMO (Mixed Metal Oxide) coated titanium (Ti) sheet with 8 gm/m2 coating. One anode, one cathodeand 10 bipolar electrodes are used to make electrode stack. The effective area of electrolysis is 11 cm2 and thecurrent density is 2 mA/cm2 when 1A current is applied. The electrode stack required for the study was produced byTi Anode Fabricators Pvt.Ltd, Chennai. The experimental set up is given in Figure 1.
The power source is 110 V, 15A Direct Cell. In all experimental conditions, the pH maintained as 7.0, flow 16 lpmand the chloride content is varied from 40 mg/l to 250 mg/l. The experiment is repeated for a flow of 7 lpm fordeionized water and for filtered water.
RESULTS AND CONCLUSIONS
Figure 2 shows the effects of chloride variation on residual chlorine production in deionized water for differentflows (7 lpm and 16 lpm). Fig.3 shows the comparison of the results of this experiment for deionized water andfiltered water for the same flow of 7 lpm. As the chloride content in water is increased, the residual chlorineproduced is increased. The curve obtained is a power line and hence higher chloride content is favorable for theproduction of active chlorine. But the recommended permissible limit of chloride content in drinking water as perIS 10500(1991) is 250 mg/l. Since the production of residual chlorine increases in power form, the chloride contentwhich is suitable to drinking water (80 mg/l) could be effectively used. The higher residual chlorine produced athigher chloride content can be utilized for the disinfection of large quantity of water, if proper mixing and contacttime is provided. Moreover by providing a bye pass line, the chloride content is reduced in the treated water bymixing this with raw water.
Proceedings of 22nd Kerala Science Congress, 28-31 January 2010, KFRI, Peechi, pp. 559-560© KSCSTE 2010
08-29
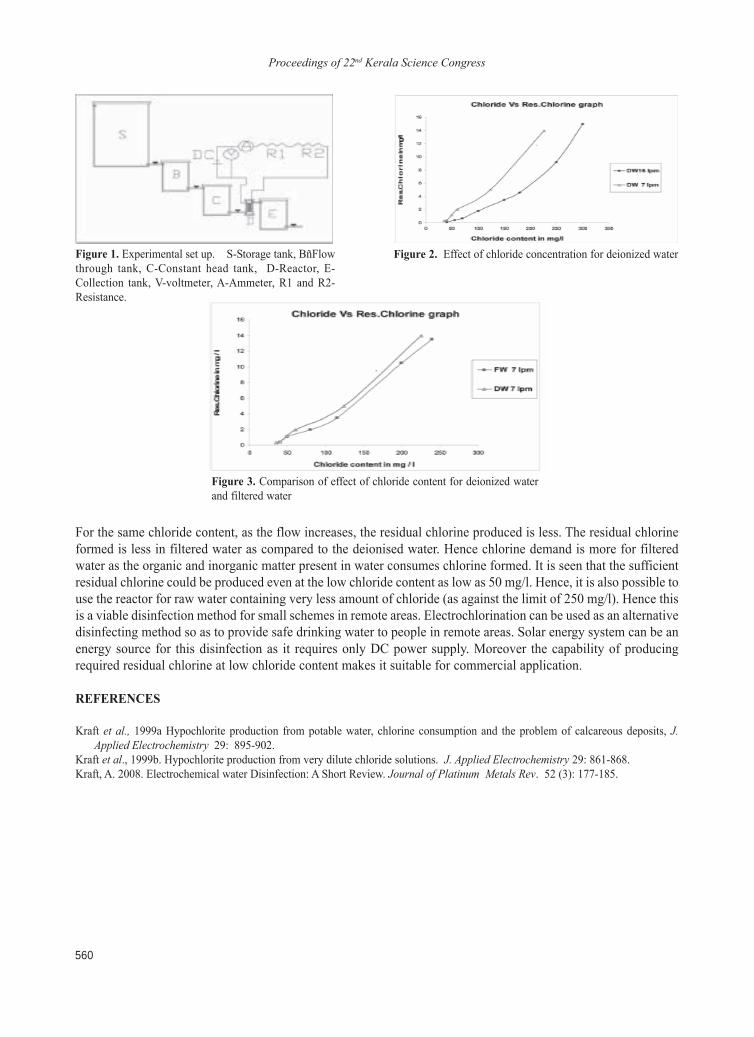
Proceedings of 22nd Kerala Science Congress
560
For the same chloride content, as the flow increases, the residual chlorine produced is less. The residual chlorineformed is less in filtered water as compared to the deionised water. Hence chlorine demand is more for filteredwater as the organic and inorganic matter present in water consumes chlorine formed. It is seen that the sufficientresidual chlorine could be produced even at the low chloride content as low as 50 mg/l. Hence, it is also possible touse the reactor for raw water containing very less amount of chloride (as against the limit of 250 mg/l). Hence thisis a viable disinfection method for small schemes in remote areas. Electrochlorination can be used as an alternativedisinfecting method so as to provide safe drinking water to people in remote areas. Solar energy system can be anenergy source for this disinfection as it requires only DC power supply. Moreover the capability of producingrequired residual chlorine at low chloride content makes it suitable for commercial application.
REFERENCES
Kraft et al., 1999a Hypochlorite production from potable water, chlorine consumption and the problem of calcareous deposits, J.Applied Electrochemistry 29: 895-902.
Kraft et al., 1999b. Hypochlorite production from very dilute chloride solutions. J. Applied Electrochemistry 29: 861-868.Kraft, A. 2008. Electrochemical water Disinfection: A Short Review. Journal of Platinum Metals Rev. 52 (3): 177-185.
Figure 3. Comparison of effect of chloride content for deionized waterand filtered water
Figure 1. Experimental set up. S-Storage tank, BñFlowthrough tank, C-Constant head tank, D-Reactor, E-Collection tank, V-voltmeter, A-Ammeter, R1 and R2-Resistance.
Figure 2. Effect of chloride concentration for deionized water
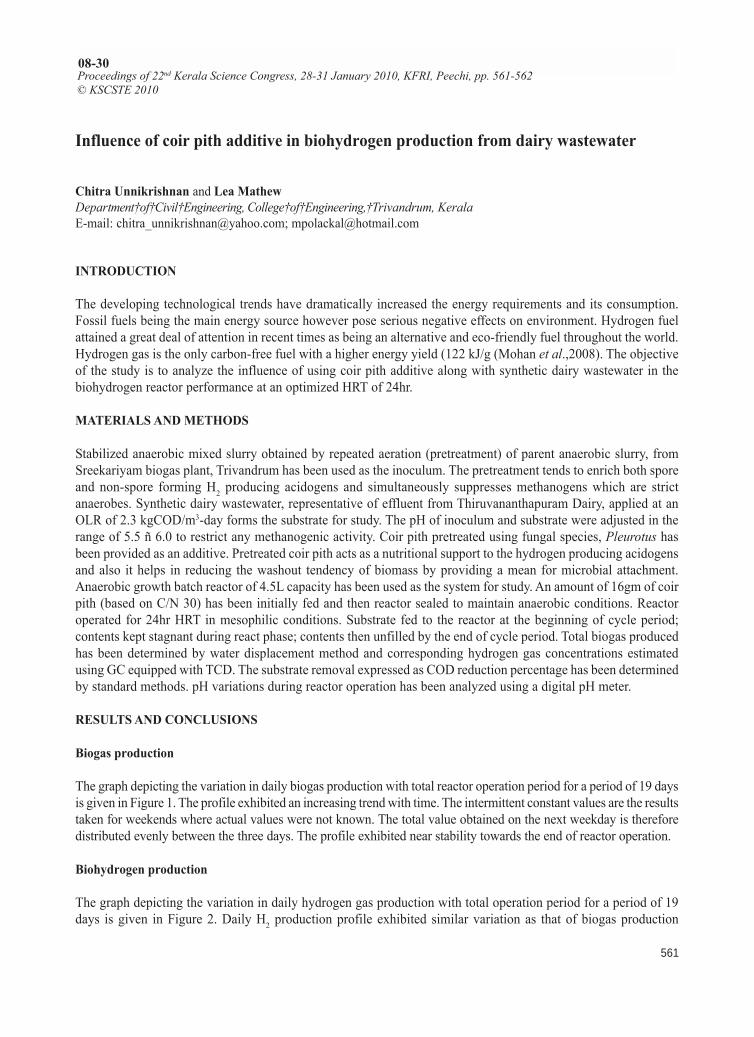
Proceedings of 22nd Kerala Science Congress
561
Influence of coir pith additive in biohydrogen production from dairy wastewater
Chitra Unnikrishnan and Lea MathewDepartment�of�Civil�Engineering, College�of�Engineering,�Trivandrum, KeralaE-mail: [email protected]; [email protected]
INTRODUCTION
The developing technological trends have dramatically increased the energy requirements and its consumption.Fossil fuels being the main energy source however pose serious negative effects on environment. Hydrogen fuelattained a great deal of attention in recent times as being an alternative and eco-friendly fuel throughout the world.Hydrogen gas is the only carbon-free fuel with a higher energy yield (122 kJ/g (Mohan et al.,2008). The objectiveof the study is to analyze the influence of using coir pith additive along with synthetic dairy wastewater in thebiohydrogen reactor performance at an optimized HRT of 24hr.
MATERIALS AND METHODS
Stabilized anaerobic mixed slurry obtained by repeated aeration (pretreatment) of parent anaerobic slurry, fromSreekariyam biogas plant, Trivandrum has been used as the inoculum. The pretreatment tends to enrich both sporeand non-spore forming H2 producing acidogens and simultaneously suppresses methanogens which are strictanaerobes. Synthetic dairy wastewater, representative of effluent from Thiruvananthapuram Dairy, applied at anOLR of 2.3 kgCOD/m3-day forms the substrate for study. The pH of inoculum and substrate were adjusted in therange of 5.5 ñ 6.0 to restrict any methanogenic activity. Coir pith pretreated using fungal species, Pleurotus hasbeen provided as an additive. Pretreated coir pith acts as a nutritional support to the hydrogen producing acidogensand also it helps in reducing the washout tendency of biomass by providing a mean for microbial attachment.Anaerobic growth batch reactor of 4.5L capacity has been used as the system for study. An amount of 16gm of coirpith (based on C/N 30) has been initially fed and then reactor sealed to maintain anaerobic conditions. Reactoroperated for 24hr HRT in mesophilic conditions. Substrate fed to the reactor at the beginning of cycle period;contents kept stagnant during react phase; contents then unfilled by the end of cycle period. Total biogas producedhas been determined by water displacement method and corresponding hydrogen gas concentrations estimatedusing GC equipped with TCD. The substrate removal expressed as COD reduction percentage has been determinedby standard methods. pH variations during reactor operation has been analyzed using a digital pH meter.
RESULTS AND CONCLUSIONS
Biogas production
The graph depicting the variation in daily biogas production with total reactor operation period for a period of 19 daysis given in Figure 1. The profile exhibited an increasing trend with time. The intermittent constant values are the resultstaken for weekends where actual values were not known. The total value obtained on the next weekday is thereforedistributed evenly between the three days. The profile exhibited near stability towards the end of reactor operation.
Biohydrogen production
The graph depicting the variation in daily hydrogen gas production with total operation period for a period of 19days is given in Figure 2. Daily H2 production profile exhibited similar variation as that of biogas production
Proceedings of 22nd Kerala Science Congress, 28-31 January 2010, KFRI, Peechi, pp. 561-562© KSCSTE 2010
08-30
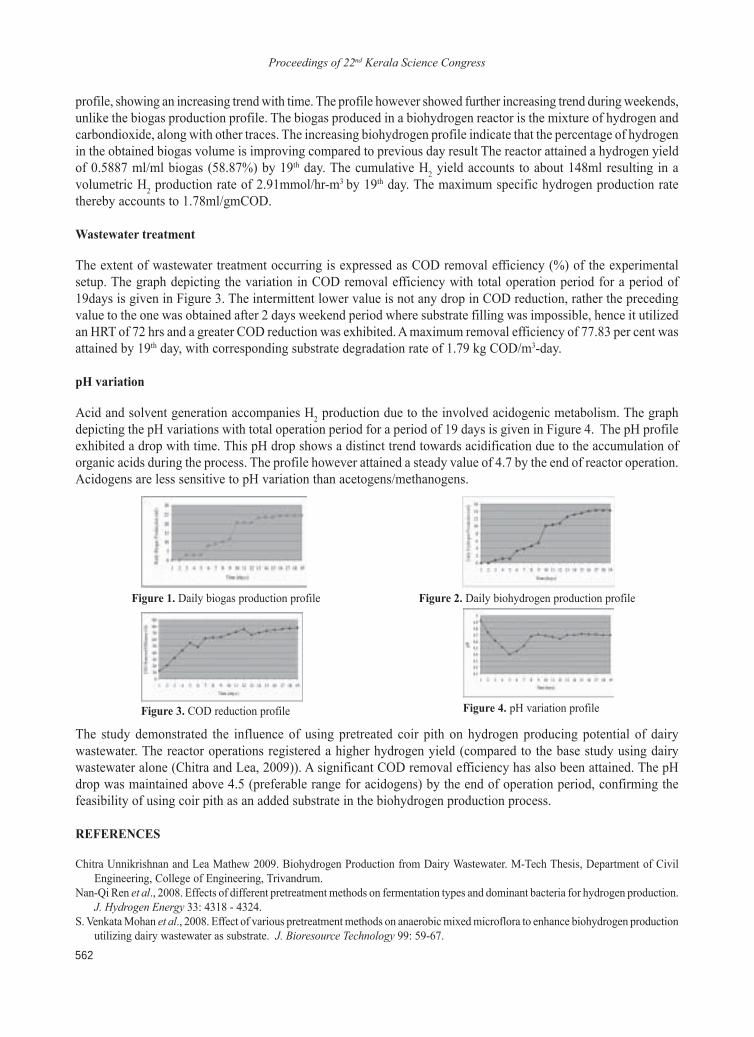
Proceedings of 22nd Kerala Science Congress
562
profile, showing an increasing trend with time. The profile however showed further increasing trend during weekends,unlike the biogas production profile. The biogas produced in a biohydrogen reactor is the mixture of hydrogen andcarbondioxide, along with other traces. The increasing biohydrogen profile indicate that the percentage of hydrogenin the obtained biogas volume is improving compared to previous day result The reactor attained a hydrogen yieldof 0.5887 ml/ml biogas (58.87%) by 19th day. The cumulative H2 yield accounts to about 148ml resulting in avolumetric H2 production rate of 2.91mmol/hr-m
3 by 19th day. The maximum specific hydrogen production ratethereby accounts to 1.78ml/gmCOD.
Wastewater treatment
The extent of wastewater treatment occurring is expressed as COD removal efficiency (%) of the experimentalsetup. The graph depicting the variation in COD removal efficiency with total operation period for a period of19days is given in Figure 3. The intermittent lower value is not any drop in COD reduction, rather the precedingvalue to the one was obtained after 2 days weekend period where substrate filling was impossible, hence it utilizedan HRT of 72 hrs and a greater COD reduction was exhibited. A maximum removal efficiency of 77.83 per cent wasattained by 19th day, with corresponding substrate degradation rate of 1.79 kg COD/m3-day.
pH variation
Acid and solvent generation accompanies H2 production due to the involved acidogenic metabolism. The graphdepicting the pH variations with total operation period for a period of 19 days is given in Figure 4. The pH profileexhibited a drop with time. This pH drop shows a distinct trend towards acidification due to the accumulation oforganic acids during the process. The profile however attained a steady value of 4.7 by the end of reactor operation.Acidogens are less sensitive to pH variation than acetogens/methanogens.
Figure 4. pH variation profile
The study demonstrated the influence of using pretreated coir pith on hydrogen producing potential of dairywastewater. The reactor operations registered a higher hydrogen yield (compared to the base study using dairywastewater alone (Chitra and Lea, 2009)). A significant COD removal efficiency has also been attained. The pHdrop was maintained above 4.5 (preferable range for acidogens) by the end of operation period, confirming thefeasibility of using coir pith as an added substrate in the biohydrogen production process.
REFERENCES
Chitra Unnikrishnan and Lea Mathew 2009. Biohydrogen Production from Dairy Wastewater. M-Tech Thesis, Department of CivilEngineering, College of Engineering, Trivandrum.
Nan-Qi Ren et al., 2008. Effects of different pretreatment methods on fermentation types and dominant bacteria for hydrogen production.J. Hydrogen Energy 33: 4318 - 4324.
S. Venkata Mohan et al., 2008. Effect of various pretreatment methods on anaerobic mixed microflora to enhance biohydrogen productionutilizing dairy wastewater as substrate. J. Bioresource Technology 99: 59-67.
Figure 1. Daily biogas production profile Figure 2. Daily biohydrogen production profile
Figure 3. COD reduction profile
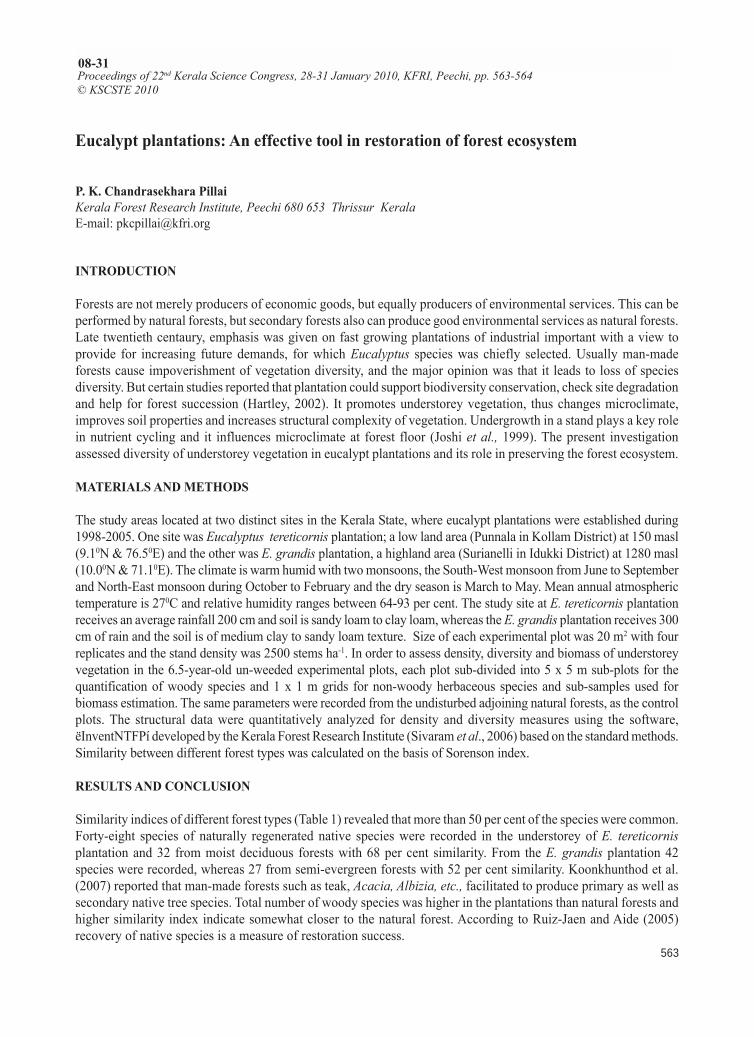
Proceedings of 22nd Kerala Science Congress
563
Eucalypt plantations: An effective tool in restoration of forest ecosystem
P. K. Chandrasekhara PillaiKerala Forest Research Institute, Peechi 680 653 Thrissur KeralaE-mail: [email protected]
INTRODUCTION
Forests are not merely producers of economic goods, but equally producers of environmental services. This can beperformed by natural forests, but secondary forests also can produce good environmental services as natural forests.Late twentieth centaury, emphasis was given on fast growing plantations of industrial important with a view toprovide for increasing future demands, for which Eucalyptus species was chiefly selected. Usually man-madeforests cause impoverishment of vegetation diversity, and the major opinion was that it leads to loss of speciesdiversity. But certain studies reported that plantation could support biodiversity conservation, check site degradationand help for forest succession (Hartley, 2002). It promotes understorey vegetation, thus changes microclimate,improves soil properties and increases structural complexity of vegetation. Undergrowth in a stand plays a key rolein nutrient cycling and it influences microclimate at forest floor (Joshi et al., 1999). The present investigationassessed diversity of understorey vegetation in eucalypt plantations and its role in preserving the forest ecosystem.
MATERIALS AND METHODS
The study areas located at two distinct sites in the Kerala State, where eucalypt plantations were established during1998-2005. One site was Eucalyptus tereticornis plantation; a low land area (Punnala in Kollam District) at 150 masl(9.10N & 76.50E) and the other was E. grandis plantation, a highland area (Surianelli in Idukki District) at 1280 masl(10.00N & 71.10E). The climate is warm humid with two monsoons, the South-West monsoon from June to Septemberand North-East monsoon during October to February and the dry season is March to May. Mean annual atmospherictemperature is 270C and relative humidity ranges between 64-93 per cent. The study site at E. tereticornis plantationreceives an average rainfall 200 cm and soil is sandy loam to clay loam, whereas the E. grandis plantation receives 300cm of rain and the soil is of medium clay to sandy loam texture. Size of each experimental plot was 20 m2 with fourreplicates and the stand density was 2500 stems ha-1. In order to assess density, diversity and biomass of understoreyvegetation in the 6.5-year-old un-weeded experimental plots, each plot sub-divided into 5 x 5 m sub-plots for thequantification of woody species and 1 x 1 m grids for non-woody herbaceous species and sub-samples used forbiomass estimation. The same parameters were recorded from the undisturbed adjoining natural forests, as the controlplots. The structural data were quantitatively analyzed for density and diversity measures using the software,ëInventNTFPí developed by the Kerala Forest Research Institute (Sivaram et al., 2006) based on the standard methods.Similarity between different forest types was calculated on the basis of Sorenson index.
RESULTS AND CONCLUSION
Similarity indices of different forest types (Table 1) revealed that more than 50 per cent of the species were common.Forty-eight species of naturally regenerated native species were recorded in the understorey of E. tereticornisplantation and 32 from moist deciduous forests with 68 per cent similarity. From the E. grandis plantation 42species were recorded, whereas 27 from semi-evergreen forests with 52 per cent similarity. Koonkhunthod et al.(2007) reported that man-made forests such as teak, Acacia, Albizia, etc., facilitated to produce primary as well assecondary native tree species. Total number of woody species was higher in the plantations than natural forests andhigher similarity index indicate somewhat closer to the natural forest. According to Ruiz-Jaen and Aide (2005)recovery of native species is a measure of restoration success.
Proceedings of 22nd Kerala Science Congress, 28-31 January 2010, KFRI, Peechi, pp. 563-564© KSCSTE 2010
08-31
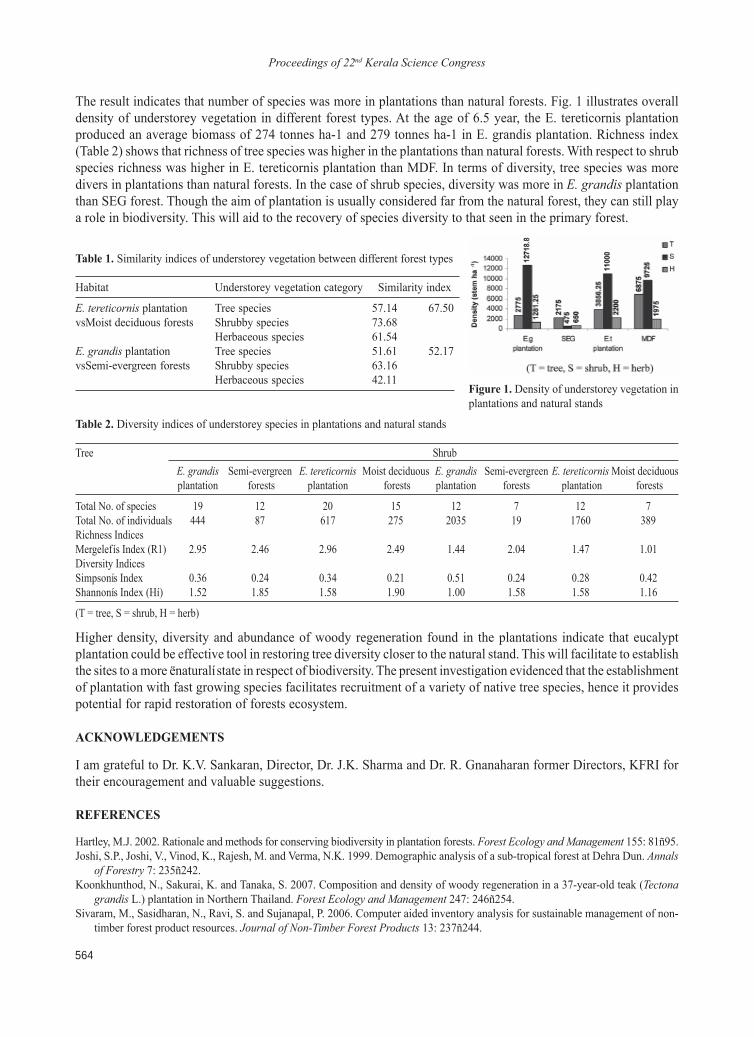
Proceedings of 22nd Kerala Science Congress
564
The result indicates that number of species was more in plantations than natural forests. Fig. 1 illustrates overalldensity of understorey vegetation in different forest types. At the age of 6.5 year, the E. tereticornis plantationproduced an average biomass of 274 tonnes ha-1 and 279 tonnes ha-1 in E. grandis plantation. Richness index(Table 2) shows that richness of tree species was higher in the plantations than natural forests. With respect to shrubspecies richness was higher in E. tereticornis plantation than MDF. In terms of diversity, tree species was moredivers in plantations than natural forests. In the case of shrub species, diversity was more in E. grandis plantationthan SEG forest. Though the aim of plantation is usually considered far from the natural forest, they can still playa role in biodiversity. This will aid to the recovery of species diversity to that seen in the primary forest.
Table 2. Diversity indices of understorey species in plantations and natural stands
Tree ShrubE. grandis Semi-evergreen E. tereticornis Moist deciduous E. grandis Semi-evergreen E. tereticornisMoist deciduousplantation forests plantation forests plantation forests plantation forests
Total No. of species 19 12 20 15 12 7 12 7Total No. of individuals 444 87 617 275 2035 19 1760 389Richness IndicesMergelefís Index (R1) 2.95 2.46 2.96 2.49 1.44 2.04 1.47 1.01Diversity IndicesSimpsonís Index 0.36 0.24 0.34 0.21 0.51 0.24 0.28 0.42Shannonís Index (Hí) 1.52 1.85 1.58 1.90 1.00 1.58 1.58 1.16
(T = tree, S = shrub, H = herb)
Higher density, diversity and abundance of woody regeneration found in the plantations indicate that eucalyptplantation could be effective tool in restoring tree diversity closer to the natural stand. This will facilitate to establishthe sites to a more ënaturalí state in respect of biodiversity. The present investigation evidenced that the establishmentof plantation with fast growing species facilitates recruitment of a variety of native tree species, hence it providespotential for rapid restoration of forests ecosystem.
ACKNOWLEDGEMENTS
I am grateful to Dr. K.V. Sankaran, Director, Dr. J.K. Sharma and Dr. R. Gnanaharan former Directors, KFRI fortheir encouragement and valuable suggestions.
REFERENCES
Hartley, M.J. 2002. Rationale and methods for conserving biodiversity in plantation forests. Forest Ecology and Management 155: 81ñ95.Joshi, S.P., Joshi, V., Vinod, K., Rajesh, M. and Verma, N.K. 1999. Demographic analysis of a sub-tropical forest at Dehra Dun. Annals
of Forestry 7: 235ñ242.Koonkhunthod, N., Sakurai, K. and Tanaka, S. 2007. Composition and density of woody regeneration in a 37-year-old teak (Tectona
grandis L.) plantation in Northern Thailand. Forest Ecology and Management 247: 246ñ254.Sivaram, M., Sasidharan, N., Ravi, S. and Sujanapal, P. 2006. Computer aided inventory analysis for sustainable management of non-
timber forest product resources. Journal of Non-Timber Forest Products 13: 237ñ244.
Figure 1. Density of understorey vegetation inplantations and natural stands
Table 1. Similarity indices of understorey vegetation between different forest types
Habitat Understorey vegetation category Similarity index
E. tereticornis plantation Tree species 57.14 67.50vsMoist deciduous forests Shrubby species 73.68
Herbaceous species 61.54E. grandis plantation Tree species 51.61 52.17vsSemi-evergreen forests Shrubby species 63.16
Herbaceous species 42.11
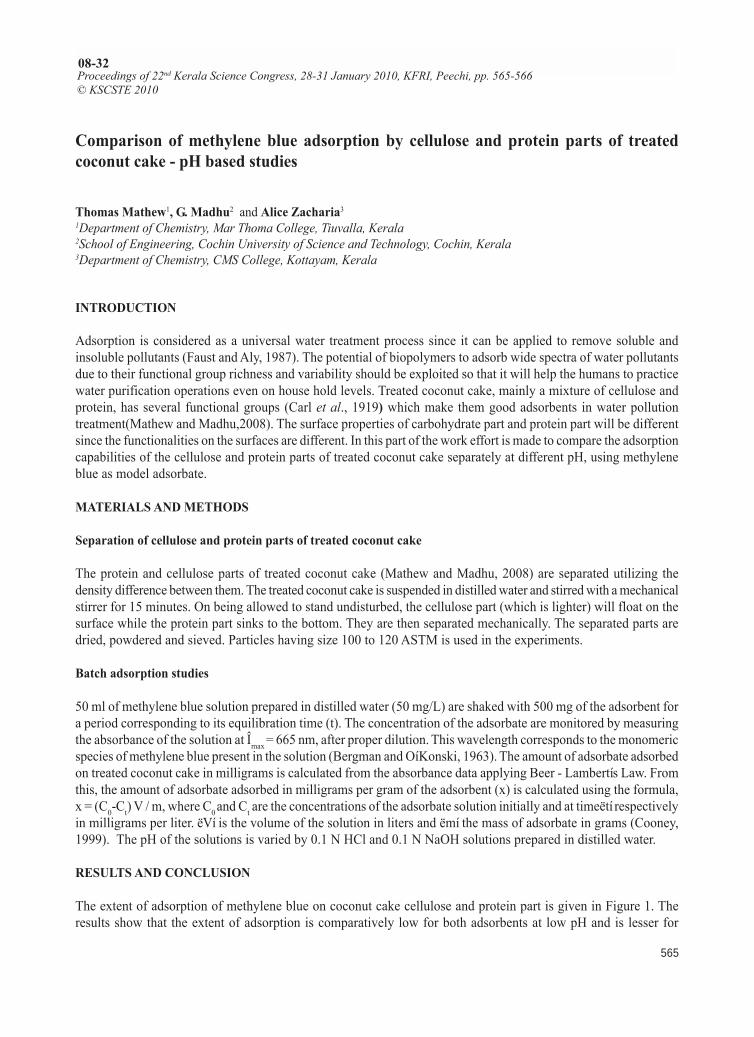
Proceedings of 22nd Kerala Science Congress
565
Comparison of methylene blue adsorption by cellulose and protein parts of treatedcoconut cake - pH based studies
Thomas Mathew1, G. Madhu2 and Alice Zacharia31Department of Chemistry, Mar Thoma College, Tiuvalla, Kerala2School of Engineering, Cochin University of Science and Technology, Cochin, Kerala3Department of Chemistry, CMS College, Kottayam, Kerala
INTRODUCTION
Adsorption is considered as a universal water treatment process since it can be applied to remove soluble andinsoluble pollutants (Faust and Aly, 1987). The potential of biopolymers to adsorb wide spectra of water pollutantsdue to their functional group richness and variability should be exploited so that it will help the humans to practicewater purification operations even on house hold levels. Treated coconut cake, mainly a mixture of cellulose andprotein, has several functional groups (Carl et al., 1919) which make them good adsorbents in water pollutiontreatment(Mathew and Madhu,2008). The surface properties of carbohydrate part and protein part will be differentsince the functionalities on the surfaces are different. In this part of the work effort is made to compare the adsorptioncapabilities of the cellulose and protein parts of treated coconut cake separately at different pH, using methyleneblue as model adsorbate.
MATERIALS AND METHODS
Separation of cellulose and protein parts of treated coconut cake
The protein and cellulose parts of treated coconut cake (Mathew and Madhu, 2008) are separated utilizing thedensity difference between them. The treated coconut cake is suspended in distilled water and stirred with a mechanicalstirrer for 15 minutes. On being allowed to stand undisturbed, the cellulose part (which is lighter) will float on thesurface while the protein part sinks to the bottom. They are then separated mechanically. The separated parts aredried, powdered and sieved. Particles having size 100 to 120 ASTM is used in the experiments.
Batch adsorption studies
50 ml of methylene blue solution prepared in distilled water (50 mg/L) are shaked with 500 mg of the adsorbent fora period corresponding to its equilibration time (t). The concentration of the adsorbate are monitored by measuringthe absorbance of the solution at Îmax = 665 nm, after proper dilution. This wavelength corresponds to the monomericspecies of methylene blue present in the solution (Bergman and OíKonski, 1963). The amount of adsorbate adsorbedon treated coconut cake in milligrams is calculated from the absorbance data applying Beer - Lambertís Law. Fromthis, the amount of adsorbate adsorbed in milligrams per gram of the adsorbent (x) is calculated using the formula,x = (C0-Ct) V / m, where C0 and Ct are the concentrations of the adsorbate solution initially and at timeëtí respectivelyin milligrams per liter. ëVí is the volume of the solution in liters and ëmí the mass of adsorbate in grams (Cooney,1999). The pH of the solutions is varied by 0.1 N HCl and 0.1 N NaOH solutions prepared in distilled water.
RESULTS AND CONCLUSION
The extent of adsorption of methylene blue on coconut cake cellulose and protein part is given in Figure 1. Theresults show that the extent of adsorption is comparatively low for both adsorbents at low pH and is lesser for
Proceedings of 22nd Kerala Science Congress, 28-31 January 2010, KFRI, Peechi, pp. 565-566© KSCSTE 2010
08-32
Proceedings of 22nd Kerala Science Congress
566
protein. The extent of adsorption gradually increases as pH is increased up to 11.14 and then decreases. At higherpH the adsorption capacity is larger for the protein part.
Figure 1. Comparison of methylene blue adsorption on cellulose and protein parts at different pH
Both cellulose and protein surfaces will acquire positive character at low pH due to the high density of electronegativeatoms which forms bond with the positive hydrogen ions of the medium. Thus the chances for the methylene bluecations to get attached to the surface is less in these conditions due to repulsive forces, resulting in less adsorption.The observation that the extent of adsorption by proteins at low pH is less than that of cellulose can be explained onthe basis of the functional group differences between the cellulose and protein surfaces. The surface of the celluloseis rich with highly electronegative oxygen atoms while the surface of the protein has less electronegative nitrogenand sulphur atoms. As the electronegativity is increased the ability of the atoms to provide their lone pairs ofelectrons to positive species is decreased (March, 1992). Hence at low pH, the H+ ions in the medium will beattached to the surface of protein in excess than that to the cellulose surface, giving the protein surface morepositive character. Accordingly, the amount of methylene blue cations attached to the surface of protein part is lessat low pH. As the pH is increased the concentration of H + ions decreases and its role become less important asobserved from the almost equivalent adsorption near neutral pH. As the pH is increased the extent of adsorption islarger for the protein part, may be due to the involvement of the indole and imidazole rings of the amino acidswhich may provide their pi electronic cloud (Morrison and Boyd, 1997) so as to render a better interaction with themethylene blue cations.
The present study shows that the extent of adsorption of methylene blue on cellulose and protein parts of coconutcake depend on the hydrogen ion concentration of the medium. The difference in the degree of adsorption can beexplained in terms of the surface properties of the adsorbents. The functional group richness of treated coconutcake can be used in water pollution treatment.
REFERENCES
Bergmann, K. and OíKonski, C.T. 1963. A spectroscopic study of methylene blue monomer, dimer and complexes with montmorillonite.Journal of Physical Chemistry 67: 2169-2177.
Carl, O.J., Finks, A.J. and Mael, S. 1919. Studies in Nutrition, the Nutritive Value of Globulin and Coconut press Cake. The Journal ofBiological Chemistry 37:497-502.
Cooney, D.O. and Wijaya, J. 1987. Effect of pH and added salts on the adsorption of ionizable organic species onto activated carbonfrom aqueous solution, Fundamentals of Adsorption. 185-194.
Faust, S.D. and Aly, O.M. 1987. Adsorption Process for Water Treatment. Butterworths Publishers, Stoneham.March, J. 1992. Advanced Organic Chemistry, Reaction, Mechanism and Structure, 4th Edn., Wiley Interscience Publication.Mathew, T. and Madhu, G. 2008. Surface modifications of coconut cake with respect to pH changes- studies bases on the adsorption of
dyes, Proceedings of the third CUSAT National Conference on Recent Advances in Civil Engineering, Kochi, 281-286.Morrison, R.T. and Boyd, R.N. 1997. Organic Chemistry, 6th Edn., Prentice Hall of India Limited, New Delhi.
Proceedings of 22nd Kerala Science Congress
567
Integrated Rural Accessibility Plan (IRAP) : A case study of Attappady Block Panchayathin Palakkad District
C. Muraleedharan Pillai1 and N. Vijayakumar21NATPAC, Trivandrum, Kerala2NATPAC, Kozhikkode, Kerala
INTRODUCTION
Conventional planning efforts in the area of rural road development aims at the provision of connectivity to settlementsnot connected with an all weather road. Limited number of beneficiaries and the huge cost involved in developmentand maintenance of road facilities due to geographic constraints also act as stumbling blocks in the matter of providingconnectivity to these areas. Along with the accessibility improvements initiatives steps have to be taken to enhancemobility. As a part of RandD programme, a study on IRAP a case study of Attappady blocks panchyath in Palakkaddistrict was undertaken. The study was carried out for selected tribal settlements located along accessibility restrictedhilly region based on an evaluation of accessibility/ mobility related problems to arrive at comprehensive cost ñeffective solution for the poor quality of life by means of accessibility improvement measures which will generateadditional employment opportunities in sustainable manner. The scope of the study was to objectively evaluate themobility needs of tribal communities, who are socially and economically backward and are residing in accessibilityrestricted hilly and mountainous terrains vis a vis their accessibility status and mobility needs. The main objectives ofthe study were: To study the household and demographic characteristics of tribal communities in typically hilly areas;to study the socio economic characteristics that have a bearing on transport needs of these people; to assess the travelrequirements and pattern of goods transportation; to study the existing transport facilities especially the road transportand to suggest cost effective solutions aimed at improving mobility of people.
METHODOLOGY
The data required for the study was collected from primary and secondary sources. Most of the secondary data wereavailable in various offices of rural local bodies, DRDA and Tribal Development Department. The Attappady HillArea Development Society (AHADS) an autonomous society working towards the comprehensive development ofthe region with international funding was a valuable source of information required for undertaking the study. Fieldstudies like household surveys were also carried out to collect information on the socio ñ economic characteristicsand travel demand and pattern of goods transportation. Tribal settlements with accessibility restriction / seasonedaccessibility where identified and census method was adopted for all the hamlets during household survey. Detailedobservation were also initiated to evaluate the existing accessibility means for each settlement to various facilitieslike shops, school and other identifiable trip destinations.
Case Study
Study area consisted of 183 oors (Tribal Settlements) spread over Agali, Pudur and Sholayur Grama Panchayath inAttappady Block. Irula, Muduga and Kurumba are the main tribal communities living in the Block. Figure 1 showsthe study area. A detailed reconnaissance survey was carried out in all the three panchayaths of Attappady block inorder to find the inaccessible oors (settlements) out of the 183 tribal settlements 19 settlements do not have allweather road connectivity. The existing jeep road/ cart track cannot be used during monsoon seasons.
Link volume on major roads: Volume count survey on major road links were carried out on normal working day toknow the traffic volume to/from the major location in the Attappady block.
Proceedings of 22nd Kerala Science Congress, 28-31 January 2010, KFRI, Peechi, pp. 567-568© KSCSTE 2010
08-33
Proceedings of 22nd Kerala Science Congress
568
Household survey: To evaluate the mobility, accessibility and travel requirements of the tribal community, censustype household survey was carried out in all 19 Oors.
Analysis of data and findings
The study team visited all the oors in the panchayaths identified with accessibility restriction through out the year.The hamlets are not provided with an all weather road. Most of the roads connecting Oors were muddy and rockyand found to be difficult to travel / transport men and materials through out the year. The distance to the nearest busroute road varies from 2 km to 15 km in the Oors in the Pudur panchayath. It is between 1 km to 7 km in the case ofAgali panchayath. Almost all roads connecting these oors were found to be either foot track or cart track thatcannot be used during rainy season.
RESULTS
General accessibility and improvement measures
Measures aimed at accessibility improvement in the case of settlements to be provided for footpaths, forest trails orcart track and for facilitating stream/river crossing are the following.
• Bamboo reinforced concrete Mobility Improvement Measures• Causeway 1. Wheel Barrows• Construction of passing points 2. Animal Power• Engineered earth road 3. Animal drawn Carts• Suspension bridge 4. Improved Carts• Hand packed stone surface• Stepping stones• Ropeway
CONCLUSION
The study was carried out for selected tribal settlements located along accessibility restricted hilly region based onthe IRAP methodology developed by International development agencies. Aim of the study was the evaluation ofaccessibility / mobility related problems so as to arrive at comprehensive cost ñ effective solution for the poorquality of life by means of accessibility improvement measures which will generate additional employmentopportunities is a sustainable manner. The purpose of the study was to evaluate the prevailing accessibility standardsvisña-vis the mobility needs of tribal communities that are residing in accessibility restricted settlements in AttappadyBlock Panchayath in Palakkd district. Out of 183 tribal settlements, 19 settlements are facing accessibility restrictions.The study on settlements, households, demographic and socio ñ economic characteristics including travel needsand of existing transport facilities have given an insight on the various aspects of the study area.
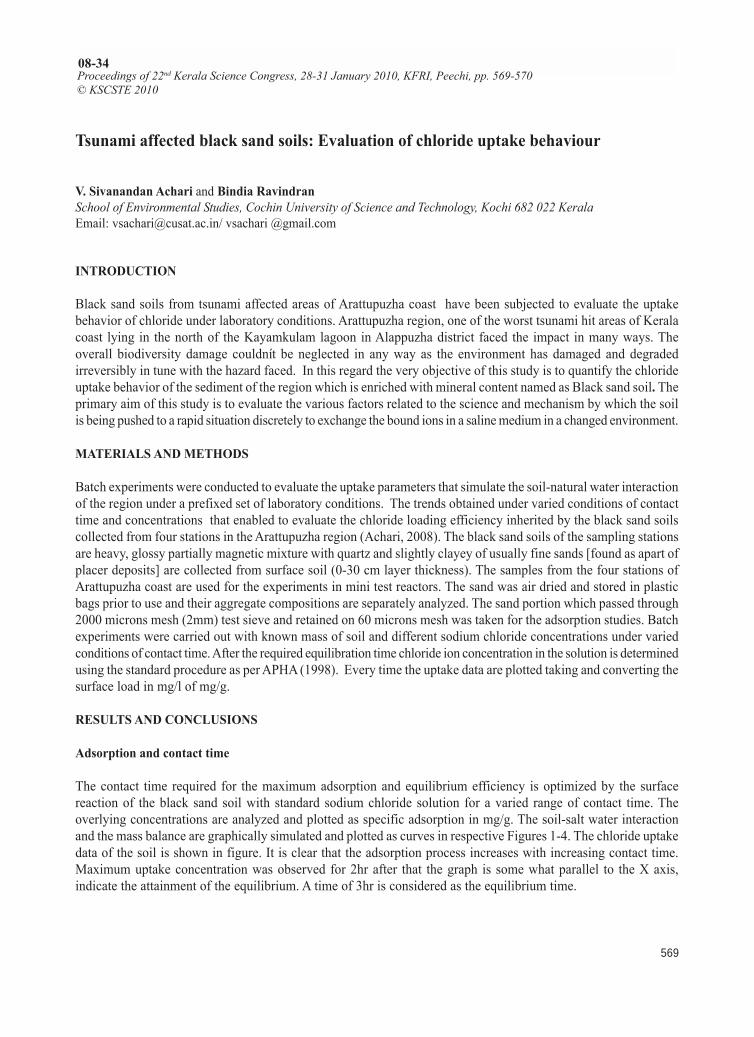
Proceedings of 22nd Kerala Science Congress
569
Tsunami affected black sand soils: Evaluation of chloride uptake behaviour
V. Sivanandan Achari and Bindia RavindranSchool of Environmental Studies, Cochin University of Science and Technology, Kochi 682 022 KeralaEmail: [email protected]/ vsachari @gmail.com
INTRODUCTION
Black sand soils from tsunami affected areas of Arattupuzha coast have been subjected to evaluate the uptakebehavior of chloride under laboratory conditions. Arattupuzha region, one of the worst tsunami hit areas of Keralacoast lying in the north of the Kayamkulam lagoon in Alappuzha district faced the impact in many ways. Theoverall biodiversity damage couldnít be neglected in any way as the environment has damaged and degradedirreversibly in tune with the hazard faced. In this regard the very objective of this study is to quantify the chlorideuptake behavior of the sediment of the region which is enriched with mineral content named as Black sand soil. Theprimary aim of this study is to evaluate the various factors related to the science and mechanism by which the soilis being pushed to a rapid situation discretely to exchange the bound ions in a saline medium in a changed environment.
MATERIALS AND METHODS
Batch experiments were conducted to evaluate the uptake parameters that simulate the soil-natural water interactionof the region under a prefixed set of laboratory conditions. The trends obtained under varied conditions of contacttime and concentrations that enabled to evaluate the chloride loading efficiency inherited by the black sand soilscollected from four stations in the Arattupuzha region (Achari, 2008). The black sand soils of the sampling stationsare heavy, glossy partially magnetic mixture with quartz and slightly clayey of usually fine sands [found as apart ofplacer deposits] are collected from surface soil (0-30 cm layer thickness). The samples from the four stations ofArattupuzha coast are used for the experiments in mini test reactors. The sand was air dried and stored in plasticbags prior to use and their aggregate compositions are separately analyzed. The sand portion which passed through2000 microns mesh (2mm) test sieve and retained on 60 microns mesh was taken for the adsorption studies. Batchexperiments were carried out with known mass of soil and different sodium chloride concentrations under variedconditions of contact time. After the required equilibration time chloride ion concentration in the solution is determinedusing the standard procedure as per APHA (1998). Every time the uptake data are plotted taking and converting thesurface load in mg/l of mg/g.
RESULTS AND CONCLUSIONS
Adsorption and contact time
The contact time required for the maximum adsorption and equilibrium efficiency is optimized by the surfacereaction of the black sand soil with standard sodium chloride solution for a varied range of contact time. Theoverlying concentrations are analyzed and plotted as specific adsorption in mg/g. The soil-salt water interactionand the mass balance are graphically simulated and plotted as curves in respective Figures 1-4. The chloride uptakedata of the soil is shown in figure. It is clear that the adsorption process increases with increasing contact time.Maximum uptake concentration was observed for 2hr after that the graph is some what parallel to the X axis,indicate the attainment of the equilibrium. A time of 3hr is considered as the equilibrium time.
Proceedings of 22nd Kerala Science Congress, 28-31 January 2010, KFRI, Peechi, pp. 569-570© KSCSTE 2010
08-34
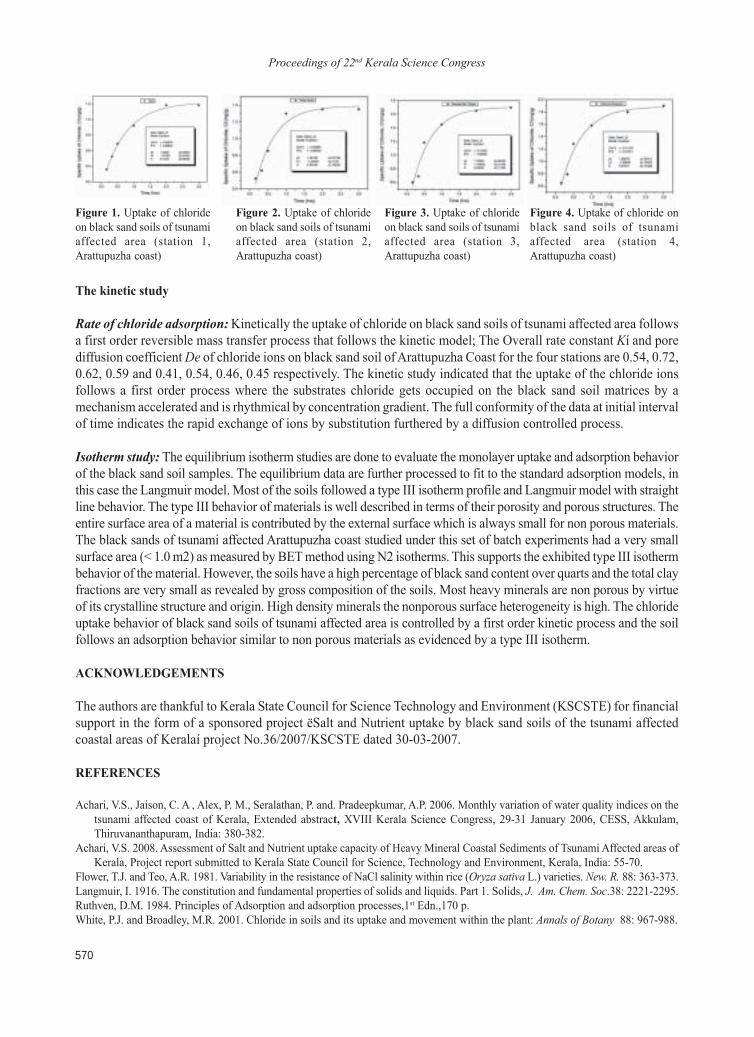
Proceedings of 22nd Kerala Science Congress
570
The kinetic study
Rate of chloride adsorption: Kinetically the uptake of chloride on black sand soils of tsunami affected area followsa first order reversible mass transfer process that follows the kinetic model; The Overall rate constant Kí and porediffusion coefficient De of chloride ions on black sand soil of Arattupuzha Coast for the four stations are 0.54, 0.72,0.62, 0.59 and 0.41, 0.54, 0.46, 0.45 respectively. The kinetic study indicated that the uptake of the chloride ionsfollows a first order process where the substrates chloride gets occupied on the black sand soil matrices by amechanism accelerated and is rhythmical by concentration gradient. The full conformity of the data at initial intervalof time indicates the rapid exchange of ions by substitution furthered by a diffusion controlled process.
Isotherm study: The equilibrium isotherm studies are done to evaluate the monolayer uptake and adsorption behaviorof the black sand soil samples. The equilibrium data are further processed to fit to the standard adsorption models, inthis case the Langmuir model. Most of the soils followed a type III isotherm profile and Langmuir model with straightline behavior. The type III behavior of materials is well described in terms of their porosity and porous structures. Theentire surface area of a material is contributed by the external surface which is always small for non porous materials.The black sands of tsunami affected Arattupuzha coast studied under this set of batch experiments had a very smallsurface area (< 1.0 m2) as measured by BET method using N2 isotherms. This supports the exhibited type III isothermbehavior of the material. However, the soils have a high percentage of black sand content over quarts and the total clayfractions are very small as revealed by gross composition of the soils. Most heavy minerals are non porous by virtueof its crystalline structure and origin. High density minerals the nonporous surface heterogeneity is high. The chlorideuptake behavior of black sand soils of tsunami affected area is controlled by a first order kinetic process and the soilfollows an adsorption behavior similar to non porous materials as evidenced by a type III isotherm.
ACKNOWLEDGEMENTS
The authors are thankful to Kerala State Council for Science Technology and Environment (KSCSTE) for financialsupport in the form of a sponsored project ëSalt and Nutrient uptake by black sand soils of the tsunami affectedcoastal areas of Keralaí project No.36/2007/KSCSTE dated 30-03-2007.
REFERENCES
Achari, V.S., Jaison, C. A , Alex, P. M., Seralathan, P. and. Pradeepkumar, A.P. 2006. Monthly variation of water quality indices on thetsunami affected coast of Kerala, Extended abstract, XVIII Kerala Science Congress, 29-31 January 2006, CESS, Akkulam,Thiruvananthapuram, India: 380-382.
Achari, V.S. 2008. Assessment of Salt and Nutrient uptake capacity of Heavy Mineral Coastal Sediments of Tsunami Affected areas ofKerala, Project report submitted to Kerala State Council for Science, Technology and Environment, Kerala, India: 55-70.
Flower, T.J. and Teo, A.R. 1981. Variability in the resistance of NaCl salinity within rice (Oryza sativa L.) varieties. New. R. 88: 363-373.Langmuir, I. 1916. The constitution and fundamental properties of solids and liquids. Part 1. Solids, J. Am. Chem. Soc.38: 2221-2295.Ruthven, D.M. 1984. Principles of Adsorption and adsorption processes,1st Edn.,170 p.White, P.J. and Broadley, M.R. 2001. Chloride in soils and its uptake and movement within the plant: Annals of Botany 88: 967-988.
Figure 1. Uptake of chlorideon black sand soils of tsunamiaffected area (station 1,Arattupuzha coast)
Figure 2. Uptake of chlorideon black sand soils of tsunamiaffected area (station 2,Arattupuzha coast)
Figure 3. Uptake of chlorideon black sand soils of tsunamiaffected area (station 3,Arattupuzha coast)
Figure 4. Uptake of chloride onblack sand soils of tsunamiaffected area (station 4,Arattupuzha coast)
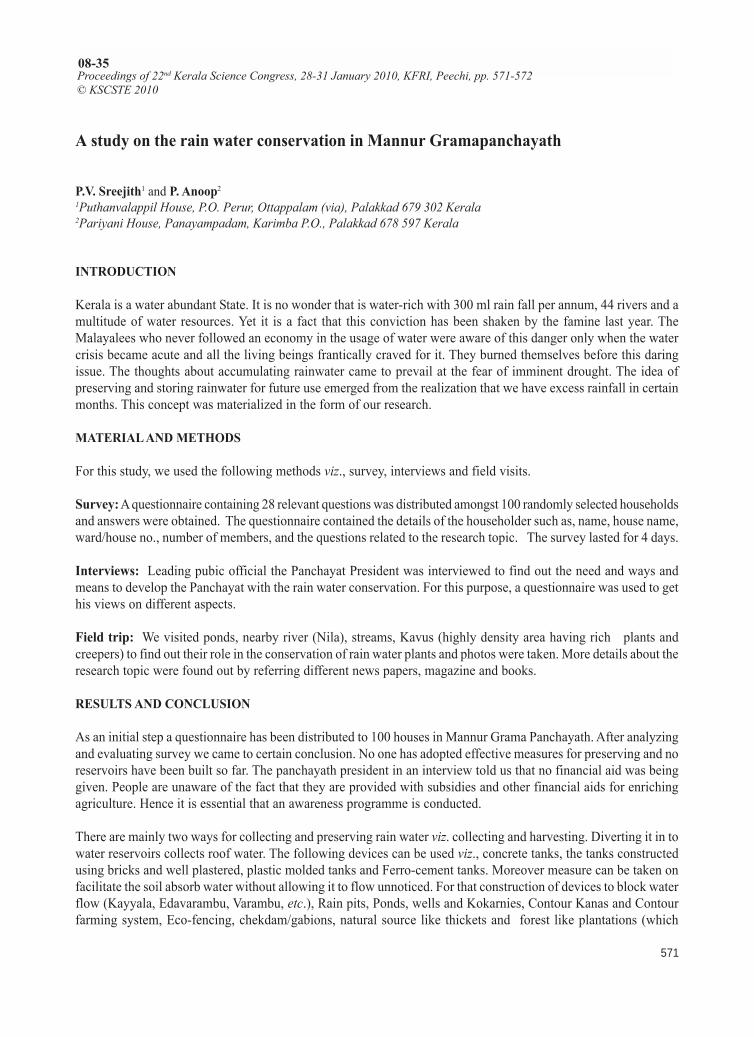
Proceedings of 22nd Kerala Science Congress
571
A study on the rain water conservation in Mannur Gramapanchayath
P.V. Sreejith1 and P. Anoop21Puthanvalappil House, P.O. Perur, Ottappalam (via), Palakkad 679 302 Kerala2Pariyani House, Panayampadam, Karimba P.O., Palakkad 678 597 Kerala
INTRODUCTION
Kerala is a water abundant State. It is no wonder that is water-rich with 300 ml rain fall per annum, 44 rivers and amultitude of water resources. Yet it is a fact that this conviction has been shaken by the famine last year. TheMalayalees who never followed an economy in the usage of water were aware of this danger only when the watercrisis became acute and all the living beings frantically craved for it. They burned themselves before this daringissue. The thoughts about accumulating rainwater came to prevail at the fear of imminent drought. The idea ofpreserving and storing rainwater for future use emerged from the realization that we have excess rainfall in certainmonths. This concept was materialized in the form of our research.
MATERIAL AND METHODS
For this study, we used the following methods viz., survey, interviews and field visits.
Survey: A questionnaire containing 28 relevant questions was distributed amongst 100 randomly selected householdsand answers were obtained. The questionnaire contained the details of the householder such as, name, house name,ward/house no., number of members, and the questions related to the research topic. The survey lasted for 4 days.
Interviews: Leading pubic official the Panchayat President was interviewed to find out the need and ways andmeans to develop the Panchayat with the rain water conservation. For this purpose, a questionnaire was used to gethis views on different aspects.
Field trip: We visited ponds, nearby river (Nila), streams, Kavus (highly density area having rich plants andcreepers) to find out their role in the conservation of rain water plants and photos were taken. More details about theresearch topic were found out by referring different news papers, magazine and books.
RESULTS AND CONCLUSION
As an initial step a questionnaire has been distributed to 100 houses in Mannur Grama Panchayath. After analyzingand evaluating survey we came to certain conclusion. No one has adopted effective measures for preserving and noreservoirs have been built so far. The panchayath president in an interview told us that no financial aid was beinggiven. People are unaware of the fact that they are provided with subsidies and other financial aids for enrichingagriculture. Hence it is essential that an awareness programme is conducted.
There are mainly two ways for collecting and preserving rain water viz. collecting and harvesting. Diverting it in towater reservoirs collects roof water. The following devices can be used viz., concrete tanks, the tanks constructedusing bricks and well plastered, plastic molded tanks and Ferro-cement tanks. Moreover measure can be taken onfacilitate the soil absorb water without allowing it to flow unnoticed. For that construction of devices to block waterflow (Kayyala, Edavarambu, Varambu, etc.), Rain pits, Ponds, wells and Kokarnies, Contour Kanas and Contourfarming system, Eco-fencing, chekdam/gabions, natural source like thickets and forest like plantations (which
Proceedings of 22nd Kerala Science Congress, 28-31 January 2010, KFRI, Peechi, pp. 571-572© KSCSTE 2010
08-35
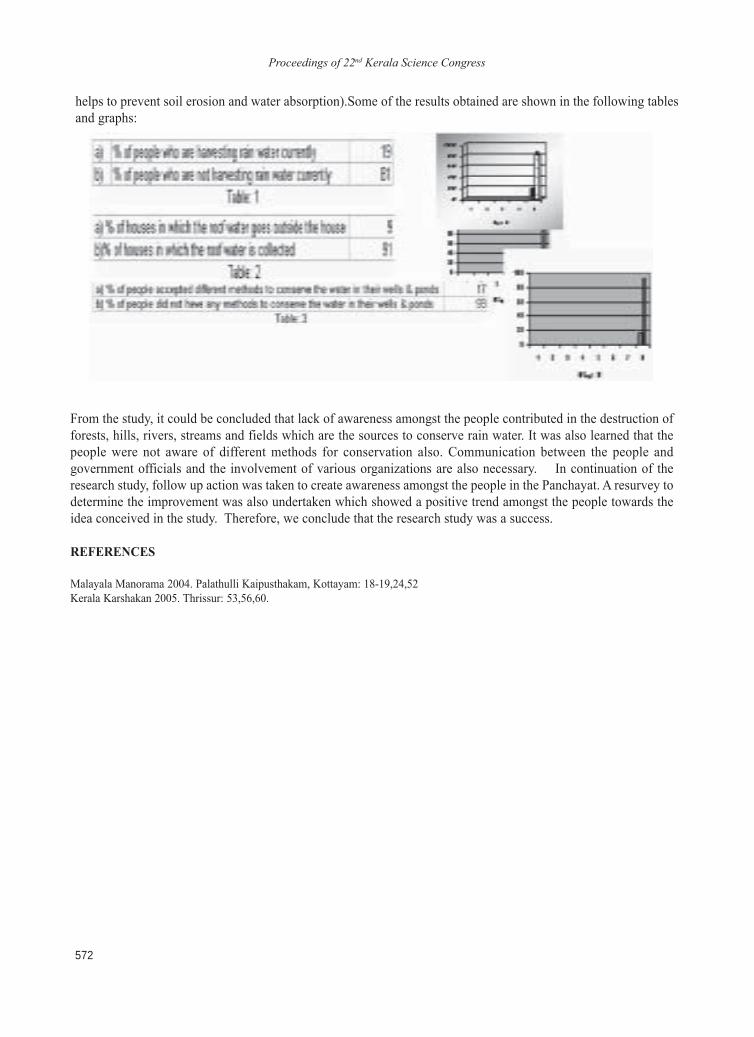
Proceedings of 22nd Kerala Science Congress
572
helps to prevent soil erosion and water absorption).Some of the results obtained are shown in the following tablesand graphs:
From the study, it could be concluded that lack of awareness amongst the people contributed in the destruction offorests, hills, rivers, streams and fields which are the sources to conserve rain water. It was also learned that thepeople were not aware of different methods for conservation also. Communication between the people andgovernment officials and the involvement of various organizations are also necessary. In continuation of theresearch study, follow up action was taken to create awareness amongst the people in the Panchayat. A resurvey todetermine the improvement was also undertaken which showed a positive trend amongst the people towards theidea conceived in the study. Therefore, we conclude that the research study was a success.
REFERENCES
Malayala Manorama 2004. Palathulli Kaipusthakam, Kottayam: 18-19,24,52Kerala Karshakan 2005. Thrissur: 53,56,60.
Proceedings of 22nd Kerala Science Congress
573
Spatial data generation for bamboo resource management
N. C. Anil Kumar, Kavitha Krishnan, K. G. Kavya, B. Anilkumar and C. U. VivekKerala State Remote Sensing and Environment Centre, Vikas Bhavan, Thiruvananthapuram, Kerala
INTRODUCTION
The Western Ghats in Kerala is the second largest diversity of bamboos and contain 25 species in 7 genera. Themost common species are Bambusa bambos, Dendrocalamus strictus, Ochlandra travancorica and O. scriptoria(Kumar and Remesh,1999). Eleven types of thin walled bamboos called reeds (Ochlandra) were also found in theState which mainly used for weaving purposes. Bamboo plays a critical role in soil and water conservation, balanceof O2 and Co2 in the atmosphere and protects against ultraviolet radiation. Its ability to grow in marginal andwastelands makes it preferred for greening the wasteland and degraded sites. Bamboo development can be used asan instrument of poverty alleviation, employment generation, improves the nutritional status of tribal people inrural sector and also a viable replacement for wood. Government of India started National Bamboo mission schemefor tapping unused potential of bamboo in industries and other related activities (NBM, 2009). On the basis, Stategovernment is also implementing mission programme for the sustainable development and utilization of bambooresources in the State. A system capable of handling and processing vast amount of data is essential for ensuringsuccessful planning and development of bamboo resources. Geomatic tools including Remote Sensing, GPS andGIS have capabilities for generating spatial informationís and integrating it with attribute data for developing needBased Decision Support Systems. The present study discuss the spatial database generated for bamboo sectoractivities in Kerala using geomatic tools.
MATERIALS AND METHODS
The study area covers the Forest Development agencies (FDA) in different circles coming under southern districtsof Kerala. IRS-P6, LISS IV data was used to demarcate the various forest classes including bamboo areas. Locationsof Vanasamrakshana Samithiís (VSS), Nurseries, Plantations and bamboo based industrial units were taken usingGPS through field survey and attribute information also collected. The developed Spatial and non spatial data arestored in POSTGRE database with POSTGIS enablety and integrated using .Net coding method to make the systeminteractive. It provide option to access and edit the spatial and attribute data.
RESULTS AND CONCLUSIONS
Existing bamboo growing sites/Potential area for bamboo cultivation
The spatial data on the various forest classes including bamboo areas, generated using IRS P6 LISS IV data, forKollam and Pathanamthitta districts are shown in Figure 1 and 2. Wasteland area map were generated for identifyingnew sites for bamboo cultivation and it shown Figure 3. Soil details were also incorporated in the wasteland mapfor finding in the suitability of the wasteland for bamboo cultivation. The soil classes K09 and K12 which are verydeep laterite soil, well drained with moderate surface, are generally reported as suitable for bamboo cultivation.
Vana Samrakshana Samities involved in bamboo mission activities
Details of VSS, bamboo plantation, nurseries, mother bed collected in field survey using GPS are given in Table -1. This database were converted into Shape files using ArcGIS 9.2. The non-spatial data are entered in the attributesinformation and added with the Shape files. The generated spatial data are given in Fig. 4.
Proceedings of 22nd Kerala Science Congress, 28-31 January 2010, KFRI, Peechi, pp. 573-574© KSCSTE 2010
08-36
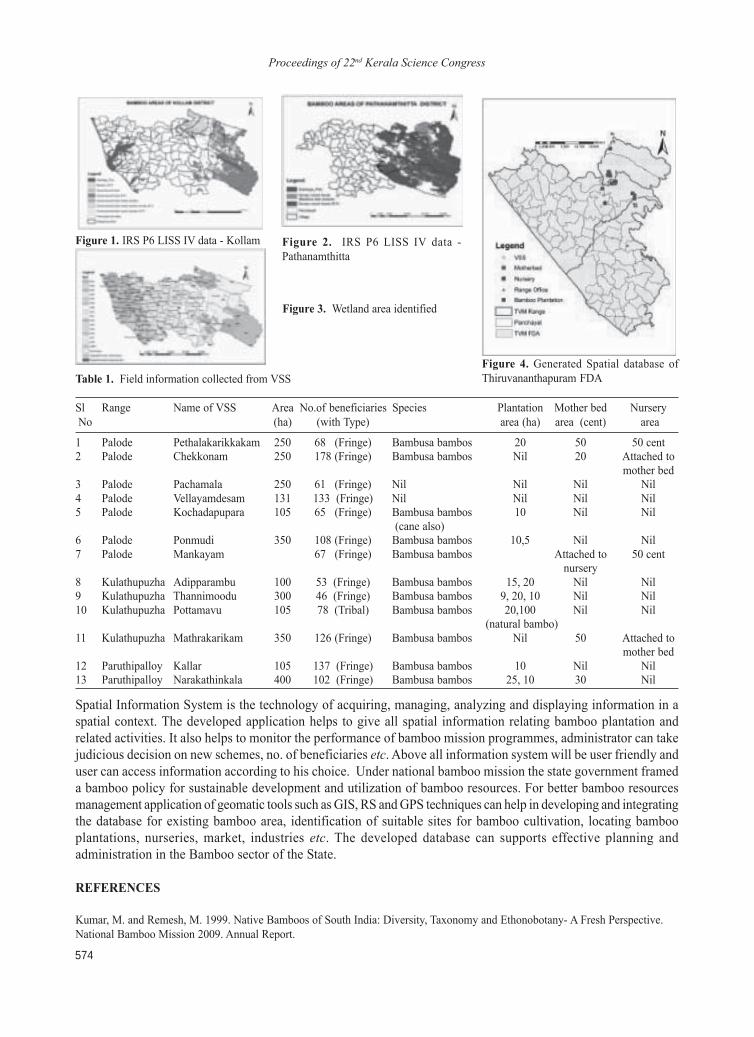
Proceedings of 22nd Kerala Science Congress
574
Spatial Information System is the technology of acquiring, managing, analyzing and displaying information in aspatial context. The developed application helps to give all spatial information relating bamboo plantation andrelated activities. It also helps to monitor the performance of bamboo mission programmes, administrator can takejudicious decision on new schemes, no. of beneficiaries etc. Above all information system will be user friendly anduser can access information according to his choice. Under national bamboo mission the state government frameda bamboo policy for sustainable development and utilization of bamboo resources. For better bamboo resourcesmanagement application of geomatic tools such as GIS, RS and GPS techniques can help in developing and integratingthe database for existing bamboo area, identification of suitable sites for bamboo cultivation, locating bambooplantations, nurseries, market, industries etc. The developed database can supports effective planning andadministration in the Bamboo sector of the State.
REFERENCES
Kumar, M. and Remesh, M. 1999. Native Bamboos of South India: Diversity, Taxonomy and Ethonobotany- A Fresh Perspective.National Bamboo Mission 2009. Annual Report.
Table 1. Field information collected from VSS
Sl Range Name of VSS Area No.of beneficiaries Species Plantation Mother bed Nursery No (ha) (with Type) area (ha) area (cent) area
1 Palode Pethalakarikkakam 250 68 (Fringe) Bambusa bambos 20 50 50 cent2 Palode Chekkonam 250 178 (Fringe) Bambusa bambos Nil 20 Attached to
mother bed3 Palode Pachamala 250 61 (Fringe) Nil Nil Nil Nil4 Palode Vellayamdesam 131 133 (Fringe) Nil Nil Nil Nil5 Palode Kochadapupara 105 65 (Fringe) Bambusa bambos 10 Nil Nil
(cane also)6 Palode Ponmudi 350 108 (Fringe) Bambusa bambos 10,5 Nil Nil7 Palode Mankayam 67 (Fringe) Bambusa bambos Attached to 50 cent
nursery8 Kulathupuzha Adipparambu 100 53 (Fringe) Bambusa bambos 15, 20 Nil Nil9 Kulathupuzha Thannimoodu 300 46 (Fringe) Bambusa bambos 9, 20, 10 Nil Nil10 Kulathupuzha Pottamavu 105 78 (Tribal) Bambusa bambos 20,100 Nil Nil
(natural bambo)11 Kulathupuzha Mathrakarikam 350 126 (Fringe) Bambusa bambos Nil 50 Attached to
mother bed12 Paruthipalloy Kallar 105 137 (Fringe) Bambusa bambos 10 Nil Nil13 Paruthipalloy Narakathinkala 400 102 (Fringe) Bambusa bambos 25, 10 30 Nil
Figure 3. Wetland area identified
Figure 4. Generated Spatial database ofThiruvananthapuram FDA
Figure 1. IRS P6 LISS IV data - Kollam Figure 2. IRS P6 LISS IV data -Pathanamthitta
Proceedings of 22nd Kerala Science Congress
575
Assessment of metal pollution based on Total Organic Carbon in sediments fromAkkulam-Veli Lake, Southern Kerala
N. Anu, K. Swarna Latha and M. N. M. Nair1Department of Civil Engineering, College of Engineering Trivandrum1Centre for Earth Science Studies, Trivandrum, Kerala
INTRODUCTION
Population growth and distribution, use of chemicals are adversely affecting the aquatic system. Sediments play amajor role in determining pollution pattern of aquatic systems, they act as both carriers and sinks for contaminants,reflecting the history of pollution, and providing a record of catchment inputs into aquatic ecosystems. The soilcomponents mainly responsible for binding metals especially metal cations and directly bioavailable form areorganic matter, clay minerals, and Fe and Mn oxides (Covelo et al., 2008). The bottom sediment serves as areservoir for heavy metals, and therefore, deserves special consideration in the planning and design of aquaticpollution research studies. The build-up of metals in sediments has significant environmental implications forlocal communities, as well as for lake quality. Sediment constitutes the most important sink of metals and otherpollutants; it can act as a non-point source and has the potential to release the sediment-bound metals and otherpollutants to overlying waters, and in turn adversely affects aquatic organisms. Organic matter is important incontrolling the distribution of trace elements in soil, suspended and aquatic sediment. Hence measurement of TOCis an important parameter in interpreting geochemical data. However the capacity of organic matter to concentratetrace elements varies with the amount and type of organic matter. (Sanei and Goodarzi, 2006).
The association between organic matter and loss on ignition (LOI) of sediments can be used as a basis for developmentof statistical models. Based on observed co variation of elements at 15 estuaries remote from contaminant input,linear regression of metals on organic matter were used to model the metal content in baseline sediments. Ageochemical model for the covariation is developed, verified and used to guide the statistical modeling approach.Using these baseline relationships, sediment metal concentration can be partitioned into natural and anthropogenicfractions (Simeonov, 2000). In the present study a correlation analysis of heavy metals with total organic carbon(TOC) and loss on ignition (LOI) in the surface sediment samples of Akkulam-Veli Lake was done.
MATERIALS AND METHODS
The study area selected, Akkulam-Veli Lake, is situated approximately 5km North-West of Thiruvananthapuramcity in Kerala, between latitudes 8∫25íN and 8∫35í N and longitudes 76∫50íE and 76∫58í E. The lake is having anarea of less than 1km2 surrounded by laterite hillocks. The representative sediment samples were collected for thestudy from ten selected stations of the lake during the month of February 2009. Grab samples were processed andanalysed for various parameters. Analysis was carried out for parameters texture analysis, total organic carbon(TOC), and trace elements. The dried sediment samples were powdered and sieved through 230mesh sieve and theloss on ignition (LOI) for 100gm sediment sample by heating at 900ÚC for one hour in a Muffle furnace was found.Heating will remove all the organic fraction, volatile and light metals from the sediments. Principal heavy metalssuch as Cr, Ni, Cu and Zn, Fe and Mn in the sediments were detected by X-ray fluorescence (XRF) spectrophotometer.
RESULTS AND CONCLUSIONS
The heavy metal concentrations, pH, %TOC and LOI of the sediments are shown in Table 1. pH of the sediments
Proceedings of 22nd Kerala Science Congress, 28-31 January 2010, KFRI, Peechi, pp. 575-576© KSCSTE 2010
08-37
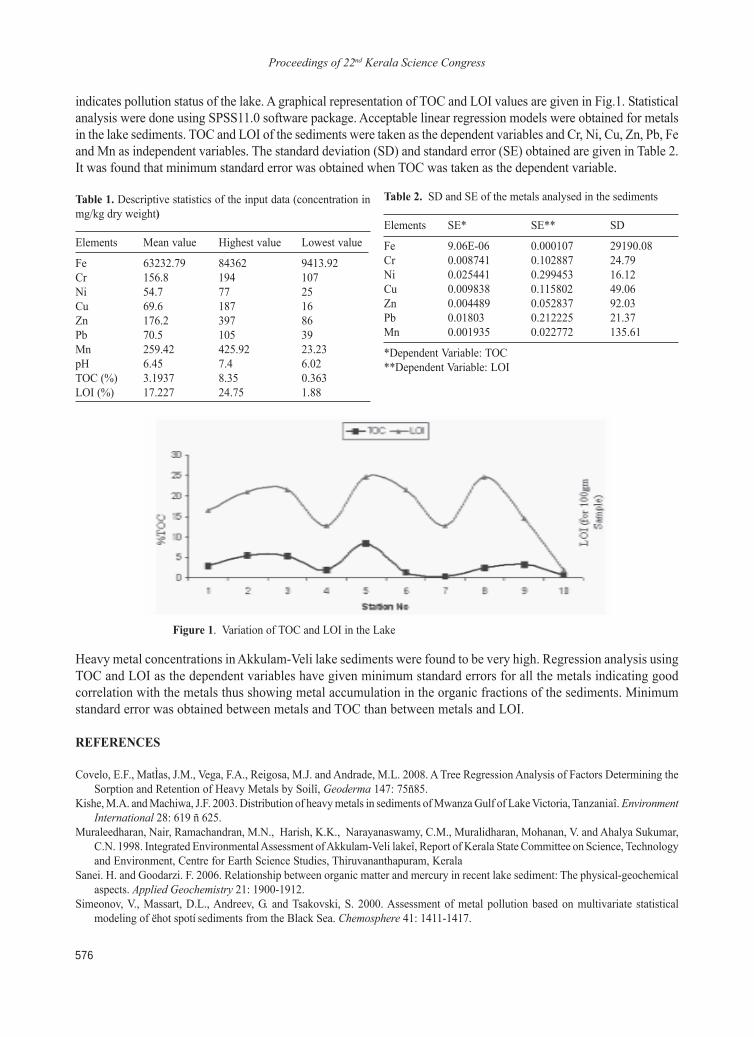
Proceedings of 22nd Kerala Science Congress
576
indicates pollution status of the lake. A graphical representation of TOC and LOI values are given in Fig.1. Statisticalanalysis were done using SPSS11.0 software package. Acceptable linear regression models were obtained for metalsin the lake sediments. TOC and LOI of the sediments were taken as the dependent variables and Cr, Ni, Cu, Zn, Pb, Feand Mn as independent variables. The standard deviation (SD) and standard error (SE) obtained are given in Table 2.It was found that minimum standard error was obtained when TOC was taken as the dependent variable.
Figure 1. Variation of TOC and LOI in the Lake
Table 1. Descriptive statistics of the input data (concentration inmg/kg dry weight)
Elements Mean value Highest value Lowest value
Fe 63232.79 84362 9413.92Cr 156.8 194 107Ni 54.7 77 25Cu 69.6 187 16Zn 176.2 397 86Pb 70.5 105 39Mn 259.42 425.92 23.23pH 6.45 7.4 6.02TOC (%) 3.1937 8.35 0.363LOI (%) 17.227 24.75 1.88
Table 2. SD and SE of the metals analysed in the sediments
Elements SE* SE** SD
Fe 9.06E-06 0.000107 29190.08Cr 0.008741 0.102887 24.79Ni 0.025441 0.299453 16.12Cu 0.009838 0.115802 49.06Zn 0.004489 0.052837 92.03Pb 0.01803 0.212225 21.37Mn 0.001935 0.022772 135.61
*Dependent Variable: TOC**Dependent Variable: LOI
Heavy metal concentrations in Akkulam-Veli lake sediments were found to be very high. Regression analysis usingTOC and LOI as the dependent variables have given minimum standard errors for all the metals indicating goodcorrelation with the metals thus showing metal accumulation in the organic fractions of the sediments. Minimumstandard error was obtained between metals and TOC than between metals and LOI.
REFERENCES
Covelo, E.F., MatÌas, J.M., Vega, F.A., Reigosa, M.J. and Andrade, M.L. 2008. A Tree Regression Analysis of Factors Determining theSorption and Retention of Heavy Metals by Soilî, Geoderma 147: 75ñ85.
Kishe, M.A. and Machiwa, J.F. 2003. Distribution of heavy metals in sediments of Mwanza Gulf of Lake Victoria, Tanzaniaî. EnvironmentInternational 28: 619 ñ 625.
Muraleedharan, Nair, Ramachandran, M.N., Harish, K.K., Narayanaswamy, C.M., Muralidharan, Mohanan, V. and Ahalya Sukumar,C.N. 1998. Integrated Environmental Assessment of Akkulam-Veli lakeî, Report of Kerala State Committee on Science, Technologyand Environment, Centre for Earth Science Studies, Thiruvananthapuram, Kerala
Sanei. H. and Goodarzi. F. 2006. Relationship between organic matter and mercury in recent lake sediment: The physical-geochemicalaspects. Applied Geochemistry 21: 1900-1912.
Simeonov, V., Massart, D.L., Andreev, G. and Tsakovski, S. 2000. Assessment of metal pollution based on multivariate statisticalmodeling of ëhot spotí sediments from the Black Sea. Chemosphere 41: 1411-1417.
Proceedings of 22nd Kerala Science Congress
577
Seasonal changes in potable water quality of selected coastal wards in KollamCorporation, Kerala
Nissy John and V. Salom Gnana ThangaDepartment of Environmental Science, University of Kerala, Kariavattom, Thiruvananthapuram, Kerala
INTRODUCTION
Kollam is an important maritime district of the state with a coastline of 37.3km. Fishing has prominent placein the economy of the district. The ground water bodies along the coastline have become polluted by theeffluents from the industries, municipal and domestic sewage, agricultural runoff, retting of coconut husk andfecal contamination. Intensive fishing practices has also become one of the major problem for deterioratingquality of the ground water in the coastline areas. Water gets impurities of various types from ground or soilwith which it comes in contact. The demand for water has drawn attention to the extraction of groundwaterresources in the coastal areas of Kerala. The main problem encountered in the coastal belt is the extremely lowquality of the ground water due to the influence of adjacent sea and salinity intrusion. The quality of groundwater may also vary with the depth of the water table, seasonal changes and all the processes and reactions thatact on the water. Hence the quality of the water has to be monitored at a periodical interval to maintain thequality of water for human use and for the sustenance of the ecosystem. In this context an attempt has been madeto assess the quality of potable water in selected coastal wards of Kollam Coporation, Kerala.
MATERIALS AND METHODS
Kollam District is situated in the South West coast of Kerala . A total of 10 water samples were collected fromfive different spots during Premonsoon (Feb) and monsoon (June) 2008 seasons. The sites selected for the studyare sampling station A (Shakthikulangara), sampling station B (Kavanadu), sampling station C (Thirumullavaram),sampling station D (Thangasseri) and sampling station E (Eravipuram) of Kollam Corporation from the dugwells situated in the residential sites of coastal wards. Samples were collected in sterile polythene bottlesfrom each sampling station. Physico chemical characteristics were analyzed as per APHA (1985) and totalcoliforms were detected by MPN method as per APHA (1985). The data were statistically analyzed by ANOVAto test the significance difference between different stations in the monsoon and the premonsoon seasons.
RESULTS AND CONCLUSIONS
Variation in sample characteristics taken from various sampling sites were statistically significant (P < 0.01 )during both premonsoon and monsoon season, with the exception of pH and phosphate during premonsoonseason. In the present investigation the temperature was found to vary from 250C to 280C in the well waters.Minimum temperature was recorded during the monsoon and maximum in the premonsoon months. According toMurugesan (2004) ground water maintained fairly a constant temperature. According to Kamath (1980) weatherconditions, load of organic and inorganic compounds are probably the main cause of variations in temperature.Further, the pH of the samples ranged from 6.02 to 7.52 which are within the desirable limits. Maximum pHvalue was noted in Shakthikulangara during monsoon and minimum in Kavanadu during premonsoon seasons.The maximum pH value may be due to consumption of carbon dioxide by phytoplanktons and minimum valuemay be due to edaphic factors. All the samples falls within the Indian Standards of Drinking Water Standards BISwhich recommends a pH range of 6.5 ñ 8.5.
Proceedings of 22nd Kerala Science Congress, 28-31 January 2010, KFRI, Peechi, pp. 577-578© KSCSTE 2010
08-38
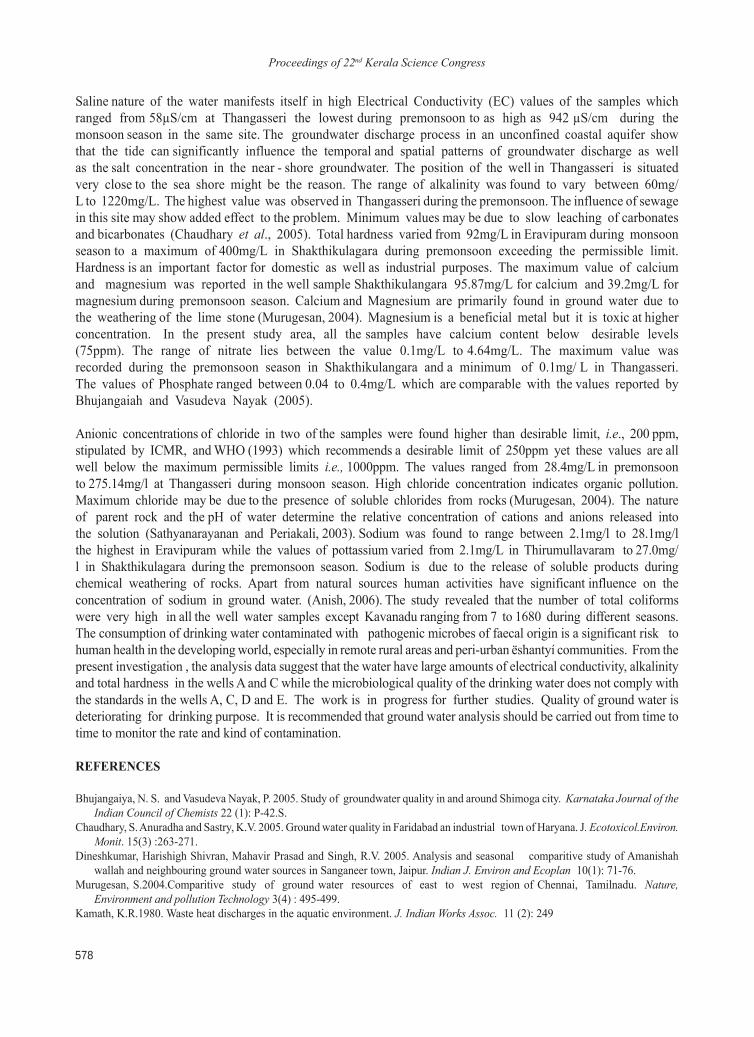
Proceedings of 22nd Kerala Science Congress
578
Saline nature of the water manifests itself in high Electrical Conductivity (EC) values of the samples whichranged from 58µS/cm at Thangasseri the lowest during premonsoon to as high as 942 µS/cm during themonsoon season in the same site. The groundwater discharge process in an unconfined coastal aquifer showthat the tide can significantly influence the temporal and spatial patterns of groundwater discharge as wellas the salt concentration in the near - shore groundwater. The position of the well in Thangasseri is situatedvery close to the sea shore might be the reason. The range of alkalinity was found to vary between 60mg/L to 1220mg/L. The highest value was observed in Thangasseri during the premonsoon. The influence of sewagein this site may show added effect to the problem. Minimum values may be due to slow leaching of carbonatesand bicarbonates (Chaudhary et al., 2005). Total hardness varied from 92mg/L in Eravipuram during monsoonseason to a maximum of 400mg/L in Shakthikulagara during premonsoon exceeding the permissible limit.Hardness is an important factor for domestic as well as industrial purposes. The maximum value of calciumand magnesium was reported in the well sample Shakthikulangara 95.87mg/L for calcium and 39.2mg/L formagnesium during premonsoon season. Calcium and Magnesium are primarily found in ground water due tothe weathering of the lime stone (Murugesan, 2004). Magnesium is a beneficial metal but it is toxic at higherconcentration. In the present study area, all the samples have calcium content below desirable levels(75ppm). The range of nitrate lies between the value 0.1mg/L to 4.64mg/L. The maximum value wasrecorded during the premonsoon season in Shakthikulangara and a minimum of 0.1mg/ L in Thangasseri.The values of Phosphate ranged between 0.04 to 0.4mg/L which are comparable with the values reported byBhujangaiah and Vasudeva Nayak (2005).
Anionic concentrations of chloride in two of the samples were found higher than desirable limit, i.e., 200 ppm,stipulated by ICMR, and WHO (1993) which recommends a desirable limit of 250ppm yet these values are allwell below the maximum permissible limits i.e., 1000ppm. The values ranged from 28.4mg/L in premonsoonto 275.14mg/l at Thangasseri during monsoon season. High chloride concentration indicates organic pollution.Maximum chloride may be due to the presence of soluble chlorides from rocks (Murugesan, 2004). The natureof parent rock and the pH of water determine the relative concentration of cations and anions released intothe solution (Sathyanarayanan and Periakali, 2003). Sodium was found to range between 2.1mg/l to 28.1mg/lthe highest in Eravipuram while the values of pottassium varied from 2.1mg/L in Thirumullavaram to 27.0mg/l in Shakthikulagara during the premonsoon season. Sodium is due to the release of soluble products duringchemical weathering of rocks. Apart from natural sources human activities have significant influence on theconcentration of sodium in ground water. (Anish, 2006). The study revealed that the number of total coliformswere very high in all the well water samples except Kavanadu ranging from 7 to 1680 during different seasons.The consumption of drinking water contaminated with pathogenic microbes of faecal origin is a significant risk tohuman health in the developing world, especially in remote rural areas and peri-urban ëshantyí communities. From thepresent investigation , the analysis data suggest that the water have large amounts of electrical conductivity, alkalinityand total hardness in the wells A and C while the microbiological quality of the drinking water does not comply withthe standards in the wells A, C, D and E. The work is in progress for further studies. Quality of ground water isdeteriorating for drinking purpose. It is recommended that ground water analysis should be carried out from time totime to monitor the rate and kind of contamination.
REFERENCES
Bhujangaiya, N. S. and Vasudeva Nayak, P. 2005. Study of groundwater quality in and around Shimoga city. Karnataka Journal of theIndian Council of Chemists 22 (1): P-42.S.
Chaudhary, S. Anuradha and Sastry, K.V. 2005. Ground water quality in Faridabad an industrial town of Haryana. J. Ecotoxicol.Environ.Monit. 15(3) :263-271.
Dineshkumar, Harishigh Shivran, Mahavir Prasad and Singh, R.V. 2005. Analysis and seasonal comparitive study of Amanishahwallah and neighbouring ground water sources in Sanganeer town, Jaipur. Indian J. Environ and Ecoplan 10(1): 71-76.
Murugesan, S.2004.Comparitive study of ground water resources of east to west region of Chennai, Tamilnadu. Nature,Environment and pollution Technology 3(4) : 495-499.
Kamath, K.R.1980. Waste heat discharges in the aquatic environment. J. Indian Works Assoc. 11 (2): 249
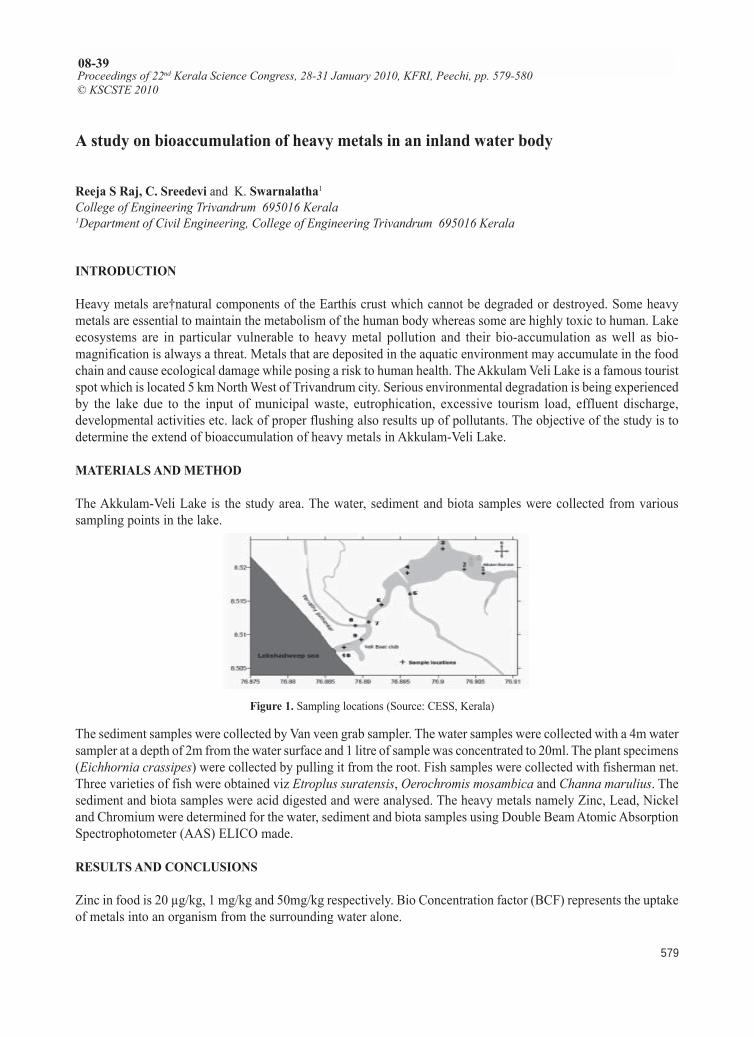
Proceedings of 22nd Kerala Science Congress
579
A study on bioaccumulation of heavy metals in an inland water body
Reeja S Raj, C. Sreedevi and K. Swarnalatha1College of Engineering Trivandrum 695016 Kerala1Department of Civil Engineering, College of Engineering Trivandrum 695016 Kerala
INTRODUCTION
Heavy metals are�natural components of the Earthís crust which cannot be degraded or destroyed. Some heavymetals are essential to maintain the metabolism of the human body whereas some are highly toxic to human. Lakeecosystems are in particular vulnerable to heavy metal pollution and their bio-accumulation as well as bio-magnification is always a threat. Metals that are deposited in the aquatic environment may accumulate in the foodchain and cause ecological damage while posing a risk to human health. The Akkulam Veli Lake is a famous touristspot which is located 5 km North West of Trivandrum city. Serious environmental degradation is being experiencedby the lake due to the input of municipal waste, eutrophication, excessive tourism load, effluent discharge,developmental activities etc. lack of proper flushing also results up of pollutants. The objective of the study is todetermine the extend of bioaccumulation of heavy metals in Akkulam-Veli Lake.
MATERIALS AND METHOD
The Akkulam-Veli Lake is the study area. The water, sediment and biota samples were collected from varioussampling points in the lake.
Proceedings of 22nd Kerala Science Congress, 28-31 January 2010, KFRI, Peechi, pp. 579-580© KSCSTE 2010
08-39
Figure 1. Sampling locations (Source: CESS, Kerala)
The sediment samples were collected by Van veen grab sampler. The water samples were collected with a 4m watersampler at a depth of 2m from the water surface and 1 litre of sample was concentrated to 20ml. The plant specimens(Eichhornia crassipes) were collected by pulling it from the root. Fish samples were collected with fisherman net.Three varieties of fish were obtained viz Etroplus suratensis, Oerochromis mosambica and Channa marulius. Thesediment and biota samples were acid digested and were analysed. The heavy metals namely Zinc, Lead, Nickeland Chromium were determined for the water, sediment and biota samples using Double Beam Atomic AbsorptionSpectrophotometer (AAS) ELICO made.
RESULTS AND CONCLUSIONS
Zinc in food is 20 µg/kg, 1 mg/kg and 50mg/kg respectively. Bio Concentration factor (BCF) represents the uptakeof metals into an organism from the surrounding water alone.
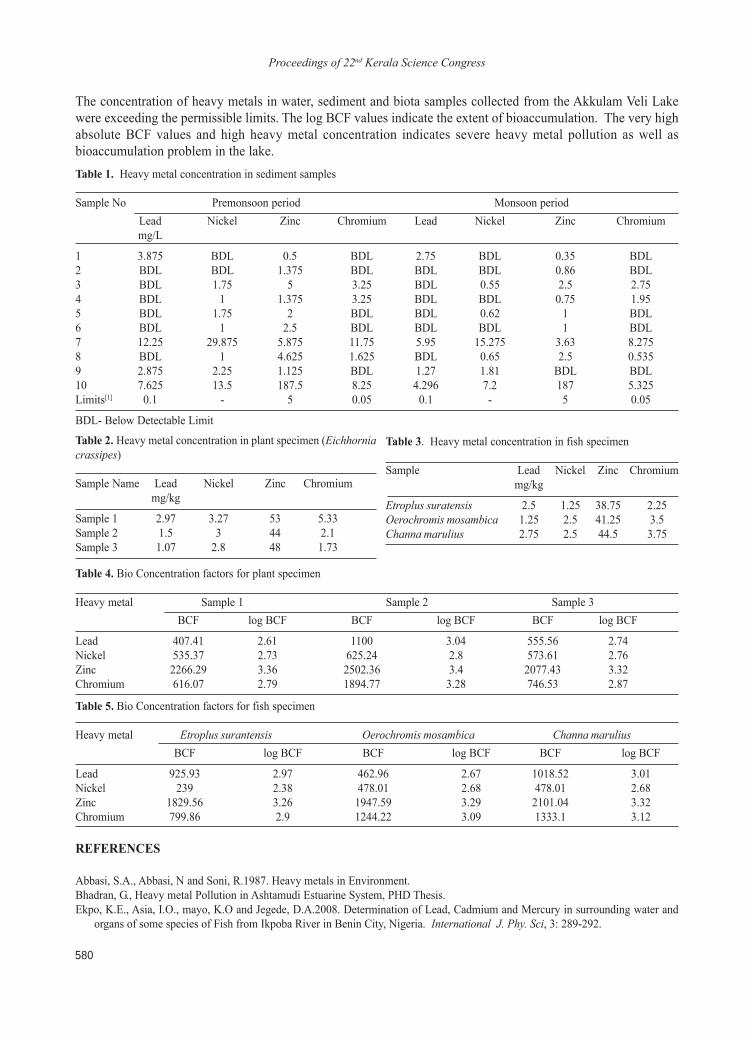
Proceedings of 22nd Kerala Science Congress
580
Table 4. Bio Concentration factors for plant specimen
Heavy metal Sample 1 Sample 2 Sample 3BCF log BCF BCF log BCF BCF log BCF
Lead 407.41 2.61 1100 3.04 555.56 2.74Nickel 535.37 2.73 625.24 2.8 573.61 2.76Zinc 2266.29 3.36 2502.36 3.4 2077.43 3.32Chromium 616.07 2.79 1894.77 3.28 746.53 2.87
Table 5. Bio Concentration factors for fish specimen
Heavy metal Etroplus surantensis Oerochromis mosambica Channa maruliusBCF log BCF BCF log BCF BCF log BCF
Lead 925.93 2.97 462.96 2.67 1018.52 3.01Nickel 239 2.38 478.01 2.68 478.01 2.68Zinc 1829.56 3.26 1947.59 3.29 2101.04 3.32Chromium 799.86 2.9 1244.22 3.09 1333.1 3.12
REFERENCES
Abbasi, S.A., Abbasi, N and Soni, R.1987. Heavy metals in Environment.Bhadran, G., Heavy metal Pollution in Ashtamudi Estuarine System, PHD Thesis.Ekpo, K.E., Asia, I.O., mayo, K.O and Jegede, D.A.2008. Determination of Lead, Cadmium and Mercury in surrounding water and
organs of some species of Fish from Ikpoba River in Benin City, Nigeria. International J. Phy. Sci, 3: 289-292.
The concentration of heavy metals in water, sediment and biota samples collected from the Akkulam Veli Lakewere exceeding the permissible limits. The log BCF values indicate the extent of bioaccumulation. The very highabsolute BCF values and high heavy metal concentration indicates severe heavy metal pollution as well asbioaccumulation problem in the lake.Table 1. Heavy metal concentration in sediment samples
Sample No Premonsoon period Monsoon periodLead Nickel Zinc Chromium Lead Nickel Zinc Chromiummg/L
1 3.875 BDL 0.5 BDL 2.75 BDL 0.35 BDL2 BDL BDL 1.375 BDL BDL BDL 0.86 BDL3 BDL 1.75 5 3.25 BDL 0.55 2.5 2.754 BDL 1 1.375 3.25 BDL BDL 0.75 1.955 BDL 1.75 2 BDL BDL 0.62 1 BDL6 BDL 1 2.5 BDL BDL BDL 1 BDL7 12.25 29.875 5.875 11.75 5.95 15.275 3.63 8.2758 BDL 1 4.625 1.625 BDL 0.65 2.5 0.5359 2.875 2.25 1.125 BDL 1.27 1.81 BDL BDL10 7.625 13.5 187.5 8.25 4.296 7.2 187 5.325Limits[1] 0.1 - 5 0.05 0.1 - 5 0.05
BDL- Below Detectable Limit
Table 3. Heavy metal concentration in fish specimen
Sample Lead Nickel Zinc Chromiummg/kg
Etroplus suratensis 2.5 1.25 38.75 2.25Oerochromis mosambica 1.25 2.5 41.25 3.5Channa marulius 2.75 2.5 44.5 3.75
Table 2. Heavy metal concentration in plant specimen (Eichhorniacrassipes)
Sample Name Lead Nickel Zinc Chromiummg/kg
Sample 1 2.97 3.27 53 5.33Sample 2 1.5 3 44 2.1Sample 3 1.07 2.8 48 1.73
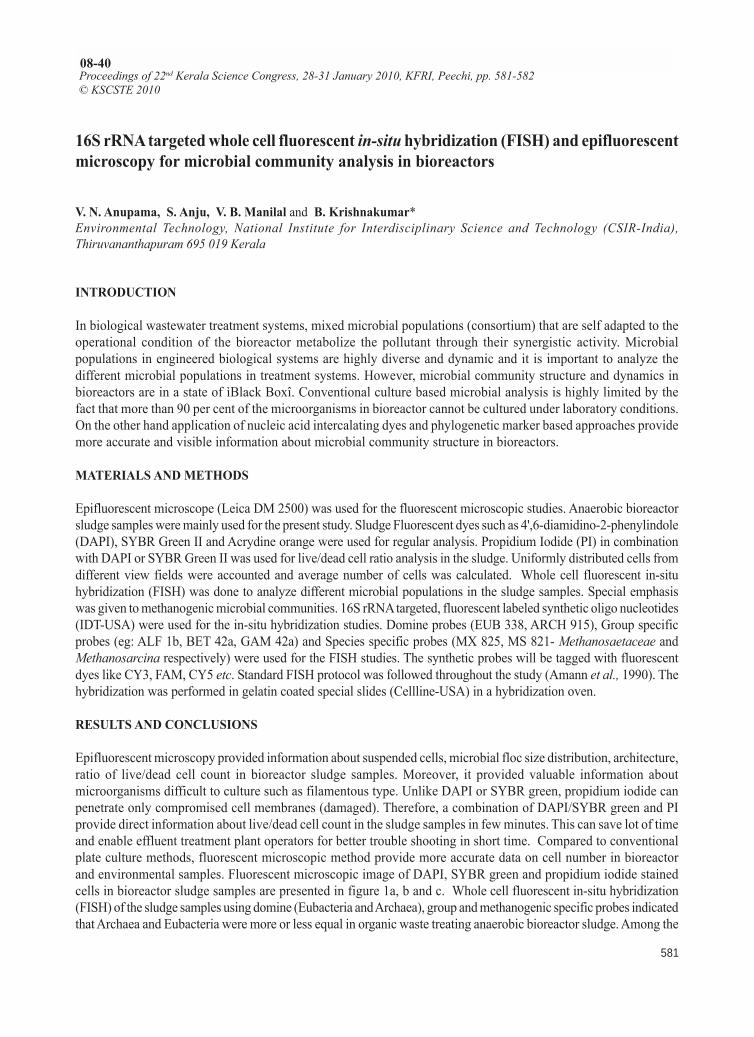
Proceedings of 22nd Kerala Science Congress
581
16S rRNA targeted whole cell fluorescent in-situ hybridization (FISH) and epifluorescentmicroscopy for microbial community analysis in bioreactors
V. N. Anupama, S. Anju, V. B. Manilal and B. Krishnakumar*Environmental Technology, National Institute for Interdisciplinary Science and Technology (CSIR-India),Thiruvananthapuram 695 019 Kerala
INTRODUCTION
In biological wastewater treatment systems, mixed microbial populations (consortium) that are self adapted to theoperational condition of the bioreactor metabolize the pollutant through their synergistic activity. Microbialpopulations in engineered biological systems are highly diverse and dynamic and it is important to analyze thedifferent microbial populations in treatment systems. However, microbial community structure and dynamics inbioreactors are in a state of ìBlack Boxî. Conventional culture based microbial analysis is highly limited by thefact that more than 90 per cent of the microorganisms in bioreactor cannot be cultured under laboratory conditions.On the other hand application of nucleic acid intercalating dyes and phylogenetic marker based approaches providemore accurate and visible information about microbial community structure in bioreactors.
MATERIALS AND METHODS
Epifluorescent microscope (Leica DM 2500) was used for the fluorescent microscopic studies. Anaerobic bioreactorsludge samples were mainly used for the present study. Sludge Fluorescent dyes such as 4',6-diamidino-2-phenylindole(DAPI), SYBR Green II and Acrydine orange were used for regular analysis. Propidium Iodide (PI) in combinationwith DAPI or SYBR Green II was used for live/dead cell ratio analysis in the sludge. Uniformly distributed cells fromdifferent view fields were accounted and average number of cells was calculated. Whole cell fluorescent in-situhybridization (FISH) was done to analyze different microbial populations in the sludge samples. Special emphasiswas given to methanogenic microbial communities. 16S rRNA targeted, fluorescent labeled synthetic oligo nucleotides(IDT-USA) were used for the in-situ hybridization studies. Domine probes (EUB 338, ARCH 915), Group specificprobes (eg: ALF 1b, BET 42a, GAM 42a) and Species specific probes (MX 825, MS 821- Methanosaetaceae andMethanosarcina respectively) were used for the FISH studies. The synthetic probes will be tagged with fluorescentdyes like CY3, FAM, CY5 etc. Standard FISH protocol was followed throughout the study (Amann et al., 1990). Thehybridization was performed in gelatin coated special slides (Cellline-USA) in a hybridization oven.
RESULTS AND CONCLUSIONS
Epifluorescent microscopy provided information about suspended cells, microbial floc size distribution, architecture,ratio of live/dead cell count in bioreactor sludge samples. Moreover, it provided valuable information aboutmicroorganisms difficult to culture such as filamentous type. Unlike DAPI or SYBR green, propidium iodide canpenetrate only compromised cell membranes (damaged). Therefore, a combination of DAPI/SYBR green and PIprovide direct information about live/dead cell count in the sludge samples in few minutes. This can save lot of timeand enable effluent treatment plant operators for better trouble shooting in short time. Compared to conventionalplate culture methods, fluorescent microscopic method provide more accurate data on cell number in bioreactorand environmental samples. Fluorescent microscopic image of DAPI, SYBR green and propidium iodide stainedcells in bioreactor sludge samples are presented in figure 1a, b and c. Whole cell fluorescent in-situ hybridization(FISH) of the sludge samples using domine (Eubacteria and Archaea), group and methanogenic specific probes indicatedthat Archaea and Eubacteria were more or less equal in organic waste treating anaerobic bioreactor sludge. Among the
Proceedings of 22nd Kerala Science Congress, 28-31 January 2010, KFRI, Peechi, pp. 581-582© KSCSTE 2010
08-40
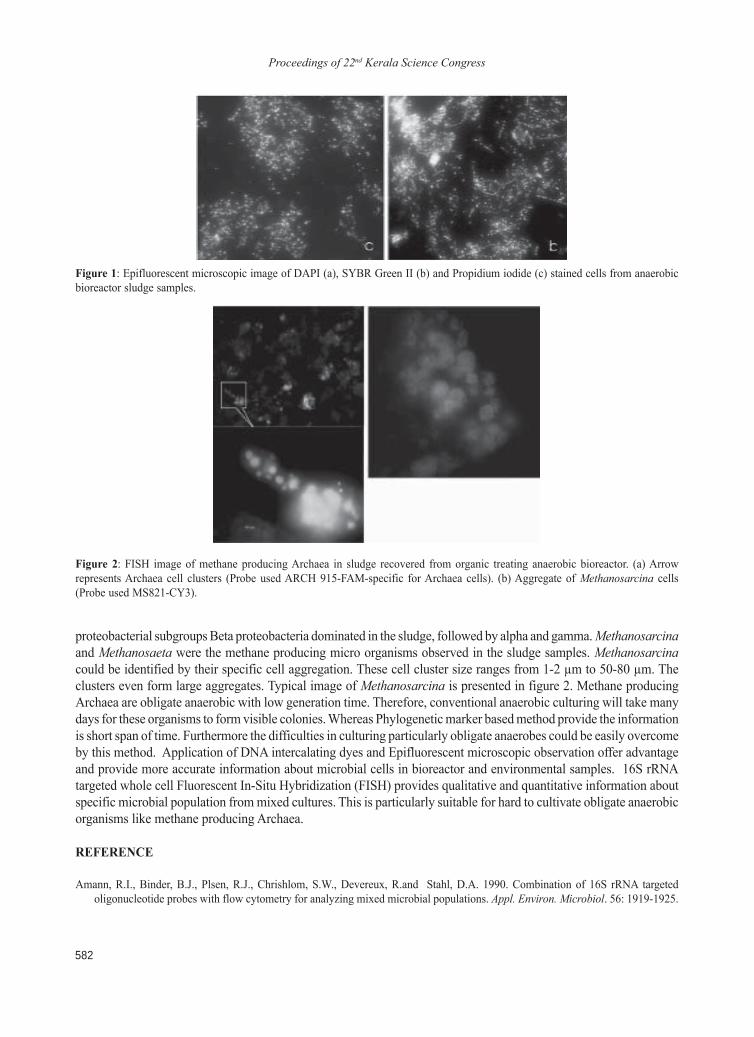
Proceedings of 22nd Kerala Science Congress
582
proteobacterial subgroups Beta proteobacteria dominated in the sludge, followed by alpha and gamma. Methanosarcinaand Methanosaeta were the methane producing micro organisms observed in the sludge samples. Methanosarcinacould be identified by their specific cell aggregation. These cell cluster size ranges from 1-2 µm to 50-80 µm. Theclusters even form large aggregates. Typical image of Methanosarcina is presented in figure 2. Methane producingArchaea are obligate anaerobic with low generation time. Therefore, conventional anaerobic culturing will take manydays for these organisms to form visible colonies. Whereas Phylogenetic marker based method provide the informationis short span of time. Furthermore the difficulties in culturing particularly obligate anaerobes could be easily overcomeby this method. Application of DNA intercalating dyes and Epifluorescent microscopic observation offer advantageand provide more accurate information about microbial cells in bioreactor and environmental samples. 16S rRNAtargeted whole cell Fluorescent In-Situ Hybridization (FISH) provides qualitative and quantitative information aboutspecific microbial population from mixed cultures. This is particularly suitable for hard to cultivate obligate anaerobicorganisms like methane producing Archaea.
REFERENCE
Amann, R.I., Binder, B.J., Plsen, R.J., Chrishlom, S.W., Devereux, R.and Stahl, D.A. 1990. Combination of 16S rRNA targetedoligonucleotide probes with flow cytometry for analyzing mixed microbial populations. Appl. Environ. Microbiol. 56: 1919-1925.
Figure 2: FISH image of methane producing Archaea in sludge recovered from organic treating anaerobic bioreactor. (a) Arrowrepresents Archaea cell clusters (Probe used ARCH 915-FAM-specific for Archaea cells). (b) Aggregate of Methanosarcina cells(Probe used MS821-CY3).
Figure 1: Epifluorescent microscopic image of DAPI (a), SYBR Green II (b) and Propidium iodide (c) stained cells from anaerobicbioreactor sludge samples.
Proceedings of 22nd Kerala Science Congress
583
Biodegradation of antimicrobial compound-Triclosan
V. N. Anupama, K.S. Sudheer, Rugmini Sukumar and B. Krishnakumar*Environmental Technology, National Institute for Interdisciplinary Science and Technology (CSIR-India),Thiruvananthapuram 695 019Kerala E-mail: [email protected],
INTRODUCTION
Triclosan (2,4, 4¥-trichloro-2¥-hydroxyl diphenyl ether) is a broad spectrum antimicrobial compound commonlyused in many personal care and household products. Due its extensive use and stability under natural conditions,triclosan and its transformation products are widely detected from wastewater treatment facilities and naturalenvironments. There is a growing concern about the adverse environmental effects of triclosan and its derivativeslike 2,2/2,8-dichloro di benzo-p-dioxin contamination in water and soil mainly due to toxicity of the compounds aswell as emergence of strains of antibiotic-resistant bacteria (Mezcua et al., 2004; Chee-Sanford et al.,., 2001).Presence of traces of TCS and related compounds hinder the reuse quality of treated wastewater. Triclosan alsoinhibited plant growth in soil and found to be acutely toxic to certain types of aquatic organisms (Liu et al., 2009;Orvos et al., 2002). The present study reports isolated Pseudomonas species exhibiting high tolerance to TCS anddegrading the compound in liquid and solid agar medium.
MATERIALS AND METHODS
Three different inoculum sources were used for enrichment and isolation of triclosan degrading bacteria. Effluentsample from a sewage treating household sanitation system, aerobic activated sludge from a diary effluent treatmentplant and sewage contaminated soil samples were used separately. TCS was supplied to the culture at 10mg/L level.Pure cultures were prepared from the enrichment cultures through plating in LB agar or R2A agar media.
Growth and Triclosan degradation in batch cultures
The isolates were inoculated to LB broth containing 10 mg/L triclosan. After 24 hrs incubation the biomass wasconcentrated by centrifugation at 5100 ◊ g for 10 min. The cell pellet was washed with PBS two times and resuspendedin minimum PBS and used as inoculums for the batch experiment. TCS was added at 100 mg/L level to the batchcultures. Heat killed biomass control was run parallel to account any nonbiological degradation of triclosan. Sampleswere withdrawn from the flasks every 24 hr for OD measurement (600 nm) and HPLC analysis for residual TCSand intermediate product monitoring.
Phylogenetic analysis
Genomic DNA was extracted under standard PCR conditions using a thermocycler part of 16sDNA was amplifiedand sequenced commercially (Axygen, India). The gene sequence obtained was compared with correspondingsequences of related organisms retrieved from GeneBank database with BLAST algorithm. Multiple sequencealignment was carried out using ClustalX (2.0) software (Larkin et al., 2007). The Phylogenetic tree was constructedby Neighbor Joining method.
Proceedings of 22nd Kerala Science Congress, 28-31 January 2010, KFRI, Peechi, pp. 583-584© KSCSTE 2010
08-41
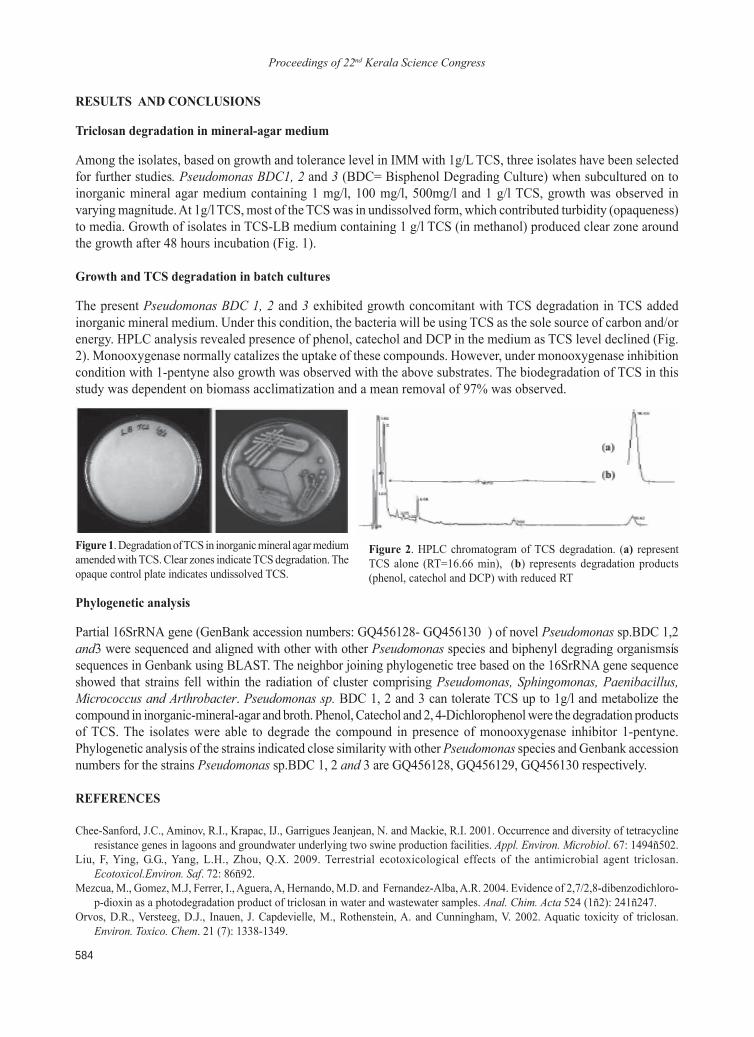
Proceedings of 22nd Kerala Science Congress
584
RESULTS AND CONCLUSIONS
Triclosan degradation in mineral-agar medium
Among the isolates, based on growth and tolerance level in IMM with 1g/L TCS, three isolates have been selectedfor further studies. Pseudomonas BDC1, 2 and 3 (BDC= Bisphenol Degrading Culture) when subcultured on toinorganic mineral agar medium containing 1 mg/l, 100 mg/l, 500mg/l and 1 g/l TCS, growth was observed invarying magnitude. At 1g/l TCS, most of the TCS was in undissolved form, which contributed turbidity (opaqueness)to media. Growth of isolates in TCS-LB medium containing 1 g/l TCS (in methanol) produced clear zone aroundthe growth after 48 hours incubation (Fig. 1).
Growth and TCS degradation in batch cultures
The present Pseudomonas BDC 1, 2 and 3 exhibited growth concomitant with TCS degradation in TCS addedinorganic mineral medium. Under this condition, the bacteria will be using TCS as the sole source of carbon and/orenergy. HPLC analysis revealed presence of phenol, catechol and DCP in the medium as TCS level declined (Fig.2). Monooxygenase normally catalizes the uptake of these compounds. However, under monooxygenase inhibitioncondition with 1-pentyne also growth was observed with the above substrates. The biodegradation of TCS in thisstudy was dependent on biomass acclimatization and a mean removal of 97% was observed.
Figure 1. Degradation of TCS in inorganic mineral agar mediumamended with TCS. Clear zones indicate TCS degradation. Theopaque control plate indicates undissolved TCS.
Figure 2. HPLC chromatogram of TCS degradation. (a) representTCS alone (RT=16.66 min), (b) represents degradation products(phenol, catechol and DCP) with reduced RT
a b
Phylogenetic analysis
Partial 16SrRNA gene (GenBank accession numbers: GQ456128- GQ456130 ) of novel Pseudomonas sp.BDC 1,2and3 were sequenced and aligned with other with other Pseudomonas species and biphenyl degrading organismsíssequences in Genbank using BLAST. The neighbor joining phylogenetic tree based on the 16SrRNA gene sequenceshowed that strains fell within the radiation of cluster comprising Pseudomonas, Sphingomonas, Paenibacillus,Micrococcus and Arthrobacter. Pseudomonas sp. BDC 1, 2 and 3 can tolerate TCS up to 1g/l and metabolize thecompound in inorganic-mineral-agar and broth. Phenol, Catechol and 2, 4-Dichlorophenol were the degradation productsof TCS. The isolates were able to degrade the compound in presence of monooxygenase inhibitor 1-pentyne.Phylogenetic analysis of the strains indicated close similarity with other Pseudomonas species and Genbank accessionnumbers for the strains Pseudomonas sp.BDC 1, 2 and 3 are GQ456128, GQ456129, GQ456130 respectively.
REFERENCES
Chee-Sanford, J.C., Aminov, R.I., Krapac, IJ., Garrigues Jeanjean, N. and Mackie, R.I. 2001. Occurrence and diversity of tetracyclineresistance genes in lagoons and groundwater underlying two swine production facilities. Appl. Environ. Microbiol. 67: 1494ñ502.
Liu, F, Ying, G.G., Yang, L.H., Zhou, Q.X. 2009. Terrestrial ecotoxicological effects of the antimicrobial agent triclosan.Ecotoxicol.Environ. Saf. 72: 86ñ92.
Mezcua, M., Gomez, M.J, Ferrer, I., Aguera, A, Hernando, M.D. and Fernandez-Alba, A.R. 2004. Evidence of 2,7/2,8-dibenzodichloro-p-dioxin as a photodegradation product of triclosan in water and wastewater samples. Anal. Chim. Acta 524 (1ñ2): 241ñ247.
Orvos, D.R., Versteeg, D.J., Inauen, J. Capdevielle, M., Rothenstein, A. and Cunningham, V. 2002. Aquatic toxicity of triclosan.Environ. Toxico. Chem. 21 (7): 1338-1349.
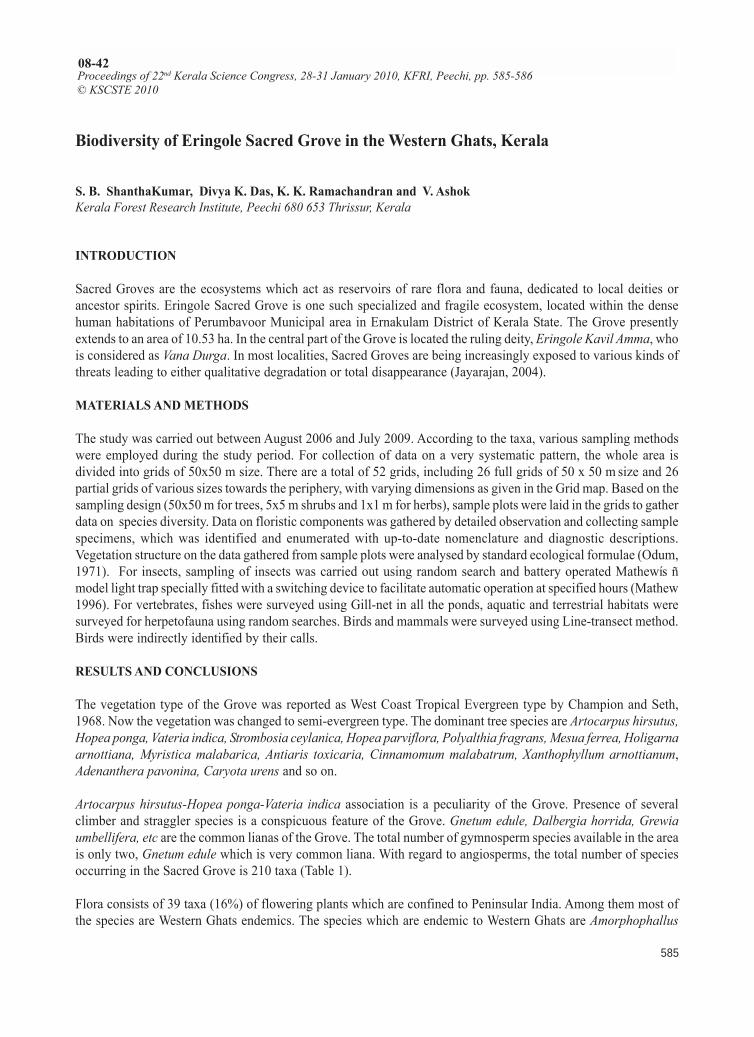
Proceedings of 22nd Kerala Science Congress
585
Biodiversity of Eringole Sacred Grove in the Western Ghats, Kerala
S. B. ShanthaKumar, Divya K. Das, K. K. Ramachandran and V. AshokKerala Forest Research Institute, Peechi 680 653 Thrissur, Kerala
INTRODUCTION
Sacred Groves are the ecosystems which act as reservoirs of rare flora and fauna, dedicated to local deities orancestor spirits. Eringole Sacred Grove is one such specialized and fragile ecosystem, located within the densehuman habitations of Perumbavoor Municipal area in Ernakulam District of Kerala State. The Grove presentlyextends to an area of 10.53 ha. In the central part of the Grove is located the ruling deity, Eringole Kavil Amma, whois considered as Vana Durga. In most localities, Sacred Groves are being increasingly exposed to various kinds ofthreats leading to either qualitative degradation or total disappearance (Jayarajan, 2004).
MATERIALS AND METHODS
The study was carried out between August 2006 and July 2009. According to the taxa, various sampling methodswere employed during the study period. For collection of data on a very systematic pattern, the whole area isdivided into grids of 50x50 m size. There are a total of 52 grids, including 26 full grids of 50 x 50 m size and 26partial grids of various sizes towards the periphery, with varying dimensions as given in the Grid map. Based on thesampling design (50x50 m for trees, 5x5 m shrubs and 1x1 m for herbs), sample plots were laid in the grids to gatherdata on species diversity. Data on floristic components was gathered by detailed observation and collecting samplespecimens, which was identified and enumerated with up-to-date nomenclature and diagnostic descriptions.Vegetation structure on the data gathered from sample plots were analysed by standard ecological formulae (Odum,1971). For insects, sampling of insects was carried out using random search and battery operated Mathewís ñmodel light trap specially fitted with a switching device to facilitate automatic operation at specified hours (Mathew1996). For vertebrates, fishes were surveyed using Gill-net in all the ponds, aquatic and terrestrial habitats weresurveyed for herpetofauna using random searches. Birds and mammals were surveyed using Line-transect method.Birds were indirectly identified by their calls.
RESULTS AND CONCLUSIONS
The vegetation type of the Grove was reported as West Coast Tropical Evergreen type by Champion and Seth,1968. Now the vegetation was changed to semi-evergreen type. The dominant tree species are Artocarpus hirsutus,Hopea ponga, Vateria indica, Strombosia ceylanica, Hopea parviflora, Polyalthia fragrans, Mesua ferrea, Holigarnaarnottiana, Myristica malabarica, Antiaris toxicaria, Cinnamomum malabatrum, Xanthophyllum arnottianum,Adenanthera pavonina, Caryota urens and so on.
Artocarpus hirsutus-Hopea ponga-Vateria indica association is a peculiarity of the Grove. Presence of severalclimber and straggler species is a conspicuous feature of the Grove. Gnetum edule, Dalbergia horrida, Grewiaumbellifera, etc are the common lianas of the Grove. The total number of gymnosperm species available in the areais only two, Gnetum edule which is very common liana. With regard to angiosperms, the total number of speciesoccurring in the Sacred Grove is 210 taxa (Table 1).
Flora consists of 39 taxa (16%) of flowering plants which are confined to Peninsular India. Among them most ofthe species are Western Ghats endemics. The species which are endemic to Western Ghats are Amorphophallus
Proceedings of 22nd Kerala Science Congress, 28-31 January 2010, KFRI, Peechi, pp. 585-586© KSCSTE 2010
08-42
Proceedings of 22nd Kerala Science Congress
586
commutatus, Artocarpus hirsutus, Cinnamomum malabatrum, Dalbergia horrida, Grewia umbellifera, Holigarnaarnottiana, Hopea parviflora, Hopea ponga, etc. A total of 12 taxa of Eringole Sacred Grove flora belong todifferent threat which includes critically endangered (Vateria indica), Endangered (Hopea parviflora, Hopea ponga)Vulnerable (Begonia trichocarpa), Rare (Ampelocissus indica, Vepris bilocularis) Low risk (Tabernaemontanaalternifolia) and Threatened (Molineria trichocarpa).
In faunal analysis the grove is rich in invertebrate fauna. Of about 30 insect orders, insects belonging to 12 orderswere collected. Of the 182 species collected from the grove, 102 species have been identified which included 51species of Lepidoptera (31 species of butterflies and 20 species of moths). Ten species of butterflies recorded in thisstudy were found to be of high conservation status being either endemic or protected species. The abundance ofmacro-invertebrates such as Molluscs, Millipede, Centipede and Scorpion were also recorded. A rich diversity ofspiders was observed in the Grove. A total of 45 species of spiders have been recorded, belonging to 16 families.The dominant families are Araneidae with ten species. Of the sixteen families the highest percentage of populationrecorded was Oxyopidae (28%). Of these nine species of spiders were endemic to India.
During the study period eight species of amphibians were recorded belonging to four families. Of these, fourspecies were Rhacophorids, two species of Dicroglossids, Bufonids and Ranids represented by single species. Fourspecies of amphibians recorded in this study were found to be native. During the study period, fifteen species ofreptiles identified belonging to seven families. These include six species of snakes (Uropeltis sp, Ahaetulla nasutus,Dendrelaphis tristis, Xenochrophis piscator, Ptyas mucosus and Elaphe helena), three species of geckos (Cnemaspiskandiana, Hemidactylus brooki and H. frenatus), turtles (Melanochelys trijuga and Lissemys punctata), agamids(Calotes versicolor and C. calotes) and scincids (Mabuya macularius and M. carinata) were represented by twospecies each. A total of 65 species of birds were recorded from the Grove. Two species of birds were endemic toIndia. The mammals sighted in the Sacred Grove area are Macaca radiata, Cynopterus sphinx and Funambuluspalmarum. The study highlights the importance of these pristine patches, as endangered, restricted, and fragmentedhabitat for rare flora and fauna. Those benefits might, however, soon be lost if they are allowed to be degraded ordestroyed. Thus protection and monitoring of the biodiversity of Sacred Groves must gain priority.
REFERENCES
Jayarajan, M. 2004. Sacred Groves of North Malabar, Kerala Research Programme on Local Level Development, Centre for DevelopmentStudies, Thiruvananthapuram ISBN 81-87621-95-8.
Mathew G., Rugmini, P. and Sudheendrakumar, V.V. 1998. Insect Biodiversity in Disturbed and Undisturbed Forests in the Kerala Partof Western Ghats. KFRI Research Report No.135. KFRI, Peechi.
Odum, E.P. 1971. Fundamentals of Ecology. W.B. Saunders. Co., Philadelphia.
Table 1. Details of gymnosperms and angiosperms in the flora of Eringole sacred grove
Plant groups No. families No. genera No. species No. ssp./vars.
Gymnosperms 2 2 2 0Dicotyledons 69 150 173 4Monocotyledons 9 25 30 1Total 80 177 205 5
Proceedings of 22nd Kerala Science Congress
587
Nesting habitat preference by Great Hornbill (Buceros bicornis) and Malabar PiedHornbill (Anthracoceros coronatus) in tropical wet evergreen forests of Vazhachal ForestDivision, Anamalai part of Southern Western Ghats, Kerala, India
K.H. Amitha BachanWestern Ghats Hornbill Foundation, Aranyak, Mathilakam 680 685 Thrissur, Kerala
INTRODUCTION
Tropical humid forest probably contains the greatest diversity of plants and animals in comparison with all otherterrestrial ecosystems. Hornbills are particularly sensitive indicators of forest conditions and human disturbance ofthe tropical forests because they require large tracts of unfragmented forest with large trees for nesting and arefairly well studied or documented. (Poonswad and Kemp, 1993; Kannan and James, 1998). There are 54 speciesof hornbills in the world (Kemp, 1995), of which nine occur in India, and four in the Western Ghats. Habitat lossdue to shifting cultivation and logging, and traditional hunting by tribes was reported as important threats tohornbills in India ñ north-east and the Western Ghats (Kannan and James, 1998; Datta 1998). One-fourth (25.6%)of the Western Ghatsís forest cover had been lost over a period of 22 years from 1973 to 1995 (Jha et al., 2000). Inthe Anamalai hills alone, 26 per cent of the natural forests have been converted into non-forest areas. ( Ramesh etal., 2007). The Anamalai Hills along the southern edge of the Palghat Gap culminating at Anaimudi (2695 m), thehighest point in the Western Ghats is considered one of three endemic centers of the Ghats (Ramesh et al., 1997).Four species of hornbills occur sympatrically in the Anamalais which is one of the strongholds for hornbills insouth India (Bachan 2006, Mudappa and Raman, 2009). The forests of Vazhachal Forest Division occupy a centraland pivotal position in the Anamalai landscape with 30 per cent of its natural forests and link all the important forestareas in the vicinity. The temperature 16-230C, the rainfall (average annual 4019 mm), duration of dry months (with2-4 months) and elevation (100-1400m MSL) support the primary wet-evergreen forests and various degradedstages. The study contributes to the nest habitat preference for the two larger hornbills of south India.
MATERIALS AND METHODS
Intensive field surveys were conducted during 2004-05 to 2007-08, four consecutive nesting seasons (December ñMay) in the forests of Vazhachal Forest Division. Nesting trees were located with the previous experience of thetribal people, the following of lone males, presence of regurgitated seeds in fecal matter or seedlings of hornbill-preferred trees and presence of old feathers at the middens under nesting trees. Details regarding nesting trees likename, girth at breast height (gbh), height of tree, height at the nest cavity location of nest-tree, nature of vegetation,nature of terrain and nearest plants were recorded. Vegetation and terrain features were identified within the field.The major vegetation includes evergreen-dense, evergreen-degraded, riparian forests, moist deciduous forests andplantations. Terrain categorized into riverside, streamside, cliffs, slops and plains. The locations of nests wereplotted in a vegetation map using GPS readings and the vegetation types were fine-tuned. Basic statistics of the nestlocations, terrain features, characters of nest trees were calculated. Principal component analysis was done fordistributions of nests correspond to the vegetation and terrain features.
RESULTS AND CONCLUSIONS
A total of 61 nests were located during four years search, of which 57were Great Hornbill nests and four wereMalabar Pied Hornbill nests. Great Hornbills here found to nest on trees greater than 2 m gbh (average 4.3 m,n=57). Average tree height ranged 24-40 m with an average of 31 m. Height of the nest ranged 18-32 m with an
Proceedings of 22nd Kerala Science Congress, 28-31 January 2010, KFRI, Peechi, pp. 587-588© KSCSTE 2010
08-43
Proceedings of 22nd Kerala Science Congress
588
average of 25 m. Great Hornbills were found to nest on 18 species of trees. Most nests were located on Terminaliabellirica (8), Palaquium ellipticum and Dipterocarpus indicus (7), Calophyllum polyanthum (5), Bombax ceiba,Vateria indica and Kingiodendron pinnatum (3), Cullenia exarillata, Dysoxylum malabaricum and Ficus beddomei(2) and single nest each in Aglaia malabarica, Buchanania lanceolata, Ficus callosa, Lagerstroemia microcarpa,Lophopetalum wightianum and Syzygium cumini. Out of the four Malabar Pied Hornbill nests three were on Tetramelesnudiflora and one on T.bellirica. Nesting density is 0.14 nests/km2 and becomes 2.25/ km2 when comparing withactual forest area. The three hornbill species Great Hornbill, Malabar Pied Hornbill and Malabar Gray Hornbillfound to nest sympatrically in the Low elevation Riparian forest at Vazhachal.
About 80 per cent nests occur in primary moist forests. Analysis showed maximum density in the medium elevationprimary wet evergreen forests (sd=3.421) and least in secondary moist deciduous forests (sd=0.44). The principalcomponent analysis showed Great Hornbill nest density directly correlated with quality of the forests i.e. decreeswith disturbance and are more concentrated in the Riparian -streamside and Cliffs (85%) than which occur in plainsand slops (15%). The Malabar Pied Hornbill restricted only to the low elevation riparian forests (100-300m MSL).The strict low elevation riparian habitat preference of Malabar Pied Hornbill, the only occurrence here (Athirapillyñ Vazhachal) in southern Western Ghats agrees with others (Datta, 1998; Bachan, 2006; Mudappa and Raman,2009). This point out their restricted distribution, vulnerability and need for conservation against traditional huntingand also from the threat of local extinction with the proposed Athirapilly Hydro Electric Project. Affinity of theGreat Hornbills nesting sites towards the Riparian ñ streamside and cliffs may be due to: 1) distribution of largetrees in the riparian or streamside 2) removal of large suitable nest trees from other areas during past forestryoperations 3) Availability of more natural hollows in trees located in the riparian-streamside or cliffs due to windeffect and 4) may provide easy access for the hornbills to the canopy gaps.
REFERENCES
Kemp, A.C. 1995. The Hornbills. Oxford University Press, Oxford, England.Ramesh, B.R. and Rajan Gurukkal 2007. Forest Landscapes of the Southern Western Ghats, India. French Institute Pondichery.Bachan, A.K.H 2006. The Hornbill Haven. Sanctuary Asia 25(6): 46-49.Mudappa, D. and Raman, T.R.S. 2009. A conservation status survey of hornbills (Bucerotidae) in the Western Ghats, India. Indian Birds
5 (4): 90ñ102.Datta, A. 1998. Hornbill abundance in unlogged forest, selectively logged forest and a forest plantation in Arunachal Pradesh, India.
Oryx 32 : 285-294.Kannan, R. and James, D.A. 1998. Forest Management and the Conservation of the Great Hornbill (Buceros bicornis) in Southern
India. Poonswad, P. (Ed.) The Asian Hornbills: Ecology and Conservation. Thai Studies in Biodiversity No. 2: 1-336.Poonswad, P. and Kemp, A.C., (Eds). 1993. Manual to the conservation of Asian hornbills. Mahidol University, Bangkok: Hornbill
Project, Thailand.Jha, C.S., Dutt, C.B.S., and Bawa, K. S. 2000. Deforestation and land use changes in Western Ghats, India. Current Science 79: 231ñ
238.
Proceedings of 22nd Kerala Science Congress
589
Weed problems in High Ranges of Kerala
C. T. Joseph Paulson, Abraham and P. G. ShijuNational Invasive Weed Surveillance Programme, College of Horticulture, Kerala Agricultural University, Thrissur 680656Kerala
INTRODUCTION
The high ranges of Kerala is commonly known as Malanadu. Idukki and Wayanad districts come under high rangeareas of Kerala, with an altitude of more than 2500ft. above the mean sea level. Different levels of elevationpromote the growth of diverse weed flora. The high land region is having a comparatively cold climate. Theaverage annual rainfall in these districts varies from 250 to 400cms. Tea, Cardamom and Coffee are cultivated asmajor plantation crops. The weed flora of high range is different from the plains of Kerala.
MATERIALS AND METHODS
A survey was conducted under National Invasive Weed Surveillance Programme (ICAR) in high ranges of Kerala.Observations were taken randomly from cropped and non cropped areas at 10 KM intervals by travelling alongwith the main routes. In each spot, average species wise count of the weeds were recorded using an iron quadrate of1x1 M size. The dominance of the weed species was determined on the basis of average density, relative frequency,relative density and summed dominance ratio (SDR).
RESULTS AND CONCLUSION
In non cropped area 12 weed species have SDR value above 2 (Table 1). Among these Axonopus compressus (Sw.Beauv.) a grass was the most wide spread weed with highest SDR value. It is found as a major weed in the road sideof both Idukki and Wayanad districts. Synedrella nodiflora (L. Gaertn.) was the next dominant weed species.Density of Lantana camara L. is higher in high altitude areas, compared with lower areas. Tithonia diversifolia(Hemsl.) A. Gray and Lantana camara were found in almost all areas of high ranges, with different flower colour.Sida acuta Burm. F was mostly seen in Kharif and rabi seasons. Some weeds like Ageratum houstonianum Mill,Bidens pilosa L., Wedelia chinensis (Osbeck) Merr. and Tithonia diversifolia were typical of the high ranges.Crassocephalum crepidioides (Benth.) S. Moore was found in high humid areas. Infestation of Partheniumhysterophorus L., an alien weed causing allergic problems, was wide spread in Kumaly, Vandy Periyar and Marayur(Idukki Dist.) Muthanga and Tholpatti regions (Wayanad Dist.). Parthenium hysterophorus spread mainly throughgoods vehicle and cow dung brought for agricultural practices from other states.
Ageratina adenophora (Spreng.) King and Robins was only in higher altitude (√3000 ft. MSL) (Shiju et al., 2009)seen areas like Munnar, Devikulam etc where tea is the major crop. Chromolaena odorata, a related weed, isusually seen in lower elevations where Ageratina adenophora is not common. In Tea plantations Oxalis latifoliaHBK. and Drymaria cordata (L.) Willd. are the major weeds in Idukki district (Table 2). But in Wayanad districtErigeron canadensis was the most dominant weed. Drymaria cordata is always found in low temperature areas(Victor et al., 2008). Crassocephalum crepidioides, Bidens pilosa, and Ageratum houstonianum are equally commonin the Tea estates of both districts. Oplismenus burmannii (Retz.) P. Beauv was the major grass weed species inCoffee (Table 3) and Cardamom (Table 4). Mikania micrantha Kunth HBK cause damage by climbing over thecoffee plant. Some plants Balsam species (Impatiens spp.) are found in the moist area of the high ranges.
Climatic and soil conditions decode the weed flora and their distribution in high ranges. Several weed speciesbelonging to different families are seen in the agricultural ecosystem of high ranges.
Proceedings of 22nd Kerala Science Congress, 28-31 January 2010, KFRI, Peechi, pp. 589-590© KSCSTE 2010
08-44
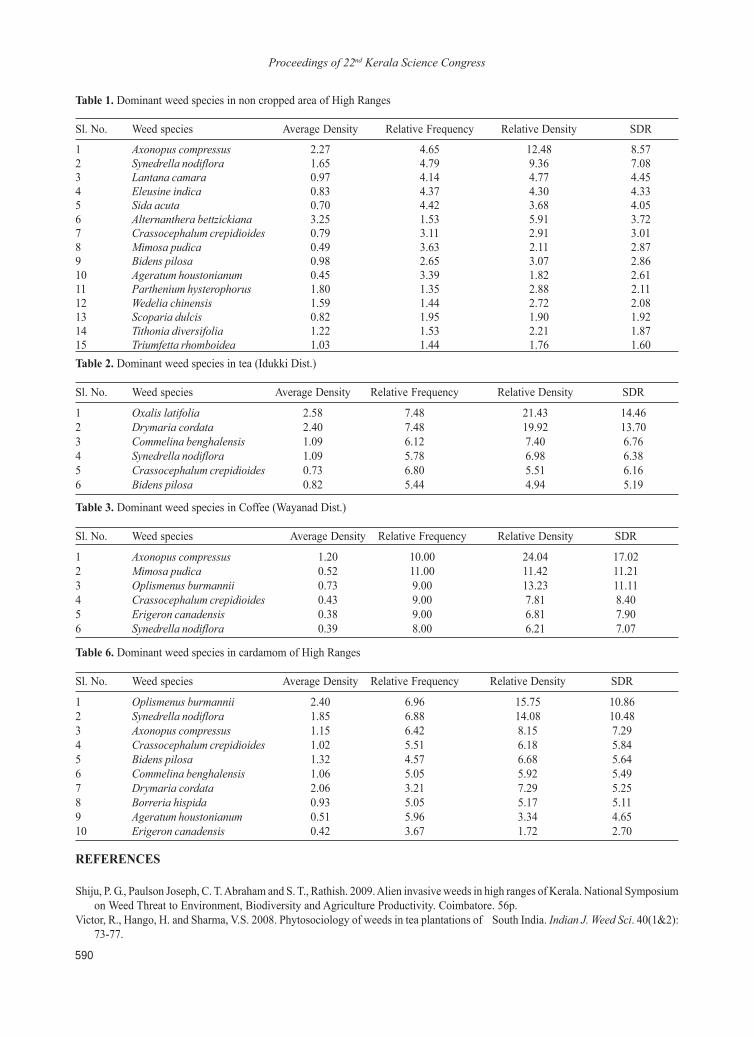
Proceedings of 22nd Kerala Science Congress
590
Table 6. Dominant weed species in cardamom of High Ranges
Sl. No. Weed species Average Density Relative Frequency Relative Density SDR
1 Oplismenus burmannii 2.40 6.96 15.75 10.862 Synedrella nodiflora 1.85 6.88 14.08 10.483 Axonopus compressus 1.15 6.42 8.15 7.294 Crassocephalum crepidioides 1.02 5.51 6.18 5.845 Bidens pilosa 1.32 4.57 6.68 5.646 Commelina benghalensis 1.06 5.05 5.92 5.497 Drymaria cordata 2.06 3.21 7.29 5.258 Borreria hispida 0.93 5.05 5.17 5.119 Ageratum houstonianum 0.51 5.96 3.34 4.6510 Erigeron canadensis 0.42 3.67 1.72 2.70
REFERENCES
Shiju, P. G., Paulson Joseph, C. T. Abraham and S. T., Rathish. 2009. Alien invasive weeds in high ranges of Kerala. National Symposiumon Weed Threat to Environment, Biodiversity and Agriculture Productivity. Coimbatore. 56p.
Victor, R., Hango, H. and Sharma, V.S. 2008. Phytosociology of weeds in tea plantations of South India. Indian J. Weed Sci. 40(1&2):73-77.
Table 2. Dominant weed species in tea (Idukki Dist.)
Sl. No. Weed species Average Density Relative Frequency Relative Density SDR
1 Oxalis latifolia 2.58 7.48 21.43 14.462 Drymaria cordata 2.40 7.48 19.92 13.703 Commelina benghalensis 1.09 6.12 7.40 6.764 Synedrella nodiflora 1.09 5.78 6.98 6.385 Crassocephalum crepidioides 0.73 6.80 5.51 6.166 Bidens pilosa 0.82 5.44 4.94 5.19
Table 3. Dominant weed species in Coffee (Wayanad Dist.)
Sl. No. Weed species Average Density Relative Frequency Relative Density SDR
1 Axonopus compressus 1.20 10.00 24.04 17.022 Mimosa pudica 0.52 11.00 11.42 11.213 Oplismenus burmannii 0.73 9.00 13.23 11.114 Crassocephalum crepidioides 0.43 9.00 7.81 8.405 Erigeron canadensis 0.38 9.00 6.81 7.906 Synedrella nodiflora 0.39 8.00 6.21 7.07
Table 1. Dominant weed species in non cropped area of High Ranges
Sl. No. Weed species Average Density Relative Frequency Relative Density SDR
1 Axonopus compressus 2.27 4.65 12.48 8.572 Synedrella nodiflora 1.65 4.79 9.36 7.083 Lantana camara 0.97 4.14 4.77 4.454 Eleusine indica 0.83 4.37 4.30 4.335 Sida acuta 0.70 4.42 3.68 4.056 Alternanthera bettzickiana 3.25 1.53 5.91 3.727 Crassocephalum crepidioides 0.79 3.11 2.91 3.018 Mimosa pudica 0.49 3.63 2.11 2.879 Bidens pilosa 0.98 2.65 3.07 2.8610 Ageratum houstonianum 0.45 3.39 1.82 2.6111 Parthenium hysterophorus 1.80 1.35 2.88 2.1112 Wedelia chinensis 1.59 1.44 2.72 2.0813 Scoparia dulcis 0.82 1.95 1.90 1.9214 Tithonia diversifolia 1.22 1.53 2.21 1.8715 Triumfetta rhomboidea 1.03 1.44 1.76 1.60
Proceedings of 22nd Kerala Science Congress
591
New alien invasive weeds in Kerala
T. P. Ramya, C. T. Abraham and S. T. RathishNational Invasive Weeds Surveillance Programme, DWSR, Kerala Agricultural University, Thrissur 680 656 Kerala
INTRODUCTION
Weeds are plants that are undesirable to human activity at a particular time and place. Weeds will always beassociated with human endeavours. Weeds are not only a problem to agriculture but also a great nuisance in forestry,pastures and grasslands, wastelands, public amenity areas, aquatic bodies etc. They also affect biodiversity,environment and health of humans and livestock. Currently the country is losing about Rs. 1000 billion per annumin food production on account of competition due to weeds (Varshney and Babu, 2008).
In Kerala the serious infestation of several alien weeds such as Chromoleana odorata, Mikania micrantha, Mimosainvisa, Mimosa pudica, Merrremia vitifolia, Lantana camara, Parthenium hysterophorus and Axonopus compressuswere already reported by Abraham et al. (2009). Several new alien weeds are also seen spreading in the terrestrialeco system of Kerala. Under the National Invasive Weeds Surveillance Programme a detailed survey was conductedto understand the spread of alien weeds in Kerala.
MATERIALS AND METHODS
A survey was conducted under the National Invasive Weeds Surveillance Programme (ICAR), during Kharif 2008ñ 09, to study the weed flora of Kerala in different ecosystems (cropped, non cropped and garbage areas). Suitableroute maps were prepared for each district by the Surveillance Inspectors (SIs) working under the programme forcovering different parts of the state in the survey. The SIs surveyed spots at every 10 kms in the survey route,covering approximately 100 km/day. At each place 10 non cropped, 10 cropped and 10 garbage areas were surveyedfor the presence of weeds. The observations were taken using quadrats of 1m ◊ 1m size. The data obtained weretabulated and compared with the reports of earlier survey to understand the shifts/additions of the flora. Details onthe new alien weeds spreading in the state are presented in the paper.
RESULTS AND CONCLUSION
Under the survey conducted by National Invasive Weeds Surveillance Programme during Kharif 2008 ñ 09, severalnew aliens weeds are seen spreading in the terrestrial eco system of Kerala. They are given in the Table 1. Amongthis, Hyptis capitata is a major weed of concern in Idukki, Kasargod, Pathanamthitta and Kannur districts. Theinfestation of this weed is found in non cropped areas, coconut gardens, arecanut and young rubber. Alternantherabrasiliana is a shade loving plant mostly invading the non cropped areas. It is seen spreading in all the districts ofKerala, especially in the Kollam and Idukki districts. Crassocephalum crepidioides is a already a common weed ofhigh ranges of Kerala. It is a major weed of tea and coffee gardens. Now it is spreading in lower elevation areas inthe plans. Croton hirtus is a major weed of non cropped areas in Alleppey, Kollam, Trivandrum, Palghat andThrissur districts. It is mostly found in sandy soils of Kerala. Sesamum radiatum is mainly found in non croppedand garbage areas of Alleppey, Kollam, Trivandrum and Kasargod. Melochia corchorifolia, used for fibre, is usuallyseen as a major weed in rice fields of Kollam, during the first crop season. It is also a serious menace in thesesamum crop during the summer season. Tithonia diversifolia is a major weed of non cropped areas of high rangesof Kerala, now is spreading to the lower plains. Spilanthes radicans is spreading in Palghat, Wayanad, Idukki andTrivandrum. Indigofera astragalina (hirsuta) is found to be a major weed of non cropped areas of Alleppey and
Proceedings of 22nd Kerala Science Congress, 28-31 January 2010, KFRI, Peechi, pp. 591-592© KSCSTE 2010
08-45
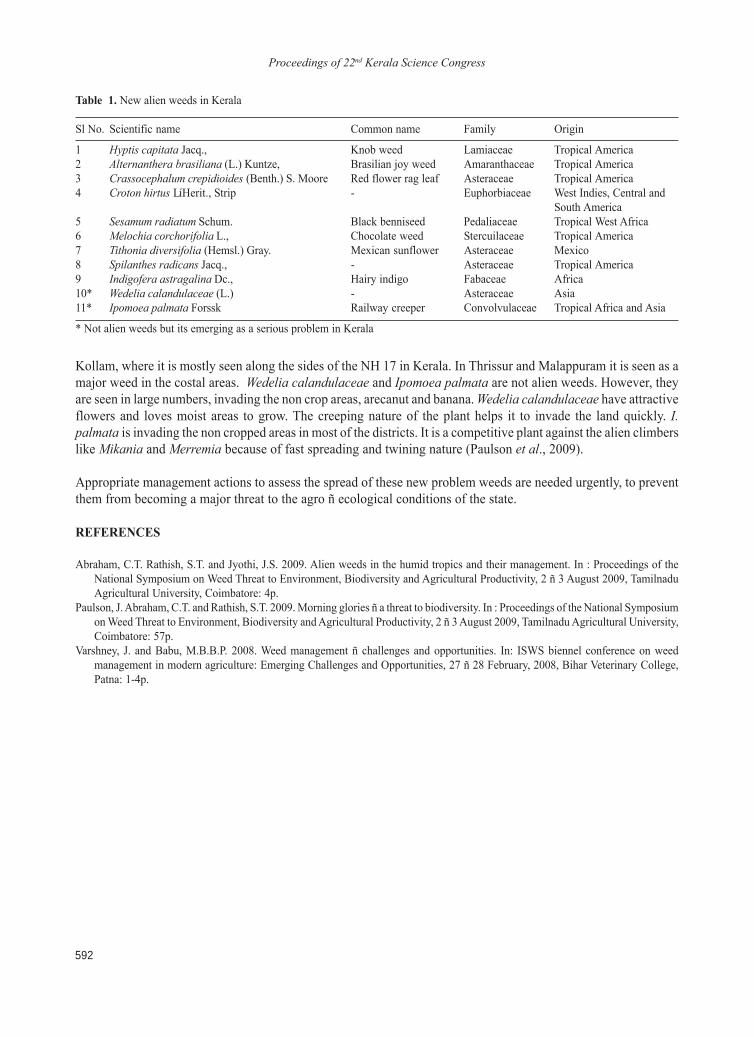
Proceedings of 22nd Kerala Science Congress
592
Kollam, where it is mostly seen along the sides of the NH 17 in Kerala. In Thrissur and Malappuram it is seen as amajor weed in the costal areas. Wedelia calandulaceae and Ipomoea palmata are not alien weeds. However, theyare seen in large numbers, invading the non crop areas, arecanut and banana. Wedelia calandulaceae have attractiveflowers and loves moist areas to grow. The creeping nature of the plant helps it to invade the land quickly. I.palmata is invading the non cropped areas in most of the districts. It is a competitive plant against the alien climberslike Mikania and Merremia because of fast spreading and twining nature (Paulson et al., 2009).
Appropriate management actions to assess the spread of these new problem weeds are needed urgently, to preventthem from becoming a major threat to the agro ñ ecological conditions of the state.
REFERENCES
Abraham, C.T. Rathish, S.T. and Jyothi, J.S. 2009. Alien weeds in the humid tropics and their management. In : Proceedings of theNational Symposium on Weed Threat to Environment, Biodiversity and Agricultural Productivity, 2 ñ 3 August 2009, TamilnaduAgricultural University, Coimbatore: 4p.
Paulson, J. Abraham, C.T. and Rathish, S.T. 2009. Morning glories ñ a threat to biodiversity. In : Proceedings of the National Symposiumon Weed Threat to Environment, Biodiversity and Agricultural Productivity, 2 ñ 3 August 2009, Tamilnadu Agricultural University,Coimbatore: 57p.
Varshney, J. and Babu, M.B.B.P. 2008. Weed management ñ challenges and opportunities. In: ISWS biennel conference on weedmanagement in modern agriculture: Emerging Challenges and Opportunities, 27 ñ 28 February, 2008, Bihar Veterinary College,Patna: 1-4p.
Table 1. New alien weeds in Kerala
Sl No. Scientific name Common name Family Origin
1 Hyptis capitata Jacq., Knob weed Lamiaceae Tropical America2 Alternanthera brasiliana (L.) Kuntze, Brasilian joy weed Amaranthaceae Tropical America3 Crassocephalum crepidioides (Benth.) S. Moore Red flower rag leaf Asteraceae Tropical America4 Croton hirtus LíHerit., Strip - Euphorbiaceae West Indies, Central and
South America5 Sesamum radiatum Schum. Black benniseed Pedaliaceae Tropical West Africa6 Melochia corchorifolia L., Chocolate weed Stercuilaceae Tropical America7 Tithonia diversifolia (Hemsl.) Gray. Mexican sunflower Asteraceae Mexico8 Spilanthes radicans Jacq., - Asteraceae Tropical America9 Indigofera astragalina Dc., Hairy indigo Fabaceae Africa10* Wedelia calandulaceae (L.) - Asteraceae Asia11* Ipomoea palmata Forssk Railway creeper Convolvulaceae Tropical Africa and Asia
* Not alien weeds but its emerging as a serious problem in Kerala
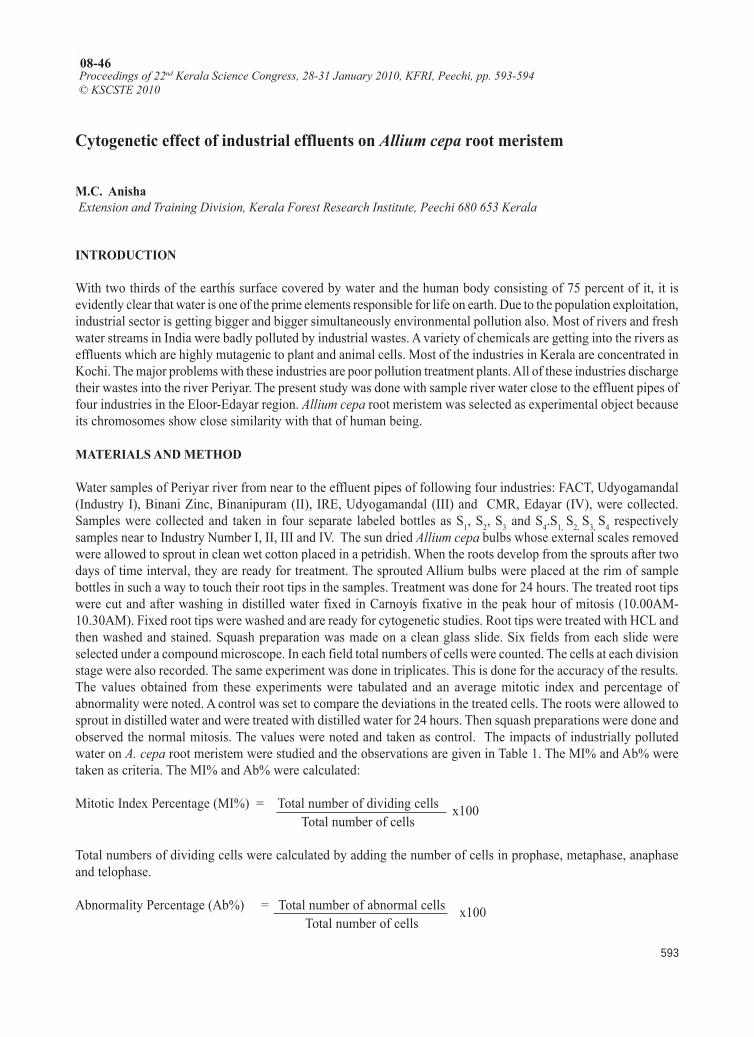
Proceedings of 22nd Kerala Science Congress
593
Cytogenetic effect of industrial effluents on Allium cepa root meristem
M.C. Anisha Extension and Training Division, Kerala Forest Research Institute, Peechi 680 653 Kerala
INTRODUCTION
With two thirds of the earthís surface covered by water and the human body consisting of 75 percent of it, it isevidently clear that water is one of the prime elements responsible for life on earth. Due to the population exploitation,industrial sector is getting bigger and bigger simultaneously environmental pollution also. Most of rivers and freshwater streams in India were badly polluted by industrial wastes. A variety of chemicals are getting into the rivers aseffluents which are highly mutagenic to plant and animal cells. Most of the industries in Kerala are concentrated inKochi. The major problems with these industries are poor pollution treatment plants. All of these industries dischargetheir wastes into the river Periyar. The present study was done with sample river water close to the effluent pipes offour industries in the Eloor-Edayar region. Allium cepa root meristem was selected as experimental object becauseits chromosomes show close similarity with that of human being.
MATERIALS AND METHOD
Water samples of Periyar river from near to the effluent pipes of following four industries: FACT, Udyogamandal(Industry I), Binani Zinc, Binanipuram (II), IRE, Udyogamandal (III) and CMR, Edayar (IV), were collected.Samples were collected and taken in four separate labeled bottles as S1, S2, S3 and S4.S1, S2, S3, S4 respectivelysamples near to Industry Number I, II, III and IV. The sun dried Allium cepa bulbs whose external scales removedwere allowed to sprout in clean wet cotton placed in a petridish. When the roots develop from the sprouts after twodays of time interval, they are ready for treatment. The sprouted Allium bulbs were placed at the rim of samplebottles in such a way to touch their root tips in the samples. Treatment was done for 24 hours. The treated root tipswere cut and after washing in distilled water fixed in Carnoyís fixative in the peak hour of mitosis (10.00AM-10.30AM). Fixed root tips were washed and are ready for cytogenetic studies. Root tips were treated with HCL andthen washed and stained. Squash preparation was made on a clean glass slide. Six fields from each slide wereselected under a compound microscope. In each field total numbers of cells were counted. The cells at each divisionstage were also recorded. The same experiment was done in triplicates. This is done for the accuracy of the results.The values obtained from these experiments were tabulated and an average mitotic index and percentage ofabnormality were noted. A control was set to compare the deviations in the treated cells. The roots were allowed tosprout in distilled water and were treated with distilled water for 24 hours. Then squash preparations were done andobserved the normal mitosis. The values were noted and taken as control. The impacts of industrially pollutedwater on A. cepa root meristem were studied and the observations are given in Table 1. The MI% and Ab% weretaken as criteria. The MI% and Ab% were calculated:
Mitotic Index Percentage (MI%) = Total number of dividing cells x100Total number of cells
Total numbers of dividing cells were calculated by adding the number of cells in prophase, metaphase, anaphaseand telophase.
Abnormality Percentage (Ab%) = Total number of abnormal cells x100Total number of cells
Proceedings of 22nd Kerala Science Congress, 28-31 January 2010, KFRI, Peechi, pp. 593-594© KSCSTE 2010
08-46
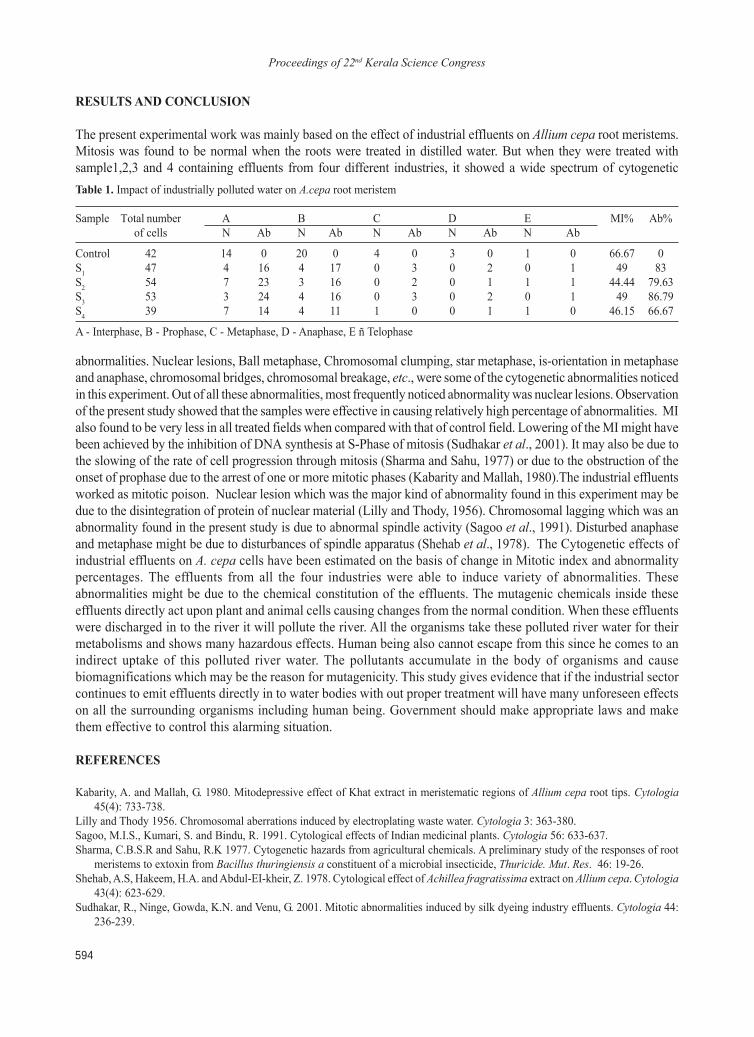
Proceedings of 22nd Kerala Science Congress
594
RESULTS AND CONCLUSION
The present experimental work was mainly based on the effect of industrial effluents on Allium cepa root meristems.Mitosis was found to be normal when the roots were treated in distilled water. But when they were treated withsample1,2,3 and 4 containing effluents from four different industries, it showed a wide spectrum of cytogeneticTable 1. Impact of industrially polluted water on A.cepa root meristem
Sample Total number A B C D E MI% Ab%of cells N Ab N Ab N Ab N Ab N Ab
Control 42 14 0 20 0 4 0 3 0 1 0 66.67 0S1 47 4 16 4 17 0 3 0 2 0 1 49 83S2 54 7 23 3 16 0 2 0 1 1 1 44.44 79.63S3 53 3 24 4 16 0 3 0 2 0 1 49 86.79S4 39 7 14 4 11 1 0 0 1 1 0 46.15 66.67
A - Interphase, B - Prophase, C - Metaphase, D - Anaphase, E ñ Telophase
abnormalities. Nuclear lesions, Ball metaphase, Chromosomal clumping, star metaphase, is-orientation in metaphaseand anaphase, chromosomal bridges, chromosomal breakage, etc., were some of the cytogenetic abnormalities noticedin this experiment. Out of all these abnormalities, most frequently noticed abnormality was nuclear lesions. Observationof the present study showed that the samples were effective in causing relatively high percentage of abnormalities. MIalso found to be very less in all treated fields when compared with that of control field. Lowering of the MI might havebeen achieved by the inhibition of DNA synthesis at S-Phase of mitosis (Sudhakar et al., 2001). It may also be due tothe slowing of the rate of cell progression through mitosis (Sharma and Sahu, 1977) or due to the obstruction of theonset of prophase due to the arrest of one or more mitotic phases (Kabarity and Mallah, 1980).The industrial effluentsworked as mitotic poison. Nuclear lesion which was the major kind of abnormality found in this experiment may bedue to the disintegration of protein of nuclear material (Lilly and Thody, 1956). Chromosomal lagging which was anabnormality found in the present study is due to abnormal spindle activity (Sagoo et al., 1991). Disturbed anaphaseand metaphase might be due to disturbances of spindle apparatus (Shehab et al., 1978). The Cytogenetic effects ofindustrial effluents on A. cepa cells have been estimated on the basis of change in Mitotic index and abnormalitypercentages. The effluents from all the four industries were able to induce variety of abnormalities. Theseabnormalities might be due to the chemical constitution of the effluents. The mutagenic chemicals inside theseeffluents directly act upon plant and animal cells causing changes from the normal condition. When these effluentswere discharged in to the river it will pollute the river. All the organisms take these polluted river water for theirmetabolisms and shows many hazardous effects. Human being also cannot escape from this since he comes to anindirect uptake of this polluted river water. The pollutants accumulate in the body of organisms and causebiomagnifications which may be the reason for mutagenicity. This study gives evidence that if the industrial sectorcontinues to emit effluents directly in to water bodies with out proper treatment will have many unforeseen effectson all the surrounding organisms including human being. Government should make appropriate laws and makethem effective to control this alarming situation.
REFERENCES
Kabarity, A. and Mallah, G. 1980. Mitodepressive effect of Khat extract in meristematic regions of Allium cepa root tips. Cytologia45(4): 733-738.
Lilly and Thody 1956. Chromosomal aberrations induced by electroplating waste water. Cytologia 3: 363-380.Sagoo, M.I.S., Kumari, S. and Bindu, R. 1991. Cytological effects of Indian medicinal plants. Cytologia 56: 633-637.Sharma, C.B.S.R and Sahu, R.K 1977. Cytogenetic hazards from agricultural chemicals. A preliminary study of the responses of root
meristems to extoxin from Bacillus thuringiensis a constituent of a microbial insecticide, Thuricide. Mut. Res. 46: 19-26.Shehab, A.S, Hakeem, H.A. and Abdul-EI-kheir, Z. 1978. Cytological effect of Achillea fragratissima extract on Allium cepa. Cytologia
43(4): 623-629.Sudhakar, R., Ninge, Gowda, K.N. and Venu, G. 2001. Mitotic abnormalities induced by silk dyeing industry effluents. Cytologia 44:
236-239.
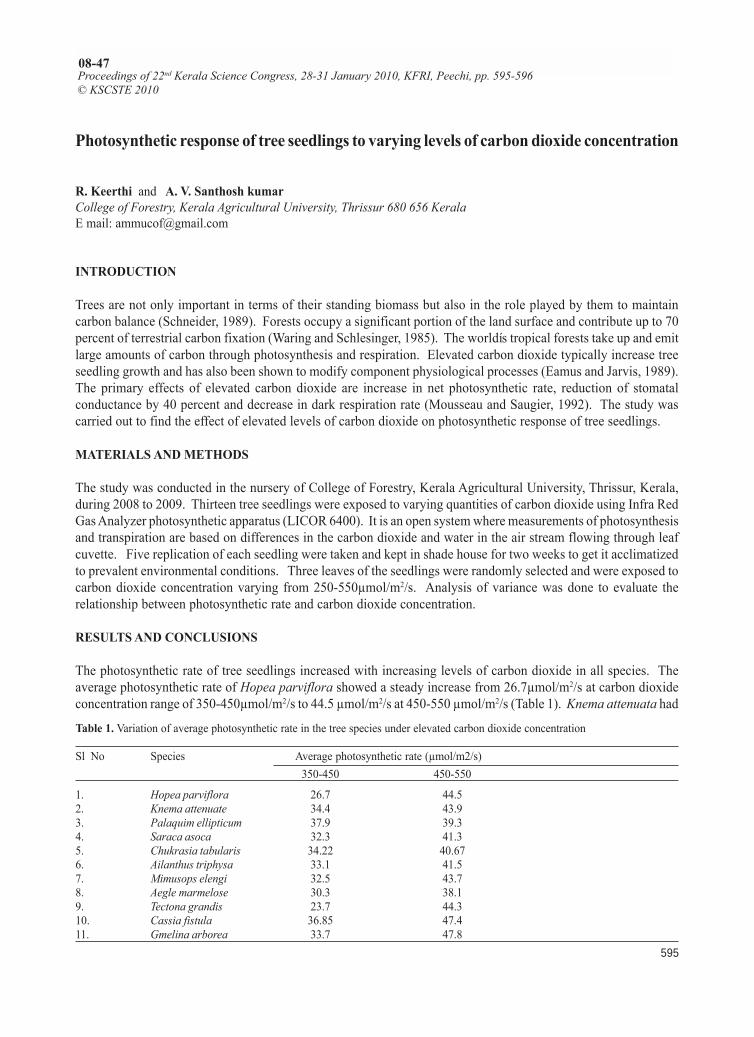
Proceedings of 22nd Kerala Science Congress
595
Photosynthetic response of tree seedlings to varying levels of carbon dioxide concentration
R. Keerthi and A. V. Santhosh kumarCollege of Forestry, Kerala Agricultural University, Thrissur 680 656 KeralaE mail: [email protected]
INTRODUCTION
Trees are not only important in terms of their standing biomass but also in the role played by them to maintaincarbon balance (Schneider, 1989). Forests occupy a significant portion of the land surface and contribute up to 70percent of terrestrial carbon fixation (Waring and Schlesinger, 1985). The worldís tropical forests take up and emitlarge amounts of carbon through photosynthesis and respiration. Elevated carbon dioxide typically increase treeseedling growth and has also been shown to modify component physiological processes (Eamus and Jarvis, 1989).The primary effects of elevated carbon dioxide are increase in net photosynthetic rate, reduction of stomatalconductance by 40 percent and decrease in dark respiration rate (Mousseau and Saugier, 1992). The study wascarried out to find the effect of elevated levels of carbon dioxide on photosynthetic response of tree seedlings.
MATERIALS AND METHODS
The study was conducted in the nursery of College of Forestry, Kerala Agricultural University, Thrissur, Kerala,during 2008 to 2009. Thirteen tree seedlings were exposed to varying quantities of carbon dioxide using Infra RedGas Analyzer photosynthetic apparatus (LICOR 6400). It is an open system where measurements of photosynthesisand transpiration are based on differences in the carbon dioxide and water in the air stream flowing through leafcuvette. Five replication of each seedling were taken and kept in shade house for two weeks to get it acclimatizedto prevalent environmental conditions. Three leaves of the seedlings were randomly selected and were exposed tocarbon dioxide concentration varying from 250-550µmol/m2/s. Analysis of variance was done to evaluate therelationship between photosynthetic rate and carbon dioxide concentration.
RESULTS AND CONCLUSIONS
The photosynthetic rate of tree seedlings increased with increasing levels of carbon dioxide in all species. Theaverage photosynthetic rate of Hopea parviflora showed a steady increase from 26.7µmol/m2/s at carbon dioxideconcentration range of 350-450µmol/m2/s to 44.5 µmol/m2/s at 450-550 µmol/m2/s (Table 1). Knema attenuata had
Proceedings of 22nd Kerala Science Congress, 28-31 January 2010, KFRI, Peechi, pp. 595-596© KSCSTE 2010
08-47
Table 1. Variation of average photosynthetic rate in the tree species under elevated carbon dioxide concentration
Sl No Species Average photosynthetic rate (µmol/m2/s)350-450 450-550
1. Hopea parviflora 26.7 44.52. Knema attenuate 34.4 43.93. Palaquim ellipticum 37.9 39.34. Saraca asoca 32.3 41.35. Chukrasia tabularis 34.22 40.676. Ailanthus triphysa 33.1 41.57. Mimusops elengi 32.5 43.78. Aegle marmelose 30.3 38.19. Tectona grandis 23.7 44.310. Cassia fistula 36.85 47.411. Gmelina arborea 33.7 47.8
Proceedings of 22nd Kerala Science Congress
596
an average photosynthetic rate of 43.9 µmol/m2/s. From table 1 it is evident that all the species exhibits an enhancedaverage photosynthetic rate at elevated levels of carbon dioxide concentration (450-550 µmol/m2/s). Regressionanalysis showed that Teak had lowest photosynthetic rate at lower levels of carbon dioxide concentration andhighest rate of increase in photosynthetic rate with increase in carbon dioxide concentration. Analysis of variancetest showed significant difference between various species under observation.
REFERENCES
Eamus, D. and Jarvis, P.G. 1989. The direct effects of increase in global atmospheric CO2 concentration on natural and commercialtemperate trees and forests. Adv. Ecol. Res. 19:1-55.
Mousseau, M. and Saugier, B. 1992. Direct effect of increased CO2 on gas exchange and growth of forest tree species. J. Expt. Bot. 43:1121-1136.
Schneider, S.H. 1989. The changing climate. Scientific American 1989: 70-79.Waring, R.H. and Schlesinger, W.H. 1985. Forest ecosystems: Concepts and Management. Orlando, USA, Academic Press.
Proceedings of 22nd Kerala Science Congress
597
Effect of variation in clump density on the performance of reed bamboo (Ochlandratravancorica Benth.)
V. P. Raveendran*, C. M. Jijeesh and K. K. SeethalakshmiKerala Forest Research Institute, Peechi 680 653 Thrissur, Kerala
INTRODUCTION
Ochlandra travancorica Benth. is a shrubby reed bamboo species endemic to Western Ghats, naturally distributedin the evergreen and semi-evergreen forests of Kerala. It is an integral part of rural economy of Kerala form timeimmemorial. O. travancorica is used for mat and basket making, fishing rods, handicrafts etc. It is an ideal rawmaterial for paper making, bambooply and weaving. Due to its divergent uses it is identified as one of the priorityspecies for large scale cultivation in India by National Mission on Bamboo Applications. Generally, clump density(clumps per unit area) influences the growth and yield of the bamboos as it alters the available growing space.Hence, the present study was sought to investigate the effect of spacing on the growth attributes of O. travancorica.
MATERIAL AND METHODS
The present study was conducted at Dhoni farm in Plaakkad district of Kerala. The O. travancorica seeds werecollected from Neriamangalam in Idukki during May 2005, brought in to nursery and germinated on standardnursery beds. Three weeks after germination, the seedlings were polypotted in a medium containing soil, sand andcow dung in the ratio 3:1:1 and kept in the nursery for one year. The seedlings were planted in the field in pits of 45cm x45 cm x 45 cm during June 2006 and a basal dose of FYM (10 kg), neem cake (1 kg), P (25 g) and K (50 g) wasgiven. The different planting density adopted were 400 (5x5 m), 204 (7x7 m) 122 (9x9m), 247 (9x4.5m), 329(9x4.5x4.5 m) and 476 (9x5x3 m) plants per hectare. Each treatment was replicated thrice and 16 plants constitutedone replication.The growth observations were recorded after six month of planting and there after every year.
RESULTS AND CONCLUSION
In general the variation clump density influenced the growth of the O. travancorica seedlings and those planted ata wider spacing showed a better growth (Fig. 1-5). At the end of the observation period (3.5 years), the seedlingsplanted at a spacing of 9x9 m (clump density = 122 plants per ha) produced the largest number of culms per clump(62), culm height (415.5 cm), collar diameter (7.11 cm), number of internodes (7) and internodal length (51.3 cm).Meanwhile, lowest number of culms (26) per clump was obtained for the spacing 9x5x3 m (476 plants per ha). Patiland Patil (1990) had obtained a higher number of culms and growth for closely spaced D. strictus seedlingscontradicting the present results. This might be due to the fact that at a wider spacing, O. travancorica new shootsutilize the maximum growing space and resources available to them and establish easily leading to the maximumsurvival in the field. However, on a per hectare basis, the plants spaced at 9x4.5x4.5 m gave the maximum numberof culms (18, 973) followed by 5x5 m (18, 652) and the least number of culms were obtained for spacing 9x9 m (7,509). Statistical analysis of the data revealed the significant differences due to time of observation and spacing(P=0.01) and the interaction effects of spacing and time of observation also was significant (P=0.05). In summary,from the three years observations on growth of the O. travancoria, it can be concluded that the seedlings spaced at9x4.5x4.5 m and 5x5 m produces the highest number of culms and thereby the maximum yield (Fig. 6). However,the observations are to be continued till the extraction stage (7 years) of the bamboo to find out the changesassociated with canopy closure to recommend optimum spacing for large scale plantation of O. travancoria.
Proceedings of 22nd Kerala Science Congress, 28-31 January 2010, KFRI, Peechi, pp. 597-598© KSCSTE 2010
08-48
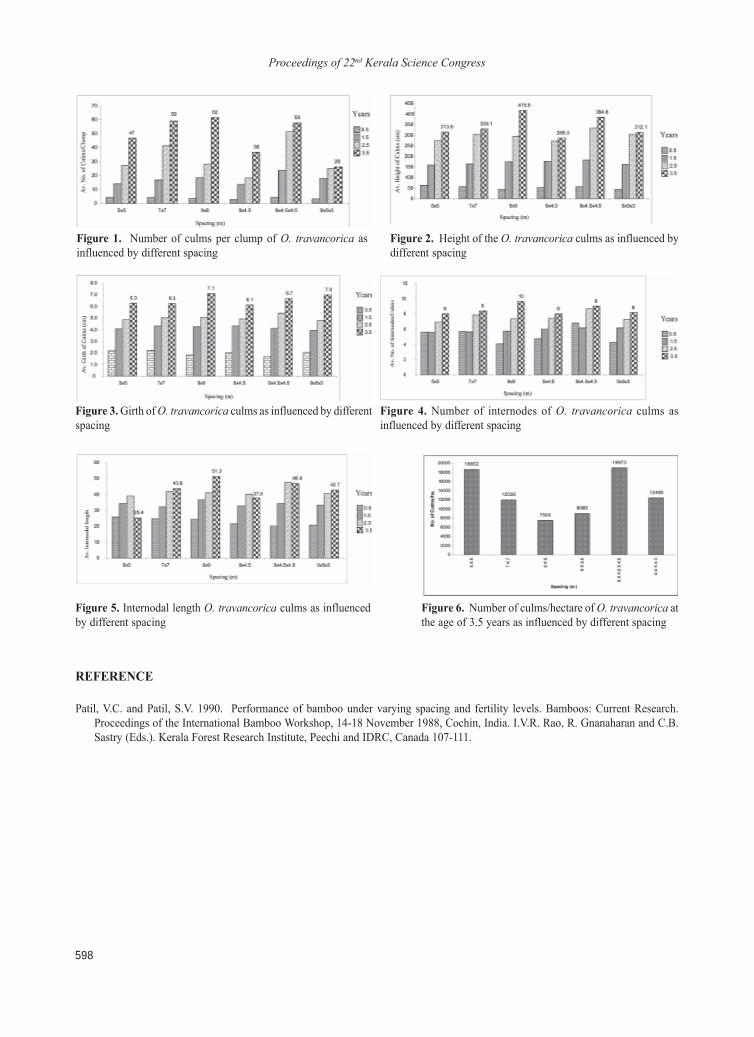
Proceedings of 22nd Kerala Science Congress
598
Figure 1. Number of culms per clump of O. travancorica asinfluenced by different spacing
Figure 2. Height of the O. travancorica culms as influenced bydifferent spacing
Figure 3. Girth of O. travancorica culms as influenced by differentspacing
Figure 4. Number of internodes of O. travancorica culms asinfluenced by different spacing
Figure 5. Internodal length O. travancorica culms as influencedby different spacing
Figure 6. Number of culms/hectare of O. travancorica atthe age of 3.5 years as influenced by different spacing
REFERENCE
Patil, V.C. and Patil, S.V. 1990. Performance of bamboo under varying spacing and fertility levels. Bamboos: Current Research.Proceedings of the International Bamboo Workshop, 14-18 November 1988, Cochin, India. I.V.R. Rao, R. Gnanaharan and C.B.Sastry (Eds.). Kerala Forest Research Institute, Peechi and IDRC, Canada 107-111.
Proceedings of 22nd Kerala Science Congress
599
Conservation of Terminalia travancorensis - a rare, endangered and threatened (RET)tree species
P. K. Chandrasekhara Pillai and S. SubinKerala Forest Research Institute, Peechi 680 653 Thrissur, Kerala
INTRODUCTION
The Western Ghats of India is one of the hot spots of plant diversity and endemism. The Kerala part of it (Latitude 10∞00' N Longitude 76∞ 25' E) is well known for endemism and diversity. Terminalias belonging to the family Combretaceaeis a prominent species in the moist deciduous forests of Western Ghats. Twelve species of terminalias are found inKerala, ten of them in the natural forests and two grown in gardens as exotics. Terminalia travancorensis Wt. and Arn.is the only evergreen species among terminalias, that has been listed as a Rare, Endangered and Threatened (RET)species. It grows to a height of 35 m with large canopy and buttress and is seen in the wet-evergreen forests of Keralaranging from 100 to 1000 m altitude. Considering the importance of this species, an extensive survey was undertakenthrough out Kerala to assess its regeneration status and to standardize the propagation techniques.
MATERIALS AND METHODS
The study was conducted in the Kerala part of Western Ghats covering all the Forest Ranges. A total of 211 temporaryplots were randomly laid out to study the details on regeneration status of the species. Seeds and shoot cuttingswere collected from the trees for germination and vegetative propagation studies. Germination and vegetativepropagation trials were conducted at the central nursery, Kerala Forest Research Institute, Peechi, Thrissur. Themature fruits were collected from trees as well as ground during January 2008. The seeds were subjected to threedifferent pre-treatments viz. weathering (alternate wetting and drying for seven days - T1), splitting (decoated-T2)and de-pulping (T3). After the pre-treatments hundred seeds each were sown in trays containing vermiculate asfour replicates. A control (T0) with out any pre-treatment was also maintained. Daily observations on shoot height,collar diameter, number of leaves were recorded up to 60 days. The seedlings were potted in poly bags (10 cm x 20cm) filled with soil, sand and farmyard manure in the ratio 2:1:1. The growth parameters of seedlings were recordedat 15 days intervals. The growth data were subjected to Analysis of variance.
Mature stem cuttings, freshly collected from the trees failed to sprout in the mist chamber and hence single noddedjuvenile shoot cuttings of 5 to 6 cm length and 2 to 4 mm diameter were prepared from the established seedlingsraised in the nursery and were used for vegetative propagation. The leaf area was minimized to avoid excesstranspiration, the cuttings were treated with bavistine solution (1%) for 5 minutes and then treated with 5000 (T1),6000 (T2), 7000 (T3) and 8000 (T4) ppm of Indole-3-butyric acid (IBA) and kinetin in very low combinationsprepared in talc. The conventional quick dip method was followed for the application of hormone. The treatedcuttings were potted in root trainers filled with vermiculite moistened with water and kept in the mist chamber. Aset of control (T0) was also maintained. Twenty-four fresh Juvenile shoot cuttings were used for each treatment.Rooting initiation was observed from the seventh day of potting. The cuttings were carefully removed from therooting medium on 25th day and the numbers of roots, their maximum and minimum length were recorded. The datawas subjected to ANOVA for statistical analysis.
RESULTS AND CONCLUSIONS
The study confirmed that density of T. travancorensis in the natural forests is only 0.54 ha-1 and its natural regeneration
Proceedings of 22nd Kerala Science Congress, 28-31 January 2010, KFRI, Peechi, pp. 599-600© KSCSTE 2010
08-49
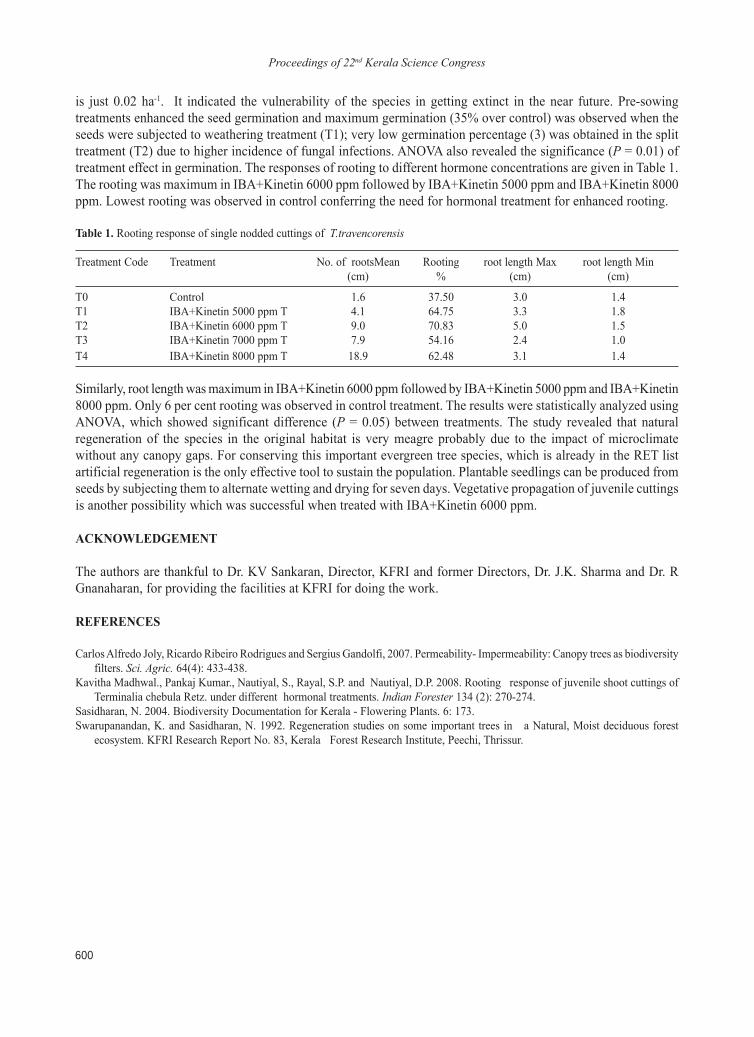
Proceedings of 22nd Kerala Science Congress
600
is just 0.02 ha-1. It indicated the vulnerability of the species in getting extinct in the near future. Pre-sowingtreatments enhanced the seed germination and maximum germination (35% over control) was observed when theseeds were subjected to weathering treatment (T1); very low germination percentage (3) was obtained in the splittreatment (T2) due to higher incidence of fungal infections. ANOVA also revealed the significance (P = 0.01) oftreatment effect in germination. The responses of rooting to different hormone concentrations are given in Table 1.The rooting was maximum in IBA+Kinetin 6000 ppm followed by IBA+Kinetin 5000 ppm and IBA+Kinetin 8000ppm. Lowest rooting was observed in control conferring the need for hormonal treatment for enhanced rooting.
Table 1. Rooting response of single nodded cuttings of T.travencorensis
Treatment Code Treatment No. of rootsMean Rooting root length Max root length Min(cm) % (cm) (cm)
T0 Control 1.6 37.50 3.0 1.4T1 IBA+Kinetin 5000 ppm T 4.1 64.75 3.3 1.8T2 IBA+Kinetin 6000 ppm T 9.0 70.83 5.0 1.5T3 IBA+Kinetin 7000 ppm T 7.9 54.16 2.4 1.0T4 IBA+Kinetin 8000 ppm T 18.9 62.48 3.1 1.4
Similarly, root length was maximum in IBA+Kinetin 6000 ppm followed by IBA+Kinetin 5000 ppm and IBA+Kinetin8000 ppm. Only 6 per cent rooting was observed in control treatment. The results were statistically analyzed usingANOVA, which showed significant difference (P = 0.05) between treatments. The study revealed that naturalregeneration of the species in the original habitat is very meagre probably due to the impact of microclimatewithout any canopy gaps. For conserving this important evergreen tree species, which is already in the RET listartificial regeneration is the only effective tool to sustain the population. Plantable seedlings can be produced fromseeds by subjecting them to alternate wetting and drying for seven days. Vegetative propagation of juvenile cuttingsis another possibility which was successful when treated with IBA+Kinetin 6000 ppm.
ACKNOWLEDGEMENT
The authors are thankful to Dr. KV Sankaran, Director, KFRI and former Directors, Dr. J.K. Sharma and Dr. RGnanaharan, for providing the facilities at KFRI for doing the work.
REFERENCES
Carlos Alfredo Joly, Ricardo Ribeiro Rodrigues and Sergius Gandolfi, 2007. Permeability- Impermeability: Canopy trees as biodiversityfilters. Sci. Agric. 64(4): 433-438.
Kavitha Madhwal., Pankaj Kumar., Nautiyal, S., Rayal, S.P. and Nautiyal, D.P. 2008. Rooting response of juvenile shoot cuttings ofTerminalia chebula Retz. under different hormonal treatments. Indian Forester 134 (2): 270-274.
Sasidharan, N. 2004. Biodiversity Documentation for Kerala - Flowering Plants. 6: 173.Swarupanandan, K. and Sasidharan, N. 1992. Regeneration studies on some important trees in a Natural, Moist deciduous forest
ecosystem. KFRI Research Report No. 83, Kerala Forest Research Institute, Peechi, Thrissur.
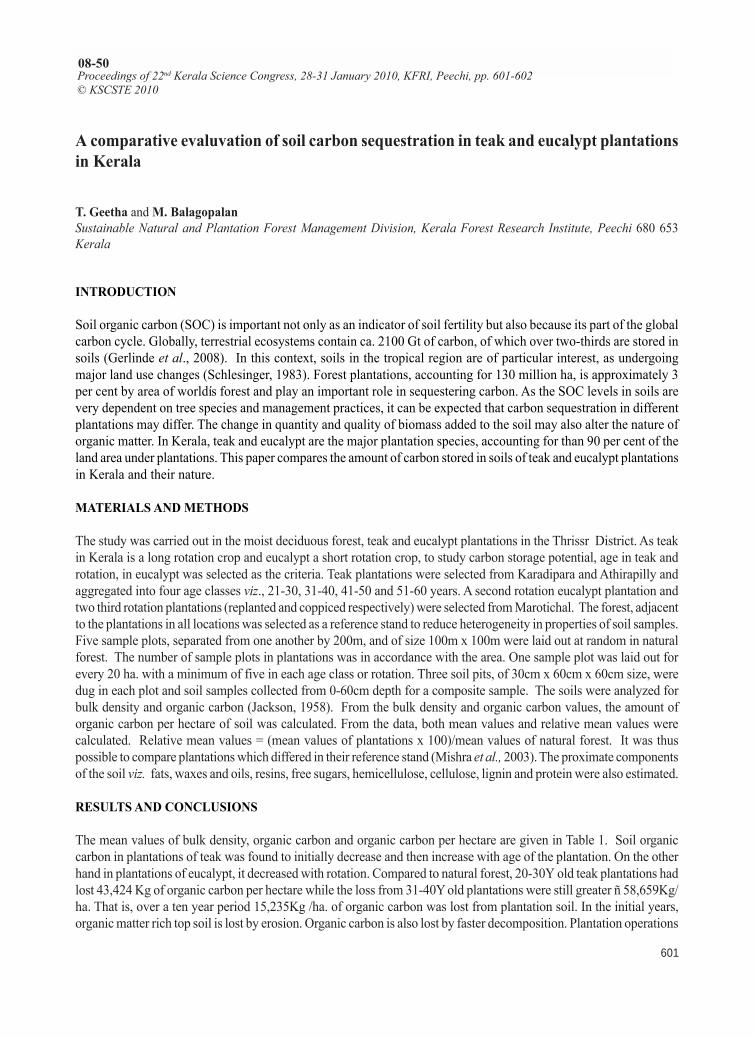
Proceedings of 22nd Kerala Science Congress
601
A comparative evaluvation of soil carbon sequestration in teak and eucalypt plantationsin Kerala
T. Geetha and M. BalagopalanSustainable Natural and Plantation Forest Management Division, Kerala Forest Research Institute, Peechi 680 653Kerala
INTRODUCTION
Soil organic carbon (SOC) is important not only as an indicator of soil fertility but also because its part of the globalcarbon cycle. Globally, terrestrial ecosystems contain ca. 2100 Gt of carbon, of which over two-thirds are stored insoils (Gerlinde et al., 2008). In this context, soils in the tropical region are of particular interest, as undergoingmajor land use changes (Schlesinger, 1983). Forest plantations, accounting for 130 million ha, is approximately 3per cent by area of worldís forest and play an important role in sequestering carbon. As the SOC levels in soils arevery dependent on tree species and management practices, it can be expected that carbon sequestration in differentplantations may differ. The change in quantity and quality of biomass added to the soil may also alter the nature oforganic matter. In Kerala, teak and eucalypt are the major plantation species, accounting for than 90 per cent of theland area under plantations. This paper compares the amount of carbon stored in soils of teak and eucalypt plantationsin Kerala and their nature.
MATERIALS AND METHODS
The study was carried out in the moist deciduous forest, teak and eucalypt plantations in the Thrissr District. As teakin Kerala is a long rotation crop and eucalypt a short rotation crop, to study carbon storage potential, age in teak androtation, in eucalypt was selected as the criteria. Teak plantations were selected from Karadipara and Athirapilly andaggregated into four age classes viz., 21-30, 31-40, 41-50 and 51-60 years. A second rotation eucalypt plantation andtwo third rotation plantations (replanted and coppiced respectively) were selected from Marotichal. The forest, adjacentto the plantations in all locations was selected as a reference stand to reduce heterogeneity in properties of soil samples.Five sample plots, separated from one another by 200m, and of size 100m x 100m were laid out at random in naturalforest. The number of sample plots in plantations was in accordance with the area. One sample plot was laid out forevery 20 ha. with a minimum of five in each age class or rotation. Three soil pits, of 30cm x 60cm x 60cm size, weredug in each plot and soil samples collected from 0-60cm depth for a composite sample. The soils were analyzed forbulk density and organic carbon (Jackson, 1958). From the bulk density and organic carbon values, the amount oforganic carbon per hectare of soil was calculated. From the data, both mean values and relative mean values werecalculated. Relative mean values = (mean values of plantations x 100)/mean values of natural forest. It was thuspossible to compare plantations which differed in their reference stand (Mishra et al., 2003). The proximate componentsof the soil viz. fats, waxes and oils, resins, free sugars, hemicellulose, cellulose, lignin and protein were also estimated.
RESULTS AND CONCLUSIONS
The mean values of bulk density, organic carbon and organic carbon per hectare are given in Table 1. Soil organiccarbon in plantations of teak was found to initially decrease and then increase with age of the plantation. On the otherhand in plantations of eucalypt, it decreased with rotation. Compared to natural forest, 20-30Y old teak plantations hadlost 43,424 Kg of organic carbon per hectare while the loss from 31-40Y old plantations were still greater ñ 58,659Kg/ha. That is, over a ten year period 15,235Kg /ha. of organic carbon was lost from plantation soil. In the initial years,organic matter rich top soil is lost by erosion. Organic carbon is also lost by faster decomposition. Plantation operations
Proceedings of 22nd Kerala Science Congress, 28-31 January 2010, KFRI, Peechi, pp. 601-602© KSCSTE 2010
08-50
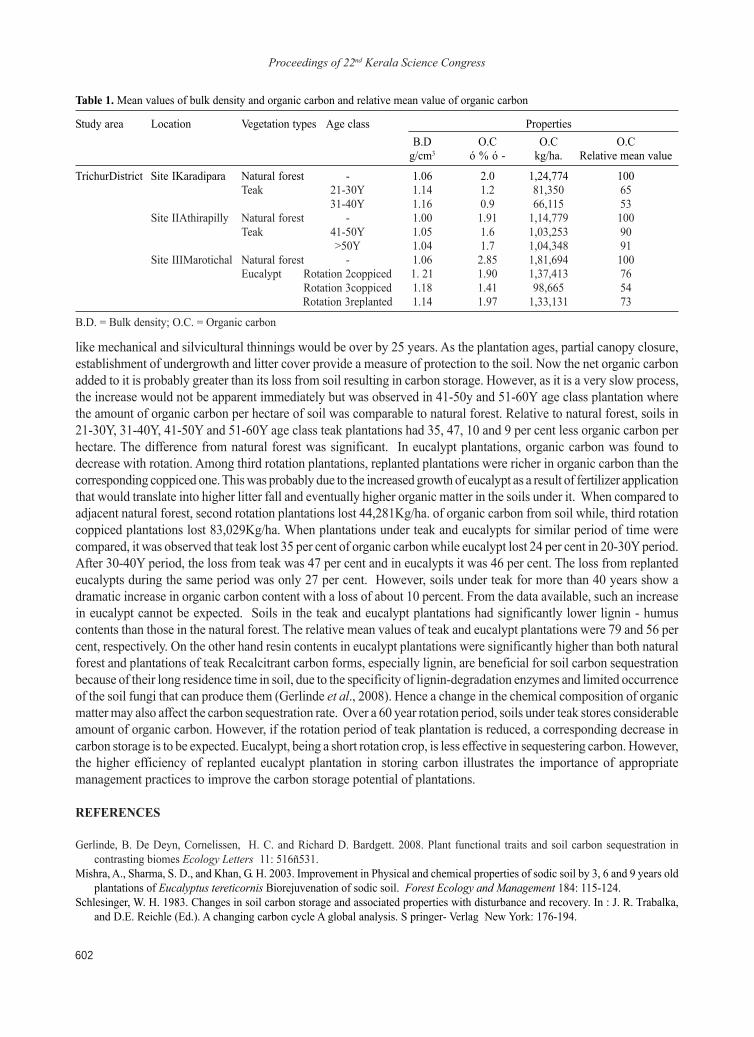
Proceedings of 22nd Kerala Science Congress
602
like mechanical and silvicultural thinnings would be over by 25 years. As the plantation ages, partial canopy closure,establishment of undergrowth and litter cover provide a measure of protection to the soil. Now the net organic carbonadded to it is probably greater than its loss from soil resulting in carbon storage. However, as it is a very slow process,the increase would not be apparent immediately but was observed in 41-50y and 51-60Y age class plantation wherethe amount of organic carbon per hectare of soil was comparable to natural forest. Relative to natural forest, soils in21-30Y, 31-40Y, 41-50Y and 51-60Y age class teak plantations had 35, 47, 10 and 9 per cent less organic carbon perhectare. The difference from natural forest was significant. In eucalypt plantations, organic carbon was found todecrease with rotation. Among third rotation plantations, replanted plantations were richer in organic carbon than thecorresponding coppiced one. This was probably due to the increased growth of eucalypt as a result of fertilizer applicationthat would translate into higher litter fall and eventually higher organic matter in the soils under it. When compared toadjacent natural forest, second rotation plantations lost 44,281Kg/ha. of organic carbon from soil while, third rotationcoppiced plantations lost 83,029Kg/ha. When plantations under teak and eucalypts for similar period of time werecompared, it was observed that teak lost 35 per cent of organic carbon while eucalypt lost 24 per cent in 20-30Y period.After 30-40Y period, the loss from teak was 47 per cent and in eucalypts it was 46 per cent. The loss from replantedeucalypts during the same period was only 27 per cent. However, soils under teak for more than 40 years show adramatic increase in organic carbon content with a loss of about 10 percent. From the data available, such an increasein eucalypt cannot be expected. Soils in the teak and eucalypt plantations had significantly lower lignin - humuscontents than those in the natural forest. The relative mean values of teak and eucalypt plantations were 79 and 56 percent, respectively. On the other hand resin contents in eucalypt plantations were significantly higher than both naturalforest and plantations of teak Recalcitrant carbon forms, especially lignin, are beneficial for soil carbon sequestrationbecause of their long residence time in soil, due to the specificity of lignin-degradation enzymes and limited occurrenceof the soil fungi that can produce them (Gerlinde et al., 2008). Hence a change in the chemical composition of organicmatter may also affect the carbon sequestration rate. Over a 60 year rotation period, soils under teak stores considerableamount of organic carbon. However, if the rotation period of teak plantation is reduced, a corresponding decrease incarbon storage is to be expected. Eucalypt, being a short rotation crop, is less effective in sequestering carbon. However,the higher efficiency of replanted eucalypt plantation in storing carbon illustrates the importance of appropriatemanagement practices to improve the carbon storage potential of plantations.
REFERENCES
Gerlinde, B. De Deyn, Cornelissen, H. C. and Richard D. Bardgett. 2008. Plant functional traits and soil carbon sequestration incontrasting biomes Ecology Letters 11: 516ñ531.
Mishra, A., Sharma, S. D., and Khan, G. H. 2003. Improvement in Physical and chemical properties of sodic soil by 3, 6 and 9 years oldplantations of Eucalyptus tereticornis Biorejuvenation of sodic soil. Forest Ecology and Management 184: 115-124.
Schlesinger, W. H. 1983. Changes in soil carbon storage and associated properties with disturbance and recovery. In : J. R. Trabalka,and D.E. Reichle (Ed.). A changing carbon cycle A global analysis. S pringer- Verlag New York: 176-194.
Table 1. Mean values of bulk density and organic carbon and relative mean value of organic carbon
Study area Location Vegetation types Age class PropertiesB.D O.C O.C O.Cg/cm3 ó % ó - kg/ha. Relative mean value
TrichurDistrict Site IKaradipara Natural forest - 1.06 2.0 1,24,774 100Teak 21-30Y 1.14 1.2 81,350 65
31-40Y 1.16 0.9 66,115 53Site IIAthirapilly Natural forest - 1.00 1.91 1,14,779 100
Teak 41-50Y 1.05 1.6 1,03,253 90>50Y 1.04 1.7 1,04,348 91
Site IIIMarotichal Natural forest - 1.06 2.85 1,81,694 100Eucalypt Rotation 2coppiced 1. 21 1.90 1,37,413 76
Rotation 3coppiced 1.18 1.41 98,665 54Rotation 3replanted 1.14 1.97 1,33,131 73
B.D. = Bulk density; O.C. = Organic carbon
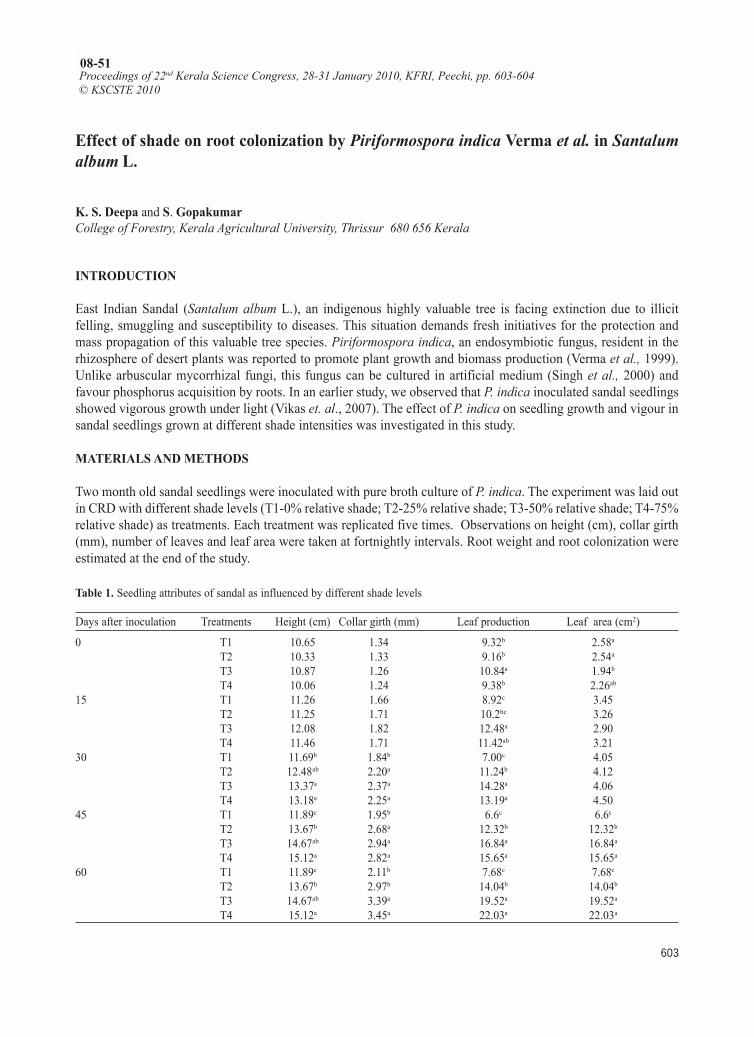
Proceedings of 22nd Kerala Science Congress
603
Effect of shade on root colonization by Piriformospora indica Verma et al. in Santalumalbum L.
K. S. Deepa and S. GopakumarCollege of Forestry, Kerala Agricultural University, Thrissur 680 656 Kerala
INTRODUCTION
East Indian Sandal (Santalum album L.), an indigenous highly valuable tree is facing extinction due to illicitfelling, smuggling and susceptibility to diseases. This situation demands fresh initiatives for the protection andmass propagation of this valuable tree species. Piriformospora indica, an endosymbiotic fungus, resident in therhizosphere of desert plants was reported to promote plant growth and biomass production (Verma et al., 1999).Unlike arbuscular mycorrhizal fungi, this fungus can be cultured in artificial medium (Singh et al., 2000) andfavour phosphorus acquisition by roots. In an earlier study, we observed that P. indica inoculated sandal seedlingsshowed vigorous growth under light (Vikas et. al., 2007). The effect of P. indica on seedling growth and vigour insandal seedlings grown at different shade intensities was investigated in this study.
MATERIALS AND METHODS
Two month old sandal seedlings were inoculated with pure broth culture of P. indica. The experiment was laid outin CRD with different shade levels (T1-0% relative shade; T2-25% relative shade; T3-50% relative shade; T4-75%relative shade) as treatments. Each treatment was replicated five times. Observations on height (cm), collar girth(mm), number of leaves and leaf area were taken at fortnightly intervals. Root weight and root colonization wereestimated at the end of the study.
Proceedings of 22nd Kerala Science Congress, 28-31 January 2010, KFRI, Peechi, pp. 603-604© KSCSTE 2010
08-51
Table 1. Seedling attributes of sandal as influenced by different shade levels
Days after inoculation Treatments Height (cm) Collar girth (mm) Leaf production Leaf area (cm2)
0 T1 10.65 1.34 9.32b 2.58aT2 10.33 1.33 9.16b 2.54aT3 10.87 1.26 10.84a 1.94bT4 10.06 1.24 9.38b 2.26ab
15 T1 11.26 1.66 8.92c 3.45T2 11.25 1.71 10.2bc 3.26T3 12.08 1.82 12.48a 2.90T4 11.46 1.71 11.42ab 3.21
30 T1 11.69b 1.84b 7.00c 4.05T2 12.48ab 2.20a 11.24b 4.12T3 13.37a 2.37a 14.28a 4.06T4 13.18a 2.25a 13.19a 4.50
45 T1 11.89c 1.95b 6.6c 6.6cT2 13.67b 2.68a 12.32b 12.32bT3 14.67ab 2.94a 16.84a 16.84aT4 15.12a 2.82a 15.65a 15.65a
60 T1 11.89c 2.11b 7.68c 7.68cT2 13.67b 2.97b 14.04b 14.04bT3 14.67ab 3.39a 19.52a 19.52aT4 15.12a 3.45a 22.03a 22.03a
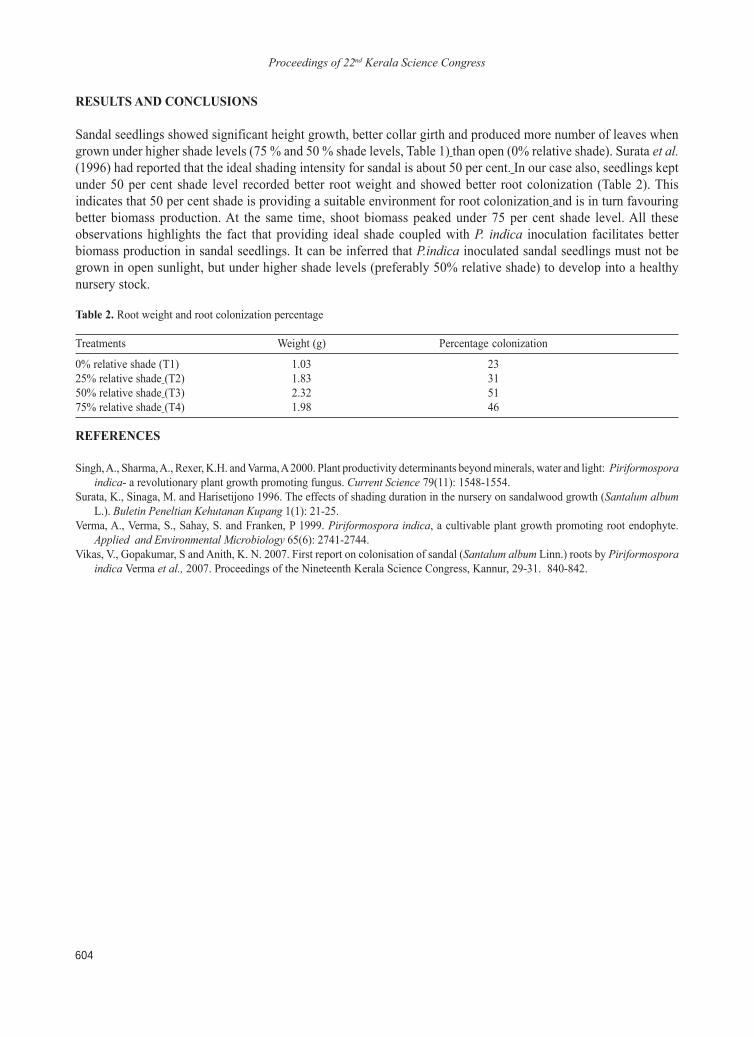
Proceedings of 22nd Kerala Science Congress
604
RESULTS AND CONCLUSIONS
Sandal seedlings showed significant height growth, better collar girth and produced more number of leaves whengrown under higher shade levels (75 % and 50 % shade levels, Table 1) than open (0% relative shade). Surata et al.(1996) had reported that the ideal shading intensity for sandal is about 50 per cent. In our case also, seedlings keptunder 50 per cent shade level recorded better root weight and showed better root colonization (Table 2). Thisindicates that 50 per cent shade is providing a suitable environment for root colonization and is in turn favouringbetter biomass production. At the same time, shoot biomass peaked under 75 per cent shade level. All theseobservations highlights the fact that providing ideal shade coupled with P. indica inoculation facilitates betterbiomass production in sandal seedlings. It can be inferred that P.indica inoculated sandal seedlings must not begrown in open sunlight, but under higher shade levels (preferably 50% relative shade) to develop into a healthynursery stock.
Table 2. Root weight and root colonization percentage
Treatments Weight (g) Percentage colonization
0% relative shade (T1) 1.03 2325% relative shade (T2) 1.83 3150% relative shade (T3) 2.32 5175% relative shade (T4) 1.98 46
REFERENCES
Singh, A., Sharma, A., Rexer, K.H. and Varma, A 2000. Plant productivity determinants beyond minerals, water and light: Piriformosporaindica- a revolutionary plant growth promoting fungus. Current Science 79(11): 1548-1554.
Surata, K., Sinaga, M. and Harisetijono 1996. The effects of shading duration in the nursery on sandalwood growth (Santalum albumL.). Buletin Peneltian Kehutanan Kupang 1(1): 21-25.
Verma, A., Verma, S., Sahay, S. and Franken, P 1999. Piriformospora indica, a cultivable plant growth promoting root endophyte.Applied and Environmental Microbiology 65(6): 2741-2744.
Vikas, V., Gopakumar, S and Anith, K. N. 2007. First report on colonisation of sandal (Santalum album Linn.) roots by Piriformosporaindica Verma et al., 2007. Proceedings of the Nineteenth Kerala Science Congress, Kannur, 29-31. 840-842.
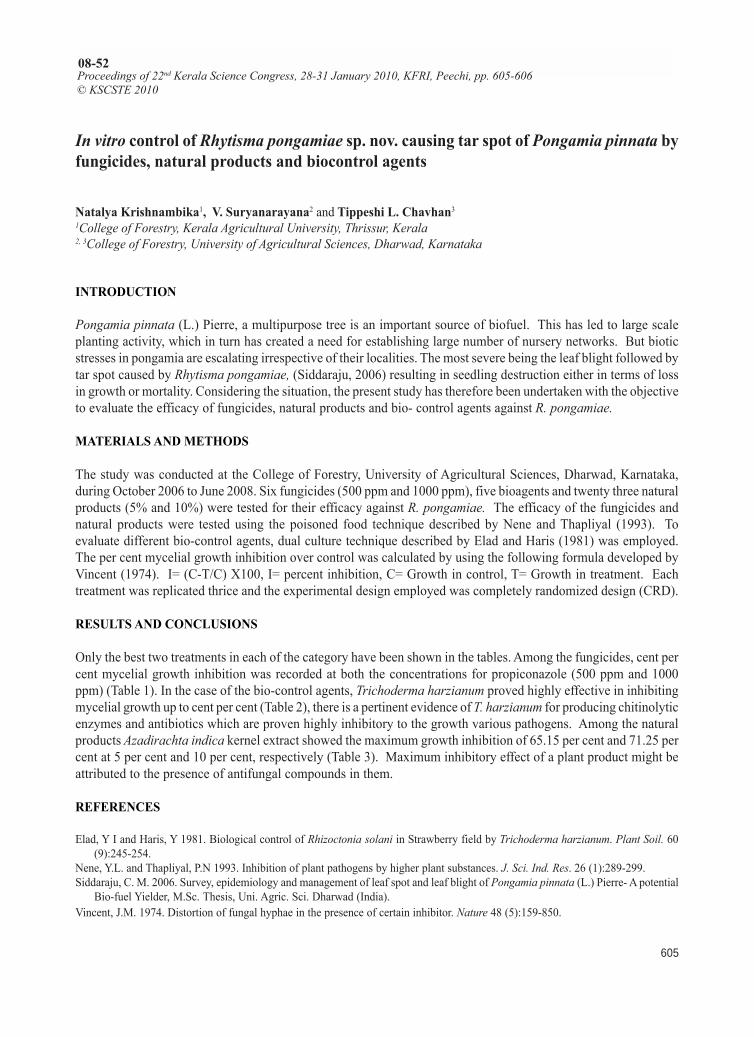
Proceedings of 22nd Kerala Science Congress
605
In vitro control of Rhytisma pongamiae sp. nov. causing tar spot of Pongamia pinnata byfungicides, natural products and biocontrol agents
Natalya Krishnambika1, V. Suryanarayana2 and Tippeshi L. Chavhan31College of Forestry, Kerala Agricultural University, Thrissur, Kerala2, 3College of Forestry, University of Agricultural Sciences, Dharwad, Karnataka
INTRODUCTION
Pongamia pinnata (L.) Pierre, a multipurpose tree is an important source of biofuel. This has led to large scaleplanting activity, which in turn has created a need for establishing large number of nursery networks. But bioticstresses in pongamia are escalating irrespective of their localities. The most severe being the leaf blight followed bytar spot caused by Rhytisma pongamiae, (Siddaraju, 2006) resulting in seedling destruction either in terms of lossin growth or mortality. Considering the situation, the present study has therefore been undertaken with the objectiveto evaluate the efficacy of fungicides, natural products and bio- control agents against R. pongamiae.
MATERIALS AND METHODS
The study was conducted at the College of Forestry, University of Agricultural Sciences, Dharwad, Karnataka,during October 2006 to June 2008. Six fungicides (500 ppm and 1000 ppm), five bioagents and twenty three naturalproducts (5% and 10%) were tested for their efficacy against R. pongamiae. The efficacy of the fungicides andnatural products were tested using the poisoned food technique described by Nene and Thapliyal (1993). Toevaluate different bio-control agents, dual culture technique described by Elad and Haris (1981) was employed.The per cent mycelial growth inhibition over control was calculated by using the following formula developed byVincent (1974). I= (C-T/C) X100, I= percent inhibition, C= Growth in control, T= Growth in treatment. Eachtreatment was replicated thrice and the experimental design employed was completely randomized design (CRD).
RESULTS AND CONCLUSIONS
Only the best two treatments in each of the category have been shown in the tables. Among the fungicides, cent percent mycelial growth inhibition was recorded at both the concentrations for propiconazole (500 ppm and 1000ppm) (Table 1). In the case of the bio-control agents, Trichoderma harzianum proved highly effective in inhibitingmycelial growth up to cent per cent (Table 2), there is a pertinent evidence of T. harzianum for producing chitinolyticenzymes and antibiotics which are proven highly inhibitory to the growth various pathogens. Among the naturalproducts Azadirachta indica kernel extract showed the maximum growth inhibition of 65.15 per cent and 71.25 percent at 5 per cent and 10 per cent, respectively (Table 3). Maximum inhibitory effect of a plant product might beattributed to the presence of antifungal compounds in them.
REFERENCES
Elad, Y I and Haris, Y 1981. Biological control of Rhizoctonia solani in Strawberry field by Trichoderma harzianum. Plant Soil. 60(9):245-254.
Nene, Y.L. and Thapliyal, P.N 1993. Inhibition of plant pathogens by higher plant substances. J. Sci. Ind. Res. 26 (1):289-299.Siddaraju, C. M. 2006. Survey, epidemiology and management of leaf spot and leaf blight of Pongamia pinnata (L.) Pierre- A potential
Bio-fuel Yielder, M.Sc. Thesis, Uni. Agric. Sci. Dharwad (India).Vincent, J.M. 1974. Distortion of fungal hyphae in the presence of certain inhibitor. Nature 48 (5):159-850.
Proceedings of 22nd Kerala Science Congress, 28-31 January 2010, KFRI, Peechi, pp. 605-606© KSCSTE 2010
08-52
Proceedings of 22nd Kerala Science Congress
606
Table 1. In vitro efficacy of fungicides against Rhytisma pongamiae causing tar spot in Pongamia pinnata
Treatment Mean colony diameter (mm) Mycelial growth inhibition over control (%) Mean inhibition (%)Concentration (ppm) Concentration (ppm)
500 1000 500 1000Control 90.00 90.00 0.00 (0.00) 0.00 (0.00) 0.00 (0.00) *Tridemorph 80% EC 18.02 0.00 79.97 (63.36) 100.00 (90,00) 89.98 (76.68)Propiconazole 10% EC 0.00 0.00 100.00 (90.00) 100.00 (90.00) 100.00 (90.00)
Sem+ CD at 1%Concentration 0.48 1.46Treatment 0.86 2.57Concentration X fungicide 1.24 3.71
*Figures in parentheses indicate transformed arcsine values
Table 2. In vitro efficacy of bioagents on inhibition of mycelial growth of R. pongamiae causing tar spot in P. pinnata
Treatment Mean colony diameter (mm) Growth inhibition over control (%)
Control 90.00 0.00 (0.00)*Trichoderma viride 8.88 90.13 (71.66)Trichoderma harzianum 0.00 100.00 (90.00)SEm ± 4.23CD at 1% 12.66
*Figure in the parentheses indicate transformed arcsine values
Table 3. In vitro efficacy of natural products against R. pongamiae causing tar spot in P. pinnata
Treatment Mean colony diameter (mm) Mycelial growth inhibition over control (mm) Mean inhibitionConcentration Concentration5% 10% 5% 10%
Control 90.00 90.00 0.00 (0.00)* 0.00 (0.00) 0.00 (0.00)Allium sativum bulb extract 37.89 32.67 57.89 (49.54) 63.70 (52.95) 60.79 (51.24)Azadirachta indica kernel extract 31.36 25.87 65.15 (53.85) 71.25 (57.61) 68.20 (55.73)� �� SEm+ CD at 1% �Concentration 0.69 2.05Treatment 1.89 5.63Concentration X fungicide 2.45 7.32
*Figures in parentheses indicate transformed arcsine values
Proceedings of 22nd Kerala Science Congress
607
Histopathological studies on morbid materials from wild felids of Gujarat State employingspecial stains
Shyama N. Prabhu, B. P. Joshi, D. J. Ghodasara and K. S. PrajapatiCollege of Veterinary Science and Animal Husbandry, Anand Agricultural University, Anand, Gujarat
INTRODUCTION
The diseases of wild felids are almost identical to those of their domestic counterparts except for the differences inseverity and some epidemiological features. The postmortem findings along with histopathological studies elucidatethe cause of mortality and based on the probable cause of death, necessary preventive measures can be adopted tominimize deaths in captive and wild large felids. Histopathology remains one of the major tools of diagnosis inpathology. The major advantages of histopathology are speed, low-cost, and the ability to provide a presumptiveidentification of the pathological condition, as well as demonstrating the tissue reaction.� Special stains employstaining techniques to identify suspected pathogens or demonstrate specific cellular components that aid in theevaluation of disease states.� The present study was conducted to study and analyze the different pathologicalconditions in morbid materials from the captive and wild large felids in Gujarat state.
MATERIALS AND METHODS
The present study was conducted to analyze the different pathological conditions based on histopathologicalexamination in dead large wild felids namely lion, leopard and panther during the period from January 2008 toMarch 2009.The gross and histopathological lesions of tissue samples collected during the post mortem examinationat the Department as well as those received from the field were studied. The different pathological conditions werediagnosed by routine Haematoxylin and eosin (HandE) staining and confirmed by employing various special stainingprocedures. A total of 31 samples were received at the department. The special staining methods used for theconfirmation of histopathological conditions were van Geisonís stain (VG) for collagen, Acid Fast stain (ZeihlNeelsenís Stain- ZN) for acid fast bacteria and Perlís method (Prussian blue reaction) for hemosiderin.
RESULTS AND CONCLUSIONS
Three lions were reported to have granulomatous pneumonia on H and E staining. ZN staining of these tissuesections confirmed tuberculosis in two of them. Clumps of acid fast bacilli were seen within the epithelioid cells(Fig.1). Similarly the HandE stained sections of lung from a Siberian tiger revealed extensive multifocal infiltrationof lymphocytes, histiocytes, and some scattered multinuclear giant cells within the framework of proliferatedconnective tissue and collagen fibers of the cavernous lesions. The ZN staining showed an intracellular accumulationof acid-fast bacteria in several alveolar macrophages and epithelioid cells (Lantos et al., 2003). Tuberculosis is acondition seen in captive carnivores probably by feeding on contaminated meat. Chronic interstitial nephritis wasseen in five leopards and two lions. The VG staining of these tissue sections revealed the dark pink to red collagenfibers in the interstitium Fig. 2). Chronic interstitial nephritis was observed in the case of hydronephrosis in a maletiger (Gajendragad et al., 2004). Chronic hepatitis was seen in two animals, one lion and one leopard on HandEwhich was confirmed by VG staining. Red colored collagen fibers were seen throughout the liver parenchymadisrupting the normal architecture of the liver Fig. 3). There was moderate to severe proliferation of fibrous connectivetissue with aggregates of inflammatory cells in the livers of two snow leopards with histoplasmosis (Aviles et al.,2008). van Giesonís stain is of considerable importance to determine the presence of collagen fibers in chronichepatitis. Similarly hemosiderosis and diffuse haemorrhage was seen in hepatic tissue of a lion. Hemosiderin was
Proceedings of 22nd Kerala Science Congress, 28-31 January 2010, KFRI, Peechi, pp. 607-608© KSCSTE 2010
08-53
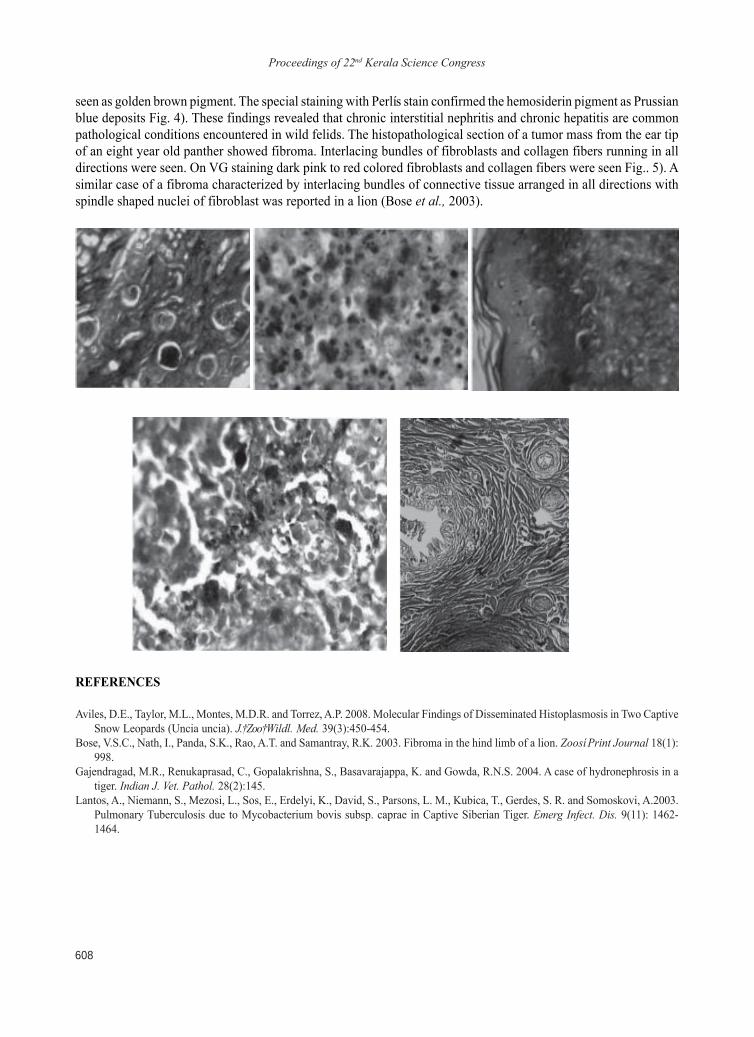
Proceedings of 22nd Kerala Science Congress
608
seen as golden brown pigment. The special staining with Perlís stain confirmed the hemosiderin pigment as Prussianblue deposits Fig. 4). These findings revealed that chronic interstitial nephritis and chronic hepatitis are commonpathological conditions encountered in wild felids. The histopathological section of a tumor mass from the ear tipof an eight year old panther showed fibroma. Interlacing bundles of fibroblasts and collagen fibers running in alldirections were seen. On VG staining dark pink to red colored fibroblasts and collagen fibers were seen Fig.. 5). Asimilar case of a fibroma characterized by interlacing bundles of connective tissue arranged in all directions withspindle shaped nuclei of fibroblast was reported in a lion (Bose et al., 2003).
REFERENCES
Aviles, D.E., Taylor, M.L., Montes, M.D.R. and Torrez, A.P. 2008. Molecular Findings of Disseminated Histoplasmosis in Two CaptiveSnow Leopards (Uncia uncia). J.�Zoo�Wildl. Med. 39(3):450-454.
Bose, V.S.C., Nath, I., Panda, S.K., Rao, A.T. and Samantray, R.K. 2003. Fibroma in the hind limb of a lion. Zoosí Print Journal 18(1):998.
Gajendragad, M.R., Renukaprasad, C., Gopalakrishna, S., Basavarajappa, K. and Gowda, R.N.S. 2004. A case of hydronephrosis in atiger. Indian J. Vet. Pathol. 28(2):145.
Lantos, A., Niemann, S., Mezosi, L., Sos, E., Erdelyi, K., David, S., Parsons, L. M., Kubica, T., Gerdes, S. R. and Somoskovi, A.2003.Pulmonary Tuberculosis due to Mycobacterium bovis subsp. caprae in Captive Siberian Tiger. Emerg Infect. Dis. 9(11): 1462-1464.
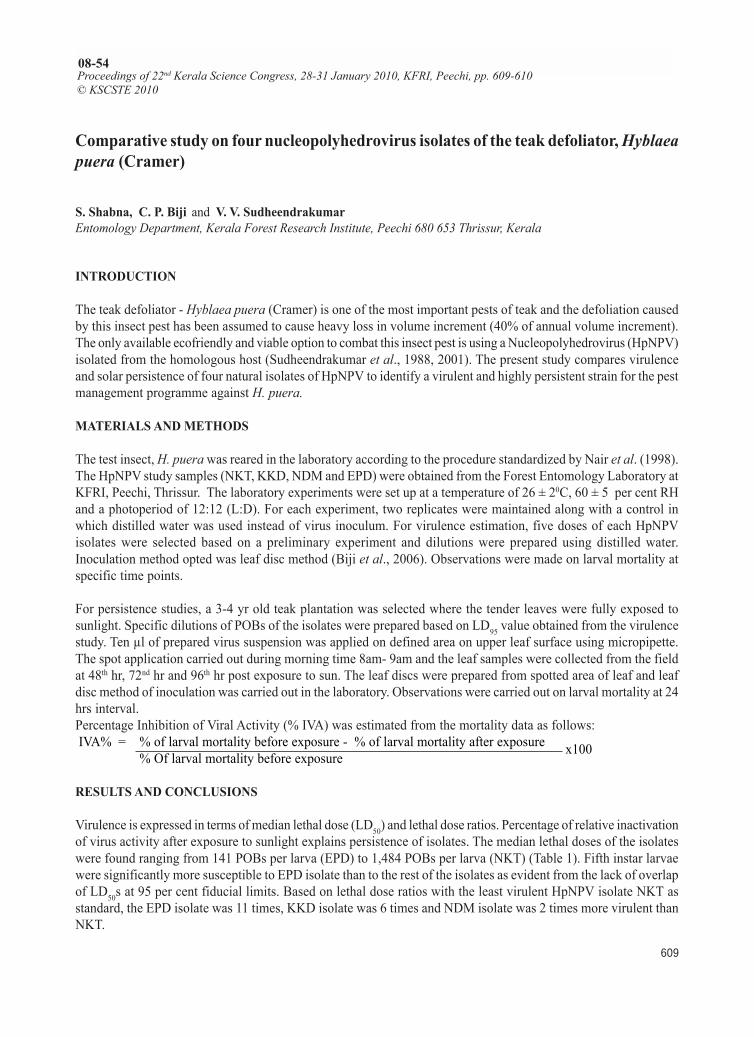
Proceedings of 22nd Kerala Science Congress
609
Proceedings of 22nd Kerala Science Congress, 28-31 January 2010, KFRI, Peechi, pp. 609-610© KSCSTE 2010
08-54
Comparative study on four nucleopolyhedrovirus isolates of the teak defoliator, Hyblaeapuera (Cramer)
S. Shabna, C. P. Biji and V. V. SudheendrakumarEntomology Department, Kerala Forest Research Institute, Peechi 680 653 Thrissur, Kerala
INTRODUCTION
The teak defoliator - Hyblaea puera (Cramer) is one of the most important pests of teak and the defoliation causedby this insect pest has been assumed to cause heavy loss in volume increment (40% of annual volume increment).The only available ecofriendly and viable option to combat this insect pest is using a Nucleopolyhedrovirus (HpNPV)isolated from the homologous host (Sudheendrakumar et al., 1988, 2001). The present study compares virulenceand solar persistence of four natural isolates of HpNPV to identify a virulent and highly persistent strain for the pestmanagement programme against H. puera.
MATERIALS AND METHODS
The test insect, H. puera was reared in the laboratory according to the procedure standardized by Nair et al. (1998).The HpNPV study samples (NKT, KKD, NDM and EPD) were obtained from the Forest Entomology Laboratory atKFRI, Peechi, Thrissur. The laboratory experiments were set up at a temperature of 26 ± 20C, 60 ± 5 per cent RHand a photoperiod of 12:12 (L:D). For each experiment, two replicates were maintained along with a control inwhich distilled water was used instead of virus inoculum. For virulence estimation, five doses of each HpNPVisolates were selected based on a preliminary experiment and dilutions were prepared using distilled water.Inoculation method opted was leaf disc method (Biji et al., 2006). Observations were made on larval mortality atspecific time points.
For persistence studies, a 3-4 yr old teak plantation was selected where the tender leaves were fully exposed tosunlight. Specific dilutions of POBs of the isolates were prepared based on LD95 value obtained from the virulencestudy. Ten µl of prepared virus suspension was applied on defined area on upper leaf surface using micropipette.The spot application carried out during morning time 8am- 9am and the leaf samples were collected from the fieldat 48th hr, 72nd hr and 96th hr post exposure to sun. The leaf discs were prepared from spotted area of leaf and leafdisc method of inoculation was carried out in the laboratory. Observations were carried out on larval mortality at 24hrs interval.Percentage Inhibition of Viral Activity (% IVA) was estimated from the mortality data as follows: IVA% = % of larval mortality before exposure - % of larval mortality after exposure x100
% Of larval mortality before exposure
RESULTS AND CONCLUSIONS
Virulence is expressed in terms of median lethal dose (LD50) and lethal dose ratios. Percentage of relative inactivationof virus activity after exposure to sunlight explains persistence of isolates. The median lethal doses of the isolateswere found ranging from 141 POBs per larva (EPD) to 1,484 POBs per larva (NKT) (Table 1). Fifth instar larvaewere significantly more susceptible to EPD isolate than to the rest of the isolates as evident from the lack of overlapof LD50s at 95 per cent fiducial limits. Based on lethal dose ratios with the least virulent HpNPV isolate NKT asstandard, the EPD isolate was 11 times, KKD isolate was 6 times and NDM isolate was 2 times more virulent thanNKT.
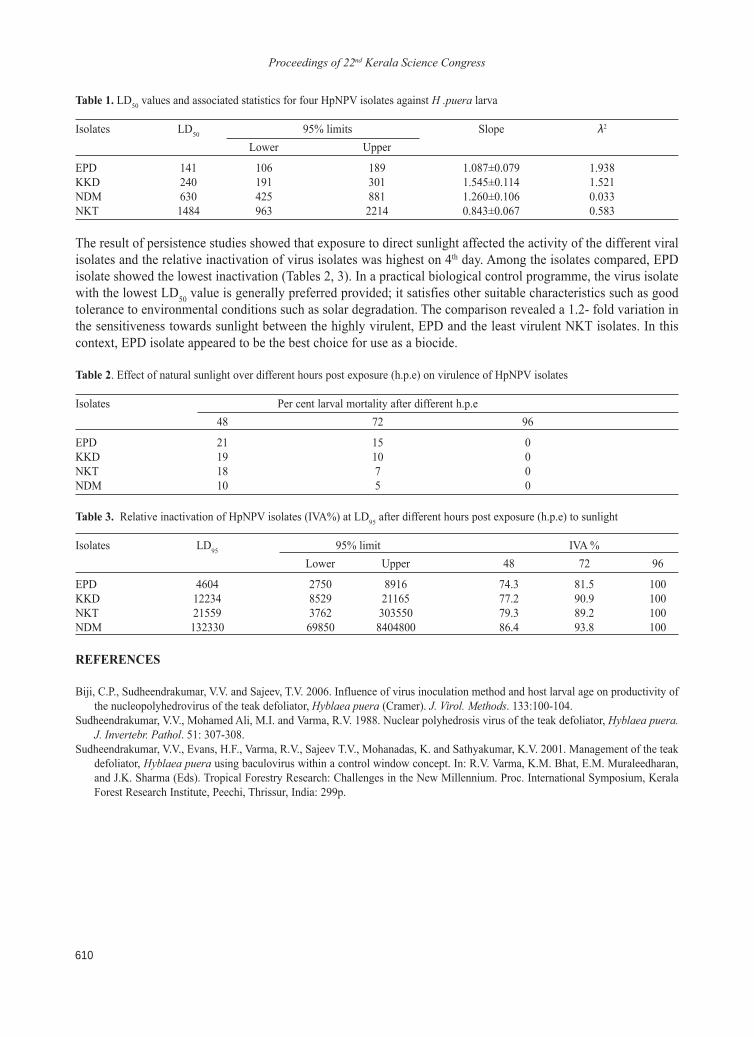
Proceedings of 22nd Kerala Science Congress
610
Table 1. LD50 values and associated statistics for four HpNPV isolates against H .puera larva
Isolates LD50 95% limits Slope λ2
Lower Upper
EPD 141 106 189 1.087±0.079 1.938KKD 240 191 301 1.545±0.114 1.521NDM 630 425 881 1.260±0.106 0.033NKT 1484 963 2214 0.843±0.067 0.583
The result of persistence studies showed that exposure to direct sunlight affected the activity of the different viralisolates and the relative inactivation of virus isolates was highest on 4th day. Among the isolates compared, EPDisolate showed the lowest inactivation (Tables 2, 3). In a practical biological control programme, the virus isolatewith the lowest LD50 value is generally preferred provided; it satisfies other suitable characteristics such as goodtolerance to environmental conditions such as solar degradation. The comparison revealed a 1.2- fold variation inthe sensitiveness towards sunlight between the highly virulent, EPD and the least virulent NKT isolates. In thiscontext, EPD isolate appeared to be the best choice for use as a biocide.
Table 2. Effect of natural sunlight over different hours post exposure (h.p.e) on virulence of HpNPV isolates
Isolates Per cent larval mortality after different h.p.e48 72 96
EPD 21 15 0KKD 19 10 0NKT 18 7 0NDM 10 5 0
Table 3. Relative inactivation of HpNPV isolates (IVA%) at LD95 after different hours post exposure (h.p.e) to sunlight
Isolates LD95 95% limit IVA %Lower Upper 48 72 96
EPD 4604 2750 8916 74.3 81.5 100KKD 12234 8529 21165 77.2 90.9 100NKT 21559 3762 303550 79.3 89.2 100NDM 132330 69850 8404800 86.4 93.8 100
REFERENCES
Biji, C.P., Sudheendrakumar, V.V. and Sajeev, T.V. 2006. Influence of virus inoculation method and host larval age on productivity ofthe nucleopolyhedrovirus of the teak defoliator, Hyblaea puera (Cramer). J. Virol. Methods. 133:100-104.
Sudheendrakumar, V.V., Mohamed Ali, M.I. and Varma, R.V. 1988. Nuclear polyhedrosis virus of the teak defoliator, Hyblaea puera.J. Invertebr. Pathol. 51: 307-308.
Sudheendrakumar, V.V., Evans, H.F., Varma, R.V., Sajeev T.V., Mohanadas, K. and Sathyakumar, K.V. 2001. Management of the teakdefoliator, Hyblaea puera using baculovirus within a control window concept. In: R.V. Varma, K.M. Bhat, E.M. Muraleedharan,and J.K. Sharma (Eds). Tropical Forestry Research: Challenges in the New Millennium. Proc. International Symposium, KeralaForest Research Institute, Peechi, Thrissur, India: 299p.
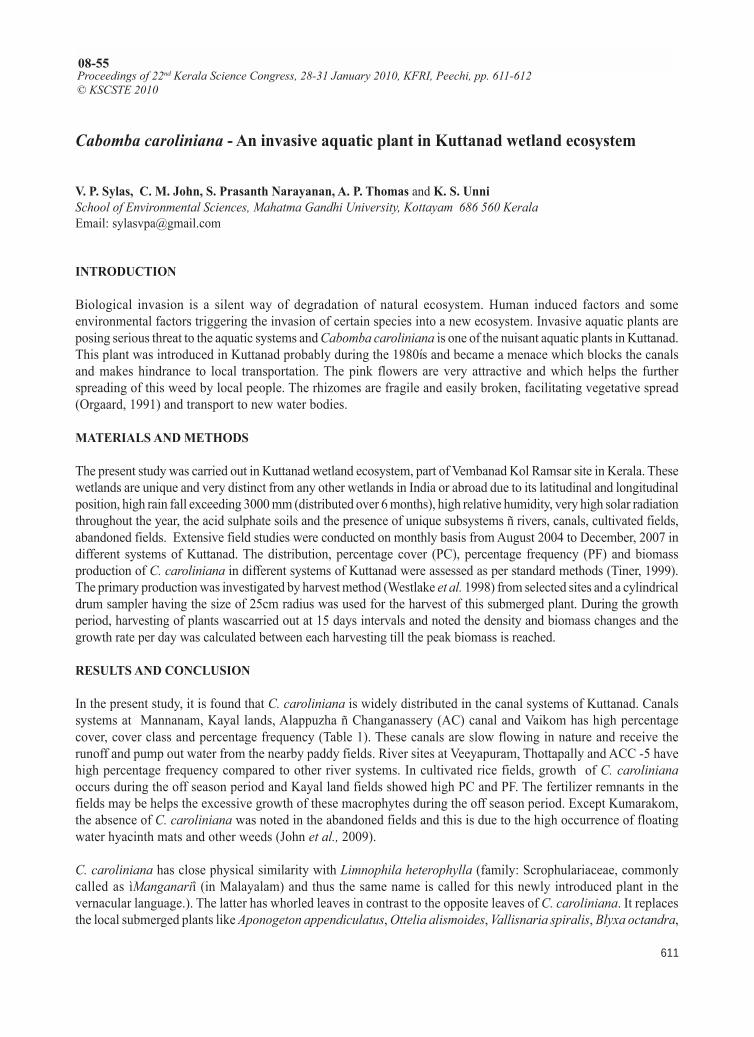
Proceedings of 22nd Kerala Science Congress
611
Cabomba caroliniana - An invasive aquatic plant in Kuttanad wetland ecosystem
V. P. Sylas, C. M. John, S. Prasanth Narayanan, A. P. Thomas and K. S. UnniSchool of Environmental Sciences, Mahatma Gandhi University, Kottayam 686 560 KeralaEmail: [email protected]
INTRODUCTION
Biological invasion is a silent way of degradation of natural ecosystem. Human induced factors and someenvironmental factors triggering the invasion of certain species into a new ecosystem. Invasive aquatic plants areposing serious threat to the aquatic systems and Cabomba caroliniana is one of the nuisant aquatic plants in Kuttanad.This plant was introduced in Kuttanad probably during the 1980ís and became a menace which blocks the canalsand makes hindrance to local transportation. The pink flowers are very attractive and which helps the furtherspreading of this weed by local people. The rhizomes are fragile and easily broken, facilitating vegetative spread(Orgaard, 1991) and transport to new water bodies.
MATERIALS AND METHODS
The present study was carried out in Kuttanad wetland ecosystem, part of Vembanad Kol Ramsar site in Kerala. Thesewetlands are unique and very distinct from any other wetlands in India or abroad due to its latitudinal and longitudinalposition, high rain fall exceeding 3000 mm (distributed over 6 months), high relative humidity, very high solar radiationthroughout the year, the acid sulphate soils and the presence of unique subsystems ñ rivers, canals, cultivated fields,abandoned fields. Extensive field studies were conducted on monthly basis from August 2004 to December, 2007 indifferent systems of Kuttanad. The distribution, percentage cover (PC), percentage frequency (PF) and biomassproduction of C. caroliniana in different systems of Kuttanad were assessed as per standard methods (Tiner, 1999).The primary production was investigated by harvest method (Westlake et al. 1998) from selected sites and a cylindricaldrum sampler having the size of 25cm radius was used for the harvest of this submerged plant. During the growthperiod, harvesting of plants wascarried out at 15 days intervals and noted the density and biomass changes and thegrowth rate per day was calculated between each harvesting till the peak biomass is reached.
RESULTS AND CONCLUSION
In the present study, it is found that C. caroliniana is widely distributed in the canal systems of Kuttanad. Canalssystems at Mannanam, Kayal lands, Alappuzha ñ Changanassery (AC) canal and Vaikom has high percentagecover, cover class and percentage frequency (Table 1). These canals are slow flowing in nature and receive therunoff and pump out water from the nearby paddy fields. River sites at Veeyapuram, Thottapally and ACC -5 havehigh percentage frequency compared to other river systems. In cultivated rice fields, growth of C. carolinianaoccurs during the off season period and Kayal land fields showed high PC and PF. The fertilizer remnants in thefields may be helps the excessive growth of these macrophytes during the off season period. Except Kumarakom,the absence of C. caroliniana was noted in the abandoned fields and this is due to the high occurrence of floatingwater hyacinth mats and other weeds (John et al., 2009).
C. caroliniana has close physical similarity with Limnophila heterophylla (family: Scrophulariaceae, commonlycalled as ìManganariî (in Malayalam) and thus the same name is called for this newly introduced plant in thevernacular language.). The latter has whorled leaves in contrast to the opposite leaves of C. caroliniana. It replacesthe local submerged plants like Aponogeton appendiculatus, Ottelia alismoides, Vallisnaria spiralis, Blyxa octandra,
Proceedings of 22nd Kerala Science Congress, 28-31 January 2010, KFRI, Peechi, pp. 611-612© KSCSTE 2010
08-55
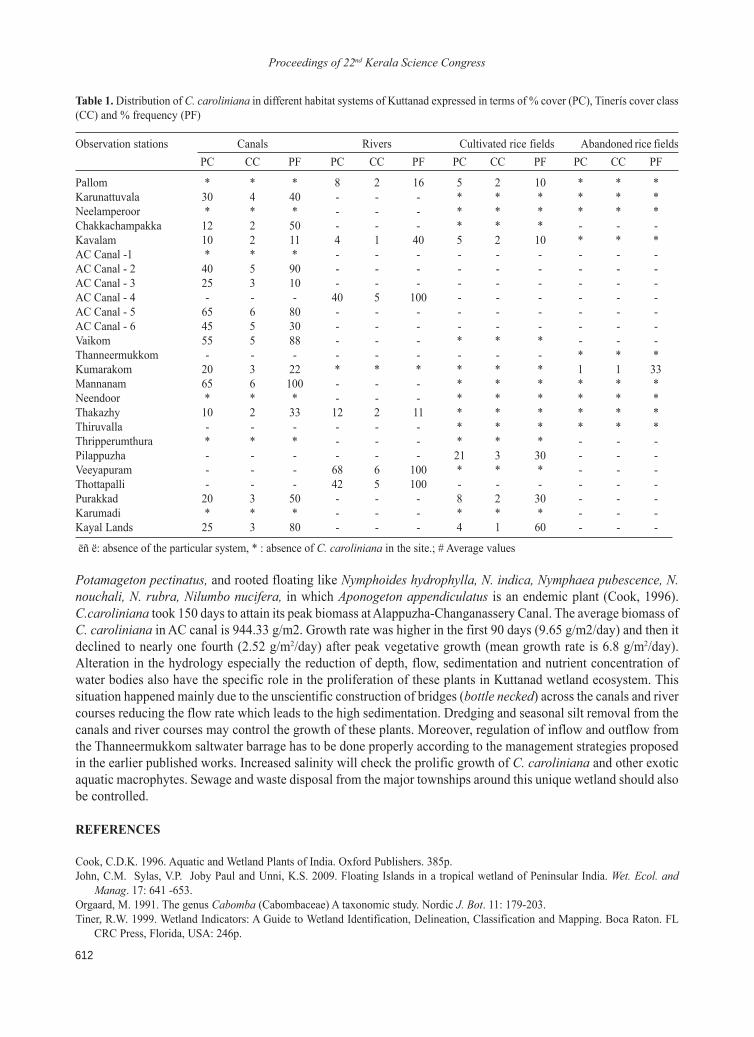
Proceedings of 22nd Kerala Science Congress
612
Potamageton pectinatus, and rooted floating like Nymphoides hydrophylla, N. indica, Nymphaea pubescence, N.nouchali, N. rubra, Nilumbo nucifera, in which Aponogeton appendiculatus is an endemic plant (Cook, 1996).C.caroliniana took 150 days to attain its peak biomass at Alappuzha-Changanassery Canal. The average biomass ofC. caroliniana in AC canal is 944.33 g/m2. Growth rate was higher in the first 90 days (9.65 g/m2/day) and then itdeclined to nearly one fourth (2.52 g/m2/day) after peak vegetative growth (mean growth rate is 6.8 g/m2/day).Alteration in the hydrology especially the reduction of depth, flow, sedimentation and nutrient concentration ofwater bodies also have the specific role in the proliferation of these plants in Kuttanad wetland ecosystem. Thissituation happened mainly due to the unscientific construction of bridges (bottle necked) across the canals and rivercourses reducing the flow rate which leads to the high sedimentation. Dredging and seasonal silt removal from thecanals and river courses may control the growth of these plants. Moreover, regulation of inflow and outflow fromthe Thanneermukkom saltwater barrage has to be done properly according to the management strategies proposedin the earlier published works. Increased salinity will check the prolific growth of C. caroliniana and other exoticaquatic macrophytes. Sewage and waste disposal from the major townships around this unique wetland should alsobe controlled.
REFERENCES
Cook, C.D.K. 1996. Aquatic and Wetland Plants of India. Oxford Publishers. 385p.John, C.M. Sylas, V.P. Joby Paul and Unni, K.S. 2009. Floating Islands in a tropical wetland of Peninsular India. Wet. Ecol. and
Manag. 17: 641 -653.Orgaard, M. 1991. The genus Cabomba (Cabombaceae) A taxonomic study. Nordic J. Bot. 11: 179-203.Tiner, R.W. 1999. Wetland Indicators: A Guide to Wetland Identification, Delineation, Classification and Mapping. Boca Raton. FL
CRC Press, Florida, USA: 246p.
Table 1. Distribution of C. caroliniana in different habitat systems of Kuttanad expressed in terms of % cover (PC), Tinerís cover class(CC) and % frequency (PF)
Observation stations Canals Rivers Cultivated rice fields Abandoned rice fieldsPC CC PF PC CC PF PC CC PF PC CC PF
Pallom * * * 8 2 16 5 2 10 * * *Karunattuvala 30 4 40 - - - * * * * * *Neelamperoor * * * - - - * * * * * *Chakkachampakka 12 2 50 - - - * * * - - -Kavalam 10 2 11 4 1 40 5 2 10 * * *AC Canal -1 * * * - - - - - - - - -AC Canal - 2 40 5 90 - - - - - - - - -AC Canal - 3 25 3 10 - - - - - - - - -AC Canal - 4 - - - 40 5 100 - - - - - -AC Canal - 5 65 6 80 - - - - - - - - -AC Canal - 6 45 5 30 - - - - - - - - -Vaikom 55 5 88 - - - * * * - - -Thanneermukkom - - - - - - - - - * * *Kumarakom 20 3 22 * * * * * * 1 1 33Mannanam 65 6 100 - - - * * * * * *Neendoor * * * - - - * * * * * *Thakazhy 10 2 33 12 2 11 * * * * * *Thiruvalla - - - - - - * * * * * *Thripperumthura * * * - - - * * * - - -Pilappuzha - - - - - - 21 3 30 - - -Veeyapuram - - - 68 6 100 * * * - - -Thottapalli - - - 42 5 100 - - - - - -Purakkad 20 3 50 - - - 8 2 30 - - -Karumadi * * * - - - * * * - - -Kayal Lands 25 3 80 - - - 4 1 60 - - -
ëñ ë: absence of the particular system, * : absence of C. caroliniana in the site.; # Average values
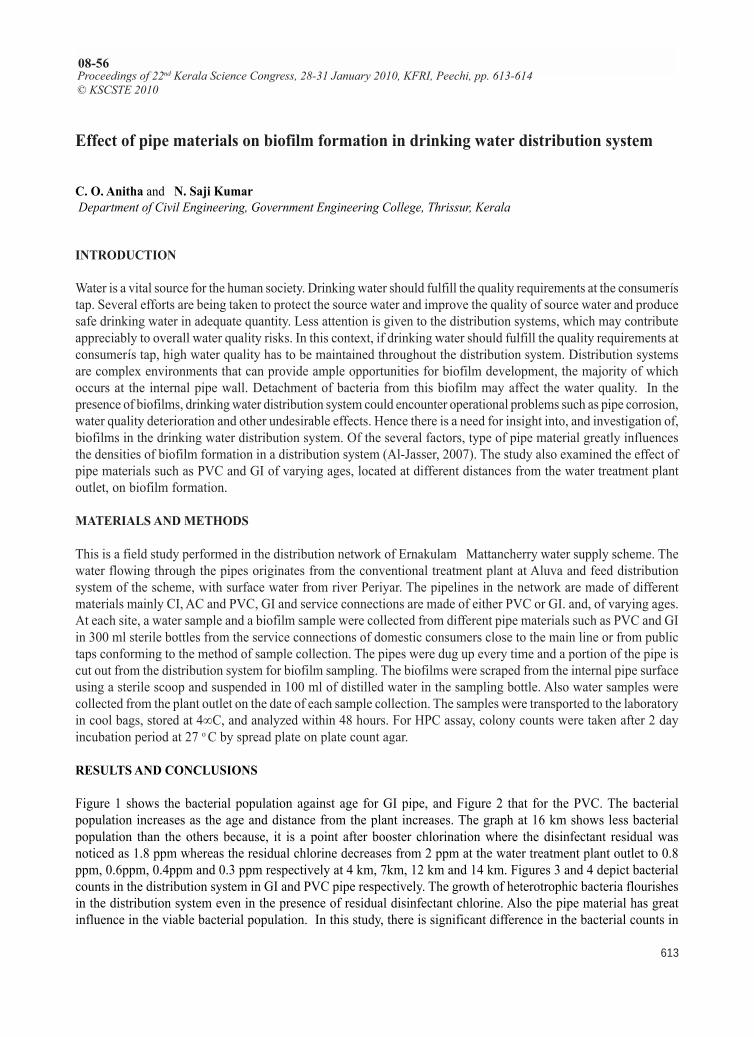
Proceedings of 22nd Kerala Science Congress
613
Effect of pipe materials on biofilm formation in drinking water distribution system
C. O. Anitha and N. Saji Kumar Department of Civil Engineering, Government Engineering College, Thrissur, Kerala
INTRODUCTION
Water is a vital source for the human society. Drinking water should fulfill the quality requirements at the consumerístap. Several efforts are being taken to protect the source water and improve the quality of source water and producesafe drinking water in adequate quantity. Less attention is given to the distribution systems, which may contributeappreciably to overall water quality risks. In this context, if drinking water should fulfill the quality requirements atconsumerís tap, high water quality has to be maintained throughout the distribution system. Distribution systemsare complex environments that can provide ample opportunities for biofilm development, the majority of whichoccurs at the internal pipe wall. Detachment of bacteria from this biofilm may affect the water quality. In thepresence of biofilms, drinking water distribution system could encounter operational problems such as pipe corrosion,water quality deterioration and other undesirable effects. Hence there is a need for insight into, and investigation of,biofilms in the drinking water distribution system. Of the several factors, type of pipe material greatly influencesthe densities of biofilm formation in a distribution system (Al-Jasser, 2007). The study also examined the effect ofpipe materials such as PVC and GI of varying ages, located at different distances from the water treatment plantoutlet, on biofilm formation.
MATERIALS AND METHODS
This is a field study performed in the distribution network of Ernakulam Mattancherry water supply scheme. Thewater flowing through the pipes originates from the conventional treatment plant at Aluva and feed distributionsystem of the scheme, with surface water from river Periyar. The pipelines in the network are made of differentmaterials mainly CI, AC and PVC, GI and service connections are made of either PVC or GI. and, of varying ages.At each site, a water sample and a biofilm sample were collected from different pipe materials such as PVC and GIin 300 ml sterile bottles from the service connections of domestic consumers close to the main line or from publictaps conforming to the method of sample collection. The pipes were dug up every time and a portion of the pipe iscut out from the distribution system for biofilm sampling. The biofilms were scraped from the internal pipe surfaceusing a sterile scoop and suspended in 100 ml of distilled water in the sampling bottle. Also water samples werecollected from the plant outlet on the date of each sample collection. The samples were transported to the laboratoryin cool bags, stored at 4∞C, and analyzed within 48 hours. For HPC assay, colony counts were taken after 2 dayincubation period at 27 o C by spread plate on plate count agar.
RESULTS AND CONCLUSIONS
Figure 1 shows the bacterial population against age for GI pipe, and Figure 2 that for the PVC. The bacterialpopulation increases as the age and distance from the plant increases. The graph at 16 km shows less bacterialpopulation than the others because, it is a point after booster chlorination where the disinfectant residual wasnoticed as 1.8 ppm whereas the residual chlorine decreases from 2 ppm at the water treatment plant outlet to 0.8ppm, 0.6ppm, 0.4ppm and 0.3 ppm respectively at 4 km, 7km, 12 km and 14 km. Figures 3 and 4 depict bacterialcounts in the distribution system in GI and PVC pipe respectively. The growth of heterotrophic bacteria flourishesin the distribution system even in the presence of residual disinfectant chlorine. Also the pipe material has greatinfluence in the viable bacterial population. In this study, there is significant difference in the bacterial counts in
Proceedings of 22nd Kerala Science Congress, 28-31 January 2010, KFRI, Peechi, pp. 613-614© KSCSTE 2010
08-56
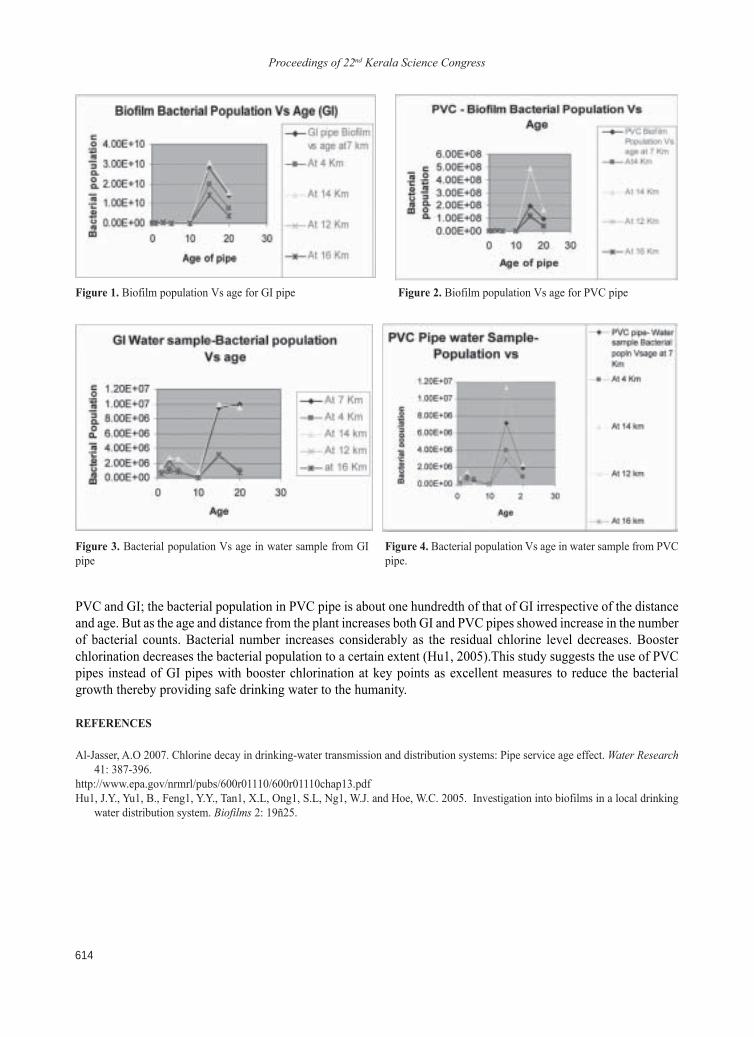
Proceedings of 22nd Kerala Science Congress
614
Figure 4. Bacterial population Vs age in water sample from PVCpipe.
Figure 1. Biofilm population Vs age for GI pipe Figure 2. Biofilm population Vs age for PVC pipe
Figure 3. Bacterial population Vs age in water sample from GIpipe
PVC and GI; the bacterial population in PVC pipe is about one hundredth of that of GI irrespective of the distanceand age. But as the age and distance from the plant increases both GI and PVC pipes showed increase in the numberof bacterial counts. Bacterial number increases considerably as the residual chlorine level decreases. Boosterchlorination decreases the bacterial population to a certain extent (Hu1, 2005).This study suggests the use of PVCpipes instead of GI pipes with booster chlorination at key points as excellent measures to reduce the bacterialgrowth thereby providing safe drinking water to the humanity.
REFERENCES
Al-Jasser, A.O 2007. Chlorine decay in drinking-water transmission and distribution systems: Pipe service age effect. Water Research41: 387-396.
http://www.epa.gov/nrmrl/pubs/600r01110/600r01110chap13.pdfHu1, J.Y., Yu1, B., Feng1, Y.Y., Tan1, X.L, Ong1, S.L, Ng1, W.J. and Hoe, W.C. 2005. Investigation into biofilms in a local drinking
water distribution system. Biofilms 2: 19ñ25.
Proceedings of 22nd Kerala Science Congress
615
Rapid assessment protocol for alien invasive weed species: A case study of WaynadDistrict, Kerala
T. A. Suresh, T.V. Sajeev and K. V. SankaranKerala Forest Research Institute, Peechi 680 653 Thrissur, Kerala
INTRODUCTION
Biological invasion is one of the global threats next to habitat destruction. The estimated loss due to invasivespecies globally is around 1.5 trillion US dollars every year. They can affect native biodiversity in several ways,including outcompeting native species for food or habitat, changing the food web or physical environment, andpreying directly on native species. Rare species with limited ranges, small numbers, and restricted habitat requirementsare often particularly vulnerable, as are rare habitat types. As global trade and travel increase, the problem worsens,with invasive species able to establish themselves in places where they have no natural checks on their population.
Hundreds to thousands of nonnative plant species are established and spreading outside cultivation in many statesand countries. Some of these species are abundant and known or suspected to cause significant reductions in nativespecies populations, severe alterations of native ecological communities, or significant changes in ecosystemprocesses and parameters. Within a particular nation, state, or region, however, only a relatively small proportion ofthe established nonnative plant species are recognized as causing, or having the potential to cause, significantdamage to native biodiversity. In fact, many established nonnative species are uncommon, rarely colonize areasother than croplands and other heavily disturbed sites, or otherwise have little or no detectable impact on lands andwaters set aside for conservation or in other habitats that support native species. Some nonnative species werereported as established in the wild only historically but has not been seen outside cultivation again for manydecades or more. It is critical that we be able to determine which nonnative species are causing significant biodiversityimpacts so we can prioritize the most harmful species for prevention and management to protect native species andecological communities. To some authors, only plant species that are nonnative, spread into natural or semi naturalhabitats, and cause significant negative impacts to biodiversity meet the definition of ìinvasiveî plants. Others usethe term
ìinvasiveî plants more broadly to cover all nonnative species with adverse effects on the economy, human health,and/or the environment, and still others use ëíinvasiveî for all nonnative species that establish and spread beyondcultivation. In order to avoid confusion between these different definitions, we generally use the mere precisephrase ìnonnative plants that negatively impact biodiversityî in this paper when referring to this subset of species.In India, no attempts made for assessing the non native species till today. In Kerala, Western Ghats covered mostpart of our vegetation is gradually invaded by alien weeds.
MATERIAL AND METHODS
The invasive species assessment protocol includes two screening questions plus twenty assessment questions whichare grouped into four sections: Ecological impact, Current Distribution and Abundance, Trend in Distribution andAbundance, and Management Difficulty (Table 1). Four scaled answers (A-D) are provided for each of the twentyquestions. The Invasive species impact rank is determined from answers to these questions. The screening questions(S1 and S2) before investing effort in assessing a species further. If your answer to both questions ëYesí proceed toconsider the 20 assessment questions that follows. In the assessment questions, Ecological Impact includes five
Proceedings of 22nd Kerala Science Congress, 28-31 January 2010, KFRI, Peechi, pp. 615-617© KSCSTE 2010
08-57
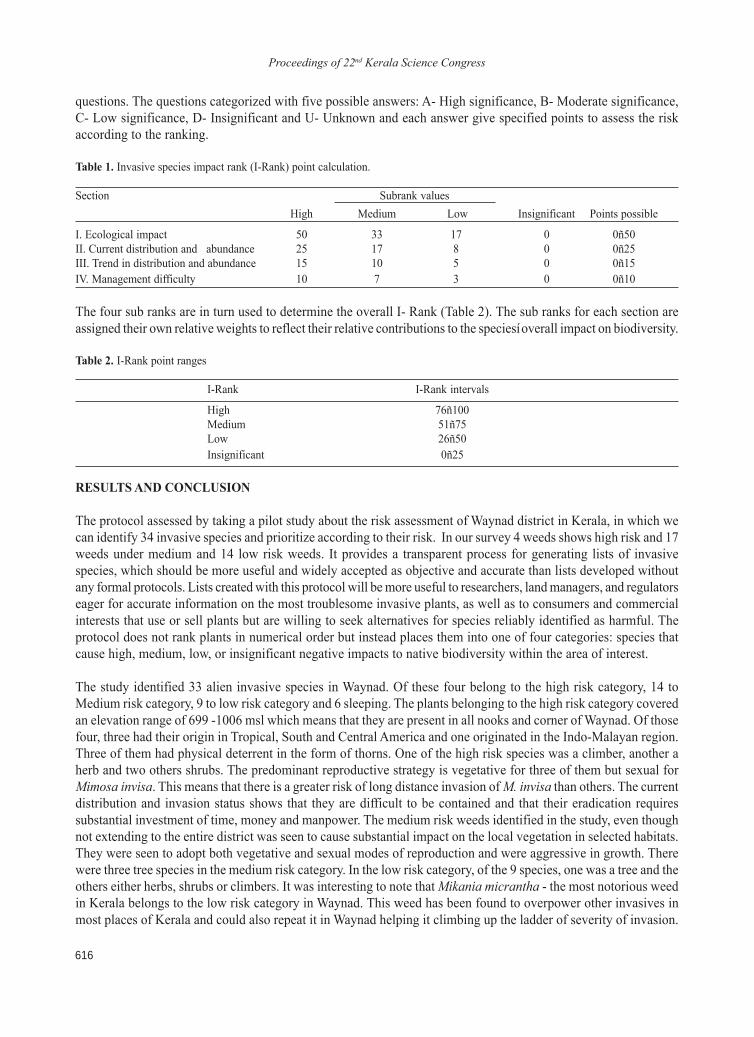
Proceedings of 22nd Kerala Science Congress
616
questions. The questions categorized with five possible answers: A- High significance, B- Moderate significance,C- Low significance, D- Insignificant and U- Unknown and each answer give specified points to assess the riskaccording to the ranking.
Table 1. Invasive species impact rank (I-Rank) point calculation.
Section Subrank valuesHigh Medium Low Insignificant Points possible
I. Ecological impact 50 33 17 0 0ñ50II. Current distribution and abundance 25 17 8 0 0ñ25III. Trend in distribution and abundance 15 10 5 0 0ñ15IV. Management difficulty 10 7 3 0 0ñ10
The four sub ranks are in turn used to determine the overall I- Rank (Table 2). The sub ranks for each section areassigned their own relative weights to reflect their relative contributions to the speciesí overall impact on biodiversity.
Table 2. I-Rank point ranges
I-Rank I-Rank intervals
High 76ñ100Medium 51ñ75Low 26ñ50Insignificant 0ñ25
RESULTS AND CONCLUSION
The protocol assessed by taking a pilot study about the risk assessment of Waynad district in Kerala, in which wecan identify 34 invasive species and prioritize according to their risk. In our survey 4 weeds shows high risk and 17weeds under medium and 14 low risk weeds. It provides a transparent process for generating lists of invasivespecies, which should be more useful and widely accepted as objective and accurate than lists developed withoutany formal protocols. Lists created with this protocol will be more useful to researchers, land managers, and regulatorseager for accurate information on the most troublesome invasive plants, as well as to consumers and commercialinterests that use or sell plants but are willing to seek alternatives for species reliably identified as harmful. Theprotocol does not rank plants in numerical order but instead places them into one of four categories: species thatcause high, medium, low, or insignificant negative impacts to native biodiversity within the area of interest.
The study identified 33 alien invasive species in Waynad. Of these four belong to the high risk category, 14 toMedium risk category, 9 to low risk category and 6 sleeping. The plants belonging to the high risk category coveredan elevation range of 699 -1006 msl which means that they are present in all nooks and corner of Waynad. Of thosefour, three had their origin in Tropical, South and Central America and one originated in the Indo-Malayan region.Three of them had physical deterrent in the form of thorns. One of the high risk species was a climber, another aherb and two others shrubs. The predominant reproductive strategy is vegetative for three of them but sexual forMimosa invisa. This means that there is a greater risk of long distance invasion of M. invisa than others. The currentdistribution and invasion status shows that they are difficult to be contained and that their eradication requiressubstantial investment of time, money and manpower. The medium risk weeds identified in the study, even thoughnot extending to the entire district was seen to cause substantial impact on the local vegetation in selected habitats.They were seen to adopt both vegetative and sexual modes of reproduction and were aggressive in growth. Therewere three tree species in the medium risk category. In the low risk category, of the 9 species, one was a tree and theothers either herbs, shrubs or climbers. It was interesting to note that Mikania micrantha - the most notorious weedin Kerala belongs to the low risk category in Waynad. This weed has been found to overpower other invasives inmost places of Kerala and could also repeat it in Waynad helping it climbing up the ladder of severity of invasion.
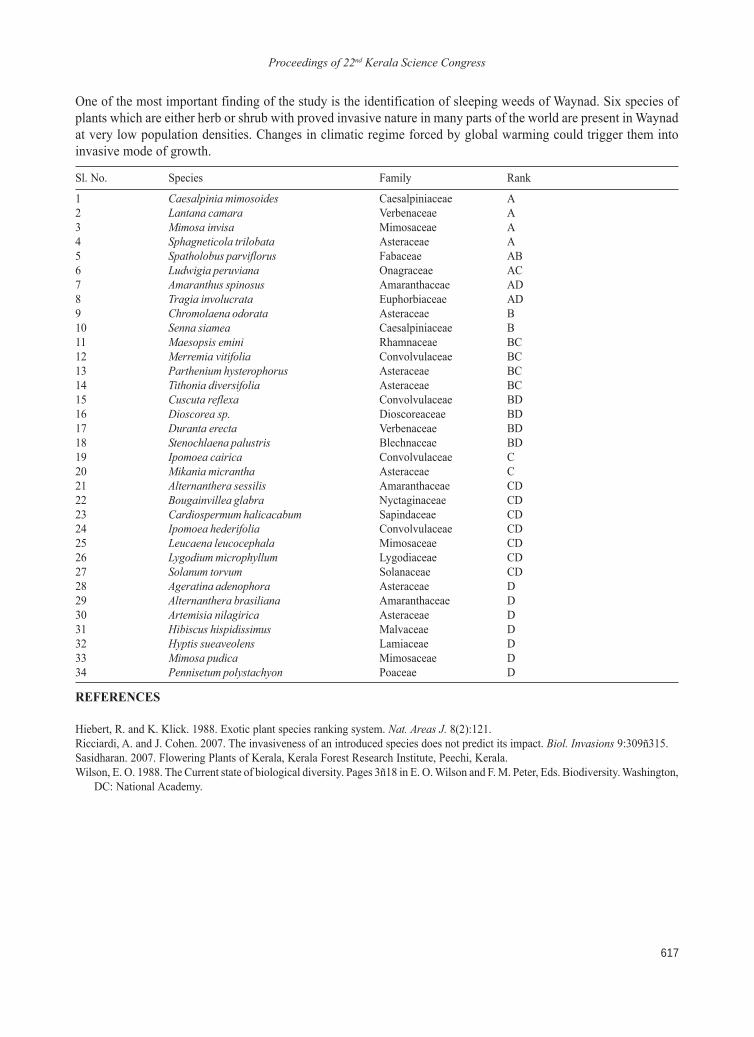
Proceedings of 22nd Kerala Science Congress
617
One of the most important finding of the study is the identification of sleeping weeds of Waynad. Six species ofplants which are either herb or shrub with proved invasive nature in many parts of the world are present in Waynadat very low population densities. Changes in climatic regime forced by global warming could trigger them intoinvasive mode of growth.
Sl. No. Species Family Rank
1 Caesalpinia mimosoides Caesalpiniaceae A2 Lantana camara Verbenaceae A3 Mimosa invisa Mimosaceae A4 Sphagneticola trilobata Asteraceae A5 Spatholobus parviflorus Fabaceae AB6 Ludwigia peruviana Onagraceae AC7 Amaranthus spinosus Amaranthaceae AD8 Tragia involucrata Euphorbiaceae AD9 Chromolaena odorata Asteraceae B10 Senna siamea Caesalpiniaceae B11 Maesopsis emini Rhamnaceae BC12 Merremia vitifolia Convolvulaceae BC13 Parthenium hysterophorus Asteraceae BC14 Tithonia diversifolia Asteraceae BC15 Cuscuta reflexa Convolvulaceae BD16 Dioscorea sp. Dioscoreaceae BD17 Duranta erecta Verbenaceae BD18 Stenochlaena palustris Blechnaceae BD19 Ipomoea cairica Convolvulaceae C20 Mikania micrantha Asteraceae C21 Alternanthera sessilis Amaranthaceae CD22 Bougainvillea glabra Nyctaginaceae CD23 Cardiospermum halicacabum Sapindaceae CD24 Ipomoea hederifolia Convolvulaceae CD25 Leucaena leucocephala Mimosaceae CD26 Lygodium microphyllum Lygodiaceae CD27 Solanum torvum Solanaceae CD28 Ageratina adenophora Asteraceae D29 Alternanthera brasiliana Amaranthaceae D30 Artemisia nilagirica Asteraceae D31 Hibiscus hispidissimus Malvaceae D32 Hyptis sueaveolens Lamiaceae D33 Mimosa pudica Mimosaceae D34 Pennisetum polystachyon Poaceae D
REFERENCES
Hiebert, R. and K. Klick. 1988. Exotic plant species ranking system. Nat. Areas J. 8(2):121.Ricciardi, A. and J. Cohen. 2007. The invasiveness of an introduced species does not predict its impact. Biol. Invasions 9:309ñ315.Sasidharan. 2007. Flowering Plants of Kerala, Kerala Forest Research Institute, Peechi, Kerala.Wilson, E. O. 1988. The Current state of biological diversity. Pages 3ñ18 in E. O. Wilson and F. M. Peter, Eds. Biodiversity. Washington,
DC: National Academy.
Proceedings of 22nd Kerala Science Congress
618
Exploratory studies of actinomycetes biodiversity of high altitude shola soils of Keralain aid of antibiotic discovery
Rinoy Varghese1, S. Nishamol1, R. Suchithra1, Devi K. Balan and A. A. Mohamed Hatha21School of Environmental Sciences, MG University, Kottayam2School of Marine Sciences, Cochin University of Science and Technology, Cochin, Kerala
INTRODUCTION
Actinomycetes are free living, spore forming, chemo-organotrophic gram-positive bacteria having high G+C contentin their DNA. They occur in a wide variety of natural and man-made habitats, growing on a vast range of substratesand widely distributed in soil. Actinomycetes are noteworthy as antibiotic producers, making three quarters of allknown antibiotic products. Diseases caused by drug resistant bacteria have become a major global healthcareproblem in the 21st century. The emergence and spread of multidrug resistant pathogens emphasize the need for thedevelopment of new antimicrobial agents. In this regard exploration of antibiotic potential of actinomycetes fromvarious environments merit focused attention and research. The present study is aimed at exploring the diversityand potential actinomycetes strains from the highland shola forest soils.
MATERIALS AND METHODS
The study area is located at the top areas of Eravikulam National Park lies between 10∫05íN - 10∫20íN latitude and77∫0íE - 77∫10íE longitude in Idukki District (Anamudy region) at an altitude of 1900 - 2400 m above MSL. Mostof the land in this area is covered by grass lands and shola. In the present study samples were collected from sixselected sites in shola forest at different altitudes.
Collection of samples, isolation, enumeration and characterization of actinomycete isolates
The soil samples were collected from the pre-fixed stations in the shola forest. Collections were carried out duringpre-monsoon, monsoon and post-monsoon seasons. Soil samples were collected from a depth of 15 to 20 cm fromthe surface after removing the top soil. Isolation and enumeration of actinomycetes were carried by standard serialdilution plate technique using Kusters Agar. Actinomycete strains which are maintained as pure culture on KustersAgar were characterized by morphological tests as per Bergeyís Manual of Determinative Bacteriology (2000) andphysiological tests (Gordon, 1967). The morphology of actinomycetes strains was examined using slide culturetechnique (Bergeyís Manual of Determinate Bacteriology, 2000).
Evaluation of antibacterial activity of the isolates using well diffusion method
Lawn cultures of different pathogens were prepared by swabbing young culture (16-18 h) in Glycerol Yeast Agar.Agar wells (3 mm dia) were punched in the plates using a sterile gel puncture. Thirty microlitres of a 4 day oldculture of all the isolated Actinomycetes strains in appropriate broth was pipetted in to separate wells and plateswere incubated for 24 h at room temperature. Zone of inhibition around the wells were recorded in mm.
RESULTS AND CONCLUSIONS
Actinomycetes load was higher in pre monsoon season followed by post monsoon and monsoon periods; thisindicated that decomposers are most active during pre monsoon season because of better soil temperature. Lower
Proceedings of 22nd Kerala Science Congress, 28-31 January 2010, KFRI, Peechi, pp. 618-619© KSCSTE 2010
08-58
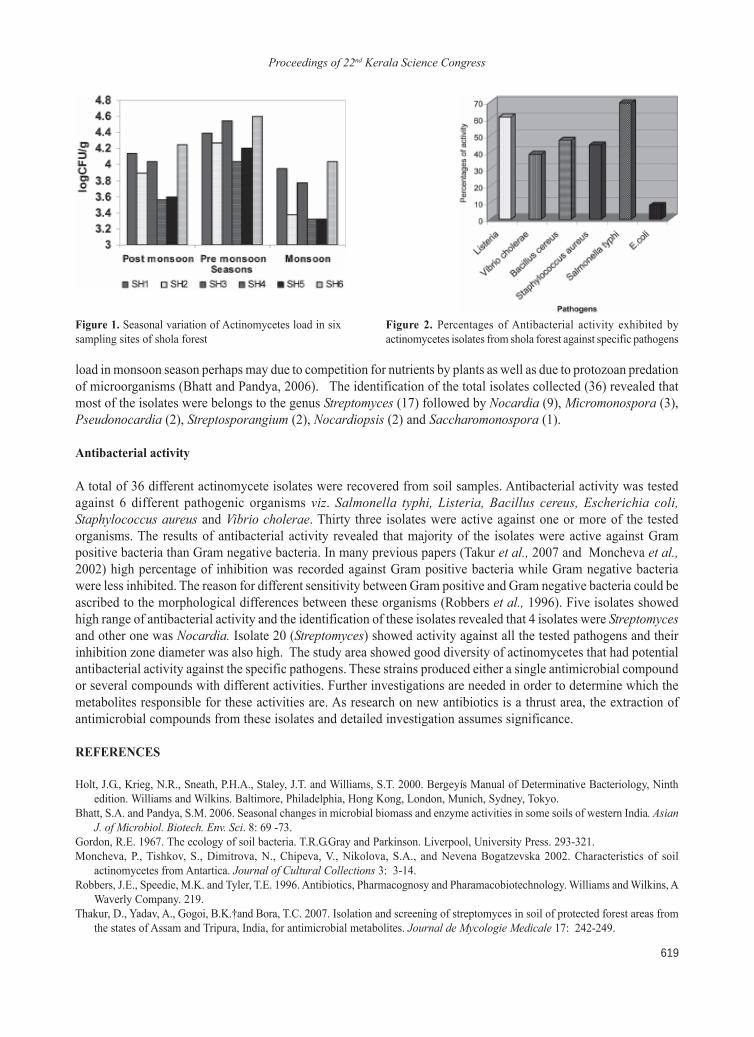
Proceedings of 22nd Kerala Science Congress
619
load in monsoon season perhaps may due to competition for nutrients by plants as well as due to protozoan predationof microorganisms (Bhatt and Pandya, 2006). The identification of the total isolates collected (36) revealed thatmost of the isolates were belongs to the genus Streptomyces (17) followed by Nocardia (9), Micromonospora (3),Pseudonocardia (2), Streptosporangium (2), Nocardiopsis (2) and Saccharomonospora (1).
Antibacterial activity
A total of 36 different actinomycete isolates were recovered from soil samples. Antibacterial activity was testedagainst 6 different pathogenic organisms viz. Salmonella typhi, Listeria, Bacillus cereus, Escherichia coli,Staphylococcus aureus and Vibrio cholerae. Thirty three isolates were active against one or more of the testedorganisms. The results of antibacterial activity revealed that majority of the isolates were active against Grampositive bacteria than Gram negative bacteria. In many previous papers (Takur et al., 2007 and Moncheva et al.,2002) high percentage of inhibition was recorded against Gram positive bacteria while Gram negative bacteriawere less inhibited. The reason for different sensitivity between Gram positive and Gram negative bacteria could beascribed to the morphological differences between these organisms (Robbers et al., 1996). Five isolates showedhigh range of antibacterial activity and the identification of these isolates revealed that 4 isolates were Streptomycesand other one was Nocardia. Isolate 20 (Streptomyces) showed activity against all the tested pathogens and theirinhibition zone diameter was also high. The study area showed good diversity of actinomycetes that had potentialantibacterial activity against the specific pathogens. These strains produced either a single antimicrobial compoundor several compounds with different activities. Further investigations are needed in order to determine which themetabolites responsible for these activities are. As research on new antibiotics is a thrust area, the extraction ofantimicrobial compounds from these isolates and detailed investigation assumes significance.
REFERENCES
Holt, J.G., Krieg, N.R., Sneath, P.H.A., Staley, J.T. and Williams, S.T. 2000. Bergeyís Manual of Determinative Bacteriology, Ninthedition. Williams and Wilkins. Baltimore, Philadelphia, Hong Kong, London, Munich, Sydney, Tokyo.
Bhatt, S.A. and Pandya, S.M. 2006. Seasonal changes in microbial biomass and enzyme activities in some soils of western India. AsianJ. of Microbiol. Biotech. Env. Sci. 8: 69 -73.
Gordon, R.E. 1967. The ecology of soil bacteria. T.R.G.Gray and Parkinson. Liverpool, University Press. 293-321.Moncheva, P., Tishkov, S., Dimitrova, N., Chipeva, V., Nikolova, S.A., and Nevena Bogatzevska 2002. Characteristics of soil
actinomycetes from Antartica. Journal of Cultural Collections 3: 3-14.Robbers, J.E., Speedie, M.K. and Tyler, T.E. 1996. Antibiotics, Pharmacognosy and Pharamacobiotechnology. Williams and Wilkins, A
Waverly Company. 219.Thakur, D., Yadav, A., Gogoi, B.K.�and Bora, T.C. 2007. Isolation and screening of streptomyces in soil of protected forest areas from
the states of Assam and Tripura, India, for antimicrobial metabolites. Journal de Mycologie Medicale 17: 242-249.
Figure 2. Percentages of Antibacterial activity exhibited byactinomycetes isolates from shola forest against specific pathogens
Figure 1. Seasonal variation of Actinomycetes load in sixsampling sites of shola forest
Proceedings of 22nd Kerala Science Congress
620
A pictorial guide to the field identification of trees of Wayanad Wildlife Sanctuary, Kerala
Mithunlal, K. A. Sujana, M. K. Ratheesh Narayanan and N. Anil KumarCommunity Agrobiodiversity Centre, M. S. Swaminathan Research Foundation, Puthurvayal, Kalpetta 673 121 Wayanad,KeralaE-mil: [email protected].
INTRODUCTION
Wayanad Wildlife Sanctuary includes four ranges, Sulthan Bathery, Kurichyad, Muthanga and Tholpetty, of whichMuthanga and Tholpetty forest ranges, holds the attention due to its importance in the tourist map of Wayanad.Mainly the vegetation represents tropical dry deciduous, moist deciduous and riparian type of forests. In the year2008 April ñ 2009 March, 99660 persons visited Muthanga of which 3355 were foreigners and 28958 were students.Sanctuary is flourished with diverse distribution of flora and fauna. In the Sanctuary one can find animals like slothbears, smbhar, elephants, monkeys, tigers, reptiles, deer, panthers etc. Even though tourists visit the Sanctuarymainly to see animals, most of them enjoy the greenery and have interest in knowing forest trees. But only a fewtrees near the forest office and the museum bear name boards. Trees like Cassine albens, Diospyros montana, foundnear the forest office, are not marked or even recognized by the forest officials. Most of the forest researchers havementioned that the enormous height, inconspicuous short duration of flowers and irregular flowering cycle posedifficulties in the verification using keys based on floral and fruit characters (Ledwig, 1992; Parthasarathy, 1992).Nevertheless, identification of trees in the field at sight is necessary. This work is intended as a pictorial fieldidentification guide by denoting mainly the trunk, leaves, flowers and fruits.
MATERIALS AND METHODS
Field trips were conducted across the sanctuary for the collection of plant species and observation of variouscharacters of trees like bole, bark, blaze, exudation, leaves, flowers and fruits. Field notes were prepared andspecimens of each tree species were collected for the proper identification and herbarium preparation. Transactwalks have been conducted through the sanctuary along with Katunaikka men to get the local names of trees and itsuses. Clear, good quality photographs of bark, blaze, twigs, flowers and fruits were taken.
RESULTS AND CONCLUSION
Our current understanding of the taxonomic diversity of the trees of Wayanad Wildlife Sanctuary revealed theoccurrence of 85 species in 70 genera of 33 families. Most dominating species are Anogeissus latifolia, Terminaliaelliptica, Terminalia paniculata, Grewia tiliifolia, Pterocarpus marsupium, Butea monosperma, and Haldinacordifolia. Rubiaceae is the largest family with eight species located in this area. Terminalia is the largest genushaving 5 species. Annonaceae, Apocynaceae, Salicaceae, Sapindaceae, Sapotaceae, Tiliaceae and Ulmaceae arereported with single species.
During the present study 7 tree species have been located exclusively endemic to Southern Western Ghats. They areHopea parviflora, Phyllanthus indofischeri, Casearia wynadensis, Hydnocarpus pentandra, Cinnamomummalabatrum, Tabernaemontana alternifolia and Lagerstroemia microcarpa. Three species viz. Terminalia paniculata,Radermachera xylocarpa and Chionanthus mala- elengi are endemic to Peninsular India. According to IUCN listof threatened plants Casearia wynadensis and Dalbergia lanceolaria are vulnerable in their entire natural habitatlocated.
Proceedings of 22nd Kerala Science Congress, 28-31 January 2010, KFRI, Peechi, pp. 620-621© KSCSTE 2010
08-59
Proceedings of 22nd Kerala Science Congress
621
Detailed observation of the bark and blaze of every tree has been made which can be used as an identification tool.Field identification characters like bark, blaze, leafy twigs, and reproductive structures of every tree have beenobserved in detail and 348 photographs taken and arranged. The format of arrangement of photographs is leafytwig, flowers/ fruits, bark, and blaze. The plates are arranged family wise in alphabetical order. This pictorialidentification guide specially emphasizes the texture and colour of the bark and blaze, and the colour and natureof exudations. Mainly 6 types of bark (smooth, rough, prickled, thorny, fissured and cracked) are categorized invariants of either grayish or brownish colour. Smooth barks were observed in 17 trees like Phyllanthus emblica,Lagerstroemia microcarpa, Kydia calycina, Ficus racemosa, Cordia obliqua etc. Prickled trunk was observed inBombax ceiba and Erythrina stricta. The trunk of Briedelia retusa, Flacourtia Montana and Scolopia crenata arethorny. Rough bark was observed in 39 trees, of which 18 were slightly or prominently fissured. 6 trees withcracked bark were enlisted. Blaze colors are mainly of three types viz. reddish, whitish yellow and brownish.Twenty seven trees with rough inner bark and 14 with smooth inner bark have been observed. Blaze of Cinnamomummalabatrum, Kydia calycina and Grewia tiliifolia are mucilaginous while that of Shorea roxburghii, FlacourtiaMontana and Diospyros Montana are having sandy texture. Thirteen trees have corky inner bark and of twenty twoare fibrous. Exudations are classified in to 4 categories based on color viz. watery/ colorless exudation, milky latex,reddish exudation, and resinous exudation. Out of 85 species, 72 were without any stem exudations. 3 species withblood reddish exudation and 7 species with milky exudation were observed. Cassine albens and Persea macranthaare having watery exudation. Along with the floral characters and other vegetative characters, the above mentionedcharacters and the photographs will be helpful in identifying the common trees of the sanctuary.
Most of the trees mentioned here are being used by Kattunaikka and other tribes of the sanctuary as diverse sourcesof medicines, food and fuel. We collected the names of trees in Kattunaikka dialect, which is a mixture of Kannadaand Malayalam. And also major ethnic uses of trees were documented. Many species having timber value arelocated including Hopea parviflora, Lagerstroemia microcarpa, Tectona grandis, Dalbergia latifolia. Resin obtainedfrom Shorea roxburghii (Jal) is used for religious and ritualistic purposes by the Kattunaikkas. Fruits of manyspecies like Tamilnadia uliginosa, Madhuca longifolia, Semecarpus anacardium etc. are edible and are used by thelocal tribes. Crushed leaves of Casearia wynadensis and Diospyros montana are used as piscicide. Trees become avaluable source for diverse remedial measures for various diseases in Kattunaikka and Mullukkuruma communitiesresiding in the area. Twenty three medicinally important trees have been located. Conservation of this traditionalknowledge can be achieved only through the conservation of these valuable tree species.
REFERENCES
Ledwig, F.T 1992. Human impact on genetic diversity in forest ecosystem. Oikos 63:87-108.Parthasarathy, N. 1992. Tree diversity in distribution in undisturbed and human impacted site tropical wet evergreen forest in Southern
Western Ghats, India, Biodiversity and Conservation 8:1365-1381.
Proceedings of 22nd Kerala Science Congress
622
Proceedings of 22nd Kerala Science Congress, 28-31 January 2010, KFRI, Peechi, pp. 622-623© KSCSTE 2010
08-60
Datura L. genetic resources of India
S. Abdul KaderDepartment of Medicinal Botany, Govt. Siddha Medical College, Arumbakkam, Chennai 600 106 Tamil Nadu
INTRODUCTION
The genus Datura L. (Solanaceae) includes herbs, shrubs and trees growing in the temperate and tropical parts ofthe world. There are more than 15 species across the globe but in India 11 species have been recorded so far(Hooker, 1885; Gamble, 1921; Somasundaram, 2006) and in Kerala, only 3 species were reported (Sasidharan,2004). All the Datura species are violently narcotic but some are medicinally used from ancient times to cureasthma, chronic coughs, to relieve pain and inflammation in glandular swellings, pains of gout and rheumatism. Ithas been observed that in almost all recent publications including many floras, text books etc., and in websites toodealing with Daturas have mistaken the species D. fastuosa L. and D. alba Nees (= D. fastuosa L. var. alba Cl.) asD. metel L., even though the earlier publications (Hooker, 1885; Gamble, 1921; Nadkarni, 1910; Kritikar and Basu,1918) clearly described that all these three species are distinct and separate. This contradictory information willlead to faulty identification of the species and will often create confusion among students, researchers and teachers,particularly so among the beginners in the field of Plant Taxonomy. Nadkarni (1910) said that though D. fastuosaL. and D. alba Nees possess same medicinal properties, the purple variety is generally regarded as the more valuable.According to Gamble (1921), D. metel L. is the most poisonous species among the Daturas. Being a Plant Biologist,I have been concerned about this confusing and contradictory information and, therefore, felt the need for correctingthe errors. Since some of the Datura species are medicinally used, the correct identification and use of differentDatura species are very important. Hence, I have undertaken a detailed study to document the distribution ofDatura species in India.
MATERIALS AND METHODS
Field exploration studies were carried out in South India particularly in Kerala and Tamil Nadu during 2006 ñ 2009.Different species of Daturas were collected and studied for their correct identity. Photographs were taken. The datasuch as habit, habitat, phenology of flowering and fruiting period etc. were recorded. Data were also gathered fromthe literature.
RESULTS AND CONCLUSIONS
The present study reports the occurrence of about 15 species of Datura viz., D. alba Nees [= D. fastuosa L. var. albaCl.], D. alba Nees var. ?, D. arborea L. [= Brugmansia arborea (L.) Lagerh.], D. aurea (Lagerh.) Saff. [= Brugmansiaaurea Lagerh.; Datura affinis Safford], D. discolor Bernh., D. dubia G. [= D. fastuosa L. var. dubia?], D. fastuosaL., D. ferox L. [= D. quercifolia Kunth], D. innoxia Mill., D. metel L., D. sanguinea Ruiz. and Pav. [= Brugmansiasanguinea (Ruiz. and Pav.) D. Don], D. stramonium L., D. suaveolens Willd. [= Brugmansia suaveolens (Willd.)Berchtold and Presl], D. tatula L. [= D. stramonium L. var. tatula (L.) Cl.] and D. sps. in India. Of these, eightspecies viz., D. alba Nees, D. arborea L., D. discolor Bernh., D. dubia G. ?, D. fastuosa L., D. metel L., D. stramoniumL. and D. alba Nees var.? occur in Kerala. While in Tamil Nadu, in addition to these 8 species, 5 more species viz.,D. aurea (Lagerh.) Saff., D. ferox L., D. sanguinea Ruiz. and Pav., D. suaveolens Willd. and an unidentified D. sps.(growing in Pulney and Nilgiris hills naturally?) occur. The distinguishing characters of different species of Daturaare given in Table 1.
Proceedings of 22nd Kerala Science Congress
623
J. D. Hooker (1885) had reported 6 species viz., D. stramonium L., D. stramonium L. var. tatula L. (= D. tatulaWilld.), D. fastuosa L., D. fastuosa L. var. alba L. (= D. alba Nees), D. fastuosa L. var. dubia ? (= D. dubia G.), andD. metel L. in his compilation ëFlora of British Indiaí. Subsequently, Gamble (1921) while compiling the ëFlora ofthe Presidency of Madrasí which includes the parts of four Southern States like, Andhra Pradesh, Karnataka, Keralaand Tamil Nadu had also described 6 species but with two additional exotics viz., D. stramonium L., D. fastuosa L.,D. alba Nees, D. metel L., D. arborea L. and D. sanguinea Ruiz. and Pav. Recently, Somasundaram (2006) hasmentioned 9 species viz., D. stramonium L., D. innoxia Mill., D. discolor Bernh., D. ferox L., D. arborea L., D.metel L. (= D. fastuosa L.; D. alba Nees) and D. sps. in his publication ëTaxonomy of Angiosperms [MedicinalBotany, Part ñ 2]í. Of these, in Kerala, only three species viz., D. arborea L., D. metel L. (= D. fastuosa L.; D.fastuosa L. var. alba Cl.; D. alba Nees) and D. stramonium L. (= D. stramonium L. var. tatula Cl.; D. tatula L.; D.inermis Jacq.; D. laevis L.f.; D. bertolonii Paxt. ex Guss; D. ferox Nees and D. wallichii Dunal) have been reportedby Sasidharan (2004) in his publication ëBiodiversity Documentation for Kerala ñ Part 6 : Flowering Plantsí.
As I said earlier, in almost all recent publications, such as ëTreatise on Indian Medicinal Plantsí (Chatterjee andPakrashi, 1995), ëIndian Medicinal Plants: a compendium of 500 speciesí (Vaidyaratnam P. S. Varierís Arya VaidyaSala, 1994), ëThe Useful Plants of Indiaí (CSIR, 1986), ëDatabase on Medicinal Plants used in Ayurvedaí (Sharmaet al., 2001), ëBiodiversity Documentation for Kerala ñ Part 6: Flowering Plantsí (Sasidharan, 2004), and in almostall Botany textbooks including ëTaxonomy of Angiosperms [Medicinal Botany, Part ñ 2]í (Somasundaram, 2006)and ëMedical Taxonomy of Angiosperms: Recent Trends in Medicinal uses and Chemical Constituentsí(Sankaranarayanan, 2009) the species D. metel L. was often used as synonym for D. fastuosa L. and its varieties, inspite of, the earlier publications like ëFlora of British Indiaí by Hooker (1885), ëIndian Medicinal Plantsí by Kritikarand Basu (1918) and ëFlora of the Presidency of Madrasí by Gamble (1921) which very clearly described that D.metel L., D. fastuosa L. and its varieties are different and distinct species.
The study, based on the observations and data collected, thus conclude that D. metel L. is a distinct species and isdifferent from D. fastuosa L. and D. alba Nees (= D. fastuosa L. var. alba Cl.). The species medicinally used in thename of D. metel L. in Kerala and Tamil Nadu and possibly throughout the country is D. fastuosa L. and D. albaNees. Again, one more variety of D. fastuosa L. with white flowers having longer style than its stamens (probablyD. dubia?) is also used medicinally in these areas. One can easily recognize D. metel L. by its grayish or purplishcolour, soft hairs all over the plant body, the large persistent reflexed calyx base on the fruit, the sharp long capsule-spines and the foul odor emitting from the plant body when crushed or bruised. In fact, D. metel L. prefer to growin dry areas and thus it is very common throughout Tamil Nadu. On the contrary, D. alba Nees (green stemmed butsometimes light purple coloured at the nodes only) and D. dubia?, D. fastuosa L. (dark purple coloured) prefermoist localities or grow in high rain fall areas and therefore the former two species are abundantly found in Kerala.Moreover, today, D. fastuosa L. is not a common species in both the States.
REFERENCES
Chatterjee, A. and Pakrashi, S.C. 1995. The Treatise on Indian Medicinal Plants. Publications and Information Directorate, New Delhi.Vol. 4.325p.
CSIR 1986. The Useful Plants of India. National Institute of Science Communication, 918p.Gamble, J.S. 1921. Flora of the Presidency of Madras (Reprint). Bishen Singh Mahendra Pal Singh, Dehra Dun, India. Vol. II. 577p.Hooker, J.D. 1885. Flora of British India. Vol. IV. (Reprint) International Book Distributors, Dehra Dun. 780p.Kritikar, K.R. and Basu, B.D. 1918. Indian Medicinal Plants ñ Text. Vol. III. (Reprint) International Book Distributors, Dehra Dun.
1593 ñ 2393.Sankaranarayanan, S. 2009. Medical Taxonomy of Angiosperms: Recent Trends in Medicinal uses and Chemical Constituents. Harishi
Publications, Chennai. 866 p.Sasidharan, N. 2004. Biodiversity documentation for Kerala. Part 6: Flowering Plants. Kerala Forest Research Institute, Peechi. 702p.Sharma, P.C. Yelne, M.B. and Dennis, T.J. 2001. Database on Medicinal Plants used in Ayurveda. Vol. 2. Central Council for Research
in Ayurveda and Siddha, Govt. of India, New Delhi. 200p.Somasundaram, S. 2006. Taxonomy of Angiosperms [Medicinal Botany, Part-2]. Elangovan Printers, Palayamkottai. 243p.Vaidyaratnam PS Varierís Arya Vaidya Sala 1994. Indian Medicinal Plants: a Compendium of 500 species. Vol. 2. Orient Longman
Limited, Madras. 416p.
Proceedings of 22nd Kerala Science Congress
624
First report on the phytoplankton flora of Mullaperiyar - a tropical high altitude lake inthe Western Ghats of Kerala
R. Jithesh KrishnanDepartment of Botany, Catholicate College, Pathanamthitta, KeralaE-mail: [email protected]
INTRODUCTION
Fresh water lakes situated in the Western Ghat region of India were little explored for their Phytoplankton. Periyarlake, in the Idukki District is the largest (26 km2 area) and oldest (built in 1895) reservoir-lake constructed in Keralato irrigate the plains of Tamil Nadu. The Mullaperiyar dam was constructed near the confluence of Periyar (244km) and Mullayar. This study was designed to understand the micro-flora of the Lake, which was not yet explored,and will give information about the biology of the water bodies in the Western Ghats (one of the 18 biodiversityhotspots of the world), majority of them are parts of international tourist centers.
MATERIALS AND METHODS
The lake is situated at the centre of PTR (core environment of the precious wildlife of the ìProject Tigerî andìProject Elephantî sanctuary),and it lies between 09í16í and 09í40 N latitude, and 76í55í and 77í26íE longitude,and an altitude of 1525m above mean sea level. Three stations were fixed in the lake. They were P-1 (boat landing),P-2 (Mullaperiyar dam), and P-3 (confluence of Mullayar and Periyar). The stations were sampled between January2004 and December 2005. Free floating plankton, Benthic algae, and Periphyton were collected and examined.Samples for free floating plankton were collected from the surface water (1-2cm) in 1L, clean wide mouthed plasticjars and were centrifuged to concentrate the planktonic organisms, before counting. Epiphytes were gathered bycollecting the micro algae colonized on angiosperm plants along the shorelines of the lake, and were kept in 100 mldistilled water in clean plastic bottles. Benthos was collected from the surface sediments using a 50 ml (2cm wide)syringe from the shores. Two representative samples (having 50 ml) for benthos analysis were collected from eachlocation (50 ml x 50 ml=100ml). All the samples were fixed in Lugolís iodine solution immediately after collection(1ml: 10 ml) according to APHA (1980). The phytoplankton were enumerated by Lackeyís drop method (APHA,1980) in the Laboratory using an inverted microscope, having 45 x magnifications and were identified using thestandard keys provided by Reynolds (1984), and Subrahmanyan (1946).
RESULTS AND CONCLUSIONS
A total of 59 taxa of Phytoplankton were identified from different representative samples. Among them 54 wereidentified up to the species level and five were identified only up to the Genus level.
Planktonic assemblage
Among the planktons 60 per cent of the total planktons identified include Diatoms, 30 per cent Desmids and 10 percent Cyanophyceae (Table-1). Major species among the Diatom noticed was Melosira granulata, which dominatedthe whole year in the lake. The filament integration of this centric diatom varied with season. During rainy seasonwith flood, Melosira showed 6 to 8 celled and large sized filaments. While during other seasons filament size andcell numbers decreased (3 to 4). The second most abundant plankton noticed was Staurastrum paradoxum
Proceedings of 22nd Kerala Science Congress, 28-31 January 2010, KFRI, Peechi, pp. 624-626© KSCSTE 2010
08-61
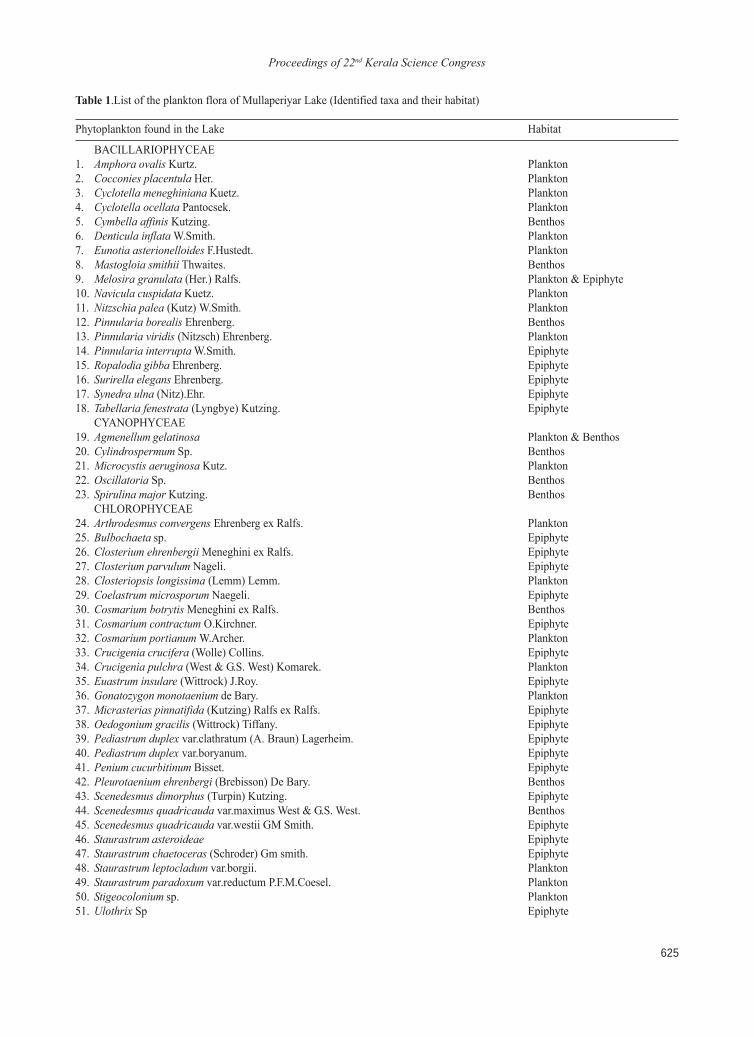
Proceedings of 22nd Kerala Science Congress
625
Table 1.List of the plankton flora of Mullaperiyar Lake (Identified taxa and their habitat)
Phytoplankton found in the Lake Habitat
BACILLARIOPHYCEAE1. Amphora ovalis Kurtz. Plankton2. Cocconies placentula Her. Plankton3. Cyclotella meneghiniana Kuetz. Plankton4. Cyclotella ocellata Pantocsek. Plankton5. Cymbella affinis Kutzing. Benthos6. Denticula inflata W.Smith. Plankton7. Eunotia asterionelloides F.Hustedt. Plankton8. Mastogloia smithii Thwaites. Benthos9. Melosira granulata (Her.) Ralfs. Plankton & Epiphyte10. Navicula cuspidata Kuetz. Plankton11. Nitzschia palea (Kutz) W.Smith. Plankton12. Pinnularia borealis Ehrenberg. Benthos13. Pinnularia viridis (Nitzsch) Ehrenberg. Plankton14. Pinnularia interrupta W.Smith. Epiphyte15. Ropalodia gibba Ehrenberg. Epiphyte16. Surirella elegans Ehrenberg. Epiphyte17. Synedra ulna (Nitz).Ehr. Epiphyte18. Tabellaria fenestrata (Lyngbye) Kutzing. Epiphyte
CYANOPHYCEAE19. Agmenellum gelatinosa Plankton & Benthos20. Cylindrospermum Sp. Benthos21. Microcystis aeruginosa Kutz. Plankton22. Oscillatoria Sp. Benthos23. Spirulina major Kutzing. Benthos
CHLOROPHYCEAE24. Arthrodesmus convergens Ehrenberg ex Ralfs. Plankton25. Bulbochaeta sp. Epiphyte26. Closterium ehrenbergii Meneghini ex Ralfs. Epiphyte27. Closterium parvulum Nageli. Epiphyte28. Closteriopsis longissima (Lemm) Lemm. Plankton29. Coelastrum microsporum Naegeli. Epiphyte30. Cosmarium botrytis Meneghini ex Ralfs. Benthos31. Cosmarium contractum O.Kirchner. Epiphyte32. Cosmarium portianum W.Archer. Plankton33. Crucigenia crucifera (Wolle) Collins. Epiphyte34. Crucigenia pulchra (West & G.S. West) Komarek. Plankton35. Euastrum insulare (Wittrock) J.Roy. Epiphyte36. Gonatozygon monotaenium de Bary. Plankton37. Micrasterias pinnatifida (Kutzing) Ralfs ex Ralfs. Epiphyte38. Oedogonium gracilis (Wittrock) Tiffany. Epiphyte39. Pediastrum duplex var.clathratum (A. Braun) Lagerheim. Epiphyte40. Pediastrum duplex var.boryanum. Epiphyte41. Penium cucurbitinum Bisset. Epiphyte42. Pleurotaenium ehrenbergi (Brebisson) De Bary. Benthos43. Scenedesmus dimorphus (Turpin) Kutzing. Epiphyte44. Scenedesmus quadricauda var.maximus West & G.S. West. Benthos45. Scenedesmus quadricauda var.westii GM Smith. Epiphyte46. Staurastrum asteroideae Epiphyte47. Staurastrum chaetoceras (Schroder) Gm smith. Epiphyte48. Staurastrum leptocladum var.borgii. Plankton49. Staurastrum paradoxum var.reductum P.F.M.Coesel. Plankton50. Stigeocolonium sp. Plankton51. Ulothrix Sp Epiphyte
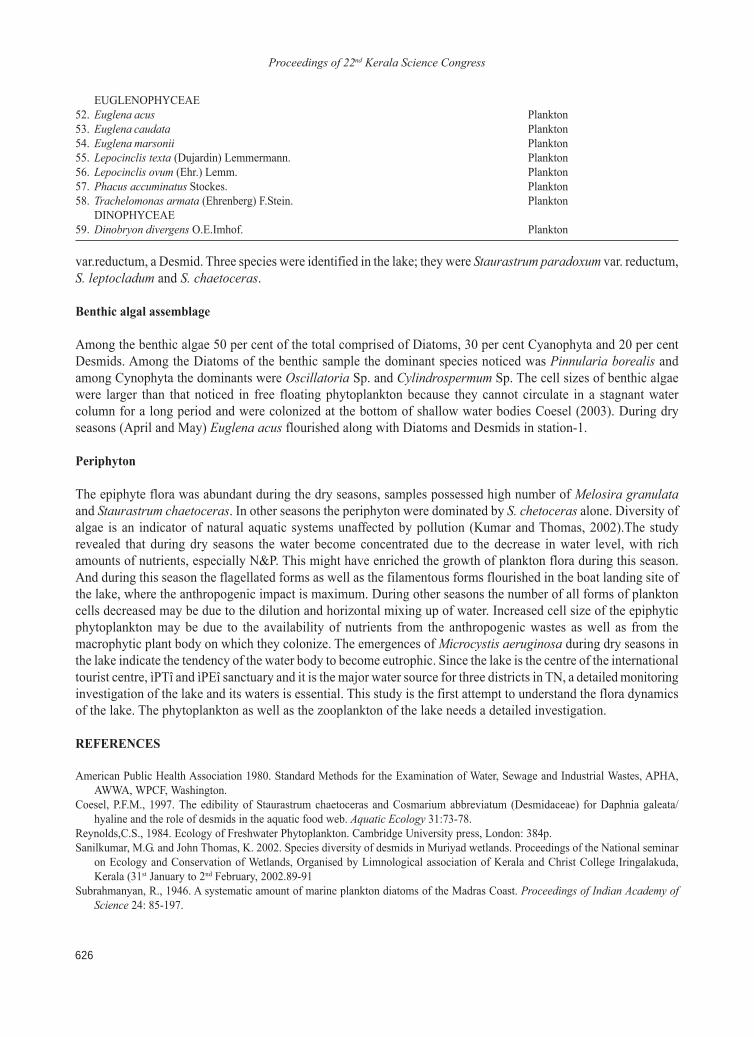
Proceedings of 22nd Kerala Science Congress
626
var.reductum, a Desmid. Three species were identified in the lake; they were Staurastrum paradoxum var. reductum,S. leptocladum and S. chaetoceras.
Benthic algal assemblage
Among the benthic algae 50 per cent of the total comprised of Diatoms, 30 per cent Cyanophyta and 20 per centDesmids. Among the Diatoms of the benthic sample the dominant species noticed was Pinnularia borealis andamong Cynophyta the dominants were Oscillatoria Sp. and Cylindrospermum Sp. The cell sizes of benthic algaewere larger than that noticed in free floating phytoplankton because they cannot circulate in a stagnant watercolumn for a long period and were colonized at the bottom of shallow water bodies Coesel (2003). During dryseasons (April and May) Euglena acus flourished along with Diatoms and Desmids in station-1.
Periphyton
The epiphyte flora was abundant during the dry seasons, samples possessed high number of Melosira granulataand Staurastrum chaetoceras. In other seasons the periphyton were dominated by S. chetoceras alone. Diversity ofalgae is an indicator of natural aquatic systems unaffected by pollution (Kumar and Thomas, 2002).The studyrevealed that during dry seasons the water become concentrated due to the decrease in water level, with richamounts of nutrients, especially N&P. This might have enriched the growth of plankton flora during this season.And during this season the flagellated forms as well as the filamentous forms flourished in the boat landing site ofthe lake, where the anthropogenic impact is maximum. During other seasons the number of all forms of planktoncells decreased may be due to the dilution and horizontal mixing up of water. Increased cell size of the epiphyticphytoplankton may be due to the availability of nutrients from the anthropogenic wastes as well as from themacrophytic plant body on which they colonize. The emergences of Microcystis aeruginosa during dry seasons inthe lake indicate the tendency of the water body to become eutrophic. Since the lake is the centre of the internationaltourist centre, ìPTî and ìPEî sanctuary and it is the major water source for three districts in TN, a detailed monitoringinvestigation of the lake and its waters is essential. This study is the first attempt to understand the flora dynamicsof the lake. The phytoplankton as well as the zooplankton of the lake needs a detailed investigation.
REFERENCES
American Public Health Association 1980. Standard Methods for the Examination of Water, Sewage and Industrial Wastes, APHA,AWWA, WPCF, Washington.
Coesel, P.F.M., 1997. The edibility of Staurastrum chaetoceras and Cosmarium abbreviatum (Desmidaceae) for Daphnia galeata/hyaline and the role of desmids in the aquatic food web. Aquatic Ecology 31:73-78.
Reynolds,C.S., 1984. Ecology of Freshwater Phytoplankton. Cambridge University press, London: 384p.Sanilkumar, M.G. and John Thomas, K. 2002. Species diversity of desmids in Muriyad wetlands. Proceedings of the National seminar
on Ecology and Conservation of Wetlands, Organised by Limnological association of Kerala and Christ College Iringalakuda,Kerala (31st January to 2nd February, 2002.89-91
Subrahmanyan, R., 1946. A systematic amount of marine plankton diatoms of the Madras Coast. Proceedings of Indian Academy ofScience 24: 85-197.
EUGLENOPHYCEAE52. Euglena acus Plankton53. Euglena caudata Plankton54. Euglena marsonii Plankton55. Lepocinclis texta (Dujardin) Lemmermann. Plankton56. Lepocinclis ovum (Ehr.) Lemm. Plankton57. Phacus accuminatus Stockes. Plankton58. Trachelomonas armata (Ehrenberg) F.Stein. Plankton
DINOPHYCEAE59. Dinobryon divergens O.E.Imhof. Plankton
Proceedings of 22nd Kerala Science Congress
627
Proceedings of 22nd Kerala Science Congress, 28-31 January 2010, KFRI, Peechi, pp. 627-628© KSCSTE 2010
08-62
Allelopathic studies on two invasive weeds in Kerala: Lantana camara L. and Partheniumhysterophorus L.
Varun R. Menon*, Sajna Kolappatta and Bosco LawarenceSree Neelakanta Government Sanskrit College, Pattambi, Palakkad, Kerala
INTRODUCTION
Lantana camara L. and Parthenium hysterophorus L. belonging to the angiospermic families Verbenaceae andLamiaceae respectively are two major invasive weeds in kerala. These weeds along with other exotic species suchas Chromolaena odorata, Mikania micrantha, Adenophora ageratina, Hypos capitata and Mimosa invisa haveextensively invaded the degraded forest areas and wastelands. Invasive alien species have become a serious threatto plant biodiversity in many parts of the world. Globally, invasive plant species are considered one of the largestthreats to biodiversity, second only to habitat loss. (Rice 1984) The present study aims to analyze the allelopathiceffects of these plants on a leguminous plant and a Poacean member.
MATERIALS AND METHODS
Commercially available bulbs of Allium cepa having chromosome No: 2n=16 was used for the experiment. Freshand healthy leaf, stem and root from L. camara and P. hysterophorus were collected and were ground in a mixergrinder and diluted. Fresh and healthy onion bulbs were rooted in Petri plates. A control was also maintained incotton moistened with distilled water. To study the effect of extract on mitosis of root tip cells, 12 hours treatmentwas conducted. The root tips were collected and fixed in Carnoyís fluid, treated in 1N HCl and stained in acetocarmineand observed under compound microscope. From this temporary preparation the percentage of abnormalities andmitotic index were calculated.
Commercially available pea Vigna unguiculata seeds were selected and soaked in the three different concentrationsof the extracts and control was maintained in distilled water. After 24 hours the soaked seeds were sown (10 each)in Petri dishes having cotton moistened with corresponding concentrations of plant extracts. The germination wasobserved in the following days and the length of radicle and plumule of germinated seeds were measured on thefourth day. From the obtained data, percentage of germination & GRI was calculated using the formula;
Growth relative index (GRI) = Xn (k-n)Where, n = No: of days; Xn = No: of seeds germinated on n
th day; k= No: of counts
The rice used for the study was Oryza sativa var. jyothi. The seeds were germinated in 15 ml of different concentrationsof aqueous extracts. Each treatment had seven replicas. On the fourth day the number of germinated seeds werecounted and the root and shoot lengths were measured. Measurements were taken ion the 14th day also.
RESULTS AND CONCLUSIONS
Cytotoxic effects of L. camara and P. hysterophorus on A. cepa root tip cells
The control material showed a decreased mitotic index (10.8) than 10 per cent leaf extract (16.45). But the 20 per centleaf extract had slight decrease (10.9) in mitotic index than the control. This may be due to the composting effect ofcrude extract (Quasem, 1995).The 10 per cent stem extract showed a decreased mitotic index (4.3) than the control. 20
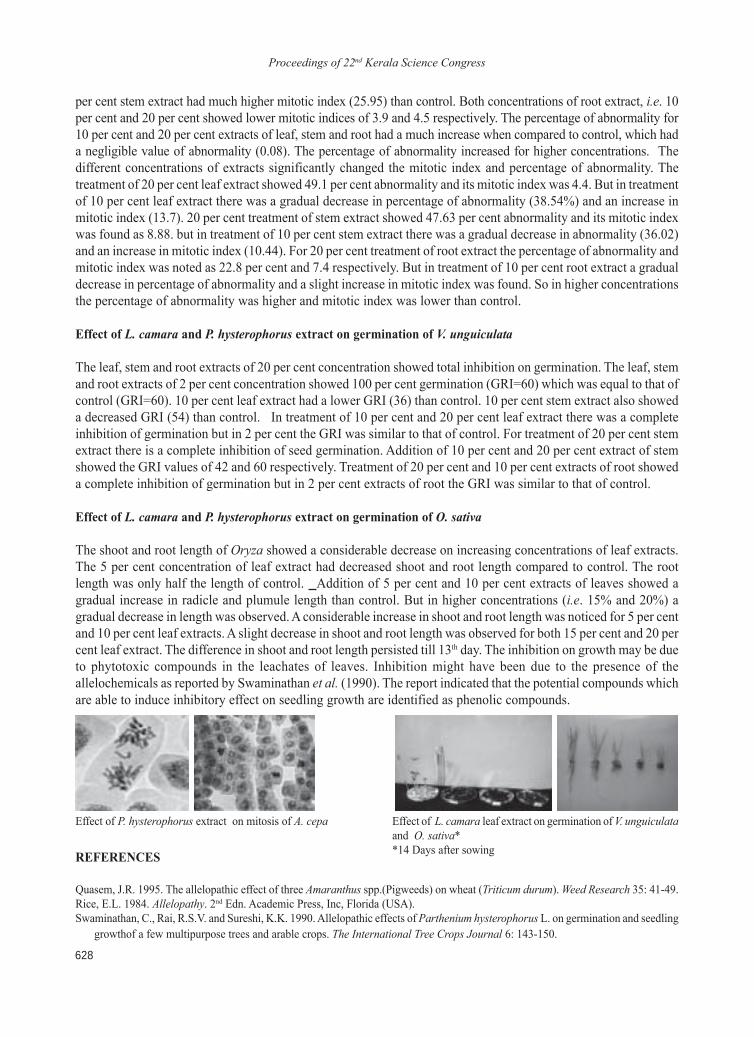
Proceedings of 22nd Kerala Science Congress
628
Effect of P. hysterophorus extract on mitosis of A. cepa Effect of L. camara leaf extract on germination of V. unguiculataand O. sativa**14 Days after sowing
per cent stem extract had much higher mitotic index (25.95) than control. Both concentrations of root extract, i.e. 10per cent and 20 per cent showed lower mitotic indices of 3.9 and 4.5 respectively. The percentage of abnormality for10 per cent and 20 per cent extracts of leaf, stem and root had a much increase when compared to control, which hada negligible value of abnormality (0.08). The percentage of abnormality increased for higher concentrations. Thedifferent concentrations of extracts significantly changed the mitotic index and percentage of abnormality. Thetreatment of 20 per cent leaf extract showed 49.1 per cent abnormality and its mitotic index was 4.4. But in treatmentof 10 per cent leaf extract there was a gradual decrease in percentage of abnormality (38.54%) and an increase inmitotic index (13.7). 20 per cent treatment of stem extract showed 47.63 per cent abnormality and its mitotic indexwas found as 8.88. but in treatment of 10 per cent stem extract there was a gradual decrease in abnormality (36.02)and an increase in mitotic index (10.44). For 20 per cent treatment of root extract the percentage of abnormality andmitotic index was noted as 22.8 per cent and 7.4 respectively. But in treatment of 10 per cent root extract a gradualdecrease in percentage of abnormality and a slight increase in mitotic index was found. So in higher concentrationsthe percentage of abnormality was higher and mitotic index was lower than control.
Effect of L. camara and P. hysterophorus extract on germination of V. unguiculata
The leaf, stem and root extracts of 20 per cent concentration showed total inhibition on germination. The leaf, stemand root extracts of 2 per cent concentration showed 100 per cent germination (GRI=60) which was equal to that ofcontrol (GRI=60). 10 per cent leaf extract had a lower GRI (36) than control. 10 per cent stem extract also showeda decreased GRI (54) than control. In treatment of 10 per cent and 20 per cent leaf extract there was a completeinhibition of germination but in 2 per cent the GRI was similar to that of control. For treatment of 20 per cent stemextract there is a complete inhibition of seed germination. Addition of 10 per cent and 20 per cent extract of stemshowed the GRI values of 42 and 60 respectively. Treatment of 20 per cent and 10 per cent extracts of root showeda complete inhibition of germination but in 2 per cent extracts of root the GRI was similar to that of control.
Effect of L. camara and P. hysterophorus extract on germination of O. sativa
The shoot and root length of Oryza showed a considerable decrease on increasing concentrations of leaf extracts.The 5 per cent concentration of leaf extract had decreased shoot and root length compared to control. The rootlength was only half the length of control. Addition of 5 per cent and 10 per cent extracts of leaves showed agradual increase in radicle and plumule length than control. But in higher concentrations (i.e. 15% and 20%) agradual decrease in length was observed. A considerable increase in shoot and root length was noticed for 5 per centand 10 per cent leaf extracts. A slight decrease in shoot and root length was observed for both 15 per cent and 20 percent leaf extract. The difference in shoot and root length persisted till 13th day. The inhibition on growth may be dueto phytotoxic compounds in the leachates of leaves. Inhibition might have been due to the presence of theallelochemicals as reported by Swaminathan et al. (1990). The report indicated that the potential compounds whichare able to induce inhibitory effect on seedling growth are identified as phenolic compounds.
REFERENCES
Quasem, J.R. 1995. The allelopathic effect of three Amaranthus spp.(Pigweeds) on wheat (Triticum durum). Weed Research 35: 41-49.Rice, E.L. 1984. Allelopathy. 2nd Edn. Academic Press, Inc, Florida (USA).Swaminathan, C., Rai, R.S.V. and Sureshi, K.K. 1990. Allelopathic effects of Parthenium hysterophorus L. on germination and seedling
growthof a few multipurpose trees and arable crops. The International Tree Crops Journal 6: 143-150.
Proceedings of 22nd Kerala Science Congress
629
Biochemical aspects of coir pith degraded by Pleurotus sajor caju
Abesh Reghuvaran and Anita Das Ravindranath1Rajiv Gandhi Chair in Contemporary Studies,School of Environmental Studies, CUSAT, Ernakulam-22 Kerala1Central Coir Research Institute, Kalavoor, Alappuzha
INTRODUCTION
India is the leading producers of coconut. It is an important oil seed and cash crop grown in south Indian statesespecially in Kerala, Tamil Nadu and Karnataka. About 7.5◊ 105 tons of coir pith is produced annually in India(Pillai et al., 1952). It is available either from retted or unretted processing industries of coir fiber, where for everyton of fiber extracted, the coir dust is produced to the extent of 2 tons. Coir pith constitutes as much as 70 percentof the coconut husk. It is estimated that, at present there is an accumulated stock of 10◊106 metric tons of coir pithin the southern states of India. Fiber extracted from husk is used in production of mats, matting, rubberized coirmattresses, yarn, ropes etc. After extraction of coir fiber from husk, the, coir pith is unutilized. Coir pith is knownas coir dust and is the major byproduct of the coir fiber extraction industries. It has a high water holding capacity of8 times its weight. It is a fluffy, light, spongy material with increased water-holding capacity and extremelycompressive and has a sizable percentage of combustible matter along with low ash content. It is essentially alignocellulosic material that decomposes very slowly in soil, because its pentosan/lignin ratio is 1:0.30; the minimumrequired for moderately fast decomposition in the soil is 1:0.50. It should be noted that coir pith is resistant tobiodegradation due to the presence of lignin (33%-35%). Lignins constitute the second most abundant group ofbiopolymers in the biosphere. It is estimated that the planet currently contains 3◊1011 metric tons of lignin with anannual biosynthetic rate of approximately 2◊1010 tons (Argyropoulos and Menachem, 1997). It is an aromaticpolymer composed of phenyl propane subunits including coumaryl, guaicyl and syringyl moeities that are covalentlylinked together by a variety of bonds, mainly ≤-aryl ether bonds. It is also present in the fiber and is responsible forthe stiffness of coir. Oyster mushroom belonging to Pleurotus species has the ability to degrade lignin slowly underfavorable conditions. This is reason for the selection of a suitable species of Basidiomycetes fungus called P. sajor-caju, which has the ability to slowly degrade. The cellulosic compounds present in the coir waste support the initialgrowth of this fungus and acts as co-substrate for lignin degradation.
MATERIALS AND METHODS
Coir pith collected from the fibre extracted units in areas of Cherthala, Alappuzha district in Kerala was used in thestudy. The Pleurotus procured from the Microbiology Division of Central Coir Research Institute (CCRI), Alappuzha.The experimental protocol and biochemical analysis of coir pith was carried out at Rajiv Gandhi Chair inContemporary Studies, Cochin University of Science and Technology (CUSAT) during September 2008 to November2008. One 1 Kg of washed coir pith in duplicates were laid on a shady area. Added 12 g of Pleurotus sajor cajuspawn was thoroughly mixed with the sample of coir pith. To this add 5 g of urea. The heap was moistened bysprinkling water to maintain moisture to 200 per cent and monitored for 30 days. The composted coir pith wassubjected to analysis for lignin content, Organic Cabon content, NPK, formation of phenolic compounds such asresorcinol, guaicol and catechol. Lignin was estimated by Modefied Klason lignin assay method, Nitrogen wasestimated by Kjeldahl method, the estimation of Phosphorous was done with Spectrophotometry, potassium byFlame photometry and the estimation of phenolics by Thin Layer Chromatography.
RESULTS AND CONCLUSION
The lignin content, pH and organic carbon of coir pith before and after decomposition with the mushroom species
Proceedings of 22nd Kerala Science Congress, 28-31 January 2010, KFRI, Peechi, pp. 629-630© KSCSTE 2010
08-63
Proceedings of 22nd Kerala Science Congress
630
were estimated. The lignin content of raw coir pith has observed as 48.8 per cent lignin. Whereas the coir pith whentreated with P. sajor caju, the lignin content showed varying levels. The decomposition is to 30.4 per cent. Thisshows the interesting fact from the Klason-lignin assay revealed an interesting fact. It is observed that the amountof lignin in the sample first increased from 48 per cent to 54. per cent in the first five days. Then the amount oflignin started decreasing and in a span of thirty days the lignin content decreased to about 30 per cent. The decreasein lignin content can be explained by the hypothesis that may be the fungi first extracts all the lignin from the cellsand then acts on it. Our experiment proved that by the action of P. sajor caju the amount of lignin could be reducedfrom 48 per cent to 30.4 per cent. It is also seen that the action of P. sajor caju on the washed sample of coir pith ismore than that on the unwashed sample. This can be explained by the fact that washing exposes the cell walls thusincreasing the surface area for decomposition. The pH of the raw coir pith on 15 th day and 30 th day of compostingdid not show any variation and it remained at 6.3. The pH was showed acidic and at no point of time it was eitherneutral or towards alkaline, however without the difference, it was not significant. The organic carbon content ofcoir pith on 15 th and 30 th day did not show any variation and it was 26.28 per cent. Where as the values undertreatment at time intervals showed variation. The organic carbon content of coir pith after 15 days of treatment withP. sajor caju showed that a decrease in the carbon content from 6.28 to 6.17 and the 30 th day sample shows thereduction of carbon up to 6.16 per cent. This shows the organic carbon in the pith is utilized by the organism andbreak down to form its products. Nitrogen, Phosphorous and Potassium (NPK) content of raw and treated coir pithwith mushroom species (P. sajor caju) on 15 th and 30 th day of composting are presented in Table . The results ofthe study revealed some interesting information on different variables on account of decomposition. The nitrogencontent of the raw coir pith was 0.73 per cent, but after the treatment of 15 days of treatment, the amount of thesame is increased to 0.84 per cent and which is again increased to 0.86 per cent. In the case of Phosphorous, the rawcoir pith holds 0.24 per cent and which in reach to 0.29 per cent in 15 th day and which again increased to 0.48 percent after the time of composting(30 th day). The same enrichment of the nutrient amount is also observed in thecase of Potassium also the, it accounts 0.28 per cent Potassium in the case of raw coir pith. After the degradation of15 days it was increased to 0.42 per cent. But there was a bit reduced amount of Potassium was observed when itreached to the 30 th day (0.41%).
The Thin Chromatographic results of the standards and the coir pith samples are given in the table III. Spottedsamples of coir pith along with Phenolic standards such as Resorcinol, Guaicol and Catechol. On Comparing theRf values(Retension factor) of raw and coir pith samples, with these standards we can interpret the presence ofphenolic compounds. It is very evident from the results that upto the fifteenth day sample, only one spot wasobtained whose value corresponded to the value of Catechol and Guaicol. On the twenty-fifth and thirtieth daysample, three spots were obtained corresponding to Catechol, Guaicol and Resorcinol. Thus it can be suggestedthat these phenolic compounds are formed during the degradation of coir pith. It can also stated that these compoundsare the breakdown products of lignin thus decreasing the total lignin content. Thus, the present study confirms thatthe mushroom species, P. sajor caju influences lignin degradation effectively. Coir pith is highly non-degradablemainly due to the presence of high percentage of lignin. It is one of the major pollutants of land and water in southIndian states. Our work find application in such places. From our work we can conclude that by the action of P.sajor caju, the amount of lignin in the coir pith can be reduced considerably thus converting the waste pith into auseful product in an eco-friendly manner. The product obtained after bio-degradation can be used as manure and ashydroponic systems for growing roses and vegetables.
REFERENCES
Abesh Reghuvaran, Anita Das Ravindranath, Natarajan,P. and Arun Augustine. 2009. Substitution of Urea with Fungi and Nitrogenfixing bacteria for composting Coir Pith. Madras Agric. J. 96(1-6): 144-149.
Arora, D.S., Chander, M. and Gill, P.K. 2002. Involvement of lignin peroxidase,manganese peroxidase and laccase in the degradationand selective ligninolysis of wheat straw.Int. Biotetior. Biodegrad. 50: 115-120.
Argypropoulos, D.S. and Menachem, S.B.1997. Lignin. Adv. Biochem. Bioengn. Biotechnol. 57: 128-159.Cullen, D. and Kersten, P.J. 2004. Enzymology and Molecular Biology of Lignin Degradation second edition. Biochemi. Molec. Biology.
249-263.Pillay, K.S. and Warrier, N.S. 1952. Coconut pith as an insulating material. Indian Coconut J. 5, 159-161.
Proceedings of 22nd Kerala Science Congress
631
Proceedings of 22nd Kerala Science Congress, 28-31 January 2010, KFRI, Peechi, pp. 631-632© KSCSTE 2010
08-64
Impact of instream sand mining: An example from Southern Kerala
S. Vishnu Mohan, K. L. Lini Krishna, K. Maya and D. PadmalalCentre for Earth Science Studies, Thiruvananthapuram 695 031 Kerala
INTRODUCTION
Blessed with heavy monsoon rains and a sloping topography from the towering Western Ghats, the 41 rivers inKerala flow westerly through the high land (>75 m amsl), mid land (8 ñ75 m amsl) and low land (< 8 m amsl)physiographic provinces. All of them are much smaller in length compared to other rivers in India. Further more,these rivers are swift flowing and with limited river bed resources. However, mining of river sand is mountingexponentially since early 1970ís consequent to the increasing economic developments caused by foreign remittanceby the expatriate Keralites. The major threats faced by Kerala rivers are deforestation, construction of dams,discharge of pollutants and finally, but more seriously, river sand mining taking place at an alarming rate throughoutthe river channels. In this paper, we examine the environmental effects of sand mining in the Kallada River- the lifeline of Kollam district with a population of 2585208. Kallada River (Length 121 km/ Catchment area 1699 km2)originates from the Western Ghat mountain ranges at an elevation of 1753 m above mean sea level (amsl) anddrains through highly varied physiographic regions of Kollam district (Fig.1). It merges with the Lakshadweep Seathrough the Ashtamudi estuary, near Neendakara. On an average, the Kallada river discharges 1.58 km3y-1 of waterand 1.23 lakh tonnes of sediments into the coastal lands of Kollam district. The Kallada river basin experiences awet, humid type of climate.
RESULTS AND CONCLUSIONS
River sand mining
The details of instream mining are given in Table 1. There are about 88 sand mining locations (locally known askadavus) in this river. Altogether an amount of 0.656 million ty-1 of sand being is scooped out from the entire river,the bulk of which is from the storage zone. However, estimates from sediment discharge data reveals that anamount of 0.018 million ty-1 of sand is only replenished in the storage zone especially down to the Pattazhi gaugingstation of Central Water Commission (CWC) against mining figure 0.348 million ty-1, which is about 20 timeshigher than the replenishment level. When the extraction rate exceeds the replenishment rate, the river wouldundergo significant and potentially irreversible changes. This in turn, affects the stability of the river channelleading to serious environmental problems in the biophysical environment (Collins and Dunne, 1989; Kondolf,1995). The gravity of the problems basically depends on the magnitude of sand extraction relative to its supply andtransport through the reach (Padmalal et al., 2008).
Environmental impacts
Analysis of the cross-profile measurements of CWC gauging station reveals that the riverbed has been lowered toabout 2 cm during the period 1980 ñ 2000. This is a clear indication of the extent of degradation of the river bedwhich is subjected to indiscriminate sand mining. It is now axiomatic that indiscriminate sand mining can triggera series of environmental problems like river bank slumping, damages to engineering structures like bridges, waterintake structures etc. Ground water level fluctuations in the areas adjoining sand mining locations is also a greatconcern as these sand deposits have direct bearing on the local hydrological regime and ground water movement inthe densely populated lowlands. The study by Kurup et al. (2005) in Kallada river reveals that the existence of fish
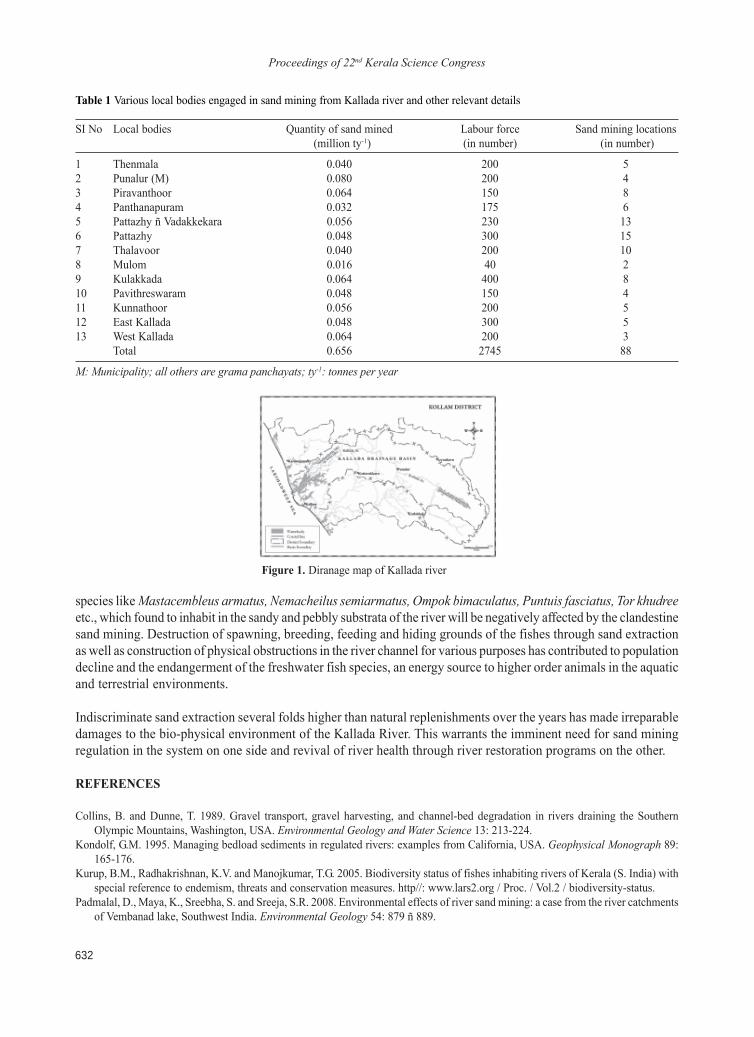
Proceedings of 22nd Kerala Science Congress
632
species like Mastacembleus armatus, Nemacheilus semiarmatus, Ompok bimaculatus, Puntuis fasciatus, Tor khudreeetc., which found to inhabit in the sandy and pebbly substrata of the river will be negatively affected by the clandestinesand mining. Destruction of spawning, breeding, feeding and hiding grounds of the fishes through sand extractionas well as construction of physical obstructions in the river channel for various purposes has contributed to populationdecline and the endangerment of the freshwater fish species, an energy source to higher order animals in the aquaticand terrestrial environments.
Indiscriminate sand extraction several folds higher than natural replenishments over the years has made irreparabledamages to the bio-physical environment of the Kallada River. This warrants the imminent need for sand miningregulation in the system on one side and revival of river health through river restoration programs on the other.
REFERENCES
Collins, B. and Dunne, T. 1989. Gravel transport, gravel harvesting, and channel-bed degradation in rivers draining the SouthernOlympic Mountains, Washington, USA. Environmental Geology and Water Science 13: 213-224.
Kondolf, G.M. 1995. Managing bedload sediments in regulated rivers: examples from California, USA. Geophysical Monograph 89:165-176.
Kurup, B.M., Radhakrishnan, K.V. and Manojkumar, T.G. 2005. Biodiversity status of fishes inhabiting rivers of Kerala (S. India) withspecial reference to endemism, threats and conservation measures. http//: www.lars2.org / Proc. / Vol.2 / biodiversity-status.
Padmalal, D., Maya, K., Sreebha, S. and Sreeja, S.R. 2008. Environmental effects of river sand mining: a case from the river catchmentsof Vembanad lake, Southwest India. Environmental Geology 54: 879 ñ 889.
Figure 1. Diranage map of Kallada river
Table 1 Various local bodies engaged in sand mining from Kallada river and other relevant details
SI No Local bodies Quantity of sand mined Labour force Sand mining locations (million ty-1) (in number) (in number)
1 Thenmala 0.040 200 52 Punalur (M) 0.080 200 43 Piravanthoor 0.064 150 84 Panthanapuram 0.032 175 65 Pattazhy ñ Vadakkekara 0.056 230 136 Pattazhy 0.048 300 157 Thalavoor 0.040 200 108 Mulom 0.016 40 29 Kulakkada 0.064 400 810 Pavithreswaram 0.048 150 411 Kunnathoor 0.056 200 512 East Kallada 0.048 300 513 West Kallada 0.064 200 3
Total 0.656 2745 88
M: Municipality; all others are grama panchayats; ty-1: tonnes per year
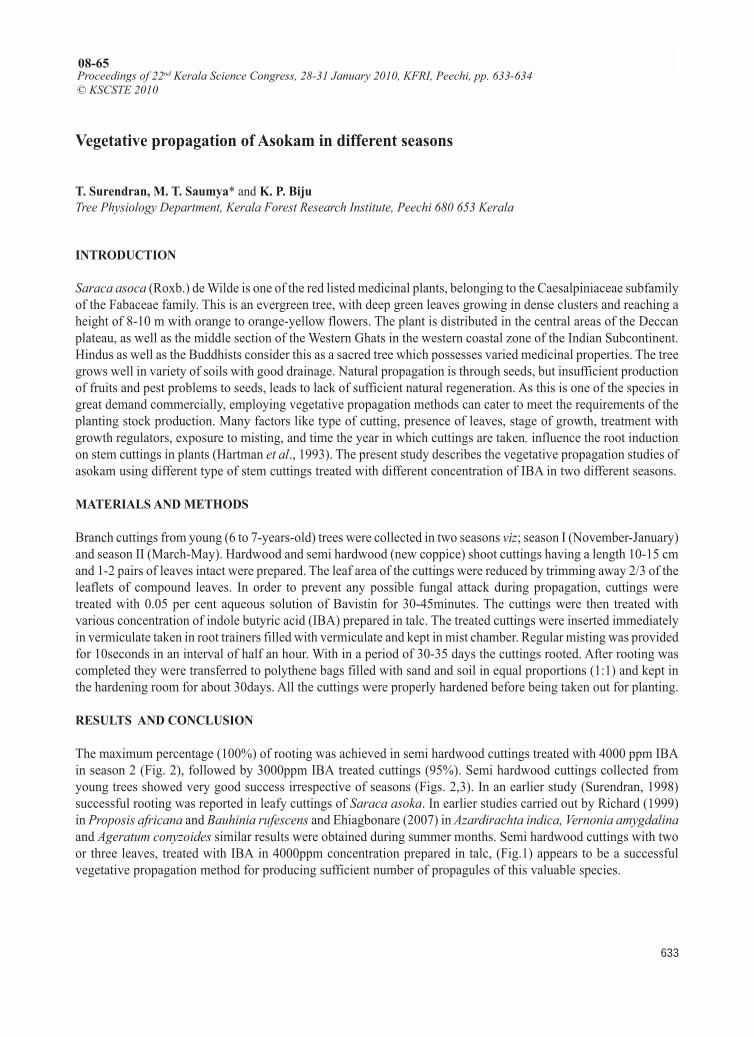
Proceedings of 22nd Kerala Science Congress
633
Vegetative propagation of Asokam in different seasons
T. Surendran, M. T. Saumya* and K. P. BijuTree Physiology Department, Kerala Forest Research Institute, Peechi 680 653 Kerala
INTRODUCTION
Saraca asoca (Roxb.) de Wilde is one of the red listed medicinal plants, belonging to the Caesalpiniaceae subfamilyof the Fabaceae family. This is an evergreen tree, with deep green leaves growing in dense clusters and reaching aheight of 8-10 m with orange to orange-yellow flowers. The plant is distributed in the central areas of the Deccanplateau, as well as the middle section of the Western Ghats in the western coastal zone of the Indian Subcontinent.Hindus as well as the Buddhists consider this as a sacred tree which possesses varied medicinal properties. The treegrows well in variety of soils with good drainage. Natural propagation is through seeds, but insufficient productionof fruits and pest problems to seeds, leads to lack of sufficient natural regeneration. As this is one of the species ingreat demand commercially, employing vegetative propagation methods can cater to meet the requirements of theplanting stock production. Many factors like type of cutting, presence of leaves, stage of growth, treatment withgrowth regulators, exposure to misting, and time the year in which cuttings are taken. influence the root inductionon stem cuttings in plants (Hartman et al., 1993). The present study describes the vegetative propagation studies ofasokam using different type of stem cuttings treated with different concentration of IBA in two different seasons.
MATERIALS AND METHODS
Branch cuttings from young (6 to 7-years-old) trees were collected in two seasons viz; season I (November-January)and season II (March-May). Hardwood and semi hardwood (new coppice) shoot cuttings having a length 10-15 cmand 1-2 pairs of leaves intact were prepared. The leaf area of the cuttings were reduced by trimming away 2/3 of theleaflets of compound leaves. In order to prevent any possible fungal attack during propagation, cuttings weretreated with 0.05 per cent aqueous solution of Bavistin for 30-45minutes. The cuttings were then treated withvarious concentration of indole butyric acid (IBA) prepared in talc. The treated cuttings were inserted immediatelyin vermiculate taken in root trainers filled with vermiculate and kept in mist chamber. Regular misting was providedfor 10seconds in an interval of half an hour. With in a period of 30-35 days the cuttings rooted. After rooting wascompleted they were transferred to polythene bags filled with sand and soil in equal proportions (1:1) and kept inthe hardening room for about 30days. All the cuttings were properly hardened before being taken out for planting.
RESULTS AND CONCLUSION
The maximum percentage (100%) of rooting was achieved in semi hardwood cuttings treated with 4000 ppm IBAin season 2 (Fig. 2), followed by 3000ppm IBA treated cuttings (95%). Semi hardwood cuttings collected fromyoung trees showed very good success irrespective of seasons (Figs. 2,3). In an earlier study (Surendran, 1998)successful rooting was reported in leafy cuttings of Saraca asoka. In earlier studies carried out by Richard (1999)in Proposis africana and Bauhinia rufescens and Ehiagbonare (2007) in Azardirachta indica, Vernonia amygdalinaand Ageratum conyzoides similar results were obtained during summer months. Semi hardwood cuttings with twoor three leaves, treated with IBA in 4000ppm concentration prepared in talc, (Fig.1) appears to be a successfulvegetative propagation method for producing sufficient number of propagules of this valuable species.
Proceedings of 22nd Kerala Science Congress, 28-31 January 2010, KFRI, Peechi, pp. 633-634© KSCSTE 2010
08-65
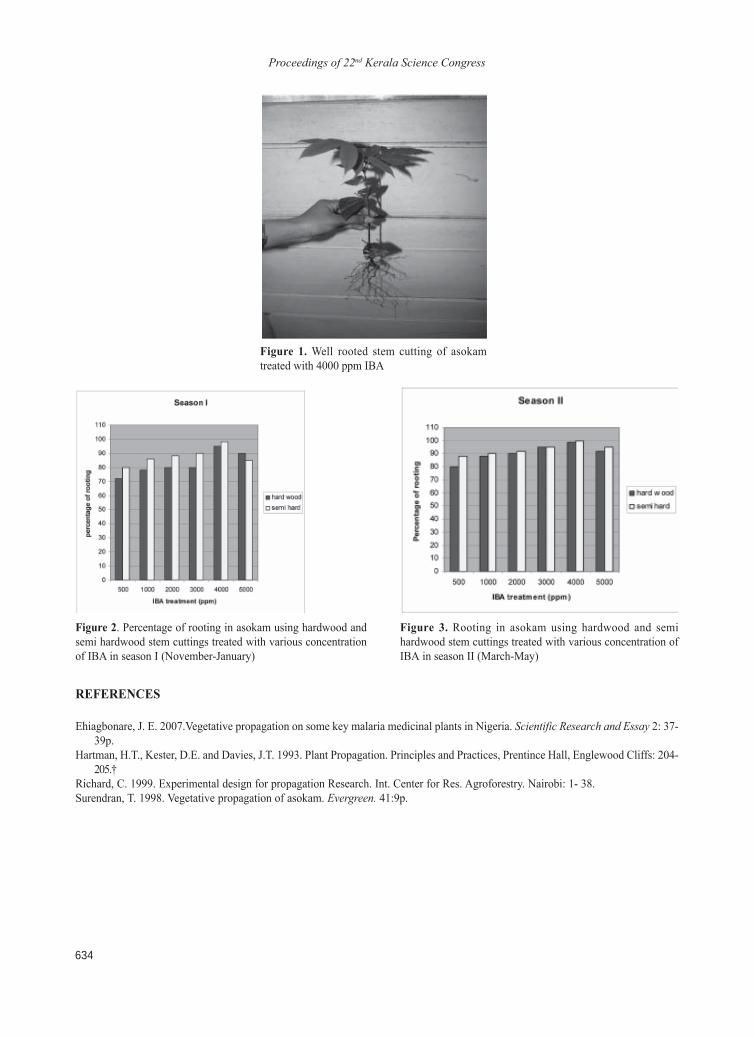
Proceedings of 22nd Kerala Science Congress
634
Figure 3. Rooting in asokam using hardwood and semihardwood stem cuttings treated with various concentration ofIBA in season II (March-May)
REFERENCES
Ehiagbonare, J. E. 2007.Vegetative propagation on some key malaria medicinal plants in Nigeria. Scientific Research and Essay 2: 37-39p.
Hartman, H.T., Kester, D.E. and Davies, J.T. 1993. Plant Propagation. Principles and Practices, Prentince Hall, Englewood Cliffs: 204-205.�
Richard, C. 1999. Experimental design for propagation Research. Int. Center for Res. Agroforestry. Nairobi: 1- 38.Surendran, T. 1998. Vegetative propagation of asokam. Evergreen. 41:9p.
Figure 1. Well rooted stem cutting of asokamtreated with 4000 ppm IBA
Figure 2. Percentage of rooting in asokam using hardwood andsemi hardwood stem cuttings treated with various concentrationof IBA in season I (November-January)
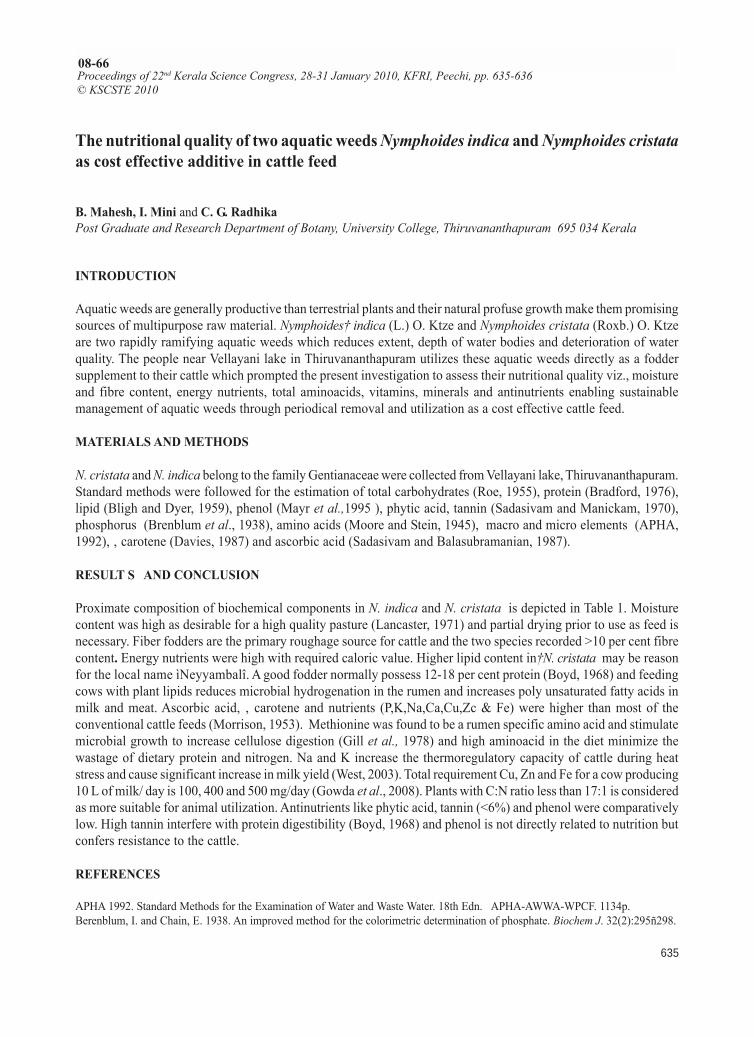
Proceedings of 22nd Kerala Science Congress
635
Proceedings of 22nd Kerala Science Congress, 28-31 January 2010, KFRI, Peechi, pp. 635-636© KSCSTE 2010
08-66
The nutritional quality of two aquatic weeds Nymphoides indica and Nymphoides cristataas cost effective additive in cattle feed
B. Mahesh, I. Mini and C. G. RadhikaPost Graduate and Research Department of Botany, University College, Thiruvananthapuram 695 034 Kerala
INTRODUCTION
Aquatic weeds are generally productive than terrestrial plants and their natural profuse growth make them promisingsources of multipurpose raw material. Nymphoides� indica (L.) O. Ktze and Nymphoides cristata (Roxb.) O. Ktzeare two rapidly ramifying aquatic weeds which reduces extent, depth of water bodies and deterioration of waterquality. The people near Vellayani lake in Thiruvananthapuram utilizes these aquatic weeds directly as a foddersupplement to their cattle which prompted the present investigation to assess their nutritional quality viz., moistureand fibre content, energy nutrients, total aminoacids, vitamins, minerals and antinutrients enabling sustainablemanagement of aquatic weeds through periodical removal and utilization as a cost effective cattle feed.
MATERIALS AND METHODS
N. cristata and N. indica belong to the family Gentianaceae were collected from Vellayani lake, Thiruvananthapuram.Standard methods were followed for the estimation of total carbohydrates (Roe, 1955), protein (Bradford, 1976),lipid (Bligh and Dyer, 1959), phenol (Mayr et al.,1995 ), phytic acid, tannin (Sadasivam and Manickam, 1970),phosphorus (Brenblum et al., 1938), amino acids (Moore and Stein, 1945), macro and micro elements (APHA,1992), � carotene (Davies, 1987) and ascorbic acid (Sadasivam and Balasubramanian, 1987).
RESULT S AND CONCLUSION
Proximate composition of biochemical components in N. indica and N. cristata is depicted in Table 1. Moisturecontent was high as desirable for a high quality pasture (Lancaster, 1971) and partial drying prior to use as feed isnecessary. Fiber fodders are the primary roughage source for cattle and the two species recorded >10 per cent fibrecontent. Energy nutrients were high with required caloric value. Higher lipid content in�N. cristata may be reasonfor the local name ìNeyyambalî. A good fodder normally possess 12-18 per cent protein (Boyd, 1968) and feedingcows with plant lipids reduces microbial hydrogenation in the rumen and increases poly unsaturated fatty acids inmilk and meat. Ascorbic acid, � carotene and nutrients (P,K,Na,Ca,Cu,Zc & Fe) were higher than most of theconventional cattle feeds (Morrison, 1953). Methionine was found to be a rumen specific amino acid and stimulatemicrobial growth to increase cellulose digestion (Gill et al., 1978) and high aminoacid in the diet minimize thewastage of dietary protein and nitrogen. Na and K increase the thermoregulatory capacity of cattle during heatstress and cause significant increase in milk yield (West, 2003). Total requirement Cu, Zn and Fe for a cow producing10 L of milk/ day is 100, 400 and 500 mg/day (Gowda et al., 2008). Plants with C:N ratio less than 17:1 is consideredas more suitable for animal utilization. Antinutrients like phytic acid, tannin (<6%) and phenol were comparativelylow. High tannin interfere with protein digestibility (Boyd, 1968) and phenol is not directly related to nutrition butconfers resistance to the cattle.
REFERENCES
APHA 1992. Standard Methods for the Examination of Water and Waste Water. 18th Edn. APHA-AWWA-WPCF. 1134p.Berenblum, I. and Chain, E. 1938. An improved method for the colorimetric determination of phosphate. Biochem J. 32(2):295ñ298.
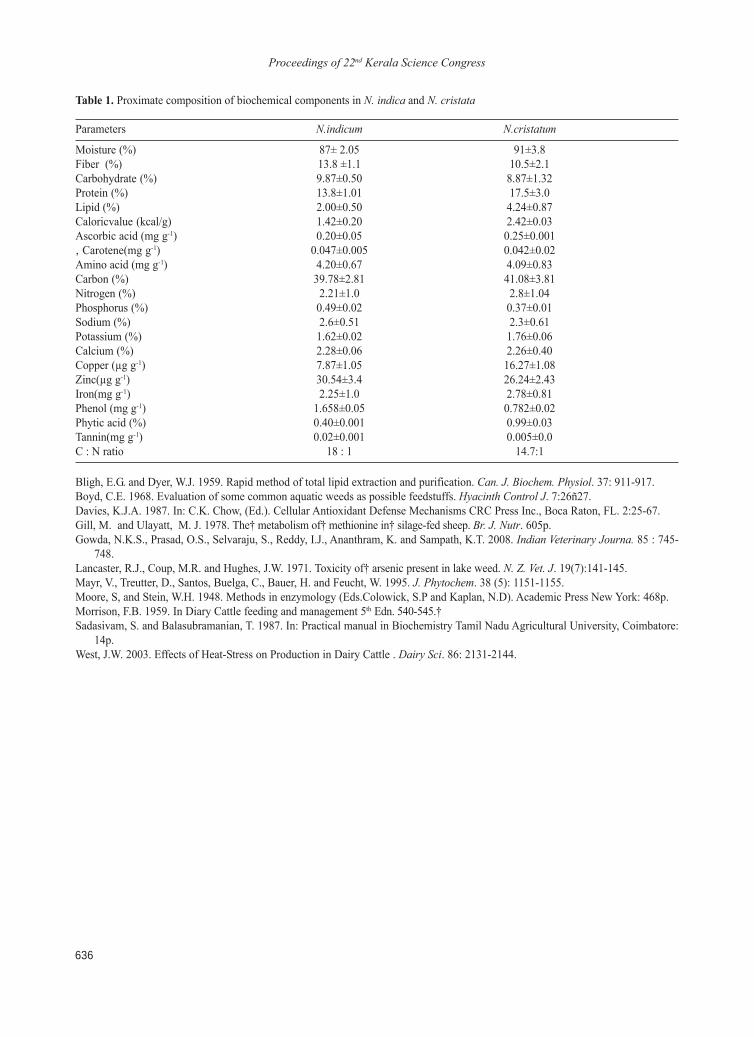
Proceedings of 22nd Kerala Science Congress
636
Bligh, E.G. and Dyer, W.J. 1959. Rapid method of total lipid extraction and purification. Can. J. Biochem. Physiol. 37: 911-917.Boyd, C.E. 1968. Evaluation of some common aquatic weeds as possible feedstuffs. Hyacinth Control J. 7:26ñ27.Davies, K.J.A. 1987. In: C.K. Chow, (Ed.). Cellular Antioxidant Defense Mechanisms CRC Press Inc., Boca Raton, FL. 2:25-67.Gill, M. and Ulayatt, M. J. 1978. The� metabolism of� methionine in� silage-fed sheep. Br. J. Nutr. 605p.Gowda, N.K.S., Prasad, O.S., Selvaraju, S., Reddy, I.J., Ananthram, K. and Sampath, K.T. 2008. Indian Veterinary Journa. 85 : 745-
748.Lancaster, R.J., Coup, M.R. and Hughes, J.W. 1971. Toxicity of� arsenic present in lake weed. N. Z. Vet. J. 19(7):141-145.Mayr, V., Treutter, D., Santos, Buelga, C., Bauer, H. and Feucht, W. 1995. J. Phytochem. 38 (5): 1151-1155.Moore, S, and Stein, W.H. 1948. Methods in enzymology (Eds.Colowick, S.P and Kaplan, N.D). Academic Press New York: 468p.Morrison, F.B. 1959. In Diary Cattle feeding and management 5th Edn. 540-545.�Sadasivam, S. and Balasubramanian, T. 1987. In: Practical manual in Biochemistry Tamil Nadu Agricultural University, Coimbatore:
14p.West, J.W. 2003. Effects of Heat-Stress on Production in Dairy Cattle . Dairy Sci. 86: 2131-2144.
Table 1. Proximate composition of biochemical components in N. indica and N. cristata
Parameters N.indicum N.cristatum
Moisture (%) 87± 2.05 91±3.8Fiber (%) 13.8 ±1.1 10.5±2.1Carbohydrate (%) 9.87±0.50 8.87±1.32Protein (%) 13.8±1.01 17.5±3.0Lipid (%) 2.00±0.50 4.24±0.87Caloricvalue (kcal/g) 1.42±0.20 2.42±0.03Ascorbic acid (mg g-1) 0.20±0.05 0.25±0.001� Carotene(mg g-1) 0.047±0.005 0.042±0.02Amino acid (mg g-1) 4.20±0.67 4.09±0.83Carbon (%) 39.78±2.81 41.08±3.81Nitrogen (%) 2.21±1.0 2.8±1.04Phosphorus (%) 0.49±0.02 0.37±0.01Sodium (%) 2.6±0.51 2.3±0.61Potassium (%) 1.62±0.02 1.76±0.06Calcium (%) 2.28±0.06 2.26±0.40Copper (µg g-1) 7.87±1.05 16.27±1.08Zinc(µg g-1) 30.54±3.4 26.24±2.43Iron(mg g-1) 2.25±1.0 2.78±0.81Phenol (mg g-1) 1.658±0.05 0.782±0.02Phytic acid (%) 0.40±0.001 0.99±0.03Tannin(mg g-1) 0.02±0.001 0.005±0.0C : N ratio 18 : 1 14.7:1
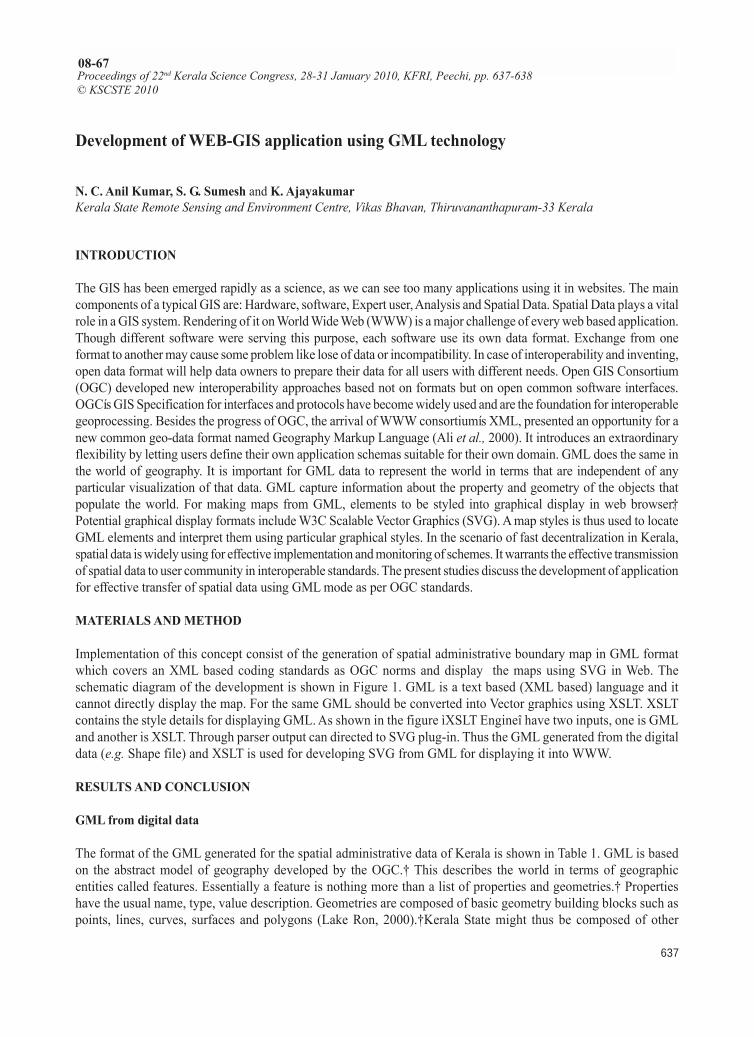
Proceedings of 22nd Kerala Science Congress
637
Development of WEB-GIS application using GML technology
N. C. Anil Kumar, S. G. Sumesh and K. AjayakumarKerala State Remote Sensing and Environment Centre, Vikas Bhavan, Thiruvananthapuram-33 Kerala
INTRODUCTION
The GIS has been emerged rapidly as a science, as we can see too many applications using it in websites. The maincomponents of a typical GIS are: Hardware, software, Expert user, Analysis and Spatial Data. Spatial Data plays a vitalrole in a GIS system. Rendering of it on World Wide Web (WWW) is a major challenge of every web based application.Though different software were serving this purpose, each software use its own data format. Exchange from oneformat to another may cause some problem like lose of data or incompatibility. In case of interoperability and inventing,open data format will help data owners to prepare their data for all users with different needs. Open GIS Consortium(OGC) developed new interoperability approaches based not on formats but on open common software interfaces.OGCís GIS Specification for interfaces and protocols have become widely used and are the foundation for interoperablegeoprocessing. Besides the progress of OGC, the arrival of WWW consortiumís XML, presented an opportunity for anew common geo-data format named Geography Markup Language (Ali et al., 2000). It introduces an extraordinaryflexibility by letting users define their own application schemas suitable for their own domain. GML does the same inthe world of geography. It is important for GML data to represent the world in terms that are independent of anyparticular visualization of that data. GML capture information about the property and geometry of the objects thatpopulate the world. For making maps from GML, elements to be styled into graphical display in web browser.�Potential graphical display formats include W3C Scalable Vector Graphics (SVG). A map styles is thus used to locateGML elements and interpret them using particular graphical styles. In the scenario of fast decentralization in Kerala,spatial data is widely using for effective implementation and monitoring of schemes. It warrants the effective transmissionof spatial data to user community in interoperable standards. The present studies discuss the development of applicationfor effective transfer of spatial data using GML mode as per OGC standards.
MATERIALS AND METHOD
Implementation of this concept consist of the generation of spatial administrative boundary map in GML formatwhich covers an XML based coding standards as OGC norms and display the maps using SVG in Web. Theschematic diagram of the development is shown in Figure 1. GML is a text based (XML based) language and itcannot directly display the map. For the same GML should be converted into Vector graphics using XSLT. XSLTcontains the style details for displaying GML. As shown in the figure ìXSLT Engineî have two inputs, one is GMLand another is XSLT. Through parser output can directed to SVG plug-in. Thus the GML generated from the digitaldata (e.g. Shape file) and XSLT is used for developing SVG from GML for displaying it into WWW.
RESULTS AND CONCLUSION
GML from digital data
The format of the GML generated for the spatial administrative data of Kerala is shown in Table 1. GML is basedon the abstract model of geography developed by the OGC.� This describes the world in terms of geographicentities called features. Essentially a feature is nothing more than a list of properties and geometries.� Propertieshave the usual name, type, value description. Geometries are composed of basic geometry building blocks such aspoints, lines, curves, surfaces and polygons (Lake Ron, 2000).�Kerala State might thus be composed of other
Proceedings of 22nd Kerala Science Congress, 28-31 January 2010, KFRI, Peechi, pp. 637-638© KSCSTE 2010
08-67
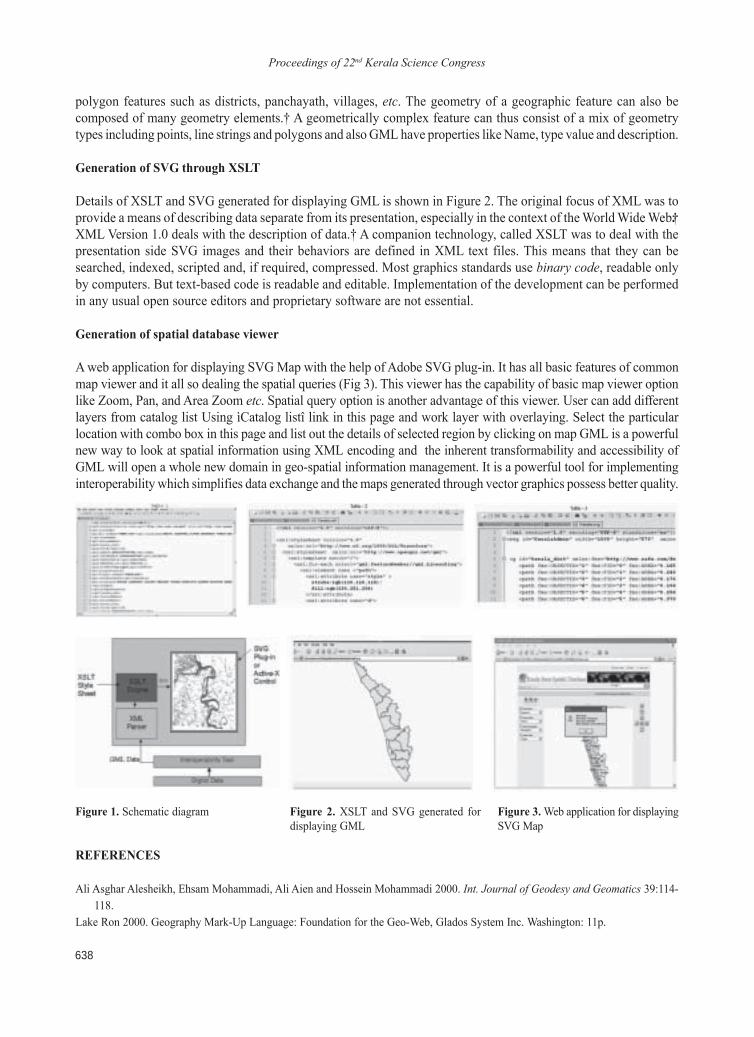
Proceedings of 22nd Kerala Science Congress
638
polygon features such as districts, panchayath, villages, etc. The geometry of a geographic feature can also becomposed of many geometry elements.� A geometrically complex feature can thus consist of a mix of geometrytypes including points, line strings and polygons and also GML have properties like Name, type value and description.
Generation of SVG through XSLT
Details of XSLT and SVG generated for displaying GML is shown in Figure 2. The original focus of XML was toprovide a means of describing data separate from its presentation, especially in the context of the World Wide Web.�XML Version 1.0 deals with the description of data.� A companion technology, called XSLT was to deal with thepresentation side SVG images and their behaviors are defined in XML text files. This means that they can besearched, indexed, scripted and, if required, compressed. Most graphics standards use binary code, readable onlyby computers. But text-based code is readable and editable. Implementation of the development can be performedin any usual open source editors and proprietary software are not essential.
Generation of spatial database viewer
A web application for displaying SVG Map with the help of Adobe SVG plug-in. It has all basic features of commonmap viewer and it all so dealing the spatial queries (Fig 3). This viewer has the capability of basic map viewer optionlike Zoom, Pan, and Area Zoom etc. Spatial query option is another advantage of this viewer. User can add differentlayers from catalog list Using ìCatalog listî link in this page and work layer with overlaying. Select the particularlocation with combo box in this page and list out the details of selected region by clicking on map GML is a powerfulnew way to look at spatial information using XML encoding and the inherent transformability and accessibility ofGML will open a whole new domain in geo-spatial information management. It is a powerful tool for implementinginteroperability which simplifies data exchange and the maps generated through vector graphics possess better quality.
REFERENCES
Ali Asghar Alesheikh, Ehsam Mohammadi, Ali Aien and Hossein Mohammadi 2000. Int. Journal of Geodesy and Geomatics 39:114-118.
Lake Ron 2000. Geography Mark-Up Language: Foundation for the Geo-Web, Glados System Inc. Washington: 11p.
Figure 1. Schematic diagram Figure 2. XSLT and SVG generated fordisplaying GML
Figure 3. Web application for displayingSVG Map
Proceedings of 22nd Kerala Science Congress
639
Proceedings of 22nd Kerala Science Congress, 28-31 January 2010, KFRI, Peechi, pp. 639-640© KSCSTE 2010
08-68
Effectiveness of vetiver to reduce the pollution load in coconut husk retting area at P.Vemballur, Thrissur
V. M. Asma and E.S. SabeenaP.G. Department of Botany, M.E.S. Asmabi College, P. Vemballur 680 671 Thrissur, Kerala
INTRODUCTION
Coir industry is one of the important traditional cottage industries widely spread in south India. Retting activity hascaused extensive pollution and mass destruction of flora and fauna in the water tracts of the region. Phytoremediationis a cost effective means of using green plants or ëgreen liversí and their associated micro-organisms, soil amendmentsand agronomic techniques to remove, contain or render environmental pollutants harmless. Vetiveria zizanioides(L.) Nash is a densely tufted perennial aromatic plant belonging to family Gramineae. Morphological andphysiological attributes of vetiver grass, its strong, deep penetrating, aerenchymatous root system, unusual abilityto absorb and tolerate extreme levels of nutrients, agrochemicals and heavy metals make ideal system forenvironmental enhancement through appropriate intervention in the treatment regime. Phytoremediation is basedon the fact that a living plant can be considered as a solar driven pump; which can extract and concentrate toxicelements from the contaminated soil (Raskin and Ensley, 2000) The role of Vetiver as an ideal plant for bioengineeringand phytoremediation was studied by Hengchavonich (2000). Vetiver has played an important role in the retentionand decontamination of agrochemicals especially pesticides, preventing them from contaminating and accumulatingin the soils and crops (Trunong, 2000). The present study was carried out to find out the usefulness of vetiver inreducing the pollution load of coconut husk retting areas.
MATERIALS AND METHODS
The study area is coconut husk retting area at P. Vemballur in S.N. Puram panchayat. The study area is back waterregion near the seashore. The vetiver plants were planted at three sites of this area. First site selected is the actualplace were retting process occur, second site is 2 meter away from first site and site third is 2 meter away fromsecond site. They are planted linearly in each site. Then the leaf length, leaf number and tiller number are measured,and noted every month and data were recorded. The soil samples collected from three sites of study area was testedat Soil Testing Laboratory in Chempukkavu before starting the experiment. The soil samples were also analysedbefore starting experiment for the detection of metals in the laboratory of Chemical Oceanography Division ofCochin University of Science and Technology, using Atomic Absorption Spectrophotometer (AAS).
RESULTS AND CONCLUSION
Figure 1 shows the number of tillers of vetiver plants in each sites. The initial tiller number was 3 in three sites. Thetiller number in first site was 6 to 7, in second site it varied from 6 to 4 and third site the tiller number did notincreased, the tiller number is 4. Figure 2 shows the variation in number of leaves after 3month duration. The leafnumber increased in first site, the average number of leaves increased in first site from 20 to 25, in second site from30 to 40, The initial leaf number is 12 in three sites. Figure 3 shows the variation in leaf length in three sites. Theinitial leaf length was 10 cm in three sites. The first site shows the leaf length vary from 22.7 cm to 51 cm. In secondsite leaf length changed from 21cm to 40.6cm. The morphological results proved the survival capacity of vetiverplant in coconut husk retting area.
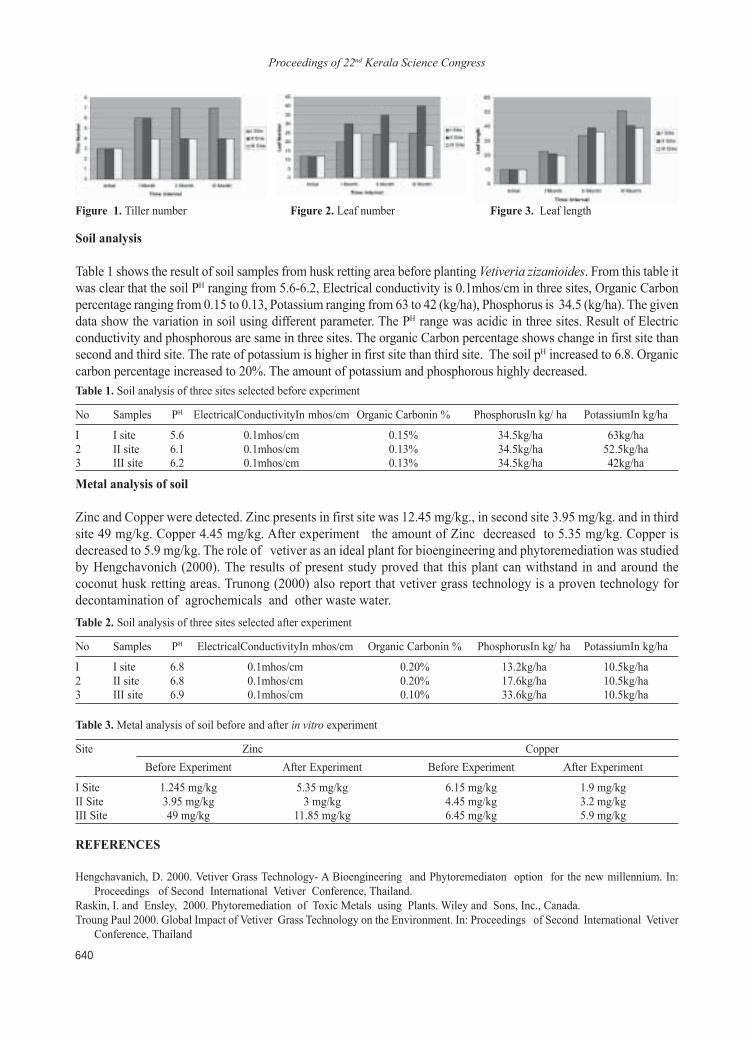
Proceedings of 22nd Kerala Science Congress
640
Soil analysis
Table 1 shows the result of soil samples from husk retting area before planting Vetiveria zizanioides. From this table itwas clear that the soil PH ranging from 5.6-6.2, Electrical conductivity is 0.1mhos/cm in three sites, Organic Carbonpercentage ranging from 0.15 to 0.13, Potassium ranging from 63 to 42 (kg/ha), Phosphorus is 34.5 (kg/ha). The givendata show the variation in soil using different parameter. The PH range was acidic in three sites. Result of Electricconductivity and phosphorous are same in three sites. The organic Carbon percentage shows change in first site thansecond and third site. The rate of potassium is higher in first site than third site. The soil pH increased to 6.8. Organiccarbon percentage increased to 20%. The amount of potassium and phosphorous highly decreased.
Figure 3. Leaf lengthFigure 1. Tiller number Figure 2. Leaf number
Metal analysis of soil
Zinc and Copper were detected. Zinc presents in first site was 12.45 mg/kg., in second site 3.95 mg/kg. and in thirdsite 49 mg/kg. Copper 4.45 mg/kg. After experiment the amount of Zinc decreased to 5.35 mg/kg. Copper isdecreased to 5.9 mg/kg. The role of vetiver as an ideal plant for bioengineering and phytoremediation was studiedby Hengchavonich (2000). The results of present study proved that this plant can withstand in and around thecoconut husk retting areas. Trunong (2000) also report that vetiver grass technology is a proven technology fordecontamination of agrochemicals and other waste water.
Table 3. Metal analysis of soil before and after in vitro experiment
Site Zinc CopperBefore Experiment After Experiment Before Experiment After Experiment
I Site 1.245 mg/kg 5.35 mg/kg 6.15 mg/kg 1.9 mg/kgII Site 3.95 mg/kg 3 mg/kg 4.45 mg/kg 3.2 mg/kgIII Site 49 mg/kg 11.85 mg/kg 6.45 mg/kg 5.9 mg/kg
REFERENCES
Hengchavanich, D. 2000. Vetiver Grass Technology- A Bioengineering and Phytoremediaton option for the new millennium. In:Proceedings of Second International Vetiver Conference, Thailand.
Raskin, I. and Ensley, 2000. Phytoremediation of Toxic Metals using Plants. Wiley and Sons, Inc., Canada.Troung Paul 2000. Global Impact of Vetiver Grass Technology on the Environment. In: Proceedings of Second International Vetiver
Conference, Thailand
Table 1. Soil analysis of three sites selected before experiment
No Samples PH ElectricalConductivityIn mhos/cm Organic Carbonin % PhosphorusIn kg/ ha PotassiumIn kg/ha
I I site 5.6 0.1mhos/cm 0.15% 34.5kg/ha 63kg/ha2 II site 6.1 0.1mhos/cm 0.13% 34.5kg/ha 52.5kg/ha3 III site 6.2 0.1mhos/cm 0.13% 34.5kg/ha 42kg/ha
Table 2. Soil analysis of three sites selected after experiment
No Samples PH ElectricalConductivityIn mhos/cm Organic Carbonin % PhosphorusIn kg/ ha PotassiumIn kg/ha
I I site 6.8 0.1mhos/cm 0.20% 13.2kg/ha 10.5kg/ha2 II site 6.8 0.1mhos/cm 0.20% 17.6kg/ha 10.5kg/ha3 III site 6.9 0.1mhos/cm 0.10% 33.6kg/ha 10.5kg/ha
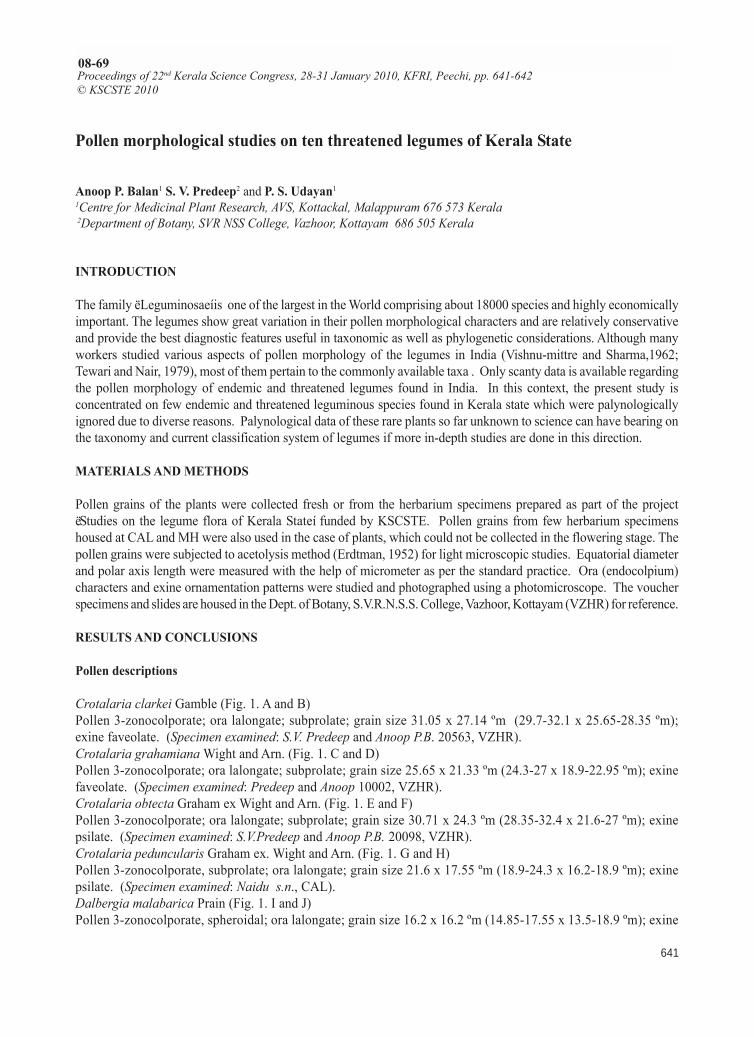
Proceedings of 22nd Kerala Science Congress
641
Pollen morphological studies on ten threatened legumes of Kerala State
Anoop P. Balan1 S. V. Predeep2 and P. S. Udayan11Centre for Medicinal Plant Research, AVS, Kottackal, Malappuram 676 573 Kerala 2Department of Botany, SVR NSS College, Vazhoor, Kottayam 686 505 Kerala
INTRODUCTION
The family ëLeguminosaeíis one of the largest in the World comprising about 18000 species and highly economicallyimportant. The legumes show great variation in their pollen morphological characters and are relatively conservativeand provide the best diagnostic features useful in taxonomic as well as phylogenetic considerations. Although manyworkers studied various aspects of pollen morphology of the legumes in India (Vishnu-mittre and Sharma,1962;Tewari and Nair, 1979), most of them pertain to the commonly available taxa . Only scanty data is available regardingthe pollen morphology of endemic and threatened legumes found in India. In this context, the present study isconcentrated on few endemic and threatened leguminous species found in Kerala state which were palynologicallyignored due to diverse reasons. Palynological data of these rare plants so far unknown to science can have bearing onthe taxonomy and current classification system of legumes if more in-depth studies are done in this direction.
MATERIALS AND METHODS
Pollen grains of the plants were collected fresh or from the herbarium specimens prepared as part of the projectëStudies on the legume flora of Kerala Stateí funded by KSCSTE. Pollen grains from few herbarium specimenshoused at CAL and MH were also used in the case of plants, which could not be collected in the flowering stage. Thepollen grains were subjected to acetolysis method (Erdtman, 1952) for light microscopic studies. Equatorial diameterand polar axis length were measured with the help of micrometer as per the standard practice. Ora (endocolpium)characters and exine ornamentation patterns were studied and photographed using a photomicroscope. The voucherspecimens and slides are housed in the Dept. of Botany, S.V.R.N.S.S. College, Vazhoor, Kottayam (VZHR) for reference.
RESULTS AND CONCLUSIONS
Pollen descriptions
Crotalaria clarkei Gamble (Fig. 1. A and B)Pollen 3-zonocolporate; ora lalongate; subprolate; grain size 31.05 x 27.14 ºm (29.7-32.1 x 25.65-28.35 ºm);exine faveolate. (Specimen examined: S.V. Predeep and Anoop P.B. 20563, VZHR).Crotalaria grahamiana Wight and Arn. (Fig. 1. C and D)Pollen 3-zonocolporate; ora lalongate; subprolate; grain size 25.65 x 21.33 ºm (24.3-27 x 18.9-22.95 ºm); exinefaveolate. (Specimen examined: Predeep and Anoop 10002, VZHR).Crotalaria obtecta Graham ex Wight and Arn. (Fig. 1. E and F)Pollen 3-zonocolporate; ora lalongate; subprolate; grain size 30.71 x 24.3 ºm (28.35-32.4 x 21.6-27 ºm); exinepsilate. (Specimen examined: S.V.Predeep and Anoop P.B. 20098, VZHR).Crotalaria peduncularis Graham ex. Wight and Arn. (Fig. 1. G and H)Pollen 3-zonocolporate, subprolate; ora lalongate; grain size 21.6 x 17.55 ºm (18.9-24.3 x 16.2-18.9 ºm); exinepsilate. (Specimen examined: Naidu s.n., CAL).Dalbergia malabarica Prain (Fig. 1. I and J)Pollen 3-zonocolporate, spheroidal; ora lalongate; grain size 16.2 x 16.2 ºm (14.85-17.55 x 13.5-18.9 ºm); exine
Proceedings of 22nd Kerala Science Congress, 28-31 January 2010, KFRI, Peechi, pp. 641-642© KSCSTE 2010
08-69
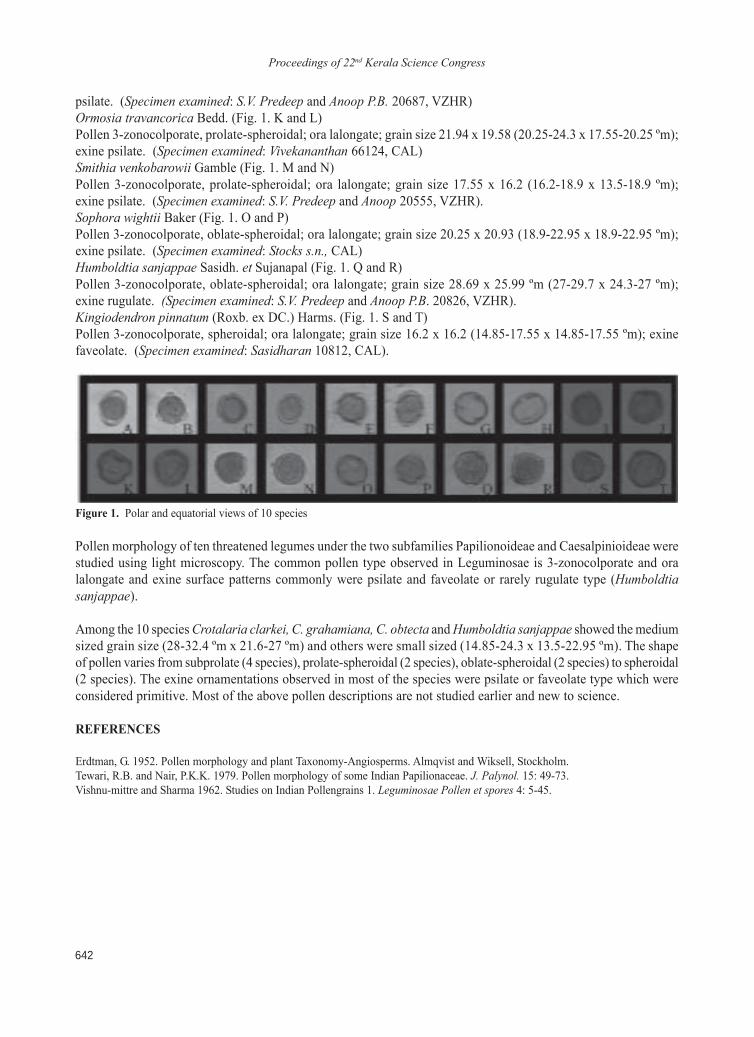
Proceedings of 22nd Kerala Science Congress
642
psilate. (Specimen examined: S.V. Predeep and Anoop P.B. 20687, VZHR)Ormosia travancorica Bedd. (Fig. 1. K and L)Pollen 3-zonocolporate, prolate-spheroidal; ora lalongate; grain size 21.94 x 19.58 (20.25-24.3 x 17.55-20.25 ºm);exine psilate. (Specimen examined: Vivekananthan 66124, CAL)Smithia venkobarowii Gamble (Fig. 1. M and N)Pollen 3-zonocolporate, prolate-spheroidal; ora lalongate; grain size 17.55 x 16.2 (16.2-18.9 x 13.5-18.9 ºm);exine psilate. (Specimen examined: S.V. Predeep and Anoop 20555, VZHR).Sophora wightii Baker (Fig. 1. O and P)Pollen 3-zonocolporate, oblate-spheroidal; ora lalongate; grain size 20.25 x 20.93 (18.9-22.95 x 18.9-22.95 ºm);exine psilate. (Specimen examined: Stocks s.n., CAL)Humboldtia sanjappae Sasidh. et Sujanapal (Fig. 1. Q and R)Pollen 3-zonocolporate, oblate-spheroidal; ora lalongate; grain size 28.69 x 25.99 ºm (27-29.7 x 24.3-27 ºm);exine rugulate. (Specimen examined: S.V. Predeep and Anoop P.B. 20826, VZHR).Kingiodendron pinnatum (Roxb. ex DC.) Harms. (Fig. 1. S and T)Pollen 3-zonocolporate, spheroidal; ora lalongate; grain size 16.2 x 16.2 (14.85-17.55 x 14.85-17.55 ºm); exinefaveolate. (Specimen examined: Sasidharan 10812, CAL).
Pollen morphology of ten threatened legumes under the two subfamilies Papilionoideae and Caesalpinioideae werestudied using light microscopy. The common pollen type observed in Leguminosae is 3-zonocolporate and oralalongate and exine surface patterns commonly were psilate and faveolate or rarely rugulate type (Humboldtiasanjappae).
Among the 10 species Crotalaria clarkei, C. grahamiana, C. obtecta and Humboldtia sanjappae showed the mediumsized grain size (28-32.4 ºm x 21.6-27 ºm) and others were small sized (14.85-24.3 x 13.5-22.95 ºm). The shapeof pollen varies from subprolate (4 species), prolate-spheroidal (2 species), oblate-spheroidal (2 species) to spheroidal(2 species). The exine ornamentations observed in most of the species were psilate or faveolate type which wereconsidered primitive. Most of the above pollen descriptions are not studied earlier and new to science.
REFERENCES
Erdtman, G. 1952. Pollen morphology and plant Taxonomy-Angiosperms. Almqvist and Wiksell, Stockholm.Tewari, R.B. and Nair, P.K.K. 1979. Pollen morphology of some Indian Papilionaceae. J. Palynol. 15: 49-73.Vishnu-mittre and Sharma 1962. Studies on Indian Pollengrains 1. Leguminosae Pollen et spores 4: 5-45.
Figure 1. Polar and equatorial views of 10 species
Proceedings of 22nd Kerala Science Congress
643
Implementation of spatial database generation in open GIS consortium (OGC) standards
N. C. Anil Kumar, Suresh Francis, B. R. Anil and Sreenal SreedharKerala State Remote Sensing and Environment Centre, Vikas Bhavan, Thiruvananthapuram-33 Kerala
INTRODUCTION
The Open GIS Consortium (OGC), an organization that addresses issues of interoperability between systems thatprocess geospatial data, developed Geography Markup Language (GML) to solve most of the issues in datainteroperability. The GML is an XML (Extensible Markup Language) based encoding standard for the transportand storage of geographic information including both geometry and properties of geographic features (Lake Ron,2000). It enables data sharing and integration easier than ever before. Since GML is an XML dialect, GML upholdsthe principle of separating geographic content from its presentation and it does not address the visualization of thegeographic features. The separation of content from presentation offers more extensibility in data production,handling as well as in visualization. Therefore data providers need not to concern about the presentation aspects. Ingeographic data visualization graphical visual properties such as colours and symbols play an important role tomake the presentation more informative and effective. In the scenario of fast decentralization in Kerala, spatial datais widely using for effective implementation and monitoring of schemas. It warrants the effective transformation ofspatial data to user community in interoperable standards. The present study discusses the result of the developmentof spatial database performed through OGC specified standards.
MATERIALS AND METHODS
The development of the Spatial Database discussed in the study follows totally the Open Geospatial ConsortiumSpecifications. The architecture of the concept consist of the generation of spatial administrative boundary map incentralised spatial database format which renders an GML encoding standards as OGC norms. The methodologyadopted in the study is shown in Figure 1. Geography Mark-up Language is an encoded language written in XMLschema for the modelling, transport, and storage of geographic information. GML provides a variety of objects fordescribing geography including features, coordinate reference system, geometry, topology, time, units of measureand generalized values. Spatial database is optimized to store and query data related to objects in space, includingpoints, lines and polygons. In this study , an open source spatial databases, postgresql with postGis. PostGIS addssupport for geographic objects to the PostgreSQL. When a user uploads a spatial formats into this database, thespatial data or geometric part is stored in PostGis. The spatial data is uploaded to database through ìImport spatialfeature to Postgisî. The communication between front end application and spatial database is achieved through anopen source dynamic linking library (dll) called NpgSql.dll and the map rendered and manipulated through an opensource map engine called SharpMap ver 2.0. The SVG formatted data is displayed through Adobe SVG Plug-In.
RESULTS AND CONCLUSIONS
Importing Spatial Features into PostgreSql Database. The tool developed in C#.NET for uploading and importingspatial data into database is shown in Figure 2. The tool provides the option for selecting and setting spatial featuressuch as spatial indexing and Spatial Reference Identification (SRID). The uploaded spatial data in postgre databaseand the attribute records were shown in Figure 3. Generated database will be the backend for the furtherimplementation and it will render supports similar to any other spatial database such as Oracle spatial, MicrosoftSql spatial.
Proceedings of 22nd Kerala Science Congress, 28-31 January 2010, KFRI, Peechi, pp. 643-644© KSCSTE 2010
08-70
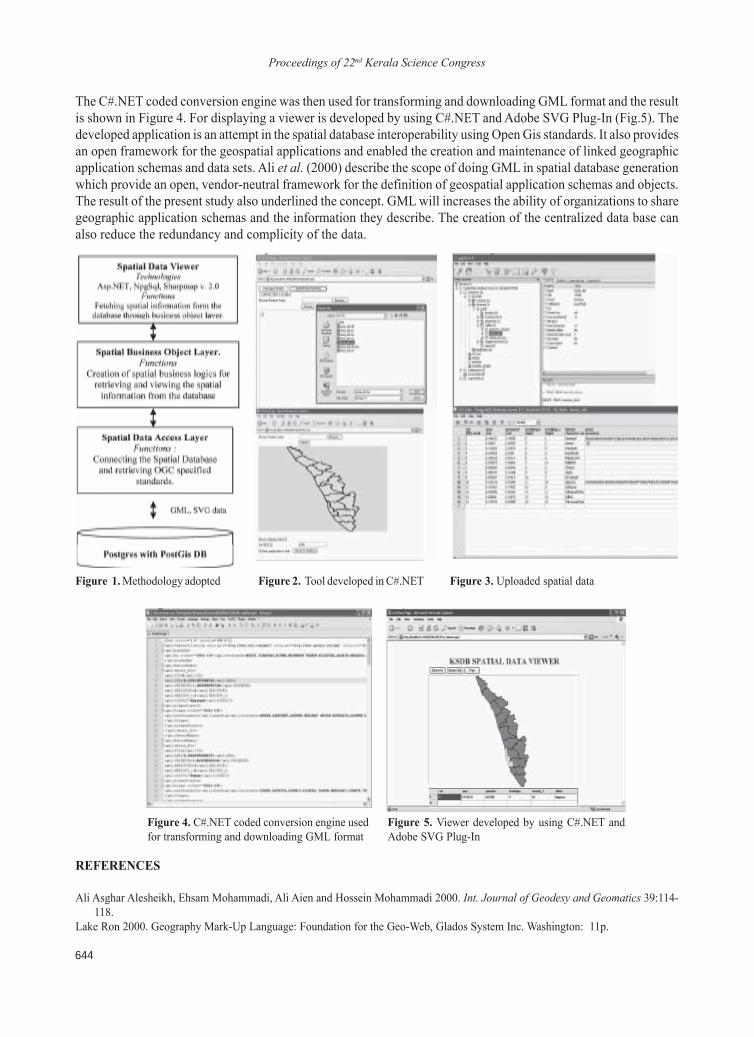
Proceedings of 22nd Kerala Science Congress
644
The C#.NET coded conversion engine was then used for transforming and downloading GML format and the resultis shown in Figure 4. For displaying a viewer is developed by using C#.NET and Adobe SVG Plug-In (Fig.5). Thedeveloped application is an attempt in the spatial database interoperability using Open Gis standards. It also providesan open framework for the geospatial applications and enabled the creation and maintenance of linked geographicapplication schemas and data sets. Ali et al. (2000) describe the scope of doing GML in spatial database generationwhich provide an open, vendor-neutral framework for the definition of geospatial application schemas and objects.The result of the present study also underlined the concept. GML will increases the ability of organizations to sharegeographic application schemas and the information they describe. The creation of the centralized data base canalso reduce the redundancy and complicity of the data.
REFERENCES
Ali Asghar Alesheikh, Ehsam Mohammadi, Ali Aien and Hossein Mohammadi 2000. Int. Journal of Geodesy and Geomatics 39:114-118.
Lake Ron 2000. Geography Mark-Up Language: Foundation for the Geo-Web, Glados System Inc. Washington: 11p.
Figure 1. Methodology adopted Figure 2. Tool developed in C#.NET Figure 3. Uploaded spatial data
Figure 4. C#.NET coded conversion engine usedfor transforming and downloading GML format
Figure 5. Viewer developed by using C#.NET andAdobe SVG Plug-In
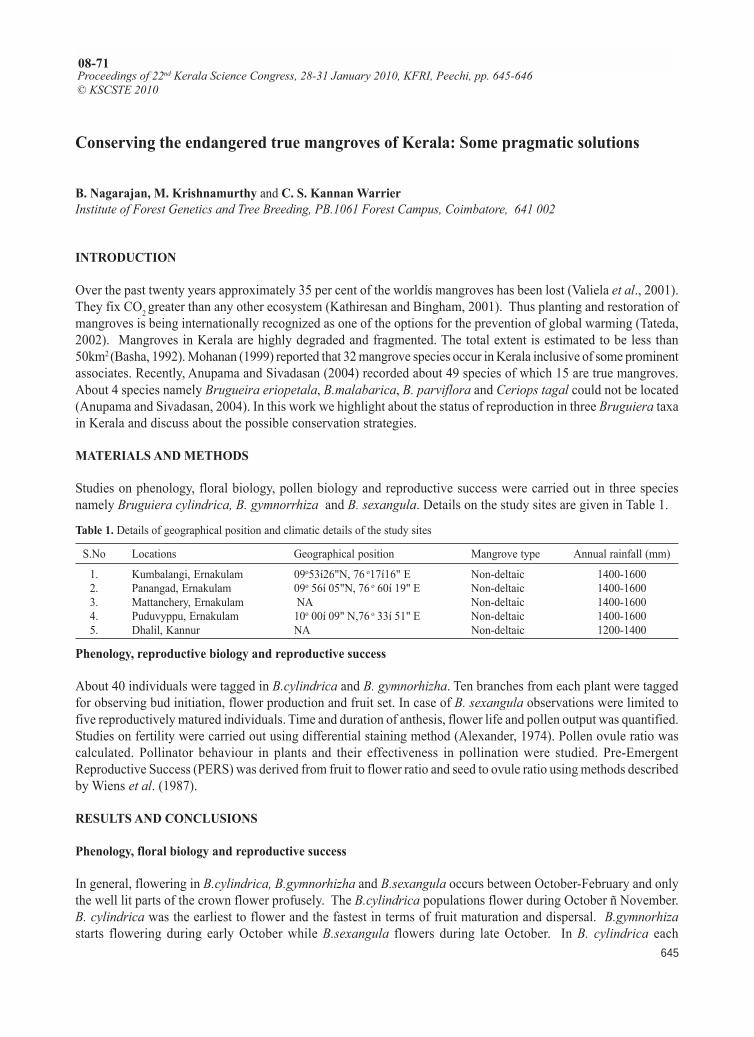
Proceedings of 22nd Kerala Science Congress
645
Conserving the endangered true mangroves of Kerala: Some pragmatic solutions
B. Nagarajan, M. Krishnamurthy and C. S. Kannan WarrierInstitute of Forest Genetics and Tree Breeding, PB.1061 Forest Campus, Coimbatore, 641 002
INTRODUCTION
Over the past twenty years approximately 35 per cent of the worldís mangroves has been lost (Valiela et al., 2001).They fix CO2 greater than any other ecosystem (Kathiresan and Bingham, 2001). Thus planting and restoration ofmangroves is being internationally recognized as one of the options for the prevention of global warming (Tateda,2002). Mangroves in Kerala are highly degraded and fragmented. The total extent is estimated to be less than50km2 (Basha, 1992). Mohanan (1999) reported that 32 mangrove species occur in Kerala inclusive of some prominentassociates. Recently, Anupama and Sivadasan (2004) recorded about 49 species of which 15 are true mangroves.About 4 species namely Brugueira eriopetala, B.malabarica, B. parviflora and Ceriops tagal could not be located(Anupama and Sivadasan, 2004). In this work we highlight about the status of reproduction in three Bruguiera taxain Kerala and discuss about the possible conservation strategies.
MATERIALS AND METHODS
Studies on phenology, floral biology, pollen biology and reproductive success were carried out in three speciesnamely Bruguiera cylindrica, B. gymnorrhiza and B. sexangula. Details on the study sites are given in Table 1.
Phenology, reproductive biology and reproductive success
About 40 individuals were tagged in B.cylindrica and B. gymnorhizha. Ten branches from each plant were taggedfor observing bud initiation, flower production and fruit set. In case of B. sexangula observations were limited tofive reproductively matured individuals. Time and duration of anthesis, flower life and pollen output was quantified.Studies on fertility were carried out using differential staining method (Alexander, 1974). Pollen ovule ratio wascalculated. Pollinator behaviour in plants and their effectiveness in pollination were studied. Pre-EmergentReproductive Success (PERS) was derived from fruit to flower ratio and seed to ovule ratio using methods describedby Wiens et al. (1987).
RESULTS AND CONCLUSIONS
Phenology, floral biology and reproductive success
In general, flowering in B.cylindrica, B.gymnorhizha and B.sexangula occurs between October-February and onlythe well lit parts of the crown flower profusely. The B.cylindrica populations flower during October ñ November.B. cylindrica was the earliest to flower and the fastest in terms of fruit maturation and dispersal. B.gymnorhizastarts flowering during early October while B.sexangula flowers during late October. In B. cylindrica each
Proceedings of 22nd Kerala Science Congress, 28-31 January 2010, KFRI, Peechi, pp. 645-646© KSCSTE 2010
08-71
Table 1. Details of geographical position and climatic details of the study sites
S.No Locations Geographical position Mangrove type Annual rainfall (mm)
1. Kumbalangi, Ernakulam 09o53í26"N, 76 o17í16" E Non-deltaic 1400-16002. Panangad, Ernakulam 09o 56í 05"N, 76 o 60í 19" E Non-deltaic 1400-16003. Mattanchery, Ernakulam NA Non-deltaic 1400-16004. Puduvyppu, Ernakulam 10o 00í 09" N,76 o 33í 51" E Non-deltaic 1400-16005. Dhalil, Kannur NA Non-deltaic 1200-1400
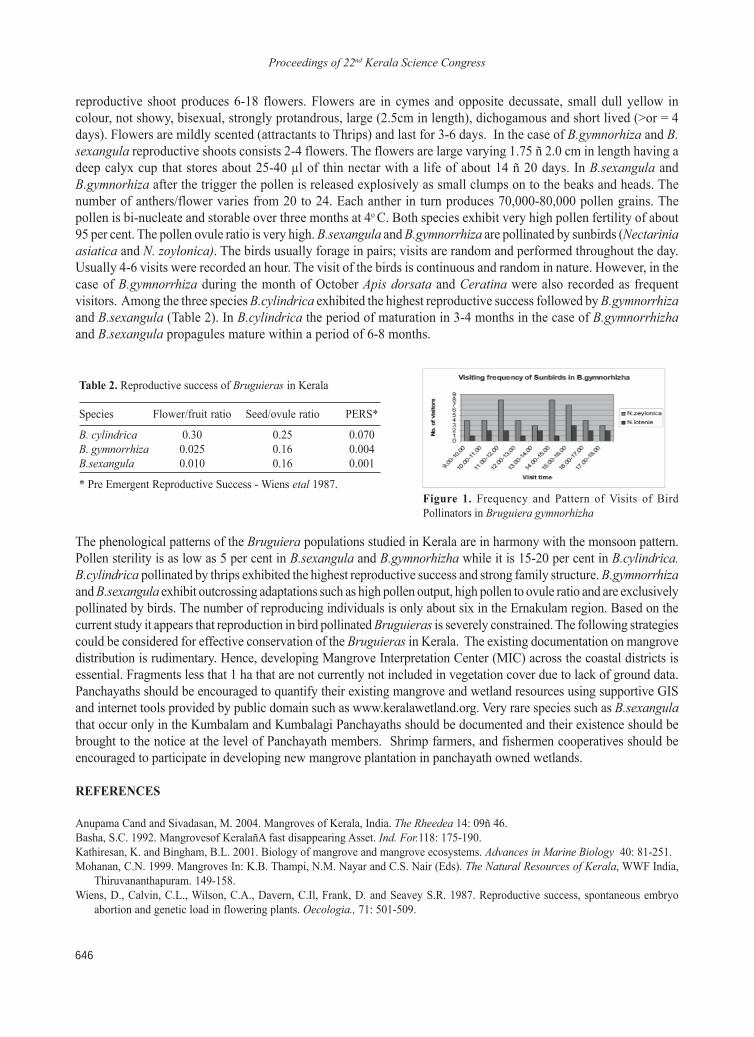
Proceedings of 22nd Kerala Science Congress
646
Figure 1. Frequency and Pattern of Visits of BirdPollinators in Bruguiera gymnorhizha
reproductive shoot produces 6-18 flowers. Flowers are in cymes and opposite decussate, small dull yellow incolour, not showy, bisexual, strongly protandrous, large (2.5cm in length), dichogamous and short lived (>or = 4days). Flowers are mildly scented (attractants to Thrips) and last for 3-6 days. In the case of B.gymnorhiza and B.sexangula reproductive shoots consists 2-4 flowers. The flowers are large varying 1.75 ñ 2.0 cm in length having adeep calyx cup that stores about 25-40 µl of thin nectar with a life of about 14 ñ 20 days. In B.sexangula andB.gymnorhiza after the trigger the pollen is released explosively as small clumps on to the beaks and heads. Thenumber of anthers/flower varies from 20 to 24. Each anther in turn produces 70,000-80,000 pollen grains. Thepollen is bi-nucleate and storable over three months at 4o C. Both species exhibit very high pollen fertility of about95 per cent. The pollen ovule ratio is very high. B.sexangula and B.gymnorrhiza are pollinated by sunbirds (Nectariniaasiatica and N. zoylonica). The birds usually forage in pairs; visits are random and performed throughout the day.Usually 4-6 visits were recorded an hour. The visit of the birds is continuous and random in nature. However, in thecase of B.gymnorrhiza during the month of October Apis dorsata and Ceratina were also recorded as frequentvisitors. Among the three species B.cylindrica exhibited the highest reproductive success followed by B.gymnorrhizaand B.sexangula (Table 2). In B.cylindrica the period of maturation in 3-4 months in the case of B.gymnorrhizhaand B.sexangula propagules mature within a period of 6-8 months.
The phenological patterns of the Bruguiera populations studied in Kerala are in harmony with the monsoon pattern.Pollen sterility is as low as 5 per cent in B.sexangula and B.gymnorhizha while it is 15-20 per cent in B.cylindrica.B.cylindrica pollinated by thrips exhibited the highest reproductive success and strong family structure. B.gymnorrhizaand B.sexangula exhibit outcrossing adaptations such as high pollen output, high pollen to ovule ratio and are exclusivelypollinated by birds. The number of reproducing individuals is only about six in the Ernakulam region. Based on thecurrent study it appears that reproduction in bird pollinated Bruguieras is severely constrained. The following strategiescould be considered for effective conservation of the Bruguieras in Kerala. The existing documentation on mangrovedistribution is rudimentary. Hence, developing Mangrove Interpretation Center (MIC) across the coastal districts isessential. Fragments less that 1 ha that are not currently not included in vegetation cover due to lack of ground data.Panchayaths should be encouraged to quantify their existing mangrove and wetland resources using supportive GISand internet tools provided by public domain such as www.keralawetland.org. Very rare species such as B.sexangulathat occur only in the Kumbalam and Kumbalagi Panchayaths should be documented and their existence should bebrought to the notice at the level of Panchayath members. Shrimp farmers, and fishermen cooperatives should beencouraged to participate in developing new mangrove plantation in panchayath owned wetlands.
REFERENCES
Anupama Cand and Sivadasan, M. 2004. Mangroves of Kerala, India. The Rheedea 14: 09ñ 46.Basha, S.C. 1992. Mangrovesof KeralañA fast disappearing Asset. Ind. For.118: 175-190.Kathiresan, K. and Bingham, B.L. 2001. Biology of mangrove and mangrove ecosystems. Advances in Marine Biology 40: 81-251.Mohanan, C.N. 1999. Mangroves In: K.B. Thampi, N.M. Nayar and C.S. Nair (Eds). The Natural Resources of Kerala, WWF India,
Thiruvananthapuram. 149-158.Wiens, D., Calvin, C.L., Wilson, C.A., Davern, C.Il, Frank, D. and Seavey S.R. 1987. Reproductive success, spontaneous embryo
abortion and genetic load in flowering plants. Oecologia., 71: 501-509.
Table 2. Reproductive success of Bruguieras in Kerala
Species Flower/fruit ratio Seed/ovule ratio PERS*
B. cylindrica 0.30 0.25 0.070B. gymnorrhiza 0.025 0.16 0.004B.sexangula 0.010 0.16 0.001
* Pre Emergent Reproductive Success - Wiens etal 1987.
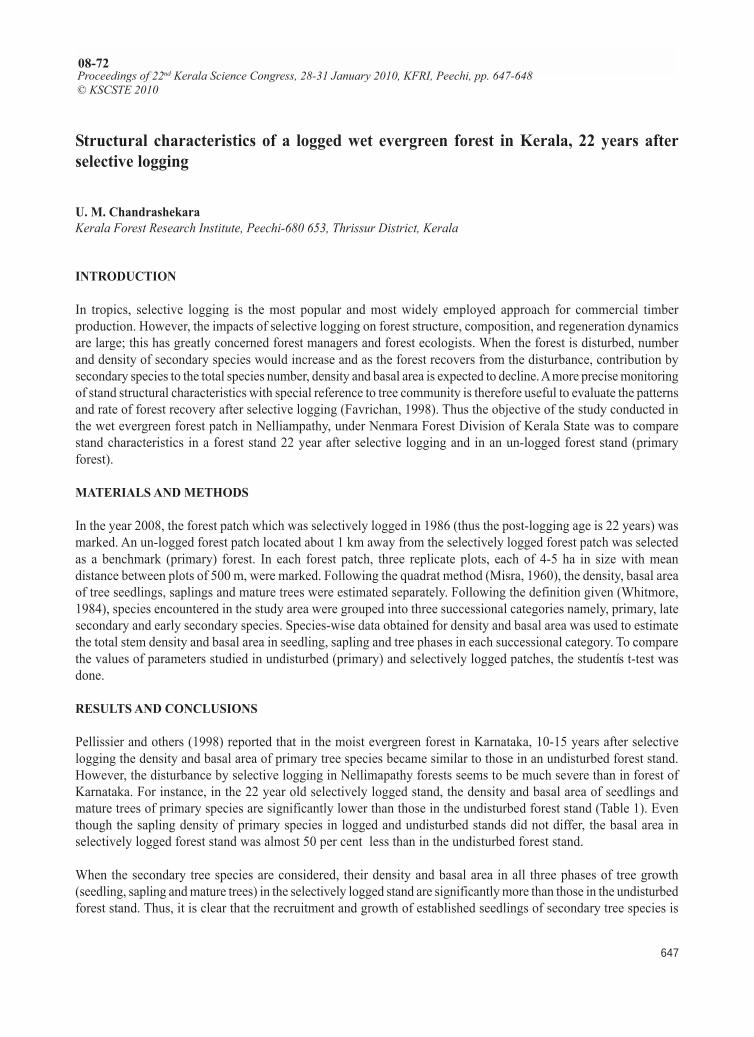
Proceedings of 22nd Kerala Science Congress
647
Structural characteristics of a logged wet evergreen forest in Kerala, 22 years afterselective logging
U. M. ChandrashekaraKerala Forest Research Institute, Peechi-680 653, Thrissur District, Kerala
INTRODUCTION
In tropics, selective logging is the most popular and most widely employed approach for commercial timberproduction. However, the impacts of selective logging on forest structure, composition, and regeneration dynamicsare large; this has greatly concerned forest managers and forest ecologists. When the forest is disturbed, numberand density of secondary species would increase and as the forest recovers from the disturbance, contribution bysecondary species to the total species number, density and basal area is expected to decline. A more precise monitoringof stand structural characteristics with special reference to tree community is therefore useful to evaluate the patternsand rate of forest recovery after selective logging (Favrichan, 1998). Thus the objective of the study conducted inthe wet evergreen forest patch in Nelliampathy, under Nenmara Forest Division of Kerala State was to comparestand characteristics in a forest stand 22 year after selective logging and in an un-logged forest stand (primaryforest).
MATERIALS AND METHODS
In the year 2008, the forest patch which was selectively logged in 1986 (thus the post-logging age is 22 years) wasmarked. An un-logged forest patch located about 1 km away from the selectively logged forest patch was selectedas a benchmark (primary) forest. In each forest patch, three replicate plots, each of 4-5 ha in size with meandistance between plots of 500 m, were marked. Following the quadrat method (Misra, 1960), the density, basal areaof tree seedlings, saplings and mature trees were estimated separately. Following the definition given (Whitmore,1984), species encountered in the study area were grouped into three successional categories namely, primary, latesecondary and early secondary species. Species-wise data obtained for density and basal area was used to estimatethe total stem density and basal area in seedling, sapling and tree phases in each successional category. To comparethe values of parameters studied in undisturbed (primary) and selectively logged patches, the studentís t-test wasdone.
RESULTS AND CONCLUSIONS
Pellissier and others (1998) reported that in the moist evergreen forest in Karnataka, 10-15 years after selectivelogging the density and basal area of primary tree species became similar to those in an undisturbed forest stand.However, the disturbance by selective logging in Nellimapathy forests seems to be much severe than in forest ofKarnataka. For instance, in the 22 year old selectively logged stand, the density and basal area of seedlings andmature trees of primary species are significantly lower than those in the undisturbed forest stand (Table 1). Eventhough the sapling density of primary species in logged and undisturbed stands did not differ, the basal area inselectively logged forest stand was almost 50 per cent less than in the undisturbed forest stand.
When the secondary tree species are considered, their density and basal area in all three phases of tree growth(seedling, sapling and mature trees) in the selectively logged stand are significantly more than those in the undisturbedforest stand. Thus, it is clear that the recruitment and growth of established seedlings of secondary tree species is
Proceedings of 22nd Kerala Science Congress, 28-31 January 2010, KFRI, Peechi, pp. 647-648© KSCSTE 2010
08-72
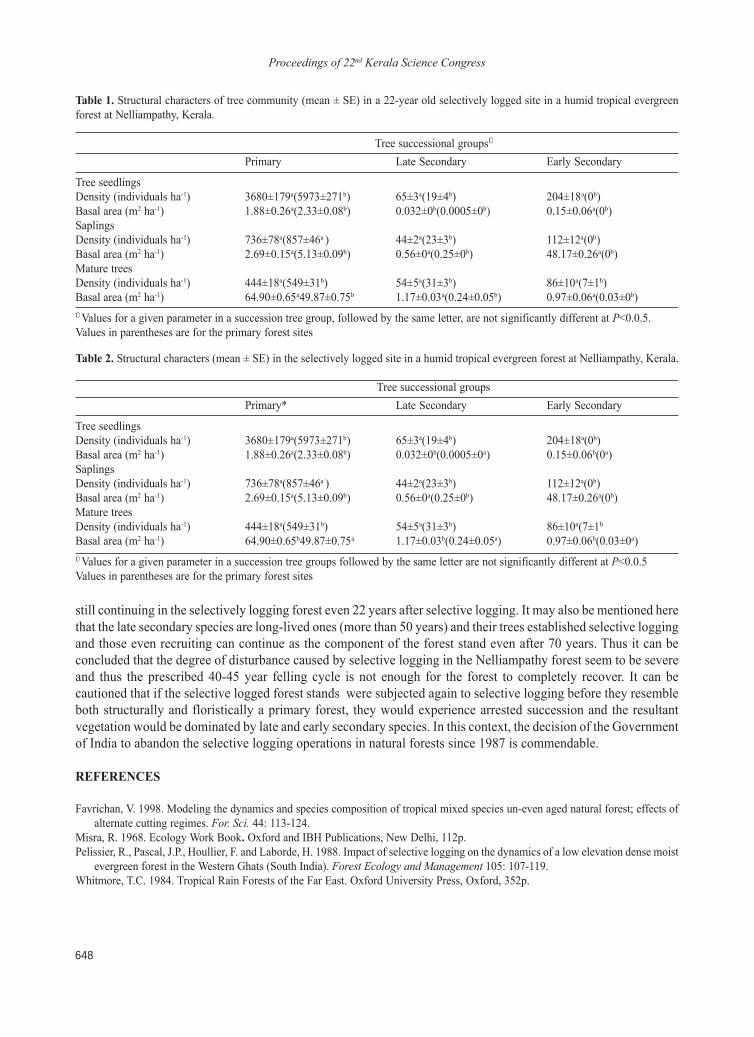
Proceedings of 22nd Kerala Science Congress
648
still continuing in the selectively logging forest even 22 years after selective logging. It may also be mentioned herethat the late secondary species are long-lived ones (more than 50 years) and their trees established selective loggingand those even recruiting can continue as the component of the forest stand even after 70 years. Thus it can beconcluded that the degree of disturbance caused by selective logging in the Nelliampathy forest seem to be severeand thus the prescribed 40-45 year felling cycle is not enough for the forest to completely recover. It can becautioned that if the selective logged forest stands were subjected again to selective logging before they resembleboth structurally and floristically a primary forest, they would experience arrested succession and the resultantvegetation would be dominated by late and early secondary species. In this context, the decision of the Governmentof India to abandon the selective logging operations in natural forests since 1987 is commendable.
REFERENCES
Favrichan, V. 1998. Modeling the dynamics and species composition of tropical mixed species un-even aged natural forest; effects ofalternate cutting regimes. For. Sci. 44: 113-124.
Misra, R. 1968. Ecology Work Book. Oxford and IBH Publications, New Delhi, 112p.Pelissier, R., Pascal, J.P., Houllier, F. and Laborde, H. 1988. Impact of selective logging on the dynamics of a low elevation dense moist
evergreen forest in the Western Ghats (South India). Forest Ecology and Management 105: 107-119.Whitmore, T.C. 1984. Tropical Rain Forests of the Far East. Oxford University Press, Oxford, 352p.
Table 1. Structural characters of tree community (mean ± SE) in a 22-year old selectively logged site in a humid tropical evergreenforest at Nelliampathy, Kerala.
Tree successional groupsÜ
Primary Late Secondary Early Secondary
Tree seedlingsDensity (individuals ha-1) 3680±179a(5973±271b) 65±3a(19±4b) 204±18a(0b)Basal area (m2 ha-1) 1.88±0.26a(2.33±0.08b) 0.032±0b(0.0005±0b) 0.15±0.06a(0b)SaplingsDensity (individuals ha-1) 736±78a(857±46a ) 44±2a(23±3b) 112±12a(0b)Basal area (m2 ha-1) 2.69±0.15a(5.13±0.09b) 0.56±0a(0.25±0b) 48.17±0.26a(0b)Mature treesDensity (individuals ha-1) 444±18a(549±31b) 54±5a(31±3b) 86±10a(7±1b)Basal area (m2 ha-1) 64.90±0.65a49.87±0.75b 1.17±0.03a(0.24±0.05b) 0.97±0.06a(0.03±0b)Ü Values for a given parameter in a succession tree group, followed by the same letter, are not significantly different at P<0.0.5.Values in parentheses are for the primary forest sites
Table 2. Structural characters (mean ± SE) in the selectively logged site in a humid tropical evergreen forest at Nelliampathy, Kerala.
Tree successional groupsPrimary* Late Secondary Early Secondary
Tree seedlingsDensity (individuals ha-1) 3680±179a(5973±271b) 65±3a(19±4b) 204±18a(0b)Basal area (m2 ha-1) 1.88±0.26a(2.33±0.08b) 0.032±0b(0.0005±0a) 0.15±0.06b(0a)SaplingsDensity (individuals ha-1) 736±78a(857±46a ) 44±2a(23±3b) 112±12a(0b)Basal area (m2 ha-1) 2.69±0.15a(5.13±0.09b) 0.56±0a(0.25±0b) 48.17±0.26a(0b)Mature treesDensity (individuals ha-1) 444±18a(549±31b) 54±5a(31±3b) 86±10a(7±1bBasal area (m2 ha-1) 64.90±0.65b49.87±0.75a 1.17±0.03b(0.24±0.05a) 0.97±0.06b(0.03±0a)Ü Values for a given parameter in a succession tree groups followed by the same letter are not significantly different at P<0.0.5Values in parentheses are for the primary forest sites
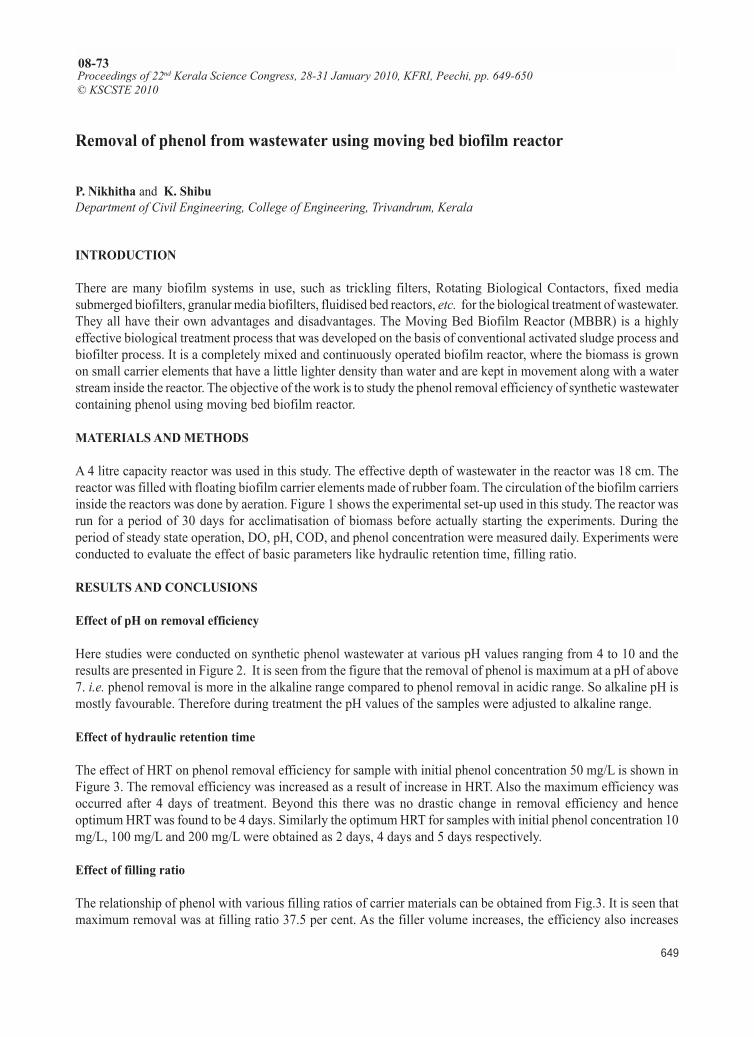
Proceedings of 22nd Kerala Science Congress
649
Removal of phenol from wastewater using moving bed biofilm reactor
P. Nikhitha and K. ShibuDepartment of Civil Engineering, College of Engineering, Trivandrum, Kerala
INTRODUCTION
There are many biofilm systems in use, such as trickling filters, Rotating Biological Contactors, fixed mediasubmerged biofilters, granular media biofilters, fluidised bed reactors, etc. for the biological treatment of wastewater.They all have their own advantages and disadvantages. The Moving Bed Biofilm Reactor (MBBR) is a highlyeffective biological treatment process that was developed on the basis of conventional activated sludge process andbiofilter process. It is a completely mixed and continuously operated biofilm reactor, where the biomass is grownon small carrier elements that have a little lighter density than water and are kept in movement along with a waterstream inside the reactor. The objective of the work is to study the phenol removal efficiency of synthetic wastewatercontaining phenol using moving bed biofilm reactor.
MATERIALS AND METHODS
A 4 litre capacity reactor was used in this study. The effective depth of wastewater in the reactor was 18 cm. Thereactor was filled with floating biofilm carrier elements made of rubber foam. The circulation of the biofilm carriersinside the reactors was done by aeration. Figure 1 shows the experimental set-up used in this study. The reactor wasrun for a period of 30 days for acclimatisation of biomass before actually starting the experiments. During theperiod of steady state operation, DO, pH, COD, and phenol concentration were measured daily. Experiments wereconducted to evaluate the effect of basic parameters like hydraulic retention time, filling ratio.
RESULTS AND CONCLUSIONS
Effect of pH on removal efficiency
Here studies were conducted on synthetic phenol wastewater at various pH values ranging from 4 to 10 and theresults are presented in Figure 2. It is seen from the figure that the removal of phenol is maximum at a pH of above7. i.e. phenol removal is more in the alkaline range compared to phenol removal in acidic range. So alkaline pH ismostly favourable. Therefore during treatment the pH values of the samples were adjusted to alkaline range.
Effect of hydraulic retention time
The effect of HRT on phenol removal efficiency for sample with initial phenol concentration 50 mg/L is shown inFigure 3. The removal efficiency was increased as a result of increase in HRT. Also the maximum efficiency wasoccurred after 4 days of treatment. Beyond this there was no drastic change in removal efficiency and henceoptimum HRT was found to be 4 days. Similarly the optimum HRT for samples with initial phenol concentration 10mg/L, 100 mg/L and 200 mg/L were obtained as 2 days, 4 days and 5 days respectively.
Effect of filling ratio
The relationship of phenol with various filling ratios of carrier materials can be obtained from Fig.3. It is seen thatmaximum removal was at filling ratio 37.5 per cent. As the filler volume increases, the efficiency also increases
Proceedings of 22nd Kerala Science Congress, 28-31 January 2010, KFRI, Peechi, pp. 649-650© KSCSTE 2010
08-73
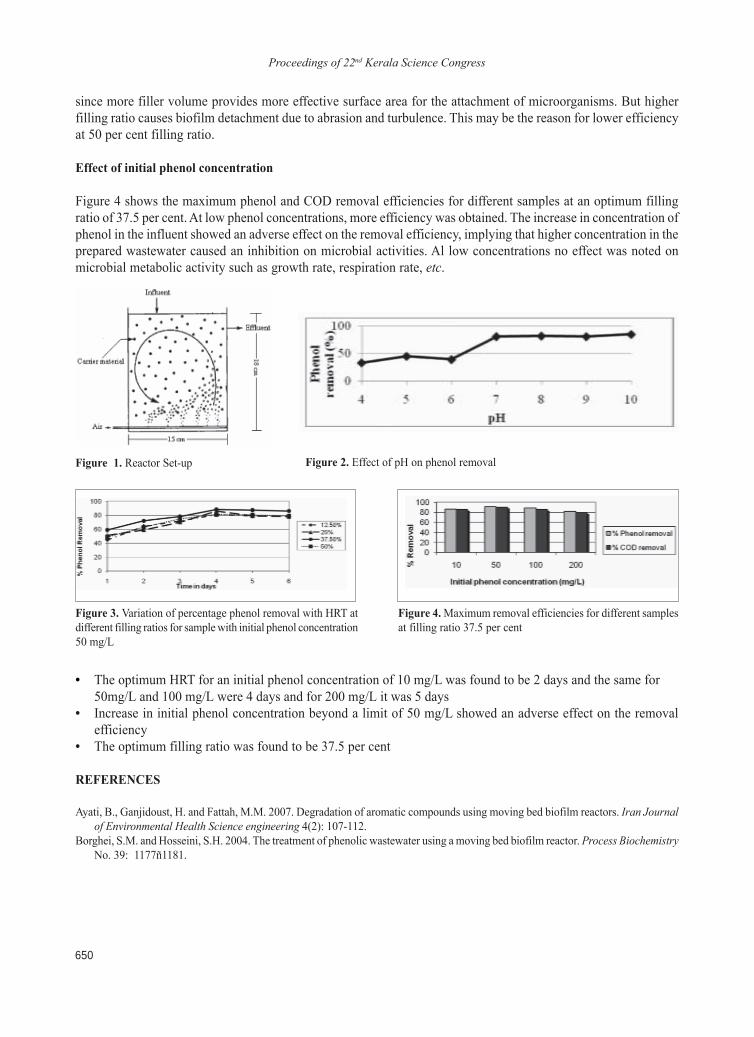
Proceedings of 22nd Kerala Science Congress
650
since more filler volume provides more effective surface area for the attachment of microorganisms. But higherfilling ratio causes biofilm detachment due to abrasion and turbulence. This may be the reason for lower efficiencyat 50 per cent filling ratio.
Effect of initial phenol concentration
Figure 4 shows the maximum phenol and COD removal efficiencies for different samples at an optimum fillingratio of 37.5 per cent. At low phenol concentrations, more efficiency was obtained. The increase in concentration ofphenol in the influent showed an adverse effect on the removal efficiency, implying that higher concentration in theprepared wastewater caused an inhibition on microbial activities. Al low concentrations no effect was noted onmicrobial metabolic activity such as growth rate, respiration rate, etc.
Figure 1. Reactor Set-up Figure 2. Effect of pH on phenol removal
Figure 3. Variation of percentage phenol removal with HRT atdifferent filling ratios for sample with initial phenol concentration50 mg/L
Figure 4. Maximum removal efficiencies for different samplesat filling ratio 37.5 per cent
• The optimum HRT for an initial phenol concentration of 10 mg/L was found to be 2 days and the same for50mg/L and 100 mg/L were 4 days and for 200 mg/L it was 5 days
• Increase in initial phenol concentration beyond a limit of 50 mg/L showed an adverse effect on the removalefficiency
• The optimum filling ratio was found to be 37.5 per cent
REFERENCES
Ayati, B., Ganjidoust, H. and Fattah, M.M. 2007. Degradation of aromatic compounds using moving bed biofilm reactors. Iran Journalof Environmental Health Science engineering 4(2): 107-112.
Borghei, S.M. and Hosseini, S.H. 2004. The treatment of phenolic wastewater using a moving bed biofilm reactor. Process BiochemistryNo. 39: 1177ñ1181.
Proceedings of 22nd Kerala Science Congress
651
Proceedings of 22nd Kerala Science Congress, 28-31 January 2010, KFRI, Peechi, pp. 651-652© KSCSTE 2010
08-74
Effect of earliness in germination on seedling attributes of teak (Tectona grandis Linn. f.)
C. M. Jijeesh1* and K. Sudhakara21Kerala Forest Research Institute, Peechi 680 653 Thrissur, Kerala2College of Forestry, Kerala Agricultural University, Thrissur 680 656 Kerala
INTRODUCTION
Teak is a high value timber species originated from South East Asia and much prized for technological charactersas well as aesthetic value of wood; it is also well known for its durability. The traditional method of propagating thisspecies is through drupes. It is observed that teak seedlings emerge over a period of time when pretreated drupes aresown in nursery beds. Timing of emergence of the seedlings has important consequences for the subsequent survivaland fitness (Bush and Van Auken, 1991). A few days delay in emergence can be magnified into large differences inestablishment, growth, final biomass and reproduction, especially under competitive situations (Ross and Harper,1972). Hence, the present investigation was carried out to find the influence of time of emergence on seedlingperformance of Tectona grandis Linn. f.
MATERIALS AND METHODS
The study was conducted at the College of Forestry, Kerala Agricultural University, Thrissur, Kerala, during June2002 to June 2003. The teak drupes were collected during January - February of 2002 from the Cherupuzha plantationof Nilambur Forest Division, Kerala. The seeds were pretreated by termites (Chacko, 1998) and sown in the standardnursery beds. The germinants emerging at weekly interval up to four weeks were pricked out and polypotted inrooting medium containing sand: soil in the ratio of 1:1. Observations were taken (12 plants per treatment) onseedling height, collar diameter and number of functional leaves, leaf area, length of taproot, number of lateralroots, total biomass and relative growth rate at 90, 120, 180, 270 and 360 days after planting.. Relative growth rate(RGR) (g g-1 month-1) was calculated from the formula given by Hunt (1990): )/()log(log 1212 ttWWRGR ee −−=where, W1 and W2 are the dry weight determined at time t1 and t2 respectively. Data were subjected to Analysis ofVariance and treatment means were compared with least significant difference (lsd) at one percent level.
RESULTS AND CONCLUSIONS
Time of germination significantly influenced the seedling performance in teak. At 90 days after planting, the secondweek germinants recorded significantly higher value for collar diameter, number of functional leaves, tap root lengthand RGR (Table 1 and Fig. 1). The height and number of lateral roots of the seedlings varied significantly from 180days and the first week germinants recorded the maximum value. The number of functional leaves, tap root length andspecific leaf area were also significantly highest in the case of first week emergents. At 270 days after planting, collardiameter, number of functional leaves, leaf area, number of lateral roots and total biomass were highest in secondweek emergents; whereas RGR was highest in fourth week emergents. At 360 days after planting, seedlings emergedduring the first week recorded the highest mean value for seedling height (50.37 cm), collar diameter (7.64 mm), leafarea (1444.95 cm2), number of lateral roots (55.46), total biomass (13.50 g) and RGR (0.3356 g g-1 month-1), while, thelowest mean value was recorded for the fourth week emergent in seedling height (37.60cm), collar diameter (6.60mm), leaf area (1069.49 cm2), number of lateral roots (47.06) and total biomass (9.67g). But the third week emergentsrecorded the lowest mean value for RGR (0.1330 g g-1 month-1). The results of the present study are in accordance withthe finding that the biomass is much higher for earlier emerging seedlings than late-emerging ones (Ross and Harper,1972 and Howell, 1981). In our study, with a few exceptions, the seedling performance was in the order first> second>
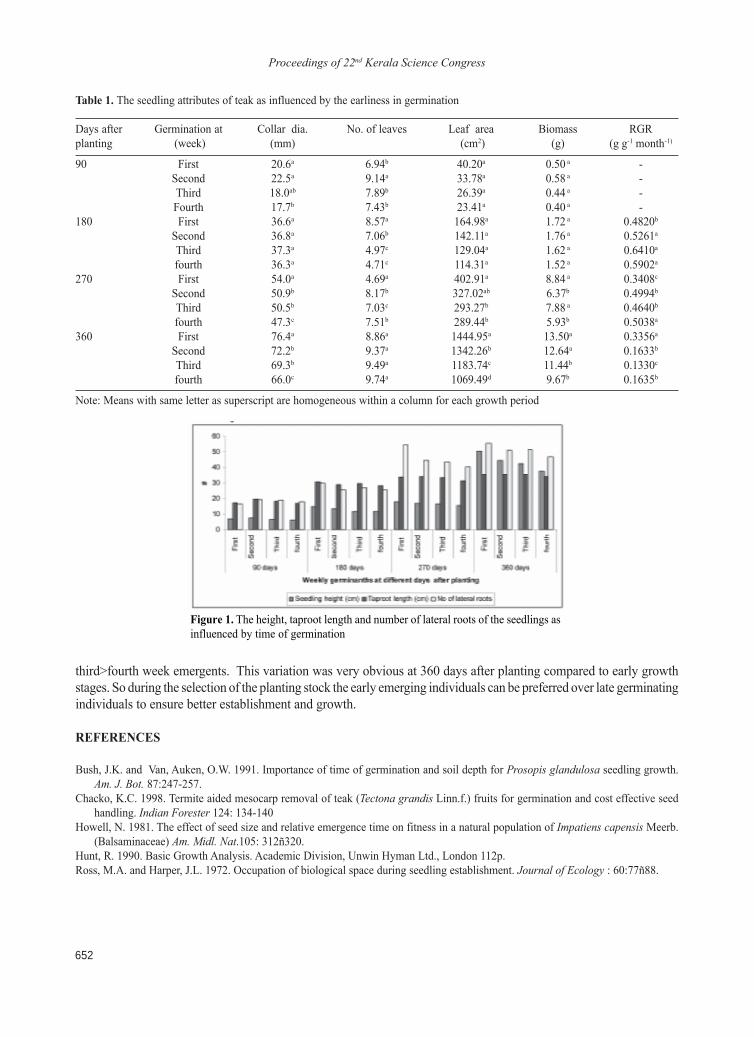
Proceedings of 22nd Kerala Science Congress
652
third>fourth week emergents. This variation was very obvious at 360 days after planting compared to early growthstages. So during the selection of the planting stock the early emerging individuals can be preferred over late germinatingindividuals to ensure better establishment and growth.
REFERENCES
Bush, J.K. and Van, Auken, O.W. 1991. Importance of time of germination and soil depth for Prosopis glandulosa seedling growth.Am. J. Bot. 87:247-257.
Chacko, K.C. 1998. Termite aided mesocarp removal of teak (Tectona grandis Linn.f.) fruits for germination and cost effective seedhandling. Indian Forester 124: 134-140
Howell, N. 1981. The effect of seed size and relative emergence time on fitness in a natural population of Impatiens capensis Meerb.(Balsaminaceae) Am. Midl. Nat.105: 312ñ320.
Hunt, R. 1990. Basic Growth Analysis. Academic Division, Unwin Hyman Ltd., London 112p.Ross, M.A. and Harper, J.L. 1972. Occupation of biological space during seedling establishment. Journal of Ecology : 60:77ñ88.
Table 1. The seedling attributes of teak as influenced by the earliness in germination
Days after Germination at Collar dia. No. of leaves Leaf area Biomass RGRplanting (week) (mm) (cm2) (g) (g g-1 month-1)
90 First 20.6a 6.94b 40.20a 0.50 a -Second 22.5a 9.14a 33.78a 0.58 a -Third 18.0ab 7.89b 26.39a 0.44 a -Fourth 17.7b 7.43b 23.41a 0.40 a -
180 First 36.6a 8.57a 164.98a 1.72 a 0.4820bSecond 36.8a 7.06b 142.11a 1.76 a 0.5261aThird 37.3a 4.97c 129.04a 1.62 a 0.6410afourth 36.3a 4.71c 114.31a 1.52 a 0.5902a
270 First 54.0a 4.69a 402.91a 8.84 a 0.3408cSecond 50.9b 8.17b 327.02ab 6.37b 0.4994bThird 50.5b 7.03c 293.27b 7.88 a 0.4640bfourth 47.3c 7.51b 289.44b 5.93b 0.5038a
360 First 76.4a 8.86a 1444.95a 13.50a 0.3356aSecond 72.2b 9.37a 1342.26b 12.64a 0.1633bThird 69.3b 9.49a 1183.74c 11.44b 0.1330cfourth 66.0c 9.74a 1069.49d 9.67b 0.1635b
Note: Means with same letter as superscript are homogeneous within a column for each growth period
Figure 1. The height, taproot length and number of lateral roots of the seedlings asinfluenced by time of germination
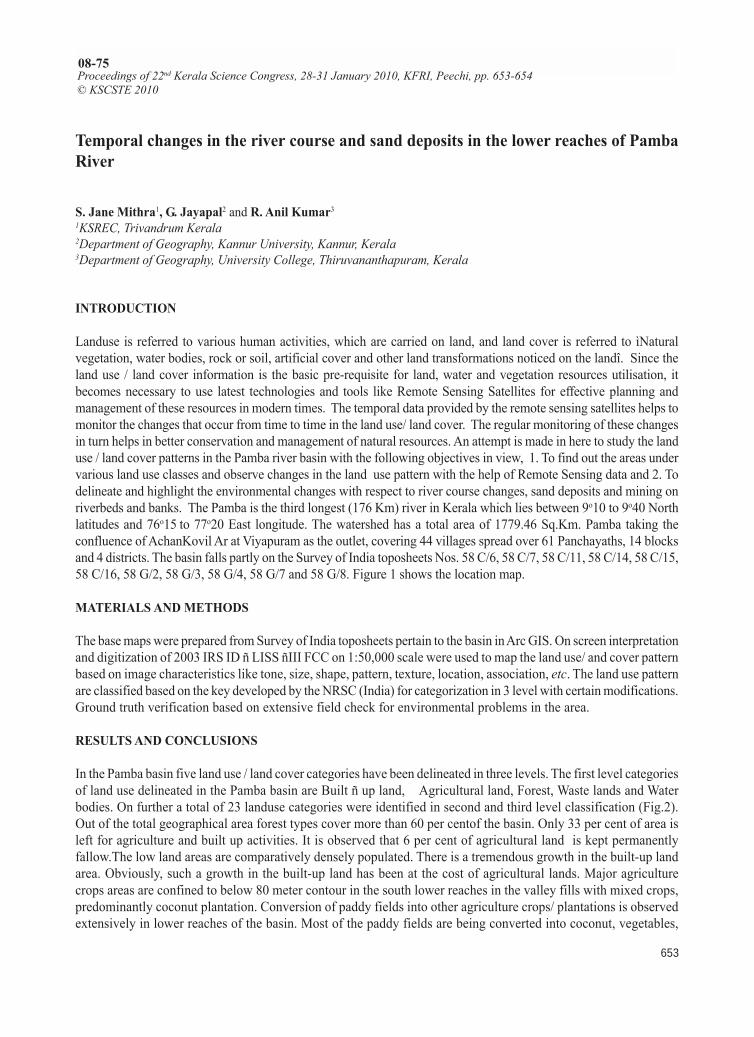
Proceedings of 22nd Kerala Science Congress
653
Proceedings of 22nd Kerala Science Congress, 28-31 January 2010, KFRI, Peechi, pp. 653-654© KSCSTE 2010
08-75
Temporal changes in the river course and sand deposits in the lower reaches of PambaRiver
S. Jane Mithra1, G. Jayapal2 and R. Anil Kumar31KSREC, Trivandrum Kerala2Department of Geography, Kannur University, Kannur, Kerala3Department of Geography, University College, Thiruvananthapuram, Kerala
INTRODUCTION
Landuse is referred to various human activities, which are carried on land, and land cover is referred to ìNaturalvegetation, water bodies, rock or soil, artificial cover and other land transformations noticed on the landî. Since theland use / land cover information is the basic pre-requisite for land, water and vegetation resources utilisation, itbecomes necessary to use latest technologies and tools like Remote Sensing Satellites for effective planning andmanagement of these resources in modern times. The temporal data provided by the remote sensing satellites helps tomonitor the changes that occur from time to time in the land use/ land cover. The regular monitoring of these changesin turn helps in better conservation and management of natural resources. An attempt is made in here to study the landuse / land cover patterns in the Pamba river basin with the following objectives in view, 1. To find out the areas undervarious land use classes and observe changes in the land use pattern with the help of Remote Sensing data and 2. Todelineate and highlight the environmental changes with respect to river course changes, sand deposits and mining onriverbeds and banks. The Pamba is the third longest (176 Km) river in Kerala which lies between 9o10 to 9o40 Northlatitudes and 76o15 to 77
o20 East longitude. The watershed has a total area of 1779.46 Sq.Km. Pamba taking theconfluence of AchanKovil Ar at Viyapuram as the outlet, covering 44 villages spread over 61 Panchayaths, 14 blocksand 4 districts. The basin falls partly on the Survey of India toposheets Nos. 58 C/6, 58 C/7, 58 C/11, 58 C/14, 58 C/15,58 C/16, 58 G/2, 58 G/3, 58 G/4, 58 G/7 and 58 G/8. Figure 1 shows the location map.
MATERIALS AND METHODS
The base maps were prepared from Survey of India toposheets pertain to the basin in Arc GIS. On screen interpretationand digitization of 2003 IRS ID ñ LISS ñIII FCC on 1:50,000 scale were used to map the land use/ and cover patternbased on image characteristics like tone, size, shape, pattern, texture, location, association, etc. The land use patternare classified based on the key developed by the NRSC (India) for categorization in 3 level with certain modifications.Ground truth verification based on extensive field check for environmental problems in the area.
RESULTS AND CONCLUSIONS
In the Pamba basin five land use / land cover categories have been delineated in three levels. The first level categoriesof land use delineated in the Pamba basin are Built ñ up land, Agricultural land, Forest, Waste lands and Waterbodies. On further a total of 23 landuse categories were identified in second and third level classification (Fig.2).Out of the total geographical area forest types cover more than 60 per centof the basin. Only 33 per cent of area isleft for agriculture and built up activities. It is observed that 6 per cent of agricultural land is kept permanentlyfallow.The low land areas are comparatively densely populated. There is a tremendous growth in the built-up landarea. Obviously, such a growth in the built-up land has been at the cost of agricultural lands. Major agriculturecrops areas are confined to below 80 meter contour in the south lower reaches in the valley fills with mixed crops,predominantly coconut plantation. Conversion of paddy fields into other agriculture crops/ plantations is observedextensively in lower reaches of the basin. Most of the paddy fields are being converted into coconut, vegetables,
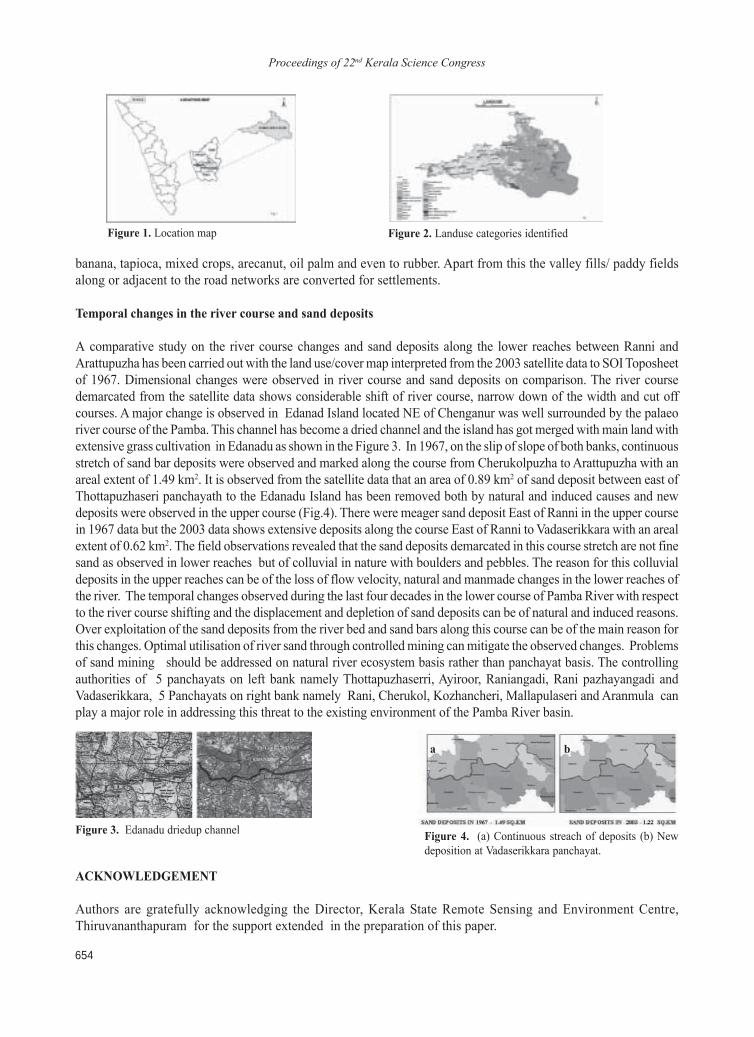
Proceedings of 22nd Kerala Science Congress
654
Figure 3. Edanadu driedup channel Figure 4. (a) Continuous streach of deposits (b) Newdeposition at Vadaserikkara panchayat.
Figure 1. Location map Figure 2. Landuse categories identified
banana, tapioca, mixed crops, arecanut, oil palm and even to rubber. Apart from this the valley fills/ paddy fieldsalong or adjacent to the road networks are converted for settlements.
Temporal changes in the river course and sand deposits
A comparative study on the river course changes and sand deposits along the lower reaches between Ranni andArattupuzha has been carried out with the land use/cover map interpreted from the 2003 satellite data to SOI Toposheetof 1967. Dimensional changes were observed in river course and sand deposits on comparison. The river coursedemarcated from the satellite data shows considerable shift of river course, narrow down of the width and cut offcourses. A major change is observed in Edanad Island located NE of Chenganur was well surrounded by the palaeoriver course of the Pamba. This channel has become a dried channel and the island has got merged with main land withextensive grass cultivation in Edanadu as shown in the Figure 3. In 1967, on the slip of slope of both banks, continuousstretch of sand bar deposits were observed and marked along the course from Cherukolpuzha to Arattupuzha with anareal extent of 1.49 km2. It is observed from the satellite data that an area of 0.89 km2 of sand deposit between east ofThottapuzhaseri panchayath to the Edanadu Island has been removed both by natural and induced causes and newdeposits were observed in the upper course (Fig.4). There were meager sand deposit East of Ranni in the upper coursein 1967 data but the 2003 data shows extensive deposits along the course East of Ranni to Vadaserikkara with an arealextent of 0.62 km2. The field observations revealed that the sand deposits demarcated in this course stretch are not finesand as observed in lower reaches but of colluvial in nature with boulders and pebbles. The reason for this colluvialdeposits in the upper reaches can be of the loss of flow velocity, natural and manmade changes in the lower reaches ofthe river. The temporal changes observed during the last four decades in the lower course of Pamba River with respectto the river course shifting and the displacement and depletion of sand deposits can be of natural and induced reasons.Over exploitation of the sand deposits from the river bed and sand bars along this course can be of the main reason forthis changes. Optimal utilisation of river sand through controlled mining can mitigate the observed changes. Problemsof sand mining should be addressed on natural river ecosystem basis rather than panchayat basis. The controllingauthorities of 5 panchayats on left bank namely Thottapuzhaserri, Ayiroor, Raniangadi, Rani pazhayangadi andVadaserikkara, 5 Panchayats on right bank namely Rani, Cherukol, Kozhancheri, Mallapulaseri and Aranmula canplay a major role in addressing this threat to the existing environment of the Pamba River basin.
a b
ACKNOWLEDGEMENT
Authors are gratefully acknowledging the Director, Kerala State Remote Sensing and Environment Centre,Thiruvananthapuram for the support extended in the preparation of this paper.
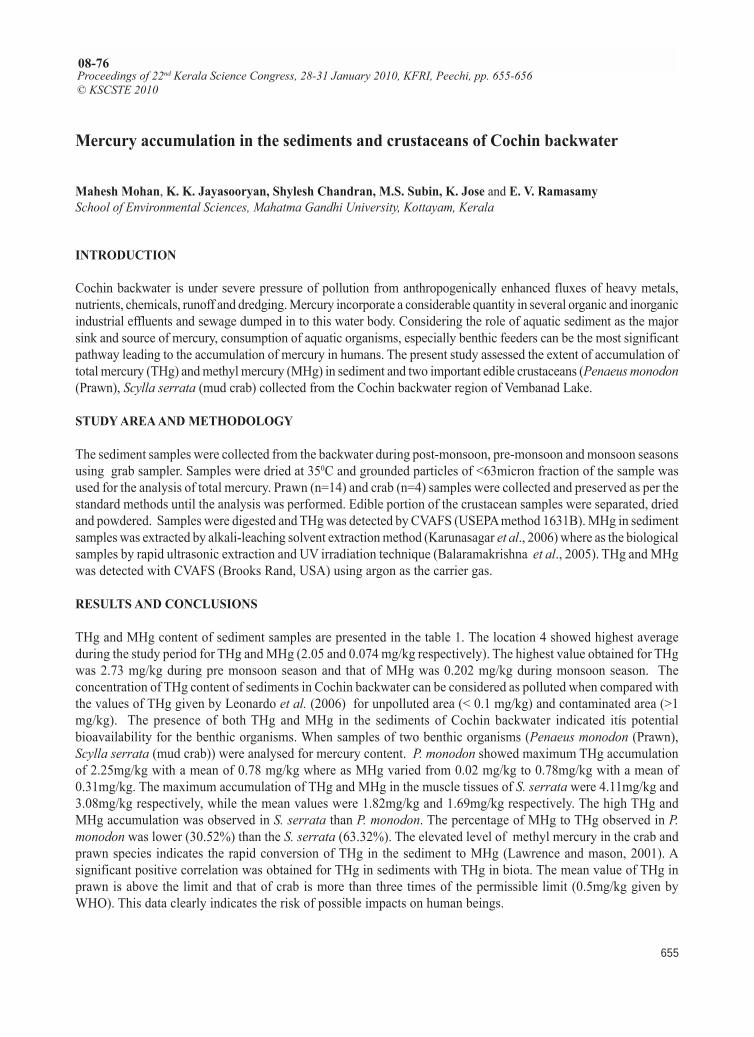
Proceedings of 22nd Kerala Science Congress
655
Proceedings of 22nd Kerala Science Congress, 28-31 January 2010, KFRI, Peechi, pp. 655-656© KSCSTE 2010
08-76
Mercury accumulation in the sediments and crustaceans of Cochin backwater
Mahesh Mohan, K. K. Jayasooryan, Shylesh Chandran, M.S. Subin, K. Jose and E. V. RamasamySchool of Environmental Sciences, Mahatma Gandhi University, Kottayam, Kerala
INTRODUCTION
Cochin backwater is under severe pressure of pollution from anthropogenically enhanced fluxes of heavy metals,nutrients, chemicals, runoff and dredging. Mercury incorporate a considerable quantity in several organic and inorganicindustrial effluents and sewage dumped in to this water body. Considering the role of aquatic sediment as the majorsink and source of mercury, consumption of aquatic organisms, especially benthic feeders can be the most significantpathway leading to the accumulation of mercury in humans. The present study assessed the extent of accumulation oftotal mercury (THg) and methyl mercury (MHg) in sediment and two important edible crustaceans (Penaeus monodon(Prawn), Scylla serrata (mud crab) collected from the Cochin backwater region of Vembanad Lake.
STUDY AREA AND METHODOLOGY
The sediment samples were collected from the backwater during post-monsoon, pre-monsoon and monsoon seasonsusing grab sampler. Samples were dried at 350C and grounded particles of <63micron fraction of the sample wasused for the analysis of total mercury. Prawn (n=14) and crab (n=4) samples were collected and preserved as per thestandard methods until the analysis was performed. Edible portion of the crustacean samples were separated, driedand powdered. Samples were digested and THg was detected by CVAFS (USEPA method 1631B). MHg in sedimentsamples was extracted by alkali-leaching solvent extraction method (Karunasagar et al., 2006) where as the biologicalsamples by rapid ultrasonic extraction and UV irradiation technique (Balaramakrishna et al., 2005). THg and MHgwas detected with CVAFS (Brooks Rand, USA) using argon as the carrier gas.
RESULTS AND CONCLUSIONS
THg and MHg content of sediment samples are presented in the table 1. The location 4 showed highest averageduring the study period for THg and MHg (2.05 and 0.074 mg/kg respectively). The highest value obtained for THgwas 2.73 mg/kg during pre monsoon season and that of MHg was 0.202 mg/kg during monsoon season. Theconcentration of THg content of sediments in Cochin backwater can be considered as polluted when compared withthe values of THg given by Leonardo et al. (2006) for unpolluted area (< 0.1 mg/kg) and contaminated area (>1mg/kg). The presence of both THg and MHg in the sediments of Cochin backwater indicated itís potentialbioavailability for the benthic organisms. When samples of two benthic organisms (Penaeus monodon (Prawn),Scylla serrata (mud crab)) were analysed for mercury content. P. monodon showed maximum THg accumulationof 2.25mg/kg with a mean of 0.78 mg/kg where as MHg varied from 0.02 mg/kg to 0.78mg/kg with a mean of0.31mg/kg. The maximum accumulation of THg and MHg in the muscle tissues of S. serrata were 4.11mg/kg and3.08mg/kg respectively, while the mean values were 1.82mg/kg and 1.69mg/kg respectively. The high THg andMHg accumulation was observed in S. serrata than P. monodon. The percentage of MHg to THg observed in P.monodon was lower (30.52%) than the S. serrata (63.32%). The elevated level of methyl mercury in the crab andprawn species indicates the rapid conversion of THg in the sediment to MHg (Lawrence and mason, 2001). Asignificant positive correlation was obtained for THg in sediments with THg in biota. The mean value of THg inprawn is above the limit and that of crab is more than three times of the permissible limit (0.5mg/kg given byWHO). This data clearly indicates the risk of possible impacts on human beings.
Proceedings of 22nd Kerala Science Congress
656
The concentration of THg and MHg in the sediment samples indicated the high mercury contamination and itísavailability for bioaccumulation. The high THg and MHg accumulation was observed in S. serrata than P. monodonand were higher than the permissible limits. The percentage ratio of MHg to THg indicates the high potential ofchemical transformation of mercury from inorganic to more toxic organic forms. Therefore, the present studyindicated that mercury contamination in this area can pose significant health hazards.
REFERENCES
Balarama Krishna, M.V., Ranjit, M. Karunasagar, D. and Arunachalam, J. 2005. A rapid ultrasound-assisted thiourea extraction methodfor the determination of inorganic and methyl mercury in biological and environmental samples by CVAAS. Talant 15: 70-80.
Karunasagar, D. Krishna, M.V.B. Anjaneyulu, Y. and Arunachalam, J. 2006. Studies of mercury pollution in a lake due to a thermometerfactory situated in a tourist resort: Kodaikanal, India. Environ. Pollut. 143: 153-158.
Lawrence, A.L. and Mason, R.P. 2001. Factors controlling the bioaccumulation of mercury and methyl mercury by the estuarineamphipod Leptocheirus plumulosus. Environ. Pollut. 111: 217-231.
Leonardo, R.D. Tranchida, G. Bellanca, A. Neri, R. Angelone, M. and Mazzola, S. 2006. Mercury levels in sediments of centralMediterranean sea: A 150+ year record from box-cores recovered in the strait of Sicily. Chemosphere 65: 2366-2376.
USEPA 2001. Appendix to method 1631, Total mercury in tissue, sludge, sediment and soil by acid digestion and BrCl oxidation,United States Environmental Protection Agency.
Figure 2. Mean concentration of THg and MHg inbiological samples.
Table 1. Mercury (mg/kg) in the sediment of Cochin backwater
� Post-monsoon Pre-monsoon Monsoon� MeanSample No. THg MHg THg MHg THg MHg THg MHg
1 0.380 0.0013 0.713 nd 2.850 0.0415 1.3143 0.01432 2.140 0.0090 2.0010 0.0284 0.634 0.0008 1.5947 0.01273 1.180 nd 0.910 0.0046 0.582 0.0006 0.8907 0.00024 1.333 0.0064 2.730 0.0130 2.100 0.2020 2.0543 0.07385 1.260 nd 0.550 0.0030 0.500 0.0005 0.7700 0.00126 0.682 nd 0.969 0.0040 0.331 0.0003 0.6607 0.0014
nd: not detectable
Figure 1. Study area and samplinglocations
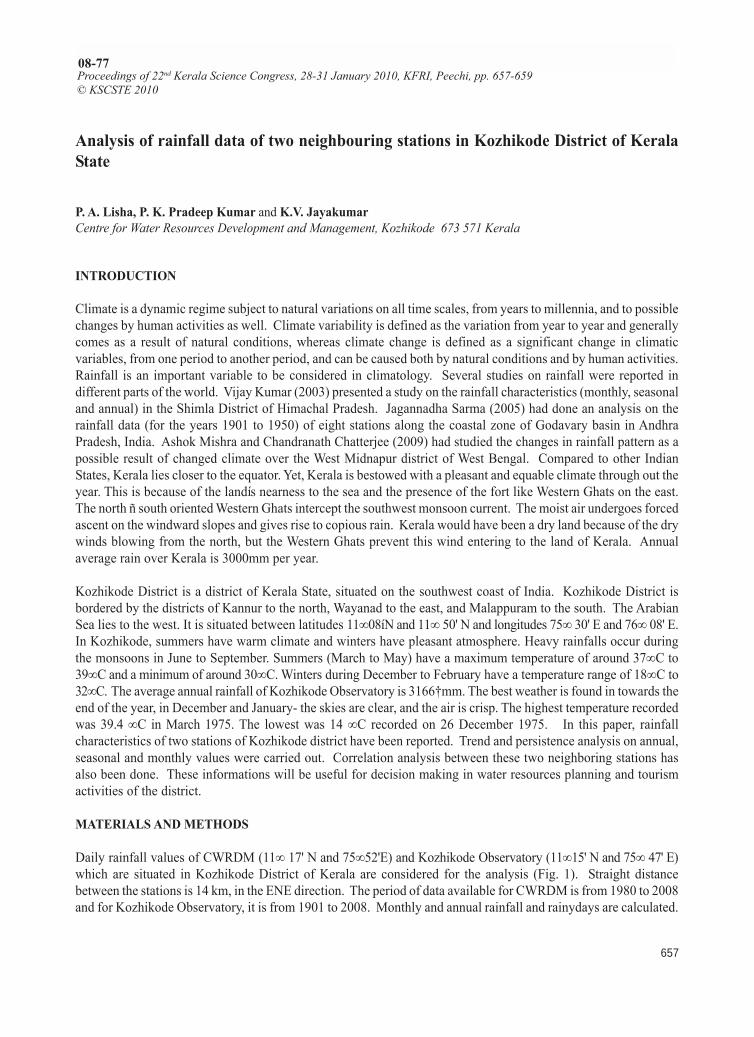
Proceedings of 22nd Kerala Science Congress
657
Proceedings of 22nd Kerala Science Congress, 28-31 January 2010, KFRI, Peechi, pp. 657-659© KSCSTE 2010
08-77
Analysis of rainfall data of two neighbouring stations in Kozhikode District of KeralaState
P. A. Lisha, P. K. Pradeep Kumar and K.V. JayakumarCentre for Water Resources Development and Management, Kozhikode 673 571 Kerala
INTRODUCTION
Climate is a dynamic regime subject to natural variations on all time scales, from years to millennia, and to possiblechanges by human activities as well. Climate variability is defined as the variation from year to year and generallycomes as a result of natural conditions, whereas climate change is defined as a significant change in climaticvariables, from one period to another period, and can be caused both by natural conditions and by human activities.Rainfall is an important variable to be considered in climatology. Several studies on rainfall were reported indifferent parts of the world. Vijay Kumar (2003) presented a study on the rainfall characteristics (monthly, seasonaland annual) in the Shimla District of Himachal Pradesh. Jagannadha Sarma (2005) had done an analysis on therainfall data (for the years 1901 to 1950) of eight stations along the coastal zone of Godavary basin in AndhraPradesh, India. Ashok Mishra and Chandranath Chatterjee (2009) had studied the changes in rainfall pattern as apossible result of changed climate over the West Midnapur district of West Bengal. Compared to other IndianStates, Kerala lies closer to the equator. Yet, Kerala is bestowed with a pleasant and equable climate through out theyear. This is because of the landís nearness to the sea and the presence of the fort like Western Ghats on the east.The north ñ south oriented Western Ghats intercept the southwest monsoon current. The moist air undergoes forcedascent on the windward slopes and gives rise to copious rain. Kerala would have been a dry land because of the drywinds blowing from the north, but the Western Ghats prevent this wind entering to the land of Kerala. Annualaverage rain over Kerala is 3000mm per year.
Kozhikode District is a district of Kerala State, situated on the southwest coast of India. Kozhikode District isbordered by the districts of Kannur to the north, Wayanad to the east, and Malappuram to the south. The ArabianSea lies to the west. It is situated between latitudes 11∞08íN and 11∞ 50' N and longitudes 75∞ 30' E and 76∞ 08' E.In Kozhikode, summers have warm climate and winters have pleasant atmosphere. Heavy rainfalls occur duringthe monsoons in June to September. Summers (March to May) have a maximum temperature of around 37∞C to39∞C and a minimum of around 30∞C. Winters during December to February have a temperature range of 18∞C to32∞C. The average annual rainfall of Kozhikode Observatory is 3166�mm. The best weather is found in towards theend of the year, in December and January- the skies are clear, and the air is crisp. The highest temperature recordedwas 39.4 ∞C in March 1975. The lowest was 14 ∞C recorded on 26 December 1975. In this paper, rainfallcharacteristics of two stations of Kozhikode district have been reported. Trend and persistence analysis on annual,seasonal and monthly values were carried out. Correlation analysis between these two neighboring stations hasalso been done. These informations will be useful for decision making in water resources planning and tourismactivities of the district.
MATERIALS AND METHODS
Daily rainfall values of CWRDM (11∞ 17' N and 75∞52'E) and Kozhikode Observatory (11∞15' N and 75∞ 47' E)which are situated in Kozhikode District of Kerala are considered for the analysis (Fig. 1). Straight distancebetween the stations is 14 km, in the ENE direction. The period of data available for CWRDM is from 1980 to 2008and for Kozhikode Observatory, it is from 1901 to 2008. Monthly and annual rainfall and rainydays are calculated.
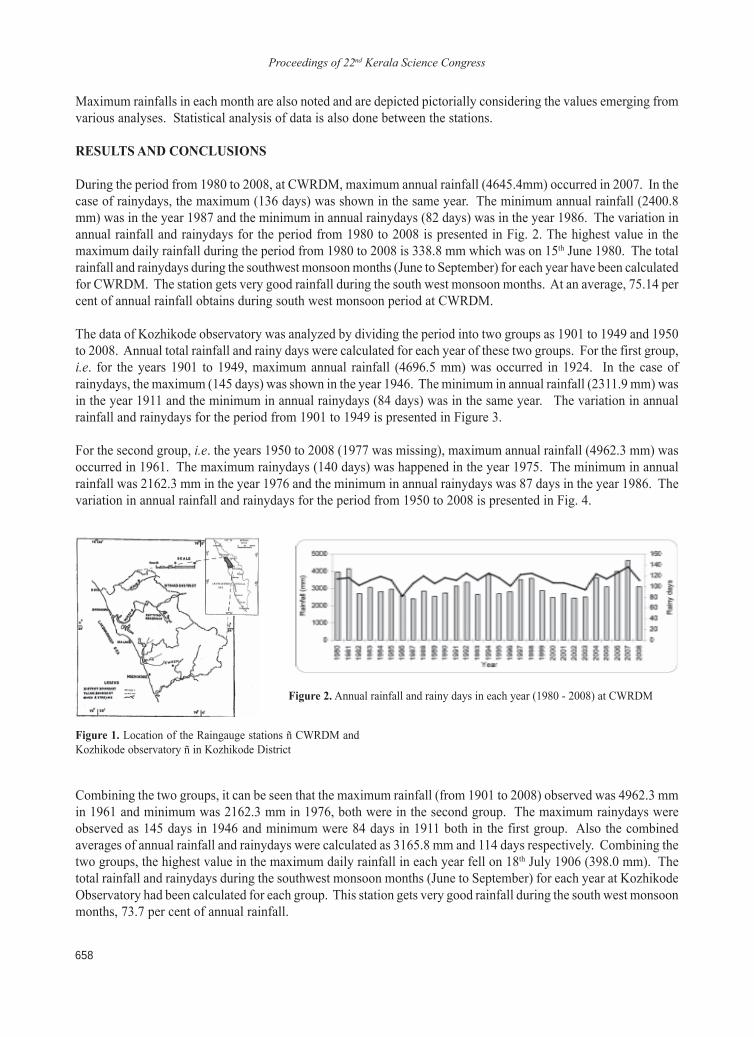
Proceedings of 22nd Kerala Science Congress
658
Maximum rainfalls in each month are also noted and are depicted pictorially considering the values emerging fromvarious analyses. Statistical analysis of data is also done between the stations.
RESULTS AND CONCLUSIONS
During the period from 1980 to 2008, at CWRDM, maximum annual rainfall (4645.4mm) occurred in 2007. In thecase of rainydays, the maximum (136 days) was shown in the same year. The minimum annual rainfall (2400.8mm) was in the year 1987 and the minimum in annual rainydays (82 days) was in the year 1986. The variation inannual rainfall and rainydays for the period from 1980 to 2008 is presented in Fig. 2. The highest value in themaximum daily rainfall during the period from 1980 to 2008 is 338.8 mm which was on 15th June 1980. The totalrainfall and rainydays during the southwest monsoon months (June to September) for each year have been calculatedfor CWRDM. The station gets very good rainfall during the south west monsoon months. At an average, 75.14 percent of annual rainfall obtains during south west monsoon period at CWRDM.
The data of Kozhikode observatory was analyzed by dividing the period into two groups as 1901 to 1949 and 1950to 2008. Annual total rainfall and rainy days were calculated for each year of these two groups. For the first group,i.e. for the years 1901 to 1949, maximum annual rainfall (4696.5 mm) was occurred in 1924. In the case ofrainydays, the maximum (145 days) was shown in the year 1946. The minimum in annual rainfall (2311.9 mm) wasin the year 1911 and the minimum in annual rainydays (84 days) was in the same year. The variation in annualrainfall and rainydays for the period from 1901 to 1949 is presented in Figure 3.
For the second group, i.e. the years 1950 to 2008 (1977 was missing), maximum annual rainfall (4962.3 mm) wasoccurred in 1961. The maximum rainydays (140 days) was happened in the year 1975. The minimum in annualrainfall was 2162.3 mm in the year 1976 and the minimum in annual rainydays was 87 days in the year 1986. Thevariation in annual rainfall and rainydays for the period from 1950 to 2008 is presented in Fig. 4.
Figure 1. Location of the Raingauge stations ñ CWRDM andKozhikode observatory ñ in Kozhikode District
Figure 2. Annual rainfall and rainy days in each year (1980 - 2008) at CWRDM
Combining the two groups, it can be seen that the maximum rainfall (from 1901 to 2008) observed was 4962.3 mmin 1961 and minimum was 2162.3 mm in 1976, both were in the second group. The maximum rainydays wereobserved as 145 days in 1946 and minimum were 84 days in 1911 both in the first group. Also the combinedaverages of annual rainfall and rainydays were calculated as 3165.8 mm and 114 days respectively. Combining thetwo groups, the highest value in the maximum daily rainfall in each year fell on 18th July 1906 (398.0 mm). Thetotal rainfall and rainydays during the southwest monsoon months (June to September) for each year at KozhikodeObservatory had been calculated for each group. This station gets very good rainfall during the south west monsoonmonths, 73.7 per cent of annual rainfall.
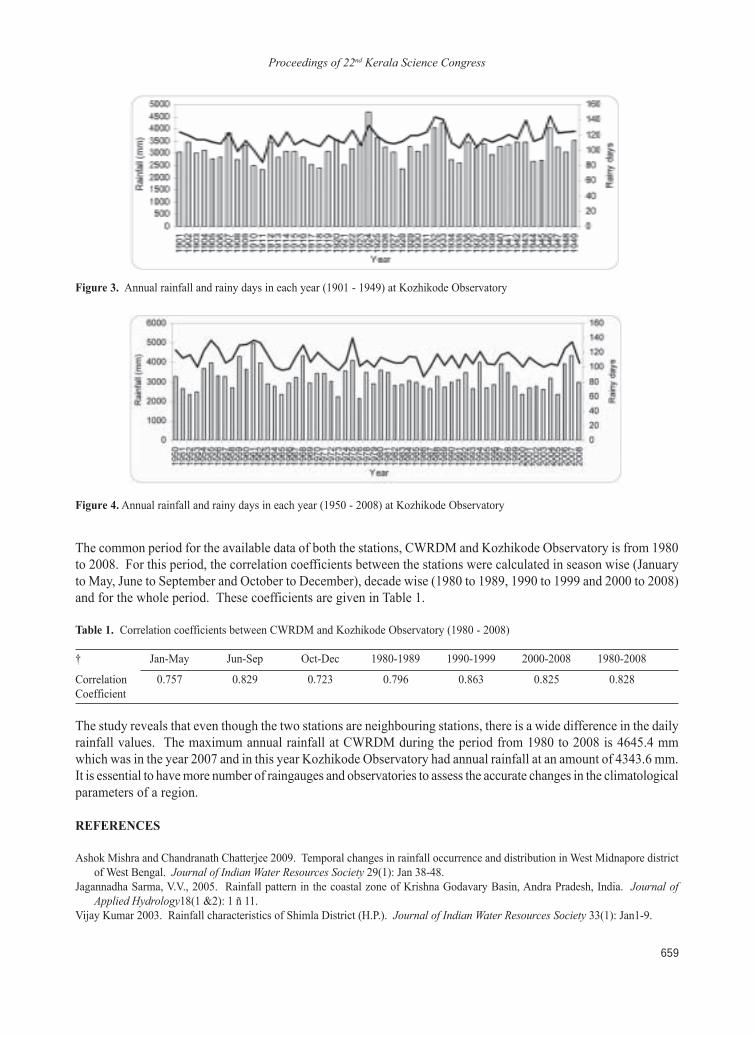
Proceedings of 22nd Kerala Science Congress
659
The common period for the available data of both the stations, CWRDM and Kozhikode Observatory is from 1980to 2008. For this period, the correlation coefficients between the stations were calculated in season wise (Januaryto May, June to September and October to December), decade wise (1980 to 1989, 1990 to 1999 and 2000 to 2008)and for the whole period. These coefficients are given in Table 1.
Table 1. Correlation coefficients between CWRDM and Kozhikode Observatory (1980 - 2008)
� Jan-May Jun-Sep Oct-Dec 1980-1989 1990-1999 2000-2008 1980-2008
Correlation 0.757 0.829 0.723 0.796 0.863 0.825 0.828Coefficient
The study reveals that even though the two stations are neighbouring stations, there is a wide difference in the dailyrainfall values. The maximum annual rainfall at CWRDM during the period from 1980 to 2008 is 4645.4 mmwhich was in the year 2007 and in this year Kozhikode Observatory had annual rainfall at an amount of 4343.6 mm.It is essential to have more number of raingauges and observatories to assess the accurate changes in the climatologicalparameters of a region.
REFERENCES
Ashok Mishra and Chandranath Chatterjee 2009. Temporal changes in rainfall occurrence and distribution in West Midnapore districtof West Bengal. Journal of Indian Water Resources Society 29(1): Jan 38-48.
Jagannadha Sarma, V.V., 2005. Rainfall pattern in the coastal zone of Krishna Godavary Basin, Andra Pradesh, India. Journal ofApplied Hydrology18(1 &2): 1 ñ 11.
Vijay Kumar 2003. Rainfall characteristics of Shimla District (H.P.). Journal of Indian Water Resources Society 33(1): Jan1-9.
Figure 4. Annual rainfall and rainy days in each year (1950 - 2008) at Kozhikode Observatory
Figure 3. Annual rainfall and rainy days in each year (1901 - 1949) at Kozhikode Observatory
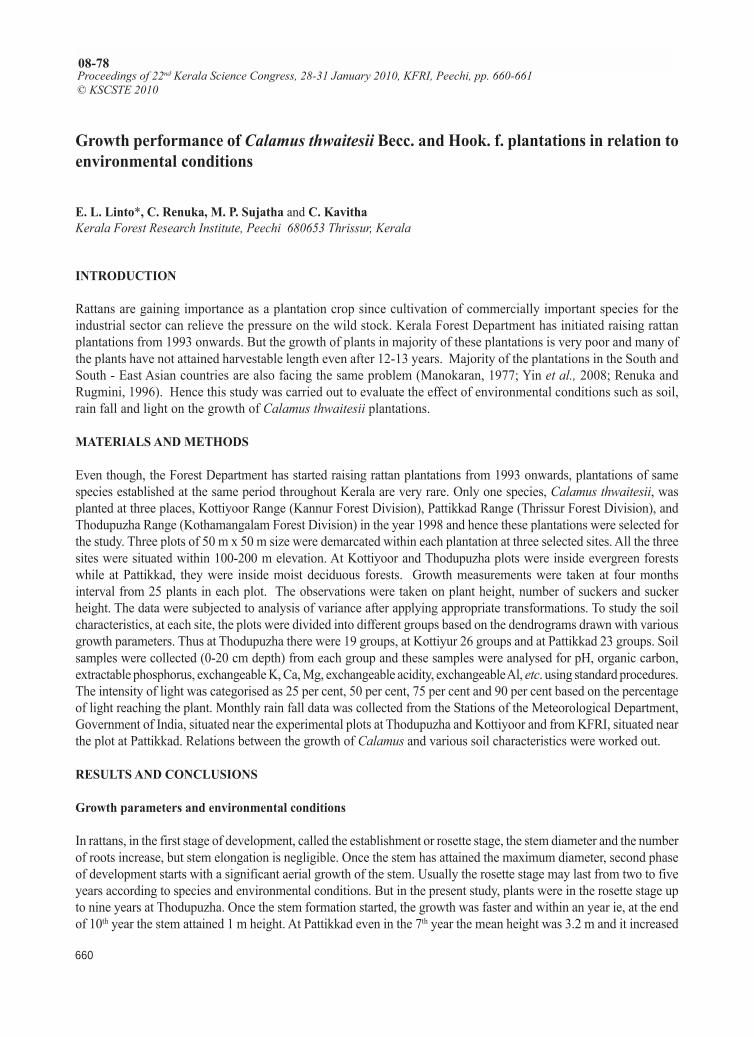
Proceedings of 22nd Kerala Science Congress
660
Proceedings of 22nd Kerala Science Congress, 28-31 January 2010, KFRI, Peechi, pp. 660-661© KSCSTE 2010
08-78
Growth performance of Calamus thwaitesii Becc. and Hook. f. plantations in relation toenvironmental conditions
E. L. Linto*, C. Renuka, M. P. Sujatha and C. KavithaKerala Forest Research Institute, Peechi 680653 Thrissur, Kerala
INTRODUCTION
Rattans are gaining importance as a plantation crop since cultivation of commercially important species for theindustrial sector can relieve the pressure on the wild stock. Kerala Forest Department has initiated raising rattanplantations from 1993 onwards. But the growth of plants in majority of these plantations is very poor and many ofthe plants have not attained harvestable length even after 12-13 years. Majority of the plantations in the South andSouth - East Asian countries are also facing the same problem (Manokaran, 1977; Yin et al., 2008; Renuka andRugmini, 1996). Hence this study was carried out to evaluate the effect of environmental conditions such as soil,rain fall and light on the growth of Calamus thwaitesii plantations.
MATERIALS AND METHODS
Even though, the Forest Department has started raising rattan plantations from 1993 onwards, plantations of samespecies established at the same period throughout Kerala are very rare. Only one species, Calamus thwaitesii, wasplanted at three places, Kottiyoor Range (Kannur Forest Division), Pattikkad Range (Thrissur Forest Division), andThodupuzha Range (Kothamangalam Forest Division) in the year 1998 and hence these plantations were selected forthe study. Three plots of 50 m x 50 m size were demarcated within each plantation at three selected sites. All the threesites were situated within 100-200 m elevation. At Kottiyoor and Thodupuzha plots were inside evergreen forestswhile at Pattikkad, they were inside moist deciduous forests. Growth measurements were taken at four monthsinterval from 25 plants in each plot. The observations were taken on plant height, number of suckers and suckerheight. The data were subjected to analysis of variance after applying appropriate transformations. To study the soilcharacteristics, at each site, the plots were divided into different groups based on the dendrograms drawn with variousgrowth parameters. Thus at Thodupuzha there were 19 groups, at Kottiyur 26 groups and at Pattikkad 23 groups. Soilsamples were collected (0-20 cm depth) from each group and these samples were analysed for pH, organic carbon,extractable phosphorus, exchangeable K, Ca, Mg, exchangeable acidity, exchangeable Al, etc. using standard procedures.The intensity of light was categorised as 25 per cent, 50 per cent, 75 per cent and 90 per cent based on the percentageof light reaching the plant. Monthly rain fall data was collected from the Stations of the Meteorological Department,Government of India, situated near the experimental plots at Thodupuzha and Kottiyoor and from KFRI, situated nearthe plot at Pattikkad. Relations between the growth of Calamus and various soil characteristics were worked out.
RESULTS AND CONCLUSIONS
Growth parameters and environmental conditions
In rattans, in the first stage of development, called the establishment or rosette stage, the stem diameter and the numberof roots increase, but stem elongation is negligible. Once the stem has attained the maximum diameter, second phaseof development starts with a significant aerial growth of the stem. Usually the rosette stage may last from two to fiveyears according to species and environmental conditions. But in the present study, plants were in the rosette stage upto nine years at Thodupuzha. Once the stem formation started, the growth was faster and within an year ie, at the endof 10th year the stem attained 1 m height. At Pattikkad even in the 7th year the mean height was 3.2 m and it increased
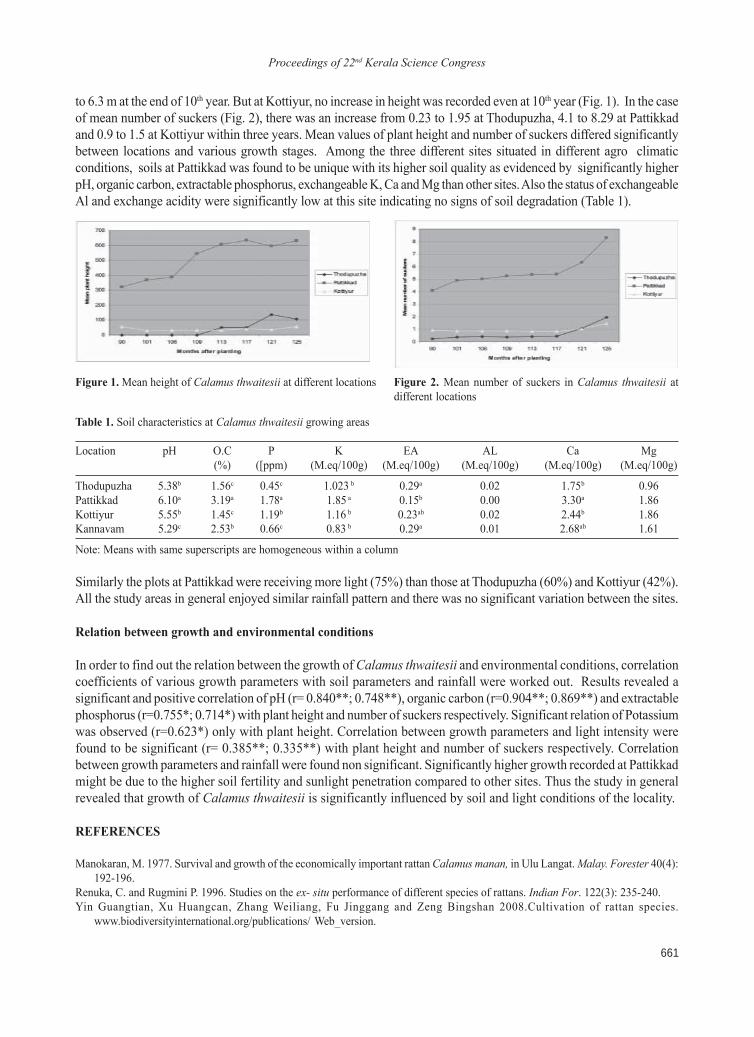
Proceedings of 22nd Kerala Science Congress
661
to 6.3 m at the end of 10th year. But at Kottiyur, no increase in height was recorded even at 10th year (Fig. 1). In the caseof mean number of suckers (Fig. 2), there was an increase from 0.23 to 1.95 at Thodupuzha, 4.1 to 8.29 at Pattikkadand 0.9 to 1.5 at Kottiyur within three years. Mean values of plant height and number of suckers differed significantlybetween locations and various growth stages. Among the three different sites situated in different agro climaticconditions, soils at Pattikkad was found to be unique with its higher soil quality as evidenced by significantly higherpH, organic carbon, extractable phosphorus, exchangeable K, Ca and Mg than other sites. Also the status of exchangeableAl and exchange acidity were significantly low at this site indicating no signs of soil degradation (Table 1).
Figure 2. Mean number of suckers in Calamus thwaitesii atdifferent locations
Figure 1. Mean height of Calamus thwaitesii at different locations
Table 1. Soil characteristics at Calamus thwaitesii growing areas
Location pH O.C P K EA AL Ca Mg(%) ([ppm) (M.eq/100g) (M.eq/100g) (M.eq/100g) (M.eq/100g) (M.eq/100g)
Thodupuzha 5.38b 1.56c 0.45c 1.023 b 0.29a 0.02 1.75b 0.96Pattikkad 6.10a 3.19a 1.78a 1.85 a 0.15b 0.00 3.30a 1.86Kottiyur 5.55b 1.45c 1.19b 1.16 b 0.23ab 0.02 2.44b 1.86Kannavam 5.29c 2.53b 0.66c 0.83 b 0.29a 0.01 2.68ab 1.61
Note: Means with same superscripts are homogeneous within a column
Similarly the plots at Pattikkad were receiving more light (75%) than those at Thodupuzha (60%) and Kottiyur (42%).All the study areas in general enjoyed similar rainfall pattern and there was no significant variation between the sites.
Relation between growth and environmental conditions
In order to find out the relation between the growth of Calamus thwaitesii and environmental conditions, correlationcoefficients of various growth parameters with soil parameters and rainfall were worked out. Results revealed asignificant and positive correlation of pH (r= 0.840**; 0.748**), organic carbon (r=0.904**; 0.869**) and extractablephosphorus (r=0.755*; 0.714*) with plant height and number of suckers respectively. Significant relation of Potassiumwas observed (r=0.623*) only with plant height. Correlation between growth parameters and light intensity werefound to be significant (r= 0.385**; 0.335**) with plant height and number of suckers respectively. Correlationbetween growth parameters and rainfall were found non significant. Significantly higher growth recorded at Pattikkadmight be due to the higher soil fertility and sunlight penetration compared to other sites. Thus the study in generalrevealed that growth of Calamus thwaitesii is significantly influenced by soil and light conditions of the locality.
REFERENCES
Manokaran, M. 1977. Survival and growth of the economically important rattan Calamus manan, in Ulu Langat. Malay. Forester 40(4):192-196.
Renuka, C. and Rugmini P. 1996. Studies on the ex- situ performance of different species of rattans. Indian For. 122(3): 235-240.Yin Guangtian, Xu Huangcan, Zhang Weiliang, Fu Jinggang and Zeng Bingshan 2008.Cultivation of rattan species.
www.biodiversityinternational.org/publications/ Web_version.
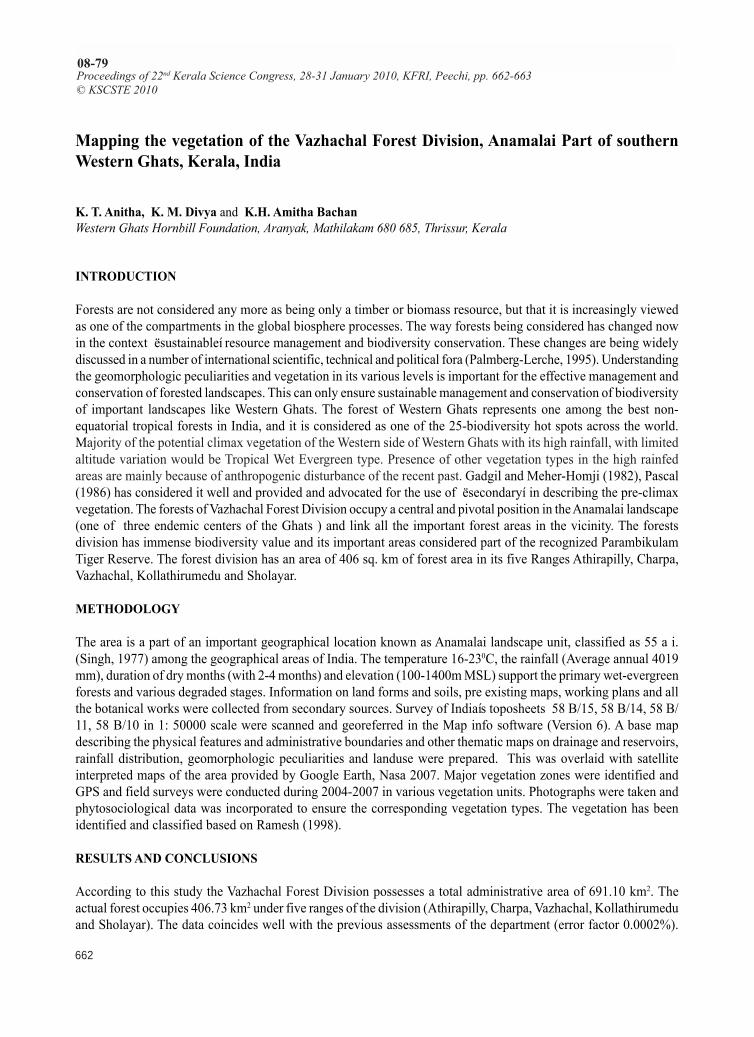
Proceedings of 22nd Kerala Science Congress
662
Proceedings of 22nd Kerala Science Congress, 28-31 January 2010, KFRI, Peechi, pp. 662-663© KSCSTE 2010
08-79
Mapping the vegetation of the Vazhachal Forest Division, Anamalai Part of southernWestern Ghats, Kerala, India
K. T. Anitha, K. M. Divya and K.H. Amitha BachanWestern Ghats Hornbill Foundation, Aranyak, Mathilakam 680 685, Thrissur, Kerala
INTRODUCTION
Forests are not considered any more as being only a timber or biomass resource, but that it is increasingly viewedas one of the compartments in the global biosphere processes. The way forests being considered has changed nowin the context ësustainableí resource management and biodiversity conservation. These changes are being widelydiscussed in a number of international scientific, technical and political fora (Palmberg-Lerche, 1995). Understandingthe geomorphologic peculiarities and vegetation in its various levels is important for the effective management andconservation of forested landscapes. This can only ensure sustainable management and conservation of biodiversityof important landscapes like Western Ghats. The forest of Western Ghats represents one among the best non-equatorial tropical forests in India, and it is considered as one of the 25-biodiversity hot spots across the world.Majority of the potential climax vegetation of the Western side of Western Ghats with its high rainfall, with limitedaltitude variation would be Tropical Wet Evergreen type. Presence of other vegetation types in the high rainfedareas are mainly because of anthropogenic disturbance of the recent past. Gadgil and Meher-Homji (1982), Pascal(1986) has considered it well and provided and advocated for the use of ësecondaryí in describing the pre-climaxvegetation. The forests of Vazhachal Forest Division occupy a central and pivotal position in the Anamalai landscape(one of three endemic centers of the Ghats ) and link all the important forest areas in the vicinity. The forestsdivision has immense biodiversity value and its important areas considered part of the recognized ParambikulamTiger Reserve. The forest division has an area of 406 sq. km of forest area in its five Ranges Athirapilly, Charpa,Vazhachal, Kollathirumedu and Sholayar.
METHODOLOGY
The area is a part of an important geographical location known as Anamalai landscape unit, classified as 55 a i.(Singh, 1977) among the geographical areas of India. The temperature 16-230C, the rainfall (Average annual 4019mm), duration of dry months (with 2-4 months) and elevation (100-1400m MSL) support the primary wet-evergreenforests and various degraded stages. Information on land forms and soils, pre existing maps, working plans and allthe botanical works were collected from secondary sources. Survey of Indiaís toposheets 58 B/15, 58 B/14, 58 B/11, 58 B/10 in 1: 50000 scale were scanned and georeferred in the Map info software (Version 6). A base mapdescribing the physical features and administrative boundaries and other thematic maps on drainage and reservoirs,rainfall distribution, geomorphologic peculiarities and landuse were prepared. This was overlaid with satelliteinterpreted maps of the area provided by Google Earth, Nasa 2007. Major vegetation zones were identified andGPS and field surveys were conducted during 2004-2007 in various vegetation units. Photographs were taken andphytosociological data was incorporated to ensure the corresponding vegetation types. The vegetation has beenidentified and classified based on Ramesh (1998).
RESULTS AND CONCLUSIONS
According to this study the Vazhachal Forest Division possesses a total administrative area of 691.10 km2. Theactual forest occupies 406.73 km2 under five ranges of the division (Athirapilly, Charpa, Vazhachal, Kollathirumeduand Sholayar). The data coincides well with the previous assessments of the department (error factor 0.0002%).
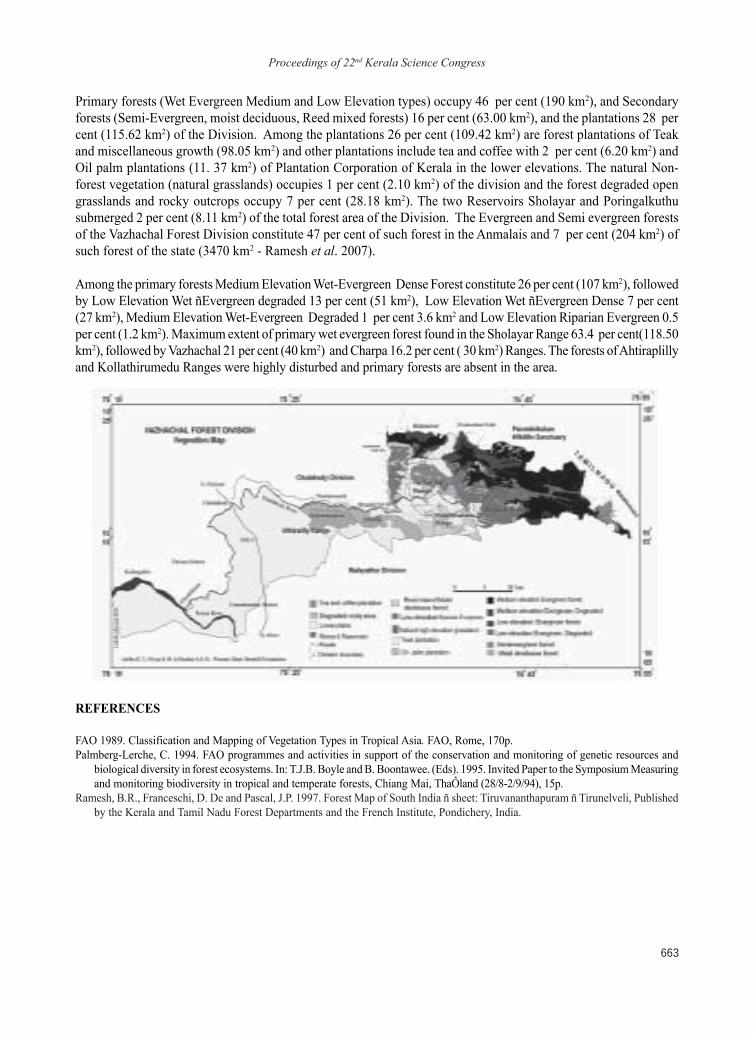
Proceedings of 22nd Kerala Science Congress
663
Primary forests (Wet Evergreen Medium and Low Elevation types) occupy 46 per cent (190 km2), and Secondaryforests (Semi-Evergreen, moist deciduous, Reed mixed forests) 16 per cent (63.00 km2), and the plantations 28 percent (115.62 km2) of the Division. Among the plantations 26 per cent (109.42 km2) are forest plantations of Teakand miscellaneous growth (98.05 km2) and other plantations include tea and coffee with 2 per cent (6.20 km2) andOil palm plantations (11. 37 km2) of Plantation Corporation of Kerala in the lower elevations. The natural Non-forest vegetation (natural grasslands) occupies 1 per cent (2.10 km2) of the division and the forest degraded opengrasslands and rocky outcrops occupy 7 per cent (28.18 km2). The two Reservoirs Sholayar and Poringalkuthusubmerged 2 per cent (8.11 km2) of the total forest area of the Division. The Evergreen and Semi evergreen forestsof the Vazhachal Forest Division constitute 47 per cent of such forest in the Anmalais and 7 per cent (204 km2) ofsuch forest of the state (3470 km2 - Ramesh et al. 2007).
Among the primary forests Medium Elevation Wet-Evergreen Dense Forest constitute 26 per cent (107 km2), followedby Low Elevation Wet ñEvergreen degraded 13 per cent (51 km2), Low Elevation Wet ñEvergreen Dense 7 per cent(27 km2), Medium Elevation Wet-Evergreen Degraded 1 per cent 3.6 km2 and Low Elevation Riparian Evergreen 0.5per cent (1.2 km2). Maximum extent of primary wet evergreen forest found in the Sholayar Range 63.4 per cent(118.50km2), followed by Vazhachal 21 per cent (40 km2) and Charpa 16.2 per cent ( 30 km2) Ranges. The forests of Ahtiraplillyand Kollathirumedu Ranges were highly disturbed and primary forests are absent in the area.
REFERENCES
FAO 1989. Classification and Mapping of Vegetation Types in Tropical Asia. FAO, Rome, 170p.Palmberg-Lerche, C. 1994. FAO programmes and activities in support of the conservation and monitoring of genetic resources and
biological diversity in forest ecosystems. In: T.J.B. Boyle and B. Boontawee. (Eds). 1995. Invited Paper to the Symposium Measuringand monitoring biodiversity in tropical and temperate forests, Chiang Mai, ThaÔland (28/8-2/9/94), 15p.
Ramesh, B.R., Franceschi, D. De and Pascal, J.P. 1997. Forest Map of South India ñ sheet: Tiruvananthapuram ñ Tirunelveli, Publishedby the Kerala and Tamil Nadu Forest Departments and the French Institute, Pondichery, India.
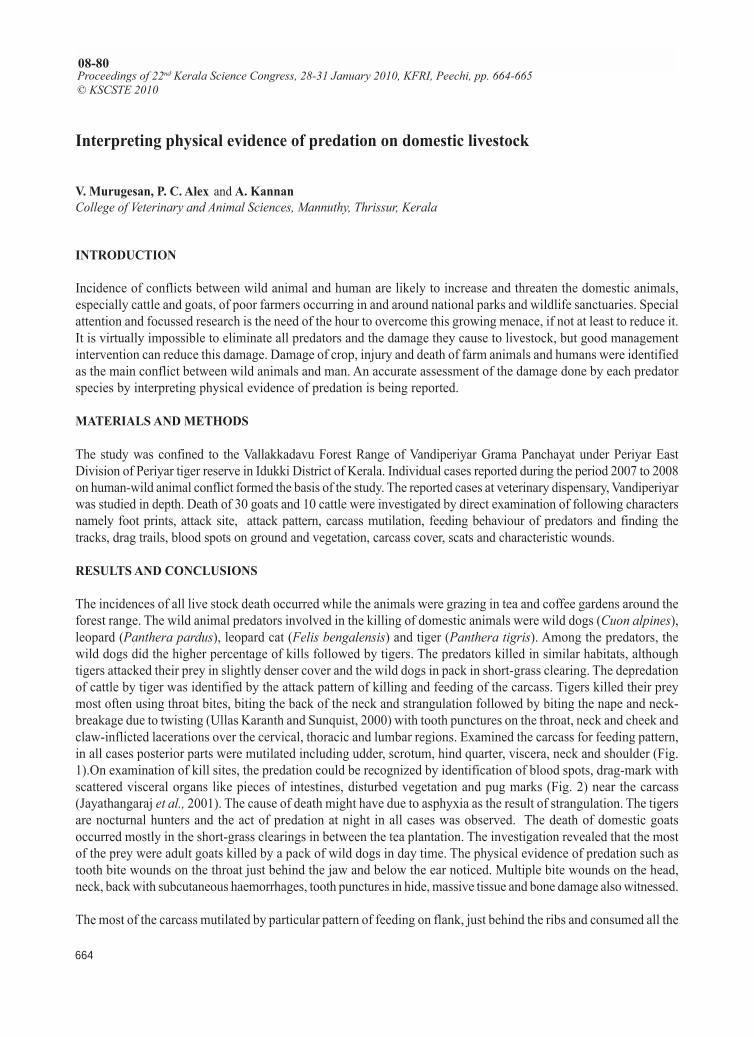
Proceedings of 22nd Kerala Science Congress
664
Proceedings of 22nd Kerala Science Congress, 28-31 January 2010, KFRI, Peechi, pp. 664-665© KSCSTE 2010
08-80
Interpreting physical evidence of predation on domestic livestock
V. Murugesan, P. C. Alex and A. KannanCollege of Veterinary and Animal Sciences, Mannuthy, Thrissur, Kerala
INTRODUCTION
Incidence of conflicts between wild animal and human are likely to increase and threaten the domestic animals,especially cattle and goats, of poor farmers occurring in and around national parks and wildlife sanctuaries. Specialattention and focussed research is the need of the hour to overcome this growing menace, if not at least to reduce it.It is virtually impossible to eliminate all predators and the damage they cause to livestock, but good managementintervention can reduce this damage. Damage of crop, injury and death of farm animals and humans were identifiedas the main conflict between wild animals and man. An accurate assessment of the damage done by each predatorspecies by interpreting physical evidence of predation is being reported.
MATERIALS AND METHODS
The study was confined to the Vallakkadavu Forest Range of Vandiperiyar Grama Panchayat under Periyar EastDivision of Periyar tiger reserve in Idukki District of Kerala. Individual cases reported during the period 2007 to 2008on human-wild animal conflict formed the basis of the study. The reported cases at veterinary dispensary, Vandiperiyarwas studied in depth. Death of 30 goats and 10 cattle were investigated by direct examination of following charactersnamely foot prints, attack site, attack pattern, carcass mutilation, feeding behaviour of predators and finding thetracks, drag trails, blood spots on ground and vegetation, carcass cover, scats and characteristic wounds.
RESULTS AND CONCLUSIONS
The incidences of all live stock death occurred while the animals were grazing in tea and coffee gardens around theforest range. The wild animal predators involved in the killing of domestic animals were wild dogs (Cuon alpines),leopard (Panthera pardus), leopard cat (Felis bengalensis) and tiger (Panthera tigris). Among the predators, thewild dogs did the higher percentage of kills followed by tigers. The predators killed in similar habitats, althoughtigers attacked their prey in slightly denser cover and the wild dogs in pack in short-grass clearing. The depredationof cattle by tiger was identified by the attack pattern of killing and feeding of the carcass. Tigers killed their preymost often using throat bites, biting the back of the neck and strangulation followed by biting the nape and neck-breakage due to twisting (Ullas Karanth and Sunquist, 2000) with tooth punctures on the throat, neck and cheek andclaw-inflicted lacerations over the cervical, thoracic and lumbar regions. Examined the carcass for feeding pattern,in all cases posterior parts were mutilated including udder, scrotum, hind quarter, viscera, neck and shoulder (Fig.1).On examination of kill sites, the predation could be recognized by identification of blood spots, drag-mark withscattered visceral organs like pieces of intestines, disturbed vegetation and pug marks (Fig. 2) near the carcass(Jayathangaraj et al., 2001). The cause of death might have due to asphyxia as the result of strangulation. The tigersare nocturnal hunters and the act of predation at night in all cases was observed. The death of domestic goatsoccurred mostly in the short-grass clearings in between the tea plantation. The investigation revealed that the mostof the prey were adult goats killed by a pack of wild dogs in day time. The physical evidence of predation such astooth bite wounds on the throat just behind the jaw and below the ear noticed. Multiple bite wounds on the head,neck, back with subcutaneous haemorrhages, tooth punctures in hide, massive tissue and bone damage also witnessed.
The most of the carcass mutilated by particular pattern of feeding on flank, just behind the ribs and consumed all the
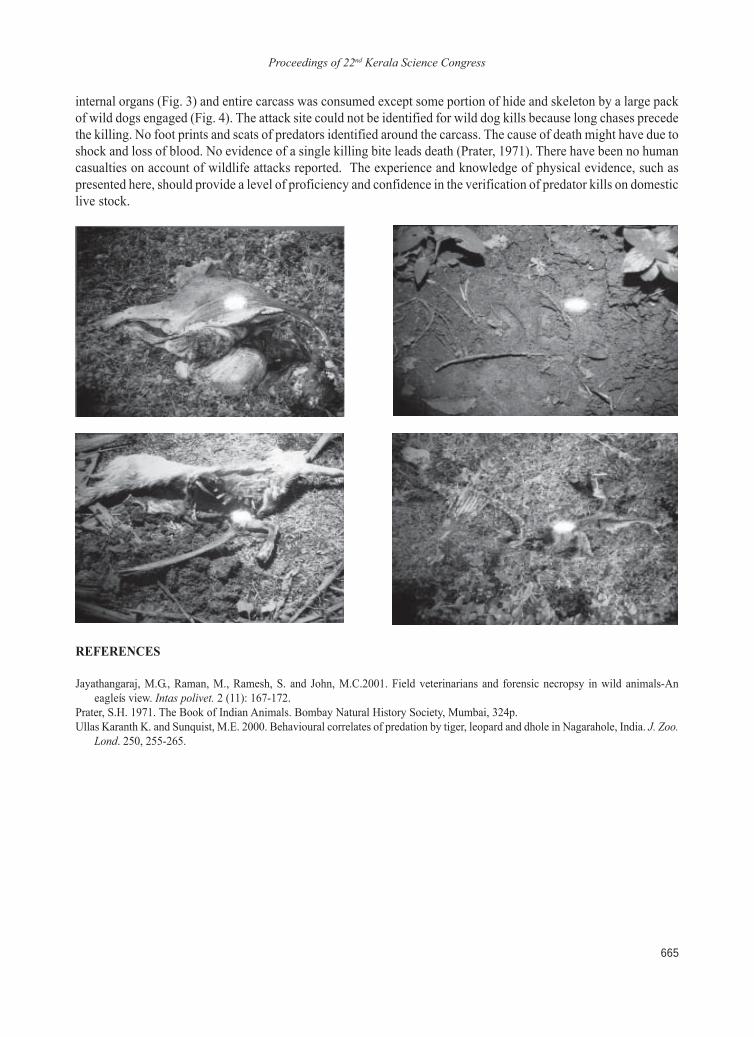
Proceedings of 22nd Kerala Science Congress
665
internal organs (Fig. 3) and entire carcass was consumed except some portion of hide and skeleton by a large packof wild dogs engaged (Fig. 4). The attack site could not be identified for wild dog kills because long chases precedethe killing. No foot prints and scats of predators identified around the carcass. The cause of death might have due toshock and loss of blood. No evidence of a single killing bite leads death (Prater, 1971). There have been no humancasualties on account of wildlife attacks reported. The experience and knowledge of physical evidence, such aspresented here, should provide a level of proficiency and confidence in the verification of predator kills on domesticlive stock.
REFERENCES
Jayathangaraj, M.G., Raman, M., Ramesh, S. and John, M.C.2001. Field veterinarians and forensic necropsy in wild animals-Aneagleís view. Intas polivet. 2 (11): 167-172.
Prater, S.H. 1971. The Book of Indian Animals. Bombay Natural History Society, Mumbai, 324p.Ullas Karanth K. and Sunquist, M.E. 2000. Behavioural correlates of predation by tiger, leopard and dhole in Nagarahole, India. J. Zoo.
Lond. 250, 255-265.
Proceedings of 22nd Kerala Science Congress
666
Proceedings of 22nd Kerala Science Congress, 28-31 January 2010, KFRI, Peechi, pp. 666-667© KSCSTE 2010
08-81
Correlation analysis on water quality parameters of Back water tourism destination: ARamsar site in Kerala, South India
Brilliant Rajan1, Vincy Mary Varghese1 and K. V. George21School of Environmental Sciences Mahatma Gandhi University Kottyam, Kerala2 CMS College, Kottyam, Kerala
INTRODUCTION
Vembanad lake is characterized by a wealth of natural heritage and resources that percent an attractive element fortourism. Vembanad - Kol - Wetland ñ System, one of the three Ramsar sites in Kerala (November 2002), is thelargest estuarine system of the western coastal wetland systems (090 00í ñ 100 40í N Latitude and 760 00í- 770 30í ELongitude), and is spread over four districts of Kerala state. The Vembanad Wetland ñ System is one of the mostattractive backwater systems in the world. Tourism industry is now flourishing in the banks of Vembanad lakeespecially in the Kumarakom area. As a result, many new tourism facilities (like resorts and hotels) are coming upwithout any concern to the natural system or culture or heritage of the area. More than 650 house boats are servicingthe study area of the lake. The wastes of most of them are directly littering into the lake. At present the agriculturaldischarges is one of the major threat facing the Vembanad lake. Present status of this land-water system is the resultof a series of massive human interventions and consequences.
MATERIALS AND METHODS
Water samples were analyzed in the Chemical Laboratory of School of Environmental Science, MGU, Kottayam,following standard American Public Health Association procedures. The area under investigation covers 18 samplingpoints from the back water south to Thannermukkam barrage. The sample locations were fixed exactly by usingglobal positioning system (GPS). Samples were collected in pre cleaned plastic polyethylene bottles forphysiochemical analysis of samples in the pre monsoon season. The samples were analyzed for different physicalchemical parameters including twenty four parameters such as air and water temperature, depth of water column,pH, conductivity, dissolved oxygen (DO), biochemical oxygen demand (BOD), total alkalinity, bicarbonate, salinity,nitrate, phosphate, hardness, sodium, potassium, calcium, chlorides, silicate etc. The area of study and samplinglocations are depicted in Figure 1. The water quality is compared with national and international standards to findout its suitability for contact water sports and drinking. The statistical analysis has been performed using standardmethods. Karl-Pearson correlation coefficient was (r) calculated. Systematic calculation of correlation coefficientbetween water quality parameters has been done with the objective of minimizing the complexity and dimensionalityof large set of data.
RESULTS AND CONCLUSION
The observed pH values are ranging from 4.5 to 8.63. These values are within maximum permissible limit prescribedby WHO. The calcium (1.68- 4.2 mg/l), chloride (7090-10067.8mg/l), TDS (7122.2-1148.7 mg/l), DO (5.78-9.92 mg/l), BOD (0-4.79 mg/l) values of water samples are within the highest desirable or maximum permissible limit set byWHO. A significant positive correlation was found between pH and alkalinity. The DO was also positively correlatedwith pH. In the present study, pH bear weak correlation or no correlation with other physico-chemical parameters.
Vembanad Lake chloride has strong positive correlation with TS (+0.94), TDS (+0.96), TSS (+0.94), TH (+0.85),CaH (+0.58), MgH (+0.74), Na (+0.95) and K (+0.75). The chloride showed weak positive correlation with phosphate
Proceedings of 22nd Kerala Science Congress
667
(+0.11), Ca (+0.32), DO (0.43). In the study area the chloride showed negative correlation with BOD (-0.3), Silicate(-0.2) and bicarbonate (-0.2). An appreciable significant positive correlation was found between total alkalinityand bicarbonates (+0.97). It showed weak positive correlation with DO, nitrite. It showed weak negative correlationwith phosphate, hardness and all other parameters. Phosphate showed positive correlation with K and Ca (+0.5). Ithas negative correlation with nitrite (-0.36). In general, nitrite is present in low quantities in aquatic ecosystems.Here it bears positive correlation with Na (+0.5). It has weak negative correlation with Ca and silicate. Otherparameters have weak positive correlation with nitrite. In general, the concentration of NA and K is very low whencompared to Ca and Mg. However, higher values are also noticed. It showed strong positive correlation with K(+0.84) and DO (+0.36). But it was negative correlated with BOD (-0.4). Potassium had weak positive correlationwith Ca (+0.3) and DO (+0.2). It showed negative correlation with BOD (-0.4). Silicates showed very weak (positive/negative) correlation with almost all the parameters.
A large number of factors and geological conditions influence the correlations between different pairs directly orindirectly. The increase in nutrient flex is mainly due to the agricultural discharges from watersheds and catchmentarea. The annual fertilizer consumption in Kuttanad (an agricultural area very near to the Vembanad lake) alone isestimated as 20000 tons (CWRDM, 1995). Agriculture and aquaculture practices prevalent in the drainage basinsare also partly responsible for eutrophication through deposition of eroded top soil and agrochemicals and pesticides.The dissolved oxygen ranges between 5.78 mg/l to 9.92 mg/l in the lake, much above the standard value. This isbecause of the presents of rich diversity of phytoplankton in the lake. Bijoy and Unnithan (2004) recorded 24species of green algae, 10 species of blue green algae, one species of yellow brown algae, 13 species of desmids and19 species of diatoms from the Vembanad lake. The higher level of BOD is due to the discharge of domestic sewagefrom nearby places and discharges from house boats and tourism sector. A large population living within its drainagebasin (13.3 million people) is directly or indirectly dependent upon the wetland ecosystem for their livelihoods.
REFERENCES
APHA 1995. Standard Methods for the Examination of Water and Wastewater.19th Ed. American Public Health Association, NewYork.
Bijoy Nandan, S. and V. K. Unnithan. 2004. Time scale changes in the Vembanad Wetland Ecosystem due to Thanneermukkombarrage. Proc. of Kerala Science Congress, Kerala State Council for Science, Technology and Environment (KSCSTE),Thiruvananthapuram, Kerala.
CWRDM 1995. Water Atlas of Kerala. Centre for Water Resource Development and Management, Kozhikode, Kerala.World Health Organization. 1993. Guidelines for drinking water quality ñ I, Recommendations, 2nd Ed. Geneva WHO.
Proceedings of 22nd Kerala Science Congress
668
Proceedings of 22nd Kerala Science Congress, 28-31 January 2010, KFRI, Peechi, pp. 668-669© KSCSTE 2010
08-82
The importance of management of lianas and conservation of forests
K. A. Sujana and N. Anil KumarCommunity Agrobiodiversity Centre, M. S. Swaminathan Research Foundation, Puthurvayal, Kalpetta, Wayanad, KeralaE-mail: [email protected]
INTRODUCTION
Lianas are defined as climbing plants that produce true wood (xylem tissues derived from a vascular cambium) andthat germinate on the ground but lose their ability to support themselves as they grow, so they are to rely onexternal physical support to ascend to the canopy (Gerwing et al., 2006). Lianas remain rooted to the groundthroughout their lives and often have special adaptation to attach themselves to their host and climb into forestcanopy. These adaptations include stem twining, clasping tendrils arising from stem, leaf and branch modifications,thorns and spines that attach the liana to its host, downward pointing adhesive hairs and adhesive adventitiousroots. Most of these climbing forms can be found in any of the tropical forest types.
MATERIALS AND METHODS
A study of lianas of Wayanad plateau of the Western Ghats was carried out between May 2006 and November 2009with special reference to taxonomic and ecological diversity. Extensive surveys were conducted in all the majorvegetation types and plants collected for herbarium as well as ex situ conservation. Plant identification was madeboth in the field and herbarium. The mode of dispersal and nature of seeds were evaluated by consulting relevantliterature and field observation. Climbing mechanism was also studied for each species. Ethnic uses of lianas weredocumented by interviewing the elderly men and women residing in families in and around the forests. The 1 haplot established in 30 randomly selected study sites distributed in forest types of tropical evergreen, semi evergreen,moist deciduous, dry deciduous, riparian and shola and each harbours 5 sites. Each plot was subdivided into hundred,10m x 10m subplots and all rooted lianas within the plot having a girth greater than or equal to 3.1 cm wereenumerated. Richness Indices like R1 and R2, Hillís number N1 and N2, Diversity Indices like Shannon-Weiner(Hí) and Simpsonís (l), Evenness measures like E1 and E2 were calculated using the computer programSPDIVERS.BAS. Jaccardís coefficient of similarity was calculated to compare species similarity between the sitesand Importance Value Index was also calculated.
RESULTS AND CONCLUSION
The present study enabled to collect a total of 219 species of lianas which belongs to 114 genera representing 55families from Wayanad plateau of Western Ghats. In terms of species richness the best represented families are,Fabaceae (21 species), Oleaceae and Vitaceae (14), and Hippocrateaceae (12). Lianas display a diversity of climbingmechanisms and its frequencies are twiners (116); scramblers (54); hook climbers (21); root climbers (8) andtendril climbers (20). A few species employ a combination of climbing mechanism. Twiners such as Toddaliaasiatica, Caesalpinia cucculata and Acacia sinuata have sturdy prickles on twining stem. Erythropalam scandens,Gouania microcarpa, Strychnos colubrina and Entada rheedii twine and also possess tendril. A single individual ofEntada rheedii hosted by 32 tree species was observed from Kadassery section of Meppadi forest range. This is thehighest number of support trees for a single species.
One hundred and thirty three species (60.73 %) with fleshy fruits or arillated fruits are animal dispersed diaspores.One species Entada rheedii growing in riparian forests has water dispersed diaspores, 53 species (24.20 per cent)
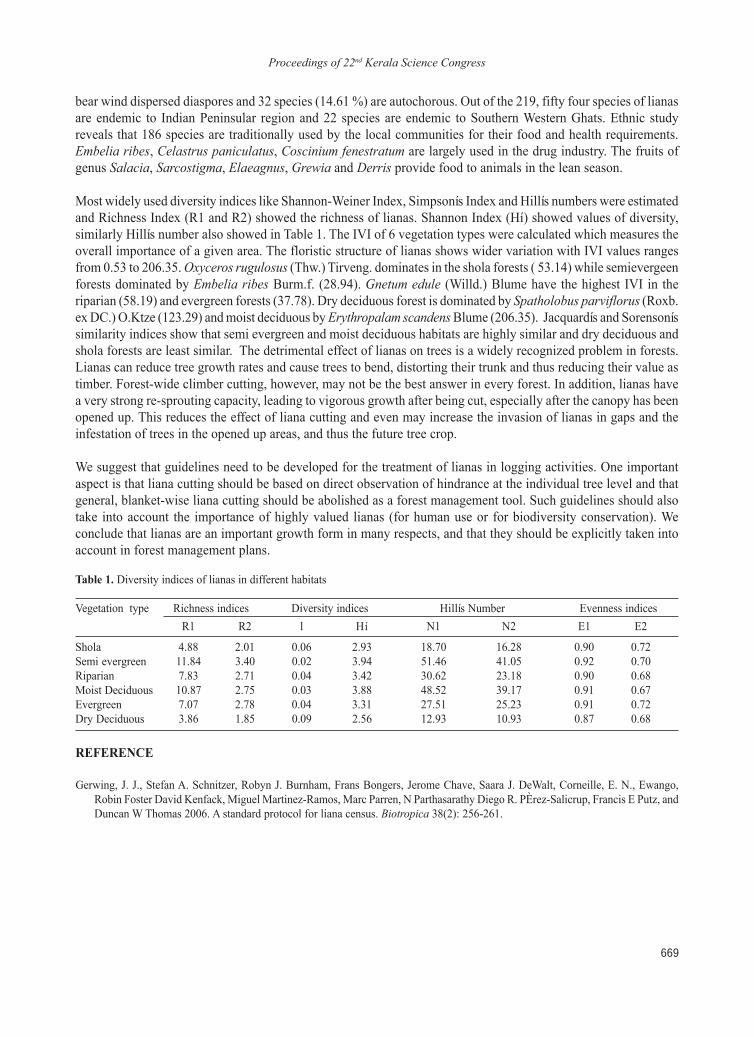
Proceedings of 22nd Kerala Science Congress
669
bear wind dispersed diaspores and 32 species (14.61 %) are autochorous. Out of the 219, fifty four species of lianasare endemic to Indian Peninsular region and 22 species are endemic to Southern Western Ghats. Ethnic studyreveals that 186 species are traditionally used by the local communities for their food and health requirements.Embelia ribes, Celastrus paniculatus, Coscinium fenestratum are largely used in the drug industry. The fruits ofgenus Salacia, Sarcostigma, Elaeagnus, Grewia and Derris provide food to animals in the lean season.
Most widely used diversity indices like Shannon-Weiner Index, Simpsonís Index and Hillís numbers were estimatedand Richness Index (R1 and R2) showed the richness of lianas. Shannon Index (Hí) showed values of diversity,similarly Hillís number also showed in Table 1. The IVI of 6 vegetation types were calculated which measures theoverall importance of a given area. The floristic structure of lianas shows wider variation with IVI values rangesfrom 0.53 to 206.35. Oxyceros rugulosus (Thw.) Tirveng. dominates in the shola forests ( 53.14) while semievergeenforests dominated by Embelia ribes Burm.f. (28.94). Gnetum edule (Willd.) Blume have the highest IVI in theriparian (58.19) and evergreen forests (37.78). Dry deciduous forest is dominated by Spatholobus parviflorus (Roxb.ex DC.) O.Ktze (123.29) and moist deciduous by Erythropalam scandens Blume (206.35). Jacquardís and Sorensoníssimilarity indices show that semi evergreen and moist deciduous habitats are highly similar and dry deciduous andshola forests are least similar. The detrimental effect of lianas on trees is a widely recognized problem in forests.Lianas can reduce tree growth rates and cause trees to bend, distorting their trunk and thus reducing their value astimber. Forest-wide climber cutting, however, may not be the best answer in every forest. In addition, lianas havea very strong re-sprouting capacity, leading to vigorous growth after being cut, especially after the canopy has beenopened up. This reduces the effect of liana cutting and even may increase the invasion of lianas in gaps and theinfestation of trees in the opened up areas, and thus the future tree crop.
We suggest that guidelines need to be developed for the treatment of lianas in logging activities. One importantaspect is that liana cutting should be based on direct observation of hindrance at the individual tree level and thatgeneral, blanket-wise liana cutting should be abolished as a forest management tool. Such guidelines should alsotake into account the importance of highly valued lianas (for human use or for biodiversity conservation). Weconclude that lianas are an important growth form in many respects, and that they should be explicitly taken intoaccount in forest management plans.
REFERENCE
Gerwing, J. J., Stefan A. Schnitzer, Robyn J. Burnham, Frans Bongers, Jerome Chave, Saara J. DeWalt, Corneille, E. N., Ewango,Robin Foster David Kenfack, Miguel Martinez-Ramos, Marc Parren, N Parthasarathy Diego R. PÈrez-Salicrup, Francis E Putz, andDuncan W Thomas 2006. A standard protocol for liana census. Biotropica 38(2): 256-261.
Table 1. Diversity indices of lianas in different habitats
Vegetation type Richness indices Diversity indices Hillís Number Evenness indicesR1 R2 l Hí N1 N2 E1 E2
Shola 4.88 2.01 0.06 2.93 18.70 16.28 0.90 0.72Semi evergreen 11.84 3.40 0.02 3.94 51.46 41.05 0.92 0.70Riparian 7.83 2.71 0.04 3.42 30.62 23.18 0.90 0.68Moist Deciduous 10.87 2.75 0.03 3.88 48.52 39.17 0.91 0.67Evergreen 7.07 2.78 0.04 3.31 27.51 25.23 0.91 0.72Dry Deciduous 3.86 1.85 0.09 2.56 12.93 10.93 0.87 0.68
Proceedings of 22nd Kerala Science Congress
670
Proceedings of 22nd Kerala Science Congress, 28-31 January 2010, KFRI, Peechi, pp. 670-671© KSCSTE 2010
08-83
Assessment of trace metal distribution and contamination in soil around MalabarCements Ltd., Walayar, Palakkad
C. Lathika1* and R. V. Rajan21Kerala Forest Research Institute, Peechi 680 653 Kerala2Departmen of Geology and Environmental Science, Christ College, Irinjalakuda, Thrissur, Kerala
INTRODUCTION
Rapid industrialization has left with us polluted rivers, contaminated soil, depleted wild life and exhausted naturalresources. The centralization of industry and the presence of intensive human activities in urban areas have worsenedthe problem of heavy metal contamination in urban soils. Soil pH, cation exchange capacity and organic mattercontent are the major factors controlling availabilities of metals derived from contaminated soil. Hence, the presentinvestigation is carried out to address the problem pertaining to the characteristics of soil around the MalabarCements Ltd., Walayar, Palakkad .
MATERIALS AND METHODS
The present investigation carried out in MCL Walayar, approximately 15 sq. km. (76o43íE-76o53íE longitude,10o47íN-10o53íN latitude) which falls in the Survey of India Toposheet (1977) No. 58 B/13 of 1:50,000 scales isconsisting of two phases ñ field survey and sample collection, and laboratory analysis.
Sample collection and soil analyses
Twenty-two soil samples have been collected in a grid system (Table 1) from eleven locations around The MalabarCement Factory at Walayar at two depth levels, 0-10 cm and 10-20 cm. All the samples were collected with astainless steel spatula and kept in plastic bags. After air drying for 15 days, soil samples are crushed gently andsieved through a 2 mm sieve. Ground samples are stored in polythene bags and are mixed well before analysis(ASTM D 6051, 1997; Gupta P.K., 2000). The soil samples were dried at 105 + 20c, about 1g of the sample wastaken in a kjeldhal flask covered with a funnel and 5:1 volume of concentrated Nitric acid and Perchloric acid wereadded. It was heated first gently and then strongly until all the organic matter was destroyed. The digestion wascontinued with additional quantity of acid mixtures a colorless residue is obtained. The flask was cooled and thesolution diluted to 25 ml in a standard flask using double distilled water. The sample was directly fed into theAtomic Absorption Spectrophotometer and absorbance taken (AAS model. Perkin ñ Elmer 2380)
RESULTS AND CONCLUSION
The distribution of nutrient level and various trace metals in the two depths of the soil sample is shown in table 2. Thesoil of the region around the Malabar Cement factory is alkaline. Of the trace metals analyzed only Cd exceeds thenormal range in natural soils while Cu, Cr and Zn are within the normal range. The Cd concentrations in surface soilare in the range of 0.28 to 1.13 ppm dry soil and the highest value is shown in sample 8. The Cu concentrations of thesurface soil ranges to 13.5-43.75 ppm .The maximum value recorded in sample 7 and the minimum value recorded insample 10. The concentration of Zn in surface soil ranges to 29.9-45.3ppm dry soil and the maximum value recordedin sample 11 and the minimum value recorded in sample 3. The high level of Zn in the soil is associated mainly withthe emission sources of the cement industry and traffic emissions in the investigated area. The maximum value of Crrecorded in sample 2 and the minimum value recorded in sample 6 and 9. The metal concentrations in the soils of the
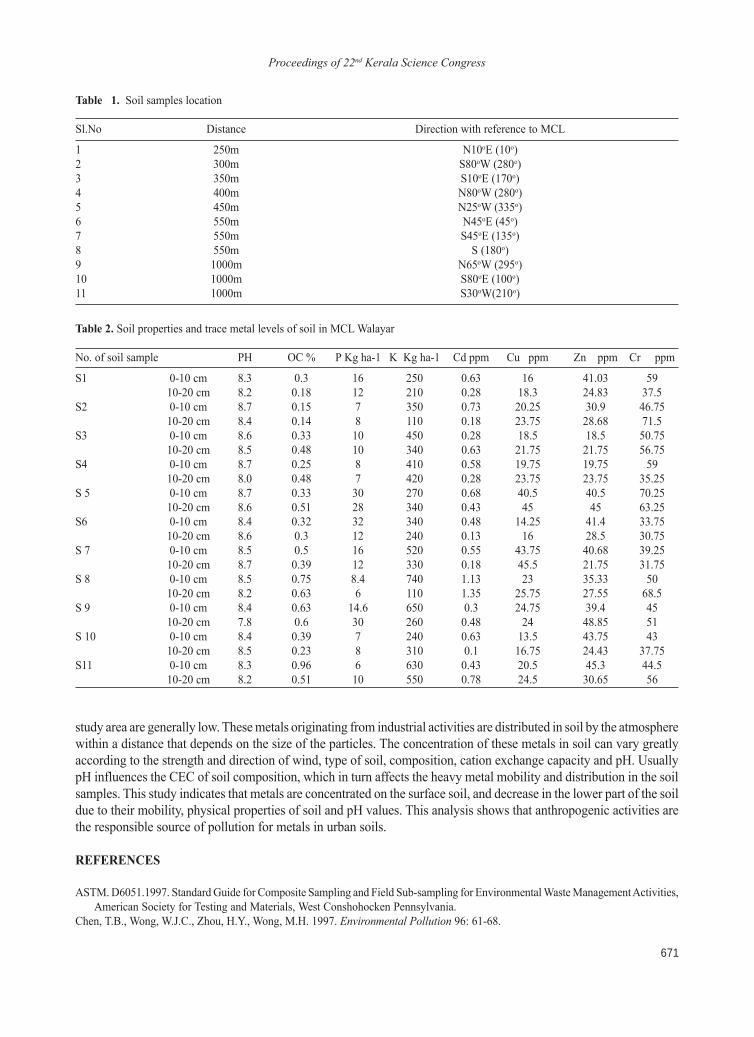
Proceedings of 22nd Kerala Science Congress
671
study area are generally low. These metals originating from industrial activities are distributed in soil by the atmospherewithin a distance that depends on the size of the particles. The concentration of these metals in soil can vary greatlyaccording to the strength and direction of wind, type of soil, composition, cation exchange capacity and pH. UsuallypH influences the CEC of soil composition, which in turn affects the heavy metal mobility and distribution in the soilsamples. This study indicates that metals are concentrated on the surface soil, and decrease in the lower part of the soildue to their mobility, physical properties of soil and pH values. This analysis shows that anthropogenic activities arethe responsible source of pollution for metals in urban soils.
REFERENCES
ASTM. D6051.1997. Standard Guide for Composite Sampling and Field Sub-sampling for Environmental Waste Management Activities,American Society for Testing and Materials, West Conshohocken Pennsylvania.
Chen, T.B., Wong, W.J.C., Zhou, H.Y., Wong, M.H. 1997. Environmental Pollution 96: 61-68.
Table 1. Soil samples location
Sl.No Distance Direction with reference to MCL
1 250m N10oE (10o)2 300m S80oW (280o)3 350m S10oE (170o)4 400m N80oW (280o)5 450m N25oW (335o)6 550m N45oE (45o)7 550m S45oE (135o)8 550m S (180o)9 1000m N65oW (295o)10 1000m S80oE (100o)11 1000m S30oW(210o)
Table 2. Soil properties and trace metal levels of soil in MCL Walayar
No. of soil sample PH OC % P Kg ha-1 K Kg ha-1 Cd ppm Cu ppm Zn ppm Cr ppm
S1 0-10 cm 8.3 0.3 16 250 0.63 16 41.03 5910-20 cm 8.2 0.18 12 210 0.28 18.3 24.83 37.5
S2 0-10 cm 8.7 0.15 7 350 0.73 20.25 30.9 46.7510-20 cm 8.4 0.14 8 110 0.18 23.75 28.68 71.5
S3 0-10 cm 8.6 0.33 10 450 0.28 18.5 18.5 50.7510-20 cm 8.5 0.48 10 340 0.63 21.75 21.75 56.75
S4 0-10 cm 8.7 0.25 8 410 0.58 19.75 19.75 5910-20 cm 8.0 0.48 7 420 0.28 23.75 23.75 35.25
S 5 0-10 cm 8.7 0.33 30 270 0.68 40.5 40.5 70.2510-20 cm 8.6 0.51 28 340 0.43 45 45 63.25
S6 0-10 cm 8.4 0.32 32 340 0.48 14.25 41.4 33.7510-20 cm 8.6 0.3 12 240 0.13 16 28.5 30.75
S 7 0-10 cm 8.5 0.5 16 520 0.55 43.75 40.68 39.2510-20 cm 8.7 0.39 12 330 0.18 45.5 21.75 31.75
S 8 0-10 cm 8.5 0.75 8.4 740 1.13 23 35.33 5010-20 cm 8.2 0.63 6 110 1.35 25.75 27.55 68.5
S 9 0-10 cm 8.4 0.63 14.6 650 0.3 24.75 39.4 4510-20 cm 7.8 0.6 30 260 0.48 24 48.85 51
S 10 0-10 cm 8.4 0.39 7 240 0.63 13.5 43.75 4310-20 cm 8.5 0.23 8 310 0.1 16.75 24.43 37.75
S11 0-10 cm 8.3 0.96 6 630 0.43 20.5 45.3 44.510-20 cm 8.2 0.51 10 550 0.78 24.5 30.65 56
Proceedings of 22nd Kerala Science Congress
672
Proceedings of 22nd Kerala Science Congress, 28-31 January 2010, KFRI, Peechi, pp. 672© KSCSTE 2010
08-84
Bacteriological quality of well water and soft drinks in and around Thiruvalla
Shyama Mohan Nair and Reema Achiamma MathewsDepartment of Zoology, Marthoma College, Thiruvalla, Kerala
INTRODUCTION
The purity of drinking water is evaluated by testing for the presence of coliforms (indicator organisms) as evidence forfaecal contamination. Coliforms are bacteria that are always present in the digestive tracts of animals including humansand are found in their wastes. Total coliform counts give a general indication of the sanitary condition of a watersupply. The coliform bacteria include Escherechia coli, Streptococcus faecalis, Clostridium welchii, Aerobacteraerugenes and Streptococcus pyogenes. E.coli is the major species in the faecal coliform group. Soft drinks are usuallydevoid of bacteria as they undergo several treatment processes. They are likely to get contaminated with bacteria dueto inappropriate or improper storage methods followed by the retail shops and that too for prolonged periods.
MATERIALS AND METHODS
A total of 15 samples were collected for the present study. It included 10 samples of well water which were collectedfrom wells in and around Tiruvalla and 5 samples of soft drinks which were collected from retail shops in andaround Tiruvalla. These samples were brought to the laboratory without keeping in ice bags. Samples of soft drinkscollected for this study were stored in room temperature in the retail shops. The bacteriological examination of thesample water was carried following the standard methods (APHA, 1971). Multiple tube fermentation test was usedto detect coliform bacteria which are considered as faecal contamination indicators. The test was performedsequentially in three stages: presumptive test, confirmed test and completed test. Coliform bacteria are aerobic orfacultative anaerobic, gram negative, rod shaped, non endospore forming, capable of fermenting lactose with theproduction of acid and gas within 24 hrs of incubation at 37∫C.
RESULTS AND CONCLUSIONS
The well water samples (designated as V1, V2, V3, V4, V5, V6, V7, V8, V9, and V10) and the soft drink samples(designated as S1, S2, S3, S4, S5) were inoculated in lactose broth tubes so as to perform the presumptive coliformtest. All the 10 well water samples gave positive presumptive test and the MPN index per 100 ml was thus obtained asin the table. Three of the soft drink samples also gave positive results. Thus from the results obtained it was clear thatall the well water samples and the three of the soft drink samples (ie, S1, S2, and S3) exceeded the standard limit. Thetubes showing positive presumptive test were further tested for confirmed coliform test on EMB agar plate. From theresults, seven of the well water samples (i.e, V2, V3, V4, V7, V8, V9, V10) and 1 soft drink sample (i.e., S3) showeda positive confirmed test. The drinking water standard recommended by ICMR for coliform group is 1 per 100 ml.Hence all the wells are found to be contaminated with coliform group, hence it is unfit for drinking. Majority of wellsfrom which water samples were collected was near to the sanitary systems. Lack of sanitation and well protection maybe the reason for faecal contamination. As coliform are detected in all the samples of well water, repair or modificationof the water system may be required. Soft drinks are usually devoid of bacteria as they undergo several treatmentprocesses. They are likely to get contaminated with bacteria due to inappropriate storage method. Coliform bacteriawere observed in the products of local companies, while the products of standard companies had no coliform bacteria.
REFERENCES
APHA 1980. Standard Methods for the Examination for Water and Waste Water. 15th Edn., Washington.Aneja, K.R. 1986. Experiments in Microbiology, Plant Pathology, Tissue Culture and Mushroom Cultivation. Wishwa Prakasam, New
Delhi.
Proceedings of 22nd Kerala Science Congress
673
Proceedings of 22nd Kerala Science Congress, 28-31 January 2010, KFRI, Peechi, pp. 673-674© KSCSTE 2010
08-85
Biodiversity of macrofungi in the Western Ghats of Kerala
C. Mohanan, P. M. Sumesh*, P. Rajesh and K.B. AnilaDepartment of Forest Pathology, Kerala Forest Research Institute, Peechi 680653 Thrissur, Kerala
INTRODUCTION
Macrofungi are distinguished by having fruiting structures (sporocarps) visible to the naked eyes. Macrofungibelong to Basidiomycota and Ascomycota play vital roles in ecosystem functions. Most of them are saprobes andoccur in soil, humus, decaying wood, litter, dung, etc. Many are ectomycorrhizal members having mutualisticrelationship with trees and shrubs. Some are pathogens of plants, insects or fungi. Mycodiversity, as with all othersub-sects of biodiversity exhibits distinct patterns in both space and time. Such fungal biodiversity patterns are toa large extent unexplored. The Western Ghats of Kerala, covering an approximate area of 20,000 km2 is biologicallyone of the richest tracts. Earlier, studies on specific groups of mushrooms (Pradeep and Vrinda, 2007; Manimohanet al., 2006) and polypores (Leelavathy and Ganesh, 2000; Mohanan, 2007) were undertaken. The present studywas aimed at to increase our knowledge of macrofungal diversity in different forest ecosystems and to learn abouthabitat preference, interaction with other components of ecosystems and geographic distribution of different taxa.
MATERIALS AND METHODS
Opportunistic or convenience sampling was done in selected areas in different forest ecosystems viz., moist deciduous,semi-evergreen, evergreen, wet evergreen, shola forests, swamp forests, grasslands, deciduous forests, and forestplantations throughout the State during pre-monsoon and post-monsoon periods and covered as many habitats inthe areas as possible. Fixed-size plots sampling was done in plots of 100 x 50 m (3 plots in each area) in threelocations in semi-evergreen and evergreen forests were also selected by following line transect sampling method.Systematic observations and documentations were made from the plots at monthly intervals. Additional collectionof macrofungi was also made from ëoff sitesí, thus a combination of opportunistic and plot-based sampling wasmade to maximize the documentation of the macromycetes diversity. Meteorological data for the different studyareas, details on substratum, saprobic/parasitic/symbiotic relationship, human interventions, etc. were also collected.Macromorphological features of the fungal sporocarps were recorded, spore prints prepared, and chemical spottests on fungal tissues were carried out. Sections of the tissues from different parts of the sporocarps were cut byhand or Cryostat Microtome and observed under Research Microscope. Different stains including Melzerís reagent,Phloxin, Cresil blue, Aniline blue, etc. were used and micro-morphological features of the fungus, including hyphalsystem, hymenium, basidia, pleurocystidia, chaelocystidia, pileipellis, peridium, hymenial trama, caulocystidia,veil remnants, pileus, stipe trama, gleba, spore wall structure and spore ornamentation, size, shape, inclusions, etc.were recorded. Line drawings as well as digital photomicrographs of the fungal structures were also made.
RESULTS AND CONCLUSIONS
The Western Ghats of Kerala are endowed with a rich macrofungal flora. Among the different ecosystems studied,moist deciduous forests harbour comparatively large number of macromycetes followed by semievergreen, evergreen,and shola forests. The grassland ecosystem supports only a few macromycetes; however, quite a large number ofmacromycetes belonging to different fungal orders were encountered in swamp forests. Terricolous macrofungi(1750), followed by lignicolous macrofungi (1480) were abundant and predominant ones followed by humicolous(210) and coprophilous. Three years field data revealed that a definite pattern of macrofungal diversity exist indifferent forest ecosystems with temporal variation and spatial heterogeneity highly influenced by climatic factors,especially rainfall, and biotic interventions.
Proceedings of 22nd Kerala Science Congress
674
Basidiomycota is well represented by more than 107 genera belonging to 58 families under 11 orders. Of these,Agaricales alone is represented by 27 families with a total of more than 55 genera. Among the 27 families underAgaricales, Agaricaceae is having large number of genera and species which are mostly terricolous and widely distributedin different ecosystems. Agaricus, Coprinus, Lepiota, Macrolepiota, Leucocoprinus, Leucoagaricus, Chlorophyllum,Clarkeinda are the significant genera. Agrocybe, Bolbitius, Conocybe and Panaeolus are the significant genera underBolbitiaceae. Clavulinopsis and Clavaria are the most widespread genera of Clavariaceae. Gymnopilus and Cortinariusrepresented the Cortinariaceae. A large number of species belonging to Entoloma of Entolomataceae are extensivelydistributed in moist-deciduous, semievergreen, evergreen and shola and swamp forests. Hydnaceae, Hydnangiaceaeand Hygrophoraceae were represented by Hydnum, Laccaria, Hygrocybe, and Inocybe respectively. Lycoperdaceaeis represented by Bovista, Calvatia and Lycoperdon. A large number of species belonging to the Termitomyces ofLyophyllaceae having mutualistic association with termite in nests and mounts were encountered. The primary colonizersof forest litter viz., Marasmius, Marasmiellus of Marasmiaceae and Favolschia, Filoboletus, Mycena of Mycenaceaewere also encountered in most of the ecosystems. Omphalotus, the luminescent fungus belong to Omphalotaceae wasrecorded in most deciduous to evergreen forests. Lentinula was in limited distribution. Hohenbuhelia and Pleurotus ofPleurotaceae and members of Pluteaceae family viz., Amanita, Pluteus and Volvariella were widely distributed indifferent ecosystems. Physalacriaceae is represented by Cyptotrama and Oudemansiella. Psathyrellaceae is representedby Psathyrella, Parasola and Coprinellus. Hypholoma, Pholiota, Psilocybe and Stropharia of Strophariaceaeencountered mostly in grasslands and semievergreen forests. Clytocybe, Tricholoma, Lepista belonging toTricholomataceae are the other most extensively distributed members of Agaricales. Boletales is represented by membersunder seven families. Boletus, Leccinium, Tylopilus, Boletinellus, Paxillus, and Gyrodon showed narrow distributionand form ectomycorrhizal association with several tree species. Pisolithus and Scleroderma are the other ectomycorrhizalmembers widely distributed in forest plantations and natural stands.
Members belonging to Cantharellaceae and Clavulinaceae are of limited distribution. Cantharellus, the most potentialedible fungus forms ectomycorrhizal association with tree species. Ramaria and Ramariopsis of Gomphaceae arewidely distributed, while Gomphus was sparsely distributed. Geastrum belongs to Geastraceae was observed in mostof the ecosystems and is well represented by several species. Hymenochaetales is typified by Phellinus, Inonotus andHymenochaetae. These are the significant genera causing heart rot and butt rot in living trees and their sporocarps areperennial. Polyporales is represented by five families. Daedalia and Fomitopsis of Phomitopsidaceae, Ganoderma,and Amauroderma of Ganodermataceae, Fomes, Lentinus, Poria, Trametus of Polyporaceae are the dominantmacrofungi in most of the ecosystems. Their occurrence and distribution are governed by level of degradation of thestands. Aseroe, Clathrus, Mutinus, and Dictyophora of Phallaceae, the most attractive, rare and endangered macrofungiwere encountered in evergreen and shola forests. Order Russulales is represented by four families. Russula andLaccaria are the significant genera and are the important ectomycorrhizal partners in different forest ecosystems.Macromycetes belonging to Ascomycota are comparatively least represented in the forests. So far, well known specieslike Morchella could not be detected. However, macrofungi belonging to families Bulgariaceae, Clavicepitaceae,Hyaloscyphaceae, Pezizaceae, Pyrenomycetaceae, Sarcoscyphaceae and Xylariaceae were recorded from differentforests. Among these, Xylaria and Hypoxylon of Xylariaceae are the most widely distributed ones, while Cookenia,Sarcoscypha, and Philipsia, the primary colonizers of decaying forest litter are widely distributed in semievergreen,evergreen, and shola forests. Macromycetes belong to Basidiomycota are well represented and widely distributed indifferent forest ecosystems. Ascomycota are least represented and exhibited restricted and patchy distribution.Macrofungal diversity in the different forest ecosystems of Western Ghats follows distinct patterns in both space andtime and is highly influenced by abiotic and biotic factors.
REFERENCES
Leelavathy, K.M. and Ganesh, P.N. 2000. Polypores of Kerala. Daya Publishing House, Delhi.Manimohan, P., Noordeloos, M.E. and Dhanya, A.M. 2006. Studies on the genus Entoloma in Kerala State, India. Persoonia 19 (1): 45-93.Mohanan, C. 2007. Prevalence of decay and decay fungi in natural forests of Kerala. Journal of Tropical Forestry 23(3&4): 39-47.Pradeep, C. K. and Vrinda, K.B. 2007. Some noteworthy Agaricus from the Western Ghats of Kerala. J. Mycopathol. Res. 45 (1): 1-14.


