Embed Size (px)
Citation preview

CHANGES IN THE X-RAY EMISSION FROM THE MAGNETAR CANDIDATE1E 2259+586 DURING ITS 2002 OUTBURST
P. M. Woods,1,2
V. M. Kaspi,3,4
C. Thompson,5F. P. Gavriil,
3H. L. Marshall,
4D. Chakrabarty,
4K. Flanagan,
4
J. Heyl,6,7
and L. Hernquist6
Received 2003 October 17; accepted 2003 December 28
ABSTRACT
An outburst of more than 80 individual bursts, similar to those seen from Soft Gamma Repeaters (SGRs), wasdetected from the anomalous X-ray pulsar (AXP) 1E 2259+586 in 2002 June. Coincident with this burst activitywere gross changes in the pulsed flux, persistent flux, energy spectrum, pulse profile, and spin-down of theunderlying X-ray source. We present Rossi X-Ray Timing Explorer and X-Ray Multi-Mirror Mission observationsof 1E 2259+586 that show the evolution of the aforementioned source parameters during and following thisepisode and identify recovery timescales for each. Specifically, we observe an X-ray flux increase (pulsed andphase-averaged) by more than an order of magnitude having two distinct components. The first component islinked to the burst activity and decays within �2 days, during which the energy spectrum is considerably harderthan during the quiescent state of the source. The second component decays over the year following the glitchaccording to a power law in time with an exponent �0:22 � 0:01. The pulsed fraction decreased initially to�15% rms but recovered rapidly to the preoutburst level of �23% within the first 3 days. The pulse profilechanged significantly during the outburst and recovered almost fully within 2 months of the outburst. A glitch ofsize ��max=� ¼ (4:24 � 0:11) ; 10�6 was observed in 1E 2259+586, which preceded the observed burst activity.The glitch could not be well fitted with a simple partial exponential recovery. An exponential rise of �20% of thefrequency jump with a timescale of �14 days results in a significantly better fit to the data; however, contam-ination from a systematic drift in the phase of the pulse profile cannot be excluded. A fraction of the glitch(�19%) was recovered in a quasi-exponential manner having a recovery timescale of �16 days. The long-termpostglitch spin-down rate decreased in magnitude relative to the preglitch value. The changes in the sourceproperties of 1E 2259+586 during its 2002 outburst are shown to be qualitatively similar to changes seen duringor following burst activity in two SGRs, thus further solidifying the common nature of SGRs and AXPs asmagnetars. The changes in persistent emission properties of 1E 2259+586 suggest that the star underwent aplastic deformation of the crust that simultaneously impacted the superfluid interior (crustal and possibly coresuperfluid) and the magnetosphere. Finally, the changes in persistent emission properties coincident with burstactivity in 1E 2259+586 enabled us to infer previous burst-active episodes from this and other AXPs. Thenondetection of these outbursts by all-sky gamma-ray instruments suggests that the number of active magnetarcandidates in our Galaxy is larger than previously thought.
Subject headings: pulsars: general — stars: individual (1E 2259+586) — stars: neutron — X-rays: bursts
1. INTRODUCTION
Anomalous X-ray pulsars (AXPs) and soft gamma repeaters(SGRs) are two intriguing classes of isolated neutron stars,very likely magnetars, whose bright X-ray emission is pow-ered by the decay of their strong magnetic fields. When thecommon nature of AXPs and SGRs was first proposed byThompson & Duncan (1996) with both being magnetars, the
observational evidence linking them was tenuous. A majoradvance in connecting these two classes came when slowpulsations and rapid spin-down, defining characteristics ofAXPs, were discovered from SGR 1806�20 (Kouveliotouet al. 1998). Since then, further observational similaritiesamong AXPs and SGRs have been established. For example,Marsden & White (2001) performed a systematic analysis ofSGR and AXP spectral data that showed the two classes forma continuum in spectral hardness versus spin-down rate inwhich the SGRs have harder spectra and faster spin-downrates than the spectrally softer, slower braking AXPs. Simi-larly, the timing noise strength in SGRs and AXPs appearsto be correlated with spin-down rate (Woods et al. 2000;Gavriil & Kaspi 2002). For a review of SGRs and AXPs, seeWoods (2004) and Mereghetti et al. (2002), respectively.Until recently, the most prominent characteristic distin-guishing the two groups was the emission of soft bright (up to1044 ergs s�1) bursts of soft gamma-rays from the SGRs andnot the AXPs. In fact, it was this extraordinary property ofSGRs that led to doubt within the community that AXPs andSGRs were of the same nature. This uncertainty was removedwhen SGR-like bursts were recently discovered from at least
1 Universities Space Research Association, 320 Sparkman Drive, Huntsville,AL 35805; [email protected].
2 National Space Science and Technology Center, 320 Sparkman Drive,Huntsville, AL 35805.
3 Department of Physics, Rutherford Physics Building, McGill University,3600 University Street, Montreal, QC, H3A 2T8, Canada.
4 Center for Space Research, 77 Vassar Street, Massachusetts Institute ofTechnology, Cambridge, MA 02139.
5 Canadian Institute for Theoretical Astrophysics, 60 St. George Street,Toronto, ON M5S 3H8, Canada.
6 Harvard-Smithsonian Center for Astrophysics, 60 Garden Street,Cambridge, MA 02138.
7 Chandra Fellow; current address: Department of Physics and Astronomy,University of British Colombia, 6224 Agricultural Road, Vancouver, BC V6T1Z1, Canada.
378
The Astrophysical Journal, 605:378–399, 2004 April 10
# 2004. The American Astronomical Society. All rights reserved. Printed in U.S.A.
one AXP (Kaspi et al. 2003) and probably one other (Gavriil,Kaspi, & Woods 2002).
SGR-like bursts from the direction of an AXP were firstdetected from the source 1E 1048.1�5937 (Gavriil et al. 2002).A single weak SGR-like burst was detected during each of twoRossi X-Ray Timing Explorer (RXTE) Proportional CounterArray (PCA) monitoring observations of this AXP separatedby 2 weeks. However, the identification of 1E 1048.1�5937as the burst source could not be made unambiguously becauseof the lack of imaging capability with the PCA. Interestingly,the quiescent properties of this AXP (e.g., energy spectrum,pulse profile, and timing noise) most closely resemble those ofthe SGRs (Kaspi et al. 2001), making this AXP the most SGR-like of its class.
The second detection of SGR-like bursts was recorded fromthe AXP 1E 2259+586 on 2002 June 18. This is the leastSGR-like of the AXPs in terms of its quiescent source prop-erties. Unlike the two weak bursts observed earlier from 1E1048.1�5937, this AXP showed a major SGR-like outburst orcollection of bursts (Kaspi et al. 2003). In total, more than 80bursts were detected within 3 hr of observing time. A detailedstudy of these bursts will be presented in a companion paper(Gavriil, Kaspi, & Woods 2003). In addition to emittingthese hard X-ray bursts, several parameters of the persistentsource changed in conjunction with this outburst, therebyconfirming the AXP as the source of the burst emission (Kaspiet al. 2003).
Here we present X-Ray Multi-Mirror Mission (XMM-Newton) and RXTE PCA observations of the persistent X-rayflux from 1E 2259+586 before, during, and after the 2002 Juneoutburst. We quantify the changes of the spectral and temporalproperties of the X-ray source, as well as the timescales fortheir recovery. We compare the changes observed in this AXPwith dynamic behavior seen in the persistent emission of SGR1900+14 (Woods et al. 2001) and SGR 1627�41 (Kouveliotouet al. 2003) during episodes of intense burst activity. Finally,we present a possible explanation for the observed behaviorin 1E 2259+586 within the context of the magnetar model.
2. XMM-NEWTON OBSERVATIONS
The results presented in this section were obtained fromobservations of 1E 2259+586 with the telescopes aboard theXMM-Newton observatory (Jansen et al. 2001). This observa-tory is composed of three co-aligned X-ray telescopes. Thefocal plane instruments are one EPIC pn camera (Struder et al.2001) and two EPIC MOS cameras (Turner et al. 2001). Allinstruments are sensitive to X-rays between 0.2 and 15.0 keV.The pn camera has an effective area of �1400 cm2 at 1.5 keV,while the MOS cameras each have areas of �500 cm2 at1.5 keV. The focused X-ray beam for the telescopes serving
each MOS camera is split between the focal plane instrumentand the ReflectionGrating Spectrometer (RGS; denHerder et al.2001).
The XMM-Newton observatory observed 1E 2259+586 5times during 2002. Three pointings were focused on differentportions of CTB 109, the supernova remnant (SNR) sur-rounding 1E 2259+586. The primary scientific objective of theremaining two observations was the central point source. Ineach of the three CTB 109 pointings, the AXP is within thefield of view at large off-axis angles (100–130). Results fromall five observations on the central source will be presentedhere. Analysis of the data from the remnant will be presentedelsewhere (M. Sasaki et al. 2004, in preparation).
The first XMM-Newton observation of 1E 2259+586 wasone of the remnant pointings, carried out on 2002 January 22.The second was centered on the AXP and was performed on2002 June 11, fortuitously 1 week prior to the outburst of 1E2259+586. Following theoutburst, a target of opportunity (ToO)was declared and the source was reobserved 3 days later on 2002June 21. The remaining two observations of CTB 109 werecarried out on 2002 July 9. See Table 1 for further details on theseobservations. Hereafter, each XMM-Newton observation is re-ferred to by the identifier label assigned to it in Table 1.
The two MOS cameras were operated in full-frame modefor all but one observation (Obs3, Small Window for MOS1)to study the SNR. The frame time for the full-frame data modeis 2.6 s, which causes severe pile-up for the AXP (k50%).Therefore, these data are not considered further here.
The pn camera was operated in small-window mode forboth Obs2 and Obs3, the two observations closely bracketingthe 2002 June outburst in time. The frame time for the pncamera in this mode is ’5.86 ms, allowing detailed study ofthe pulsed emission and a search for burst emission. For theon-axis count rate of the AXP, the dead-time fraction is 30%,but the pile-up fraction is only 0.03%. The three off-axispointings (Obs1, Obs4, and Obs5) were carried out in ex-tended full-frame mode, which has a time resolution of200 ms. The high off-axis angles for the AXP reduced the countrate by a factor of 2–3. The different data mode and reductionin count rate lessened the dead time to 2%, but the pile-upfraction increased to 3%.
The RGS data from Obs2 and Obs3 were acquired in spec-troscopy mode with 5.7 s time resolution and excellent energyresolution (�E=E ¼ 10–20). The coarse time resolution al-lowed for only phase-averaged spectral analysis (see x 2.3).
All data were processed using the XMM-Newton ScienceAnalysis System8 (SAS) version 5.4.1. For the pn data, the
TABLE 1
XMM-Newton Observation Log for 1E 2259+586
Name XMM-Newton ObsID Relation to Burst Activity
Datea
(MJD TDB)
pn Exposureb
(ks) pn Data ModecAXP Offsetd
(arcmin)
Obs1 ....... 0057540101 Before 52,296.791 10.7 Extended 11.2
Obs2 ....... 0038140101 Before 52,436.546 24.9 Small 1.7
Obs3 ....... 0155350301 After 52,446.449 18.5 Small 1.7
Obs4 ....... 0057540201 After 52,464.369 12.3 Extended 13.0
Obs5 ....... 0057540301 After 52,464.606 12.4 Extended 9.7
a Start time of each observation. Note that the outburst began on date 52,443.65 MJD.b Exposure times quoted reflect on-source times after filtering of flares, etc. for spectral and temporal analysis.c Extended full-frame mode or small-window mode.d The angular distance of 1E 2259+586 from the optical axis of the EPIC mirrors.
8 See http://xmm.vilspa.esa.es/external/xmm_sw_cal/sas.shtml.
X-RAY EMISSION FROM 1E 2259+586 379

script EPCHAIN was run on the observation data files. Thisscript processes the data for use in higher end analysis tools. Alight curve of the full field of view (FOV) excluding the brightcentral source was constructed (0.5–10.0 keV) and inspectedfor times of high background. We chose a threshold of 2 timesthe nominal background to define regions of high background.Periods of high background constituted 0%–33% of each dataset and were eliminated from further analysis.
2.1. Burst Search
We have used the data from the pn camera to search forburst emission from 1E 2259+586 during the XMM-Newtonobservations. By using the SAS tool EVSELECT, events fromwithin 1000 and 12B5 radius circles around the position of theAXP were extracted for the on-axis and off-axis (remnant)pointings, respectively. Following the standard filtering pro-cedures for XMM-Newton pn data, grades �12 and flag valuesequal to 0 were retained. Next, we filtered the event list forenergy between 0.5 and 12.0 keV to optimize the signal-to-noise ratio for burst emission.
Light curves were constructed for each of the XMM-Newtonobservations at the nominal time resolution (6 ms for Obs2and Obs3 and 200 ms for the others), 0.1 s resolution (Obs2 andObs3), 1 s, and 10 s resolution. No significant burst emissionwas detected on these timescales during any of these obser-vations. This is consistent with the absence of bursts in themore densely sampled RXTE data (Gavriil et al. 2003) thatbracket these XMM-Newton observations. Bursts were re-corded from 1E 2259+586 only on 2002 June 18.
2.2. Pulse-Timing Analysis
Using the same procedures as those described above for theburst search, source event lists from the pn data were extractedto study the pulsed emission from 1E 2259+586. To optimizethe signal-to-noise ratio for the pulsed emission, the event listwas filtered for energy between 0.5 and 7.0 keV.
There is a known problem with the time tags of XMM-Newton pn data in that there can be sudden jumps in thephoton arrival times of integral second values (W. Becker2003, private communication). It is still not understood atwhat stage of the processing these ‘‘time jumps’’ distort thetime tags, only that they do occur. We searched for and iden-tified four time jumps within two of the five data sets (Obs 2and 3). All time jumps were identified in the two pointingsat which the pn camera was operated in small-windowmode. To find these time jumps we calculated the modulus ofeach event time stamp with the mean frame time of the cor-responding data set. The frame time varied with data mode
(small window vs. extended full frame), as well as between andwithin observations having identical data modes. The lattereffect is believed to be due to temperature variations in the on-board electronics (XMM-Newton Helpdesk 2003, privatecommunication).The time jumps in each data set were obvious after plotting
the frame time residuals versus the time of each event. Timejumps manifested themselves as discontinuities in the frametime residuals plot. These discontinuities were identified andcorrected for by adding or subtracting an integral number ofseconds to the data following the jump until the frame timeresiduals matched precisely across the boundary. The timecorrections we applied to the data were verified by the pulsardata. In the uncorrected pulsar data set, phase jumps that wereconsistent with being equal to the time corrections required bythe frame time inconsistencies were detected. By using thetime-corrected data set, the phase jumps in the pulsar datadisappeared. Therefore, we are secure about the relative tim-ing of the corrected XMM-Newton pn data set. However, theabsolute timing of these events will require a better under-standing of the origin of the time jump problem.The corrected time tags were next converted to the solar
system barycenter by using the SAS tool BARYCORR. As-suming that the remaining uncertainty in the corrected timetags is a small integral number of seconds, the propagatederror in the barycenter correction applied to the data is in-significant with respect to the precision with which we canmeasure the pulse frequency.For the two point-source observations in small-window
mode (Obs2 and Obs3), the data were binned at twice thenominal frame time of each observation, and a fast Fouriertransform was constructed of the light curves (0.5–7.0 keV).The only significant power detected between 4 ; 10�4 Hzand the Nyquist frequency (44 Hz) is from the first seven oreight harmonics of the pulsar. The 3 � upper limit to themean fractional power in the frequency range 0.001–1.0 Hz(minus the pulsar frequency and harmonics) is 3 ; 10�3 and2 ; 10�3 (rms/mean)2 Hz�1, for Obs2 and Obs3, respectively.These limits are orders of magnitude lower than typicalbroadband noise power levels seen in accreting X-ray pul-sars, even so-called quiet accreting pulsars such as 4U 1626�67 (Owens, Oosterbroek, & Parmar 1997; Shinoda et al.1990).
The precise pulse frequencies for each pointing were de-termined using a phase-folding technique. For each data set, atemplate pulse profile was constructed by folding the data onthe frequency as determined from the peak power of thefundamental frequency in the power density spectrum. Next,the data set was split into �103 s segments, and each segment
TABLE 2
Pulse Frequencies and Pulsed Fractions of 1E 2259+586 Measured Using XMM-Newton pn Data
Pulsed Fraction
Observation
Epoch
(MJD TDB)
Frequencya
(Hz) 0.3–1.0 keV 1.0–2.0 keV 2.0–5.0 keV 5.0–12.0 keV 2.0–10.0 keV
Obs1 .............. 52,296.791–52,296.932 0.14328688 (55) 0.169 (15) 0.195 (6) 0.230 (10) 0.314 (73) 0.232 (10)
Obs2 .............. 52,436.546–52,436.983 0.14328705 (13) 0.215 (6) 0.225 (3) 0.234 (4) 0.284 (23) 0.234 (4)
Obs3 .............. 52,446.449–52,446.755 0.14328746 (9) 0.168 (5) 0.200 (2) 0.223 (3) 0.189 (13) 0.220 (3)
Obs4b............. 52,464.369–52,464.534 0.14328771 (13) 0.166 (15) 0.180 (7) 0.225 (11) 0.294 (50) 0.230 (10)
Obs5b............. 52,464.606–52,464.761 0.14328771 (13) 0.139 (13) 0.168 (6) 0.225 (8) 0.339 (38) 0.230 (8)
a Numbers in parenthses indicate the 1 � uncertainty in the least significant digits of the frequency.b Frequency derived from combined data set of Obs4 and Obs5 due to their close proximity to one another in time.
WOODS ET AL.380 Vol. 605

was folded with the same frequency. The pulse profiles fromeach segment were cross-correlated with the template pulseprofile, and a phase offset was measured. The resulting phasedifferences for each segment were fitted to a line, and the slopewas used to correct the frequency. By using the refined fre-quency, a new template pulse profile was constructed, and theprocedure for refining the pulse frequency was repeated. Theepochs and frequencies measured for each XMM-Newton ob-servation are listed in Table 2. Since two of the CTB 109observations were performed sequentially, we determined asingle frequency for the combined observation. The spin fre-quencies measured in the XMM-Newton observations areconsistent with the much more precise spin ephemeris mea-sured using the RXTE data (see x 3.1).
Using the measured frequencies, the background-subtractedpn data were folded over different energy bands. The back-ground was estimated by measuring the count rate for thedifferent energy bands in a circular extraction region close tothe pulsar and within CTB 109 but away from bright knotswithin the remnant. The normalized pulse profiles for differentenergy bands are shown in Figure 1. Clearly, the pulse profilechanged significantly directly after the outburst. SubsequentX-ray observations revealed a gradual recovery to the pre-outburst pulse shape (see x 3.4).
The rms pulsed fractions were calculated for each obser-vation over several energy bands. Following van der Klis(1989), the pulsed fractions were calculated using the firstseven harmonics of the Fourier representation of the pulse
profile according to the equation
Frms ¼
ffiffiffiffiffiffiffiffiffiffiffiffiffiffiffiffiffiffiffiffiffiffiffiffiffiffiffiffiffiffiffiffiffiffiffiffiffiffiffiffiffiffiffiffiffiffiffiffiffiffiffiffiffiX7k¼1
�2k þ �2k � (�2� k
þ �2�k )
2
vuut ; ð1Þ
where
� k ¼1
N
XNi¼1
ri cos 2��ik; �k ¼1
N
XNi¼1
ri sin 2��ik;
�2� k¼ 1
N2
XNi¼1
�2ri cos22��ik; �2�k ¼
1
N2
XNi¼1
�2ri sin22��ik:
Here Frms is the pulsed fraction, k refers to the harmonicnumber, i refers to the phase bin, N is the total number ofphase bins, �i is the phase, ri is the count rate in the ith phasebin, and �xi is the uncertainty in the count rate of the ith phasebin. Note that equation (1) is insensitive to reducing the num-ber of harmonics used in calculating Frms for low signal-to-noise ratio pulse profiles since the statistical noise is sub-tracted from the total variance. Seven harmonics were chosenfor N to encompass all statistically significant source power inthe highest signal-to-noise ratio pulse profiles. The pulsedfractions and uncertainties are given in Table 2.
Directly following the outburst (Obs3), the pulsed fractionat all energies dropped relative to the preoutburst level (Obs2).
Fig. 1.—Folded-pulse profile of 1E 2259+586 as observed with the XMM-Newton pn camera as a function of energy for the all five observations. Time increasesfrom left to right. The burst activity is recorded between Obs2 and Obs3. See Table 1 for exact times of observations.
X-RAY EMISSION FROM 1E 2259+586 381No. 1, 2004

The largest change was seen in the hard band (5.0–12.0 keV).During the XMM-Newton observations 3 weeks after theoutburst (Obs4 and Obs5), the broadband pulsed fraction (2–10 keV) had recovered to its preoutburst value, although thepulse profile was still significantly different. The time evolu-tion of the pulsed fraction is presented in x 3.3, in whichadditional pulsed fraction measurements made with the RXTEPCA are reported.
In the observation directly before the outburst (Obs2), thepulsed fraction does not vary strongly with photon energy.The energy dependence of the pulsed fraction is most prom-inent in the observations following the outburst for which thepulsed fraction increased significantly with energy. Interest-ingly, the pulsed fraction in the soft band (0.3–1.0 keV) ishigher 1 week before the outburst than at any of the otherXMM-Newton epochs before or after.
2.3. Spectroscopy
The pn data were used for spectral analysis of 1E 2259+586because of their excellent signal-to-noise ratio and negligiblepile-up. For the two observations centered on the point source,events from within a 1000 radius circle around the position ofthe AXP were extracted using the SAS tool EVSELECT.Following the standard procedures for XMM-Newton pn data,these events were filtered for grades �4, and flag valuesequal to 0 were retained for the source spectrum. Similarly, abackground spectrum was extracted using the same filteringcriteria from nearby circular regions of 1000 radius for each ob-servation identical to the regions used for the pulsed-fractionanalysis. The total number of source counts accumulated foreach spectrum was 259,000 and 373,000 for the preburst(Obs2) and postburst (Obs3) observations, respectively.
The three observations of CTB 109 included the AXP butat large off-axis angles (100–130). At off-axis positions of�100, the point-spread function of the EPIC mirrors is sig-nificantly broader than on-axis. Because of this effect, a largersource extraction radius (12B5) was used. Background spectrawere extracted from circular regions of radius �2200 withcenters at off-axis positions similar to the source extractionregion. The larger extraction radii were chosen to increase thenumber of background counts and improve the accuracy ofthe background subtraction. Furthermore, the backgroundspectra were extracted from the same chip. Because of the off-axis positions of the AXP and the lower exposures of the CTB109 observations, the total number of source counts extractedin each spectrum was much lower, between 38,000 and56,000.
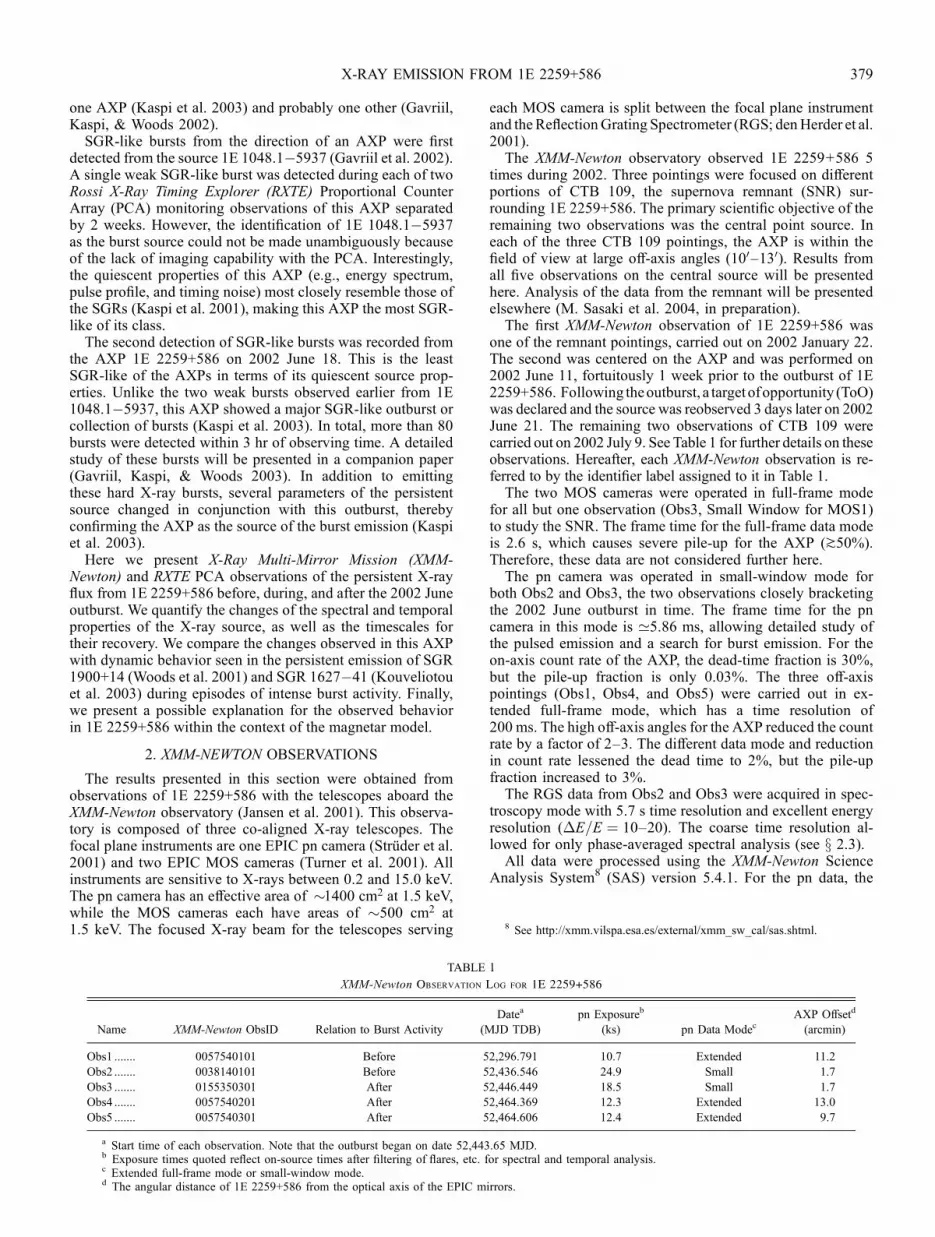
Each spectrum was grouped such that there was a minimumof 25 counts per bin. The spectra were fitted individually usingXSPEC9 version 11.2.0. Because of the high column along theline of sight to this source, the observed counts in pulse heightamplitude (PHA) channels corresponding to E < 0:6 keV aredominated by the low PHA tails of events whose true energiesare above 1 keV. We, therefore, restrict our spectral fits to thedata in the range 0.6–12.0 keV. Fits to single-componentmodels (blackbody, power law, and bremsstrahlung) modifiedby interstellar absorption did not yield statistically acceptablefits. The resulting reduced �2 values to the single-componentmodels were k4. We next tried the standard AXP two-component spectral model of a blackbody plus a power lawmodified by interstellar absorption. We obtained good fits toall five data sets. The results of these fits are given in Table 3.The X-ray spectrum of 1E 2259+586 during Obs2 and theresiduals from the best fit are shown in Figure 2. Formally, thefit to the Obs3 spectrum is not statistically acceptable. How-ever, the residuals between 0.8 and 3.0 keV constitute themajority of the total �2 and are at the few percent level. Theseresiduals are very likely due to uncertainties in the instru-mental response (Briel et al. 2004). Introducing a 3% sys-tematic error in the spectral model reduces �2
� to unity. Theerrors quoted in Table 3 are inflated according the systematicerror. No narrow-line features (absorption or emission) areevident in any of the phase-averaged spectra. Within the en-ergy range 0.9–2.0 keV, the 90% confidence limit on a narrow-line feature on the order of the pn response function (�50 eVFWHM) is �10 eV for the equivalent width. Between 2.0 and7.0 keV, the response function increases up to �130 eV andthe line limit increases from �10 to �70 eV.We next included the RGS data in our spectral analysis. The
RGS spectra for Obs2 and Obs3 were extracted using standardprocessing techniques for a point source. The data weregrouped to 25 counts per spectral bin and ported into XSPECfor simultaneous fitting with the pn data. Each observationwas fitted independently, again to the blackbody plus powerlaw model, and the measured spectral parameters were con-sistent with those obtained using the pn data alone. The su-perior energy resolution of the RGS data combined with thehigh signal-to-noise ratio data from the pn camera allow us toput even more constraining limits on the presence of narrow-line features. Within the energy range 0.8–1.75 keV, the 90%confidence limit on a narrow-line feature (�3–10 eV) is�7 eVfor the equivalent width.
9 See http://heasarc.gsfc.nasa.gov/docs/xanadu/xspec.
TABLE 3
Phase-averaged Spectral Fit Parameters of 1E 2259+586 from XMM-Newton pn Data
Parametera Obs1 Obs2 Obs3 Obs4 Obs5
NH (1022 cm�2) ........................................................................... 1.096 (24) 1.098 (12) 1.035 (8) 0.953 (24) 0.937 (20)
kT (keV) ...................................................................................... 0.488 (14) 0.411 (4) 0.517 (5) 0.537 (19) 0.548 (13)
� .................................................................................................. 4.04 (8) 4.10 (3) 3.59 (2) 3.62 (7) 3.58 (6)
Flux (10�11 ergs cm�2 s�1)b....................................................... 1.24 (4) 1.30 (2) 3.47 (3) 2.01 (5) 2.11 (5)
Unabsorbed flux (10�11 ergs cm�2 s�1)c ................................... 1.53 (4) 1.63 (2) 4.17 (4) 2.37 (6) 2.49 (5)
PL/BB ratiod ............................................................................... 0.70 (6) 0.43 (2) 0.74 (2) 0.93 (9) 0.79 (6)
�2/dof .......................................................................................... 619/578 922/851 1332/1094 606/540 599/638
a Numbers in parentheses indicate the 1 � uncertainty in the least significant digits of the spectral parameter. Note that these uncertainties reflect the 1 �error for a reduced �2 of unity.
b Observed flux from both spectral components 2–10 keV.c Unabsorbed flux from both spectral components 2–10 keV.d The ratio of the power-law flux (2–10 keV) to the bolometric blackbody flux (corrected for absorption).
WOODS ET AL.382 Vol. 605
We used the RGS data to confirm whether the fit value ofNH was affected by the steep power-law component of thespectral model. Specifically, using just the pn data, it is diffi-cult to distinguish between a steep power law that is stronglyabsorbed and a flat or inverted power law (e.g., blackbody)that is observed through modest absorption. The Ne-K edge at0.87 keV is readily detected in the RGS data. Freeing both theNH and the Ne abundance relative to solar, aNe, and using theTBVARABS model in XSPEC, we find that aNe ¼ 1:27 �0:24 (at 90% confidence for 1 degree of freedom [dof ]) andthat the best-fit value of NH is very close to the best-fit valuewhen aNe is fixed at 1. Thus, unless the true Ne abundance issignificantly different from the solar value, the fitted NH seemsaccurate (see Table 3).
Clearly, the energy spectrum of 1E 2259+586 hardenedfollowing the 2002 June outburst. Between the XMM-Newtonobservation 1 week prior to the outburst and 3 days following,the photon index became significantly flatter and the black-body temperature rose. However, the blackbody temperatureduring Obs1, several months before the outburst, was signif-icantly higher than the Obs2 temperature and only marginallylower than the postoutburst temperature, albeit with a con-siderably lower flux. This might suggest that the low tem-perature measured during Obs2 was an indicator of theimpending outburst. However, the blackbody temperaturemeasured using the Chandra X-Ray Observatory in 2000January was 0:412 � 0:006 keV (Patel et al. 2001), and therewas no glitch detected from 1E 2259+586 at this time (Gavriil& Kaspi 2002). Moreover, Patel et al. (2001) measure a photonindex of 3:6 � 0:1, consistent with the postoutburst value.Other previous observations of this AXP have shown similarvariance in these spectral parameters (e.g., Parmar et al. 1998;Marsden & White 2001), in addition to the power law–to–blackbody (PL/BB) flux ratio (Marsden & White 2001).Thus, it appears that 1E 2259+586 undergoes significantspectral changes independent of large outbursts, and the spec-tral parameters measured during all the XMM-Newton obser-vations (even those following the outburst) are within thehistorical range of these parameters.
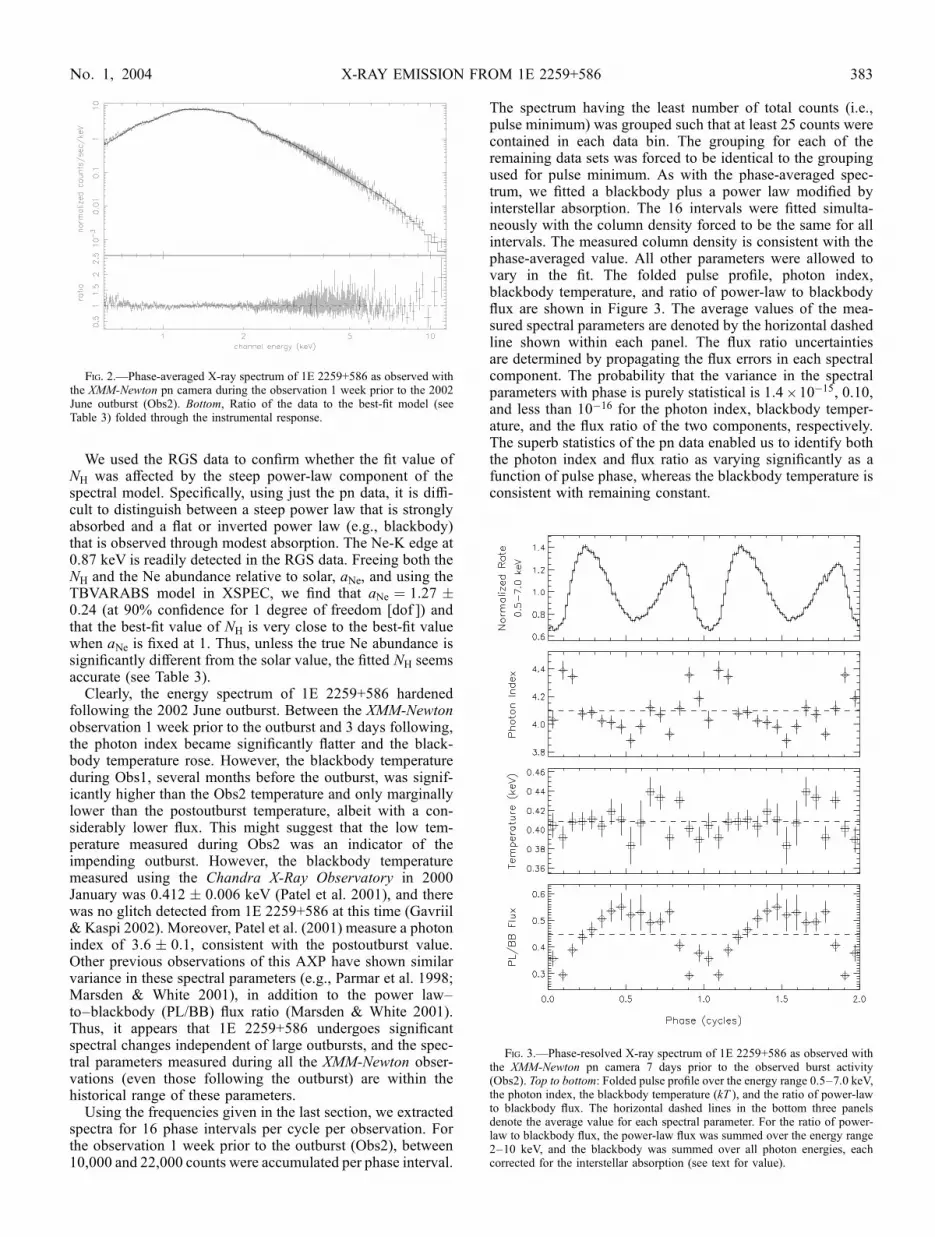
Using the frequencies given in the last section, we extractedspectra for 16 phase intervals per cycle per observation. Forthe observation 1 week prior to the outburst (Obs2), between10,000 and 22,000 counts were accumulated per phase interval.
The spectrum having the least number of total counts (i.e.,pulse minimum) was grouped such that at least 25 counts werecontained in each data bin. The grouping for each of theremaining data sets was forced to be identical to the groupingused for pulse minimum. As with the phase-averaged spec-trum, we fitted a blackbody plus a power law modified byinterstellar absorption. The 16 intervals were fitted simulta-neously with the column density forced to be the same for allintervals. The measured column density is consistent with thephase-averaged value. All other parameters were allowed tovary in the fit. The folded pulse profile, photon index,blackbody temperature, and ratio of power-law to blackbodyflux are shown in Figure 3. The average values of the mea-sured spectral parameters are denoted by the horizontal dashedline shown within each panel. The flux ratio uncertaintiesare determined by propagating the flux errors in each spectralcomponent. The probability that the variance in the spectralparameters with phase is purely statistical is 1:4 ; 10�15, 0.10,and less than 10�16 for the photon index, blackbody temper-ature, and the flux ratio of the two components, respectively.The superb statistics of the pn data enabled us to identify boththe photon index and flux ratio as varying significantly as afunction of pulse phase, whereas the blackbody temperature isconsistent with remaining constant.
Fig. 3.—Phase-resolved X-ray spectrum of 1E 2259+586 as observed withthe XMM-Newton pn camera 7 days prior to the observed burst activity(Obs2). Top to bottom: Folded pulse profile over the energy range 0.5–7.0 keV,the photon index, the blackbody temperature (kT ), and the ratio of power-lawto blackbody flux. The horizontal dashed lines in the bottom three panelsdenote the average value for each spectral parameter. For the ratio of power-law to blackbody flux, the power-law flux was summed over the energy range2–10 keV, and the blackbody was summed over all photon energies, eachcorrected for the interstellar absorption (see text for value).
Fig. 2.—Phase-averaged X-ray spectrum of 1E 2259+586 as observed withthe XMM-Newton pn camera during the observation 1 week prior to the 2002June outburst (Obs2). Bottom, Ratio of the data to the best-fit model (seeTable 3) folded through the instrumental response.
X-RAY EMISSION FROM 1E 2259+586 383No. 1, 2004

Taken at face value, this observation favors two distinctcomponents to the 1E 2259+586 spectrum as has been arguedpreviously (Thompson & Duncan 1996; Perna et al. 2001).However, the two components are likely highly correlated toexplain the minimal variation of the pulse fraction and shapeversus energy (Ozel, Psaltis, & Kaspi 2001). Alternatively, asingle thermal component modified by the strong magneticfield (Ozel 2001) may be possible if there is substantial var-iation in the magnetic field across the stellar surface.
The same analysis procedure was applied to the data directlyfollowing the outburst. The folded profile and spectral param-eters versus pulse phase are shown in Figure 4. Unlike theobservation 10 days earlier, the changes in photon index areonly marginally significant (2:9 ; 10�3). Similarly, the black-body temperature changes are also marginally significant(1 ; 10�3). The flux ratio, on the other hand, still shows signif-icant variability (<10�16). The phase dependence of the fluxratio data is markedly different from what was seen preoutburst.
The total number of counts recorded from 1E 2259+586within the off-axis pointings (Obs1/4/5) is comparable to thecounts recorded within only two phase bins for the on-axispointings. Because of the poorer count statistics in theseobservations, phase-resolved spectroscopy was not performedon these data.
3. RXTE PCA OBSERVATIONS
The bursting behavior on 2002 June 18 from 1E 2259+586(Fig. 5) was detected as part of an ongoing monitoring cam-paign of AXPs spanning the last 6 years (e.g., Kaspi,Chakrabarty, & Steinberger 1999; Gavriil & Kaspi 2002).
Follow-up ToO observations of the source with the PCA wereimmediately triggered and started as early as 1 day followingthe outburst. ToO observations continued for roughly the nextmonth before regular monitoring observations resumed. Herewe report on observations of the persistent and pulsed emis-sion from the AXP leading up to, during, and following the2002 outburst of this source. A detailed analysis of the burstproperties is presented in a companion paper (Gavriil et al.2003).The PCA instrument aboard RXTE is a collimated (1�
FWHM FOV) proportional counter containing a mixture ofxenon and methane gas (Jahoda et al. 1996). It is sensitive toX-rays in the 2–60 keV bandpass and has a maximum effec-tive area of �6500 cm2 at 7 keV. The data from the PCAare read out in a number of different data acquisition modes.Different data modes were used depending on the analysis per-formed. In all the analysis, integration times including de-tected burst emission were eliminated from the accumulatedspectra and/or light curves.With the exception of the first two ToO pointings directly
following the outburst, GoodXenonWithPropane data wereacquired during each observation. These data were used forthe pulse-timing analysis described below. For the firsttwo ToO observations, data modes better suited for studyingbright bursts were employed; however, no further burst ac-tivity was seen. For these pointings, the event data mode(E_125us_64M_0_1s) was used for the timing analysis.Starting from RXTE production level data, GoodXenon-
WithPropane and event mode data were energy selected(2–10 keV) for all xenon layers and binned into light curveshaving a 0.0625 s time resolution. The time values in the lightcurve were then corrected to the solar system barycenter. Forthese processing steps, the standard prescriptions for RXTEPCA data analysis were followed.10 The data were filteredfurther by eliminating times of high background and burstsduring the 2002 June 18 observation by using custom soft-ware. The count rates were normalized to the number ofproportional counter units (PCUs) on at a given time.
Fig. 4.—Same as Fig. 3, but 3 days after the observed burst activity (Obs3)
Fig. 5.—RXTE PCA light curve of 1E 2259+586 recorded on 2002 June 18.The light curve displays counts within 2–20 keV at 1 s time resolution.
10 See http://heasarc.gsfc.nasa.gov/docs/xte/recipes/cook_book.html.
WOODS ET AL.384 Vol. 605

3.1. Pulse-Timing Analysis
Within 2 days of the outburst, it was clear from the PCAdata that a glitch had occurred (Kaspi et al. 2003). A newtiming ephemeris was established and refined with continuingPCA observations. It gradually became apparent that accom-panying the sudden increase in frequency was a dramatic in-crease in spin-down rate (i.e., torque) by a factor of �2. Thistorque excess decayed rapidly over the next several weeks,approaching the preoutburst level. Here we extend the pulse-timing ephemeris 15 months beyond the glitch, allowing us tobetter characterize the frequency evolution postglitch andquantify the recovery timescale of the torque.
As with the XMM-Newton pn data, a phase-folding tech-nique was used to determine the precise ephemeris from theRXTE PCA data. Briefly, photon arrival times, obtained usingdata in the energy range 2–10 keV, were binned with 62.5 mstime resolution, reduced to the solar system barycenter, andthen folded at the nominal pulse period. The folded pulseprofiles for each pointing were cross-correlated in the Fourierdomain with a template pulse profile obtained from preoutburstobservations only, and a relative phase (i.e., time of arrival)was measured. Our analysis includes a total of 62 phase mea-surements obtained between 2000 March and 2003 September,with 43 measurements obtained either during or postoutburst.
This particular analysis was complicated by the change inthe pulse profile at the time of the outburst (see x 3.4), as thecross-correlation procedure assumes a fixed profile. Grosspulse profile changes in which the relative amplitudes of thetwo peaks were reversed resulted in a misidentification of thestandard fiducial point by the cross-correlator for a subset ofthe phase measurements made during the outburst. This wasaccounted for by aligning the average pulse profile during theoutburst observation with the template profile. The alignedoutburst profile was then used as the template for phasemeasurements during the outburst. We verified this procedureby comparing the phase measurements made using this methodwith those calculated using the original template. We foundthat when the cross-correlator identified the appropriate peakin the original measurements, the revised measurements agreedto within the errors. We further checked that our methodworked by verifying that the results we describe below areinsensitive to the omission of the phase measurements madewithin 1 day of the burst activity for which the pulse profilechanges were largest.
We attempted to fit the spin evolution through and followingthe glitch with standard glitch models, that is, a simple jump infrequency, and a two-component frequency jump in which onepart decays exponentially (eq. [2] with ��g ¼ 0). Neitherprovided a good fit to the phase data. Figure 6 shows the fre-quency evolution and phase residuals following subtraction ofthe best-fit model including a sudden frequency jump and anadditional exponential decay. The best-fit parameters imply atotal frequency jump (��) of 6:3 ; 10�7 Hz, with a fractionQ ¼ 0:23 decaying on a timescale of �40 days. However, ascan be seen from the figure, the residuals from this model showa significant systematic trend at the few percent level(�2 ¼ 447 for 54 dof ). Omitting the immediate postburst datain which the pulse profile had substantially changed does notalter the result. It is possible, however, that the residuals are aresult of low-level systematic pulse morphology variations (seex 3.4). This is hard to rule out.
However, as we show next, a model in which a substantialportion of the glitch is resolved in time provides a better fit to
the data. We employed a more complex model previouslyinvoked for fitting two glitches from the Crab pulsar in whichthe rise in frequency is resolved (Lyne, Pritchard, & Graham-Smith 1993; Wong, Backer, & Lyne 2001). We model the fre-quency evolution as
� ¼ �0(t)þ�� þ��g(1� e�(t�tg)=�g )
���d(1� e�(t�tg)=�d )þ��t; ð2Þ
where �0(t) is the frequency evolution preglitch, �� is a in-stantaneous frequency jump, ��g is the resolved frequencyjump that grows exponentially on a timescale �g, ��d is thepostglitch frequency drop that decays exponentially on a time-scale �d , tg is the glitch epoch, and �� is the postglitch changein the long-term frequency derivative.
The full ensemble of phases was fitted to the model aboveusing a Levenberg-Marquardt least squares–fitting routine.The fit improved significantly over the simple jump in fre-quency and partial exponential recovery (�2 ¼ 131 for 53 dof ).Because of the strong correlation between the amplitudes of thetwo exponential factors (��g and ��d) and similar associatedtimescales, our fit was mildly nonconvergent. For this reason,we can quote only lower limits for each amplitude. Fixingeither one of the exponential amplitudes to a value above itslower limit allows the fit to converge. The key parameter is thedifference between the two amplitudes, which determines thepeak frequency following the glitch. The best-fit parame-ters for this fit (including the relationship between ��g and��d) are given in Table 4. The variance of the timescales (�gand �d) is far less than the amplitudes. We quote the for-mal errors for these timescales by using a fixed ��g ¼2:3 ; 10�6 Hz. However, fixing ��g to the minimum allowedvalue yields significantly different timescales [�g ¼ 12:8 (7)days and �d ¼ 17:4 (6) days]. Going to higher values for ��g
Fig. 6.—Top: Frequency evolution of 1E 2259+586 around the time of theoutburst for a simple exponential recovery model. See text for details. The linerepresents the best-fit model. The circles denote frequency measurements forindependent subsets of data. Middle: Frequency residuals of the independentfrequency points minus the model. Bottom: Phase residuals with respect to thebest-fit model. Clearly, there is a systematic trend in the postglitch residualsreflecting the inadequacy of this model.
X-RAY EMISSION FROM 1E 2259+586 385No. 1, 2004

(and correspondingly ��d) does not change the timescalessignificantly.
The frequency evolution of 1E 2259+586 just before andfollowing the outburst as determined by our fit is shown inFigure 7. The preoutburst ephemeris is fully consistent withthe ephemeris determined through earlier monitoring of thispulsar (Gavriil & Kaspi 2002). The glitch epoch (tg) precedesthe PCA observation containing the burst activity by 12:5 �2:1 hr. Note that the glitch epoch precedes the observed burstactivity whether the exponential growth term is included in thefit or not (it is 4.7 � in the case with no growth term). Theexponential growth term clearly improves the fit to the fulldata set; however, there is a systematic trend in the phaseresidual cluster just postglitch. This is discussed in detailbelow. Including the growth term significantly reduces thetimescale of the exponential decay term to �16 days. Finally,the long-term postglitch spin-down rate decreases signifi-cantly in magnitude (8 �) for both models.
The parameters in Table 4 show that the glitch consisted of atotal fractional frequency increase ��max=� ¼ (4:24 � 0:11) ;10�6, where ��max is the maximum upward excursion in fre-quency relative to the preglitch ephemeris. Of this frequencyjump, a fraction Q � (��max ��� ���g þ��d)=��max ¼0:185 � 0:010 was recovered within 2 months following theglitch.
We note that a decrease in the magnitude of the spin-downrate would be unique among all known pulsar and AXP glitches(Shemar & Lyne 1996; Kaspi &Gavriil 2003). This is discussedmore in x 4.2.5. Alternatively, some radio pulsars have shown along-term exponential rise in frequency postglitch. However,our best fit to this model was excluded by the frequency data.
The exponential rise term in this frequency model is clearlyfavored by the data; however, several important caveats mustbe stated. The exponential form was chosen because of itssuccess in modeling radio pulsar glitches (Lyne et al. 1993).However, for the 19 days following the glitch, there is a sig-nificant deviation from this model that constitutes a largeportion of the remaining �2 in the fit. During this 19 dayinterval, the best-fit model predicts rapid spin-up for the first�10 days, after which the frequency derivative again becomesnegative. If we fit only the data from the 12 days following theglitch, we measure a frequency derivative of � 1:0 � 0:3ð Þ ;
10�13 Hz s�1, whereas the model predicts an average fre-quency derivative of 5 ; 10�14 Hz s�1. Summing the fre-quency derivative measurement error and the model error inquadrature, we find that the two values differ at the �5 �level. Hence, there is no direct proof that there was significantspin-up during the first 12 days following the glitch. Note alsothat the frequency derivative measurement is at only the 3 �level, so some spin-up cannot be completely ruled out. An-other caveat when we consider the exponential rise in fre-quency is that the pulse profile was undergoing large changesduring this same time interval (see x 3.4), thus compromisingour ability to phase align with our template pulse profile. Inparticular, if the pulse profile was shifting in phase in a smoothmanner as it changed shape, then this shift in phase wouldmanifest itself as an apparent change in frequency. It is notlikely that the deviation from a pure exponential recovery canbe attributed entirely to a systematic shift in the pulse profile,as that would require a large drift of �0.35 cycles within the2 weeks following the glitch. Furthermore, even if we excludefrom our fit the data in which the pulse profile changes werelargest, the growth term still significantly improves the fit overthe simple exponential recovery (��2 ¼ 136 for 2 fewer dof ).We conclude from our analysis that there is a significant de-viation from a simple exponential recovery; however, due togaps in the data coverage (in particular from 19 to 60 daysafter the glitch) and the inherent pulse profile changes, wecould not precisely identify the manner in which the frequencyevolution deviated.
3.2. Pulsed-Flux History
Coincident with the burst activity on 2002 June 18 was asudden increase in the pulsed flux from 1E 2259+586 (Kaspiet al. 2003). The pulsed intensity of the AXP decreased through
TABLE 4
Spin Parameters for 1E 2259+586 from 3.2 yr of Phase-CoherentTiming Using RXTE PCA Data
Parameter Value
Spin frequency, �a........................................ 0.14328703257 (21) Hz
Spin frequency derivative, � ....................... �9:920 (6) ; 10�15 Hz s�1
Epoch ........................................................... 52,400.0000 MJD TDB
�� ................................................................ 5:25 (12) ; 10�7 Hz
��gb ............................................................. >8:7 ; 10�7 Hz
�g .................................................................. 14.1 (7)
��d .............................................................. ��g þ �5 ; 10�9ð Þ Hz�d .................................................................. 15.9 (6) days
�� ................................................................ +2:18 (25) ; 10�16 Hz s�1
tg ................................................................... 52,443.13 (9) MJD TDB
rms timing residual ...................................... 44.9 ms
Start observing epoch .................................. 51,613 MJD
End observing epoch ................................... 52,900 MJD
a Numbers in parentheses represent 1 � uncertainties in the least significantdigits quoted.
b Lower limit given at 90% confidence.
Fig. 7.—Top: Frequency evolution of 1E 2259+586 around the time of theoutburst for a model including an exponential rise and fall in frequencypostglitch. See text for details. The line represents the best-fit model (see Table 4for model parameters). The circles denote frequency measurements for inde-pendent subsets of data. The effect of the glitch is obvious, as is the partialrecovery. Middle: Frequency residuals of the independent frequency pointsminus the model. Bottom: Phase residuals with respect to the best-fit model.Closer inspection of the residual cluster just following the outburst epochreveals a low-amplitude systematic trend. This is discussed further in the text.
WOODS ET AL.386 Vol. 605

the burst observation as did the burst rate, thereby confirmingthe AXP as the origin of the burst emission. Here we put thepulsed-flux enhancement in context with the long-term pulsed-flux history and track the recovery back toward the preoutburstlevel.
Using the ephemeris determined in the last section, pulseprofiles of the PCA data (2–10 keV) from 2000 Marchthrough 2003 June were constructed. The pulse profiles weregenerated for each pointing at times before and up to 1 yearfollowing the outburst. For the 2002 June 18 observation, thebursts were removed, and the data were split into �200 ssegments before folding. Between 1 and 19 days after theoutburst, the data were grouped by spacecraft orbit (�3 ks).Once the pulse profiles were constructed, the pulsed intensitywas measured by first decomposing each pulse profile in termsof its Fourier powers. The power in the first seven harmonicswas summed to give the rms pulsed intensity (see eq. [1]).The pulsed-flux history of 1E 2259+586 is shown in Figure 8.The large spike indicates the time of the outburst. Note that thepulsed flux has not yet returned to the preoutburst level. Thetimescale and functional form of the recovery are studied inmore detail in x 3.6.
3.3. Pulsed Fraction
The PCA is a sensitive X-ray detector with a wide FOV andno imaging capabilities (for a fixed pointing). Because of thedesign of the instrument, it is not possible to reliably measurethe pulsed fraction and/or spectrum of weak X-ray sourcessuch as 1E 2259+586 on account of uncertainties in the back-ground, particularly in the direction of the Galactic plane.However, during episodes when the AXP flux increases sub-stantially, one can measure accurately the pulsed fraction andspectrum (see x 3.5) with the PCA under certain assumptions(Lenters et al. 2003).
The observed count rate in the PCA during pointings of 1E2259+586 consists of several components, namely, the centralsource, instrumental background, near-Earth background dueto precipitating particles, the ‘‘diffuse’’ cosmic background,the Galactic ridge, the bright SNR surrounding the AXP, and
other dim sources in the FOV. To disentangle the spectrum ofthe central source from all the other contributions to the netcount rate, the remaining components must somehow bemodeled. The instrumental and near-Earth background (i.e.,local background) can be subtracted using housekeeping dataand models provided by the RXTE team.11 Fortunately, theremaining components do not vary greatly on timescales ofmonths to years.
To estimate the count rate in the PCA of the remainingbackground components, we did the following. Using the lastPCA observation (2002 May 4) taken before the outburst, weselected counts in the range 2–10 keV from all PCUs otherthan PCU0 and subtracted the background as estimated usingthe FTOOL PCABACKEST with the combined model versionof 2003 March 30. Note that PCU0 was excluded because ofthe loss of the propane layer and the resulting large increase inthe magnitude and variance of the background rate. Next, wemeasured the pulsed count rate (per PCU) during this obser-vation. Assuming that the 2–10 keV pulse fraction measuredduring the XMM-Newton observation from 2002 June 11(Table 2) was the same on 2002 May 4, we determined thebackground rate in the PCA. We use this ‘‘cosmic’’ back-ground rate for all observations during and following theoutburst for which we measure the pulsed fraction. In usingthis count rate for our background, we assume that (1) theAXP pulse fraction was the same on 2002 May 4 as it was on2002 June 11 and (2) the cosmic background remained con-stant from 2002 May 4 until 2002 July 6 (the time of the lastpulsed-fraction measurement reported here).
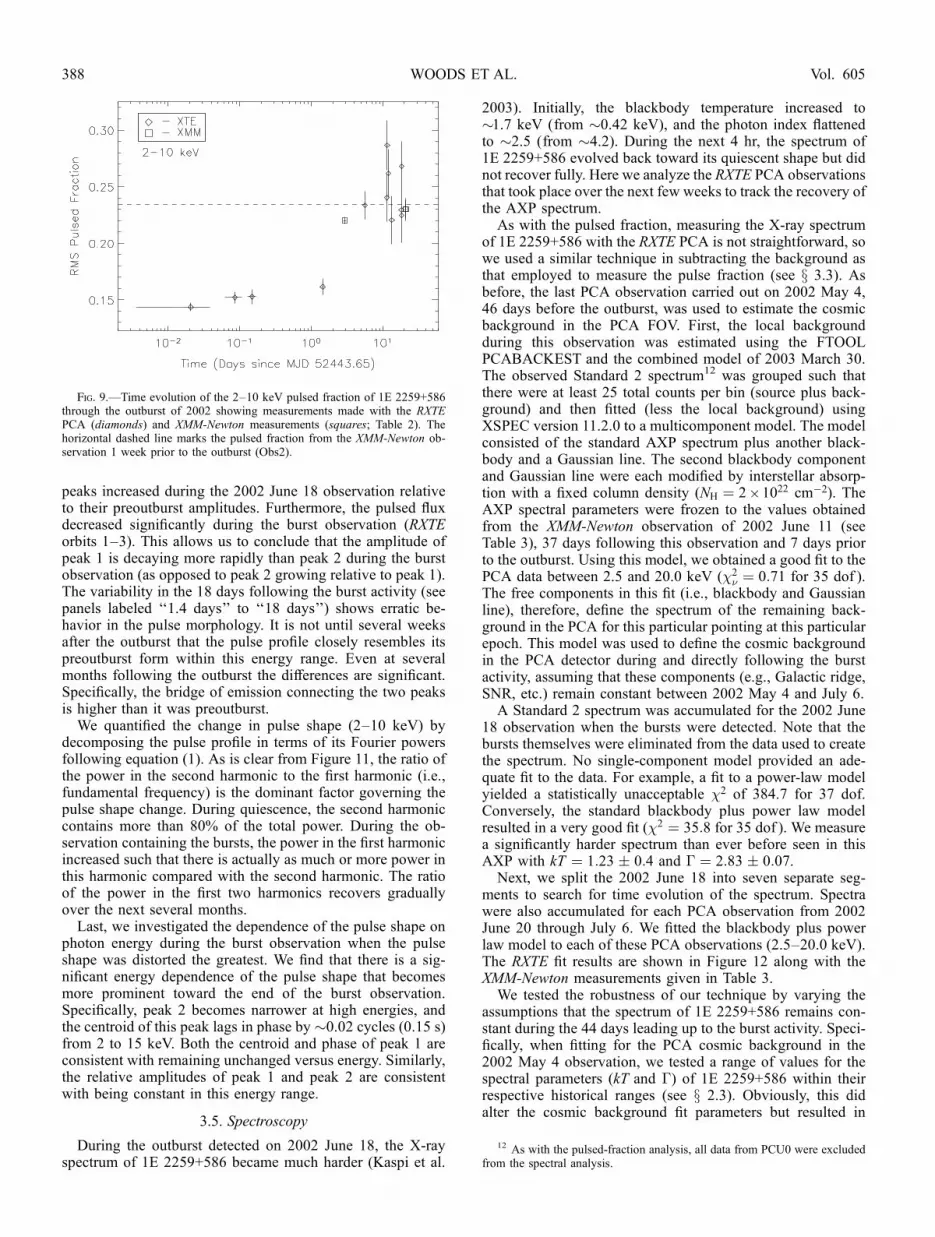
Using this technique, we determined that the pulsed fractionof 1E 2259+586 decreased relative to the preoutburst level,while the source was burst active (Kaspi et al. 2003). Here wehave extended this analysis to later PCA observations through2002 July 6. As with the XMM-Newton data, we measured thepulsed fraction by subtracting the background and decom-posing the folded pulse profile in terms of its Fourier powers.The rms pulsed fraction was determined from the sum of thefirst seven harmonics by using the formalism described inx 2.2. The RXTE PCA pulsed-fraction measurements areplotted, along with the XMM-Newton measurements (Table 2)in Figure 9. We found that the 2–10 keV pulsed fraction de-creased initially to a level of �15% at which it remained for atleast 1 day before rapidly returning to the preoutburst valuewithin �6 days of the outburst.
3.4. Pulse Profile
Coincident with the detected burst activity in the PCA from1E 2259+586 was a sudden change in the folded pulse profile(Kaspi et al. 2003). In the energy range 2–5 keV, the relativeamplitudes of the two peaks were switched while the sourcewas burst active. In this energy range, the pulse profile re-turned to near its preoutburst form within �6 days. Nochanges like this have been seen in more than 6 years ofmonthly monitoring with the PCA (Gavriil & Kaspi 2002),although similar changes have been noted prior to the PCAmonitoring (Iwasawa, Koyama, & Halpern 1992). Here weinvestigate further the pulse profile evolution over a longertime baseline and as a function of energy.
The temporal evolution of the folded pulse profile of 1E2259+586 from 2–10 keV is shown in Figure 10. From thepulsed-flux analysis, we know that the amplitudes of both
Fig. 8.—Pulsed-flux history of 1E 2259+586 (2–10 keV) from 2000 Marchthrough 2003 June as measured using the RXTE PCA. The sharp rise in thepulsed intensity coincides with the burst activity.
11 See ftp://legacy.gsfc.nasa.gov/xte/calib_data/pca_bkgd.
X-RAY EMISSION FROM 1E 2259+586 387No. 1, 2004
peaks increased during the 2002 June 18 observation relativeto their preoutburst amplitudes. Furthermore, the pulsed fluxdecreased significantly during the burst observation (RXTEorbits 1–3). This allows us to conclude that the amplitude ofpeak 1 is decaying more rapidly than peak 2 during the burstobservation (as opposed to peak 2 growing relative to peak 1).The variability in the 18 days following the burst activity (seepanels labeled ‘‘1.4 days’’ to ‘‘18 days’’) shows erratic be-havior in the pulse morphology. It is not until several weeksafter the outburst that the pulse profile closely resembles itspreoutburst form within this energy range. Even at severalmonths following the outburst the differences are significant.Specifically, the bridge of emission connecting the two peaksis higher than it was preoutburst.
We quantified the change in pulse shape (2–10 keV) bydecomposing the pulse profile in terms of its Fourier powersfollowing equation (1). As is clear from Figure 11, the ratio ofthe power in the second harmonic to the first harmonic (i.e.,fundamental frequency) is the dominant factor governing thepulse shape change. During quiescence, the second harmoniccontains more than 80% of the total power. During the ob-servation containing the bursts, the power in the first harmonicincreased such that there is actually as much or more power inthis harmonic compared with the second harmonic. The ratioof the power in the first two harmonics recovers graduallyover the next several months.
Last, we investigated the dependence of the pulse shape onphoton energy during the burst observation when the pulseshape was distorted the greatest. We find that there is a sig-nificant energy dependence of the pulse shape that becomesmore prominent toward the end of the burst observation.Specifically, peak 2 becomes narrower at high energies, andthe centroid of this peak lags in phase by �0.02 cycles (0.15 s)from 2 to 15 keV. Both the centroid and phase of peak 1 areconsistent with remaining unchanged versus energy. Similarly,the relative amplitudes of peak 1 and peak 2 are consistentwith being constant in this energy range.
3.5. Spectroscopy
During the outburst detected on 2002 June 18, the X-rayspectrum of 1E 2259+586 became much harder (Kaspi et al.
2003). Initially, the blackbody temperature increased to�1.7 keV (from �0.42 keV), and the photon index flattenedto �2.5 (from �4.2). During the next 4 hr, the spectrum of1E 2259+586 evolved back toward its quiescent shape but didnot recover fully. Here we analyze the RXTE PCA observationsthat took place over the next few weeks to track the recovery ofthe AXP spectrum.As with the pulsed fraction, measuring the X-ray spectrum
of 1E 2259+586 with the RXTE PCA is not straightforward, sowe used a similar technique in subtracting the background asthat employed to measure the pulse fraction (see x 3.3). Asbefore, the last PCA observation carried out on 2002 May 4,46 days before the outburst, was used to estimate the cosmicbackground in the PCA FOV. First, the local backgroundduring this observation was estimated using the FTOOLPCABACKEST and the combined model of 2003 March 30.The observed Standard 2 spectrum12 was grouped such thatthere were at least 25 total counts per bin (source plus back-ground) and then fitted (less the local background) usingXSPEC version 11.2.0 to a multicomponent model. The modelconsisted of the standard AXP spectrum plus another black-body and a Gaussian line. The second blackbody componentand Gaussian line were each modified by interstellar absorp-tion with a fixed column density (NH ¼ 2 ; 1022 cm�2). TheAXP spectral parameters were frozen to the values obtainedfrom the XMM-Newton observation of 2002 June 11 (seeTable 3), 37 days following this observation and 7 days priorto the outburst. Using this model, we obtained a good fit to thePCA data between 2.5 and 20.0 keV (�2
� ¼ 0:71 for 35 dof ).The free components in this fit (i.e., blackbody and Gaussianline), therefore, define the spectrum of the remaining back-ground in the PCA for this particular pointing at this particularepoch. This model was used to define the cosmic backgroundin the PCA detector during and directly following the burstactivity, assuming that these components (e.g., Galactic ridge,SNR, etc.) remain constant between 2002 May 4 and July 6.A Standard 2 spectrum was accumulated for the 2002 June
18 observation when the bursts were detected. Note that thebursts themselves were eliminated from the data used to createthe spectrum. No single-component model provided an ade-quate fit to the data. For example, a fit to a power-law modelyielded a statistically unacceptable �2 of 384.7 for 37 dof.Conversely, the standard blackbody plus power law modelresulted in a very good fit (�2 ¼ 35:8 for 35 dof ). We measurea significantly harder spectrum than ever before seen in thisAXP with kT ¼ 1:23 � 0:4 and � ¼ 2:83 � 0:07.Next, we split the 2002 June 18 into seven separate seg-
ments to search for time evolution of the spectrum. Spectrawere also accumulated for each PCA observation from 2002June 20 through July 6. We fitted the blackbody plus powerlaw model to each of these PCA observations (2.5–20.0 keV).The RXTE fit results are shown in Figure 12 along with theXMM-Newton measurements given in Table 3.We tested the robustness of our technique by varying the
assumptions that the spectrum of 1E 2259+586 remains con-stant during the 44 days leading up to the burst activity. Speci-fically, when fitting for the PCA cosmic background in the2002 May 4 observation, we tested a range of values for thespectral parameters (kT and �) of 1E 2259+586 within theirrespective historical ranges (see x 2.3). Obviously, this didalter the cosmic background fit parameters but resulted in
Fig. 9.—Time evolution of the 2–10 keV pulsed fraction of 1E 2259+586through the outburst of 2002 showing measurements made with the RXTEPCA (diamonds) and XMM-Newton measurements (squares; Table 2). Thehorizontal dashed line marks the pulsed fraction from the XMM-Newton ob-servation 1 week prior to the outburst (Obs2).
12 As with the pulsed-fraction analysis, all data from PCU0 were excludedfrom the spectral analysis.
WOODS ET AL.388 Vol. 605

only insignificant changes (P1%) to the measured spectralparameters of the AXP for the 2002 June 18 observation. Forthe final PCA observation fit in this analysis for which theAXP was dimmest (2002 July 6), the relative change in theseparameters is larger (�5%) but is still less than 1 �.
The unabsorbed flux decayed rapidly within the first day ofthe outburst. The functional form of the decay depends criti-cally on the reference epoch chosen. Both power-law and ex-ponential decay models yield acceptable fits to the data. At 20days following the outburst, the AXP is still a factor of �2brighter than its nominal (quiescent) flux level. The flux decayis covered in greater detail in the next section. The remainingspectral parameters shown here recover to within 25% of theirpreburst levels within the first �1–3 days. By using thepulsed-flux history as an indicator for the recovery timescale, afull recovery of the spectral parameters would not be expecteduntil �1 yr later. However, variation in these spectral parametersat the �25% level has been seen outside burst activity (seex 2.3); thus, these parameters may not decay further.
It is interesting to note that the X-ray spectrum of 1E2259+586 was harder when the spin-down rate was higher
during the first month following the glitch. This behavior in1E 2259+586 is qualitatively consistent with the spectralhardness versus spin-down rate correlation found by Marsden& White (2001), who considered the AXPs and SGRs as awhole. This suggests that individual members of this class thathave shown significant variability in spin-down rate may alsoshow correlated spectral variations.
We note that the later RXTE PCA spectral measurements(>1 day) agree reasonably well with the XMM-Newton mea-surements contained within this interval; however, they aresystematically offset from one another. This could be due tosystematic effects in our background subtraction method, adeviation in the power-law spectral model at high energiesat which the two instrumental responses do not overlap(12–20 keV), and/or a systematic offset in the cross-calibration between the XMM-Newton pn and the RXTE PCA.
3.6. Flux Decay and Energetics
To better quantify the flux decay of 1E 2259+586 fol-lowing the outburst of 2002 June, we combined the XMM-Newton flux measurements with our RXTE PCA pulsed-flux
Fig. 10.—Time evolution of the 2–10 keV pulse profile of 1E 2259+586 through the outburst of 2002. Profiles have arbitrary flux units, and two pulse cycles areshown for clarity. Time increases from left to right and top to bottom.
X-RAY EMISSION FROM 1E 2259+586 389No. 1, 2004

measurements, which span a much broader temporal baseline.The advantage of using the PCA pulsed-flux measurements asopposed to the phase-averaged flux measurements is that thesystematic errors present in the background subtraction are nota concern.
The pulsed-flux measurements were converted to unab-sorbed phase-averaged fluxes in the following way. First, wedetermined a conversion factor between the two by calculatingthe ratio of the preoutburst unabsorbed flux measured withXMM-Newton to the average PCA pulsed flux for the yearleading up to the outburst. Assuming that the pulsed fractionand spectrum do not change, this factor can be multiplied bysubsequent PCA pulsed-flux values to estimate the unab-sorbed phase-averaged flux at those times. However, we knowthat both the pulsed fraction and the energy spectrum changedduring this outburst. We corrected for the brief period duringwhich the pulsed fraction decreased by multiplying by anadditional factor of the ratio of the nominal pulsed fraction tothe observed pulsed fraction at those times. This factor wasapplied only to the PCA pulsed-flux measurements within thefirst 2 days following the burst activity during which thefraction dropped from 23% to �15%. Computing this con-version factor for a broad energy range (2–10 keV) reduces
the effects of spectral changes. In fact, when we applied ourpulsed flux–to–unabsorbed phase-averaged flux conversionfactor to the data for which we have independent unabsorbedflux measurements at early times in the outburst (<20 daysafter burst activity), the agreement between the two mea-surements was found to be quite good (Fig. 13). Since thespectral differences are greatest at these times in the outburst,we feel that this technique is a robust one for constructing along-term light curve for the source.In this way, we have taken the pulsed-flux measurements
presented in Figure 8 and converted them to phase-averagedunabsorbed flux values. These data are plotted relative to theglitch epoch (Table 4) in Figure 13 in addition to the threeXMM-Newton flux measurements. Clearly, the flux decay isnot well described by a single-component model (e.g., expo-nential or power law). The temporal decay of the flux duringthe PCA observations containing the burst activity (<1 day) ismuch more rapid than the decay during the year following theburst activity. We split the data into two segments (<1 dayand >1 day after the glitch) and fitted each independently to apower-law model (F / t� ). The measured temporal decayindices for the two segments are�4:8 � 0:5 and�0:22 � 0:01,respectively.
Fig. 11.—Time evolution of the Fourier power harmonic distribution of the 2–10 keV pulse profile of 1E 2259+586 through the outburst of 2002. Power levelshave been normalized to the total power of the first seven harmonics. Time increases from left to right and top to bottom.
WOODS ET AL.390 Vol. 605

The RXTE All-Sky Monitor (ASM) observed 1E 2259+586at 0350 and 1443 UT on 2002 June 18, before the observedburst activity and following the measured glitch epoch, al-though the first observation is within the errors of the measuredglitch epoch. If we extrapolate the slower flux decay model(� ¼ �0:22) back to the time of the ASM observations, wefind that the expected flux values (14 and 8 ; 10�11 ergs cm�2
s�1, respectively) are comfortably below the 99% confidenceupper limit of 1 ; 10�9 ergs cm�2 s�1 (Kaspi et al. 2003); thus,the ASM limits are not constraining for this component. Forthe steeper component (� ¼ �4:8) containing the burst ac-tivity, we find that the expected flux at the time of the first ASMobservation is several orders of magnitude above the upperlimit. The second ASM observation (52,443.611 MJD TDB) isunconstraining. This suggests that the onset of burst activity(associated with the first decay component) must have comeafter the earlier ASM observation (52,443.158 MJD TDB) orthe flux enhancement deviated from this steep decay betweenthe glitch epoch and the RXTE PCA observations. One possi-bility is that the onset of this burst activity was delayed withrespect to the glitch epoch. In fact, a much later onset time forthe burst activity is inferred from the time evolution of the burstrecurrence frequency (Gavriil et al. 2003).
The absence of a fiducial point for the initial, rapid fluxdecay associated with the burst activity does not allow us to
accurately measure the temporal decay index of this compo-nent. Choosing a reference epoch just before the time of thefirst bursts detected with the PCA yields a decay index lessthan unity (in magnitude). Thus, we can only constrain theindex of the flux decay within the time span containing theburst activity to be less than 6.6 (in magnitude). Note that asthe reference epoch approaches the start of the burst obser-vation, the flux decay becomes steeper than a power law inform (e.g., exponential). This is discussed further in x 4.1.1.Unlike the early component, the temporal index of the moregradual flux decay in the months following the glitch(� ¼ �0:22) is insensitive to varying the reference epochbetween the time of the glitch and the beginning of the ob-served burst activity.
We next used these power-law fits for estimating the totalenergy released during this outburst. We integrated eachmodel, less the quiescent flux level (Fig. 13), only over thetime ranges during which we have flux measurements (i.e.,from the start time of the burst observation onward). In spiteof the large range of allowed temporal decay indices, theenergy we measure in the early flux decay component is welldetermined since we integrate the model only over the intervalfor which we have observations (i.e., we do not extrapolate themodel back toward the glitch epoch). Assuming a distance of3 kpc to 1E 2259+586 (Kothes, Uyaniker, & Aylin 2002), wemeasure an energy release (2–10 keV) of 2:7 ; 1039 and2:1 ; 1041 ergs for the fast and slow-decay intervals, respec-tively. In terms of the overall energy budget, the energy re-leased in the bursts themselves (6 ; 1037 ergs over 2–60 keV;Gavriil et al. 2003) is insignificant in comparison with theexcess persistent emission in X-rays released during the yearfollowing the outburst. Moreover, the excess persistent fluxemitted during the interval containing the burst activity isinsignificant in comparison with the total energy releasedduring the year-long flux decay.
Fig. 13.—Time evolution of the unabsorbed flux from 1E 2259+586 fol-lowing the 2002 June outburst. The glitch epoch (Table 4) is used as thereference time for this plot. Diamonds denote inferred unabsorbed flux valuescalculated from RXTE PCA pulsed-flux measurements. Asterisks and squaresmark independent phase-averaged unabsorbed flux values from RXTE andXMM-Newton, respectively. The dotted line denotes the flux level measuredusing XMM-Newton 1 week prior to the glitch. The dashed line is a power-lawfit to the PCA flux measurements during the observations containing the burstactivity (<1 day). The dot-dashed line marks the power-law fit to all data morethan 1 day following the glitch. See text for further details.
Fig. 12.—Spectral evolution of 1E 2259+586 through and following theoutburst of 2002. Top to bottom: Unabsorbed flux (2–10 keV), the blackbodytemperature (kT ), the photon index, the blackbody radius, and the ratio ofpower-law (2–10 keV) to bolometric blackbody flux. A distance of 3 kpc wasassumed (Kothes, Uyaniker, & Aylin 2002) to compute the blackbody radius.Horizontal dashed lines denote the values of each parameter during the XMM-Newton observation 1 week prior to the outburst.
X-RAY EMISSION FROM 1E 2259+586 391No. 1, 2004

4. DISCUSSION
Virtually all measurable X-ray properties of 1E 2259+586changed suddenly and dramatically during the 2002 Juneoutburst. Continued observations with RXTE and XMM-Newton have allowed us to track the recovery of several sourceparameters shown to change during this outburst (Kaspi et al.2003) and identify additional parameters that were similarlyaffected. Many of the observed variations resemble phenom-ena seen in other classes of neutron stars, namely, SGRs andradio pulsars. Here we compare the AXP outburst propertieswith similar phenomena seen in those source classes in thehope of identifying similarities and differences that can helpelucidate the physical properties of these different manifes-tations of young neutron stars. Specifically, we consider (1)the radiative properties of the persistent and pulsed emissionduring and following the outburst and compare these withthose seen in SGRs, since that is the only other source classfor which such outbursts have been seen, and (2) the rotationalbehavior of the pulsar and compare it with behavior seen inradio pulsars, as well as in SGRs, and in another AXP, 1RXSJ1708�4009. Finally, we point out that the detection of low-intensity outbursts in AXPs has important implications for ourestimates of the number of active magnetar candidates in ourGalaxy. The 1E 2259+586 burst properties and their relationto SGR burst properties are considered separately (Gavriilet al. 2003)
4.1. Transient X-Ray Emission and Pulse Properties
We have shown that there are two components to the fluxdecay in 1E 2259+586 during the 2002 June outburst. There isa rapid decay of the flux during the observations containing theburst activity, and then there is a more gradual flux decay seenin the year following the glitch. During the initial flux decay,the spectrum was considerably harder than at all other times,while the spectral hardness at times greater than 1 day after theglitch is consistent with preglitch spectral measurements. Thespectral differences in the two decay components (total energy,blackbody radius, etc.) point toward separate physical mech-anisms for the two flux enhancements (see Figs. 9 and 12).
Coincident with the glitch and burst activity was a dramaticchange in the pulse profile of 1E 2259+586. The majority ofthe observed shape change recovered within�6 days, but therewas still some residual change that slowly decayed over themonths following the outburst (x 3.4). The 2–10 keV pulsedfraction dropped to �15% during the observed burst activityand quickly recovered to the preoutburst level of 23.4% within�6 days (x 3.3). Here we compare the observed properties ofthe flux enhancement and pulse properties in 1E 2259+586with qualitatively similar behavior detected in SGRs andbriefly discuss how the changes seen in 1E 2259+586 can beaccommodated within the magnetar model.
4.1.1. Comparison with SGR Outbursts: X-Ray Flux and Spectrum
The richest SGR database with which to make an empiricalcomparison with the 1E 2259+586 outburst comes from themost active SGR during the last 6 years, SGR 1900+14. ThisSGR has been observed on 14 separate occasions since 1997by imaging X-ray telescopes and more than 100 times withRXTE. Within this time span, SGR 1900+14 entered severalburst-active episodes; the most notable of which was theoutburst that began on 1998 August 27 with a giant flarehaving a total energy �1044 ergs (e.g., Feroci et al. 2001).Coincident with this giant flare was a large increase in the
persistent and pulsed flux from the source (e.g., Woods et al.2001), in addition to a dramatic change in the pulse profile anda timing anomaly (see x 4.2.3).A spectral analysis of the RXTE PCA observation of SGR
1900+14 1 day following the giant flare shows that the black-body temperature was higher than the nominal temperature(�0.5 keV) at 0.94 keV (Woods 2003). Two other high-fluence bursts from SGR 1900+14 have extended X-ray tailsor afterglows that show enhanced thermal emission at timesreaching up to 4 keV (Ibrahim et al. 2001; Lenters et al. 2003).The thermal component of 1E 2259+586 shows a similarbrightening and temporal decay. Here the temperature rosefrom 0.4 up to 1.7 keV at the onset of the outburst beforequickly decaying to 0.5 keV within the first few days. Ac-companying the temperature increase in 1E 2259+586 was asignificant hardening of the photon index. This is differentfrom what has been seen in SGR 1900+14, where there hasbeen either no change in photon index after some bursts(Lenters et al. 2003) or even a slight softening of the non-thermal component of the spectrum (Woods 2003).An analysis of four separate bursts or flares from SGR
1900+14 and their associated afterglows (Lenters et al. 2003)shows that the emitted energy within the afterglow (2–10 keV)corresponds to roughly 2% of the burst energy (25–100 keV).Because of the bandpass of the PCA, we have been able tomeasure the burst energy only within the 2–60 keV range(Gavriil et al. 2003). However, we can estimate the burst en-ergy (25–100 keV) during the 2002 June outburst by takingthe measured count fluence with the PCA (Gavriil et al. 2003)and multiplying by the counts-to-energy conversion factordetermined for SGR 1900+14 (GoguY et al. 1999). This con-version factor was used because the mean burst spectralhardness in the PCA was similar for 1E 2259+586 (Gavriilet al. 2003) and SGR 1900+14 (GoguY et al. 2001). The totalenergy was further modified by a factor-of-2 increase toroughly compensate for gaps in the data due to Earth occul-tation during the PCA pointing. Assuming that the energyspectra of the 1E 2259+586 bursts above 60 keV is similar toSGR 1900+14, we estimated the burst energy released by 1E2259+586 to be �1 ; 1038 ergs (25–100 keV). The brighten-ing of 1E 2259+586 during the 2002 June outburst containedtwo components: a rapid decay during the initial burst ob-servation followed by a more gradual flux decay in the yearfollowing the glitch. The energy released from 1E 2259+586within these two components is �30 and �2000 times greaterthan the burst energy (Table 5), in stark contrast with the valueof 0.02 found for SGR 1900+14. In fact, for a 2% after-glow-to-burst energy ratio, we can rule out the presence of anintermediate burst from 1E 2259+586 preceding the 2002 June18 PCA observation. Assuming that only the hard componentof the decay constituted the burst afterglow, the energy of thehypothetical burst powering this afterglow must be 1:5 ;1041 ergs (equivalent fluence of 1:4 ; 10�4 ergs cm�2). TheKonus detector aboard the Wind spacecraft located at the L1point between Earth and the Sun maintained continuouscoverage of 1E 2259+586 from the time of the glitch throughthe first PCA observation and did not detect any emissionfrom the AXP (S. Golenetskii 2003, private communication).The upper limits on the burst fluence (17–70 keV) derivedfrom the Konus data are 1:7 ; 10�7 ergs cm�2 for bursts ofduration less than 3 s and 1:7 ; 10�7(�t=3 s)1=2 ergs cm�2,where �t is the burst duration, for bursts lasting between 3and �1000 s. Clearly, the putative burst with fluence 1:4 ;10�4 ergs cm�2 can be excluded for durations less than �1000 s.
WOODS ET AL.392 Vol. 605
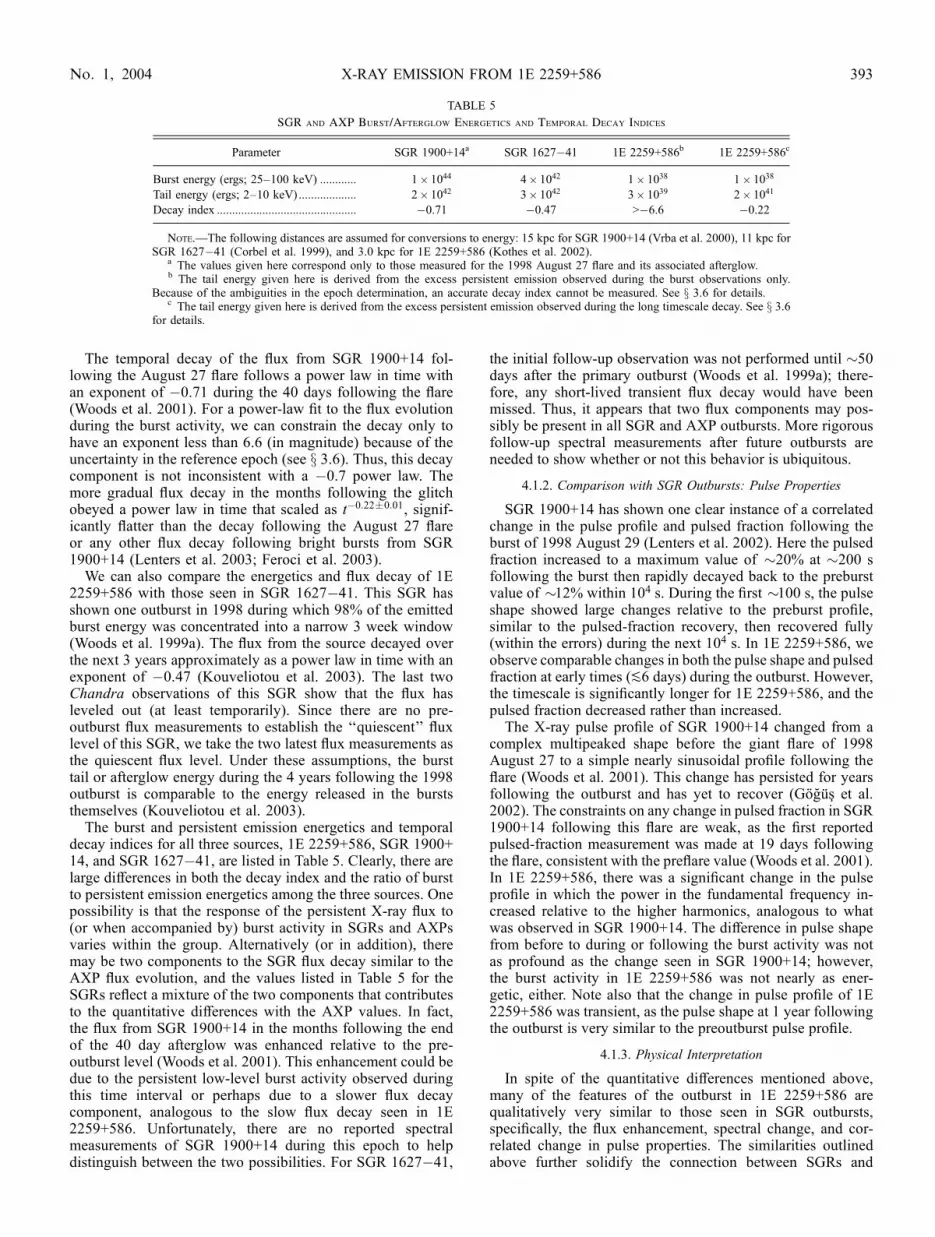
The temporal decay of the flux from SGR 1900+14 fol-lowing the August 27 flare follows a power law in time withan exponent of �0.71 during the 40 days following the flare(Woods et al. 2001). For a power-law fit to the flux evolutionduring the burst activity, we can constrain the decay only tohave an exponent less than 6.6 (in magnitude) because of theuncertainty in the reference epoch (see x 3.6). Thus, this decaycomponent is not inconsistent with a �0.7 power law. Themore gradual flux decay in the months following the glitchobeyed a power law in time that scaled as t�0:22�0:01, signif-icantly flatter than the decay following the August 27 flareor any other flux decay following bright bursts from SGR1900+14 (Lenters et al. 2003; Feroci et al. 2003).
We can also compare the energetics and flux decay of 1E2259+586 with those seen in SGR 1627�41. This SGR hasshown one outburst in 1998 during which 98% of the emittedburst energy was concentrated into a narrow 3 week window(Woods et al. 1999a). The flux from the source decayed overthe next 3 years approximately as a power law in time with anexponent of �0.47 (Kouveliotou et al. 2003). The last twoChandra observations of this SGR show that the flux hasleveled out (at least temporarily). Since there are no pre-outburst flux measurements to establish the ‘‘quiescent’’ fluxlevel of this SGR, we take the two latest flux measurements asthe quiescent flux level. Under these assumptions, the bursttail or afterglow energy during the 4 years following the 1998outburst is comparable to the energy released in the burststhemselves (Kouveliotou et al. 2003).
The burst and persistent emission energetics and temporaldecay indices for all three sources, 1E 2259+586, SGR 1900+14, and SGR 1627�41, are listed in Table 5. Clearly, there arelarge differences in both the decay index and the ratio of burstto persistent emission energetics among the three sources. Onepossibility is that the response of the persistent X-ray flux to(or when accompanied by) burst activity in SGRs and AXPsvaries within the group. Alternatively (or in addition), theremay be two components to the SGR flux decay similar to theAXP flux evolution, and the values listed in Table 5 for theSGRs reflect a mixture of the two components that contributesto the quantitative differences with the AXP values. In fact,the flux from SGR 1900+14 in the months following the endof the 40 day afterglow was enhanced relative to the pre-outburst level (Woods et al. 2001). This enhancement could bedue to the persistent low-level burst activity observed duringthis time interval or perhaps due to a slower flux decaycomponent, analogous to the slow flux decay seen in 1E2259+586. Unfortunately, there are no reported spectralmeasurements of SGR 1900+14 during this epoch to helpdistinguish between the two possibilities. For SGR 1627�41,
the initial follow-up observation was not performed until �50days after the primary outburst (Woods et al. 1999a); there-fore, any short-lived transient flux decay would have beenmissed. Thus, it appears that two flux components may pos-sibly be present in all SGR and AXP outbursts. More rigorousfollow-up spectral measurements after future outbursts areneeded to show whether or not this behavior is ubiquitous.
4.1.2. Comparison with SGR Outbursts: Pulse Properties
SGR 1900+14 has shown one clear instance of a correlatedchange in the pulse profile and pulsed fraction following theburst of 1998 August 29 (Lenters et al. 2002). Here the pulsedfraction increased to a maximum value of �20% at �200 sfollowing the burst then rapidly decayed back to the preburstvalue of �12% within 104 s. During the first �100 s, the pulseshape showed large changes relative to the preburst profile,similar to the pulsed-fraction recovery, then recovered fully(within the errors) during the next 104 s. In 1E 2259+586, weobserve comparable changes in both the pulse shape and pulsedfraction at early times (P6 days) during the outburst. However,the timescale is significantly longer for 1E 2259+586, and thepulsed fraction decreased rather than increased.
The X-ray pulse profile of SGR 1900+14 changed from acomplex multipeaked shape before the giant flare of 1998August 27 to a simple nearly sinusoidal profile following theflare (Woods et al. 2001). This change has persisted for yearsfollowing the outburst and has yet to recover (GoguY et al.2002). The constraints on any change in pulsed fraction in SGR1900+14 following this flare are weak, as the first reportedpulsed-fraction measurement was made at 19 days followingthe flare, consistent with the preflare value (Woods et al. 2001).In 1E 2259+586, there was a significant change in the pulseprofile in which the power in the fundamental frequency in-creased relative to the higher harmonics, analogous to whatwas observed in SGR 1900+14. The difference in pulse shapefrom before to during or following the burst activity was notas profound as the change seen in SGR 1900+14; however,the burst activity in 1E 2259+586 was not nearly as ener-getic, either. Note also that the change in pulse profile of 1E2259+586 was transient, as the pulse shape at 1 year followingthe outburst is very similar to the preoutburst pulse profile.
4.1.3. Physical Interpretation
In spite of the quantitative differences mentioned above,many of the features of the outburst in 1E 2259+586 arequalitatively very similar to those seen in SGR outbursts,specifically, the flux enhancement, spectral change, and cor-related change in pulse properties. The similarities outlinedabove further solidify the connection between SGRs and
TABLE 5
SGR and AXP Burst/Afterglow Energetics and Temporal Decay Indices
Parameter SGR 1900+14a SGR 1627�41 1E 2259+586b 1E 2259+586c
Burst energy (ergs; 25–100 keV) ............ 1 ; 1044 4 ; 1042 1 ; 1038 1 ; 1038
Tail energy (ergs; 2–10 keV) ................... 2 ; 1042 3 ; 1042 3 ; 1039 2 ; 1041
Decay index .............................................. �0.71 �0.47 >�6.6 �0.22
Note.—The following distances are assumed for conversions to energy: 15 kpc for SGR 1900+14 (Vrba et al. 2000), 11 kpc forSGR 1627�41 (Corbel et al. 1999), and 3.0 kpc for 1E 2259+586 (Kothes et al. 2002).
a The values given here correspond only to those measured for the 1998 August 27 flare and its associated afterglow.b The tail energy given here is derived from the excess persistent emission observed during the burst observations only.
Because of the ambiguities in the epoch determination, an accurate decay index cannot be measured. See x 3.6 for details.c The tail energy given here is derived from the excess persistent emission observed during the long timescale decay. See x 3.6
for details.
X-RAY EMISSION FROM 1E 2259+586 393No. 1, 2004

AXPs. Combined with the similar burst characteristics (Gavriilet al. 2003), this outburst in 1E 2259+586 shows beyond anyreasonable doubt that SGRs and AXPs are of the same nature,as predicted uniquely by the magnetar model.
During the rapid initial flux decay, the blackbody radiuswas smaller (�1 km) than at all other times, and the tem-perature was higher (0.8–1.7 keV). The thermal component ofthe spectrum suggests the existence of a hot spot that either iscooling through its surface or is being heated by energeticparticles accelerated in the magnetosphere. A localized hotspot will clearly result in a change in the emitted radiationpattern (i.e., pulse profile) even if the pulse shape is stronglymodified by scattering in the magnetosphere (Thompson,Lyutikov, & Kulkarni 2002). The reduction in pulsed fractionsuggests that the heated region is offset in angle from thelocations on (or above) the stellar surface that give rise to thetwo pulse maxima.
These observations do not allow us to distinguish con-vincingly between magnetospheric emission and passive cool-ing of an impulsively heated crust as the underlying source ofthe transient X-ray emission. The rapid flux decay could havea very different time scaling from what is observed followingintermediate-energy bursts in SGR 1900+14, and any changein the magnetic field of 1E 2259+586 may have occurred toogradually to generate a bright X-ray outburst. A large currentdensity will be excited in the magnetosphere above regions ofstrong crustal shear, but the mechanism by which this current isdamped depends on how rapidly it is excited (Thompson &Duncan 2001). The rapid flux decay as measured is consistentwith a gradually diminishing creep within a small region ofthe crust over a period of �105 s.
It is also worth considering whether this part of the X-raytransient is the direct aftermath of a more energetic burst. Theshort-lived afterglows detected after SGR bursts of interme-diate energy have a simple explanation as the cooling of apair-rich surface layer heated by a high-energy burst (Ibrahimet al. 2001) and as such are valuable probes of the burstmechanism. As estimated above, the minimum energy of sucha burst is �3:0 ; 1041 (eag=10�2)�1 ergs, where eag is afterglowenergy divided by the burst energy. Konus data (S. Golenetskii2003, private communication) sets an upper bound of �2 ;1038 ergs for bursts with duration less than 3 s and �2 ;1038 (�t=3 s)1/2 ergs for bursts with duration 3 < �t < 1000 s.Therefore, a much higher afterglow efficiency is required for1E 2259+586 than is inferred for the intermediate and giantSGR 1900+14 flares.
Is there any evidence for such extended energy releaseduring SGR outbursts? SGR 1900+14 has, in fact, been ob-served to radiate the same energy over timescales rangingfrom �100 s in the declining tail of the August 27 flare (Ferociet al. 2001) down to �2 s in the August 29 burst that followedit. Thus, the putative burst from 1E 2259+586 would neces-sarily have a much longer duration than any (of an equivalentenergy) yet observed from an SGR. Although the magneto-spheric opacity scales as B�2 and is expected to be lower in 1E2259+586 than in the actively bursting SGRs, the luminosityof a passively cooling trapped fireball would almost certainlyexceed the bound derived from Konus (e.g., for B � BQED).
We now comment on the relative importance of crustalheating and enhanced magnetospheric emission for the slow-decay component of the outburst of 1E 2259+586. Bulkheating of the crust of a magnetar can power an excessheat flux from its surface for a year or longer and has been
proposed as the explanation for the quasi–power-law flux de-cay seen in SGR 1900+14 (Lyubarsky, Eichler, & Thompson2002) and SGR 1627�41 (Kouveliotou et al. 2003). In eachcase, an initial energy deposition of 1044 ergs was assumed.For SGR 1900+14, there was in fact a giant flare preceding theflux enhancement that emitted �1044 ergs in soft gamma-rays.For SGR 1627�41, the burst energy output was more than 1order of magnitude less, so it was suggested that the processthat generates the burst energy was much less efficient in thissource (Kouveliotou et al. 2003). As discussed previously, therelative energy released in burst and excess persistent emis-sion remains very uncertain in the case of 1E 2259+586. Still,the excess persistent energy output in the slow-decay com-ponent (2 ; 1041 ergs) was only a factor of 10 lower than theoutput from the two SGRs, yet there was not a single burstdetected with an isotropic luminosity above �1 ; 1039 ergs s�1
during this outburst. Thus, if we ascribe the slow flux decayseen in these three sources to deep heating of the crust of amagnetar, then it follows that 1E 2259+586 is almost certainlyless efficient in producing burst emission than either of theother two SGRs. Note also that the similarity in the timescalesfor the relaxation of the torque and the X-ray pulse profilemust be coincidental if the slow-decay component of theX-ray emission is powered by crustal cooling.A small twist of the stellar crust, as is hypothesized to
explain the glitch characteristics (x 4.2.4), will impart a twistin the field lines that are anchored to this patch of crust.This drives a current along these twisted field lines, whichultimately produces X-ray emission whose luminosity is pro-portional to the twist angle (Thompson et al. 2000, 2002).However, following a twisting motion of the crust and ex-ternal magnetic field through an angle , at most a fraction�0:03(=0:01)(max=10
�3)�1(Bdip=1014 G)2 of the energy re-
leased is stored in the external nonpotential magnetic field.(Here max is the maximum strain that the crust can sustainbefore yielding.) The majority of the energy is dissipatedthrough the deformation of the crust itself, because theshear modulus at the base of the crust corresponds to a muchstronger magnetic field, B ¼ (4�)1=2 ’ 6 ; 1015 G. Theamplitude of the required global twist (about �10�2 rad)will only slightly change the optical depth to resonant cyclo-tron scattering or change the external torque through a flaringout of the external dipole field (Thompson et al. 2002). Hence,this cannot explain the large shape changes seen in thepulse profile within the first week following the glitch. Itis possible, however, that the more subtle pulse profilechanges seen more than 1 week postglitch can be explained asa slight change in optical depth due to a twisting of (likelyextended) field lines. The torque is more sensitive to a currentlocalized on the most extended field lines, as is discussed inx 4.2.5.
4.2. Rotational Evolution
The timing data clearly show that a large spin-up glitchoccurred in 1E 2259+586 coincident with or perhaps shortlybefore the onset of burst activity. A portion of the frequencyjump (�20%) recovered in a quasi-exponential manner withinthe next �60 days. The long-term timing in the year followingthe glitch shows a significant reduction in the spin-down rateof this pulsar. Below, we draw comparisons between thecharacteristics of the 1E 2259+586 glitch and those of otherneutron stars and offer possible explanations for the observedbehavior in 1E 2259+586.
WOODS ET AL.394 Vol. 605

4.2.1. Comparison with Radio Pulsars: Overall Energetics
A conservative bound on the change in rotational energy isobtained by treating the star as a rotating solid body. For a starhaving moment of inertia I ¼ 1045 g cm2, one infers a changein the rotational energy of 3 ; 1039 ergs, some 2 orders ofmagnitude smaller than the integrated excess X-ray emission.If the glitch involves an exchange of angular momentum be-tween a superfluid with moment of inertia Isf , and the crust ofthe star with moment of inertia Ic, then the release of rotationalenergy is �Eg � (2�)2Ic��(�sf � �c), where �sf � �c is theequilibrium lag between the rotation frequency of the super-fluid and crust. Evaluating this lag by using the observed�15� d postglitch relaxation time, one finds a value for �Egthat is smaller by a factor of 10�3(Isf=0:02I )
�1. Thus, therotation of the star is manifestly not the source of energy forthe transient X-ray emission.
The relaxation of elastic strains in the stellar crust is anotherpossible source of energy. The magnitude of these strainscould easily exceed the equilibrium rotational bulge ofthe star, (Reqtr � Rpole)=RNS ¼ �2R3
NS=GMNS ¼ 10�8(P=7 s)�2.However, the energy stored in the strained crust is �3 ;1039( =10�4)2 ergs. The magnitude of the strain must, by wayof comparison, be smaller than 5 ; 10�5 in the precessingpulsar PSR B1828�11 (Cutler, Ushomirsky, & Link 2003),whose spin is an order of magnitude faster than that of 1E2259+586. We conclude that the observed X-ray transientcould be powered by the release of elastic energy only ifdeparture from spherical shape in the crust were comparableto that of a neutron star with a �15 ms spin period.
The remaining possibility is that the transient X-ray emis-sion is powered by magnetic field decay. The energy carriedby the (exterior) magnetic field of 1E 2259+586 is comfort-ably larger: 8 ; 1044(Bpole=10
14G)2(RNS=10 km)3 ergs in thesimplest case of a centered dipole. This is clearly a lowerbound to the total magnetic energy of the star, as it does notaccount for the internal (e.g., toroidal) field. The surface field(and magnetic energy) would also be significantly stronger, bya factor of �(�R=2RNS)
�3, if the dipole moment were offsetfrom the center of the star (with a separation �R between themagnetic poles).
4.2.2. Comparison with the AXP 1RXS J1708�4009
It is interesting to compare the 1E 2259+586 glitch withthose reported for a different AXP, 1RXS 1708�4009. ThisAXP has shown two glitches, one in 1999 (Kaspi, Lackey, &Chakrabarty 2000) and one in 2001 (Kaspi & Gavriil 2003;Dall’Osso et al. 2003). The first glitch was similar to thoseseen in the Vela and other radio pulsars; it showed a step��=� ¼ 6 ; 10�7 with Q ¼ 0 and ��=� ’ 1%, such that themagnitude of the spin-down increased. The 2001 glitch,however, was markedly different and in some ways resembledthe glitch seen in 1E 2259+586. Specifically, it showed��=� ¼ 1:4 ; 10�7,which completely recovered exponentiallyon a timescale of 50 days (i.e., Q � 1). Whether it suffered astep in � depends on the interpretation of an apparent �detected between glitches; this is discussed in more detail byKaspi & Gavriil (2003) and Dall’Osso et al. (2003). As arguedby Kaspi & Gavriil (2003), this glitch may have indicated that1RXS 1708�4009 underwent bursting activity some time inthe few week long interval between monitoring observationsthat straddled the glitch epoch but went unobserved. However,no flux or pulse profile changes comparable to those seen in1E 2259+586 still weeks after its outburst were seen for 1RXS
1708�4009. Thus, any radiative changes would have had todecay on shorter timescales than seen in 1E 2259+586, inparticular on shorter timescales than the exponential glitchrelaxation timescale. This must be kept in mind when oneconsiders the coincidence in timescales of the 1E 2259+586rotational exponential decay and the average pulse profile’srelaxation to its preoutburst morphology.
4.2.3. Comparison to SGRs
From pulse frequency measurements leading up to andfollowing the August 27 flare, it was determined that SGR1900+14 likely underwent rapid spin-down (��=� � �1 ;10�4) at or near the time of the flare (Woods et al. 1999b). Ananalysis of the pulsations during the flare itself (Palmer 2002)confirmed the existence of a timing anomaly, but only anupper limit on the timescale for the frequency change wasmeasured (P1 day). For 1E 2259+586, we detect a suddenincrease in the rotation rate, as opposed to a decrease, in ad-dition to a much smaller magnitude than inferred for SGR1900+14. In general, the available limits on glitches (of eithersign) in SGRs are poor. This is a result of fewer and lessextensive phase-coherent timing solutions for these sourcesbecause of their strong timing noise (Woods et al. 2002) andweaker pulsed signals relative to most AXPs. Given the ob-servational limitations for monitoring glitch activity in theSGRs, it is not clear whether the glitch that accompanied theoutburst in 1E 2259+586 is common to SGR outbursts.
Although there are not any lengthy phase-coherent solutionsbridging the boundary between quiescent and burst-activestates in SGRs to allow for identification of glitches, there aresufficient observations during and following a few outbursts tosearch for transient changes in spin-down rate. During the first2 months following the outburst of 1E 2259+586, the frequencyderivative may have changed sign (assuming the pulse shapechanges did not affect our phase measurements; see x 3.1) andthen rapidly switched back to spin-down with a higher mag-nitude compared with preoutburst. The average spin-down rateduring the first 2 months after the glitch in 1E 2259+586 wasapproximately double the preoutburst value. Similar behaviorhas not been seen during or following SGR outbursts. The fairlywell sampled frequency histories of two SGRs (1900+14 and1806�20) show that there is no direct correlation between burstactivity and enhancements in the spin-down rate during orshortly following the outburst (Woods et al. 2002). In fact, thespin-down rate of SGR 1900+14 in the�40 days following the1998 August 27 flare was at its lowest (in magnitude) historicalvalue (Woods et al. 1999b, 2002).
4.2.4. Postglitch Relaxation
In radio pulsars, postglitch relaxation is almost always ob-served and can be classified into two regimes: one in whichthe initial frequency jump relaxes exponentially relativelyquickly (i.e., timescales of hours to weeks) and one in whichthe frequency jump does not relax and which is generallyaccompanied by a permanent or very slowly (timescales ofyears) relaxing increase in the magnitude of the frequencyderivative.Many radio pulsar glitches showboth such behaviors(e.g., Shemar & Lyne 1996; Wang et al. 2000). These aretoday generally interpreted in terms of vortex creep theory, inwhich the glitches are due to a sudden unpinning of angularmomentum vortices in the neutron star crustal superfluid(Anderson & Itoh 1975). The latter, in the model, rotates fasterthan the crust but in equilibrium is loosely coupled to it viapinning of vortices to crustal lattice sites. In this picture, the
X-RAY EMISSION FROM 1E 2259+586 395No. 1, 2004

vortices creep outward slowly because of thermal activation(Alpar et al. 1984a, 1984c), slowly transferring angular mo-mentum to the crust. In equilibrium, the crust, slowed downby the external torque of magnetic braking, shares an identicalspin-down rate with the superfluid in spite of a nonzero an-gular velocity differential between them. Vortex creep theoryidentifies the two observational postglitch relaxation regimeswith different pinning regions (Alpar, Cheng, & Pines 1989,1993): the exponential relaxation is associated with superfluidregions with temperatures high compared with pinning ener-gies, so that equilibrium can be established with only a smallangular velocity lag. This linear regime relaxation is mathe-matically equivalent to the original two-component model forthe crust-superfluid interaction suggested by Baym, Pethick,& Pines (1969), which did not incorporate the more recentvortex pinning theory. When the temperature is low comparedwith the pinning energy, a large lag is needed to establishequilibrium; this is the nonlinear regime and may be respon-sible for the longer timescale relaxations of spin-down rateenhancements.
For 1E 2259+586, qualitatively, we detect both such classicalglitch behaviors as well. However, quantitatively, the postglitchrelaxation of 1E 2259+586 is very different from that seen inradio pulsars. Specifically, the exponential decay time is longerthan what is observed in most pulsar glitches, and the Q value,the fraction of the glitch that heals, is also large by pulsarstandards, although neither value is extreme.What is extreme isthe combination: the net effect is that at 1 month postglitch thepulsar spins down for a couple weeks with more than double itslong-term preoutburst spin-down rate. In radio pulsars, thespin-down enhancement is typically a few percent, nearly 2orders of magnitude smaller. This is because the spin-downenhancement is due to a temporarily reduced moment of inertia,as a linear component of the crustal neutron superfluid re-establishes equilibrium, and this superfluid has at most a fewpercent of the moment of inertia of the crust. As discussed byKaspi et al. (2003), a spin-down enhancement of order unitywould imply that half the stellar moment of inertia was effec-tively decoupled from the crust following the glitch, muchmorethan ought to be present in the crustal superfluid. Indeed thecrust itself has a relatively small moment of inertia comparedwith the core, which is thought to be coupled to the crust onshort timescales (Alpar, Langer, & Sauls 1984b; Alpar & Sauls1988). Hence, the postglitch relaxation of 1E 2259+586 couldimply a core decoupling. This would provide the best evidenceyet for the existence of core superfluid.
However, the observed postglitch relaxation can be under-stood in terms of conventional crustal superfluid if it isassumed that the superfluid or crust angular velocity lagtemporarily reversed at the time of the glitch (as was noted byAlpar, Pines, & Cheng 1990 in the case of the 1988 Christmasglitch of the Vela pulsar). The standard two-component theoryhas the following equations of motion for the crust (includingeverything coupled to it on short timescales) and superfluid:
Ic�c ¼Isf (�sf � �c)
�� Nex; ð3Þ
Isf �sf ¼ � Isf (�sf � �c)
�; ð4Þ
where Nex is the external torque on the crust and � is the crust-superfluid energy dissipation rate. The dissipation rate can be
estimated from the postglitch exponential recovery timescale.From these equations, it follows that the change in the crustalangular frequency derivative is given by
��c ¼Isf
Ic
�(�sf � �c)
�; ð5Þ
or
�(�sf � �c) ¼ ��c
Ic
Isf�: ð6Þ
For � ’ 15 days, Isf=Ic ’ 0:01, and ��c ’ 2� ; 10�14 rads�2, we find �(�sf � �c) ’ 8 ; 10�6 rad s�1. Since �(�sf ��c) ¼ ��sf ���c and ��c ¼ 3 ; 10�6 rad s�1, we havethat ��sf ’ 5 ; 10�6 rad s�1. As the lag was initially smalland �c ’ 0:9 rad s�1, this implies the superfluid angularvelocity changed by only 1 part in 200,000. However, thischange was about twice the observed change in the crust.Thus, at the time of the glitch in this picture the superfluid wastemporarily spun down twice as much as the crust spun up.The observed enhanced spin-down postglitch is then due tothe crust transferring angular momentum back to the super-fluid, as the latter attempts to arrange its vortices so as toreestablish equilibrium.The overall activity in glitches is a measure of the moment
of inertia of the internal flywheel, which gives up angularmomentum during glitch events (Link, Epstein, & Lattimer1999). The activity parameter is obtained by summing over allglitches measured over a long time interval T. If the frequencylag between the superfluid and the star is sourced only by theexternal torque, then one has
1
h�iTXi
��i �Isf
I: ð7Þ
In the case of 1E 2259+586, we estimate ��=� ¼ 4 ; 10�6
over an interval of T ¼ 10 yr (the last outburst of 1E2259+586 being estimated to have occurred 10 years earlier;Iwasawa et al. 1992; see also x 4.3). The resulting activityparameter is �0.1, several times larger than what is measuredin glitching radio pulsars (Link et al. 1999). Either Isf isproportionately larger or the spin rate of the superfluid is beingreduced by some mechanism other than vortex line unpinningand thermal creep. For example, smooth deformations of thestellar crust, driven by magnetic stresses, can have the lattereffect (Thompson et al. 2000).A variety of models have been proposed to explain the or-
igin of glitches in radio pulsars. In most models, the rotationallag between the superfluid and the crust is the principal sourceof free energy. The frequency lag may as a result decrease inmagnitude during the glitch, but it is more difficult to reverseits sign. For example, Ruderman (1991) suggested that thetension of the superfluid vortices would fracture the crust,thereby allowing an outward shift in the positions of thevortices. Link & Epstein (1996) noted that any deposition ofheat (on the order of �1041–1042 ergs in the deep crust) wouldaccelerate the creep rate of the pinned vortex lines, therebycausing a transient spin-down of the superfluid and a spin-upof the rest of the star. Our observation of enhanced X-rayemission from 1E 2259+586 is, indeed, consistent with thislevel of heat deposition in the crust. But it appears that this
WOODS ET AL.396 Vol. 605

cannot be the entire mechanism responsible for the observedglitch, because the vortex creep rate goes to zero as the spinrate of the superfluid approaches that of the crustal lattice.
In a slowly rotating neutron star, magnetic stresses can acton timescales much shorter than the external torque. Glitch-like events result either from sudden fractures of the crust(Thompson & Duncan 1993) or from more gradual plasticdeformations during which the vortices remain pinned(Thompson et al. 2000). The lowest energy deformations ofthis type are torsional. Consider, for example, a twistingmotion of a circular patch of the crust that is offset in azimuthfrom the rotation axis. Starting from a uniform distribution,more vortices are advected outward than inward (because ofthe curvature of the stellar surface). A twist on the order of10�2 rad is enough to provide the required spin-down of thecrustal superfluid in 1E 2259+586 (eq. [12] of Thompson et al.2000). By forcing the superfluid to rotate more slowly than itotherwise would, this mechanism also provides an explanationfor the unusually large glitch activity that we inferred for 1E2259+586 (see also Heyl & Hernquist 1999).
Finally, as noted by Kaspi et al. (2003), the spin-down rateenhancement could also be due to a magnetospheric restruc-turing that causes the external torque to approximately double.However, given that the spin-up itself is inescapably enabledby an internal transfer of angular momentum, it would have tobe a surprising coincidence that the external torque changeoffsets, to within a factor of 4–5, the internally generatedfrequency jump. This of course does not preclude somemagnetospheric restructuring; indeed the residual pulse profilechange following the initial rapid flux decay and the post-outburst infrared enhancement (Kaspi et al. 2003) suggest thatlikely occurred. However, it seems unlikely that a magneto-spheric restructuring is the cause of the enhanced spin-downjust postoutburst.
4.2.5. Postglitch Long-Term Rotation
Our glitch fitting clearly measured a long-term postglitchchange in the spin-down rate. Interestingly, unlike that seen ina number of radio pulsars to date, the magnitude of the spin-down torque decreased. (In the case of the Crab pulsar, forexample, the cumulative effect of the torque changes observedfollowing some glitches is to increase the rate of spin-down by0.07% over 23 yr of observations; Lyne et al. 1993). If this isdue to a superfluid effect, the conventionally observed long-term increase in magnitude of �c represents a reduction in themoment of inertia of the part of the neutron star that is coupledto its crust. This suggests that some fraction of the crustalsuperfluid is tightly pinned and not creeping outward andhence is decoupled from the stellar spin-down (Alpar et al.1994), with this fraction increasing at the glitch. The oppositemust therefore be true of 1E 2259+586 in this scenario. It hasalternatively been suggested that the effect is due to a secularchange in the magnetic moment (Ruderman 1991) or to achange in the electromagnetic torque acting on the star, drivenby a reorientation of the magnetic moment with respect to theangular velocity of the star (Link & Epstein 1997).
We now comment on the relative merits of a change ininternal versus external torque in the case of 1E 2259+586.The sign of the torque change is interesting, because there isindependent evidence that the spin-down torque of 1E2259+586 has decayed over time: its characteristic age,�c ¼ 2 ; 105 yr, is an order of magnitude greater than that ofthe SNR CTB 109 (estimated radius 12 pc; Kothes et al.
2002). A change in vortex creep rate with a timescale � muchlonger than 1 yr but much less than the characteristic age�c ¼ 2 ; 105 yr would appear as a permanent change inbraking torque. The required moment of inertia of the super-fluid component would be Isf=I ¼ 0:05(�=�c), comfortablybelow the fraction inferred for glitching radio pulsars (Linket al. 1999) unless the creep timescale were more than amillion times longer than the observed 15 day relaxation. Thesimplest explanation for the required change is that the ex-ternal torque—a �2.5% reduction in the magnetic moment—can be discounted. If, for example, the external magnetic fieldof 1E 2259+586 were a centered dipole, the total field energyoutside the star would amount to some 1045 ergs, and thereduction in field energy would be a few hundred times largerthat the excess X-ray emission we have observed.
Nonetheless, changes in external torque can result frommore subtle effects. If the magnetosphere is globally twistedbecause of the action of internal magnetic stresses, theresulting expansion of the poloidal field lines increases thecurrent crossing the speed-of-light cylinder and thereforeyields a greater torque than would exist from a simple dipolarfield rotating in a vacuum (Thompson et al. 2002). Muchof this effect results from the closed field lines that extendfar from the star to a large radius Rmax, are anchored in asmall fraction � 1
2(Rmax=RNS)
�1 of its surface area, and containonly a small fraction �(Rmax=RNS)
�3 of the energy in thenonpotential (toroidal) field outside the star. A slight relaxa-tion in the twist of the closed field lines is therefore consistentwith the observed energetic output following the glitch if thatreconfiguration occurs close to the magnetic poles. Persistentseismic activity in a magnetar will also modulate the spin-down torque, through a coupling of crustal shear waves tothe magnetosphere, which in turns drives a particle wind(Thompson & Blaes 1998; Harding, Contopoulos, & Kazanas1999; Thompson et al. 2000). In this case, the observedchange in torque corresponds to a very small reduction in theparticle luminosity, by only �0:1I�� � 1031 ergs s�1.
Finally, a change in torque could result from the excitation ofprecession during the glitch, followed by a permanent reori-entation of the magnetic axis relative to the rotation axis of thestar (Link & Epstein 1997). That would require a precessionangle of at least a few degrees, which is uncomfortably large ifthe nonspherical shape of the star is predominantly due to itsmagnetic field. The fractional difference in the sizes of theprincipal moments is �10�6½hB2i=(1015 G)2 (Wasserman2003). However, the observed energy of the X-ray transientcorresponds to less than �10�3 of the total magnetic energy ofthe star (x 4.2.1) and, thus, to a proportionately small change inthe shape of the star.
4.3. Implications for the Number of Active Magnetars
As suggested by Kaspi et al. (2003), past reports of fluxvariability (Iwasawa et al. 1992; Baykal & Swank 1996),pulse profile changes (Iwasawa et al. 1992), and glitch activity(Heyl & Hernquist 1999) in 1E 2259+586 likely indicateprevious episodes of burst activity in this source. The bestexample of an inferred outburst from 1E 2259+586 comesfrom a pair of Ginga observations in 1989 and 1990. Between1989 and 1990, the pulse profile of 1E 2259+586 changeddrastically, the flux increased by more than a factor 2, and themeasured frequency showed evidence of a glitch. The closesimilarities with the well-studied outburst of 2002 Junestrongly suggests that a bursting episode from 1E 2259+586
X-RAY EMISSION FROM 1E 2259+586 397No. 1, 2004

preceded the 1990 Ginga observation by roughly 1 week.Similar reports of flux variability and timing anomalies in theAXP be 1048.1�5937 (e.g., Oosterbroek et al. 1998) suggestpast episodes of burst activity in this source as well.
What is most intriguing about the detected and inferredoutbursts in AXPs is that none have been detected with largeFOV gamma-ray detectors (e.g., BATSE, Konus, Ulysses,etc.) that traditionally detect burst-active episodes in SGRs.This shows that we are missing low-intensity SGR-like out-bursts from magnetar candidates in our Galaxy (i.e., the SGRsare a sensitivity-limited sample).
The number of active SGRs in our Galaxy was calculatedpreviously to be �10 (Kouveliotou et al. 1993). A key as-sumption in this estimation was that SGR outbursts are easilydetected (i.e., there are always bright bursts within a givenoutburst that would trigger at least some of the large FOVgamma-ray instruments). The discovery of low-intensity SGR-like outbursts in AXPs clearly invalidates that assumption,making the estimate of 10 a lower limit only.
The future prospects for detecting weak SGR-like outburstsand addressing the question of the number of active SGRs inour Galaxy is promising. Until 2000 June, BATSE was themost sensitive large FOV detector for SGR burst emissions.The impending Swift mission and its sensitive BAT detectorwill be �20 times more sensitive than BATSE was (D. Band2003, private communication). Just as the RXTE PCA openedour eyes to the larger population of low-luminosity SGRbursts (e.g., GoguY et al. 1999), perhaps Swift will reveal apreviously unknown source population of dimmer SGRs.
5. SUMMARY
In 2002 June, the AXP 1E 2259+586 was observed to emitmore than 80 SGR-like bursts. Accompanying this outburstwere several changes in the persistent X-ray emission prop-erties of the source, many of which are similar to what hasbeen seen in SGRs, thus further blurring the distinction be-tween the two classes. We have quantified the observedchanges by using data obtained with XMM-Newton and RXTE.In particular, we found the following:
1. The flux increased by more than an order of magnitudeand showed two decay components. The first componentdecayed rapidly within the first day of the outburst, while thesecond decayed much more slowly as a power law in timeaccording to t�0:22.
2. The X-ray spectrum hardened during the outburst butalmost fully recovered within 3 days. The spectrum at 21 dayspast the burst activity was significantly harder than at 7 dayspreoutburst but was fully consistent with historical spectralmeasurements of this source in quiescence.
3. The phase dependence of the energy spectrum changedfrom that before to that after the outburst. One week prior to theoutburst, we observe significant variability in the photon indexbut not the blackbody temperature. Three days following theoutburst, the dependence of the photon index on pulse phaseflattened significantly.
4. The pulse profile changed suddenly during the observa-tion containing the burst activity during which much of thepower moved to the fundamental frequency. The pulse profilerapidly returned to near its preoutburst shape within 1 weekand showed only very slow recovery thereafter. As with theflux and spectral changes, the recovery was not complete evenafter 1 year.5. The pulsed fraction decreased during the outburst to
�15% but quickly recovered to the preoutburst value of �23%within 6 days.6. 1E 2259+586 suffered a glitch having an ordinary am-
plitude [��max=� ¼ (4:24 � 0:11) ; 10�6] but a unique re-covery. Approximately 19% of the glitch recovered on atimescale of �16 days, although the recovery was not exactlyexponential in form. During the recovery, the torque was en-hanced relative to the preoutburst value by a factor of �2. Wedetect a long-term �2% reduction in the spin-down rate fol-lowing the glitch [�� ¼ 2:18 � 0:25ð Þ ; 10�16 Hz s�1].7. The measured glitch epoch precedes the observed burst
activity by �12 hr. Given the rapid flux decay during theoutburst, the true onset of this burst activity may have followedthe glitch.
The cumulative properties of the outburst in 1E 2259+586lead us to conclude that the star suffered some major event thatwas extended in time and had two components, one tightlylocalized on the surface of the star (i.e., a fracture or a series offractures) and the second more broadly distributed (possiblyinvolving a smoother plastic change). This event affected boththe superfluid interior and the magnetosphere. The glitchpoints toward a disturbance within the superfluid interior,while the extended flux enhancement and pulse profile changesuggest an excitation of magnetospheric currents and crustalheating. Finally, we show that the lack of detection of AXPoutbursts with all-sky gamma-ray detectors suggests thereexists a larger population of active SGRs in our Galaxy thanpreviously thought.
We thank P. Plucinsky (principal investigator of the CTB109 observations) for providing XMM-Newton data on 1E2259+586. We thank the anonymous referee for useful com-ments that improved this manuscript. We would like to thankW. Becker, R. Epstein, M. Finger, A. Harding, C. Kouveliotou,B. Link, F. Ozel, D. Psaltis, and I. Wasserman for usefuldiscussions. We thank J. Swank and the RXTE schedulingteam. We thank F. Jansen for scheduling a ToO observationwith XMM-Newton. We thank S. Golenetskii and E. Mazetsfor providing limits on burst emission from 1E 2259+586 byusing their Konus data set. P. M. W. acknowledges supportthrough NASA. V. M. K. is a Canada Research Chair, anNSERC Steacie Fellow, and a Fellow of the CIAR. Funding toV. M. K. and F. G. was provided by an NSERC DiscoveryGrant and Steacie Supplement, NATEQ, CIAR, and NASA.C. T. is supported by the NSERC of Canada. J. H. is supportedby a Chandra Postdoctoral Fellowship Award.
REFERENCES
Alpar, M. A., Anderson, P. W., Pines, D., & Shaham, J. 1984a, ApJ, 278, 791Alpar, M. A., Chau, H. F., Cheng, K. S., & Pines, D. 1993, ApJ, 409, 345———. 1994, ApJ, 427, L29Alpar, M. A., Cheng, K. S., & Pines, D. A. 1989, ApJ, 346, 823Alpar, M. A., Langer, S. A., & Sauls, J. A. 1984b, ApJ, 282, 533Alpar, M. A., Pines, D., Anderson, P. W., & Shaham, J. 1984c, ApJ, 276, 325Alpar, M. A., Pines, D., & Cheng, K. S. 1990, Nature, 348, 707
Alpar, M. A., & Sauls, J. A. 1988, ApJ, 327, 723Anderson, P. W., & Itoh, N. 1975, Nature, 256, 25Baykal, A., & Swank, J. 1996, ApJ, 460, 470Baym, G., Pethick, C., & Pines, D. 1969, Nature, 224, 673Briel, U. G., Dennerl, K., Freyberg, M. J., Haberl, F., & Zavlin, V. E. 2004,Proc. SPIE, 5165, 96
Corbel, S., Chapuis, C., Dame, T. M., & Durouchoux, P. 1999, ApJ, 526, L29
WOODS ET AL.398 Vol. 605

Cutler, C., Ushomirsky, G., & Link, B. 2003, ApJ, 588, 975Dall’Osso, S., Israel, G. L., Stella, L., Possenti, A., & Perozzi, E. 2003, ApJ,599, 485
den Herder, J. W., et al. 2001, A&A, 365, L7Feroci, M., Hurley, K., Duncan, R. C., & Thompson, C. 2001, ApJ, 549, 1021Feroci, M., et al. 2003, ApJ, 596, 470Gavriil, F., & Kaspi, V. M. 2002, ApJ, 567, 1067Gavriil, F. P., Kaspi, V. M., & Woods, P. M. 2002, Nature, 419, 142———. 2003, ApJ, in pressGoguY, E., Kouveliotou, C., Woods, P. M., Finger, M. H., & van der Klis, M.2002, ApJ, 577, 929
GoguY, E., Kouveliotou, C., Woods, P. M., Thompson, C., Duncan, R. C., &Briggs, M. S. 2001, ApJ, 558, 228
GoguY, E., Woods, P. M., Kouveliotou, C., van Paradijs, J., Briggs, M. S.,Duncan, R. C., & Thompson, C. 1999, ApJ, 526, L93
Harding, A. K., Contopoulos, I., & Kazanas, D. 1999, ApJ, 525, L125Heyl, J. S., & Hernquist, L. 1999, MNRAS, 304, L37Ibrahim, A., et al. 2001, ApJ, 558, 237Iwasawa, K., Koyama, K., & Halpern, J. P. 1992, PASJ, 44, 9Jahoda, K., Swank, J. H., Giles, A. B., Stark, M. J., Strohmayer, T., Zhang, W.,& Morgan, E. H. 1996, Proc. SPIE, 2808, 59
Jansen, F., et al. 2001, A&A, 365, L1Kaspi, V. M., Chakrabarty, D., & Steinberger, J. 1999, ApJ, 525, L33Kaspi, V. M., & Gavriil, F. P. 2003, ApJ, 596, L71Kaspi, V. M., Gavriil, F. P., Chakrabarty, D., Lackey, J. R., & Muno, M. P.2001, ApJ, 558, 253
Kaspi, V. M., Gavriil, F. P., Woods, P. M., Jensen, J. B., Roberts, M. S. E., &Chakrabarty, D. 2003, ApJ, 588, L93
Kaspi, V. M., Lackey, J. R., & Chakrabarty, D. 2000, ApJ, 537, L31Kothes, R., Uyaniker, B., & Aylin, Y. 2002, ApJ, 576, 169Kouveliotou, C., et al. 1993, Nature, 362, 728———. 1998, Nature, 393, 235———. 2003, ApJ, 596, L79Lenters, G., et al. 2002, ApJ, 587, 761———. 2003, ApJ, 587, 761Link, B., & Epstein, R. I. 1996, ApJ, 457, 844———. 1997, ApJ, 478, L91Link, B., Epstein, R. I., & Lattimer, J. M. 1999, Phys. Rev. Lett., 83, 3362Lyne, A. G., Pritchard, R. S., & Graham-Smith, F. 1993, MNRAS, 265, 1003Lyubarsky, E., Eichler, D., & Thompson, C. 2002, ApJ, 580, L69Marsden, D., & White, N. E. 2001, ApJ, 551, L155Mereghetti, S., Chiarlone, L., Israel, G. L., & Stella, L. 2002, in Neutron Stars,Pulsars and Supernova Remnants, ed. H. W. Becker, H. Lesch, & J. Trumper(MPE 278; Garching: MPE), 29
Oosterbroek, T., Parmar, A. N., Mereghetti, S., & Israel, G. L. 1998, A&A,334, 925
Owens, A., Oosterbroek, T., & Parmar, A. N. 1997, A&A, 324, L9Ozel, F. 2001, ApJ, 563, 276Ozel, F., Psaltis, D., & Kaspi, V. M. 2001, ApJ, 563, 255Palmer, D. M. 2002, Mem. Soc. Astron. Italiana, 73, 578Parmar,A.N.,Oosterbroek,T., Favata, F., Pightling, S.,Coe,M. J.,Mereghetti, S.,& Israel, G. L. 1998, A&A, 330, 175
Patel, S. K., et al. 2001, ApJ, 563, L45Perna, R., Heyl, J. S., Hernquist, L. E., Juett, A. M., & Chakrabarty, D. 2001,ApJ, 557, 18
Ruderman, R. 1991, ApJ, 382, 576Shemar, S. L., & Lyne, A. G. 1996, MNRAS, 282, 677Shinoda, K., Kii, T., Mitsuda, K., Nagase, F., Tanaka, Y., Makishima, K., &Shibazaki, N. 1990, PASJ, 42, L27
Struder, L., et al. 2001, A&A, 365, L18Thompson, C., & Blaes, O. 1998, Phys. Rev. D, 57, 3219Thompson, C., & Duncan, R. 1993, ApJ, 408, 194———. 1996, ApJ, 473, 322———. 2001, ApJ, 561, 980Thompson, C., Duncan, R., Woods, P. M., Kouveliotou, C., Finger, M. H., &van Paradijs, J. 2000, ApJ, 543, 340
Thompson, C., Lyutikov, M., & Kulkarni, S. R. 2002, ApJ, 574, 332Turner, M., et al. 2001, A&A, 365, L27van der Klis, M. 1989, in Timing Neutron Stars, ed. H. Ogelman & E. P. J.van den Heuvel (Dordrecht: Kluwer), 27
Vrba, F. J., Henden, A. A., Luginbuhl, C. B., Guetter, H. H., Hartmann, D. H.,& Klose, S. 2000, ApJ, 533, L17
Wang, N., Manchester, R. N., Pace, R. T., Bailes, M., Kaspi, V. M., Stappers,B. W., & Lyne, A. G. 2000, MNRAS, 317, 843
Wasserman, I. 2003, MNRAS, 341, 1020Wong, T., Backer, D. C., & Lyne, A. G. 2001, ApJ, 548, 447Woods, P. M. 2003, in Pulsars, AXPs, and SGRs Observed with Beppo SAXand Other Observatories, ed. G. Cusumano, E. Massaro, & T. Mineo (Rome:Aracne), 159
———. 2004, preprint (astro-ph/0304372)Woods, P. M., Kouveliotou, C., Gogus, E., Finger, M. H., Swank, J., Markwardt,C. B., Hurley, K., & van der Klis, M. 2002, ApJ, 576, 381
Woods, P. M., et al. 1999a, ApJ, 519, L139———. 1999b, ApJ, 524, L55———. 2000, ApJ, 535, L55———. 2001, ApJ, 552, 748
X-RAY EMISSION FROM 1E 2259+586 399No. 1, 2004