Embed Size (px)
Citation preview
PROJECT DESIGN DOCUMENT FORM (CDM PDD) - Version 02 CDM – Executive Board page 1
This template shall not be altered. It shall be completed without modifying/adding headings or logo, format or font.
CLEAN DEVELOPMENT MECHANISM PROJECT DESIGN DOCUMENT FORM (CDM-PDD)
Version 02 - in effect as of: 1 July 2004) CONTENTS A. General description of project activity B. Application of a baseline methodology C. Duration of the project activity / Crediting period D. Application of a monitoring methodology and plan E. Estimation of GHG emissions by sources F. Environmental impacts G. Stakeholders’ comments
Annexes Annex 1: Contact information on participants in the project activity Annex 2: Information regarding public funding Annex 3: Baseline information
Annex 4: Monitoring plan

PROJECT DESIGN DOCUMENT FORM (CDM PDD) - Version 02 CDM – Executive Board page 2
This template shall not be altered. It shall be completed without modifying/adding headings or logo, format or font.
SECTION A. General description of project activity A.1 Title of the project activity: Darajat Unit III Geothermal Project. Document version number 4.
3rd June 2008.

PROJECT DESIGN DOCUMENT FORM (CDM PDD) - Version 02 CDM – Executive Board page 24
This template shall not be altered. It shall be completed without modifying/adding headings or logo, format or font.
SECTION D. Application of a monitoring methodology and plan D.1. Name and reference of approved monitoring methodology applied to the project activity: Approved consolidated monitoring methodology ACM0002 “Consolidated monitoring methodology for zero-emissions grid-connected electricity generation from renewable sources” (Version 6). D.2. Justification of the choice of the methodology and why it is applicable to the project activity: This monitoring methodology shall be used in conjunction with the approved baseline methodology ACM0002 (“Consolidated baseline methodology for grid-connected electricity generation from renewable sources”) and applied to geothermal sources. The geographic and system boundaries for the relevant electricity grid can be clearly identified and information on the characteristics of the grid is available. Consistent with the “Consolidated baseline methodology for grid-connected electricity generation from renewable sources” (ACM0002), the project boundary includes the following emissions sources: − For geothermal project activities, fugitive emissions of methane and carbon dioxide from non-
condensable gases (NCGs) contained in geothermal steam and carbon dioxide emissions from combustion of fossil fuels required to operate the geothermal power plant.
The monitoring methodology is applicable to the Darajat Unit III Geothermal Project as it provides a comprehensive monitoring of the emissions reductions associated with the project. The monitoring methodology consists of measurements of all the process and data streams needed in order to accurately quantify the emissions associated with the proposed Darajat Unit III Project. These include: Generated electricity and the fraction exported to the JAMALI grid, for Darajat Unit III and for the
existing Unit I and Unit II, and a daily log of Unit I and Unit II Steam mass flow delivered to the power plant, NCG fraction in the main steam flow, Analysis of NCG samples to determine GHG content, and Measurement of fuel consumption in vehicles and other ancillary on-site equipment.
The collected data will be inventoried over the lifetime of the project.
PROJECT DESIGN DOCUMENT FORM (CDM PDD) - Version 02 CDM – Executive Board page 25
This template shall not be altered. It shall be completed without modifying/adding headings or logo, format or font.
D.2. 1. Option 1: Monitoring of the emissions in the project scenario and the baseline scenario
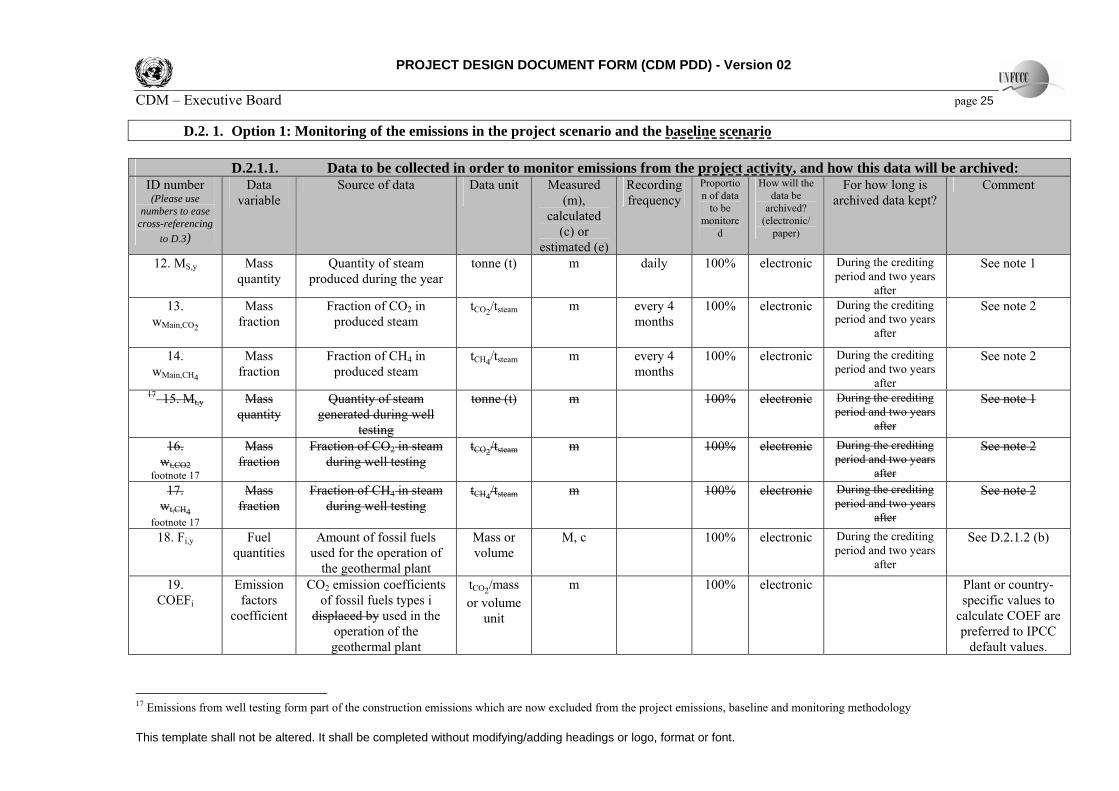
D.2.1.1. Data to be collected in order to monitor emissions from the project activity, and how this data will be archived: ID number (Please use
numbers to ease cross-referencing
to D.3)
Data variable
Source of data Data unit
Measured (m),
calculated (c) or
estimated (e)
Recording frequency
Proportion of data
to be monitore
d
How will the data be
archived? (electronic/
paper)
For how long is archived data kept?
Comment
12. MS,y
Mass quantity
Quantity of steam produced during the year
tonne (t) m daily 100% electronic During the crediting period and two years
after
See note 1
13. wMain,CO2
Mass fraction
Fraction of CO2 in produced steam
tCO2/tsteam m every 4 months
100% electronic During the crediting period and two years
after
See note 2
14. wMain,CH4
Mass fraction
Fraction of CH4 in produced steam
tCH4/tsteam m every 4 months
100% electronic During the crediting period and two years
after
See note 2
17 15. Mt,y
Mass quantity
Quantity of steam generated during well
testing
tonne (t) m 100% electronic During the crediting period and two years
after
See note 1
16. wt,CO2
footnote 17
Mass fraction
Fraction of CO2 in steam during well testing
tCO2/tsteam m 100% electronic During the crediting period and two years
after
See note 2
17. wt,CH4
footnote 17
Mass fraction
Fraction of CH4 in steam during well testing
tCH4/tsteam m 100% electronic During the crediting period and two years
after
See note 2
18. Fi,y
Fuel quantities
Amount of fossil fuels used for the operation of
the geothermal plant
Mass or volume
M, c 100% electronic During the crediting period and two years
after
See D.2.1.2 (b)
19. COEFi
Emission factors
coefficient
CO2 emission coefficients of fossil fuels types i
displaced by used in the operation of the geothermal plant
tCO2/mass or volume
unit
m 100% electronic Plant or country-specific values to
calculate COEF are preferred to IPCC
default values.
17 Emissions from well testing form part of the construction emissions which are now excluded from the project emissions, baseline and monitoring methodology
PROJECT DESIGN DOCUMENT FORM (CDM PDD) - Version 02 CDM – Executive Board page 26
This template shall not be altered. It shall be completed without modifying/adding headings or logo, format or font.
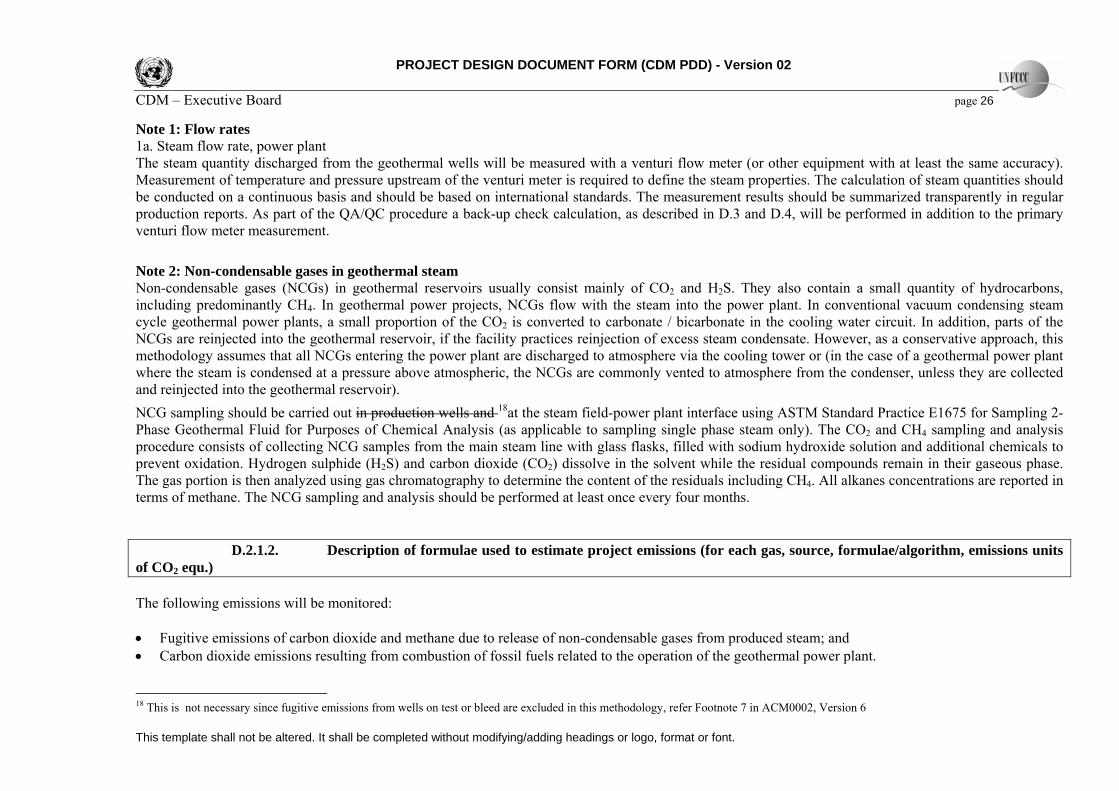
Note 1: Flow rates 1a. Steam flow rate, power plant The steam quantity discharged from the geothermal wells will be measured with a venturi flow meter (or other equipment with at least the same accuracy). Measurement of temperature and pressure upstream of the venturi meter is required to define the steam properties. The calculation of steam quantities should be conducted on a continuous basis and should be based on international standards. The measurement results should be summarized transparently in regular production reports. As part of the QA/QC procedure a back-up check calculation, as described in D.3 and D.4, will be performed in addition to the primary venturi flow meter measurement.
Note 2: Non-condensable gases in geothermal steam Non-condensable gases (NCGs) in geothermal reservoirs usually consist mainly of CO2 and H2S. They also contain a small quantity of hydrocarbons, including predominantly CH4. In geothermal power projects, NCGs flow with the steam into the power plant. In conventional vacuum condensing steam cycle geothermal power plants, a small proportion of the CO2 is converted to carbonate / bicarbonate in the cooling water circuit. In addition, parts of the NCGs are reinjected into the geothermal reservoir, if the facility practices reinjection of excess steam condensate. However, as a conservative approach, this methodology assumes that all NCGs entering the power plant are discharged to atmosphere via the cooling tower or (in the case of a geothermal power plant where the steam is condensed at a pressure above atmospheric, the NCGs are commonly vented to atmosphere from the condenser, unless they are collected and reinjected into the geothermal reservoir).
NCG sampling should be carried out in production wells and 18at the steam field-power plant interface using ASTM Standard Practice E1675 for Sampling 2-Phase Geothermal Fluid for Purposes of Chemical Analysis (as applicable to sampling single phase steam only). The CO2 and CH4 sampling and analysis procedure consists of collecting NCG samples from the main steam line with glass flasks, filled with sodium hydroxide solution and additional chemicals to prevent oxidation. Hydrogen sulphide (H2S) and carbon dioxide (CO2) dissolve in the solvent while the residual compounds remain in their gaseous phase. The gas portion is then analyzed using gas chromatography to determine the content of the residuals including CH4. All alkanes concentrations are reported in terms of methane. The NCG sampling and analysis should be performed at least once every four months.
D.2.1.2. Description of formulae used to estimate project emissions (for each gas, source, formulae/algorithm, emissions units of CO2 equ.) The following emissions will be monitored: • Fugitive emissions of carbon dioxide and methane due to release of non-condensable gases from produced steam; and • Carbon dioxide emissions resulting from combustion of fossil fuels related to the operation of the geothermal power plant. 18 This is not necessary since fugitive emissions from wells on test or bleed are excluded in this methodology, refer Footnote 7 in ACM0002, Version 6
PROJECT DESIGN DOCUMENT FORM (CDM PDD) - Version 02 CDM – Executive Board page 27
This template shall not be altered. It shall be completed without modifying/adding headings or logo, format or font.
a) Fugitive carbon dioxide and methane emissions due to release of non-condensable gases from the produced steam (PESy): PESy = (wmain,CO2 + wMain,CH4 · GWPCH4 ) · MS,y where PESy are the project emissions due to release of carbon dioxide and methane from the produced steam during the year y, wMain,CO2 and wMain,CH4
are the average mass fractions of carbon dioxide and methane in the produced steam, GWPCH4 is the global warming potential of methane and MS,y is the quantity of steam produced during the year y.
b) Carbon dioxide emissions from fossil fuel combustion (PEFFy)
PEFFy = ∑i
iyi COEFF ·,
where PEFFy are the project emissions from combustion of fossil fuels related to the operation of the geothermal power plant in tons of CO2, Fi,y is
the fuel consumption of fuel type i during the year y and COEFi is the CO2 emission factor coefficient of the fuel type i. Fuel purchased for use at the Darajat asset is consumed both by existing geothermal operations and the geothermal power plant which is the subject
of this PDD. Fuel is not purchased or consumed separately for Darajat Unit III. To obtain a value of Fi,y applicable for use in the calculation of PEFFy, the total consumption of fuel of type i at the Darajat asset will be pro-rated on the basis of the nominal gross output of Unit III (110 MW) versus the total nominal gross output of all geothermal generating units at the Darajat asset operated by CGI, currently 205 MW (Unit II: 95 MW gross – this is 5MW higher than the value noted in Section A.2 due to operation at a higher turbine inlet pressure). Refer to discussion in Section D.4.
Total project emissions, PEy , are therefore equal to PESy + PEFFy.
PROJECT DESIGN DOCUMENT FORM (CDM PDD) - Version 02 CDM – Executive Board page 28
This template shall not be altered. It shall be completed without modifying/adding headings or logo, format or font.
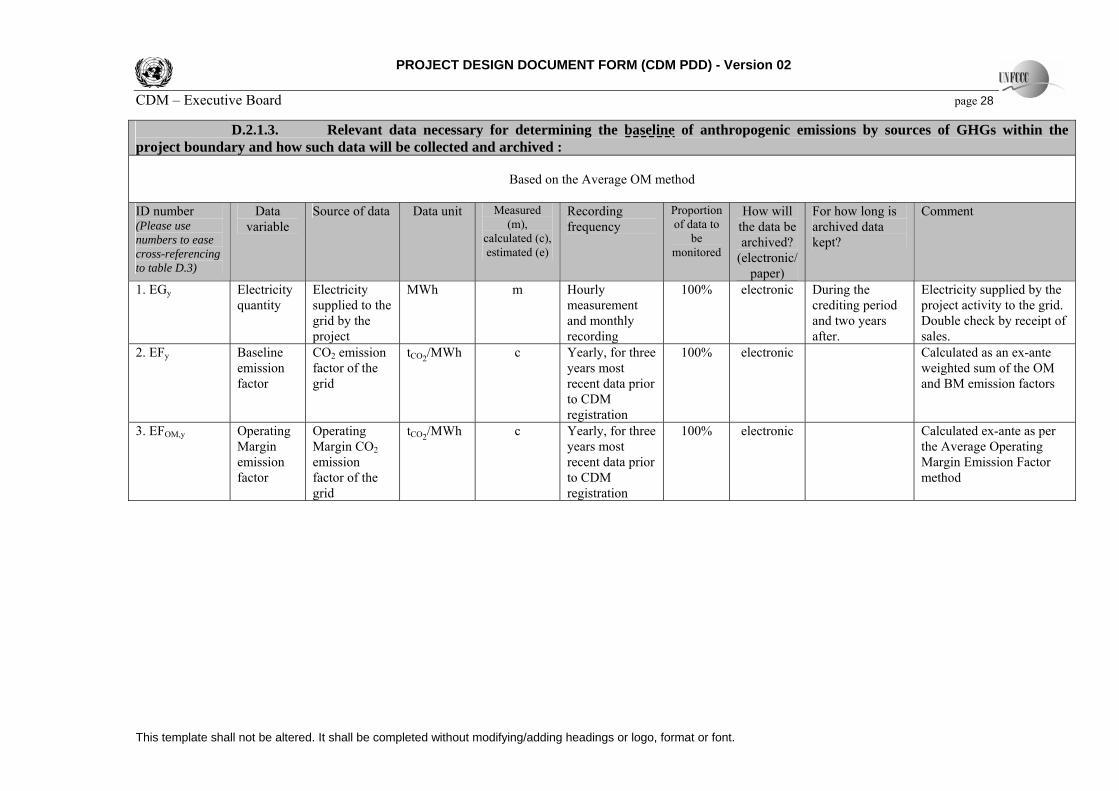
D.2.1.3. Relevant data necessary for determining the baseline of anthropogenic emissions by sources of GHGs within the project boundary and how such data will be collected and archived :
Based on the Average OM method ID number (Please use numbers to ease cross-referencing to table D.3)
Data variable
Source of data Data unit Measured (m),
calculated (c), estimated (e)
Recording frequency
Proportion of data to
be monitored
How will the data be archived?
(electronic/ paper)
For how long is archived data kept?
Comment
1. EGy
Electricity quantity
Electricity supplied to the grid by the project
MWh m Hourly measurement and monthly recording
100% electronic During the crediting period and two years after.
Electricity supplied by the project activity to the grid. Double check by receipt of sales.
2. EFy
Baseline emission factor
CO2 emission factor of the grid
tCO2/MWh c Yearly, for three years most recent data prior to CDM registration
100% electronic Calculated as an ex-ante weighted sum of the OM and BM emission factors
3. EFOM,y
Operating Margin emission factor
Operating Margin CO2 emission factor of the grid
tCO2/MWh c Yearly, for three years most recent data prior to CDM registration
100% electronic Calculated ex-ante as per the Average Operating Margin Emission Factor method
PROJECT DESIGN DOCUMENT FORM (CDM PDD) - Version 02 CDM – Executive Board page 29
This template shall not be altered. It shall be completed without modifying/adding headings or logo, format or font.
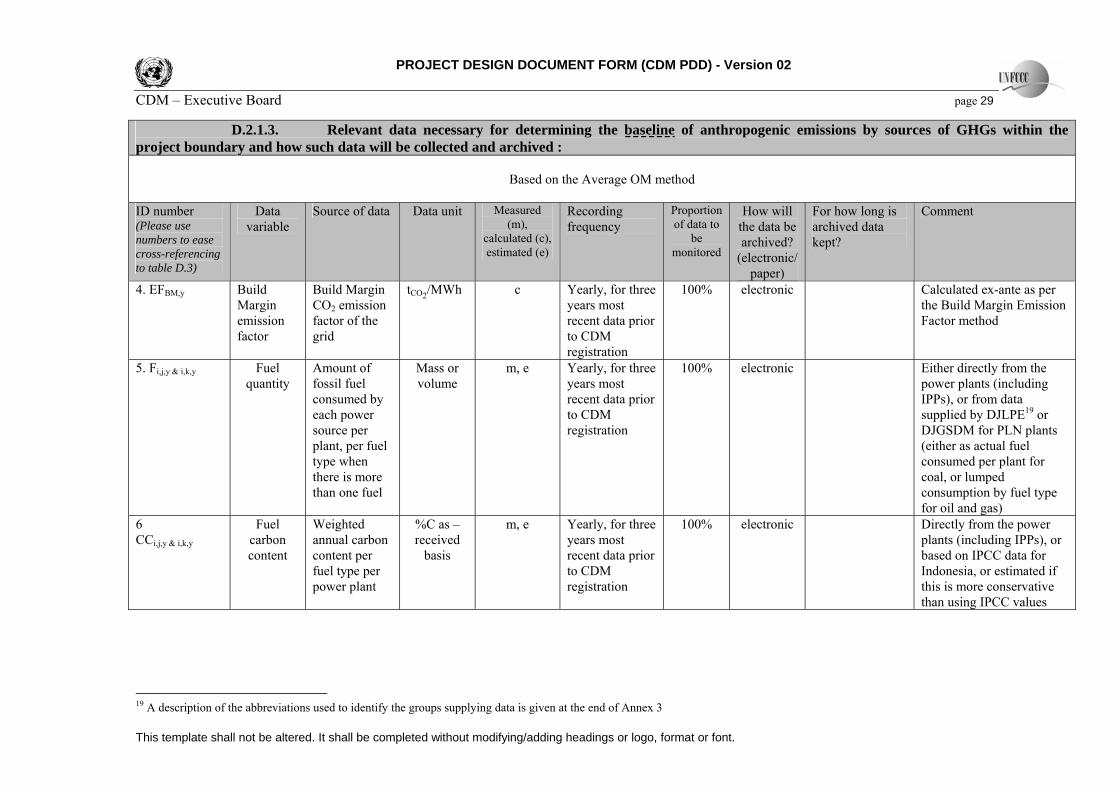
D.2.1.3. Relevant data necessary for determining the baseline of anthropogenic emissions by sources of GHGs within the project boundary and how such data will be collected and archived :
Based on the Average OM method ID number (Please use numbers to ease cross-referencing to table D.3)
Data variable
Source of data Data unit Measured (m),
calculated (c), estimated (e)
Recording frequency
Proportion of data to
be monitored
How will the data be archived?
(electronic/ paper)
For how long is archived data kept?
Comment
4. EFBM,y
Build Margin emission factor
Build Margin CO2 emission factor of the grid
tCO2/MWh c Yearly, for three years most recent data prior to CDM registration
100% electronic Calculated ex-ante as per the Build Margin Emission Factor method
5. Fi,j,y & i,k,y
Fuel quantity
Amount of fossil fuel consumed by each power source per plant, per fuel type when there is more than one fuel
Mass or volume
m, e Yearly, for three years most recent data prior to CDM registration
100% electronic Either directly from the power plants (including IPPs), or from data supplied by DJLPE19 or DJGSDM for PLN plants (either as actual fuel consumed per plant for coal, or lumped consumption by fuel type for oil and gas)
6 CCi,j,y & i,k,y
Fuel carbon content
Weighted annual carbon content per fuel type per power plant
%C as –received
basis
m, e Yearly, for three years most recent data prior to CDM registration
100% electronic Directly from the power plants (including IPPs), or based on IPCC data for Indonesia, or estimated if this is more conservative than using IPCC values
19 A description of the abbreviations used to identify the groups supplying data is given at the end of Annex 3
PROJECT DESIGN DOCUMENT FORM (CDM PDD) - Version 02 CDM – Executive Board page 30
This template shall not be altered. It shall be completed without modifying/adding headings or logo, format or font.
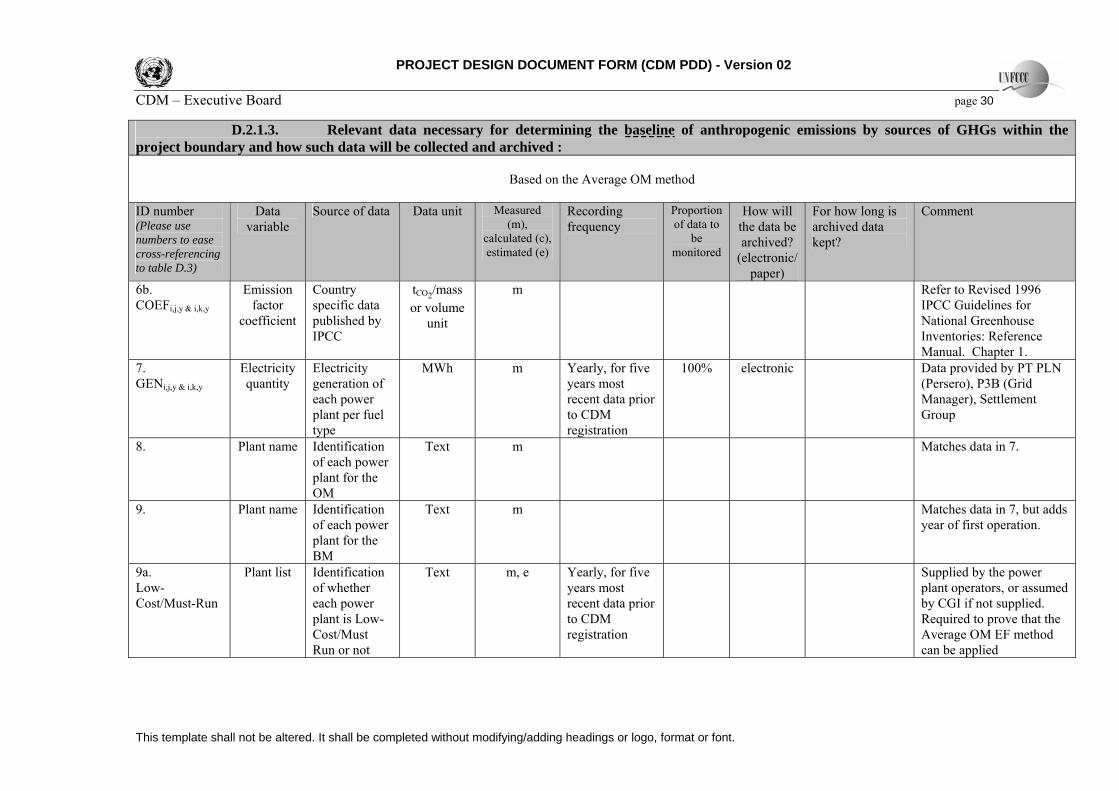
D.2.1.3. Relevant data necessary for determining the baseline of anthropogenic emissions by sources of GHGs within the project boundary and how such data will be collected and archived :
Based on the Average OM method ID number (Please use numbers to ease cross-referencing to table D.3)
Data variable
Source of data Data unit Measured (m),
calculated (c), estimated (e)
Recording frequency
Proportion of data to
be monitored
How will the data be archived?
(electronic/ paper)
For how long is archived data kept?
Comment
6b. COEFi,j,y & i,k,y
Emission factor
coefficient
Country specific data published by IPCC
tCO2/mass or volume
unit
m Refer to Revised 1996 IPCC Guidelines for National Greenhouse Inventories: Reference Manual. Chapter 1.
7. GENi,j,y & i,k,y
Electricity quantity
Electricity generation of each power plant per fuel type
MWh m Yearly, for five years most recent data prior to CDM registration
100% electronic Data provided by PT PLN (Persero), P3B (Grid Manager), Settlement Group
8.
Plant name Identification of each power plant for the OM
Text m Matches data in 7.
9.
Plant name Identification of each power plant for the BM
Text m Matches data in 7, but adds year of first operation.
9a. Low-Cost/Must-Run
Plant list Identification of whether each power plant is Low-Cost/Must Run or not
Text m, e Yearly, for five years most recent data prior to CDM registration
Supplied by the power plant operators, or assumed by CGI if not supplied. Required to prove that the Average OM EF method can be applied
PROJECT DESIGN DOCUMENT FORM (CDM PDD) - Version 02 CDM – Executive Board page 31
This template shall not be altered. It shall be completed without modifying/adding headings or logo, format or font.
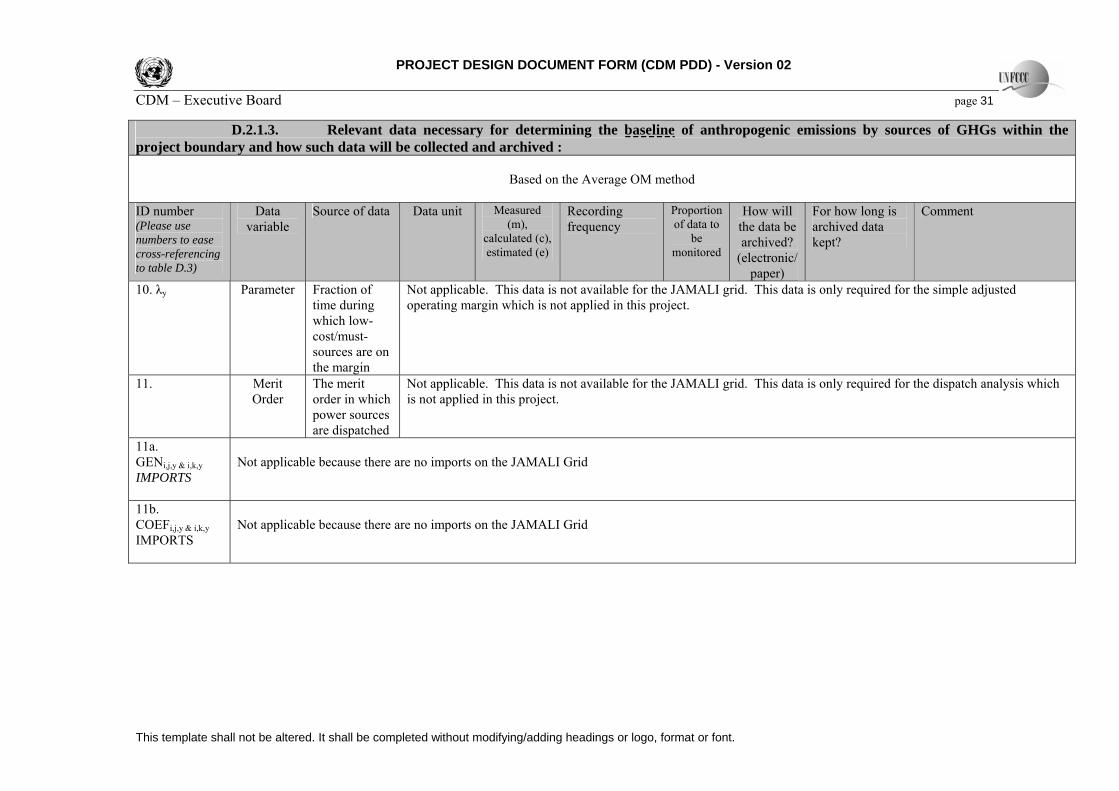
D.2.1.3. Relevant data necessary for determining the baseline of anthropogenic emissions by sources of GHGs within the project boundary and how such data will be collected and archived :
Based on the Average OM method ID number (Please use numbers to ease cross-referencing to table D.3)
Data variable
Source of data Data unit Measured (m),
calculated (c), estimated (e)
Recording frequency
Proportion of data to
be monitored
How will the data be archived?
(electronic/ paper)
For how long is archived data kept?
Comment
10. λy
Parameter Fraction of time during which low-cost/must-sources are on the margin
Not applicable. This data is not available for the JAMALI grid. This data is only required for the simple adjusted operating margin which is not applied in this project.
11.
Merit Order
The merit order in which power sources are dispatched
Not applicable. This data is not available for the JAMALI grid. This data is only required for the dispatch analysis which is not applied in this project.
11a. GENi,j,y & i,k,y IMPORTS
Not applicable because there are no imports on the JAMALI Grid
11b. COEFi,j,y & i,k,y IMPORTS
Not applicable because there are no imports on the JAMALI Grid
PROJECT DESIGN DOCUMENT FORM (CDM PDD) - Version 02 CDM – Executive Board page 32
This template shall not be altered. It shall be completed without modifying/adding headings or logo, format or font.
D.2.1.4. Description of formulae used to estimate baseline emissions (for each gas, source, formulae/algorithm, emissions units of CO2 equ.) As per ACM0002 (Version 6): “A baseline emission factor (EFy) is calculated as a combined margin (CM), consisting of the combination of operating margin (OM) and build margin (BM) factors according to the following three steps. Calculations for this combined margin must be based on data from an official source (where available) and made publicly available.” STEP 1. Calculate the Operating Margin emission factor(s) (EFOM,y) based on one of the four following methods: Per ACM0002, the Operating Margin emission factor (EFOM,y) can be based on one of the four following methods: (a) Simple OM, (SOM) or (b) Simple adjusted OM (SAOM), or (c) Dispatch Data Analysis OM (DDOM), or (d) Average OM (AOM). “Dispatch data analysis should be the first methodological choice. Where this option is not selected project participants shall justify why and may use the simple OM, the simple adjusted OM or the average emission rate method taking into account the provisions outlined hereafter.
The Simple OM method (a) can only be used where low-cost/must run resources3 constitute less than 50% of total grid generation in: 1) average of the five most recent years, or 2) based on long-term normals for hydroelectricity production.
The average emission rate method (d) can only be used
where low-cost/must run resources constitute more than 50% of total grid generation and detailed data to apply option (b) is not available, and where detailed data to apply option (c) above is unavailable.”
The JAMALI grid is complex. It includes more than 200 individual electric generators, driven by a variety of turbines, themselves driven by a variety of energy sources.
For the operating margin, data is not publicly available with which to calculate this margin using the dispatch data analysis method. The choice thus narrows to the Simple or Average OM. CGI was able to show (see later) that low-cost/must run resources constituted more than 50% of total grid generation in the five most recent years and therefore that the Average OM could be applied. ACM0002 (Version 6) defines the Average Operating Margin (OM) emission factor (EFOM,average,y) as:
PROJECT DESIGN DOCUMENT FORM (CDM PDD) - Version 02 CDM – Executive Board page 33
This template shall not be altered. It shall be completed without modifying/adding headings or logo, format or font.
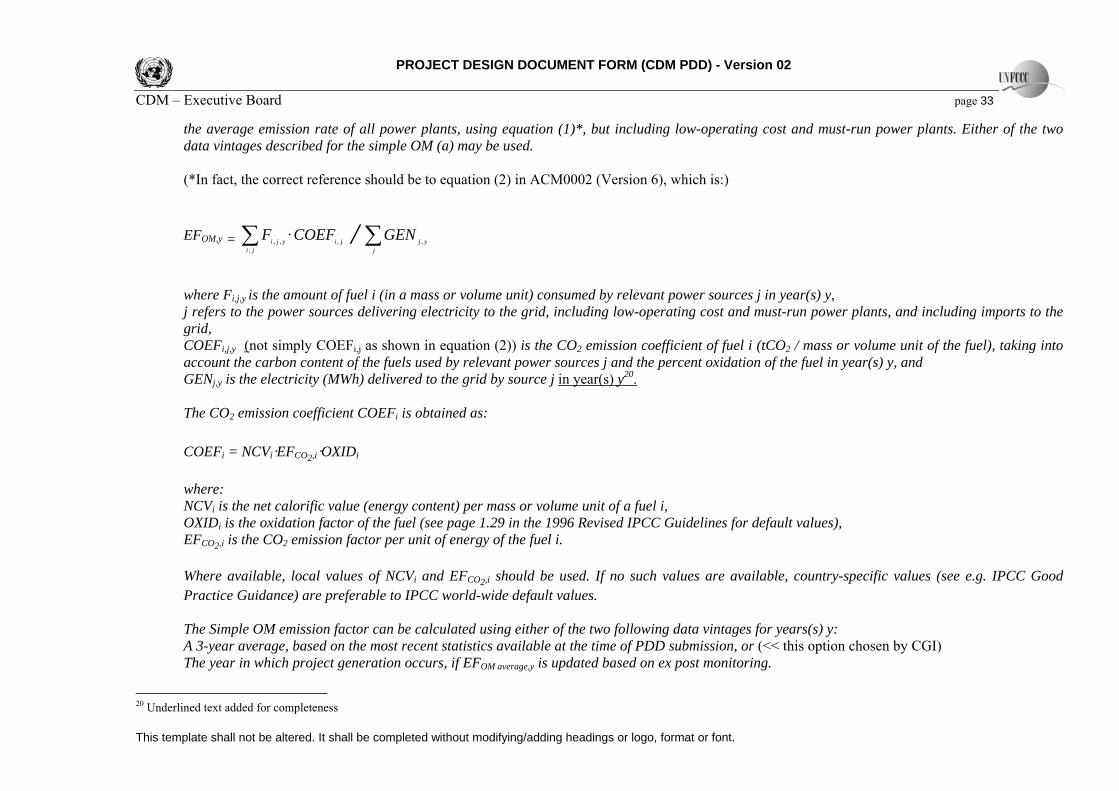
the average emission rate of all power plants, using equation (1)*, but including low-operating cost and must-run power plants. Either of the two data vintages described for the simple OM (a) may be used. (*In fact, the correct reference should be to equation (2) in ACM0002 (Version 6), which is:)
EFOM,y = ∑ji
jiyji COEFF,
,,, · / ∑j
yjGEN ,
where Fi,j,y is the amount of fuel i (in a mass or volume unit) consumed by relevant power sources j in year(s) y, j refers to the power sources delivering electricity to the grid, including low-operating cost and must-run power plants, and including imports to the grid, COEFi,j,y (not simply COEFi,j as shown in equation (2)) is the CO2 emission coefficient of fuel i (tCO2 / mass or volume unit of the fuel), taking into account the carbon content of the fuels used by relevant power sources j and the percent oxidation of the fuel in year(s) y, and GENj,y is the electricity (MWh) delivered to the grid by source j in year(s) y20. The CO2 emission coefficient COEFi is obtained as: COEFi = NCVi·EFCO2,i·OXIDi where: NCVi is the net calorific value (energy content) per mass or volume unit of a fuel i, OXIDi is the oxidation factor of the fuel (see page 1.29 in the 1996 Revised IPCC Guidelines for default values), EFCO2,i is the CO2 emission factor per unit of energy of the fuel i. Where available, local values of NCVi and EFCO2,i should be used. If no such values are available, country-specific values (see e.g. IPCC Good Practice Guidance) are preferable to IPCC world-wide default values. The Simple OM emission factor can be calculated using either of the two following data vintages for years(s) y: A 3-year average, based on the most recent statistics available at the time of PDD submission, or (<< this option chosen by CGI) The year in which project generation occurs, if EFOM average,y is updated based on ex post monitoring.
20 Underlined text added for completeness
PROJECT DESIGN DOCUMENT FORM (CDM PDD) - Version 02 CDM – Executive Board page 34
This template shall not be altered. It shall be completed without modifying/adding headings or logo, format or font.
Data was sought from official sources in order to calculate the operating and build margins for the JAMALI grid. Several approaches were made to generators and the national dispatch center. Several meetings were held with stakeholders through 2005 and 2006 at which the data requirements for ACM0002 were described and discussed. These meetings were called by the government body which had been appointed (by the Minister of the Environment) as the CDM Focal Point for renewable electricity projects, namely the Sub-Directorate of New Energy and Energy Conservation within the Directorate of Electricity and Energy Utilization (DJLPE) of the Ministry of Energy and Mineral Resources. The stakeholders included: Ministry of the Environment Ministry of Energy and Mineral Resources Non Governmental Organisations PT Pertamina (Persero) PT PLN (Persero) (Pusat, P3B) PLN generating companies (PTPJB, PTIP) IPPs (coal and geothermal)
The following data was supplied from various sources for the JAMALI grid: The electricity dispatched onto the JAMALI grid by each generating unit for the 5 years 2000-2004, and information as to the type of power plant (from
the PLN Dispatch Center; P3B) Fuel consumed by power plants operated by PTPJB for years 1999-2004 (from PTPJB) Year of first operation for all power plants operated by PTIP and of the fossil fuel power plants of PTPJB (from PTIP and PTPJB) Low cost / Must Run status of PTPJB’s thermal power plants Coal consumed by Paiton Energy Company (2002-2004), analyses of coals used plus the mix ratio of these coals Coal consumed by Jawa Power Company (2003-2004), analyses of coals used plus the mix ratio of these coals PTIP’s design coal specification for the Suralaya Power Station, plus some analyses of typical coals supplied to Suralaya DJLPE annual Indonesia statistics on electricity and energy for 2000-2004 (including lumped values for electricity generated and fuel consumed by PLN
and electricity purchased by PLN from IPPs) DJGSDM annual Indonesia statistics on minerals and coal for 2004 (including the quantities of coal consumed by domestic coal users for electricity
production 2003-2004) Actual non-condensable gas contents and steam consumption data for Darajat Unit II, Gunung Salak Units 1-6, and estimated values for Wayang Windu
geothermal power plants.
PROJECT DESIGN DOCUMENT FORM (CDM PDD) - Version 02 CDM – Executive Board page 35
This template shall not be altered. It shall be completed without modifying/adding headings or logo, format or font.
Based on the data received as detailed above, for fossil fuel fired power plants, CGI calculated the mass CO2 emissions (the numerator in the equation for EFOM above) of each fossil fuel fired generating unit on the JAMALI grid as below. Where information was missing from the above data sets, CGI made assumptions or used IPCC default values (Indonesia-specific where available) in order to calculate the mass emissions. Items [1] through [5] below define the hierarchical approach used by CGI where CO2 mass emissions were calculated for each generator based on the type of generator and the actual quantity and actual carbon content of the fuel consumed, if any, and if known. When one or either of these two parameters was not available, the next most rigorous source of information was applied, with [1] being the most rigorous, and [5] being the least rigorous.
[1] When actual fuel consumption was given by the generator or was available from DJGSDM data and the actual carbon content of the fuel used by a specific generator was either known or could be estimated [applies to Paiton PTPJB, Paiton IPP (PEC:2002-2004, JP:2003-2004) and PTIP Suralaya (2003-2004) coal plants] CO2 emissions = fuel consumed x actual (or estimated) carbon content [converted to mass carbon per unit of fuel consumed] x IPCC
oxidation factor x 44/12 (refer Annex 3, Table 6.4)
[2] When actual fuel consumption was not given by the generator but a generator-specific fuel consumption for subsequent years was available from DJGSDM or IPP fuel data together with P3B generation data and the actual carbon content of the fuel used by a specific generator could be estimated [applies to PTIP and IPP coal plants not included in [1]] CO2 emissions = lumped specific fuel consumption/MWh x estimated carbon content [converted to mass carbon per unit of fuel
consumed] x IPCC oxidation factor x 44/12 x total MWh dispatched by generator (refer Annex 3, Table 6.4)
[3] When fuel consumption by a specific generator was known and actual carbon content of fuel was not known [applies to PTPJB oil and gas plants]
CO2 emissions = fuel consumed x IPCC Indonesia-specific default carbon content [converted to mass carbon per unit of fuel consumed] x IPCC oxidation factor x 44/12 (refer Annex 3, Table 6.2)
[4] When actual fuel consumption was not given by the generator but a lumped value was available from DJLPE statistics and actual carbon content of
fuel was not known [applies to PTIP and IPP steam oil plants and PTIP open cycle gas turbine oil fired plants]
CO2 emissions = lumped specific fuel consumption/MWh x IPCC Indonesia-specific default carbon content [converted to mass carbon per unit of fuel consumed] x IPCC oxidation factor x 44/12 x total MWh dispatched by generator (refer Annex 3, Table 6.3)
PROJECT DESIGN DOCUMENT FORM (CDM PDD) - Version 02 CDM – Executive Board page 36
This template shall not be altered. It shall be completed without modifying/adding headings or logo, format or font.
[5] When fuel consumption by generator type or by generator was not known and actual carbon content of fuel was not known [applies to PTIP open cycle gas turbine and IPP combined cycle gas turbine plants]
CO2 emissions = IPCC Reference Indonesia-specific Fuel-specific Carbon Emission Factor x 44/12 x IPCC oxidation factor x industry-
typical heat rate x total MWh dispatched by generator (refer Annex 3, Table 6.5)
Other required assumptions related to fossil fuel combustion were: [6] When a liquid fuel was combusted in a gas turbine, but the type of liquid fuel was not known, it was assumed to be gas/diesel oil per IPCC. When a
liquid fuel was combusted in an oil fired boiler, but the type of liquid fuel was not known, it was assumed to be crude oil per IPCC (refer Annex 3, Table 6.1).
[7] Industry-typical heat rates were selected based on typical values for new plant (refer Annex 3, Table 6.5). Mass CO2 emissions from non-fossil fuel power plants were calculated as: [8] When geothermal CO2 emissions per MWh were not known [applies to all geothermal plants except Darajat, Gunung Salak and Wayang Windu, for
which actual or approximate actual non-condensable gas concentrations and specific steam consumptions were known and thus for which plant-specific CO2 emissions could be calculated]
CO2 emissions = Darajat Unit III emissions/MWh x total MWh dispatched by generator (refer Annex 3, Table 10)
[9] For a hydro-electric power plant or a steam turbine in a combined cycle power plant
CO2 emissions = 0
Other data received, and assumptions made in its absence were: [10] Year of first operation (required for Build Margin) This was either as provided by the generators or, if the generators did not provide data, assumed by CGI based on information available to CGI
(PTPJB and PTIP provided most of this data for their plants (refer Annex 3, Tables A7 & A8)). The data were presented by year and were not further differentiated by month so if more than one generator came on line in a year, and any one of these generators tipped the 20% required for Build Margin, all generators which came on line in that year were included in the Build Margin calculation.
PROJECT DESIGN DOCUMENT FORM (CDM PDD) - Version 02 CDM – Executive Board page 37
This template shall not be altered. It shall be completed without modifying/adding headings or logo, format or font.
[11] Low-cost/Must-run (Yes or No for each generating source) This was either as provided by PTPJB (refer Annex 3, Table A6) or assumed by CGI on the following basis: ▪ All hydro-electric plants are Yes as they are low cost ▪ All IPPs are Yes because they are Must Run (Take or Pay) ▪ All non-IPP coal plants are Yes because they are either Low Cost or Must Run or both ▪ All PTIP thermal plants, excluding Suralaya, are No ▪ All PTIP geothermal plants are Yes.
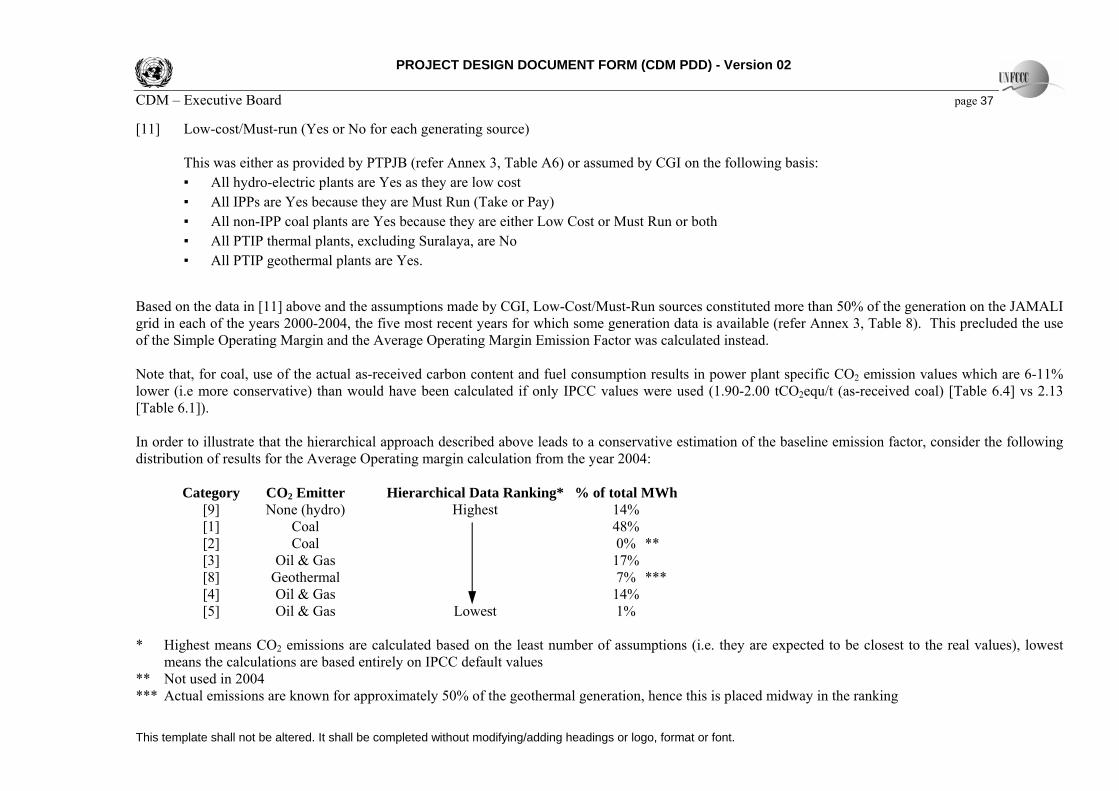
Based on the data in [11] above and the assumptions made by CGI, Low-Cost/Must-Run sources constituted more than 50% of the generation on the JAMALI grid in each of the years 2000-2004, the five most recent years for which some generation data is available (refer Annex 3, Table 8). This precluded the use of the Simple Operating Margin and the Average Operating Margin Emission Factor was calculated instead. Note that, for coal, use of the actual as-received carbon content and fuel consumption results in power plant specific CO2 emission values which are 6-11% lower (i.e more conservative) than would have been calculated if only IPCC values were used (1.90-2.00 tCO2equ/t (as-received coal) [Table 6.4] vs 2.13 [Table 6.1]). In order to illustrate that the hierarchical approach described above leads to a conservative estimation of the baseline emission factor, consider the following distribution of results for the Average Operating margin calculation from the year 2004: Category CO2 Emitter Hierarchical Data Ranking* % of total MWh [9] None (hydro) Highest 14% [1] Coal 48% [2] Coal 0% ** [3] Oil & Gas 17% [8] Geothermal 7% *** [4] Oil & Gas 14% [5] Oil & Gas Lowest 1% * Highest means CO2 emissions are calculated based on the least number of assumptions (i.e. they are expected to be closest to the real values), lowest
means the calculations are based entirely on IPCC default values ** Not used in 2004 *** Actual emissions are known for approximately 50% of the geothermal generation, hence this is placed midway in the ranking
PROJECT DESIGN DOCUMENT FORM (CDM PDD) - Version 02 CDM – Executive Board page 38
This template shall not be altered. It shall be completed without modifying/adding headings or logo, format or font.
This table shows that the higher ranked data ([9] & [1]) are a significant component of the calculation (more than 60% of the total generation), which supports the claim that this is a conservative approach (since use of the highest ranked data features strongly in the baseline emission factor calculation and it is associated with lower emissions than use of the IPCC default values).
The ranking of the inputs to the Build Margin, although not shown directly here, is even more significant due to the preponderance of coal (>80% of MWh) in the Build Margin calculation for 2004. Thus this hierarchical approach, which places coal at highest equal data ranking, strengthens the argument that the approach taken is conservative for both Operating Margin and Build Margin (because coal has the highest impact on the baseline calculation). It should be noted that the coal carbon contents used here are based on only a few data points. Nevertheless, as these are deemed to be representative, and their use leads to a conservative result, their use is appropriate. For each JAMALI generator a total emission value in tCO2 was calculated for each year 2002-2004. The Average Operating Margin Emission Factor (EFOM,average, y), in tCO2equ/MWh, is the sum of the carbon dioxide emissions of all generators for the years 2002-2003 in tonnes, divided by the sum of all electricity dispatched onto the JAMALI gird for the same period in MWh. The actual calculation is presented in Annex 3, Table 8. The value of the Average Operating Margin Emission Factor so calculated is 0.688 tCO2equ/MWh. STEP 2. Calculate the Build Margin emission factor (EFBM,y) as the generation-weighted average emission factor (tCO2equ/MWh) of a sample of power plants m, as follows:
EFBM,y = ∑mi
miymi COEFF,
,,, · / ∑m
ymGEN ,
where Fi,m,y, COEFi,m and GENm,y are analogous to the variables described for the simple OM method above for plants m21. ACM0002 permits two options: Option 1. Calculate the Build Margin emission factor EFBM,y ex ante based on the most recent information available on plants already built for sample group m at the time of PDD submission. The sample group m consists of either • the five power plants that have been built most recently, or • the power plants capacity additions in the electricity system that comprise 20% of the system generation (in MWh) and that have been built most recently. Project participants should use from these two options that sample group that comprises the larger annual generation. If 20% falls on part capacity of a plant, that plant is fully included in the calculation. 21 The bold font is used to indicate wording which supports use of the three year data vintage (refer to the OM definitions), in the BM calculation
PROJECT DESIGN DOCUMENT FORM (CDM PDD) - Version 02 CDM – Executive Board page 39
This template shall not be altered. It shall be completed without modifying/adding headings or logo, format or font.
Option 2. For the first crediting period, the Build Margin emission factor EFBM,y must be updated annually ex post for the year in which actual project generation and associated emissions reductions occur. For subsequent crediting periods, EFBM,y should be calculated ex-ante, as described in option 1 above. The sample group m consists of either
• the five power plants that have been built most recently, or • the power plants capacity additions in the electricity system that comprise 20% of the system generation (in MWh) and that have been built most recently.
Project participants should use from these two options that sample group that comprises the larger annual generation. If 20% falls on part capacity of a plant, that plant is fully included in the calculation.
CGI has chosen Option 1. The data required to calculate the value of the Build Margin Emission Factor is a sub-set of the data points used to calculate the Average Operating Margin Emission Factor. To choose the sub-set (m) of data points, in each of the three years 2002, 2003 and 2004, the most recent plants are selected to achieve the 20% criteria in the year 2004. The same set of plants which meets this criterion in 2004 is fixed and selected again for both 2003 and 2004. Developing the Build Margin Emission Factor based on three years provides a representative sample of capacity additions on the grid and follows the methodology which states that the sub-set (m) of data points as defined in the Simple Adjusted Operating Margin should be used. ACM0002 is not 100% clear regarding how many years of data should be applied to calculate the Build Margin. Alternatives to the position taken here would be (1) use only the most recent data (2004), or (2) calculate the set of plants meeting the criteria in 2002, 2003 and 2004, and in each of these years choose the set of plants which meets the criteria in that year (this could result in three different sets of plants, with overlap). The Build Margin was calculated according to the three different alternatives. The chosen alternative was the most conservative (i.e. it gave the lowest value for the Build Margin).
The Build Margin Emission Factor (EFBM,y), in tCO2equ/MWh, is the sum of the carbon dioxide emissions in 2002, 2003 and 20004 of the set of mi generators selected for the year i =2004, in tonnes, divided by the sum of all electricity dispatched onto the JAMALI grid for the same three year period in MWh by this set of generators. The actual calculation is presented in Annex 3, Table 8. The value of the Build Margin Emission Factor so calculated is 0.820 tCO2equ/MWh.
STEP 3. Calculate the baseline emission factor EFy as the weighted average of the Operating Margin Emission Factor (EFOM,y) and the Build Margin Emission Factor (EFBM,y):
EFy = wOM · EFOM,y + wBM · EFBM,y
where the weights wOM and wBM are 50% (i.e., wOM = wBM = 0.5), and EFOM,y and EFBM,y are calculated as described in Steps 1 and 2 above and are expressed in tCO2equ/MWh.
The value of the JAMALI Baseline Emission Factor so calculated is 0.754 tCO2equ/MWh. The application of ACM0002 to calculate the JAMALI Baseline Emission Factor was reviewed by the stakeholders and acknowledged by them on 17 April 2006. The value calculated at that time was officially submitted as the JAMALI Baseline Emission Factor for 2004 by the Director General of Electricity and Energy Utilization, Ministry of Energy and Mineral Resources, to the Chairperson of the Designated National Authority of Indonesia on 28 April 2006 (Refer Annex 3, Attachment 3.1). Subsequently an updated value of 0.754 tCO2equ/MWh was agreed with stakeholders on 22 August 2006. The Designated National Authority notified this updated value on 12 September 2006 (Refer Annex 3, Attachment 3.2).
PROJECT DESIGN DOCUMENT FORM (CDM PDD) - Version 02 CDM – Executive Board page 40
This template shall not be altered. It shall be completed without modifying/adding headings or logo, format or font.
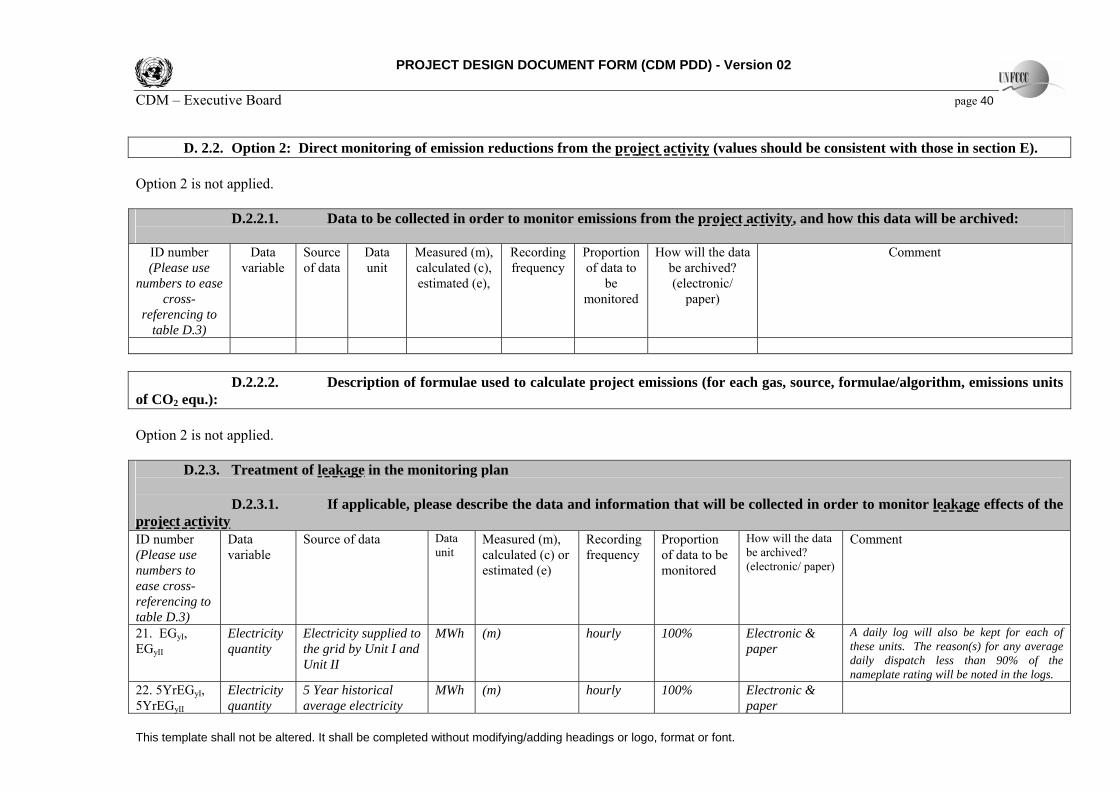
D. 2.2. Option 2: Direct monitoring of emission reductions from the project activity (values should be consistent with those in section E).
Option 2 is not applied.
D.2.2.1. Data to be collected in order to monitor emissions from the project activity, and how this data will be archived:
ID number (Please use
numbers to ease cross-
referencing to table D.3)
Data variable
Source of data
Data unit
Measured (m), calculated (c), estimated (e),
Recording frequency
Proportion of data to
be monitored
How will the data be archived? (electronic/
paper)
Comment
D.2.2.2. Description of formulae used to calculate project emissions (for each gas, source, formulae/algorithm, emissions units of CO2 equ.): Option 2 is not applied.
D.2.3. Treatment of leakage in the monitoring plan
D.2.3.1. If applicable, please describe the data and information that will be collected in order to monitor leakage effects of the project activity ID number (Please use numbers to ease cross-referencing to table D.3)
Data variable
Source of data Data unit
Measured (m), calculated (c) or estimated (e)
Recording frequency
Proportion of data to be monitored
How will the data be archived? (electronic/ paper)
Comment
21. EGyI, EGyII
Electricity quantity
Electricity supplied to the grid by Unit I and Unit II
MWh (m) hourly 100% Electronic & paper
A daily log will also be kept for each of these units. The reason(s) for any average daily dispatch less than 90% of the nameplate rating will be noted in the logs.
22. 5YrEGyI, 5YrEGyII
Electricity quantity
5 Year historical average electricity
MWh (m) hourly 100% Electronic & paper
PROJECT DESIGN DOCUMENT FORM (CDM PDD) - Version 02 CDM – Executive Board page 41
This template shall not be altered. It shall be completed without modifying/adding headings or logo, format or font.
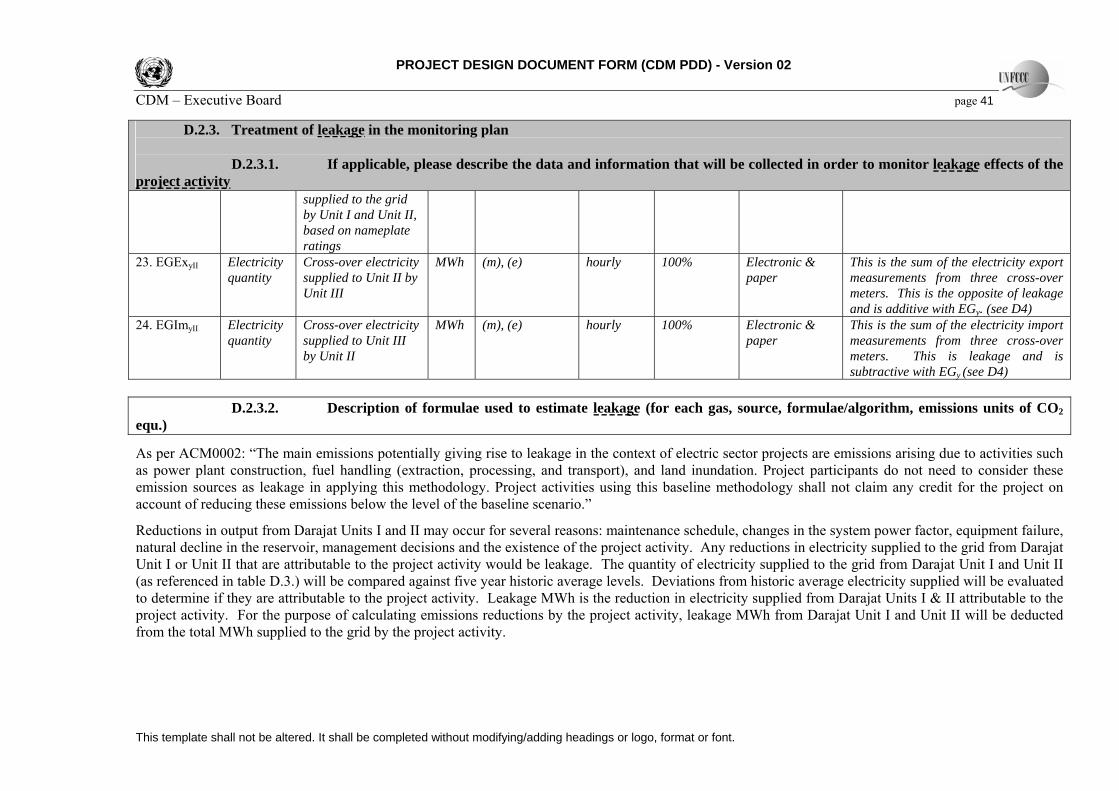
D.2.3. Treatment of leakage in the monitoring plan
D.2.3.1. If applicable, please describe the data and information that will be collected in order to monitor leakage effects of the project activity
supplied to the grid by Unit I and Unit II, based on nameplate ratings
23. EGExyII Electricity quantity
Cross-over electricity supplied to Unit II by Unit III
MWh (m), (e) hourly 100% Electronic & paper
This is the sum of the electricity export measurements from three cross-over meters. This is the opposite of leakage and is additive with EGy. (see D4)
24. EGImyII Electricity quantity
Cross-over electricity supplied to Unit III by Unit II
MWh (m), (e) hourly 100% Electronic & paper
This is the sum of the electricity import measurements from three cross-over meters. This is leakage and is subtractive with EGy (see D4)
D.2.3.2. Description of formulae used to estimate leakage (for each gas, source, formulae/algorithm, emissions units of CO2
equ.)
As per ACM0002: “The main emissions potentially giving rise to leakage in the context of electric sector projects are emissions arising due to activities such as power plant construction, fuel handling (extraction, processing, and transport), and land inundation. Project participants do not need to consider these emission sources as leakage in applying this methodology. Project activities using this baseline methodology shall not claim any credit for the project on account of reducing these emissions below the level of the baseline scenario.”
Reductions in output from Darajat Units I and II may occur for several reasons: maintenance schedule, changes in the system power factor, equipment failure, natural decline in the reservoir, management decisions and the existence of the project activity. Any reductions in electricity supplied to the grid from Darajat Unit I or Unit II that are attributable to the project activity would be leakage. The quantity of electricity supplied to the grid from Darajat Unit I and Unit II (as referenced in table D.3.) will be compared against five year historic average levels. Deviations from historic average electricity supplied will be evaluated to determine if they are attributable to the project activity. Leakage MWh is the reduction in electricity supplied from Darajat Units I & II attributable to the project activity. For the purpose of calculating emissions reductions by the project activity, leakage MWh from Darajat Unit I and Unit II will be deducted from the total MWh supplied to the grid by the project activity.
PROJECT DESIGN DOCUMENT FORM (CDM PDD) - Version 02 CDM – Executive Board page 42
This template shall not be altered. It shall be completed without modifying/adding headings or logo, format or font.
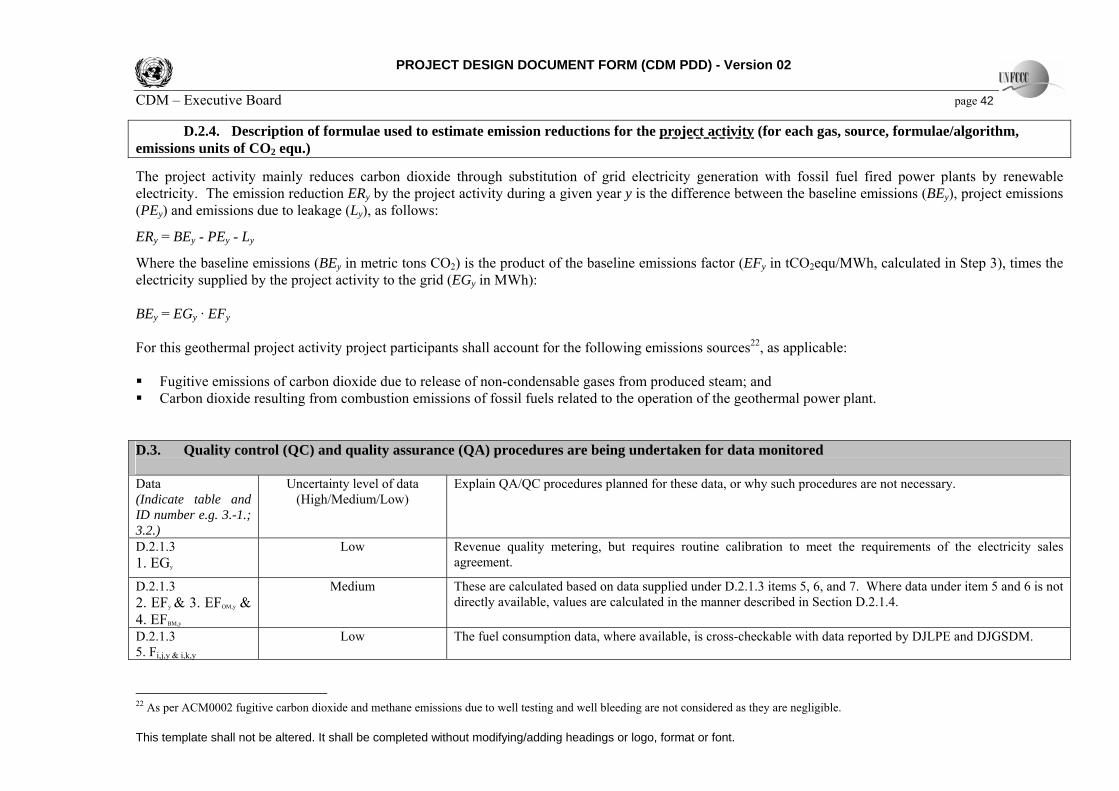
D.2.4. Description of formulae used to estimate emission reductions for the project activity (for each gas, source, formulae/algorithm, emissions units of CO2 equ.)
The project activity mainly reduces carbon dioxide through substitution of grid electricity generation with fossil fuel fired power plants by renewable electricity. The emission reduction ERy by the project activity during a given year y is the difference between the baseline emissions (BEy), project emissions (PEy) and emissions due to leakage (Ly), as follows:
ERy = BEy - PEy - Ly
Where the baseline emissions (BEy in metric tons CO2) is the product of the baseline emissions factor (EFy in tCO2equ/MWh, calculated in Step 3), times the electricity supplied by the project activity to the grid (EGy in MWh): BEy = EGy · EFy For this geothermal project activity project participants shall account for the following emissions sources22, as applicable: Fugitive emissions of carbon dioxide due to release of non-condensable gases from produced steam; and Carbon dioxide resulting from combustion emissions of fossil fuels related to the operation of the geothermal power plant.
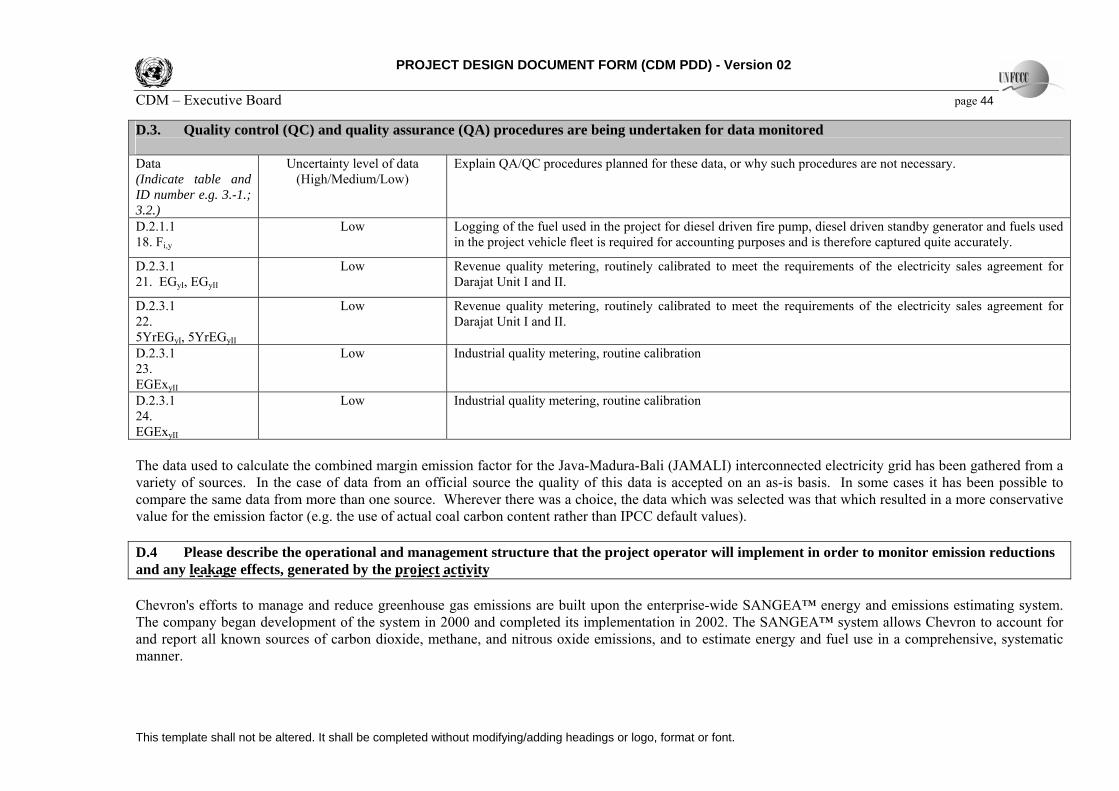
D.3. Quality control (QC) and quality assurance (QA) procedures are being undertaken for data monitored Data (Indicate table and ID number e.g. 3.-1.; 3.2.)
Uncertainty level of data (High/Medium/Low)
Explain QA/QC procedures planned for these data, or why such procedures are not necessary.
D.2.1.3 1. EGy
Low Revenue quality metering, but requires routine calibration to meet the requirements of the electricity sales agreement.
D.2.1.3 2. EFy & 3. EFOM,y & 4. EFBM,y
Medium These are calculated based on data supplied under D.2.1.3 items 5, 6, and 7. Where data under item 5 and 6 is not directly available, values are calculated in the manner described in Section D.2.1.4.
D.2.1.3 5. Fi,j,y & i,k,y
Low The fuel consumption data, where available, is cross-checkable with data reported by DJLPE and DJGSDM.
22 As per ACM0002 fugitive carbon dioxide and methane emissions due to well testing and well bleeding are not considered as they are negligible.
PROJECT DESIGN DOCUMENT FORM (CDM PDD) - Version 02 CDM – Executive Board page 43
This template shall not be altered. It shall be completed without modifying/adding headings or logo, format or font.
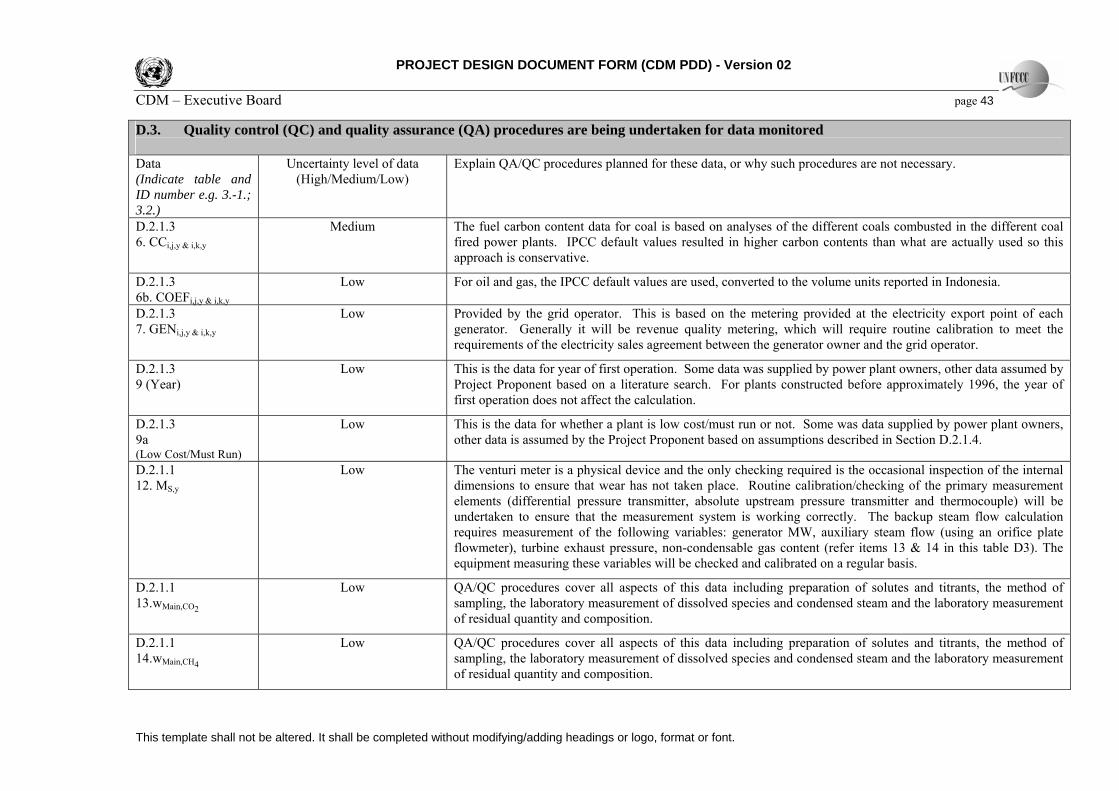
D.3. Quality control (QC) and quality assurance (QA) procedures are being undertaken for data monitored Data (Indicate table and ID number e.g. 3.-1.; 3.2.)
Uncertainty level of data (High/Medium/Low)
Explain QA/QC procedures planned for these data, or why such procedures are not necessary.
D.2.1.3 6. CCi,j,y & i,k,y
Medium The fuel carbon content data for coal is based on analyses of the different coals combusted in the different coal fired power plants. IPCC default values resulted in higher carbon contents than what are actually used so this approach is conservative.
D.2.1.3 6b. COEFi,j,y & i,k,y
Low For oil and gas, the IPCC default values are used, converted to the volume units reported in Indonesia.
D.2.1.3 7. GENi,j,y & i,k,y
Low Provided by the grid operator. This is based on the metering provided at the electricity export point of each generator. Generally it will be revenue quality metering, which will require routine calibration to meet the requirements of the electricity sales agreement between the generator owner and the grid operator.
D.2.1.3 9 (Year)
Low This is the data for year of first operation. Some data was supplied by power plant owners, other data assumed by Project Proponent based on a literature search. For plants constructed before approximately 1996, the year of first operation does not affect the calculation.
D.2.1.3 9a (Low Cost/Must Run)
Low This is the data for whether a plant is low cost/must run or not. Some was data supplied by power plant owners, other data is assumed by the Project Proponent based on assumptions described in Section D.2.1.4.
D.2.1.1 12. MS,y
Low The venturi meter is a physical device and the only checking required is the occasional inspection of the internal dimensions to ensure that wear has not taken place. Routine calibration/checking of the primary measurement elements (differential pressure transmitter, absolute upstream pressure transmitter and thermocouple) will be undertaken to ensure that the measurement system is working correctly. The backup steam flow calculation requires measurement of the following variables: generator MW, auxiliary steam flow (using an orifice plate flowmeter), turbine exhaust pressure, non-condensable gas content (refer items 13 & 14 in this table D3). The equipment measuring these variables will be checked and calibrated on a regular basis.
D.2.1.1 13.wMain,CO2
Low QA/QC procedures cover all aspects of this data including preparation of solutes and titrants, the method of sampling, the laboratory measurement of dissolved species and condensed steam and the laboratory measurement of residual quantity and composition.
D.2.1.1 14.wMain,CH4
Low QA/QC procedures cover all aspects of this data including preparation of solutes and titrants, the method of sampling, the laboratory measurement of dissolved species and condensed steam and the laboratory measurement of residual quantity and composition.
PROJECT DESIGN DOCUMENT FORM (CDM PDD) - Version 02 CDM – Executive Board page 44
This template shall not be altered. It shall be completed without modifying/adding headings or logo, format or font.
D.3. Quality control (QC) and quality assurance (QA) procedures are being undertaken for data monitored Data (Indicate table and ID number e.g. 3.-1.; 3.2.)
Uncertainty level of data (High/Medium/Low)
Explain QA/QC procedures planned for these data, or why such procedures are not necessary.
D.2.1.1 18. Fi,y
Low Logging of the fuel used in the project for diesel driven fire pump, diesel driven standby generator and fuels used in the project vehicle fleet is required for accounting purposes and is therefore captured quite accurately.
D.2.3.1 21. EGyI, EGyII
Low Revenue quality metering, routinely calibrated to meet the requirements of the electricity sales agreement for Darajat Unit I and II.
D.2.3.1 22. 5YrEGyI, 5YrEGyII
Low Revenue quality metering, routinely calibrated to meet the requirements of the electricity sales agreement for Darajat Unit I and II.
D.2.3.1 23. EGExyII
Low Industrial quality metering, routine calibration
D.2.3.1 24. EGExyII
Low Industrial quality metering, routine calibration
The data used to calculate the combined margin emission factor for the Java-Madura-Bali (JAMALI) interconnected electricity grid has been gathered from a variety of sources. In the case of data from an official source the quality of this data is accepted on an as-is basis. In some cases it has been possible to compare the same data from more than one source. Wherever there was a choice, the data which was selected was that which resulted in a more conservative value for the emission factor (e.g. the use of actual coal carbon content rather than IPCC default values). D.4 Please describe the operational and management structure that the project operator will implement in order to monitor emission reductions and any leakage effects, generated by the project activity Chevron's efforts to manage and reduce greenhouse gas emissions are built upon the enterprise-wide SANGEA™ energy and emissions estimating system. The company began development of the system in 2000 and completed its implementation in 2002. The SANGEA™ system allows Chevron to account for and report all known sources of carbon dioxide, methane, and nitrous oxide emissions, and to estimate energy and fuel use in a comprehensive, systematic manner.
PROJECT DESIGN DOCUMENT FORM (CDM PDD) - Version 02 CDM – Executive Board page 45
This template shall not be altered. It shall be completed without modifying/adding headings or logo, format or font.
Chevron also established its first greenhouse gas emissions inventory protocol, which was updated on February 17, 2004, and provides guidelines, sets boundaries and establishes scope for what to report. It also defines emissions accounting principles and specific terminology for greenhouse gas emissions accounting and reporting. Together, the Protocol and the SANGEA™ system form the foundation for greenhouse gas emissions management throughout Chevron. Reductions in output from Darajat Units I and II may occur for several reasons: maintenance schedule, changes in the system power factor, equipment failure, natural decline in the reservoir, management decisions and the existence of the project activity. Any reductions in electricity supplied to the grid from Darajat Unit I or Unit II that are attributable to the project activity would be leakage. The quantity of electricity supplied to the grid from Darajat Unit I and Unit II (as referenced in table D.3.) will be compared against five year historic average levels. Deviations from historic average electricity supplied will be evaluated to determine if they are attributable to the project activity. Leakage MWh is the reduction in electricity supplied from Darajat Units I & II attributable to the project activity. For the purpose of calculating emissions reductions by the project activity, leakage MWh from Darajat Unit I and Unit II will be deducted from the total MWh supplied to the grid by the project activity. The emission reductions from Darajat Unit III are calculated from the product of the combined margin emission factor and the electricity dispatched by Darajat Unit III, less any CO2equ emissions from the Darajat Unit III project (from CO2 and CH4 in the steam supplied to the project), less any leakage as per previous paragraph. Additional to the SANGEA™ energy and emissions estimating system, CGI will prepare a Monitoring Plan for Emissions Reductions from the Darajat Unit III Project prior to the commencement of generation of emissions reductions. This will define what variables are to be monitored, how frequently they will be monitored, how the quality of the variable data gathered will be checked and maintained and archived, and who (within the CGI organization) will be responsible for the implementation and routine management, reporting and auditing of the ongoing Monitoring Plan. This process will assure the accuracy and validity of the emissions reductions calculated on a regular basis and submitted to the DOE for CERs Certification. As mentioned in D2.1, CO2 and CH4 in the steam supplied to the project will be monitored through regular sampling of the steam supplied to the project, as defined in the Monitoring Plan. The calculation of mass of CO2 and CH4 in the steam supplied to the project involves two main variables: steam flow and CO2 and CH4 concentration in the steam flow. Steam flow is measured continuously and stored in a database. The process variables required to measure steam flow are steam temperature, steam pressure and differential pressure across the venturi flow meter. These parameters are recorded continuously and the primary elements will be checked and calibrated based on a frequency defined in the Monitoring Plan. Calibration will be carried out by the Darajat Unit III instrument technicians following a procedure, and to a frequency which will be included in the Monitoring Plan. In addition to regular calibration of the primary measurement elements, additional Quality Control will be exercised on a not-less-than hourly basis by retrospectively comparing the measured venturi steam flow against a check steam flow calculated from a) the actual measured gross turbine power and the known relationship between gross turbine power and turbine steam flow (including the impact of significant variables on this relationship) plus b) the measured auxiliary steam flow measured by an orifice plate flowmeter. In any hour if the measured venturi steam flow data is missing or varies significantly from the check steam flow, the value to be used for steam flow will be the higher of the measured venturi steam flow or the check steam flow except if the measured steam flow is more than 105% of the check steam flow in which case the value to be used will be 105% of the check steam flow. The CO2 and CH4 concentration in the steam flow will be
PROJECT DESIGN DOCUMENT FORM (CDM PDD) - Version 02 CDM – Executive Board page 46
This template shall not be altered. It shall be completed without modifying/adding headings or logo, format or font.
analysed from samples taken from the steam line supplying steam to Unit III at the frequency defined in the Monitoring Plan. Such samples will be obtained using ASTM method E 1675 referred to in ACM0002 and analysed in an accredited laboratory for the constituents of interest, CO2 and CH4 (and CO will be analyzed for as long as it takes to confirm the assumption that this is not present). At each sampling, duplicate samples will be taken and both will be analysed. If the CO2 analysis results of the duplicate samples vary by more than 10%, further samples will be taken until agreement is obtained within 10%. To monitor potential leakage associated with Darajat Units I and II, the Monitoring Plan will call for the routine logging of the status of Darajat Units I & II, as well as the electricity generated by Darajat Unit I & II. The reason for any reduction in gross output more than 10% below the nameplate rating of the unit will be noted in the log. Whenever the annual output of Darajat Unit I or II is below five year historic average levels (based on nameplate ratings), the unit log will be examined to determine whether or not the reduction in output is attributable to Darajat Unit III. The Monitoring Plan will call for review and confirmation that the electrical energy dispatch meters associated with Darajat Units I, II and III are routinely calibrated. Regular calibration is required by the Electricity Sales Contract covering these three units, and the purpose of the Monitoring Plan will be to focus regularly on ensuring that this does happen. Consistent with ACM0002, Version 6, Darajat Unit III Project is required to monitor: “carbon dioxide emissions resulting from combustion of fossil fuels related to the operation of the geothermal power plant”. The methodology is silent on whether or how this should be apportioned when the CDM Project is added to an existing facility in which there is existing use of fossil fuels. ACM0002, Version 7, includes a "Tool to calculate project or leakage CO2 emissions from fossil fuel combustion" to be used for the calculation of project emissions from fossil fuel combustion. Under FCi,j,y (Quantity of fuel type i combusted in process j during the year y) this notes "The consistency of metered fuel consumption quantities should be crosschecked by an annual energy balance that is based on purchased quantities and stock changes. Where the purchased fuel invoices can be identified specifically for the CDM project, the metered fuel consumption quantities should also be cross-checked with available purchase invoices from the financial records". However, this tool does not provide any guidance on how to apportion fuel consumption to a CDM project when the measured quantities cover activities which are wider than the CDM project activity. Options for apportioning the total asset fossil fuel consumption to the Darajat Unit III Geothermal Project could be (from highest project emissions to lowest project emissions) include: (a) Allocate based on the ratio: (installed gross generation capacity of Darajat Unit III)/(total installed gross generation capacity at the Darajat asset operated
by CGI) (b) Allocate based on the increase in consumption of fossil fuels at the Darajat asset above a historical baseline of consumption over the five years preceding
the operation of the Darajat Unit III power project. Option (b) is supportable, but is not as conservative as option (a). CGI will use option (a) to determine the “carbon dioxide emissions resulting from combustion of fossil fuels related to the operation of the geothermal power plant”. The total fossil fuel consumption for the Darajat asset will include fuel consumed for operational and maintenance activities as purchased by the Darajat asset, and fuel consumed for drilling activities at the Darajat geothermal resource, either purchased by CGI or CGI’s subcontractors. It is conservative as it does not allocate fossil fuel consumption to CGI’s steam supply activities associated with Darajat Unit I.
PROJECT DESIGN DOCUMENT FORM (CDM PDD) - Version 02 CDM – Executive Board page 47
This template shall not be altered. It shall be completed without modifying/adding headings or logo, format or font.
The Darajat Unit III Geothermal Project has been added to a geothermal reservoir where two existing non-CDM electricity generating units (Units I & II) take steam from the same reservoir and convert this to electricity delivered to the interconnected grid. As there are one medium voltage (6.8kV) and two low voltage (380V) connections (cross-overs) between Unit III and the adjacent Unit II which is located in the same powerhouse building, it is possible for Unit III to supply electricity to Unit II (the quantum of which (EGExyII) must be added to the net electrical energy delivered to the grid since it has lead to a reduction in baseline emissions elsewhere) and for Unit II to supply Unit III (the quantum of which (EGImyII) must be deducted from the net electrical energy delivered to the grid since it has lead to an increase in baseline emissions elsewhere – this is conservative as there are some common services supplied by Unit III which may need to be fed from Unit II when Unit III is not operational). This cross-over electricity is normally zero (the cross-over circuit breakers being normally open). Bidirectional electrical energy metering will be installed at each cross-over and used to obtain values for EGExyII and EGImyII. Additionally, until the meters are installed (and if the meters, once installed, are not operating), the position of the cross-over circuit breakers will be monitored and if they are closed the duration of closure will be recorded and the estimated electrical energy flow will be estimated from the connected loads and the period of closure.
D.5 Name of person/entity determining the monitoring methodology:
Mr. Maher Sungkar Chevron Geothermal Indonesia Sentral Senayan I Jl. Asia Afrika No. 8 Jakarta 10270 INDONESIA OE/HES Manager Ph.: +62 21 5798 4278 Fax.: +62 21 5798 4477 Email: [email protected]


![Canon in D (C version) [Easy version] - Sheets Daily](https://img.pdfslide.net/doc/110x75/6331def97f0d9c38da012b43/canon-in-d-c-version-easy-version-sheets-daily.jpg)