Embed Size (px)
Citation preview
Waste Management 32 (2012) 2115–2125
Contents lists available at SciVerse ScienceDirect
Waste Management
journal homepage: www.elsevier .com/locate /wasman
Sustainable waste management in Africa through CDM projects
R. Couth, C. Trois ⇑CRECHE, Centre for Research in Environmental, Coastal and Hydrological Engineering, School of Engineering, University of KwaZulu-Natal, Durban 4041, South Africa
a r t i c l e i n f o a b s t r a c t
Article history:Received 13 August 2011Accepted 28 February 2012Available online 10 April 2012
Keywords:Waste managementWaste hierarchySustainable developmentClean Development Mechanism (CDM)Africa
0956-053X/$ - see front matter � 2012 Elsevier Ltd. Ahttp://dx.doi.org/10.1016/j.wasman.2012.02.022
Abbreviations: AD, Anaerobic Digestion; CDM, CleCDIAC, Carbon Dioxide Information Analysis CentReduction; CO2e, carbon dioxide equivalent; DAT,DM, dry matter; EU, European Union; EU-ETS, EuropScheme; EF, emission factors; EfW, energy from wasteGlobal Warming Factor; HDPE, high density pcomposting; LCA, life-cycle assessment; LDC, Least Ddensity polyethylene; MBT, mechanical biologicalrecovery facility; MSW, municipal solid waste; MWPublicly Available Specification; PDD, Project DesignEnergy Feed-In Tariff; UNFCCC, United Nations FrameChange; UNSD, United Nations Statistics Division; Vtions; ww, wet waste.⇑ Corresponding author. Tel.: +27 31 260 3065/55;
E-mail address: [email protected] (C. Trois).
Only few Clean Development Mechanism (CDM) projects (traditionally focussed on landfill gas combus-tion) have been registered in Africa if compared to similar developing countries. The waste hierarchyadopted by many African countries clearly shows that waste recycling and composting projects are gen-erally the most sustainable. This paper undertakes a sustainability assessment for practical waste treat-ment and disposal scenarios for Africa and makes recommendations for consideration. The appraisal inthis paper demonstrates that mechanical biological treatment of waste becomes more financially attrac-tive if established through the CDM process. Waste will continue to be dumped in Africa with increasinggreenhouse gas emissions produced, unless industrialised countries (Annex 1) fund carbon emissionreduction schemes through a replacement to the Kyoto Protocol. Such a replacement should calculateall of the direct and indirect carbon emission savings and seek to promote public–private partnershipsthrough a concerted support of the informal sector.
� 2012 Elsevier Ltd. All rights reserved.
1. Introduction
This paper assesses the sustainability of practical options for themanagement of urban municipal waste in Africa against disposal tolandfill and the recovery of landfill gas. The paper is the conclusionof a study to quantify greenhouse gas (GHG) emissions from wastemanagement activities in Africa and evaluate sustainable methodsfor controlling and reducing these emissions with the ultimate aimto propose to local authorities a philosophy for the sustainablemanagement of these refuse. The study is part of a larger researchproject on Zero Waste and Waste Management Strategies for theeffective reduction of carbon emissions in the atmosphere fromdeveloping countries (with focus on Africa), which has been con-ducted by the University of KwaZulu-Natal since 2002.
ll rights reserved.
an Development Mechanism;er; CER, Certified EmissionDome Aeration Technology;
ean Union Emissions Trading; GHG, greenhouse gas; GWF,olyethylene; IVC, in-vesseleveloped Country; LDPE, lowtreatment; MRF, materials
h, Mega Watt hours; PAS,Document; REFIT, Renewablework Convention on Climate
ER, Verified Emission Reduc-
fax: +27 31 260 1411.
An extensive review of waste management practices acrossAfrica (Couth and Trois, 2010) has concluded that the most sustain-able way to manage waste in the majority of urban communities isto:
� remove dry recyclables by scavenging, through door to door col-lection, and/or a dirty materials recovery facility (MRF);� compost the remaining biogenic waste in windrows, using the
maturated compost as a substitute fertilizer; and� dispose reject fossil carbon (plastics, synthetic textiles, metals)
and inert waste in sanitary landfills. If biogenic waste isremoved the landfills should not require biogas extraction sys-tems as the wastes will comprise mainly inert and fossil carbonwastes.
This waste management practice is in accordance with theinternationally adopted waste hierarchy. It will require limitedcapital investment in comparison to complex and expensive wastetreatment and landfill disposal systems which are typically used indeveloped countries. It will also require less technology andcomplexity.
The UNFCCC had sought to initiate GHG emission reductionsthrough the Kyoto Protocol, which includes the CDM (UnitedNations, December 1997). The Kyoto Protocol has two objectives,firstly to support developed countries to reach their emissionreduction targets through the mobilisation of more cost efficientreduction options in developing countries, and secondly to providefunding for sustainable development in developing countries(Couth and Trois, 2010). Round One of the Kyoto Protocol
2116 R. Couth, C. Trois / Waste Management 32 (2012) 2115–2125
concludes for the Validation and Registration of new projects inDecember 2012. There is less appetite for the Round Two periodafter December 2012–2017 or 2020, with no new initiativesplanned to 2020. The caution of funders, the bureaucracy of theCDM process, and the limited market for Certified Emission Reduc-tions (CERs) in Round Two of Kyoto make it less likely that manynew CDM projects will be initiated across Africa, although manycountries in Africa are Least Developed Countries (LDCs) and willbe favoured for the purchase of CERs by the European Union Emis-sions Trading Scheme (EU-ETS). The CDM is dying and a newreplacement mechanism is needed to control carbon emissionsfrom waste management in all developing countries.
This paper seeks to quantify the cost, in terms of carbon reduc-tions and social benefits, of different recycling and windrow com-posting options for municipal waste against disposal in landfills(with or without landfill gas and energy recovery systems). Follow-ing this introduction, the paper quantifies the emission reductionbenefits of recycling wastes and composting biogenic wastes. Thepaper summarises CDM waste opportunities in Africa, before mak-ing a sustainable development comparison of five scenarios forwaste management for the three elements of sustainability: eco-nomic, environmental and social. This paper provides conclusionson sustainable waste management in Africa and recommendationsto the UNFCCC for an improved replacement to CDM beyond 2012.
2. Waste recycling and composting
Solid waste managed by municipalities is generally referred toas municipal solid waste (MSW). The specific types of wastes in-cluded in MSW vary significantly, but essentially comprise ofmaterials, which can be recycled or composted.
2.1. Waste recycling
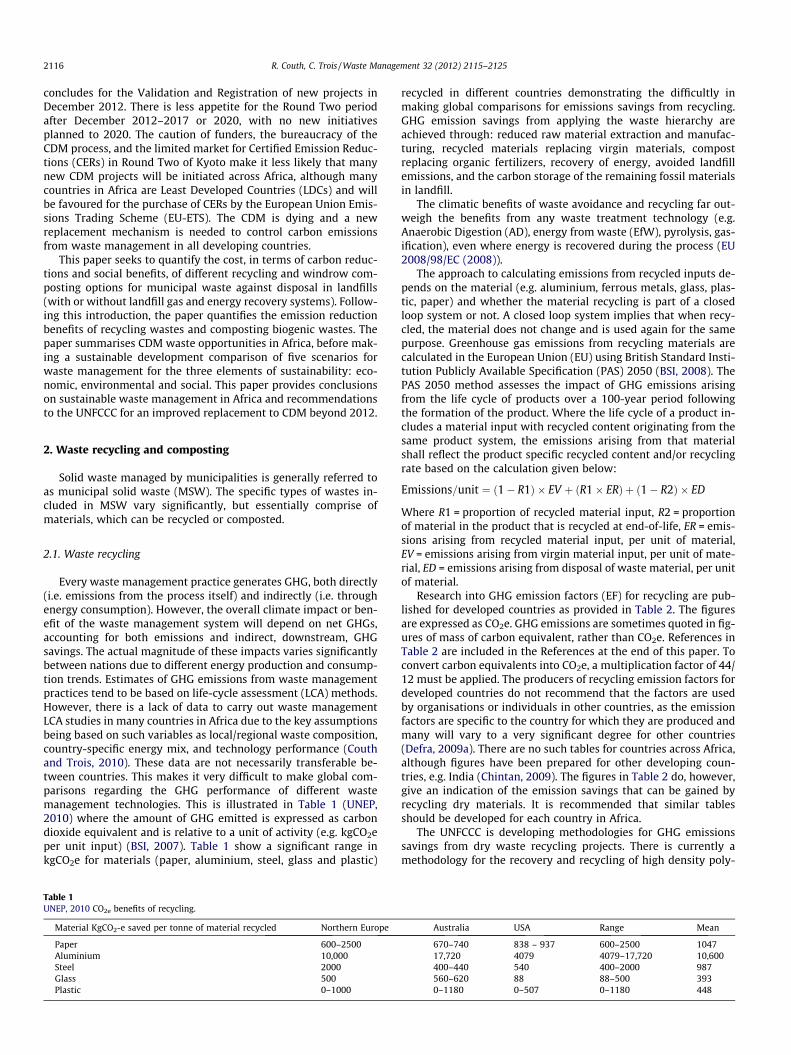
Every waste management practice generates GHG, both directly(i.e. emissions from the process itself) and indirectly (i.e. throughenergy consumption). However, the overall climate impact or ben-efit of the waste management system will depend on net GHGs,accounting for both emissions and indirect, downstream, GHGsavings. The actual magnitude of these impacts varies significantlybetween nations due to different energy production and consump-tion trends. Estimates of GHG emissions from waste managementpractices tend to be based on life-cycle assessment (LCA) methods.However, there is a lack of data to carry out waste managementLCA studies in many countries in Africa due to the key assumptionsbeing based on such variables as local/regional waste composition,country-specific energy mix, and technology performance (Couthand Trois, 2010). These data are not necessarily transferable be-tween countries. This makes it very difficult to make global com-parisons regarding the GHG performance of different wastemanagement technologies. This is illustrated in Table 1 (UNEP,2010) where the amount of GHG emitted is expressed as carbondioxide equivalent and is relative to a unit of activity (e.g. kgCO2eper unit input) (BSI, 2007). Table 1 show a significant range inkgCO2e for materials (paper, aluminium, steel, glass and plastic)
Table 1UNEP, 2010 CO2e benefits of recycling.
Material KgCO2-e saved per tonne of material recycled Northern Europe
Paper 600–2500Aluminium 10,000Steel 2000Glass 500Plastic 0–1000
recycled in different countries demonstrating the difficultly inmaking global comparisons for emissions savings from recycling.GHG emission savings from applying the waste hierarchy areachieved through: reduced raw material extraction and manufac-turing, recycled materials replacing virgin materials, compostreplacing organic fertilizers, recovery of energy, avoided landfillemissions, and the carbon storage of the remaining fossil materialsin landfill.
The climatic benefits of waste avoidance and recycling far out-weigh the benefits from any waste treatment technology (e.g.Anaerobic Digestion (AD), energy from waste (EfW), pyrolysis, gas-ification), even where energy is recovered during the process (EU2008/98/EC (2008)).
The approach to calculating emissions from recycled inputs de-pends on the material (e.g. aluminium, ferrous metals, glass, plas-tic, paper) and whether the material recycling is part of a closedloop system or not. A closed loop system implies that when recy-cled, the material does not change and is used again for the samepurpose. Greenhouse gas emissions from recycling materials arecalculated in the European Union (EU) using British Standard Insti-tution Publicly Available Specification (PAS) 2050 (BSI, 2008). ThePAS 2050 method assesses the impact of GHG emissions arisingfrom the life cycle of products over a 100-year period followingthe formation of the product. Where the life cycle of a product in-cludes a material input with recycled content originating from thesame product system, the emissions arising from that materialshall reflect the product specific recycled content and/or recyclingrate based on the calculation given below:
Emissions=unit ¼ ð1� R1Þ � EV þ ðR1� ERÞ þ ð1� R2Þ � ED
Where R1 = proportion of recycled material input, R2 = proportionof material in the product that is recycled at end-of-life, ER = emis-sions arising from recycled material input, per unit of material,EV = emissions arising from virgin material input, per unit of mate-rial, ED = emissions arising from disposal of waste material, per unitof material.
Research into GHG emission factors (EF) for recycling are pub-lished for developed countries as provided in Table 2. The figuresare expressed as CO2e. GHG emissions are sometimes quoted in fig-ures of mass of carbon equivalent, rather than CO2e. References inTable 2 are included in the References at the end of this paper. Toconvert carbon equivalents into CO2e, a multiplication factor of 44/12 must be applied. The producers of recycling emission factors fordeveloped countries do not recommend that the factors are usedby organisations or individuals in other countries, as the emissionfactors are specific to the country for which they are produced andmany will vary to a very significant degree for other countries(Defra, 2009a). There are no such tables for countries across Africa,although figures have been prepared for other developing coun-tries, e.g. India (Chintan, 2009). The figures in Table 2 do, however,give an indication of the emission savings that can be gained byrecycling dry materials. It is recommended that similar tablesshould be developed for each country in Africa.
The UNFCCC is developing methodologies for GHG emissionssavings from dry waste recycling projects. There is currently amethodology for the recovery and recycling of high density poly-
Australia USA Range Mean
670–740 838 – 937 600–2500 104717,720 4079 4079–17,720 10,600400–440 540 400–2000 987560–620 88 88–500 3930–1180 0–507 0–1180 448
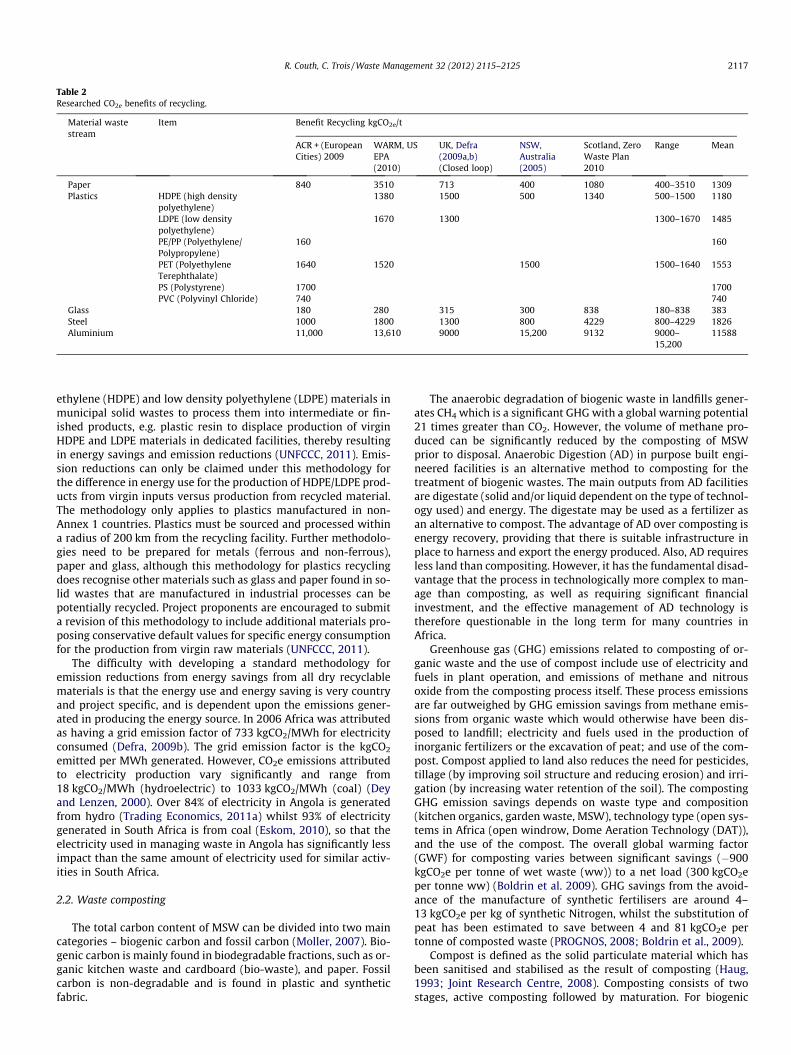
Table 2Researched CO2e benefits of recycling.
Material wastestream
Item Benefit Recycling kgCO2e/t
ACR + (EuropeanCities) 2009
WARM, USEPA(2010)
UK, Defra(2009a,b)(Closed loop)
NSW,Australia(2005)
Scotland, ZeroWaste Plan2010
Range Mean
Paper 840 3510 713 400 1080 400–3510 1309Plastics HDPE (high density
polyethylene)1380 1500 500 1340 500–1500 1180
LDPE (low densitypolyethylene)
1670 1300 1300–1670 1485
PE/PP (Polyethylene/Polypropylene)
160 160
PET (PolyethyleneTerephthalate)
1640 1520 1500 1500–1640 1553
PS (Polystyrene) 1700 1700PVC (Polyvinyl Chloride) 740 740
Glass 180 280 315 300 838 180–838 383Steel 1000 1800 1300 800 4229 800–4229 1826Aluminium 11,000 13,610 9000 15,200 9132 9000–
15,20011588
R. Couth, C. Trois / Waste Management 32 (2012) 2115–2125 2117
ethylene (HDPE) and low density polyethylene (LDPE) materials inmunicipal solid wastes to process them into intermediate or fin-ished products, e.g. plastic resin to displace production of virginHDPE and LDPE materials in dedicated facilities, thereby resultingin energy savings and emission reductions (UNFCCC, 2011). Emis-sion reductions can only be claimed under this methodology forthe difference in energy use for the production of HDPE/LDPE prod-ucts from virgin inputs versus production from recycled material.The methodology only applies to plastics manufactured in non-Annex 1 countries. Plastics must be sourced and processed withina radius of 200 km from the recycling facility. Further methodolo-gies need to be prepared for metals (ferrous and non-ferrous),paper and glass, although this methodology for plastics recyclingdoes recognise other materials such as glass and paper found in so-lid wastes that are manufactured in industrial processes can bepotentially recycled. Project proponents are encouraged to submita revision of this methodology to include additional materials pro-posing conservative default values for specific energy consumptionfor the production from virgin raw materials (UNFCCC, 2011).
The difficulty with developing a standard methodology foremission reductions from energy savings from all dry recyclablematerials is that the energy use and energy saving is very countryand project specific, and is dependent upon the emissions gener-ated in producing the energy source. In 2006 Africa was attributedas having a grid emission factor of 733 kgCO2/MWh for electricityconsumed (Defra, 2009b). The grid emission factor is the kgCO2
emitted per MWh generated. However, CO2e emissions attributedto electricity production vary significantly and range from18 kgCO2/MWh (hydroelectric) to 1033 kgCO2/MWh (coal) (Deyand Lenzen, 2000). Over 84% of electricity in Angola is generatedfrom hydro (Trading Economics, 2011a) whilst 93% of electricitygenerated in South Africa is from coal (Eskom, 2010), so that theelectricity used in managing waste in Angola has significantly lessimpact than the same amount of electricity used for similar activ-ities in South Africa.
2.2. Waste composting
The total carbon content of MSW can be divided into two maincategories – biogenic carbon and fossil carbon (Moller, 2007). Bio-genic carbon is mainly found in biodegradable fractions, such as or-ganic kitchen waste and cardboard (bio-waste), and paper. Fossilcarbon is non-degradable and is found in plastic and syntheticfabric.
The anaerobic degradation of biogenic waste in landfills gener-ates CH4 which is a significant GHG with a global warning potential21 times greater than CO2. However, the volume of methane pro-duced can be significantly reduced by the composting of MSWprior to disposal. Anaerobic Digestion (AD) in purpose built engi-neered facilities is an alternative method to composting for thetreatment of biogenic wastes. The main outputs from AD facilitiesare digestate (solid and/or liquid dependent on the type of technol-ogy used) and energy. The digestate may be used as a fertilizer asan alternative to compost. The advantage of AD over composting isenergy recovery, providing that there is suitable infrastructure inplace to harness and export the energy produced. Also, AD requiresless land than compositing. However, it has the fundamental disad-vantage that the process in technologically more complex to man-age than composting, as well as requiring significant financialinvestment, and the effective management of AD technology istherefore questionable in the long term for many countries inAfrica.
Greenhouse gas (GHG) emissions related to composting of or-ganic waste and the use of compost include use of electricity andfuels in plant operation, and emissions of methane and nitrousoxide from the composting process itself. These process emissionsare far outweighed by GHG emission savings from methane emis-sions from organic waste which would otherwise have been dis-posed to landfill; electricity and fuels used in the production ofinorganic fertilizers or the excavation of peat; and use of the com-post. Compost applied to land also reduces the need for pesticides,tillage (by improving soil structure and reducing erosion) and irri-gation (by increasing water retention of the soil). The compostingGHG emission savings depends on waste type and composition(kitchen organics, garden waste, MSW), technology type (open sys-tems in Africa (open windrow, Dome Aeration Technology (DAT)),and the use of the compost. The overall global warming factor(GWF) for composting varies between significant savings (�900kgCO2e per tonne of wet waste (ww)) to a net load (300 kgCO2eper tonne ww) (Boldrin et al. 2009). GHG savings from the avoid-ance of the manufacture of synthetic fertilisers are around 4–13 kgCO2e per kg of synthetic Nitrogen, whilst the substitution ofpeat has been estimated to save between 4 and 81 kgCO2e pertonne of composted waste (PROGNOS, 2008; Boldrin et al., 2009).
Compost is defined as the solid particulate material which hasbeen sanitised and stabilised as the result of composting (Haug,1993; Joint Research Centre, 2008). Composting consists of twostages, active composting followed by maturation. For biogenic
2118 R. Couth, C. Trois / Waste Management 32 (2012) 2115–2125
waste composting to be successful (Haug, 1993) the oxygen con-centration should be maintained above 15%; the temperature inthe composting process should be 50–60 �C; the moisture contentshould be 50–55%; the carbon to nitrogen (C:N) ratio should be be-tween 25:1 and 40:1 (Trois et al., 2007; SNIFFER, 2011); the pHshould be neutral, i.e. between 6.5 and 8; there should be a smallparticle size to allow greater surface area for aeration; and the Res-piration Index of the composted waste must be reduced to lessthan 5 gO2/kgDM (dry matter).
Crop residues and animal manure have traditionally been com-posted in long rows referred to as windrows. There are several op-tions for the management of oxygen and moisture in windrows:the windrows can be turned with moisture added; air can besucked on blown into the windrow; or pathways for air movementcan be provided by Dome Aeration Technology (DAT) (Parr et al.,1999; Trois et al., 2005, 2007). In-vessel composters (IVCs) are analternative to windrow composting and generally consist of metaltanks or concrete bunkers in which air flow and temperature canbe more readily controlled, using the principles of a ‘‘bioreactor’’(e.g. VCU, http://www.vcutechnology.com). IVCs are not consid-ered applicable to many territories in sub-Saharan Africa due toreasons of cost, availability of technology and maintenancerequirements.
In developed countries there is legislation for the quality ofMSW compost that can be applied to land. Compost from MSWin Europe must comply with PAS 100: 2011 Specification for com-post material (BSI, January 2011). This only permits compost fromsource segregated biowaste to be applied to land. The authors haveresearched similar standards for the application of biowaste toland in Africa and can find no similar legislation. For example,South Africa has no comparable legislation.
Likewise for composting projects, there is no market for com-posting projects without financial support. It is cheaper in the shortterm to dump waste than compost it. Markets for waste compostare not established in countries across Africa.
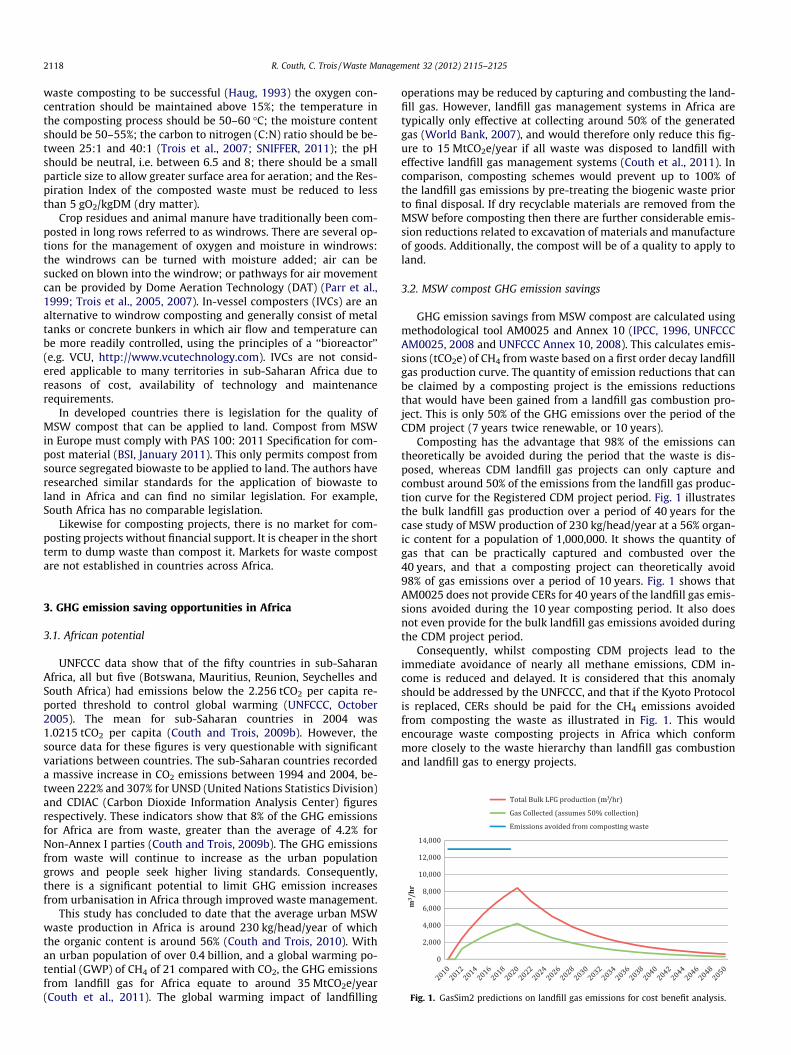
Fig. 1. GasSim2 predictions on landfill gas emissions for cost benefit analysis.
3. GHG emission saving opportunities in Africa
3.1. African potential
UNFCCC data show that of the fifty countries in sub-SaharanAfrica, all but five (Botswana, Mauritius, Reunion, Seychelles andSouth Africa) had emissions below the 2.256 tCO2 per capita re-ported threshold to control global warming (UNFCCC, October2005). The mean for sub-Saharan countries in 2004 was1.0215 tCO2 per capita (Couth and Trois, 2009b). However, thesource data for these figures is very questionable with significantvariations between countries. The sub-Saharan countries recordeda massive increase in CO2 emissions between 1994 and 2004, be-tween 222% and 307% for UNSD (United Nations Statistics Division)and CDIAC (Carbon Dioxide Information Analysis Center) figuresrespectively. These indicators show that 8% of the GHG emissionsfor Africa are from waste, greater than the average of 4.2% forNon-Annex I parties (Couth and Trois, 2009b). The GHG emissionsfrom waste will continue to increase as the urban populationgrows and people seek higher living standards. Consequently,there is a significant potential to limit GHG emission increasesfrom urbanisation in Africa through improved waste management.
This study has concluded to date that the average urban MSWwaste production in Africa is around 230 kg/head/year of whichthe organic content is around 56% (Couth and Trois, 2010). Withan urban population of over 0.4 billion, and a global warming po-tential (GWP) of CH4 of 21 compared with CO2, the GHG emissionsfrom landfill gas for Africa equate to around 35 MtCO2e/year(Couth et al., 2011). The global warming impact of landfilling
operations may be reduced by capturing and combusting the land-fill gas. However, landfill gas management systems in Africa aretypically only effective at collecting around 50% of the generatedgas (World Bank, 2007), and would therefore only reduce this fig-ure to 15 MtCO2e/year if all waste was disposed to landfill witheffective landfill gas management systems (Couth et al., 2011). Incomparison, composting schemes would prevent up to 100% ofthe landfill gas emissions by pre-treating the biogenic waste priorto final disposal. If dry recyclable materials are removed from theMSW before composting then there are further considerable emis-sion reductions related to excavation of materials and manufactureof goods. Additionally, the compost will be of a quality to apply toland.
3.2. MSW compost GHG emission savings
GHG emission savings from MSW compost are calculated usingmethodological tool AM0025 and Annex 10 (IPCC, 1996, UNFCCCAM0025, 2008 and UNFCCC Annex 10, 2008). This calculates emis-sions (tCO2e) of CH4 from waste based on a first order decay landfillgas production curve. The quantity of emission reductions that canbe claimed by a composting project is the emissions reductionsthat would have been gained from a landfill gas combustion pro-ject. This is only 50% of the GHG emissions over the period of theCDM project (7 years twice renewable, or 10 years).
Composting has the advantage that 98% of the emissions cantheoretically be avoided during the period that the waste is dis-posed, whereas CDM landfill gas projects can only capture andcombust around 50% of the emissions from the landfill gas produc-tion curve for the Registered CDM project period. Fig. 1 illustratesthe bulk landfill gas production over a period of 40 years for thecase study of MSW production of 230 kg/head/year at a 56% organ-ic content for a population of 1,000,000. It shows the quantity ofgas that can be practically captured and combusted over the40 years, and that a composting project can theoretically avoid98% of gas emissions over a period of 10 years. Fig. 1 shows thatAM0025 does not provide CERs for 40 years of the landfill gas emis-sions avoided during the 10 year composting period. It also doesnot even provide for the bulk landfill gas emissions avoided duringthe CDM project period.
Consequently, whilst composting CDM projects lead to theimmediate avoidance of nearly all methane emissions, CDM in-come is reduced and delayed. It is considered that this anomalyshould be addressed by the UNFCCC, and that if the Kyoto Protocolis replaced, CERs should be paid for the CH4 emissions avoidedfrom composting the waste as illustrated in Fig. 1. This wouldencourage waste composting projects in Africa which conformmore closely to the waste hierarchy than landfill gas combustionand landfill gas to energy projects.
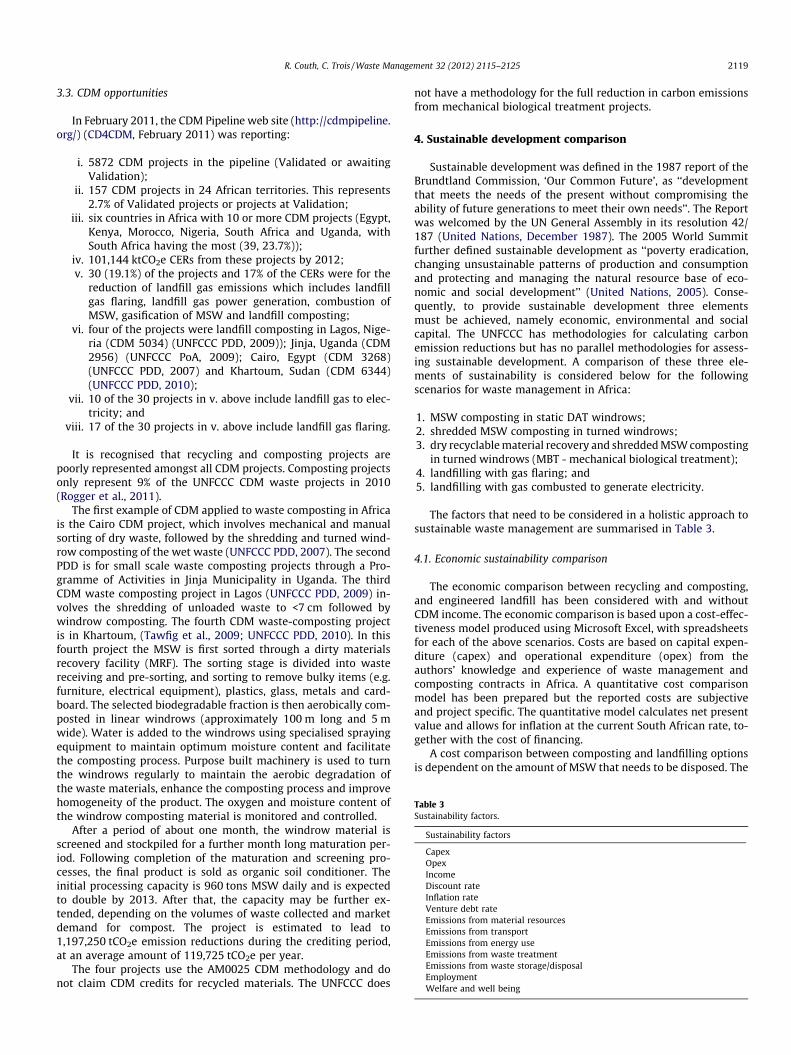
Table 3Sustainability factors.
Sustainability factors
CapexOpexIncomeDiscount rateInflation rateVenture debt rateEmissions from material resourcesEmissions from transportEmissions from energy useEmissions from waste treatmentEmissions from waste storage/disposalEmploymentWelfare and well being
R. Couth, C. Trois / Waste Management 32 (2012) 2115–2125 2119
3.3. CDM opportunities
In February 2011, the CDM Pipeline web site (http://cdmpipeline.org/) (CD4CDM, February 2011) was reporting:
i. 5872 CDM projects in the pipeline (Validated or awaitingValidation);
ii. 157 CDM projects in 24 African territories. This represents2.7% of Validated projects or projects at Validation;
iii. six countries in Africa with 10 or more CDM projects (Egypt,Kenya, Morocco, Nigeria, South Africa and Uganda, withSouth Africa having the most (39, 23.7%));
iv. 101,144 ktCO2e CERs from these projects by 2012;v. 30 (19.1%) of the projects and 17% of the CERs were for the
reduction of landfill gas emissions which includes landfillgas flaring, landfill gas power generation, combustion ofMSW, gasification of MSW and landfill composting;
vi. four of the projects were landfill composting in Lagos, Nige-ria (CDM 5034) (UNFCCC PDD, 2009)); Jinja, Uganda (CDM2956) (UNFCCC PoA, 2009); Cairo, Egypt (CDM 3268)(UNFCCC PDD, 2007) and Khartoum, Sudan (CDM 6344)(UNFCCC PDD, 2010);
vii. 10 of the 30 projects in v. above include landfill gas to elec-tricity; and
viii. 17 of the 30 projects in v. above include landfill gas flaring.
It is recognised that recycling and composting projects arepoorly represented amongst all CDM projects. Composting projectsonly represent 9% of the UNFCCC CDM waste projects in 2010(Rogger et al., 2011).
The first example of CDM applied to waste composting in Africais the Cairo CDM project, which involves mechanical and manualsorting of dry waste, followed by the shredding and turned wind-row composting of the wet waste (UNFCCC PDD, 2007). The secondPDD is for small scale waste composting projects through a Pro-gramme of Activities in Jinja Municipality in Uganda. The thirdCDM waste composting project in Lagos (UNFCCC PDD, 2009) in-volves the shredding of unloaded waste to <7 cm followed bywindrow composting. The fourth CDM waste-composting projectis in Khartoum, (Tawfig et al., 2009; UNFCCC PDD, 2010). In thisfourth project the MSW is first sorted through a dirty materialsrecovery facility (MRF). The sorting stage is divided into wastereceiving and pre-sorting, and sorting to remove bulky items (e.g.furniture, electrical equipment), plastics, glass, metals and card-board. The selected biodegradable fraction is then aerobically com-posted in linear windrows (approximately 100 m long and 5 mwide). Water is added to the windrows using specialised sprayingequipment to maintain optimum moisture content and facilitatethe composting process. Purpose built machinery is used to turnthe windrows regularly to maintain the aerobic degradation ofthe waste materials, enhance the composting process and improvehomogeneity of the product. The oxygen and moisture content ofthe windrow composting material is monitored and controlled.
After a period of about one month, the windrow material isscreened and stockpiled for a further month long maturation per-iod. Following completion of the maturation and screening pro-cesses, the final product is sold as organic soil conditioner. Theinitial processing capacity is 960 tons MSW daily and is expectedto double by 2013. After that, the capacity may be further ex-tended, depending on the volumes of waste collected and marketdemand for compost. The project is estimated to lead to1,197,250 tCO2e emission reductions during the crediting period,at an average amount of 119,725 tCO2e per year.
The four projects use the AM0025 CDM methodology and donot claim CDM credits for recycled materials. The UNFCCC does
not have a methodology for the full reduction in carbon emissionsfrom mechanical biological treatment projects.
4. Sustainable development comparison
Sustainable development was defined in the 1987 report of theBrundtland Commission, ‘Our Common Future’, as ‘‘developmentthat meets the needs of the present without compromising theability of future generations to meet their own needs’’. The Reportwas welcomed by the UN General Assembly in its resolution 42/187 (United Nations, December 1987). The 2005 World Summitfurther defined sustainable development as ‘‘poverty eradication,changing unsustainable patterns of production and consumptionand protecting and managing the natural resource base of eco-nomic and social development’’ (United Nations, 2005). Conse-quently, to provide sustainable development three elementsmust be achieved, namely economic, environmental and socialcapital. The UNFCCC has methodologies for calculating carbonemission reductions but has no parallel methodologies for assess-ing sustainable development. A comparison of these three ele-ments of sustainability is considered below for the followingscenarios for waste management in Africa:
1. MSW composting in static DAT windrows;2. shredded MSW composting in turned windrows;3. dry recyclable material recovery and shredded MSW composting
in turned windrows (MBT - mechanical biological treatment);4. landfilling with gas flaring; and5. landfilling with gas combusted to generate electricity.
The factors that need to be considered in a holistic approach tosustainable waste management are summarised in Table 3.
4.1. Economic sustainability comparison
The economic comparison between recycling and composting,and engineered landfill has been considered with and withoutCDM income. The economic comparison is based upon a cost-effec-tiveness model produced using Microsoft Excel, with spreadsheetsfor each of the above scenarios. Costs are based on capital expen-diture (capex) and operational expenditure (opex) from theauthors’ knowledge and experience of waste management andcomposting contracts in Africa. A quantitative cost comparisonmodel has been prepared but the reported costs are subjectiveand project specific. The quantitative model calculates net presentvalue and allows for inflation at the current South African rate, to-gether with the cost of financing.
A cost comparison between composting and landfilling optionsis dependent on the amount of MSW that needs to be disposed. The
2120 R. Couth, C. Trois / Waste Management 32 (2012) 2115–2125
cost comparison model applies to urban waste and assumes a pop-ulation of 1,000,000 generating 230 kg/head/year. An organic con-tent of 56% has been used for the first order decay modelcalculation for the landfill gas generated. The assumption for thethree composting scenarios is that the windrows are placed on aconstructed hard standing and the surface water runoff is managedas dirty water. The dirty water is discharged and managed througha reed bed. All three windrow options include for the monitoring ofoxygen, temperature, moisture content and C:N. None of the com-posted options include for the forced aeration of the windrowsalthough the moisture content can be controlled.
For the cost-effectiveness analysis, the assumptions which havebeen applied to all scenarios are given in Table 4 and are explainedbelow:
(a) the CDM income is €16/tCO2e per CER with 1.33 $/€exchange and 7R/$ exchange. It is assumed that it takes12 months for CER Verification and Issuance by the UNFCCC,although some projects have taken considerably longer thanthis;
(b) a 10 year project life is taken, assuming a 10 year CDM life isselected. A project will be more viable if the 3 � 7 year CDMlife option is selected;
(c) a 7 year life for plant and equipment is assumed;(d) a compost income of $2.3/t (WRAP, 2008) for sorted and
shredded MSW composting with no income from otherunsorted composting options;
(e) the land costs are €100,000/ha. This will be very variable incountries across Africa; and
(f) a discount rate of 3.5% (Treasury, 2011) to convert all capital(capex) and operational cost (opex) to net present values(NPV); an inflation rate of 3.7% (Trading Economics,2011b); and venture debt of 20% (8.68% cost of the SouthAfrican government borrowing for 10 years (Trading Eco-nomics, 2011c), plus 11–12% risk premium).
The cost-effectiveness model for the two landfill gas scenarioshas been based on GasSim2 (Gregory and Rosevear, 2005) model-ling of the above parameters using average African waste analysis(Couth and Trois, 2010). The cost-effectiveness model for the com-posting scenarios has continuous composting with 6 weeks com-posting followed by 11 weeks maturation. It is also assumed thatthe compost can be applied to land, with the compost from thesorted and shredded MSW in turned windrows option having amarket value and being sold. The compost from MSW in staticDAT windrows and shredded MSW in turned windrows options
Table 4Cost effectiveness model assumptions.
No. Factor Data
1 CDM income per CER tCO2e €16.002 Project life 10 years3 CDM income per CER tCO2e 7 years4 Compost income $2.305 Land cost €100,000/ha6 Discount rate 3.50%7 Compost period 6 weeks8 Compost maturation period 11 weeks9 Composting landfill gas emission avoidance 98%
10 Landfill gas extraction efficiency 50%11 Landfill gas combustion efficiency 97%12 Grid emission factor tCO2e/kWh 0.0010313 Electricity income per kWh $0.0214 Landfill disposal cost per tonne $215 Compost density kg/m3 55016 Dry recyclables capture rate 80%17 Dry recyclables recovery rate 80%
is not of a quality to be sold but may be used as an organic fertil-izer. CDM income can theoretically be claimed for the emissionsavings from the avoided manufacture of compost achieved bythe alternative use of waste compost. However, as such compostis not commercially generated in many countries in Africa, noallowance is made for this in the cost-effectiveness model. Organiccompost does not substitute chemical fertilizers.
Income for the five scenarios is calculated as follows:
1. MSW composting in static DAT windrows;a. CERs from landfill gas at 98% avoidance; andb. avoided landfill disposal costs.
2. Shredded MSW composting in turned windrows;a. CERs from landfill gas at 98% avoidance; andb. avoided landfill disposal costs.
3. Sorted and shredded MSW composting in turned windrows(MBT (Mechanical, biological treatment));
a. CERs from landfill gas at 98% avoidance;b. CERs from recycled materials;c. avoided landfill disposal costs;d. sale of recyclable materials; ande. sale of compost.
4. Landfilling with gas flaring;a. CERs from landfill gas at 50% landfill gas recovery and 97%
combustion efficiency.5. Landfilling with gas to electricity;
a. CERs from landfill gas 50% landfill gas recovery and 97%combustion efficiency;
b. CERs from the emission savings for the generation of elec-tricity by fossil fuel (the 2010 published Eskom grid emis-sion factor of 0.00103 tCO2e/kWh is used); and
c. sale of electricity (standard purchase prices, no REFIT)(Couth et al., 2011).
The sorted and shredded MSW composting in turned windrowsprovides CDM income for the tCO2e emission saving from thereprocessing of dry recyclable materials against use of virgin mate-rials together with the CDM income from avoided landfill gas gen-eration. The CDM income is calculated from the rising landfill gascollected curve (50% of the gas generated) over 10 years in Fig. 1.Ten years is the selected CDM time period. The CDM income fromcarbon emissions saved in tCO2e from the reprocessing of recycledmaterials against manufacture from virgin materials is based uponTable 1 which is described in the environmental sustainabilitycomparison made below. An income of $0.02/kWh is used for thesale of electricity. $0.02/kWh was the rate quoted by Eskom forthe eThekwini Municipality CDM projects in 2009 (Couth et al.,2011). Eskom average prices have increased four times from since2008 by 260% from $0.02/kWh (Aquasolar, 2011), however Eskompay less than their average price for the supply of electricity to cov-er their transmitting and management costs.
The landfilling with gas to electricity option could provide addi-tional income from higher prices paid for electricity generated byrenewable fuels. However, few countries in Africa have renewableenergy tariffs for electricity. The South Africa Government passedinto law the Renewable Energy Feed-In Tariff (REFIT) mechanismin March 2009 to promote the deployment of renewable energy(NERSA, 2009), but this has yet to be applied to landfilling withgas to electricity projects in South Africa (Couth et al., 2011). Thecost-effectiveness model includes a nominal avoided landfill dis-posal cost for the composting scenarios, $2/t. This equates to a costsaving to a municipality of $1.15 m/year in avoided landfill of thewastes for the modelled population of 1,000,000. Gate prices fordisposal to landfill in the EU are calculated on the whole life costsfor the management of the waste disposed in the landfills, and withLandfill Taxes can be of the order of $100/t. Gate prices for the dis-
R. Couth, C. Trois / Waste Management 32 (2012) 2115–2125 2121
posal of wastes to landfill are minimal in most countries in sub-Saharan Africa.
In calculating the costs for the options, the same land area is ta-ken for the three composting options. DAT windrows may be largeras their size is not restricted by turning equipment and require aslightly smaller land area, however they have a lower overall den-sity due to bulky material. The density of the compost depends onsource material. For comparison, green waste windrow composthas a density around 550 kg/m3 and composting results in a reduc-tion in the weight of around 35% (Defra, 2009b). The MBT optionrequires additional land for sorting and storage of dry recyclablematerials, but less area for composting.
For the MBT option, it is recognised in Africa that recyclablematerials are sorted and recovered when the waste is collected.However, in urban areas there remains a certain amount of dryrecyclable materials in the waste (Couth and Trois, 2011). Thecost-effectiveness model assumes 80% of the dry recyclables arecaptured from collected waste with an 80% recovery rate. Of theremaining materials, 80% are recovered at the MRF. Glass, paperand card recovered at the MRF will have little value, but ferrousmetals, aluminium cans and plastic bottles will have a greater va-lue. Net income from the sale of these materials is calculated basedupon the tonnage of material captured multiplied by the net prices,where the net prices are the international prices for the materialsless the collection, handling and transfer costs. The net incomefrom CDM credits is based on the mean tCO2e UNEP figures in Ta-ble 1, although it is considered that these underestimate the emis-sions saved as illustrated in Table 2. The costs for landfilling withgas flaring and landfilling with gas to electricity calculates capexand opex for the operational costs for the landfill gas managementsystems for 10 years, but does not include any costs for the longterm management of the landfills.
The ranking from the cost-effectiveness model with and with-out CDM income is identical and is as follows:
1. MBT – sorted and shredded MSW in turned windrows;2. MSW in static DAT windrows;3. shredded MSW in turned windrows;4. landfilling with gas flaring; and5. landfilling with gas to electricity.
Considering the cost-effectiveness model ranking:
1. Sorted and shredded MSW in turned windrows. This is the mostfavourable option from the cost-effectiveness model due to theincome derived from dry recyclables and compost, although thevalue and security of the income from the sale of recyclablesand compost is uncertain. The amortization period for this sce-nario is calculated as 3 years but is very dependent on incomefrom recyclate. The five sources of income for this scenariolisted above makes this scenario considerably more financiallyattractive than the other options. The most valuable incomesource is CERs from the recyclates. A tonne of aluminium cansgives a CDM income of $169,600 ($16 ⁄ 10,600 tCO2e/t). Itshould however be noted that sorted and shredded MSW in aturned windrow project requires considerably more capitalinvestment than just windrow composting, and such projectswill therefore be dependent on the availability of funding whichwill be difficult in less stable African countries. The 4 yearamortization is dependent on the availability of dry recyclablematerials and the CDM income from dry recyclable materials.The UNFCCC currently does not have a combined mechanicalbiological treatment methodology. If recyclable CDM incomeis excluded the amortization is 6 years which is longer thatthe other two composting options. The shredded MSW inturned windrows and MSW in static DAT windrows options
could be favoured over the sorted and shredded MSW in turnedwindrows option as they have an existing UNFCCC CDM meth-odology, a lower capex, and therefore the need to resource lessfunding.
2. MSW in static DAT windrows. The cost for the static DAT wind-row composting is slightly cheaper than the shredded MSW inturned windrow option although there is little difference inthe capex costs. The cost benefit of the MSW in static DAT win-drows option is very similar to the shredded MSW in turnedwindrows option. It is questionable whether turning, air injec-tion/exhaustion and moisture control equipment for windrowcomposting is technically viable in sub-Saharan Africa. How-ever, if CDM or other funding is available, it would be recom-mended that the static piles are turned and the moisture iscontrolled. Turning will control oxygen, and moisture can bemanaged by monitoring the windrows and adding water totrenches before they are turned. The shredded and turnedwindrow system should therefore produce better compost fromMSW than the DAT system.
3. Shredded MSW in turned windrows. The three CDM compost-ing options are considerably more financially favourable thanlandfill disposal and gas collection options, as the waste is con-verted into a useable product and there are a number of sourcesof income. Also, 98% of the landfill gas is avoided (assuming 2%anaerobic conditions in the windrow), compared with 50% cap-tured and combusted in the gas flaring and gas to electricityscenarios. It is assumed in the three composting options that:CDM income is based upon the rising profile of the bulk landfillgas production curve (Fig. 1); all three composting options gen-erate the same CERs; composting is continuous and not a batchprocess; and there is no difference in the composting times inthe static dome and turned windrows. The amortization periodfor this scenario is calculated as 5 years. The compostingoptions are not attractive without CDM income. The compost-ing options will not pay back in 10 years without CDM income.
4. Landfilling with gas flaring. Landfill gas flaring projects shouldbe amortized within 7 years. Landfill gas flaring projects arenot viable without CDM income (Couth et al., 2011). The Gas-Sim2 analysis shows that a maximum of 8400 m3/hr of gascould be generated after 10 years of landfill disposal for ‘typical’African waste. If the gas extraction system has 50% recoveryefficiency, then this equates to 4200 m3/hr of landfill gas oraround 2100 m3/hr of CH4 gas combusted as extracted landfillgas typically contains around 50% CH4. Landfill gas systems willneed continued operation and management to capture carbonfor at least 10 years after the landfill is closed. This cost is notincluded in the model. Landfill gas extraction with flaring isnot viable without CDM income.
5. Landfilling with gas to electricity. Landfill gas to electricity CDMprojects are only viable on the largest landfills in Africa (Couthet al., 2011). Landfill gas to electricity projects are not viable inAfrica for waste from urban populations of less than 1,000,000as the cost per 1 MW engine installed with a gas extraction sys-tem is over $1,000,000, and the engines require expert mainte-nance. The amortisation for this scenario is 8 years. Given theterm of the investment and the uncertainty of technology forgas engines in Africa over 8 years, this option is not financiallyattractive.
The discounted cash flow for the five options is summarised inTable 5. The costs for the sorted and shredded MSW in turned win-drows do not include CDM recyclate income. The final column ofthe table calculates the income per tonne of waste received aver-aged over the 10 year CDM period.
Similar simulation studies carried out in the early 2000s in India(Yedla, 2003). These compared a landfill system with gas recovery
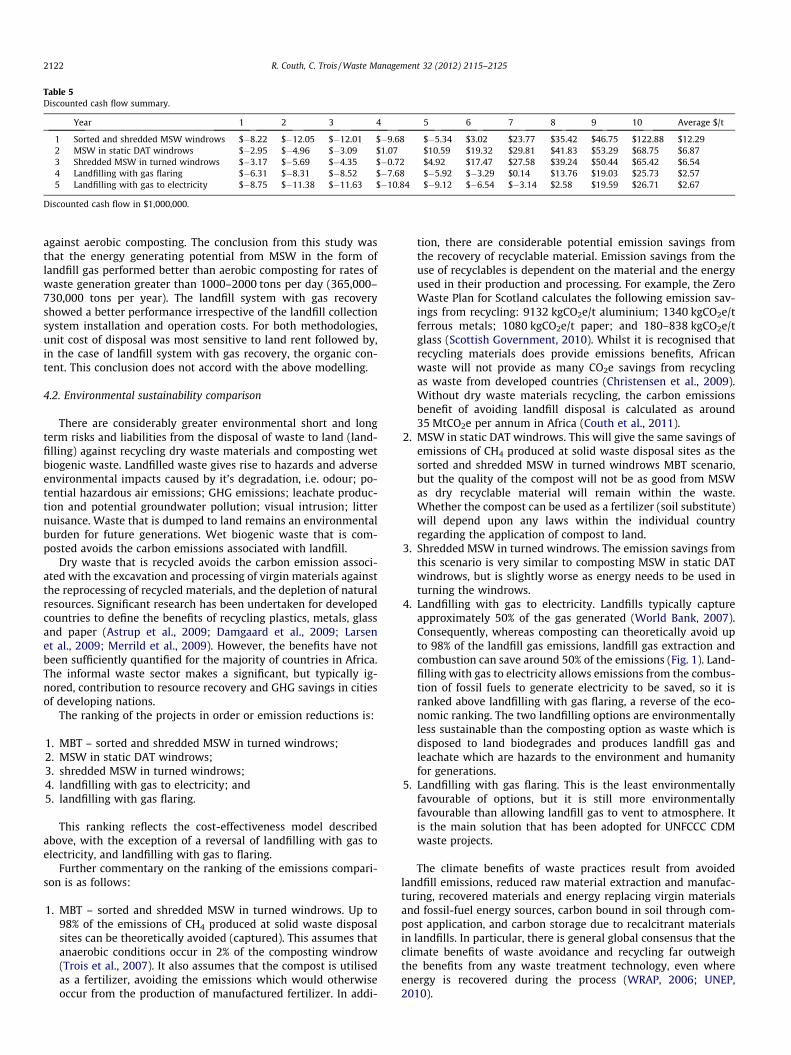
Table 5Discounted cash flow summary.
Year 1 2 3 4 5 6 7 8 9 10 Average $/t
1 Sorted and shredded MSW windrows $�8.22 $�12.05 $�12.01 $�9.68 $�5.34 $3.02 $23.77 $35.42 $46.75 $122.88 $12.292 MSW in static DAT windrows $�2.95 $�4.96 $�3.09 $1.07 $10.59 $19.32 $29.81 $41.83 $53.29 $68.75 $6.873 Shredded MSW in turned windrows $�3.17 $�5.69 $�4.35 $�0.72 $4.92 $17.47 $27.58 $39.24 $50.44 $65.42 $6.544 Landfilling with gas flaring $�6.31 $�8.31 $�8.52 $�7.68 $�5.92 $�3.29 $0.14 $13.76 $19.03 $25.73 $2.575 Landfilling with gas to electricity $�8.75 $�11.38 $�11.63 $�10.84 $�9.12 $�6.54 $�3.14 $2.58 $19.59 $26.71 $2.67
Discounted cash flow in $1,000,000.
2122 R. Couth, C. Trois / Waste Management 32 (2012) 2115–2125
against aerobic composting. The conclusion from this study wasthat the energy generating potential from MSW in the form oflandfill gas performed better than aerobic composting for rates ofwaste generation greater than 1000–2000 tons per day (365,000–730,000 tons per year). The landfill system with gas recoveryshowed a better performance irrespective of the landfill collectionsystem installation and operation costs. For both methodologies,unit cost of disposal was most sensitive to land rent followed by,in the case of landfill system with gas recovery, the organic con-tent. This conclusion does not accord with the above modelling.
4.2. Environmental sustainability comparison
There are considerably greater environmental short and longterm risks and liabilities from the disposal of waste to land (land-filling) against recycling dry waste materials and composting wetbiogenic waste. Landfilled waste gives rise to hazards and adverseenvironmental impacts caused by it’s degradation, i.e. odour; po-tential hazardous air emissions; GHG emissions; leachate produc-tion and potential groundwater pollution; visual intrusion; litternuisance. Waste that is dumped to land remains an environmentalburden for future generations. Wet biogenic waste that is com-posted avoids the carbon emissions associated with landfill.
Dry waste that is recycled avoids the carbon emission associ-ated with the excavation and processing of virgin materials againstthe reprocessing of recycled materials, and the depletion of naturalresources. Significant research has been undertaken for developedcountries to define the benefits of recycling plastics, metals, glassand paper (Astrup et al., 2009; Damgaard et al., 2009; Larsenet al., 2009; Merrild et al., 2009). However, the benefits have notbeen sufficiently quantified for the majority of countries in Africa.The informal waste sector makes a significant, but typically ig-nored, contribution to resource recovery and GHG savings in citiesof developing nations.
The ranking of the projects in order or emission reductions is:
1. MBT – sorted and shredded MSW in turned windrows;2. MSW in static DAT windrows;3. shredded MSW in turned windrows;4. landfilling with gas to electricity; and5. landfilling with gas flaring.
This ranking reflects the cost-effectiveness model describedabove, with the exception of a reversal of landfilling with gas toelectricity, and landfilling with gas to flaring.
Further commentary on the ranking of the emissions compari-son is as follows:
1. MBT – sorted and shredded MSW in turned windrows. Up to98% of the emissions of CH4 produced at solid waste disposalsites can be theoretically avoided (captured). This assumes thatanaerobic conditions occur in 2% of the composting windrow(Trois et al., 2007). It also assumes that the compost is utilisedas a fertilizer, avoiding the emissions which would otherwiseoccur from the production of manufactured fertilizer. In addi-
tion, there are considerable potential emission savings fromthe recovery of recyclable material. Emission savings from theuse of recyclables is dependent on the material and the energyused in their production and processing. For example, the ZeroWaste Plan for Scotland calculates the following emission sav-ings from recycling: 9132 kgCO2e/t aluminium; 1340 kgCO2e/tferrous metals; 1080 kgCO2e/t paper; and 180–838 kgCO2e/tglass (Scottish Government, 2010). Whilst it is recognised thatrecycling materials does provide emissions benefits, Africanwaste will not provide as many CO2e savings from recyclingas waste from developed countries (Christensen et al., 2009).Without dry waste materials recycling, the carbon emissionsbenefit of avoiding landfill disposal is calculated as around35 MtCO2e per annum in Africa (Couth et al., 2011).
2. MSW in static DAT windrows. This will give the same savings ofemissions of CH4 produced at solid waste disposal sites as thesorted and shredded MSW in turned windrows MBT scenario,but the quality of the compost will not be as good from MSWas dry recyclable material will remain within the waste.Whether the compost can be used as a fertilizer (soil substitute)will depend upon any laws within the individual countryregarding the application of compost to land.
3. Shredded MSW in turned windrows. The emission savings fromthis scenario is very similar to composting MSW in static DATwindrows, but is slightly worse as energy needs to be used inturning the windrows.
4. Landfilling with gas to electricity. Landfills typically captureapproximately 50% of the gas generated (World Bank, 2007).Consequently, whereas composting can theoretically avoid upto 98% of the landfill gas emissions, landfill gas extraction andcombustion can save around 50% of the emissions (Fig. 1). Land-filling with gas to electricity allows emissions from the combus-tion of fossil fuels to generate electricity to be saved, so it isranked above landfilling with gas flaring, a reverse of the eco-nomic ranking. The two landfilling options are environmentallyless sustainable than the composting option as waste which isdisposed to land biodegrades and produces landfill gas andleachate which are hazards to the environment and humanityfor generations.
5. Landfilling with gas flaring. This is the least environmentallyfavourable of options, but it is still more environmentallyfavourable than allowing landfill gas to vent to atmosphere. Itis the main solution that has been adopted for UNFCCC CDMwaste projects.
The climate benefits of waste practices result from avoidedlandfill emissions, reduced raw material extraction and manufac-turing, recovered materials and energy replacing virgin materialsand fossil-fuel energy sources, carbon bound in soil through com-post application, and carbon storage due to recalcitrant materialsin landfills. In particular, there is general global consensus that theclimate benefits of waste avoidance and recycling far outweighthe benefits from any waste treatment technology, even whereenergy is recovered during the process (WRAP, 2006; UNEP,2010).
R. Couth, C. Trois / Waste Manage
The Scottish Government is now setting carbon targets forwaste management with focus on targeting dry recyclable materi-als (Scottish Government, 2010). It is recommended that the car-bon baseline from waste management is calculated for countriesin Africa; targets are proposed to manage and reduce these emis-sions; and the UNFCCC introduces a new mechanism for Annex 1countries to fund developing countries to meet these carbontargets.
4.3. Social sustainability comparison
This second objective of CDM of sustainable development hasbeen assessed by many projects (Olsen, 2007; Rogger et al.,2011; Sutter and Parreño, 2007). It is concluded that many CDMprojects do not contribute significantly to sustainable develop-ment, and that the CDM does not offer adequate incentives to hostcountries to achieve the second goal of sustainable development. Ashift in mind set in favour of the second objective will only happenwhen value is attributed to sustainability. Climate change organi-sations have sought to develop a measure for sustainable CDM pro-jects (e.g. the Gold Standard) but this has yet to be adopted by theUNFCCC (Gold Standard, 2011). The Gold Standard rewards CDMProjects in terms of their contribution to sustainable developmentleading to a higher value for CERs generated. There are Gold Stan-dard CERs and VERs (Verified Emission Reductions). However thesecurrently exclude landfill projects, including composting.
Waste management projects have the social benefit of provid-ing employment opportunities with improved working conditionsfor waste pickers; an increase in the number of jobs for the localcommunity; and reduced health risks to the neighbouring commu-nities. They also contribute to knowledge and technology transfer.
The social ranking of the five options is:
1. MBT – sorted and shredded MSW in turned windrows. Thisoption has the advantage of providing direct local employ-ment through waste picking, with the potential for over100 jobs per scheme, and the advantage of providing indi-rect employment through waste reprocessing (Tawfiget al, 2009);
2/3. MSW in static DAT windrows and shredded MSW in turnedwindrows. These options will provide similar employmentopportunities from the management of waste compostingand application to land. More people should be directlyemployed through waste composting than landfilling. Peo-ple currently living on landfills who pick waste as it isdumped can be employed in the managed picking of wastesprior to composting;
4. landfilling with gas to electricity. This provides some localemployment through the engagement and training of engi-neers to manage the engines. However well being is reducedthough exposure of the local community to landfill andlandfill related activities; and
5. landfilling with gas flaring. Similar to landfilling with gas toelectricity but slightly less employment and techniciantraining.
4.4. Sustainability comparison conclusions
The overall sustainability ranking of economic, environmentaland social impacts of the five options is:
1. MBT – sorted and shredded MSW in turned windrows;2. MSW in static DAT windrows;3. shredded MSW in turned windrows;4. landfilling with gas to electricity; and5. landfilling with gas flaring.
However, landfilling with gas to electricity is only viable for
large projects and requires greater funding and technologicalmanagement.The sustainability ranking accords with the waste hierarchy asdetailed in the EU Waste Framework Directive (EU 2008/98/EC(2008)). It demonstrates that where waste is generated, it will bemost sustainable to prepare the waste for re-use and recycle,rather than landfill with landfill gas combustion and energy recov-ery. It is difficult to have a Waste Management Strategy for Africa,but one should focus on the waste hierarchy. All Waste Manage-ment Strategies for countries in Africa should be holistic, providinga sustainable integrated approach with consideration to econom-ics, the environment and social issues.
5. Conclusions and recommendations
In a global context, the management of wastes was estimated toproduce 3–5% of the total anthropogenic GHG emissions in 2005(UNEP, 2010). The percentage in Africa is higher due to largelyuncontrolled waste disposal practices (Couth and Trois, 2011).Although a reasonable proportion of emissions are releasedthrough waste disposal, the prevention, recycling and compostingof waste avoids significant emissions in other sectors of the econ-omy, i.e. energy, forestry, agriculture, mining, transport, andmanufacturing.
Africa has the highest proportion of Least Developed Countries(LDCs) of the five continents (Africa, Americas, Asia, Australasiaand Europe). Sub-Sahara Africa has 33 LDCs, whilst there are only14 LDC in Asia and one LDC in the American Pacific. The majority ofthe people in sub-Saharan Africa live in a rural setting with anaverage income per capita as low as $596 (Couth and Trois,2009a). The urban population is however increasing at a significantrate but there is not the income to treat and dispose of wastes(Couth and Trois, 2009a). Urban waste in sub-Saharan Africa hasa high biodegradable content (around 56%), it is dumped and ittherefore produces a high percentage of carbon emissions per capi-ta (Couth and Trois, 2010). The high and increasing rate of carbonemissions per capita and the non availability of reliable data forwaste management and the population in sub-Sahara Africa is achallenge.
The sustainability analysis shows that waste recycling and com-posting is beneficial over controlled landfilling, although uncon-trolled dumping of waste as practiced across sub-Saharan Africais cheaper in the short term. Of the composting options, it is attrac-tive to have an upstream materials recovery facility (MRF) to re-move dry recyclables from the waste which will significantlyimprove the quality of the compost and will also provide localemployment. Under this option, compost and recyclable materialsmay be sold; CDM income gained from recycled materials and dis-placed landfill gas; and landfill disposal costs may be avoided.
Waste recycling and composting projects fulfil the CDM objec-tives better than landfill disposal projects. Composting projectsprovide twice the reduction in GHG emissions when compared tolandfill gas combustion projects. The GHG emission reductionscan be effectively provided over the period of waste productionrather than over a generation. They are more sustainable in devel-oping countries and do not leave an environmental hazard for fu-ture generations.
Landfill CH4 emissions are increasing in developing countriesbecause of larger quantities of MSW from increasing urban popu-lations, increasing economic development and, to some extent,the replacement of open burning and dumping by engineered land-fills. Without additional measures, a 50% increase in landfill CH4
emissions from 2005 to 2020 is projected, mainly from the Non-Annex I countries (IPCC, 2007; Couth et al., 2011).
ment 32 (2012) 2115–2125 2123
2124 R. Couth, C. Trois / Waste Management 32 (2012) 2115–2125
The UNFCCC does not currently have an approved CDM meth-odology to value the emission savings from recycled materials; itdoes not have a methodology for composting that correctly calcu-late the emissions avoided; and it does not have a methodologythat rewards the second CDM objective of sustainable develop-ment. Landfill gas CDM projects do not contribute as significantlyto sustainable development as waste recycling and compostingprojects. The UNFCCC should distinguish between the sustainabil-ity of landfill category CDM projects and value CERs accordingly,similar to the Gold Standard (Gold Standard, 2011). More sustain-able CERs should then achieve a higher value on the world markets.CDM methodologies need to be developed for these parameters.
In summary, it is considered that the UNFCCC should:
(a) renew and develop CDM through a replacement to the KyotoProtocol focusing on sustainable projects in developingcountries. MBT and composting projects in Africa are unli-kely to proceed without funding from Annex 1 developedcountries through a replacement to the CDM;
(b) develop a mechanism to grade CDM projects and the result-ing CERs depending upon their sustainability (as in the GoldStandard). The definition of ‘‘sustainability’’ for these pro-jects should be defined. CERs from more sustainable projectsshould have a higher value and thereby generate moreincome. CDM methodologies should take account of thewider social costs and benefits of proposals, and the needto ensure the proper use of public resources. These CDMmethodologies should reward the informal sector;
(c) establish the current direct and indirect baselines for carbonemissions from waste management for individual countriesin Africa and set carbon emission targets. Most countriesin Africa have universities and the waste management car-bon emission baselines could be determined by the univer-sities against UNFCCC criteria. These carbon emissiontargets should then be met through new projects fundedby the replacement to the Kyoto Protocol;
(d) develop a CDM methodology for small scale mechanical bio-logical treatment (MBT) projects. This should include all dryrecyclable waste materials and wet compostable biogenicwastes. CERs should be for the total gas emissions avoidedby composting biogenic wastes, not the landfill gas capturedand combusted over the CDM landfill period;
(e) calculate tables for emission savings from closed loop recy-cling and use of dry materials for each country in Africa;
(f) specify a standard for the application of waste compost toland in countries in Africa; and
(g) amend the existing AM0025 composting methodology toprovide CERs for the total emissions avoided during the lifeof the composting project.
Waste generation is related to population, affluence and urban-isation. Recycling and composting can provide an affordable, sus-tainable alternative to engineered landfills, especially wheremore labour-intensive, lower-technology strategies are applied tothe recyclable and biodegradable waste streams. The truth is thatthere are millions of informal poor, including recyclers, whosework contributes to emissions reductions, but who remain unac-counted for, and unrewarded for protecting our global community.Mechanisms should be adopted to ensure that such efforts are ac-counted for, and that those involved are rewarded accordingly.
Whereas developed countries such as the United States, Canada,and Australia all emit over 20 tCO2e per capita per year (Chintan,2009), sub-Saharan African countries emit an average of just over1 tCO2e per capita per year (Couth and Trois, 2009b). UNFCCC tar-gets to reduce carbon emissions by 85% by 2050 to control the glo-
bal temperature rise to 2 �C (Metz, 2008), will only be met ifinitiatives are progressed with regard to waste management prac-tices in developing countries.
Acknowledgements
The authors would like to acknowledge to Lindsay Strachan(SLR Consulting UK), John Parkin, Marc Wright and Logan Moodley(Durban Solid Waste) for their support in the DAT composting tri-als; Grant Pearson for reviewing the paper, and Andy Chapman ofQuilter for advice in the economic sustainability modelling.
References
Aquasolar, 2011. Eskom electricity price increases. <http://aquasolar.co.za/eskom-electricity-price-increases-just-in-time-for-winter/>.
Astrup, T., Fruergaard, T., Christensen, T.H., 2009. Recycling of plastic: accounting ofgreenhouse gases and global warming contributions. Waste Management &Research. <http://wmr.sagepub.com/content/27/8/763>.
Boldrin, A., Andersen, J.K., Møller, J., Christensen, T.H., Favoino, E., 2009. Compostingand compost utilization: accounting of greenhouse gases and global warmingcontributions. Waste Management & Research 27, 800–812. ISSN 0734-242X.<http://wmr.sagepub.com/>.
BSI, 2007. Guide to PAS 2050: How to Assess the Carbon Footprint of Good andServices. ISBN 978-0-580-64636-2. <http://shop.bsigroup.com/en/Browse-by-Sector/Energy–Utilities/PAS-2050/>.
BSI, 2008. PAS 2050 – Assessing the Life Cycle Greenhouse Gas Emissions of Goodsand Services. ISBN 978 0 580 50978 0. <http://shop.bsigroup.com/en/Browse-by-Sector/Energy–Utilities/PAS-2050/>.
BSI, 2011. PAS 100 2011 Specification for Composted Materials. ISBN 978 0580 65307 0. <http://www.wrap.org.uk/downloads/PAS_100_2011.d04491e0.10478.pdf>.
CD4CDM (February 2011). Capacity Development for the Clean DevelopmentMechanism. <http://cd4cdm.org/>.
Chintan Environmental Research and Action Group, 2009. Cooling agents. Ananalysis of climate change mitigation by the informal recycling sector in India.<www.chintan-india.org>.
Christensen, T.H., Simion, F., Tonini, D., Møller, J., 2009. Global warming factorsmodelled for 40 generic municipal waste management scenarios. WasteManagement & Research 27, 871. <http://www.uk.sagepub.com/dicken6/Additional_Resources_for_International_Business/Online_journal_readings/christensen_et_al_2009.pdf>.
Couth, R., Trois, C., 2009a. Comparison of waste management activities across Africawith respect to carbon emissions. In: Twelfth International Waste Managementand Landfill Symposium October 2009, Santa Margherita di Pula, Cagliari,Sardinia, 2009. ISBN 978-88-6265-007-6.
Couth, R., Trois, C., 2009b. Calculation of carbon emissions from waste managementacross Africa and potential for reduction. Sardinia 2009. In: TwelfthInternational Waste Management and Landfill Symposium October 2009,Santa Margherita di Pula, Cagliari, Sardinia, 2009. ISBN 978-88-6265-007-6.
Couth, R., Trois, C., 2010. Carbon reduction strategies in Africa for improved wastemanagement: a review. Waste Management 30, 2336–2346. <http://www.sciencedirect.com/science>.
Couth, R., Trois, C., 2011. Waste management activities and carbon emissions inAfrica. Waste Management 31, 131–137. <http://www.sciencedirect.com/science>.
Couth, R., Trois, C., Vaughan-Jones, S., 2011. Modelling of carbon emissionsreduction potentials from municipal solid waste disposal in Africa. WasteManagement 5 (6), 1443–1453.
Couth, R., Trois, C., Parkin, J., Strachan, L.J., Gilder, A., Wright, M., 2011. Delivery andviability of landfill gas CDM projects in Africa – a South African experience.Renewable and Sustainable Energy Reviews 15 (1), 392–403. <http://www.sciencedirect.com/science>.
Damgaard, A., Larsen, A.W., Christensen, T.H., 2009. Recycling of metals: accountingof greenhouse gases and global warming contributions. Waste Management &Research 27, 773. <http://wmr.sagepub.com/content/27/8/773>.
Defra, 2009a. Guidelines to Defra/DECC’s GHG Conversion Factors for CompanyReporting. Version 2 September 2009. <http://www.defra.gov.uk/environment/business/reporting/pdf/20090928-guidelines-ghg-conversion-factors.pdf>.
Defra, 2009b. A preliminary assessment of greenhouse gases associated withgrowing materials. University of Warwick, Defra Project Code IF0154.SID 5Research Project Final Report. <www.hdc.org.uk/industry-reports/files/A_prelinary_assessment_of_the_greenhouse_gases_associated_with_growing_media_material.pdf>.
Department of Environment and Conservation, NSW, 2005. Benefits of Recycling.ISBN 1 74137 311 5. <www.environment.nsw.gov.au>.
Dey, C., Lenzen, N., 2000. Greenhouse gas analysis for electricity generationsystems. ANZSES international solar conference. In: Conference Proceedings,31st Nov–1st Dec, 2000, pp. 658–668. <www.technicart.com/Environmental_work_Swedish)/Environmental_links/Solar_2000_Conference_-_Griffith_University_Australia.pdf>.
Eskom, 2010. Integrated report 2010: On the path to recovery. <www.eskom.co.za>.
R. Couth, C. Trois / Waste Management 32 (2012) 2115–2125 2125
EU 2008/98/EC, 2008. Directive 2008/98/EC of the European Parliament and theCouncil of 19 November 2008 on waste and repealing certain Directives.<http://eur-lex.europa.eu/LexUriServ/LexUriServ.do?uri=OJ:L:2008:312:0003:0030:EN:pdf>.
Gold-Standard, 2010. Current GS rules and case studies. The Gold StandardFoundation. <http://www.cdmgoldstandard.org/> (assessed March 2011).
Gregory, R.G., Rosevear, 2005. GasSim 2: Landfill gas management quantified:Gregory R.G. and Rosevear. Tenth International Waste Management andLandfill Symposium October 2005, Santa Margherita di Pula, Cagliari, Sardinia,2005.
Haug, R.T., 1993. The Practical Handbook of Compost Engineering. Lewis Publishers,ISBN 10:0873713737.
IPCC, 1996. Revised 1996 IPCC Guidelines for National Greenhouse Gas Inventories.Intergovernmental Panel on Climate Change. <http://www.ipcc-nggip.iges.or.jp/public/gl/invs1.html>.
IPCC Fourth Assessment Report: Climate Change, 2007. Workgroup III. CambridgeUniversity Press (Chapter 10). ISBN 978-0-521-88011-4. <http://www.ipcc.ch/ipccreports/ar4-wg3.htm>.
Joint Research Centre, 2008. End of Waste Criteria, Final Report. EuropeanCommission Joint Research Centre Institute for Prospective TechnologicalStudies. <http://susproc.jrc.ec.europa.eu/documents/Endofwastecriteriafinal.pdf>.
Larsen, A.W., Merrild, H., Christensen, T.H., 2009. Recycling of glass: accounting ofgreenhouse gases and global warming contributions. Waste Management &Research 27, 754. <http://wmr.sagepub.com/content/27/8/754>.
Merrild, H., Damgaard, A., Christensen, T.H., 2009. Recycling of paper: accounting ofgreenhouse gases and global warming contributions. Waste Management &Research 27, 746. <http://wmr.sagepub.com/content/27/8/746>.
Metz, B., 2008. Emission reductions from stabilization and mitigation potentials.Information for the IPCC Working Group III AR4 and new studies. IPCCDecember 2009. <http://unfccc.int/files/kyoto_protocol/application/force-download>.
Moller, J., 2007. Greenhouse gas balance of different waste management strategy.Eleventh International Waste Management and Landfill Symposium October2007, Santa Margherita di Pula, Cagliari, Sardinia, 2007.
NERSA, 2009. Renewable Energy Feed-in Tariff (REFIT) South Africa. National EnergyRegulator of South Africa. Regulator Guidelines 26 March 2009. <http://www.nersa.org.za/UploadedFiles/ElectricityDocuments/REFIT%20Guidelines.pdf>.
Olsen, K., 2007. The clean development mechanism’s contribution to sustainabledevelopment: a review of the literature. Climatic Change 84, 59–73. <http://www.springerlink.com/content>.
Parr, S., Brummack, J., Mollekopt, N., 1999. The Advantages of DAT for thecomposting of Solid Waste. SARDINIA 99, 7th International LandfillSymposium, Conference Proceedings, Cagliari, Italy, 1999.
PROGNOS, 2008. Resource savings and CO2 reduction potential in wastemanagement in Europe and its possible contribution to the CO2 reductiontarget in 2020. www.prognos.com/fileadmin/pdf/aktuelles/Results_CO2_wasteproject.pdf.
Rogger, C., Beaurain, F., Schmidt, S.T., 2011. Composting projects under the CleanDevelopment Mechanism: sustainable contribution to mitigate climate change.Waste Management 31 (1), 138–146. <http://www.sciencedirect.com/science>.
Scottish Government, 2010. Scotland’s Zero Waste Plan. The Scottish GovernmentJune 2010. ISBN 978-0-7559-8306-3. <http://www.zerowastescotland.org.uk/>.
SNIFFER ER15, 2011. Assessment of carbon/nitrogen ratios in various compostingwaste streams. Scotland & Northern Ireland Forum for Environmental Research(SNIFFER), Scottish Charity No. SC022375.
Sutter, C., Parreño, J., 2007. Does the current Clean Development Mechanism (CDM)deliver its sustainable development claim? An analysis of officially registeredCDM projects. Climatic Change 84, 75–90. <http://www.springerlink.com/content>.
Tawfig, M., Couth, R., Pearson, G., Strachan, L., 2009. Development of sustainablewaste disposal in Sudan. Twelfth International Waste Management and LandfillSymposium October 2009, Santa Margherita di Pula, Cagliari, Sardinia, 2009.ISBN 978-88-6265-007-6.
Trading Economics, 2011a. Angola, IMF – data and forecasts. Trading Economics.<http://www.tradingeconomics.com/angola/indicators/>.
Trading Economics, 2011b. South African inflation rate. Trading Economics. <http://www.tradingeconomics.com/Economics/Inflation-CPI.aspx?Symbol=ZAR>.
Trading Economics, 2011c. Government Bond yields, 10 year notes. TradingEconomics. <http://www.tradingeconomics.com/World-Economy/Bonds.aspx>.
Treasury, H.M., 2011. The green book: appraisal and evaluation in centralgovernment. London TSO. <http://www.hm-treasury.gov.uk/d/green_book_complete.pdf>.
Trois, C., Griffith, M., Mollekopf, N., Brummack, J., 2005. A comparative study ofaerobic waste treatment: a solution for developing countries. Sardinia, 2005,Tenth International Waste Management and Landfill Symposium, October 2005,Santa Margherita di Pula, Cagliari, Sardinia. ISBN 978-88-6265-007-6.
Trois, C., Griffith, M., Brummack, J., Mollekopf, N., 2007. Introducing mechanicalbiological waste treatment in South Africa: a comparative study. WasteManagement 27, 1706–1714 <www.elsevier.com/locate/wasman>.
UNEP, 2010. Waste and Climate Change: Global Trends and Strategy Framework.United Nations Environmental Programme. Division of Technology, Industryand Economics, <www.unep/Publications/spc/Waste Climate Change/WasteClimate Change.pdf>.
UNFCCC, 2005. Sixth compilation and synthesis of initial national communicationsfrom Parties not included in Annex I to the Convention. United NationsFramework Convention on Climate Change (UNFCCC). <http://unfccc.int/resource/docs/2005/sbi/eng/18a02.pdf>.
UNFCCC, 2011. Indicative simplified baseline and monitoring methodologies forselected small-scale CDM project activity catorgies. III.AJ./Version 02. SectoralScope 13, EB 53. March 2010. <http://cdm.unfccc.int/UserManagement/FileStorage>.
UNFCCC AM0025, 2008. Approved baseline and monitoring methodology AM0025.Avoided emissions from organic waste through alternative waste treatmentprocesses. AM0025/Version 11 Sectoral Scope: 01 and 13 EB 44. <http://cdm.unfccc.int/UserManagement/FileStorage/CDMWF_AM_PJSD36RRF6X16OA7CSTR7H38OXVJTG> (accessed 28.11.08).
UNFCCC Annex 10, 2008. Methodological tool ‘‘Tool to determine methaneemissions avoided from disposal of waste at a solid waste disposal site’’(Version 04). EB 41 Report Annex 10 Page 1. <http://cdm.unfccc.int/methodologies/PAmethodologies/tools/am-tool-04-v4.pdf> (accessed02.08.08).
UNFCCC PDD, 2007. Land Filling and Processing Services for Southern Zone in Cairo.DNV (Det Norske Veritas). <http://www.dnv.com/focus/climate_change/Upload/02_-_MENA.Egypt.ECARU.PDD_7Feb08_.pdf> (accessed 12.12.07).
UNFCCC PDD, 2009. Municipal Solid Waste (MSW) composting facility in Ikorodu,Lagos State, Nigeria. <http://cdm.unfccc.int/UserManagement/FileStorage/YVWT6LP5GD8O4BI3J2SUA0KZE79FX1> (accessed 10.01.09).
UNFCCC PDD, 2010. Omdurman Landfill Municipal Solid Waste Composting Project.<http://cdm.unfccc.int/filestorage/LQK9O8I2XS6HB4V037TPYCGEMN5DZW/Project_Design_Document.pdf?t=aXZ8MTI5Njk3NTI2Ni4yNw==|zAptLt540aM-lvnQb0Ka0Vmzy3c=> (accessed 19.04.10).
UNFCCC PoA, 2009. Uganda Municipal Waste Compost Programme. Municipalwaste composting Project for Jinja Municipality. <http://cdm.unfccc.int/filestorage/J/P/8/JP8B72CIZM46NOL0VRKHSY5ADTWU1E/CPA-DD_Lira.pdf?t=T0Z8bHgwYXNvfDD06Mnr_ff8Tjv4Ro417hH0> (accessed 12.04.09).
United Nations, 1987. General Assembly 42/187. Report of the World Commissionon Environment and Development. United Nations, Brundtland Commission,Our Common Future. <http://www.un.org/documents/ga/res/42/ares42-187.htm>.
United Nations, 1997. Kyoto Protocol 1997: United Nations Convention on ClimateChange (UNFCCC). UNFCCC. <http://unfccc.int/kyoto_protocol/items/2830.php>(accessed 11.12.97).
United Nations, 2005. Resolution adopted by the General Assembly 60/1 WorldSummit Outcome. <http://unpan1.un.org/intradoc/groups/public/documents/un/unpan021752.pdf> (accessed 24.10.05).
World Bank, 2007. Comparison of forecast and reported methane recovery rates atselected landfills in developing countries. SGS Engineers 2007. <http://siteresources.worldbank.org/INTCARBONFINANCE/Resources/MSW.LFG.CDM.Newsletter_Feb09_.pdf>.
WRAP, 2006. The environmental benefits of recycling. An international review forlife cycle comparisons for key materials in the UK recycling sector. Waste &Resources Action Programme. <http://www.wrap.org.uk/downloads/Recycling_LCA_Report_Executive_Summary_Sept_2006.5c2fce82.2839.pdf>.
WRAP, 2008. Realising the value of organic waste. Market situation report – April2008. Waste and Resources Action Programme. <http://www.wrap.org.uk/downloads/Organics_MSR_Final_v2.49fc9a3f.5238.pdf>.
Yedla, S., 2003. Development of Techno-economic Integrated Models: LFSGR andAerobic Composting for Municipal Waste Management. Cambridge UniversityPress, Environment and Development Economics 8, 655–677. <http://journals.cambridge.org/action/displayAbstract?fromPage=online&aid=176455>.