Embed Size (px)
Citation preview
Report prepared and compiled on behalf of CARE International Rwanda
January, 2018
Promoting Financial Inclusion for Smallholder Farmers Project
(PROFIFA) BASELINE SURVEY REPORT

P R O F I F A B a s e l i n e S u r v e y R e p o r t P a g e i | 55
Baseline survey
Promoting Financial Inclusion for Smallholder Farmers Project (PROFIFA)
Final Report
January, 2018
Report Prepared and compiled on behalf of CARE International Rwanda Prepared by: Olivier HABIMANA, Agricultural Economist Didier Nkubito, Rural Development and Gender Expert Laurien JYAMBERE, Sustainable Livelihood Expert Contractor: Strategic and Development Research Group (StratDever Ltd) KICUKIRO, KK 502 St, Levo House, 1st Floor P.O. Box 4904 Kigali-Rwanda Tel: (+250) 788301282 [email protected] www.stratdever.com DISCLAIMER The consultants’ views expressed in this publication do not necessarily reflect the views of the International Alert Rwanda.
P R O F I F A B a s e l i n e S u r v e y R e p o r t P a g e ii | 55
ACKNOWLEDGMENTS We are thankful to CARE International for the privilege and trust given to conduct this baseline survey of Promoting Financial Inclusion for Smallholder Farmers Project (PROFIFA). We are deeply grateful to all individuals who shared their precious time and experience through the survey, interviews and focus group discussions to provide useful information with generosity despite their busy schedules. Particular thanks are expressed to the entire staff of PROFIFA project team for their continued guidance and support during the entire duration of this review and for providing useful data, information and advices. A final word of gratitude is offered to the field officers and all other non-mentioned stakeholders who supported the survey in one way or another for their generous assistance and cooperation in outreaching the key respondents and collecting useful information as well as for providing a friendly working environment to the research team.
P R O F I F A B a s e l i n e S u r v e y R e p o r t P a g e iii | 55
TABLE OF CONTENTS
ACKNOWLEDGMENTS II
TABLE OF CONTENTS III
EXECUTIVE SUMMARY V
LIST OF TABLES VI
LIST OF ACRONYMS VII
1. BACKGROUND INFORMATION 1
1.1 PROJECT DESCRIPTION 1 1.2 BASELINE STUDY OBJECTIVES 1
2. APPROACH AND METHODOLOGY 2
2.1 PLANNING AND PREPARATION 2 2.2 DATA COLLECTION 2 2.2.1 SECONDARY DATA COLLECTION 2 2.2.2 PRIMARY DATA COLLECTION 2 2.3 DATA QUALITY ASSURANCE AND SECURITY 5 2.4 DATA ANALYSIS AND REPORTING 5
3. MAIN FINDINGS AND DISCUSSIONS 6
3.1 SOCIAL DEMOGRAPHIC CHARACTERISTICS OF RESPONDENTS 6 3.1.1 GENDER, HEADSHIP AND POSITION OF RESPONDENTS 6 3.1.2 AGE OF RESPONDENTS 6 3.1.3 HOUSEHOLD SIZE 6 3.1.4 TYPE OF PRIMARY OCCUPATION 6 3.1.5 TYPE OF COMMUNITY INITIATIVE 6 3.2 OUTCOME 1: IMPROVED PROFITABILITY AND COMPETITIVENESS AMONG RURAL WOMEN AGRIBUSINESSES. 8 3.2.1 FINANCIAL LITERACY, MANAGERIAL AND ENTREPRENEURIAL SKILLS 8 3.2.2 SHF’S LEVEL OF KNOWLEDGE IN 6 DOMAINS OF FINANCIAL LITERACY 8 3.2.3 SHF’S LEVEL OF ENTREPRENEURIAL SKILLS IN 5 DOMAINS OF ENTREPRENEURSHIP 9 3.2.4 LEVEL OF PARTICIPATION IN MARKET ORIENTED PRODUCER GROUPS 9 3.2.5 LEVEL OF PROFITABILITY OF WOMEN’S MARKET ORIENTED GROUPS 10 3.2.6 CHALLENGES FACED IN THE BUSINESS PRACTICE 11 3.3 OUTCOME 2. IMPROVED ACCESS TO AND USE OF A WIDE RANGE OF AFFORDABLE AND APPROPRIATE FINANCIAL SERVICES 12 3.3.1 FARMERS ACCESSING AND USING FINANCIAL SERVICES 12 3.3.2 SHF PARTICIPATION IN VSLAS 12 3.3.3 SHF PRACTICE OF VSLAS 12 3.3.4 SHF PARTICIPATION IN FORMAL FINANCIAL INSTITUTIONS (MFIS, SACCOS AND BANKS) 13
P R O F I F A B a s e l i n e S u r v e y R e p o r t P a g e iv | 55
3.3.5 SMALL HOLDER FARMERS ACCESS TO DIVERSIFIED FINANCIAL SERVICES 13 3.3.6 SMALLHOLDER FARMERS SAVING BEHAVIOUR 14 3.3.7 FINANCIAL SERVICES USED BY SMALLHOLDER FARMERS 15 3.3.8 SMALLHOLDER FARMERS ACCESS TO CREDIT 16 3.3.9 SMALLHOLDER FARMERS ACCESS TO INSURANCE 16 3.3.10 APPROPRIATENESS OF FINANCIAL SERVICES 16 3.3.11 DIGITAL FINANCIAL SERVICES/SOLUTIONS 17 3.3.12 LINKING VSLAS TO FINANCIAL INSTITUTIONS 18 3.4 OUTCOME 3. INCREASED AGRICULTURE AND SMALL LIVESTOCK PRODUCTION, VALUE ADDITION AND ACCESS TO MARKETS 19 3.4.1 TYPE OF FARMING PRACTICED BY SMALLHOLDER FARMERS 19 3.4.2 PRODUCTIVITY OF MAIZE, HORTICULTURE AND LIVESTOCK 19 3.4.3 SHF’S LEVEL OF KNOWLEDGE ON GAP 20 3.4.4 SHF’S LEVEL OF KNOWLEDGE ON PHM 21 3.4.5 ACCESS TO MARKET FOR MAIZE, HORTICULTURE AND LIVESTOCK PRODUCTS 21 3.5 INTERMEDIATE OUTCOME. INCREASED ECONOMIC AND SOCIAL EMPOWEMENT OF WOMEN 22 3.5.1 WOMEN ACCESS TO AND CONTROL OVER PRODUCTIVE RESOURCES 22 3.5.2 WOMEN ACCESS TO OPPORTUNITIES IN DECISION MAKING 23 3.5.3 DIVISION OF TASKS IN THE HOUSEHOLD 23 3.5.4 DECISION MATING IN THE HOUSEHOLD 24
4. CONCLUSION AND RECOMMENDATION 25
5. REFERENCES 26
6. ANNEXES 27
6.1 ANNEX 1: INDICATOR RESULTS TABLE 27 6.2 ANNEX 2: SMALL FARMER HOLDER QUESTIONNAIRE 30 6.3 ANNEX 3: SMALL FARMER HOLDER FDGS GUIDES 40 6.4 ANNEX 4: INTERVIEW GUIDES FOR FINANCIAL INSTITUTIONS 42 6.5 ANNEX 5: INTERVIEW GUIDES FOR AGRONOMIST 44 6.6 ANNEX 6: INTERVIEW GUIDES FOR VSLAS REPRESENTATIVES 46
P R O F I F A B a s e l i n e S u r v e y R e p o r t P a g e v | 55
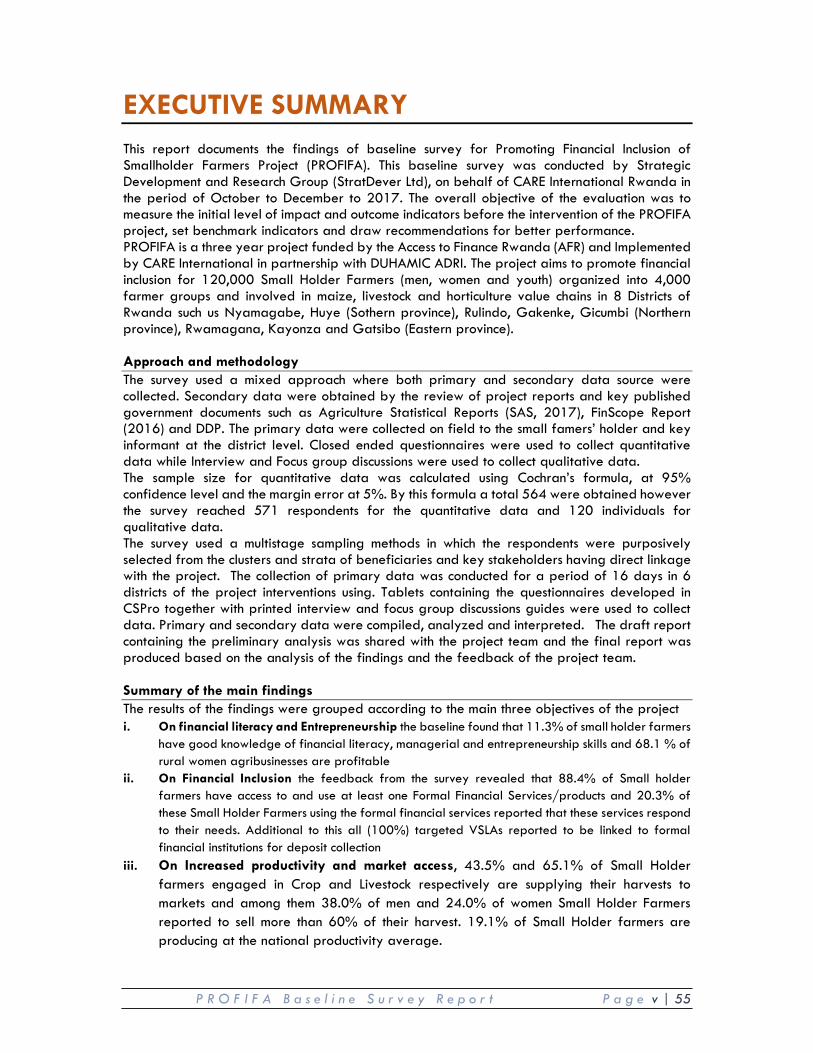
EXECUTIVE SUMMARY This report documents the findings of baseline survey for Promoting Financial Inclusion of Smallholder Farmers Project (PROFIFA). This baseline survey was conducted by Strategic Development and Research Group (StratDever Ltd), on behalf of CARE International Rwanda in the period of October to December to 2017. The overall objective of the evaluation was to measure the initial level of impact and outcome indicators before the intervention of the PROFIFA project, set benchmark indicators and draw recommendations for better performance. PROFIFA is a three year project funded by the Access to Finance Rwanda (AFR) and Implemented by CARE International in partnership with DUHAMIC ADRI. The project aims to promote financial inclusion for 120,000 Small Holder Farmers (men, women and youth) organized into 4,000 farmer groups and involved in maize, livestock and horticulture value chains in 8 Districts of Rwanda such us Nyamagabe, Huye (Sothern province), Rulindo, Gakenke, Gicumbi (Northern province), Rwamagana, Kayonza and Gatsibo (Eastern province). Approach and methodology The survey used a mixed approach where both primary and secondary data source were collected. Secondary data were obtained by the review of project reports and key published government documents such as Agriculture Statistical Reports (SAS, 2017), FinScope Report (2016) and DDP. The primary data were collected on field to the small famers’ holder and key informant at the district level. Closed ended questionnaires were used to collect quantitative data while Interview and Focus group discussions were used to collect qualitative data. The sample size for quantitative data was calculated using Cochran’s formula, at 95% confidence level and the margin error at 5%. By this formula a total 564 were obtained however the survey reached 571 respondents for the quantitative data and 120 individuals for qualitative data. The survey used a multistage sampling methods in which the respondents were purposively selected from the clusters and strata of beneficiaries and key stakeholders having direct linkage with the project. The collection of primary data was conducted for a period of 16 days in 6 districts of the project interventions using. Tablets containing the questionnaires developed in CSPro together with printed interview and focus group discussions guides were used to collect data. Primary and secondary data were compiled, analyzed and interpreted. The draft report containing the preliminary analysis was shared with the project team and the final report was produced based on the analysis of the findings and the feedback of the project team. Summary of the main findings The results of the findings were grouped according to the main three objectives of the project i. On financial literacy and Entrepreneurship the baseline found that 11.3% of small holder farmers
have good knowledge of financial literacy, managerial and entrepreneurship skills and 68.1 % of rural women agribusinesses are profitable
ii. On Financial Inclusion the feedback from the survey revealed that 88.4% of Small holder farmers have access to and use at least one Formal Financial Services/products and 20.3% of these Small Holder Farmers using the formal financial services reported that these services respond to their needs. Additional to this all (100%) targeted VSLAs reported to be linked to formal financial institutions for deposit collection
iii. On Increased productivity and market access, 43.5% and 65.1% of Small Holder farmers engaged in Crop and Livestock respectively are supplying their harvests to markets and among them 38.0% of men and 24.0% of women Small Holder Farmers reported to sell more than 60% of their harvest. 19.1% of Small Holder farmers are producing at the national productivity average.
P R O F I F A B a s e l i n e S u r v e y R e p o r t P a g e vi | 55
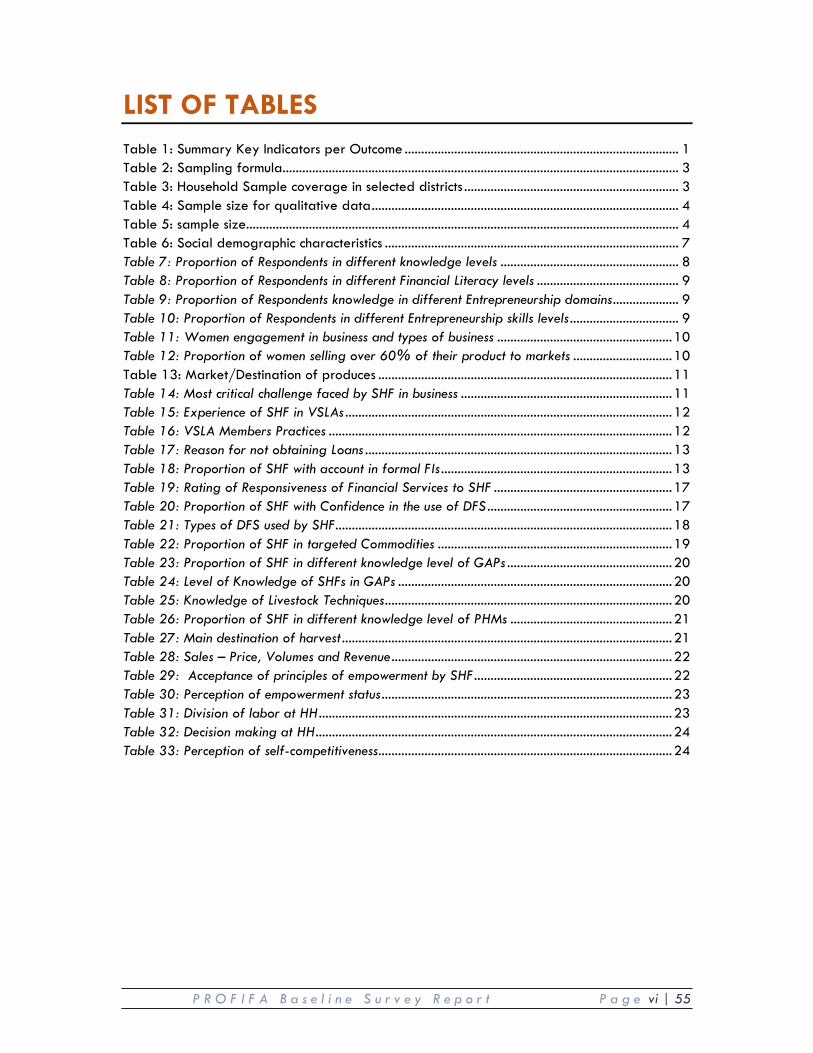
LIST OF TABLES Table 1: Summary Key Indicators per Outcome ................................................................................... 1 Table 2: Sampling formula........................................................................................................................ 3 Table 3: Household Sample coverage in selected districts ................................................................. 3 Table 4: Sample size for qualitative data ............................................................................................. 4 Table 5: sample size ................................................................................................................................... 4 Table 6: Social demographic characteristics ......................................................................................... 7 Table 7: Proportion of Respondents in different knowledge levels ...................................................... 8 Table 8: Proportion of Respondents in different Financial Literacy levels ........................................... 9 Table 9: Proportion of Respondents knowledge in different Entrepreneurship domains .................... 9 Table 10: Proportion of Respondents in different Entrepreneurship skills levels ................................. 9 Table 11: Women engagement in business and types of business ..................................................... 10 Table 12: Proportion of women selling over 60% of their product to markets .............................. 10 Table 13: Market/Destination of produces ......................................................................................... 11 Table 14: Most critical challenge faced by SHF in business ................................................................ 11 Table 15: Experience of SHF in VSLAs ................................................................................................... 12 Table 16: VSLA Members Practices ........................................................................................................ 12 Table 17: Reason for not obtaining Loans ............................................................................................. 13 Table 18: Proportion of SHF with account in formal FIs ...................................................................... 13 Table 19: Rating of Responsiveness of Financial Services to SHF ...................................................... 17 Table 20: Proportion of SHF with Confidence in the use of DFS ........................................................ 17 Table 21: Types of DFS used by SHF ...................................................................................................... 18 Table 22: Proportion of SHF in targeted Commodities ....................................................................... 19 Table 23: Proportion of SHF in different knowledge level of GAPs .................................................. 20 Table 24: Level of Knowledge of SHFs in GAPs ................................................................................... 20 Table 25: Knowledge of Livestock Techniques ....................................................................................... 20 Table 26: Proportion of SHF in different knowledge level of PHMs ................................................. 21 Table 27: Main destination of harvest .................................................................................................... 21 Table 28: Sales – Price, Volumes and Revenue ..................................................................................... 22 Table 29: Acceptance of principles of empowerment by SHF ............................................................ 22 Table 30: Perception of empowerment status ........................................................................................ 23 Table 31: Division of labor at HH ........................................................................................................... 23 Table 32: Decision making at HH ............................................................................................................ 24 Table 33: Perception of self-competitiveness ......................................................................................... 24
P R O F I F A B a s e l i n e S u r v e y R e p o r t P a g e vii | 55
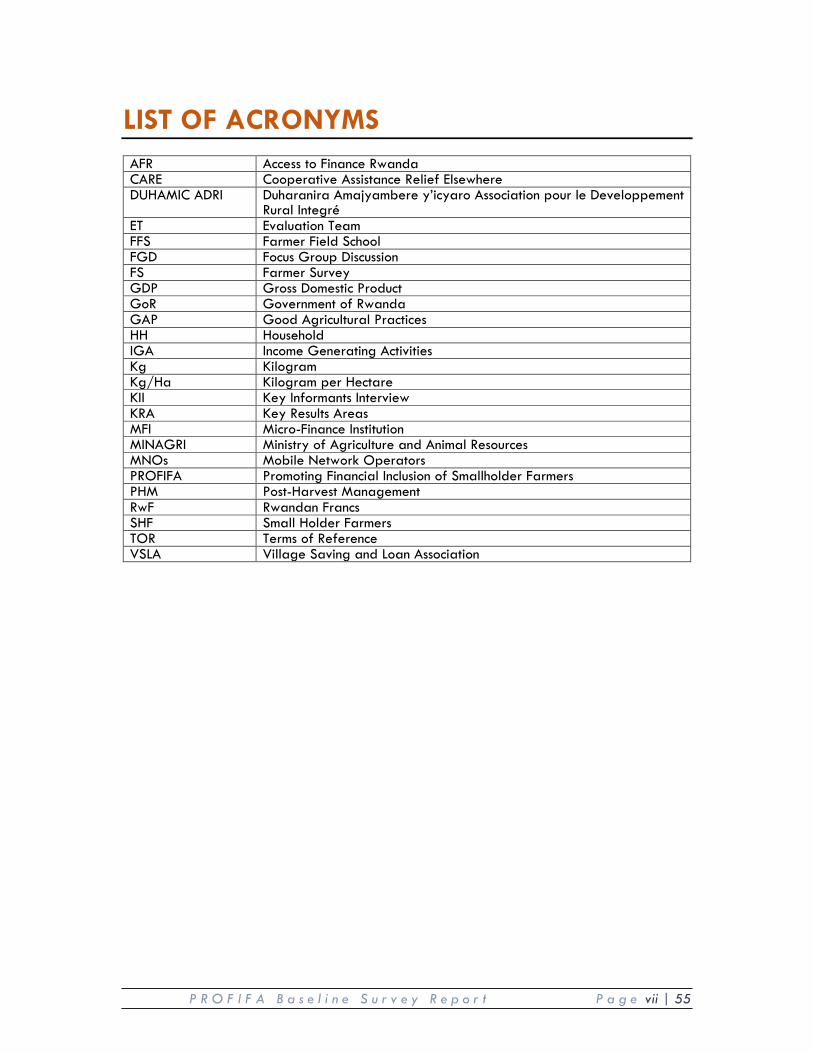
LIST OF ACRONYMS AFR Access to Finance Rwanda CARE Cooperative Assistance Relief Elsewhere DUHAMIC ADRI Duharanira Amajyambere y’icyaro Association pour le Developpement
Rural Integré ET Evaluation Team FFS Farmer Field School FGD Focus Group Discussion FS Farmer Survey GDP Gross Domestic Product GoR Government of Rwanda GAP Good Agricultural Practices HH Household IGA Income Generating Activities Kg Kilogram Kg/Ha Kilogram per Hectare KII Key Informants Interview KRA Key Results Areas MFI Micro-Finance Institution MINAGRI Ministry of Agriculture and Animal Resources MNOs Mobile Network Operators PROFIFA Promoting Financial Inclusion of Smallholder Farmers PHM Post-Harvest Management RwF Rwandan Francs SHF Small Holder Farmers TOR Terms of Reference VSLA Village Saving and Loan Association
P R O F I F A B a s e l i n e S u r v e y R e p o r t P a g e 1 | 55
1. BACKGROUND INFORMATION 1.1 Project description The Promoting Financial Inclusion of Smallholder Farmers (PROFIFA) is a 3 year project funded by the Access to Finance Rwanda (AFR) as part of its agricultural finance development agenda and Implemented by CARE International in partnership with DUHAMIC ADRI. The project aims to promoting financial inclusion for 120,000 Small Holder Farmers (Women and Youth) organized into 4,000 farmer groups and involved in maize, livestock and horticulture value chains. The project seeks to specifically achieve three (3) interlinked outcomes:
i) Improved profitability and competitiveness of rural women’s agribusinesses, ii) Smallholder farmers grouped into mature Voluntary Savings and Loans Associations (VSLA)
access and use a wide range of affordable and appropriate agricultural financial services,
iii) Increased agriculture and small livestock production, value addition and access to markets among 120,000 youth and women smallholder farmers.
The PROFIFA project will work to support entrepreneurial and competitiveness of women and youth involved in agriculture and VSLAs through promotion of a range of capacity building interventions in agribusiness, access to finance and market oriented agriculture. The project will work with small entrepreneurial farmers in eight districts of Nyamagabe, Huye (Sothern province), Rulindo, Gakenke, Gicumbi (Northern province), Rwamagana, Kayonza and Gatsibo (Eastern province), targeting Smallholder farmers who are members of saving groups and are engaged in Maize, Horticulture (Vegetables and fruits: Tomato, onions, carrots, cabbages; flours; fruits and banana) and Small Livestock (Poultry, rabbits and pig farming). This baseline supports the PROFIFA project by informing programing and monitoring and evaluation of this 4-year intervention around these key milestones
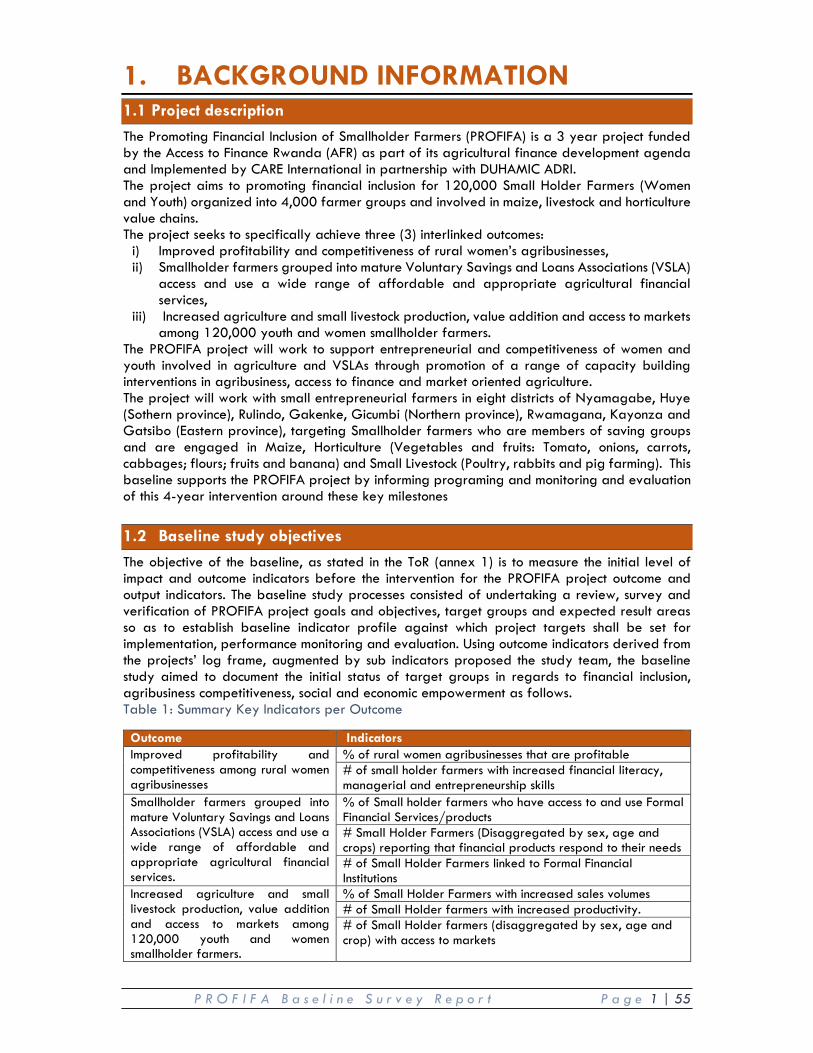
1.2 Baseline study objectives The objective of the baseline, as stated in the ToR (annex 1) is to measure the initial level of impact and outcome indicators before the intervention for the PROFIFA project outcome and output indicators. The baseline study processes consisted of undertaking a review, survey and verification of PROFIFA project goals and objectives, target groups and expected result areas so as to establish baseline indicator profile against which project targets shall be set for implementation, performance monitoring and evaluation. Using outcome indicators derived from the projects’ log frame, augmented by sub indicators proposed the study team, the baseline study aimed to document the initial status of target groups in regards to financial inclusion, agribusiness competitiveness, social and economic empowerment as follows. Table 1: Summary Key Indicators per Outcome
Outcome Indicators Improved profitability and competitiveness among rural women agribusinesses
% of rural women agribusinesses that are profitable # of small holder farmers with increased financial literacy, managerial and entrepreneurship skills
Smallholder farmers grouped into mature Voluntary Savings and Loans Associations (VSLA) access and use a wide range of affordable and appropriate agricultural financial services.
% of Small holder farmers who have access to and use Formal Financial Services/products # Small Holder Farmers (Disaggregated by sex, age and crops) reporting that financial products respond to their needs # of Small Holder Farmers linked to Formal Financial Institutions
Increased agriculture and small livestock production, value addition and access to markets among 120,000 youth and women smallholder farmers.
% of Small Holder Farmers with increased sales volumes # of Small Holder farmers with increased productivity. # of Small Holder farmers (disaggregated by sex, age and crop) with access to markets
P R O F I F A B a s e l i n e S u r v e y R e p o r t P a g e 2 | 55
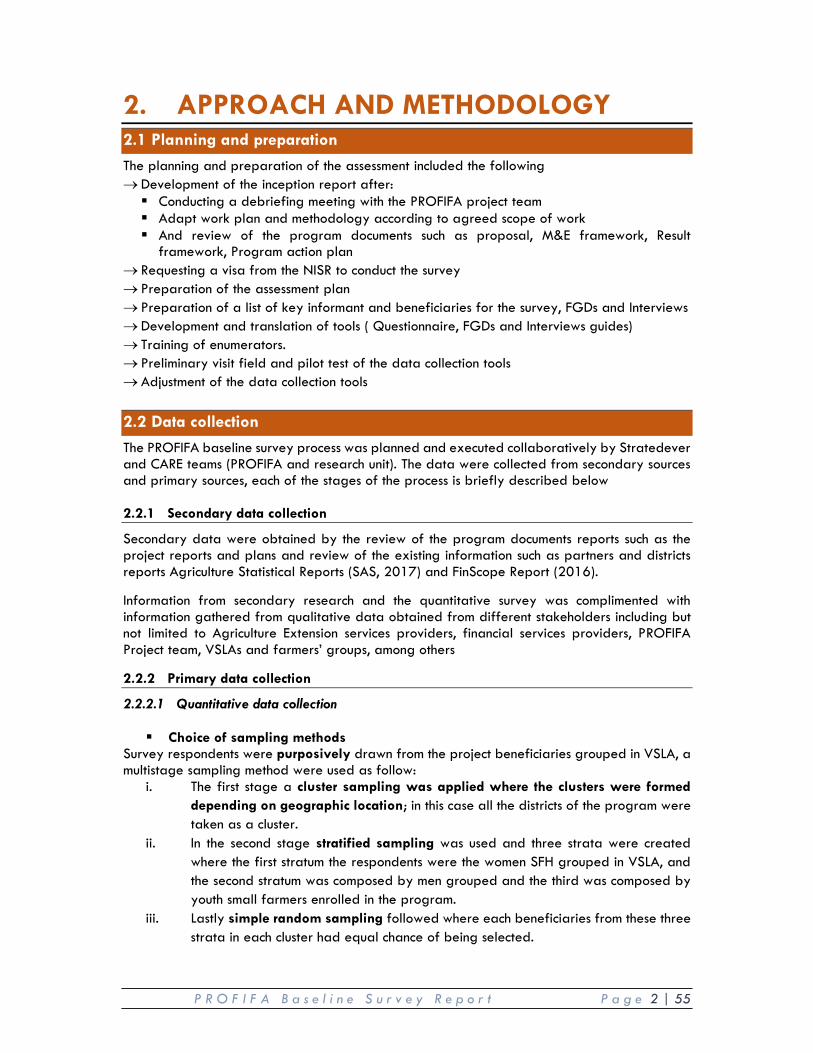
2. APPROACH AND METHODOLOGY 2.1 Planning and preparation The planning and preparation of the assessment included the following o Development of the inception report after: � Conducting a debriefing meeting with the PROFIFA project team � Adapt work plan and methodology according to agreed scope of work � And review of the program documents such as proposal, M&E framework, Result
framework, Program action plan o Requesting a visa from the NISR to conduct the survey o Preparation of the assessment plan o Preparation of a list of key informant and beneficiaries for the survey, FGDs and Interviews o Development and translation of tools ( Questionnaire, FGDs and Interviews guides) o Training of enumerators. o Preliminary visit field and pilot test of the data collection tools o Adjustment of the data collection tools
2.2 Data collection The PROFIFA baseline survey process was planned and executed collaboratively by Stratedever and CARE teams (PROFIFA and research unit). The data were collected from secondary sources and primary sources, each of the stages of the process is briefly described below 2.2.1 Secondary data collection
Secondary data were obtained by the review of the program documents reports such as the project reports and plans and review of the existing information such as partners and districts reports Agriculture Statistical Reports (SAS, 2017) and FinScope Report (2016).
Information from secondary research and the quantitative survey was complimented with information gathered from qualitative data obtained from different stakeholders including but not limited to Agriculture Extension services providers, financial services providers, PROFIFA Project team, VSLAs and farmers’ groups, among others
2.2.2 Primary data collection
2.2.2.1 Quantitative data collection
� Choice of sampling methods Survey respondents were purposively drawn from the project beneficiaries grouped in VSLA, a multistage sampling method were used as follow:
i. The first stage a cluster sampling was applied where the clusters were formed depending on geographic location; in this case all the districts of the program were taken as a cluster.
ii. In the second stage stratified sampling was used and three strata were created where the first stratum the respondents were the women SFH grouped in VSLA, and the second stratum was composed by men grouped and the third was composed by youth small farmers enrolled in the program.
iii. Lastly simple random sampling followed where each beneficiaries from these three strata in each cluster had equal chance of being selected.
P R O F I F A B a s e l i n e S u r v e y R e p o r t P a g e 3 | 55
� Sampling formula
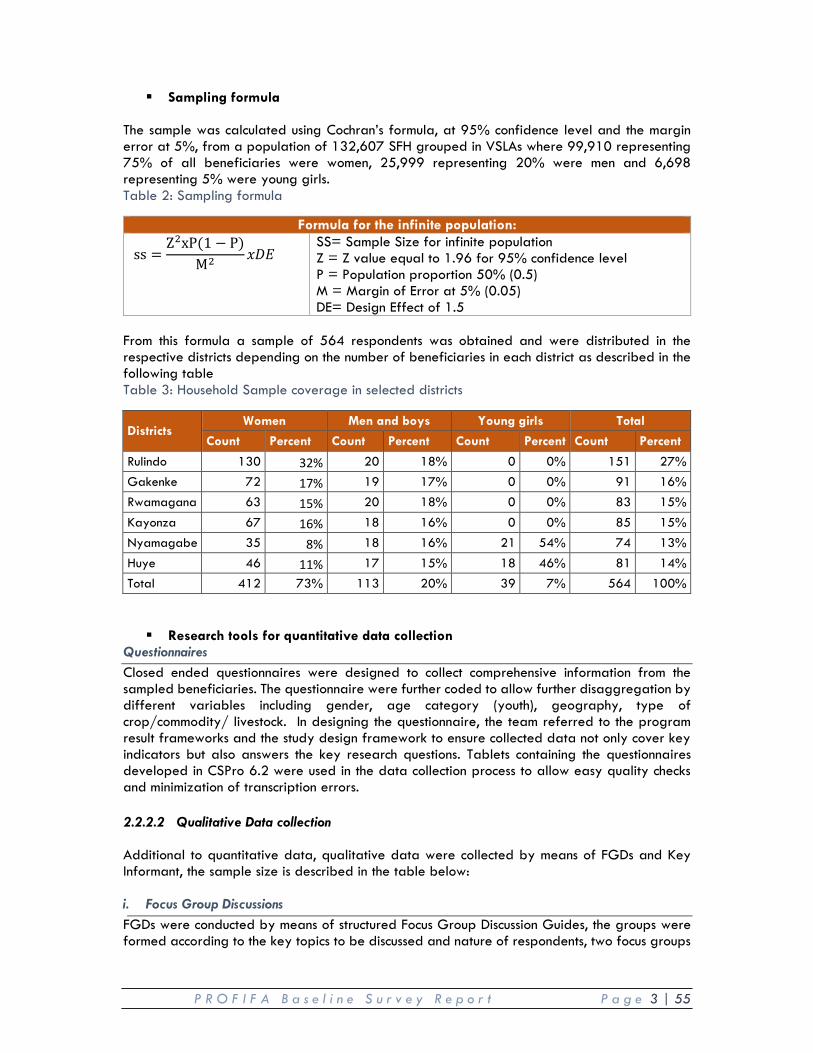
The sample was calculated using Cochran’s formula, at 95% confidence level and the margin error at 5%, from a population of 132,607 SFH grouped in VSLAs where 99,910 representing 75% of all beneficiaries were women, 25,999 representing 20% were men and 6,698 representing 5% were young girls. Table 2: Sampling formula
Formula for the infinite population:
ss =Z2xP(1 − P)
M2 𝑥𝐷𝐸 SS= Sample Size for infinite population Z = Z value equal to 1.96 for 95% confidence level P = Population proportion 50% (0.5) M = Margin of Error at 5% (0.05) DE= Design Effect of 1.5
From this formula a sample of 564 respondents was obtained and were distributed in the respective districts depending on the number of beneficiaries in each district as described in the following table Table 3: Household Sample coverage in selected districts
Districts Women Men and boys Young girls Total
Count Percent Count Percent Count Percent Count Percent
Rulindo 130 32% 20 18% 0 0% 151 27% Gakenke 72 17% 19 17% 0 0% 91 16% Rwamagana 63 15% 20 18% 0 0% 83 15% Kayonza 67 16% 18 16% 0 0% 85 15% Nyamagabe 35 8% 18 16% 21 54% 74 13% Huye 46 11% 17 15% 18 46% 81 14% Total 412 73% 113 20% 39 7% 564 100%
� Research tools for quantitative data collection Questionnaires Closed ended questionnaires were designed to collect comprehensive information from the sampled beneficiaries. The questionnaire were further coded to allow further disaggregation by different variables including gender, age category (youth), geography, type of crop/commodity/ livestock. In designing the questionnaire, the team referred to the program result frameworks and the study design framework to ensure collected data not only cover key indicators but also answers the key research questions. Tablets containing the questionnaires developed in CSPro 6.2 were used in the data collection process to allow easy quality checks and minimization of transcription errors. 2.2.2.2 Qualitative Data collection Additional to quantitative data, qualitative data were collected by means of FGDs and Key Informant, the sample size is described in the table below: i. Focus Group Discussions FGDs were conducted by means of structured Focus Group Discussion Guides, the groups were formed according to the key topics to be discussed and nature of respondents, two focus groups
P R O F I F A B a s e l i n e S u r v e y R e p o r t P a g e 4 | 55
were formed in one District and each group had at least 8 participants, the FGDs were facilitated by the team leader assisted by one enumerator for recording and note taking of the discussions.
i. Focus Group Discussion 1: SFH members of VSLA ii. Focus Group Discussion 2: VSLAs Presidents or Board committee
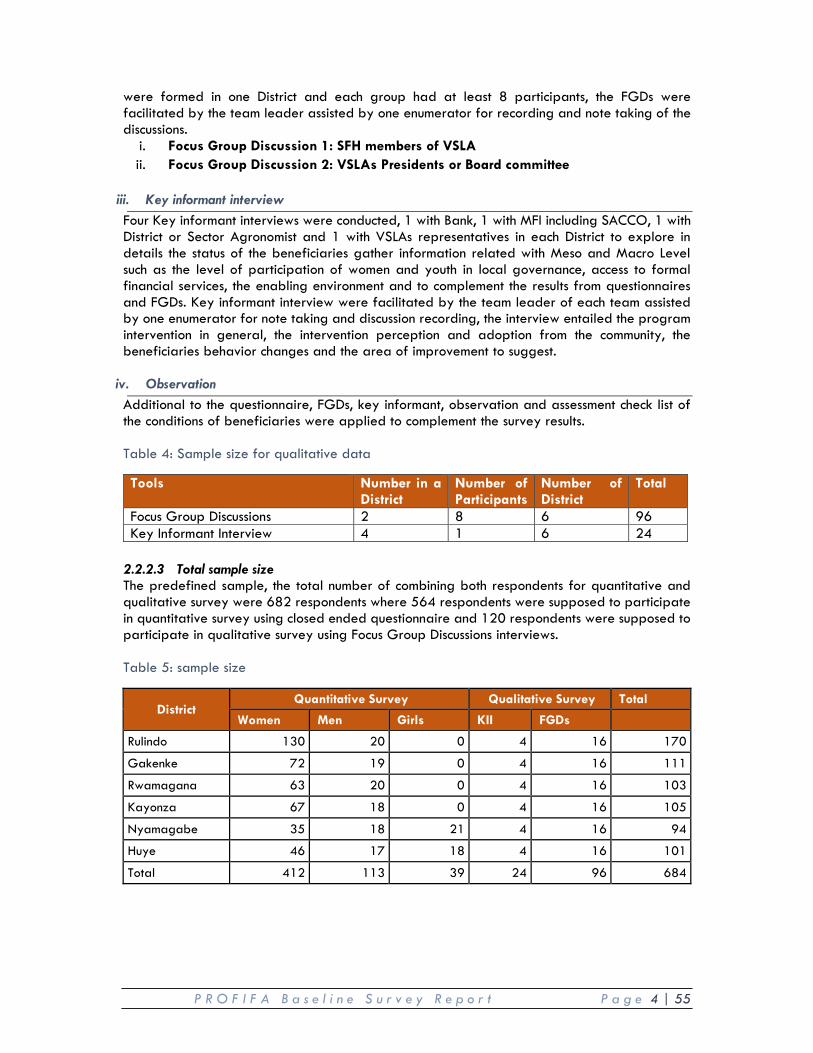
iii. Key informant interview Four Key informant interviews were conducted, 1 with Bank, 1 with MFI including SACCO, 1 with District or Sector Agronomist and 1 with VSLAs representatives in each District to explore in details the status of the beneficiaries gather information related with Meso and Macro Level such as the level of participation of women and youth in local governance, access to formal financial services, the enabling environment and to complement the results from questionnaires and FGDs. Key informant interview were facilitated by the team leader of each team assisted by one enumerator for note taking and discussion recording, the interview entailed the program intervention in general, the intervention perception and adoption from the community, the beneficiaries behavior changes and the area of improvement to suggest.
iv. Observation Additional to the questionnaire, FGDs, key informant, observation and assessment check list of the conditions of beneficiaries were applied to complement the survey results. Table 4: Sample size for qualitative data
Tools Number in a District
Number of Participants
Number of District
Total
Focus Group Discussions 2 8 6 96 Key Informant Interview 4 1 6 24
2.2.2.3 Total sample size The predefined sample, the total number of combining both respondents for quantitative and qualitative survey were 682 respondents where 564 respondents were supposed to participate in quantitative survey using closed ended questionnaire and 120 respondents were supposed to participate in qualitative survey using Focus Group Discussions interviews. Table 5: sample size
District Quantitative Survey Qualitative Survey Total
Women Men Girls KII FGDs Rulindo 130 20 0 4 16 170
Gakenke 72 19 0 4 16 111
Rwamagana 63 20 0 4 16 103
Kayonza 67 18 0 4 16 105
Nyamagabe 35 18 21 4 16 94
Huye 46 17 18 4 16 101
Total 412 113 39 24 96 684
P R O F I F A B a s e l i n e S u r v e y R e p o r t P a g e 5 | 55
2.3 Data Quality Assurance and Security
In additional to Enumerators training and briefing on data collection protocol, Spot-checks were carried out by the Field Coordinator who ensured every enumerator is spot-checked during early days (particularly on the very first 2 days) of data collection. In addition, the evaluation team had one (1) back checker who back-checked 5 to 10 % of the surveys (revisiting survey respondents and verifying data quality (key survey questions and overall survey protocol adherence) to identify concerns with data quality. The back-check protocol were approved by the evaluation team. Moreover, the programmed questionnaire had a “duration” field that recorded the time spent on each interview.
2.4 Data Analysis and reporting
Editing the data were carried out progressively during and after the field survey. Data derived from questionnaires, FGDs and KII were sorted according to key themes and sub-themes. Raw data obtained in via CAPI outputs (of data entry matrix developed using CSpro) were cleaned using Stata and imported to SPSS for analysis and Excel for Graphic presentation. Frequency tables, cross-tabulations and descriptive statistics, different types of graphs and histograms were produced and used in reporting and interpreting the survey data. Although the baseline data are ‘descriptive’ in nature, the analytical side aimed at answering the key research questions while following the Study Design Framework (see section 3.5.) in a ‘convergent parallel design where data both quantitative and qualitative) were compared, related and interpreted reference made to PROFIFA Theory of Change, Assumptions and general Theory of Financial Literacy and financial inclusion, Agriculture Extension, and access to markets. The preliminary analysis were shared with the CARE PROFIFA team in a debriefing session and included data generated to respond to specific project indicators. A draft report were compiled based on the analysis and feedback received from the CARE PROFIFA team through the debriefing session. The final report captured the analysis of the issue along with recommendations section identifying potential areas of work within the current and future programming.
P R O F I F A B a s e l i n e S u r v e y R e p o r t P a g e 6 | 55
3. MAIN FINDINGS AND DISCUSSIONS 3.1 Social Demographic Characteristics of respondents This section covers the social demographic context of the survey in terms of respondent and household characteristics. The survey questionnaires collected basic demographic and socioeconomic information. The results from the baseline survey outline the profile of the respondents in the study area. 3.1.1 Gender, Headship and Position of Respondents
73.9% of the respondents were female against the 75% planned during sampling. This was due to slightly low turn up/participation of women and a corresponding high participation of men. The analysis of the household characteristics of the respondents participating in the project revealed that household headed by men are a triple of those headed by women despite the high proportion of women sampled and interviewed. 3.1.2 Age of Respondents
A look at the distribution of age of respondents shows that the majority of the respondents (42.4%) are aged between 31 and 45 years. While the 46 – 60 range follows with 26.6%, the youth population represent (20.8 %) of respondents. While the respondents under 18 and over 60 years’ old accounts 0.7% and 9.5% respectively. 3.1.3 Household Size
Over the entire sample of 571 respondents the average household size was 5.35 members. There was not much variability between the districts where the lowest average size per district was 5.1 and the highest average size per districts was 5.45 members per households. This findings shows that this average is in line with the national average of 5.2 members (NISR, 2009). 3.1.4 Type of Primary Occupation
Sources of income or Primary occupation as reported by respondents clearly indicated that agricultural production is by far the most common source of income employing 89.7% respondents. Petty trading follows with 4.2% and other occupations represent 2.9%. While Huye, Gakenke and Rulindo take the lead in Agriculture (94%, 93% and 92%), Nyamagabe, Kayonza and Rwamagana show relatively higher proportion of respondents with petty trading as primary occupation accounting 7.5%, 5.5% and 4% respectively. A comparison of primary occupation by gender shows that women are predominantly in Agriculture while men have started diversify in non-farming employment such as Non agriculture labor where men account 2.7% against 1.7 % women, on salaried worker men account 2% as opposed to only 0.5% in women. In addition to the primary occupation, the survey explored the extent to which SHFs have a diversified income stream and it found that only 35% of the respondents are engaged in more than one income generating activity which means that 65% of respondents depend solely on Agriculture as their source of livelihoods. 3.1.5 Type of Community Initiative
Over the entire sample of 571 SHF, 50.8% are farming under consolidated lands, 26.6% are part of Twigire Farmer Groups and 12.8% benefited from VUP Support from which only 1.2% accessed its subsidized loans. As the table 11 put it, it is clear that SHFs targeted by PROFIFA have a limited access to government extension and social protection services which lead to low
P R O F I F A B a s e l i n e S u r v e y R e p o r t P a g e 7 | 55
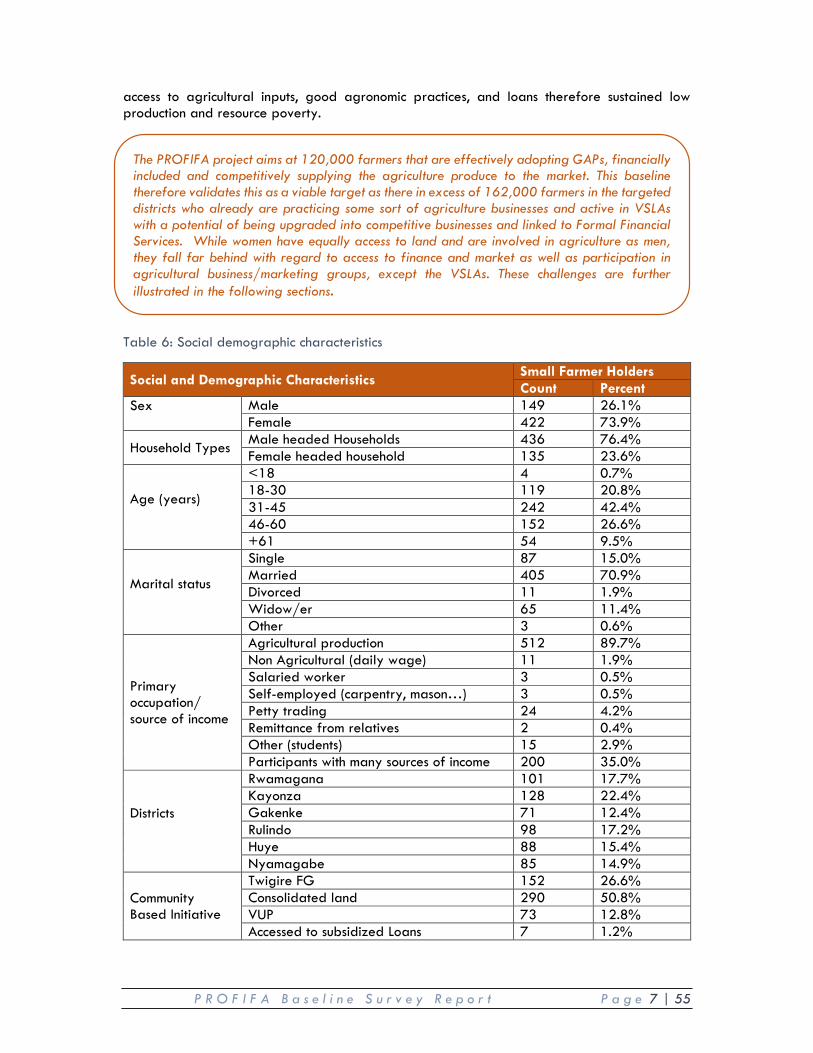
access to agricultural inputs, good agronomic practices, and loans therefore sustained low production and resource poverty. Table 6: Social demographic characteristics
Social and Demographic Characteristics Small Farmer Holders Count Percent
Sex
Male 149 26.1% Female 422 73.9%
Household Types Male headed Households 436 76.4% Female headed household 135 23.6%
Age (years)
<18 4 0.7% 18-30 119 20.8% 31-45 242 42.4% 46-60 152 26.6% +61 54 9.5%
Marital status
Single 87 15.0% Married 405 70.9% Divorced 11 1.9% Widow/er 65 11.4% Other 3 0.6%
Primary occupation/ source of income
Agricultural production 512 89.7% Non Agricultural (daily wage) 11 1.9% Salaried worker 3 0.5% Self-employed (carpentry, mason…) 3 0.5% Petty trading 24 4.2% Remittance from relatives 2 0.4% Other (students) 15 2.9% Participants with many sources of income 200 35.0%
Districts
Rwamagana 101 17.7% Kayonza 128 22.4% Gakenke 71 12.4% Rulindo 98 17.2% Huye 88 15.4% Nyamagabe 85 14.9%
Community Based Initiative
Twigire FG 152 26.6% Consolidated land 290 50.8% VUP 73 12.8% Accessed to subsidized Loans 7 1.2%
The PROFIFA project aims at 120,000 farmers that are effectively adopting GAPs, financially included and competitively supplying the agriculture produce to the market. This baseline therefore validates this as a viable target as there in excess of 162,000 farmers in the targeted districts who already are practicing some sort of agriculture businesses and active in VSLAs with a potential of being upgraded into competitive businesses and linked to Formal Financial Services. While women have equally access to land and are involved in agriculture as men, they fall far behind with regard to access to finance and market as well as participation in agricultural business/marketing groups, except the VSLAs. These challenges are further illustrated in the following sections.
P R O F I F A B a s e l i n e S u r v e y R e p o r t P a g e 8 | 55
3.2 Outcome 1: Improved profitability and competitiveness among rural women agribusinesses.
3.2.1 Financial literacy, Managerial and Entrepreneurial skills
To gauge the level of financial literacy and entrepreneurship skills, the baseline looked at knowledge levels in 6 domains of financial literacy, level of basic management capability and level of entrepreneurial skills separately. 3.2.2 SHF’s level of knowledge in 6 domains of Financial Literacy
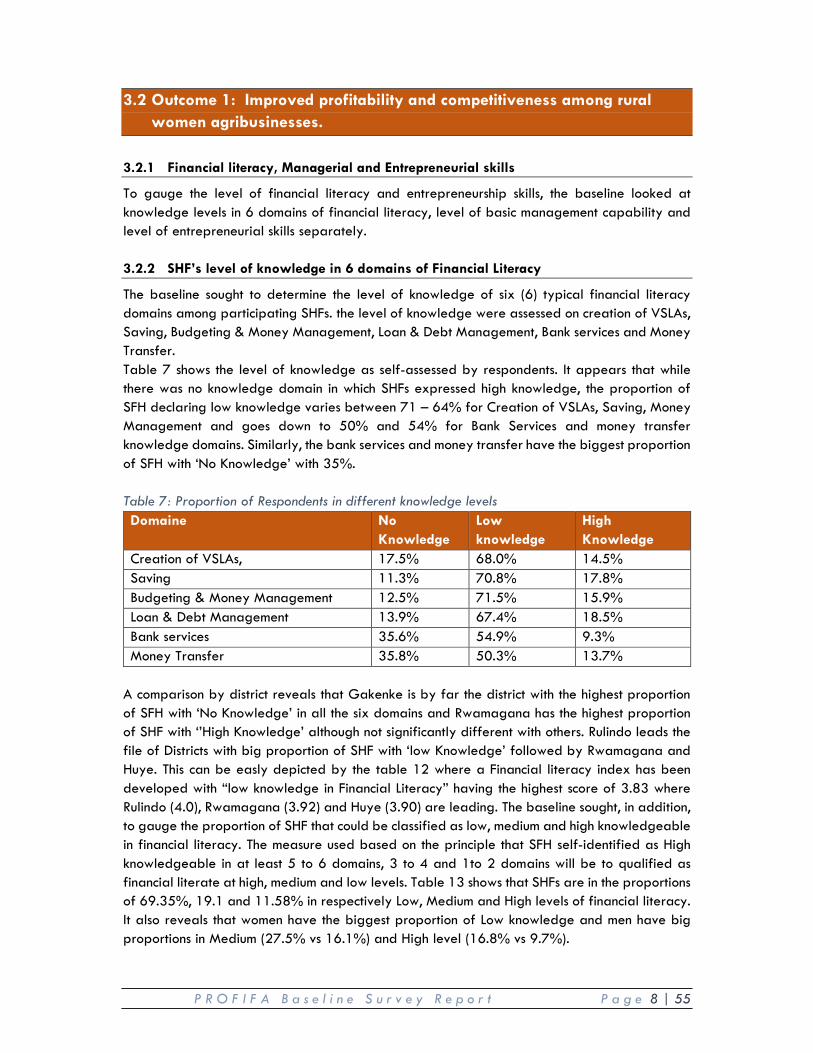
The baseline sought to determine the level of knowledge of six (6) typical financial literacy domains among participating SHFs. the level of knowledge were assessed on creation of VSLAs, Saving, Budgeting & Money Management, Loan & Debt Management, Bank services and Money Transfer. Table 7 shows the level of knowledge as self-assessed by respondents. It appears that while there was no knowledge domain in which SHFs expressed high knowledge, the proportion of SFH declaring low knowledge varies between 71 – 64% for Creation of VSLAs, Saving, Money Management and goes down to 50% and 54% for Bank Services and money transfer knowledge domains. Similarly, the bank services and money transfer have the biggest proportion of SFH with ‘No Knowledge’ with 35%. Table 7: Proportion of Respondents in different knowledge levels Domaine No
Knowledge Low knowledge
High Knowledge
Creation of VSLAs, 17.5% 68.0% 14.5% Saving 11.3% 70.8% 17.8% Budgeting & Money Management 12.5% 71.5% 15.9% Loan & Debt Management 13.9% 67.4% 18.5% Bank services 35.6% 54.9% 9.3% Money Transfer 35.8% 50.3% 13.7%
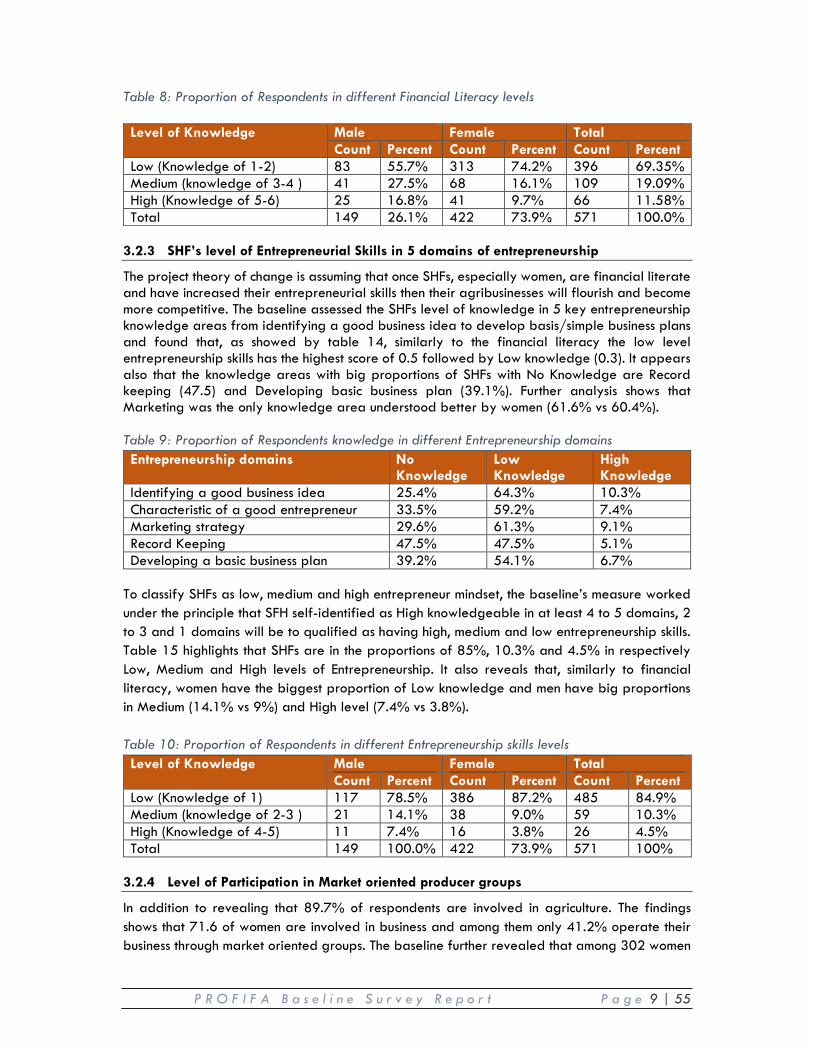
A comparison by district reveals that Gakenke is by far the district with the highest proportion of SFH with ‘No Knowledge’ in all the six domains and Rwamagana has the highest proportion of SHF with ‘’High Knowledge’ although not significantly different with others. Rulindo leads the file of Districts with big proportion of SHF with ‘low Knowledge’ followed by Rwamagana and Huye. This can be easly depicted by the table 12 where a Financial literacy index has been developed with “low knowledge in Financial Literacy” having the highest score of 3.83 where Rulindo (4.0), Rwamagana (3.92) and Huye (3.90) are leading. The baseline sought, in addition, to gauge the proportion of SHF that could be classified as low, medium and high knowledgeable in financial literacy. The measure used based on the principle that SFH self-identified as High knowledgeable in at least 5 to 6 domains, 3 to 4 and 1to 2 domains will be to qualified as financial literate at high, medium and low levels. Table 13 shows that SHFs are in the proportions of 69.35%, 19.1 and 11.58% in respectively Low, Medium and High levels of financial literacy. It also reveals that women have the biggest proportion of Low knowledge and men have big proportions in Medium (27.5% vs 16.1%) and High level (16.8% vs 9.7%).
P R O F I F A B a s e l i n e S u r v e y R e p o r t P a g e 9 | 55
Table 8: Proportion of Respondents in different Financial Literacy levels Level of Knowledge Male Female Total
Count Percent Count Percent Count Percent Low (Knowledge of 1-2) 83 55.7% 313 74.2% 396 69.35% Medium (knowledge of 3-4 ) 41 27.5% 68 16.1% 109 19.09% High (Knowledge of 5-6) 25 16.8% 41 9.7% 66 11.58% Total 149 26.1% 422 73.9% 571 100.0%
3.2.3 SHF’s level of Entrepreneurial Skills in 5 domains of entrepreneurship
The project theory of change is assuming that once SHFs, especially women, are financial literate and have increased their entrepreneurial skills then their agribusinesses will flourish and become more competitive. The baseline assessed the SHFs level of knowledge in 5 key entrepreneurship knowledge areas from identifying a good business idea to develop basis/simple business plans and found that, as showed by table 14, similarly to the financial literacy the low level entrepreneurship skills has the highest score of 0.5 followed by Low knowledge (0.3). It appears also that the knowledge areas with big proportions of SHFs with No Knowledge are Record keeping (47.5) and Developing basic business plan (39.1%). Further analysis shows that Marketing was the only knowledge area understood better by women (61.6% vs 60.4%). Table 9: Proportion of Respondents knowledge in different Entrepreneurship domains Entrepreneurship domains No
Knowledge Low Knowledge
High Knowledge
Identifying a good business idea 25.4% 64.3% 10.3% Characteristic of a good entrepreneur 33.5% 59.2% 7.4% Marketing strategy 29.6% 61.3% 9.1% Record Keeping 47.5% 47.5% 5.1% Developing a basic business plan 39.2% 54.1% 6.7%
To classify SHFs as low, medium and high entrepreneur mindset, the baseline’s measure worked under the principle that SFH self-identified as High knowledgeable in at least 4 to 5 domains, 2 to 3 and 1 domains will be to qualified as having high, medium and low entrepreneurship skills. Table 15 highlights that SHFs are in the proportions of 85%, 10.3% and 4.5% in respectively Low, Medium and High levels of Entrepreneurship. It also reveals that, similarly to financial literacy, women have the biggest proportion of Low knowledge and men have big proportions in Medium (14.1% vs 9%) and High level (7.4% vs 3.8%). Table 10: Proportion of Respondents in different Entrepreneurship skills levels Level of Knowledge Male Female Total
Count Percent Count Percent Count Percent Low (Knowledge of 1) 117 78.5% 386 87.2% 485 84.9% Medium (knowledge of 2-3 ) 21 14.1% 38 9.0% 59 10.3% High (Knowledge of 4-5) 11 7.4% 16 3.8% 26 4.5% Total 149 100.0% 422 73.9% 571 100%
3.2.4 Level of Participation in Market oriented producer groups
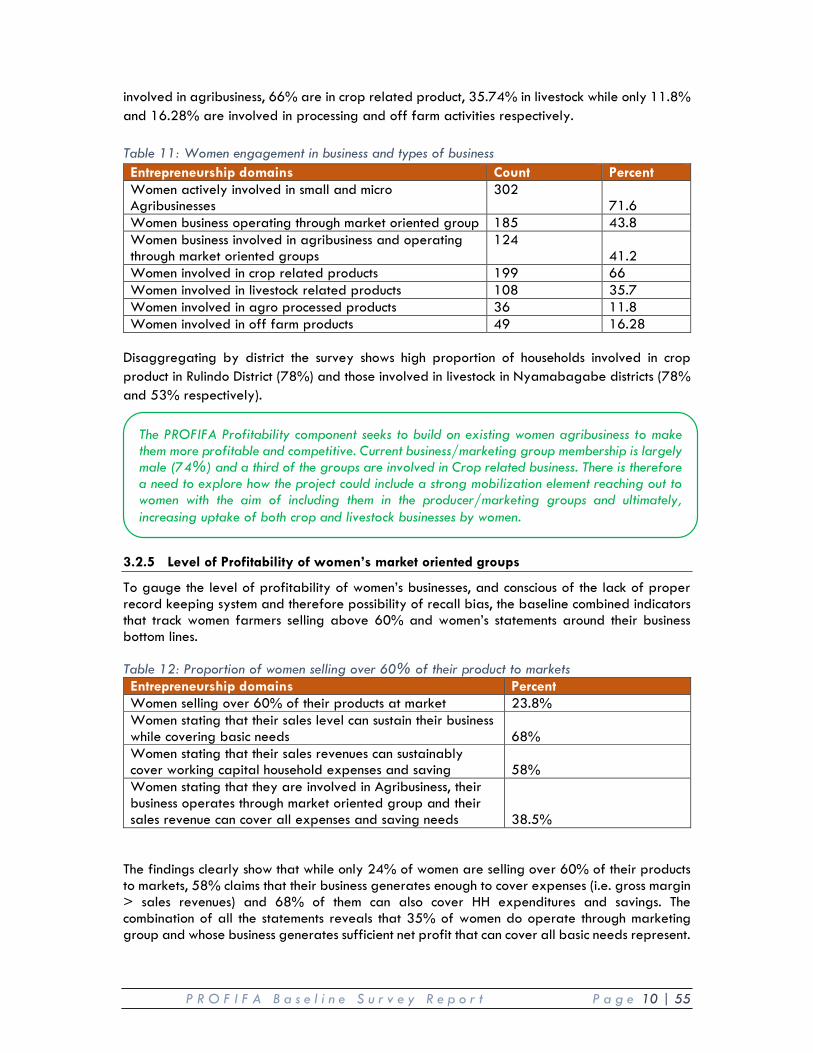
In addition to revealing that 89.7% of respondents are involved in agriculture. The findings shows that 71.6 of women are involved in business and among them only 41.2% operate their business through market oriented groups. The baseline further revealed that among 302 women
P R O F I F A B a s e l i n e S u r v e y R e p o r t P a g e 10 | 55
involved in agribusiness, 66% are in crop related product, 35.74% in livestock while only 11.8% and 16.28% are involved in processing and off farm activities respectively. Table 11: Women engagement in business and types of business Entrepreneurship domains Count Percent Women actively involved in small and micro Agribusinesses
302 71.6
Women business operating through market oriented group 185 43.8 Women business involved in agribusiness and operating through market oriented groups
124 41.2
Women involved in crop related products 199 66 Women involved in livestock related products 108 35.7 Women involved in agro processed products 36 11.8 Women involved in off farm products 49 16.28
Disaggregating by district the survey shows high proportion of households involved in crop product in Rulindo District (78%) and those involved in livestock in Nyamabagabe districts (78% and 53% respectively). 3.2.5 Level of Profitability of women’s market oriented groups
To gauge the level of profitability of women’s businesses, and conscious of the lack of proper record keeping system and therefore possibility of recall bias, the baseline combined indicators that track women farmers selling above 60% and women’s statements around their business bottom lines. Table 12: Proportion of women selling over 60% of their product to markets Entrepreneurship domains Percent Women selling over 60% of their products at market 23.8% Women stating that their sales level can sustain their business while covering basic needs 68% Women stating that their sales revenues can sustainably cover working capital household expenses and saving 58% Women stating that they are involved in Agribusiness, their business operates through market oriented group and their sales revenue can cover all expenses and saving needs 38.5%
The findings clearly show that while only 24% of women are selling over 60% of their products to markets, 58% claims that their business generates enough to cover expenses (i.e. gross margin > sales revenues) and 68% of them can also cover HH expenditures and savings. The combination of all the statements reveals that 35% of women do operate through marketing group and whose business generates sufficient net profit that can cover all basic needs represent.
The PROFIFA Profitability component seeks to build on existing women agribusiness to make them more profitable and competitive. Current business/marketing group membership is largely male (74%) and a third of the groups are involved in Crop related business. There is therefore a need to explore how the project could include a strong mobilization element reaching out to women with the aim of including them in the producer/marketing groups and ultimately, increasing uptake of both crop and livestock businesses by women.
P R O F I F A B a s e l i n e S u r v e y R e p o r t P a g e 11 | 55
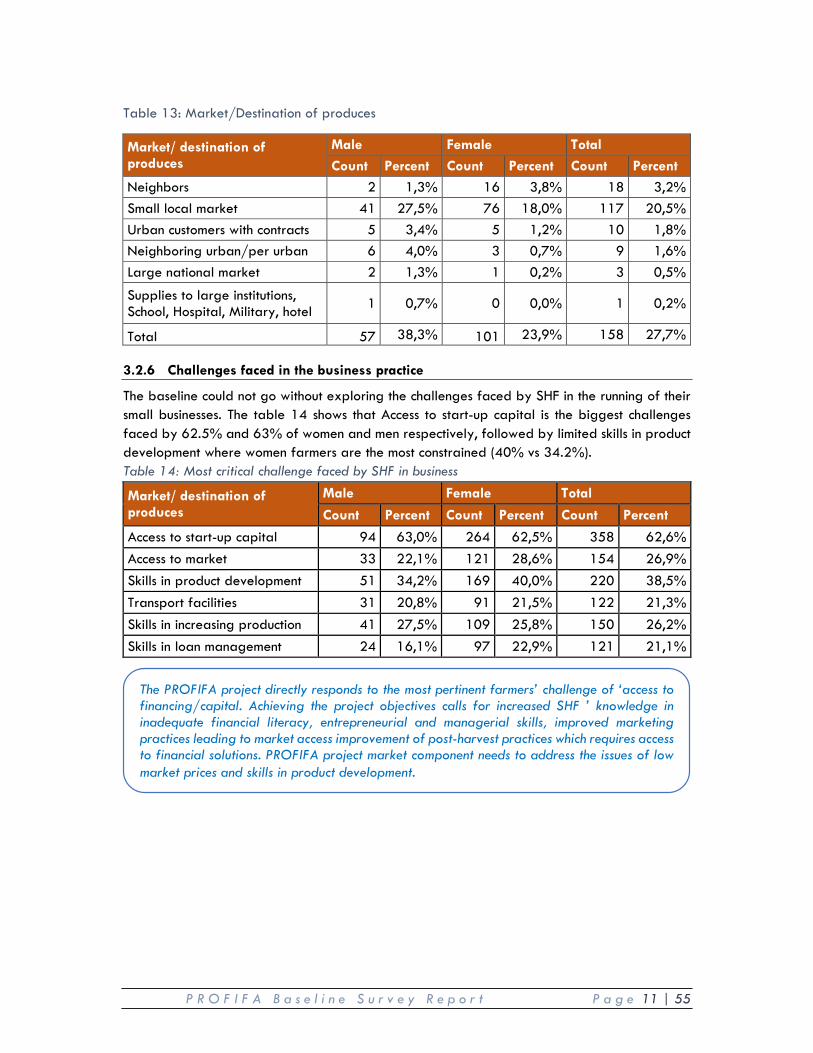
Table 13: Market/Destination of produces
Market/ destination of produces
Male Female Total Count Percent Count Percent Count Percent
Neighbors 2 1,3% 16 3,8% 18 3,2% Small local market 41 27,5% 76 18,0% 117 20,5% Urban customers with contracts 5 3,4% 5 1,2% 10 1,8% Neighboring urban/per urban 6 4,0% 3 0,7% 9 1,6% Large national market 2 1,3% 1 0,2% 3 0,5%
Supplies to large institutions, School, Hospital, Military, hotel 1 0,7% 0 0,0% 1 0,2%
Total 57 38,3% 101 23,9% 158 27,7% 3.2.6 Challenges faced in the business practice
The baseline could not go without exploring the challenges faced by SHF in the running of their small businesses. The table 14 shows that Access to start-up capital is the biggest challenges faced by 62.5% and 63% of women and men respectively, followed by limited skills in product development where women farmers are the most constrained (40% vs 34.2%). Table 14: Most critical challenge faced by SHF in business
Market/ destination of produces
Male Female Total
Count Percent Count Percent Count Percent
Access to start-up capital 94 63,0% 264 62,5% 358 62,6% Access to market 33 22,1% 121 28,6% 154 26,9% Skills in product development 51 34,2% 169 40,0% 220 38,5% Transport facilities 31 20,8% 91 21,5% 122 21,3% Skills in increasing production 41 27,5% 109 25,8% 150 26,2% Skills in loan management 24 16,1% 97 22,9% 121 21,1%
The PROFIFA project directly responds to the most pertinent farmers’ challenge of ‘access to financing/capital. Achieving the project objectives calls for increased SHF ’ knowledge in inadequate financial literacy, entrepreneurial and managerial skills, improved marketing practices leading to market access improvement of post-harvest practices which requires access to financial solutions. PROFIFA project market component needs to address the issues of low market prices and skills in product development.
P R O F I F A B a s e l i n e S u r v e y R e p o r t P a g e 12 | 55
3.3 Outcome 2. Improved access to and use of a wide range of affordable and appropriate financial Services
3.3.1 Farmers Accessing and Using Financial Services
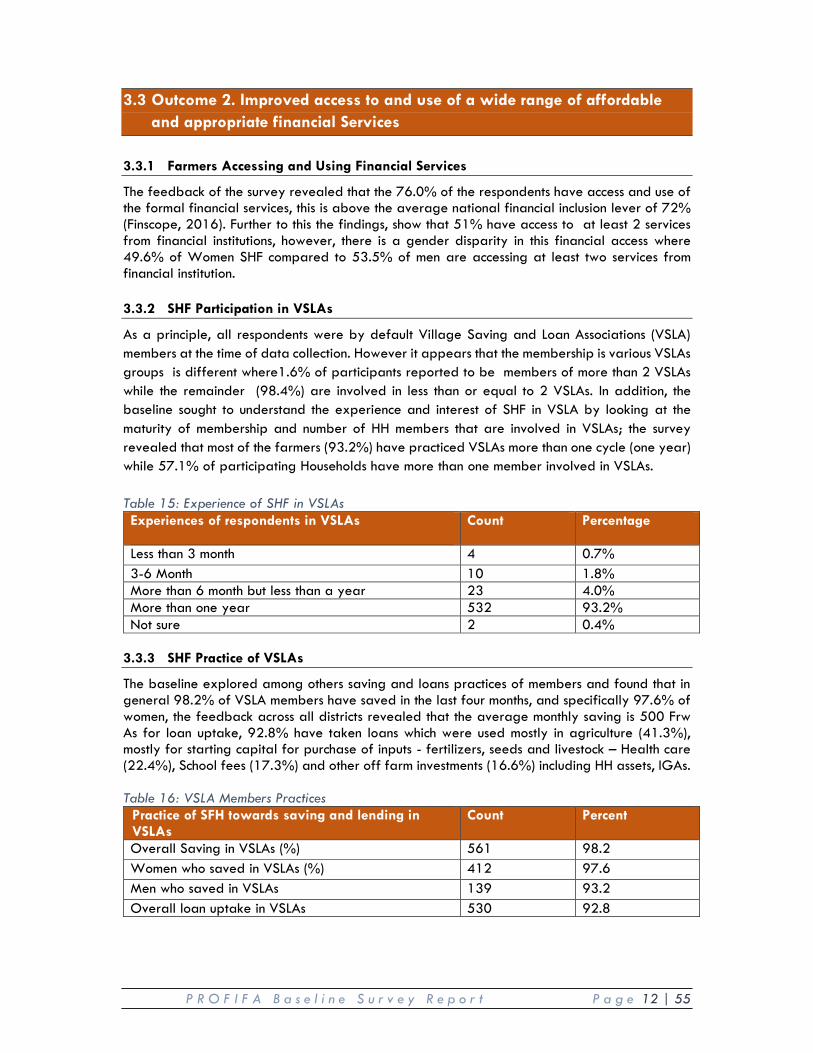
The feedback of the survey revealed that the 76.0% of the respondents have access and use of the formal financial services, this is above the average national financial inclusion lever of 72% (Finscope, 2016). Further to this the findings, show that 51% have access to at least 2 services from financial institutions, however, there is a gender disparity in this financial access where 49.6% of Women SHF compared to 53.5% of men are accessing at least two services from financial institution. 3.3.2 SHF Participation in VSLAs
As a principle, all respondents were by default Village Saving and Loan Associations (VSLA) members at the time of data collection. However it appears that the membership is various VSLAs groups is different where1.6% of participants reported to be members of more than 2 VSLAs while the remainder (98.4%) are involved in less than or equal to 2 VSLAs. In addition, the baseline sought to understand the experience and interest of SHF in VSLA by looking at the maturity of membership and number of HH members that are involved in VSLAs; the survey revealed that most of the farmers (93.2%) have practiced VSLAs more than one cycle (one year) while 57.1% of participating Households have more than one member involved in VSLAs. Table 15: Experience of SHF in VSLAs Experiences of respondents in VSLAs
Count Percentage
Less than 3 month 4 0.7% 3-6 Month 10 1.8% More than 6 month but less than a year 23 4.0% More than one year 532 93.2% Not sure 2 0.4%
3.3.3 SHF Practice of VSLAs
The baseline explored among others saving and loans practices of members and found that in general 98.2% of VSLA members have saved in the last four months, and specifically 97.6% of women, the feedback across all districts revealed that the average monthly saving is 500 Frw As for loan uptake, 92.8% have taken loans which were used mostly in agriculture (41.3%), mostly for starting capital for purchase of inputs - fertilizers, seeds and livestock – Health care (22.4%), School fees (17.3%) and other off farm investments (16.6%) including HH assets, IGAs. Table 16: VSLA Members Practices
Practice of SFH towards saving and lending in VSLAs
Count Percent
Overall Saving in VSLAs (%) 561 98.2 Women who saved in VSLAs (%) 412 97.6 Men who saved in VSLAs 139 93.2 Overall loan uptake in VSLAs 530 92.8
P R O F I F A B a s e l i n e S u r v e y R e p o r t P a g e 13 | 55
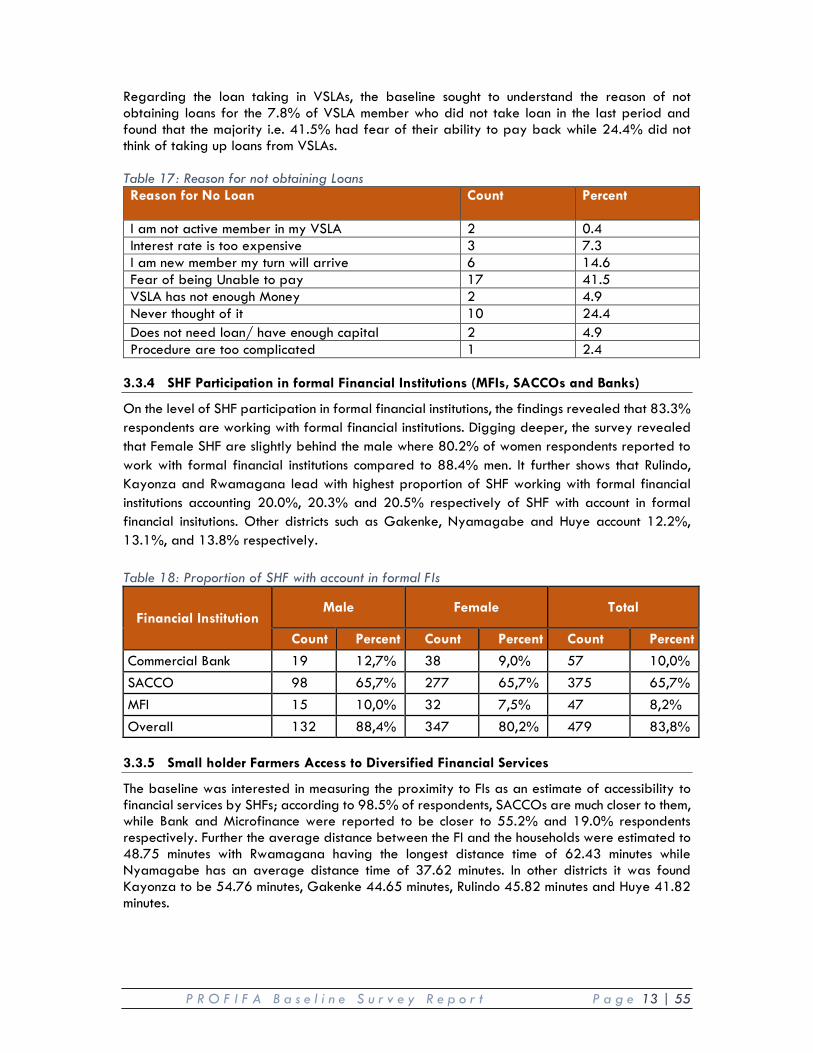
Regarding the loan taking in VSLAs, the baseline sought to understand the reason of not obtaining loans for the 7.8% of VSLA member who did not take loan in the last period and found that the majority i.e. 41.5% had fear of their ability to pay back while 24.4% did not think of taking up loans from VSLAs. Table 17: Reason for not obtaining Loans Reason for No Loan Count Percent
I am not active member in my VSLA 2 0.4 Interest rate is too expensive 3 7.3 I am new member my turn will arrive 6 14.6 Fear of being Unable to pay 17 41.5 VSLA has not enough Money 2 4.9 Never thought of it 10 24.4 Does not need loan/ have enough capital 2 4.9 Procedure are too complicated 1 2.4
3.3.4 SHF Participation in formal Financial Institutions (MFIs, SACCOs and Banks)
On the level of SHF participation in formal financial institutions, the findings revealed that 83.3% respondents are working with formal financial institutions. Digging deeper, the survey revealed that Female SHF are slightly behind the male where 80.2% of women respondents reported to work with formal financial institutions compared to 88.4% men. It further shows that Rulindo, Kayonza and Rwamagana lead with highest proportion of SHF working with formal financial institutions accounting 20.0%, 20.3% and 20.5% respectively of SHF with account in formal financial insitutions. Other districts such as Gakenke, Nyamagabe and Huye account 12.2%, 13.1%, and 13.8% respectively. Table 18: Proportion of SHF with account in formal FIs
Financial Institution Male Female Total
Count Percent Count Percent Count Percent
Commercial Bank 19 12,7% 38 9,0% 57 10,0% SACCO 98 65,7% 277 65,7% 375 65,7% MFI 15 10,0% 32 7,5% 47 8,2% Overall 132 88,4% 347 80,2% 479 83,8%
3.3.5 Small holder Farmers Access to Diversified Financial Services
The baseline was interested in measuring the proximity to FIs as an estimate of accessibility to financial services by SHFs; according to 98.5% of respondents, SACCOs are much closer to them, while Bank and Microfinance were reported to be closer to 55.2% and 19.0% respondents respectively. Further the average distance between the FI and the households were estimated to 48.75 minutes with Rwamagana having the longest distance time of 62.43 minutes while Nyamagabe has an average distance time of 37.62 minutes. In other districts it was found Kayonza to be 54.76 minutes, Gakenke 44.65 minutes, Rulindo 45.82 minutes and Huye 41.82 minutes.
P R O F I F A B a s e l i n e S u r v e y R e p o r t P a g e 14 | 55
It appears that most of the SHFs who are currently working with financial institutions are saving with Umurenge SACCO (98.5%). Microfinance institutions are used by 5.7% of the SHF in the PROFIFA Project Districts while Insurance Service Providers are used by a minority of 1% of SFH. However, FGDs have shown that insurance companies and commercial banks Commercial Banks could be important institutions in supporting farmers to afford credit requirements (credit insurance) and fair rates (Banks) especially for capital expenditure needs. 3.3.6 Smallholder Farmers Saving Behaviour
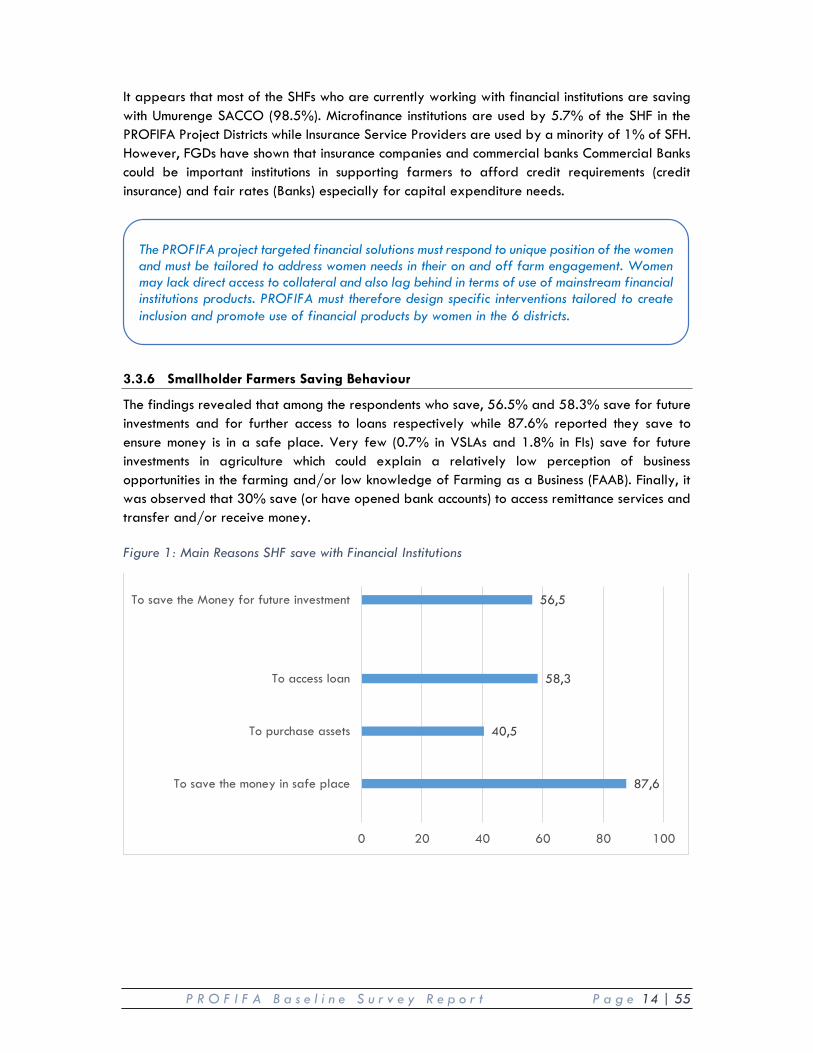
The findings revealed that among the respondents who save, 56.5% and 58.3% save for future investments and for further access to loans respectively while 87.6% reported they save to ensure money is in a safe place. Very few (0.7% in VSLAs and 1.8% in FIs) save for future investments in agriculture which could explain a relatively low perception of business opportunities in the farming and/or low knowledge of Farming as a Business (FAAB). Finally, it was observed that 30% save (or have opened bank accounts) to access remittance services and transfer and/or receive money. Figure 1: Main Reasons SHF save with Financial Institutions
87,6
40,5
58,3
56,5
0 20 40 60 80 100
To save the money in safe place
To purchase assets
To access loan
To save the Money for future investment
The PROFIFA project targeted financial solutions must respond to unique position of the women and must be tailored to address women needs in their on and off farm engagement. Women may lack direct access to collateral and also lag behind in terms of use of mainstream financial institutions products. PROFIFA must therefore design specific interventions tailored to create inclusion and promote use of financial products by women in the 6 districts.
P R O F I F A B a s e l i n e S u r v e y R e p o r t P a g e 15 | 55
The baseline further assessed the reasons of not using the formal financial institutions services to the respondents who reported to not use them, the feedback revealed that 74.5% do not use them because they claimed they have not enough money for FI, 29.6% perceive financial institutions as for the rich people, 20.8% consider the FIs to have a lot of procedures while 16.2% reported to not have enough information on financial services. The baseline has confirmed the Finscope findings that long distance and lack of financial services in proximity (6.2% both) are minimal barriers to financial inclusion. The general belief that FI are for the wealthier and that VSLA members cannot afford their service due to their relatively low level of income/savings is an attitude that has to be dealt with on the demand side. On the same note, KII with FIs revealed that FI have some barriers that limit farmers from saving with them such as i) farmers are dispersed and live in remote areas especially for MFIs incurring transaction costs, ii) lack of transaction history, iii) perception of non-repayment due to agriculture specific risks (product, price and markets) and iv) low knowledge of working with smallholder farmers. 3.3.7 Financial Services used by Smallholder Farmers
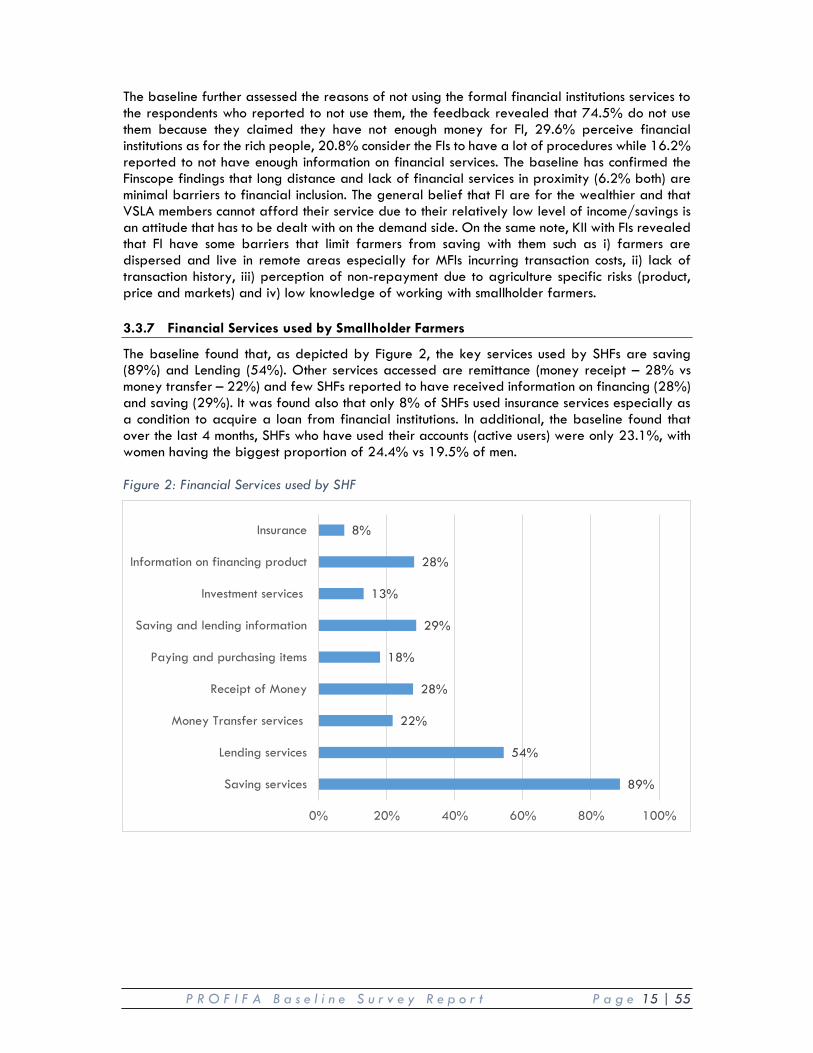
The baseline found that, as depicted by Figure 2, the key services used by SHFs are saving (89%) and Lending (54%). Other services accessed are remittance (money receipt – 28% vs money transfer – 22%) and few SHFs reported to have received information on financing (28%) and saving (29%). It was found also that only 8% of SHFs used insurance services especially as a condition to acquire a loan from financial institutions. In additional, the baseline found that over the last 4 months, SHFs who have used their accounts (active users) were only 23.1%, with women having the biggest proportion of 24.4% vs 19.5% of men. Figure 2: Financial Services used by SHF
89%
54%
22%
28%
18%
29%
13%
28%
8%
0% 20% 40% 60% 80% 100%
Saving services
Lending services
Money Transfer services
Receipt of Money
Paying and purchasing items
Saving and lending information
Investment services
Information on financing product
Insurance
P R O F I F A B a s e l i n e S u r v e y R e p o r t P a g e 16 | 55
3.3.8 Smallholder Farmers Access to Credit
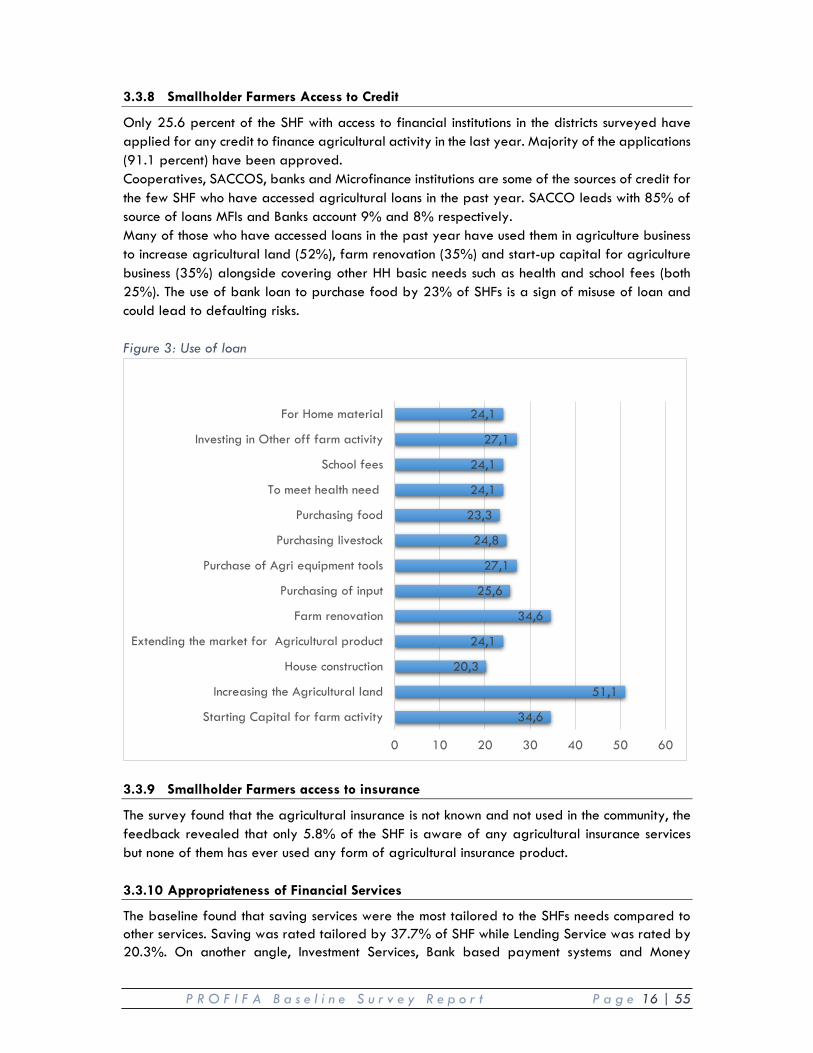
Only 25.6 percent of the SHF with access to financial institutions in the districts surveyed have applied for any credit to finance agricultural activity in the last year. Majority of the applications (91.1 percent) have been approved. Cooperatives, SACCOS, banks and Microfinance institutions are some of the sources of credit for the few SHF who have accessed agricultural loans in the past year. SACCO leads with 85% of source of loans MFIs and Banks account 9% and 8% respectively. Many of those who have accessed loans in the past year have used them in agriculture business to increase agricultural land (52%), farm renovation (35%) and start-up capital for agriculture business (35%) alongside covering other HH basic needs such as health and school fees (both 25%). The use of bank loan to purchase food by 23% of SHFs is a sign of misuse of loan and could lead to defaulting risks. Figure 3: Use of loan
3.3.9 Smallholder Farmers access to insurance
The survey found that the agricultural insurance is not known and not used in the community, the feedback revealed that only 5.8% of the SHF is aware of any agricultural insurance services but none of them has ever used any form of agricultural insurance product. 3.3.10 Appropriateness of Financial Services
The baseline found that saving services were the most tailored to the SHFs needs compared to other services. Saving was rated tailored by 37.7% of SHF while Lending Service was rated by 20.3%. On another angle, Investment Services, Bank based payment systems and Money
34,6
51,1
20,3
24,1
34,6
25,6
27,1
24,8
23,3
24,1
24,1
27,1
24,1
0 10 20 30 40 50 60
Starting Capital for farm activity
Increasing the Agricultural land
House construction
Extending the market for Agricultural product
Farm renovation
Purchasing of input
Purchase of Agri equipment tools
Purchasing livestock
Purchasing food
To meet health need
School fees
Investing in Other off farm activity
For Home material
P R O F I F A B a s e l i n e S u r v e y R e p o r t P a g e 17 | 55
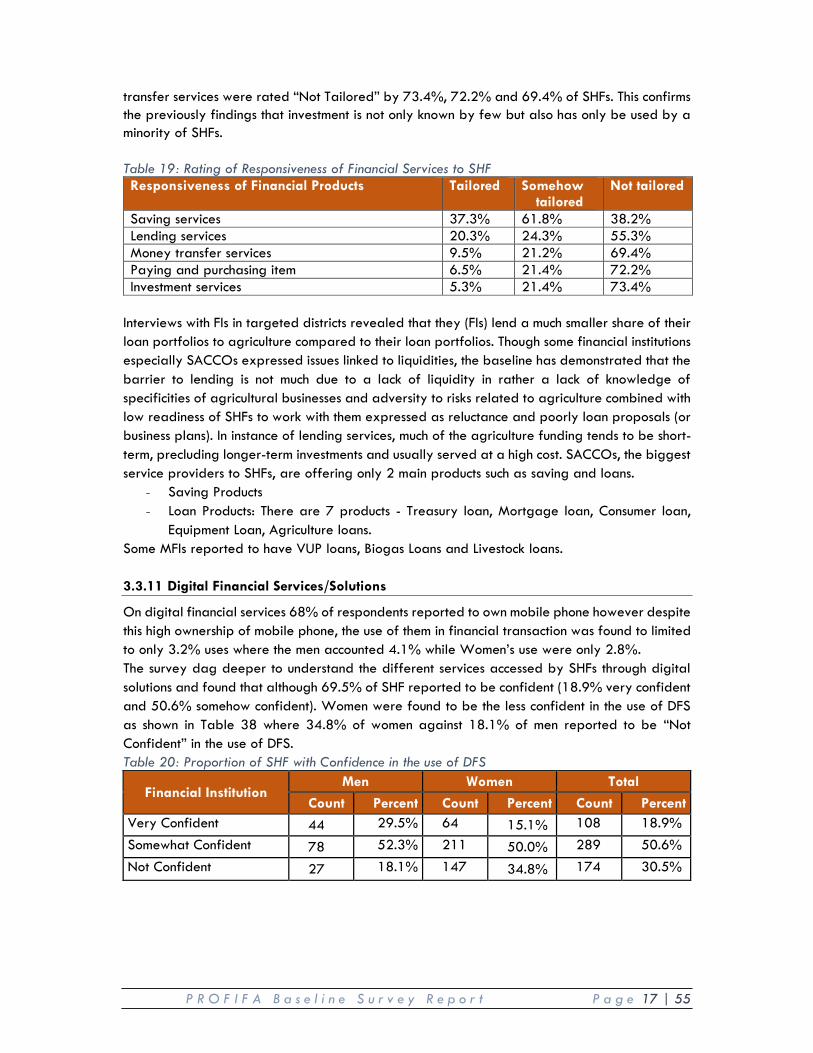
transfer services were rated “Not Tailored” by 73.4%, 72.2% and 69.4% of SHFs. This confirms the previously findings that investment is not only known by few but also has only be used by a minority of SHFs. Table 19: Rating of Responsiveness of Financial Services to SHF Responsiveness of Financial Products Tailored Somehow
tailored Not tailored
Saving services 37.3% 61.8% 38.2% Lending services 20.3% 24.3% 55.3% Money transfer services 9.5% 21.2% 69.4% Paying and purchasing item 6.5% 21.4% 72.2% Investment services 5.3% 21.4% 73.4%
Interviews with FIs in targeted districts revealed that they (FIs) lend a much smaller share of their loan portfolios to agriculture compared to their loan portfolios. Though some financial institutions especially SACCOs expressed issues linked to liquidities, the baseline has demonstrated that the barrier to lending is not much due to a lack of liquidity in rather a lack of knowledge of specificities of agricultural businesses and adversity to risks related to agriculture combined with low readiness of SHFs to work with them expressed as reluctance and poorly loan proposals (or business plans). In instance of lending services, much of the agriculture funding tends to be short-term, precluding longer-term investments and usually served at a high cost. SACCOs, the biggest service providers to SHFs, are offering only 2 main products such as saving and loans.
- Saving Products - Loan Products: There are 7 products - Treasury loan, Mortgage loan, Consumer loan,
Equipment Loan, Agriculture loans. Some MFIs reported to have VUP loans, Biogas Loans and Livestock loans. 3.3.11 Digital Financial Services/Solutions
On digital financial services 68% of respondents reported to own mobile phone however despite this high ownership of mobile phone, the use of them in financial transaction was found to limited to only 3.2% uses where the men accounted 4.1% while Women’s use were only 2.8%. The survey dag deeper to understand the different services accessed by SHFs through digital solutions and found that although 69.5% of SHF reported to be confident (18.9% very confident and 50.6% somehow confident). Women were found to be the less confident in the use of DFS as shown in Table 38 where 34.8% of women against 18.1% of men reported to be “Not Confident” in the use of DFS. Table 20: Proportion of SHF with Confidence in the use of DFS
Financial Institution Men Women Total
Count Percent Count Percent Count Percent Very Confident 44 29.5% 64 15.1% 108 18.9% Somewhat Confident 78 52.3% 211 50.0% 289 50.6% Not Confident 27 18.1% 147 34.8% 174 30.5%
P R O F I F A B a s e l i n e S u r v e y R e p o r t P a g e 18 | 55
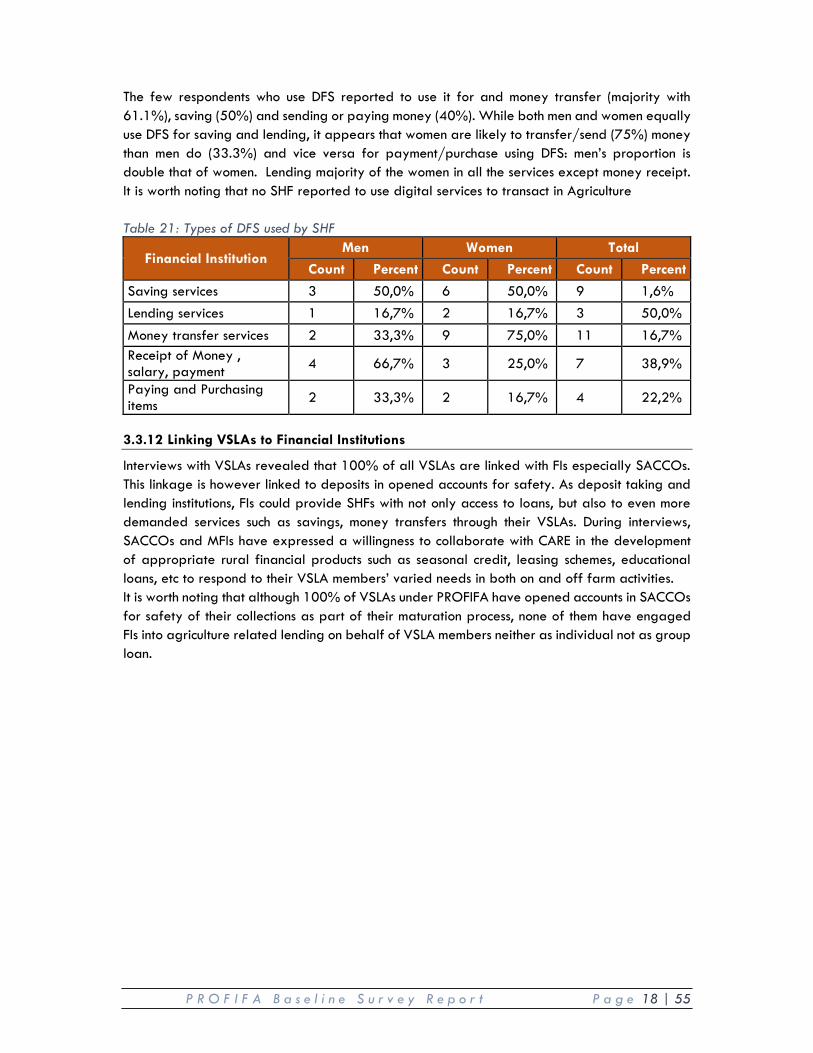
The few respondents who use DFS reported to use it for and money transfer (majority with 61.1%), saving (50%) and sending or paying money (40%). While both men and women equally use DFS for saving and lending, it appears that women are likely to transfer/send (75%) money than men do (33.3%) and vice versa for payment/purchase using DFS: men’s proportion is double that of women. Lending majority of the women in all the services except money receipt. It is worth noting that no SHF reported to use digital services to transact in Agriculture Table 21: Types of DFS used by SHF
Financial Institution Men Women Total
Count Percent Count Percent Count Percent
Saving services 3 50,0% 6 50,0% 9 1,6% Lending services 1 16,7% 2 16,7% 3 50,0% Money transfer services 2 33,3% 9 75,0% 11 16,7% Receipt of Money , salary, payment 4 66,7% 3 25,0% 7 38,9%
Paying and Purchasing items 2 33,3% 2 16,7% 4 22,2%
3.3.12 Linking VSLAs to Financial Institutions
Interviews with VSLAs revealed that 100% of all VSLAs are linked with FIs especially SACCOs. This linkage is however linked to deposits in opened accounts for safety. As deposit taking and lending institutions, FIs could provide SHFs with not only access to loans, but also to even more demanded services such as savings, money transfers through their VSLAs. During interviews, SACCOs and MFIs have expressed a willingness to collaborate with CARE in the development of appropriate rural financial products such as seasonal credit, leasing schemes, educational loans, etc to respond to their VSLA members’ varied needs in both on and off farm activities. It is worth noting that although 100% of VSLAs under PROFIFA have opened accounts in SACCOs for safety of their collections as part of their maturation process, none of them have engaged FIs into agriculture related lending on behalf of VSLA members neither as individual not as group loan.
P R O F I F A B a s e l i n e S u r v e y R e p o r t P a g e 19 | 55
3.4 Outcome 3. Increased agriculture and small livestock production, value addition and access to markets
To establish benchmark for agriculture/livestock levels of production, value addition and sales, the baseline explored the production, post-harvest, processing and marketing practices of SHFs and established their links to revenues levels. 3.4.1 Type of Farming practiced by smallholder farmers
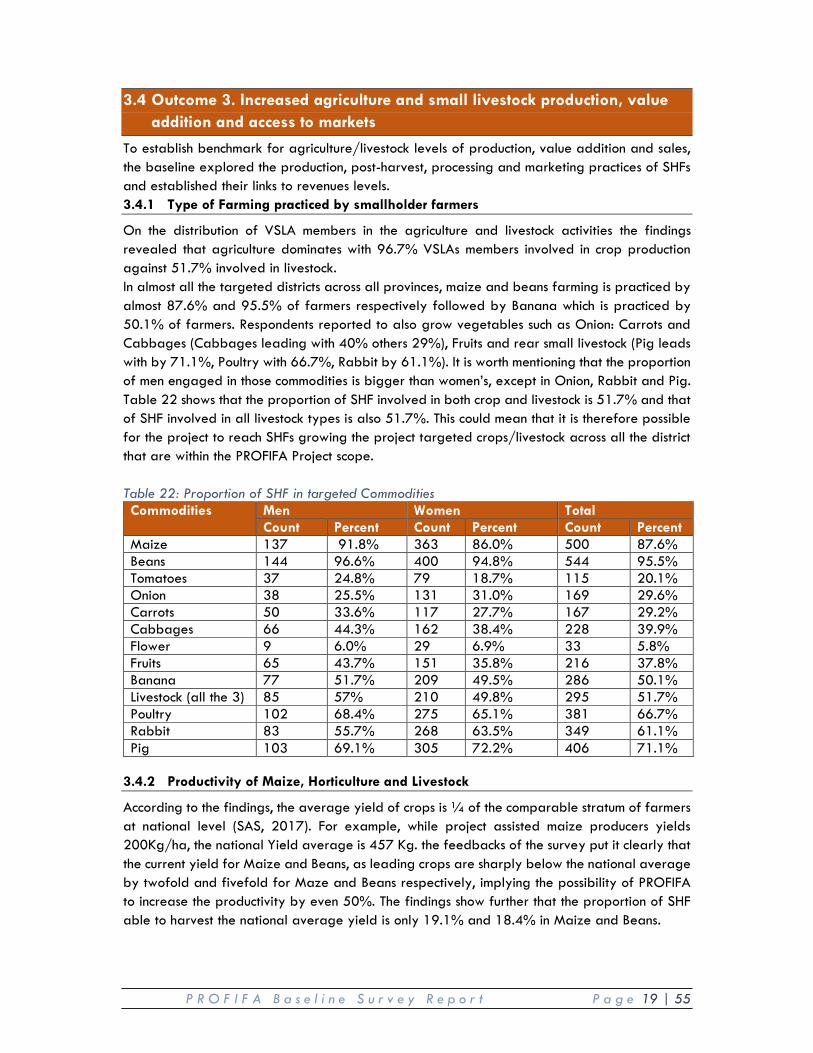
On the distribution of VSLA members in the agriculture and livestock activities the findings revealed that agriculture dominates with 96.7% VSLAs members involved in crop production against 51.7% involved in livestock. In almost all the targeted districts across all provinces, maize and beans farming is practiced by almost 87.6% and 95.5% of farmers respectively followed by Banana which is practiced by 50.1% of farmers. Respondents reported to also grow vegetables such as Onion: Carrots and Cabbages (Cabbages leading with 40% others 29%), Fruits and rear small livestock (Pig leads with by 71.1%, Poultry with 66.7%, Rabbit by 61.1%). It is worth mentioning that the proportion of men engaged in those commodities is bigger than women’s, except in Onion, Rabbit and Pig. Table 22 shows that the proportion of SHF involved in both crop and livestock is 51.7% and that of SHF involved in all livestock types is also 51.7%. This could mean that it is therefore possible for the project to reach SHFs growing the project targeted crops/livestock across all the district that are within the PROFIFA Project scope. Table 22: Proportion of SHF in targeted Commodities Commodities
Men Women Total Count Percent Count Percent Count Percent
Maize 137 91.8% 363 86.0% 500 87.6% Beans 144 96.6% 400 94.8% 544 95.5% Tomatoes 37 24.8% 79 18.7% 115 20.1% Onion 38 25.5% 131 31.0% 169 29.6% Carrots 50 33.6% 117 27.7% 167 29.2% Cabbages 66 44.3% 162 38.4% 228 39.9% Flower 9 6.0% 29 6.9% 33 5.8% Fruits 65 43.7% 151 35.8% 216 37.8% Banana 77 51.7% 209 49.5% 286 50.1% Livestock (all the 3) 85 57% 210 49.8% 295 51.7% Poultry 102 68.4% 275 65.1% 381 66.7% Rabbit 83 55.7% 268 63.5% 349 61.1% Pig 103 69.1% 305 72.2% 406 71.1%
3.4.2 Productivity of Maize, Horticulture and Livestock
According to the findings, the average yield of crops is ¼ of the comparable stratum of farmers at national level (SAS, 2017). For example, while project assisted maize producers yields 200Kg/ha, the national Yield average is 457 Kg. the feedbacks of the survey put it clearly that the current yield for Maize and Beans, as leading crops are sharply below the national average by twofold and fivefold for Maze and Beans respectively, implying the possibility of PROFIFA to increase the productivity by even 50%. The findings show further that the proportion of SHF able to harvest the national average yield is only 19.1% and 18.4% in Maize and Beans.
P R O F I F A B a s e l i n e S u r v e y R e p o r t P a g e 20 | 55
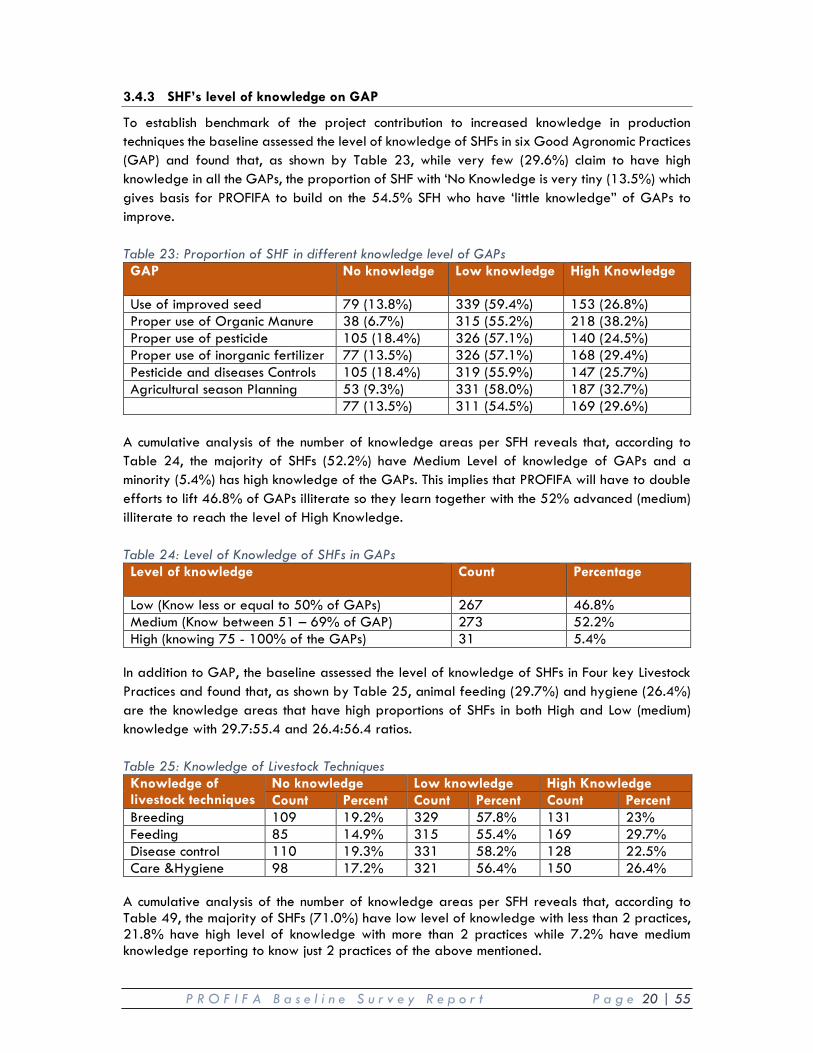
3.4.3 SHF’s level of knowledge on GAP
To establish benchmark of the project contribution to increased knowledge in production techniques the baseline assessed the level of knowledge of SHFs in six Good Agronomic Practices (GAP) and found that, as shown by Table 23, while very few (29.6%) claim to have high knowledge in all the GAPs, the proportion of SHF with ‘No Knowledge is very tiny (13.5%) which gives basis for PROFIFA to build on the 54.5% SFH who have ‘little knowledge” of GAPs to improve. Table 23: Proportion of SHF in different knowledge level of GAPs GAP
No knowledge Low knowledge High Knowledge
Use of improved seed 79 (13.8%) 339 (59.4%) 153 (26.8%) Proper use of Organic Manure 38 (6.7%) 315 (55.2%) 218 (38.2%) Proper use of pesticide 105 (18.4%) 326 (57.1%) 140 (24.5%) Proper use of inorganic fertilizer 77 (13.5%) 326 (57.1%) 168 (29.4%) Pesticide and diseases Controls 105 (18.4%) 319 (55.9%) 147 (25.7%) Agricultural season Planning 53 (9.3%) 331 (58.0%) 187 (32.7%) 77 (13.5%) 311 (54.5%) 169 (29.6%)
A cumulative analysis of the number of knowledge areas per SFH reveals that, according to Table 24, the majority of SHFs (52.2%) have Medium Level of knowledge of GAPs and a minority (5.4%) has high knowledge of the GAPs. This implies that PROFIFA will have to double efforts to lift 46.8% of GAPs illiterate so they learn together with the 52% advanced (medium) illiterate to reach the level of High Knowledge. Table 24: Level of Knowledge of SHFs in GAPs Level of knowledge
Count Percentage
Low (Know less or equal to 50% of GAPs) 267 46.8% Medium (Know between 51 – 69% of GAP) 273 52.2% High (knowing 75 - 100% of the GAPs) 31 5.4%
In addition to GAP, the baseline assessed the level of knowledge of SHFs in Four key Livestock Practices and found that, as shown by Table 25, animal feeding (29.7%) and hygiene (26.4%) are the knowledge areas that have high proportions of SHFs in both High and Low (medium) knowledge with 29.7:55.4 and 26.4:56.4 ratios. Table 25: Knowledge of Livestock Techniques Knowledge of livestock techniques
No knowledge Low knowledge High Knowledge Count Percent Count Percent Count Percent
Breeding 109 19.2% 329 57.8% 131 23% Feeding 85 14.9% 315 55.4% 169 29.7% Disease control 110 19.3% 331 58.2% 128 22.5% Care &Hygiene 98 17.2% 321 56.4% 150 26.4%
A cumulative analysis of the number of knowledge areas per SFH reveals that, according to Table 49, the majority of SHFs (71.0%) have low level of knowledge with less than 2 practices, 21.8% have high level of knowledge with more than 2 practices while 7.2% have medium knowledge reporting to know just 2 practices of the above mentioned.
P R O F I F A B a s e l i n e S u r v e y R e p o r t P a g e 21 | 55
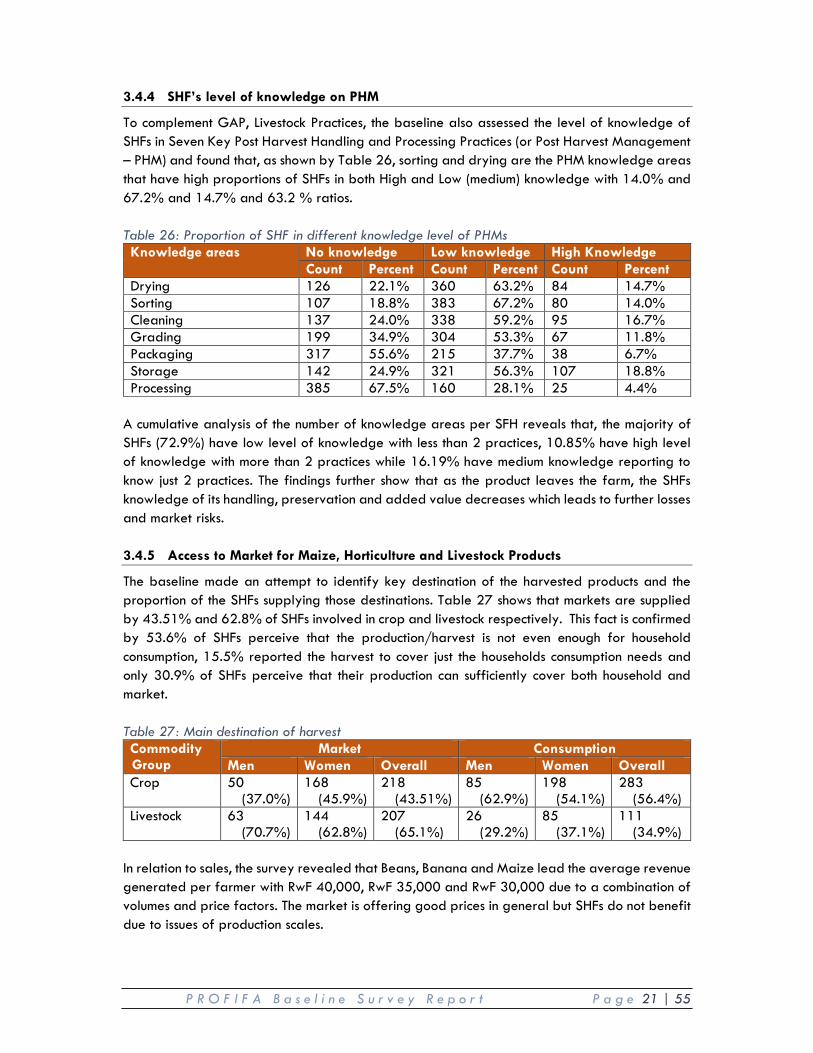
3.4.4 SHF’s level of knowledge on PHM
To complement GAP, Livestock Practices, the baseline also assessed the level of knowledge of SHFs in Seven Key Post Harvest Handling and Processing Practices (or Post Harvest Management – PHM) and found that, as shown by Table 26, sorting and drying are the PHM knowledge areas that have high proportions of SHFs in both High and Low (medium) knowledge with 14.0% and 67.2% and 14.7% and 63.2 % ratios. Table 26: Proportion of SHF in different knowledge level of PHMs Knowledge areas No knowledge Low knowledge High Knowledge
Count Percent Count Percent Count Percent Drying 126 22.1% 360 63.2% 84 14.7% Sorting 107 18.8% 383 67.2% 80 14.0% Cleaning 137 24.0% 338 59.2% 95 16.7% Grading 199 34.9% 304 53.3% 67 11.8% Packaging 317 55.6% 215 37.7% 38 6.7% Storage 142 24.9% 321 56.3% 107 18.8% Processing 385 67.5% 160 28.1% 25 4.4%
A cumulative analysis of the number of knowledge areas per SFH reveals that, the majority of SHFs (72.9%) have low level of knowledge with less than 2 practices, 10.85% have high level of knowledge with more than 2 practices while 16.19% have medium knowledge reporting to know just 2 practices. The findings further show that as the product leaves the farm, the SHFs knowledge of its handling, preservation and added value decreases which leads to further losses and market risks. 3.4.5 Access to Market for Maize, Horticulture and Livestock Products
The baseline made an attempt to identify key destination of the harvested products and the proportion of the SHFs supplying those destinations. Table 27 shows that markets are supplied by 43.51% and 62.8% of SHFs involved in crop and livestock respectively. This fact is confirmed by 53.6% of SHFs perceive that the production/harvest is not even enough for household consumption, 15.5% reported the harvest to cover just the households consumption needs and only 30.9% of SHFs perceive that their production can sufficiently cover both household and market. Table 27: Main destination of harvest Commodity Group
Market Consumption Men Women Overall Men Women Overall
Crop 50 (37.0%)
168 (45.9%)
218 (43.51%)
85 (62.9%)
198 (54.1%)
283 (56.4%)
Livestock 63 (70.7%)
144 (62.8%)
207 (65.1%)
26 (29.2%)
85 (37.1%)
111 (34.9%)
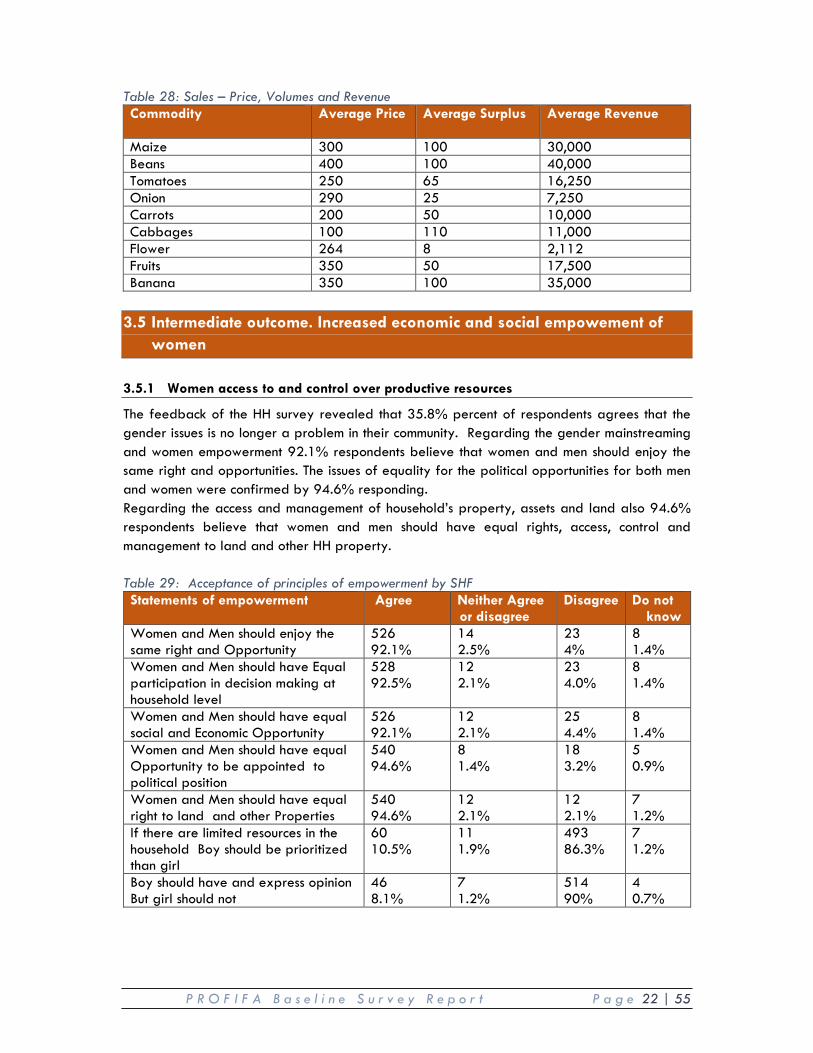
In relation to sales, the survey revealed that Beans, Banana and Maize lead the average revenue generated per farmer with RwF 40,000, RwF 35,000 and RwF 30,000 due to a combination of volumes and price factors. The market is offering good prices in general but SHFs do not benefit due to issues of production scales.
P R O F I F A B a s e l i n e S u r v e y R e p o r t P a g e 22 | 55
Table 28: Sales – Price, Volumes and Revenue Commodity Average Price Average Surplus Average Revenue
Maize 300 100 30,000 Beans 400 100 40,000 Tomatoes 250 65 16,250 Onion 290 25 7,250 Carrots 200 50 10,000 Cabbages 100 110 11,000 Flower 264 8 2,112 Fruits 350 50 17,500 Banana 350 100 35,000
3.5 Intermediate outcome. Increased economic and social empowement of women
3.5.1 Women access to and control over productive resources
The feedback of the HH survey revealed that 35.8% percent of respondents agrees that the gender issues is no longer a problem in their community. Regarding the gender mainstreaming and women empowerment 92.1% respondents believe that women and men should enjoy the same right and opportunities. The issues of equality for the political opportunities for both men and women were confirmed by 94.6% responding. Regarding the access and management of household’s property, assets and land also 94.6% respondents believe that women and men should have equal rights, access, control and management to land and other HH property. Table 29: Acceptance of principles of empowerment by SHF Statements of empowerment Agree Neither Agree
or disagree Disagree Do not
know Women and Men should enjoy the same right and Opportunity
526 92.1%
14 2.5%
23 4%
8 1.4%
Women and Men should have Equal participation in decision making at household level
528 92.5%
12 2.1%
23 4.0%
8 1.4%
Women and Men should have equal social and Economic Opportunity
526 92.1%
12 2.1%
25 4.4%
8 1.4%
Women and Men should have equal Opportunity to be appointed to political position
540 94.6%
8 1.4%
18 3.2%
5 0.9%
Women and Men should have equal right to land and other Properties
540 94.6%
12 2.1%
12 2.1%
7 1.2%
If there are limited resources in the household Boy should be prioritized than girl
60 10.5%
11 1.9%
493 86.3%
7 1.2%
Boy should have and express opinion But girl should not
46 8.1%
7 1.2%
514 90%
4 0.7%
P R O F I F A B a s e l i n e S u r v e y R e p o r t P a g e 23 | 55
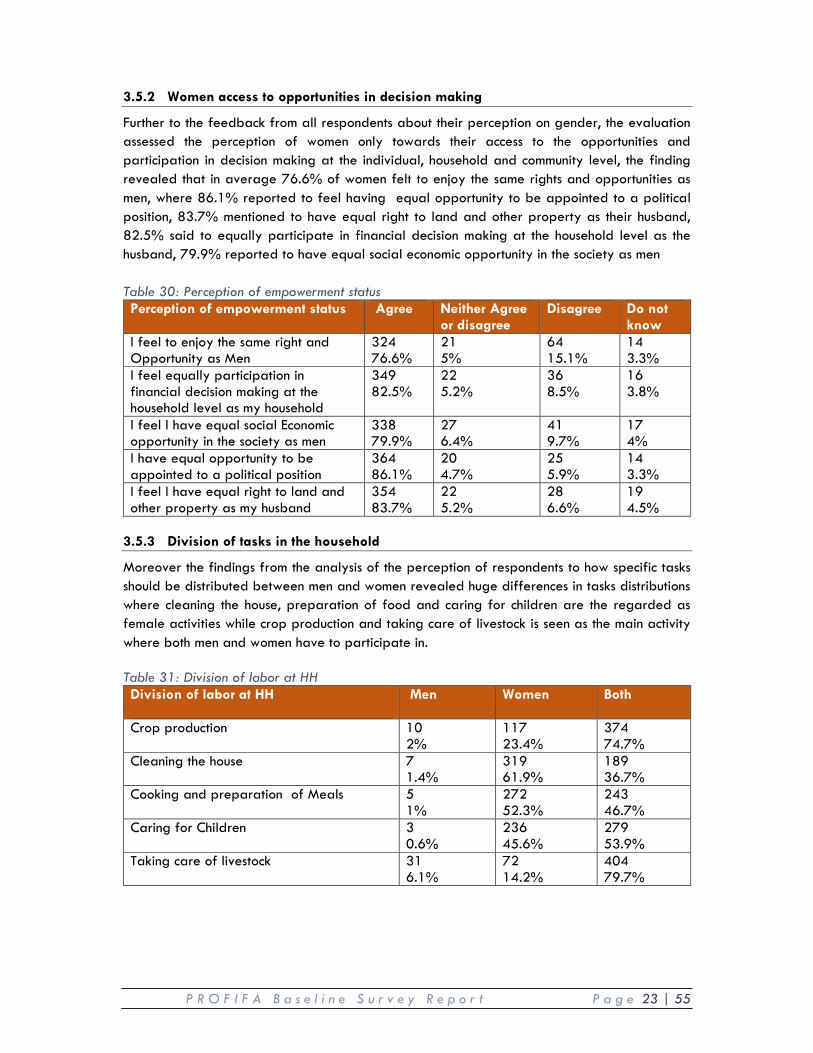
3.5.2 Women access to opportunities in decision making
Further to the feedback from all respondents about their perception on gender, the evaluation assessed the perception of women only towards their access to the opportunities and participation in decision making at the individual, household and community level, the finding revealed that in average 76.6% of women felt to enjoy the same rights and opportunities as men, where 86.1% reported to feel having equal opportunity to be appointed to a political position, 83.7% mentioned to have equal right to land and other property as their husband, 82.5% said to equally participate in financial decision making at the household level as the husband, 79.9% reported to have equal social economic opportunity in the society as men Table 30: Perception of empowerment status Perception of empowerment status Agree Neither Agree
or disagree Disagree Do not
know I feel to enjoy the same right and Opportunity as Men
324 76.6%
21 5%
64 15.1%
14 3.3%
I feel equally participation in financial decision making at the household level as my household
349 82.5%
22 5.2%
36 8.5%
16 3.8%
I feel I have equal social Economic opportunity in the society as men
338 79.9%
27 6.4%
41 9.7%
17 4%
I have equal opportunity to be appointed to a political position
364 86.1%
20 4.7%
25 5.9%
14 3.3%
I feel I have equal right to land and other property as my husband
354 83.7%
22 5.2%
28 6.6%
19 4.5%
3.5.3 Division of tasks in the household
Moreover the findings from the analysis of the perception of respondents to how specific tasks should be distributed between men and women revealed huge differences in tasks distributions where cleaning the house, preparation of food and caring for children are the regarded as female activities while crop production and taking care of livestock is seen as the main activity where both men and women have to participate in. Table 31: Division of labor at HH Division of labor at HH
Men Women Both
Crop production 10 2%
117 23.4%
374 74.7%
Cleaning the house 7 1.4%
319 61.9%
189 36.7%
Cooking and preparation of Meals 5 1%
272 52.3%
243 46.7%
Caring for Children 3 0.6%
236 45.6%
279 53.9%
Taking care of livestock 31 6.1%
72 14.2%
404 79.7%
P R O F I F A B a s e l i n e S u r v e y R e p o r t P a g e 24 | 55
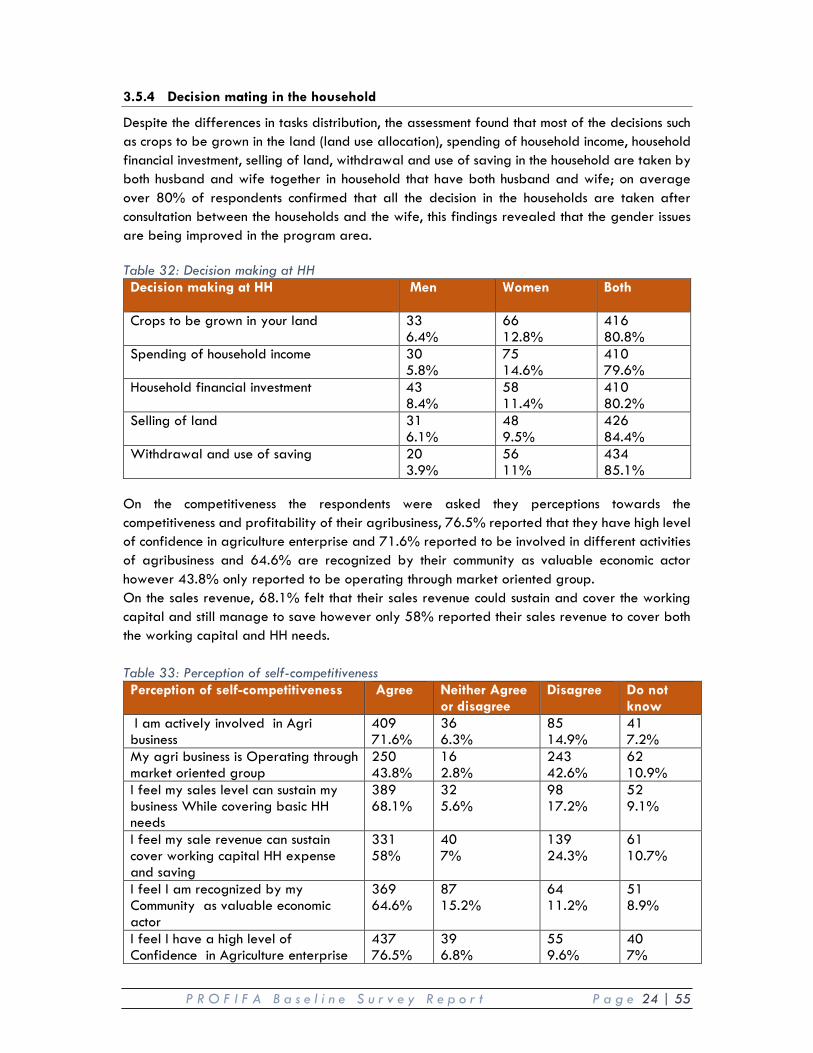
3.5.4 Decision mating in the household
Despite the differences in tasks distribution, the assessment found that most of the decisions such as crops to be grown in the land (land use allocation), spending of household income, household financial investment, selling of land, withdrawal and use of saving in the household are taken by both husband and wife together in household that have both husband and wife; on average over 80% of respondents confirmed that all the decision in the households are taken after consultation between the households and the wife, this findings revealed that the gender issues are being improved in the program area. Table 32: Decision making at HH Decision making at HH
Men Women Both
Crops to be grown in your land 33 6.4%
66 12.8%
416 80.8%
Spending of household income 30 5.8%
75 14.6%
410 79.6%
Household financial investment 43 8.4%
58 11.4%
410 80.2%
Selling of land 31 6.1%
48 9.5%
426 84.4%
Withdrawal and use of saving 20 3.9%
56 11%
434 85.1%
On the competitiveness the respondents were asked they perceptions towards the competitiveness and profitability of their agribusiness, 76.5% reported that they have high level of confidence in agriculture enterprise and 71.6% reported to be involved in different activities of agribusiness and 64.6% are recognized by their community as valuable economic actor however 43.8% only reported to be operating through market oriented group. On the sales revenue, 68.1% felt that their sales revenue could sustain and cover the working capital and still manage to save however only 58% reported their sales revenue to cover both the working capital and HH needs. Table 33: Perception of self-competitiveness Perception of self-competitiveness Agree Neither Agree
or disagree Disagree Do not
know I am actively involved in Agri business
409 71.6%
36 6.3%
85 14.9%
41 7.2%
My agri business is Operating through market oriented group
250 43.8%
16 2.8%
243 42.6%
62 10.9%
I feel my sales level can sustain my business While covering basic HH needs
389 68.1%
32 5.6%
98 17.2%
52 9.1%
I feel my sale revenue can sustain cover working capital HH expense and saving
331 58%
40 7%
139 24.3%
61 10.7%
I feel I am recognized by my Community as valuable economic actor
369 64.6%
87 15.2%
64 11.2%
51 8.9%
I feel I have a high level of Confidence in Agriculture enterprise
437 76.5%
39 6.8%
55 9.6%
40 7%
P R O F I F A B a s e l i n e S u r v e y R e p o r t P a g e 25 | 55
4. CONCLUSION AND RECOMMENDATION The aim of this chapter is to present a concluding statement of the findings in relation to the four research questions proposed in the methodology in chapter two. The findings from the study uncover that majority of the respondents (69.34%) have inadequate financial knowledge as the higher proportion of SHFs reported to have high knowledge in few determinants of Financial Literacy. Ability to understand different bank services is an important determinant of financial knowledge and a precondition for further financial inclusion. The findings of the study show that 54.9% and 35.6% have low and no knowledge of bank services. It is not therefore a surprise to see that only 51% (and 49.6% women) of the respondents are financially included in the formal financial system across the PROFIFA Districts. The study further shows that the majority of respondents have low levels of entrepreneurship skills as 84.9% reported to have no knowledge of any of the five domains of entrepreneurship. This could explain again the low proportions of SHFs (1.8%) who save for future investment in agriculture compared to 56% of SHF who reported to save for other future investments (Figure On the status and impact of Digital Financial Services among PROFIFA project beneficiaries on their livelihood condition, the study has established that, although the mobile phone ownership is 68%, the use of DFS among PROFIFA is very low (3%) and only 18.9% of SHFs are very confidence in using DFS related technologies (30% not confident, 50.6% somewhat confident). On the relationship between entrepreneurship and market-driven agriculture skills and practices improve productivity among women smallholder farmers, the study conducted correlation analysis to determine the relationship between key explanatory variables such as Productivity, GAPs, Entrepreneurship, Profitability, and Financial Literacy, the results of the analysis shows that there were correlations between Yield (Productivity) and GAP knowledge, Yield and Income, Yield and Profitability, Profitability and Entrepreneurship, and Profitability and Financial Literacy. This means that the variation in one variable is caused by the variations in the other. On the relationship between knowledge and usage of appropriate agriculture financing products and the household’s income, the results found that the knowledge of agriculture financing (or Bank Services) is one determinant of financial literacy, one can argue that, based on analysis the two variables are correlated. The knowledge of financial products is essential in sparking the financial behavior and practice of SHFs (i.e usage of financial product) to apply GAPs such as inputs which boost the productivity, profitability and therefore income.
P R O F I F A B a s e l i n e S u r v e y R e p o r t P a g e 26 | 55
5. REFERENCES CARE International Rwanda. (2017). PROFIFA project proposal. Kigali: CARE International
Rwanda AFR. (2016). Finscope, Financial Inclusion in Rwanda 2016. Kigali: AFR IPAR. (2009). Rwanda Agriculture Sector Situation Analysis, An IPAR Sector Review. Kigali: IPAR. MINAGRI. (2013). Strategic plan for the transformation of agriculture in Rwanda III . Kigali:
MINAGRI. MINECOFIN. (2012). Rwanda Vision 2020 Revised 2012. Kigali: MINECOFIN. MINECOFIN. (2013). Economic development and poverty reduction strategy II. Kigali:
MINECOFIN. MINISANTE. (2014). National Food and Nutrition Strategic Plan . Kigali: Republic of Rwanda.
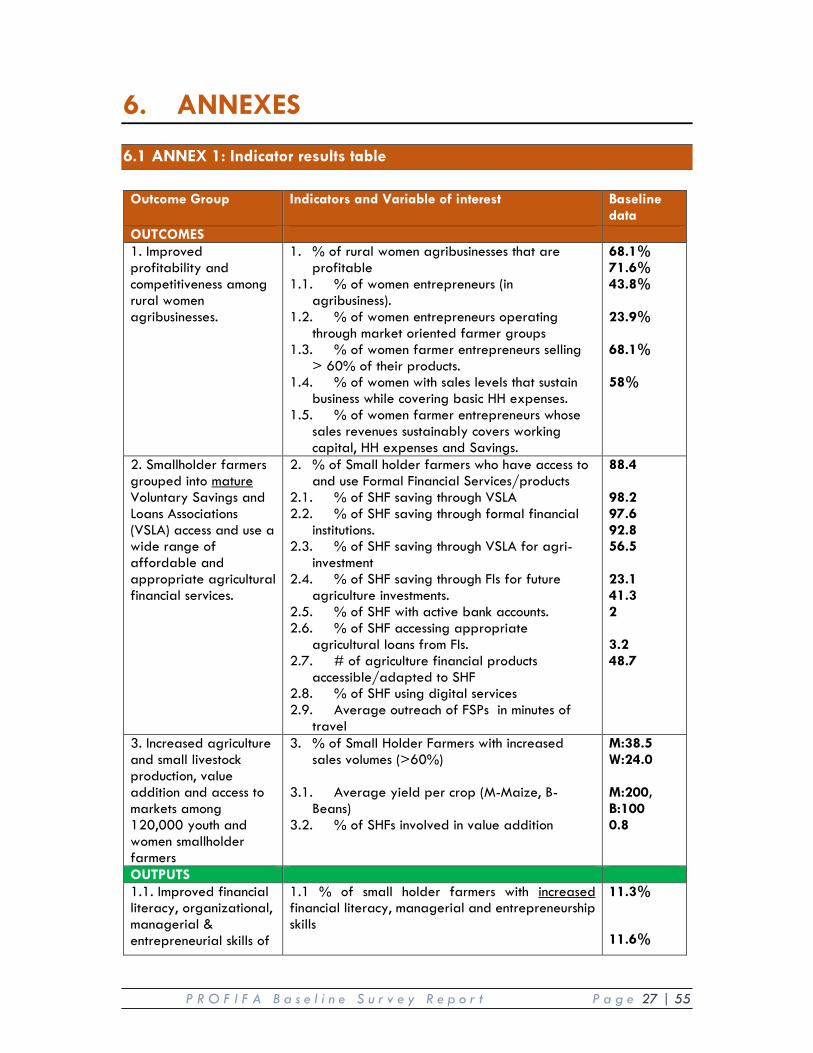
P R O F I F A B a s e l i n e S u r v e y R e p o r t P a g e 27 | 55
6. ANNEXES
6.1 ANNEX 1: Indicator results table Outcome Group Indicators and Variable of interest Baseline
data OUTCOMES 1. Improved profitability and competitiveness among rural women agribusinesses.
1. % of rural women agribusinesses that are profitable
1.1. % of women entrepreneurs (in agribusiness).
1.2. % of women entrepreneurs operating through market oriented farmer groups
1.3. % of women farmer entrepreneurs selling > 60% of their products.
1.4. % of women with sales levels that sustain business while covering basic HH expenses.
1.5. % of women farmer entrepreneurs whose sales revenues sustainably covers working capital, HH expenses and Savings.
68.1% 71.6% 43.8% 23.9% 68.1% 58%
2. Smallholder farmers grouped into mature Voluntary Savings and Loans Associations (VSLA) access and use a wide range of affordable and appropriate agricultural financial services.
2. % of Small holder farmers who have access to and use Formal Financial Services/products
2.1. % of SHF saving through VSLA 2.2. % of SHF saving through formal financial
institutions. 2.3. % of SHF saving through VSLA for agri-
investment 2.4. % of SHF saving through FIs for future
agriculture investments. 2.5. % of SHF with active bank accounts. 2.6. % of SHF accessing appropriate
agricultural loans from FIs. 2.7. # of agriculture financial products
accessible/adapted to SHF 2.8. % of SHF using digital services 2.9. Average outreach of FSPs in minutes of
travel
88.4 98.2 97.6 92.8 56.5 23.1 41.3 2 3.2 48.7
3. Increased agriculture and small livestock production, value addition and access to markets among 120,000 youth and women smallholder farmers
3. % of Small Holder Farmers with increased sales volumes (>60%)
3.1. Average yield per crop (M-Maize, B-Beans)
3.2. % of SHFs involved in value addition
M:38.5 W:24.0 M:200, B:100 0.8
OUTPUTS 1.1. Improved financial literacy, organizational, managerial & entrepreneurial skills of
1.1 % of small holder farmers with increased financial literacy, managerial and entrepreneurship skills
11.3%
11.6%
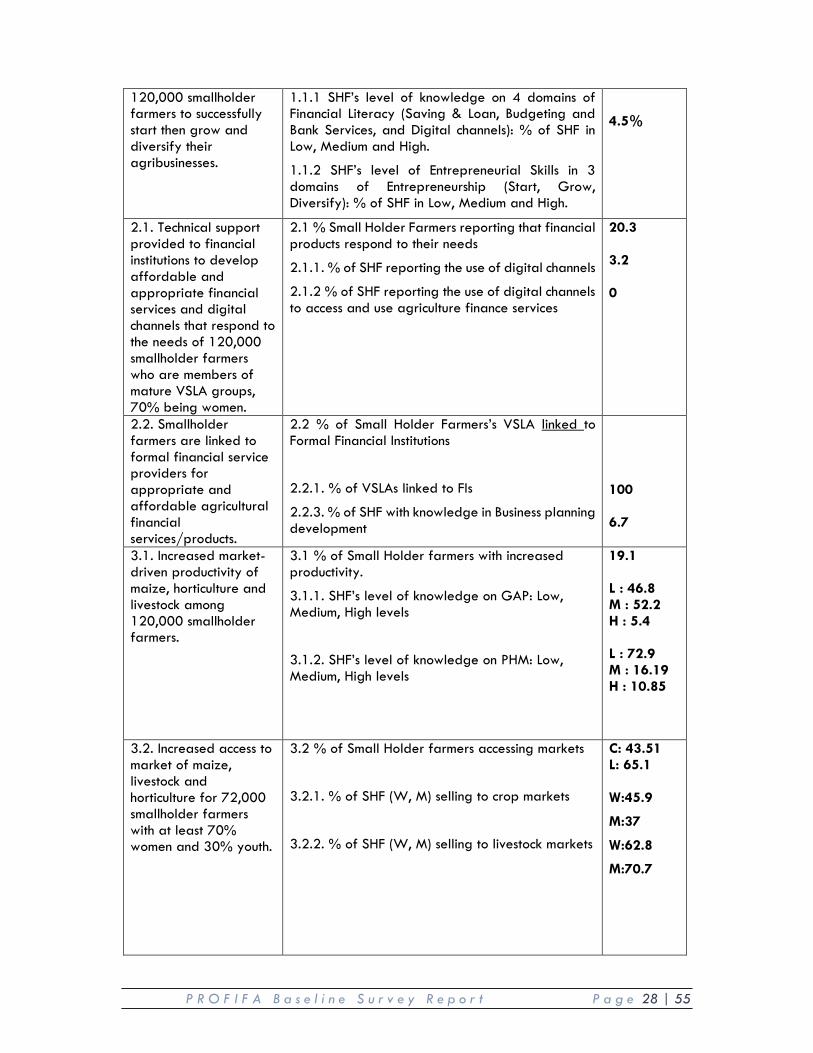
P R O F I F A B a s e l i n e S u r v e y R e p o r t P a g e 28 | 55
120,000 smallholder farmers to successfully start then grow and diversify their agribusinesses.
1.1.1 SHF’s level of knowledge on 4 domains of Financial Literacy (Saving & Loan, Budgeting and Bank Services, and Digital channels): % of SHF in Low, Medium and High.
1.1.2 SHF’s level of Entrepreneurial Skills in 3 domains of Entrepreneurship (Start, Grow, Diversify): % of SHF in Low, Medium and High.
4.5%
2.1. Technical support provided to financial institutions to develop affordable and appropriate financial services and digital channels that respond to the needs of 120,000 smallholder farmers who are members of mature VSLA groups, 70% being women.
2.1 % Small Holder Farmers reporting that financial products respond to their needs
2.1.1. % of SHF reporting the use of digital channels
2.1.2 % of SHF reporting the use of digital channels to access and use agriculture finance services
20.3 3.2 0
2.2. Smallholder farmers are linked to formal financial service providers for appropriate and affordable agricultural financial services/products.
2.2 % of Small Holder Farmers’s VSLA linked to Formal Financial Institutions
2.2.1. % of VSLAs linked to FIs
2.2.3. % of SHF with knowledge in Business planning development
100 6.7
3.1. Increased market-driven productivity of maize, horticulture and livestock among 120,000 smallholder farmers.
3.1 % of Small Holder farmers with increased productivity.
3.1.1. SHF’s level of knowledge on GAP: Low, Medium, High levels
3.1.2. SHF’s level of knowledge on PHM: Low, Medium, High levels
19.1 L : 46.8 M : 52.2 H : 5.4 L : 72.9 M : 16.19 H : 10.85
3.2. Increased access to market of maize, livestock and horticulture for 72,000 smallholder farmers with at least 70% women and 30% youth.
3.2 % of Small Holder farmers accessing markets
3.2.1. % of SHF (W, M) selling to crop markets
3.2.2. % of SHF (W, M) selling to livestock markets
C: 43.51 L: 65.1 W:45.9
M:37
W:62.8
M:70.7
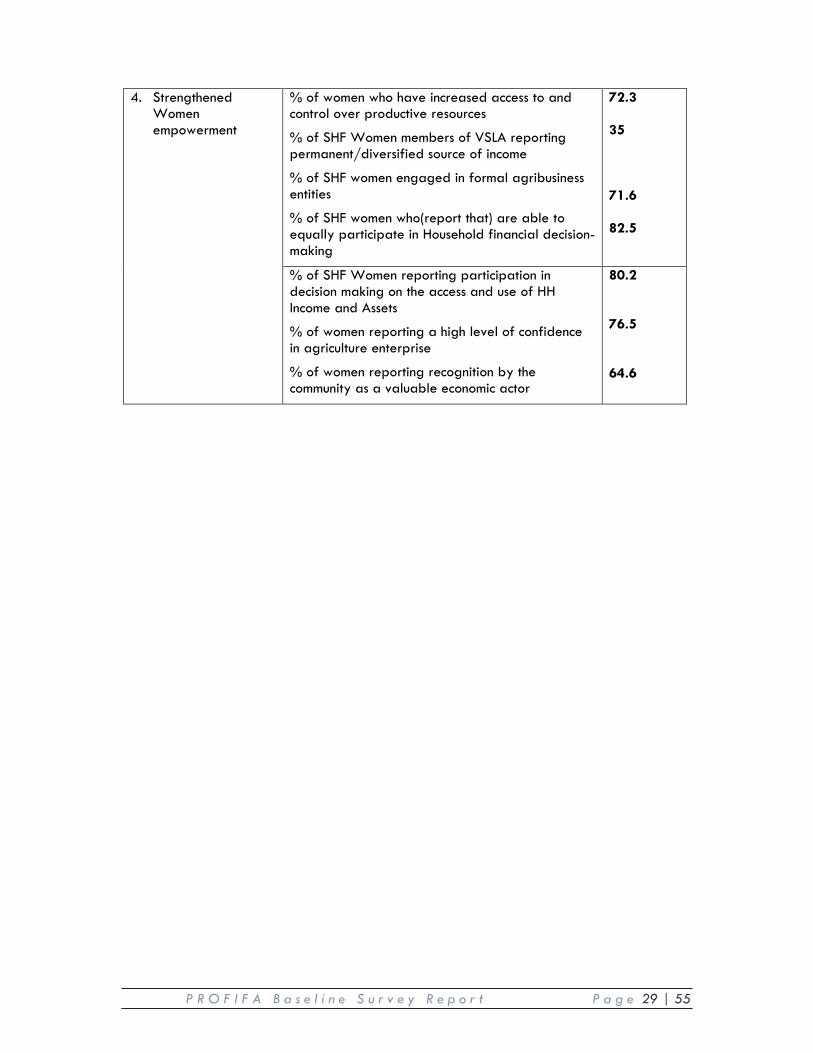
P R O F I F A B a s e l i n e S u r v e y R e p o r t P a g e 29 | 55
4. Strengthened Women empowerment
% of women who have increased access to and control over productive resources
% of SHF Women members of VSLA reporting permanent/diversified source of income
% of SHF women engaged in formal agribusiness entities
% of SHF women who(report that) are able to equally participate in Household financial decision-making
72.3 35 71.6 82.5
% of SHF Women reporting participation in decision making on the access and use of HH Income and Assets
% of women reporting a high level of confidence in agriculture enterprise
% of women reporting recognition by the community as a valuable economic actor
80.2 76.5 64.6
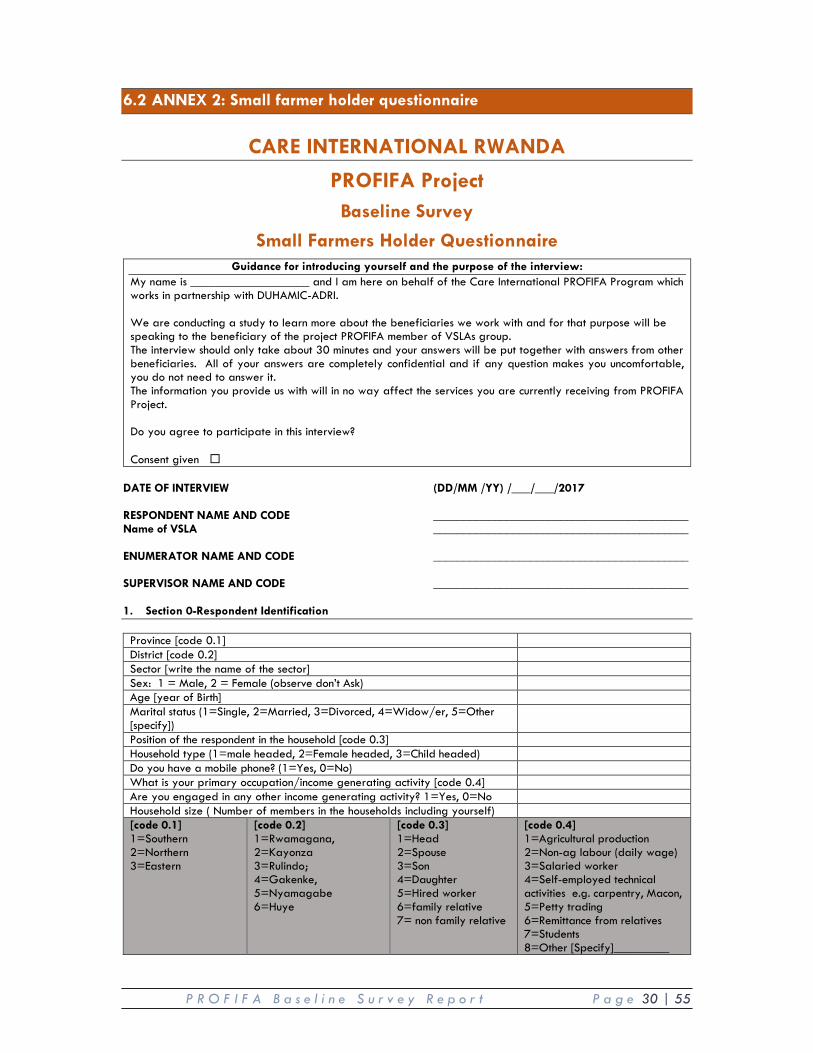
P R O F I F A B a s e l i n e S u r v e y R e p o r t P a g e 30 | 55
6.2 ANNEX 2: Small farmer holder questionnaire
CARE INTERNATIONAL RWANDA
PROFIFA Project Baseline Survey
Small Farmers Holder Questionnaire Guidance for introducing yourself and the purpose of the interview:
My name is ___________________ and I am here on behalf of the Care International PROFIFA Program which works in partnership with DUHAMIC-ADRI. We are conducting a study to learn more about the beneficiaries we work with and for that purpose will be speaking to the beneficiary of the project PROFIFA member of VSLAs group. The interview should only take about 30 minutes and your answers will be put together with answers from other beneficiaries. All of your answers are completely confidential and if any question makes you uncomfortable, you do not need to answer it. The information you provide us with will in no way affect the services you are currently receiving from PROFIFA Project. Do you agree to participate in this interview? Consent given �
DATE OF INTERVIEW (DD/MM /YY) /___/___/2017 RESPONDENT NAME AND CODE __________________________________________ Name of VSLA __________________________________________ ENUMERATOR NAME AND CODE __________________________________________ SUPERVISOR NAME AND CODE __________________________________________ 1. Section 0-Respondent Identification Province [code 0.1] District [code 0.2] Sector [write the name of the sector] Sex: 1 = Male, 2 = Female (observe don’t Ask) Age [year of Birth] Marital status (1=Single, 2=Married, 3=Divorced, 4=Widow/er, 5=Other [specify])
Position of the respondent in the household [code 0.3] Household type (1=male headed, 2=Female headed, 3=Child headed) Do you have a mobile phone? (1=Yes, 0=No) What is your primary occupation/income generating activity [code 0.4] Are you engaged in any other income generating activity? 1=Yes, 0=No Household size ( Number of members in the households including yourself) [code 0.1] 1=Southern 2=Northern 3=Eastern
[code 0.2] 1=Rwamagana, 2=Kayonza 3=Rulindo; 4=Gakenke, 5=Nyamagabe 6=Huye
[code 0.3] 1=Head 2=Spouse 3=Son 4=Daughter 5=Hired worker 6=family relative 7= non family relative
[code 0.4] 1=Agricultural production 2=Non-ag labour (daily wage) 3=Salaried worker 4=Self-employed technical activities e.g. carpentry, Macon, 5=Petty trading 6=Remittance from relatives 7=Students 8=Other [Specify]_________
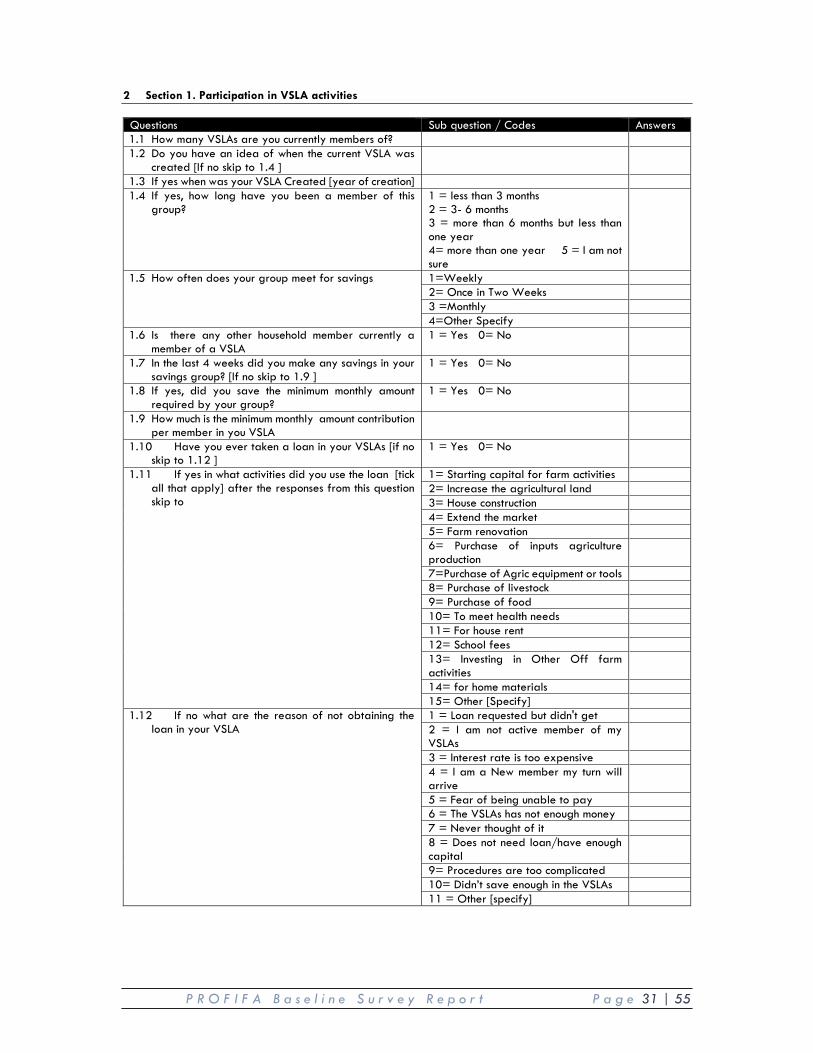
P R O F I F A B a s e l i n e S u r v e y R e p o r t P a g e 31 | 55
2 Section 1. Participation in VSLA activities Questions Sub question / Codes Answers 1.1 How many VSLAs are you currently members of? 1.2 Do you have an idea of when the current VSLA was
created [If no skip to 1.4 ]
1.3 If yes when was your VSLA Created [year of creation] 1.4 If yes, how long have you been a member of this
group?
1 = less than 3 months 2 = 3- 6 months 3 = more than 6 months but less than one year 4= more than one year 5 = I am not sure
1.5 How often does your group meet for savings 1=Weekly 2= Once in Two Weeks 3 =Monthly 4=Other Specify
1.6 Is there any other household member currently a member of a VSLA
1 = Yes 0= No
1.7 In the last 4 weeks did you make any savings in your savings group? [If no skip to 1.9 ]
1 = Yes 0= No
1.8 If yes, did you save the minimum monthly amount required by your group?
1 = Yes 0= No
1.9 How much is the minimum monthly amount contribution per member in you VSLA
1.10 Have you ever taken a loan in your VSLAs [if no skip to 1.12 ]
1 = Yes 0= No
1.11 If yes in what activities did you use the loan [tick all that apply] after the responses from this question skip to
1= Starting capital for farm activities 2= Increase the agricultural land 3= House construction 4= Extend the market 5= Farm renovation 6= Purchase of inputs agriculture production
7=Purchase of Agric equipment or tools 8= Purchase of livestock 9= Purchase of food 10= To meet health needs 11= For house rent 12= School fees 13= Investing in Other Off farm activities
14= for home materials 15= Other [Specify]
1.12 If no what are the reason of not obtaining the loan in your VSLA
1 = Loan requested but didn't get 2 = I am not active member of my VSLAs
3 = Interest rate is too expensive 4 = I am a New member my turn will arrive
5 = Fear of being unable to pay 6 = The VSLAs has not enough money 7 = Never thought of it 8 = Does not need loan/have enough capital
9= Procedures are too complicated 10= Didn’t save enough in the VSLAs 11 = Other [specify]
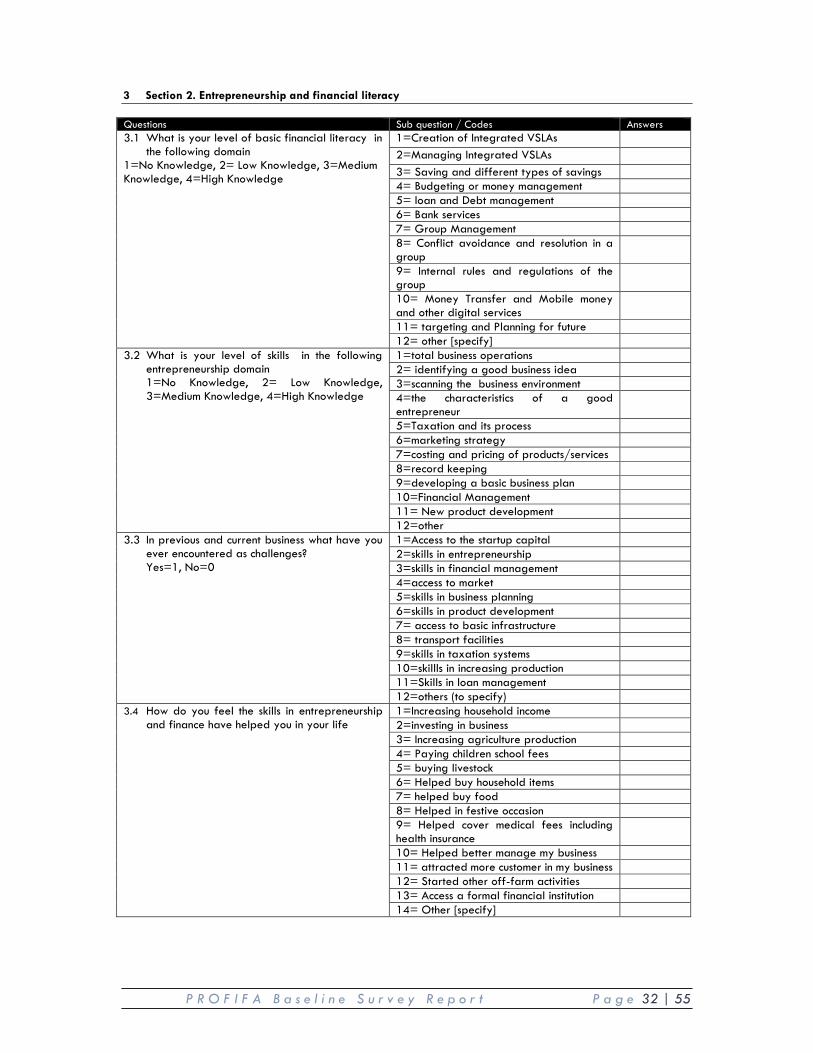
P R O F I F A B a s e l i n e S u r v e y R e p o r t P a g e 32 | 55
3 Section 2. Entrepreneurship and financial literacy Questions Sub question / Codes Answers 3.1 What is your level of basic financial literacy in
the following domain 1=No Knowledge, 2= Low Knowledge, 3=Medium Knowledge, 4=High Knowledge
1=Creation of Integrated VSLAs 2=Managing Integrated VSLAs 3= Saving and different types of savings 4= Budgeting or money management 5= loan and Debt management 6= Bank services 7= Group Management 8= Conflict avoidance and resolution in a group
9= Internal rules and regulations of the group
10= Money Transfer and Mobile money and other digital services
11= targeting and Planning for future 12= other [specify]
3.2 What is your level of skills in the following entrepreneurship domain 1=No Knowledge, 2= Low Knowledge, 3=Medium Knowledge, 4=High Knowledge
1=total business operations 2= identifying a good business idea 3=scanning the business environment 4=the characteristics of a good entrepreneur
5=Taxation and its process 6=marketing strategy 7=costing and pricing of products/services 8=record keeping 9=developing a basic business plan 10=Financial Management 11= New product development 12=other
3.3 In previous and current business what have you ever encountered as challenges? Yes=1, No=0
1=Access to the startup capital 2=skills in entrepreneurship 3=skills in financial management 4=access to market 5=skills in business planning 6=skills in product development 7= access to basic infrastructure 8= transport facilities 9=skills in taxation systems 10=skillls in increasing production 11=Skills in loan management 12=others (to specify)
3.4 How do you feel the skills in entrepreneurship and finance have helped you in your life
1=Increasing household income 2=investing in business 3= Increasing agriculture production 4= Paying children school fees 5= buying livestock 6= Helped buy household items 7= helped buy food 8= Helped in festive occasion 9= Helped cover medical fees including health insurance
10= Helped better manage my business 11= attracted more customer in my business 12= Started other off-farm activities 13= Access a formal financial institution 14= Other [specify]
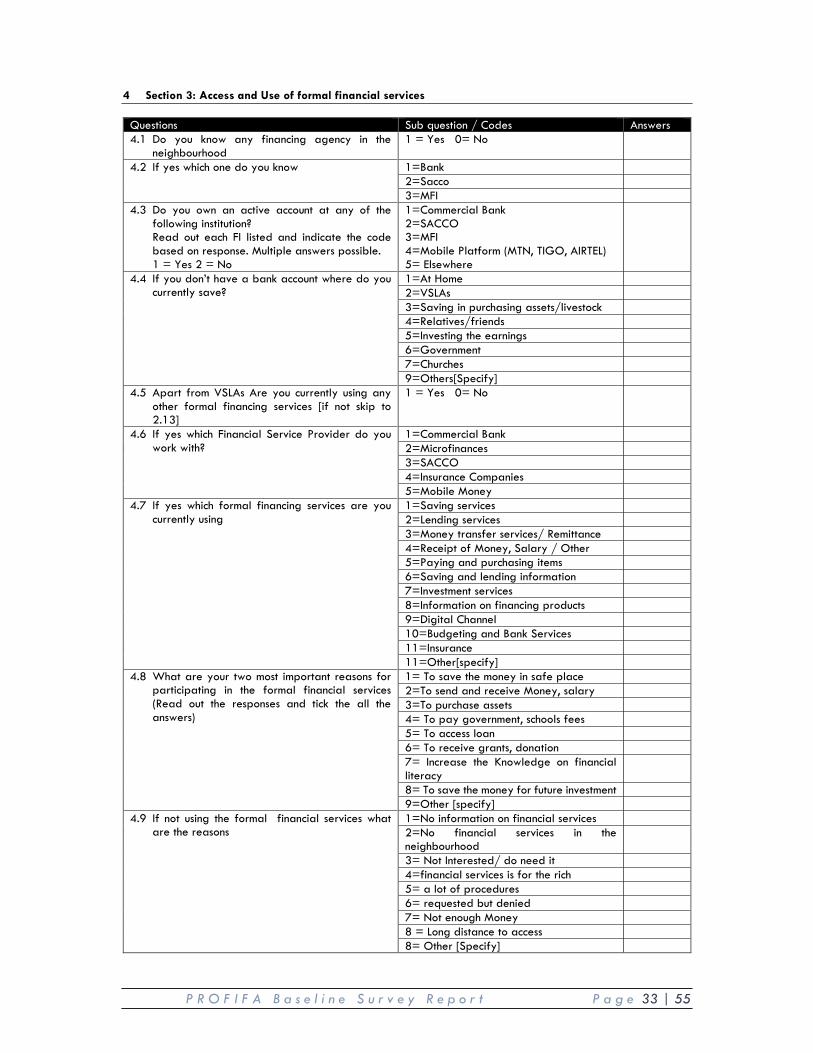
P R O F I F A B a s e l i n e S u r v e y R e p o r t P a g e 33 | 55
4 Section 3: Access and Use of formal financial services Questions Sub question / Codes Answers 4.1 Do you know any financing agency in the
neighbourhood 1 = Yes 0= No
4.2 If yes which one do you know 1=Bank 2=Sacco 3=MFI
4.3 Do you own an active account at any of the following institution? Read out each FI listed and indicate the code based on response. Multiple answers possible. 1 = Yes 2 = No
1=Commercial Bank 2=SACCO 3=MFI 4=Mobile Platform (MTN, TIGO, AIRTEL) 5= Elsewhere
4.4 If you don’t have a bank account where do you currently save?
1=At Home 2=VSLAs 3=Saving in purchasing assets/livestock 4=Relatives/friends 5=Investing the earnings 6=Government 7=Churches 9=Others[Specify]
4.5 Apart from VSLAs Are you currently using any other formal financing services [if not skip to 2.13]
1 = Yes 0= No
4.6 If yes which Financial Service Provider do you work with?
1=Commercial Bank 2=Microfinances 3=SACCO 4=Insurance Companies 5=Mobile Money
4.7 If yes which formal financing services are you currently using
1=Saving services 2=Lending services 3=Money transfer services/ Remittance 4=Receipt of Money, Salary / Other 5=Paying and purchasing items 6=Saving and lending information 7=Investment services 8=Information on financing products 9=Digital Channel 10=Budgeting and Bank Services 11=Insurance 11=Other[specify]
4.8 What are your two most important reasons for participating in the formal financial services (Read out the responses and tick the all the answers)
1= To save the money in safe place 2=To send and receive Money, salary 3=To purchase assets 4= To pay government, schools fees 5= To access loan 6= To receive grants, donation 7= Increase the Knowledge on financial literacy
8= To save the money for future investment 9=Other [specify]
4.9 If not using the formal financial services what are the reasons
1=No information on financial services 2=No financial services in the neighbourhood
3= Not Interested/ do need it 4=financial services is for the rich 5= a lot of procedures 6= requested but denied 7= Not enough Money 8 = Long distance to access 8= Other [Specify]
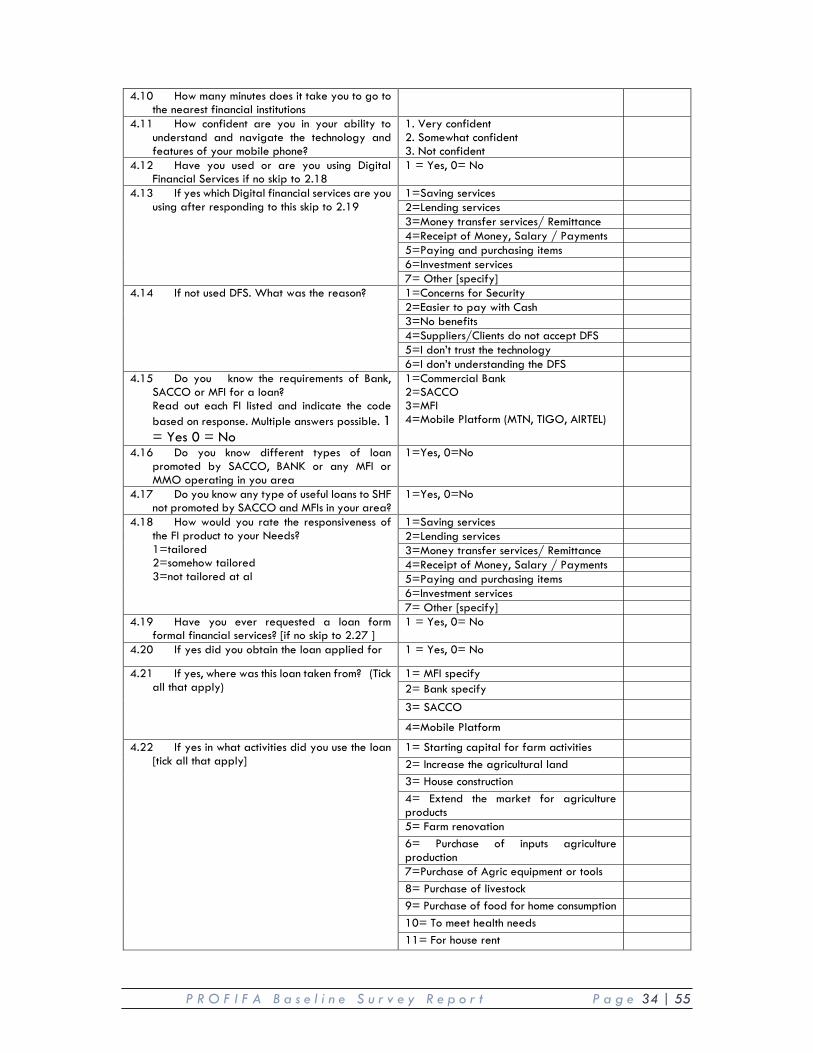
P R O F I F A B a s e l i n e S u r v e y R e p o r t P a g e 34 | 55
4.10 How many minutes does it take you to go to the nearest financial institutions
4.11 How confident are you in your ability to understand and navigate the technology and features of your mobile phone?
1. Very confident 2. Somewhat confident 3. Not confident
4.12 Have you used or are you using Digital Financial Services if no skip to 2.18
1 = Yes, 0= No
4.13 If yes which Digital financial services are you using after responding to this skip to 2.19
1=Saving services 2=Lending services 3=Money transfer services/ Remittance 4=Receipt of Money, Salary / Payments 5=Paying and purchasing items 6=Investment services 7= Other [specify]
4.14 If not used DFS. What was the reason? 1=Concerns for Security 2=Easier to pay with Cash 3=No benefits 4=Suppliers/Clients do not accept DFS 5=I don’t trust the technology 6=I don’t understanding the DFS
4.15 Do you know the requirements of Bank, SACCO or MFI for a loan? Read out each FI listed and indicate the code based on response. Multiple answers possible. 1 = Yes 0 = No
1=Commercial Bank 2=SACCO 3=MFI 4=Mobile Platform (MTN, TIGO, AIRTEL)
4.16 Do you know different types of loan promoted by SACCO, BANK or any MFI or MMO operating in you area
1=Yes, 0=No
4.17 Do you know any type of useful loans to SHF not promoted by SACCO and MFIs in your area?
1=Yes, 0=No
4.18 How would you rate the responsiveness of the FI product to your Needs? 1=tailored 2=somehow tailored 3=not tailored at al
1=Saving services 2=Lending services 3=Money transfer services/ Remittance 4=Receipt of Money, Salary / Payments 5=Paying and purchasing items 6=Investment services 7= Other [specify]
4.19 Have you ever requested a loan form formal financial services? [if no skip to 2.27 ]
1 = Yes, 0= No
4.20 If yes did you obtain the loan applied for 1 = Yes, 0= No
4.21 If yes, where was this loan taken from? (Tick all that apply)
1= MFI specify 2= Bank specify 3= SACCO
4=Mobile Platform
4.22 If yes in what activities did you use the loan [tick all that apply]
1= Starting capital for farm activities 2= Increase the agricultural land 3= House construction 4= Extend the market for agriculture products
5= Farm renovation 6= Purchase of inputs agriculture production
7=Purchase of Agric equipment or tools 8= Purchase of livestock 9= Purchase of food for home consumption 10= To meet health needs 11= For house rent
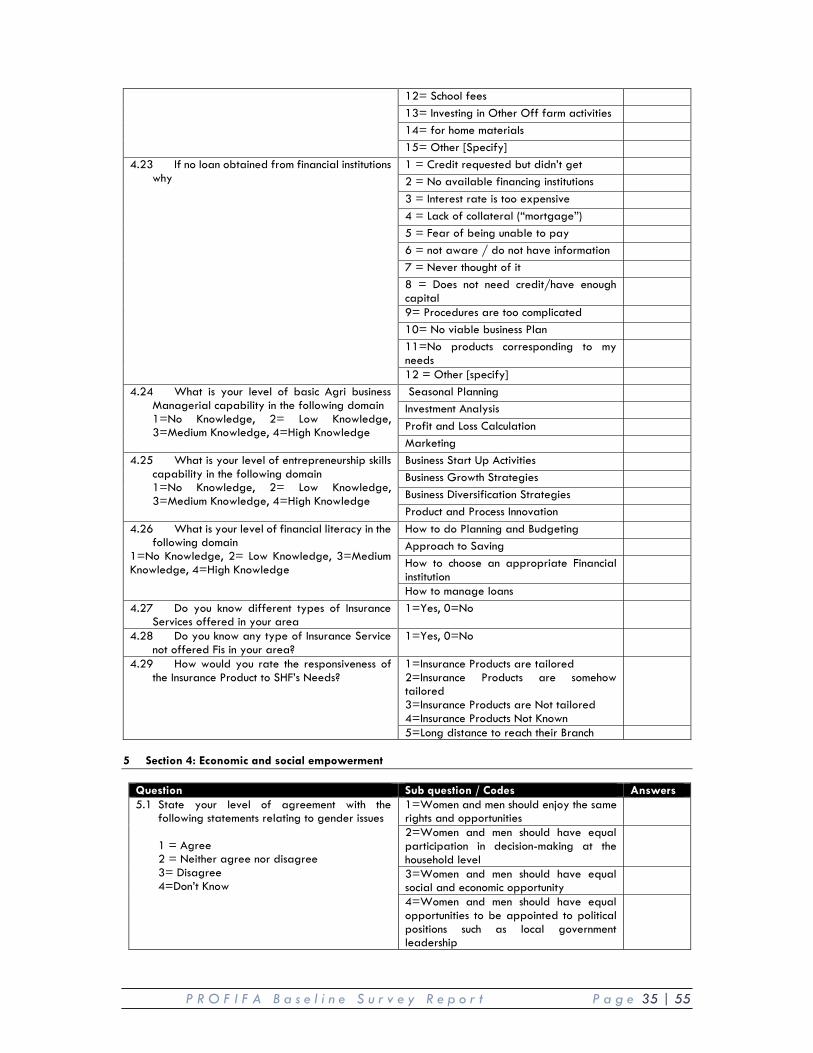
P R O F I F A B a s e l i n e S u r v e y R e p o r t P a g e 35 | 55
12= School fees 13= Investing in Other Off farm activities 14= for home materials 15= Other [Specify]
4.23 If no loan obtained from financial institutions why
1 = Credit requested but didn’t get 2 = No available financing institutions 3 = Interest rate is too expensive 4 = Lack of collateral (“mortgage”) 5 = Fear of being unable to pay 6 = not aware / do not have information 7 = Never thought of it 8 = Does not need credit/have enough capital
9= Procedures are too complicated 10= No viable business Plan 11=No products corresponding to my needs
12 = Other [specify] 4.24 What is your level of basic Agri business
Managerial capability in the following domain 1=No Knowledge, 2= Low Knowledge, 3=Medium Knowledge, 4=High Knowledge
Seasonal Planning Investment Analysis Profit and Loss Calculation Marketing
4.25 What is your level of entrepreneurship skills capability in the following domain 1=No Knowledge, 2= Low Knowledge, 3=Medium Knowledge, 4=High Knowledge
Business Start Up Activities Business Growth Strategies Business Diversification Strategies Product and Process Innovation
4.26 What is your level of financial literacy in the following domain
1=No Knowledge, 2= Low Knowledge, 3=Medium Knowledge, 4=High Knowledge
How to do Planning and Budgeting Approach to Saving How to choose an appropriate Financial institution
How to manage loans 4.27 Do you know different types of Insurance
Services offered in your area 1=Yes, 0=No
4.28 Do you know any type of Insurance Service not offered Fis in your area?
1=Yes, 0=No
4.29 How would you rate the responsiveness of the Insurance Product to SHF’s Needs?
1=Insurance Products are tailored 2=Insurance Products are somehow tailored 3=Insurance Products are Not tailored 4=Insurance Products Not Known
5=Long distance to reach their Branch 5 Section 4: Economic and social empowerment
Question Sub question / Codes Answers 5.1 State your level of agreement with the
following statements relating to gender issues 1 = Agree 2 = Neither agree nor disagree 3= Disagree 4=Don’t Know
1=Women and men should enjoy the same rights and opportunities
2=Women and men should have equal participation in decision-making at the household level
3=Women and men should have equal social and economic opportunity
4=Women and men should have equal opportunities to be appointed to political positions such as local government leadership
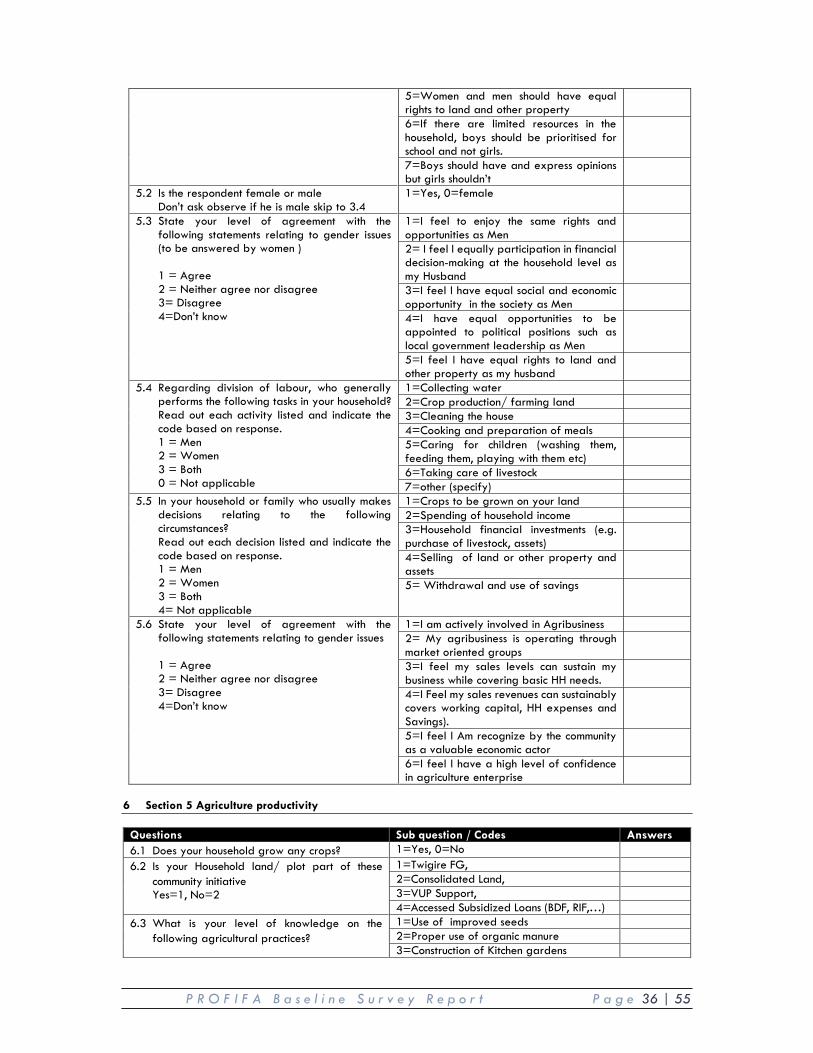
P R O F I F A B a s e l i n e S u r v e y R e p o r t P a g e 36 | 55
5=Women and men should have equal rights to land and other property
6=If there are limited resources in the household, boys should be prioritised for school and not girls.
7=Boys should have and express opinions but girls shouldn’t
5.2 Is the respondent female or male Don’t ask observe if he is male skip to 3.4
1=Yes, 0=female
5.3 State your level of agreement with the following statements relating to gender issues (to be answered by women ) 1 = Agree 2 = Neither agree nor disagree 3= Disagree 4=Don’t know
1=I feel to enjoy the same rights and opportunities as Men
2= I feel I equally participation in financial decision-making at the household level as my Husband
3=I feel I have equal social and economic opportunity in the society as Men
4=I have equal opportunities to be appointed to political positions such as local government leadership as Men
5=I feel I have equal rights to land and other property as my husband
5.4 Regarding division of labour, who generally performs the following tasks in your household? Read out each activity listed and indicate the code based on response. 1 = Men 2 = Women 3 = Both 0 = Not applicable
1=Collecting water 2=Crop production/ farming land 3=Cleaning the house 4=Cooking and preparation of meals 5=Caring for children (washing them, feeding them, playing with them etc)
6=Taking care of livestock 7=other (specify)
5.5 In your household or family who usually makes decisions relating to the following circumstances? Read out each decision listed and indicate the code based on response. 1 = Men 2 = Women 3 = Both 4= Not applicable
1=Crops to be grown on your land 2=Spending of household income 3=Household financial investments (e.g. purchase of livestock, assets)
4=Selling of land or other property and assets
5= Withdrawal and use of savings
5.6 State your level of agreement with the following statements relating to gender issues 1 = Agree 2 = Neither agree nor disagree 3= Disagree 4=Don’t know
1=I am actively involved in Agribusiness 2= My agribusiness is operating through market oriented groups
3=I feel my sales levels can sustain my business while covering basic HH needs.
4=I Feel my sales revenues can sustainably covers working capital, HH expenses and Savings).
5=I feel I Am recognize by the community as a valuable economic actor
6=I feel I have a high level of confidence in agriculture enterprise
6 Section 5 Agriculture productivity
Questions Sub question / Codes Answers 6.1 Does your household grow any crops? 1=Yes, 0=No 6.2 Is your Household land/ plot part of these
community initiative Yes=1, No=2
1=Twigire FG, 2=Consolidated Land, 3=VUP Support, 4=Accessed Subsidized Loans (BDF, RIF,…)
6.3 What is your level of knowledge on the following agricultural practices?
1=Use of improved seeds 2=Proper use of organic manure 3=Construction of Kitchen gardens
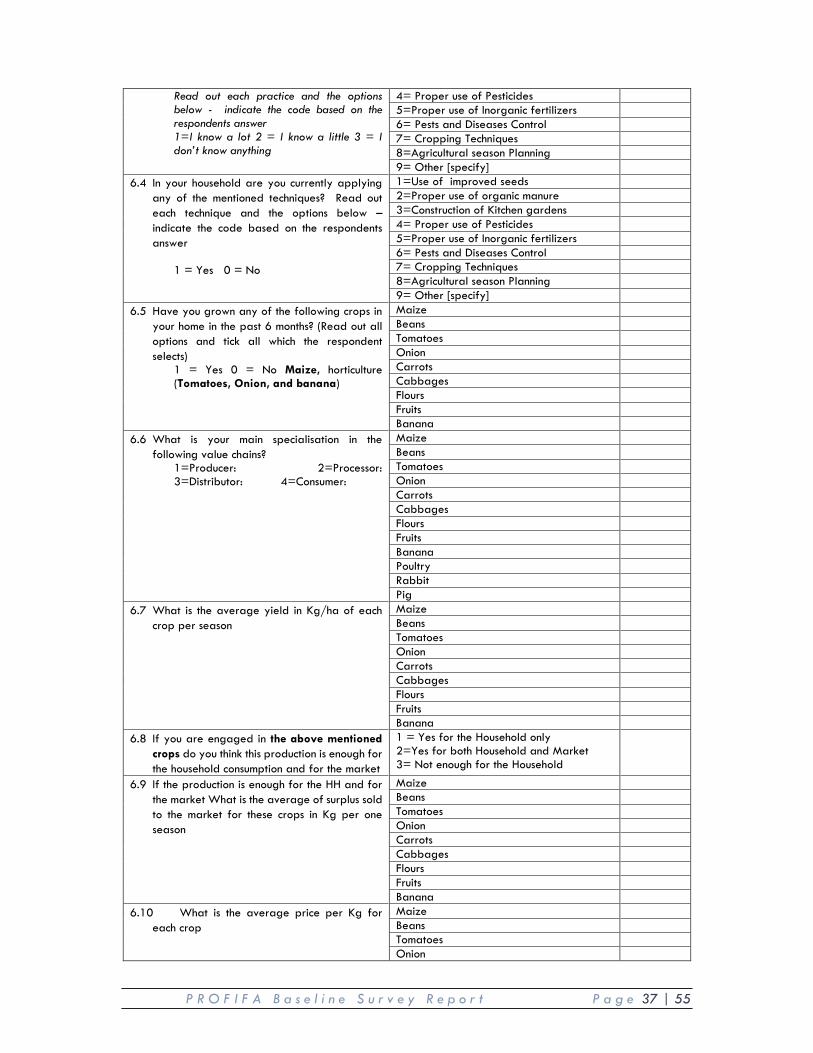
P R O F I F A B a s e l i n e S u r v e y R e p o r t P a g e 37 | 55
Read out each practice and the options below - indicate the code based on the respondents answer 1=I know a lot 2 = I know a little 3 = I don’t know anything
4= Proper use of Pesticides 5=Proper use of Inorganic fertilizers 6= Pests and Diseases Control 7= Cropping Techniques 8=Agricultural season Planning 9= Other [specify]
6.4 In your household are you currently applying any of the mentioned techniques? Read out each technique and the options below – indicate the code based on the respondents answer
1 = Yes 0 = No
1=Use of improved seeds 2=Proper use of organic manure 3=Construction of Kitchen gardens 4= Proper use of Pesticides 5=Proper use of Inorganic fertilizers 6= Pests and Diseases Control 7= Cropping Techniques 8=Agricultural season Planning 9= Other [specify]
6.5 Have you grown any of the following crops in your home in the past 6 months? (Read out all options and tick all which the respondent selects)
1 = Yes 0 = No Maize, horticulture (Tomatoes, Onion, and banana)
Maize Beans Tomatoes Onion Carrots Cabbages Flours Fruits Banana
6.6 What is your main specialisation in the following value chains?
1=Producer: 2=Processor: 3=Distributor: 4=Consumer:
Maize Beans Tomatoes Onion Carrots Cabbages Flours Fruits Banana Poultry Rabbit Pig
6.7 What is the average yield in Kg/ha of each crop per season
Maize Beans Tomatoes Onion Carrots Cabbages Flours Fruits Banana
6.8 If you are engaged in the above mentioned crops do you think this production is enough for the household consumption and for the market
1 = Yes for the Household only 2=Yes for both Household and Market 3= Not enough for the Household
6.9 If the production is enough for the HH and for the market What is the average of surplus sold to the market for these crops in Kg per one season
Maize Beans Tomatoes Onion Carrots Cabbages Flours Fruits Banana
6.10 What is the average price per Kg for each crop
Maize Beans Tomatoes Onion
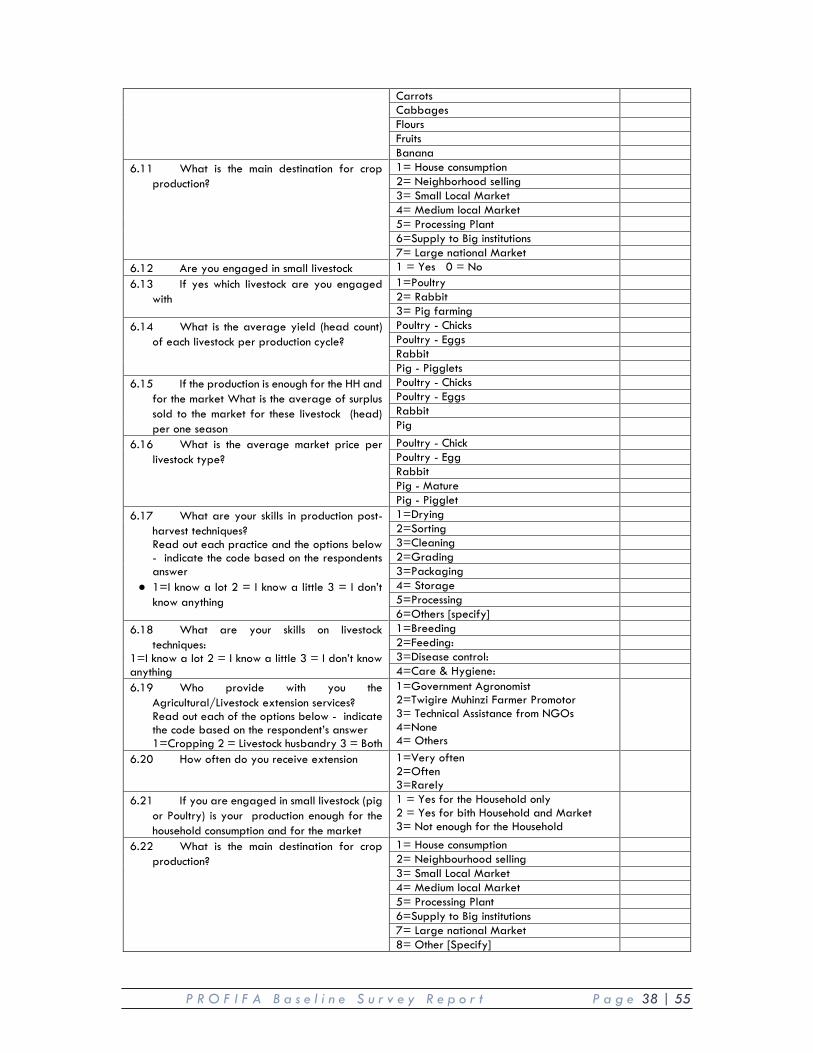
P R O F I F A B a s e l i n e S u r v e y R e p o r t P a g e 38 | 55
Carrots Cabbages Flours Fruits Banana
6.11 What is the main destination for crop production?
1= House consumption 2= Neighborhood selling 3= Small Local Market 4= Medium local Market 5= Processing Plant 6=Supply to Big institutions 7= Large national Market
6.12 Are you engaged in small livestock 1 = Yes 0 = No 6.13 If yes which livestock are you engaged
with 1=Poultry 2= Rabbit 3= Pig farming
6.14 What is the average yield (head count) of each livestock per production cycle?
Poultry - Chicks Poultry - Eggs Rabbit Pig - Pigglets
6.15 If the production is enough for the HH and for the market What is the average of surplus sold to the market for these livestock (head) per one season
Poultry - Chicks Poultry - Eggs Rabbit Pig
6.16 What is the average market price per livestock type?
Poultry - Chick Poultry - Egg Rabbit Pig - Mature Pig - Pigglet
6.17 What are your skills in production post-harvest techniques? Read out each practice and the options below - indicate the code based on the respondents answer
● 1=I know a lot 2 = I know a little 3 = I don’t know anything
1=Drying 2=Sorting 3=Cleaning 2=Grading 3=Packaging 4= Storage 5=Processing 6=Others [specify]
6.18 What are your skills on livestock techniques:
1=I know a lot 2 = I know a little 3 = I don’t know anything
1=Breeding 2=Feeding: 3=Disease control: 4=Care & Hygiene:
6.19 Who provide with you the Agricultural/Livestock extension services? Read out each of the options below - indicate the code based on the respondent’s answer 1=Cropping 2 = Livestock husbandry 3 = Both
1=Government Agronomist 2=Twigire Muhinzi Farmer Promotor 3= Technical Assistance from NGOs 4=None 4= Others
6.20 How often do you receive extension 1=Very often 2=Often 3=Rarely
6.21 If you are engaged in small livestock (pig or Poultry) is your production enough for the household consumption and for the market
1 = Yes for the Household only 2 = Yes for bith Household and Market 3= Not enough for the Household
6.22 What is the main destination for crop production?
1= House consumption 2= Neighbourhood selling 3= Small Local Market 4= Medium local Market 5= Processing Plant 6=Supply to Big institutions 7= Large national Market 8= Other [Specify]
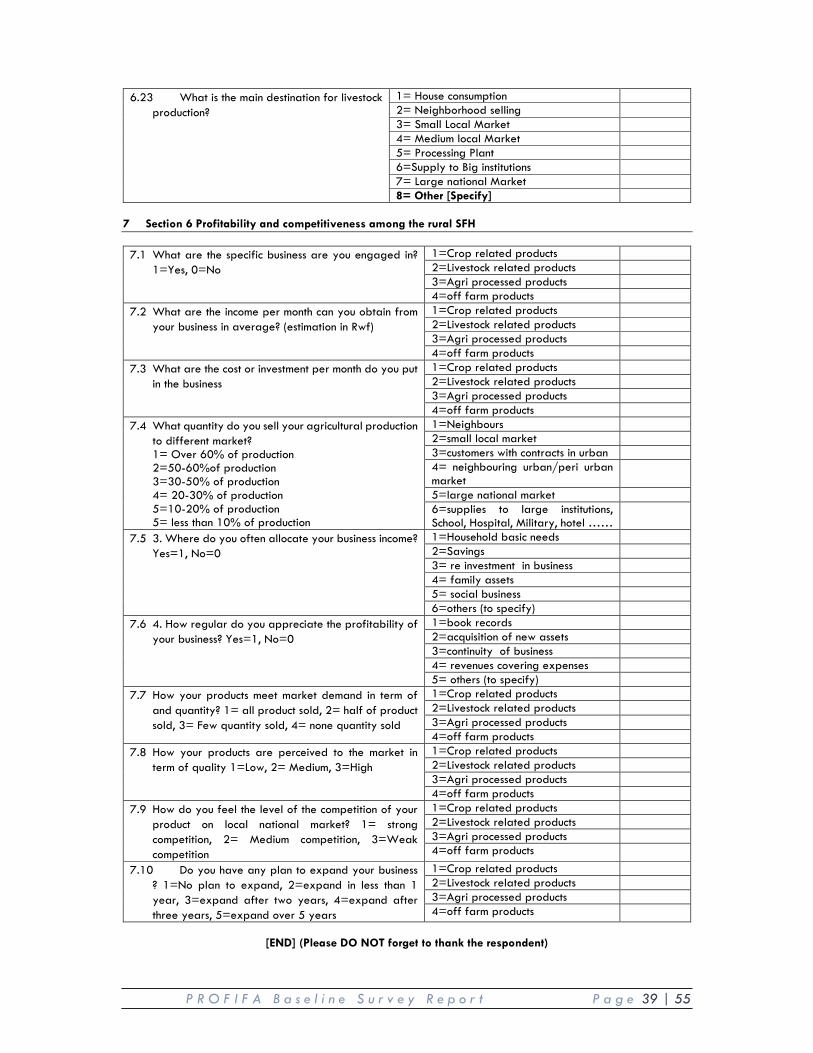
P R O F I F A B a s e l i n e S u r v e y R e p o r t P a g e 39 | 55
6.23 What is the main destination for livestock production?
1= House consumption 2= Neighborhood selling 3= Small Local Market 4= Medium local Market 5= Processing Plant 6=Supply to Big institutions 7= Large national Market 8= Other [Specify]
7 Section 6 Profitability and competitiveness among the rural SFH 7.1 What are the specific business are you engaged in?
1=Yes, 0=No 1=Crop related products 2=Livestock related products 3=Agri processed products 4=off farm products
7.2 What are the income per month can you obtain from your business in average? (estimation in Rwf)
1=Crop related products 2=Livestock related products 3=Agri processed products 4=off farm products
7.3 What are the cost or investment per month do you put in the business
1=Crop related products 2=Livestock related products 3=Agri processed products 4=off farm products
7.4 What quantity do you sell your agricultural production to different market? 1= Over 60% of production 2=50-60%of production 3=30-50% of production 4= 20-30% of production 5=10-20% of production 5= less than 10% of production
1=Neighbours 2=small local market 3=customers with contracts in urban 4= neighbouring urban/peri urban market
5=large national market 6=supplies to large institutions, School, Hospital, Military, hotel ……
7.5 3. Where do you often allocate your business income? Yes=1, No=0
1=Household basic needs 2=Savings 3= re investment in business 4= family assets 5= social business 6=others (to specify)
7.6 4. How regular do you appreciate the profitability of your business? Yes=1, No=0
1=book records 2=acquisition of new assets 3=continuity of business 4= revenues covering expenses 5= others (to specify)
7.7 How your products meet market demand in term of and quantity? 1= all product sold, 2= half of product sold, 3= Few quantity sold, 4= none quantity sold
1=Crop related products 2=Livestock related products 3=Agri processed products 4=off farm products
7.8 How your products are perceived to the market in term of quality 1=Low, 2= Medium, 3=High
1=Crop related products 2=Livestock related products 3=Agri processed products 4=off farm products
7.9 How do you feel the level of the competition of your product on local national market? 1= strong competition, 2= Medium competition, 3=Weak competition
1=Crop related products 2=Livestock related products 3=Agri processed products 4=off farm products
7.10 Do you have any plan to expand your business ? 1=No plan to expand, 2=expand in less than 1 year, 3=expand after two years, 4=expand after three years, 5=expand over 5 years
1=Crop related products 2=Livestock related products 3=Agri processed products 4=off farm products
[END] (Please DO NOT forget to thank the respondent)
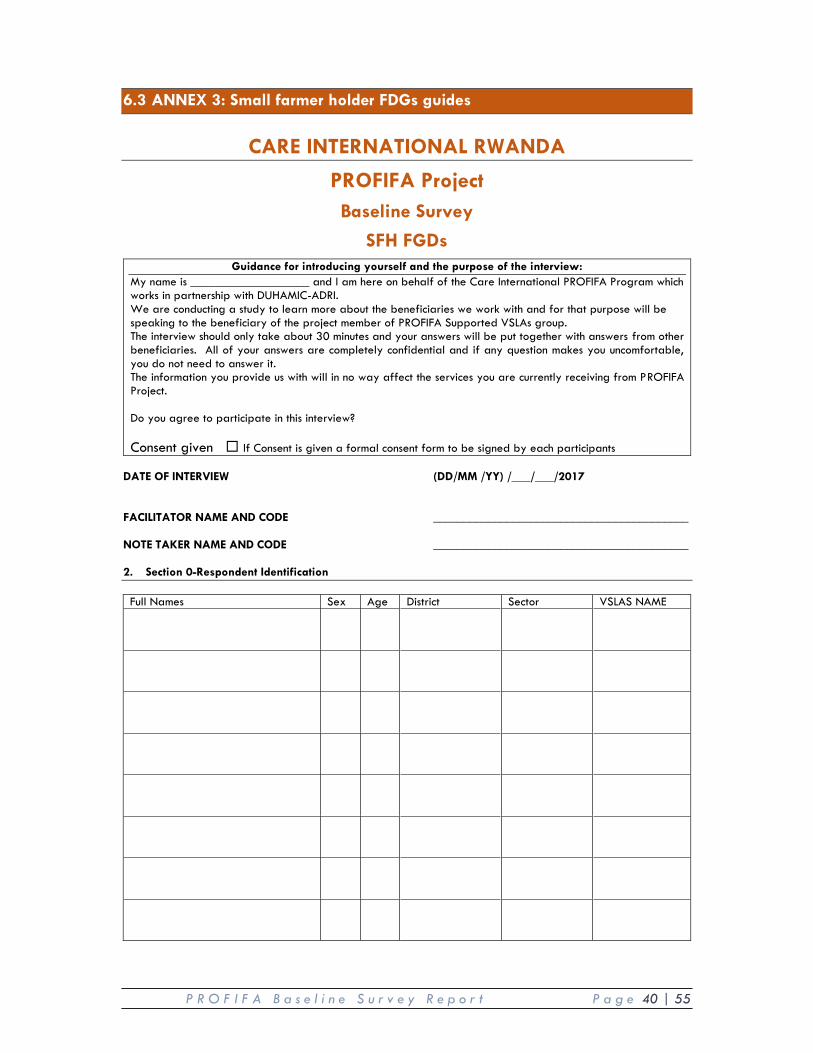
P R O F I F A B a s e l i n e S u r v e y R e p o r t P a g e 40 | 55
6.3 ANNEX 3: Small farmer holder FDGs guides
CARE INTERNATIONAL RWANDA
PROFIFA Project Baseline Survey
SFH FGDs Guidance for introducing yourself and the purpose of the interview:
My name is ___________________ and I am here on behalf of the Care International PROFIFA Program which works in partnership with DUHAMIC-ADRI. We are conducting a study to learn more about the beneficiaries we work with and for that purpose will be speaking to the beneficiary of the project member of PROFIFA Supported VSLAs group. The interview should only take about 30 minutes and your answers will be put together with answers from other beneficiaries. All of your answers are completely confidential and if any question makes you uncomfortable, you do not need to answer it. The information you provide us with will in no way affect the services you are currently receiving from PROFIFA Project. Do you agree to participate in this interview? Consent given � If Consent is given a formal consent form to be signed by each participants
DATE OF INTERVIEW (DD/MM /YY) /___/___/2017 FACILITATOR NAME AND CODE __________________________________________ NOTE TAKER NAME AND CODE __________________________________________ 2. Section 0-Respondent Identification Full Names Sex Age District Sector VSLAS NAME
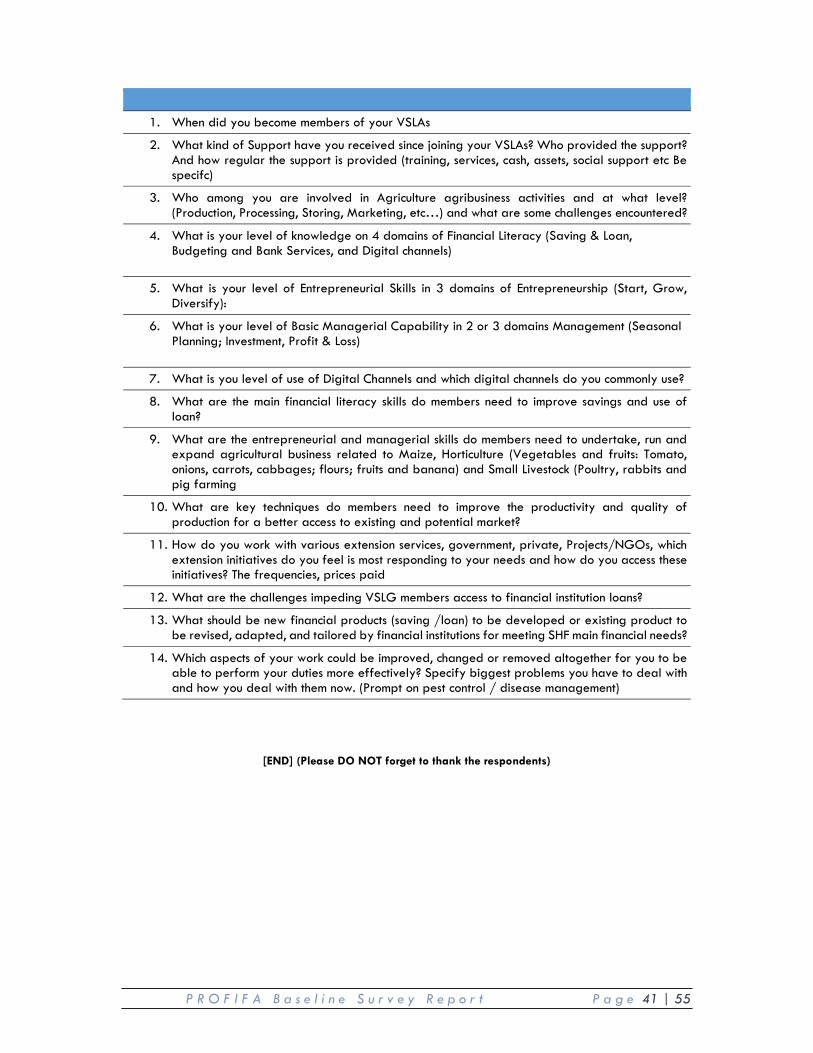
P R O F I F A B a s e l i n e S u r v e y R e p o r t P a g e 41 | 55
1. When did you become members of your VSLAs
2. What kind of Support have you received since joining your VSLAs? Who provided the support? And how regular the support is provided (training, services, cash, assets, social support etc Be specifc)
3. Who among you are involved in Agriculture agribusiness activities and at what level? (Production, Processing, Storing, Marketing, etc…) and what are some challenges encountered?
4. What is your level of knowledge on 4 domains of Financial Literacy (Saving & Loan, Budgeting and Bank Services, and Digital channels)
5. What is your level of Entrepreneurial Skills in 3 domains of Entrepreneurship (Start, Grow, Diversify):
6. What is your level of Basic Managerial Capability in 2 or 3 domains Management (Seasonal Planning; Investment, Profit & Loss)
7. What is you level of use of Digital Channels and which digital channels do you commonly use?
8. What are the main financial literacy skills do members need to improve savings and use of loan?
9. What are the entrepreneurial and managerial skills do members need to undertake, run and expand agricultural business related to Maize, Horticulture (Vegetables and fruits: Tomato, onions, carrots, cabbages; flours; fruits and banana) and Small Livestock (Poultry, rabbits and pig farming
10. What are key techniques do members need to improve the productivity and quality of production for a better access to existing and potential market?
11. How do you work with various extension services, government, private, Projects/NGOs, which extension initiatives do you feel is most responding to your needs and how do you access these initiatives? The frequencies, prices paid
12. What are the challenges impeding VSLG members access to financial institution loans?
13. What should be new financial products (saving /loan) to be developed or existing product to be revised, adapted, and tailored by financial institutions for meeting SHF main financial needs?
14. Which aspects of your work could be improved, changed or removed altogether for you to be able to perform your duties more effectively? Specify biggest problems you have to deal with and how you deal with them now. (Prompt on pest control / disease management)
[END] (Please DO NOT forget to thank the respondents)
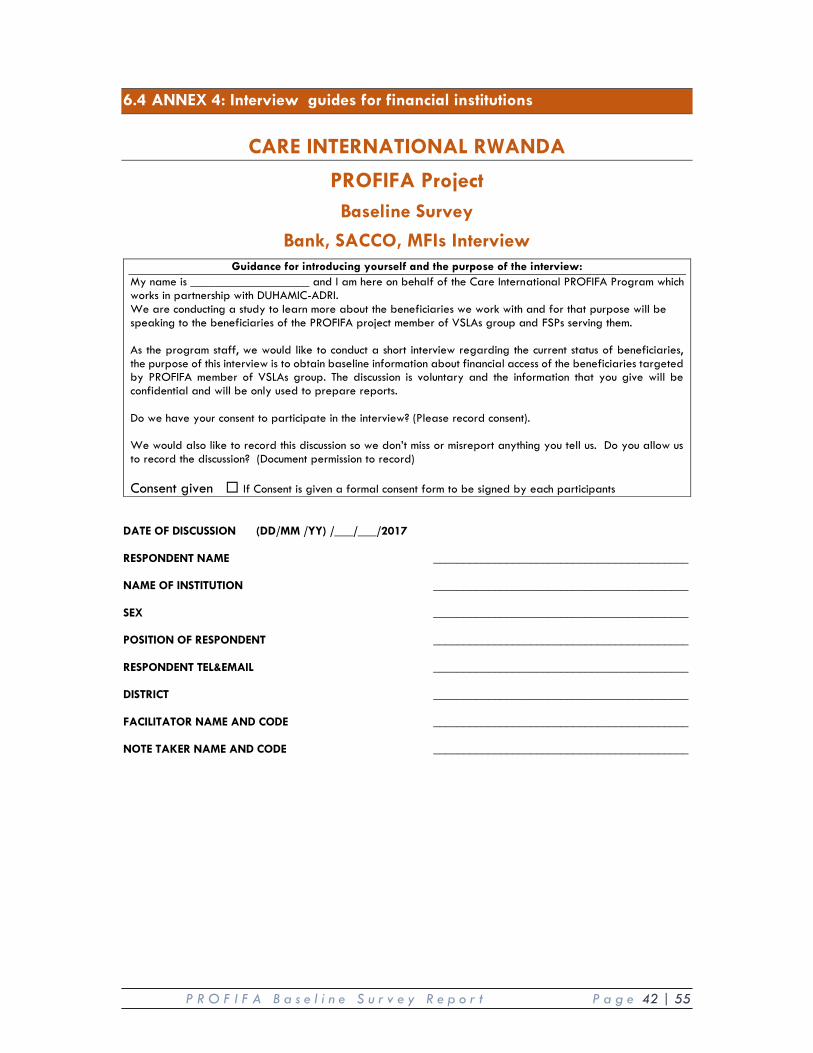
P R O F I F A B a s e l i n e S u r v e y R e p o r t P a g e 42 | 55
6.4 ANNEX 4: Interview guides for financial institutions
CARE INTERNATIONAL RWANDA
PROFIFA Project Baseline Survey
Bank, SACCO, MFIs Interview Guidance for introducing yourself and the purpose of the interview:
My name is ___________________ and I am here on behalf of the Care International PROFIFA Program which works in partnership with DUHAMIC-ADRI. We are conducting a study to learn more about the beneficiaries we work with and for that purpose will be speaking to the beneficiaries of the PROFIFA project member of VSLAs group and FSPs serving them. As the program staff, we would like to conduct a short interview regarding the current status of beneficiaries, the purpose of this interview is to obtain baseline information about financial access of the beneficiaries targeted by PROFIFA member of VSLAs group. The discussion is voluntary and the information that you give will be confidential and will be only used to prepare reports. Do we have your consent to participate in the interview? (Please record consent). We would also like to record this discussion so we don’t miss or misreport anything you tell us. Do you allow us to record the discussion? (Document permission to record) Consent given � If Consent is given a formal consent form to be signed by each participants
DATE OF DISCUSSION (DD/MM /YY) /___/___/2017 RESPONDENT NAME __________________________________________ NAME OF INSTITUTION __________________________________________ SEX __________________________________________ POSITION OF RESPONDENT __________________________________________ RESPONDENT TEL&EMAIL __________________________________________ DISTRICT __________________________________________ FACILITATOR NAME AND CODE __________________________________________ NOTE TAKER NAME AND CODE __________________________________________
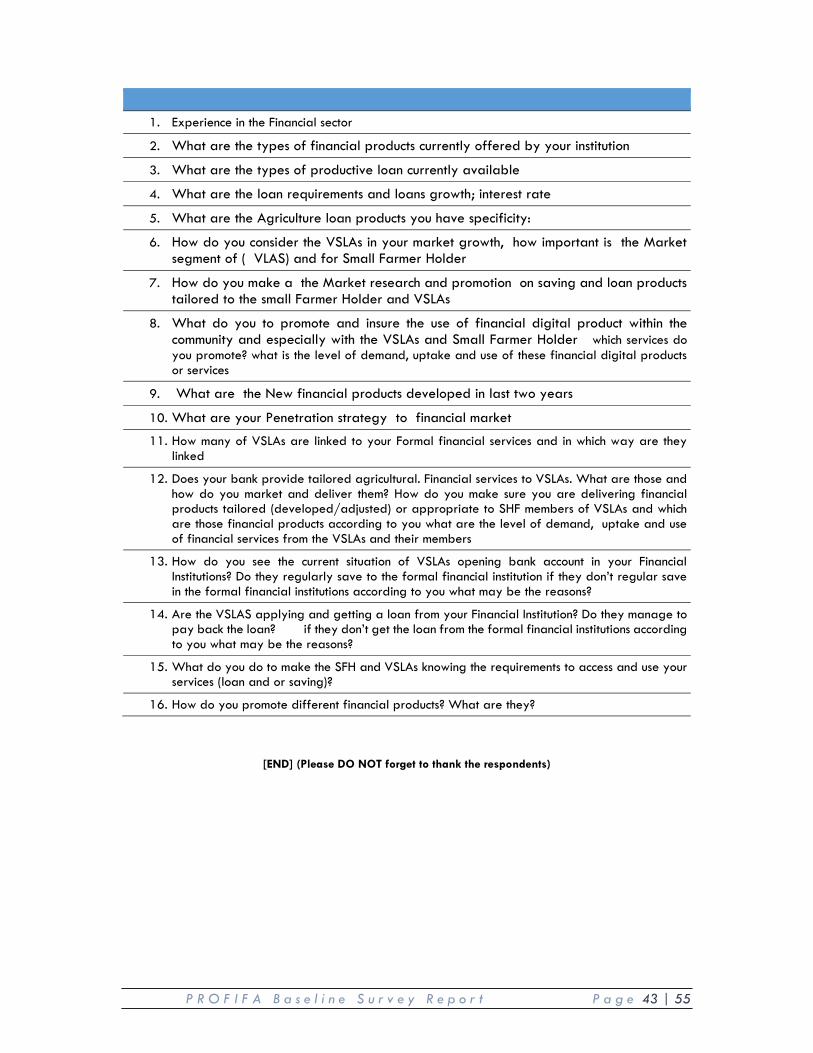
P R O F I F A B a s e l i n e S u r v e y R e p o r t P a g e 43 | 55
1. Experience in the Financial sector
2. What are the types of financial products currently offered by your institution
3. What are the types of productive loan currently available
4. What are the loan requirements and loans growth; interest rate
5. What are the Agriculture loan products you have specificity:
6. How do you consider the VSLAs in your market growth, how important is the Market segment of ( VLAS) and for Small Farmer Holder
7. How do you make a the Market research and promotion on saving and loan products tailored to the small Farmer Holder and VSLAs
8. What do you to promote and insure the use of financial digital product within the community and especially with the VSLAs and Small Farmer Holder which services do you promote? what is the level of demand, uptake and use of these financial digital products or services
9. What are the New financial products developed in last two years
10. What are your Penetration strategy to financial market
11. How many of VSLAs are linked to your Formal financial services and in which way are they linked
12. Does your bank provide tailored agricultural. Financial services to VSLAs. What are those and how do you market and deliver them? How do you make sure you are delivering financial products tailored (developed/adjusted) or appropriate to SHF members of VSLAs and which are those financial products according to you what are the level of demand, uptake and use of financial services from the VSLAs and their members
13. How do you see the current situation of VSLAs opening bank account in your Financial Institutions? Do they regularly save to the formal financial institution if they don’t regular save in the formal financial institutions according to you what may be the reasons?
14. Are the VSLAS applying and getting a loan from your Financial Institution? Do they manage to pay back the loan? if they don’t get the loan from the formal financial institutions according to you what may be the reasons?
15. What do you do to make the SFH and VSLAs knowing the requirements to access and use your services (loan and or saving)?
16. How do you promote different financial products? What are they?
[END] (Please DO NOT forget to thank the respondents)
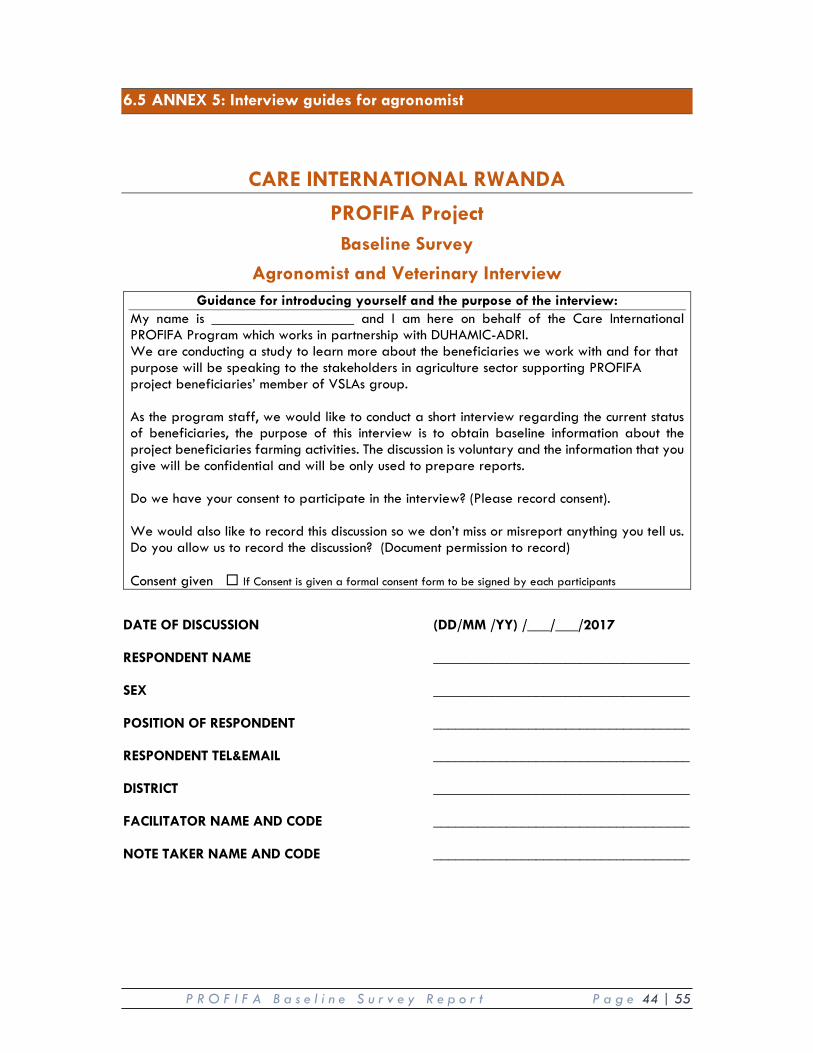
P R O F I F A B a s e l i n e S u r v e y R e p o r t P a g e 44 | 55
6.5 ANNEX 5: Interview guides for agronomist
CARE INTERNATIONAL RWANDA
PROFIFA Project Baseline Survey
Agronomist and Veterinary Interview Guidance for introducing yourself and the purpose of the interview:
My name is ___________________ and I am here on behalf of the Care International PROFIFA Program which works in partnership with DUHAMIC-ADRI. We are conducting a study to learn more about the beneficiaries we work with and for that purpose will be speaking to the stakeholders in agriculture sector supporting PROFIFA project beneficiaries’ member of VSLAs group. As the program staff, we would like to conduct a short interview regarding the current status of beneficiaries, the purpose of this interview is to obtain baseline information about the project beneficiaries farming activities. The discussion is voluntary and the information that you give will be confidential and will be only used to prepare reports. Do we have your consent to participate in the interview? (Please record consent). We would also like to record this discussion so we don’t miss or misreport anything you tell us. Do you allow us to record the discussion? (Document permission to record) Consent given � If Consent is given a formal consent form to be signed by each participants
DATE OF DISCUSSION (DD/MM /YY) /___/___/2017 RESPONDENT NAME ___________________________________ SEX ___________________________________ POSITION OF RESPONDENT ___________________________________ RESPONDENT TEL&EMAIL ___________________________________ DISTRICT ___________________________________ FACILITATOR NAME AND CODE ___________________________________ NOTE TAKER NAME AND CODE ___________________________________
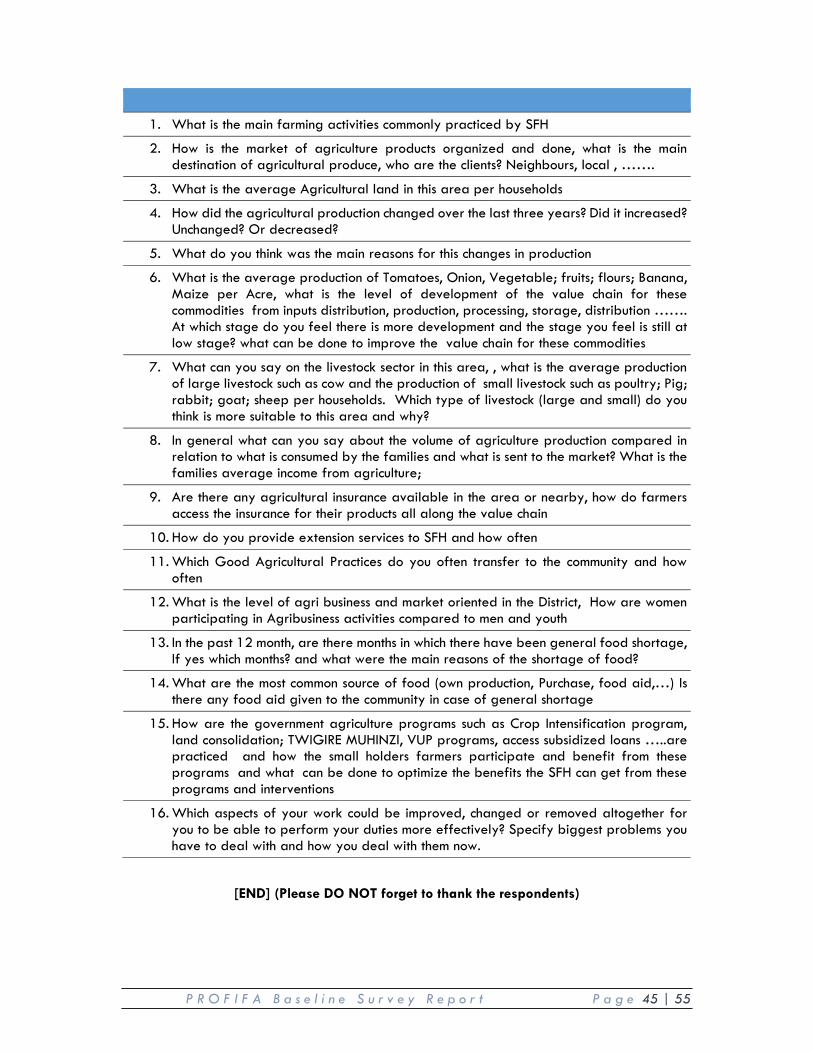
P R O F I F A B a s e l i n e S u r v e y R e p o r t P a g e 45 | 55
1. What is the main farming activities commonly practiced by SFH
2. How is the market of agriculture products organized and done, what is the main destination of agricultural produce, who are the clients? Neighbours, local , …….
3. What is the average Agricultural land in this area per households
4. How did the agricultural production changed over the last three years? Did it increased? Unchanged? Or decreased?
5. What do you think was the main reasons for this changes in production
6. What is the average production of Tomatoes, Onion, Vegetable; fruits; flours; Banana, Maize per Acre, what is the level of development of the value chain for these commodities from inputs distribution, production, processing, storage, distribution ……. At which stage do you feel there is more development and the stage you feel is still at low stage? what can be done to improve the value chain for these commodities
7. What can you say on the livestock sector in this area, , what is the average production of large livestock such as cow and the production of small livestock such as poultry; Pig; rabbit; goat; sheep per households. Which type of livestock (large and small) do you think is more suitable to this area and why?
8. In general what can you say about the volume of agriculture production compared in relation to what is consumed by the families and what is sent to the market? What is the families average income from agriculture;
9. Are there any agricultural insurance available in the area or nearby, how do farmers access the insurance for their products all along the value chain
10. How do you provide extension services to SFH and how often
11. Which Good Agricultural Practices do you often transfer to the community and how often
12. What is the level of agri business and market oriented in the District, How are women participating in Agribusiness activities compared to men and youth
13. In the past 12 month, are there months in which there have been general food shortage, If yes which months? and what were the main reasons of the shortage of food?
14. What are the most common source of food (own production, Purchase, food aid,…) Is there any food aid given to the community in case of general shortage
15. How are the government agriculture programs such as Crop Intensification program, land consolidation; TWIGIRE MUHINZI, VUP programs, access subsidized loans …..are practiced and how the small holders farmers participate and benefit from these programs and what can be done to optimize the benefits the SFH can get from these programs and interventions
16. Which aspects of your work could be improved, changed or removed altogether for you to be able to perform your duties more effectively? Specify biggest problems you have to deal with and how you deal with them now.
[END] (Please DO NOT forget to thank the respondents)
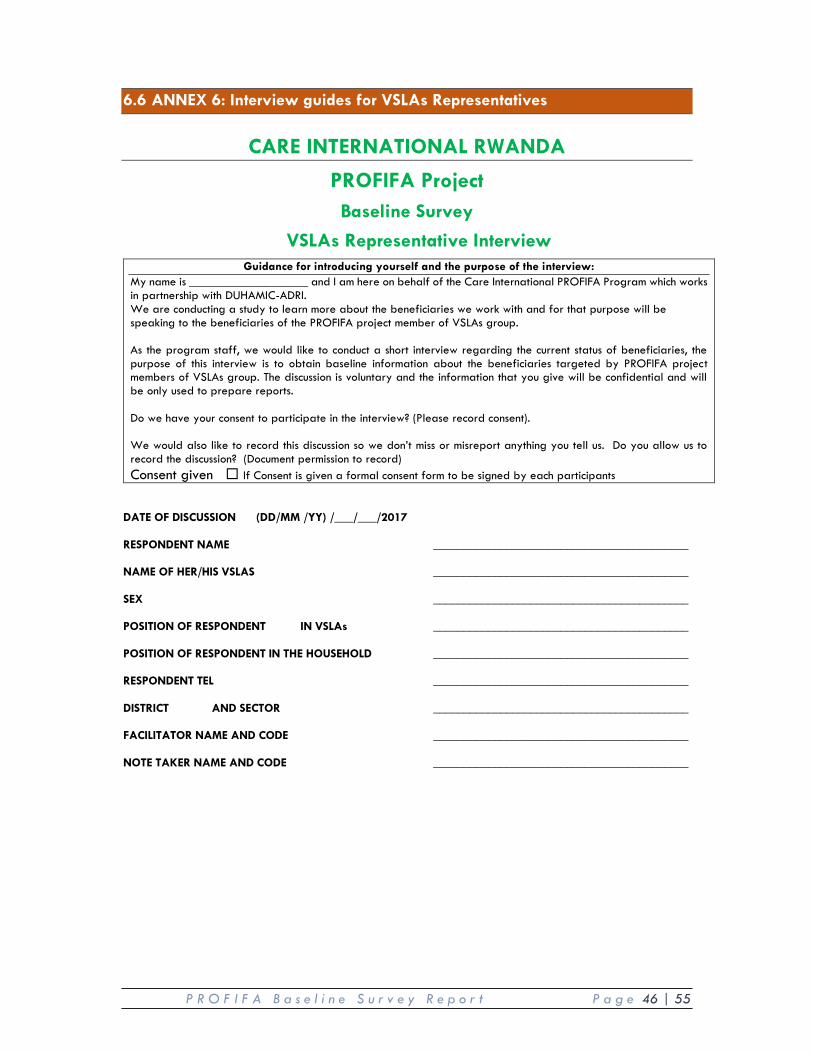
P R O F I F A B a s e l i n e S u r v e y R e p o r t P a g e 46 | 55
6.6 ANNEX 6: Interview guides for VSLAs Representatives
CARE INTERNATIONAL RWANDA
PROFIFA Project Baseline Survey
VSLAs Representative Interview Guidance for introducing yourself and the purpose of the interview:
My name is ___________________ and I am here on behalf of the Care International PROFIFA Program which works in partnership with DUHAMIC-ADRI. We are conducting a study to learn more about the beneficiaries we work with and for that purpose will be speaking to the beneficiaries of the PROFIFA project member of VSLAs group. As the program staff, we would like to conduct a short interview regarding the current status of beneficiaries, the purpose of this interview is to obtain baseline information about the beneficiaries targeted by PROFIFA project members of VSLAs group. The discussion is voluntary and the information that you give will be confidential and will be only used to prepare reports. Do we have your consent to participate in the interview? (Please record consent). We would also like to record this discussion so we don’t miss or misreport anything you tell us. Do you allow us to record the discussion? (Document permission to record) Consent given � If Consent is given a formal consent form to be signed by each participants
DATE OF DISCUSSION (DD/MM /YY) /___/___/2017 RESPONDENT NAME __________________________________________ NAME OF HER/HIS VSLAS __________________________________________ SEX __________________________________________ POSITION OF RESPONDENT IN VSLAs __________________________________________ POSITION OF RESPONDENT IN THE HOUSEHOLD __________________________________________ RESPONDENT TEL __________________________________________ DISTRICT AND SECTOR __________________________________________ FACILITATOR NAME AND CODE __________________________________________ NOTE TAKER NAME AND CODE __________________________________________
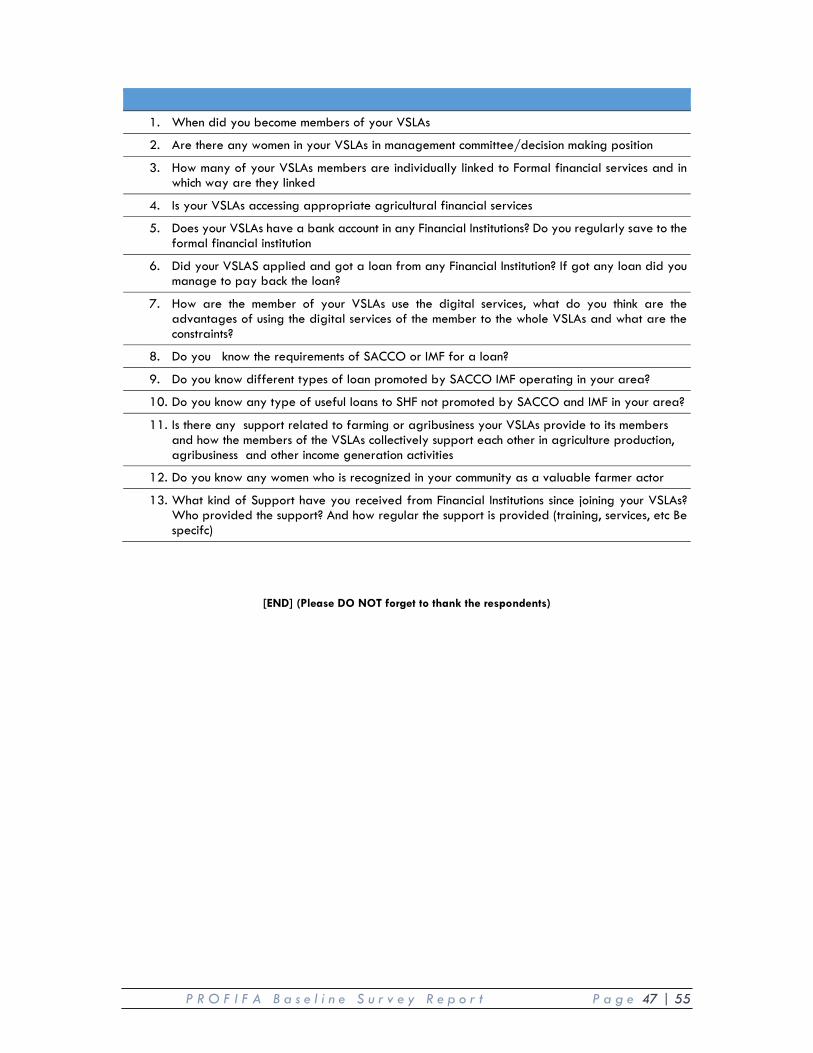
P R O F I F A B a s e l i n e S u r v e y R e p o r t P a g e 47 | 55
1. When did you become members of your VSLAs
2. Are there any women in your VSLAs in management committee/decision making position
3. How many of your VSLAs members are individually linked to Formal financial services and in which way are they linked
4. Is your VSLAs accessing appropriate agricultural financial services
5. Does your VSLAs have a bank account in any Financial Institutions? Do you regularly save to the formal financial institution
6. Did your VSLAS applied and got a loan from any Financial Institution? If got any loan did you manage to pay back the loan?
7. How are the member of your VSLAs use the digital services, what do you think are the advantages of using the digital services of the member to the whole VSLAs and what are the constraints?
8. Do you know the requirements of SACCO or IMF for a loan?
9. Do you know different types of loan promoted by SACCO IMF operating in your area?
10. Do you know any type of useful loans to SHF not promoted by SACCO and IMF in your area?
11. Is there any support related to farming or agribusiness your VSLAs provide to its members and how the members of the VSLAs collectively support each other in agriculture production, agribusiness and other income generation activities
12. Do you know any women who is recognized in your community as a valuable farmer actor
13. What kind of Support have you received from Financial Institutions since joining your VSLAs? Who provided the support? And how regular the support is provided (training, services, etc Be specifc)
[END] (Please DO NOT forget to thank the respondents)