Embed Size (px)
Citation preview

Ip challenge
Ref: https://www.humanrights.gov.au/sites/default/files/content/social_justice/sj_report/sjreport08/downloads/chap3.pdf
Indigenous Disadvantage
While the East Kimberley is rich in natural resources, its Aboriginal population experiences significant disadvantage, particularly relative to its non-Aboriginal population. The figures below come from the 2011 Census:
East Kimberley
National rate
AboriginalNon-Aboriginal
Completed Year 12 17.5% 54% 54%
Bachelor or post-graduate degree 1% 19% 15%
In a real job* 25% 87% 58%
Not in the labour force 60% 12% 35%
≥ 8 residents in house 14% 0% 0.3%
Homes owned or mortgaged 10% 41% 68%
Median person income/week $280 $1050 $577
*This does not include people engaged in Community Development Employment Projects (CDEP)

Other sources reveal that relative to the region’s non-Aboriginal population and overall Australian population, the Aboriginal population in the East Kimberley experiences significantly higher rates of: chronic diseases such as cardiovascular disease and diabetes; foetal alcohol spectrum disorders; incarceration; substance abuse; and suicide. Consequently, the median Aboriginal male in the region dies up to 30 years earlier than his non-Aboriginal counterpart.
While Aboriginal wellbeing has improved over the last decade, the disadvantage experienced by many Aboriginal families in the region remains unacceptable and pace of change is too slow. With 55% of the Aboriginal population in the East Kimberley aged under 25 years, it is critical that more effective action is taken now to improve Aboriginal wellbeing.
The complex, inter-related causes of this situation are well documented elsewhere and include the intergenerational legacy of colonisation, dispossession, dislocation, racism, inadequate infrastructure and services, and introduction of alcohol and welfare. Wunan is conscious of these factors but focused on pragmatic initiatives that enable Aboriginal success into the future.
You can download here a more detailed analysis of the 2011 Census figures and progress on “Closing the Gap” in the East Kimberley.
The following extract from the ANU Centre for Aboriginal Economic Policy Research report, “Aboriginal Population Profiles for Development Planning in the Northern East Kimberley” (Taylor, 2003), succinctly puts forward the case for the role of Wunan Foundation:
“If social and economic conditions for Aboriginal people remain the same as currently experienced, then the cost to government in providing income support and other welfare payments, as well as program support in areas of health, housing and CDEP in particular, will escalate over time…
..in line with the growth in the working age population. On the other hand, if Aboriginal people had more jobs at higher occupational levels, then, from their own incomes, they would be able to meet many of the basic needs that governments now provide for. Some estimate of the opportunity cost to government of simply continuing business as usual is provided here (in the report) in the form of welfare dependency rates and associated estimates of dollar amounts. What is not costed, though, is the

potentially greater public impost of excess disease burden, infrastructure replacement, and foregone educational outcomes due to the continued and growing marginalisation of Aboriginal people within the regional economy. It is important to recognise that the policy options for addressing this situation are not cost neutral – expenditure will grow either in response to declining economic status, or in order to enhance it. Whatever the case, a fiscal response is unavoidable.”
Addressing the challenge
There is a clear and obvious need to improve socio-economic outcomes for Aboriginal people in the East Kimberley. While this unacceptable situation is widely recognised, scant attention has been paid to ensuring the development of effective and robust organisations that are capable of partnering with government and the private sector to effectively implement new initiatives.
A critical component of such an approach is the ability of long-term local institutions to harness and coordinate resources from outside the region to achieve effective solutions on the ground in the East Kimberley.
Wunan has a demonstrated track record of successfully implementing projects that create pathways for Indigenous people to achieve tangible outcomes and improved life choices.
Wunan continues to develop its capacity and capabilities as it implements its agenda for change. Wunan’s strong Foundation both enables and ensures the long term success of the other strategic priorities of our mission:
Education – Ensuring all children receive a good education that affords them opportunity and life choices
Employment – Delivering direct employment and training outcomes for Aboriginal people to grow independent income-earning capacity and reduce welfare dependency.
Accommodation – Providing housing solutions that underpin family stability, employment and educational opportunities.
Living Change – A community-led initiative that seeks to enable Aboriginal people in the East Kimberley to lead a life that they value, reduce welfare dependency and the ability to choose their future.
Today, a key objective for Wunan is to shift the balance of dependence of Aboriginal people on welfare from 80% to 20% over 20 years. This objective is based on a clear guiding philosophy that Aboriginal success grows from investing in people’s ability, real opportunity and reward for effort.
The Challenge
Indigenous Disadvantage
Addressing The Challenge

The Wunan/East Kimberley Region
PDF Downloads
Wunan Fact Sheet (424KB)
How you can help
Help us create a positive future for Aboriginal people in the East Kimberley - every donation makes a difference.
FIND OUT MORE
SIGN UP FOR OUR NEWSLETTER
GO
© Copyright 2016 Wunan Foundation. All rights reserved. Site created by Make It Happen
Ref: http://wunan.org.au/disadvantage
2016
Survey Analysis for Indigenous Policy in Australia
Boyd Hunter, Nicholas Biddle (Editors)
1. Download this book
2. First page
← previous next →
7. The benefits of Indigenous education: Data findings and data gaps
Nicholas Biddle and Timothy Cameron
Although the headline target for the Council of Australian Governments (COAG) Closing the Gap agenda is the elimination of the life expectancy gap between Indigenous and non-Indigenous Australians, in numerical terms, education dominates with three of the six targets related to it. This includes targets related

3. Cover
4. Title page
5. Imprint and copyright information
6. Abbreviatio ns and acronyms
7. List of tables
8. List of figures
9. Acknowled gements
10. Contributor s
11. 1. Towards a broader understanding of Indigenous disadvantage
12. 2. Mobile people, mobile measures: Limitations and opportunities for
to preschool access (Target 3), literacy and numeracy (Target 4) and Year 12 completion (Target 5). The setting of these targets clearly recognises that not only is education important in and of itself, but without reducing disparities between Indigenous and non-Indigenous Australians in education, other targets on health and employment are unlikely to be met.
Closing the gap between Indigenous and non-Indigenous Australians in education outcomes will not be easy. To indicate the scale of the challenge, consider findings from the most recent (2006) Census. First, 47.8 per cent of Indigenous 3–5 year olds (who had not started school) were attending preschool compared to 57.5 per cent of non-Indigenous children. Across the Indigenous lifecourse, this gap only widens. By age 20–24, 36.0 per cent of Indigenous Australians (who were not still at school) had completed Year 12 compared to 74.5 per cent of non-Indigenous Australians. For all education types, 34.5 per cent of Indigenous 15–24 year olds were undertaking education compared to 55.3 per cent of non-Indigenous young adults.
One potential reason for this education disparity is physical and financial access. Biddle (2010) showed that Indigenous youth were more likely to live in remote areas than their non-Indigenous counterparts and that within the Indigenous population there were substantial disparities by region in terms of education participation and attainment. Furthermore, on average Indigenous Australians grow up in families with fewer material resources meaning that financially it is more difficult to attend relatively expensive private schools (Biddle and Yap 2010).
While important, the above financial and geographic disparities alone do not explain the gap in education attendance and attainment between Indigenous and non-Indigenous Australians. In all regions, including Australia’s largest capital cities, Indigenous Australians had lower levels of education than their non-Indigenous counterparts (Biddle 2010). Biddle (2007) also showed that the gap between the two populations in terms of participation also remained after controlling for family income, employment and education. Access is not the only issue driving the disparity in education between the two populations. For most Indigenous youth there is usually one high school or a tertiary institution available relatively close by that is free or, in the case of universities, may be paid for later in life. For many Indigenous youth, it would appear that the benefits of engaging

mobility analysis
13. 3. Fertility and the demography of Indigenous Australians: What can the NATSISS 2008 tell us?
14. 4. Does the 2008 NATSISS underestimate the prevalence of high risk Indigenous drinking?
15. 5. Improving Indigenous health: Are mainstream determinants sufficient?
16. 6. What shapes the development of Indigenous
with these educational opportunities do not outweigh the costs.
To a certain extent, the choice being made by some Indigenous youth to not participate in formal education should be respected. There are many activities outside the non-Indigenous mainstream that do not require extended formal education. If an Indigenous youth or their family does not see later secondary school or post-school education as being worthwhile, then compelling them to attend is likely to be counterproductive. Not only will the negative effects outweigh the positive, but students who do not want to be at school can have a detrimental effect on those who do. However, if these students are opting out of school or post-school options without full information, then this is potential grounds for government intervention. Furthermore, it is also of concern if childhood and early school experiences are having an undue influence on the choices available to Indigenous Australians when they are considering their education options.
Ultimately, the policy response to low education participation by Indigenous Australians will be determined by the reasons why Indigenous Australians make alternative education decisions and the constraints that they face in making these decisions. Unfortunately, the data available to analyse these decisions is far from perfect. There is no longitudinal data that allows analysis of the effect of early childhood experiences on later school choice. However, we know from other contexts that the early years are crucial in determining future educational options and constraints (Cunha et al. 2006). We also do not have information for estimating accurate returns to education for Indigenous Australians, information which is crucial when trying to gauge whether economic incentives are driving the education decision.
In situations such as these where data is lacking, it is important to have a solid theoretical model, based on empirical research in other contexts but also informed by the unique circumstances of the Indigenous population. Such a model will help to identify the likely impacts on the education decision, the key research questions that need to be answered, and the data required to answer the questions. In the next section of the paper, we outline the beginnings of such a model and pose two research questions that will guide the analysis in this paper.
children?
17. 7. The benefits of Indigenous education: Data findings and data gaps
18. 8. What are the factors determining Indigenous labour market outcomes?
19. 9. The Indigenous hybrid economy: Can the NATSISS adequately recognise difference?
20. 10. Is Indigenous poverty different from other poverty?
21. 11. Is there
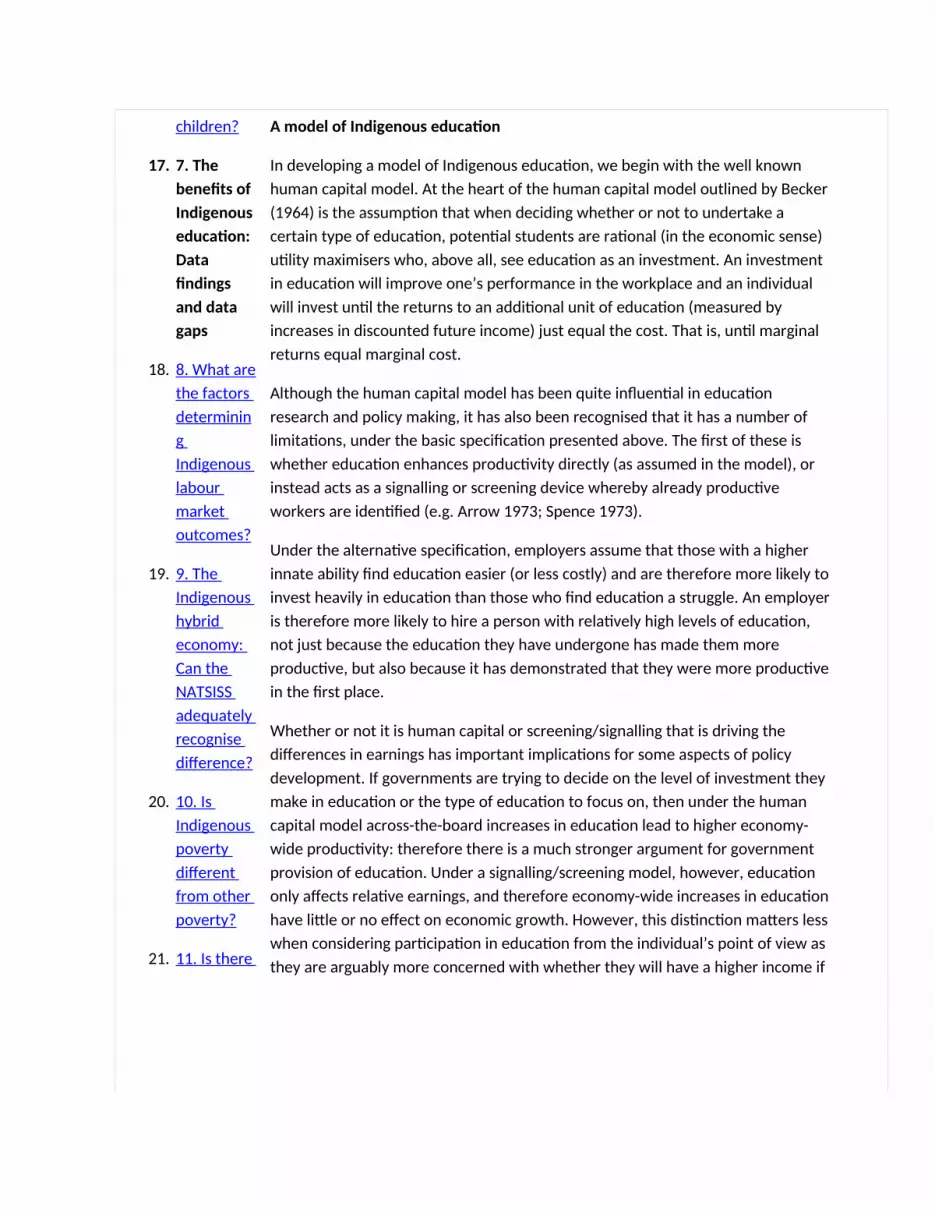
A model of Indigenous education
In developing a model of Indigenous education, we begin with the well known human capital model. At the heart of the human capital model outlined by Becker (1964) is the assumption that when deciding whether or not to undertake a certain type of education, potential students are rational (in the economic sense) utility maximisers who, above all, see education as an investment. An investment in education will improve one’s performance in the workplace and an individual will invest until the returns to an additional unit of education (measured by increases in discounted future income) just equal the cost. That is, until marginal returns equal marginal cost.
Although the human capital model has been quite influential in education research and policy making, it has also been recognised that it has a number of limitations, under the basic specification presented above. The first of these is whether education enhances productivity directly (as assumed in the model), or instead acts as a signalling or screening device whereby already productive workers are identified (e.g. Arrow 1973; Spence 1973).
Under the alternative specification, employers assume that those with a higher innate ability find education easier (or less costly) and are therefore more likely to invest heavily in education than those who find education a struggle. An employer is therefore more likely to hire a person with relatively high levels of education, not just because the education they have undergone has made them more productive, but also because it has demonstrated that they were more productive in the first place.
Whether or not it is human capital or screening/signalling that is driving the differences in earnings has important implications for some aspects of policy development. If governments are trying to decide on the level of investment they make in education or the type of education to focus on, then under the human capital model across-the-board increases in education lead to higher economy-wide productivity: therefore there is a much stronger argument for government provision of education. Under a signalling/screening model, however, education only affects relative earnings, and therefore economy-wide increases in education have little or no effect on economic growth. However, this distinction matters less when considering participation in education from the individual’s point of view as they are arguably more concerned with whether they will have a higher income if

a cultural explanation for Indigenous violence? A second look at the NATSISS
22. 12. NATSISS crowding data: What does it assume and how can we challenge the orthodoxy?
23. 13. Do traditional culture and identity promote the wellbeing of Indigenous Australians? Evidence from the 2008 NATSISS
24. 14. A mile wide, inch deep: The future for
they study, rather than the source of that higher income.
The basic human capital model also assumes that a person’s utility is determined mainly by their income, and if discounted future additional income is higher than the cost of education, then people will invest in education. It is likely, though, that a student’s current social situation is also important in influencing their behaviour. Specifically, children who have positive attitudes to school when they are in the middle secondary years are more inclined to further school participation. They are more likely to intend completing Year 12 and consequently are also more likely to actually do so (Khoo and Ainley 2005; Marks 1998). Students who do not like school are more likely to leave without completing their secondary education (Wehlage and Rutter 1986) and children who are happy in the later years of secondary school are more likely to complete university (Dockery 2010).
Despite the above research, there is a lack of literature relating happiness at school to school completion rates both on the whole, and especially with respect to Indigenous Australians. Most literature linking education and happiness tells the other side of the story: how education affects future happiness. Higher levels of education lead to, on average, higher future incomes but it has been shown that education correlates weakly with happiness scores in rich countries (Hartog and Oosterbeek 1998). A recent study shows that Australian university graduates, despite their improved labour market outcomes, have lower levels of happiness compared to those that have only completed Year 12 (Dockery 2010).
In addition to income and school-level wellbeing, there are also a number of other outcomes that are likely to be associated with higher education levels that people may take into account when deciding whether or not to invest in education. Although there are indirect effects that operate via income, education may also have direct effects on things like health, the schooling of one’s children, the efficiency of consumer choices and the ability to plan fertility decisions (Wolfe and Haveman 2001).
Finally, the human capital model assumes that potential students make decisions based on a comparison between their future income streams with and without education. However, potential students cannot know their precise future income and must therefore form expectations based on what they do know. Different students have access to different information, so it is possible that expectations

Indigenous social surveys?
25. CAEPR Research Monograph Series
are also formed differently (Dominitz and Manski 1996).
Pulling this discussion together, an economic model of Indigenous education participation would take into account the factor that Indigenous Australians start school with lower levels of cognitive and non-cognitive ability (as valued in formal education) with the gap widening throughout the early school years. When making the decision to continue on at school beyond the post-compulsory years, Indigenous students may have different potential benefits of education due to the types of labour markets they have access to. However, these returns may be estimated with uncertainty as they have relatively few role models to provide information. There are also other non-economic returns to education that may be important, but these must be traded off against different non-economic costs of schooling.
In this paper, we focus on two aspects of the education decision. The first relates to the potential benefits of studying and the second the potential social costs of studying. Specifically, we consider the following two research questions:
What are the apparent benefits – economic and non-economic – of education and do they vary by gender or remoteness?
Are Indigenous Australians happier or less happy at school than non-Indigenous Australians and do any differences change after controlling for other characteristics?
The relationship between education attainment and wellbeing
The first step is to consider the relationship between an Indigenous Australian’s level of education and a number of outcome measures. Ideally, we would like to be able to measure a return to education across a number of domains. Returns are usually calculated by comparing the benefit of education – the average difference in a particular outcome measure for a person with a given level of education and another person with a lower level of education but otherwise identical characteristics – with the cost. If this return was lower for the Indigenous population across a range of measures, then this might explain why Indigenous Australians are less likely to participate in education.
Unfortunately, it is not possible to measure such returns to education with the data available. This is because although we know what a particular outcome is for

a person with a given level of education (on average) we do not observe what their outcome would be if they had a different level of education (the counterfactual). What we can and do measure is the average difference within the Indigenous population between those with a given level of education and a separate set of individuals with a different level of education. This would be roughly equivalent to a return to education (after taking into account costs) if the level of education was the only thing that differed between the two groups. However, we know from the literature used to develop the model in the previous section, as well as analysis presented later in this chapter, that those with different levels of education also differ in important ways.
Specifically, we know from other contexts that having higher levels of cognitive and non-cognitive ability makes education easier or less costly (Card 2001). Similarly, those who are more intrinsically motivated and who value the future relatively highly are also more likely to undertake and complete education. This would not be an issue if education was the only thing that these characteristics affected. However, they are also potentially associated with a number of the outcome measures that are considered to be measures of wellbeing or that influence wellbeing directly. For example, being highly numerate makes education easier, but it also makes it easier to obtain a job whatever a person’s education levels.
If these other factors were observable, then we could control for them in the model and still estimate a return to education. However, while they are often observable to the individual making the decision, they are rarely observable to the researcher attempting to estimate a return to education. This is particularly the case with cross-sectional data. Longitudinal databases with a much greater age range than is currently available, or evaluations of policies that add a degree of randomness to the education decision, would be allow us to shed some light on this issue.
While it is not possible to calculate a return to education with currently available data, it can still be instructive to compare the average difference in outcomes by education across a number of domains of interest. This is useful for three reasons. First, although there are undoubtedly omitted variable biases when trying to estimate returns to education with cross-sectional data, they are not always large (Leigh and Ryan 2008). A simple comparison by education level can therefore identify those outcomes where returns to education are potentially high – areas

for further study with better data if/when it becomes available. Secondly, it is not clear whether individuals use such a sophisticated analysis when deciding to undertake education. It is entirely possible that they make a simple comparison between those with and without a particular qualification when making their decision.
The final reason for calculating average differences by education is that, even if returns to education are necessary for studying the education decision, when targeting policy towards adults one might still be interested in the extent to which one particular group in the population has better outcomes than another. That is, in certain contexts, policy makers are less concerned with what is causing the difference in outcomes as opposed to what types of people have relatively poor outcomes on average.
With that in mind, we calculate differences by education across eight measures/determinants of wellbeing:
employment
income for those employed
happiness: feeling happy in the past four weeks all or most of the time
sadness: feeling so sad that nothing could cheer one up at least a little bit of the time in the past four weeks
health fair/poor: reporting one’s own health as being fair or poor (as opposed to good, very good or excellent
cultural: being involved in cultural events, ceremonies or organisations in the previous 12 months
have a say: feeling that one is able to have a say within the community on important issues all or most of the time, and
raise $2 000: feeling that household members could raise $2 000 in an emergency within a week.
Differences are calculated separately by high school education and post-school qualifications. For the former, those who have completed Year 9 or less and those

who have completed Year 10 or 11 are compared separately with those who have completed Year 12. In terms of post-school qualifications, individuals are compared by their highest qualification, with those with no qualifications treated as the base case and four other qualification types compared: those with a degree or higher; those with a diploma; those with a Certificate I/II; and those with a Certificate III/IV.
Comparisons are made using a modelling framework controlling for h a limited set of variables. Other explanatory variables in the model include: age; remoteness; marital status; family type; Indigenous status of others in the household; language spoken at home and mobility. We are interested in the net relationship between education and the measures of wellbeing and hence other variables that are likely to be strongly influenced by education or which could potentially be influenced by the dependent variables are not included in the model. Separate estimates are undertaken for males and females (in Table 7.1 and Table 7.2 respectively).
For seven of the eight variables, the dependent variable is constructed as the probability of that particular event occurring (e.g. being employed as opposed to not employed). For income, on the other hand, the dependent variable is the natural log of personal income (with results converted back to linear personal income).
Table 7.1 Association between education and measures of wellbeing, Indigenous males, Australia, 2008
Explanatory variables
Employed
Income if employed
Happiness
Sadness
Health Cultural
Have a say
Raise $2 000
Aged 15–24
–0.028
–315
***
0.052
**
–0.090
***
–0.222
***
0.008
–0.128
***
–0.017

Explanatory variables
Employed
Income if employed
Happiness
Sadness
Health Cultural
Have a say
Raise $2 000
Aged 25–34
0.010
–114
***
0.041
* –0.071
***
–0.135
***
0.001
–0.071
***
–0.048
*
Aged 55 plus
–0.262
***
–67
0.052
**
–0.096
***
0.110
***
–0.008
0.051
* 0.069
***
Lives in remote Australia
0.099
***
–60
0.096
***
–0.022
–0.094
***
0.160
***
0.022
–0.056
**
Not married
–0.236
***
–384
***
0.013
–0.005
–0.046
–0.045
–0.052
0.012
Lives in a couple family with children
0.003
13 0.004
–0.030
–0.063
**
0.071
***
0.031
–0.073
**
Lives in a couple family with no children but dependents
0.053
* 109
0.003
–0.025
–0.072
* –0.063
0.151
***
–0.030

Explanatory variables
Employed
Income if employed
Happiness
Sadness
Health Cultural
Have a say
Raise $2 000
Lives in a single parent family with children
0.059
* 311
***
–0.041
–0.013
0.017
0.031
0.042
–0.154
***
Lives in a single parent family with no children but dependents
0.075
**
250
**
–0.039
0.032
0.097
* –0.010
0.067
–0.101
**
Lives in an ‘other’ family type
0.109
***
404
***
–0.103
**
0.062
0.053
–0.006
0.049
–0.113
**
Has a non-Indigenous person living in the household
0.085
***
66 * –0.011
–0.054
**
–0.025
–0.206
***
0.028
0.171
***

Explanatory variables
Employed
Income if employed
Happiness
Sadness
Health Cultural
Have a say
Raise $2 000
Main language spoken at home is not English
–0.020
–346
***
0.025
0.085
***
–0.052
* 0.156
***
0.164
***
–0.170
***
Changed usual residents in the previous five years
–0.031
* 13 –0.015
0.021
0.031
0.000
–0.061
***
–0.049
**
Completed Year 10 or 11 only
–0.111
***
–178
***
–0.012
0.023
0.010
–0.063
**
–0.037
–0.079
***
Completed Year 9 or less
–0.294
***
–278
***
–0.068
**
0.091
***
0.151
***
–0.076
***
–0.057
**
–0.199
***
Has a degree or higher as highest qualification
0.152
***
373
***
0.060
–0.026
–0.061
0.180
***
0.058
0.147
***

Explanatory variables
Employed
Income if employed
Happiness
Sadness
Health Cultural
Have a say
Raise $2 000
Has a diploma as highest qualifications
0.136
***
294
***
–0.053
0.053
–0.077
0.177
***
0.060
0.142
***
Has a Certificate I or II as highest qualification
0.056
**
139
**
0.040
–0.016
–0.003
0.098
***
0.048
0.023
Has a Certificate III or IV as highest qualification
0.142
***
218
***
0.009
–0.029
–0.058
**
0.070
***
0.046
* 0.091
***
Probability of base case
0.768 959 0.729 0.362 0.314 0.630 0.320 0.674
Pseudo/Adjusted R-Squared
0.1582 0.2681
0.0256 0.0245 0.1219 0.1103 0.0485 0.1315
Number 3 259 1 839 3 202 3 199 3 259 3 259 3,259 3,094

Explanatory variables
Employed
Income if employed
Happiness
Sadness
Health Cultural
Have a say
Raise $2 000
of observations
Note: The base case individual is: aged 35–54; lives in non-remote Australia; is married; lives in a couple family without children with Indigenous Australians only in the household; speaks English at home; and did not change usual residence in the previous 5 years.
*** Marginal effect for which the coefficient is statistically significant at the 1% level of significance.
** Marginal effect for which the coefficient is statistically significant at the 5% level of significance.
* Marginal effect for which the coefficient is statistically significant at the 10% level of significance.
Source: Customised calculations using the 2008 NATSISS
Table 7.2 Association between education and measures of wellbeing, Indigenous females, Australia, 2008

Explanatory variables
Employed
Income if employed
Happiness
Sadness
Health Cultural
Have a say
Raise $2 000
Aged 15–24
–0.169
***
–270
***
0.050
**
–0.032
–0.155
***
-0.042
* -0.101
***
-0.027
Aged 25–34
–0.086
***
–25
0.017
–0.035
* –0.111
***
-0.041
**
-0.066
***
-0.025
Aged 55 plus
–0.315
***
–77
**
0.080
***
–0.101
***
0.071
***
-0.031
0.056
**
0.117
***
Lives in remote Australia
0.099
***
38 0.078
***
0.000
–0.065
***
0.138
***
-0.005
-0.018
Not married
0.096
***
–209
***
0.006
0.025
–0.022
0.035
-0.013
0.018
Lives in a couple family with children
–0.103
***
–72
**
0.033
–0.038
–0.027
0.045
* -0.017
-0.072
***
Lives in a couple family with no
–0.018
9 0.036
0.004
0.010
-0.044
0.012
0.073
*

Explanatory variables
Employed
Income if employed
Happiness
Sadness
Health Cultural
Have a say
Raise $2 000
children but dependents
Lives in a single parent family with children
–0.272
***
333
***
–0.039
0.008
0.029
-0.052
0.055
-0.207
***
Lives in a single parent family with no children but dependents
–0.118
**
233
***
–0.007
0.004
0.055
-0.055
0.046
-0.191
***
Lives in an ‘other’ family type
–0.135
***
323
***
–0.025
–0.004
0.093
**
-0.082
* 0.032
-0.128
***
Has a non-Indigenou
0.125
***
–59
**
0.024
–0.056
***
–0.016
-0.186
***
0.047
**
0.178
***

Explanatory variables
Employed
Income if employed
Happiness
Sadness
Health Cultural
Have a say
Raise $2 000
s person living in the household
Main language spoken at home is not English
–0.020
–189
***
0.063
***
0.028
–0.023
0.092
***
0.100
***
-0.186
***
Changed usual residents in the previous five years
–0.049
***
26 –0.043
***
0.058
***
0.009
0.023
-0.024
-0.079
***
Completed Year 10 or 11 only
–0.136
***
–106
***
–0.039
* 0.067
***
0.043
* -0.025
-0.024
-0.119
***
Completed Year 9 or less
–0.317
***
–188
***
–0.122
***
0.120
***
0.147
***
-0.074
***
-0.085
***
-0.260
***
Has a degree or
0.259
**
382
**
–0.0
–0.0
–0.0
* 0.173
**
0.119
**
0.183
**

Explanatory variables
Employed
Income if employed
Happiness
Sadness
Health Cultural
Have a say
Raise $2 000
higher as highest qualification
* * 39 28 58 * * *
Has a diploma as highest qualifications
0.225
***
357
***
0.033
–0.084
**
–0.052
* 0.150
***
0.137
***
0.093
***
Has a Certificate I or II as highest qualification
0.110
***
57 0.013
0.050
* 0.030
-0.002
0.066
**
-0.006
Has a Certificate III or IV as highest qualification
0.236
***
180
***
0.040
* –0.030
–0.048
**
0.109
***
0.071
***
0.114
***
Probability of base case
0.649 717 0.710 0.391 0.263 0.689 0.283 0.664
Pseudo/ 0.1814 0.286 0.0257 0.0212 0.0855 0.0813 0.0337 0.1614

Explanatory variables
Employed
Income if employed
Happiness
Sadness
Health Cultural
Have a say
Raise $2 000
Adjusted R-Squared
6
Number of observations
4 303 1 751 4 256 4 249 4 303 4 303 4,303 4,051
Note: The base case individual is: aged 35–54; lives in non-remote Australia; is married; lives in a couple family without children with Indigenous Australians only in the household; speaks English at home; and did not change usual residence in the previous 5 years.
*** Marginal effect for which the coefficient is statistically significant at the 1% level of significance.
** Marginal effect for which the coefficient is statistically significant at the 5% level of significance.
* Marginal effect for which the coefficient is statistically significant at the 10% level of significance.
Source: Customised calculations using the 2008 NATSISS
Beginning in the first column of Table 7.1 and Table 7.2, Indigenous males and females are both more likely to be employed if they have relatively high levels of education. This is not necessarily a causal effect as those who would otherwise be more likely to be employed are more likely to undertake education. However, it does show that if COAG is to meet its target on halving the gap in employment outcomes between Indigenous and non-Indigenous Australians, then the

employment rate of the relatively low skilled will probably need to be raised by the largest proportion.
There appears to be greater variation in employment by education for females, particularly by post-school qualifications. This is a consistent finding across the literature and probably reflects the fact that females still tend to take on a greater childcare role, care within the community, and unpaid work in general (Biddle and Yap 2010). As shown in the second column of results, in deciding whether or not to work in addition or instead of providing care, the opportunity cost of not working is higher for females with relatively high levels of education.
For those who were working, there was a greater difference by education in terms of personal income for males rather than females, particularly at the lower end of the education distribution. This is explained once again by higher levels of caring responsibilities and unpaid work for females, with those females with low skills and low income having lower opportunity costs if they opt out of employment.
There is a somewhat different association between education and the two measures of emotional wellbeing for males and females. For both sexes, higher levels of education are associated with higher levels of emotional wellbeing. However, not all levels of education have an association. For males, the only differences are between those who have completed Year 9 or less and the rest of the population. For females on the other hand, those who have completed Year 10 or 11 also have lower levels of emotional wellbeing than those who have completed Year 12. Furthermore, having a diploma was associated with a lower level of sadness than having no qualification at all, whereas having a Certificate I/II was actually associated with a higher level of sadness (albeit at the 10% level of significance only). In addition to emotional wellbeing, there is also a greater health gradient for Indigenous females with regards to reporting one’s health as fair or poor (in terms of statistical significance in particular).
Ultimately, all three of these measures of wellbeing are lower for those with relatively low levels of education, as is the probability of participating in cultural events, ceremonies and organisations. Undertaking formal education may impose significant social and emotional costs on Indigenous Australians (though as discussed later in this chapter, the empirical evidence for this is mixed). However, it would appear from these results that those Indigenous adults who have

completed formal education are on average happier, less sad, have better health and are more likely to engage in Indigenous cultural activities.
Perhaps the biggest difference by gender in terms of the association between the measures of wellbeing and education is with regard to the ability with which individuals feel they are able to have a say within the community on important issues. For males, those who have completed Year 9 or less have lower levels of this measure of efficacy than those who have completed Year 12. There are small differences by qualifications but these tend to not be significant or only significant at the 10% level of significance. For females on the other hand, the differences by qualification are large and consistently significant. It is possible that those who would otherwise have a high sense of efficacy are more likely to undertake education in the first place. Nonetheless, the results presented in this section give qualified support to the view that prestige or stature within one’s community is one of the motivating factors in undertaking education for the Indigenous population.
The final outcome included in Table 7.1 and Table 7.2 is whether or not a person feels that their household could raise $2 000 within a week in an emergency. This measure of financial security is much higher for those with relatively high levels of education, with differences slightly larger for females compared to males. There are three potential causal explanations for this. Firstly, those with higher levels of education have greater income and wealth. Secondly, those with higher levels of education are more likely to be married to someone who also has relatively high levels of education (so called assortative mating, see Mare 1991), compounding the income effect at the household level. Finally, those with higher levels of education may be more likely to plan their finances and seek alternative forms of credit beyond household income. However, there is also a possible reverse causal effect associated with this variable – with those with greater financial security growing up within their household and within their wider social networks better able to undertake education. Whatever the explanation, those with lower levels of education are much less likely to feel financially secure than those who have completed Year 12 or have qualifications.
In general, the results presented in Table 7.1 and Table 7.2 show a large association between education and a number of outcome measures. It is unfortunate that we cannot be more definitive with regards to the causal direction of these associations. However, one of the more consistent findings

from the analysis here is that there is a much greater education gradient for females for many of the wellbeing measures analysed. Putting this another way, Indigenous females may need to have a higher level of education than an Indigenous male to have the same level of wellbeing. If this is causal and Indigenous females take this into account when making education decisions, then this may be a reason for the generally higher levels of education participation amongst Indigenous females outlined in Biddle (2010) and demonstrated in later sections of this paper.
Factors associated with school happiness and expectations
Results presented in the previous section suggested one potential explanation for variation within the Indigenous population in terms of education participation. Differences by education in terms of social outcomes were higher for females than males, as is education participation. However, this does not explain why Indigenous Australians are less likely to undertake education compared to the non-Indigenous population. For this, we need to consider school and family background characteristics.
We now look at one aspect of school participation results by analysing the factors associated with an index of school happiness. This index is calculated based on a factor analysis of seven variables in the Longitudinal Survey of Australian Youth (LSAY) and scaled to have a mean of zero and a standard deviation of one. However, it should be noted that results do not change qualitatively if any of the single variables that are used to construct the index are used instead.
The main aim of the analysis in this section is to test whether Indigenous Australians have a higher or lower index value than non-Indigenous Australians indicating that, at the age of 15 at least, they are more or less happy at school. To test for this, the first model includes basic demographic information only. The discussion in the second section of this paper outlined how in previous research socioeconomic status is associated with happiness at school. In addition to testing whether this holds in the LSAY, the analysis presented in Model 2 allows us to test whether any differences between Indigenous and non-Indigenous Australians remain after controlling for language spoken at home, parental education and parental occupation.
The final model includes a number of school specific variables. This includes an

assessment of one’s own ability, other information on school satisfaction, an index of the individual’s test scores across maths, English and science (administered as part of the international component of the LSAY), and the average test scores of individuals in one’s school. In essence, Model 3 allows us to test whether there are differences between Indigenous and non-Indigenous Australians in terms of happiness after controlling for other components of the human capital model.
As the dependent variable in the analysis is continuous, we use the linear model estimated via Ordinary Least Squares (OLS). Marginal effects and statistical significance are to be interpreted in comparison to the base case, given underneath Table 7.3.
Table 7.3 Factors associated with an index of student happiness, by Indigenous status, Australia, 2006
Model 1 Model 2 Model 3
Age 0.025 * 0.026 * 0.024 *
Female 0.039 *** 0.041 *** 0.026 ***
Indigenous 0.058 ** 0.053 ** 0.089 ***
Born overseas 0.093 *** 0.052 *** 0.045 ***
Mother born overseas 0.032 ** 0.021 0.008
Father born overseas 0.020 0.011 0.007
Lives in provincial Australia –0.019
* –0.003
–0.005
Lives in remote Australia –0.034
–0.015
0.023

Speaks a language other than English at home
0.097 *** 0.080 ***
Number of years of education for parent with highest level
0.014 *** 0.005 **
Mother works as a manager or professional
0.027 *** –0.003
Father works as a manager or professional
0.063 *** 0.016 *
Assessed own ability as ‘very well’ 0.276 ***
Assessed own ability as ‘above average’ 0.119 ***
Assessed own ability as ‘below average’ –0.142
***
Agree or strongly agree that ‘Teachers are fair and just to me’ at school
0.176 ***
Agree or strongly agree that ‘The work I do is good preparation for the future’ at school
0.316 ***
Agree or strongly agree that ‘I feel safe and secure’ at school
0.298 ***
Index of test scores –0.018
***
Index of test scores for school 0.019 *

Predicted index value for base case 0.140 0.094 –0.610
Adjusted R-Squared 0.0126 0.0288 0.2964
Number of observations 12 846 12 846 12 324
Note: The base case individual for all estimations is: aged 15; male; non-Indigenous, born in Australia; and living in a major city. For Model 2, the base case is further defined to speak English at home; have a parent with 13 years of education (but no more); and have a mother and father not employed as a manager or professional. For Model 3, the base case is further defined to assess one’s own ability at school as average; disagree or strongly disagree with the statements on their school; have an index value of zero for their test scores (the mean); and attend a school where that is the mean value.
*** Marginal effect for which the coefficient is statistically significant at the 1% level of significance.
** Marginal effect for which the coefficient is statistically significant at the 5% level of significance.
* Marginal effect for which the coefficient is statistically significant at the 10% level of significance.
Source: Customised calculations using Wave 1 of the LSAY (enumerated in 2006)
Beginning with Model 1, we can see an Indigenous Australian is on average happier at school than a non-Indigenous Australian (born in Australia) of the same age, gender and broad region of usual residence. Looking across the models, this difference not only holds once other characteristics are controlled for, but actually widens between Model 2 and Model 3. In other words, Indigenous Australians are on average happier at school than their non-Indigenous counterparts.
This is an important finding because other research (e.g. Munns and McFadden 2000) has shown that Indigenous Australians in certain contexts resist aspects of

formal education. The results presented in Table 7.3 do not contradict that research. However, the results do nonetheless suggest that there are other aspects of education that counterbalance this resistance.
A student’s happiness is important in its own right. Simply for the fact that school makes up a large proportion of most people’s lives, the greater one’s happiness whilst at school the higher one’s emotional wellbeing across the lifecourse. However, happiness is also important because of its potential impact on school completion. The standard human capital model assumes that individuals focus on the economic costs and benefits of schooling only. While students probably do take this into account, most extensions to the model recognise that a student’s happiness is also important.
Summary and data gaps
In discussing previous models of education participation and attempting to tie them to the development of a model of Indigenous education, we identified two research questions related to the costs and benefits of education. In any applied empirical analysis, the number of research questions that cannot be answered is always frustrating. However, this would appear to be particularly the case when it comes to analysing Indigenous education. Nonetheless, by combining information from a few datasets (the LSAY (Waves 1–4), and the 2008 NATSISS), we were able to partially answer some of the questions and be a little more definitive with others.
Research question 1: What are the apparent benefits of education and do they vary by gender or remoteness?
For the most part, those with relatively high levels of education tend to have better outcomes than those without qualifications or who drop out of school at a young age. Differences tend to be greatest for the economic variables (employment, income, financial security), but are also present for a number of broader measures of wellbeing. Differences also tend to be greatest for females and those who live in non-remote Australia – two groups within the Indigenous population with relatively high levels of participation.
Research question 2: Are Indigenous Australians happier or less happy at school than non-Indigenous Australians and do any differences change once other characteristics are controlled for?

Using an index of student happiness, Indigenous Australians are on average happier at school at the age of 15 than non-Indigenous Australians. This difference widens after controlling for other characteristics. There is more to student utility than happiness and analysis of data on life satisfaction and other related concepts (were it available) would provide a more rounded picture of student wellbeing. Nonetheless, the results presented in this paper would tend to suggest that happiness at school is not the reason for low Indigenous completion rates.
The analysis presented in this paper utilised two data sets, the 2008 NATSISS and the 2006 cohort of the LSAY. It may seem strange to have presented analysis using a separate set of data at a conference on the NATSISS. However, this was done for two main reasons. First, because analysis of the LSAY produced interesting, policy-relevant findings that were expected to be of interest to the audience. The second reason though is that it highlighted the benefit of longitudinal data for answering policy relevant research questions. For example, by combining information across waves, it was shown that this difference in completion was explained by socioeconomic background and academic ability at age 15.
Much analysis presented of Indigenous employment, income, mobility or health would also benefit from longitudinal data. However, at present, there is no dataset that tracks individuals across the entire lifecourse. There is some information at key points (for example youth in the LSAY or children in the Longitudinal Study of Indigenous Children (LSIC)), but no information on adults. With this data gap in mind, we renew the call made in Biddle and Yap (2010) for a National Closing the Gap Survey (NCGS).
The NATSISS (and other ABS collections) provide important national level estimates that would be compromised through data attrition if they were replaced by a single longitudinal survey. However, the Indigenous population already experiences a reasonably large survey burden. One alternative would be to implement a rolling-panel approach to the collection of national statistical datasets. A hypothetical structure of a six-year collection cycle beginning with a NATSISS in 2012 (2 years ahead of schedule) and 2018 as well as a National Aboriginal and Torres Strait Islander Health Survey (NATSIHS) in 2015 (5 years after the current survey) and 2021 is given in Table 7.4. In the intervening years, Biddle and Yap (2010) propose that a reduced module of questions be asked that

would allow key lifecourse events to be tracked and the COAG Closing the Gap targets to be analysed. Depending on costs, this survey could be carried out on a subset of the original cohort only.
Table 7.4 Proposed National Closing the Gap Survey
Year Cohort 1
Cohort 2 Cohort 3 Cohort 4
2012 NATSISS
2013 NCGS
2014 NCGS
2015 NATSIHS NATSIHS
2016 NCGS
2017 NCGS
2018 NATSISS NATSISS
2019 NCGS
2020 NCGS
2021 NATSIHS NATSIHS
… …
Note: NCGS = National Closing the Gap Survey
NATSISS = National Aboriginal and Torres Strait Islander Social Survey

NATSIHS = National Aboriginal and Torres Strait Islander Health Survey
Source: Author’s extrapolation
Biddle and Yap (2010) outline three benefits of the above structure. Firstly, it will be possible for the first time to undertake robust longitudinal analysis of a core set of Indigenous outcomes across the lifecourse. This would be restricted those questions that are available on the NATSISS, the NATSIHS and the new National Closing the Gap Survey. However, this would include the major aspects of the Closing the Gap agenda covered at this conference. The second benefit of the above structure (as opposed to a single longitudinal study) would be that the sample for the major surveys would still be nationally representative. That is, Cohort 1 for the 2012 NATSISS, Cohort 2 for the 2015 NATSIHS and so on. The third major benefit is that, by overlapping the cohorts, the representativeness of the longitudinal aspects of the cohorts could be tested against the new cohorts that replace them. For example, the characteristics of Cohort 1 in 2015 could be tested against the characteristics of Cohort 2 in the same year. It may not be possible to maintain a sufficient sample to undertake robust-through-time analysis for all jurisdictions. However, the Closing the Gap targets are set at the national level, and hence it is vital that they be evaluated in these broad terms.
The above structure would clearly require a significant investment from all levels of government. It would not be possible for the ABS to follow such an approach within their existing budget. However, the investment in adequate data collection is inconsequential compared to the investment governments have made, and will need to make in order to substantially reduce Indigenous disadvantage
Survey Analysis for Indigenous Policy in Australia
by Boyd Hunter, Nicholas Biddle (Editors)
Ref: http://press.anu.edu.au/apps/bookworm/view/Survey+Analysis+for+Indigenous+Policy+in+Australia/10101/ch07.html

dc.identifier.citation Rudolph, S. (2011). Rethinking indigenous educational disadvantage: a critical analysis of race and whiteness in Australian education policy. Masters Research thesis, Melbourne Graduate School of Education, The University of Melbourne.
en_US
dc.identifier.uri http://hdl.handle.net/11343/37077
dc.description © 2011 Sophie Rudolph en_US
dc.description.abstract This thesis examines Indigenous school education in Australia, through analysing themes of difference, race and whiteness in contemporary education policy. The study asks why educational inequality and disadvantage continue to be experienced by Indigenous school students, despite concerted policy attention towards redressing these issues. It seeks to better understand how Indigenous education is represented in policy and scholarly debates and what implications this has for Indigenous educational achievement. I argue that in order to succeed Indigenous school students are often expected to assimilate into an education system that judges success according to values and expectations influenced by an invisible ‘whiteness’. The investigation of these issues is framed by insights and approaches drawn from three theoretical frameworks. Michel Foucault’s concepts of ‘discourse’, ‘disciplinary power’, ‘regimes of truth’ and ‘normalisation’, and Iris Marion Young’s work with issues of difference, ‘cultural imperialism’, oppression and justice are brought into critical dialogue with critical race theory (CRT). In particular, CRT is engaged as an attempt to bring some new perspectives to understandings of race and difference in Australian education policy. This combination of theories informs an examination of policy (and policy related texts) guided by Foucauldian discourse analysis and critical policy research methods. Through my analysis I develop a number of arguments. First, that the combined theoretical approach I engage is useful for uncovering some of the silences and assumptions that have typically influenced attempts to achieve educational justice for Indigenous Australians. Second, in the
en_US

documents I analyse, the ways in which Indigenous students are described commonly positions them as deficient and suggests that these deficiencies are to be remedied through exhibiting more of the behaviours and attitudes of non-Indigenous students. Third, that the commitment to ‘inclusion’ within the policies analysed is important, but typically maintains a relationship in which a powerful and central white ‘norm’ remains invisible and dictates how and when the ‘Other’ is included. Fourth, that in seeking to understand equity issues for Indigenous students it is important to look also at the broader education system and its dominant values and goals. Through analysis of policies related to education for ‘all students’, I suggest that educational success is commonly identified and assessed according to ‘white’ norms, within schools that are expected to improve and be accountable within a neo-liberal agenda, which is largely supportive of standardisation and sameness, and not readily accommodating of ‘difference’. Overall, this study has attempted to bring some important conceptual approaches to analysis of current education policy in Australia in order to build greater understanding of Indigenous educational disadvantage. It has sought to open possibilities for addressing issues of race and justice that are characterised by listening, support of difference and responsibility, and commitment to disruption and discomfort.
dc.language eng en_US
dc.rights Terms and Conditions: Copyright in works deposited in Minerva Access is retained by the copyright owner. The work may not be altered without permission from the copyright owner. Readers may only, download, print, and save electronic copies of whole works for their own personal non-commercial use. Any use that exceeds these limits requires permission from the copyright owner. Attribution is essential when quoting or paraphrasing from these works.
dc.subject indigenous en_U

S
dc.subject Australia en_US
dc.subject education en_US
dc.subject disadvantage en_US
dc.subject inclusion en_US
dc.subject race en_US
dc.subject whiteness en_US
dc.subject policy en_US
dc.subject listening en_US
dc.subject difference en_US
dc.subject Foucault en

_US
dc.subject critical race theory en_US
dc.subject Iris Marion Young en_US
dc.title Rethinking indigenous educational disadvantage: a critical analysis of race and whiteness in Australian education policy
en_US
dc.type Masters Research thesis en_US
melbourne.affiliation The University of Melbourne en_US
melbourne.affiliation.department Melbourne Graduate School of Education en_US
melbourne.linkedresource.url http://cat.lib.unimelb.edu.au/record=b4301981
melbourne.accessrights Open Access
Ref: https://minerva-access.unimelb.edu.au/handle/11343/37077?show=full
University of Melbourne
http://educationactiontoronto.com/file_download/85/4Marie-Battisteikp_e(2).pdf