Embed Size (px)
Citation preview

Proteomic Profiling of Plasmodium falciparum through Improved,
Semiquantitative Two-Dimensional Gel Electrophoresis
Salome Smit,† Stoyan Stoychev,‡ Abraham I. Louw,† and Lyn-Marie Birkholtz*,†
Department of Biochemistry, Faculty of Natural and Agricultural Sciences, University of Pretoria,Pretoria, 0002, South Africa, and CSIR Biosciences, Pretoria, 0001, South Africa
Received October 14, 2009
Two-dimensional gel electrophoresis (2-DE) is one of the most commonly used technologies to obtaina snapshot of the proteome at any specific time. However, its application to study the Plasmodial(malaria parasite) proteome is still limited due to inefficient extraction and detection methods and theextraordinarily large size of some proteins. Here, we report an optimized protein extraction method,the most appropriate methods for Plasmodial protein quantification and 2-DE detection, and finallyprotein identification by mass spectrometry (MS). Linear detection of Plasmodial proteins in a optimizedlysis buffer was only possible with the 2-D Quant kit, and of the four stains investigated, Flamingo Pinkwas superior regarding sensitivity, linearity, and excellent MS-compatibility. 2-DE analyses of thePlasmodial proteome using this methodology resulted in the reliable detection of 349 spots and a 95%success rate in MS/MS identification. Subsequent application to the analyses of the Plasmodial ringand trophozoite proteomes ultimately resulted in the identification of 125 protein spots, whichconstituted 57 and 49 proteins from the Plasmodial ring and trophozoite stages, respectively. This studyadditionally highlights the presence of various isoforms within the Plasmodial proteome, which is ofsignificant biological importance within the Plasmodial parasite during development in the intraeryth-rocytic developmental cycle.
Keywords: 2-D gel electrophoresis • malaria • fluorescent dyes • proteome • isoforms
Introduction
Global efforts to eradicate malaria in Third World countriesare hampered by various factors including global climatechanges, increasing migration behavior, failing health caresystems, absence of a licensed vaccine and, most disturbingly,the rapid development and dispersal of the respective drug-and insecticide-resistant forms of the malaria parasite and themosquito vector. About 40% of the world’s population in 107countries live under the constant risk of malaria infection andmore than 80% of malaria-associated deaths in the world occurin Africa south of the Sahara. Currently, only one drug,Artemisinin, is still effective against the malaria parasite, butthe first signs of drug resistance have now emerged at the Thai-Cambodian border.1 This raises serious concerns and under-scores the urgency for innovative strategies to discover newand robust antimalarial drugs as well as new targets to combatthe disease. The latter can be expedited by the inclusion oftechniques such as functional genomics in drug-discoverypipelines.2
The Plasmodium parasite has complex life cycles in both thehuman host and the mosquito vector. Pathogenesis is displayed
during the 48 h schizogony of the parasite in human erythro-cytes (intraerythrocytic developmental cycle, IDC), whereparasites mature from ring to trophozoite stages to the ultimateproduction of daughter merozoites from schizonts. This asexualreplication cycle is tightly controlled in P. falciparum with aunique cascade of gene regulation resulting in the “just-in-time” production of transcripts coordinated with expressionof genes involved in related biological processes.3 Therefore,in the majority of cases, proteins are produced from theirrespective transcripts without delay.3,4
The resultant Plasmodial proteome is multifaceted and stage-specific, indicating a high degree of specialization at themolecular level to support the biological and metabolic changesassociated with each of the life cycle changes.5,6 Post-translational modifications are employed as a mechanism toregulate protein activity during the parasite’s life cycle,7 andcertain proteins are predicted to act as controlling nodes thatare highly interconnected to other nodes and thus result in ahighly specialized interactome.2 These enticing propertiesmotivate studies focused on in-depth characterization of thePlasmodial proteome including regulatory mechanisms andthe ability to respond to external perturbations. Analysis ofthe schizont stage proteome reinforced the notion that bothpost-transcriptional and post-translational mechanisms areinvolved in the regulation of protein expression in P. falci-parum.8
* To whom correspondence should be addressed. Prof Lyn-Marie Birkholtz,Department of Biochemistry, Faculty of Natural and Agricultural Sciences,University of Pretoria, Pretoria, South Africa, 0002, telephone +27 12 4202479, fax +27 12 362 5302, e-mail: [email protected].
† University of Pretoria.‡ CSIR Biosciences.
2170 Journal of Proteome Research 2010, 9, 2170–2181 10.1021/pr9009244 2010 American Chemical SocietyPublished on Web 03/10/2010

Due to the >80% AT-richness of the Plasmodial genome,9
the resultant Plasmodial proteome contains proteins in whichlong hydrophobic stretches and amino acid repeats (notablyconsisting of lysine and asparagine) are found. Moreover, theproteins from this parasite are comparatively large, nonho-mologous and highly charged with multiple isoforms withinthe parasite.10 These properties have confounded analyses ofthe Plasmodial proteome, including the recombinant expres-sion of Plasmodial proteins.11,12 Few studies attempted todescribe the Plasmodial proteome, which is predicted to haveabout 5300 proteins of which ∼60% are hypothetical andunannotated.8,13,14
The reported efficacy of two-dimensional gel electrophoresis(2-DE) to analyze the Plasmodial proteome is relatively poorsince only a low number of protein spots could be detectedwith various protocols and stains.13–17 The highest number ofspots detected to date on Plasmodial 2-DE gels with silverstaining is only 239,15 and recently, a total of 345 spots weredetected for 4 time points in the Plasmodial schizont stageusing two-dimensional differential gel electrophoresis (2-DDIGE),8 of which only 54 protein spots were identified. Thisclearly illustrates the need for an optimized protocol includingextraction, quantification and detection methods. This studydetails such an optimized 2-DE protocol, which was appliedto the analysis of the Plasmodial proteome in the ring andtrophozoite stages. This study first optimized establishedmethodology with regard to protein extraction, quantification,detection and finally MS identification. Once the protocol wasestablished, it was subsequently applied to the analyses of thesoluble Plasmodial proteome, resulting in the detection of 349spots using the fluorescent stain, Flamingo Pink, with a 95%success rate achieved in the mass spectrometry (MS) identifica-tion of a subset of these proteins, far exceeding previouslyreported Plasmodial protein identification success rates of50-79%.13,14 After the successful establishment of the opti-mized 2-DE protocol, this methodology was applied to thePlasmodial ring and trophozoite proteomes for which a totalof 125 protein spots were identified. Several protein isoformswere also identified in the two Plasmodial life-stages, whichhas biological significance for the Plasmodial parasite.
Experimental Section
Culturing of Parasites. P. falciparum 3D7 (Pf3D7) parasiteswere maintained in vitro in human O+ erythrocytes in RPMI1640 media (Sigma) with 0.5% (w/v) Albumax II (Gibco).18
Parasites were synchronized (∼98% morphological synchro-nicity) with sorbitol treatment for three consecutive genera-tions. Thirty milliliters of Pf3D7 parasite cultures at 8%parasitemia and 5% hematocrit were used per gel to establishthe proteomics methodology. Saponin was added to a finalconcentration of 0.01% (v/v) followed by incubation on ice for5 min to lyse the erythrocytes. Parasites were collected bycentrifugation at 2500× g for 15 min at room temperature, andwashed in PBS at 16 000× g for 1 min at 4 °C. This step wasrepeated at least four times until the supernatant was clearinstead of three times as previously reported.7 The parasitepellet was stored at -80 °C. For analyses of proteomes ofdifferent developmental states of the parasites, parasites wereharvested from 60 mL cultures at 16 h post invasion (HPI) (laterings) and 20 HPI (early trophozoites).
Protein Preparation. Parasite pellets were suspended in 500µL lysis buffer as described by Nirmalan et al. (8 M urea, 2 Mthiourea, 2% CHAPS, 0.5% (w/v) fresh DTT and 0.7% (v/v)
ampholytes).7 Samples were pulsed-sonicated on a Virsonicsonifier with microtip for 20 s with alternating pulsing (1 spulse, 1 s rest) at 3 W output with 1 min cooling steps on ice(to prevent foaming and carbamylation) and repeated 6 moretimes. Sonication was followed by centrifugation at 16 000× gfor 60 min at 4 °C, after which the protein-containing super-natant was used in subsequent 2-DE.
Protein Quantification. Four different protein quantificationmethods were tested on the samples obtained using two BSAstandard curves in each of the methods: first, BSA in 0.9%saline, and second, BSA in the Plasmodial optimized lysisbuffer, each containing the same amount of protein foranalysis. The Quick Start Bradford dye method (BioRad) wasused for protein determination at an absorbance of 595 nm.19
The Lowry method used a reaction mixture containing solutionA (2% (w/v) NaCO3, 2% (w/v) NaOH, 10% (w/v) Na2CO3),solution B (2% (w/v) CuSO4.5H2O), and solution C (0.5% (w/v)potassium tartrate). Two hundred microliters of the reactionmixture was added to each protein sample, mixed and incu-bated for 15 min at room temperature. Six hundred microlitersof Folin Ciocalteau reagent (1:10, FC reagent and H2O) wereadded and incubated at room temperature for 45 min in thedark. Absorbance was measured at 660 nm.20 Lastly, twocommercial protein concentration determination kits were usedaccording to the manufacturer’s instructions and included theMicro BCA Protein assay kit (Pierce) and the 2-D Quant Kit(GE Healthcare).
SDS-PAGE Gels. Low molecular weight markers (GE Health-care) were diluted in reducing buffer (0.06 M Tris-HCl, 2%(w/v) SDS, 0.1% (v/v) glycerol, 0.05% (v/v) �-mercaptoethanoland 0.025% (v/v) bromophenol blue, pH 6.8), to provide aconcentration range from 100 ng to 0.6 ng protein. Equalamounts of markers were loaded onto four different 12.5% SDS-PAGE gels and the gels were subsequently stained with eitherColloidal Coomassie, silver, SYPRO Ruby (Molecular Probes)or Flamingo Pink (Bio-Rad) stains. The gels were scanned ona Versadoc 3000 and analyzed using the Quantity One Program(Bio-Rad). The Rf values and the intensities of each band werecompared and used to determine the limit of detection andlinearity.
Two-Dimensional Gel Electrophoresis (2-DE). For 2-DE, theprotein concentration was determined with the 2-D Quant kit.Two hundred micrograms of protein in rehydration buffer (8M urea, 2 M thiourea, 2% (w/v) CHAPS). 0.5% (w/v) DTT and0.7% (v/v) IPG Buffer (pH 3-10 Linear) was applied to a 13cm IPG, pH 3-10 L strip. First dimensional isoelectric focusingwas performed on an Ettan IPGphore Isoelectric Focusing Unit(GE Healthcare), and commenced with a 10 h active rehydra-tion step. Isoelectric focusing time followed an alternatinggradient and step-and-hold protocol and was always allowedto proceed to a total of 18 500 V-h, that completed within 15 h.IPG strips were equilibrated for 10 min each in SDS equilibra-tion buffer (50 mM Tris-HCl, pH 6.8, 6 M urea, 30% (v/v)glycerol, 2% (w/v) SDS, 0.002% bromophenol blue) containing2% DTT, and then incubated in 2.5% iodoacetamide. Finally,the strip was placed in SDS electrophoresis running buffer (0.25M Tris-HCl, pH 8.3, 0.1% SDS, 192 mM glycine) for 10 min asa final equilibration step. Second dimensional separation wasperformed by placing the IPG strips on top of the 10% SDSPAGE gel (Hoefer SE 600), covered with 1% agarose dissolvedin SDS electrophoresis running buffer. Separation was per-formed at 80 V at 20 °C until the bromophenol blue frontreached the bottom of the gel. The gels were then fixed in the
Proteomic Profiling of Plasmodial Proteins research articles
Journal of Proteome Research • Vol. 9, No. 5, 2010 2171

appropriate fixing solution for each specific stain (see below).For the method optimization protocol, gel image analysis wasperformed using PD Quest 7.1.1 (Bio-Rad). All 8 gels werefiltered using the Filter Wizard. Spot detection was performedon the gels by automated spot detection. The display of thegels stained with SYPRO Ruby and Flamingo Pink was invertedfor easier comparisons with the gels stained with CCB andsilver. Additional manual settings for spot detection weresensitivity (2.22), size scale (5) and min peak (1244). Forproteomic analyses of the different developmental stages of P.falciparum, 400 µg protein was applied to 18 cm IPG strips forseparation and subsequently stained with Flamingo Pink andscanned using the Versadoc 3000 as described below. PD Quest7.1.1 was used to identify the number of spots on each of thegels that were done for the ring and trophozoite 2-DE pro-teomes (8 gels for each stage). First, all images were croppedto the same dimensions (1.59 Mb, 933 × 893 pixels, 303.7 ×290.7 mm) and filtered using the salt setting (light spots ondark background) of the Filter Wizard. The Spot DetectionWizard was used to automatically detect spots on the selectedmaster image by manual identification of a small spot, faintspot and large spot. Additional settings for spot detection weremanually selected for sensitivity (5.31 for rings and 4.35 fortrophozoites), size scale 5.0 (both), and min peak (808 for ringsand 4712 for trophozoites). After automated matching of allthe gels, every spot was manually verified to determine cor-rectness of matching. The master image contained 369 spotsfor the ring stage proteome with a match rate of 98%, and thetrophozoite master image contained 450 spots with a matchrate of 96%.
Flamingo Pink Staining of 2-DE Gels. Gels were fixedovernight in 40% (v/v) ethanol, 10% (v/v) acetic acid, andsubsequently in 200 mL Flamingo Pink working solution andincubated with gentle agitation in the dark for 24 h, to increasethe sensitivity of the stain. The gels were washed in 0.1%(w/v) Tween-20 for 30 min to reduce background. Finally thegels were rinsed in Milli-Q water twice before scanning on theVersadoc 3000. All gels were stored in Flamingo Pink at 4 °Cuntil use for MS.
Silver Staining of 2-DE Gels. Gels were fixed in 45% (v/v)methanol, 5% (v/v) acetic acid overnight, followed by sensitiz-ing for 2 min in 0.02% (w/v) sodium thiosulfate, and rinsingwith Milli-Q water twice. Two-hundred milliliters of ice cold0.1% (w/v) silver nitrate was added and incubated at 4 °C for30 min, rinsed twice with Milli-Q water and developed in fresh2% (w/v) sodium carbonate with 0.04% (v/v) formaldehyde.Development was stopped by adding 1% (v/v) acetic acid. Allgels were stored in 1% (v/v) acetic acid at 4 °C in airtightcontainers until use for MS.
SYPRO Ruby Staining of 2-DE Gels. Gels were fixed in 10%(v/v) methanol, 7% (v/v) acetic acid overnight. The fixingsolution was replaced with 200 mL SYPRO Ruby stain andincubated with agitation for 24 h in the dark, to increasesensitivity. After staining, the gels were washed for 60 min with10% (v/v) methanol, 7% (v/v) acetic acid to reduce fluorescentbackground. Finally the gels were rinsed twice with Milli-Qwater before scanning on the Versadoc 3000. Gels were storedin SYPRO Ruby at 4 °C until use for MS.
Colloidal Coomasie Blue (CCB) Staining of 2-DE Gels.Colloidal Coomassie Brilliant Blue G250 stock solution (2%(v/v) phosphoric acid, 10% (w/v) ammoniumsulfate, and 0.1%(v/v) Coomassie Brilliant Blue G250) was diluted (4:1) withmethanol just before use. The gels were immersed in the
Colloidal Coomassie solution and left shaking overnight. Gelswere rinsed with 25% (v/v) methanol, 10% (v/v) acetic acidbefore destaining with 25% (v/v) methanol, until the back-ground was clear.21 Gels were then scanned on the Versadoc3000, and stored in 1% (v/v) acetic acid at 4 °C until use forMS.
2-D Spot Identification by Tandem Mass Spectrometry. Forcomparative purposes mostly the same 39 spots (154 in total)covering a wide range on the gels as well as low molecularweight markers were cut from each of the 4 differently stainedgels, dried and stored at -20 °C. The silver stained sampleswere first destained with potassium ferricyanide and sodiumthiosulfate to remove the silver before proceeding to washsteps.22 All gel pieces was cut into smaller cubes and washedtwice with water followed by 50% (v/v) acetonitrile for 10 mineach. The acetonitrile was replaced with 50 mM ammoniumbicarbonate and incubated for 10 min, repeated twice, exceptfor CCB samples, which had an additional wash step to ensurecomplete removal of the dye. All the gel pieces were thenincubated in 100% acetonitrile until they turned white. Thiswas followed by another ammonium bicarbonate, acetonitrilewash step as above, after which the gel pieces were dried invacuo. Gel pieces were digested with 10 ng/µL trypsin at 37 °Covernight. Resulting peptides were extracted twice with 70%acetonitrile for 30 min, and then dried and stored at -20 °C.Dried peptides were dissolved in 10% (v/v) acetonitrile, 0.1%(v/v) formic acid and mixed with saturated alpha-cyano-4-hydroxycinnamic acid before being spotted onto a MALDIsample plate. Experiments were performed using AppliedBiosystems QSTAR-ELITE, Q-TOF mass spectrometer withoMALDI source installed. Laser pulses were generated using aNitrogen laser with intensities between 15 and 25 µJ dependingon sample concentration and whether single MS or MS/MSexperiments were performed. First, single MS spectra wereacquired for 15-30 s. The 50 highest peaks from the MS spectrawere automatically selected for MS/MS acquisition. Tandemspectra acquisition lasted 4-8 min depending on sampleconcentration. Argon was used as cooling gas in Q0 andcollision gas in Q2. The collision energy was first optimizedusing a 9 peptide mixture covering the scan range of 500-3500Da and then automatically set during MS/MS experimentsusing the Information Dependent Acquisition (IDA) functionof the Analyst QS 2.0 software. The instrument was calibratedexternally, in TOF-MS mode, via a two point calibration usingthe peptides Bradykinin 1-7 and Somatostatin 28 ([M + H]+
) 757.3992 and 3147.4710 Da, respectively). Data was submittedin MASCOT (www.matrixscience.com). For the Plasmodial ringand trophozoite proteome analysis, spots of various intensitiescovering the whole 2-DE range (pI 4-9, and Mr 13-135 kDa)were selected, and subjected to MS/MS as described above.For the ring stage 2-DE proteome analysis 77 spots wereselected for MS identification and 63 spots were selected forthe trophozoite stage. The normalized intensities of these spotsranged from 58 to a maximum of 9734 with 1963 as the averageintensity per spot.
Results and Discussion
Optimization for 2-DE of Plasmodial Proteins. The abilityof 2-DE to provide a snapshot of the proteome at any particulartime is a distinct advantage for a multistage organism such asPlasmodium. The 2-DE technique remains the most widelyused for proteomic investigation techniques23 due to severaladvantageous properties such as good resolution of abundant
research articles Smit et al.
2172 Journal of Proteome Research • Vol. 9, No. 5, 2010

proteins as well as information on protein size, quantity andisoforms with post-translational modifications or different pIs.24
However, 2-DE gels are biased to the detection of relatively highabundant proteins as well as soluble and midrange molecularweight proteins.25 Besides the visual advantages of 2-DE incomparing protein levels, proteins are differentially stained dueto their specific chemical and physical properties, whichnecessitates careful selection of the staining method in termsof its sensitivity, reproducibility, ease of use and cost-effective-ness. Most importantly, the stain should be compatible withdownstream applications such as MS. This study describes animproved protocol for the detection and identification ofPlasmodial proteins separated by 2-DE, which was then alsosubsequently applied to identify the proteome of the Plasmo-dial ring and trophozoites stages.
The analysis of the Plasmodial proteome by 2-DE has beenhampered by numerous technical constraints. Plasmodialproteins are notoriously insoluble, comparatively large, non-homologous and highly charged10 and therefore necessitate theuse of optimized lysis buffers to ensure maximal solubility ofthese proteins for 2-DE. The lysis buffer described by Nirmalanet al. is able to solubilize a large proportion of Plasmodialproteins. In this study, the combination of 5-fold less saponinused, increased washing steps and shorter sonication cycles(with prolonged cooling in between cycles), contributed to theabsence of hemoglobin on the 2-DE gels and the detection ofproteins in the range of pH 8-9 that was previously cumber-some in Plasmodial 2-DE. The use of this lysis buffer, however,precludes the use of traditional methods of protein concentra-tion determination.
A two-pronged approach was used in this study to determinethe most effective and reproducible detection and stainingmethod for Plasmodial proteins. First, the effect of the extrac-tion medium on standard protein determination methods wasestablished as well as the sensitivity of staining methods todetect gel-separated molecular weight standards and second,for comparative purposes the sensitivity and reproducibility ofthese staining methods to detect Plasmodial proteins on 2-DEgels. Four different methodologies were evaluated to determinePlasmodial protein concentrations in the lysis buffer used forthe protein extraction. The standard Bradford method as wellas the Lowry and BCA methods was found to be incompatiblewith the lysis buffer, (results not shown). The 2-D Quant kitconversely provided reproducible and comparable data for boththe saline (R2 ) 0.9918) and lysis buffer (R2 ) 0.9929) standardcurves, most likely due to the quantitative protein precipitationstep by which any other interfering substances in the lysisbuffer are also removed. Although various Plasmodial pro-teomic studies have employed the Bradford method,14,15 thepresent study confirms recent reports of the reliability of the2-D Quant method.8,26
A second caveat in semiquantitative proteomics is thesensitivity of the staining method used for the detection ofprotein spots after 2-DE. The sensitivity, performance, andlinear regression constants of four different staining methodswere compared in this study with quantitative 1-D analyses ofstandard molecular weight markers. Four different SDS-PAGEgels were individually stained with Colloidal Coomassie Blue(CCB), MS-compatible silver stain, SYPRO Ruby and FlamingoPink, and compared by using Quantity One 4.4.1 to determinethe detection limits (Table 1, 1-D SDS-PAGE MW analysis ofstains). SYPRO Ruby and Flamingo Pink achieved similarresults, as both were able to detect up to 1 ng of protein and
were linear (R2 ) 0.97). CCB was the least sensitive of the fourstains with a detection limit of 25 ng and relatively poorlinearity (R2 ) 0.89). The MS-compatible silver stain was ableto detect a minimum of 10 ng but has a very poor linear range(R2 ) 0.83). The fluorescent stains, SYPRO Ruby and FlamingoPink, thus seem superior to CCB and silver in both sensitivityand dynamic linear quantification range of standard proteinmolecular weight markers.
These same stains were subsequently tested on the proteomeof Plasmodial proteins after 2-DE. The total Plasmodial tro-phozoite proteome is predicted to contain 1029 proteins27,28
(PlasmoDB 6.0), which spans a wide molecular weight rangeand pI with different degrees of solubility. Filtering of this dataset to represent the conditions used in this study for 2-DEresulted in 443 Plasmodial trophozoite proteins that should bedetectable on a standard 2-DE gel in the molecular weightrange of 10-110 kDa with a pI range of 4-9. Duplicate 2-DEanalysis were performed for all 4 stains used (n ) 2 per stainand n ) 8 in total). The CCB stain performed poor in detectionwith an average of 126 spots detected, markedly less than anyof the other three stains tested (Table 1, 2-DE trophozoiteanalysis of stains). The MS-compatible silver stain was superiorin terms of sensitivity and 420 spots of the Plasmodial tropho-zoite proteome could be detected (Figure 1). This represents95% (420/443) of the expected trophozoite proteome that weredetected here. However, the poor linearity and spuriousartifacts associated with silver staining of 2-DE could lead tounreliable results when groups of gels with differentiallyexpressed proteins are compared (Table 1).29
Fluorescent stains have been developed with seeminglysimilar sensitivity to silver as well as being MS-compatible,which include the earlier SYPRO Orange and SYPRO Red,30,31
and the currently commonly used SYPRO Ruby stain.29 Thelatter is a fluorescent ruthenium-based stain that binds non-covalently to protein in gels, and is used to stain refractoryproteins like glycoproteins and lipoproteins. SYPRO Ruby hasbeen reported to be a photostable end-point stain, with a goodlinear dynamic range29,32 and to be MS compatible.33 However,SYPRO Ruby was only able to detect 235 Plasmodial proteinspots after 2-DE with a MS identification rate of 85% (Table1). These results are in sharp contrast to those obtained withstandard protein molecular weight markers and indicate thatSYPRO Ruby is not an appropriate stain to use with Plasmodialproteins. New generation fluorescent stains such as FlamingoPink are reported to be able to detect proteins across the fullrange of molecular weights and isoelectric points separated on2-DE with little gel-to-gel variability,34 good linear dynamic
Table 1. Comparative Stain Analysis for Plasmodial ProteinsAnalyzed with 1-D as well as 2-DE SDS-PAGEa
1-D SDS-PAGE MWanalysis of stains 2-DE trophozoite analysis of stains
stainLOD(ng) R2
spotsdetected
(PD Quest)Nr cutfor MS
Nr identifiedby MS
identificationsuccess rate
(%)
CCB 25-90 0.89 126 37 35 95Silver 10-90 0.83 420 39 33 85SYPRO 1-90 0.97 235 39 33 85Flamingo 1-90 0.97 349 39 37 95Total 1130 154 138 90b
a Spot detection and MS identification rates are included for each ofthe four different stains, analyzed on duplicate gels each (n ) 2).b Average.
Proteomic Profiling of Plasmodial Proteins research articles
Journal of Proteome Research • Vol. 9, No. 5, 2010 2173

range and MS-compatibility. These properties seem to besupported by the results of this study since 79% (349/443) ofthe Plasmodial trophozoite proteome were detected on 2-DEas predicted by our calculations.
In order to assess the overall MS-compatibility of the fourstaining methods, approximately 39 spots of four individual gelswere selected consisting of 33 Plasmodial proteins (Figure 1,1-33) and 6 standard molecular weight marker proteins (Figure1, marked Mr1 to Mr6), summarized in Table 1 (2-DE tropho-zoite analysis of stains). Proteins were identified when asignificant Mascot score was obtained and further criteria ofat least 5 peptides and sequence coverage of at least 10% wasachieved (Supplementary Table 1A-D, Supporting Informa-tion). This was done to increase the MS/MS identificationconfidence. Silver staining resulted in the least number ofpositive identifications (85%) with MS/MS (Table 1). This lowpositive identification value was also observed for SYPRO Rubystaining. The most promising results concerning protein iden-tification were obtained with CCB and Flamingo Pink, which
both had MS/MS success rates in excess of 90% (CCB hadpositive identification for 35/37 proteins subjected to MS/MSand Flamingo Pink had positive identification for 37/39 proteinssubjected to MS/MS). The MS-compatibility of CCB is welldocumented,35,36 but literature evidence for the MS-compat-ibility of Flamingo Pink is still lacking. However, for thePlasmodial proteins investigated here, Flamingo Pink wassuperior to the other standard stains regarding its ability toprovide excellent MS/MS identification rates (95% success).Moreover, it provides an excellent linear dynamic range (R2 )0.97) as detected on 1-D SDS PAGE gels with standard molec-ular weight markers and was able to detect 79% of the predicted2-DE trophozoite proteome under our experimental conditions.Thus, Flamingo Pink provided high sensitivity to detect proteinson both 2-DE and 1-D gels, as well as good linear dynamicranges with the added advantage of excellent MS-compatibility.This suggests that Flamingo Pink may the preferable stain asfar as Plasmodial proteomics are concerned but this may also
Figure 1. Comparison of Plasmodial proteins on 2-DE gels using four different stains. Two-hundred micrograms of Pf3D7 proteinswere loaded onto 13 cm IPG pH 3-10 L strips for 2-DE analysis. After electrophoresis, the gels were stained with (A) Colloidal CoomassieBlue, (B) MS compatible silver stain, (C) SYPRO Ruby, and (D) Flamingo Pink. The number of spots was determined using PD Quest7.1.1 with n ) 2 for each individual stain. About 39 similar spots were cut from each of the stained gels to determine the MS efficiency.The spots that were identified are marked on the gels.
research articles Smit et al.
2174 Journal of Proteome Research • Vol. 9, No. 5, 2010

be generally true for proteome analyses due to its superiordetection and identification of proteins after 2-DE.
2-DE based analyses of the Plasmodial proteome is ham-pered by contaminating hemoglobin derived products (HDP),37
possibly as a result of the thiourea/sonication steps during theextraction of Plasmodial proteins, and the resultant destabiliza-tion of hemozoin. Typically, these HDPs are observed as anintense smear focused around pI 7-10 with varying molecularweights. The less harsh sonication steps used in this studycombined with extensive wash steps (to remove hemoglobin)and 5-fold less saponin, resulted in discrete spots identified inthe 2-DE based Plasmodial proteome described here. Very littlebackground and smearing were observed here compared toother Plasmodial proteome studies7,14,15,38 enabling the iden-tification of several proteins in the pI 7.5-9 range (Figure 1,e.g. LDH, G3PDH, Adenylate kinase). Moreover, the protocolused here makes it unnecessary to use additional fractionationsteps to remove contaminating high pI fractions37 or two-stepextraction procedures.15 Furthermore, the use of the 2-D Quantkit provided the only means of protein concentration deter-mination for Plasmodial proteins in the lysis buffer. Finally,Flamingo Pink proved to be superior with regard to sensitivityas far as detection of spots on 2-DE is concerned and providedexcellent MS/MS compatibility for Plasmodial proteins.
Application of 2-DE Optimized Method on the Plasmo-dial Ring and Trophozoite Stages. The successful establish-ment of an optimized 2-DE method allowed the comprehensiveanalyses of the Plasmodial proteome during its IDC. The recentreport of the schizont stage P. falciparum proteome analyzedwith 2-DE8 prompted the analyses of expressed Plasmodialproteins during the ring and trophozoite stages of parasitedevelopment. Due to the just-in-time nature of transcriptproduction per life cycle stage in the parasite, and little delaybetween transcript and protein production, the majority of thisparasite’s proteins are relatively life cycle specific.4 Proteins aretherefore expressed 0.75-1.5 times of a life cycle.3 Highlysynchronized parasites were used where proteins were isolatedfrom either >98% pure ring stage or conversely trophozoitestage proteins. For the ring-stage parasite proteome, an averageof 328 spots were detected on 2-DE with Flamingo Pinkstaining, and of these spots, 73 protein spots were identifiedby MS/MS. An average of 272 spots were detected on 2-DE withFlamingo Pink staining for the trophozoite proteome, of which52 protein spots were positively identified by MS/MS, resultingin a total of 125 protein spots identified (out of 140 analyzed)in the late ring and trophozoite proteomes (Figure 2, Table 2Aand B). These results confirmed the high MS success rate (90%)that was achieved by applying the optimized methodology tothe analyses of the Plasmodial proteome. The identifiedproteins all had significant MASCOT scores, at least 5 peptidesidentified, and sequence coverage of at least 10% each (Table2A and B). Of the 73 proteins spots identified in the ring stageproteome, 57 proteins spots were from Plasmodial origin, andconsisted of 41 unique Plasmodial protein groups, where somegroups contained multiple isoforms of the same protein.Therefore, protein isoforms represented 28% (16 isoforms) ofthe total number of Plasmodial protein spots identified. Thetrophozoite proteome consists of 52 protein spots identifiedby MS of which 49 protein spots were from Plasmodial origin.Of these, 29% (14 protein spots) accounted for isoforms fromthe 35 unique Plasmodial protein groups. From this data, it isclear that protein isoforms are prominent within both the ringand trophozoite stages and may play an important role in
Plasmodial protein regulation. Similarly, this has also beendemonstrated on 2-DE proteome maps for other protozoanparasites that also highlighted the importance of isoformdetection and PTM’s that regulate protein function.39–41 Thesignificance of isoforms is further exemplified in a 2-DEproteomic study of T. brucei where the absence of a singleprotein isoform was associated with drug resistance.42
Comparison of the positively identified proteins groups fromthe ring (41 Plasmodial proteins) and trophozoite (35 Plasmo-dial proteins) stage proteomes to those of the schizont stageproteome (24 Plasmodial proteins)8 revealed only 9 proteins(∼9%) which were shared between all three stages. Theseinclude proteins involved in a variety of biological processessuch as glycolysis, protein folding, oxidative stress and thecytoskeleton. Nineteen proteins are shared between the ringand trophozoite stage while only 11 proteins were sharedbetween the trophozoite and schizont. However, 14 proteinsare shared between the ring and schizont stage parasitessuggesting differentiation of the schizont stage proteins inpreparation for the next round of invasion by the merozoitesand the formation of the subsequent ring stage parasites. Theremaining 39% of the proteins (39 proteins, 31 proteins fromring and trophozoite stage and 8 from schizont stage) were notshared between the different life stages of the parasite, con-sistent with stage-specific production of proteins (and theirtranscripts) due to tightly controlled mechanisms within theparasite.3
Comparison of the protein levels from the ring and tropho-zoite proteomes to the IDC transcript profile demonstrateddistinct similarities between transcript production profiles(obtained from PlasmoDB 6.0 www.plasmodb.org)28 and pro-tein levels (Table 2). Proteins that were up-regulated from ringsto trophozoites mostly exhibited a corresponding increase intranscript level when compared to IDC data (Figure 3, Table2). Enolase, S-adenosylmethionine synthase, ornithine ami-notransferase, uridine phosphorylase and disulfide isomeraseall demonstrated an increase in abundance of both thetranscript and protein expression levels. Similarly, eIF4A-likehelicase and ribosomal phosphoprotein P0 all exhibited un-changed transcript and protein expression levels from ring totrophozoite stage parasites. These results emphasize the generalobservation of correspondences between transcript and proteinlevels in P. falciparum.4 Actin-1 was one of the few exceptionsin which transcript levels remained constant from ring totrophozoite stage parasites while protein levels were increasing.Similarly, the transcript levels of 2-Cys peroxiredoxin remainedconstant over the two time points while the protein was down-regulated. This could indicate possible differential regulationof these proteins at a post-transcriptional/translational level.
Of the 19 identified Plasmodial proteins shared between thering and trophozoite stages of the parasite, several proteinsappear as isoforms (Figure 4, isoforms are also marked in Figure2 and Table 2). Moreover, some of these protein isoformsdisplay differential regulation from the ring to trophozoitestages (Figure 4). An increase in both transcript as well asprotein expression levels were determined for the four enolaseand phosphoethanolamine methyltransferase isoforms and thethree glyceraldehyde-3-phosphate dehydrogenase isoforms.The transcript levels of pyruvate kinase (2 isoforms) increasedover the specified period, but the protein expression levels forboth isoforms declined. The transcript levels for both triose-phosphate isomerase (2 isoforms) and eIF4A (2 isoforms)remained constant during this period but the corresponding
Proteomic Profiling of Plasmodial Proteins research articles
Journal of Proteome Research • Vol. 9, No. 5, 2010 2175

proteins increased in abundance. For glutamate dehydrogenase(3 isoforms) the transcript level decreased but the protein levelremained constant from the ring to the trophozoite stages.Unchanged transcript and protein levels were detected foreIF4A-like helicase (2 isoforms). These examples demonstratethe complexity of post-transcriptional and post-translationalregulation in the P. falciparum proteome.
Post-translational modification of proteins in P. falciparumhas also been observed in the schizont stage proteome8 similarto what has been detected within this study. Post-translationalmodifications of Plasmodial proteins include at least phosphor-ylation,43,44 glycosylation,45–48 acetylation49 and sulfonation.50
The lateral shift of the eIF4A-like helicase isoforms in this studysuggests phosphorylation or sulfonation as potential modifica-tions (Figure 3).51,52 However, only 2 isoforms of this proteinwere observed in the trophozoite stage compared to 5 in theschizont stage, indicating additional regulatory mechanisms e.g.increased phosphorylation in later stages of the parasite44
consistent with the proposed involvement of this protein incontrolling developmentally regulated protein expression. Eno-lase seems to undergo post-translational modifications toproduce 5 isoforms in P. yoelii, 7 isoforms in the P. falciparumschizont stages8,43 and 4 isoforms as described here. However,enolase phosphorylation was not reported in the P. falciparum
Figure 2. 2-DE of the rings and trophozoites stage P. falciparum indicating identified proteins. 2-DE of Plasmodial ring-stage proteome(A) and its master image (C) compared to the 2-DE of early trophozoites stage proteome (B) and its corresponding master image (D).Master images were created by PD Quest as representative of all the 2-DE gels performed for each of the time points and contains spotinformation of a total of eight 2-DE gels. Plasmodial proteins are marked in white, human proteins are marked in yellow and bovineproteins are marked in red. Isoforms are encircled with dotted lines. The representing master images are also marked with identifiedproteins and all positively identified proteins are listed in Table 2A and B.
research articles Smit et al.
2176 Journal of Proteome Research • Vol. 9, No. 5, 2010

Table 2. List of Proteins Identified by Tandem Mass Spectrometry
spotnra
transcripttrendb
PlasmoDBID namec
Mr
(obtained)Da
pI(PlasmoDB)
Mascot scoreMS/MSd
seqcovere matchf
(A) For late rings60 Up PF10_0111 20S proteasome beta subunit, putative 30862 5.18 150 9 459 T PF14_0368 2-Cys peroxiredoxin 21964 6.65 540 59 846 T PF10_0264 40S ribosomal protein, putative (1) 30008 5.91 152 11 372 T PF10_0264 40S ribosomal protein, putative (2) 30008 5.91 146 14 435 T PFL2215w Actin-I 42022 5.27 627 33 1040 Up PF10_0289 Adenosine deaminase, putative 42895 5.41 573 38 1529 - - Bisphosphoglycerate mutase (Homo sapiens) 30027 6.1 441 46 1053 - - Carbonic anhydrase 1 (Homo sapiens) 28778 6.63 531 50 854 - - Carbonic anhydrase 1 (Homo sapiens) 28620 6.65 845 58 1155 - - Carbonic anhydrase 2 (Homo sapiens) 28802 6.63 320 30 716 - - Catalase (Homo sapiens) 59816 6.95 659 29 1528 - - Catalase (Homo sapiens) 59816 6.95 425 22 915 Up MAL8P1.17 Disulfide isomerase, putative (1) 55808 5.56 693 35 1520 Up MAL8P1.17 Disulfide isomerase, putative (2) 55808 5.56 1005 41 176 - - dnaK-type molecular chaperone hsc70 (Bos taurus) 71454 5.37 579 20 1124 - PF14_0655 eIF4A 45624 5.48 580 36 1611 T PFB0445c eIF4A-like helicase, putative (1) 52647 5.68 589 26 1012 T PFB0445c eIF4A-like helicase, putative (2) 52647 5.68 251 13 637 Up PF11_0098 Endoplasmic reticulum-resident calcium binding protein 39464 4.49 1135 59 174 Up PFL1070c Endoplasmin homologue, putative 95301 5.28 298 14 1022 Up PF10_0155 Enolase (1) 48989 6.21 313 18 723 Up PF10_0155 Enolase (2) 48989 6.21 373 18 725 Up PF10_0155 Enolase (3) 48989 6.21 414 27 1126 Up PF10_0155 Enolase (4) 48989 6.21 1000 40 1671 T PFL0210c Eukaryotic initiation factor 5a, putative 17791 5.42 159 27 443 T PF14_0678 Exported protein 2 33619 5.1 379 26 844 T PF11_0165 Falcipain 2 56405 7.12 212 12 630 Down PF14_0164 Glutamate dehydrogenase (NADP+) (1) 53140 7.48 283 17 831 Down PF14_0164 Glutamate dehydrogenase (NADP+) (2) 53140 7.48 212 15 632 Down PF14_0164 Glutamate dehydrogenase (NADP+) (3) 53140 7.48 497 30 1361 - PF14_0187 Glutathione s-transferase 24888 5.97 47 11 249 Up PF14_0598 Glyceraldehyde-3-phosphate dehydrogenase (1) 37068 7.59 302 25 750 Up PF14_0598 Glyceraldehyde-3-phosphate dehydrogenase (2) 37068 7.59 131 11 351 Up PF14_0598 Glyceraldehyde-3-phosphate dehydrogenase (3) 37068 7.59 810 47 1456 - PF11_0183 GTP binding nuclear protein Ran 24974 7.72 485 55 1241 Down PF14_0078 HAP protein 51889 8.05 645 34 135 T PF08_0054 Heat shock 70 kDa protein 74382 5.51 1378 34 233 T PF07_0029 Heat shock protein 86 86468 4.94 1153 25 2458 - - Hemoglobin subunit beta (Homo sapiens) 16112 6.75 294 43 610 Up PF10_0153 Heat shock protein 60 kDa 62911 6.71 870 37 1913 T PF14_0439 Leucine aminopeptidase, putative 68343 8.78 172 14 752 T PF13_0141 Lactate dehydrogenase 34314 7.12 611 43 1214 T MAL13P1.283 MAL13P1.283 protein 58506 6.09 261 10 617 T PFE0585c Myo-inositol 1-phosphate synthase, putative 69639 7.11 454 25 1436 Down PFL0185c Nucleosome assembly protein 1, putative 42199 4.19 293 16 734 Up PFF0435w Ornithine aminotransferase 46938 6.47 589 27 1168 - - Peroxiredoxin-2 (Homo sapiens) 21918 5.67 515 41 1069 - - Peroxiredoxin-2 (Homo sapiens) 21918 5.67 664 43 1164 Up MAL13P1.214 Phosphoethanolamine N-methyltransferase, putative (1) 31309 5.43 871 50 1465 Up MAL13P1.214 Phosphoethanolamine N-methyltransferase, putative (2) 31309 5.43 935 50 1466 Up MAL13P1.214 Phosphoethanolamine N-methyltransferase, putative (3) 31309 5.43 252 22 533 Up PFI1105w Phosphoglycerate kinase 45569 7.63 214 15 542 T PF14_0077 Plasmepsin 2 51847 5.35 72 6 348 T MAL8P1.142 Proteasome beta-subunit 31080 6.00 212 22 72 - PFF0940c Putative cell division cycle protein 48 homologue, putative 90690 4.95 303 10 718 Up PFF1300w Putative pyruvate kinase (1) 56480 7.50 633 28 1519 Up PFF1300w Putative pyruvate kinase (2) 56480 7.50 732 37 1667 - PFI1270w Putative uncharacterized protein PFI1270w 24911 5.49 327 26 647 T PF11_0313 Ribosomal phosphoprotein P0 35002 6.28 430 36 927 Up PFI1090w S-adenosylmethionine synthetase 45272 6.28 863 40 1421 - - Selenium binding protein 1 (Homo sapiens) 52928 5.93 140 12 67 - - Serum albumin (Bos taurus) 71274 5.82 620 24 1557 - - Serum albumin (Bos taurus) 71274 5.82 510 16 1038 - - Solute carrier family 4, anion exchanger, member 1
(Homo sapiens)101987 5.13 189 7 4
1 - - Spectrin alpha chain (Homo sapiens) 282024 4.98 889 24 9
Proteomic Profiling of Plasmodial Proteins research articles
Journal of Proteome Research • Vol. 9, No. 5, 2010 2177

Table 2. Continued
spotnra
transcripttrendb
PlasmoDBID namec
Mr
(obtained) DapI
(PlasmoDB)Mascot score
MS/MSdseq
covere matchf
70 - - Superoxide dismutase (Homo sapiens) 16154 5.70 219 37 439 T PFI0645w Translation elongation factor 1 beta 32121 4.94 208 24 762 T PF14_0378 Triosephosphate isomerase (1) 27971 6.02 490 43 1063 T PF14_0378 Triosephosphate isomerase (2) 27971 6.02 430 38 945 Up PFE0660c Uridine phosphorylase, putative (1) 27525 6.07 315 31 863 Up PFE0660c Uridine phosphorylase, putative (2) 27525 6.07 572 35 108 - PF13_0065 V-type proton ATPase catalytic subunit A (1) 69160 5.51 291 19 109 - PF13_0065 V-type proton ATPase catalytic subunit A (2) 69160 5.51 184 13 7
(B) For early trophozoites50 T PF14_0368 2-Cys peroxiredoxin 21964 6.65 504 72 1145 Down PFC0295c 40S ribosomal protein S12, putative (1) 15558 4.67 85 14 247 Down PFC0295c 40S ribosomal protein S12, putative (2) 15558 4.67 217 36 528 T PF10_0264 40S ribosomal protein, putative (1) 30008 5.91 27 11 329 T PF10_0264 40S ribosomal protein, putative (2) 30008 5.91 267 24 840 Up PF14_0036 Acid phosphatase, putative 35972 6.3 63 5 251 T PFL2215w Actin-1 (1) 42272 5.17 81 36 1216 T PFL2215w Actin-1 (2) 42022 5.27 455 36 938 T PFL2215w Actin-1 (3) 42022 5.27 225 14 548 - - Carbonic anhydrase 1 (Homo sapiens) 28620 6.65 70 20 415 Up MAL8P1.17 Disulfide isomerase precursor, putative 55808 5.56 883 38 1618 Up PF14_0655 eIF4A (1) 45624 5.28 353 30 1219 Up PF14_0655 eIF4A (2) 45624 5.48 326 23 1213 T PFB0445c eIF4A-like helicase, putative (1) 52647 5.68 320 23 814 T PFB0445c eIF4A-like helicase, putative (2) 52646 5.68 62 42 145 T PF14_0486 Elongation factor 2 (1) 94546 6.36 91 4 46 T PF14_0486 Elongation factor 2 (2) 94546 6.78 657 26 1820 T PF10_0155 Enolase (1) 48989 6.21 408 32 1021 T PF10_0155 Enolase (2) 48989 6.21 949 36 1230 - PFD0615c Eryhrocyte membrane protein 1 (fragment) 13608 6.96 51 38 733 T PF11_0165 Falcipain 2 (1) 56481 7.9 47 23 1034 T PF11_0165 Falcipain 2 (2) 55928 7.49 56 24 1111 T PF14_0341 Glucose-6-phosphate isomerase 67610 6.78 61 28 1424 Down PF14_0164 Glutamate dehydrogenase (NADP+) 53140 7.48 336 28 1139 T PF10_0325 Haloacid dehalogenase-like hydrolase, putative 33220 5.62 180 27 67 T PF08_0054 Heat shock 70 kDa protein 74382 5.33 861 33 1852 Up PF10_0153 Heat shock protein 60 kDa 62911 6.71 128 38 2135 Up PF11_0069 Hypothetical protein 32112 4.91 55 13 336 Up PF14_0138 Hypothetical protein 23889 5.49 53 9 223 Up MAL13P1.237 Hypothetical protein MAL13P1.237 42475 7.14 574 37 1317 Down MAL8P1.95 Hypothetical protein MAL8P1.95 37933 4.13 385 25 810 T PF14_0324 Hypothetical protein, conserved 66415 6.63 66 7 425 Up PF13_0141 Lactate dehydrogenase 34314 7.12 100 12 31 T MAL13P1.56 M1 family aminopeptidase (1) 126552 7.3 102 26 232 T MAL13P1.56 M1 family aminopeptidase (2) 126552 6.68 124 26 253 T MAL13P1.56 M1 family aminopeptidase (3) 126552 7.3 107 27 2322 Up PFF0435w Ornithine aminotransferase 46938 6.47 637 29 1237 Up MAL13P1.214 Phosphoethanolamine N-methyltransferase, putative (1) 31043 5.28 69 9 238 Up MAL13P1.214 Phosphoethanolamine N-methyltransferase, putative (2) 31043 5.28 261 26 641 Up MAL13P1.214 Phosphoethanolamine N-methyltransferase, putative (3) 31309 5.28 177 22 542 Up MAL13P1.214 Phosphoethanolamine N-methyltransferase, putative (4) 31309 5.28 722 48 1349 T PF11_0208 Phosphoglycerate mutase, putative 28866 8.3 401 36 1026 Down PF14_0076 Plasmepsin-1 51656 6.72 540 35 1243 T PF14_0716 Proteosome subunit alpha type 1, putative 29218 5.51 268 31 646 - PFL0590c P-type ATPase, putative 135214 6.13 54 18 1612 Up PFF1300w Putative pyruvate kinase 56480 7.5 101 51 1631 T PF11_0313 Ribosomal phosphoprotein P0 35002 6.28 121 13 322 Up PFI1090w S-adenosylmethionine synthetase 45272 6.28 480 32 108 - - Serum albumin (Bos taurus) 71274 5.82 466 24 159 - - Serum albumin (Bos taurus) 71274 5.82 822 36 2127 T PFI0645w Translation elongation factor 1 beta 32121 4.94 488 35 944 Up PF14_0378 Triosephosphate isomerase 27971 6.02 183 22 6
a Spot number corresponds to marked spots on the master image of ring stage parasites. b Trend of transcripts regulation from 16-20 HPI as acquiredfrom the IDC database (http://malaria.ucsf.edu/comparison/index.php) for each of the identified proteins. (T) indicates unchanged transcript levels and(-) is indicative that result is not applicable. c Proteins identified are sorted alphabetically according to name with isoforms grouped together and thenumber of isoforms per protein is marked in brackets. d Mascot scores are based on MS/MS searches and is only taken when the score is significant (p <0.05). e Sequence coverage is given by Mascot for detected peptide sequences. f Matched is the number of peptides matched to the particular protein.
research articles Smit et al.
2178 Journal of Proteome Research • Vol. 9, No. 5, 2010
phospho-proteome.44 Some of these enolase-isoforms have alsobeen detected in nuclei and membranes in P. yoelii andtherefore suggests moonlighting functions including host cellinvasion, stage-specific gene expression (Toxoplasma), stressresponses and molecular chaperone functions.43 The biologicalsignificance of these isoforms is not yet fully understood, butit clearly emphasizes the need for further in-depth investiga-tions of post-transcriptional and post-translational modifica-tions to further our understanding of the biological regulatorymechanisms within the Plasmodial parasite.
Concluding remarks
This is the first Plasmodial proteome study in which the 2-DEproteomic process was optimized in detail, from samplepreparation through spot identification with MS/MS. Thisresulted in a more detailed description of the Plasmodialproteome due to the removal of contaminating hemoglobin
without additional fractionation steps or extraction procedures.The fluorescent stain, Flamingo Pink, proved superior to theother stains tested and resulted in the detection of 79% of thepredicted trophozoite proteome after 2-DE and achievedexceptional protein identification by MS. The reproducibilityof the methods described here makes it highly expedient forthe analysis of differentially expressed Plasmodial proteins. Theapplication of the optimized 2-DE method allowed the char-acterization of 2-DE proteomes of the ring and trophozoitestages of P. falciparum, which showed that some proteins aredifferentially regulated between these life cycle stages andincluded the identification of a significant number of proteinisoforms. Further analysis of the remainder of the detectedspots is ongoing. These results emphasize the importance ofpost-translational modifications as regulatory mechanismswithin this parasite.
Acknowledgment. Funding was provided by theNational Research Foundation (NRF Grant FA2004051300055,Thuthuka TTK2006061500031 and Prestigious Bursary to S.S.),the South African Malaria Initiative (www.sami.org.za) and theUniversity of Pretoria. Any opinions, findings and conclusionsexpressed in this paper are those of the authors.
Supporting Information Available: SupplementaryTable 1A. List of proteins identified by MS/MS for ColloidalCoomassie Blue. Supplementary Table 1B. List of proteinsidentified by MS/MS for MS-compatible silver stain. Supple-mentary Table 1C. List of proteins identified by MS/MS forSYPRO Ruby. Supplementary Table 1D. List of proteins identi-fied by MS/MS for Flamingo Pink. This material is availablefree of charge via the Internet at http://pubs.acs.org.
References(1) Noedl, H.; Se, Y.; Schaecher, K.; Smith, B. L.; Socheat, D.; Fukuda,
M. M. Evidence of Artemisinin-Resistant Malaria in WesternCambodia. N. Engl. J. Med. 2008, 359 (24), 2619–2620.
(2) Birkholtz, L.; van Brummelen, A. C.; Clark, K.; Niemand, J.;Marechal, E.; Llinas, M.; Louw, A. I. Exploring functional genomicsfor drug target and therapeutics discovery in Plasmodia. Acta Trop.2008, 105 (2), 113–123.
(3) Bozdech, Z.; Llinas, M.; Pulliam, B. L.; Wong, E. D.; Zhu, J. C.;DeRisi, J. L. The transcriptome of the intraerythrocytic develop-mental cycle of Plasmodium falciparum. PLoS Biol. 2003, 1 (1),85–100.
(4) Le Roch, K. G.; Johnson, J. R.; Florens, L.; Zhou, Y. Y.; Santrosyan,A.; Grainger, M.; Yan, S. F.; Williamson, K. C.; Holder, A. A.; Carucci,D. J.; Yates, J. R.; Winzeler, E. A. Global analysis of transcript andprotein levels across the Plasmodium falciparum life cycle. GenomeRes. 2004, 14 (11), 2308–2318.
(5) Shock, J. L.; Fischer, K. F.; DeRisi, J. L. Whole-genome analysis ofmRNA decay in Plasmodium falciparum reveals a global lengthen-ing of mRNA half-life during the intra-erythrocytic developmentcycle. Genome Biol. 2007, 8 (7), .
(6) Sims, P. F. G.; Hyde, J. E. Proteomics of the human malaria parasitePlasmodium falciparum. Exp. Rev. Proteomics 2006, 3 (1), 87–95.
(7) Nirmalan, N.; Sims, P. F. G.; Hyde, J. E. Quantitative proteomicsof the human malaria parasite Plasmodium falciparum and itsapplication to studies of development and inhibition. Mol. Mi-crobiol. 2004, 52 (4), 1187–1199.
(8) Foth, B. J.; Zhang, N.; Mok, S.; Preiser, P. R.; Bozdech, Z.Quantitative protein expression profiling reveals extensive post-transcriptional regulation and post-translational modifications inschizont-stage malaria parasites. Genome Biol. 2008, 9, R177.
(9) Gardner, M. J.; Hall, N.; Fung, E.; White, O.; Berriman, M.; Hyman,R. W.; Carlton, J. M.; Pain, A.; Nelson, K. E.; Bowman, S.; Paulsen,I. T.; James, K.; Eisen, J. A.; Rutherford, K.; Salzberg, S. L.; Craig,A.; Kyes, S.; Chan, M. S.; Nene, V.; Shallom, S. J.; Suh, B.; Peterson,J.; Angiuoli, S.; Pertea, M.; Allen, J.; Selengut, J.; Haft, D.; Mather,M. W.; Vaidya, A. B.; Martin, D. M. A.; Fairlamb, A. H.; Fraunholz,M. J.; Roos, D. S.; Ralph, S. A.; McFadden, G. I.; Cummings, L. M.;Subramanian, G. M.; Mungall, C.; Venter, J. C.; Carucci, D. J.;
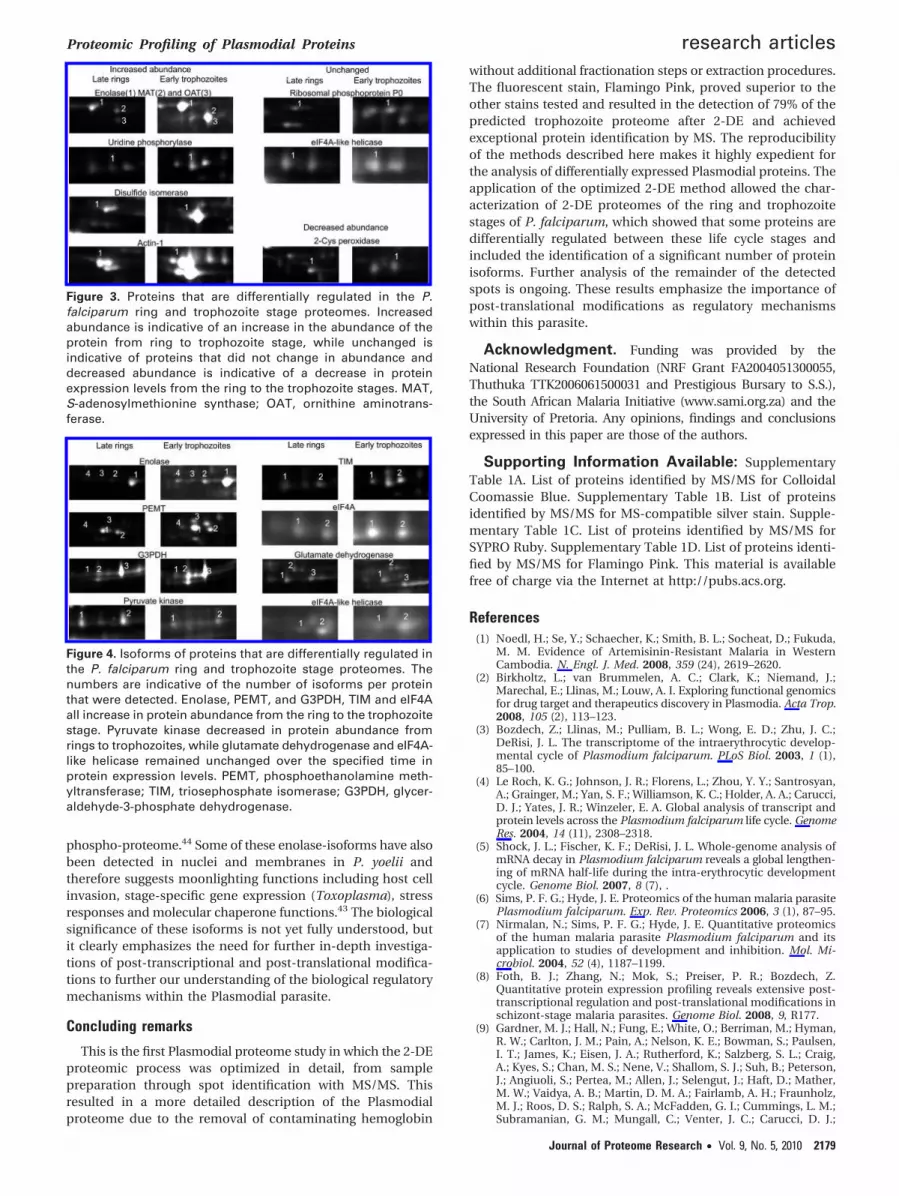
Figure 3. Proteins that are differentially regulated in the P.falciparum ring and trophozoite stage proteomes. Increasedabundance is indicative of an increase in the abundance of theprotein from ring to trophozoite stage, while unchanged isindicative of proteins that did not change in abundance anddecreased abundance is indicative of a decrease in proteinexpression levels from the ring to the trophozoite stages. MAT,S-adenosylmethionine synthase; OAT, ornithine aminotrans-ferase.
Figure 4. Isoforms of proteins that are differentially regulated inthe P. falciparum ring and trophozoite stage proteomes. Thenumbers are indicative of the number of isoforms per proteinthat were detected. Enolase, PEMT, and G3PDH, TIM and eIF4Aall increase in protein abundance from the ring to the trophozoitestage. Pyruvate kinase decreased in protein abundance fromrings to trophozoites, while glutamate dehydrogenase and eIF4A-like helicase remained unchanged over the specified time inprotein expression levels. PEMT, phosphoethanolamine meth-yltransferase; TIM, triosephosphate isomerase; G3PDH, glycer-aldehyde-3-phosphate dehydrogenase.
Proteomic Profiling of Plasmodial Proteins research articles
Journal of Proteome Research • Vol. 9, No. 5, 2010 2179

Hoffman, S. L.; Newbold, C.; Davis, R. W.; Fraser, C. M.; Barrell,B. Genome sequence of the human malaria parasite Plasmodiumfalciparum. Nature 2002, 419, 498–511.
(10) Birkholtz, L.; Blatch, G.; Coetzer, T.; Hoppe, H.; Human, E.; Morris,E.; Ngcete, Z.; Oldfield, L.; Roth, R.; Shonhai, A.; Stephens, L.; Louw,A. Heterologous expression of Plasmodial proteins for structuralstudies and functional annotation. Malaria J. 2008, 7 (1), 197.
(11) Mehlin, C.; Boni, E.; Buckner, F. S.; Engel, L.; Feist, T.; Gelb, M. H.;Haji, L.; Kim, D.; Liu, C.; Mueller, N.; Myler, P. J.; Reddy, J. T.;Sampson, J. N.; Subramanian, E.; Van Voorhis, W. C.; Worthey,E.; Zucker, F.; Hol, W. G. J. Heterologous expression of proteinsfrom Plasmodium falciparum: Results from 1000 genes. Mol.Biochem. Parasitol. 2006, 148 (2), 144–160.
(12) Vedadi, M.; Lew, J.; Artz, J.; Amani, M.; Zhao, Y.; Dong, A. P.;Wasney, G. A.; Gao, M.; Hills, T.; Brokx, S.; Qiu, W.; Sharma, S.;Diassiti, A.; Alam, Z.; Melone, M.; Mulichak, A.; Wernimont, A.;Bray, J.; Loppnau, P.; Plotnikova, O.; Newberry, K.; Sundararajan,E.; Houston, S.; Walker, J.; Tempel, W.; Bochkarev, A.; Kozieradzki,L.; Edwards, A.; Arrowsmith, C.; Roos, D.; Kain, K.; Hui, R. Genome-scale protein expression and structural biology of Plasmodiumfalciparum and related Apicomplexan organisms. Mol. Biochem.Parasitol. 2007, 151 (1), 100–110.
(13) Gelhaus, C.; Fritsch, J.; Krause, E.; Leippe, M. Fractionation andidentification of proteins by 2DE and MS: towards a proteomicanalysis of Plasmodium falciparum. Proteomics 2005, 5.
(14) Makanga, M.; Bray, P. G.; Horrocks, P.; Ward, S. A. Towards aproteomic definition of CoArtem action in Plasmodium falciparummalaria. Proteomics 2005, 5, 1–10.
(15) Panpumthong, P.; Vattanaviboon, P. Improvement of proteomicprofile of Plasmodium falciparum by two step protein extractionin two dimensional gel electrophoresis. Thammasat Int. J. Sci.Technol. 2006, 11 (3), 61–68.
(16) Radfar, A.; Diez, A.; Bautista, J. M. Chloroquine mediates specificproteome oxidative damage across the erythrocytic cycle ofresistant Plasmodium falciparum. Free Radical Biol. Med. 2008,44 (12), 2034–2042.
(17) Wu, Y.; Craig, A. Comparative proteomic analysis of metabolicallylabelled proteins from Plasmodium falciparum isolates withdifferent adhesion properties. Malaria J. 2006, 5, 67.
(18) Trager, W.; Jensen, J. B. Human malaria parasites in continuousculture. Science 1976, 193 (4254), 673–675.
(19) Bradford, M. M. A rapid and sensitive method for the quantitationof microgram quantities of protein utilizing the principle ofprotein-dye binding. Anal. Biochem. 1976, 72, 248–254.
(20) Lowry, O. H.; Rosebrough, N. J.; Farr, A. L.; Randall, R. J. Proteinmeasurement with the Folin Phenol Reagent. J. Biol. Chem. 1951,193, 265–275.
(21) Neuhoff, V.; Arold, N.; Taube, D.; Ehrhardt, W. Improved stainingof proteins in polyacrylamide gels including isoelectric focusinggels with clear background at nanogram sensitivity using Coo-massie Brilliant Blue G-250 and R-250. Electrophoresis 1988, 9, 255–262.
(22) Gharahdaghi, F.; Weinberg, C. R.; Meagher, D. A.; Imai, B. S.;Mische, S. M. Mass spectrometric identification of proteins fromsilver-stained polyacrylamide gel: A method for the removal ofsilver ions to enhance sensitivity. Electrophoresis 1999, 20 (3), 601–605.
(23) Wang, P.; Bouwman, F. G.; Mariman, E. C. M. Generally detectedproteins in comparative proteomics - A matter of cellular stressresponse. Proteomics 2009, 9, 1–12.
(24) Lopez, M. F. Better approaches to finding the needle in a haystack:Optimizing proteome analysis through automation. Electrophoresis2000, 21, 1082–1093.
(25) Ong, S. E.; Pandey, A. An evaluation of the use of two-dimensionalgel electrophoresis in proteomics. Biomol. Eng. 2001, 18 (5), 195–205.
(26) van Brummelen, A. C.; Olszewski, K. L.; Wilinski, D.; Llinas, M.;Louw, A. I.; Birkholtz, L. Co-inhibition of Plasmodium falciparumS-Adenosylmethionine Decarboxylase/Ornithine DecarboxylaseReveals Perturbation-specific Compensatory Mechanisms by Tran-scriptome, Proteome, and Metabolome Analyses. J. Biol. Chem.2009, 284 (7), 4635–4646.
(27) Florens, L.; Washburn, M. P.; Raine, J. D.; Anthony, R. M.; Grainger,M.; Haynes, J. D.; Moch, J. K.; Muster, N.; Sacci, J. B.; Tabb, D. L.;Witney, A. A.; Wolters, D.; Wu, Y. M.; Gardner, M. J.; Holder, A. A.;Sinden, R. E.; Yates, J. R.; Carucci, D. J. A proteomic view of thePlasmodium falciparum life cycle. Nature 2002, 419 (6906), 520–526.
(28) Aurrecoechea, C.; Brestelli, J.; Brunk, B. P.; Dommer, J.; Fischer,S.; Gajria, B.; Gao, X.; Gingle, A.; Grant, G.; Harb, O. S.; Heiges,M.; Innamorato, F.; Iodice, J.; Kissinger, J. C.; Kraemer, E.; Li, W.;
Miller, J. A.; Nayak, V.; Pennington, C.; Pinney, D. F.; Roos, D. S.;Ross, C.; Stoeckert Jr, C. J.; Treatman, C.; Wang, H. PlasmoDB: afunctional genomic database for malaria parasites. Nucleic AcidsRes. 2008, 37 (January), D539-D543.
(29) Berggren, K.; Chernokalskaya, E.; Steinberg, T. H.; Kemper, C.;Lopez, M. F.; Diwu, Z.; Haugland, R. P.; Patton, W. F. Background-free, high sensitivity staining of proteins in one- and two-dimensional sodium dodecyl sulfate-polyacrylamide gels using aluminescent ruthenium complex. Electrophoresis 2000, 21 (12),2509–2521.
(30) Steinberg, T. H.; Jones, L. J.; Haugland, R. P.; Singer, V. L. SYPROOrange and SYPRO Red gel stains: One-step fluorescent stainingof denaturing gels for detection of nanogram levels of protein.Anal. Biochem. 1996, 239, 223–237.
(31) Steinberg, T. H.; Haugland, R. P.; Singer, V. L. Applications ofSYPRO Orange and SYPRO Red protein gel stains. Anal. Biochem.1996, 239, 238–245.
(32) Yan, J. X.; Harry, R. A.; Spibey, C.; Dunn, M. J. Postelectrophoreticstaining of proteins separated by two-dimensional gel electro-phoresis using SYPRO dyes. Electrophoresis 2000, 21 (17), 3657–3665.
(33) Lopez, M. F.; Berggren, K.; Chernokalskaya, E.; Lazarev, A.;Robinson, M.; Patton, W. F. A comparison of silver stain andSYPRO Ruby Protein Gel Stain with respect to protein detectionin two-dimensional gels and identification by peptide massprofiling. Electrophoresis 2000, 21 (17), 3673–3683.
(34) Harris, L. R.; Churchward, M. A.; Butt, R. H.; Coorssen, J. R.Assessing detection methods for gel-based proteomic analyses. J.Proteome Res. 2007, (6), 1418–1425.
(35) Winkler, C.; Denker, K.; Wortelkamp, S.; Sickmann, A. Silver- andcoomassie-staining protocols: Detection limits and compatibilitywith ESI MS. Electrophoresis 2007, 28 (12), 2095–2099.
(36) Lauber, W. M.; Carroll, J. A.; Dufield, D. R.; Kiesel, J. R.; Radabaugh,M. R.; Malone, J. P. Mass spectrometry compatibility of two-dimensional gel protein stains. Electrophoresis 2001, 22 (5), 906–918.
(37) Nirmalan, N.; Flett, F.; Skinner, T.; Hyde, J. E.; Sims, P. F. G.Microscale solution lsoelectric focusing as an effective strategyenabling containment of hemeoglobin-derived products for high-resolution gel-based analysis of the Plasmodium falciparumproteome. J. Proteome Res. 2007, 6 (9), 3780–3787.
(38) Aly, N. S. M.; Hiramoto, A.; Sanai, H.; Hiraoka, O.; Hiramoto, K.;Kataoka, H.; Wu, J. M.; Masuyama, A.; Nojima, M.; Kawai, S.; Kim,H. S.; Wataya, Y. Proteome analysis of new antimalarial endo-peroxide against Plasmodium falciparum. Parasitol. Res. 2007, 100(5), 1119–1124.
(39) De Jesus, J. B.; Cuervo, P.; Junqueira, M.; Britto, C.; Silva-Filho,F. C.; Saboia-Vahia, L.; Gonzalez, L. J.; Domont, G. B. Applicationof two-dimensional electrophoresis and matrix-assisted laserdesorption/ionization time-of-flight mass spectrometry for pro-teomic analysis of the sexually transmitted parasite Trichomonasvaginalis. J. Mass Spectrom. 2007, 42 (11), 1463–1473.
(40) Brobey, R. K. B.; Soong, L. Establishing a liquid-phase IEF incombination with 2-DE for the analysis of Leishmania proteins.Proteomics 2007, 7 (1), 116–120.
(41) Jones, A.; Faldas, A.; Foucher, A.; Hunt, E.; Tait, A.; Wastling, J. M.;Turner, C. M. Visualisation and analysis of proteomic data fromthe procyclic form of Trypanosoma brucei. Proteomics 2006, 6 (1),259–267.
(42) Foucher, A. L.; McIntosh, A.; Douce, G.; Wastling, J.; Tait, A.;Turner, C. M. R. A proteomic analysis of arsenical drug resistancein Trypanosoma brucei. Proteomics 2006, 6 (9), 2726–2732.
(43) Pal-Bhowmick, I.; Vora, H. K.; Jarori, G. K. Sub-cellular localizationand post-translational modifications of the Plasmodium yoeliienolase suggest moonlighting functions. Malaria J. 2007, 6.
(44) Wu, Y.; Nelson, M. M.; Quaile, A.; Xia, D.; Wastling, J. M.; Craig, A.Identification of phosphorylated proteins in erythrocytes infectedby the human malaria parasite Plasmodium falciparum. MalariaJ. 2009, 8.
(45) Davidson, E. A.; Gowda, D. C.; Yang, S. T.; Nikodem, D.; Naik, R.Glycobiology of the malaria parasite. Glycobiology 1999, 9 (10),52.
(46) Gowda, D. C.; Davidson, E. A. Protein glycosylation in the malariaparasite. Parasitol. Today 1999, 15 (4), 147–152.
(47) Yang, S. T.; Nikodem, D.; Davidson, E. A.; Gowda, D. C. Glycosy-lation and proteolytic processing of 70 kDa C-terminal recombi-nant polypeptides of Plasmodium falciparum merozoite surfaceprotein 1 expressed in mammalian cells. Glycobiology 1999, 9 (12),1347–1356.
(48) Davidson, E. A.; Gowda, D. C. Glycobiology of Plasmodiumfalciparum. Biochimie 2001, 83 (7), 601–604.
research articles Smit et al.
2180 Journal of Proteome Research • Vol. 9, No. 5, 2010

(49) Miao, J.; Fan, Q.; Cui, L.; Li, J. S.; Li, J. Y.; Cui, L. W. The malariaparasite Plasmodium falciparum histones: Organization, expres-sion, and acetylation. Gene 2006, 369, 53–65.
(50) Medzihradszky, K. F.; Darula, Z.; Perlson, E.; Fainzilber, M.;Chalkley, R. J.; Ball, H.; Greenbaum, D.; Bogyo, M.; Tyson, D. R.;Bradshaw, R. A.; Burlingame, A. L. O-sulfonation of serine andthreonine - Mass spectrometric detection and characterization ofa new posttranslational modification in diverse proteins through-out the eukaryotes. Mol. Cell. Proteomics 2004, 3 (5), 429–440.
(51) Kinoshita, E.; Kinoshita-Kikutal, E.; Matsubara, M.; Aoki, Y.; Ohie,S.; Mouri, Y.; Koike, T. Two-dimensional phosphate-affinity gelelectrophoresis for the analysis of phosphoprotein isotypes. Elec-trophoresis 2009, 30 (3), 550–559.
(52) Thingholm, T. E.; Jensen, O. N.; Larsen, M. R. Analyticalstrategies for phosphoproteomics. Proteomics 2009, 9 (6),1451–1468.
PR9009244
Proteomic Profiling of Plasmodial Proteins research articles
Journal of Proteome Research • Vol. 9, No. 5, 2010 2181


