Embed Size (px)
Citation preview
Proteomics Analysis of Serum from MutantMice Reveals Lysosomal Proteins SelectivelyTransported by Each of the Two Mannose6-Phosphate Receptors*□S
Meiqian Qian‡§, David E. Sleat‡§, Haiyan Zheng‡, Dirk Moore¶, and Peter Lobel‡§�
Most mammalian cells contain two types of mannose6-phosphate (Man-6-P) receptors (MPRs): the 300 kDacation-independent (CI) MPR and 46 kDa cation-depend-ent (CD) MPR. The two MPRs have overlapping function inintracellular targeting of newly synthesized lysosomalproteins, but both are required for efficient targeting. De-spite extensive investigation, the relative roles and spe-cialized functions of each MPR in targeting of specificproteins remain questions of fundamental interest. Onepossibility is that most Man-6-P glycoproteins are trans-ported by both MPRs, but there may be subsets that arepreferentially transported by each. To investigate this, wehave conducted a proteomics analysis of serum frommice lacking either MPR with the reasoning that lysoso-mal proteins that are selectively transported by a givenMPR should be preferentially secreted into the blood-stream in its absence. We purified and identified Man-6-Pglycoproteins and glycopeptides from wild-type, CDMPR-deficient, and CIMPR-deficient mouse serum and foundboth lysosomal proteins and proteins not currentlythought to have lysosomal function. Different mass spec-trometric approaches (spectral count analysis of nano-spray LC-MS/MS experiments on unlabeled samples andLC-MALDI/TOF/TOF experiments on iTRAQ-labeled sam-ples) revealed a number of proteins that appear specifi-cally elevated in serum from each MPR-deficient mouse.Man-6-P glycoforms of cellular repressor of E1A-stimu-lated genes 1, tripeptidyl peptidase I, and heparanasewere elevated in absence of the CDMPR and Man-6-Pglycoforms of alpha-mannosidase B1, cathepsin D, andprosaposin were elevated in the absence of the CIMPR.Results were confirmed by Western blot analyses for se-lect proteins. This study provides a comparison of dif-ferent quantitative mass spectrometric approaches andprovides the first report of proteins whose cellular targetingappears to be MPR-selective under physiological condi-tions. Molecular & Cellular Proteomics 6:58–70, 2007.
The lysosome is a cellular organelle that plays a role in thedegradation of macromolecules and contains �60 knownsoluble hydrolytic enzymes and associated proteins toachieve this purpose (1). Most of these proteins are targetedto the lysosome by the mannose 6-phosphate (Man-6-P)1
pathway. Here, shortly after biosynthesis, the N-linked oligo-saccharides on lysosomal proteins are selectively modified togenerate the Man-6-P recognition marker. The phosphoryla-ted proteins bind to Man-6-P receptors (MPRs) in the transGolgi network (TGN). The receptors and bound ligands entertransport vesicles and travel to a prelysosomal compartmentwhere the receptor and ligands dissociate. The lysosomalproteins subsequently travel to the lysosome while the MPRsrecycle back to the TGN to repeat the process, or to the cellsurface.
Most mammalian cells contain two distinct MPRs, a �46kDa cation-dependent (CD) MPR and a �300 kDa cation-independent (CI) MPR (2, 3). Both receptors are type I trans-membrane glycoproteins that cycle between the TGN, endo-somes, and the plasma membrane. In addition to its role in thetransport of newly synthesized lysosomal proteins, the CI-MPR is also involved in the endocytosis of extracellularMan-6-P glycoproteins, whereas the CDMPR, despite beingpresent on the cell surface, does not function in endocytosisunder physiological conditions. The CIMPR also binds in-sulin-like growth factor II (IGF2) (4, 5), a ligand that does notcontain Man-6-P, and mediates its endocytosis and clear-ance from the bloodstream.
The physiological rationale for the existence of two distinctMPRs has long been a question of fundamental interest (6, 7),and one approach to investigate their individual functions hasbeen to generate mutant mice lacking either type of MPR.CIMPR mutants have developmental abnormalities and usu-ally die perinatally (8, 9), but this is independent of disruptionsin lysosomal enzyme targeting and results from decreased
From the ‡Center for Advanced Biotechnology and Medicine, §De-partment of Pharmacology, University of Medicine and Dentistry ofNew Jersey-Robert Wood Johnson Medical School and ¶Departmentof Biostatistics, University of Medicine and Dentistry of New JerseySchool of Public Health, Piscataway, NJ 08854
Received, May 15, 2007, and in revised form, August 22, 2007Published, MCP Papers in Press, September 11, 2007, DOI
10.1074/mcp.M700217-MCP200
1 The abbreviations used are: Man-6-P, mannose 6-phosphate;MPR, mannose 6-phosphate receptor; CD, cation-dependent; TGN,trans Golgi network; CI, cation-independent; IGF2, insulin-like growthfactor II; FA, formic acid; ACN, acetonitrile; SCX, strong cation ex-change; wt, wild type; MALDI, matrix-assisted laser desorption ioni-zation; TOF, time-of-flight.
Research
© 2007 by The American Society for Biochemistry and Molecular Biology, Inc.58 Molecular & Cellular Proteomics 6.1This paper is available on line at http://www.mcponline.org
clearance of IGF2 and subsequent embryonic overgrowth.Mice lacking both IGF2 and the CIMPR are dwarfs due to thelack of IGF2 but otherwise viable and fertile (9–11). CDMPRmutants are fertile and have no obvious defects (12, 13). Micelacking both the CDMPR and CIMPR in an IGF2-deficientbackground have a short lifespan and exhibit a lysosomalstorage phenotype (10, 14).
Serum from mice lacking either MPR (in an IGF2-deficientbackground) contain elevated levels of Man-6-P glycopro-teins (12, 15), suggesting that both MPRs are required for thecomplete targeting of all lysosomal proteins under physiolog-ical conditions. This conclusion is supported by studies ofprimary fibroblasts derived from these mice that demonstratethat the lack of either MPR results in the missorting of multiplelysosomal proteins while the lack of both MPRs results in thesecretion of even greater amounts (12, 13, 16, 17). In general,the levels of Man-6-P glycoproteins secreted in the absenceof the CIMPR appeared higher than those secreted in theabsence of the CDMPR. This is consistent with binding stud-ies employing purified receptors that indicate that all of theproteins bound by the CDMPR were also bound by the CIMPR(but not vice-versa) and with higher affinity (18). However, ifthere are Man-6-P-containing ligands that are preferentiallytransported by either MPR, they have not been identified todate.
Thus, the precise molecular basis for the requirement fortwo MPRs still remains to be elucidated. One explanation isthat they are required for the targeting of overlapping yetdistinct subsets of lysosomal proteins. Previous investigationsusing a blotting assay revealed that Man-6-P glycoproteins of�26 and �114 kDa were selectively elevated in serum ofCDMPR- and CIMPR-deficient mice, respectively (15). In thecurrent study, we have used mass spectrometric approachesto confirm and extend these observations and to identifyMan-6-P glycoproteins that are selectively elevated in theabsence of each type of MPR. Identification of these proteinsrepresents an important step toward understanding the re-spective function of each receptor in lysosomal proteintargeting.
EXPERIMENTAL PROCEDURES
Materials—Affi-Gel 15, immobilized pH gradient (IPG) strips (11 cmnonlinear pH 3–10) and Triton X-100 were from Bio-Rad (Hercules,CA); leupeptin, pepstatin A, urea, DL-dithiothreitol (DTT), CHAPS,iodoacetamide and horseradish peroxidase-conjugated secondaryantibodies were from Sigma (St. Louis, MO); Pefabloc was fromPentafarm (Basel, Switzerland); SuperSignal West Pico chemilumi-nescent reagent, Surfact-Amps Triton X-100 and TCEP hydrochloridewere from Pierce (Rockford, IL); IPG buffer pH 3–10 NL was from GEHealthcare (Piscataway, NJ); thiourea was from Fluka (Buchs, Swit-zerland); ASB-14 and Zwittergent 3–10 were from Calbiochem (SanDiego, CA), and iTRAQ reagents were from Applied Biosystems(Framingham, MA).
Mice—All experiments and procedures involving live animals wereconducted in compliance with approved Institutional Animal Care andUse Committee protocols. Adult mice (2–12 months) were killed as
described previously (19). Blood was collected by heart puncture,allowed to clot for 1 h at room temperature, and serum was obtainedby centrifugation at 300 � g for 15 min and stored at �80 °C until use.Blood was collected from wild-type (wt) mice (mixed genetic back-ground; strains BALB/c, 129/Sv, and C57BL/6J), or mice deficient inboth the CIMPR and IGF2 (designated here as CI(-), official designa-tion Igf2r(�/�) Igf2(�/�), mixed genetic background; strainsC57BL/6J and 129/Sv (15)) or mice deficient in the CDMPR (desig-nated here as CD(-), official designation M6pr(�/�), congenicC57BL/6J (12)). While the genetic backgrounds of the groups of micewere not matched, comparison of current blotting experiments (see“Results”) with previous blotting experiments on serum from 16-day-old littermates of similar genetic backgrounds lacking IGF2 (15) indi-cated that that strain differences were unlikely to affect the results.(Note that the receptor deficiencies in the juvenile animals analyzedpreviously appeared to result in a greater magnitude of Man-6-Pglycoprotein secretion compared with the current measurements,possibly due to age differences, but the patterns were quite similar.)However, we cannot exclude some minor variations due to straindependence.
Purification and Immobilization of Each MPR—Soluble bovine CI-MPR (sCIMPR) was purified from fetal bovine serum by affinity chro-matography on immobilized phosphomannan (20) and was coupledto Affi-Gel 15 as described (21) at a density of 2.3 to 4 mg/ml (�9 to16 �M). Soluble bovine CDMPR (sCDMPR) was produced from aPichia pastoris strain expressing a construct encoding the extracyto-plasmic domain engineered to eliminate four of the five N-linkedglycosylation sites (generously provided by Dr. Nancy Dahms) (22).sCDMPR was first isolated from culture medium by absorption onimmobilized phosphomannan. The protein was eluted with 20 mM
sodium acetate pH 4.5 and applied to a Mono S 10/100 GL column(GE Healthcare) which was then eluted with a 0 to 2 M sodium chloridegradient in 20 mM sodium acetate, pH 4.5. Fractions containingsCDMPR were further purified by gel filtration on a 26 � 60 cmSuperdex 75 column (GE Healthcare) equilibrated with 50 mM MESbuffer, pH 6.5 containing 100 mM NaCl. Sypro Ruby (MolecularProbes, Eugene, OR) gel stain of purified sCDMPR indicated novisible contaminants. Purified sCDMPR was immobilized on Affi-Gel15 at a density of 1.4–2.4 mg/ml (�80 to 140 �M).
Affinity Purification of Mouse Serum Man-6-P Glycoproteins—Se-rum was thawed at 37 °C and centrifuged at 13,000 � g for 1.5 h at4 °C. Supernatants were filtered using 6 layers of cheesecloth anddiluted into an equal volume of buffer A (100 mM imidazole, pH 6.5,150 mM NaCl, 20 mM MnCl2, 10 mM �-glycerophosphate, 2% TritonX-100, 2 mM Pefabloc, 2 �g/ml leupeptin, 2 �g/ml pepstatin A).Affinity chromatography was conducted using columns (1 � 10 cm)containing between 2 and 4 ml bed volume of immobilized MPRequilibrated with buffer B (50 mM imidazole, pH 6.5, 150 mM NaCl, 10mM MnCl2, 5 mM �-glycerophosphate, 1 �g/ml leupeptin, 1 �g/mlpepstatin A) containing 1% Triton X-100 and 1 mM Pefabloc. Dilutedserum was loaded onto the columns, which were then washed witheight column volumes of buffer B containing 1% Triton X-100 fol-lowed by washing with buffer B until A280 returned to baseline. Afterwashing, the column was mock eluted using four column volumes ofbuffer B containing 10 mM glucose 6-phosphate (Glu-6-P) followed byspecific elution with four column volumes of buffer B lacking MnCl2and containing 10 mM Man-6-P. Finally, each column was eluted withfour column volumes of 100 mM glycine pH 2.5 to remove tightlybound and nonspecifically bound material. Fractions containing Man-6-P glycoproteins were identified by monitoring the activities of �-glu-curonidase and �-mannosidase (15). In some cases, Man-6-P-con-taining glycoproteins were repurified by MPR affinity chromatographyafter removal of Man-6-P by buffer exchange to buffer B by ultrafil-tration (Ultra-15, Millipore, Billerica, MA). The final Man-6-P eluates
Serum Proteomics and Mannose 6-Phosphate Receptor Function
Molecular & Cellular Proteomics 6.1 59
were concentrated and buffer exchanged to 100 mM ammoniumbicarbonate by ultrafiltration. Protein concentrations were determinedusing the Bradford method (23) with bovine serum albumin as astandard. Aliquots of purified Man-6-P glycoproteins were stored at�80 °C prior to use.
Two-dimensional Gel Electrophoresis—IPG strips were rehydratedfor 14 h with sample in 200 �l rehydration buffer (7 M urea, 1.25%CHAPS, 2 M thiourea, 32.5 mM DTT, 0.65% v/v IPG buffer pH 3–10NL, 0.5% w/v Zwittergent 3–10, 0.5% w/v ASB-14, 0.5% v/v Surfact-Amps Triton X-100, 2.5 mM TCEP hydrochloride, and 0.0002% brom-phenol blue). Isoelectric focusing was conducted using a PROTEANIEF Cell (Bio-Rad) with a current limitation of 50 �A per strip for a totalof 54,000 voltage hours. IPG strips were stored at �80 °C prior totwo-dimensional SDS-PAGE. Proteins in the IPG strips were reducedwith DTT, alkylated with iodoacetamide, and fractionated on 11.5%polyacrylamide gels run at constant current (60 mA per gel) for 6 h.For visualization, preparative gels were stained first with Sypro Rubyand then stained with colloidal Coomassie blue (24) and werescanned using either a Typhoon 9400 (GE Healthcare) or an Epsonscanner.
Detection of Man-6-P Containing Glycoproteins—After fraction-ation by one- or two-dimensional gel electrophoresis, proteins weretransferred to nitrocellulose and glycoproteins containing the Man-6-P modification were detected using 125I-labeled sCIMPR as de-scribed previously (25). Signal was visualized and quantified by stor-age phosphor autoradiography using a Typhoon 9400 scanner (GEHealthcare) and ImageQuant 5.2 software, respectively.
In-gel Tryptic Digestion—Gel slices or spots excised from one-dimensional and two-dimensional gels were digested with modifiedtrypsin (Promega, Madison, WI) as described. In addition, for Prepa-ration B, digested gel slices were extracted using 60% acetonitrile(ACN)/5% formic acid (FA) and pooled with the supernatants prior todrying samples and subsequent LC-MS/MS.
iTRAQ Labeling—iTRAQ labeling (26) was performed according tothe manufacturer’s protocol (Applied Biosystems). We conducted twoiTRAQ experiments. The first iTRAQ experiment was conducted onmaterial from B1 (iTRAQ 1, Fig. 1). Three samples representing equalamounts of protein (30 �g) purified from wt, CD(-) and CI(-) mouseserum were each spiked with 1/100 (w/w) chicken ovalbumin (Sigma)as an internal standard to monitor recovery. Samples were denaturedwith guanidine hydrochloride, reduced with DTT, and alkylated withiodoacetamide as described previously (27). Samples were bufferexchanged by ultrafiltration using YM-10 Microcon devices (Millipore)to 50 mM ammonium bicarbonate and modified trypsin (1:50 w/w ratiotrypsin:substrate) was added to the retentate. After incubation at37 °C for 16 h, peptides were eluted by centrifugation at 13,000 rpmfor 15 min with two washes of 200 �l 50 mM ammonium bicarbonate.Pooled fractions were dried using a vacuum concentrator and resid-ual ammonium bicarbonate was removed using three cycles of dryingand resuspension in 200 �l 50% methanol. A 50 �l portion wasremoved from each of the wt, CD(-) and CI(-) samples and pooled togenerate a fourth sample that served as an internal control for sub-sequent steps. Samples were dried, dissolved in 30 �l 0.5 M triethyl-ammonium bicarbonate, and iTRAQ reagent dissolved in 70 �l ofethanol was added before incubation for 1 h at 20 °C. Labeling wasverified by matrix-assisted laser desorption ionization (MALDI)/time-of-flight (TOF) (MALDI)/time-of-flight (TOF)/TOF analysis using an Ap-plied Biosystems 4800. Labeling was nearly complete, as revealed bysubsequent database searching with the LC-MALDI/TOF/TOF dataallowing for variable iTRAQ modification, which failed to detect asignificant number of unlabeled peptides. Samples labeled with dif-ferent iTRAQ reagents were dried using a vacuum concentrator,dissolved in 50% methanol, and pooled. Aliquots were vacuum-driedand stored at �80 °C until use.
The second iTRAQ experiment was conducted on material from B1and B2 (iTRAQ 2, Fig. 1). In brief, four samples representing equalamounts of protein (20 �g) purified from CD(-) and CI(-) mouse serumwere spiked with chicken ovalbumin and processed as describedabove without generating the pooled standard.
Two-dimensional Liquid Chromatography of iTRAQ Samples—Forty micrograms of an iTRAQ-labeled mixture was dissolved in 100�l 0.1% FA, and loaded onto a pipette C18 tip (SPEC, Varian, LakeForest, CA) equilibrated with 0.1% FA. The absorbed sample waswashed with 300 �l 0.1% FA and peptides eluted with 100 �l of 50%ACN containing 0.1% FA and then 100 �l of 80% ACN/0.1% FA.Eluates were pooled and vacuum-dried. To reduce sample complex-ity prior to tandem mass spectrometry, iTRAQ labeled peptides werefractionated by two-dimensional liquid chromatography consisting ofstrong cation exchange (SCX) followed by reverse phase liquid chro-matography. For SCX, the dried mixture was dissolved in 25 �l bufferA (5 mM KH2PO4 and 25% ACN, pH 3.0) and applied to a polysulfo-ethyl A column (PolyLC Inc, Columbia, MD), 0.30 � 150 mm, 5 �m,300Å, using an Ultimate LC system (Dionex, Sunnyvale, CA) with flowrate of 4 �l/min. Buffer B consisted of 5 mM KH2PO4, 25% ACN and400 mM KCl, pH 3.0. The column was washed with Buffer A for 5 min;then peptides eluted with a gradient of 0–100% Buffer B in 30 minfollowed by 100% Buffer B for 5 min. Fractions were collected at 4min intervals and vacuum-dried. For second dimension reverse phaseliquid chromatography, SCX fractions of interest were dissolved in 10�l 0.1% TFA, and 5 �l was loaded onto a 300 �m � 5 mm C18 trapcolumn (Dionex). The trap column was washed with 0.1% TFA. Theflow was reversed and connected to a 75 �m � 12 cm column(in-house packed with Magic C18AQ, 3 �m, 200Å, Michrom BioRe-sources Inc., Auburn, CA). Peptides were eluted using a linear gradi-ent of 0–50% ACN in 0.1% TFA at a flow rate of 200 nl/min for 30 minwith an infusion of 5 mg/ml alpha-cyano-4-hydroxy cinnamic acid in50% ACN containing 0.1% TFA at a flow rate of 1.5 �l/min. Fractionswere collected every 10 s and spotted onto a 384-well MALDI plateusing a Probot microfraction collector (Dionex).
Tandem Mass Spectrometry—Nanospray LC-MS/MS of tryptic di-gests was conducted using an LTQ linear ion trap mass spectrometer(Thermo Electron, San Jose, CA) as described previously (28). Tan-dem MALDI mass spectrometry was conducted using an AppliedBiosystems 4800 MALDI-TOF/TOF. MS spectra were acquired in awindow of m/z 800–4000 in positive ion reflectron mode. The 15 mostabundant precursor ions with a signal-to-noise ratio �10 were se-lected for top-down MS/MS scans, excluding identical precursor ionscontained in adjacent spots from a given LC-MALDI run. MS/MS wasconducted using medium collision energy (1 kV) in positive ion mode.
Identification of Sites of Man-6-P Modification—Affinity purifiedprotein samples (10 �g) were denatured, reduced, and alkylated (27).Samples were buffer exchanged by ultrafiltration to 50 mM ammoniumbicarbonate and then digested with trypsin alone or trypsin togetherwith Glu-C (Roche). The Man-6-P-containing peptides were purifiedon an immobilized sCIMPR microcolumn and deglycosylated withEndo Hf as described previously (29).
Data Analysis—For analysis of LTQ data, peak lists were generatedusing the Sequest module of Bioworks 3.3 (Thermo Electron) usingpreviously described parameters (29). For analysis of 4800 data, peaklists were generated using the “Launch Peaks to Mascot” function ofthe 4000 Series Explorer software (Applied Biosystems) using thefollowing parameters: minimum signal to noise for both MS andMS/MS peaks was 20; minimum peak area of 1000 for both MS andMS/MS; MS spectra range, m/z from 500 to 4000; MS/MS spectrarange, m/z from 60 to 20 units below the m/z of the selected precursorion. Database searches were conducted using a local version of theGlobal Proteome Machine (GPM) (30, 31) (GPM-USB, Beavis Infor-matics Ltd., Winnipeg, Canada) using a combined ENSEMBL mouse
Serum Proteomics and Mannose 6-Phosphate Receptor Function
60 Molecular & Cellular Proteomics 6.1
NCBIm36.42 database (29784 unique sequences) and a database ofnon-mouse protein contaminants (cRAP, GPM common Repositoryof Adventious Proteins). Data files generated with a given instrumentwere searched both individually and together to produce a mergedoutput using the “Mudpit” option. LTQ LC-MS/MS data were ana-lyzed as described (29), and 4800 MALDI-TOF/TOF data weresearched using a precursor ion mass error of 100 ppm and a fragmentmass error of 0.4 Da. Thresholds for the minimum number of MS/MSfragments were 5 and 15 for the MALDI-TOF/TOF and LTQ data,respectively. For all MS/MS searches, cysteine carbamidomethylationwas a constant modification, oxidation of methionine was a variablemodification, and one missed cleavage was allowed during the pre-liminary model development. The threshold used for model refine-ment was a peptide expectation score of 0.0001. During refinement,deamidation at asparagine and glutamine residues was allowed. Foranalysis of iTRAQ experiments, modifications were as describedabove except a fixed iTRAQ modification at lysines and peptideamino termini were specified during preliminary model developmentand refinement.
The spectral count method (32) was used to estimate the relativeabundance of a given protein in two different sample types analyzedusing LC-MS/MS. The total number of spectra assigned to a givengene product was tabulated for each type of sample (note that in thisanalysis, spectral counts assigned to different accession numbers ofthe same gene, polymorphisms and splice variants, were combined).The proportion of counts in a given sample was calculated as
p̂ �a
a � b(Eq. 1)
where a and b represent the spectral counts of a given protein insamples a and b, respectively. The statistical tests used are describedin (33) unless noted otherwise and computed using the open sourcelanguage R (R Foundation for Statistical Computing). Upper and lower95% confidence intervals were calculated using Wilson’s method (34)to estimate counting errors. One-sided p values were calculated usingthe exact binomial test to determine if values were significantly dif-ferent from 1, 1.5, and 2 (see “Results”). p values were transformed toq values to control for the false discovery rate among multiple com-parisons (35). To estimate fold differences, data are presented aslog2� a
b�, which is formally,
logit2� p̂� � log2� p̂1 � p̂� (Eq. 2)
For clarity of presentation, for a � 0 or a/b � 0.1, the log2� a
b� valuewas replaced by �3.32 (log2 0.1), while for b � 0 or a/b � 10, itwas replaced by 3.32 (log210). Fisher’s exact test was also used tocalculate confidence intervals and significance values for odds ratios,estimated as
OR i �ai /at
bi /bt (Eq. 3)
where ai and bi represent the spectral counts of a given protein i insamples a and b, respectively, and at and bt represent the totalspectral counts in samples a and b, respectively. Statistics are in-cluded in supplemental Table VII.
For calculation of iTRAQ reporter ion ratios, in-house PERL scriptswere used to generate a list of identified spectra and associatedinformation from the GPM xml files and to extract relevant peak areasfrom the Oracle database used by the TOF-TOF for data acquisition.These data were subsequently manipulated using Microsoft Excel.Matrix functions were used to adjust iTRAQ reporter ion peak areasfor crossover using correction factors supplied by the vendor. The
following inclusion criteria were applied to increase the quality of thedata set: 1) only proteins with GPM expectation scores of 10�5 orbetter were chosen for further analysis; 2) for all comparisons, datawere excluded if the average iTRAQ reporter ion intensity was below10,000 or if any individual intensity was below 1000 (see “Results”);and 3) proteins were required to be represented by at least twoindependent peptides for inclusion in the final analysis. The log2
values of the remaining peak area ratios were used to calculate amean and standard deviation for each protein. Student’s two-samplet test (assuming equal variance) was used to calculate p values, andq values were subsequently calculated as described above.
Western Blot Analysis—Samples were fractionated by electro-phoresis on 10% NuPAGE Bis-Tris precast gels (Invitrogen, Carlsbad,CA). Proteins were transferred to nitrocellulose and baked for 2 hunder vacuum. Membranes were probed with a goat antibody againstcellular repressor of E1A-stimulated genes 1 (R&D Systems), rabbitantibodies against alpha-mannosidase B1 (kindly provided by Dr.Daulat Tulsiani) (36), tripeptidyl peptidase I (37), Niemann Pick typeC2 (38), and cathepsin D (Calbiochem). Bound antibodies were visu-alized using SuperSignal West Pico chemiluminescent substrate afterprobing with horseradish peroxidase-conjugated goat anti-rabbit orrabbit anti-goat secondary antibodies.
RESULTS
Purification and Comparison of Man-6-P Containing Glyco-proteins—The overall goal of this study was to identify pro-teins that might interact preferentially with one of the twoMPRs and thus provide an avenue for the investigation ofindividual MPR-specific functions. Our initial approach was tofractionate wild-type mouse brain, a rich source of Man-6-Pglycoproteins, using columns of either immobilized sCIMPRor sCDMPR. Equivalent amounts of brain extract were appliedto both columns, and after washing, each column was elutedfirst with Man-6-P and then with 100 mM glycine pH 2.5. TheMan-6-P and glycine eluates were analyzed using 125I-labeledsCIMPR (supplemental Fig. 1) and LC-MS/MS (supplementalTable I). These analyses helped characterize the brain Man-6-P glycoproteome as well as identifying additional potentialligands for the CIMPR (see “Discussion”). However, no pro-found differences were found by 125I-labeled sCIMPR blot-ting, and a serious concern with this purification approach isthat the concentration of immobilized MPRs used (micromolarrange) greatly exceeded the Kd of most phosphorylated lyso-somal proteins for each receptor (typically nanomolar range(18)); thus, biologically relevant differences in affinity wouldmost likely be masked. In addition, conditions used for in vitrobinding assays may not reflect the physiological conditionsthat the MPRs experience in the TGN.
Given these concerns, we chose to identify the spectrum ofMan-6-P-containing glycoproteins present in serum of micelacking either type of MPR and to estimate their relative abun-dances. The rationale was that, if intracellular lysosomal tar-geting for a given newly synthesized protein is selectivelymediated by a single MPR, it would be selectively secreted inthe absence of that MPR and thus may be elevated in blood(15). To this end, we conducted two large scale purificationexperiments on wt, CD(-), and CI(-) serum, with the overall
Serum Proteomics and Mannose 6-Phosphate Receptor Function
Molecular & Cellular Proteomics 6.1 61
experimental design shown in Fig. 1. The two purificationsserved as both biological and technical replicates, usingpooled sera obtained from different animals (�100 animals ofeach genotype were used per purification). In addition, thetwo purifications were designed to evaluate different experi-mental factors.
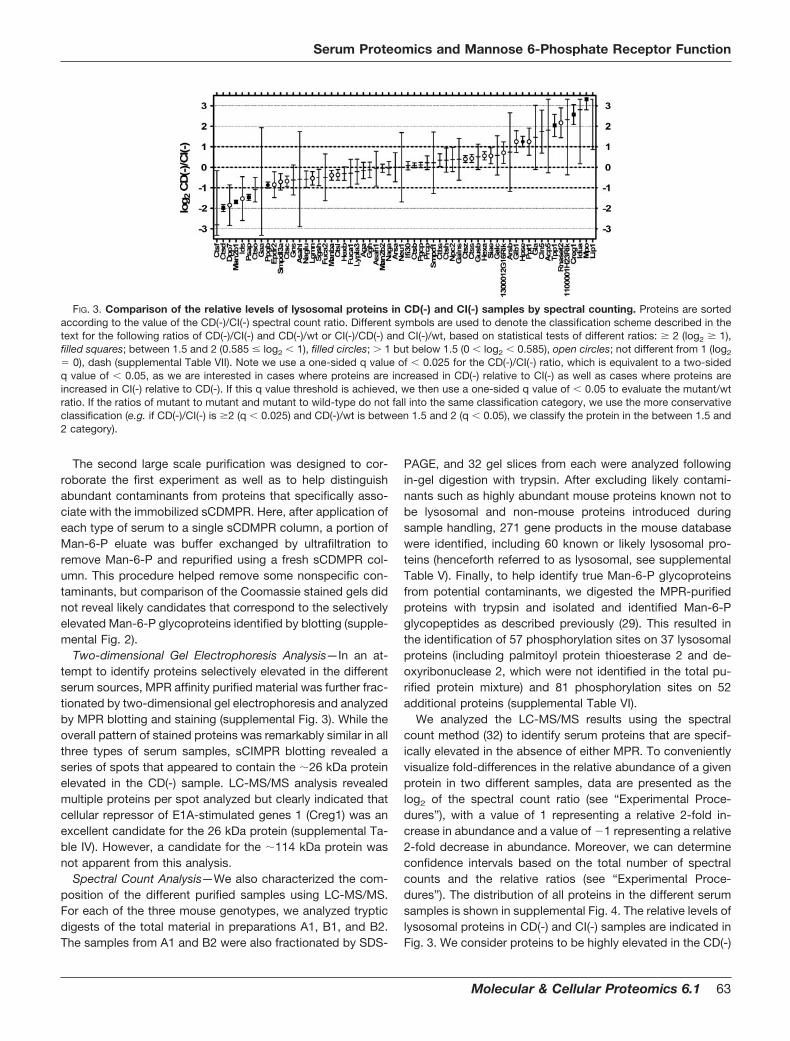
The first large scale preparation was designed to monitorcolumn capacity and specificity of the immobilized MPRs.Mouse serum was applied to two columns connected in tan-dem, the first containing immobilized sCDMPR, the secondcontaining immobilized sCIMPR. This geometry was chosenbecause in vitro binding studies indicated that, at submicro-molar concentrations, the CIMPR was more effective in cap-turing Man-6-P glycoproteins than the CDMPR and, thus, thesecond column could capture ligands that might not bebound by the first (18). After extensive washing, the twocolumns were disconnected. Each column was mock elutedwith 10 mM Glu-6-P, and specifically eluted with 10 mM Man-6-P. Finally, each column was eluted with 100 mM glycine pH2.5. The material specifically eluted from the columns byMan-6-P was analyzed by 125I-labeled sCIMPR blotting toestimate recovery of Man-6-P glycoproteins. For all seratested, we found that the first sCDMPR column retained al-
most all of the Man-6-P glycoproteins (see legend, Fig. 2).Essentially no signal was detected in material eluting withglycine, indicating that Man-6-P was sufficient to elute allMan-6-P-containing glycoproteins (data not shown). More-over, there were no unique bands apparent from MPR blottingthat were selectively retained by the second sCIMPR column(Fig. 2, compare A1 and A1�). In addition, LC-MS/MS analysison equivalent amounts of protein from each column eluate didnot reveal any lysosomal proteins that did not adhere to thesCDMPR column and that were selectively retained by thesCIMPR column (supplemental Table II).
The yields of MPR-purified protein were �10–50 �g/mlserum, representing a purification factor �1000, given a totalserum protein concentration of �70 mg/ml. Blotting revealedthat, compared with wild-type controls, Man-6-P glycoproteinlevels per milliliter of serum were elevated �3 and �5 fold inCD(-) and CI(-) mouse serum, respectively (Fig. 2, middlepanel, and supplemental Table III). Note that analysis of un-fractionated sera by MPR-blotting reveals �26 kDa and �114kDa proteins enriched in the CD(-) and CI(-) sera, respectively,as seen previously in MPR-deficient mice (15). While thesebands were also observed in the MPR-affinity purified sam-ples, the MPR purification step also allowed visualization ofnumerous additional Man-P glycoproteins that were previ-ously obscured by albumin and other abundant serum pro-teins (Fig. 2).
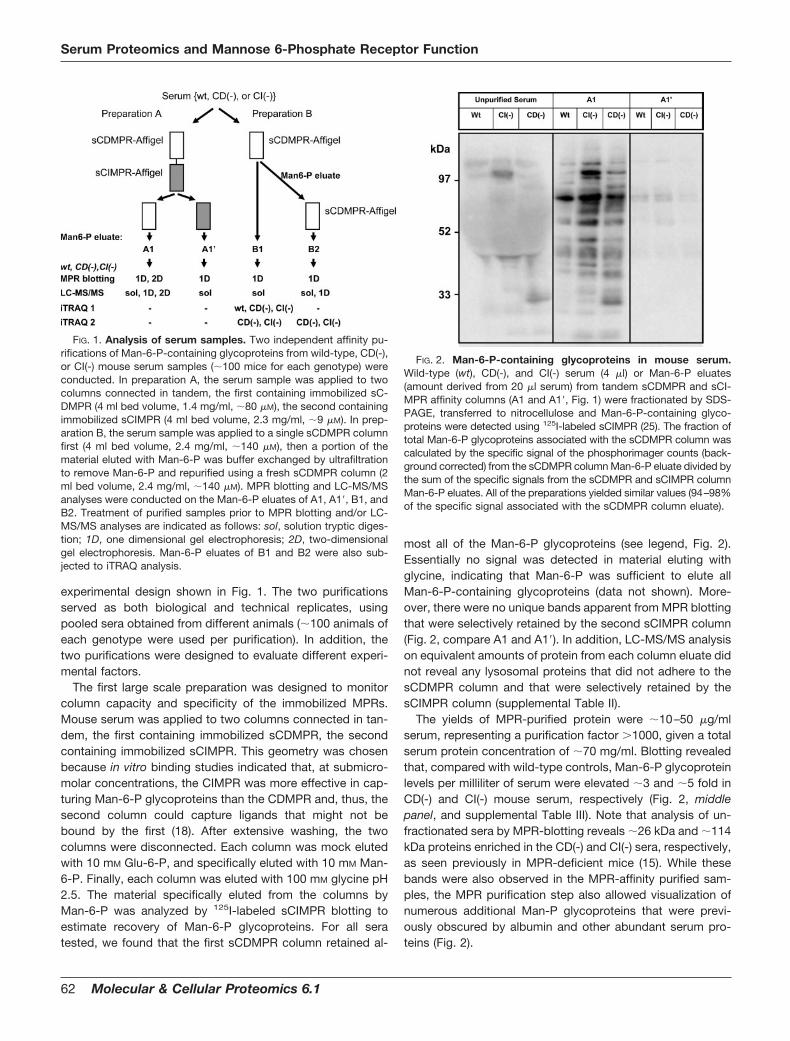
FIG. 1. Analysis of serum samples. Two independent affinity pu-rifications of Man-6-P-containing glycoproteins from wild-type, CD(-),or CI(-) mouse serum samples (�100 mice for each genotype) wereconducted. In preparation A, the serum sample was applied to twocolumns connected in tandem, the first containing immobilized sC-DMPR (4 ml bed volume, 1.4 mg/ml, �80 �M), the second containingimmobilized sCIMPR (4 ml bed volume, 2.3 mg/ml, �9 �M). In prep-aration B, the serum sample was applied to a single sCDMPR columnfirst (4 ml bed volume, 2.4 mg/ml, �140 �M), then a portion of thematerial eluted with Man-6-P was buffer exchanged by ultrafiltrationto remove Man-6-P and repurified using a fresh sCDMPR column (2ml bed volume, 2.4 mg/ml, �140 �M). MPR blotting and LC-MS/MSanalyses were conducted on the Man-6-P eluates of A1, A1�, B1, andB2. Treatment of purified samples prior to MPR blotting and/or LC-MS/MS analyses are indicated as follows: sol, solution tryptic diges-tion; 1D, one dimensional gel electrophoresis; 2D, two-dimensionalgel electrophoresis. Man-6-P eluates of B1 and B2 were also sub-jected to iTRAQ analysis.
FIG. 2. Man-6-P-containing glycoproteins in mouse serum.Wild-type (wt), CD(-), and CI(-) serum (4 �l) or Man-6-P eluates(amount derived from 20 �l serum) from tandem sCDMPR and sCI-MPR affinity columns (A1 and A1�, Fig. 1) were fractionated by SDS-PAGE, transferred to nitrocellulose and Man-6-P-containing glyco-proteins were detected using 125I-labeled sCIMPR (25). The fraction oftotal Man-6-P glycoproteins associated with the sCDMPR column wascalculated by the specific signal of the phosphorimager counts (back-ground corrected) from the sCDMPR column Man-6-P eluate divided bythe sum of the specific signals from the sCDMPR and sCIMPR columnMan-6-P eluates. All of the preparations yielded similar values (94–98%of the specific signal associated with the sCDMPR column eluate).
Serum Proteomics and Mannose 6-Phosphate Receptor Function
62 Molecular & Cellular Proteomics 6.1
The second large scale purification was designed to cor-roborate the first experiment as well as to help distinguishabundant contaminants from proteins that specifically asso-ciate with the immobilized sCDMPR. Here, after application ofeach type of serum to a single sCDMPR column, a portion ofMan-6-P eluate was buffer exchanged by ultrafiltration toremove Man-6-P and repurified using a fresh sCDMPR col-umn. This procedure helped remove some nonspecific con-taminants, but comparison of the Coomassie stained gels didnot reveal likely candidates that correspond to the selectivelyelevated Man-6-P glycoproteins identified by blotting (supple-mental Fig. 2).
Two-dimensional Gel Electrophoresis Analysis—In an at-tempt to identify proteins selectively elevated in the differentserum sources, MPR affinity purified material was further frac-tionated by two-dimensional gel electrophoresis and analyzedby MPR blotting and staining (supplemental Fig. 3). While theoverall pattern of stained proteins was remarkably similar in allthree types of serum samples, sCIMPR blotting revealed aseries of spots that appeared to contain the �26 kDa proteinelevated in the CD(-) sample. LC-MS/MS analysis revealedmultiple proteins per spot analyzed but clearly indicated thatcellular repressor of E1A-stimulated genes 1 (Creg1) was anexcellent candidate for the 26 kDa protein (supplemental Ta-ble IV). However, a candidate for the �114 kDa protein wasnot apparent from this analysis.
Spectral Count Analysis—We also characterized the com-position of the different purified samples using LC-MS/MS.For each of the three mouse genotypes, we analyzed trypticdigests of the total material in preparations A1, B1, and B2.The samples from A1 and B2 were also fractionated by SDS-
PAGE, and 32 gel slices from each were analyzed followingin-gel digestion with trypsin. After excluding likely contami-nants such as highly abundant mouse proteins known not tobe lysosomal and non-mouse proteins introduced duringsample handling, 271 gene products in the mouse databasewere identified, including 60 known or likely lysosomal pro-teins (henceforth referred to as lysosomal, see supplementalTable V). Finally, to help identify true Man-6-P glycoproteinsfrom potential contaminants, we digested the MPR-purifiedproteins with trypsin and isolated and identified Man-6-Pglycopeptides as described previously (29). This resulted inthe identification of 57 phosphorylation sites on 37 lysosomalproteins (including palmitoyl protein thioesterase 2 and de-oxyribonuclease 2, which were not identified in the total pu-rified protein mixture) and 81 phosphorylation sites on 52additional proteins (supplemental Table VI).
We analyzed the LC-MS/MS results using the spectralcount method (32) to identify serum proteins that are specif-ically elevated in the absence of either MPR. To convenientlyvisualize fold-differences in the relative abundance of a givenprotein in two different samples, data are presented as thelog2 of the spectral count ratio (see “Experimental Proce-dures”), with a value of 1 representing a relative 2-fold in-crease in abundance and a value of �1 representing a relative2-fold decrease in abundance. Moreover, we can determineconfidence intervals based on the total number of spectralcounts and the relative ratios (see “Experimental Proce-dures”). The distribution of all proteins in the different serumsamples is shown in supplemental Fig. 4. The relative levels oflysosomal proteins in CD(-) and CI(-) samples are indicated inFig. 3. We consider proteins to be highly elevated in the CD(-)
FIG. 3. Comparison of the relative levels of lysosomal proteins in CD(-) and CI(-) samples by spectral counting. Proteins are sortedaccording to the value of the CD(-)/CI(-) spectral count ratio. Different symbols are used to denote the classification scheme described in thetext for the following ratios of CD(-)/CI(-) and CD(-)/wt or CI(-)/CD(-) and CI(-)/wt, based on statistical tests of different ratios: � 2 (log2 � 1),filled squares; between 1.5 and 2 (0.585 � log2 1), filled circles; � 1 but below 1.5 (0 log2 0.585), open circles; not different from 1 (log2
� 0), dash (supplemental Table VII). Note we use a one-sided q value of 0.025 for the CD(-)/CI(-) ratio, which is equivalent to a two-sidedq value of 0.05, as we are interested in cases where proteins are increased in CD(-) relative to CI(-) as well as cases where proteins areincreased in CI(-) relative to CD(-). If this q value threshold is achieved, we then use a one-sided q value of 0.05 to evaluate the mutant/wtratio. If the ratios of mutant to mutant and mutant to wild-type do not fall into the same classification category, we use the more conservativeclassification (e.g. if CD(-)/CI(-) is �2 (q 0.025) and CD(-)/wt is between 1.5 and 2 (q 0.05), we classify the protein in the between 1.5 and2 category).
Serum Proteomics and Mannose 6-Phosphate Receptor Function
Molecular & Cellular Proteomics 6.1 63
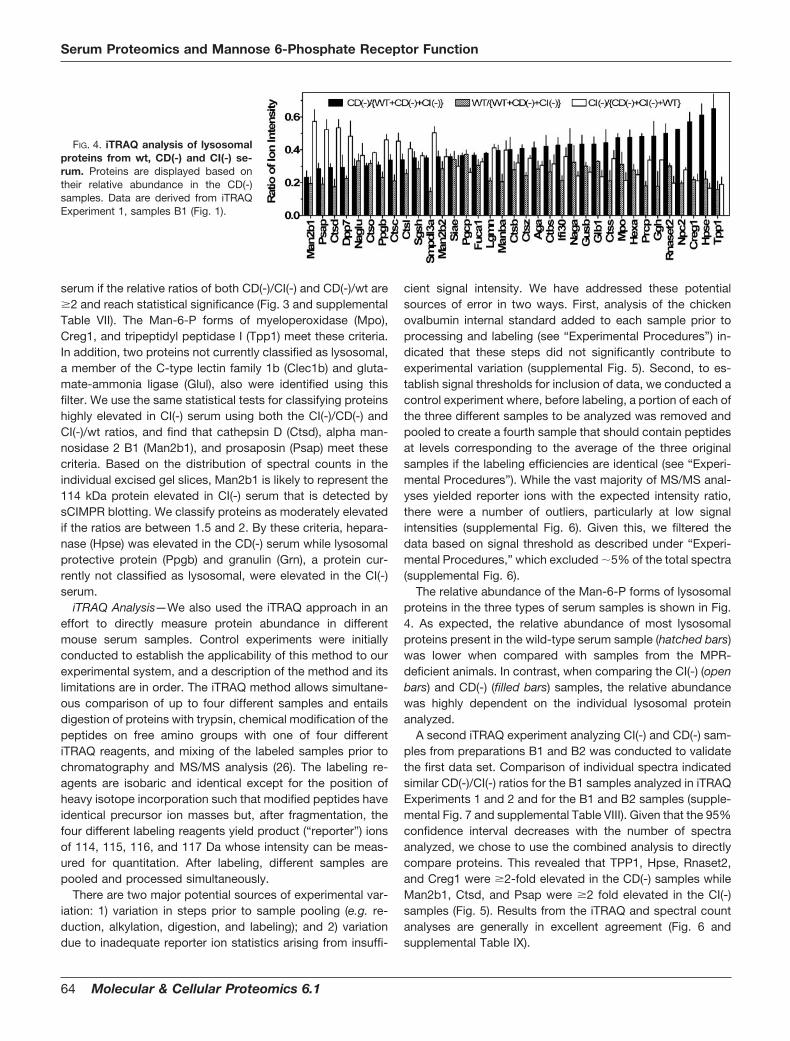
serum if the relative ratios of both CD(-)/CI(-) and CD(-)/wt are�2 and reach statistical significance (Fig. 3 and supplementalTable VII). The Man-6-P forms of myeloperoxidase (Mpo),Creg1, and tripeptidyl peptidase I (Tpp1) meet these criteria.In addition, two proteins not currently classified as lysosomal,a member of the C-type lectin family 1b (Clec1b) and gluta-mate-ammonia ligase (Glul), also were identified using thisfilter. We use the same statistical tests for classifying proteinshighly elevated in CI(-) serum using both the CI(-)/CD(-) andCI(-)/wt ratios, and find that cathepsin D (Ctsd), alpha man-nosidase 2 B1 (Man2b1), and prosaposin (Psap) meet thesecriteria. Based on the distribution of spectral counts in theindividual excised gel slices, Man2b1 is likely to represent the114 kDa protein elevated in CI(-) serum that is detected bysCIMPR blotting. We classify proteins as moderately elevatedif the ratios are between 1.5 and 2. By these criteria, hepara-nase (Hpse) was elevated in the CD(-) serum while lysosomalprotective protein (Ppgb) and granulin (Grn), a protein cur-rently not classified as lysosomal, were elevated in the CI(-)serum.
iTRAQ Analysis—We also used the iTRAQ approach in aneffort to directly measure protein abundance in differentmouse serum samples. Control experiments were initiallyconducted to establish the applicability of this method to ourexperimental system, and a description of the method and itslimitations are in order. The iTRAQ method allows simultane-ous comparison of up to four different samples and entailsdigestion of proteins with trypsin, chemical modification of thepeptides on free amino groups with one of four differentiTRAQ reagents, and mixing of the labeled samples prior tochromatography and MS/MS analysis (26). The labeling re-agents are isobaric and identical except for the position ofheavy isotope incorporation such that modified peptides haveidentical precursor ion masses but, after fragmentation, thefour different labeling reagents yield product (“reporter”) ionsof 114, 115, 116, and 117 Da whose intensity can be meas-ured for quantitation. After labeling, different samples arepooled and processed simultaneously.
There are two major potential sources of experimental var-iation: 1) variation in steps prior to sample pooling (e.g. re-duction, alkylation, digestion, and labeling); and 2) variationdue to inadequate reporter ion statistics arising from insuffi-
cient signal intensity. We have addressed these potentialsources of error in two ways. First, analysis of the chickenovalbumin internal standard added to each sample prior toprocessing and labeling (see “Experimental Procedures”) in-dicated that these steps did not significantly contribute toexperimental variation (supplemental Fig. 5). Second, to es-tablish signal thresholds for inclusion of data, we conducted acontrol experiment where, before labeling, a portion of each ofthe three different samples to be analyzed was removed andpooled to create a fourth sample that should contain peptidesat levels corresponding to the average of the three originalsamples if the labeling efficiencies are identical (see “Experi-mental Procedures”). While the vast majority of MS/MS anal-yses yielded reporter ions with the expected intensity ratio,there were a number of outliers, particularly at low signalintensities (supplemental Fig. 6). Given this, we filtered thedata based on signal threshold as described under “Experi-mental Procedures,” which excluded �5% of the total spectra(supplemental Fig. 6).
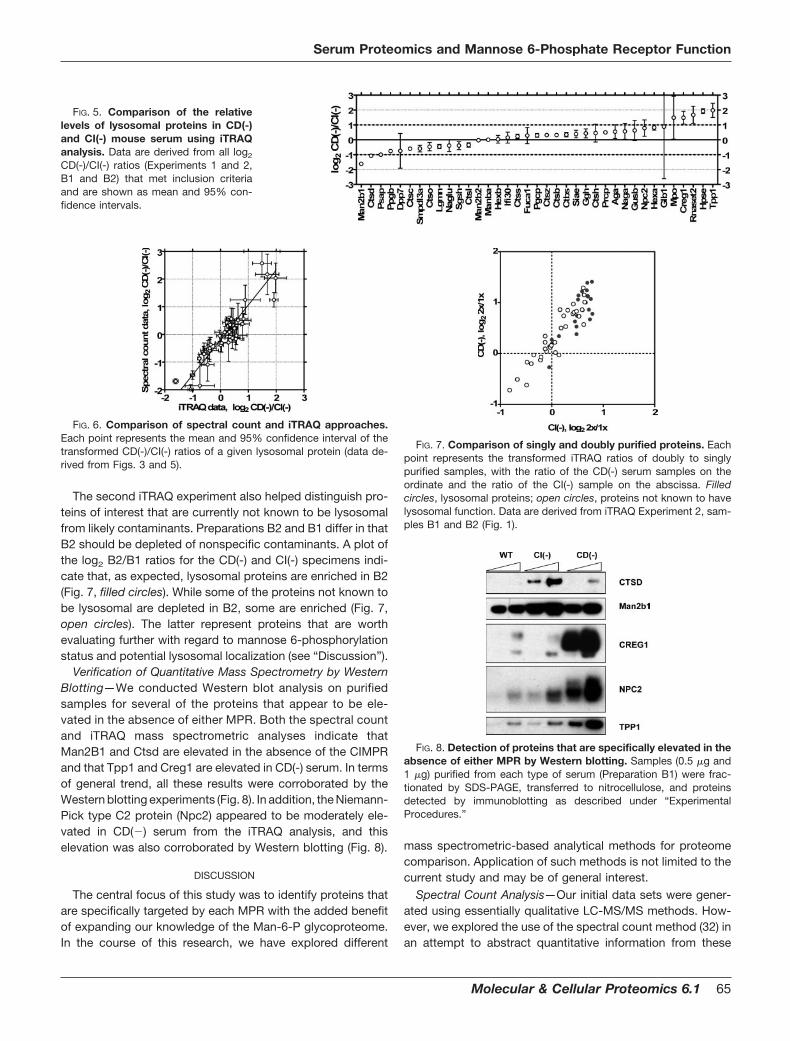
The relative abundance of the Man-6-P forms of lysosomalproteins in the three types of serum samples is shown in Fig.4. As expected, the relative abundance of most lysosomalproteins present in the wild-type serum sample (hatched bars)was lower when compared with samples from the MPR-deficient animals. In contrast, when comparing the CI(-) (openbars) and CD(-) (filled bars) samples, the relative abundancewas highly dependent on the individual lysosomal proteinanalyzed.
A second iTRAQ experiment analyzing CI(-) and CD(-) sam-ples from preparations B1 and B2 was conducted to validatethe first data set. Comparison of individual spectra indicatedsimilar CD(-)/CI(-) ratios for the B1 samples analyzed in iTRAQExperiments 1 and 2 and for the B1 and B2 samples (supple-mental Fig. 7 and supplemental Table VIII). Given that the 95%confidence interval decreases with the number of spectraanalyzed, we chose to use the combined analysis to directlycompare proteins. This revealed that TPP1, Hpse, Rnaset2,and Creg1 were �2-fold elevated in the CD(-) samples whileMan2b1, Ctsd, and Psap were �2 fold elevated in the CI(-)samples (Fig. 5). Results from the iTRAQ and spectral countanalyses are generally in excellent agreement (Fig. 6 andsupplemental Table IX).
FIG. 4. iTRAQ analysis of lysosomalproteins from wt, CD(-) and CI(-) se-rum. Proteins are displayed based ontheir relative abundance in the CD(-)samples. Data are derived from iTRAQExperiment 1, samples B1 (Fig. 1).
Serum Proteomics and Mannose 6-Phosphate Receptor Function
64 Molecular & Cellular Proteomics 6.1
The second iTRAQ experiment also helped distinguish pro-teins of interest that are currently not known to be lysosomalfrom likely contaminants. Preparations B2 and B1 differ in thatB2 should be depleted of nonspecific contaminants. A plot ofthe log2 B2/B1 ratios for the CD(-) and CI(-) specimens indi-cate that, as expected, lysosomal proteins are enriched in B2(Fig. 7, filled circles). While some of the proteins not known tobe lysosomal are depleted in B2, some are enriched (Fig. 7,open circles). The latter represent proteins that are worthevaluating further with regard to mannose 6-phosphorylationstatus and potential lysosomal localization (see “Discussion”).
Verification of Quantitative Mass Spectrometry by WesternBlotting—We conducted Western blot analysis on purifiedsamples for several of the proteins that appear to be ele-vated in the absence of either MPR. Both the spectral countand iTRAQ mass spectrometric analyses indicate thatMan2B1 and Ctsd are elevated in the absence of the CIMPRand that Tpp1 and Creg1 are elevated in CD(-) serum. In termsof general trend, all these results were corroborated by theWestern blotting experiments (Fig. 8). In addition, the Niemann-Pick type C2 protein (Npc2) appeared to be moderately ele-vated in CD(�) serum from the iTRAQ analysis, and thiselevation was also corroborated by Western blotting (Fig. 8).
DISCUSSION
The central focus of this study was to identify proteins thatare specifically targeted by each MPR with the added benefitof expanding our knowledge of the Man-6-P glycoproteome.In the course of this research, we have explored different
mass spectrometric-based analytical methods for proteomecomparison. Application of such methods is not limited to thecurrent study and may be of general interest.
Spectral Count Analysis—Our initial data sets were gener-ated using essentially qualitative LC-MS/MS methods. How-ever, we explored the use of the spectral count method (32) inan attempt to abstract quantitative information from these
FIG. 6. Comparison of spectral count and iTRAQ approaches.Each point represents the mean and 95% confidence interval of thetransformed CD(-)/CI(-) ratios of a given lysosomal protein (data de-rived from Figs. 3 and 5).
FIG. 7. Comparison of singly and doubly purified proteins. Eachpoint represents the transformed iTRAQ ratios of doubly to singlypurified samples, with the ratio of the CD(-) serum samples on theordinate and the ratio of the CI(-) sample on the abscissa. Filledcircles, lysosomal proteins; open circles, proteins not known to havelysosomal function. Data are derived from iTRAQ Experiment 2, sam-ples B1 and B2 (Fig. 1).
FIG. 8. Detection of proteins that are specifically elevated in theabsence of either MPR by Western blotting. Samples (0.5 �g and1 �g) purified from each type of serum (Preparation B1) were frac-tionated by SDS-PAGE, transferred to nitrocellulose, and proteinsdetected by immunoblotting as described under “ExperimentalProcedures.”
FIG. 5. Comparison of the relativelevels of lysosomal proteins in CD(-)and CI(-) mouse serum using iTRAQanalysis. Data are derived from all log2
CD(-)/CI(-) ratios (Experiments 1 and 2,B1 and B2) that met inclusion criteriaand are shown as mean and 95% con-fidence intervals.
Serum Proteomics and Mannose 6-Phosphate Receptor Function
Molecular & Cellular Proteomics 6.1 65
data. There are several statistical methods that could be usedto analyze spectral count data (39, 40). We have chosensimply to compare the spectral counts in two specimens ofinterest without normalization and calculate confidence inter-vals using the Wilson’s method and significance using theexact binomial test with a false discovery rate correction (see“Results” and supplemental Table VII). We also calculated anodds ratio, taking into account the total spectral counts as-sociated with each specimen, and determine confidence in-tervals and statistical significance using Fisher’s exact test(supplemental Table VII). For the serum samples, both meth-ods yield similar results, which is expected because the totalnumber of spectral counts were similar in the wt, CD(-), andCI(-) data sets. However, when comparing levels of proteins inMan-6-P and glycine eluates of MPR-purified brain samples,the odds ratio analysis appears to overestimate the abun-dance of proteins in the glycine sample where there were farfewer total protein assignments (see below).
We chose to merge results from separate MS-based anal-yses (solution digests and in-gel digests) and purifications (A,B1, and B2, Fig. 1). We think that this is justified as analysis ofeach individual experiment reveals a similar trend in terms ofrelative abundance of a given protein in the wt, CD(-), and CI(-)samples (Supplemental Table V). Data pooling tends to aver-age out random variation between experiments and also in-creases the total number of spectral counts. This is important,as there is considerable inherent uncertainty in the calculatedratios when the spectral counts are low. For instance, for thecase where the spectral counts for a given protein in twosamples differ by a factor of 2, then one would need at least42 total spectral counts (a ratio of 28:14 or 14:28) in order toachieve statistical significance (two-sided p 0.05). (For ex-amples of different simulated ratios, see (40)). Nonetheless,the spectral count method clearly revealed a number of can-didates for MPR-selective ligands.
iTRAQ Analysis—The iTRAQ method produced a high-qual-ity data set after filtering to remove spectra that gave lowreporter ion intensities (see “Experimental Procedures” and“Results”). Low ion intensities are expected to yield poorerestimates of abundance due to signal to noise considerations,as has been observed previously (41). In Experiment 1, wehad an internal control that could be used to filter the data eitherindependently or in addition to the intensity criteria that weapplied. However, this required the use of one of the reporterions and decreases the numbers of comparisons that can bemade in a given iTRAQ experiment, and thus increases theexpense and effort associated with a project. However, eitherfiltering criteria generated similar results (data not shown) so wechose to apply intensity thresholds established from analysis ofiTRAQ Experiment 1 to filter the data from iTRAQ Experiment 2.
Comparison of Analytical Methods—The results generatedusing the iTRAQ and spectral count methods were in excellentagreement. One advantage in the iTRAQ approach is that asingle spectrum yields abundance ratios; and in cases where
the abundance ratios of different spectra or peptides as-signed to a given protein vary, it is possible to inspect each ona case-by-case basis. One limitation was that the total pro-teome coverage in the LC-MALDI experiments was less thanthat obtained by LC-MS/MS on unlabeled samples (e.g. only39 lysosomal proteins were identified in the LC-MALDI/TOF/TOF experiments on iTRAQ labeled samples, two of which didnot yield usable iTRAQ ratios, while 60 proteins were foundusing LC-MS/MS on unlabeled samples.). This in part mayarise from oversampling the more abundant proteins at theexpense of detecting less abundant proteins. For example,we collected 434 acceptable spectra for murinoglobulin 1 butonly 2 for beta-galactosidase. This redundancy might be re-duced by implementing improvements in precursor ion selec-tion for MS/MS analysis such as excluding repeated analysisof peptides that elute in multiple ion exchange fractions orlimiting the number different peptides analyzed that are de-rived from a single protein. In addition, we typically only obtain�3 usable MS/MS spectra (identified peptides with accepta-ble reporter ion statistics) per MALDI spot, and this is open forfurther optimization.
Despite the difference in protein coverage using LC-MALDI/TOF/TOF on iTRAQ labeled samples and LC-MS/MS on un-labeled samples, both yielded similar quantitative results interms of discovering true differences in protein abundances.(supplemental Table IX). For instance, a total of 10 lysosomalproteins were identified as having a �1.5-fold difference whencomparing the CD(-) and CI(-) samples by the spectral countand/or iTRAQ approaches (one-sided q 0.025). Eight pro-teins were identified using both approaches, one was onlyidentified using iTRAQ, and one was only identified using thespectral count analysis. In the latter two cases, both ap-proaches yielded similar trends, but data from only one of theapproaches reached the specified significance level (supple-mental Table IX).
In addition to the agreement of the two MS-based ap-proaches, these results also were supported by the Westernblot analysis. It is important to note that the Western blotexperiments were not quantitative, as revealed by the nonlin-earity of the response from the different amounts of a givensample loaded on the gel, despite a wide range of exposuretimes (Fig. 8 and data not shown). This is not simply due tononlinearity of chemiluminescence and film detection, thereare cases where the same amount of a given protein loadedon two different lanes of a gel yields dramatically differentsignals in Western blotting (42, 43). There are a variety offactors that can account for this, including differences intransfer efficiency of the protein from gel to membrane (42).Our impression is that the MS-based results more accuratelyreflect the relative abundance of the proteins of interest in thedifferent samples, but further work is required to test thisrigorously.
Potential New Man-6-P Glycoproteins and Other Ligandsfor the MPRs—In the course of this study, we analyzed MPR-
Serum Proteomics and Mannose 6-Phosphate Receptor Function
66 Molecular & Cellular Proteomics 6.1
purified preparations from mouse brain and serum. As men-tioned under “Results,” the brain Man-6-P glycoproteins wereaffinity purified on sCIMPR or sCDMPR columns, but datafrom these experiments were not used to classify ligands asCDMPR or CIMPR specific due to the high concentration ofimmobilized MPRs. In addition, the brain Man-6-P glycopro-teins are largely in their processed forms (21, 44, 45), and asprocessing typically occurs after targeting, these do not re-flect the forms that the receptors would encounter in the TGN.This also could affect interaction with the immobilized recep-tors in different ways. For instance, by 125I-labled sCIMPRblotting, we found that in the analysis of brain extracts, a �46kDa Man-6-P protein was predominantly located in the gly-cine eluates from both of the MPR affinity columns. Thiscontrasts markedly with the serum samples, where the levelsof Man-6-P glycoproteins detected in the glycine eluate byMPR blotting were extremely low (data not shown). MS analysisindicated that the �46 KDa brain protein represents the matureform of Tpp1 (supplemental Fig. 1 and supplemental Table I).The inactive precursor form of this protein is soluble and can beeluted from MPR affinity columns using Man-6-P (46) but, afterlow pH-triggered autocatalytic processing, converts to a formthat tends to aggregate and absorb to surfaces (46).
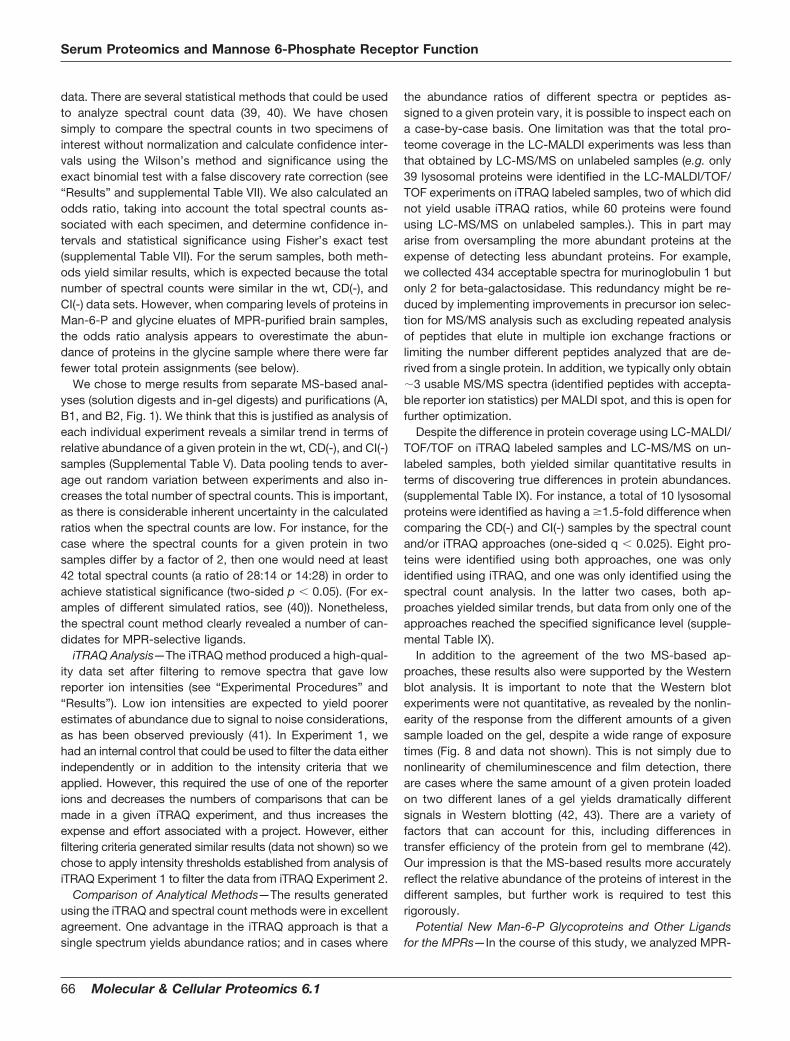
Data from the mouse brain and serum analyses can con-tribute to ongoing studies to identify novel components of theluminal lysosomal proteome (21, 28, 29, 44, 47–53). LC-MS/MS analysis of MPR affinity purified proteins from mousebrain and serum samples have revealed a total of 63 differentlysosomal proteins as well as numerous others that are notknown to reside in the lysosome (supplemental Tables I andV). The latter may represent Man-6-P modified proteins, pro-teins that specifically interact with Man-6-P modified proteins(e.g. protease inhibitors and lectins), contaminants, or pro-teins that interact with a given MPR in a Man-6-P-independ-ent manner (i.e. IGF2). Distinguishing between these possibil-ities is a formidable challenge. Most known lysosomalproteins were found in both the brain and serum samples (Fig.9, left). In contrast, of the total 313 different proteins (afterexcluding likely contaminants) not known to be lysosomal,only 29 were found in both types of samples (Fig. 9, right andsupplemental Tables I and V). These proteins are thus worthyof further consideration. Other criteria can also be used forprioritization (discussed in (28)). These include the detectionof Man-6-P glycopeptides and enrichment of proteins follow-
ing two sequential rounds of MPR-affinity purification. Whencombining these classification strategies, 5 proteins meet allthree criteria, 11 meet two of the three criteria, and 68 meetone of the criteria (supplemental Table X).
The data from the protein identification experiments con-ducted on brain samples contain information that could pro-vide clues toward additional biological functions of the CI-MPR. The CIMPR is a multifunctional protein (2, 3). Theluminal region of the CIMPR consists of 15 contiguous �147amino acids units that are 14–38% identical to each other andthat are similar to the 159 residue luminal domain of theCDMPR. The luminal CDMPR monomer contains a singleMan-6-P binding site while two of the repeating units on theCIMPR contain the high affinity binding sites (domains 3 and9) and domain 11 contains the IGF2 binding site. The CIMPRmay also bind urokinase-type plasminogen activator receptorat a site distinct from the Man-6-P and IGF2 binding sites (54),but this is controversial (55). Given the multiple domains of theCIMPR, it is possible that there are additional, as yet uniden-tified, ligands for this receptor. We would expect that thesewould be enriched in the CIMPR glycine eluate compared withthe glycine eluate of the CDMPR column or the Man-6-Peluates of both MPR columns. Interestingly, IGF2 as well asfour IGF2 binding proteins were found only in the CIMPRcolumn glycine eluate, and there were a number of otherproteins that had similar behavior that may be worthy offurther investigation (supplemental Table I).
Relative Functions of the Two MPRs—The two MPRs arepresent in a wide variety of vertebrates (56), suggesting thateach has a specific and conserved biological function. How-ever, despite over 20 years of investigation (6, 7), the specificrole of each MPR in lysosomal protein targeting remains un-clear. Studies using mutant mice indicate that animals lackingeither the CDMPR (12, 13) or the CIMPR (9) exhibit no appar-ent health defects, whereas the combined MPR deficiencyresults in a profound lysosomal storage phenotype and earlydeath (10, 14). This indicates that each MPR can partiallycompensate for the absence of the other, which complicatesdetermination of MPR-specific functions. Previous studieshave directly examined the affinities of the two MPRs fordifferent Man-6-P-containing ligands with the aim of identify-ing differences that might have functional significance. How-ever, apart from the observations that the CDMPR bindsMan-6-P-containing ligands with lower affinity than the CI-MPR (18, 57), and that the CIMPR but not the CDMPR canbind mannose 6-phosphodiesters (57), no clear differenceswere found that suggest specialized biological functions.Other studies have examined Man-6-P glycoproteins se-creted from cultured cells lacking either MPR with the ration-ale that ligands specific to either MPR should be secreted onlyin the absence of that MPR (16, 17). These studies concludethat, for the most part, the two MPRs direct the lysosomaltargeting of distinct but overlapping populations of Man-6-Pglycoproteins and that neither MPR can fully compensate for
FIG. 9. Number of proteins identified in mouse brain and serumsamples. Left Venn diagram, lysosomal proteins; right Venn diagram,proteins not known to have lysosomal function, excluding likelycontaminants.
Serum Proteomics and Mannose 6-Phosphate Receptor Function
Molecular & Cellular Proteomics 6.1 67
the absence of the other. The CIMPR appears more efficientin targeting newly synthesized lysosomal proteins to the ly-sosome (17, 58), but this in part may be due to its specificability to function in endocytosis and thus recapture secretedlysosomal proteins (59). In particular, cathepsin D was pref-erentially secreted in the absence of the CIMPR (17). How-ever, to our knowledge, no Man-6-P glycoproteins that ap-pear preferentially secreted in the absence of the CDMPRhave been identified to date.
One indication that there may be Man-6-P glycoproteinsthat are specifically targeted by each MPR arose from analy-sis of MPR-deficient mice (15). Using 125I-labeled sCIMPR asan affinity probe to visualize Man-6-P glycoproteins, bandsmigrating at �26 kDa and �114 kDa were highly elevated inthe CD(-) and CI(-) serum samples, respectively. However,there is some uncertainty in interpretation of these blottingexperiments, as an elevated signal could be due to increasedprotein levels and/or the number of phosphorylated oligosac-charides on the protein. Our quantitative MS-based andWestern blotting analyses demonstrate that levels of multipleMan-6-P glycoproteins in serum vary in an MPR-specificmanner. Of these, alpha-mannosidase 2B1 is likely to repre-sent the �114 kDa Man-6-P glycoprotein detected in unpu-rified CI(�) serum, whereas Creg1 is likely to represent the�26 kDa Man-6-P glycoprotein in CD(�) serum.
The molecular basis for the selective secretion of theseproteins in an MPR-specific manner remains to be elucidated.It is possible that there is a significant difference in the re-spective affinities of the MPRs for these proteins. For exam-ple, a protein bound with high affinity and targeted efficientlyby one MPR but not the other would be predicted to besecreted only in the absence of its high affinity receptor.Proteins that are recognized in a comparable manner by bothMPRs would be secreted into the bloodstream to a similarextent in the absence of either MPR, and this appears to bethe case with most of the Man-6-P glycoproteins identified. Itis possible that both protein and carbohydrate determinantscould modulate receptor specificity (58, 60, 61). Another pos-sibility is that serum Man-6-P glycoprotein levels could reflectdifferences in the cell or tissue distribution of the MPRs andtheir ligands. For example, a lysosomal protein that is highlyexpressed in a cell type that predominantly contains a singletype of MPR would appear disproportionately elevated inserum in the absence of that MPR. Support for this possibilitycomes from the observation that, while the MPRs are ex-pressed in most cell types, their relative expression is tissue-dependent, with heart and spleen containing 3–4-fold highermolar levels of CDMPR than CIMPR (62). While the molecularbases for the selective secretion of these various proteins inthe absence of either MPR is not yet apparent, we anticipatethat the identification of these proteins in this study will pro-vide a useful basis for the future investigation of the relativefunctions of the two MPRs.
Acknowledgments—We thank Henry Lackland and Mukarram El-Banna for technical assistance, Dr. Istvan Sohar for invaluable advice,and Dr. Vikas Nanda for helpful discussions. We also thank Drs.Thomas Ludwig, Daulat Tulsiani, Nancy Dahms, and Grace Gill forgenerously providing reagents.
* This work was supported by National Institutes of Health GrantDK054317 (to P. L.). The costs of publication of this article weredefrayed in part by the payment of page charges. This article musttherefore be hereby marked “advertisement” in accordance with 18U.S.C. Section 1734 solely to indicate this fact.
□S The on-line version of this article (available at http://www.mcponline.org) contains supplemental Figs. 1–7 and Tables I–X.
� To whom correspondence should be addressed: Center for Ad-vanced Biotechnology and Medicine, 679 Hoes Lane, Piscataway, NJ08854. Tel.: 732-235-5032; Fax: 732-235-5289; E-mail: [email protected].
REFERENCES
1. Holtzman, E. (1989) Lysosomes, Plenum Press, New York.2. Ghosh, P., Dahms, N. M., and Kornfeld, S. (2003) Mannose 6-phosphate
receptors: new twists in the tale. Nat. Rev. Mol. Cell Biol. 4, 202–2123. Dahms, N. M., and Hancock, M. K. (2002) P-type lectins. Biochim. Biophys.
Acta. 1572, 317–3404. Tong, P. Y., Tollefsen, S. E., and Kornfeld, S. (1988) The cation-indepen-
dent mannose 6-phosphate receptor binds insulin-like growth factor II.J. Biol. Chem. 263, 2585–2588
5. MacDonald, R. G., Pfeffer, S. R., Coussens, L., Tepper, M. A., Brocklebank,C. M., Mole, J. E., Anderson, J. K., Chen, E., Czech, M. P., and Ullrich,A. (1988) A single receptor binds both insulin-like growth factor II andmannose-6-phosphate. Science 239, 1134–1137
6. Sahagian, G. G., Distler, J., and Jourdian, G. W. (1981) Characterization ofa membrane-associated receptor from bovine liver that binds phospho-mannosyl residues of bovine testicular beta-galactosidase. Proc. Natl.Acad. Sci. U. S. A. 78, 4289–4293
7. Hoflack, B., and Kornfeld, S. (1985) Purification and characterization of acation-dependent mannose 6-phosphate receptor from murine P388D1macrophages and bovine liver. J. Biol. Chem. 260, 12008–12014
8. Lau, M. M., Stewart, C. E., Liu, Z., Bhatt, H., Rotwein, P., and Stewart, C. L.(1994) Loss of the imprinted IGF2/cation-independent mannose 6-phos-phate receptor results in fetal overgrowth and perinatal lethality. GenesDev. 8, 2953–2963
9. Wang, Z. Q., Fung, M. R., Barlow, D. P., and Wagner, E. F. (1994) Regu-lation of embryonic growth and lysosomal targeting by the imprintedIgf2/Mpr gene. Nature 372, 464–467
10. Ludwig, T., Eggenschwiler, J., Fisher, P., D’Ercole, A. J., Davenport, M. L.,and Efstratiadis, A. (1996) Mouse mutants lacking the type 2 IGF receptor(IGF2R) are rescued from perinatal lethality in Igf2 and Igf1r null back-grounds. Dev. Biol. 177, 517–535
11. Filson, A. J., Louvi, A., Efstratiadis, A., and Robertson, E. J. (1993) Rescueof the T-associated maternal effect in mice carrying null mutations inIgf-2 and Igf2r, two reciprocally imprinted genes. Development 118,731–736
12. Ludwig, T., Ovitt, C. E., Bauer, U., Hollinshead, M., Remmler, J., Lobel, P.,Ruther, U., and Hoflack, B. (1993) Targeted disruption of the mousecation-dependent mannose 6-phosphate receptor results in partial mis-sorting of multiple lysosomal enzymes. EMBO J. 12, 5225–5235
13. Koster, A., Saftig, P., Matzner, U., von Figura, K., Peters, C., and Pohlmann,R. (1993) Targeted disruption of the M(r) 46,000 mannose 6-phosphatereceptor gene in mice results in misrouting of lysosomal proteins. EMBOJ. 12, 5219–5223
14. Schellens, J. P., Saftig, P., von Figura, K., and Everts, V. (2003) Deficiencyof mannose 6-phosphate receptors and lysosomal storage: a morpho-metric analysis of hepatocytes of neonatal mice. Cell Biol. Int. 27,897–902
15. Sohar, I., Sleat, D., Gong Liu, C., Ludwig, T., and Lobel, P. (1998) Mousemutants lacking the cation-independent mannose 6-phosphate/insulin-like growth factor II receptor are impaired in lysosomal enzyme transport:
Serum Proteomics and Mannose 6-Phosphate Receptor Function
68 Molecular & Cellular Proteomics 6.1
comparison of cation-independent and cation-dependent mannose6-phosphate receptor-deficient mice. Biochem. J. 330, 903–908
16. Pohlmann, R., Boeker, M. W., and von Figura, K. (1995) The two mannose6-phosphate receptors transport distinct complements of lysosomal pro-teins. J. Biol. Chem. 270, 27311–27318
17. Ludwig, T., Munier-Lehmann, H., Bauer, U., Hollinshead, M., Ovitt, C.,Lobel, P., and Hoflack, B. (1994) Differential sorting of lysosomal en-zymes in mannose 6-phosphate receptor-deficient fibroblasts. EMBO J.13, 3430–3437
18. Sleat, D. E., and Lobel, P. (1997) Ligand binding specificities of the twomannose 6-phosphate receptors. J. Biol. Chem. 272, 731–738
19. Sleat, D. E., Wiseman, J. A., El-Banna, M., Kim, K. H., Mao, Q., Price, S.,Macauley, S. L., Sidman, R. L., Shen, M. M., Zhao, Q., Passini, M. A.,Davidson, B. L., Stewart, G. R., and Lobel, P. (2004) A mouse model ofclassical late-infantile neuronal ceroid lipofuscinosis based on targeteddisruption of the CLN2 gene results in a loss of tripeptidyl-peptidase Iactivity and progressive neurodegeneration. J. Neurosci. 24, 9117–9126
20. Valenzano, K. J., Remmler, J., and Lobel, P. (1995) Soluble insulin-likegrowth factor II/mannose 6-phosphate receptor carries multiple highmolecular weight forms of insulin-like growth factor II in fetal bovineserum. J. Biol. Chem. 270, 16441–16448
21. Sleat, D. E., Sohar, I., Lackland, H., Majercak, J., and Lobel, P. (1996) Ratbrain contains high levels of mannose-6-phosphorylated glycoproteinsincluding lysosomal enzymes and palmitoyl-protein thioesterase, an en-zyme implicated in infantile neuronal lipofuscinosis. J. Biol. Chem. 271,19191–19198
22. Reddy, S. T., and Dahms, N. M. (2002) High-level expression and charac-terization of a secreted recombinant cation-dependent mannose6-phosphate receptor in Pichia pastoris. Protein Expression Purif. 26,290–300
23. Bradford, M. M. (1976) A rapid and sensitive method for the quantitation ofmicrogram quantities of protein utilizing the principle of protein-dyebinding. Anal. Biochem. 72, 248–254
24. Candiano, G., Bruschi, M., Musante, L., Santucci, L., Ghiggeri, G. M.,Carnemolla, B., Orecchia, P., Zardi, L., and Righetti, P. G. (2004) Bluesilver: a very sensitive colloidal Coomassie G-250 staining for proteomeanalysis. Electrophoresis 25, 1327–1333
25. Valenzano, K. J., Kallay, L. M., and Lobel, P. (1993) An assay to detectglycoproteins that contain mannose 6-phosphate. Anal. Biochem. 209,156–162
26. Ross, P. L., Huang, Y. N., Marchese, J. N., Williamson, B., Parker, K.,Hattan, S., Khainovski, N., Pillai, S., Dey, S., Daniels, S., Purkayastha, S.,Juhasz, P., Martin, S., Bartlet-Jones, M., He, F., Jacobson, A., andPappin, D. J. (2004) Multiplexed protein quantitation in Saccharomycescerevisiae using amine-reactive isobaric tagging reagents. Mol. Cell.Proteomics 3, 1154–1169
27. Glazer, A. N., Delange, R. J., and Sigman, D. S. (1975) Chemical Modifica-tion of Proteins, Elsevier, New York
28. Sleat, D. E., Wang, Y., Sohar, I., Lackland, H., Li, Y., Li, H., Zheng, H., andLobel, P. (2006) Identification and validation of mannose 6-phosphateglycoproteins in human plasma reveal a wide range of lysosomal andnon-lysosomal proteins. Mol. Cell. Proteomics 5, 1942–1956
29. Sleat, D. E., Zheng, H., Qian, M., and Lobel, P. (2006) Identification of sitesof mannose 6-phosphorylation on lysosomal proteins. Mol. Cell. Pro-teomics 5, 686–701
30. Craig, R., Cortens, J. P., and Beavis, R. C. (2004) Open source system foranalyzing, validating, and storing protein identification data. J. ProteomeRes. 3, 1234–1242
31. Beavis, R. C. (2006) Using the global proteome machine for protein iden-tification. Methods Mol. Biol. 328, 217–228
32. Liu, H., Sadygov, R. G., and Yates, J. R., 3rd (2004) A model for randomsampling and estimation of relative protein abundance in shotgun pro-teomics. Anal. Chem. 76, 4193–4201
33. Agresti, A. (2002) Categorical Data Analysis, 2nd Ed., Wiley-Interscience,New York
34. Agresti, A., and Coull, B. (1998) Approximate is better than “exact” forinterval estimation of binomial proportions. Am. Stat. 52, 119–126
35. Storey, J. D. (2002) A direct approach to false discovery rates. J. R. Stat.Soc. B. 64, 479–498
36. Skudlarek, M. D., Orgebin-Crist, M. C., and Tulsiani, D. R. (1991) Asparag-ine-linked glycoprotein biosynthesis in rat epididymis: presence of a
mannosidase II-like enzyme. Biochem. J. 277 (Pt 1), 213–22137. Lin, L., and Lobel, P. (2001) Expression and analysis of CLN2 variants in
CHO cells: Q100R represents a polymorphism, and G389E and R447Hrepresent loss-of-function mutations. Hum. Mutat. 18, 165
38. Sleat, D. E., Wiseman, J. A., El-Banna, M., Price, S. M., Verot, L., Shen,M. M., Tint, G. S., Vanier, M. T., Walkley, S. U., and Lobel, P. (2004)Genetic evidence for nonredundant functional cooperativity betweenNPC1 and NPC2 in lipid transport. Proc. Natl. Acad. Sci. U. S. A. 101,5886–5891
39. Old, W. M., Meyer-Arendt, K., Aveline-Wolf, L., Pierce, K. G., Mendoza, A.,Sevinsky, J. R., Resing, K. A., and Ahn, N. G. (2005) Comparison oflabel-free methods for quantifying human proteins by shotgun proteom-ics. Mol. Cell. Proteomics 4, 1487–1502
40. Zhang, B., VerBerkmoes, N. C., Langston, M. A., Uberbacher, E., Hettich,R. L., and Samatova, N. F. (2006) Detecting differential and correlatedprotein expression in label-free shotgun proteomics. J. Proteome Res. 5,2909–2918
41. Hu, J., Qian, J., Borisov, O., Pan, S., Li, Y., Liu, T., Deng, L., Wannemacher,K., Kurnellas, M., Patterson, C., Elkabes, S., and Li, H. (2006) Optimizedproteomics analysis of a mouse model of cerebellar dysfunction usingamine-specific isobaric tags. Proteomics 6, 4321–4334
42. Bhavsar, J. H., Remmler, J., and Lobel, P. (1994) A method to increaseefficiency and minimize anomalous electrophoretic transfer in proteinblotting. Anal. Biochem. 221, 234–242
43. Gillespie, P. G., and Gillespie, S. K. (1997) Improved electrophoresis andtransfer of picogram amounts of protein with hemoglobin. Anal. Bio-chem. 246, 239–245
44. Sleat, D. E., Lackland, H., Wang, Y., Sohar, I., Xiao, G., Li, H., and Lobel, P.(2005) The human brain mannose 6-phosphate glycoproteome: a com-plex mixture composed of multiple isoforms of many soluble lysosomalproteins. Proteomics 5, 1520–1532
45. Jadot, M., Lin, L., Sleat, D. E., Sohar, I., Hsu, M. S., Pintar, J., Dubois, F.,Wattiaux-De Coninck, S., Wattiaux, R., and Lobel, P. (1999) Subcellularlocalization of mannose 6-phosphate glycoproteins in rat brain. J. Biol.Chem. 274, 21104–21113
46. Lin, L., Sohar, I., Lackland, H., and Lobel, P. (2001) The human CLN2protein/tripeptidyl-peptidase I is a serine protease that autoactivates atacidic pH. J. Biol. Chem. 276, 2249–2255
47. Sleat, D. E., Zheng, H., and Lobel, P. (2007) The human urine mannose6-phosphate glycoproteome. Biochim. Biophys. Acta. 1774, 368–372
48. Sleat, D. E., Donnelly, R. J., Lackland, H., Liu, C. G., Sohar, I., Pullarkat,R. K., and Lobel, P. (1997) Association of mutations in a lysosomalprotein with classical late-infantile neuronal ceroid lipofuscinosis. Sci-ence 277, 1802–1805
49. Naureckiene, S., Sleat, D. E., Lackland, H., Fensom, A., Vanier, M. T.,Wattiaux, R., Jadot, M., and Lobel, P. (2000) Identification of HE1 as thesecond gene of Niemann-Pick C disease. Science 290, 2298–2301
50. Kollmann, K., Mutenda, K. E., Balleininger, M., Eckermann, E., von Figura,K., Schmidt, B., and Lubke, T. (2005) Identification of novel lysosomalmatrix proteins by proteome analysis. Proteomics 5, 3966–3978
51. Journet, A., Chapel, A., Kieffer, S., Roux, F., and Garin, J. (2002) Proteom-ics analysis of human lysosomes: application to monocytic and breastcancer cells. Proteomics 2, 1026–1040
52. Journet, A., Chapel, A., Kieffer, S., Louwagie, M., Luche, S., and Garin, J.(2000) Towards a human repertoire of monocytic lysosomal proteins.Electrophoresis 21, 3411–3419
53. Czupalla, C., Mansukoski, H., Riedl, T., Thiel, D., Krause, E., and Hoflack, B.(2006) Proteomics analysis of lysosomal acid hydrolases secreted byosteoclasts: implications for lytic enzyme transport and bone metabo-lism. Mol. Cell. Proteomics 5, 134–143
54. Nykjaer, A., Christensen, E. I., Vorum, H., Hager, H., Petersen, C. M.,Roigaard, H., Min, H. Y., Vilhardt, F., Moller, L. B., Kornfeld, S., andGliemann, J. (1998) Mannose 6-phosphate/insulin-like growth factor-IIreceptor targets the urokinase receptor to lysosomes via a novel bindinginteraction. J. Cell Biol. 141, 815–828
55. Kreiling, J. L., Byrd, J. C., Deisz, R. J., Mizukami, I. F., Todd, R. F., 3rd, andMacDonald, R. G. (2003) Binding of urokinase-type plasminogen activa-tor receptor (uPAR) to the mannose 6-phosphate/insulin-like growthfactor II receptor: contrasting interactions of full-length and soluble formsof uPAR. J. Biol. Chem. 278, 20628–20637
56. Nolan, C. M., McCarthy, K., Eivers, E., Jirtle, R. L., and Byrnes, L. (2006)
Serum Proteomics and Mannose 6-Phosphate Receptor Function
Molecular & Cellular Proteomics 6.1 69
Mannose 6-phosphate receptors in an ancient vertebrate, zebrafish. Dev.Genes Evol. 216, 144–151
57. Tong, P. Y., and Kornfeld, S. (1989) Ligand interactions of the cation-de-pendent mannose 6-phosphate receptor: comparison with the cation-independent mannose 6-phosphate receptor. J. Biol. Chem. 264,7970–7975
58. Munier-Lehmann, H., Mauxion, F., Bauer, U., Lobel, P., and Hoflack, B.(1996) Re-expression of the mannose 6-phosphate receptors in recep-tor-deficient fibroblasts: complementary function of the two mannose6-phosphate receptors in lysosomal enzyme targeting. J. Biol. Chem.271, 15166–15174
59. Kasper, D., Dittmer, F., von Figura, K., and Pohlmann, R. (1996) Neither
type of mannose 6-phosphate receptor is sufficient for targeting oflysosomal enzymes along intracellular routes. J. Cell Biol. 134, 615–623
60. Dong, J. M., and Sahagian, G. G. (1990) Basis for low affinity binding of alysosomal cysteine protease to the cation-independent mannose6-phosphate receptor. J. Biol. Chem. 265, 4210–4217
61. Lazzarino, D., and Gabel, C. A. (1990) Protein determinants impair recog-nition of procathepsin L phosphorylated oligosaccharides by the cation-independent mannose 6-phosphate receptor. J. Biol. Chem. 265,11864–11871
62. Wenk, J., Hille, A., and von Figura, K. (1991) Quantitation of Mr 46000 andMr 300000 mannose 6-phosphate receptors in human cells and tissues.Biochem. Int. 23, 723–731
Serum Proteomics and Mannose 6-Phosphate Receptor Function
70 Molecular & Cellular Proteomics 6.1


