Embed Size (px)
Citation preview
PDPFP 2010-2015
BBBOOOHHHOOOLLL PPPRRROOOVVVIIINNNCCCEEE
SECTORAL PLANS
PPrroovviinncciiaall DDeevveellooppmmeenntt && PPhhyyssiiccaall FFrraammeewwoorrkk PPllaann PPPDDDPPPFFFPPP 222000111000---222000111555 VOLUME 4

The Bohol PDPFP 2010-2015 consists of: Volume 1 (Main Report) Volume 2 (Prov’l Dev’t Investment Plan-PDIP) Volume 3 (Maps) Volume 4 (Sectoral Plans)
For inquiries, please contact: Provincial Planning & Development Office (PPDO) Capitol Compound, Tagbilaran City Telefax: (038) 411-2088
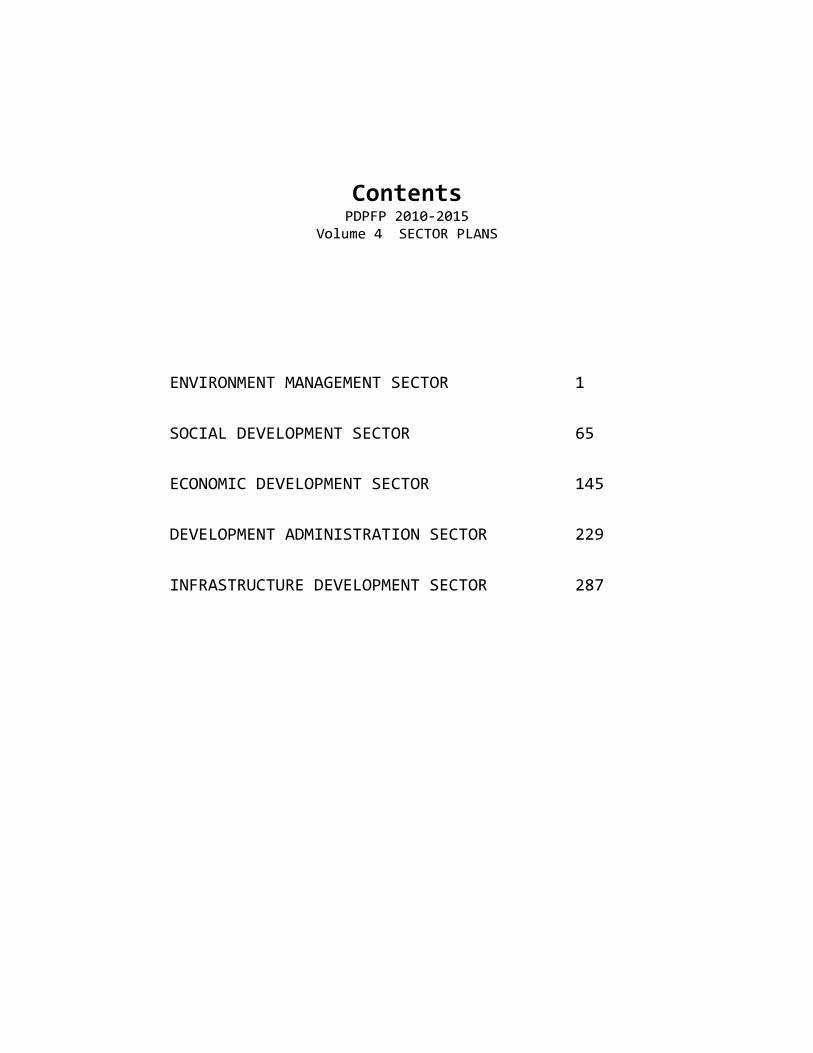
Contents PDPFP 2010-2015
Volume 4 SECTOR PLANS
ENVIRONMENT MANAGEMENT SECTOR 1
SOCIAL DEVELOPMENT SECTOR 65
ECONOMIC DEVELOPMENT SECTOR 145
DEVELOPMENT ADMINISTRATION SECTOR 229
INFRASTRUCTURE DEVELOPMENT SECTOR 287

1
ENVIRONMENT MANAGEMENT SECTOR PLAN
2
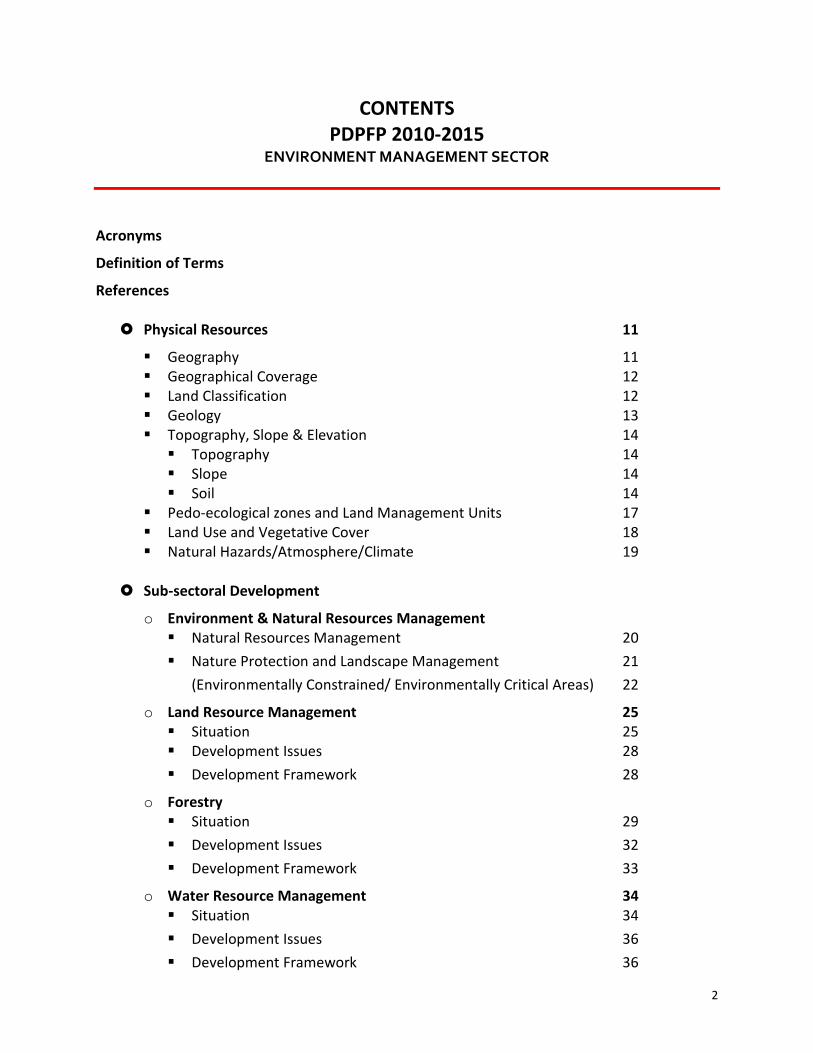
CONTENTS PDPFP 2010-2015
ENVIRONMENT MANAGEMENT SECTOR
Acronyms Definition of Terms References
� Physical Resources 11
� Geography 11 � Geographical Coverage 12 � Land Classification 12 � Geology 13 � Topography, Slope & Elevation 14
� Topography 14 � Slope 14 � Soil 14
� Pedo-ecological zones and Land Management Units 17 � Land Use and Vegetative Cover 18 � Natural Hazards/Atmosphere/Climate 19
� Sub-sectoral Development o Environment & Natural Resources Management
� Natural Resources Management 20 � Nature Protection and Landscape Management 21
(Environmentally Constrained/ Environmentally Critical Areas) 22 o Land Resource Management 25
� Situation 25 � Development Issues 28 � Development Framework 28
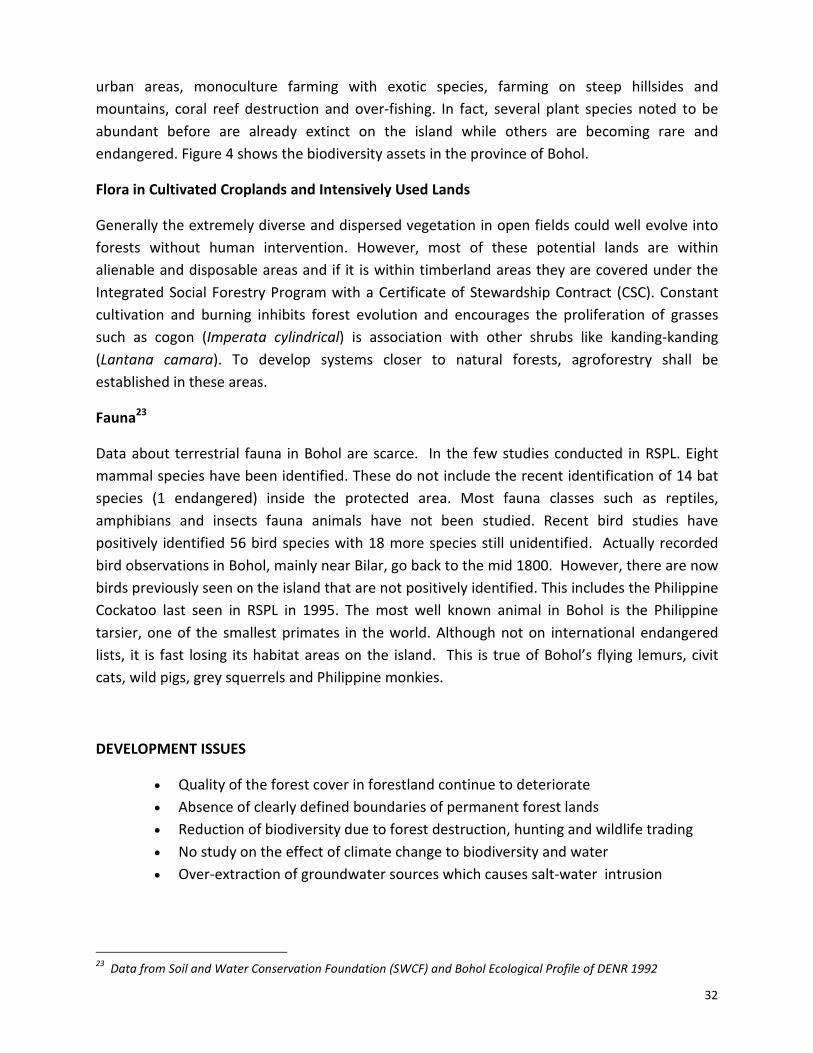
o Forestry � Situation 29 � Development Issues 32 � Development Framework 33
o Water Resource Management 34 � Situation 34 � Development Issues 36 � Development Framework 36
3
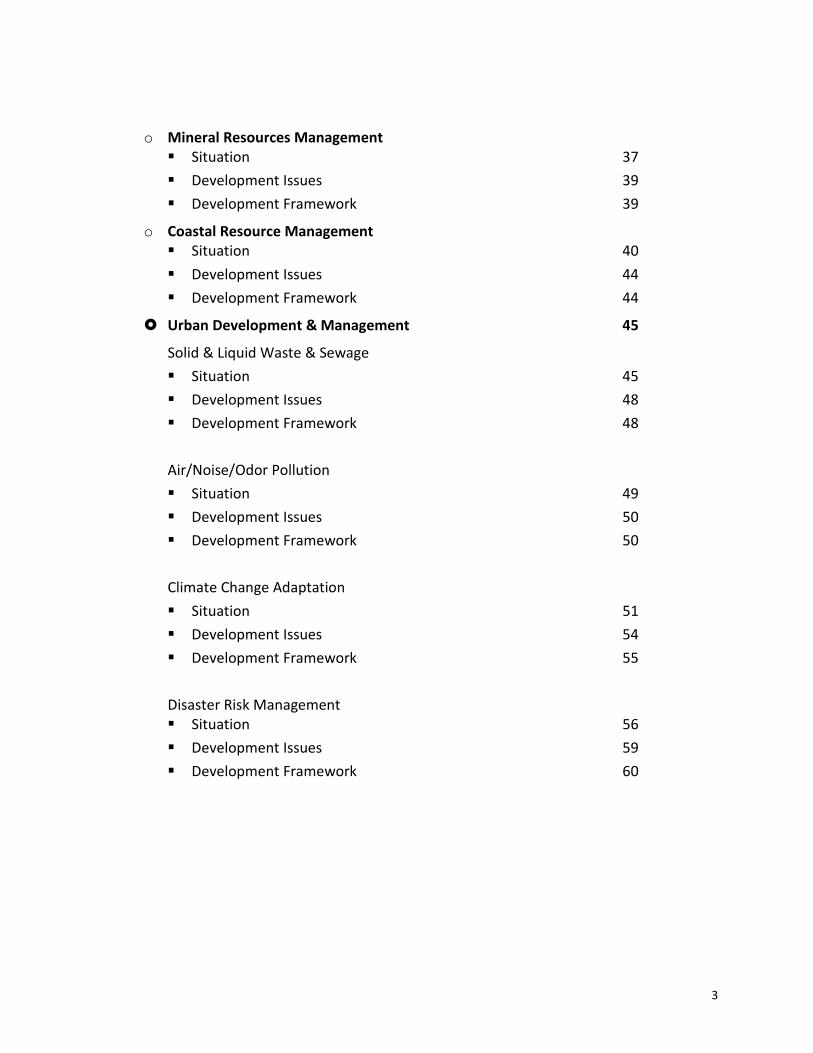
o Mineral Resources Management � Situation 37 � Development Issues 39 � Development Framework 39
o Coastal Resource Management � Situation 40 � Development Issues 44 � Development Framework 44
� Urban Development & Management 45 Solid & Liquid Waste & Sewage � Situation 45 � Development Issues 48 � Development Framework 48 Air/Noise/Odor Pollution � Situation 49 � Development Issues 50 � Development Framework 50
Climate Change Adaptation � Situation 51 � Development Issues 54 � Development Framework 55
Disaster Risk Management
� Situation 56 � Development Issues 59 � Development Framework 60
4
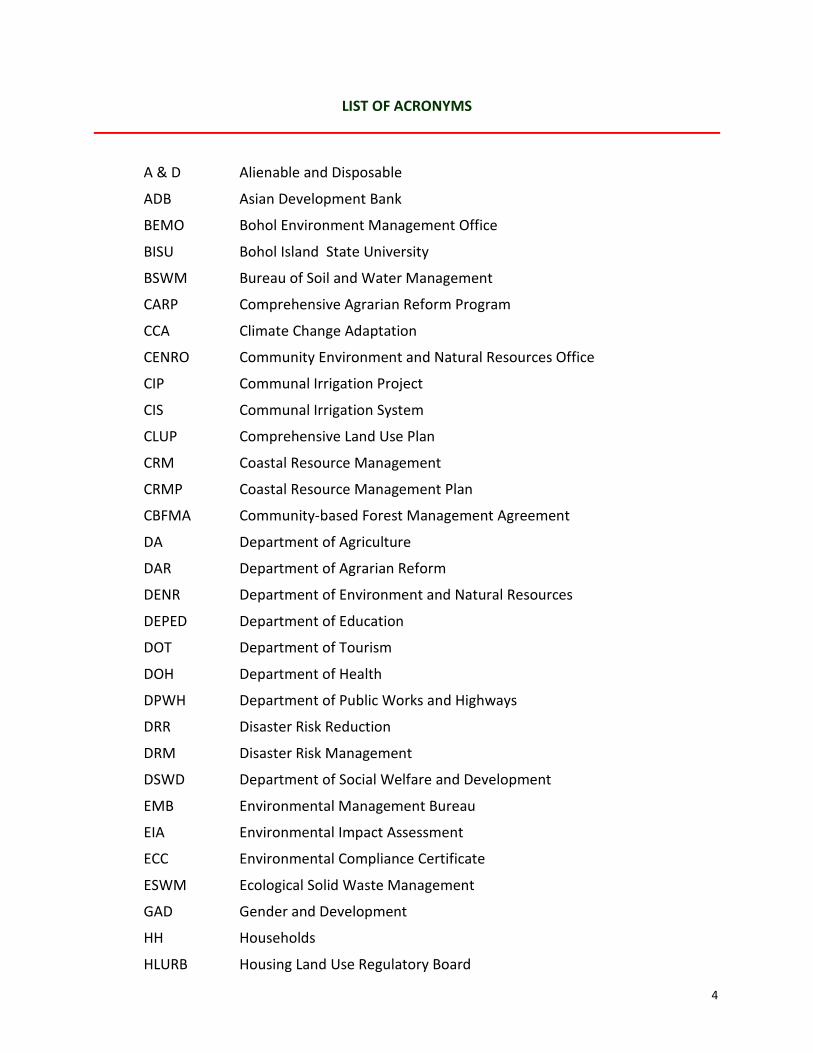
LIST OF ACRONYMS
A & D Alienable and Disposable ADB Asian Development Bank BEMO Bohol Environment Management Office BISU Bohol Island State University BSWM Bureau of Soil and Water Management CARP Comprehensive Agrarian Reform Program CCA Climate Change Adaptation CENRO Community Environment and Natural Resources Office CIP Communal Irrigation Project CIS Communal Irrigation System CLUP Comprehensive Land Use Plan CRM Coastal Resource Management CRMP Coastal Resource Management Plan CBFMA Community-based Forest Management Agreement DA Department of Agriculture DAR Department of Agrarian Reform DENR Department of Environment and Natural Resources DEPED Department of Education DOT Department of Tourism DOH Department of Health DPWH Department of Public Works and Highways DRR Disaster Risk Reduction DRM Disaster Risk Management DSWD Department of Social Welfare and Development EMB Environmental Management Bureau EIA Environmental Impact Assessment ECC Environmental Compliance Certificate ESWM Ecological Solid Waste Management GAD Gender and Development HH Households HLURB Housing Land Use Regulatory Board
5
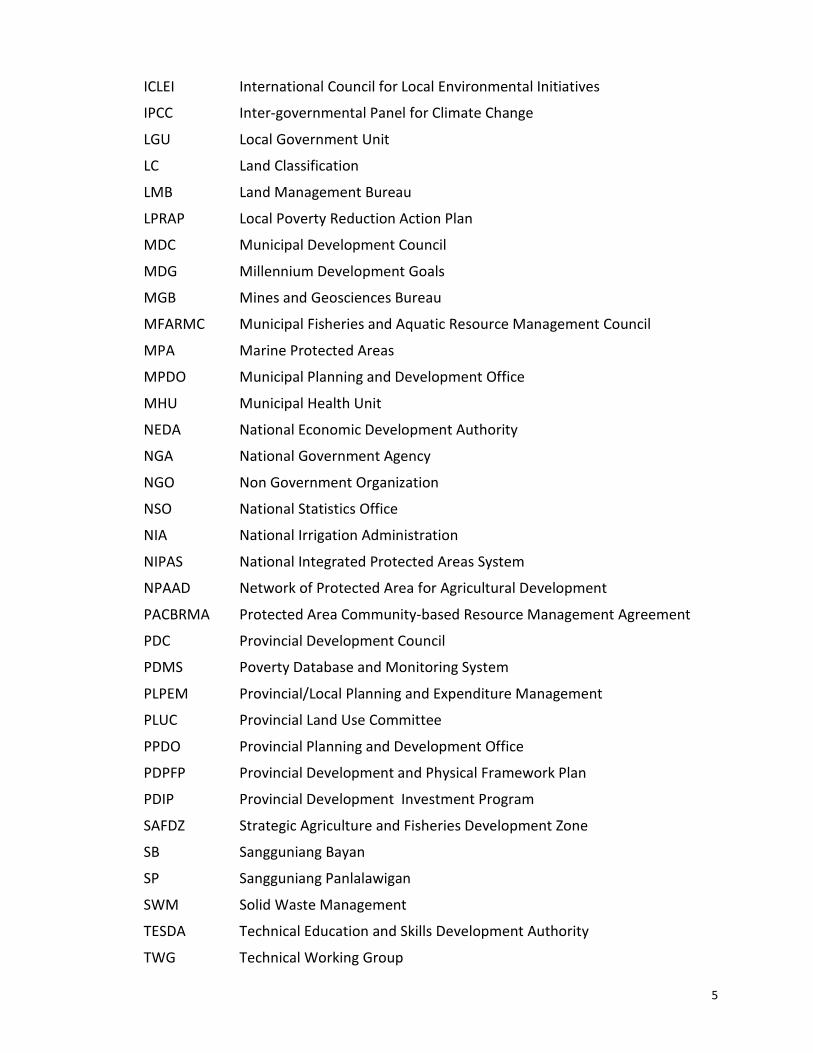
ICLEI International Council for Local Environmental Initiatives IPCC Inter-governmental Panel for Climate Change LGU Local Government Unit LC Land Classification LMB Land Management Bureau LPRAP Local Poverty Reduction Action Plan MDC Municipal Development Council MDG Millennium Development Goals MGB Mines and Geosciences Bureau MFARMC Municipal Fisheries and Aquatic Resource Management Council MPA Marine Protected Areas MPDO Municipal Planning and Development Office MHU Municipal Health Unit NEDA National Economic Development Authority NGA National Government Agency NGO Non Government Organization NSO National Statistics Office NIA National Irrigation Administration NIPAS National Integrated Protected Areas System NPAAD Network of Protected Area for Agricultural Development PACBRMA Protected Area Community-based Resource Management Agreement PDC Provincial Development Council PDMS Poverty Database and Monitoring System PLPEM Provincial/Local Planning and Expenditure Management PLUC Provincial Land Use Committee PPDO Provincial Planning and Development Office PDPFP Provincial Development and Physical Framework Plan PDIP Provincial Development Investment Program SAFDZ Strategic Agriculture and Fisheries Development Zone SB Sangguniang Bayan SP Sangguniang Panlalawigan SWM Solid Waste Management TESDA Technical Education and Skills Development Authority TWG Technical Working Group
6
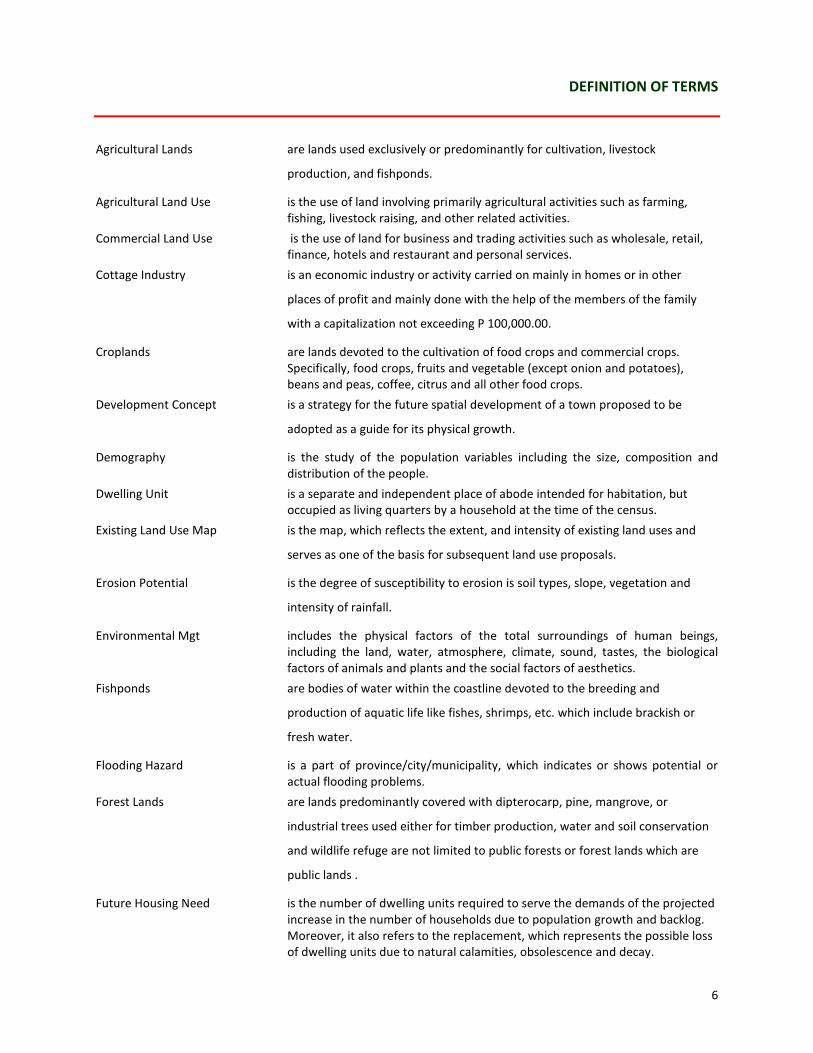
DEFINITION OF TERMS
Agricultural Lands are lands used exclusively or predominantly for cultivation, livestock
production, and fishponds. Agricultural Land Use is the use of land involving primarily agricultural activities such as farming,
fishing, livestock raising, and other related activities. Commercial Land Use is the use of land for business and trading activities such as wholesale, retail,
finance, hotels and restaurant and personal services. Cottage Industry is an economic industry or activity carried on mainly in homes or in other
places of profit and mainly done with the help of the members of the family with a capitalization not exceeding P 100,000.00.
Croplands are lands devoted to the cultivation of food crops and commercial crops. Specifically, food crops, fruits and vegetable (except onion and potatoes), beans and peas, coffee, citrus and all other food crops.
Development Concept is a strategy for the future spatial development of a town proposed to be adopted as a guide for its physical growth.
Demography is the study of the population variables including the size, composition and distribution of the people.
Dwelling Unit is a separate and independent place of abode intended for habitation, but occupied as living quarters by a household at the time of the census.
Existing Land Use Map is the map, which reflects the extent, and intensity of existing land uses and serves as one of the basis for subsequent land use proposals.
Erosion Potential is the degree of susceptibility to erosion is soil types, slope, vegetation and intensity of rainfall.
Environmental Mgt includes the physical factors of the total surroundings of human beings, including the land, water, atmosphere, climate, sound, tastes, the biological factors of animals and plants and the social factors of aesthetics.
Fishponds are bodies of water within the coastline devoted to the breeding and production of aquatic life like fishes, shrimps, etc. which include brackish or fresh water.
Flooding Hazard is a part of province/city/municipality, which indicates or shows potential or actual flooding problems.
Forest Lands are lands predominantly covered with dipterocarp, pine, mangrove, or industrial trees used either for timber production, water and soil conservation and wildlife refuge are not limited to public forests or forest lands which are public lands .
Future Housing Need is the number of dwelling units required to serve the demands of the projected increase in the number of households due to population growth and backlog. Moreover, it also refers to the replacement, which represents the possible loss of dwelling units due to natural calamities, obsolescence and decay.
7
General Land Use Map is the map, which reflects the broad categories of land uses. Goal is the general direction, which the municipality seeks to achieve that set the
guideposts for objectives, strategies, policies, programs and projects. Households consist of a group of people who sleep in the same dwelling unit and have
common arrangement for the preparation and consumption of food. Household members may include those who have no relationship to the central group but eat and sleep in the same dwelling unit. In most cases, a household consists of related groups.
Housing Backlog is the number of dwelling units required for households, which are involuntarily doubled-up with other households. Also the number of dwelling units found in the housing inventory, especially barong-barongs and dwelling units constructed wholly or mainly of light and makeshift materials.
Industrial Land Use is the use of land for manufacturing purposes or the transportation of raw materials into finished or semi-finished products, including cottages and small-scale industries.
Institutional Land Use is the use of land for public or private institution such as government buildings, hospitals, school’s, churches, etc.
Land Use Planning is a mean of systematically anticipating, achieving adjustment of the physical and biological environment consistent with the social and economic trends and sound principles of ecology and aesthetics. It is the proper management of land resources. It is a way in which an area of land is actually being put to use.
Land Use Map is the factual visual description of the present uses of lands. It reflects nature, extent and intensity of the use of land.
Land Capability is the classification of land into categories based on the maximum intensity of land use that would be consistent with low erosion rates and sustained productivity.
Land Suitability is the classification of land into categories based on the degree to which the characteristics of the land can satisfy the environmental requirements of specific crops, without deterioration.
Map is a selective symbolized and generalized picture of the partial distribution of the Earth’s surface as viewed from the above at a much-reduced scale.
Municipal Park this is developed to serve the population of a town. Its location is commended to be at the outskirts of the town for both active and passive recreation. It’s facilities include picnic areas, gardens, areas for active games and possibly other facilities for activities such as boating, swimming, hiking, etc.
Natural Resources is a wealth supplied by nature resulting or consisting of mineral deposits, soil fertility, timber, water sources, power, fish, wildlife and among others.
Open Spaces are non-agricultural lands that are used functionally as park, playground and cemetery.
Playground is usually can be found in neighborhood parks, contains facilities for passive recreation for all ages, a play lot for pre school children and a center for special events like festivals, holiday celebrations and community affairs.
Poultry Farms are lands devoted for raising chicken, ducks, geese, turkeys and other poultry.

8
Pollution is any alteration of the physical, chemical and biological properties of any water, air and/or land resources, or any discharge thereto of any liquid, gaseous or solid wastes or any production of unnecessary noise, or any emission of objectionable odor, as will or is likely to create or to render such water, air and/or land resources harmful, detrimental or injurious to public health, safety of welfare, or which will adversely affect their utilization for domestic, industrial, agricultural, recreational or other legitimate purposes.
Proposed Land Use Map is the map, which serves as a basic reference in the adaptation of a zoning ordinance for the purpose of directing, regulating the use of all lands, in accordance with the approved comprehensive land use plan.
Public Forest are all lands not classified as alienable and disposable ( A & D ) including timber lands forest reserves, national parks, military and naval reserves and civil reserves.
Recreation Center serves year-round diversified activities for all ages and interest groups of the community. Preferred location site is either near a high school campus or within a playfield or playground area.
Sectoral Plan is a plan of each sector that includes presentation of the existing situation, identifying issues, needs, objectives and strategies.
Slope is the degree of inclination of a given area relative to the horizontal plane. Soil Map shows the different soil classification units found in a given area. These are
grouped on the basis of their external and integrated characteristics that include the soil surface, soil type, slope, vegetation and intensity of rainfall.
Strategies are approaches, which generally pursue the development goals and objectives of the sector or specifically promote and effect the development of the industries to be introduced or further developed within the municipality. They are usually the “how to’s of the plans.
Targets is a translation of the objectives into plans with concrete and quantifiable outputs.
Topography is the configuration of the Earth’s surface and the location of both natural and artificial features on it.
Transport and Utilities is the use of the land for physical infrastructure facilities such as drainage, roads, parks, airport, etc.
Vacant Lands are idle lands not utilized for productive or other functional uses; including junkyards, dumpsite, etc.
Zoning it refers to the division of a community into zones where only specific land uses are allowed.
Zoning Map is a visual description of the zoning ordinance. Zoning Ordinance is an ordinance providing for the administration and enforcement of the town’s
land use plans (CLUP). It gives legal entity to the land uses plan.
9
REFERENCES
AusAID/NEDA 1994: Provincial Physical Framework Plan (PPFP) – Training Program. Manila Yorke Peninsula and Northern Adelaide, Australia Regional Spatial Plan (Draft Plan 2006) Bohol Environment Management Office (BEMO): Natural Resource Database (NRDB) Bohol Environment Code of 1998: BEC and Implementation, Rules and Regulations (IRR) Bohol Tourism Sketch Plan Bohol 1998-2020. Province of Bohol Bohol Agricultural Master Plan 2005 Bureau of Agricultural Statistics (BAS) 2005 Bureau of Fisheries and Aquatic Resources (BFAR) Bohol Ecotourism Framework Plan of 2006 Bohol Tourism Master Plan 0f 2008 Bohol Integrated Water Resources Master Plan of 2008 BSWM 1991: Preliminary Climatic Classification of 15 selected Provinces in the Philippines. Census of Population and Housing (NSO 2007) DENR - Bureau of Mines and Geology 2002: Mining Tenement Status Report and Mineral Rights Map of
Bohol, Status May 2007 and Bohol Geo-hazard Assessment in September 2007 DENR-IEMSD-SDMS 1997: Guidebooks on Sustainable Land Use Planning and Management, Volume I-VI,
published by the Integrated Environmental Management for Sustainable Development (IEMSD) Program – Sustainable Development Models and Systems Subprogram. Manila
Department of Environment and Natural Resources (DENR), PENRO and CENRO Talibon and Tagbilaran City Management Plan for the following Protected Areae (Pas) in the Province: � Initial Protected Area Plan Albur-Loay-Loboc Protected Seascape � Initial Protected Area Plan Sandingan Island Protected Landscape/Seascape: Sandingan Island,
Loon, Bohol � Initial Protected Area Plan Cabilao Island Protected Landscape/Seascape � Initial Protected Area Plan Calape Group of Island Strict Nature Reserve � Initial Protected Area Plan Pangangan island Protected Landscape/Seascape � Initial Protected Area Plan Clarin Group of island Strict Nature Reserve � Initial Protected Area Plan of Alejawan-Cansuhay-Anibongan River Watershed Forest Reserve
(ACARWFR) � Initial Protected Area Plan of Rajah Sikatuna Protected Lanscape � Initial Protected Area Plan of Loboc Watershed Reforestation Project Protected Landscape
DENR Land Classification Data for Bohol 2005 DENR Bohol Ecological Profile 1992 DENR 1992: NIPAS-Act of 1992; Implementation Rules and Regulations (DAO NO. 25, Series of 1992).
Manila Department of Agrarian Reform (DAR) (2009): Status of Agrarian Reform Communities (ARCS) Physical Framework Plan for Bohol (Draft 2005) GREEN, S., MONREAL, R.P., WHITE, A. and T.G. Bayer/ Department of Environment and Natural
Resources (DENR), Cebu City 2000: Coastal Environmental Profile of Northwestern Bohol, Philippines GREEN, S. et al 2002: Bohol Island – It’s Coastal Environment Profile. Cebu City Guidelines on Provincial/Local Planning and Expenditure Management (Volume 1-5) NEDA/ADB Guidelines in Mainstreaming Disaster Risk Reduction (DRR) in Sub-National Development and Physical
Planning in the Philippines (Draft March 2008) NEDA/EU/UNDP
10
Housing and Land Use Regulatory Bohol (HLURB) 1994: Guidelines for the Formulation/Revision of Comprehensive Land Use Planning, Vol V: Land Use Planning and Management, Vol. VII: Mapping Guidelines and the National Urban Development and Housing Framework Guidelines
Joint Memorandum Circular (JMC No 001) Series of 2007 “Harmonization of Local Planning, Investment Programming, Revenue Administration, Budgeting and Expenditure Management
Local Government Code of 1991 (RA 7160) Regional Physical Framework Plan 2003-2030 Medium-Term Development Plan of Bohol 2004-2009 National Physical Framework Plan 2001-2030 Water Supply, Sanitation and Sewerage Sector Master Plan for Bohol Province (W4SMP) 1998-2030:
Report on Water Resource Potential Vol. 1 + 2, Province of Bohol/Swedish Fund for Consultancy Services (SWECO) 1999
MAPS: BUREAU OF SOILS AND WATER MANAGEMENT (BSWM) 1999: Strategic Agricultural and Fishery
Development Zones (SAFDZ) of Bohol, scale 1:50,000, single sheets per Municipality. Cebu City BSWM 1999: Network of Protected Areas for Agriculture and Agro-industrial Development (NAPAAD) of
Bohol, scale 1:50,000, single sheets per Municipality. Cebu City BSWM 1992: Land Use and Vegetation Map of Bohol, scale 1:50,000, sheets: 3750/2,3850/3, 3850-
2,3749/4,3749/1,3849-4, 3849/1, 3749/3,3749-2, 3849/3,3849/2, 3748-4. Cebu City BSWM 1992: Slope Map Series of Bohol, scale 1:50.000, sheets no. 3750/2 (31), 3850/3, (32), 3850-2
(33), 3749/4 (37), 3749/1 (38), 3849-4 (39), 3849/1 (40), 3749/3 (45), 3749-2 (46), 3849/3 (47), 3849/2 (48), 3748-4 (53), 3748/1 (54), 3848/4 (55). Cebu City
BSWM 1992: Land Management Units Map Series of Bohol, scale 1:50,000. Cebu City BSWM 1992: Pedo-Ecological Zones Map Series of Bohol, scale 1:50,000. Cebu City BSWN 1992: Soil Map Series of Bohol, scale 1:50,000. Cebu City Bohol Geohazard Maps prepared by PHIVOLCS and DOST DENR (1989-1998): Forestry Map of Bohol, working map for Talibon and Tagbilaran City DENR Region 7: Land Classification and NIPAS-Areas scale 1:100,000; digitized data DENR Region: Watershed Areas of Bohol; digitized data. Cebu City DENR Region 7: Geologic Map of Bohol, scale 1:100.000 DENR - Bureau of Mines and Geology 1994: Flood Prone Areas on Bohol, Topographic map series, scale
1:50,000. Cebu City DPWH Bohol District I, II, III) 2007: National Road Network of Bohol, scale 1:100,000. Environmental Science for Social Change (ESSC) 2000: Watersheds, digitized data NAMRIA Topographic Map Series S-711, scale 1:50,000, sheet: Buenavista 3721-I, Talibon 3821-II,
President Garcia 3921-III, Calape 3720-I, Clarin 3820-IV, Alicia 3820-I, Mabini 3820-IV, Tagbilaran 3720-II, Dimiao 3820-III, Jagna 3920-II
Provincial Engineers Office (PEO) 2000: Provincial Road Network, scale 1:100,000
11
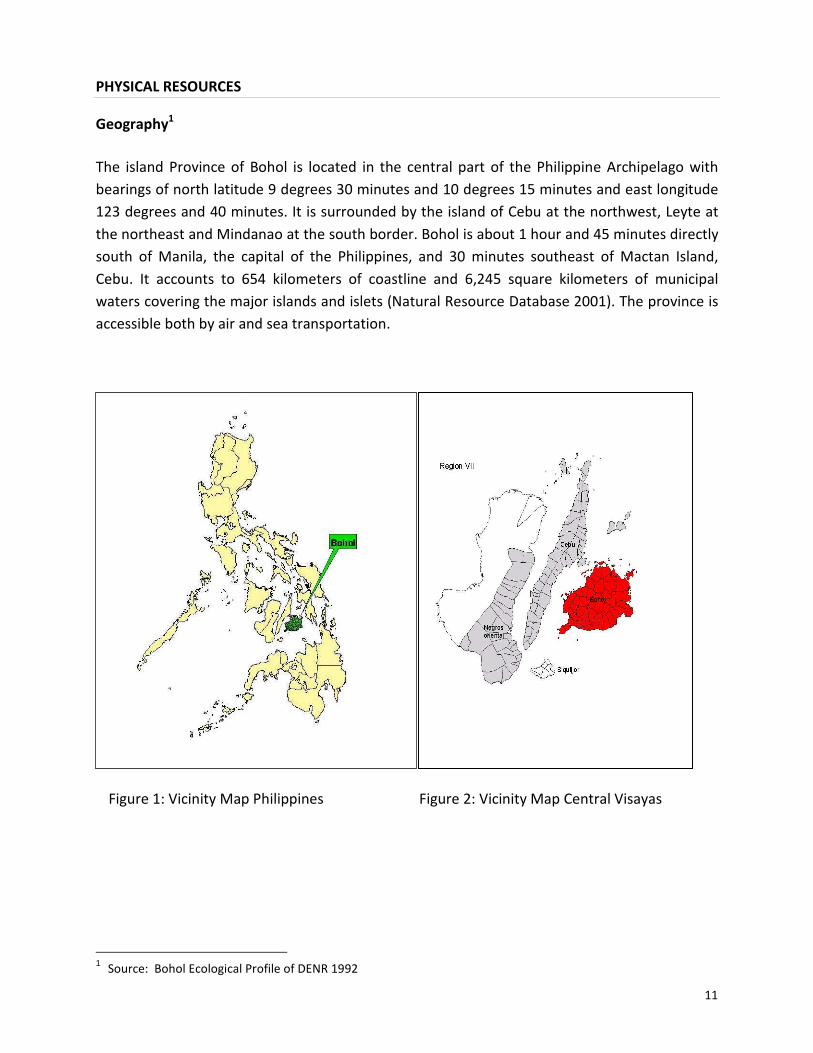
PHYSICAL RESOURCES
Geography1 The island Province of Bohol is located in the central part of the Philippine Archipelago with bearings of north latitude 9 degrees 30 minutes and 10 degrees 15 minutes and east longitude 123 degrees and 40 minutes. It is surrounded by the island of Cebu at the northwest, Leyte at the northeast and Mindanao at the south border. Bohol is about 1 hour and 45 minutes directly south of Manila, the capital of the Philippines, and 30 minutes southeast of Mactan Island, Cebu. It accounts to 654 kilometers of coastline and 6,245 square kilometers of municipal waters covering the major islands and islets (Natural Resource Database 2001). The province is accessible both by air and sea transportation.
Figure 1: Vicinity Map Philippines Figure 2: Vicinity Map Central Visayas
1 Source: Bohol Ecological Profile of DENR 1992
12
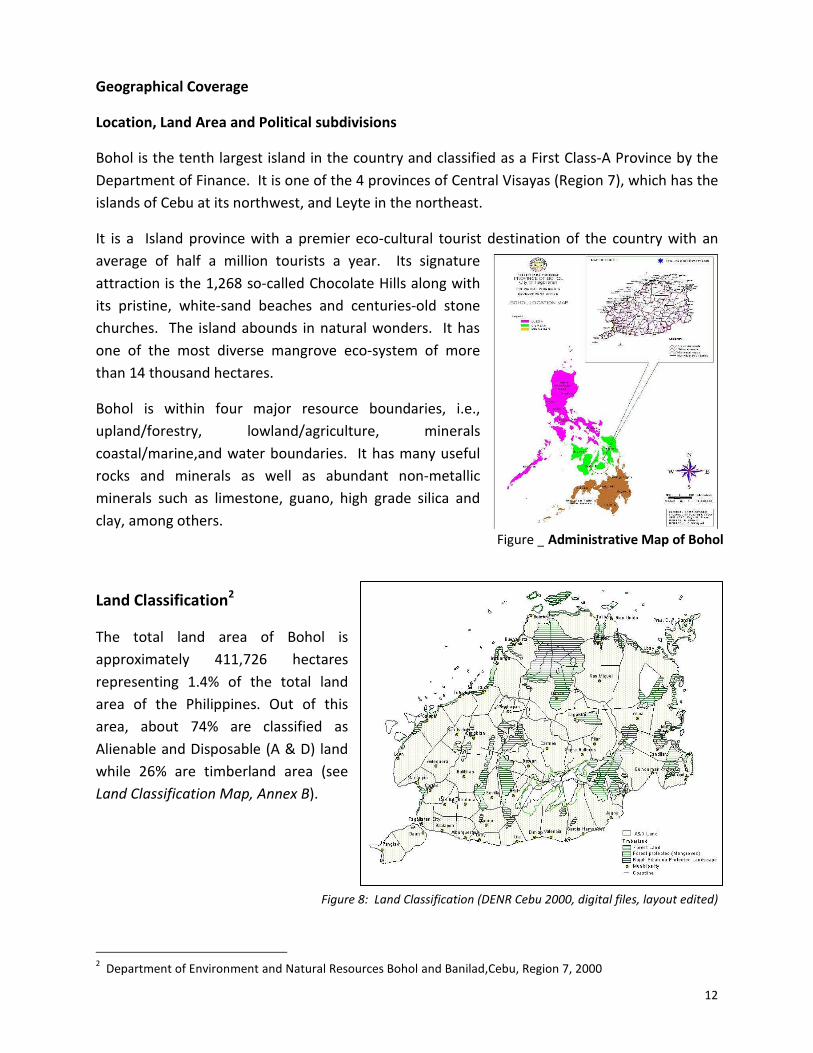
Figure _ Administrative Map of Bohol
Geographical Coverage Location, Land Area and Political subdivisions Bohol is the tenth largest island in the country and classified as a First Class-A Province by the Department of Finance. It is one of the 4 provinces of Central Visayas (Region 7), which has the islands of Cebu at its northwest, and Leyte in the northeast. It is a Island province with a premier eco-cultural tourist destination of the country with an average of half a million tourists a year. Its signature attraction is the 1,268 so-called Chocolate Hills along with its pristine, white-sand beaches and centuries-old stone churches. The island abounds in natural wonders. It has one of the most diverse mangrove eco-system of more than 14 thousand hectares. Bohol is within four major resource boundaries, i.e., upland/forestry, lowland/agriculture, minerals coastal/marine,and water boundaries. It has many useful rocks and minerals as well as abundant non-metallic minerals such as limestone, guano, high grade silica and clay, among others.
Land Classification2
The total land area of Bohol is approximately 411,726 hectares representing 1.4% of the total land area of the Philippines. Out of this area, about 74% are classified as Alienable and Disposable (A & D) land while 26% are timberland area (see Land Classification Map, Annex B).
Figure 8: Land Classification (DENR Cebu 2000, digital files, layout edited)
2 Department of Environment and Natural Resources Bohol and Banilad,Cebu, Region 7, 2000
13
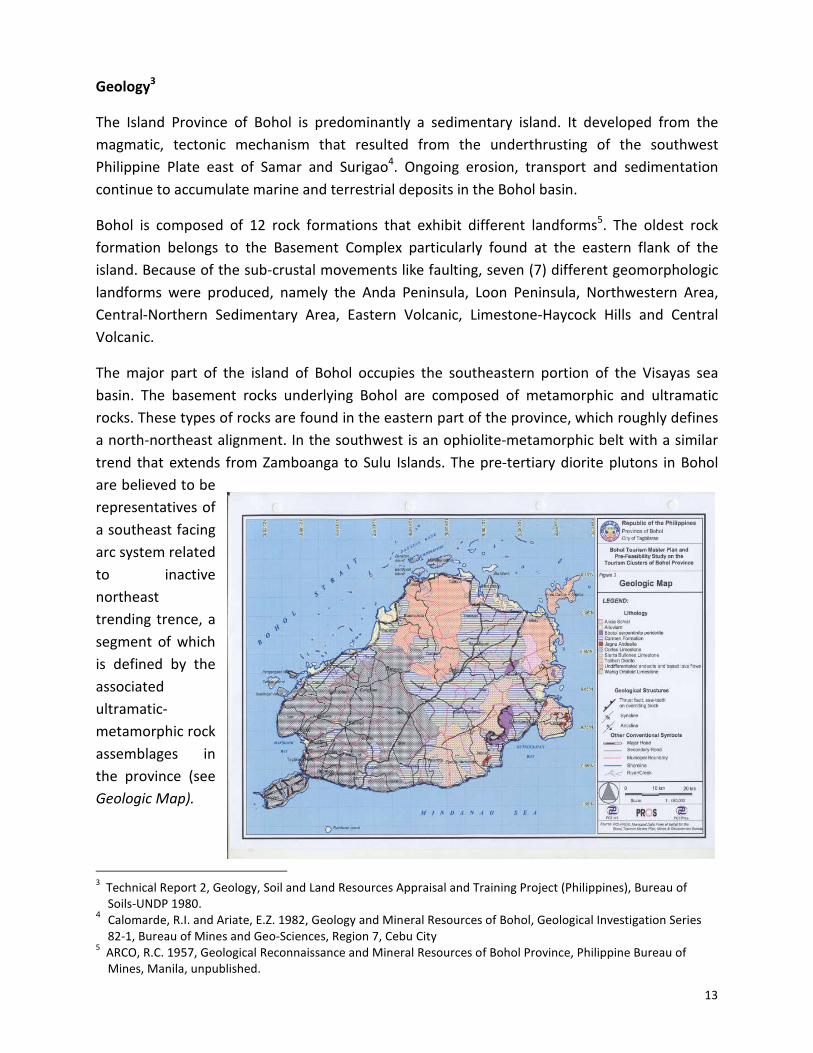
Geology3 The Island Province of Bohol is predominantly a sedimentary island. It developed from the magmatic, tectonic mechanism that resulted from the underthrusting of the southwest Philippine Plate east of Samar and Surigao4. Ongoing erosion, transport and sedimentation continue to accumulate marine and terrestrial deposits in the Bohol basin. Bohol is composed of 12 rock formations that exhibit different landforms5. The oldest rock formation belongs to the Basement Complex particularly found at the eastern flank of the island. Because of the sub-crustal movements like faulting, seven (7) different geomorphologic landforms were produced, namely the Anda Peninsula, Loon Peninsula, Northwestern Area, Central-Northern Sedimentary Area, Eastern Volcanic, Limestone-Haycock Hills and Central Volcanic. The major part of the island of Bohol occupies the southeastern portion of the Visayas sea basin. The basement rocks underlying Bohol are composed of metamorphic and ultramatic rocks. These types of rocks are found in the eastern part of the province, which roughly defines a north-northeast alignment. In the southwest is an ophiolite-metamorphic belt with a similar trend that extends from Zamboanga to Sulu Islands. The pre-tertiary diorite plutons in Bohol are believed to be representatives of a southeast facing arc system related to inactive northeast trending trence, a segment of which is defined by the associated ultramatic-metamorphic rock assemblages in the province (see Geologic Map). 3 Technical Report 2, Geology, Soil and Land Resources Appraisal and Training Project (Philippines), Bureau of
Soils-UNDP 1980. 4 Calomarde, R.I. and Ariate, E.Z. 1982, Geology and Mineral Resources of Bohol, Geological Investigation Series
82-1, Bureau of Mines and Geo-Sciences, Region 7, Cebu City 5 ARCO, R.C. 1957, Geological Reconnaissance and Mineral Resources of Bohol Province, Philippine Bureau of
Mines, Manila, unpublished.
14
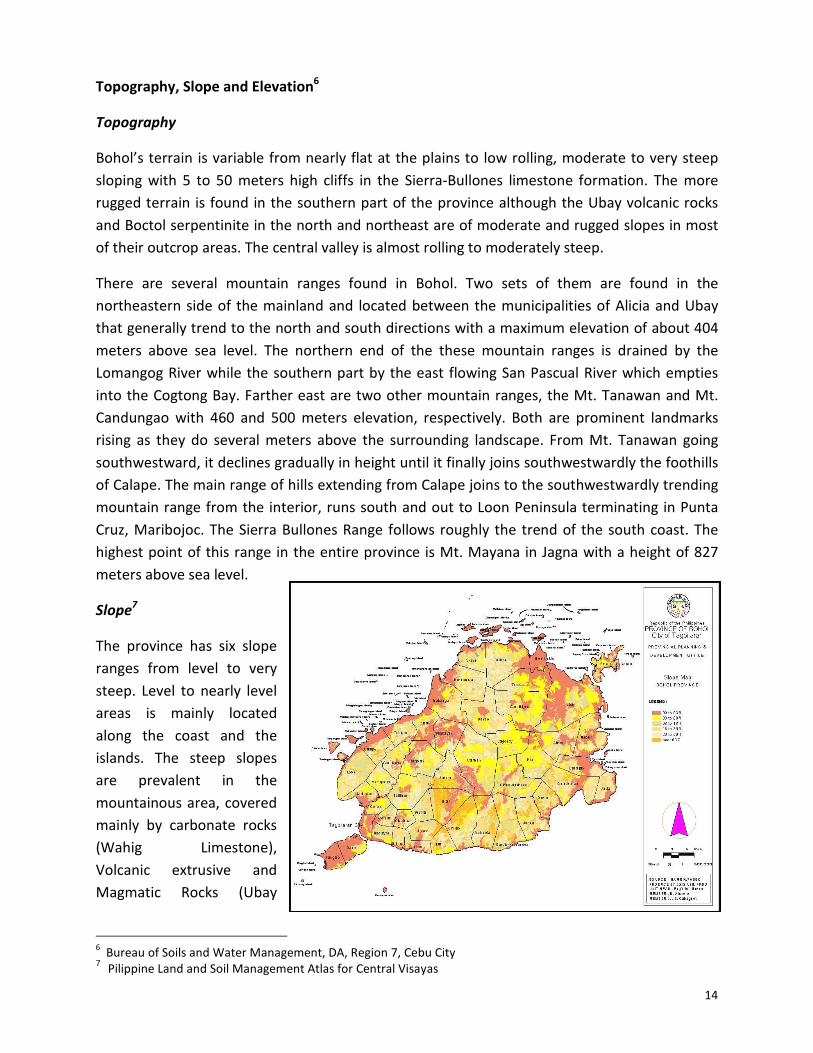
Topography, Slope and Elevation6 Topography
Bohol’s terrain is variable from nearly flat at the plains to low rolling, moderate to very steep sloping with 5 to 50 meters high cliffs in the Sierra-Bullones limestone formation. The more rugged terrain is found in the southern part of the province although the Ubay volcanic rocks and Boctol serpentinite in the north and northeast are of moderate and rugged slopes in most of their outcrop areas. The central valley is almost rolling to moderately steep. There are several mountain ranges found in Bohol. Two sets of them are found in the northeastern side of the mainland and located between the municipalities of Alicia and Ubay that generally trend to the north and south directions with a maximum elevation of about 404 meters above sea level. The northern end of the these mountain ranges is drained by the Lomangog River while the southern part by the east flowing San Pascual River which empties into the Cogtong Bay. Farther east are two other mountain ranges, the Mt. Tanawan and Mt. Candungao with 460 and 500 meters elevation, respectively. Both are prominent landmarks rising as they do several meters above the surrounding landscape. From Mt. Tanawan going southwestward, it declines gradually in height until it finally joins southwestwardly the foothills of Calape. The main range of hills extending from Calape joins to the southwestwardly trending mountain range from the interior, runs south and out to Loon Peninsula terminating in Punta Cruz, Maribojoc. The Sierra Bullones Range follows roughly the trend of the south coast. The highest point of this range in the entire province is Mt. Mayana in Jagna with a height of 827 meters above sea level. Slope7
The province has six slope ranges from level to very steep. Level to nearly level areas is mainly located along the coast and the islands. The steep slopes are prevalent in the mountainous area, covered mainly by carbonate rocks (Wahig Limestone), Volcanic extrusive and Magmatic Rocks (Ubay
6 Bureau of Soils and Water Management, DA, Region 7, Cebu City 7 Pilippine Land and Soil Management Atlas for Central Visayas
15
F igure : Slo pe C lassi f icat io n in B o ho l
17%
9%
21%15%
22%
16%
Level to Near l y Level Gentl y Sloping to Undulating
Undulating to Rol l i ng Rol l i ng to Moder ate Steep
Steep Ver y Steep
Volcanics and Jagna Andesite; see Slope Map). Table No. 1, shows the slope categories and the area covered in hectares.
Table 1: Slope Classification
Source: BSWM, DA Region 7, 1992
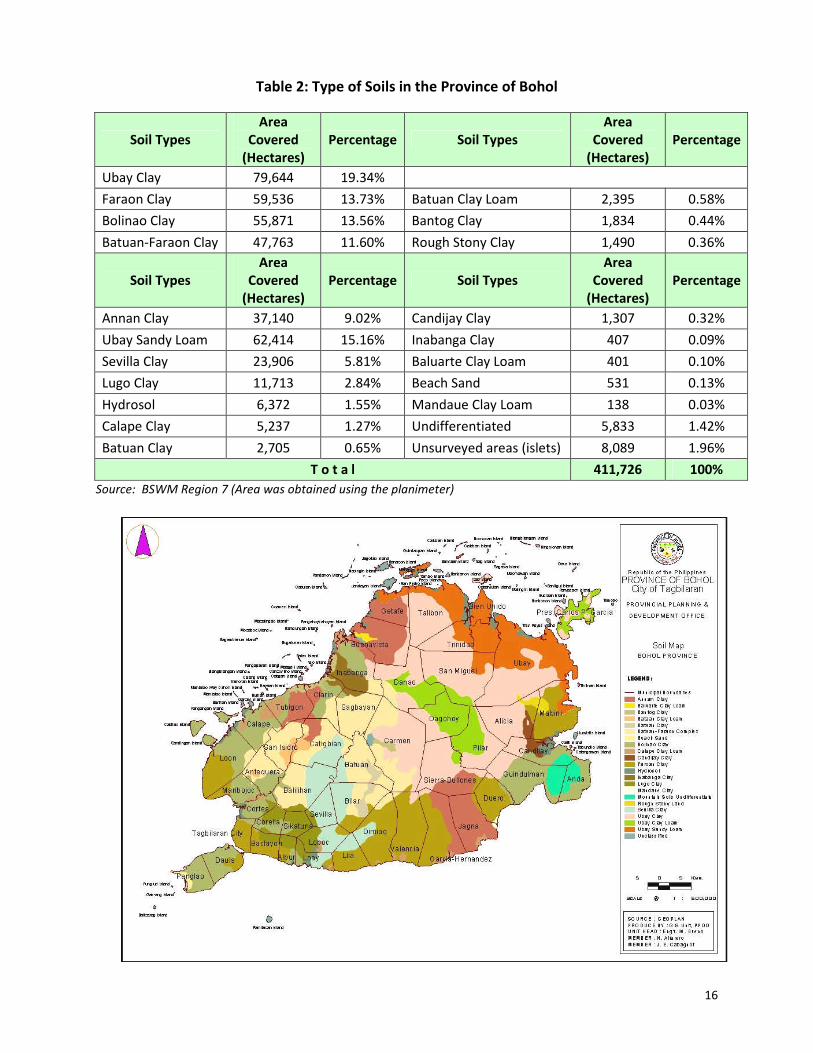
Soil8 According to the Bureau of Soils and Water Management (BSWM Region 7, Cebu) there are 22 different types of soil that can be found in Bohol, which differ mainly in physical, chemical and morphological characteristics (see Fig. 5 Soil Map). The soil depth is relatively thin ranging from a minimum depth of 24 centimeters to a maximum of 30 centimeters and its fertility is good throughout the province. Most of the hills and ridges have meager to no soil cover due to fairly rapid surface drainage over most of the province land. Clay soils with fine textures are predominant throughout the island province. The dominant soil type is Ubay Clay, which occupies in the northeastern part of Bohol constituting 19.53 percent or 79,644 hectares of the total land area of Bohol (see Soil Map and Table 2 below). The soil derived from all rock types are generally clay and silty with sandy soil limited in some parts of the coastal area. Soils on steep to very steep side slopes (18-50%) are clay loam to clay. Gently sloping to undulating (3-8%) is clay while the narrow alluvial valleys are silty clay to clay. The soils in the province are predominantly brown having moderate to high inherent fertility.
8 Bureau of Soils and Water Management, Department of Agriculture 1992, Region 7, Cebu City
Slope Category Classification Area Covered
(Has) %
Distribution
0 - 3 %
3 - 8 %
8 - 18 %
18 - 30 %
30 - 50 %
50 % >
Level to nearly level
Gently sloping to undulating
Undulating to rolling
Rolling to moderately steep
Steep hills& mountains
Very Steep hills
71,289.00
37,519.00
84,902.00
62,473.00
89,507.00
6,040.00
17.31%
9.11%
20.63%
15.17%
21.75%
16.04%
Total 411,726
100%
16
Table 2: Type of Soils in the Province of Bohol
Soil Types Area
Covered (Hectares)
Percentage Soil Types Area
Covered (Hectares)
Percentage
Ubay Clay 79,644 19.34% Faraon Clay 59,536 13.73% Batuan Clay Loam 2,395 0.58% Bolinao Clay 55,871 13.56% Bantog Clay 1,834 0.44% Batuan-Faraon Clay 47,763 11.60% Rough Stony Clay 1,490 0.36%
Soil Types Area
Covered (Hectares)
Percentage Soil Types Area
Covered (Hectares)
Percentage
Annan Clay 37,140 9.02% Candijay Clay 1,307 0.32% Ubay Sandy Loam 62,414 15.16% Inabanga Clay 407 0.09% Sevilla Clay 23,906 5.81% Baluarte Clay Loam 401 0.10% Lugo Clay 11,713 2.84% Beach Sand 531 0.13% Hydrosol 6,372 1.55% Mandaue Clay Loam 138 0.03% Calape Clay 5,237 1.27% Undifferentiated 5,833 1.42% Batuan Clay 2,705 0.65% Unsurveyed areas (islets) 8,089 1.96%
T o t a l 411,726 100% Source: BSWM Region 7 (Area was obtained using the planimeter)
17
Soil Erosion
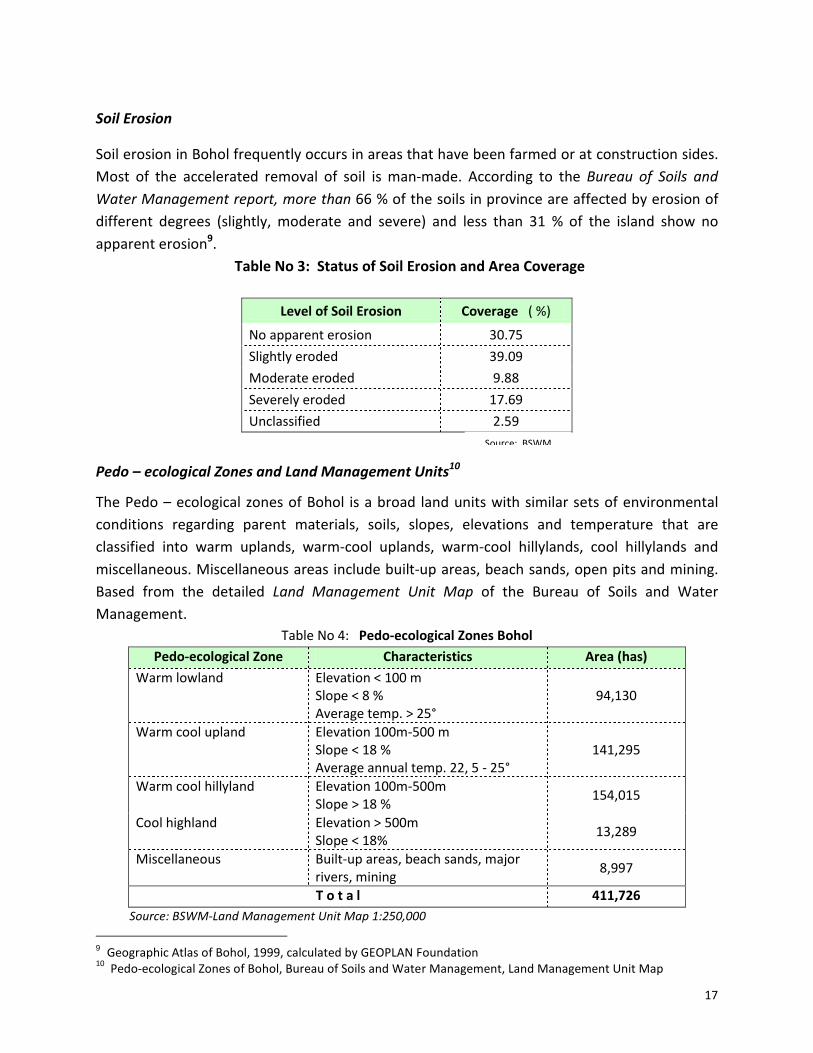
Soil erosion in Bohol frequently occurs in areas that have been farmed or at construction sides. Most of the accelerated removal of soil is man-made. According to the Bureau of Soils and Water Management report, more than 66 % of the soils in province are affected by erosion of different degrees (slightly, moderate and severe) and less than 31 % of the island show no apparent erosion9.
Table No 3: Status of Soil Erosion and Area Coverage
Level of Soil Erosion Coverage ( %) No apparent erosion 30.75 Slightly eroded 39.09 Moderate eroded 9.88 Severely eroded 17.69 Unclassified 2.59
Pedo – ecological Zones and Land Management Units10 The Pedo – ecological zones of Bohol is a broad land units with similar sets of environmental conditions regarding parent materials, soils, slopes, elevations and temperature that are classified into warm uplands, warm-cool uplands, warm-cool hillylands, cool hillylands and miscellaneous. Miscellaneous areas include built-up areas, beach sands, open pits and mining. Based from the detailed Land Management Unit Map of the Bureau of Soils and Water Management.
Table No 4: Pedo-ecological Zones Bohol Pedo-ecological Zone Characteristics Area (has)
Warm lowland Elevation < 100 m Slope < 8 % Average temp. > 25°
94,130
Warm cool upland Elevation 100m-500 m Slope < 18 % Average annual temp. 22, 5 - 25°
141,295
Warm cool hillyland Elevation 100m-500m Slope > 18 % 154,015
Cool highland Elevation > 500m Slope < 18% 13,289
Miscellaneous Built-up areas, beach sands, major rivers, mining 8,997 T o t a l 411,726
Source: BSWM-Land Management Unit Map 1:250,000 9 Geographic Atlas of Bohol, 1999, calculated by GEOPLAN Foundation 10 Pedo-ecological Zones of Bohol, Bureau of Soils and Water Management, Land Management Unit Map
Source: BSWM
18
Figure No. : Present Land Uses and Vegetation Cove r of Bohol
147,398
186,800
44,014 20,256 13,258 Agricultural
Grassland/shrubland
Woodland
Wetland
Miscellaneous( Bult-up)
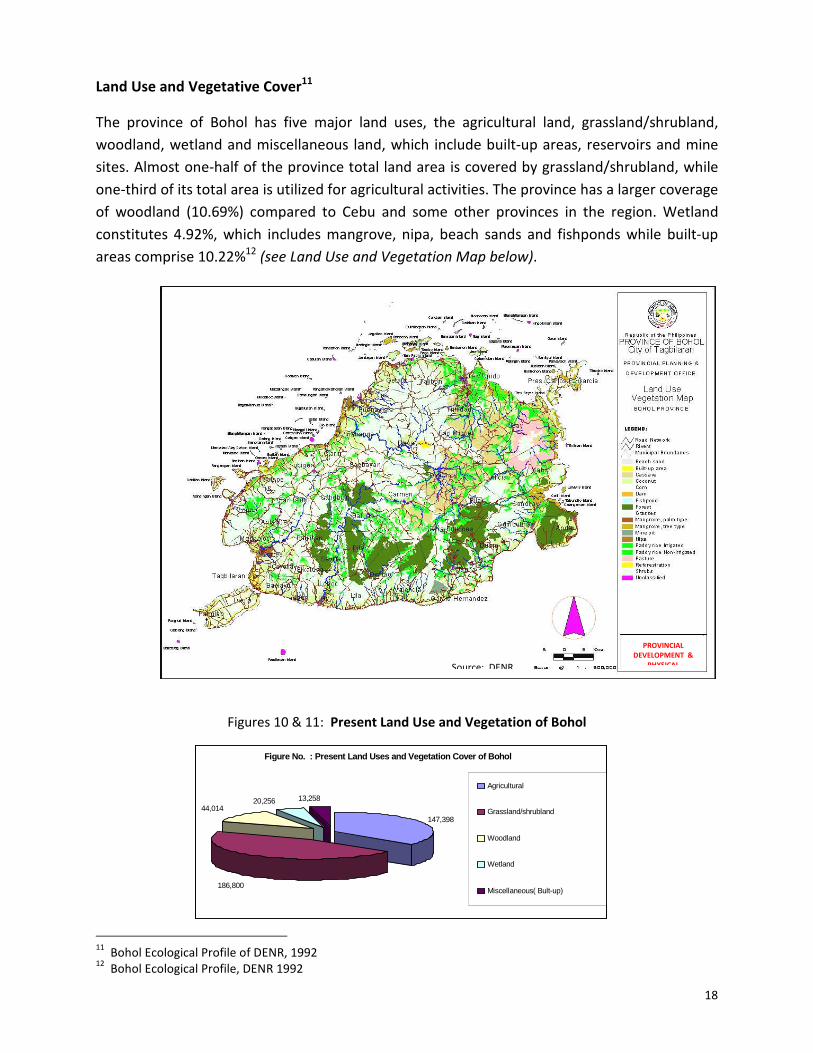
Land Use and Vegetative Cover11 The province of Bohol has five major land uses, the agricultural land, grassland/shrubland, woodland, wetland and miscellaneous land, which include built-up areas, reservoirs and mine sites. Almost one-half of the province total land area is covered by grassland/shrubland, while one-third of its total area is utilized for agricultural activities. The province has a larger coverage of woodland (10.69%) compared to Cebu and some other provinces in the region. Wetland constitutes 4.92%, which includes mangrove, nipa, beach sands and fishponds while built-up areas comprise 10.22%12 (see Land Use and Vegetation Map below).
Figures 10 & 11: Present Land Use and Vegetation of Bohol
11 Bohol Ecological Profile of DENR, 1992 12 Bohol Ecological Profile, DENR 1992
PROVINCIAL DEVELOPMENT &
PHYSICAL Source: DENR
19
Conversion of prime agricultural lands to other uses, encroachment in critical ecosystems (protected areas) continues to be the primary concern in land resource management. Degradation of critical habitats in protected areas is another factor to be addressed. Effective land resource management strategy to protect, manage and develop the natural landscapes and seascapes in such a way that would safeguard the functional capacities of the ecosystem and the sustainability of natural resources requires immediate attention with the end goal of a maintained and improved the soil-water balance capacity as a life support system of economic development.
Natural Disasters Tectonics13 Minor and major fault lines are evident on the island as shown by terraced encarpments occurring in its southern and central parts. The terraced escarpments in the Ilihan Formation as well as the graben at the Anda Peninsula are manifestations of these faults. Steep escarpments notably in Loon, Tagbilaran and in Anda Peninsula further prove vertical upliftment caused by tectonics. Earthquakes have been felt in Bohol but only an average of one perceptible shock is reported each year. Major faults usually trend towards the northeast. Three earthquakes with a magnitude above 4 of the Richter Scale (highest was 4.7 ms which occurred in June) were reported in 1998 in the province of Bohol.
Atmosphere/Climate14 Based on the distribution of rainfall during the year, Bohol’s climate as classified by PAG-ASA belongs to Corona’s 4th Type, characterized by rainfall more or less evenly distributed throughout the year. Intensification of the southwest monsoon usually occurs during the months of July to October. The rainfall varies from about 1,200 mm/yr around the coast to slightly more than 2,200 mm/yr in the mountainous areas in the province. Based on the climatogical records of Tagbilaran City weather station, the province has an annual average of 161 rainy days. Average rainfall and trend has illustrated a declining trend of 250 mm over a period of 35 years of about 7mm a year due likely to climatic change in the Southeast Asian Region. The coastal area of the province is warm in contrast with the interior part, which is colder especially during the night. Mean temperature is at 27.40 degrees centigrade. Prevailing wind direction is towards northeast with an average speed of 2 miles per record. Bohol is not included in the so-called typhoon belt of the country, as typhoons rarely pass in the province. Those passing below or above the island contribute to the greater volume of precipitation. The frequency of typhoon passage is 0-10% from the average of 20 typhoons passing over the Philippines per year.15
13 Philipine Institute of Volcanology and Seismology (PHILVOCS) 14 PAG-ASA Report and Bureau of Soil and Water Management 15 DENR-BSWM 1991 Preliminary Climatic Classification of 15 selected Provinces in the Philippines
20
SECTORAL DEVELOPMENT
SECTOR : ENVIRONMENT AND NATURAL RESOURCES MANAGEMENT
SITUATION Sustainability in development can no longer be considered a choice for local governments units, but has become a necessity. In recent times, cities and municipalities had become the hub of growth with immigration from rural areas leading to undue stress on the limited carrying capacity of the areas. It is essential to ascertain that the growth of urban and rural areas is sustainable so that they do not get into the vicious cycle of poverty and environmental degradation. With rapid urbanisation, increasing population, growing pressure to environmental resources and access to basic services has become an emerging concern in the province. Inadequate access of safe drinking water, poor sanitation and continued exposure to environmental pollution greatly affect the health and economic productivity of the populace. Unsustainable economic growth negatively impacts of the environment, putting greater stress on it and deteriorating living conditions of the poor, which in turn lays further stress on the environmental resources. These problems need to be addressed by improving the environment condition vis-a-viz people’s use of natural resources. Moreover, the environment issue implies a wide range of inter-related interventions which requires a deep understanding and concern of human activities. As a way of broadening the concept and perception of these critical issues, it is therefore imperative to articulate the behavior and socio-cultural aspect of man which is largely viewed by many as the key issues in the protection of the environment. The fragile balance between the environment and development took some twist and turn that tilted unprecedentedly towards the latter. Due to industrialization, the natural resources have been wantonly consumed by humans in their quest for development and improvement of their quality of life through material luxury and technological advancement. Our environment was constantly under pressure and we are now experiencing a never-before-imagined destruction which resulted to natural and man-made disaster, climate change and most disturbing loss of biodiversity. The challenge therefore to mankind and local government, is to accelerate and translate environmental strategies and policies into appropriate action. This would implies a renewed sense of commitment to all people in the province so that future generations can benefit, share and enjoy the earth’s natural resources, which means harmony between development and ecological protection. The Provincial Government of Bohol in collaboration with municipalities/cities government units, NGOs, NGAs and private/business sector has a greater role to play in maintaining sustainable development.
21
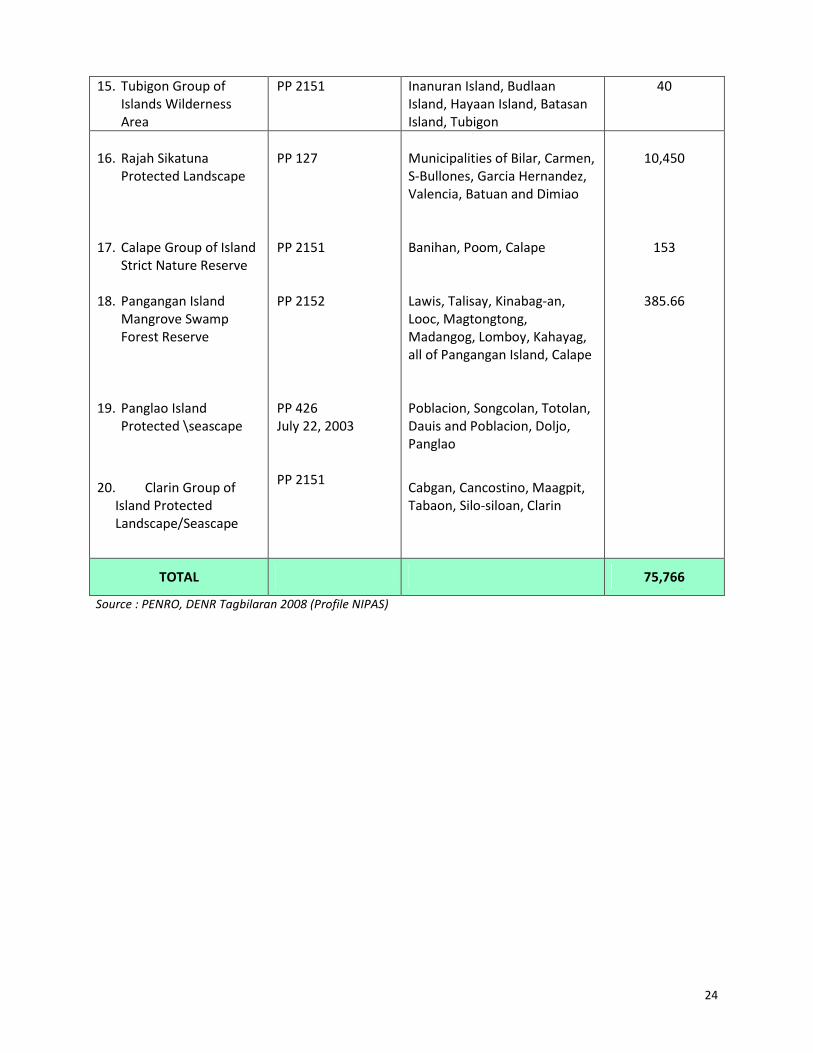
With the existence of the enhanced Poverty Database Monitoring System (PDMS) in Bohol, which has been developed by the Provincial Planning and Development Office (PPDO) along with the Bohol Local Development Foundation (BLDF), the province were able to identify and rank the levels of deprivation at the municipal, village/barangays and household level and identifying areas requiring poverty reduction support. It can track the impact of specific interventions including their correlation over time and it provides data on which policy decisions can be made. It is a vital tool to bring about convergence of efforts of all development partners in addressing basic social, economic and environmental problems of communities. Natural Resources Management Bohol is richly endowed with vast biodiversity and natural resources that plays an essential role in guiding future development for agriculture, industry, tourism, settlements, culture and infrastructure in both the medium and long-term time frame. The state of the economy and the quality of life in any given area are extremely dependent on climate, air, land, water, forest, marine ecosystems and biological resources. The management of Bohol’s ecosystem is supported with a Provincial Ordinance known as the Bohol Environment Code which provides for the policy direction and funding requirements in local environmental management and protection for the province. It is important that policy-makers are well-informed on the relevant concerns confronting environment issues. Population growth and economic activities have created pressures on Bohol’s environment and natural resources. High demand for physical infrastructure like roads, water systems and power, more settlement areas, greater demand for goods and services provided by the government are expected to increase. These are looked upon as major necessities for the province’s development but often create environmental stress. The developments in the province must pro-actively integrate a mechanism to prevent adverse impacts on the critical resources and exposure of people and property to danger due to natural hazards such as flooding, landslides, earthquakes, typhoons and including man-made hazards. It is therefore imperative however, to balance economic growth with environmental and natural resources conservation and wise use for the progress and sustainable development of the island. Nature Protection and Landscape Management The latest data shows that Bohol has a total of 75,766 hectares under protection as initial component of the National Integrated Protected Area System’s (NIPAS Act or RA 7586) Environmentally Constrained and Environmentally Critical Areas (refer to Table 1 below). Protection purposes are for the conservation of biological diversity (flora and fauna) and natural heritage areas, conservation of forest cover, as well as provision for livelihood opportunities, water conservation and sustainable development for those living in and around these areas. All development within these areas shall follow the provision embodied in the NIPAS Law.
22
Environmentally Constrained Areas are prone to natural hazards, severe erosion and more specifically hydrological and geological produced changes. The NIPAS Law does not cover these areas. However, they should be subject to restrictions in land uses in order to prevent the occurrences of accidents that endanger lives and properties. Environmentally Critically Areas (ECAs) are areas covered by Presidential Proclamation 2146 but not belonging to environmentally constrained areas. They also impose limitations in terms of land use development. Non-suitable land uses should be disallowed in these areas. In addition there are areas degraded through intensive agricultural use, erosion and mining and quarrying that need to be rehabilitated.
Table 1: Protected Areas in Bohol (NIPAS Areas)
Name Of Protected Areas Date of Proclamation LOCATION Area
(Hectares)
1. Wahig Inabanga River Watershed Forest Reserve
2. Talibon Group of
Islands Protected Seascape
3. Candijay Group of
Islands Strict Nature Preserve
4. Candijay Protected
Seascape/Landscape 5. C.P.G. Protected
Seascape/ Landscape 6. Inabanga Group of
Island Strict Nature Reserve
7. Inabanga Protected
PP 223 PP 2151 (Mangrove Wilderness Area) June 1999 PP 2151 (Mangrove Wilderness Area) PP 2152 (Mangrove Swamp Forest Reserve) PP 2151 & 2152 (Wilderness Area & Mangrove Swamp Forest Reserve) December 29, 1981 PP 2151 (Wilderness Area) PP 2152 (Mangrove
Municipalities of Pilar, Sierra Bullones, Carmen, Jagna, Duero, Sagbayan, Dagohoy, Danao, Buenavista, Inabanga, Getafe, Talibon, Trinidad and San Miguel Islands of Sag, Banbanon, Bansaan and Tambu, all of the municipality of Talibon Islets of Calanggaman, Catiil, Tabangdio and Lumislis Islet of Candijay and Mabini Cogtong, Panas, Candijay, Bohol and Badiang, Anda, Bohol Aguining, Baud, Basiao, Canmangao, Lapinig Island, Villa Milagrosa Islets of Pangahoykahoyan, and Bugatusan, all of Inabanga Hambungan, Fatima, Lawis,
14,000 subject to actual
ground verification
6,455
For verification
For verification
446.04
534
2,045
23
Seascape/Landscape 8. Ubay Protected
Seascape and Landscape
9. Getafe Group of
Islands Protected Seascape/Landscape
10. Chocolate Hills Natural
Monument 11. Loboc Watershed
Forest Reserve 12. Alejawan- Cansuhay
Anibongan River Watershed Forest Reserve
13. Albur-Loay-Loboc
Protected Landscape and Seascape
14. Sandingan-Cabilao
Mangrove Swamp Forest Reserve
Swamp Forest Reserve) PP 2152 (Mangrove Swamp Forest Reserve) December 29, 1981 PP 2151 & 2152 (Wilderness Area and Mangrove Swamp Reserve) PP 1031 February 26, 2003 PP 450 PP 881 PP 293 April 23, 2000 PP 2152
Sto. Niño and Bugang, all of Inabanga Biabas, Cagting, Cuya, Fatima, Juagdan, Pangpang and Tintinan Island, all of Ubay Jandayan Norte and Sur, Handumon, Tuy-oran, Alumar, Banacon Is, Jagoliao Is, Nasingin Is, Mahanay Is, all of Getafe Municipalities of Batuan, Carmen, Sagbayan, Sierra-Bullones, Valencia and Bilar Municipalities of Bilar, Batuan, Carmen, Balilihan, Sierra-Bullones, Lila, Loboc, Sevilla Boctol, Lonoy, Mayana, Odiong, Jagna, Bohol and Angilan, Anibongan, Bangwalog, Cansuhay, Taytay, Payao, San Antonio, San Pedro, Duero, Bohol Bahi, San Agustin, Western Poblacion, Eastern Poblacion, Sta. Felomina, Tagbuane, Alburquerque Alegria Sur, Sagnap, Palo, Villalimpia, Loay Agape, Ugpong, Canlasid, Poblacion (Western part), Loboc Basdio, Calayugan Sur, Calayugan Norte, Canigaan, Sondol, Ubujan, Mocpoc Sur, Sandingan, Loon, then Talisay, Cabacungan, Cambaguing, Pantudland, Looc, Cabilao, Loon
1,564
4,785
19,410
10,387
3,620
156
1,335
24
15. Tubigon Group of Islands Wilderness Area
PP 2151 Inanuran Island, Budlaan Island, Hayaan Island, Batasan Island, Tubigon
40
16. Rajah Sikatuna
Protected Landscape 17. Calape Group of Island
Strict Nature Reserve 18. Pangangan Island
Mangrove Swamp Forest Reserve
19. Panglao Island
Protected \seascape 20. Clarin Group of
Island Protected Landscape/Seascape
PP 127 PP 2151 PP 2152 PP 426 July 22, 2003 PP 2151
Municipalities of Bilar, Carmen, S-Bullones, Garcia Hernandez, Valencia, Batuan and Dimiao Banihan, Poom, Calape Lawis, Talisay, Kinabag-an, Looc, Magtongtong, Madangog, Lomboy, Kahayag, all of Pangangan Island, Calape Poblacion, Songcolan, Totolan, Dauis and Poblacion, Doljo, Panglao Cabgan, Cancostino, Maagpit, Tabaon, Silo-siloan, Clarin
10,450
153
385.66
TOTAL 75,766 Source : PENRO, DENR Tagbilaran 2008 (Profile NIPAS)
25
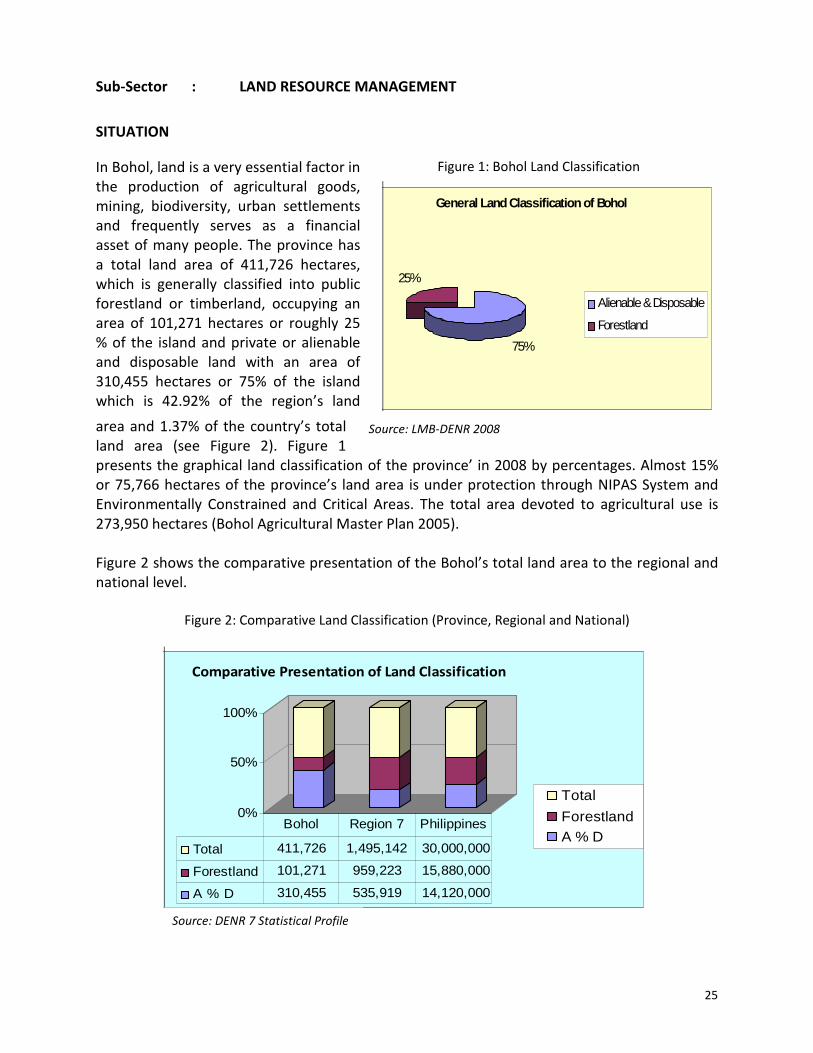
Figure 1: Bohol Land Classification
Source: LMB-DENR 2008
General Land Classification of Bohol
75%
25%
Alienable & Disposable
Forestland
Sub-Sector : LAND RESOURCE MANAGEMENT
SITUATION In Bohol, land is a very essential factor in the production of agricultural goods, mining, biodiversity, urban settlements and frequently serves as a financial asset of many people. The province has a total land area of 411,726 hectares, which is generally classified into public forestland or timberland, occupying an area of 101,271 hectares or roughly 25 % of the island and private or alienable and disposable land with an area of 310,455 hectares or 75% of the island which is 42.92% of the region’s land area and 1.37% of the country’s total land area (see Figure 2). Figure 1 presents the graphical land classification of the province’ in 2008 by percentages. Almost 15% or 75,766 hectares of the province’s land area is under protection through NIPAS System and Environmentally Constrained and Critical Areas. The total area devoted to agricultural use is 273,950 hectares (Bohol Agricultural Master Plan 2005). Figure 2 shows the comparative presentation of the Bohol’s total land area to the regional and national level.
Figure 2: Comparative Land Classification (Province, Regional and National)
0%
50%
100%
Comparative Presentation of Land Classification
Total
ForestlandA % D
Total 411,726 1,495,142 30,000,000
Forestland 101,271 959,223 15,880,000
A % D 310,455 535,919 14,120,000
Bohol Region 7 Philippines
Source: DENR 7 Statistical Profile
26
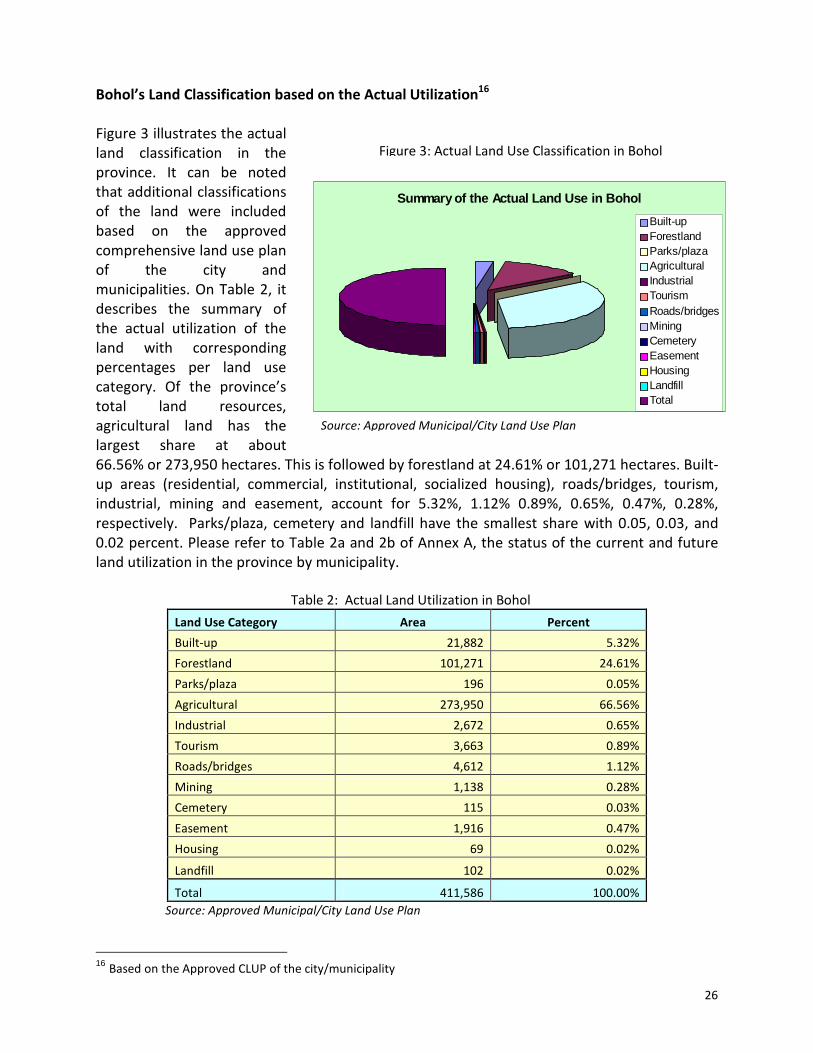
Figure 3: Actual Land Use Classification in Bohol
Summary of the Actual Land Use in Bohol
Built-upForestlandParks/plazaAgriculturalIndustrialTourismRoads/bridgesMiningCemeteryEasementHousingLandfillTotal
Bohol’s Land Classification based on the Actual Utilization16 Figure 3 illustrates the actual land classification in the province. It can be noted that additional classifications of the land were included based on the approved comprehensive land use plan of the city and municipalities. On Table 2, it describes the summary of the actual utilization of the land with corresponding percentages per land use category. Of the province’s total land resources, agricultural land has the largest share at about 66.56% or 273,950 hectares. This is followed by forestland at 24.61% or 101,271 hectares. Built-up areas (residential, commercial, institutional, socialized housing), roads/bridges, tourism, industrial, mining and easement, account for 5.32%, 1.12% 0.89%, 0.65%, 0.47%, 0.28%, respectively. Parks/plaza, cemetery and landfill have the smallest share with 0.05, 0.03, and 0.02 percent. Please refer to Table 2a and 2b of Annex A, the status of the current and future land utilization in the province by municipality.
Table 2: Actual Land Utilization in Bohol Land Use Category Area Percent Built-up 21,882 5.32% Forestland 101,271 24.61% Parks/plaza 196 0.05% Agricultural 273,950 66.56% Industrial 2,672 0.65% Tourism 3,663 0.89% Roads/bridges 4,612 1.12% Mining 1,138 0.28% Cemetery 115 0.03% Easement 1,916 0.47% Housing 69 0.02% Landfill 102 0.02% Total 411,586 100.00%
Source: Approved Municipal/City Land Use Plan 16 Based on the Approved CLUP of the city/municipality
Source: Approved Municipal/City Land Use Plan
27
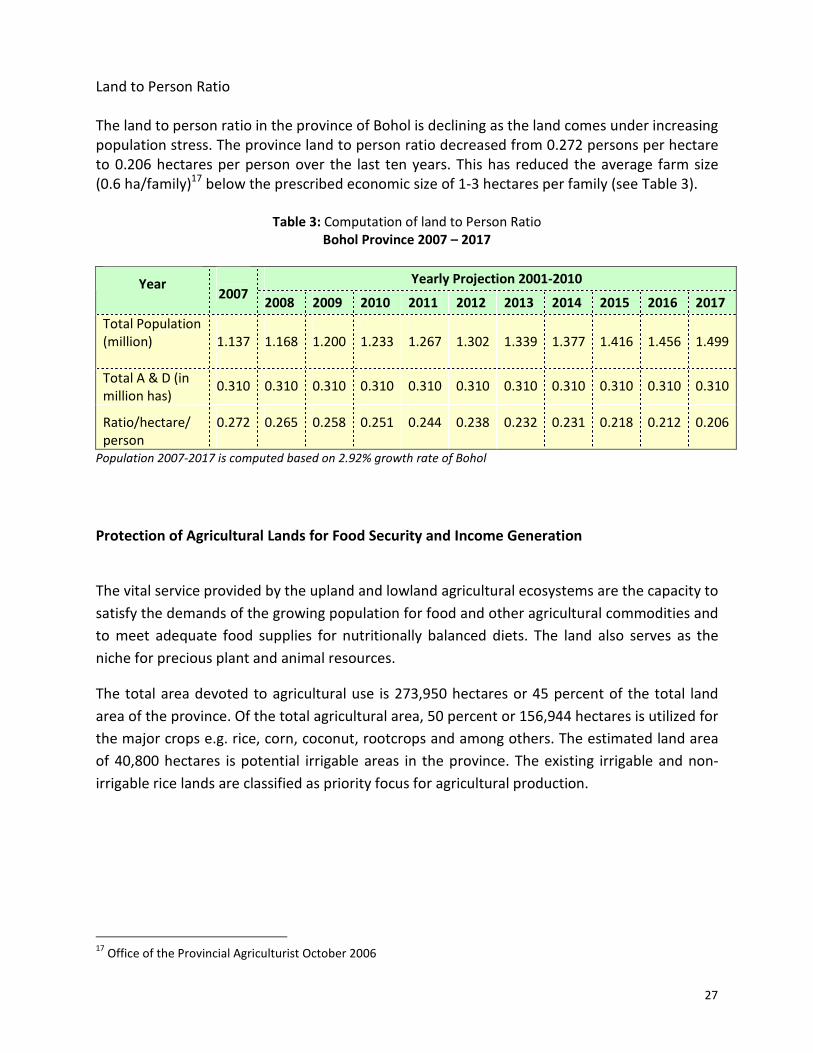
Land to Person Ratio The land to person ratio in the province of Bohol is declining as the land comes under increasing population stress. The province land to person ratio decreased from 0.272 persons per hectare to 0.206 hectares per person over the last ten years. This has reduced the average farm size (0.6 ha/family)17 below the prescribed economic size of 1-3 hectares per family (see Table 3).
Table 3: Computation of land to Person Ratio
Bohol Province 2007 – 2017 Yearly Projection 2001-2010 Year
2007 2008 2009 2010 2011 2012 2013 2014 2015 2016 2017 Total Population (million)
1.137
1.168
1.200
1.233
1.267
1.302
1.339
1.377
1.416
1.456
1.499
Total A & D (in million has) 0.310 0.310 0.310 0.310 0.310 0.310 0.310 0.310 0.310 0.310 0.310
Ratio/hectare/ person
0.272
0.265 0.258 0.251 0.244 0.238 0.232 0.231 0.218 0.212 0.206
Population 2007-2017 is computed based on 2.92% growth rate of Bohol
Protection of Agricultural Lands for Food Security and Income Generation The vital service provided by the upland and lowland agricultural ecosystems are the capacity to satisfy the demands of the growing population for food and other agricultural commodities and to meet adequate food supplies for nutritionally balanced diets. The land also serves as the niche for precious plant and animal resources. The total area devoted to agricultural use is 273,950 hectares or 45 percent of the total land area of the province. Of the total agricultural area, 50 percent or 156,944 hectares is utilized for the major crops e.g. rice, corn, coconut, rootcrops and among others. The estimated land area of 40,800 hectares is potential irrigable areas in the province. The existing irrigable and non-irrigable rice lands are classified as priority focus for agricultural production.
17 Office of the Provincial Agriculturist October 2006
28
DEVELOPMENT ISSUES • Encroachment in critical ecosystems (protected areas) • Degradation of critical habitats both inside and outside designated protected areas • Land pollution due to indiscriminate use of inorganic fertilizers, pesticides and dumping
of solid wastes including toxic and hazardous materials and chemicals • Unregulated conversion of agricultural lands to other uses • Soil erosion
DEVELOPMENT FRAMEWORK
Development Goal
• Conserve and manage Bohol’s natural landscapes and seascapes in such a way that will safeguard the functional capacities of these ecosystems and their sustainable use
Development Objectives
• To improve the soil-water balance as a life support mechanism for economic development
• To enforce the river easements, buffer zones and landscape assemblies that shall be implemented along with all the provisions of the NIPAS Law
Development Strategies
• Fast track the approval/implementation of Protected Area Management Plans • Implement watershed management/soil conservation and agro-forestry • Promote sustainable agriculture, e.g., Sloping Agricultural Land Technology • Develop Karst Landscape Management Plan • Continue implement the Land Survey and Titling Program • Adoption and implementation of poverty reduction programs • Mainstreaming Women and Development on the ENR management framework
29
Sub-Sector : FORESTRY
SITUATION The ecological importance of the forest ecosystem lies primarily in its ability to protect the land from soil erosion, prevent the occurrence of floods, droughts, siltation in rivers, dams and coastal areas and its vast depository of biodiversity. The economy of the province is predominantly based on its natural resources. Based on the assessment and evaluation of the existing natural capital stock, Bohol has reached a critical level of forest depletion. This alarming state of Bohol’s natural forest resources is eventually reflected in its social and economic performances, particularly in its based negative trade balance. Population pressure and growth further intensify the demand on forest resources. Unfortunately, the forest replenishment costs to satisfy the current demands will require large financial investments. The total area classified as timberland or forestland in Bohol is 101,271 hectares or 24.6 percent of the total land area of the province. Out of this area more than one-half are protected areas, and only 17% are covered with forests. The rest are grass and shrub lands. Based on the standard forty percent of the total land area of the province shall be covered with forest in order to maintain an ecological sound environment, wherein the island is critically below that standard. Data from the Provincial Environment and Natural Resources Office in 2008, the forest reserves are declining due to slash and burn, forest fires, illegal timber poaching and cutting and conversion of forest area to agricultural use and other uses. Ten percent of the total population in Bohol is dependent on forestry areas through farming in forestlands. With the implementation of the Integrated Social Forestry (ISF) program by DENR and now devolved to the LGUs, the farming areas in the forestry zones are now being enhanced through community-based forest management. There are 67 Community-based Forest Management Agreement (CBFMA) issued by DENR comprising a consolidated area of 8,810 hectares, which are now managed by the People’s Organizations (see Table 4, Annex A and Map 1). Thus more sustainable development is taking place. Eight out of the eleven (11) watersheds18 in Bohol are experiencing 26 to 38 percent soil erosion19 rates. These sites are now at a critical stage with an annual soil erosion rate of ten cubic meters per hectare. Biomass fuel provides a large part of the province’s energy sources. Ninety-two percent of total households are now using biomass fuel for cooking and baking. There is also a big demand for non-wood products in the province as a substitute for lumber. 18 Soil and Water Conservation Foundation (SWCF 2002) 19 Bureau of Soil and Water Management (BSWM) Region 7
30
Among the leading non-wood products are nipa and bamboo. Of the 7,247 hectares established plantations for tree farming, 80 percent planted with gemelina and mahogany. These are used for local and inter-regional consumption. However, there is low productivity in tree farming due to inappropriate technologies and a limited supply of professional extension and development trained workers to provide technical assistance to those communities that practice tree farming. There are 23 registered lumber dealers in the province with certificates of registration issued by the Forest Management Sector of DENR that serve as market outlets for tree farmers. The policy of the provincial government is to ensure the perpetual existence of adequate forest resources for the use and enjoyment of Boholanos through local government driven, inter-agency and multi-sectoral forest resources management. There are areas in protection forest that need to be indicated in respective management plans. Examples of these are Rajah Sikatuna Protected Landscape, Loboc Watershed Forest Reserve and Alijawan-Cansuhay-Duero Watershed. There are also non-forested timberland areas and woodlands in Alienable and Disposable lands that can be used for reforestation and additional tree farming. Some of these areas are found in Wahig-Inabanga Watershed, Abatan Watershed, Carood Watershed and Ipil Watershed Natural Forests20 Natural forests in the province are still evident. However, flora of the family Dipterocarpaceae, Leguminosae and Verbanaceae are becoming very rare. This is exemplified by the short supply of Bohol’s Molave or “tugas”. What is more alarming is that there are young people who have never seen this tree. Biodiversity in Bohol forest is little understood since there are few scientific surveys to determine what is present. The richness of the forest is indicated by a few of the on-going studies. These include establishment of 31 biodiversity transects in the 29 barangays of Rajah Sikatuna Protected Landscape. Each 2 kilometers transect covers an area of 6 hectares. So far in the 96 total area, there are 384 tree species have been identified. The total area of RSPL is 10,450 hectares leaving much to be surveyed. For non-tree species, only a cursory survey has been done. Results include identification of 3 shrubs, 1 fern species, 4 herbs, 11 palms and 8 vine species. This is just a small fraction of what is present. In another study completed by undergraduate students in RSPL, 400 hectares of forest inside Sierra Bullones, over 500 shrubs were collected. Of these, 313 were positively identified and 187 were unknown. The Bohol Environment Management Office is presently establishing a database for all flora and fauna found in Bohol including those from coastal and marine locations. Major contributions to this database are coming from the respective government agencies, especially the DENR and the NGO community. 20 Data from Soil and Water Conservation Foundation (SWCF 2003)
31
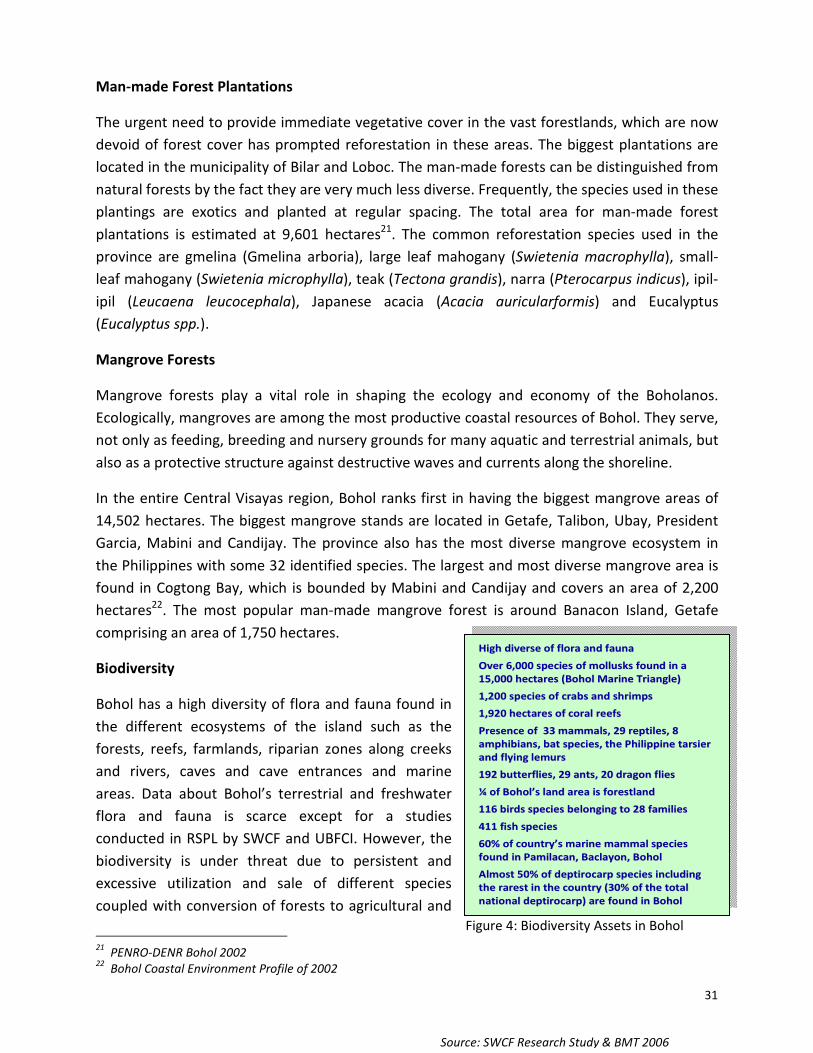
High diverse of flora and faunaHigh diverse of flora and faunaOver 6,000 species of mollusks found in a Over 6,000 species of mollusks found in a 15,000 hectares (Bohol Marine Triangle)15,000 hectares (Bohol Marine Triangle)1,200 species of crabs and shrimps1,200 species of crabs and shrimps1,920 hectares of coral reefs1,920 hectares of coral reefsPresence of 33 mammals, 29 reptiles, 8 Presence of 33 mammals, 29 reptiles, 8 amphibians, bat species, the Philippine tarsier amphibians, bat species, the Philippine tarsier and flying lemursand flying lemurs192 butterflies, 29 ants, 20 dragon flies192 butterflies, 29 ants, 20 dragon flies¼¼ of Boholof Bohol’’s land area is forestlands land area is forestland116 birds species belonging to 28 families 116 birds species belonging to 28 families 411 fish species411 fish species60% of country60% of country’’s marine mammal species s marine mammal species found in found in PamilacanPamilacan, , BaclayonBaclayon, Bohol, BoholAlmost 50% of Almost 50% of deptirocarpdeptirocarp species including species including the rarest in the country (30% of the total the rarest in the country (30% of the total national national deptirocarpdeptirocarp) are found in Bohol) are found in Bohol
Figure 4: Biodiversity Assets in Bohol
Source: SWCF Research Study & BMT 2006
Man-made Forest Plantations The urgent need to provide immediate vegetative cover in the vast forestlands, which are now devoid of forest cover has prompted reforestation in these areas. The biggest plantations are located in the municipality of Bilar and Loboc. The man-made forests can be distinguished from natural forests by the fact they are very much less diverse. Frequently, the species used in these plantings are exotics and planted at regular spacing. The total area for man-made forest plantations is estimated at 9,601 hectares21. The common reforestation species used in the province are gmelina (Gmelina arboria), large leaf mahogany (Swietenia macrophylla), small-leaf mahogany (Swietenia microphylla), teak (Tectona grandis), narra (Pterocarpus indicus), ipil-ipil (Leucaena leucocephala), Japanese acacia (Acacia auricularformis) and Eucalyptus (Eucalyptus spp.). Mangrove Forests Mangrove forests play a vital role in shaping the ecology and economy of the Boholanos. Ecologically, mangroves are among the most productive coastal resources of Bohol. They serve, not only as feeding, breeding and nursery grounds for many aquatic and terrestrial animals, but also as a protective structure against destructive waves and currents along the shoreline. In the entire Central Visayas region, Bohol ranks first in having the biggest mangrove areas of 14,502 hectares. The biggest mangrove stands are located in Getafe, Talibon, Ubay, President Garcia, Mabini and Candijay. The province also has the most diverse mangrove ecosystem in the Philippines with some 32 identified species. The largest and most diverse mangrove area is found in Cogtong Bay, which is bounded by Mabini and Candijay and covers an area of 2,200 hectares22. The most popular man-made mangrove forest is around Banacon Island, Getafe comprising an area of 1,750 hectares. Biodiversity Bohol has a high diversity of flora and fauna found in the different ecosystems of the island such as the forests, reefs, farmlands, riparian zones along creeks and rivers, caves and cave entrances and marine areas. Data about Bohol’s terrestrial and freshwater flora and fauna is scarce except for a studies conducted in RSPL by SWCF and UBFCI. However, the biodiversity is under threat due to persistent and excessive utilization and sale of different species coupled with conversion of forests to agricultural and 21 PENRO-DENR Bohol 2002 22 Bohol Coastal Environment Profile of 2002
32
urban areas, monoculture farming with exotic species, farming on steep hillsides and mountains, coral reef destruction and over-fishing. In fact, several plant species noted to be abundant before are already extinct on the island while others are becoming rare and endangered. Figure 4 shows the biodiversity assets in the province of Bohol. Flora in Cultivated Croplands and Intensively Used Lands Generally the extremely diverse and dispersed vegetation in open fields could well evolve into forests without human intervention. However, most of these potential lands are within alienable and disposable areas and if it is within timberland areas they are covered under the Integrated Social Forestry Program with a Certificate of Stewardship Contract (CSC). Constant cultivation and burning inhibits forest evolution and encourages the proliferation of grasses such as cogon (Imperata cylindrical) is association with other shrubs like kanding-kanding (Lantana camara). To develop systems closer to natural forests, agroforestry shall be established in these areas. Fauna23 Data about terrestrial fauna in Bohol are scarce. In the few studies conducted in RSPL. Eight mammal species have been identified. These do not include the recent identification of 14 bat species (1 endangered) inside the protected area. Most fauna classes such as reptiles, amphibians and insects fauna animals have not been studied. Recent bird studies have positively identified 56 bird species with 18 more species still unidentified. Actually recorded bird observations in Bohol, mainly near Bilar, go back to the mid 1800. However, there are now birds previously seen on the island that are not positively identified. This includes the Philippine Cockatoo last seen in RSPL in 1995. The most well known animal in Bohol is the Philippine tarsier, one of the smallest primates in the world. Although not on international endangered lists, it is fast losing its habitat areas on the island. This is true of Bohol’s flying lemurs, civit cats, wild pigs, grey squerrels and Philippine monkies. DEVELOPMENT ISSUES
• Quality of the forest cover in forestland continue to deteriorate • Absence of clearly defined boundaries of permanent forest lands • Reduction of biodiversity due to forest destruction, hunting and wildlife trading • No study on the effect of climate change to biodiversity and water • Over-extraction of groundwater sources which causes salt-water intrusion
23 Data from Soil and Water Conservation Foundation (SWCF) and Bohol Ecological Profile of DENR 1992
33
DEVELOPMENT FRAMEWORK Development Goals
• Ensuring the perpetual existence of adequate forest resources for the use and enjoyment of the people through local government driven, interagency, and multi-sectoral forest management
• Conserve endemic and indigenous species Development Objectives
• To enforce the river easements, buffer zones and landscape assemblies that shall be implemented along with all the provisions of the NIPAS Law
• To protect and conserve the forest ecosystems and their diverse genetic resources • To rehabilitate severely eroded areas especially those 18% slope and above • To protect and rehabilitate watersheds potential sources of local water supply • To protect wildlife species and their habitats to promote ecological balance and
enhance biological diversity Development Strategies
• Establishment of commercial tree planting & agro-forestry community parks in each barangay
• Promote the Bohol Tree Enterprise Program or Rain Forestation/Harvesting farming Program
• Institutionalize Forest Land Use Plan in the local government units • Enhance Community-based Forest Management and Protected Area community-
based resource management agreement (PACBRMA) and Special Agreement Protected Areas (SAPA)
• Continue implement Reforestation using indigenous species • Enhance the conservation of biodiversity resources through comprehensive IEC • Institutionalize innovative monitoring and evaluation systems for biodiversity
conservation • Enforcement of existing wildlife laws and Cave Act Law • Development of biodiversity database and monitoring system • Involve LGUs and local communities in biodiversity management • Establishment of Bohol Rescue Center for Wildlife and wildlife corridors
34
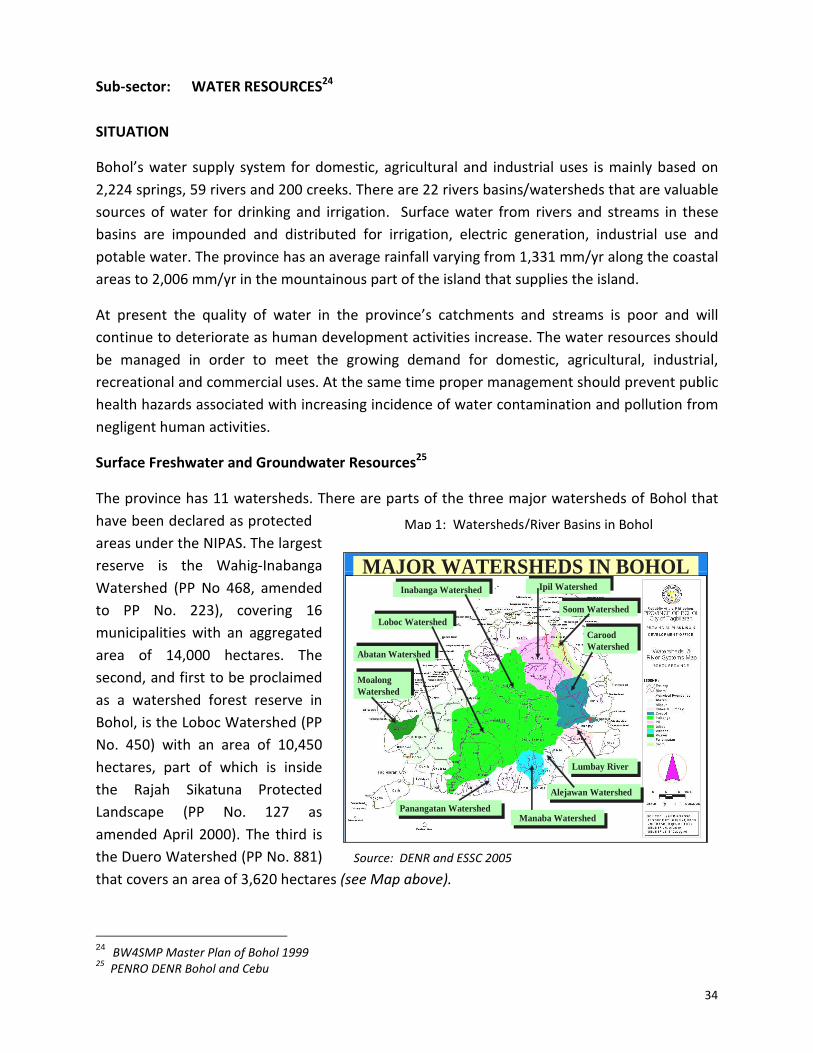
Map 1: Watersheds/River Basins in Bohol
Source: DENR and ESSC 2005
Inabanga WatershedInabanga Watershed
Loboc WatershedLoboc Watershed
Abatan WatershedAbatan Watershed
MoalongWatershed
MoalongWatershed
Ipil WatershedIpil Watershed
Soom WatershedSoom Watershed
CaroodWatershed
CaroodWatershed
Lumbay RiverLumbay River
Alejawan WatershedAlejawan Watershed
Manaba WatershedManaba WatershedPanangatan WatershedPanangatan Watershed
MAJOR WATERSHEDS IN BOHOL
Sub-sector: WATER RESOURCES24
SITUATION Bohol’s water supply system for domestic, agricultural and industrial uses is mainly based on 2,224 springs, 59 rivers and 200 creeks. There are 22 rivers basins/watersheds that are valuable sources of water for drinking and irrigation. Surface water from rivers and streams in these basins are impounded and distributed for irrigation, electric generation, industrial use and potable water. The province has an average rainfall varying from 1,331 mm/yr along the coastal areas to 2,006 mm/yr in the mountainous part of the island that supplies the island. At present the quality of water in the province’s catchments and streams is poor and will continue to deteriorate as human development activities increase. The water resources should be managed in order to meet the growing demand for domestic, agricultural, industrial, recreational and commercial uses. At the same time proper management should prevent public health hazards associated with increasing incidence of water contamination and pollution from negligent human activities. Surface Freshwater and Groundwater Resources25
The province has 11 watersheds. There are parts of the three major watersheds of Bohol that have been declared as protected areas under the NIPAS. The largest reserve is the Wahig-Inabanga Watershed (PP No 468, amended to PP No. 223), covering 16 municipalities with an aggregated area of 14,000 hectares. The second, and first to be proclaimed as a watershed forest reserve in Bohol, is the Loboc Watershed (PP No. 450) with an area of 10,450 hectares, part of which is inside the Rajah Sikatuna Protected Landscape (PP No. 127 as amended April 2000). The third is the Duero Watershed (PP No. 881) that covers an area of 3,620 hectares (see Map above).
24 BW4SMP Master Plan of Bohol 1999 25 PENRO DENR Bohol and Cebu
35
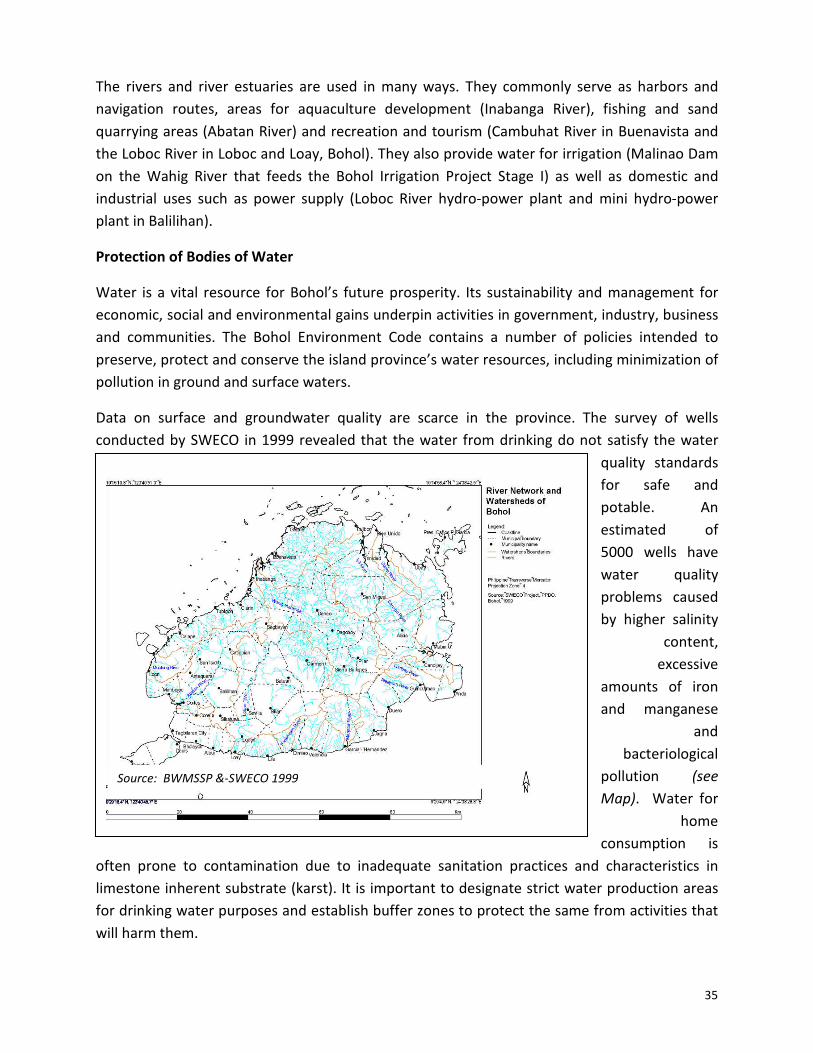
Source: BWMSSP &-SWECO 1999
The rivers and river estuaries are used in many ways. They commonly serve as harbors and navigation routes, areas for aquaculture development (Inabanga River), fishing and sand quarrying areas (Abatan River) and recreation and tourism (Cambuhat River in Buenavista and the Loboc River in Loboc and Loay, Bohol). They also provide water for irrigation (Malinao Dam on the Wahig River that feeds the Bohol Irrigation Project Stage I) as well as domestic and industrial uses such as power supply (Loboc River hydro-power plant and mini hydro-power plant in Balilihan). Protection of Bodies of Water Water is a vital resource for Bohol’s future prosperity. Its sustainability and management for economic, social and environmental gains underpin activities in government, industry, business and communities. The Bohol Environment Code contains a number of policies intended to preserve, protect and conserve the island province’s water resources, including minimization of pollution in ground and surface waters. Data on surface and groundwater quality are scarce in the province. The survey of wells conducted by SWECO in 1999 revealed that the water from drinking do not satisfy the water
quality standards for safe and potable. An estimated of 5000 wells have water quality problems caused by higher salinity
content, excessive
amounts of iron and manganese
and bacteriological
pollution (see Map). Water for
home consumption is
often prone to contamination due to inadequate sanitation practices and characteristics in limestone inherent substrate (karst). It is important to designate strict water production areas for drinking water purposes and establish buffer zones to protect the same from activities that will harm them.
36
DEVELOPMENT ISSUES • Over-extraction of groundwater sources which causes salt-water intrusion • Non-systematic approach to water resource management • Water crisis due to inefficiency of essential water infrastructure facilities • Continued pollution and exhaustion of water tables and permanent destruction of
the valuable aquifers • No karst landscape management program to protect underground water sources • Limited water conservation practices for domestic , agricultural areas and
industrial uses DEVELOPMENT FRAMEWORK Development Goal
• Ensure effective and sustainable use of water resources and generation (recharge) areas
Development Objectives • To formulate appropriate water pricing for sustainable use of water resources • To establish a Bohol Watershed Network with a designation of priority catchments
for protection. These are areas that are strictly needed for water production and enhanced protection zoning including peripheral buffer zones
• To designate flooding areas as buffer zones (water reserve basins) to reduce damage from heavy flooding and increase water infiltration
• To improve water use including conservation of groundwater resources Development Strategies
• River bank stabilization through greenbelts or planting of ornamental plants and deep-rooted trees
• Develop and implement a comprehensive karst management plan for the province • Institutionalize Integrated Water Resources Management Plan • Strengthen institutional capacity for water resource management • Implement the Provincial Water Supply, Sewerage and Sanitation Sector Plan • Promotion of water conservation program
37
Sub-sector : MINERAL RESOURCE MANAGEMENT
SITUATION According to the Mines and Geo-Sciences Bureau, Bohol has large deposits of metals and minerals e.g. limestones, manganese, silica, dolomite, gold, deorite, chromite, rock phosphate, guano(organic fertilizers) and pebbles. There are 124 mineral quarry operators (small-scale) with Environmental Compliance Certificates (ECCs) issued by the Department of Environment and Natural Resources. These certify that based on the presentations of the proponents as reviewed and validated, the projects will not cause a significant impact and that the operators or proponents have complied with all the requirements of the Environmental Impact Statement (EIS). The monitoring system for the EIS is still very weak. Consequently very little has been done with rehabilitation of abandoned mining areas. The Map below shows the location with Mining Rights in the Province of Bohol.
MINERAL RIGHTS MAPProvince of BOHOL As of March 14, 2005
Land Area - 411,726 HectaresTotal Area of Mining Rights & Applications (On-Shor e) – 101,399.1704 Hectares
(24.63% of total land area)Total Area Applied for MPSA/EXP in Offshore Mineral Reservation – 75,168.0000 has.
38
MGB-DENR records in Region 7 shows that the total area of Mining Rights and application (on- shore) is 101,399 hectares or 24.63 percent of the province’s total land area. While the total area applied for Mineral Production Sharing Agreements (MPSA) and Exploration (offshore) is 75,168 hectares. There are two large scale mining areas applied; first is the Philippine Mining Service Corporation containing an area of 640 hectares-the largest in Bohol is in Garcia-Hernandez and second is located in Talibon with a consolidated are of 243 hectares applied. Major mining activities in Bohol occur in the form of sea sand extraction, pebbles and stone gathering and limestone quarrying. Among the commodities that have also been mined and extracted are white clay, silica sand, manganese, gold, copper, rock phosphate and aggregates (Refer to Mining Map). Increasing domestic and external demands for the utilization of minerals for infrastructure development and industrial raw materials combined with irregular mining and quarrying practices have caused adverse impacts on the environment. These effects are increased soil erosion, water pollution, destruction of heritage areas and unique landscapes, reduction of biological diversity and deterioration of coastal fisheries. Bohol Mining Ordinance of 2008 In December 2008, the Bohol Mining Ordinance was approved and adopted by the Honorable
Members of the Sangguniang Panlalawigan
that regulates the issuance of
small-scale mining permits, quarry permits, sand and gravel
extraction permits,
government and private
gratuitous permits,
commercial and gratuitous guano
permits, gemstone gathering permit, pebble extraction permit and other special permits. It establishes the mechanics of issuances; imposes taxes on extracted materials; and provides penalties for violations of certain provisions. It further defines that the Provincial Governor has the power to issue permits to extract these types of resources within the territorial jurisdiction of the province as amended under R.A. 9742, The Philippine Mining Act of 1995. To fully
39
implement the Provincial Ordinance, the Governor has created and deputized a Task Force Kalikupan to monitor the province-wide mineral operation and watch for illegal haulers in consonance with the existing laws and regulations. The record shows that there 139 permittees who are engaged in sand and gravel extraction see Map 4 and Table 4 of Annex A: source BEMO 2009, the status of the sand and gravel operations in Bohol).
DEVELOPMENT ISSUES � Unregulated small-scale mining and the non- observance of the restoration provisions
under PD 1198 (amended Mining Law of 1995) � Open pit mining reducing forest and other vegetative cover � Erosion from mining activities � Uncertainties concerning protected areas and local government discretion � Inadequate personnel to monitor mining activities � Mining in geologically sensitive formations such as cave areas � Mining exploration permit is issued without the knowledge of local officials and
landowners DEVELOPMENT FRAMEWORK Development Goals
� Ensure protection and rehabilitation of the environment where mining activities are undertaken
Development Objectives � To restore quarried and other mining areas � To rationalize the extraction of minerals to support local and national industrialization
Development Strategies
� Establishment of a database for a Mineral Resource Information Management System � Institutionalization of a Multi-Partite monitoring system � Strict implementation of the EIA system (streamlining the process without disregarding
the community consultation at the barangay level) � Formulation of Policy on the issuance of Exploration Permit to ensure coordination with
MLGUs, PLGU, civil society and community organizations � Implementation of Bohol Provincial Mining Ordinance
40
Coastal Resources Map of Bohol
Source: CRM-BEMO2007
Map 6: Bohol Municipal Waters
Sub-sector : COASTAL/MARINE RESOURCE MANAGEMENT
SITUATION Bohol has a total area of 624,506 hectares of municipal waters (6,245.06 square kilometers) and has a total shoreline length excluding offshore islands of 654 kilometers.26 It has 30 coastal municipalities with 304 coastal barangays and 72 islets. Approximately 33 percent of Bohol’s population is directly dependent on fishing and fisheries-related activities as major sources of income (see Map 5 & 6). Table 5 of Annex A presents the coastal profile in the province of Bohol with corresponding barangyas, land area and population. Based on the records of the Regional Office of BFAR, the total area granted for fishpond development is 2,909.97 hectares. This data is, however, still subject for verification as BFAR is conducting an on-going inventory of fishpond areas in Bohol.
The joint DA/BFAR and DENR General Memorandum Order No. 3, Series of 1991, tried to respond to the problem of idle, unproductive, abandoned and/or illegal fishpond areas by reverting them into their original classification of timberland. Fishpond areas with FLAs that are found to be violating this policy will be reverted to the administration of DENR. All applications within timberlands, which have not been released for fishpond development by DENR, shall automatically be returned without being acted upon. However, not even one idle unproductive, abandoned or illegal fishpond has been reverted to the category of timberland.
26 Bohol Coastal Environment Profile 2002
41
Source: DENR and BFAR Region 7- 2007
Danajon Bank Double Barrier Reef Location Map
Coastal Habitats Bohol is boasts of its white, sandy beaches that are commonly used as sites for tourism development (hotels, restaurants, beach resorts among others), fish and boat landings, and as a source of construction materials. These areas are evidence of healthy coral reef ecosystems. Many environmental issues focus on the beach ecosystem as it is prime land for commercial and household development due to its aesthetic value. The coastal environment is like a magnet. It attracts the interests of many people to the shoreline, mangroves, coral reefs and fisheries that inhibit the near shore waters. The area covering municipal waters is measured 15 kilometers seaward from the furthest inhabited shoreline to one kilometer inland if the shoreline contains estuaries, mangrove forests or marshlands.27 This means the total municipal waters of the 29 towns and one city is two and one-half times Bohol’s land area. It also indicates that there is a remarkably huge area to consider in planning, yet only a few coastal LGUs have started to manage coastal areas. With the enactment of the Philippine Fisheries Code of 1998 and the Bohol Environment Code, the national government recognized that a paradigm shift was needed to adequately provide for the development, management and conservation of coastal resources. Danajon Bank Double Barrier Reef The Danajon Bank, is a double barrier reef that runs parallel to the northern coast of Bohol and is proposed as a designated provincial rehabilitation, conservation and protection area (see Map 7). The Danajon Double Barrier Reef is one of the six double barrier in the world and the only one in the Philippines which could likely be nominated as national heritage site. Because of its unique coral reef ecology, Danajon Bank is a major breeding ground and habitat of many different species of fishes, marine mammals, mollusks, seagrasses and seabeds. It is composed of the outer Caubyan and inner Calituban barrier reefs. It runs along the coastline of four municipalities, Getafe, Bien Unido, Talibon and Ubay in the south and into the Camotes Sea in the north. To the west is run all the way to Cebu and to the east and northeast to Leyte and Southern Leyte. The establishment of the protected reef area 27 Republic Act 8550 (The Philippine Fisheries Code of 1998, Chapter 1, Section 4(58))
42
Current Status of the Current Status of the DanajonDanajon Double Barrier ReefDouble Barrier Reef
Only 25% of the entire coral reef is in good condition. The other parts are either in fair or poor condition.
Figure 5: Status of Danajon Double Barrier Reef
Sattelite Image of Danajon Bank
Source: FISH Project-USAID 2005 and BFAR, UP-MSI, CRM-DENR
should serve as an excellent example of how northern coastal towns of Bohol, from Tubigon to President C. Garcia can work together to implement an inter-provincial Coast Resource Management program to protect and preserve this unique treasure. However, such as marine resources like coral reef ecosystems, seagrass beds, mangrove forests, estuaries and inter-tidal seascapes are fragile and have limited potentials if they are utilized improperly. Because these ecosystems are stressed by an increasing population, environmentally-degrading consumption patterns, pollution wastes and human encroachment in coastal zones, there is an urgent need to protect and conserve the integrity of the ecosystems in order to continue to provide benefits to the present and future generations. Status of Coral Reefs and Sea Grass Beds Coral reefs commonly known as rainforest of the sea while serving as a buffer against underwater current constitute one of the provinces most productive and diverse ecosystems. They cover an estimated area of 1,920 hectares that include the Danajon Bank Reef in Inabanga, Buenavista, Getafe, Talibon, Trinidad, Bien Unido, Ubay, President Garcia and Mabini. However, the state of the province’s reefs are classified as 35% poor condition, 40% fair condition, only 25% in good condition and o% excellent (BFAR, UP-MSI,
CRMP and DENR surveys, FISH Project-USAID Survey 2005. This means that Bohol has already lost more than three quarters of its known corals. This has had a significant effect on the breeding grounds of many marine biodiversity. Significant human threats to coral reefs include collecting and exporting, blasting, use of cyanide, siltation, boat anchorage (especially diving boats), illegal fishing methods, storms, coral bleaching due to increase temperature, pier wharf and breakwater and other construction activities (see Figure 5 & Map ).
43
Socio-Economic Significance and Value of Coastal Zone
The coastal zone in Bohol is an important part of the province wealth that interface between land and sea which is highly characterized by rich and diverse coastal ecosystem due to its 72 island including islets with a coastline extending to more than 654 kilometers. This current condition favors the growth and development of the various interrelated but distinct components of Bohol coastal ecosystem, namely, the mangrove swamps, coral reefs, seagrasses, coastal wetlands, estuaries and sandy white beaches. These areas contain natural resources of great socio-economic value. The vast marine resources contributed much in the development of livelihood for almost two-thirds of the population in Bohol living within the coastal areas. It continues to be a rich of source of fish and aquatic products, a primary mode of navigational transportation, maritime trading, coastal tourism, a major area for human settlement, a breeding ground and habitat for the province’s wildlife and a predominant feature of the Bohol’s natural beauty as an island province.
� Fisheries/marine organisms
� Water � Gravel/sand/pebbles
Resources
Ecological � Biodiversity � Habitat
Recreation � Swimming � Boating � Jet skiing � Surfing
Development � Fisheries � Tourism � Commercial � Navigation � Shipping
44
DEVELOPMENT ISSUES • Degradation of marine environment due to land-based activities like pollutive
operation industries, reclamations, agriculture, animal husbandry and settlements (shanties)
• Exploitation of coastal and marine habitat resources • Non-consideration for sustainable coastal land use planning and principles • Coastal erosion and sedimentation • Degradation of shoreline and foreshore areas • Non-observance of 20-meters salvage zone in the shoreline for environmental
protection • Seawater level rise and ocean acidification
DEVELOPMENT FRAMEWORK
Development Goals • Sustainable development of coastal/marine resources
Development Objectives • To increase productivity and income to the people of Bohol in the coastal areas • To increase protection of existing marine sanctuaries in the province of Bohol
Development Strategies • Update and integrate Coastal Resource Management Plan and Zoning Ordinances
into municipal comprehensive land use plans and Poverty Database Monitoring System
• Establish marine and fish sanctuaries to augment those already present • Establish protection program for Danajon Double Barrier Reef • Strictly enforce coastal laws, rules and regulations under the provisions of RA 8550
or The Philippine Fisheries Code of 1998 • Facilitate and regulate the issuance of PACBRMA and CBFMA in mangroves areas • Adopt intensified coastal resource management through community-based
approaches • Banning commercial fishing vessels from operating within the municipal waters • Collaborate planning, monitoring and evaluation on a yearly basis by NGAs, NGOs,
and coastal MLGUs • Encourage implementation of the Aquaculture Code of Conduct
45
Status of Waste Generation in Bohol
65%
20%
5%10%
Compostable Recyclable Special Residual
Figure 6: Waste Profile in Bohol
Source: BEMO 2008
Sub-sector : URBAN DEVELOPMENT/ MANAGEMENT
SITUATION Solid/Liquid Waste and Sewage
One of the most serious problems that confront the country and even in our province is pollution due to improper handling and disposal of both solid and liquid waste. As the population grows and continued influx of migrants, transients, and economic activities become more intensive it directly correlates with an increase in the volume of solid wastes in Bohol’s city and municipalities. This problem occurs not only in the urban areas where population is high and human activities are continuous and intense but it is widely felt in the rural areas as a consequence of development. Despite this alarming situation, current initiatives to address aggravating waste problems have been instituted by the Provincial Government through the Bohol Environment Management Office. The present waste profile warrants a more comprehensive and integrated approach to solve the problem for both liquid and solid wastes. Solid and Liquid Waste 28 In 2008, 600,000 kilograms per day (or and estimated of 0.5 kilograms per capita per day) of solid waste generated daily within the province. Roughly 60% of these solid wastes are collected and transported to the existing dumpsites. The major solid wastes in the province are food wastes, garden wastes, plastics, paper, cardboard and wood materials. Of these waste materials, 65 percent are compostable, 20 percent are recyclable, 5% are special waste like toxic and hazardous wastes generated from hospitals, funeral parlors, households (aerosols) and effluents from industries and 10% are considered the residual waste that can not be used for other purpose and have to be carefully disposed of by local government units (see Figure 6). Tagbilaran City and a few municipalities in Bohol have already their own dumping sites. However, only few sites had practiced in waste segregation, composting and recycling. In some LGUs, waste management, specifically in the final disposal system, are not yet conceived due to unavailability of suitable land areas and the high cost of establishing and maintaining a sanitary
28 Bohol Environment Management Office 2008 & ECOGOV and CDM FS Report by Ex Corporation 2006
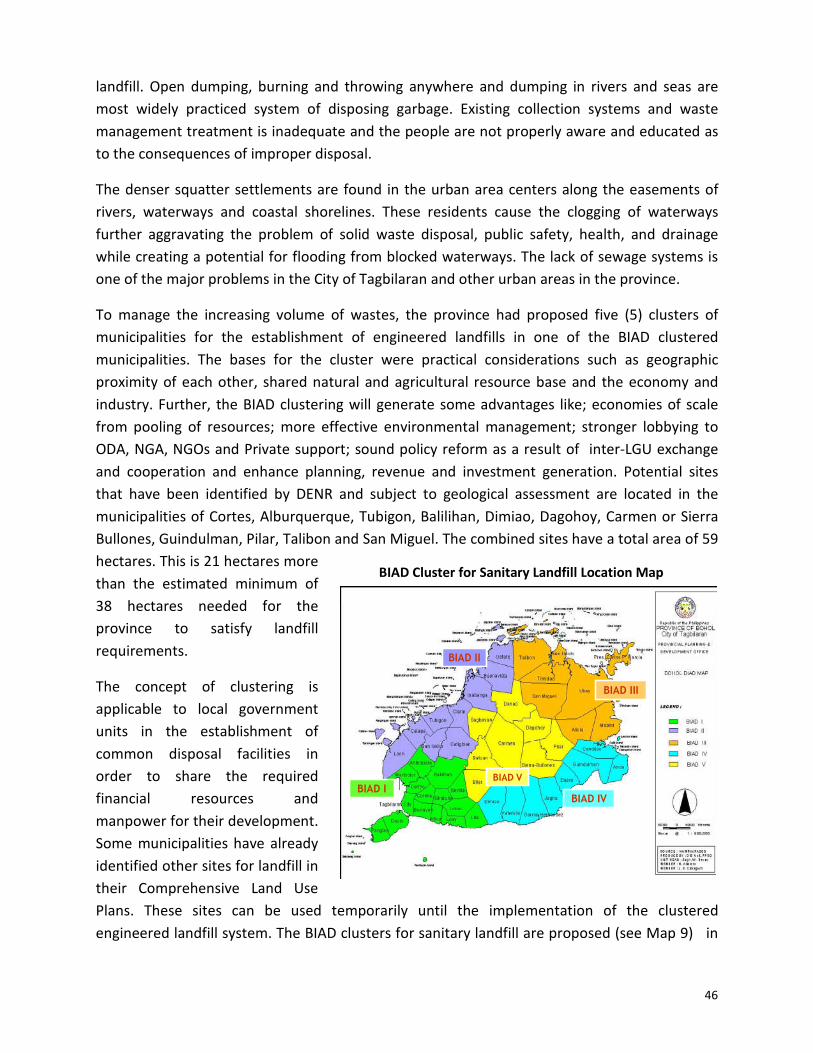
46
BIAD I
BIAD II
BIAD III
BIAD IV
BIAD VBIAD I
BIAD II
BIAD III
BIAD IV
BIAD V
BIAD Cluster for Sanitary Landfill Location Map
landfill. Open dumping, burning and throwing anywhere and dumping in rivers and seas are most widely practiced system of disposing garbage. Existing collection systems and waste management treatment is inadequate and the people are not properly aware and educated as to the consequences of improper disposal. The denser squatter settlements are found in the urban area centers along the easements of rivers, waterways and coastal shorelines. These residents cause the clogging of waterways further aggravating the problem of solid waste disposal, public safety, health, and drainage while creating a potential for flooding from blocked waterways. The lack of sewage systems is one of the major problems in the City of Tagbilaran and other urban areas in the province. To manage the increasing volume of wastes, the province had proposed five (5) clusters of municipalities for the establishment of engineered landfills in one of the BIAD clustered municipalities. The bases for the cluster were practical considerations such as geographic proximity of each other, shared natural and agricultural resource base and the economy and industry. Further, the BIAD clustering will generate some advantages like; economies of scale from pooling of resources; more effective environmental management; stronger lobbying to ODA, NGA, NGOs and Private support; sound policy reform as a result of inter-LGU exchange and cooperation and enhance planning, revenue and investment generation. Potential sites that have been identified by DENR and subject to geological assessment are located in the municipalities of Cortes, Alburquerque, Tubigon, Balilihan, Dimiao, Dagohoy, Carmen or Sierra Bullones, Guindulman, Pilar, Talibon and San Miguel. The combined sites have a total area of 59 hectares. This is 21 hectares more than the estimated minimum of 38 hectares needed for the province to satisfy landfill requirements. The concept of clustering is applicable to local government units in the establishment of common disposal facilities in order to share the required financial resources and manpower for their development. Some municipalities have already identified other sites for landfill in their Comprehensive Land Use Plans. These sites can be used temporarily until the implementation of the clustered engineered landfill system. The BIAD clusters for sanitary landfill are proposed (see Map 9) in
47
Alburquerque (BIAD 1), Tubigon (BIAD II), Talibon (BIAD III), Jagna or Duero (BIAD IV) and Dagohoy (BIAD V). Liquid Wastes Water pollution is alarming everywhere in urbanizing cities and municipalities. Steadily increasing levels of economic activities and population growth in urban and rural areas lead to an increase in the volume of liquid wastes and adverse impacts on the health of the population and Bohol’s fragile ecosystems. Sources of water contamination basically come from domestic, agricultural and industrial wastes. These would include the contaminated water and sewage from residential and institutional areas, leachate from solid waste dumps, industrial effluent and storm water. The province has 894 manufacturing establishments categorized as micro, small, medium and large-scale industries (Source: DTI Tagbilaran 2007). However, the management of these establishments with regard to liquid waste treatment is not properly followed and implemented. Even in the construction of subdivisions in the province, sewage systems are not implemented as required by law. Household sewers and liquid waste from hospitals and funeral homes are directly drained to the ground and shorelines. This causes pollution and contamination of underground and coastal waters. There is neither a centralized drainage system nor sewage system in the province of Bohol, even in the City of Tagbilaran. There is no strict supervision and monitoring in the construction of septic tanks, hence, many septic vaults have been improperly designed which has resulted in fecal contamination of water resources and degradation of aquifer water. Big industrial establishments in the province have their own sewage treatment but in terms of the operation of their treatment plants are problematic. They prefer to dispose of their liquid wastes in drains that contaminate water quality. Once contaminated, water treatment is difficult and very expensive. However, all of these activities are reactive rather than proactive and most often than not, fragmented. There is a need for a more coordinated institutional effort to manage liquid waste and maintain the standards and quality of water in the province. The DENR, through the Environment Management Bureau, in strong collaboration with the Bohol Environment Management Office is the primary agency responsible for pollution control management in the province. It is imperative to adopt a comprehensive and integrated approach both to solid and liquid waste management. Non-point Source of Pollution Pollution from non-point sources occurs when rainfall or irrigation runs through land or underground, gathers pollutants along its way and deposits them into rivers, coastal waters and groundwater. The extent of this type of pollution is widespread and difficult to pinpoint
48
because it can occur in any land and water system disturbance. The potential sources of non-point source pollution are households, agriculture, forestry, grazing, septic systems, recreational boating, urban run-off, construction and physical changes to stream channels and habitats. The non-point source pollution is difficult to manage due to its vast area and number of possible sources. Several strategies are needed to control them through planting of trees, shrubs and ground cover to absorb rainwater and lessen erosion and allow thick vegetation or buffer strips to grow along the rivers and creeks to slow down run-off and soak up pollutants. DEVELOPMENT ISSUES • Improper waste management systems in all local government units • Weak enforcement of existing laws, rules and regulations e.g. RA 9003, (RA 9275 Clean
Water Act) RA 6969 • Poor enforcement of air and sound quality regulations especially industries and vehicles
e.g. Clean Air Act (RA 8749) • Indiscriminate burning of crop residues (rice hulls, straw), household wastes and
dumpsites DEVELOPMENT FRAMEWORK Development Goal
• Ensure that all LGUs shall implement solid and liquid waste management program • Cleaner air and reduced noise for healthy people and a more pleasant environment
Development Objectives
• To reduce the negative impact of garbage on health and environment • To protect underground and surface water from contamination and maintain seawater
quality Development Strategies
• Fully implement the Ecological Solid Waste Management Act (RA 9003) and Clean Water Act (RA 9275)
• Establish clustered engineered landfill and Recovery Center Facility in the municipality and Materials Recovery Facility in all barangays
• Monitor and regulate the importation, manufacture, handling, storage and transportation and disposal of hazardous and toxic substances
• Strictly implement planning standard as provided for in the Building and Sanitation Code of the Philippines for the construction of septic systems
• Establish Wastewater Treatment Facility in every establishment
49
Air Pollution Economic activities like industrialization are usually associated with both air and noise pollution. It normally happens if wastes are released into the atmosphere at a faster rate than natural forces can clean the air. These wastes are generally hazardous to both plant and animal life, especially human health. Moreover they can corrode and damage materials, reduce visibility and could have a long-term cumulative effect on the climate leading to a global change in atmospheric conditions. The current state of air quality in the province is generally not alarming due to the fact that there are only a few heavy industries. However, internal combustions engines are the main sources of air pollution in most urban municipalities and the City of Tagbilaran. Among the major sources of air pollution are generated from tricycles, jeepneys, buses, welding shops, barbecue businesses, wood smoke, burning of rice hulls and rice straw, charcoal production, open dump sites, indiscriminate urination, piggery and poultry odors. Three other contributing short term factors are dust coming from unpaved roads, arbitrary burning of household and agricultural wastes, and smoke from the perpetual fire in the Tagbilaran City dump site. The concentration of air pollution is made worse by the nature or kind of fuel used. Power stations are mostly hydroelectric and are located away from settlement areas. The goal of the province is to preserve the air quality by favoring eco-tourism and agro-industrialization as a vehicle for economic growth. The provincial government recognized the problem that there are industries, transportation equipment, motor vehicles and quarry operations emitting both air pollutants and noise and that these should be controlled. Noise and Odor Pollution Noise pollution is mainly traceable to the operations of mechanical equipment and machineries of industrial and manufacturing firms and construction activities. Aside from these sources, noise also emanates from the airport activitiea and transport operations e.g. highways, buildings and major thoroughfares. The main sources of noise pollution in the province are coming from big buses, trucks and tricycles that pass along the highways and major arterial roads, the Bohol Power Plant of NAPOCOR located in Dampas, Tagbilaran City and the jets and planes that take off from the Tagbilaran City airport. The noise level in the City of Tagbilaran and major urban municipalities are generally higher in day time than in the nighttime. Exposure to noise of high decibels for prolonged periods of time has behavior, physiological and sociological effects that cause loss of hearing. Educational institutions situated near street or other noise sources may also have trouble in classrooms with students hearing the teachers. The problems of offensive odor is now becoming a major complaint by residents living near livestock farms, animal feeds and cassava palm oil processing plants. Likewise, gases released by decomposing organic elements as a result of leaching of toxic chemical and accumulation of
50
heavy metals could emit foul odor. Proper maintenance and cleanliness will greatly alleviate the odor problems in the area. DEVELOPMENT ISSUES
� Indiscriminate burning of crop residues (rice hulls, straw), household wastes and dumpsites
� Inadequate financial resources to purchase air quality monitoring equipment � Poor enforcement of air quality regulations especially industries and vehicles
DEVELOPMENT FRAMEWORK Development Goal
� Cleaner air and reduced noise for healthy people and a more pleasant environment Development Objectives
� To protect underground and surface water from contamination and maintain seawater quality
� To contribute to the reduction of greenhouse gases � To reduce greenhouse gas emissions from vehicles and promote fuel efficiency and non-
motorized methods of transportation to save on fuel consumption and generate positive effects to mitigate climate change
Development Strategies
� Implementation of a noise abatement program that includes, among others, restriction of operating hours of establishments that create noises
� Establish a vehicle emission system in accordance with standards provided under PD 1181
� Formulation of standards for buffer zones between noise and air pollution sources and settlements, i.e. for agro-industrial establishments as poultry and hog farms
� Enforce no burning ordinances involving crop residues and household wastes � Evaluation by LGUs of the noise generating potential of infrastructure projects as part of
the requirements in securing zoning clearances and building permits � Close coordination with the Land Transportation Office to check and monitor motor
vehicles, buses, jeepneys so they comply with air quality standards � Review and if appropriate amend the Bohol Environment Code � Improve road network and traffic management systems
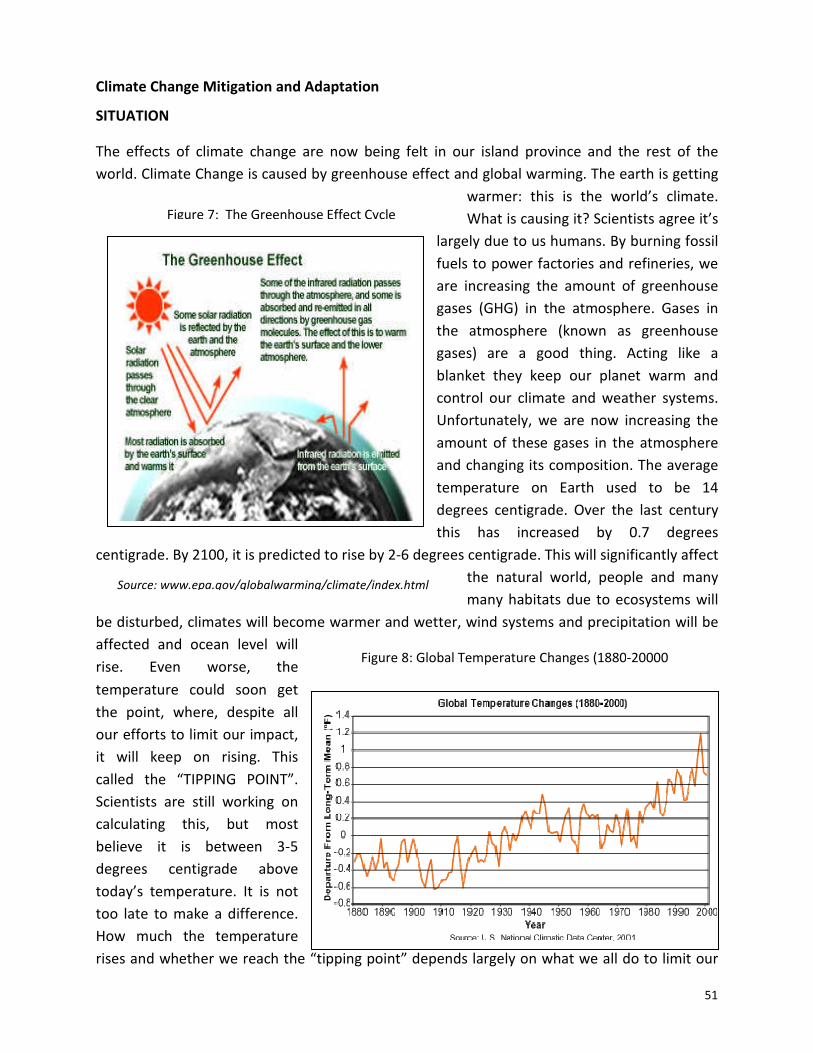
51
Figure 7: The Greenhouse Effect Cycle
Source: www.epa.gov/globalwarming/climate/index.html
Figure 8: Global Temperature Changes (1880-20000
Climate Change Mitigation and Adaptation SITUATION The effects of climate change are now being felt in our island province and the rest of the world. Climate Change is caused by greenhouse effect and global warming. The earth is getting
warmer: this is the world’s climate. What is causing it? Scientists agree it’s
largely due to us humans. By burning fossil fuels to power factories and refineries, we are increasing the amount of greenhouse gases (GHG) in the atmosphere. Gases in the atmosphere (known as greenhouse gases) are a good thing. Acting like a blanket they keep our planet warm and control our climate and weather systems. Unfortunately, we are now increasing the amount of these gases in the atmosphere and changing its composition. The average temperature on Earth used to be 14 degrees centigrade. Over the last century this has increased by 0.7 degrees
centigrade. By 2100, it is predicted to rise by 2-6 degrees centigrade. This will significantly affect the natural world, people and many many habitats due to ecosystems will
be disturbed, climates will become warmer and wetter, wind systems and precipitation will be affected and ocean level will rise. Even worse, the temperature could soon get the point, where, despite all our efforts to limit our impact, it will keep on rising. This called the “TIPPING POINT”. Scientists are still working on calculating this, but most believe it is between 3-5 degrees centigrade above today’s temperature. It is not too late to make a difference. How much the temperature rises and whether we reach the “tipping point” depends largely on what we all do to limit our
52
impact on the atmosphere. Since the industrial revolution the amount of greenhouse gases in the atmosphere have increased dramatically, which is attributed to human activities such as burning fossil fuels, which release more greenhouse gases into the atmosphere and accelerate greenhouse effect that leads to climate change. The increase of greenhouse gases in the atmosphere has caused the earth to warm over the past 100 years. The ten (10) warmest years on record all occurred in the years since 1985 and 1998 is the warmest year on record (see Figure 7 and 8). Rising temperature, erratic weather conditions are just few of the concrete evidence that climate change is unfolding and happening. Impacts of this change have affected our forestry, biodiversity, water, agricultural and fishery resources and even cultural assets. It has a wide-range adverse impact on human health with significant loss of life. Temperature changes affect the transmission of infectious diseases like malaria, dengue, yellow fever and among others. Thus, for sustainability, these resources should be managed to cushion the negative effects brought about by the said climate change. In the Global Picture: Rises in temperature are already being felt:
� The ice caps are melting, leading to sea level rises which could flood cities near the coast;
� Glaciers are disappearing, and the rate at which they disappear is speeding up. Hundreds of millions of people in Asia depend on these for their drinking water;
� Weather patterns are changing. In places like Africa where people are very dependent on rainfall to grow crops and fill wells are causing famine and drought and displacing millions of people.
In the National Situationer (Philippines)
� Seventy percent (70%) of the country’s total land area used to be forested, but this is now down to 24% at only 7.2 million hectares with less than a million (800,000 hectares) virgin forest;
� Our country has the richest marine biodiversity in the world, only less than 5% of our coral reefs are in excellent condition (meaning up to 75% coral cover. We’ve lost 3050% of our sea-grasses and more than 50% of our mangroves. All these have adversely affected the productivity of our coastal areas with fish catch down from 10 kilos effort to only about 2 kilos;
� Philippines is the 2nd to lowest in terms of freshwater availability in Southeast Asia (2nd only to Thailand as of 2000) and our country is already experiencing saline water intrusion in some coastal areas;
� Total suspended particulates (TSP) in the air in most urban centers exceed the standards adversely affecting public health. The economic cost of this air pollution for Metro Manila, Baguio, Cebu and Davao alone was estimated by the World bank at about 400 million US dollars;
53
� Many of the country’s waters (coastal, rivers, lakes, creeks) are polluted from sewage, industrial effluents, agricultural and urban run-off, with an estimated adverse impacts to water pollution on public health, fisheries and tourism to be Php 67 billion per year;
� Solid waste is mounting and is improperly dumped in our creeks, rivers, lakes, seas or any vacant lot aggravating the flooding problem and continue to pollute our surface and groundwater;
In Bohol Province: Situationer on Climate Change � Bohol is among the areas in the Philippines threatened by drastic effects of global
warming; ranked as the 9th of the top 20th provinces vulnerable to a one (1) meter sea level rise (source: Climate Hotspot, Climate Change Impacts in the Philippines conducted by the Greenpeace Southeast Asia, Climate and Energy Campaign in 2007);
� Its seascape as province eco-tourism asset is vulnerable to threats of global warming that may result in sea-level rise; loss of tourism and business investments;
� Cutting of trees in the upland communities; � Degradation of marine environment due to pollution from industries, agriculture,
including animal husbandry, and settlements; � Coastal erosion and sedimentation; � Dumping and burning of solid wastes that include toxic materials and chemicals;
overflowing of sewers; � Increase in frequency and intensity ( El Niño and La Niña phenomenom); � Agricultural and ecological problems (e.g. disruption of wildlife); and � Damage to property
The more frequent occurrence of landslides and flash floods are telling us that the time to act is NOW. We can no longer allow continued destruction of our environment or we will destroy our very own life support systems. There is really a need to Act Locally to solve the global problem on climate change by finding solutions at all levels (individual, community, local and national government, private sector, non-government organizations and among others). Every action counts, working together, we will send a powerful message to leaders and citizens all over the world that millions of us care and are doing something right now to create a safer and more sustainable world for our children and our future. To start of something serious, the cost of addressing the problem now is a lot less painful than trying to fix it later on. Are we willing to pay a little now to avoid a huge climate bill in the future? If all ice in the Antarctic melted, sea levels globally could rise by as much as 80 meters. The Role of the Provincial Government of Bohol the UN Framework on Climate Change The Provincial Government of Bohol is one of six pilot provinces in the country that has actively implemented the Local Development Action Plan for Climate Change in partnership with the
54
Institute of Climate, Energy and Environment (ICLEE) and a full-pledged and active member province in the International Council for Local Environmental Initiatives (ICLEI) since 2002. The aim of this program is to stabilize the concentration of greenhouse gases at a level that would prevent dangerous human interference with the climate system and to take measures to limit anthropogenic emissions of GHG in order to protect and enhance greenhouse sinks and reservoirs like forests. Changes in rainfall patterns, typhoon frequency and the irregular period of occurrence, sea level rise are now becoming noticeable. The connection between local environmental threats and climate change is raising increasing concerns among local government units. It is in the context that local government must and can play a major role in implementing measures on climate change mitigation and adaptation due to their authority to control the necessary changes. Since Bohol Province thru PPDO, BEMO, OPA, OPV is collaborating with national agencies like DENR, DOST, Non-government organizations, Private sector, Academe (Bohol Island State University), Philippine Alumni Association (PA3i) and international undertakings relative to climatic phenomenon, its programs on issues relating to this field have seriously been hampered by the lack of funds. However, some LGUs in the Province of Bohol has pursued to a limited extent, e.g. information and education campaigns in the form of exhibits, seminars, forum/symposium on global warming and climate change. Furthermore, it is a part of the local government’s commitment to improve the people’s understanding of climate change story, why it is happening, what it means and what needs to be done. To put things in its proper perspective, an integrated provincial development plan is necessary wherein the Climate Change Adaptation and Disaster Risk Reduction shall be mainstreamed to local development and spatial plan of the province and the municipalities, so that all issues could be discussed thoroughly which will eventually lead to formulating mitigating and adaptation measures and doable programs and projects.
Existing Activities Related to Climate Change � Climate change awareness program � Environmental management system for the province � Solid waste management program � Coastal resource management program � Watershed management � Reforestation program � Biodiversity Conservation program
DEVELOPMENT ISSUES • Inadequate adaptation or resilience plan on climate change such as the occurrence of (La
Niña) and drought (El Niño) and other natural phenomenon
55
DEVELOPMENT FRAMEWORK Development Goals • Build the capacity of the local government units and civil society in developing mechanisms
to adapt to climate change Development Objectives • To contribute to the reduction of greenhouse gases • To reduce greenhouse gas emissions from vehicles and promote fuel efficiency and non-
motorized methods of transportation to save on fuel consumption and generate positive effects to mitigate climate change
• To formulate mitigating and adaptation measures to address climate change • To develop a monitoring and evaluation framework that will track the progress and
accomplishments of the climate change agenda in the province • To develop networks on climate change Development Strategies • Implementation of Clean Development Mechanism (CDM) e.g. solid waste (bio-composting) • City and municipal LGUs shall enforce traffic regulations that will minimize congestion • Integration of climate friendly information in policy making, planning in school and training
curricula • Establish global warming monitoring (climate monitoring system) and prediction system in
the province • Mainstreaming Local Actions on Climate Change to the provincial and municipal land use
plans • Government, NGOs and the private sector shall advocate and incorporate energy efficiency
and the use of renewable energy sources in guidelines like: building codes, investment codes, procurements, infrastructure development, housing development and street lighting
• LGUs, NGOs, NGAs, and the private sectors shall implement measures that reduce vehicular emissions like anti-smoke belching campaigns, engine tune-ups, and engine maintenance
• Information, Education and Communication Campaigns (IEC). All concerned groups, especially schools and information centers shall incorporate climate friendly information in policy making, planning and implementation programs as well as in school and training curricula
• Establishment of Bohol Institute for Climate Change
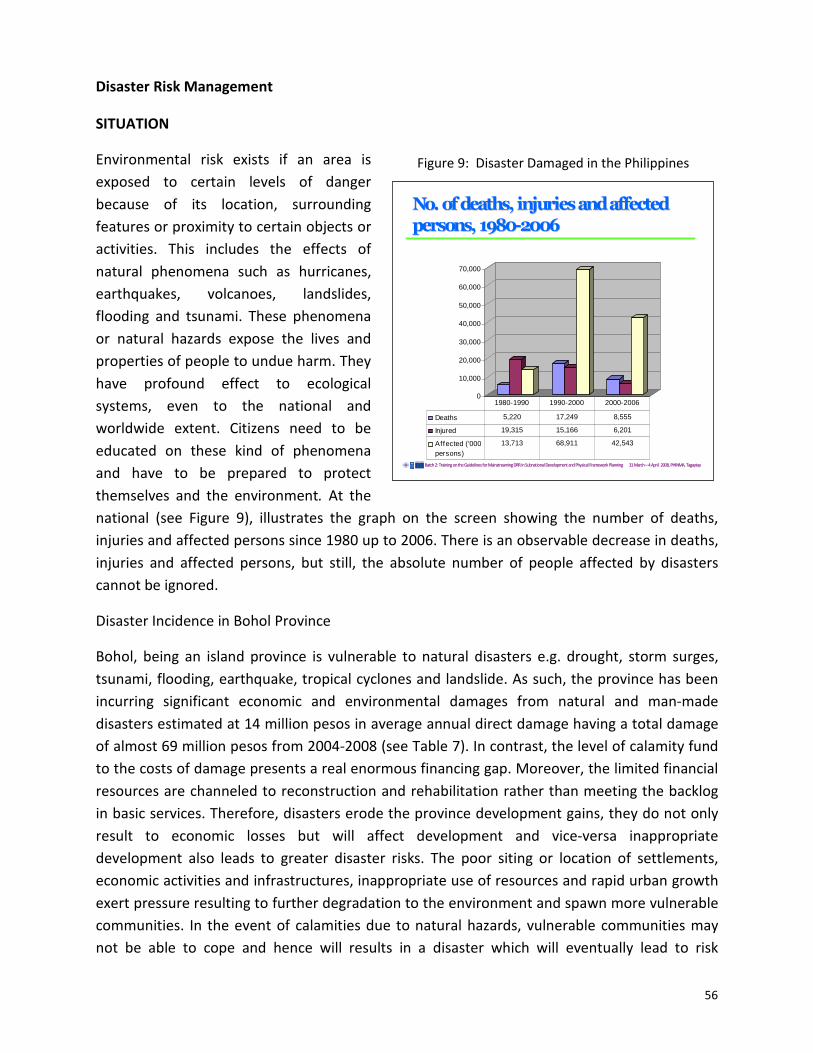
56
0
10,000
20,000
30,000
40,000
50,000
60,000
70,000
Deaths 5,220 17,249 8,555
Injured 19,315 15,166 6,201
Affected ('000persons)
13,713 68,911 42,543
1980-1990 1990-2000 2000-2006
No. of deaths, injuries and affected No. of deaths, injuries and affected persons, 1980persons, 1980--20062006
Batch 2: Training on the Guidelines for Mainstreaming DRR in Batch 2: Training on the Guidelines for Mainstreaming DRR in SubnationalSubnational Development and Physical Framework Planning 31 March Development and Physical Framework Planning 31 March –– 4 April 2008, PHINMA, 4 April 2008, PHINMA, TagaytayTagaytay
Figure 9: Disaster Damaged in the Philippines
Disaster Risk Management
SITUATION Environmental risk exists if an area is exposed to certain levels of danger because of its location, surrounding features or proximity to certain objects or activities. This includes the effects of natural phenomena such as hurricanes, earthquakes, volcanoes, landslides, flooding and tsunami. These phenomena or natural hazards expose the lives and properties of people to undue harm. They have profound effect to ecological systems, even to the national and worldwide extent. Citizens need to be educated on these kind of phenomena and have to be prepared to protect themselves and the environment. At the national (see Figure 9), illustrates the graph on the screen showing the number of deaths, injuries and affected persons since 1980 up to 2006. There is an observable decrease in deaths, injuries and affected persons, but still, the absolute number of people affected by disasters cannot be ignored. Disaster Incidence in Bohol Province Bohol, being an island province is vulnerable to natural disasters e.g. drought, storm surges, tsunami, flooding, earthquake, tropical cyclones and landslide. As such, the province has been incurring significant economic and environmental damages from natural and man-made disasters estimated at 14 million pesos in average annual direct damage having a total damage of almost 69 million pesos from 2004-2008 (see Table 7). In contrast, the level of calamity fund to the costs of damage presents a real enormous financing gap. Moreover, the limited financial resources are channeled to reconstruction and rehabilitation rather than meeting the backlog in basic services. Therefore, disasters erode the province development gains, they do not only result to economic losses but will affect development and vice-versa inappropriate development also leads to greater disaster risks. The poor siting or location of settlements, economic activities and infrastructures, inappropriate use of resources and rapid urban growth exert pressure resulting to further degradation to the environment and spawn more vulnerable communities. In the event of calamities due to natural hazards, vulnerable communities may not be able to cope and hence will results in a disaster which will eventually lead to risk
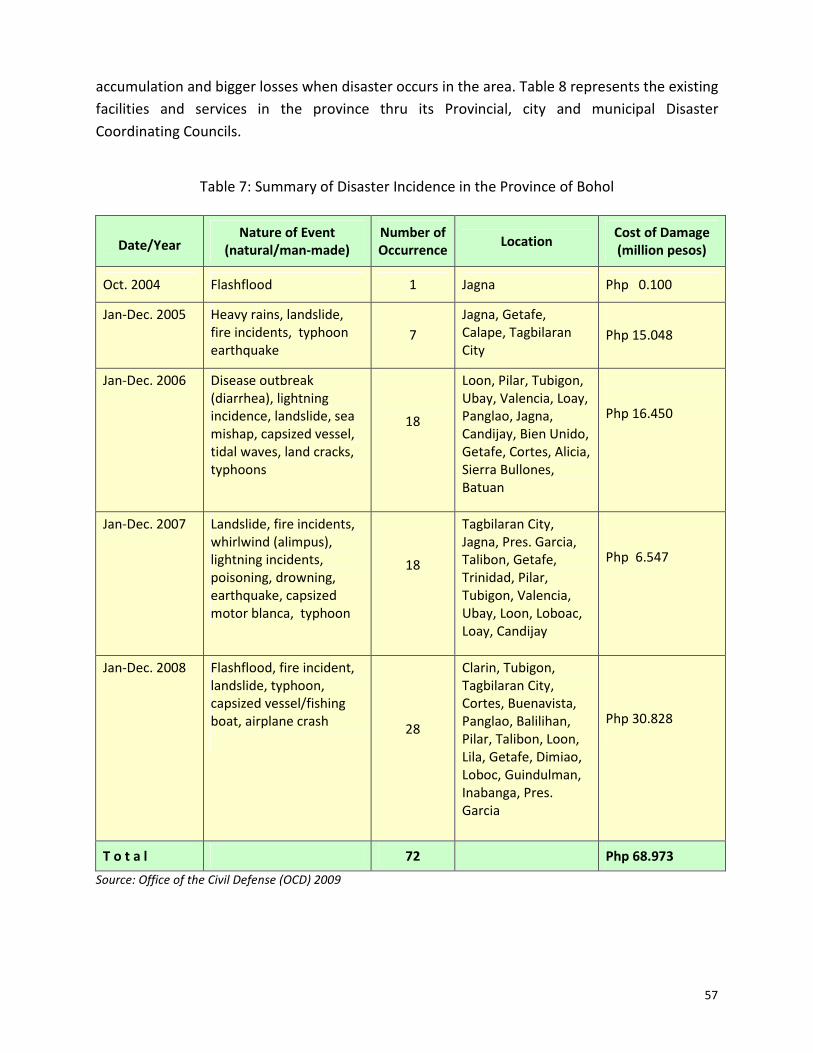
57
accumulation and bigger losses when disaster occurs in the area. Table 8 represents the existing facilities and services in the province thru its Provincial, city and municipal Disaster Coordinating Councils.
Table 7: Summary of Disaster Incidence in the Province of Bohol
Date/Year Nature of Event (natural/man-made)
Number of Occurrence Location Cost of Damage
(million pesos)
Oct. 2004 Flashflood 1 Jagna Php 0.100 Jan-Dec. 2005 Heavy rains, landslide,
fire incidents, typhoon earthquake
7
Jagna, Getafe, Calape, Tagbilaran City
Php 15.048
Jan-Dec. 2006 Disease outbreak (diarrhea), lightning incidence, landslide, sea mishap, capsized vessel, tidal waves, land cracks, typhoons
18
Loon, Pilar, Tubigon, Ubay, Valencia, Loay, Panglao, Jagna, Candijay, Bien Unido, Getafe, Cortes, Alicia, Sierra Bullones, Batuan
Php 16.450
Jan-Dec. 2007 Landslide, fire incidents, whirlwind (alimpus), lightning incidents, poisoning, drowning, earthquake, capsized motor blanca, typhoon
18
Tagbilaran City, Jagna, Pres. Garcia, Talibon, Getafe, Trinidad, Pilar, Tubigon, Valencia, Ubay, Loon, Loboac, Loay, Candijay
Php 6.547
Jan-Dec. 2008 Flashflood, fire incident, landslide, typhoon, capsized vessel/fishing boat, airplane crash
28
Clarin, Tubigon, Tagbilaran City, Cortes, Buenavista, Panglao, Balilihan, Pilar, Talibon, Loon, Lila, Getafe, Dimiao, Loboc, Guindulman, Inabanga, Pres. Garcia
Php 30.828
T o t a l 72 Php 68.973 Source: Office of the Civil Defense (OCD) 2009
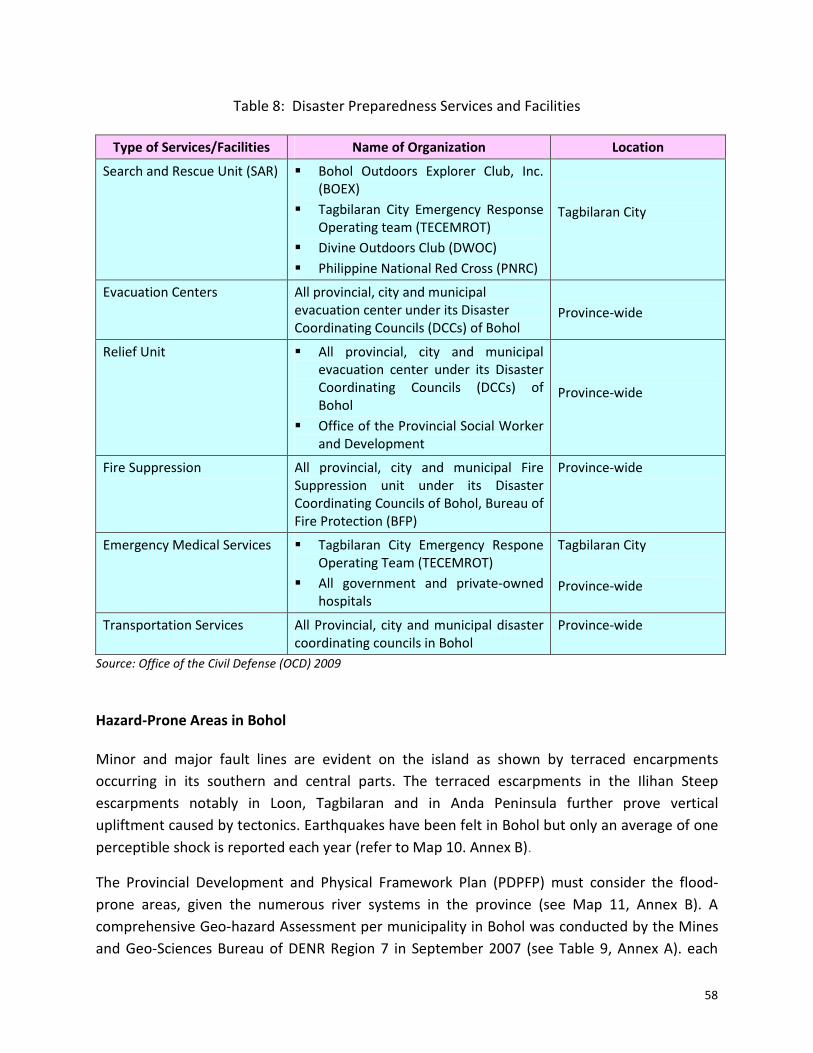
58
Table 8: Disaster Preparedness Services and Facilities
Type of Services/Facilities Name of Organization Location
Search and Rescue Unit (SAR) � Bohol Outdoors Explorer Club, Inc. (BOEX)
� Tagbilaran City Emergency Response Operating team (TECEMROT)
� Divine Outdoors Club (DWOC) � Philippine National Red Cross (PNRC)
Tagbilaran City
Evacuation Centers All provincial, city and municipal evacuation center under its Disaster Coordinating Councils (DCCs) of Bohol
Province-wide
Relief Unit � All provincial, city and municipal evacuation center under its Disaster Coordinating Councils (DCCs) of Bohol
� Office of the Provincial Social Worker and Development
Province-wide
Fire Suppression All provincial, city and municipal Fire Suppression unit under its Disaster Coordinating Councils of Bohol, Bureau of Fire Protection (BFP)
Province-wide
Emergency Medical Services � Tagbilaran City Emergency Respone Operating Team (TECEMROT)
� All government and private-owned hospitals
Tagbilaran City Province-wide
Transportation Services All Provincial, city and municipal disaster coordinating councils in Bohol
Province-wide
Source: Office of the Civil Defense (OCD) 2009 Hazard-Prone Areas in Bohol Minor and major fault lines are evident on the island as shown by terraced encarpments occurring in its southern and central parts. The terraced escarpments in the Ilihan Steep escarpments notably in Loon, Tagbilaran and in Anda Peninsula further prove vertical upliftment caused by tectonics. Earthquakes have been felt in Bohol but only an average of one perceptible shock is reported each year (refer to Map 10. Annex B). The Provincial Development and Physical Framework Plan (PDPFP) must consider the flood-prone areas, given the numerous river systems in the province (see Map 11, Annex B). A comprehensive Geo-hazard Assessment per municipality in Bohol was conducted by the Mines and Geo-Sciences Bureau of DENR Region 7 in September 2007 (see Table 9, Annex A). each
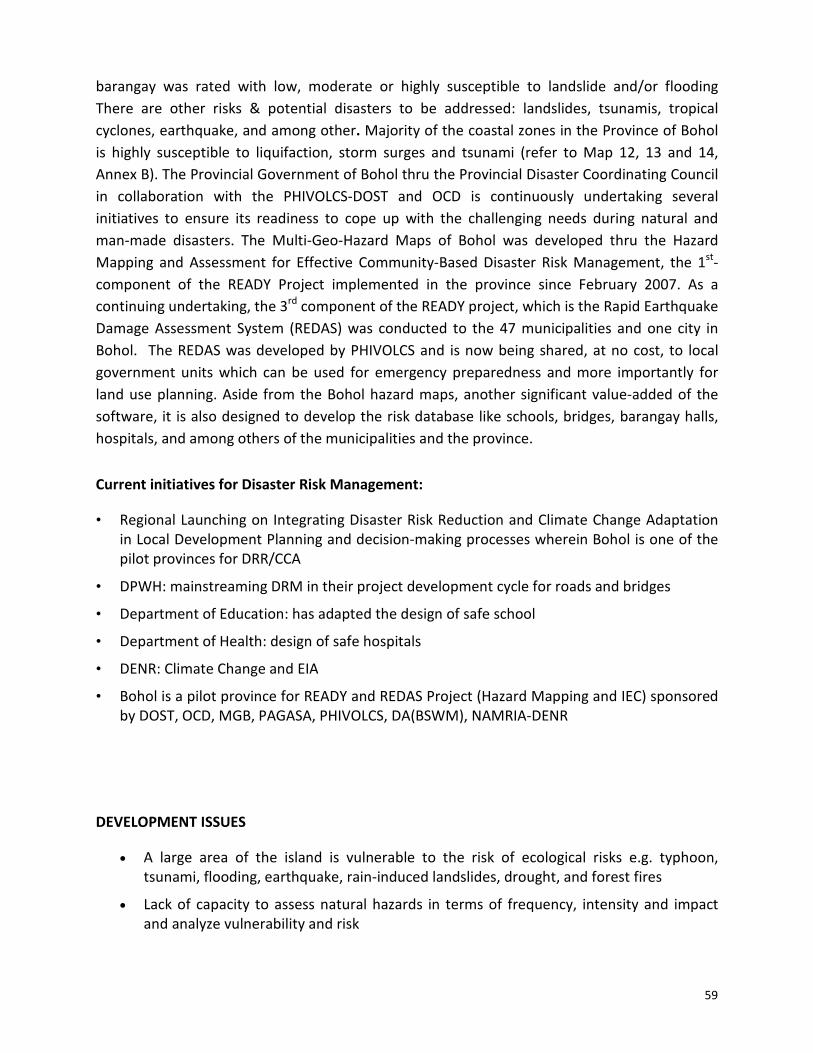
59
barangay was rated with low, moderate or highly susceptible to landslide and/or flooding There are other risks & potential disasters to be addressed: landslides, tsunamis, tropical cyclones, earthquake, and among other. Majority of the coastal zones in the Province of Bohol is highly susceptible to liquifaction, storm surges and tsunami (refer to Map 12, 13 and 14, Annex B). The Provincial Government of Bohol thru the Provincial Disaster Coordinating Council in collaboration with the PHIVOLCS-DOST and OCD is continuously undertaking several initiatives to ensure its readiness to cope up with the challenging needs during natural and man-made disasters. The Multi-Geo-Hazard Maps of Bohol was developed thru the Hazard Mapping and Assessment for Effective Community-Based Disaster Risk Management, the 1st-component of the READY Project implemented in the province since February 2007. As a continuing undertaking, the 3rd component of the READY project, which is the Rapid Earthquake Damage Assessment System (REDAS) was conducted to the 47 municipalities and one city in Bohol. The REDAS was developed by PHIVOLCS and is now being shared, at no cost, to local government units which can be used for emergency preparedness and more importantly for land use planning. Aside from the Bohol hazard maps, another significant value-added of the software, it is also designed to develop the risk database like schools, bridges, barangay halls, hospitals, and among others of the municipalities and the province.
Current initiatives for Disaster Risk Management: • Regional Launching on Integrating Disaster Risk Reduction and Climate Change Adaptation
in Local Development Planning and decision-making processes wherein Bohol is one of the pilot provinces for DRR/CCA
• DPWH: mainstreaming DRM in their project development cycle for roads and bridges • Department of Education: has adapted the design of safe school • Department of Health: design of safe hospitals • DENR: Climate Change and EIA • Bohol is a pilot province for READY and REDAS Project (Hazard Mapping and IEC) sponsored
by DOST, OCD, MGB, PAGASA, PHIVOLCS, DA(BSWM), NAMRIA-DENR
DEVELOPMENT ISSUES • A large area of the island is vulnerable to the risk of ecological risks e.g. typhoon,
tsunami, flooding, earthquake, rain-induced landslides, drought, and forest fires • Lack of capacity to assess natural hazards in terms of frequency, intensity and impact
and analyze vulnerability and risk
60
DEVELOPMENT FRAMEWORK Development Goals • Capacitate the local people in addressing natural and man-made environmental hazards
Development Objectives • To reduce, address or avoid the risks of natural environmental hazards in vulnerable
areas in Bohol including socio-economic and infrastructure risks • To identify DRM approaches and options which include the development of Disaster
Risk Reduction measures (DRR) • To enhance the capacity of local government units in instituting Disaster Risk Reduction
Development Strategies • Adoption of hazard-resilient construction and maintenance for buildings and other
infrastructures • Mainstreaming Disaster Risk Reduction program and policies in provincial and municipal
land use plans (mapping and contingency plans) • Prepare shelter plans for families that will be relocated from the high risk areas • Provision of access to safe new housing sites • Promotion of private sector-led development of affordable housing • Improvement of sites/services in the future • Provision of livelihood opportunities • Establishment of early warning and communication system • Capacity building for resilience and Hazards mapping assessment and analysis • Strengthen the provincial, municipal and barangay disaster preparedness team
Following the analyses specified in the PDPFP, the more important concerns which should be responded to, are those that have serious potentials to be: • Life threatening or are direct threats to public safety; • Threat to the sustainability of key production resources or employment activities; • Threat to the delivery of basic services; and • Harmful or destructive to protected areas, flora, fauna, and other protected natural
resources.
61
Hence, the analyses should show the risks involved in the physical development framework or the specific settlements, production & protection land uses, and infrastructure development aspects of the PDPFP and their translation into goals, objectives and targets for risk reduction. Development Policies
� Restrict or discourage development in hazard-prone areas. � Allow some improvements or activities in hazard-prone areas. � Economic incentives (such as tax relief) that encourage or discourage development in
high hazard areas. � Encourage the removal or relocation of buildings in floodplains � Protect critical facilities, such as police stations and emergency shelters (e.g., elevate
them or prohibit their construction in hazard-prone areas). � Encourage the acquisition/buying out of properties, especially those in hazard prone
areas. � Limit development in environmentally sensitive areas such as steep slopes. � Protect mitigating features of the environment, such as wetlands Environmental & Natural Resource Management (including natural capital, climate change adaptation)
� Community understanding of characteristics & functioning of local natural environment & ecosystems (e.g. drainage, watersheds, slope and soil characteristics) and the potential risks associated with these natural features and the human interventions that affect them (e.g. climate change).
� Adoption of sustainable environmental management practices that reduce hazard risk (e.g. soil & water conservation, sustainable forestry, wetland management to reduce flood risk, conservation of mangroves as buffer against storm surges, maintenance of water supply & drainage systems)
� Preservation of biodiversity (e.g. through community-managed seed banks, with equitable distribution system).
� Preservation & application of indigenous knowledge and appropriate technologies relevant to environmental management.
� Access to community-managed common property resources that can support coping & livelihood strategies in normal times & during crises.
Health and Well Being (including Human capital)
� Physical ability to labor & good health maintained in normal times through adequate food & nutrition, hygiene & health care.
� High levels of personal security and freedom from physical & psychological threats.
62
� Food supplies & nutritional status secure (e.g. through reserve stocks of grain & other staple foods managed by communities, with equitable distribution system during food crises).
� Access to sufficient quantity & quality of water for domestic needs during crises. � Awareness of means of staying healthy (e.g. hygiene, sanitation, nutrition, water
treatment) and of life-protecting/saving measures, and possession of appropriate skills.
� Community structures and culture support self confidence and can assist management of psychological consequences of disasters (trauma, PTSD).
� Community health care facilities & health workers, equipped & trained to respond to physical & mental health consequences of disasters & lesser hazard events, and supported by access to emergency health services, medicines, etc.
Sustainable Livelihoods
� High level of local economic activity & employment (including among vulnerable groups); stability in economic activity & employment levels
� Equitable distribution of wealth and livelihood assets in community � Livelihood diversification (household & community level), including on-farm and off-
farm activities in rural areas � Fewer people engaged in unsafe livelihood activities (e.g. small-scale mining) or
hazard-vulnerable activities (e.g. rainfed agriculture in drought-prone locations) � Adoption of hazard-resistant agricultural practices (e.g. soil & water conservation
methods, cropping patterns geared to low or variable rainfall, hazard-tolerant crops) for food security
� Small enterprises have business protection & continuity/recovery plans � Local trade & transport links with markets for products, labor & services protected
against hazards and other external shocks Social Protection (including social capital)
� Mutual assistance systems, social networks and support mechanisms that support risk reduction directly through targeted DRR activities, indirectly through other socio-economic development activities that reduce vulnerability, or by being capable of extending their activities to manage emergencies when these occur *
� Community access to basic social services (including registration for social protection and safety net services).
� Established social information and communication channels; vulnerable people not isolated.
63
� Collective knowledge and experience of management of previous events (hazards, crises).
� Development of informal systems (individual, household, family, clan, caste, etc.) and more structured groups (CBOs: e.g. emergency preparedness committees, support groups/buddy systems to assist particularly vulnerable people, water management committees, burial societies, women’s associations, faith groups).
Physical Protection; Structural and technical measures
• Community decisions & planning regarding built environment take potential natural hazard risks into account (including potential for increasing risks through interference with ecological, hydrological, geological systems) and vulnerabilities of different groups.
• Security of land ownership/tenancy rights. Low/minimal level of homelessness and landlessness.
• Safe locations: community members & facilities (homes, workplaces, public & social facilities) not exposed to hazards in high-risk areas and/or relocated away from unsafe sites.
• Structural mitigation measures (embankments, flood diversion channels, water harvesting tanks, etc.) in place to protect against major hazard threats, built using local labour, skills, materials and appropriate technologies as far as possible.
• Knowledge and take-up of building codes/regulations throughout community. • Adoption of hazard-resilient construction and maintenance practices for homes and
community facilities using local labor, skills, materials and appropriate technologies as far as possible
• Community capacities and skills to build, retrofit and maintain structures (technical & organizational).
• Adoption of physical measures to protect items of domestic property (e.g. raised internal platforms & storage as flood mitigation measure, portable stoves) and productive assets (e.g. livestock shelters).
• Adoption of short-term protective measures against impending events (e.g. emergency protection of doors/windows from cyclone winds)
• Infrastructure & public facilities to support emergency management needs (e.g. shelters, secure evacuation & emergency supply routes)
• Resilient & accessible critical facilities (e.g. health centers, hospitals, police & fire stations – in terms of structural resilience, back-up systems, etc.)
• Resilient transport/service infrastructure & connections (roads, paths, bridges, water supplies, sanitation, power lines, communications, etc.)
64
• Locally owned or available transport sufficient for emergency needs (e.g. evacuation, supplies), at least in the event of seasonal hazards; transport repair capacity within community.
Financial Instruments (including financial capital)
• Household and community asset bases (income, savings, convertible property) sufficiently large and diverse to support crisis coping strategies.
• Costs and risks of disasters shared through collective ownership of group/community assets.
• Existence of community/group savings and credit schemes, and/or access to micro-finance services.
• Community access to affordable insurance (covering lives, homes and other property) through insurance market or micro-finance institutions.
• Community disaster fund to implement DRR, response and recovery activities. • Access to money transfers and remittances from household and community
members working in other regions or countries. Cross-cutting Strategies for the Environment Management
• Strengthen the capacities of stakeholders for environmental assessment, policy management and enforcement
• Promote an integrated approach to link social and economic development with protection of ecosystems that is decentralized and community-based approach
• Develop sustainable funding mechanism to support different initiatives e.g. endownments, taxes, user fees, etc
• Cultivate the culture of Corporate Social Responsibility (building alliance) • Formulate Responsive Policy • Constant review of existing code and policies • Competent technical personnel in key management positions/with adequate
compensation • Adequate coordination body to reduce duplication of initiatives • Adequate IEC programs • Adequate monitoring and feed backing mechanisms • Integration of environmental education in the school curriculum • Identify good practices and promote environmentally sound natural resources
management at all levels including private sector development • Promote sustainable financing of services derived from natural
SSSOOOCCCIIIAAALLL SSSEEECCCTTTOOORRR DDDEEEVVVEEELLLOOOPPPMMMEEENNNTTT PPPLLLAAANNN
PPPDDDPPPFFFPPP 222000111000---222000111555
PDPFP 2010-2015 Social Development Sector 66
LIST OF TABLES LIST OF MAPS LIST OF FIGURES ACCRONYMS GLOSSARY OF TERMS 1 History of Bohol … 79 2 Population & Settlements … 82 2.1 Population: Regional & National Context … 82
2.2 Size & Spatial Distribution of Population in Bohol … 83 2.2.1 Population Size & Growth … 83 2.2.2. Age & Sex Composition … 86
2.3 Spatial Distribution … 87 2.3.1 Percentage of Population by … 87
Geographic Classification 2.3.2 Population Density … 87
2.4 Other Demographic Characteristics of Bohol … 89 2.4.1 Marital Status/Age at Marriage … 89
2.5 Urbanization and Settlements … 89 2.5.1 Current Trend/Existing Settlement Pattern … 89 2.5.2 Spatial Distribution and Future Population Growth/ 92
Settlement Trends 6.3 Social Services … 95
6.3.1 Health … 95 6.3.1.1 General Health Situation of the Population … 95 6.3.1.2 Key Development Challenges & Issues … 102 6.3.1.3 Development Plan Framework … 106 Annex 1. Hospital Rationalization Options … 109
Contents PDPFP 2010-2015
SOCIAL DEVELOPMENT SECTOR
PDPFP 2010-2015 Social Development Sector 67
6.3.2 Education & Manpower Development 6.3.2.1 Education Development in Bohol … 123 6.3.2.2 Key Development Challenges & Issues … 128 6.3.2.3 Development Plan Framework … 129
6.3.3 Housing 6.3.3.1 Housing Situation in Bohol … 123 6.3.3.2 Key Development Challenges & Issues … 128 6.3.3.3 Development Plan Framework … 129
6.3.4 Social Welfare & Development 6.3.4.1 Social Welfare and Development Situationer … 131 Poverty Situation, 2000-2006 … 132 Social Welfare Facilities … 135 6.3.4.2 Key Development Challenges & Issues … 137 6.3.4.3 Development Plan Framework … 137
6.3.5 Culture 6.3.5.1 Cultural Environment … 139 6.3.5.1 Ethnic/Cultural Communities … 140 Historical & Cultural Heritage … 141
6.3.4.2 Key Development Challenges & Issues … 142 6.3.4.3 Development Plan Framework … 143
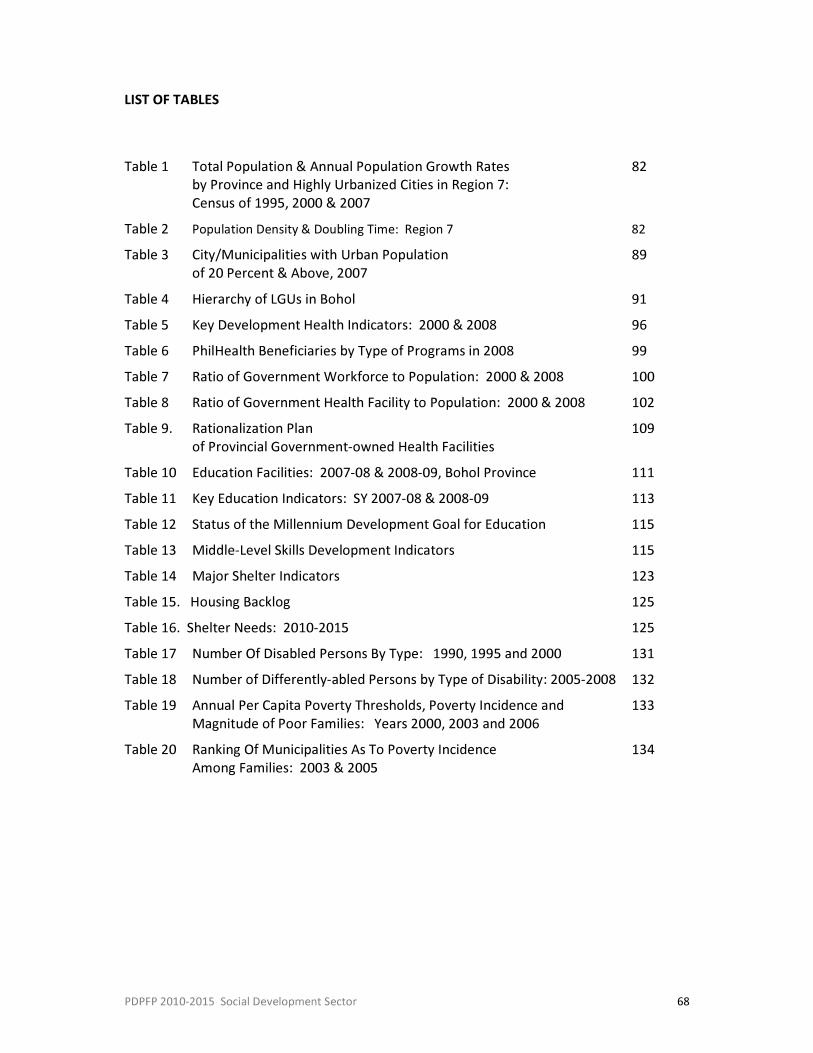
PDPFP 2010-2015 Social Development Sector 68
LIST OF TABLES
Table 1 Total Population & Annual Population Growth Rates 82
by Province and Highly Urbanized Cities in Region 7: Census of 1995, 2000 & 2007
Table 2 Population Density & Doubling Time: Region 7 82 Table 3 City/Municipalities with Urban Population 89
of 20 Percent & Above, 2007 Table 4 Hierarchy of LGUs in Bohol 91 Table 5 Key Development Health Indicators: 2000 & 2008 96 Table 6 PhilHealth Beneficiaries by Type of Programs in 2008 99 Table 7 Ratio of Government Workforce to Population: 2000 & 2008 100 Table 8 Ratio of Government Health Facility to Population: 2000 & 2008 102 Table 9. Rationalization Plan 109
of Provincial Government-owned Health Facilities Table 10 Education Facilities: 2007-08 & 2008-09, Bohol Province 111 Table 11 Key Education Indicators: SY 2007-08 & 2008-09 113 Table 12 Status of the Millennium Development Goal for Education 115 Table 13 Middle-Level Skills Development Indicators 115 Table 14 Major Shelter Indicators 123 Table 15. Housing Backlog 125 Table 16. Shelter Needs: 2010-2015 125 Table 17 Number Of Disabled Persons By Type: 1990, 1995 and 2000 131 Table 18 Number of Differently-abled Persons by Type of Disability: 2005-2008 132 Table 19 Annual Per Capita Poverty Thresholds, Poverty Incidence and 133
Magnitude of Poor Families: Years 2000, 2003 and 2006 Table 20 Ranking Of Municipalities As To Poverty Incidence 134
Among Families: 2003 & 2005
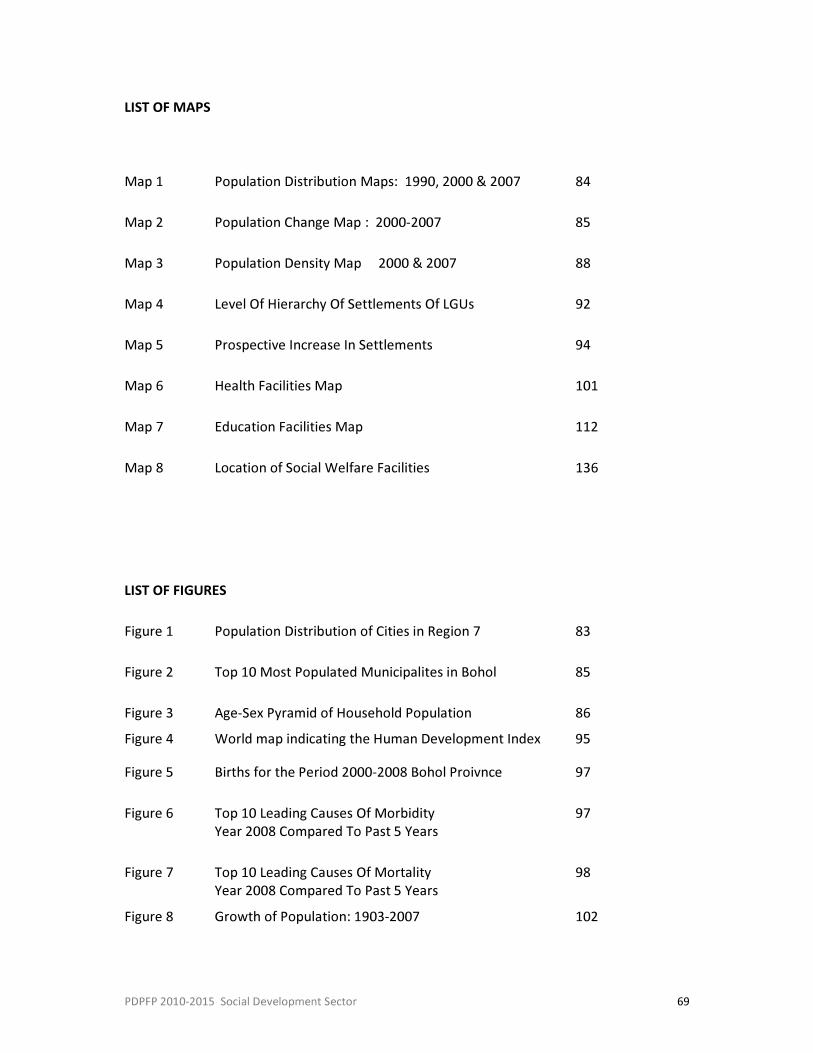
PDPFP 2010-2015 Social Development Sector 69
LIST OF MAPS
Map 1 Population Distribution Maps: 1990, 2000 & 2007 84
Map 2 Population Change Map : 2000-2007 85
Map 3 Population Density Map 2000 & 2007 88
Map 4 Level Of Hierarchy Of Settlements Of LGUs 92
Map 5 Prospective Increase In Settlements 94
Map 6 Health Facilities Map 101
Map 7 Education Facilities Map 112
Map 8 Location of Social Welfare Facilities 136
LIST OF FIGURES
Figure 1 Population Distribution of Cities in Region 7 83
Figure 2 Top 10 Most Populated Municipalites in Bohol 85
Figure 3 Age-Sex Pyramid of Household Population 86 Figure 4 World map indicating the Human Development Index 95 Figure 5 Births for the Period 2000-2008 Bohol Proivnce 97
Figure 6 Top 10 Leading Causes Of Morbidity 97 Year 2008 Compared To Past 5 Years
Figure 7 Top 10 Leading Causes Of Mortality 98 Year 2008 Compared To Past 5 Years
Figure 8 Growth of Population: 1903-2007 102
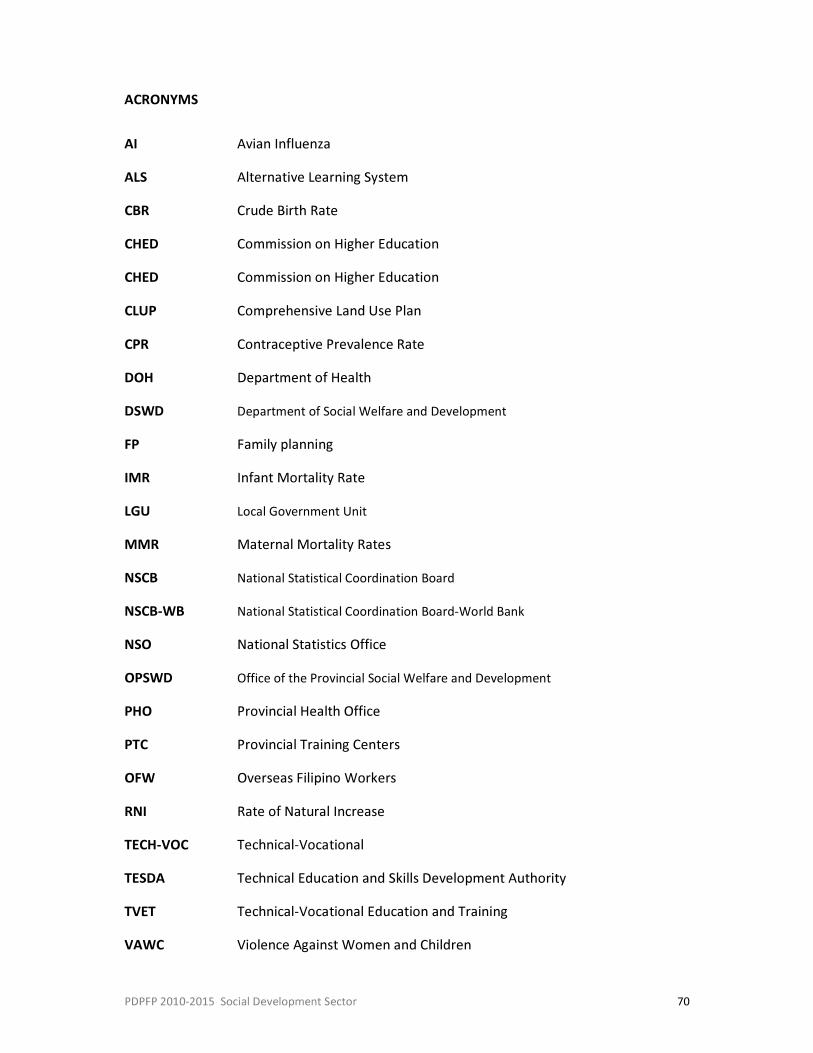
PDPFP 2010-2015 Social Development Sector 70
ACRONYMS
AI Avian Influenza ALS Alternative Learning System CBR Crude Birth Rate CHED Commission on Higher Education CHED Commission on Higher Education CLUP Comprehensive Land Use Plan CPR Contraceptive Prevalence Rate DOH Department of Health DSWD Department of Social Welfare and Development
FP Family planning IMR Infant Mortality Rate LGU Local Government Unit MMR Maternal Mortality Rates NSCB National Statistical Coordination Board NSCB-WB National Statistical Coordination Board-World Bank
NSO National Statistics Office OPSWD Office of the Provincial Social Welfare and Development PHO Provincial Health Office PTC Provincial Training Centers OFW Overseas Filipino Workers RNI Rate of Natural Increase TECH-VOC Technical-Vocational TESDA Technical Education and Skills Development Authority TVET Technical-Vocational Education and Training VAWC Violence Against Women and Children
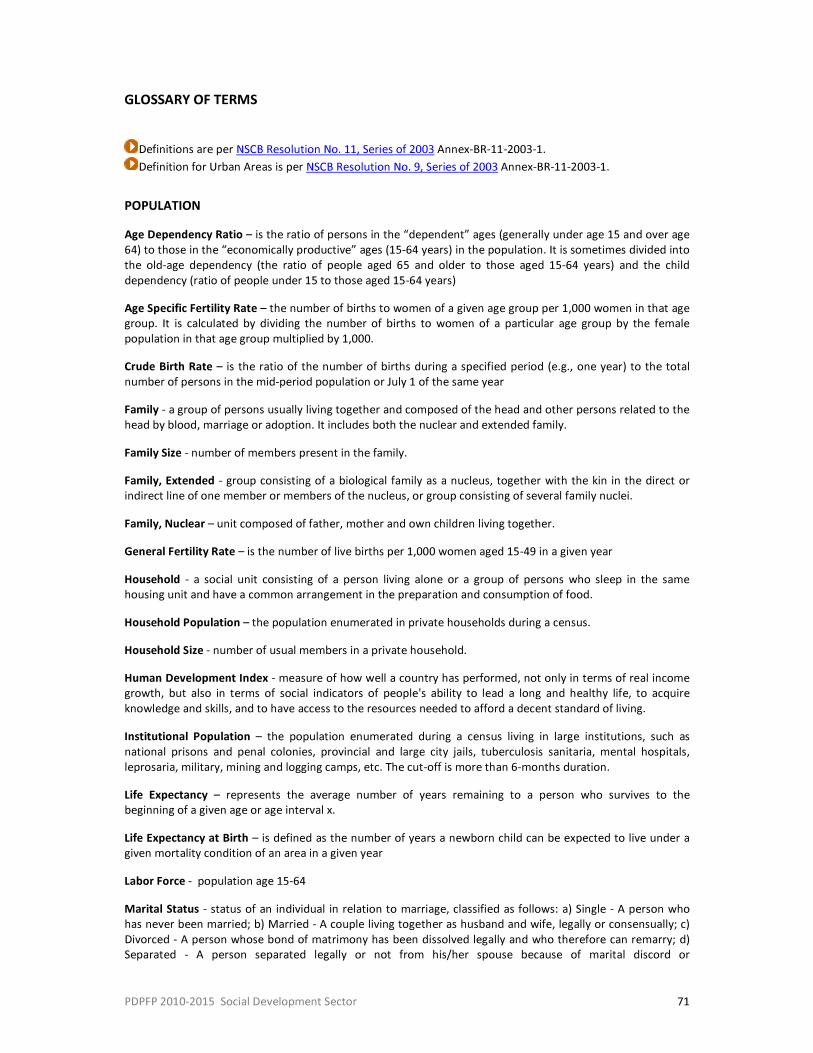
PDPFP 2010-2015 Social Development Sector 71
GLOSSARY OF TERMS
Definitions are per NSCB Resolution No. 11, Series of 2003 Annex-BR-11-2003-1. Definition for Urban Areas is per NSCB Resolution No. 9, Series of 2003 Annex-BR-11-2003-1.
POPULATION Age Dependency Ratio – is the ratio of persons in the “dependent” ages (generally under age 15 and over age 64) to those in the “economically productive” ages (15-64 years) in the population. It is sometimes divided into the old-age dependency (the ratio of people aged 65 and older to those aged 15-64 years) and the child dependency (ratio of people under 15 to those aged 15-64 years) Age Specific Fertility Rate – the number of births to women of a given age group per 1,000 women in that age group. It is calculated by dividing the number of births to women of a particular age group by the female population in that age group multiplied by 1,000. Crude Birth Rate – is the ratio of the number of births during a specified period (e.g., one year) to the total number of persons in the mid-period population or July 1 of the same year Family - a group of persons usually living together and composed of the head and other persons related to the head by blood, marriage or adoption. It includes both the nuclear and extended family. Family Size - number of members present in the family. Family, Extended - group consisting of a biological family as a nucleus, together with the kin in the direct or indirect line of one member or members of the nucleus, or group consisting of several family nuclei. Family, Nuclear – unit composed of father, mother and own children living together. General Fertility Rate – is the number of live births per 1,000 women aged 15-49 in a given year Household - a social unit consisting of a person living alone or a group of persons who sleep in the same housing unit and have a common arrangement in the preparation and consumption of food. Household Population – the population enumerated in private households during a census. Household Size - number of usual members in a private household. Human Development Index - measure of how well a country has performed, not only in terms of real income growth, but also in terms of social indicators of people's ability to lead a long and healthy life, to acquire knowledge and skills, and to have access to the resources needed to afford a decent standard of living. Institutional Population – the population enumerated during a census living in large institutions, such as national prisons and penal colonies, provincial and large city jails, tuberculosis sanitaria, mental hospitals, leprosaria, military, mining and logging camps, etc. The cut-off is more than 6-months duration. Life Expectancy – represents the average number of years remaining to a person who survives to the beginning of a given age or age interval x. Life Expectancy at Birth – is defined as the number of years a newborn child can be expected to live under a given mortality condition of an area in a given year Labor Force - population age 15-64 Marital Status - status of an individual in relation to marriage, classified as follows: a) Single - A person who has never been married; b) Married - A couple living together as husband and wife, legally or consensually; c) Divorced - A person whose bond of matrimony has been dissolved legally and who therefore can remarry; d) Separated - A person separated legally or not from his/her spouse because of marital discord or
PDPFP 2010-2015 Social Development Sector 72
misunderstanding; and e) Widowed - A person whose bond of matrimony has been dissolved by death of his/her spouse. Metropolitanization, Extent - is to define a metropolitan area as a contiguous area composed of more than one local government unit where the population tends to live and work or go to school or perform other activities across local city/municipal boundaries. Water bodies are not necessarily considered as barriers within a contiguous area as these typically serves as connectors. Migration – the movement of people across a specific boundary for the purpose of establishing a new or semi permanent residence. Two distinct types are international migration (migration between countries) and internal migration (migration within a country) Migration Rate - the ratio of migrants to the total mid-year population during a given period expressed per 1,000 population. Mother Tongue - the language or dialect first spoken in the individual's home in his early childhood, although not necessarily spoken by him at present. Net Migration Rate – shows the net effect of migration on an area in a given time period. This is expressed as the increase or decrease in the population of the area as a result of in-migration and out-migration per 1,000 population. Population – total number of individuals in a territory at a specified time. It covers both nationals and aliens, native and foreign born persons, internees, refugees and any other group physically present within the borders of a country at a specified time. In assembling national demographic statistics for publication, the basic aim has been to obtain data for the physically present (or de facto) population rather than for the legally established resident (or de jure) inhabitants. Population Census – the total process of collecting, compiling, evaluating, analyzing and publishing demographic, economic and social data pertaining to all persons in the country or in a well-limited territory. Population Change – is the growth or decline of the total population or one of its structural units Population Density - refers to the number of persons per unit of land area (usually in square kilometers). This measure is more meaningful if given as population per unit of arable land. Population Distribution - the patterns of settlement and dispersal of a population. Population Growth Rate – indicates how fast a population increases or decreases as a result of the interplay of births, deaths, and migration during a given period of time. Where the population is closed, meaning no migration, the population growth rate is the same as the rate of natural increase, i.e., the difference between the number of births and the number of deaths during a specified period of time. The three methods for computing the rate of growth based on the assumption with respect to the change are: arithmetic change, geometric change and exponential change. Population Projection – computation of future changes in population numbers, given certain assumptions about future trends in the rates of fertility, mortality and migration. Demographers often publish high, medium, and low projections of the same population based on different assumptions of how these rates will change in the future Population Pyramid – diagram usually a bar chart depicting the distribution of a given population by age and sex. By convention, the younger ages are at the bottom, with males on the left and females on the right Rural Area – an area outside any area classified as urban Sex Ratio – the number of males per 100 females in a population Singulate Mean Age at Marriage (SMAM) - a measure of nuptiality which denotes the number of years that a married individual spends in singlehood before ultimately marrying
PDPFP 2010-2015 Social Development Sector 73
Urban Barangay "(1) If a barangay has a population size of 5,000 or more, then a barangay is considered urban, or (2) If a barangay has at least one establishment with a minimum of 100 employees, a barangay is considered urban, or (3) If a barangay has 5 or more establishments with a minimum of 10 employees, and 5 or more facilities within the two-kilometer radius from the barangay hall, then a barangay is considered urban. Urbanization - in general, the historical process describing the growth of towns in modern society, implying a change in the socio-economic and demographic structure of a population, an urban way of life and new settlement. Working Age Population - refers to population 15-64 years old at a specified time. The working age population is divided into persons in the labor force and persons not in the labor force. EDUCATION (Reference: 2006 Inter-Agency Committee on Education Statistics (IACES)) Cohort - A group of pupils/students who join the first grade/year of a given cycle in the same school year, and subsequently experience the events of promotion, repetition, dropout or successful completion of the final grade, each in his/her own way. Cohort Survival Rate (CSR) - The percentage of enrollees at the beginning grade or year in a given school year who reached the final grade or year of the elementary/secondary level. Completion Rate - The percentage of first grade/year entrants in a level of education who complete/finish the level in accordance with the required number of years of study. Dropout rate - The percentage of pupils/students who leave school during the year for any reason as well as those who complete the previous grade/year level but fail to enroll in the next grade/year level the following school year to the total number of pupils/students enrolled during the previous school year. Dropouts - Pupils/students who leave school during the year for any reason as well as those who complete the previous grade/year level but fail to enroll in the next grade/year level the following school year. Enrolment - Total number of pupils/students who register/enlist in a school year. Graduates - Students or trainees who are enrolled in a particular course/program and have completed the requirements set for that course/program. Literacy rate, Simple/Basic - The percentage of the population 10 years old and over, who can read, write and understand simple messages in any language or dialect. (Reference: 2006 Inter-Agency Committee on Education Statistics (IACES)) Net Enrolment Ratio or Participation Rate (NER) - The ratio of the enrolment for the age group corresponding to the official school age in the elementary/secondary level to the population of the same age group in a given year. Pupil/Student-classroom ratio – The average number of pupils/students per classroom in elementary/secondary education in a given school year. Pupil/Student-teacher ratio - The average number of pupils/students per teacher in elementary/secondary education in a given school year.
PDPFP 2010-2015 Social Development Sector 74
HEALTH AND NUTRITION Child Mortality Rate (CMR) - the probability of dying between exact age one and age five, expressed as the number of deaths of children from exact age one to less than age five during a given period per 1,000 children surviving to age 12 months at the beginning of the period. Contraceptive Prevalence Rate (CPR) - the proportion of currently married women in the reproductive ages of 15-49 years reporting current use of any contraceptive method. Crude Death Rate (CDR)1 – the ratio of the number of deaths occurring within one year to the mid-year population expressed per 1,000 population. Fetal Death Rate (FDR)2 – the ratio of the number of fetal deaths in a population occurring within a given period to the total number of live births and fetal deaths occurring within the same period, expressed per 1,000. Fetal Death (deadborn fetus) - death prior to the complete expulsion or extraction from its mother of a product of conception, irrespective of the duration of pregnancy. Incidence Rate (of a disease) 2 - the rate at which new cases of a disease occur in the population. The numerator is the number of new cases of a disease that occur during a given period (usually a year), and the denominator is the number of the population at risk of experiencing the disease during the same period, usually expressed as the number of new cases per 100,000 persons. Infant Mortality Rate (IMR) – the probability of dying between birth and age one, expressed as the number of infant deaths or deaths occurring before reaching 12 months of life in a given period per 1,000 live births. Maternal Mortality Ratio (MMR) – the ratio between the number of women who died (for reasons of pregnancy, childbirth and puerperium) to the number of reported livebirths in a given year, expressed as the number of maternal deaths per 100,000 live births Mean Age at Death - the arithmetic average of the ages at death occurring in a population during a given year. [GTS] Median Age at Death - the median of the ages at death occurring in a population during a given year which divides the total number of deaths in a population classified by age into equal halves. Morbidity – the frequency of disease and illness, injuries, and disabilities in a population. [PH] Prevalence Proportion 2,3 –the total number of persons who have an attribute or disease at a particular point in time divided by the size of the population at risk of having the attribute or disease at this point in time (or midway through the period), usually expressed as the number of cases per 100,000 persons. Under Five Mortality Rate (U5MR) - the probability of dying between birth and age five, expressed as the number of deaths below age five per 1,000 live births during a given period Hospital Bed-Population Ratio – the ratio of hospital beds to the population, usually expressed as the number of available hospital beds for every 1,000 population. Hospital Bed Occupancy Rate - the number of in-patient hospital beds occupied divided by the average number of hospital beds, expressed in percent. HOUSING Dwelling Unit - a separate and independent place of abode intended for habitation, or one not intended for habitation but occupied as living quarters by a household at the time of the census. A dwelling unit may be a group of rooms or just one room, barong-barong, boat or cave. Household Head - the person who generally provides the chief source of income for the household unit. He is the adult person, male or female, who is responsible for the organization and care of the household or who is regarded as such by the members of the household.
PDPFP 2010-2015 Social Development Sector 75
Household, Institutional - groups of persons living in collective type of dwelling, such as boarding houses (with 10 or more boarders), hotels, boarding schools and colleges, penal establishments, chronic diseases hospitals, military installations, etc. The households of institutional directors and administrative personnel with separate living quarters are considered as private households. Households, Double-Up - also termed as hidden household, it refers to the number of households in excess of the number of dwelling units at the same time of census, assuming a ratio of one household per dwelling unit. A household with a separate arrangement for food preparation and consumption but shares the dwelling unit of another household is considered hidden or doubled up. Housing Density - the number of houses or dwelling units per unit area of land. Housing Inventory/Stock - a listing of or the total number of dwelling units existing at a certain place and time. Housing Unit - a structurally separate and independent place of abode which, by the way it has been constructed, converted or arranged is intended for habitation by one household. Structures or parts of structures which are not intended for habitation such as commercial, industrial, and cultural buildings or natural and man-made shelters such as caves, boats, abandoned trucks, culverts, and others, but which are used as living quarters by households. Housing, Standard - a building which meets legal structural and functional criteria as defined under BP 220 (prescribing minimum designs and standards for socialized and economic housing) Institution - any set of premises in a permanent structure or structures designed to house usually large groups of individuals who are subject to a common authority or regime or bound by a common public objective and/or personal interests and characteristics. In this type of housing unit, occupants of the same sex usually share dormitories. It includes hospitals, military barracks, boarding schools, convents, prisons, etc. Institutional Buildings (hospital/convent/school dormitory/penal institution, etc.) - a building intended for persons confined to receive medical, charitable, or other treatment such as jails and penal colonies, and other buildings like convents, school dormitories, etc. Institutional Population – the population enumerated during a census living in large institutions, such as national prisons and penal colonies, provincial and large city jails, tuberculosis sanitaria, mental hospitals, leprosaria, military, mining and logging camps, etc. The cut-off is more than 6-months duration. Squatter (or informal dwellers) - one who settles on the land of another without title or right or without the owner's consent whether in urban or rural areas. Tenure Status of the Housing Unit - the housing may be:
1. Owned/Being Amortized - the household is the owner and has legal possession of the housing unit, or the household claims to own it. Includes also housing units which are being amortized or on mortgage;
2. Rented - the occupant actually pays rent either in cash or in kind; 3. Being occupied for free with consent of owner - the household occupies the housing unit with
owner's permission and without paying any rent in cash or in kind to the owner, tenant/lessee or subtenant/sublessee. These are usually the households of farm tenants or lessees who occupy rent-free houses belonging to the owner of the land they farm; also those employees given free housing as part of fringe benefits but must vacate the housing unit upon separation from work; and
PDPFP 2010-2015 Social Development Sector 76
4. Being occupied for free without consent of owner - the household occupies the housing unit without the consent or knowledge of the owner. Examples are squatters who occupy public and private buildings.
GENDER AND DEVELOPMENT Gender – socially learned behavior and expectations associated with the two sexes. It also refers to the socially differentiated roles and characteristics attributed by a given culture to women and men. Gender Issues and Concerns - issues, concerns and problems arising from the different roles by women and men, as well as those that arise from a questioning of the relationship between them. Gender-Responsive Indicator System – a set of statistical measurements for monitoring the situation of women, relative to men in various sectors and for determining whether development programs respond to their problems and needs. Gender-Responsive Development Training – the use and integration of the Gender and Development (GAD) framework into the entire development planning cycle. It rests on the premise that introducing gender considerations makes development planning/programming more "people oriented or people focused." Gender is one source of heterogeneity along with education, ethnicity, class and other socio-demographic variables, all of which determine to a large extent the manner by which development plans and programs/projects impact on different groups of people. Gender-Responsive Programs/Project – programs and projects that systematically incorporate or address gender concerns. They are of three types: a) integrated programs or projects; b) women’s components; and c) for women only programs or projects. Gender Roles – these concern the activities ascribed to men and women on the basis of perceived gender differences. While men are mainly identified with productive roles, women have a triple role: a productive role; a reproductive (or domestic) role; and a community managing role. Gender roles and responsibilities vary between cultures and can change over time. Sex - the genetic and physical or biological identity of a person which indicates whether one is male or female. Violence Against Women (VAW) – any act of gender-based violence that results in, or is likely to result in, physical, sexual or psychological harm or suffering to women, including threats of such acts, coercion or arbitrary deprivation of liberty, whether occurring in public or in private life. It encompasses all forms of violation of women’s rights, including threats and reprisals, exploitation, harassment and other forms of control. CULTURE & ARTS Heritage, Cultural - Cultural heritage refers to monuments, groups of buildings and properties with historical, aesthetic, archeological, scientific, ethnological or anthropological value. Heritage, Natural - Natural heritage refers to outstanding physical, biological and geological formations, habitat of threatened species of animals and plants, and areas with scientific, conservation or aesthetic value. CATEGORIZATION OF HISTORIC STRUCTURES Under existing procedures, the framework adopted by the NHI in the evaluation of historical sites and structures for preservation consists of the following:
PDPFP 2010-2015 Social Development Sector 77
National Shrines: Historic sites or objects hallowed or honored for their history or association, e.g. the Rizal and Shrines and the Mabini Shrines; National Monuments: Objects, natural features or areas of specific historic interest that are set aside by local or national government as public properties, e.g. the Rizal and Bonifacio Monuments, and the Walls of Intramuros; National Landmarks: Places or objects that are associated with an event, achievement, characteristics or modification that presents a turning point or stage in history; Heritage House: Houses of ancestry with notable historical and cultural significance, e.g. Syquia Mansion, Vigan City, Ilocos Sur; Houses in Silay City, Negros Occidental; Historic Sites: Natural areas or places with historical significance, and places recognized, marked, or declared such as Biak-na-bato, San Miguel, Bulacan; Pamitinan Cave, Montalban, Rizal; Cultural Properties: Old buildings, monuments,shrines, documents, and objects which may be classified as antiques, relics, or artifacts, landmarks,anthropological and historical sites, and specimens of natural history which are of cultural, historical, anthropological or scientific value and significance to the nation ; such as physical, anthropological, archaeological and ethnographical materials, meteorites and tektites; historical objects and manuscripts ; household and agricultural implements ; decorative articles or personal adornment; works of art such as paintings,sculptures, carvings, jewelry, music, architecture,sketches, drawings, or illustrations in part or in whole ;works of industrial and commercial art such as furniture, pottery, ceramics, wrought iron, gold, bronze,silver, wood or other heraldic items, metals, coins,medals, badges, insignias, coat of arms, crests, flags,arms, and armor; vehicles or ships or boats in part or in whole. Important Cultural Properties: Cultural properties which have been singled out from among the innumerable cultural properties as having exceptional historical and cultural significance to the Phili National Cultural Treasure: A unique object found locally, possessing outstanding historical, cultural, artistic and/or scientific value which is significant and important to this country and nation. POVERTY Poverty incidence refers to the proportion of families (or population) with per capita income less than the per capita poverty threshold to the total number of families (population - proportion of families/population whose annual per capita income falls below the annual per capita poverty threshold to the total number of families/population. Poverty threshold refers to the minimum income required to meet the food requirements and other non-food basic needs. – annual per capita income required or the amount to be spent to satisfy nutritional requirements (2,000 Kcal) and other basic needs. Food threshold refers to the minimum cost of food required to satisfy nutritional requirements for economically necessary and socially desirable physical activities. Subsistence incidence refers to the proportion of families (or population) with per capita income less than the per capita food threshold to the total number of families (population). Severity of Poverty - is the total of the squared income shortfall (expressed in proportion to the poverty line) of families with income below the poverty threshold, divided by the total number of families. This is equal to the Foster-Greer-Thorbecke (FGT) family of measures with alpha= 2. It is a poverty measure

PDPFP 2010-2015 Social Development Sector 78
which is sensitive to the income distribution among the poor - the worse this distribution is, the more severe poverty is. Income Gap - refers to the average income shortfall (expressed in proportion to the poverty line) of families with income below the poverty threshold (1997 Philippine Poverty Statistics, NSCB) Poverty Gap - is the total income shortfall (expressed in proportion to the poverty line) of families with income below the poverty threshold, divided by the total number of families (1997 Philippine Poverty Statistics, NSCB). This value could be thought of as the amount relative to the poverty line that has to be transferred to the poor families to bring their incomes up to the poverty threshold. Gini Coefficient - the ratio of the area between the Lorenz curve and the diagonal (the line of perfect equality) to the area below the diagonal. It is a measure of the inequality in income distribution, with limits 0 for perfect equality and 1 for perfect inequality.
PDPFP 2010-2015 Social Development Sector 79
1 History1
Bohol first came into the attention of Western chroniclers in 1521 when Pigafetta, chronicler of the ill-fated Magellan expedition, reported the burning of the ship Concepcion off the coast of Maribojoc. But it was only in March of 1565 when the Spaniards, this time under the command of Miguel Lopez de Legaspi, landed and stayed for over a month in Bohol, even making the famous Blood Compact with local chieftain, Sikatuna. Formal hispanization of the island, however, started much later, in 1596, when the island of Bohol became part of the encomienda of Doña Catalina de Bolanos. It was this lady who requested for two Jesuit missionaries to start the process of Christianizing the natives. Because of the dearth of missionaries and Spanish settlers alike, Spanish presence in Bohol was minimal for the next two hundred years, consisting mainly of religious missionaries and a few tribute collectors. Two main local revolts – that of Tamblot in 1621 and Dagohoy in 1744, as well as the notorious piratical raids of the time reduced Bohol to a colonial backwater. This persisted until after the end of the Dagohoy rebellion in 1829 when peace finally reigned in the island. It was during the Spanish era that Bohol was politically a part of Cebu and was called a residencia. It became a separate politico-military province on July 22, 1854 together with the island of Siquijor It was also during this regime that several big stone churches were built which still stand today attesting to Bohol’s colonization and Christianization. With the coming of peaceful times in Bohol, the Spanish colonial government started setting up civil and political infrastructures in the island. By 1854, Bohol was deemed ready to stand on its own feet and so by royal decree, it was declared a province separate from Cebu, with Tagbilaran as its capital. Many things improved in Bohol during this period; however, these all came to a head with the sale of the entire colony to the United States of America in December of 1898. In the interregnum from 1899 to 1900 when American occupation troops finally landed in the island, Bohol was ruled by Boholanos themselves in the political set-up called “Gobierno de Canton de Bohol.” The illustrious Don Bernabe Reyes from Dauis served as its elected president. This heady experience in self-government lasted until March of 1900 when the coming of the Americans put an end to it. Although the Boholanos received their new masters in peace, they were actually resentful over the loss of their independence. Six months after, Boholanos rose in open rebellion against the Americans which resulted in the death of so many people and the destruction by fire of almost all its towns. The Boholano rebellion lasted
1 Text prepared by Marianito Jose Luspo
“Sandugo” Blood Compact
PDPFP 2010-2015 Social Development Sector 80
until December 23, 1901. Don Aniceto Clarin of Loay was appointed governor of Bohol by the American colonial administration. If the Americans destroyed much of Bohol during the rebellion, they also poured all their resources into the island upon cessation of hostilities. The result was the construction of roads, bridges, schools and other public buildings that soon became the pride and hallmark of the American colonial period. Growth and development in Bohol was further enhanced through the initiative of one person – Senator Jose Arsenio Clarin, the son of Don Aniceto who rose to become Speaker Pro-Tempore of the Philippine legislature during the Commonwealth period. Using his influence, he caused many infrastructure projects to be raised in the island, even causing the development of the interior parts of Bohol through the homestead project in the 1920’s and 30’s. New roads were also opened all over the island and new modes of transportation were introduced. The optimistic mood that typified the 20’s and 30’s in Bohol soon dissipated with the arrival of the 1940’s when, more than ever, the people of Bohol became aware of war clouds looming over the archipelago. In 1941, Japan bombed Pearl Harbor and soon invaded the Philippines. In March of 1942, Japanese Imperial troops landed in Bohol and occupied the island under a regime of terror and oppression for the next three years. The rapacity and cruelty of the occupiers were only put to check by the stiff resistance of the local guerillas who were entrenched in their mountain hide-outs. Finally, in May of 1945, the newly arrived Americans successfully drove away the last of the Japanese occupiers. Under the Philippine Republic, Bohol ’s fortune started to wane once more. In the early 50’s, thousands of Boholanos joined the exodus to the Mindanao homestead areas opened by the government as a way of defusing the HUK insurgency wars earlier in the decade. Although local prestige soared as a result of the elevation of Vice-President Carlos P. Garcia to the presidency as a result of the death of Ramon Magsaysay in 1957, this did not result in large-scale development projects in his home island. When Garcia finally stepped down from power in 1961, Bohol remained about the same backwater it found itself in by the end of the World War. The dismal economic face of Bohol further resulted in more outward migration by Boholanos. Even its best minds studied outside the province and worked far away from home. In 1995, things started to lighten when the fast-craft ferries were introduced in Bohol, revolutionizing travel and transforming the island as a reachable tourism destination. Suddenly, Boholanos started to realize the decades of neglect by the national government had actually resulted in something good, for in the near absence of economic movements in the island, Bohol had actually preserved not just the lush biodiversity in its environment, it has also resulted in the preservation of structures that are now deemed part of a fabulous heritage that could be packaged to consist the core of an irresistible eco-cultural offering for local and foreign tourists.
PDPFP 2010-2015 Social Development Sector 81
Today, Bohol is still considered one of the most attractive eco-tourism destinations in the entire country. 1.2 Year Province was founded Bohol was made a province by virtue of Republic Act 27112 on 10 March 1917 comprising 48 local government units. In 1879, Bohol was composed only of 34 municipalities having a population of 253,103. Today, Bohol has a population of more than 1.2 million comprising 47 municipalities and a city serving as its capital, grouped into three congressional districts. 1.3 Etymology The name Bohol was supposedly derived from the word Bo-ol. Bohol’s people are said to be descendants of the last group of inhabitants of the country called “pintados”, meaning the tattooed ones3. Before the Spaniards came in 1521, it is believed that Boholanos already had a culture of their own as evidenced by artifacts dug in Tagbilaran City and in Dauis and Panglao towns. Excavations in ancient burial grounds on the mainland have unearthed T'ang Dynasty porcelain, Sung and Ming vases and other artifacts of considerable age which attest to Bohol's early contact with travelers/traders from China and other southeast Asian civilizations. Local cotton, called lumpot, was most desired by these traders as material for winter clothing. This formed the basis of a lucrative trade item to be bartered for Chinese porcelains.
2 Act No. 2711, popularly known as the Revised Administrative Code (1917), established most of the modern-day provinces of the Philippines: the province of Camarines was split into Camarines Norte and Camarines Sur and the province of Bohol was created. 3 Putong, C., Bohol & Its People, July 1965
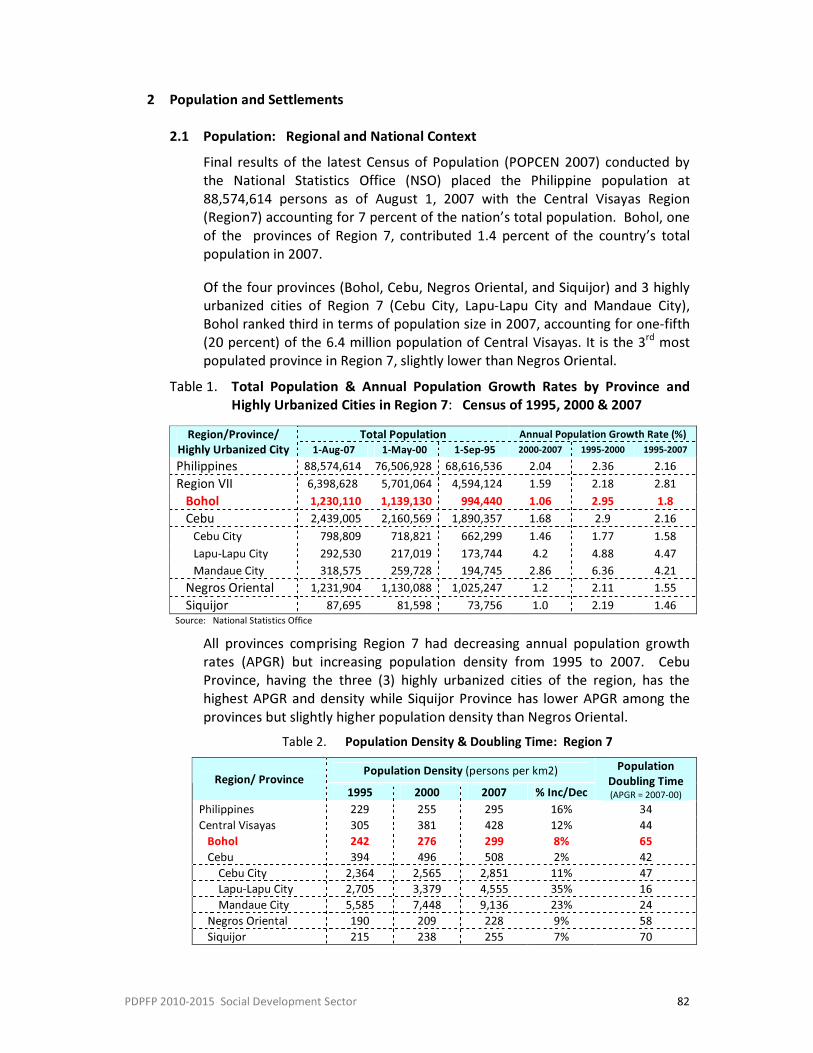
PDPFP 2010-2015 Social Development Sector 82
2 Population and Settlements 2.1 Population: Regional and National Context
Final results of the latest Census of Population (POPCEN 2007) conducted by the National Statistics Office (NSO) placed the Philippine population at 88,574,614 persons as of August 1, 2007 with the Central Visayas Region (Region7) accounting for 7 percent of the nation’s total population. Bohol, one of the provinces of Region 7, contributed 1.4 percent of the country’s total population in 2007. Of the four provinces (Bohol, Cebu, Negros Oriental, and Siquijor) and 3 highly urbanized cities of Region 7 (Cebu City, Lapu-Lapu City and Mandaue City), Bohol ranked third in terms of population size in 2007, accounting for one-fifth (20 percent) of the 6.4 million population of Central Visayas. It is the 3rd most populated province in Region 7, slightly lower than Negros Oriental.
Table 1. Total Population & Annual Population Growth Rates by Province and Highly Urbanized Cities in Region 7: Census of 1995, 2000 & 2007
Total Population Annual Population Growth Rate (%) Region/Province/
Highly Urbanized City 1-Aug-07 1-May-00 1-Sep-95 2000-2007 1995-2000 1995-2007 Philippines 88,574,614 76,506,928 68,616,536 2.04 2.36 2.16 Region VII 6,398,628 5,701,064 4,594,124 1.59 2.18 2.81 Bohol 1,230,110 1,139,130 994,440 1.06 2.95 1.8 Cebu 2,439,005 2,160,569 1,890,357 1.68 2.9 2.16 Cebu City 798,809 718,821 662,299 1.46 1.77 1.58 Lapu-Lapu City 292,530 217,019 173,744 4.2 4.88 4.47 Mandaue City 318,575 259,728 194,745 2.86 6.36 4.21 Negros Oriental 1,231,904 1,130,088 1,025,247 1.2 2.11 1.55 Siquijor 87,695 81,598 73,756 1.0 2.19 1.46 Source: National Statistics Office
All provinces comprising Region 7 had decreasing annual population growth rates (APGR) but increasing population density from 1995 to 2007. Cebu Province, having the three (3) highly urbanized cities of the region, has the highest APGR and density while Siquijor Province has lower APGR among the provinces but slightly higher population density than Negros Oriental.
Table 2. Population Density & Doubling Time: Region 7 Population Density (persons per km2) Region/ Province
1995 2000 2007 % Inc/Dec Population
Doubling Time (APGR = 2007-00)
Philippines 229 255 295 16% 34 Central Visayas 305 381 428 12% 44 Bohol 242 276 299 8% 65 Cebu 394 496 508 2% 42
Cebu City 2,364 2,565 2,851 11% 47 Lapu-Lapu City 2,705 3,379 4,555 35% 16 Mandaue City 5,585 7,448 9,136 23% 24
Negros Oriental 190 209 228 9% 58 Siquijor 215 238 255 7% 70
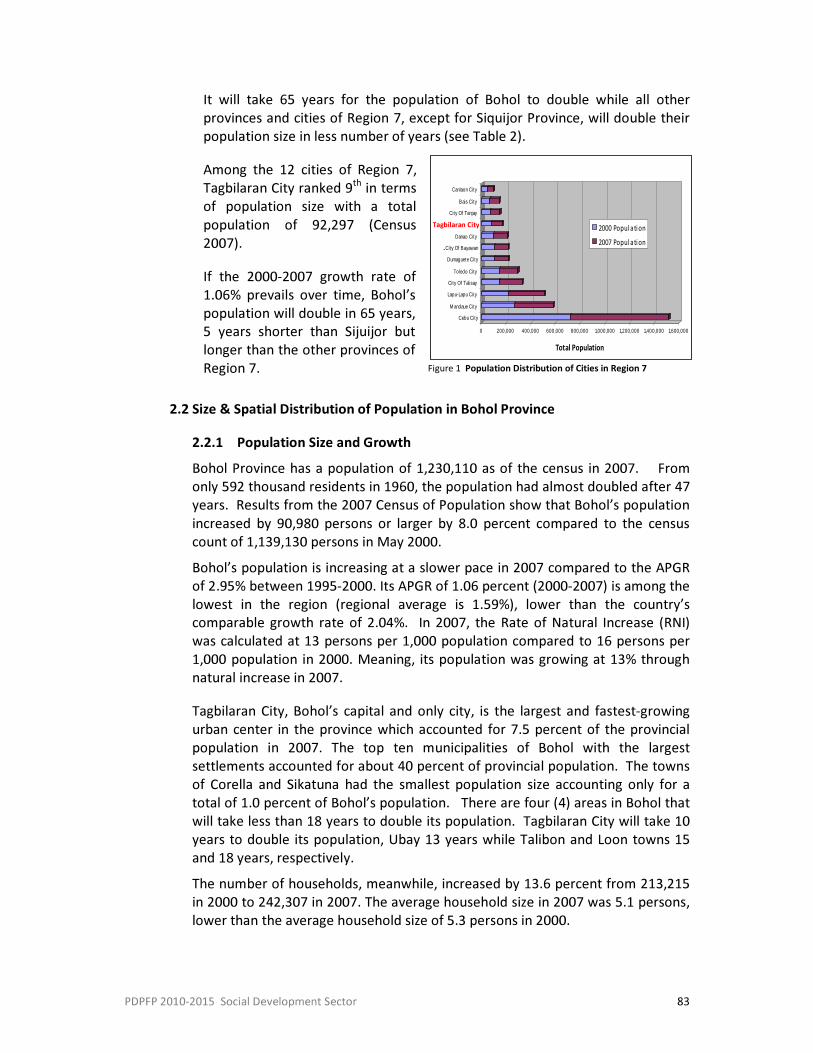
PDPFP 2010-2015 Social Development Sector 83
0 200,000 400,000 600,000 800,000 1,000,000 1,200,000 1,400,000 1,600,000
Total Population
Cebu City
M andaue City
Lapu-Lapu City
City Of Talisay
Toledo City
Dumaguete City
City Of Bayawan
Danao City
Tagbilaran City
City Of Tanjay
Bais City
Canlaon City
City
Population Distribution of Cities in Region 7
2000 Popul ati on2007 Popul ati on
Tagbilaran City
Figure 1 Population Distribution of Cities in Region 7
It will take 65 years for the population of Bohol to double while all other provinces and cities of Region 7, except for Siquijor Province, will double their population size in less number of years (see Table 2). Among the 12 cities of Region 7, Tagbilaran City ranked 9th in terms of population size with a total population of 92,297 (Census 2007). If the 2000-2007 growth rate of 1.06% prevails over time, Bohol’s population will double in 65 years, 5 years shorter than Sijuijor but longer than the other provinces of Region 7.
2.2 Size & Spatial Distribution of Population in Bohol Province 2.2.1 Population Size and Growth Bohol Province has a population of 1,230,110 as of the census in 2007. From only 592 thousand residents in 1960, the population had almost doubled after 47 years. Results from the 2007 Census of Population show that Bohol’s population increased by 90,980 persons or larger by 8.0 percent compared to the census count of 1,139,130 persons in May 2000. Bohol’s population is increasing at a slower pace in 2007 compared to the APGR of 2.95% between 1995-2000. Its APGR of 1.06 percent (2000-2007) is among the lowest in the region (regional average is 1.59%), lower than the country’s comparable growth rate of 2.04%. In 2007, the Rate of Natural Increase (RNI) was calculated at 13 persons per 1,000 population compared to 16 persons per 1,000 population in 2000. Meaning, its population was growing at 13% through natural increase in 2007. Tagbilaran City, Bohol’s capital and only city, is the largest and fastest-growing urban center in the province which accounted for 7.5 percent of the provincial population in 2007. The top ten municipalities of Bohol with the largest settlements accounted for about 40 percent of provincial population. The towns of Corella and Sikatuna had the smallest population size accounting only for a total of 1.0 percent of Bohol’s population. There are four (4) areas in Bohol that will take less than 18 years to double its population. Tagbilaran City will take 10 years to double its population, Ubay 13 years while Talibon and Loon towns 15 and 18 years, respectively. The number of households, meanwhile, increased by 13.6 percent from 213,215 in 2000 to 242,307 in 2007. The average household size in 2007 was 5.1 persons, lower than the average household size of 5.3 persons in 2000.
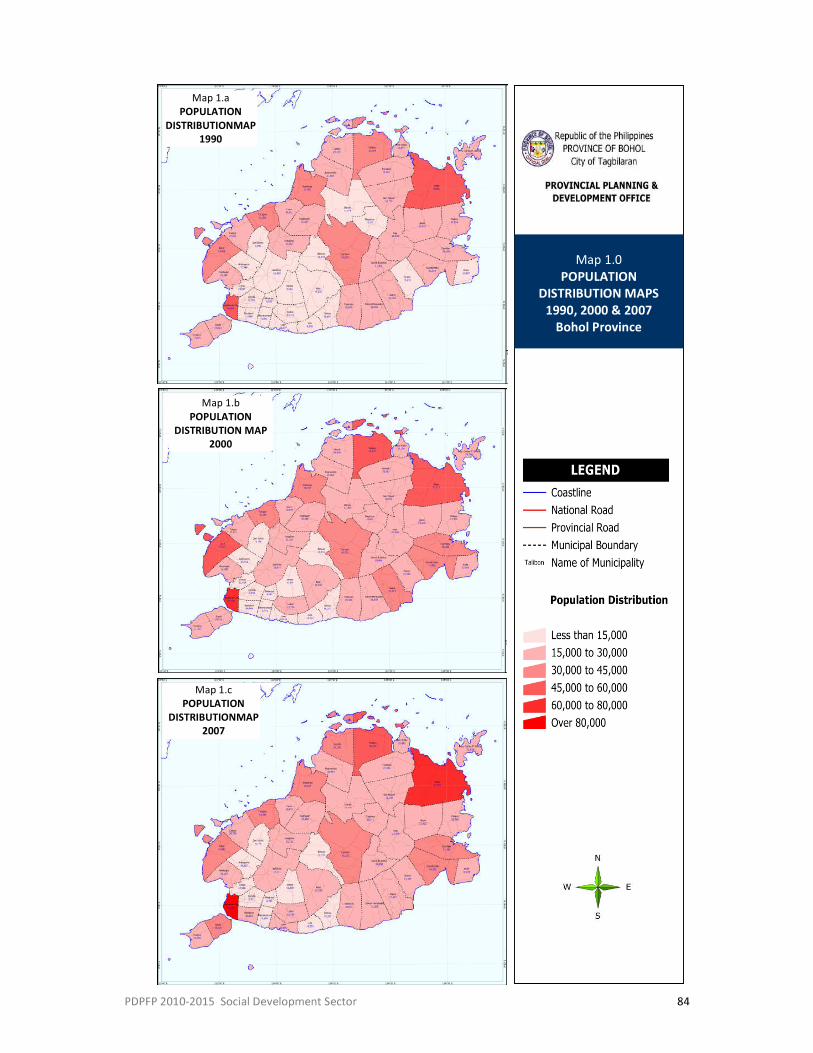
PDPFP 2010-2015 Social Development Sector 84
Map 1.b POPULATION
DISTRIBUTION MAP 2000
Map 1.a POPULATION
DISTRIBUTIONMAP 1990
Map 1.c POPULATION
DISTRIBUTIONMAP 2007
Map 1.0
POPULATION DISTRIBUTION MAPS
1990, 2000 & 2007 Bohol Province
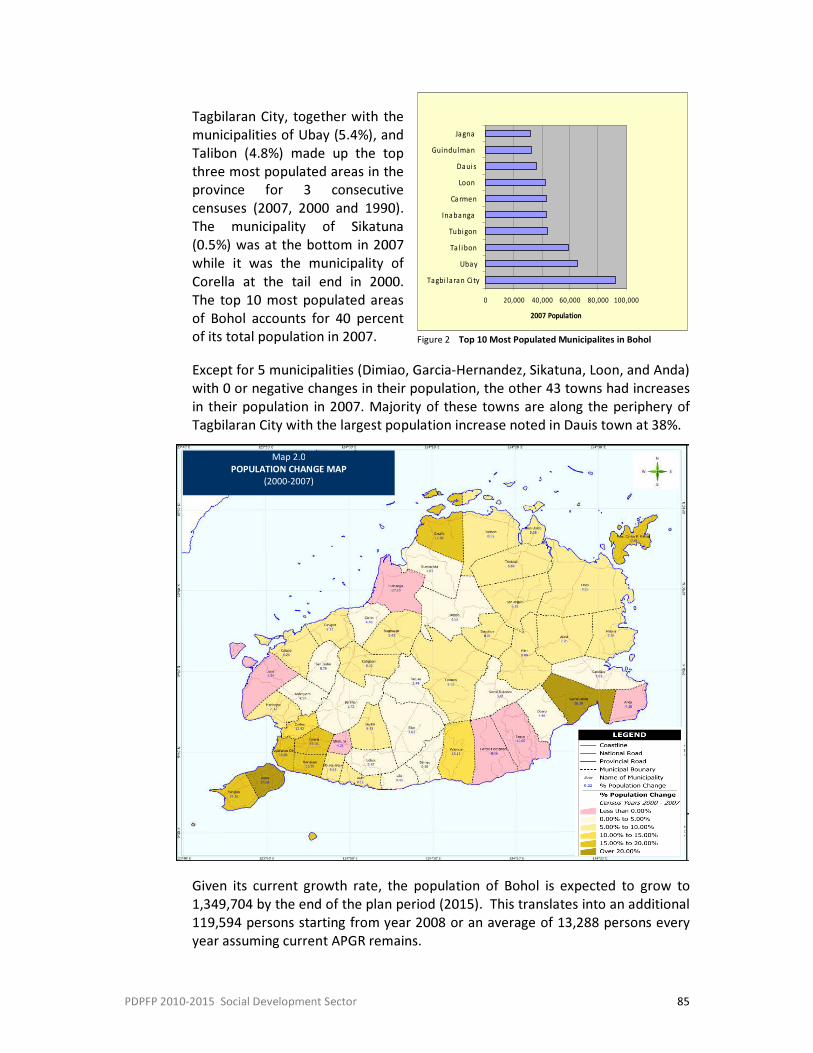
PDPFP 2010-2015 Social Development Sector 85
TOP 10 MUNICIPALITIES IN TERMS OF POPULATION SIZE: 2007
0 20,000 40,000 60,000 80,000 100,000
Tagbi laran Ci ty Ubay
Ta l ibon Tubigon
Inabanga Ca rmen
Loon Dauis
Guindulman Jagna
2007 Population
Figure 2 Top 10 Most Populated Municipalites in Bohol
Tagbilaran City, together with the municipalities of Ubay (5.4%), and Talibon (4.8%) made up the top three most populated areas in the province for 3 consecutive censuses (2007, 2000 and 1990). The municipality of Sikatuna (0.5%) was at the bottom in 2007 while it was the municipality of Corella at the tail end in 2000. The top 10 most populated areas of Bohol accounts for 40 percent of its total population in 2007. Except for 5 municipalities (Dimiao, Garcia-Hernandez, Sikatuna, Loon, and Anda) with 0 or negative changes in their population, the other 43 towns had increases in their population in 2007. Majority of these towns are along the periphery of Tagbilaran City with the largest population increase noted in Dauis town at 38%.
Given its current growth rate, the population of Bohol is expected to grow to 1,349,704 by the end of the plan period (2015). This translates into an additional 119,594 persons starting from year 2008 or an average of 13,288 persons every year assuming current APGR remains.
Map 2.0 POPULATION CHANGE MAP
(2000-2007)
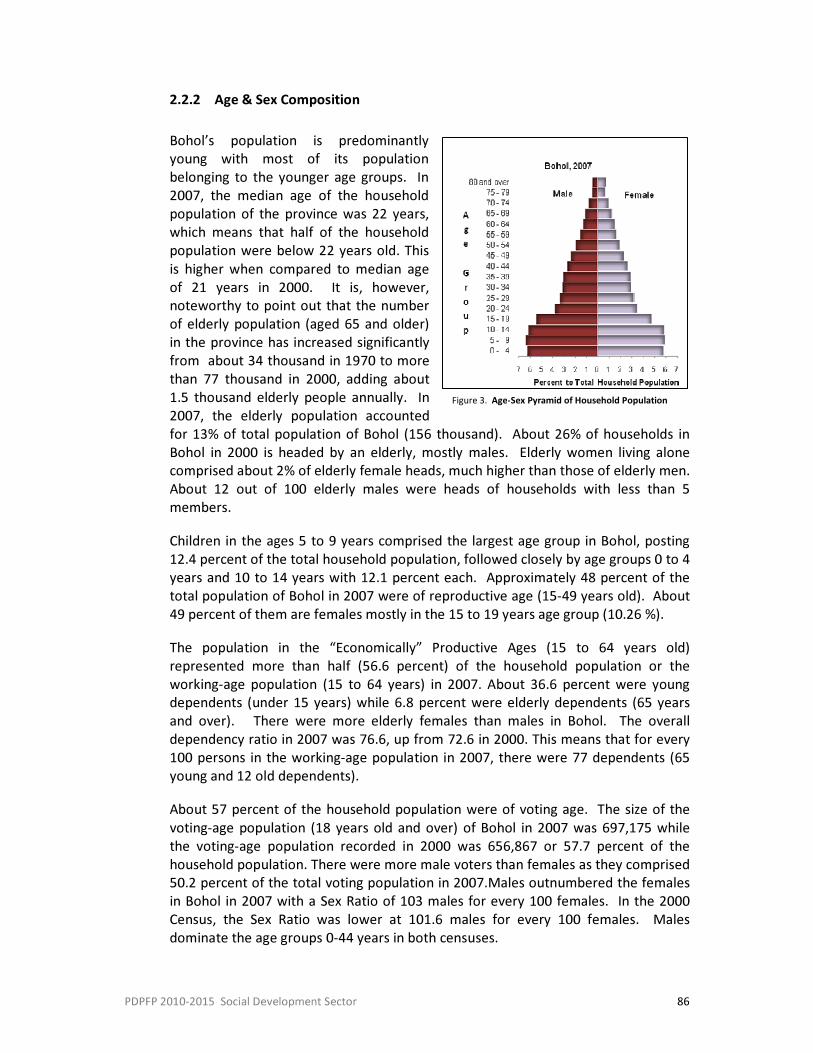
PDPFP 2010-2015 Social Development Sector 86
3
Figure 3. Age-Sex Pyramid of Household Population
2.2.2 Age & Sex Composition
Bohol’s population is predominantly young with most of its population belonging to the younger age groups. In 2007, the median age of the household population of the province was 22 years, which means that half of the household population were below 22 years old. This is higher when compared to median age of 21 years in 2000. It is, however, noteworthy to point out that the number of elderly population (aged 65 and older) in the province has increased significantly from about 34 thousand in 1970 to more than 77 thousand in 2000, adding about 1.5 thousand elderly people annually. In 2007, the elderly population accounted for 13% of total population of Bohol (156 thousand). About 26% of households in Bohol in 2000 is headed by an elderly, mostly males. Elderly women living alone comprised about 2% of elderly female heads, much higher than those of elderly men. About 12 out of 100 elderly males were heads of households with less than 5 members. Children in the ages 5 to 9 years comprised the largest age group in Bohol, posting 12.4 percent of the total household population, followed closely by age groups 0 to 4 years and 10 to 14 years with 12.1 percent each. Approximately 48 percent of the total population of Bohol in 2007 were of reproductive age (15-49 years old). About 49 percent of them are females mostly in the 15 to 19 years age group (10.26 %). The population in the “Economically” Productive Ages (15 to 64 years old) represented more than half (56.6 percent) of the household population or the working-age population (15 to 64 years) in 2007. About 36.6 percent were young dependents (under 15 years) while 6.8 percent were elderly dependents (65 years and over). There were more elderly females than males in Bohol. The overall dependency ratio in 2007 was 76.6, up from 72.6 in 2000. This means that for every 100 persons in the working-age population in 2007, there were 77 dependents (65 young and 12 old dependents). About 57 percent of the household population were of voting age. The size of the voting-age population (18 years old and over) of Bohol in 2007 was 697,175 while the voting-age population recorded in 2000 was 656,867 or 57.7 percent of the household population. There were more male voters than females as they comprised 50.2 percent of the total voting population in 2007.Males outnumbered the females in Bohol in 2007 with a Sex Ratio of 103 males for every 100 females. In the 2000 Census, the Sex Ratio was lower at 101.6 males for every 100 females. Males dominate the age groups 0-44 years in both censuses.
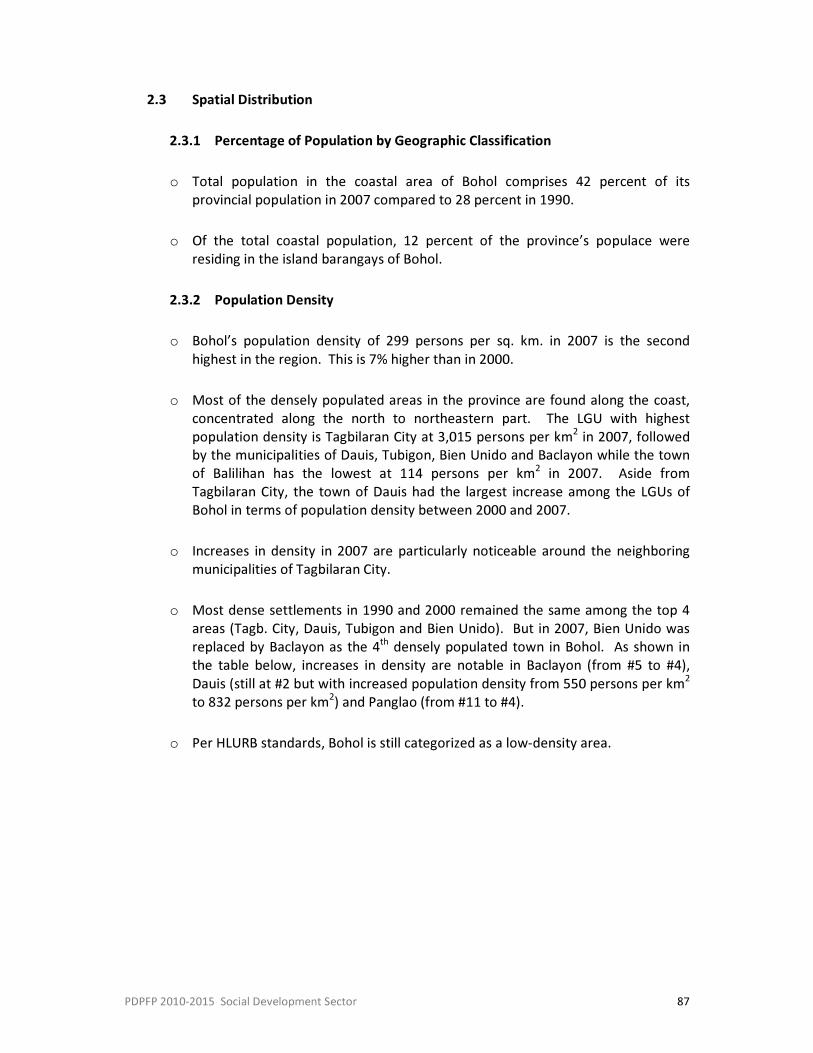
PDPFP 2010-2015 Social Development Sector 87
2.3 Spatial Distribution
2.3.1 Percentage of Population by Geographic Classification
o Total population in the coastal area of Bohol comprises 42 percent of its provincial population in 2007 compared to 28 percent in 1990.
o Of the total coastal population, 12 percent of the province’s populace were residing in the island barangays of Bohol.
2.3.2 Population Density
o Bohol’s population density of 299 persons per sq. km. in 2007 is the second highest in the region. This is 7% higher than in 2000.
o Most of the densely populated areas in the province are found along the coast, concentrated along the north to northeastern part. The LGU with highest population density is Tagbilaran City at 3,015 persons per km2 in 2007, followed by the municipalities of Dauis, Tubigon, Bien Unido and Baclayon while the town of Balilihan has the lowest at 114 persons per km2 in 2007. Aside from Tagbilaran City, the town of Dauis had the largest increase among the LGUs of Bohol in terms of population density between 2000 and 2007.
o Increases in density in 2007 are particularly noticeable around the neighboring municipalities of Tagbilaran City.
o Most dense settlements in 1990 and 2000 remained the same among the top 4 areas (Tagb. City, Dauis, Tubigon and Bien Unido). But in 2007, Bien Unido was replaced by Baclayon as the 4th densely populated town in Bohol. As shown in the table below, increases in density are notable in Baclayon (from #5 to #4), Dauis (still at #2 but with increased population density from 550 persons per km2 to 832 persons per km2) and Panglao (from #11 to #4).
o Per HLURB standards, Bohol is still categorized as a low-density area.
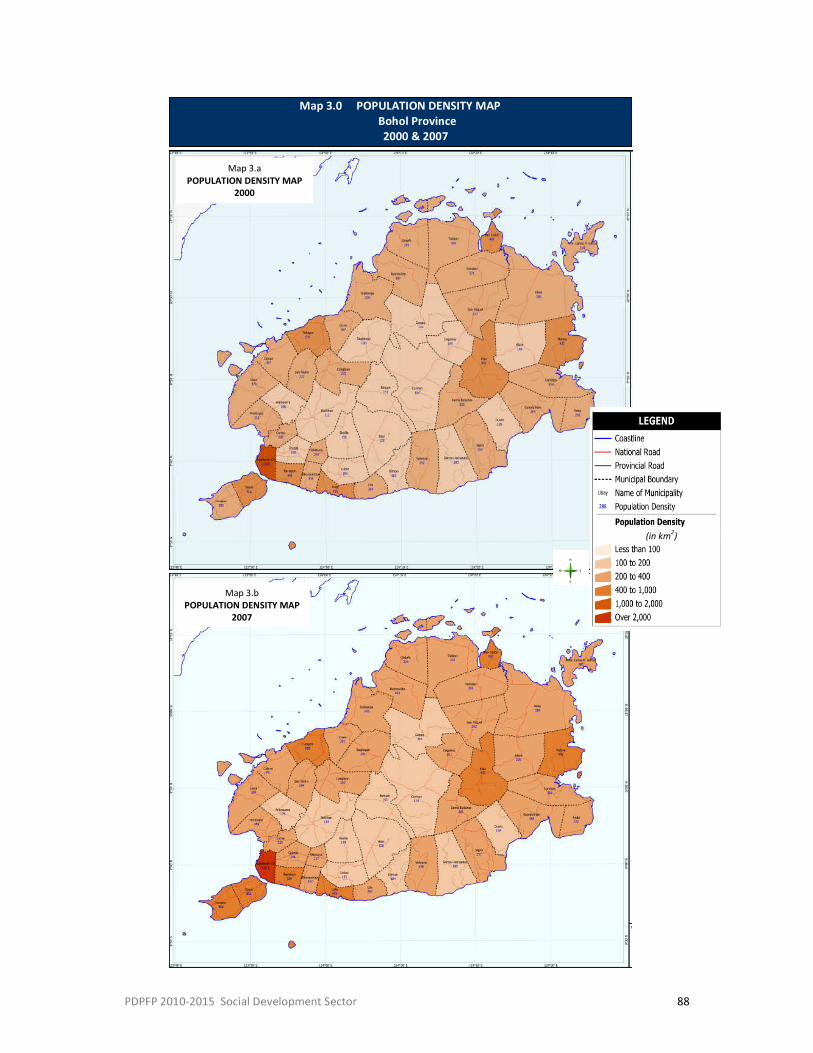
PDPFP 2010-2015 Social Development Sector 88
Map 3.b POPULATION DENSITY MAP
2007
Map 3.a POPULATION DENSITY MAP
2000
Map 3.0 POPULATION DENSITY MAP Bohol Province
2000 & 2007
(in km2)
PDPFP 2010-2015 Social Development Sector 89
2.4 Other Demographic Characteristics of Bohol
2.4.1 Marital Status/Age at Marriage
o Of the household population 10 years old and over, 46.1 percent were married while 45.9 percent were single or have never-married in 2007. The remaining proportion were either widowed, divorced/separated, had common-law/live-in marital arrangement, or had unknown marital status. A higher proportion of males were never-married in Bohol in 2007. For the rest of the marital status categories, females outnumbered their male counterparts. From the 2000 census, a married Boholano/a spends an average of 22 years before marrying (Singulate Mean Age at Marriage). A married male individual spends 23 years in singlehood before ultimately marrying while married females took 21 years.
2.5 Urbanization and Settlements
2.5.1 Current Trend/Existing Settlement Pattern
About 24% or 275,128 of Bohol’s population reside in the urban areas or in 12.35% (137) barangays4. This is a 10 percent increase in urban population compared to 1970. Aside from Tagbilaran City which is 100% urban, the other municipalities with 20% or more urban population are the following:
Table 3. City/Municipalities with Urban Population of 20 Percent & Above, 2007 Bohol Province
Geo-Political Subdivisions % Urban Pop 2007
Geo-Political Subdivisions
% Urban Pop 2007
1 Tagbilaran City 100% 10 Carmen 26% 2 Bien Unido 90% 11 Sevilla 24% 3 Dauis 66% 12 San Isidro 24% 4 Candijay 42% 13 Clarin 22% 5 Mabini 34% 14 Inabanga 22% 6 Alburquerque 29% 15 Pres. Garcia 21% 7 Sierra Bullones 29% 16 Catigbian 21% 8 Loon 27% 17 Danao 21% 9 Jagna 27%
4 Urban classification per NSO
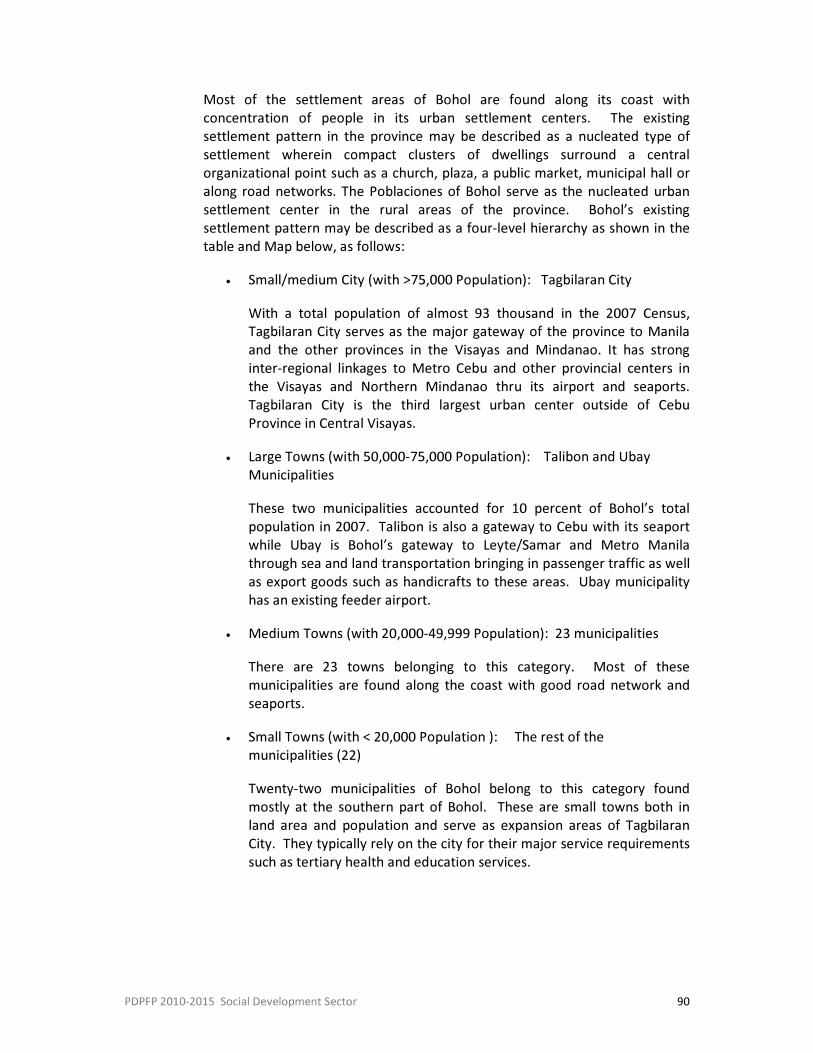
PDPFP 2010-2015 Social Development Sector 90
Most of the settlement areas of Bohol are found along its coast with concentration of people in its urban settlement centers. The existing settlement pattern in the province may be described as a nucleated type of settlement wherein compact clusters of dwellings surround a central organizational point such as a church, plaza, a public market, municipal hall or along road networks. The Poblaciones of Bohol serve as the nucleated urban settlement center in the rural areas of the province. Bohol’s existing settlement pattern may be described as a four-level hierarchy as shown in the table and Map below, as follows:
• Small/medium City (with >75,000 Population): Tagbilaran City With a total population of almost 93 thousand in the 2007 Census, Tagbilaran City serves as the major gateway of the province to Manila and the other provinces in the Visayas and Mindanao. It has strong inter-regional linkages to Metro Cebu and other provincial centers in the Visayas and Northern Mindanao thru its airport and seaports. Tagbilaran City is the third largest urban center outside of Cebu Province in Central Visayas.
• Large Towns (with 50,000-75,000 Population): Talibon and Ubay Municipalities These two municipalities accounted for 10 percent of Bohol’s total population in 2007. Talibon is also a gateway to Cebu with its seaport while Ubay is Bohol’s gateway to Leyte/Samar and Metro Manila through sea and land transportation bringing in passenger traffic as well as export goods such as handicrafts to these areas. Ubay municipality has an existing feeder airport.
• Medium Towns (with 20,000-49,999 Population): 23 municipalities There are 23 towns belonging to this category. Most of these municipalities are found along the coast with good road network and seaports.
• Small Towns (with < 20,000 Population ): The rest of the municipalities (22) Twenty-two municipalities of Bohol belong to this category found mostly at the southern part of Bohol. These are small towns both in land area and population and serve as expansion areas of Tagbilaran City. They typically rely on the city for their major service requirements such as tertiary health and education services.
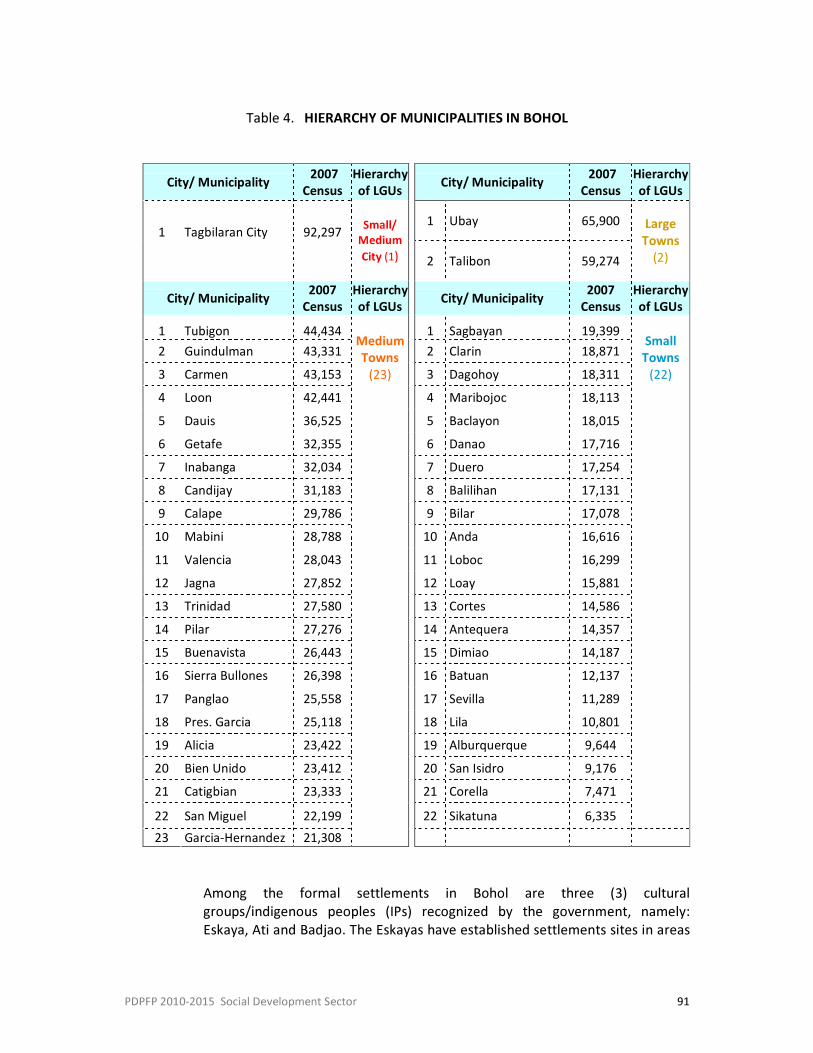
PDPFP 2010-2015 Social Development Sector 91
Table 4. HIERARCHY OF MUNICIPALITIES IN BOHOL
City/ Municipality 2007 Census
Hierarchy of LGUs City/ Municipality 2007
Census Hierarchy of LGUs
1 Ubay 65,900 1
Tagbilaran City
92,297
Small/ Medium City (1) 2 Talibon 59,274
Large Towns
(2)
City/ Municipality 2007 Census
Hierarchy of LGUs City/ Municipality 2007
Census Hierarchy of LGUs
1 Tubigon 44,434 1 Sagbayan 19,399 2 Guindulman 43,331 2 Clarin 18,871 3 Carmen 43,153 3 Dagohoy 18,311 4 Loon 42,441 4 Maribojoc 18,113 5 Dauis 36,525 5 Baclayon 18,015 6 Getafe 32,355 6 Danao 17,716 7 Inabanga 32,034 7 Duero 17,254 8 Candijay 31,183 8 Balilihan 17,131 9 Calape 29,786 9 Bilar 17,078
10 Mabini 28,788 10 Anda 16,616 11 Valencia 28,043 11 Loboc 16,299 12 Jagna 27,852 12 Loay 15,881 13 Trinidad 27,580 13 Cortes 14,586 14 Pilar 27,276 14 Antequera 14,357 15 Buenavista 26,443 15 Dimiao 14,187 16 Sierra Bullones 26,398 16 Batuan 12,137 17 Panglao 25,558 17 Sevilla 11,289 18 Pres. Garcia 25,118 18 Lila 10,801 19 Alicia 23,422 19 Alburquerque 9,644 20 Bien Unido 23,412 20 San Isidro 9,176 21 Catigbian 23,333 21 Corella 7,471 22 San Miguel 22,199 22 Sikatuna 6,335
Small
Towns (22)
23 Garcia-Hernandez 21,308
Medium Towns
(23)
Among the formal settlements in Bohol are three (3) cultural groups/indigenous peoples (IPs) recognized by the government, namely: Eskaya, Ati and Badjao. The Eskayas have established settlements sites in areas
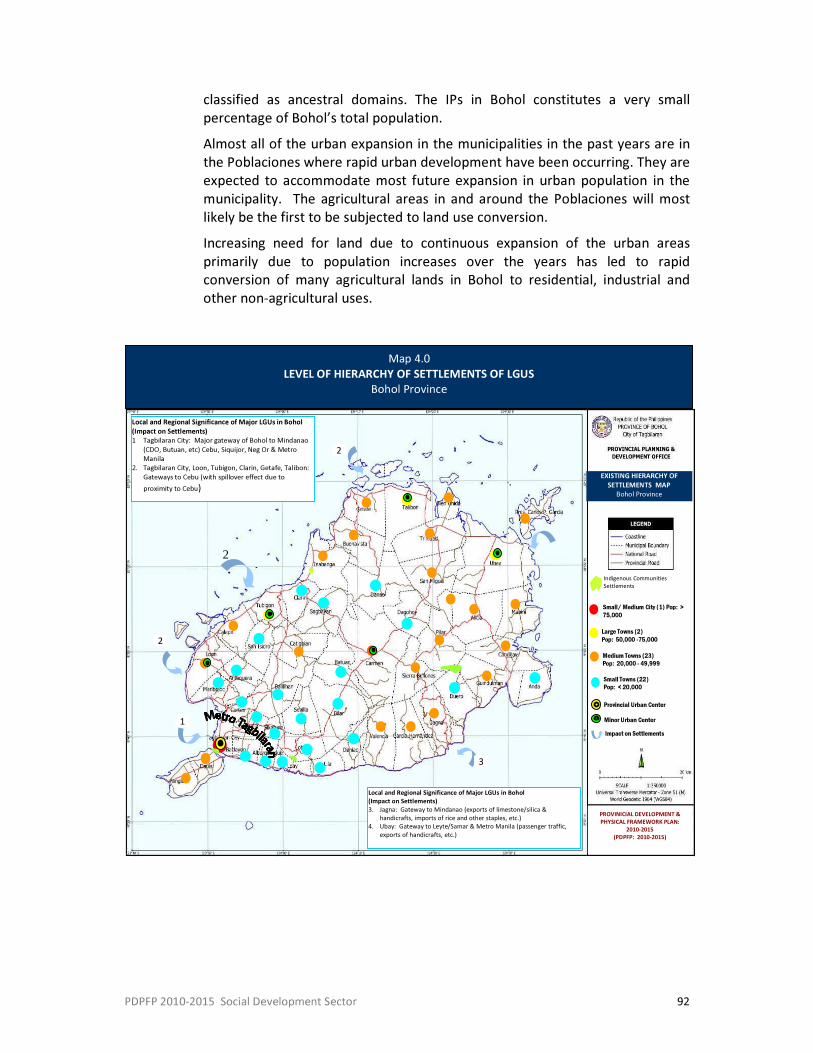
PDPFP 2010-2015 Social Development Sector 92
Local and Regional Significance of Major LGUs in Bohol (Impact on Settlements) 1 Tagbilaran City: Major gateway of Bohol to Mindanao
(CDO, Butuan, etc) Cebu, Siquijor, Neg Or & Metro Manila
2. Tagbilaran City, Loon, Tubigon, Clarin, Getafe, Talibon: Gateways to Cebu (with spillover effect due to proximity to Cebu)
Small/ Medium City (1) Pop: > 75,000
EXISTING HIERARCHY OF SETTLEMENTS MAP
Bohol Province
PROVINICIAL DEVELOPMENT & PHYSICAL FRAMEWORK PLAN:
2010-2015 (PDPFP: 2010-2015)
Indigenous Communities Settlements
Local and Regional Significance of Major LGUs in Bohol (Impact on Settlements) 3. Jagna: Gateway to Mindanao (exports of limestone/silica &
handicrafts, imports of rice and other staples, etc.) 4. Ubay: Gateway to Leyte/Samar & Metro Manila (passenger traffic,
exports of handicrafts, etc.)
Large Towns (2) Pop: 50,000 -75,000
Medium Towns (23) Pop: 20,000 - 49,999 Small Towns (22) Pop: < 20,000
Minor Urban Center
Provincial Urban Center
Map 4.0 LEVEL OF HIERARCHY OF SETTLEMENTS OF LGUS
Bohol Province
1
3
2
Impact on Settlements
2
2
classified as ancestral domains. The IPs in Bohol constitutes a very small percentage of Bohol’s total population. Almost all of the urban expansion in the municipalities in the past years are in the Poblaciones where rapid urban development have been occurring. They are expected to accommodate most future expansion in urban population in the municipality. The agricultural areas in and around the Poblaciones will most likely be the first to be subjected to land use conversion. Increasing need for land due to continuous expansion of the urban areas primarily due to population increases over the years has led to rapid conversion of many agricultural lands in Bohol to residential, industrial and other non-agricultural uses.
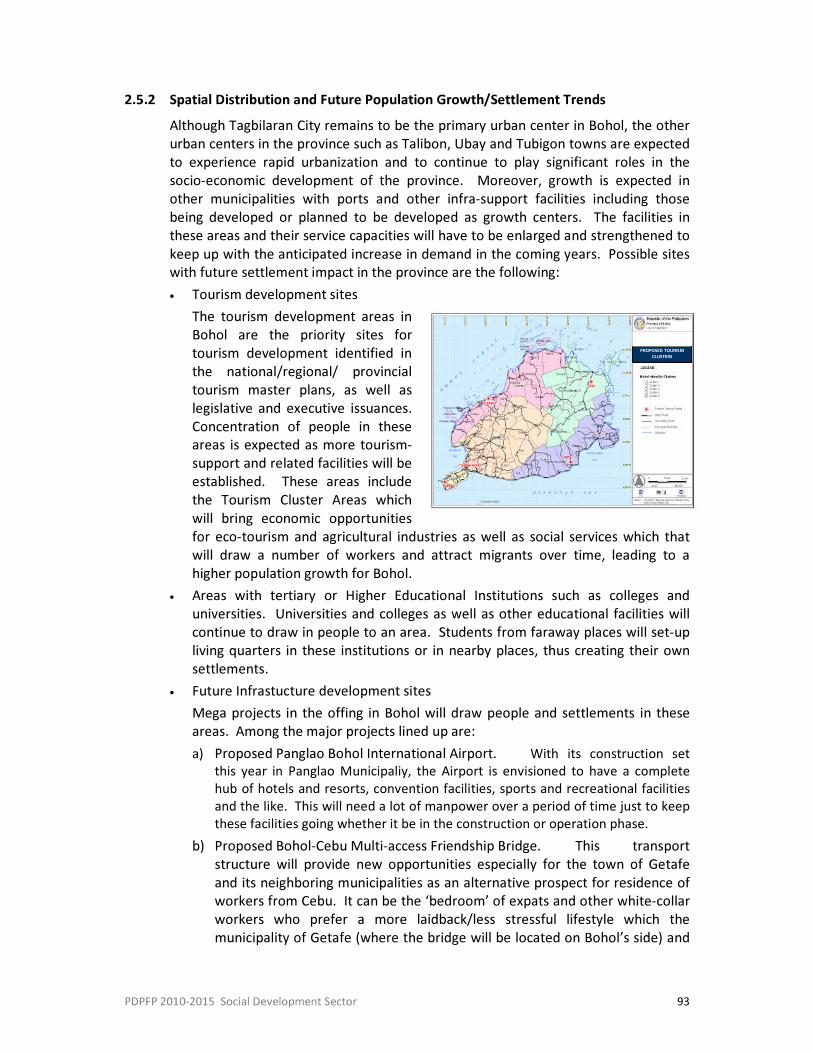
PDPFP 2010-2015 Social Development Sector 93
PROPOSED TOURISM CLUSTERS
2.5.2 Spatial Distribution and Future Population Growth/Settlement Trends Although Tagbilaran City remains to be the primary urban center in Bohol, the other urban centers in the province such as Talibon, Ubay and Tubigon towns are expected to experience rapid urbanization and to continue to play significant roles in the socio-economic development of the province. Moreover, growth is expected in other municipalities with ports and other infra-support facilities including those being developed or planned to be developed as growth centers. The facilities in these areas and their service capacities will have to be enlarged and strengthened to keep up with the anticipated increase in demand in the coming years. Possible sites with future settlement impact in the province are the following: • Tourism development sites
The tourism development areas in Bohol are the priority sites for tourism development identified in the national/regional/ provincial tourism master plans, as well as legislative and executive issuances. Concentration of people in these areas is expected as more tourism-support and related facilities will be established. These areas include the Tourism Cluster Areas which will bring economic opportunities for eco-tourism and agricultural industries as well as social services which that will draw a number of workers and attract migrants over time, leading to a higher population growth for Bohol.
• Areas with tertiary or Higher Educational Institutions such as colleges and universities. Universities and colleges as well as other educational facilities will continue to draw in people to an area. Students from faraway places will set-up living quarters in these institutions or in nearby places, thus creating their own settlements.
• Future Infrastucture development sites Mega projects in the offing in Bohol will draw people and settlements in these areas. Among the major projects lined up are: a) Proposed Panglao Bohol International Airport. With its construction set
this year in Panglao Municipaliy, the Airport is envisioned to have a complete hub of hotels and resorts, convention facilities, sports and recreational facilities and the like. This will need a lot of manpower over a period of time just to keep these facilities going whether it be in the construction or operation phase.
b) Proposed Bohol-Cebu Multi-access Friendship Bridge. This transport structure will provide new opportunities especially for the town of Getafe and its neighboring municipalities as an alternative prospect for residence of workers from Cebu. It can be the ‘bedroom’ of expats and other white-collar workers who prefer a more laidback/less stressful lifestyle which the municipality of Getafe (where the bridge will be located on Bohol’s side) and
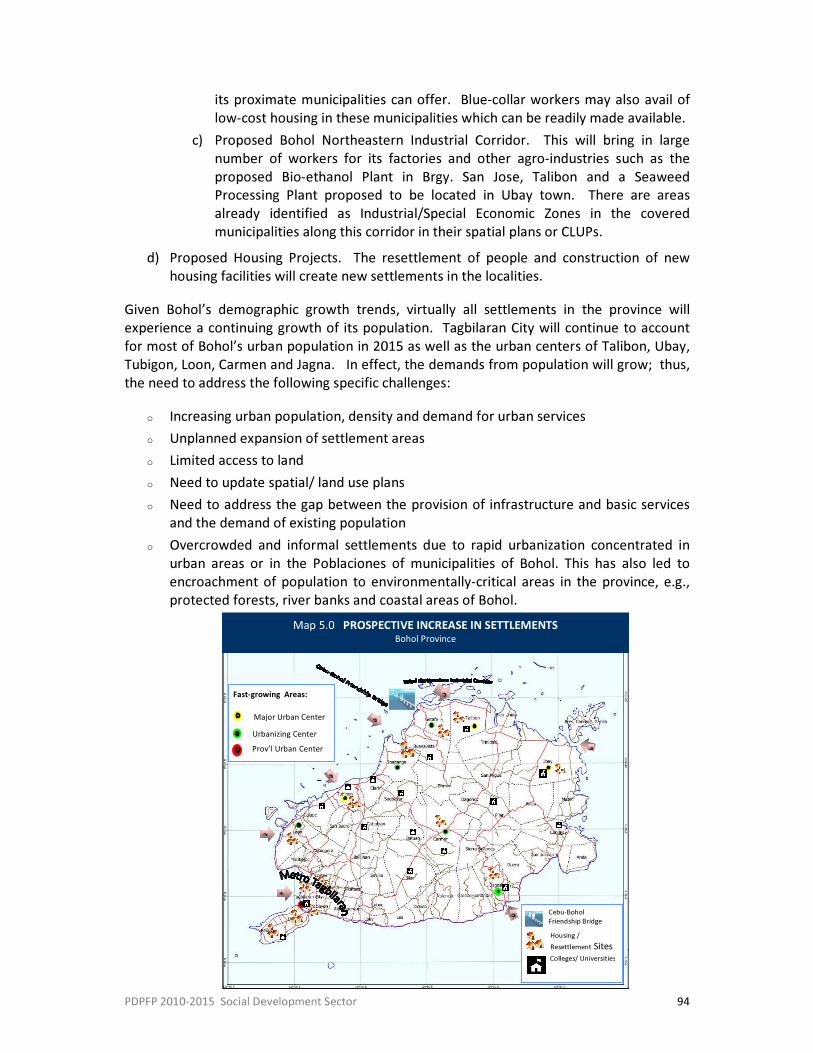
PDPFP 2010-2015 Social Development Sector 94
its proximate municipalities can offer. Blue-collar workers may also avail of low-cost housing in these municipalities which can be readily made available.
c) Proposed Bohol Northeastern Industrial Corridor. This will bring in large number of workers for its factories and other agro-industries such as the proposed Bio-ethanol Plant in Brgy. San Jose, Talibon and a Seaweed Processing Plant proposed to be located in Ubay town. There are areas already identified as Industrial/Special Economic Zones in the covered municipalities along this corridor in their spatial plans or CLUPs.
d) Proposed Housing Projects. The resettlement of people and construction of new housing facilities will create new settlements in the localities.
Given Bohol’s demographic growth trends, virtually all settlements in the province will experience a continuing growth of its population. Tagbilaran City will continue to account for most of Bohol’s urban population in 2015 as well as the urban centers of Talibon, Ubay, Tubigon, Loon, Carmen and Jagna. In effect, the demands from population will grow; thus, the need to address the following specific challenges:
o Increasing urban population, density and demand for urban services o Unplanned expansion of settlement areas o Limited access to land o Need to update spatial/ land use plans o Need to address the gap between the provision of infrastructure and basic services
and the demand of existing population o Overcrowded and informal settlements due to rapid urbanization concentrated in
urban areas or in the Poblaciones of municipalities of Bohol. This has also led to encroachment of population to environmentally-critical areas in the province, e.g., protected forests, river banks and coastal areas of Bohol.
1
2
2
2
3
4
2
Map 5.0 PROSPECTIVE INCREASE IN SETTLEMENTS Bohol Province
Major Urban Center Urbanizing Center Prov’l Urban Center
Fast-growing Areas:
Cebu-Bohol Friendship Bridge Housing / Resettlement Sites Colleges/ Universities
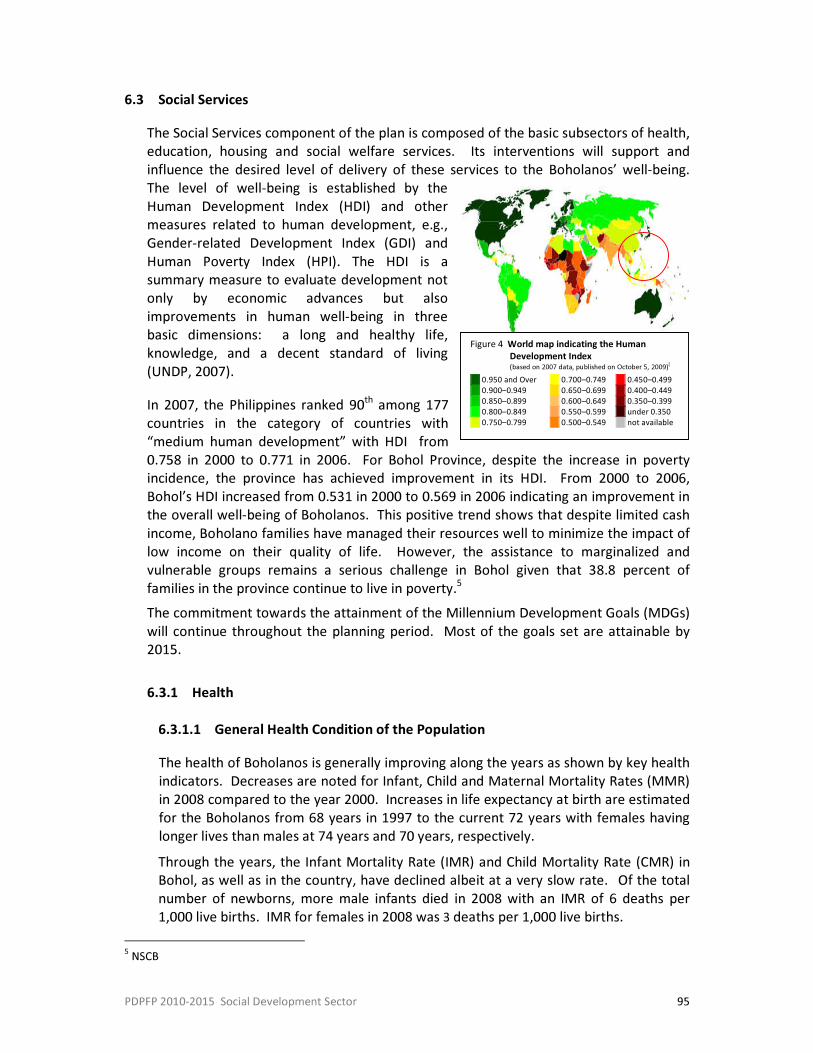
PDPFP 2010-2015 Social Development Sector 95
Figure 4 World map indicating the Human Development Index (based on 2007 data, published on October 5, 2009)[
0.950 and Over 0.900–0.949 0.850–0.899 0.800–0.849 0.750–0.799
0.700–0.749 0.650–0.699 0.600–0.649 0.550–0.599 0.500–0.549
0.450–0.499 0.400–0.449 0.350–0.399 under 0.350 not available
6.3 Social Services The Social Services component of the plan is composed of the basic subsectors of health, education, housing and social welfare services. Its interventions will support and influence the desired level of delivery of these services to the Boholanos’ well-being. The level of well-being is established by the Human Development Index (HDI) and other measures related to human development, e.g., Gender-related Development Index (GDI) and Human Poverty Index (HPI). The HDI is a summary measure to evaluate development not only by economic advances but also improvements in human well-being in three basic dimensions: a long and healthy life, knowledge, and a decent standard of living (UNDP, 2007). In 2007, the Philippines ranked 90th among 177 countries in the category of countries with “medium human development” with HDI from 0.758 in 2000 to 0.771 in 2006. For Bohol Province, despite the increase in poverty incidence, the province has achieved improvement in its HDI. From 2000 to 2006, Bohol’s HDI increased from 0.531 in 2000 to 0.569 in 2006 indicating an improvement in the overall well-being of Boholanos. This positive trend shows that despite limited cash income, Boholano families have managed their resources well to minimize the impact of low income on their quality of life. However, the assistance to marginalized and vulnerable groups remains a serious challenge in Bohol given that 38.8 percent of families in the province continue to live in poverty.5 The commitment towards the attainment of the Millennium Development Goals (MDGs) will continue throughout the planning period. Most of the goals set are attainable by 2015.
6.3.1 Health
6.3.1.1 General Health Condition of the Population The health of Boholanos is generally improving along the years as shown by key health indicators. Decreases are noted for Infant, Child and Maternal Mortality Rates (MMR) in 2008 compared to the year 2000. Increases in life expectancy at birth are estimated for the Boholanos from 68 years in 1997 to the current 72 years with females having longer lives than males at 74 years and 70 years, respectively. Through the years, the Infant Mortality Rate (IMR) and Child Mortality Rate (CMR) in Bohol, as well as in the country, have declined albeit at a very slow rate. Of the total number of newborns, more male infants died in 2008 with an IMR of 6 deaths per 1,000 live births. IMR for females in 2008 was 3 deaths per 1,000 live births.
5 NSCB
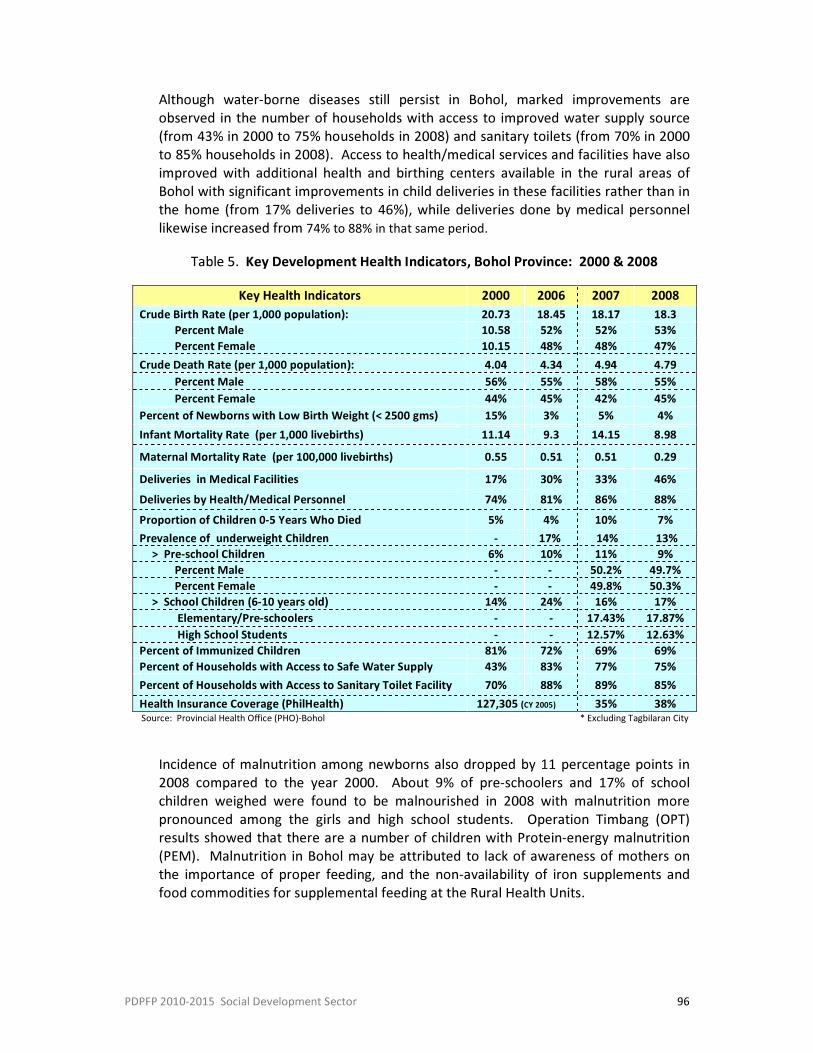
PDPFP 2010-2015 Social Development Sector 96
Although water-borne diseases still persist in Bohol, marked improvements are observed in the number of households with access to improved water supply source (from 43% in 2000 to 75% households in 2008) and sanitary toilets (from 70% in 2000 to 85% households in 2008). Access to health/medical services and facilities have also improved with additional health and birthing centers available in the rural areas of Bohol with significant improvements in child deliveries in these facilities rather than in the home (from 17% deliveries to 46%), while deliveries done by medical personnel likewise increased from 74% to 88% in that same period.
Table 5. Key Development Health Indicators, Bohol Province: 2000 & 2008 Key Health Indicators 2000 2006 2007 2008
Crude Birth Rate (per 1,000 population): 20.73 18.45 18.17 18.3 Percent Male 10.58 52% 52% 53% Percent Female 10.15 48% 48% 47%
Crude Death Rate (per 1,000 population): 4.04 4.34 4.94 4.79 Percent Male 56% 55% 58% 55% Percent Female 44% 45% 42% 45%
Percent of Newborns with Low Birth Weight (< 2500 gms) 15% 3% 5% 4% Infant Mortality Rate (per 1,000 livebirths) 11.14 9.3 14.15 8.98 Maternal Mortality Rate (per 100,000 livebirths) 0.55 0.51 0.51 0.29 Deliveries in Medical Facilities 17% 30% 33% 46% Deliveries by Health/Medical Personnel 74% 81% 86% 88% Proportion of Children 0-5 Years Who Died 5% 4% 10% 7% Prevalence of underweight Children - 17% 14% 13%
> Pre-school Children 6% 10% 11% 9% Percent Male - - 50.2% 49.7% Percent Female - - 49.8% 50.3% > School Children (6-10 years old) 14% 24% 16% 17%
Elementary/Pre-schoolers - - 17.43% 17.87% High School Students - - 12.57% 12.63%
Percent of Immunized Children 81% 72% 69% 69% Percent of Households with Access to Safe Water Supply 43% 83% 77% 75% Percent of Households with Access to Sanitary Toilet Facility 70% 88% 89% 85% Health Insurance Coverage (PhilHealth) 127,305 (CY 2005) 35% 38% Source: Provincial Health Office (PHO)-Bohol * Excluding Tagbilaran City
Incidence of malnutrition among newborns also dropped by 11 percentage points in 2008 compared to the year 2000. About 9% of pre-schoolers and 17% of school children weighed were found to be malnourished in 2008 with malnutrition more pronounced among the girls and high school students. Operation Timbang (OPT) results showed that there are a number of children with Protein-energy malnutrition (PEM). Malnutrition in Bohol may be attributed to lack of awareness of mothers on the importance of proper feeding, and the non-availability of iron supplements and food commodities for supplemental feeding at the Rural Health Units.
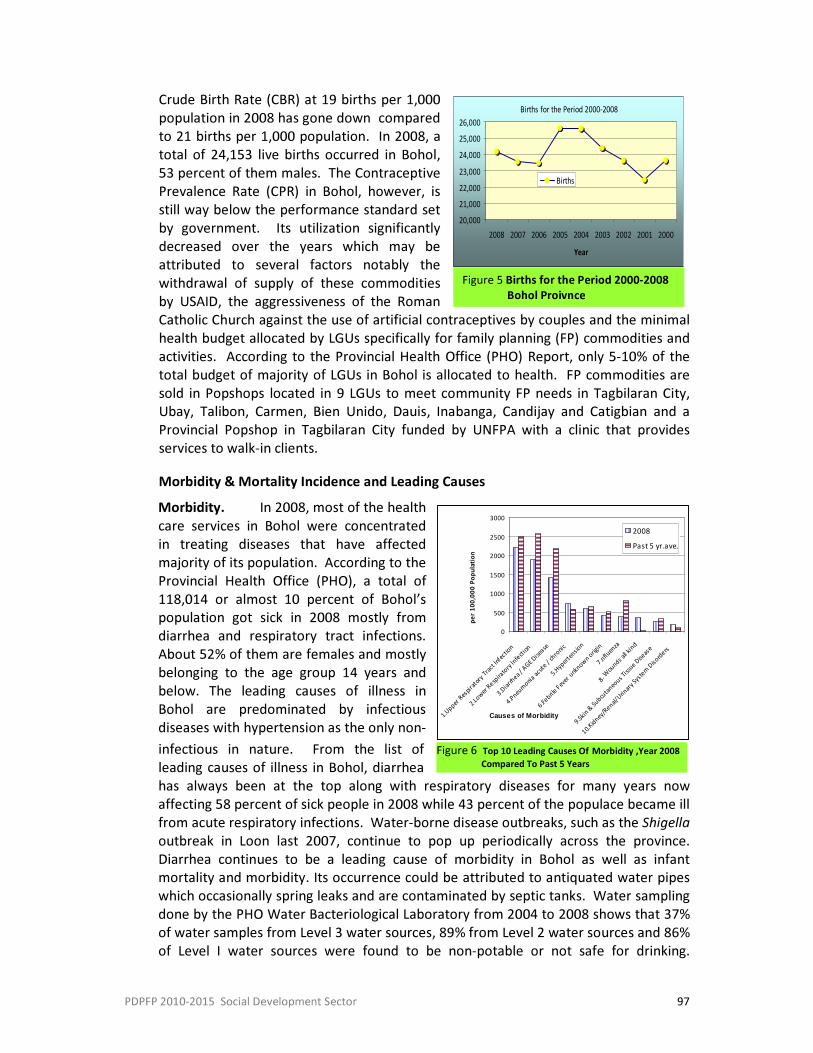
PDPFP 2010-2015 Social Development Sector 97
0
500
1000
1500
2000
2500
3000
1 . Up p e
r R es p i r
a t o ry T r
a c t I n f e
c t i on
2 . L ow e r
R e sp i r a
t o r y I n f e
c t i on
3 . Di a r rh e a
/ AG E D
i s e as e
4 . P ne u m
o n i a a c u
t e / c h r
o n i c
5 . Hy p er t e n
s i o n
6 . F eb r i l e
F e ve r u
n k no w n
o r ig i n
7 . n fl u e n
z a
8 . Wo u n
d s al l k in d
9 . S ki n &
S u bc u t a
n e ou s T
i s s ue Di s e a
s e
1 0 . Ki d n e
y / Re n a
l / U ri n a r
y S ys t e m
D i so r de r s
Causes of Morbidity
per 1
00,00
0 Pop
ulatio
n
2008Past 5 yr.ave.
Figure 6 Top 10 Leading Causes Of Morbidity ,Year 2008 Compared To Past 5 Years
Morbidity Causes
Births for the Period 2000-2008
20,00021,00022,00023,00024,00025,00026,000
2008 2007 2006 2005 2004 2003 2002 2001 2000Year
Births
Figure 5 Births for the Period 2000-2008 Bohol Proivnce
Crude Birth Rate (CBR) at 19 births per 1,000 population in 2008 has gone down compared to 21 births per 1,000 population. In 2008, a total of 24,153 live births occurred in Bohol, 53 percent of them males. The Contraceptive Prevalence Rate (CPR) in Bohol, however, is still way below the performance standard set by government. Its utilization significantly decreased over the years which may be attributed to several factors notably the withdrawal of supply of these commodities by USAID, the aggressiveness of the Roman Catholic Church against the use of artificial contraceptives by couples and the minimal health budget allocated by LGUs specifically for family planning (FP) commodities and activities. According to the Provincial Health Office (PHO) Report, only 5-10% of the total budget of majority of LGUs in Bohol is allocated to health. FP commodities are sold in Popshops located in 9 LGUs to meet community FP needs in Tagbilaran City, Ubay, Talibon, Carmen, Bien Unido, Dauis, Inabanga, Candijay and Catigbian and a Provincial Popshop in Tagbilaran City funded by UNFPA with a clinic that provides services to walk-in clients. Morbidity & Mortality Incidence and Leading Causes Morbidity. In 2008, most of the health care services in Bohol were concentrated in treating diseases that have affected majority of its population. According to the Provincial Health Office (PHO), a total of 118,014 or almost 10 percent of Bohol’s population got sick in 2008 mostly from diarrhea and respiratory tract infections. About 52% of them are females and mostly belonging to the age group 14 years and below. The leading causes of illness in Bohol are predominated by infectious diseases with hypertension as the only non-infectious in nature. From the list of leading causes of illness in Bohol, diarrhea has always been at the top along with respiratory diseases for many years now affecting 58 percent of sick people in 2008 while 43 percent of the populace became ill from acute respiratory infections. Water-borne disease outbreaks, such as the Shigella outbreak in Loon last 2007, continue to pop up periodically across the province. Diarrhea continues to be a leading cause of morbidity in Bohol as well as infant mortality and morbidity. Its occurrence could be attributed to antiquated water pipes which occasionally spring leaks and are contaminated by septic tanks. Water sampling done by the PHO Water Bacteriological Laboratory from 2004 to 2008 shows that 37% of water samples from Level 3 water sources, 89% from Level 2 water sources and 86% of Level I water sources were found to be non-potable or not safe for drinking.
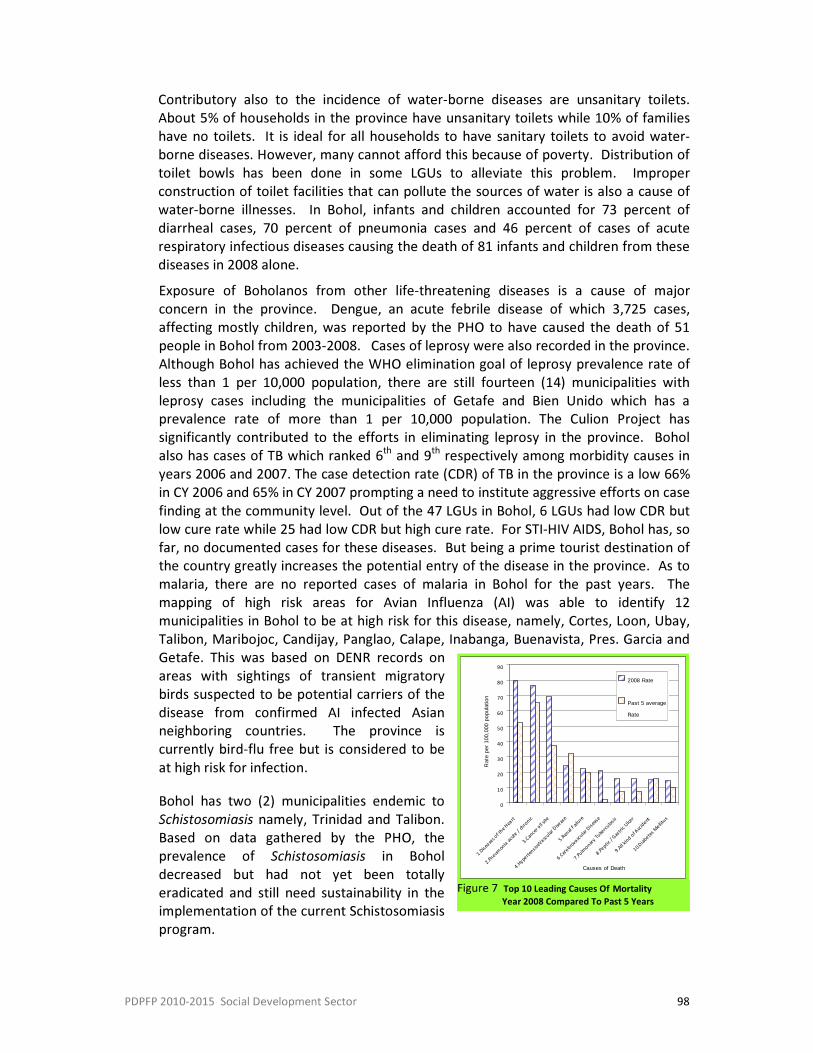
PDPFP 2010-2015 Social Development Sector 98
0
10
20
30
40
50
60
70
80
90
1 . Di s e a
s e s o f t
h e He a r
t
2 . P ne u m
o n i a a c u
t e / c h r
o n ic
3 . Ca n c
e r al l s i t
e
4 . Hy p e
r t e ns i v e
V a sc u l a
r D is e a
s e
5 . Re n a
l F ai l u r
e
6 . Ce r e
b r ov a s
c u l ar D i
s e as e
7 . P ul m o
n a ry T u
b e rc u l o
s i s
8 . P ep t i c
/ Ga s t r
i c Ul c e r
9 . Al l k i
n d o f A
c c i de n t
1 0 . Di a b e
t e s M e
l l i t us
Causes of Death
Rat
e p
er 1
00,0
00 p
opu
latio
n
2008 Rate
Past 5 average
Rate
Figure 7 Top 10 Leading Causes Of Mortality Year 2008 Compared To Past 5 Years
Contributory also to the incidence of water-borne diseases are unsanitary toilets. About 5% of households in the province have unsanitary toilets while 10% of families have no toilets. It is ideal for all households to have sanitary toilets to avoid water-borne diseases. However, many cannot afford this because of poverty. Distribution of toilet bowls has been done in some LGUs to alleviate this problem. Improper construction of toilet facilities that can pollute the sources of water is also a cause of water-borne illnesses. In Bohol, infants and children accounted for 73 percent of diarrheal cases, 70 percent of pneumonia cases and 46 percent of cases of acute respiratory infectious diseases causing the death of 81 infants and children from these diseases in 2008 alone. Exposure of Boholanos from other life-threatening diseases is a cause of major concern in the province. Dengue, an acute febrile disease of which 3,725 cases, affecting mostly children, was reported by the PHO to have caused the death of 51 people in Bohol from 2003-2008. Cases of leprosy were also recorded in the province. Although Bohol has achieved the WHO elimination goal of leprosy prevalence rate of less than 1 per 10,000 population, there are still fourteen (14) municipalities with leprosy cases including the municipalities of Getafe and Bien Unido which has a prevalence rate of more than 1 per 10,000 population. The Culion Project has significantly contributed to the efforts in eliminating leprosy in the province. Bohol also has cases of TB which ranked 6th and 9th respectively among morbidity causes in years 2006 and 2007. The case detection rate (CDR) of TB in the province is a low 66% in CY 2006 and 65% in CY 2007 prompting a need to institute aggressive efforts on case finding at the community level. Out of the 47 LGUs in Bohol, 6 LGUs had low CDR but low cure rate while 25 had low CDR but high cure rate. For STI-HIV AIDS, Bohol has, so far, no documented cases for these diseases. But being a prime tourist destination of the country greatly increases the potential entry of the disease in the province. As to malaria, there are no reported cases of malaria in Bohol for the past years. The mapping of high risk areas for Avian Influenza (AI) was able to identify 12 municipalities in Bohol to be at high risk for this disease, namely, Cortes, Loon, Ubay, Talibon, Maribojoc, Candijay, Panglao, Calape, Inabanga, Buenavista, Pres. Garcia and Getafe. This was based on DENR records on areas with sightings of transient migratory birds suspected to be potential carriers of the disease from confirmed AI infected Asian neighboring countries. The province is currently bird-flu free but is considered to be at high risk for infection. Bohol has two (2) municipalities endemic to Schistosomiasis namely, Trinidad and Talibon. Based on data gathered by the PHO, the prevalence of Schistosomiasis in Bohol decreased but had not yet been totally eradicated and still need sustainability in the implementation of the current Schistosomiasis program.
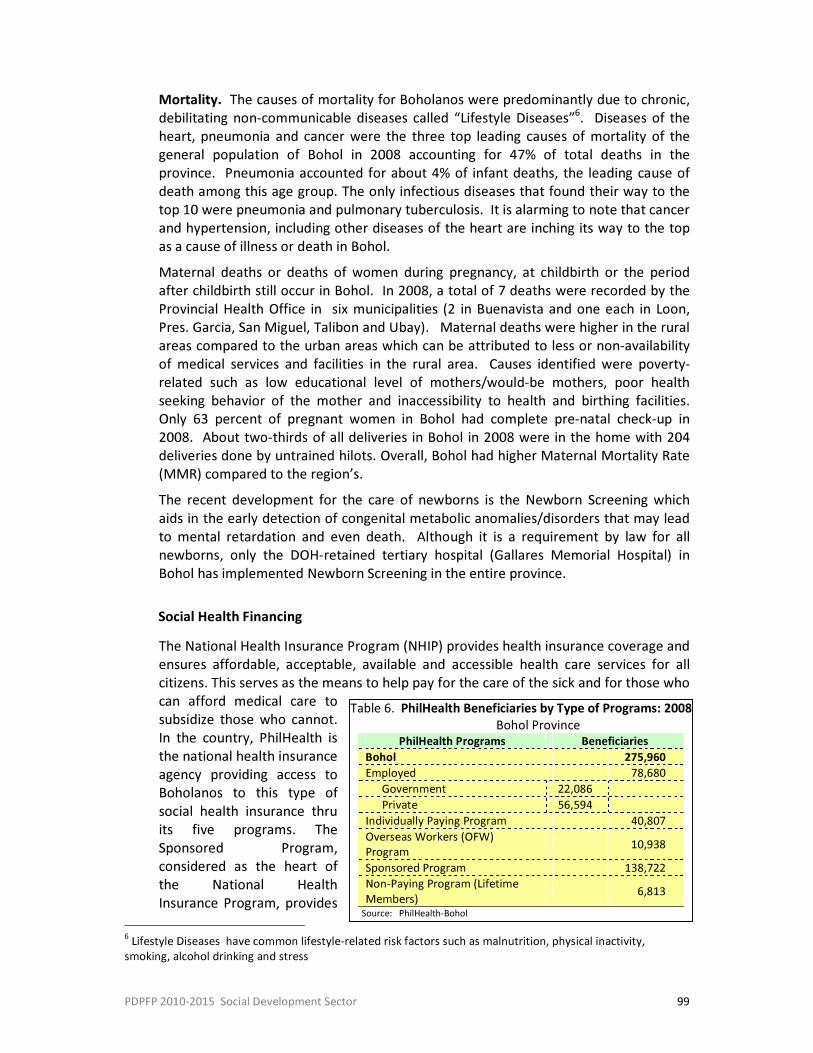
PDPFP 2010-2015 Social Development Sector 99
Table 6. PhilHealth Beneficiaries by Type of Programs: 2008 Bohol Province
PhilHealth Programs Beneficiaries Bohol 275,960 Employed 78,680 Government 22,086 Private 56,594 Individually Paying Program 40,807 Overseas Workers (OFW) Program 10,938 Sponsored Program 138,722 Non-Paying Program (Lifetime Members) 6,813
Source: PhilHealth-Bohol
Mortality. The causes of mortality for Boholanos were predominantly due to chronic, debilitating non-communicable diseases called “Lifestyle Diseases”6. Diseases of the heart, pneumonia and cancer were the three top leading causes of mortality of the general population of Bohol in 2008 accounting for 47% of total deaths in the province. Pneumonia accounted for about 4% of infant deaths, the leading cause of death among this age group. The only infectious diseases that found their way to the top 10 were pneumonia and pulmonary tuberculosis. It is alarming to note that cancer and hypertension, including other diseases of the heart are inching its way to the top as a cause of illness or death in Bohol. Maternal deaths or deaths of women during pregnancy, at childbirth or the period after childbirth still occur in Bohol. In 2008, a total of 7 deaths were recorded by the Provincial Health Office in six municipalities (2 in Buenavista and one each in Loon, Pres. Garcia, San Miguel, Talibon and Ubay). Maternal deaths were higher in the rural areas compared to the urban areas which can be attributed to less or non-availability of medical services and facilities in the rural area. Causes identified were poverty-related such as low educational level of mothers/would-be mothers, poor health seeking behavior of the mother and inaccessibility to health and birthing facilities. Only 63 percent of pregnant women in Bohol had complete pre-natal check-up in 2008. About two-thirds of all deliveries in Bohol in 2008 were in the home with 204 deliveries done by untrained hilots. Overall, Bohol had higher Maternal Mortality Rate (MMR) compared to the region’s. The recent development for the care of newborns is the Newborn Screening which aids in the early detection of congenital metabolic anomalies/disorders that may lead to mental retardation and even death. Although it is a requirement by law for all newborns, only the DOH-retained tertiary hospital (Gallares Memorial Hospital) in Bohol has implemented Newborn Screening in the entire province.
Social Health Financing The National Health Insurance Program (NHIP) provides health insurance coverage and ensures affordable, acceptable, available and accessible health care services for all citizens. This serves as the means to help pay for the care of the sick and for those who can afford medical care to subsidize those who cannot. In the country, PhilHealth is the national health insurance agency providing access to Boholanos to this type of social health insurance thru its five programs. The Sponsored Program, considered as the heart of the National Health Insurance Program, provides
6 Lifestyle Diseases have common lifestyle-related risk factors such as malnutrition, physical inactivity, smoking, alcohol drinking and stress
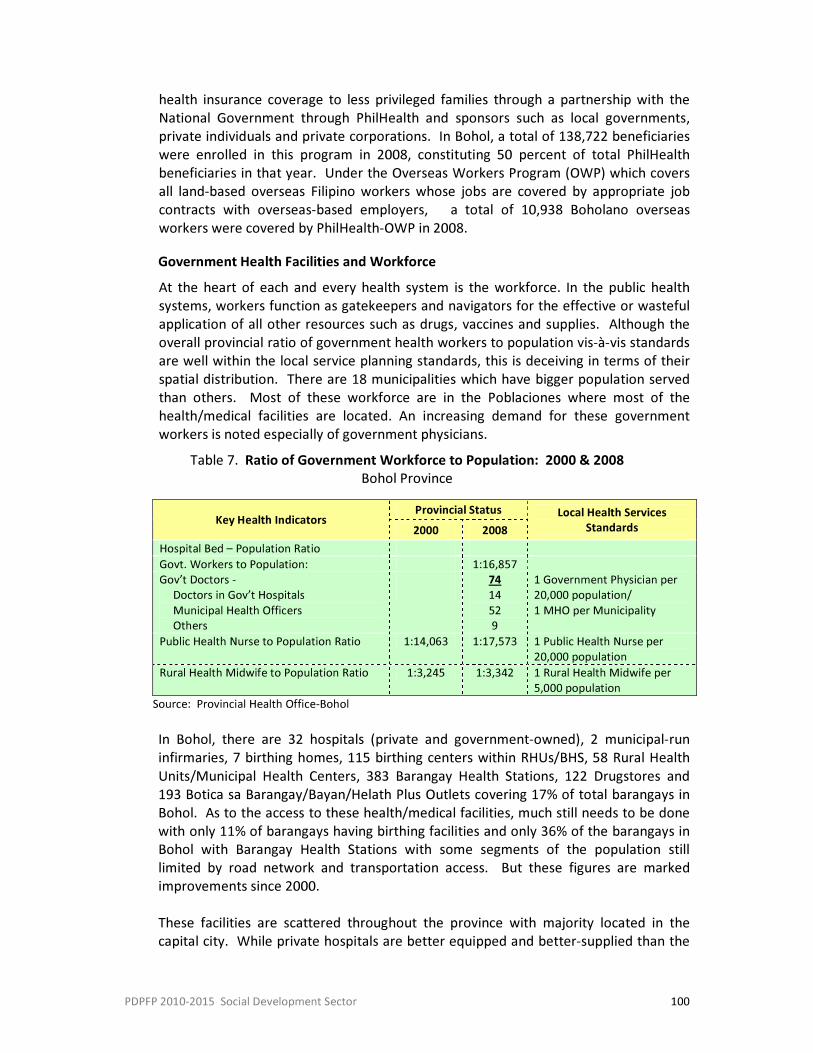
PDPFP 2010-2015 Social Development Sector 100
health insurance coverage to less privileged families through a partnership with the National Government through PhilHealth and sponsors such as local governments, private individuals and private corporations. In Bohol, a total of 138,722 beneficiaries were enrolled in this program in 2008, constituting 50 percent of total PhilHealth beneficiaries in that year. Under the Overseas Workers Program (OWP) which covers all land-based overseas Filipino workers whose jobs are covered by appropriate job contracts with overseas-based employers, a total of 10,938 Boholano overseas workers were covered by PhilHealth-OWP in 2008.
Government Health Facilities and Workforce At the heart of each and every health system is the workforce. In the public health systems, workers function as gatekeepers and navigators for the effective or wasteful application of all other resources such as drugs, vaccines and supplies. Although the overall provincial ratio of government health workers to population vis-à-vis standards are well within the local service planning standards, this is deceiving in terms of their spatial distribution. There are 18 municipalities which have bigger population served than others. Most of these workforce are in the Poblaciones where most of the health/medical facilities are located. An increasing demand for these government workers is noted especially of government physicians.
Table 7. Ratio of Government Workforce to Population: 2000 & 2008 Bohol Province
Provincial Status Key Health Indicators 2000 2008
Local Health Services Standards
Hospital Bed – Population Ratio Govt. Workers to Population: 1:16,857 Gov’t Doctors -
Doctors in Gov’t Hospitals Municipal Health Officers Others
74 14 52 9
1 Government Physician per 20,000 population/ 1 MHO per Municipality
Public Health Nurse to Population Ratio 1:14,063 1:17,573 1 Public Health Nurse per 20,000 population
Rural Health Midwife to Population Ratio 1:3,245 1:3,342 1 Rural Health Midwife per 5,000 population
Source: Provincial Health Office-Bohol In Bohol, there are 32 hospitals (private and government-owned), 2 municipal-run infirmaries, 7 birthing homes, 115 birthing centers within RHUs/BHS, 58 Rural Health Units/Municipal Health Centers, 383 Barangay Health Stations, 122 Drugstores and 193 Botica sa Barangay/Bayan/Helath Plus Outlets covering 17% of total barangays in Bohol. As to the access to these health/medical facilities, much still needs to be done with only 11% of barangays having birthing facilities and only 36% of the barangays in Bohol with Barangay Health Stations with some segments of the population still limited by road network and transportation access. But these figures are marked improvements since 2000. These facilities are scattered throughout the province with majority located in the capital city. While private hospitals are better equipped and better-supplied than the
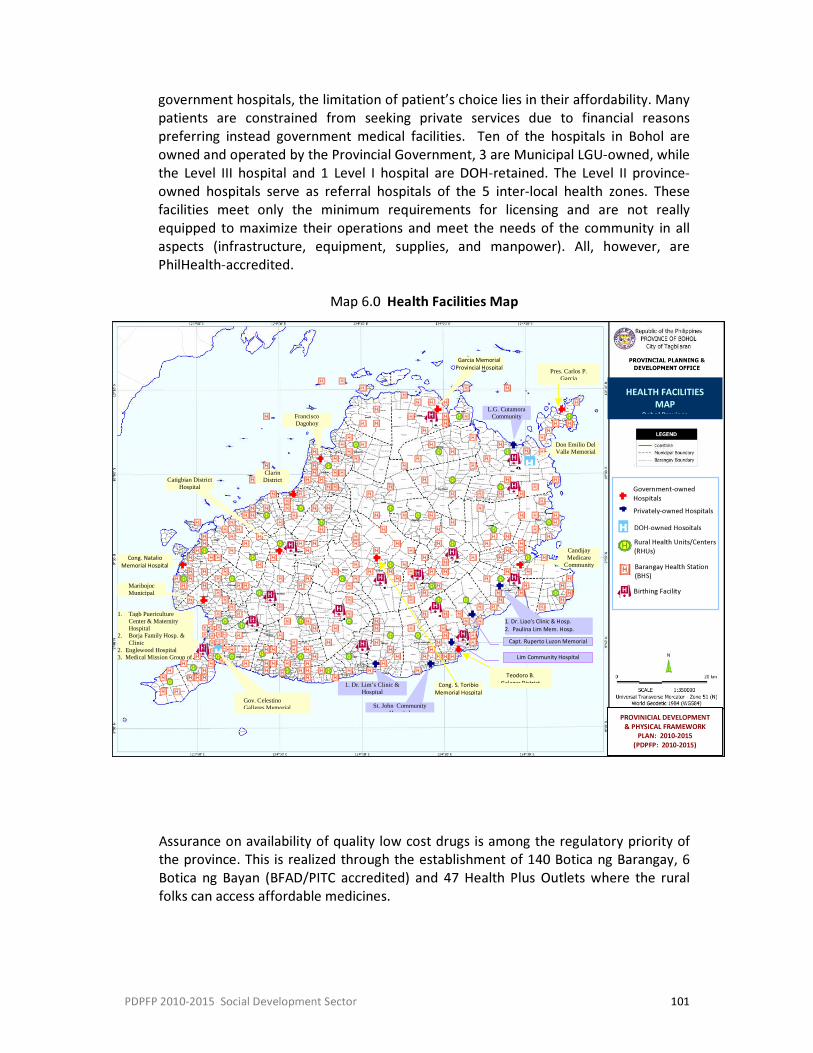
PDPFP 2010-2015 Social Development Sector 101
government hospitals, the limitation of patient’s choice lies in their affordability. Many patients are constrained from seeking private services due to financial reasons preferring instead government medical facilities. Ten of the hospitals in Bohol are owned and operated by the Provincial Government, 3 are Municipal LGU-owned, while the Level III hospital and 1 Level I hospital are DOH-retained. The Level II province-owned hospitals serve as referral hospitals of the 5 inter-local health zones. These facilities meet only the minimum requirements for licensing and are not really equipped to maximize their operations and meet the needs of the community in all aspects (infrastructure, equipment, supplies, and manpower). All, however, are PhilHealth-accredited.
Map 6.0 Health Facilities Map
Assurance on availability of quality low cost drugs is among the regulatory priority of the province. This is realized through the establishment of 140 Botica ng Barangay, 6 Botica ng Bayan (BFAD/PITC accredited) and 47 Health Plus Outlets where the rural folks can access affordable medicines.
1
1 4
1
1 1
1
1
1
7
1
9
5
1
HEALTH FACILITIES MAP
Bohol Province
Privately-owned Hospitals
Rural Health Units/Centers (RHUs)
Birthing Facility
Barangay Health Station (BHS)
PROVINICIAL DEVELOPMENT & PHYSICAL FRAMEWORK
PLAN: 2010-2015 (PDPFP: 2010-2015)
DOH-owned Hospitals H
Garcia Memorial Provincial Hospital
Gov. Celestino Galleres Memorial
Francisco Dagohoy
Clarin District
Cong. Natalio Memorial Hospital
Maribojoc Municipal
Catigbian District Hospital
1. Tagb Puericulture Center & Maternity Hospital
2. Borja Family Hosp. & Clinic
2. Englewood Hospital 3. Medical Mission Group of
Teodoro B. Galagar District Cong. S. Toribio
Memorial Hospital
1. Dr. Liao’s Clinic & Hosp. 2. Paulina Lim Mem. Hosp.
Capt. Ruperto Luzon Memorial Hospital
Don Emilio Del Valle Memorial
L.G. Cutamora Community
Candijay Medicare
Community
Lim Community Hospital
1. Dr. Lim’s Clinic & Hospital
St. John Community Hospital
Pres. Carlos P. Garcia
H
H
Government-owned Hospitals
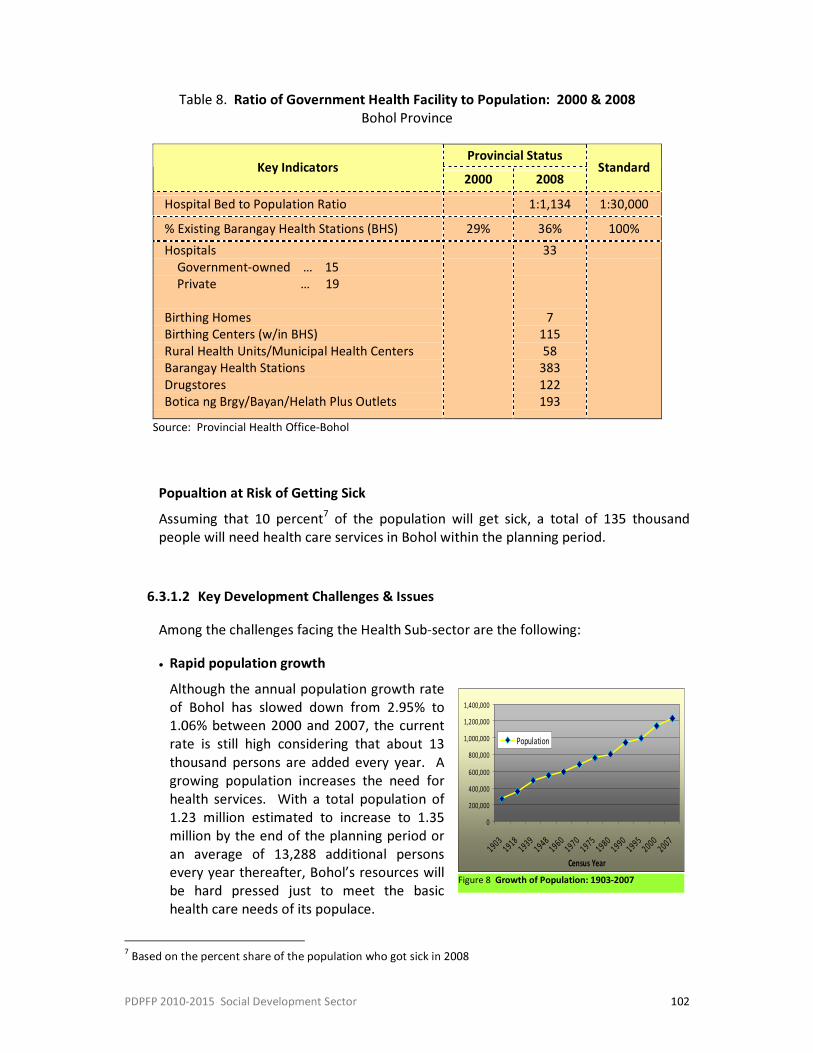
PDPFP 2010-2015 Social Development Sector 102
0200,000400,000600,000
800,0001,000,000
1,200,0001,400,000
1 9 031 9 1
81 9 3
91 9 4
81 9 6
01 9 7
01 9 7
51 9 8
01 9 9
01 9 9
52 0 0
02 0 0
7
Census Year
Population
Figure 8 Growth of Population: 1903-2007
Table 8. Ratio of Government Health Facility to Population: 2000 & 2008 Bohol Province
Provincial Status Key Indicators 2000 2008 Standard
Hospital Bed to Population Ratio 1:1,134 1:30,000 % Existing Barangay Health Stations (BHS) 29% 36% 100% Hospitals Government-owned … 15 Private … 19 Birthing Homes Birthing Centers (w/in BHS) Rural Health Units/Municipal Health Centers Barangay Health Stations Drugstores Botica ng Brgy/Bayan/Helath Plus Outlets
33
7 115 58
383 122 193
Source: Provincial Health Office-Bohol Popualtion at Risk of Getting Sick Assuming that 10 percent7 of the population will get sick, a total of 135 thousand people will need health care services in Bohol within the planning period.
6.3.1.2 Key Development Challenges & Issues Among the challenges facing the Health Sub-sector are the following: • Rapid population growth
Although the annual population growth rate of Bohol has slowed down from 2.95% to 1.06% between 2000 and 2007, the current rate is still high considering that about 13 thousand persons are added every year. A growing population increases the need for health services. With a total population of 1.23 million estimated to increase to 1.35 million by the end of the planning period or an average of 13,288 additional persons every year thereafter, Bohol’s resources will be hard pressed just to meet the basic health care needs of its populace.
7 Based on the percent share of the population who got sick in 2008
PDPFP 2010-2015 Social Development Sector 103
• Crisis in the health workforce With projected shortage of doctors, midwives, nurses and other health support workers in Bohol due to massive exit of this workforce to abroad, without massively increasing training of health workers, the growing gaps will exert even greater pressure on the outflow of health workers. • High Cost of Health Care
Although there exists a network of health care system in the province, its access, especially by the poor, is hampered mainly by high cost of health care as well as physical and socio-cultural barriers. In Bohol, many have poor health simply because they have no means of paying the often exorbitant cost of health care today. Based on the Family Income and Expenditure Survey (FIES) of the National Statistics Office (NSO), Bohol’s average family income for the year 2000 was estimated at P77.0 thousand or P6,441 monthly which can barely cover a family’s minimum basic needs. This is very much lower compared to the national average at P 144.0 thousand. According to the National Statistical Coordination Board (NSCB), the Income Index of Bohol ranked no. 66 out of 77 provinces, amongst the low income provinces in the country in 2000. Only less than 1% of a family’s income was spent on medical care.
• Poor Delivery of Health Care Services
The delivery of health care services in Bohol is affected by several factors. o Inaccessible health services
For some, inaccessible health services exist because of geographical factors. Many Boholanos are still living in remote and hard to reach areas, making access to primary health care services difficult. This has, in effect, affected the delivery of basic health services such as essential obstetric/pre-natal care services.
o Inadequate Public Health Facilities & Resources The absence of health facilities in greater part of Bohol is another issue. Out of its 1,109 barangays, only 36% of these barangays have a Barangay Health Stations (BHS) where primary health care services can be availed especially in the rural communities of the province. This could explain the fact that majority of child deliveries in Bohol in 2008 were done in the home (54%) rather than in hospitals or other health centers with only 88% of deliveries in that year performed by government doctors, nurses and midwives.8 Some of the causes of maternal deaths in Bohol may have been prevented if pre-natal care, a basic health care service, were directly and easily accessible and available in most communities in Bohol.
o Inadequate health/medical Workforce Although there are a number of health workers in Bohol, the existing health human resources in the province is unevenly distributed. Most health practitioners are located in the city, if not in urban centers or Poblaciones of
8 FHSIS Report, PHO Annual Report 2008
PDPFP 2010-2015 Social Development Sector 104
municipalities. In the Health Report of PHO for 2008, it was revealed that about 204 child deliveries in Bohol were performed by untrained “hilots”, all done in the rural communities of the province.
o Minimal hospital diagnostic equipment especially in government-owned hospitals resulting to Poor Quality of Hospital Diagnosis In areas where public hospital facilities are existing, hospital service quality is unsatisfactory especially in the Provincial Government-owned (PG) hospitals. This is primarily attributed to, among others, the lack of hospital diagnostic equipment which in turn, is ascribed mainly to the very low and sometimes non-allocation of funds for hospital equipment. In 2008, of the total budget of the Provincial Government appropriated to health, only about 1% was spent for hospital capital outlay in that year. As a result, the quality of patient diagnosis suffer, affecting the hospitals’ efficiency and effectiveness causing majority of paying Boholano patients to bypass these hospitals, preferring instead the private hospitals in Tagbilaran City or going directly to the hospitals in Cebu or Manila leaving mostly the non-paying patients (about 60%) in these hospitals. With an annual average occupancy rate of only 57.71%, the annual target revenue of P8.0 million for the year for the 10 PG hospitals altogether was not achieved.
• Still High Prevalence Of Gastro-Intestinal Illnesses (Diarheal Diseases) In Bohol
Causing Deaths Among Infants and Children The prevailing high rate of Gastro-Intestinal Illnesses particularly Diarrheal Diseases in Bohol is a result of poor quality of drinking water in majority of the areas in the province especially in its component inhabited islands/islets. Provincial health statistics reveal that about 41% of households in Bohol in 2008 have no access to potable water. The high prevalence of said diseases in the province is mainly due to contaminated (particularly from human waste matter) underground water supply, the major source of drinking water in the province. Per records obtained from the Provincial Health Office, about 17% of households in Bohol were still without sanitary toilet facilities in 2008. Despite the presence of DOH-accredited water laboratories in the province, available drinking water in Bohol is largely untreated.9 Outbreaks of diarrhea were reported by PHO in Loon in 2007 affecting 1,330 and in 2008 in Danao town with two deaths reported in those years. Gastro-intestinal illness (diarheal disease) is a leading cause of illness among infants and adults in Bohol. It is among the top 10 leading causes of death among Boholanos in 2008.
• Prevalence of Child Malnutrition Hunger and malnutrition still pose a major challenge in Bohol with quite a number of its children still found to be malnourished at varying degrees. For a province already saddled with poverty, malnutrition starts a vicious cycle of ill-health, lower learning capacity, and poor physical growth. Malnutrition is often overlooked until it becomes severe. In 2008, malnutrition continues to affect the young population of Bohol affecting 4% of newborns, 9 % of children below 6 yrs old and 18 % of school
9 At present, only one (1) of these laboratories (located at the Provincial Health Office in Tagbilaran City) is functioning
PDPFP 2010-2015 Social Development Sector 105
children. Since malnutrition affects the poor more than the rich because of factors associated with income poverty, malnutrition is thus a cause and a consequence of poverty (UNFPA).
• Rapid emergence of chronic illnesses/lifestyle diseases in the last few years Cancer and hypertension, including other diseases of the heart along with diabetes are inching its way to the top as a cause of illness or death in the province. The availability of effective vaccines and drugs to cope with these health threats imposes huge practical and moral imperatives to respond effectively.
• Inadequate medical services related to childbirth and reproductive health-related infections especially in the remote areas of Bohol. The lack of birthing facilities in the rural areas of Bohol has led to more home deliveries done by non-health personnel. In 2008, about 54 % of child births were done in the home with some deliveries performed by hilots.
• Limited distribution, accessibility and availability of low cost medicines. Assurance on the availability of quality low-cost drugs is among the regulatory priority of the province through the establishment of Botica ng Barangay and Botica ng Bayan and Health Plus Outlets. However, there are only 240 Botica ng Barangay and Botica ng Bayan established in Bohol where low cost medicines can be availed by the people. More of these outlets are needed especially in the rural areas of Bohol to make affordable medicines easier to access by the populace.
• Limited coverage and benefits of social health insurance. There are still a number of poor families most in need of such insurance who are without this benefit. In 2008, only about 276 thousand were beneficiaries of PhilHealth.
• Minimal awareness on family planning methods and women's health needs and concerns. Where there is awareness, the challenge is to meet the unmet family planning needs especially of those women who did not want anymore children or preferred to space births.
• Growing fears of new infectious threats such as H1N1, SARS and avian influenza as well as incidence of dengue, Tuberculosis, HIV/STI, Leprosy and Malaria With new flu virus strains coming out, Boholanos are now at a high risk of contamination from highly infectious diseases such as the Avian Influenza or bird flu and the H1A1 or swine flu. Although only a small number of cases were reported in 2008 for the H1A1 disease in Bohol, it remains to be at risk of disease exposure, being a prime tourist destination. Presently, Bohol remains free of malaria, filarial, SARS and Avian Influenza although the risk of contamination is high.
• Continued Incidence of Schistosomiasis Schistosomiasis (also known as bilharzia, bilharziosis or snail fever) is a parasitic disease caused by several species of fluke of the genus Schistosoma. Although it has a low mortality rate, schistosomiasis often is a chronic illness that can damage
PDPFP 2010-2015 Social Development Sector 106
internal organs and, in children, impair growth and cognitive development. Schistosomiasis is the second most socioeconomically devastating parasitic disease after malaria which may be acquired by swimming or playing in infected water. In Bohol, schistosomiasis is endemic in two (2) municipalities namely, Trinidad and Talibon municipalities. Based on records of PHO, the prevalence of said disease has decreased over the years but not yet totally eradicated. A woman died from this disease in 2007.
• Rising incidence of Rabies cases in Bohol The 6-year data on human rabies and animal bite incidence showed an increasing trend in human cases starting in year 2002 to 2007, revealing the highest death toll in Region 7. Data from the National Rabies Committee shows that Bohol ranked third in 2006 and fourth in 2007 among the provinces with the highest human rabies cases. With a dog population of 100,752 heads in 2007 in the island and with the common practice of raising dogs in the households, stray dogs, which are the common source of dog bites, are very much a part of the day to day life of Boholanos.
• Negative effects of devolution to the health care delivery system With the devolution of health services to the LGUs, the provincial and district hospitals are now under the Provincial Government while the Municipal Government manages the rural health units (RHUs) and barangay health stations (BHS). The financial burden of maintaining these facilities has brought enormous problems to the LGUs. For one, the operation and maintenance of hospital equipment and facilities are currently being minimally sustained, if at all, since it eats a huge chunk of the LGUs’ finances. With more than half of Bohol’s municipalities classified as fifth class municipalities where most of the poor lives, and, without the corresponding financial counterpart from the National Government, the maintenance of these facilities as well as the salary of health personnel/workers who are now the responsibility of LGUs, has greatly affected the LGUs’ delivery of health services to the community.
6.3.1.3 Development Plan Framework
Subsector Vision: Quality health in the hands of Boholanos by the year 2015 Overall Development Goal: Improved Public Health and Safety
Subsector Goals 1. Increased, improved and sustained investments for
health 2. Ensuring quality, affordability and access of health goods
and health care services especially to the poor 3. Reduced population growth 4. Enhanced health sector governance and performance 5. Universal access to basic and essential health care
PDPFP 2010-2015 Social Development Sector 107
Objectives: 1. To promote efficient utilization of resources for health 2. To provide the populace with adequate medical services
and affordable quality medicines and health goods 3. To lower incidence of leading mortality and morbidity
diseases 4. To decrease population growth 5. To strengthen local health systems to ensure access,
delivery and financing 6. To sustain and expand coverage on social health
insurance Strategies: 1. Mobilize municipal, provincial and national health
resources 2. Coordinate municipal, provincial and national health
spending 3. Encourage greater private sector participation and
collaboration with foreign granting institutions 4. Harness public-private partnerships and technical
assistance in the delivery of health, nutrition and population development services
5. Allow a multiplicity of family planning options consistent with widely-held religious convictions
6. Establish well-equipped hospitals, health centers (RHUs/BHS), birthing stations and other basic health facilities in the municipalities
7. Continue to strengthen Inter-local Health Zones through an enhanced and sustainable common fund financing
8. Support community-based initiatives such as establishment of more Botica ng Barangays, BFAD/PITC-accredited Botica ng Bayan and similar undertakings that increase the availability of over-the-counter low-cost quality medicines
9. Encourage greater use of generic products including its social advocacy
10. Eliminate certain diseases as public health problems 11. Promote healthy lifestyle 12. Cater to special health and nutrition 13. Pursue public health and hospital reforms 14. Improve hospital management system 15. Develop capable, motivated and supported health
workers essential for overcoming bottlenecks to achieve health goals
PDPFP 2010-2015 Social Development Sector 108
16. Campaign for Universal Health Insurance Coverage in all municipalities o Conduct massive information campaign including
guidelines for the accreditation of organized groups such as POs and cooperatives as collecting agents for expansion of reach and sustainability of health premiums.
o Encourage Municipal LGUs to increase coverage through a counter-parting scheme with the Provincial Government and private institutions
o Sustain and expand health insurance particularly for indigents through premium subsidy
o Mandate the enrolment of indigents into the sponsored program by their respective LGUs using the Municipal Poverty Database System (PDMS) in the identification of target beneficiaries
17. Expand and develop health human resource o Develop and strengthen managerial and technical
capability on public health of health workers/ program managers especially at the local level
o Support deployment programs to complement health human resource needs in underserved areas
18. Develop programs that will improve environmental sanitation
19. Align resources, harness knowledge and build robust health systems for treating and preventing diseases and promoting population health
20. Pursue public health and hospital reforms o Promote fiscal and managerial approaches to facilitate
hospital restructuring and rationalization o Strengthen health promotion and disease prevention and
control programs o Improve hospital management system
- Institutionalize a Hospital Database/Information System to include computerization of procurement and accounting system
o Implement/institutionalize an environmentally sound solid/liquid waste management system in the Provincial Hospital and in all district hospitals by 2015
o Implement the Government’s Hospital Rationalization Plan (Annex 1)
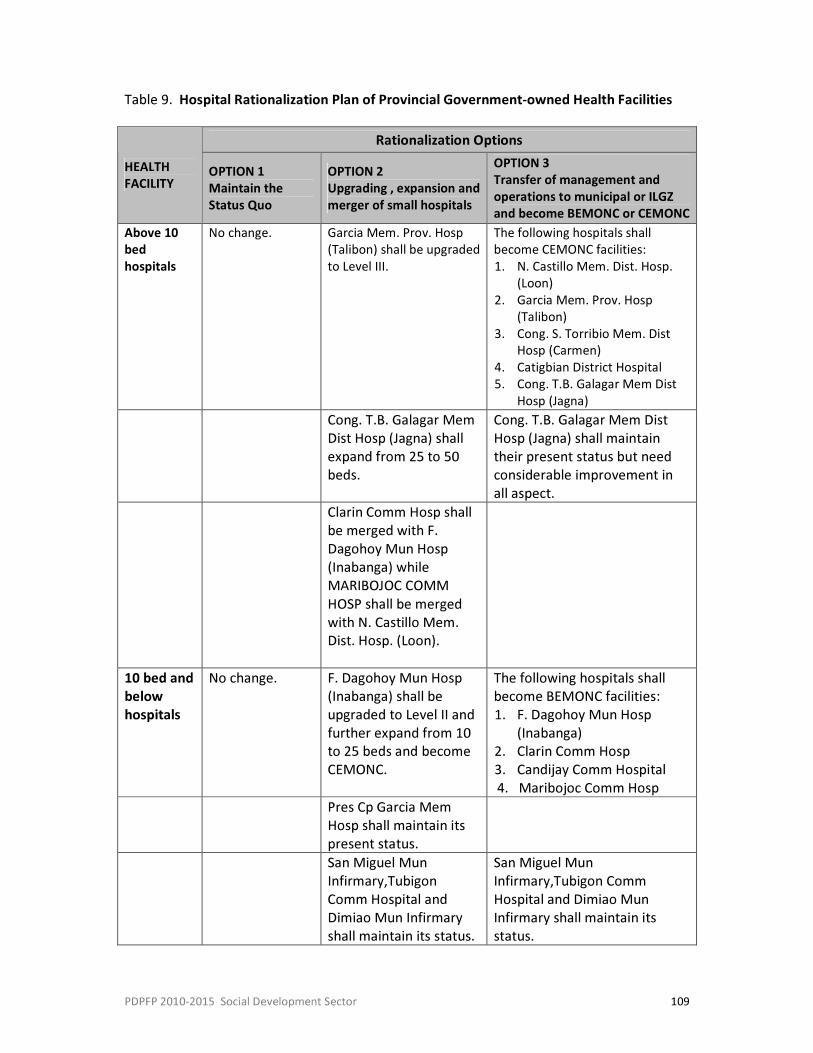
PDPFP 2010-2015 Social Development Sector 109
Table 9. Hospital Rationalization Plan of Provincial Government-owned Health Facilities
Rationalization Options HEALTH FACILITY OPTION 1
Maintain the Status Quo
OPTION 2 Upgrading , expansion and merger of small hospitals
OPTION 3 Transfer of management and operations to municipal or ILGZ and become BEMONC or CEMONC
Above 10 bed hospitals
No change. Garcia Mem. Prov. Hosp (Talibon) shall be upgraded to Level III.
The following hospitals shall become CEMONC facilities: 1. N. Castillo Mem. Dist. Hosp.
(Loon) 2. Garcia Mem. Prov. Hosp
(Talibon) 3. Cong. S. Torribio Mem. Dist
Hosp (Carmen) 4. Catigbian District Hospital 5. Cong. T.B. Galagar Mem Dist
Hosp (Jagna) Cong. T.B. Galagar Mem
Dist Hosp (Jagna) shall expand from 25 to 50 beds.
Cong. T.B. Galagar Mem Dist Hosp (Jagna) shall maintain their present status but need considerable improvement in all aspect.
Clarin Comm Hosp shall be merged with F. Dagohoy Mun Hosp (Inabanga) while MARIBOJOC COMM HOSP shall be merged with N. Castillo Mem. Dist. Hosp. (Loon).
10 bed and below hospitals
No change. F. Dagohoy Mun Hosp (Inabanga) shall be upgraded to Level II and further expand from 10 to 25 beds and become CEMONC.
The following hospitals shall become BEMONC facilities: 1. F. Dagohoy Mun Hosp
(Inabanga) 2. Clarin Comm Hosp 3. Candijay Comm Hospital 4. Maribojoc Comm Hosp
Pres Cp Garcia Mem Hosp shall maintain its present status.
San Miguel Mun Infirmary,Tubigon Comm Hospital and Dimiao Mun Infirmary shall maintain its status.
San Miguel Mun Infirmary,Tubigon Comm Hospital and Dimiao Mun Infirmary shall maintain its status.
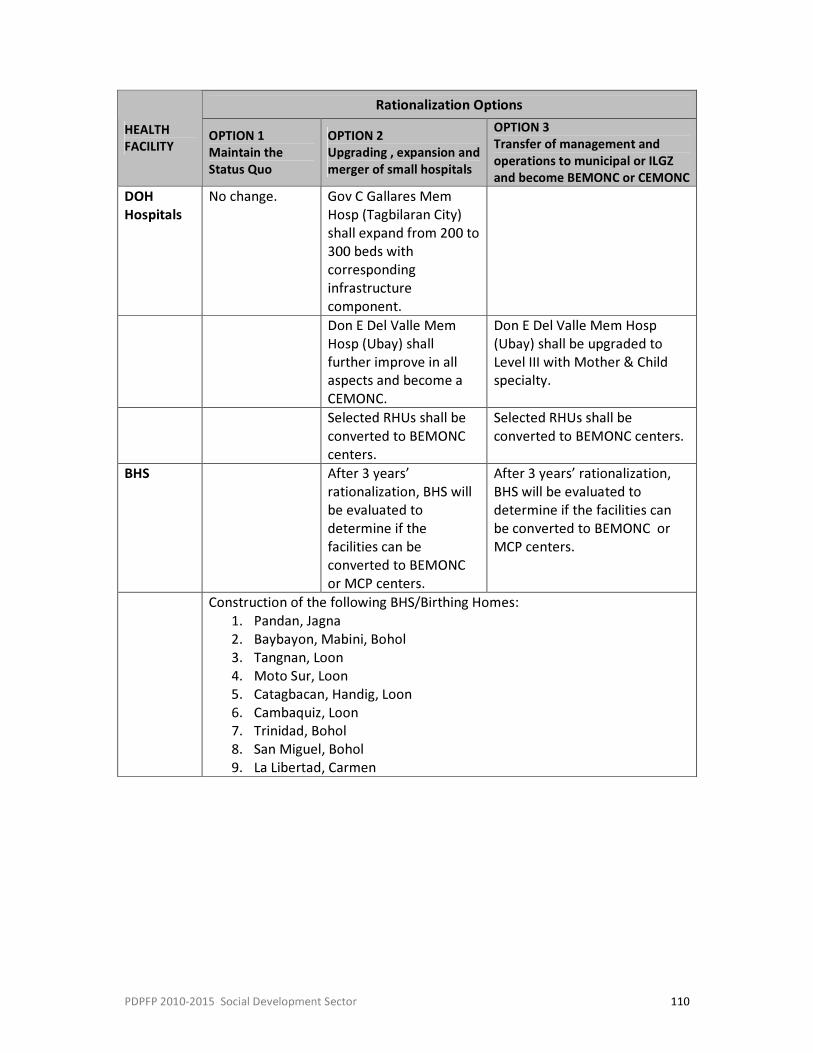
PDPFP 2010-2015 Social Development Sector 110
Rationalization Options HEALTH FACILITY OPTION 1
Maintain the Status Quo
OPTION 2 Upgrading , expansion and merger of small hospitals
OPTION 3 Transfer of management and operations to municipal or ILGZ and become BEMONC or CEMONC
DOH Hospitals
No change. Gov C Gallares Mem Hosp (Tagbilaran City) shall expand from 200 to 300 beds with corresponding infrastructure component.
Don E Del Valle Mem Hosp (Ubay) shall further improve in all aspects and become a CEMONC.
Don E Del Valle Mem Hosp (Ubay) shall be upgraded to Level III with Mother & Child specialty.
Selected RHUs shall be converted to BEMONC centers.
Selected RHUs shall be converted to BEMONC centers.
BHS After 3 years’ rationalization, BHS will be evaluated to determine if the facilities can be converted to BEMONC or MCP centers.
After 3 years’ rationalization, BHS will be evaluated to determine if the facilities can be converted to BEMONC or MCP centers.
Construction of the following BHS/Birthing Homes: 1. Pandan, Jagna 2. Baybayon, Mabini, Bohol 3. Tangnan, Loon 4. Moto Sur, Loon 5. Catagbacan, Handig, Loon 6. Cambaquiz, Loon 7. Trinidad, Bohol 8. San Miguel, Bohol 9. La Libertad, Carmen
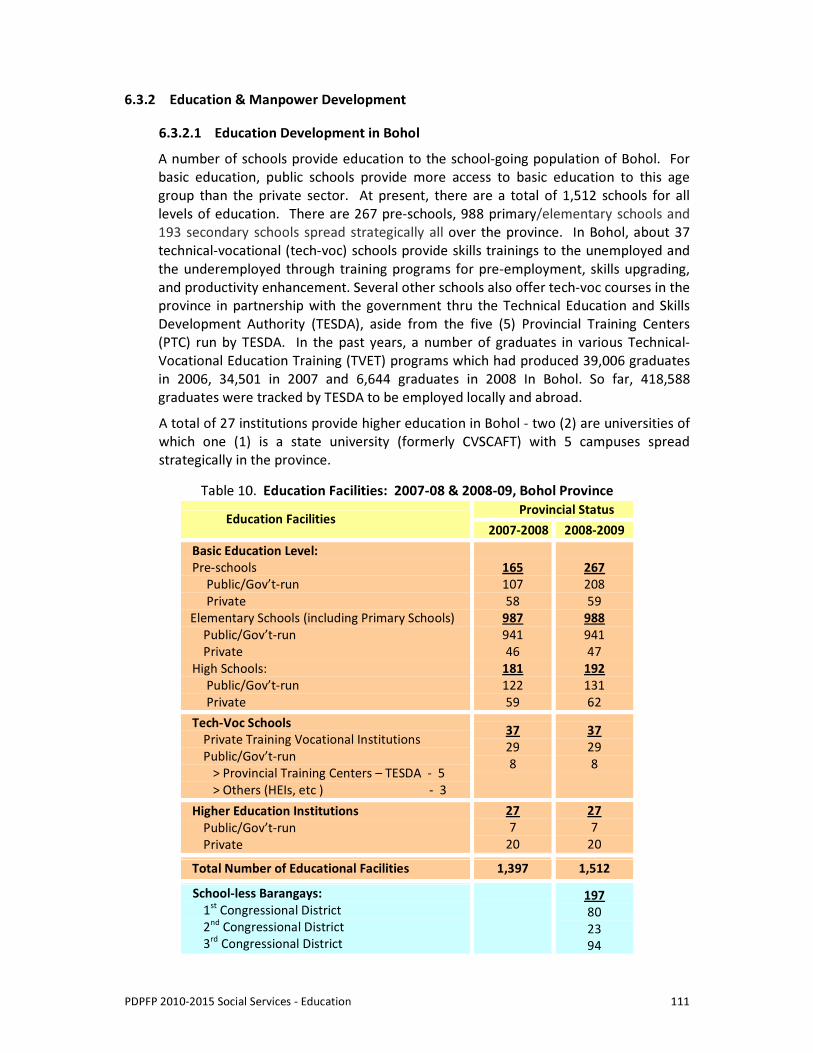
PDPFP 2010-2015 Social Services - Education 111
6.3.2 Education & Manpower Development 6.3.2.1 Education Development in Bohol A number of schools provide education to the school-going population of Bohol. For basic education, public schools provide more access to basic education to this age group than the private sector. At present, there are a total of 1,512 schools for all levels of education. There are 267 pre-schools, 988 primary/elementary schools and 193 secondary schools spread strategically all over the province. In Bohol, about 37 technical-vocational (tech-voc) schools provide skills trainings to the unemployed and the underemployed through training programs for pre-employment, skills upgrading, and productivity enhancement. Several other schools also offer tech-voc courses in the province in partnership with the government thru the Technical Education and Skills Development Authority (TESDA), aside from the five (5) Provincial Training Centers (PTC) run by TESDA. In the past years, a number of graduates in various Technical- Vocational Education Training (TVET) programs which had produced 39,006 graduates in 2006, 34,501 in 2007 and 6,644 graduates in 2008 In Bohol. So far, 418,588 graduates were tracked by TESDA to be employed locally and abroad. A total of 27 institutions provide higher education in Bohol - two (2) are universities of which one (1) is a state university (formerly CVSCAFT) with 5 campuses spread strategically in the province.
Table 10. Education Facilities: 2007-08 & 2008-09, Bohol Province Provincial Status Education Facilities 2007-2008 2008-2009
Basic Education Level: Pre-schools
Public/Gov’t-run Private
Elementary Schools (including Primary Schools) Public/Gov’t-run Private
High Schools: Public/Gov’t-run Private
165 107 58
987 941 46
181 122 59
267 208 59
988 941 47
192 131 62
Tech-Voc Schools Private Training Vocational Institutions Public/Gov’t-run > Provincial Training Centers – TESDA - 5 > Others (HEIs, etc ) - 3
37 29 8
37 29 8
Higher Education Institutions Public/Gov’t-run Private
27 7
20
27 7
20 Total Number of Educational Facilities 1,397 1,512 School-less Barangays:
1st Congressional District 2nd Congressional District 3rd Congressional District
197 80 23 94
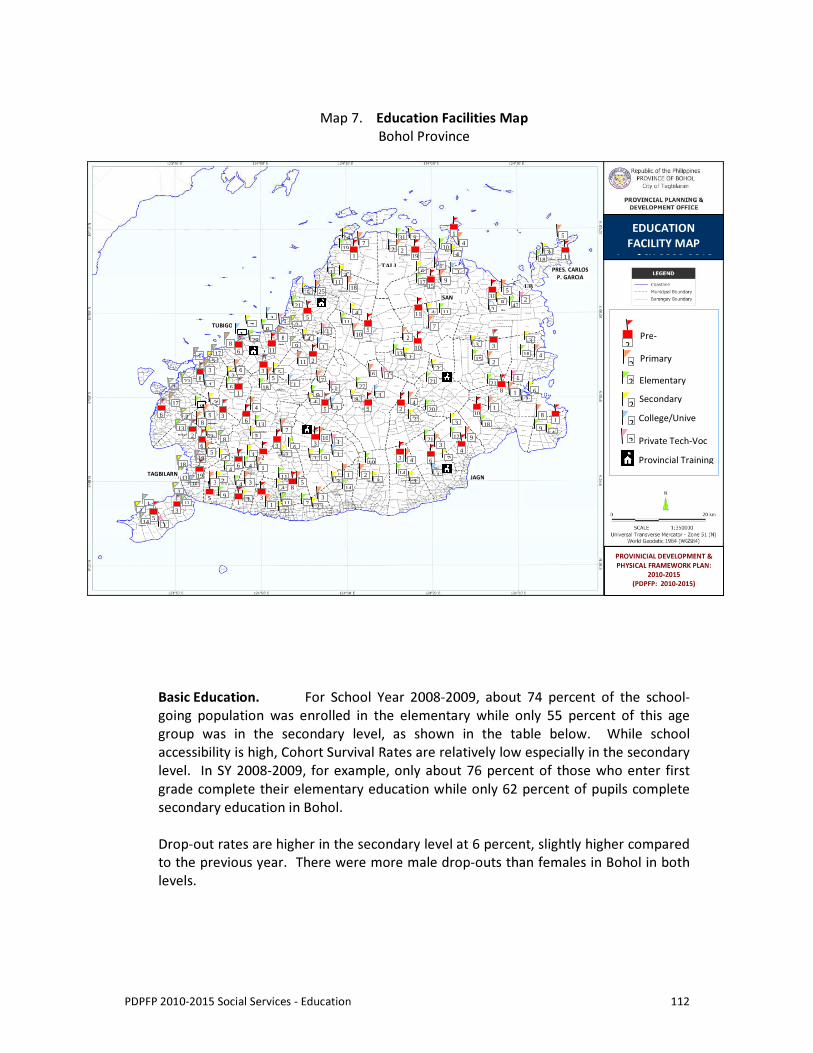
PDPFP 2010-2015 Social Services - Education 112
Map 7. Education Facilities Map
Bohol Province
Basic Education. For School Year 2008-2009, about 74 percent of the school-going population was enrolled in the elementary while only 55 percent of this age group was in the secondary level, as shown in the table below. While school accessibility is high, Cohort Survival Rates are relatively low especially in the secondary level. In SY 2008-2009, for example, only about 76 percent of those who enter first grade complete their elementary education while only 62 percent of pupils complete secondary education in Bohol. Drop-out rates are higher in the secondary level at 6 percent, slightly higher compared to the previous year. There were more male drop-outs than females in Bohol in both levels.
EDUCATION FACILITY MAP
As of SY 2009-2010
PROVINICIAL DEVELOPMENT & PHYSICAL FRAMEWORK PLAN:
2010-2015 (PDPFP: 2010-2015)
Elementary 2Secondary 2College/Unive2Private Tech-Voc 2Provincial Training
2 Primary School
Pre-2
21
9
8
18
5
6
1 1
1
1
4
4
6
11
7
14 9
11
9
33
12
14
8
4
13
19 14
21
20
27
12
13
28
6
17
11
18
9
9
19
21
17 11
23
31
13
10
15
18
11 47
18
21
9
18
4
1
3
9
3
3
2
6
2 3
7
3
4
8
3
5
4
4
2
5
2 7
5
4
4 9
4
6
3
4
3 1
2
3
2
1
3
1
4
1
2 2
3
7
3
3
3
7
3
9 8
5
4
4
10
8
2
3
1
1
2
6
5
19
3
5 3 6
1
6
5
1
3
18
6 5 8
3
4
1 8
2 10
9
3
10
5 2 10
1
3 4
6
9 3
4
2
1
25
7
3 1
3
8 5
17
8
5
1
11 2
1
6
11
7
7
3
4
2
1
2 19
9 15
8 6
5 31 2
1
2
1
1
1
1
1
1 1
2
1
1
1
1
1
1
1
1
1
2
11
TUBIGO
TALI PRES. CARLOS P. GARCIA
SAN
UB
19
TAGBILARN JAGN10
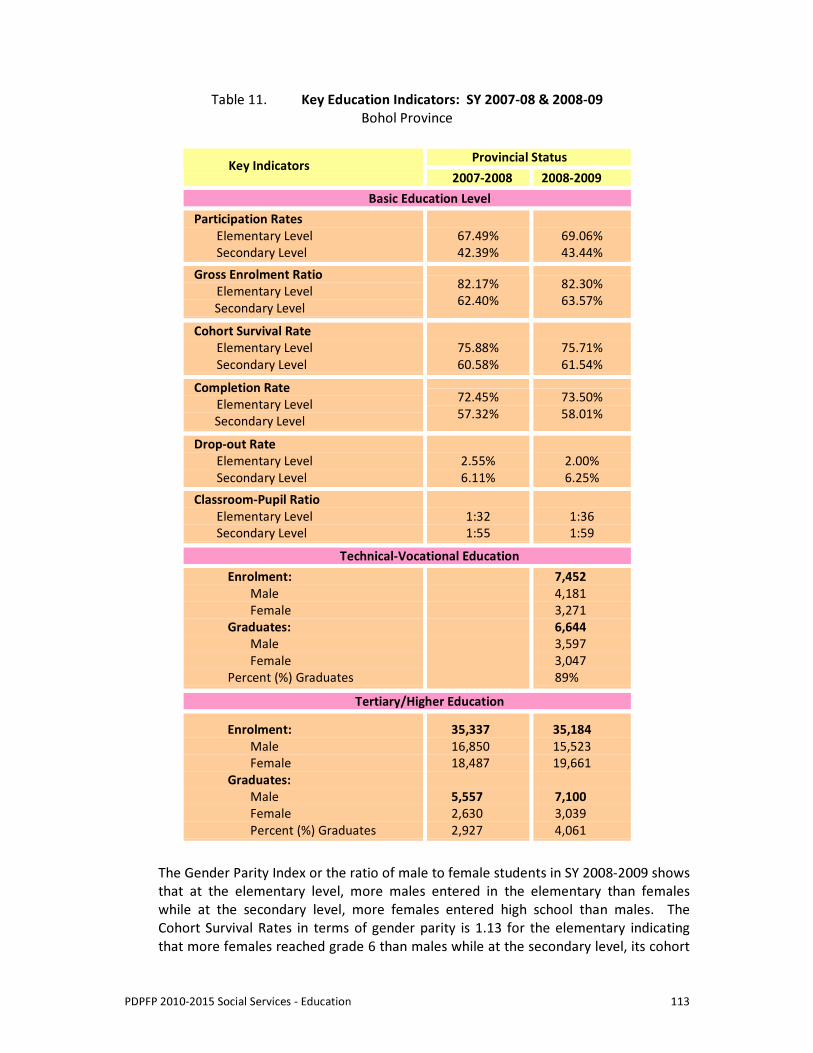
PDPFP 2010-2015 Social Services - Education 113
Table 11. Key Education Indicators: SY 2007-08 & 2008-09 Bohol Province
Provincial Status Key Indicators 2007-2008 2008-2009
Basic Education Level Participation Rates
Elementary Level Secondary Level
67.49% 42.39%
69.06% 43.44%
Gross Enrolment Ratio Elementary Level Secondary Level
82.17% 62.40%
82.30% 63.57%
Cohort Survival Rate Elementary Level Secondary Level
75.88% 60.58%
75.71% 61.54%
Completion Rate Elementary Level Secondary Level
72.45% 57.32%
73.50% 58.01%
Drop-out Rate Elementary Level Secondary Level
2.55% 6.11%
2.00% 6.25%
Classroom-Pupil Ratio Elementary Level Secondary Level
1:32 1:55
1:36 1:59
Technical-Vocational Education Enrolment:
Male Female
Graduates: Male Female
Percent (%) Graduates
7,452 4,181 3,271 6,644 3,597 3,047 89%
Tertiary/Higher Education Enrolment:
Male Female
Graduates: Male Female Percent (%) Graduates
35,337 16,850 18,487 5,557 2,630 2,927
35,184 15,523 19,661 7,100 3,039 4,061
The Gender Parity Index or the ratio of male to female students in SY 2008-2009 shows that at the elementary level, more males entered in the elementary than females while at the secondary level, more females entered high school than males. The Cohort Survival Rates in terms of gender parity is 1.13 for the elementary indicating that more females reached grade 6 than males while at the secondary level, its cohort
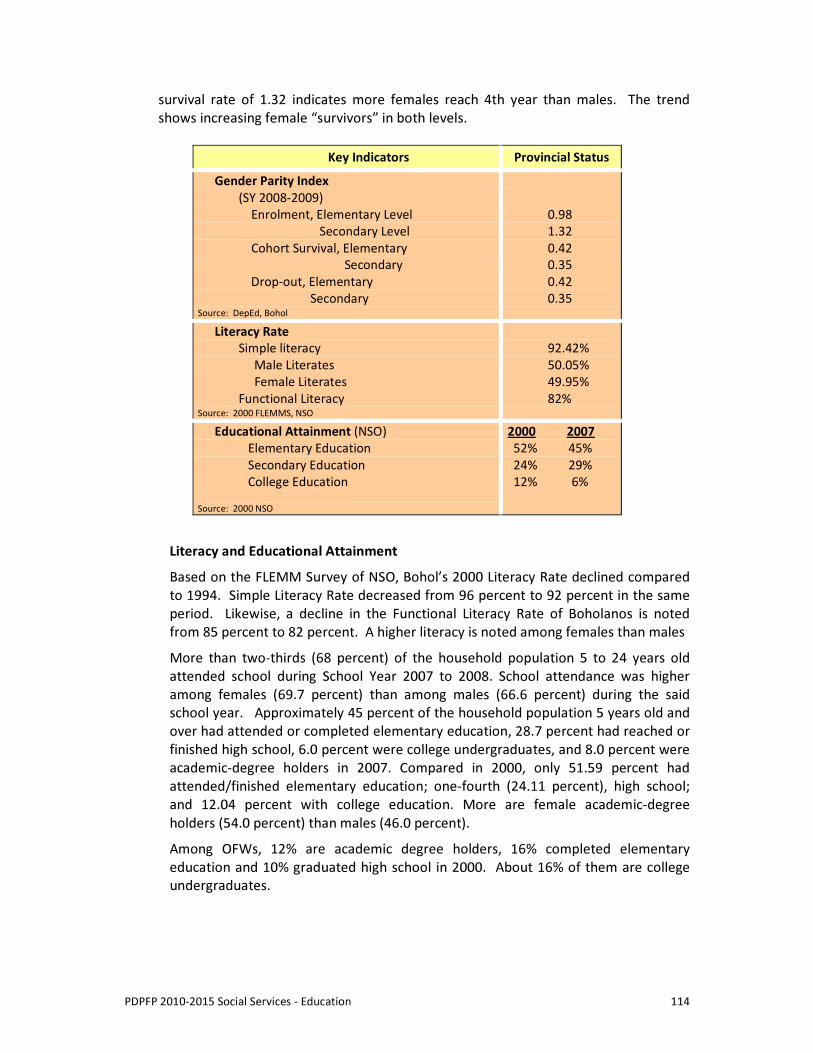
PDPFP 2010-2015 Social Services - Education 114
survival rate of 1.32 indicates more females reach 4th year than males. The trend shows increasing female “survivors” in both levels.
Key Indicators Provincial Status
Gender Parity Index (SY 2008-2009) Enrolment, Elementary Level Secondary Level Cohort Survival, Elementary Secondary Drop-out, Elementary Secondary
Source: DepEd, Bohol
0.98 1.32 0.42 0.35 0.42 0.35
Literacy Rate Simple literacy Male Literates Female Literates Functional Literacy
Source: 2000 FLEMMS, NSO
92.42% 50.05% 49.95% 82%
Educational Attainment (NSO) Elementary Education Secondary Education College Education
Source: 2000 NSO
2000 2007 52% 45% 24% 29% 12% 6%
Literacy and Educational Attainment Based on the FLEMM Survey of NSO, Bohol’s 2000 Literacy Rate declined compared to 1994. Simple Literacy Rate decreased from 96 percent to 92 percent in the same period. Likewise, a decline in the Functional Literacy Rate of Boholanos is noted from 85 percent to 82 percent. A higher literacy is noted among females than males More than two-thirds (68 percent) of the household population 5 to 24 years old attended school during School Year 2007 to 2008. School attendance was higher among females (69.7 percent) than among males (66.6 percent) during the said school year. Approximately 45 percent of the household population 5 years old and over had attended or completed elementary education, 28.7 percent had reached or finished high school, 6.0 percent were college undergraduates, and 8.0 percent were academic-degree holders in 2007. Compared in 2000, only 51.59 percent had attended/finished elementary education; one-fourth (24.11 percent), high school; and 12.04 percent with college education. More are female academic-degree holders (54.0 percent) than males (46.0 percent). Among OFWs, 12% are academic degree holders, 16% completed elementary education and 10% graduated high school in 2000. About 16% of them are college undergraduates.
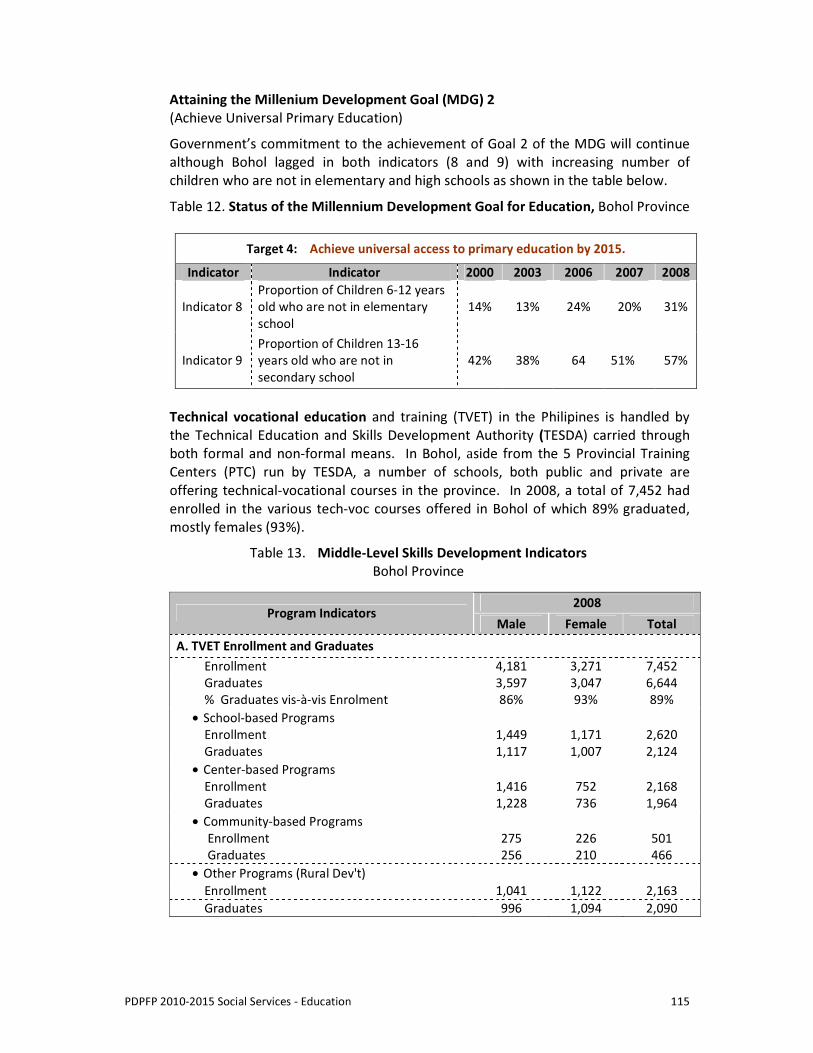
PDPFP 2010-2015 Social Services - Education 115
Attaining the Millenium Development Goal (MDG) 2 (Achieve Universal Primary Education) Government’s commitment to the achievement of Goal 2 of the MDG will continue although Bohol lagged in both indicators (8 and 9) with increasing number of children who are not in elementary and high schools as shown in the table below.
Table 12. Status of the Millennium Development Goal for Education, Bohol Province
Target 4: Achieve universal access to primary education by 2015. Indicator Indicator 2000 2003 2006 2007 2008
Indicator 8 Proportion of Children 6-12 years old who are not in elementary school
14% 13% 24% 20% 31%
Indicator 9 Proportion of Children 13-16 years old who are not in secondary school
42% 38% 64 51% 57%
Technical vocational education and training (TVET) in the Philipines is handled by the Technical Education and Skills Development Authority (TESDA) carried through both formal and non-formal means. In Bohol, aside from the 5 Provincial Training Centers (PTC) run by TESDA, a number of schools, both public and private are offering technical-vocational courses in the province. In 2008, a total of 7,452 had enrolled in the various tech-voc courses offered in Bohol of which 89% graduated, mostly females (93%).
Table 13. Middle-Level Skills Development Indicators Bohol Province
2008 Program Indicators Male Female Total
A. TVET Enrollment and Graduates Enrollment 4,181 3,271 7,452 Graduates 3,597 3,047 6,644 % Graduates vis-à-vis Enrolment 86% 93% 89% • School-based Programs
Enrollment 1,449 1,171 2,620 Graduates 1,117 1,007 2,124 • Center-based Programs
Enrollment 1,416 752 2,168 Graduates 1,228 736 1,964 • Community-based Programs
Enrollment 275 226 501 Graduates 256 210 466 • Other Programs (Rural Dev't)
Enrollment 1,041 1,122 2,163 Graduates 996 1,094 2,090
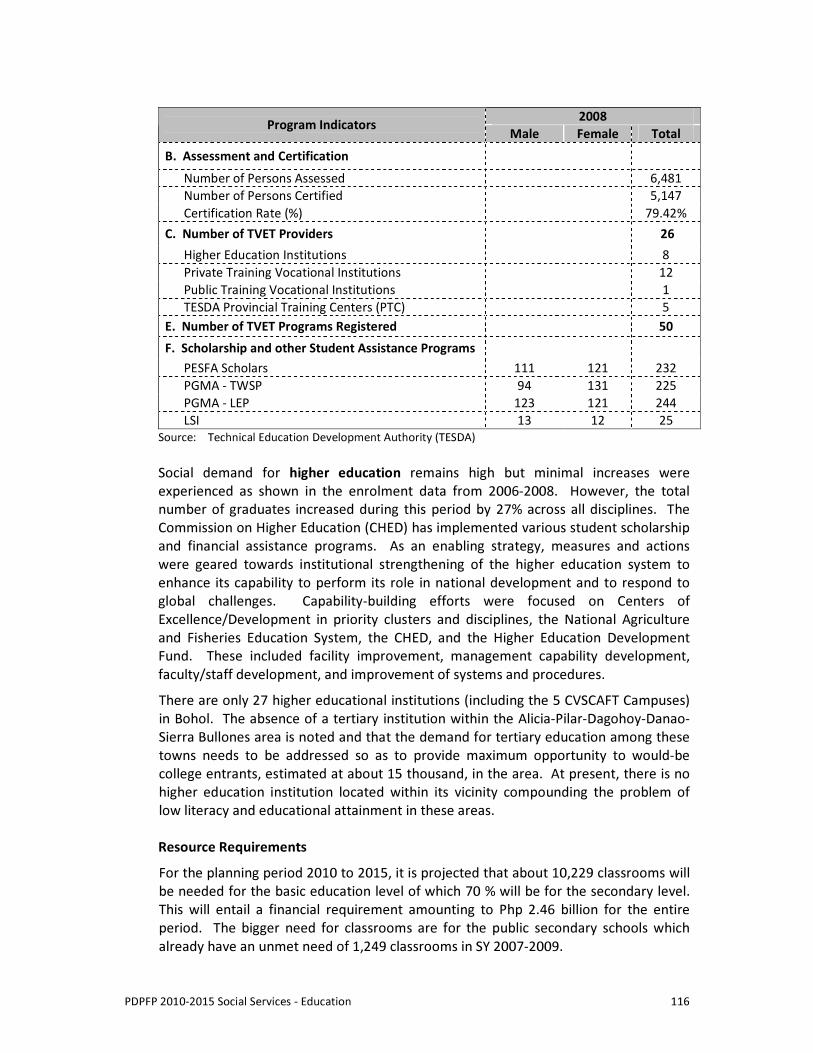
PDPFP 2010-2015 Social Services - Education 116
2008 Program Indicators Male Female Total
B. Assessment and Certification Number of Persons Assessed 6,481 Number of Persons Certified 5,147 Certification Rate (%) 79.42% C. Number of TVET Providers 26 Higher Education Institutions 8 Private Training Vocational Institutions 12 Public Training Vocational Institutions 1 TESDA Provincial Training Centers (PTC) 5 E. Number of TVET Programs Registered 50 F. Scholarship and other Student Assistance Programs PESFA Scholars 111 121 232 PGMA - TWSP 94 131 225 PGMA - LEP 123 121 244 LSI 13 12 25
Source: Technical Education Development Authority (TESDA) Social demand for higher education remains high but minimal increases were experienced as shown in the enrolment data from 2006-2008. However, the total number of graduates increased during this period by 27% across all disciplines. The Commission on Higher Education (CHED) has implemented various student scholarship and financial assistance programs. As an enabling strategy, measures and actions were geared towards institutional strengthening of the higher education system to enhance its capability to perform its role in national development and to respond to global challenges. Capability-building efforts were focused on Centers of Excellence/Development in priority clusters and disciplines, the National Agriculture and Fisheries Education System, the CHED, and the Higher Education Development Fund. These included facility improvement, management capability development, faculty/staff development, and improvement of systems and procedures. There are only 27 higher educational institutions (including the 5 CVSCAFT Campuses) in Bohol. The absence of a tertiary institution within the Alicia-Pilar-Dagohoy-Danao-Sierra Bullones area is noted and that the demand for tertiary education among these towns needs to be addressed so as to provide maximum opportunity to would-be college entrants, estimated at about 15 thousand, in the area. At present, there is no higher education institution located within its vicinity compounding the problem of low literacy and educational attainment in these areas.
Resource Requirements For the planning period 2010 to 2015, it is projected that about 10,229 classrooms will be needed for the basic education level of which 70 % will be for the secondary level. This will entail a financial requirement amounting to Php 2.46 billion for the entire period. The bigger need for classrooms are for the public secondary schools which already have an unmet need of 1,249 classrooms in SY 2007-2009.
PDPFP 2010-2015 Social Services - Education 117
For this, the province needs to provide a total of 102 hectares to meet the minimum land requirement of DepEd for the projected number of classrooms. This excludes the area requirement for the proposed tertiary institution in the Pilar-Dagohoy-Sierra Bullones area. 6.3.2.2 Key Development Challenges and Issues
The key issues and concerns of the sub-sector are the following:
• Mismatch between educational output and needs resulting to unemployment of majority of graduates
• Limited access to college education especially by the poor due to high cost of college education
• High incidence of drop-out rates especially at the secondary level • Low Cohort Survival Rate resulting to minimal number of graduates in all levels of
education • Low Participation Rates in all levels of education • Low functional literacy • Low pupil performance/poor competencies especially in Math, Science and
English especially in public schools in basic education level • Poor teacher quality/ quality of instruction • Overcrowding in classrooms of some schools especially in the public high schools
and in most public elementary schools
The following are the specific issues and challenges by level of education: Basic Education
o Increasing number of school-going age population
Despite many policy and program reforms and huge investments in the basic education sector in the past years, this sector still faces the challenge of having more than a number of school-aged children who are not in school and are still functionally illiterate. About 21% of children 6-12 years old were not in elementary schools in SY 2008-09 while 51% of children 13-16 years old were not in secondary schools in that same year.
o Poor quality of education especially in public schools
The quality of current education is shown by dismal results of pupils in the National Achievement Test (NAT) especially in public elementary (63%) and secondary (50%) levels and the National Readiness Test for Grade 1 Entrants (0.79%). Such dismal results showed poor competencies of students in math, science and English.
PDPFP 2010-2015 Social Services - Education 118
Results of the Philippine Informal Reading Inventory Test to assess the pupils reading ability showed that only 27% of elementary pupils tested can read by themselves, 36% pupils at instructional level and 37% are either at frustration/non-readers levels. The quality of learning and acquisition of human values and skills fall far short of the aspirations and needs of individuals and society. This failure may be attributed in part to the following:
a. Weak political will to pursue and sustain reforms at different levels;
b. Insufficient financial resources and inefficient use of available ones creating resource gaps. Schools are faced with the perennial problem of inadequate number of classrooms and other facilities as a result of increased enrolment;
c. Inadequate attention to the learning needs particularly of the poor or disadvantaged
d. Lack of attention to the quality of learning resulting to poor test results especially of students from the public schools in the NAT/NRT and other diagnostic tests
e. Teacher qualifications remain an issue, especially at the secondary education level wherein a majority of public secondary teachers teaching math, science, chemistry and physics are not majors in these subjects
Technical/Vocational Education
o Absence of direct link between TVET and higher education. A ladderized interface between TVET courses and college degrees should be in place to cater to the varying needs of students and promote upward academic mobility. With ladderized education in place, an individual can acquire vocational skills and training, get a job and proceed to college while working with college credits for subjects/ competencies acquired in TVET.
o Need for measuring the aptitudes of the youths to guide high school graduates on what college or TVET course to pursue after graduation so that students will not end up enrolling in courses that do not fit their aptitudes, leading to dropping out or shifting of course, both of which are wasteful. This will map out the capabilities and competencies of the students that will be useful in career guidance, in determining what career to pursue after high school.
o Existence of labor market demand-supply mismatches. Another major challenge is the problem on skills demand-supply mismatches. The main challenge of this sector is to match local labor skills with available labor demand. A large number of trained graduates are left unemployed or underemployed because they do not fit the requirements of the job market. It is quite ironic that a number of job vacancies could not be filled up because the available manpower supply would not fit the job.
PDPFP 2010-2015 Social Services - Education 119
o Need for more responsive TVET investments in middle-level skills development. This has remained too focused on direct training provision by national government, which delayed the long-intended devolution to LGUs and private sector. To optimize the use of public investments, there is a need to realign TVET programs to focus only on programs with high market absorption rate.
Tertiary/Higher Education o Need to improve access to and success in higher education, along with the
need to improve the quality of graduates in preparation for future work. The current average passing rate in board examinations suggests poor readiness of a large number of college graduates to take on professional and high-skilled jobs.
o Mismatch between what the industries need and the lack of skills and competencies by the graduates especially in the area of communication, a skill needed in the business processing and outsourcing (BPO) industry.
o Need for more financial assistance for poor and deserving students o Cost inefficiencies due to duplication of program offerings in its state
university campuses.
6.3.2.3 Development Plan Framework Sub-sector Vision: God-fearing, well-educated, adaptive, ingenious and technically skilled Boholanos who would meet and match Bohol’s bid for progressive, industrialized and sustainable development with positive work values of world class competence. Sub-sector Goals:
1. Improved educational system of all public schools 2. Enhanced quality and access to education 3. Achieved higher functional literacy of all Boholanos 4. Produced a pool of qualified and globally competent workforce who are job
ready Objectives: 1. To improve quality basic education with the provision of equitable,
quality and relevant education Strategies:
o Increase Participation Rate to 98% (elementary level) and 87.74% (secondary level), bringing in children/youth who are not in school
PDPFP 2010-2015 Social Services - Education 120
o Improve the Cohort-Survival Rate of learners to 98.72% for the elementary level and 87.69% for the secondary level
o Raise proficiency level by 80% of those in school
o Raise school academic Achievement Rate to 80% for both levels
o Expand and improve comprehensive early childhood care and education, especially for the most vulnerable and disadvantaged children;
o Ensure that by 2015 all children, particularly girls, children in difficult circumstances and those belonging to ethnic/cultural communities have access to complete and primary education;
o Ensure that the learning needs of all young people and adults are met through equitable access to appropriate learning and life skills programmes;
o Achieve a 50% improvement in levels of adult literacy by 2015, especially for women, and equitable access to basic and continuing education for all adults;
o Eliminate gender disparities in primary and secondary education by 2005, and achieve gender equality in education by 2015, with a focus on ensuring girls full and equal access to and achievement in basic education; and
o Improve every aspect of the quality of education, and ensure their excellence so that recognized and measurable learning outcomes are achieved by all, especially in literacy, numeracy, and essential life skills.
2. To improve Management of Educational Services in the Formal and
Alternative Learning System
3. To promote and strengthen quality technical education and skills development programs to attain global competitiveness.
o Conduct advocacy and Career Guidance Program to all graduating secondary school students
o Register and accredited all technical vocational programs o Full implementation of community-Based Trainings for
Enterprise Development (CBTED) in all municipalities o Realign skills training of out-of-school youths/adults to the
specific requirements of the private sector, local entrepreneurs, craftsmen and food producers in Bohol
o To provide scholarship program to deserving individuals a. 60% of Tech-Voc graduate scholars will be employed
within 6 months after the end of training period
PDPFP 2010-2015 Social Services - Education 121
b. develop skills and competencies of the unemployed and the underemployed through training programs for pre-employment, skills upgrading, and productivity enhancement
c. empower public and private Tek-Bok Providers in expanding their absorptive capacities and to enable them to offer programs for various qualifications including higher levels of technology where jobs are available in the labor market
o To intensify the implementation of competency assessment to all tech-voc graduates and workers a. 75% of all assessed workers will be certified in their
respective trade areas/qualifications o To monitor and trace tech-voc graduates who are already
employed a. 60% of all tech-voc graduates will be employed either self
or wage employed o To attract more Tek-Bok Providers to register programs under
UTPRAS a. Continuous registration of Tek-Bok Providers to register
programs under UTPRAS of TESDA especially TVET qualifications under the scholarship menu
o To intensify the implementation of massive training and retraining under school-based, center-based, enterprise-based and community-based a. Continue producing more tech-voc graduates
5. To achieve quality, access and excellence in higher education in the undergraduate and graduate education and in the broad range of disciplines relevant and responsive to a dynamically changing domestic and international environment o To update comparable standards in priority programs o To increase number of faculty with MA/MS degrees o To increase the number of accredited programs o To improve performance in licensure examination in priority areas o To increase in the number of intake and graduates in priority fields o To reduce dropout of lower income groups o To increase significantly the number of beneficiaries of
scholarships and other forms of student financial assistance
PDPFP 2010-2015 Social Services - Education 122
Strategies: 1. Improve learning facilities and environment 2. Upgrade teacher qualifications and competencies 3. Strengthen community participation in school movements and
activities 4. Appreciation of local culture and national heritage, i.e., continue to
promote school-based cultural groups, inputs to school curriculum of local culture, etc.
5. Advocate for more investments for education 6. Improve curriculum with emphasis on Math, Science, technology,
reading and writing 7. Upgrade physical facilities to accommodate more students 8. Increase advocacy programs 9. Sustain and strengthen monitoring on existing technical-vocational
programs in the province o Enhance capability of partners o Trainers training/skills upgrading o Supervisory training
10. Promote Ladderized Education Program 11. Provide scholarships/financial assistance to disadvantaged sectors 12. Promote distance learning 13. Introduce the pre-baccalaureate program as a remedial scheme 14. Develop centers of excellence which will have links with industry
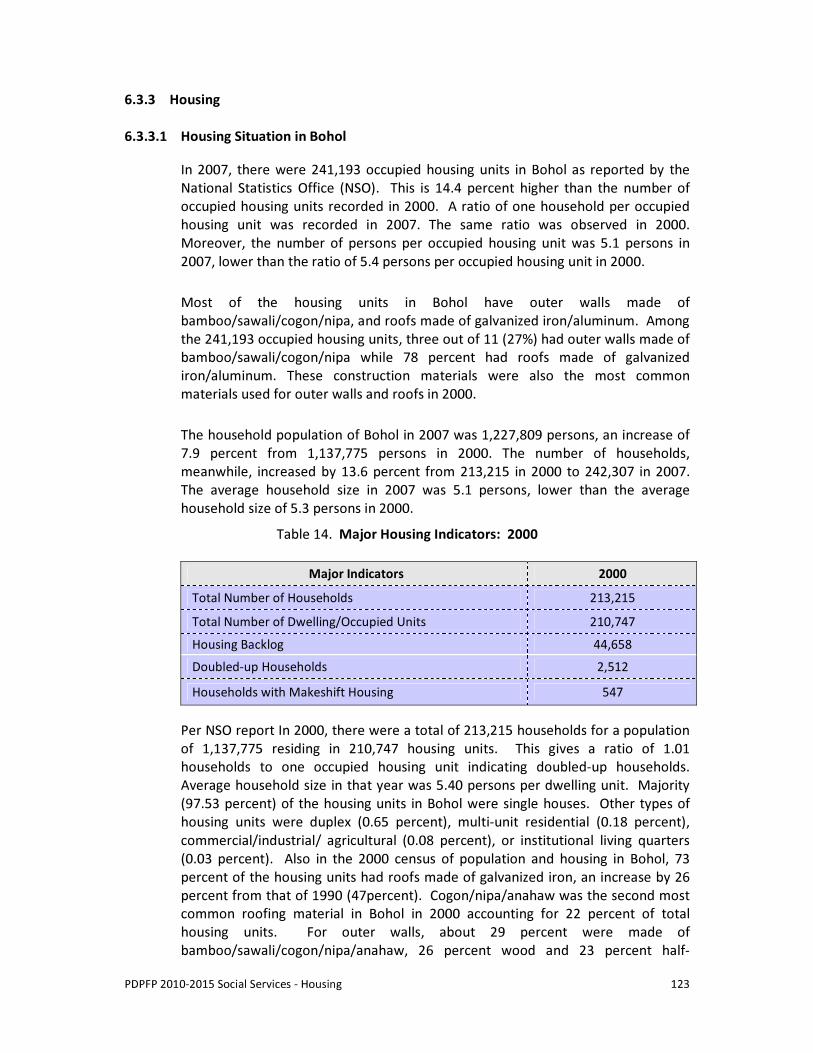
PDPFP 2010-2015 Social Services - Housing
123
6.3.3 Housing 6.3.3.1 Housing Situation in Bohol
In 2007, there were 241,193 occupied housing units in Bohol as reported by the National Statistics Office (NSO). This is 14.4 percent higher than the number of occupied housing units recorded in 2000. A ratio of one household per occupied housing unit was recorded in 2007. The same ratio was observed in 2000. Moreover, the number of persons per occupied housing unit was 5.1 persons in 2007, lower than the ratio of 5.4 persons per occupied housing unit in 2000.
Most of the housing units in Bohol have outer walls made of bamboo/sawali/cogon/nipa, and roofs made of galvanized iron/aluminum. Among the 241,193 occupied housing units, three out of 11 (27%) had outer walls made of bamboo/sawali/cogon/nipa while 78 percent had roofs made of galvanized iron/aluminum. These construction materials were also the most common materials used for outer walls and roofs in 2000.
The household population of Bohol in 2007 was 1,227,809 persons, an increase of 7.9 percent from 1,137,775 persons in 2000. The number of households, meanwhile, increased by 13.6 percent from 213,215 in 2000 to 242,307 in 2007. The average household size in 2007 was 5.1 persons, lower than the average household size of 5.3 persons in 2000.
Table 14. Major Housing Indicators: 2000
Major Indicators 2000 Total Number of Households 213,215 Total Number of Dwelling/Occupied Units 210,747 Housing Backlog 44,658 Doubled-up Households 2,512 Households with Makeshift Housing 547
Per NSO report In 2000, there were a total of 213,215 households for a population of 1,137,775 residing in 210,747 housing units. This gives a ratio of 1.01 households to one occupied housing unit indicating doubled-up households. Average household size in that year was 5.40 persons per dwelling unit. Majority (97.53 percent) of the housing units in Bohol were single houses. Other types of housing units were duplex (0.65 percent), multi-unit residential (0.18 percent), commercial/industrial/ agricultural (0.08 percent), or institutional living quarters (0.03 percent). Also in the 2000 census of population and housing in Bohol, 73 percent of the housing units had roofs made of galvanized iron, an increase by 26 percent from that of 1990 (47percent). Cogon/nipa/anahaw was the second most common roofing material in Bohol in 2000 accounting for 22 percent of total housing units. For outer walls, about 29 percent were made of bamboo/sawali/cogon/nipa/anahaw, 26 percent wood and 23 percent half-
PDPFP 2010-2015 Social Services - Housing
124
concrete/brick/stone and half wood. The highest proportion of occupied housing units (21 percent) had a combination of galvanized iron/aluminum for roofs and wood for walls. About 58 percent of housing units needed no repair or only minor repair, 13 percent with unfinished construction while 20 percent needed major repair. In 2000, 62 percent of housing units had floor area of less than 30 square meters while only 10 percent had 70 square meters and over.
Of the total number of households in Bohol, 82 percent of households owned/amortized the housing units they occupied while 11 percent occupied the housing units for free or with consent of owner, 3 percent rented and 0.3 percent occupied for free without consent of owner. In 2000, there were 6,020 renter-households in Bohol which is an increase of 4,702 households from 1990. About 16 percent of these renter-households in Bohol rented their housing units at a rate below P100.00, 13 percent at P500.00 to P999.00 a month while about 44 percent at P1,000.00 and greater a month. Per Report from the NSO, half of the housing units in Bohol were built after 1990 while 23 percent or one in five housing units was built earlier than 1981. A total of 210 thousand dwelling units were reported in Bohol in 2000 compared to 108 thousand dwelling units in 1960, twice as many. The municipality of Pilar had the largest increase in the number of dwelling units from 1960 to 2000 with 12 other municipalities with increases of more than 60 percent. Most of the households in Bohol in 2000 constructed their own houses (44 percent) while only 8 percent were purchased and 7 percent were acquired through inheritance. Of the total number of owner-households that purchased/constructed their housing units, 21 percent had their own financing resources/interest-free loans from relatives/friends, 1 percent thru government financial institutions (PAG-IBIG, GSIS, SSS, etc.), 1 percent from private persons, 0.5 percent from private banks/foundations/ cooperatives and 1 percent from other sources.
Shelter Needs 10 The demand for housing is affected by several factors such as population size, age and spatial distribution of the population. Related to these factors are nupiality (marriage), and family formation (number of new households formed) and the decision of some to remain single accounting for one-person type of households. Migration (influx of people) also affects housing demand. This increasing demand for housing is indicated by existing housing backlogs and doubled-up occupancies.
10 The Plan uses year 2009 as base year with an estimated population of 1,256,326. The annual growth rate
from year 2000 to 2007 is 1.06 percent. Population of Bohol Province based on the NSO population count year 2007 is 1,230,110. The base year is the year before the planning period. The plan period is divided into two. First planning period covers 2010 – 2012, second planning period cover 2013 – 2015, The planning period is set by the province to answer and meet the housing needs based on population growth and backlog.
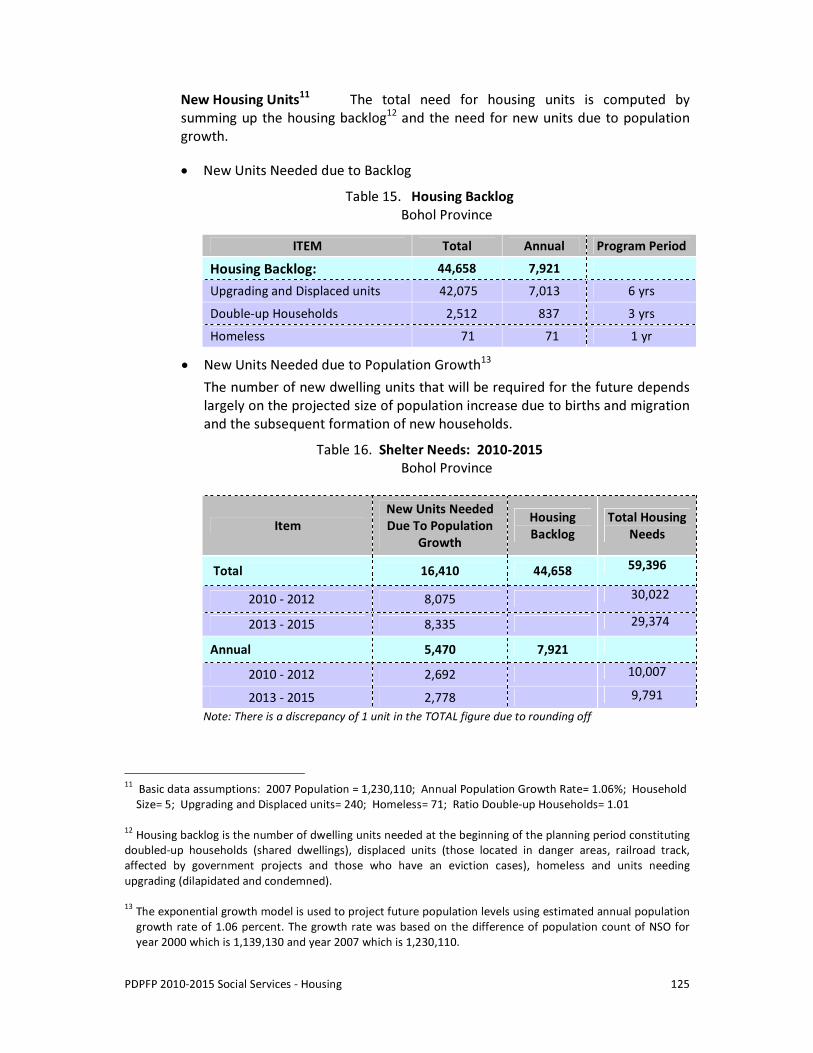
PDPFP 2010-2015 Social Services - Housing
125
New Housing Units11 The total need for housing units is computed by summing up the housing backlog12 and the need for new units due to population growth. • New Units Needed due to Backlog
Table 15. Housing Backlog Bohol Province
ITEM Total Annual Program Period Housing Backlog: 44,658 7,921 Upgrading and Displaced units 42,075 7,013 6 yrs Double-up Households 2,512 837 3 yrs Homeless 71 71 1 yr
• New Units Needed due to Population Growth13 The number of new dwelling units that will be required for the future depends largely on the projected size of population increase due to births and migration and the subsequent formation of new households.
Table 16. Shelter Needs: 2010-2015 Bohol Province
Item New Units Needed Due To Population
Growth Housing Backlog
Total Housing Needs
Total 16,410 44,658 59,396
2010 - 2012 8,075 30,022 2013 - 2015 8,335 29,374
Annual 5,470 7,921 2010 - 2012 2,692 10,007 2013 - 2015 2,778 9,791
Note: There is a discrepancy of 1 unit in the TOTAL figure due to rounding off
11 Basic data assumptions: 2007 Population = 1,230,110; Annual Population Growth Rate= 1.06%; Household
Size= 5; Upgrading and Displaced units= 240; Homeless= 71; Ratio Double-up Households= 1.01 12 Housing backlog is the number of dwelling units needed at the beginning of the planning period constituting doubled-up households (shared dwellings), displaced units (those located in danger areas, railroad track, affected by government projects and those who have an eviction cases), homeless and units needing upgrading (dilapidated and condemned). 13 The exponential growth model is used to project future population levels using estimated annual population
growth rate of 1.06 percent. The growth rate was based on the difference of population count of NSO for year 2000 which is 1,139,130 and year 2007 which is 1,230,110.
PDPFP 2010-2015 Social Services - Housing
126
Bohol Province needs 59,396 new units in the next 6 years, due to population growth and housing backlog. Annual new housing need in year 2010 – 2015 is an average of 9,899 units of which 5,940 units belong to socialized housing.
• Land Requirements Simulation of Land Requirements using 100 square meters total lot area per household (socialized housing) and 150 square meters total lot area per household (economic/high end housing).
Minimum Land Requirements For Socialized Housing 356.38 Hectares 35,638 Households Economic/High-end Housing 356.37 hectares 23,758 Households Requirements in 2010-2015 (All Income Groups) 712 Hectares
• Resources Available for Housing Identification of local resources for housing, e.g., land, infrastructure, finance, building materials and labor, is a basic task of the LGU. The LGU can mobilize its resources to provide, for example, land and infrastructure as mandated under the UDHA or use its power to influence the supply of other local resources or access other resources, e.g., other funding sourcing, to address its housing requirement or other schemes such as Joint Ventures, Build-Operate and Transfer, etc.
Land and Infrastructure for Socialized Housing a. Land Need For Housing
Land is a very critical component in housing development. Bohol Province is confronted with limited supply of land particularly for socialized housing due to the exorbitant cost of land in urban/urbanizable areas and mostly of the other lands in the municipalities. The Urban Development and Housing Act (RA 7279) mandates LGU’s, with the assistance from the National Housing Authority to provide sites and basic services for socialized housing projects and for the LGU to conduct inventory of lands and identified sites for socialized housing within their localities. Conversion of 15% of agricultural land for urban uses is one way to increase land availability for housing, more particularly on socialized housing. RA 7279 mandates the LGUs to provide resettlement and relocation sites for the homeless and underprivileged and for those living in danger areas, with court orders for demolition and those affected with government infrastructure projects.
PDPFP 2010-2015 Social Services - Housing
127
b. Provision Of Infrastructure and Basic Services For Housing Basic services, which LGUs have to provide in Socialized Housing projects and Resettlement areas are: • Potable Water • Power and Electricity • Solid Waste Disposal System • Access to Primary Roads and Transport System
Residential subdivision development projects should conform to the BP 220 standard requirement for road access, drainage and other infrastructure support.
Building Materials and Labor Building materials and labor are major components in housing development. It is practical to choose the type of materials that are inherent in the locality, to minimize costs. Limestone, which is an inherent material in Bohol Province, can be transformed into compressed earth blocks (CEB) for house walling. Production of CEB’s shall provide an alternate source of livelihood for the housing beneficiaries. Self-help build approach will help reduce the cost of house construction. The use of conventional methods and design is still the acceptable practice. Financial Requirement for Housing On the estimated 35,638 households that the Bohol Province needs to address for the next six years, the total financial requirement would be Php 14,255,200,000.00. This amount is based on the maximum cost of Php 400,000.00 (House and Lot Package). For land acquisition and development the total financial requirement is Php8,553,120,000. The amount is based on the 60 percent (Php240,000.00) of socialized housing package which is Php 400,000.00.
Funds Available for Housing
There are two possible sources of funds to finance the LGU’s socialized housing projects. One would be revenue from taxes. This includes the idle Land Tax under Section 236 of the Local Government Code. The other sources are reflows from repayments of LGU housing projects, reflows from take-outs with interim financing.
a. Accessing Funds from National Government Programs b. Other Sources of Funds
The following are the other potential sources of funds, which may be explored by the LGU. • Proceeds from the sale of Alienable Public Lands within the defined boundary
of the LGUs. • Proceeds from the sale of titled properties owned by the LGUs
PDPFP 2010-2015 Social Services - Housing
128
• Proceeds from the implementation of the Socialized Housing Tax per Sec.43, R.A. 7279
• Proceeds from the implementation of Socialized Housing Unit Participation of LGUs for developers housing credit in compliance to 20% balance housing
Institutional Organizations With the magnitude of tasks to be undertaken as reflected in the Plan, there shall be a body or an office, which is officially created with clearly defined roles and functions. The LGUs shall create a Local Housing Board in order to address the housing problem and each LGUs must have a Local Shelter Plan. The importance of shelter planning has proven itself in sustaining and guiding local government units in solving the increasing number of housing demand both from average income earner to the low-income groups. The shelter plan aims not only in providing the underprivileged and the homeless the needed security of tenure but also improving their standard of living. Resource Requirements As an industry, the potential investments in housing are substantial because of the magnitude of demand. For the period 2010-2015, the total housing need (backlog plus new household requirements) in Bohol is estimated to reach about 59,396 units at an annual average of new housing need of 9,899 units. Even if we assume that only 50% of affected households can afford such socialized housing (the national government estimate of the percentage of the population that do not have access to formal housing schemes is 40%), the resulting amount is still very significant. 6.3.3.2 Key Development Challenges
Although the housing needs of Bohol are not as critical as in some other provinces of the country, government still needs to address the following concerns of the sub-sector:
1. Growing housing demand/need as population continues to grow 2. Low priority of housing programs by some LGUs (lukewarm response to housing
problems, political bickering between the executive and legislative branches, etc.) 3. High cost of land in urban and urbanizable areas 4. High cost of land development prompting LGUs not to take up housing projects 5. Tedious technical requirements of housing projects (ECC, Eng. Geo-hazard and
Geological Assessment Report, Land Conversion, etc.) 6. Lack of technical expertise of some LGUs in undertaking housing development 7. LGUs need to have an approved Comprehensive Land Use Plan (CLUP) so that sites
for housing purposes may be defined
PDPFP 2010-2015 Social Services - Housing
129
6.3.3.3 Development Plan Framework
Subsector Vision: A province where there is shelter for every family, generally
sustained, contented and participative in local governance living in a well-organized, well-planned and environmentally-friendly communities
Development Goal: Adequately meet the housing needs of Boholanos Specifically, it aims to achieve
1. Decent, quality and affordable housing to all under-privileged and homeless Boholanos
2. Meeting the growing housing needs of the province 3. identifying new areas for residential development 4. Creating a viable and sustainable source of housing finance 5. Expanding private sector participation in socialized housing finance and
construction. Objectives/Targets:
1. To ensure shelter security 2. To provide access to affordable, quality and decent housing especially for the
poor 3. To reduce housing backlog by at least 18 percent by the year 2015 4. To identify adequate and suitable lands for housing/residential areas 5. To aggressively promote and intensify information campaign and
dissemination of housing programs 6. To encourage private sector participation in the housing programs of the
government 7. To encourage LGUs to implement housing projects within 5 hectares to avoid
cumbersome requirements of DAR (approval will be at the regional level only; more than 5 hetares, DAR Sec approval is required)
8. To encourage LGUs to have in their CLUP sites for housing purposes Strategies
1. Need to have a local Shelter Plan and Local Housing Board to oversee shelter programs
2. Conduct of IEC on Housing Laws and other housing programs 3. Promote self-help housing and local participation through joint venture
scheme with the national government and the private sector 4. Identify sites for socialized housing and resettlement sites 5. Promote low-cost housing
PDPFP 2010-2015 Social Services - Housing
130
6. Recommend to the 6.1 Department of Agrarian Reform (DAR) to simplify the tedious
process of land use conversion by shortening their list of requirements, thereby reducing the bureaucracy in land use conversion
6.2 HDMF (Pag-IBIG Fund) to accept pre-patent titles as collateral to housing loans
7 Tap private sector resources for joint venture for public housing (i.e., members of HDMF, GSIS and SSS) in government properties proclaimed for housing purposes
8 Pursue housing-related projects that may include 8.1 residential developments by the private sector 8.2 transportation infrastructure that provide access to housing and
urban expansion sites. 9 Support activities that include formulation of CLUPs for local
government units and 10 Identify financing and guarantee mechanisms for mass/socialized
housing 11 Improve services and infrastructure support to existing residential areas 12 Define appropriate residential development limits and specifications in
identified disaster-prone and other environmentally-critical areas to reduce safety risks
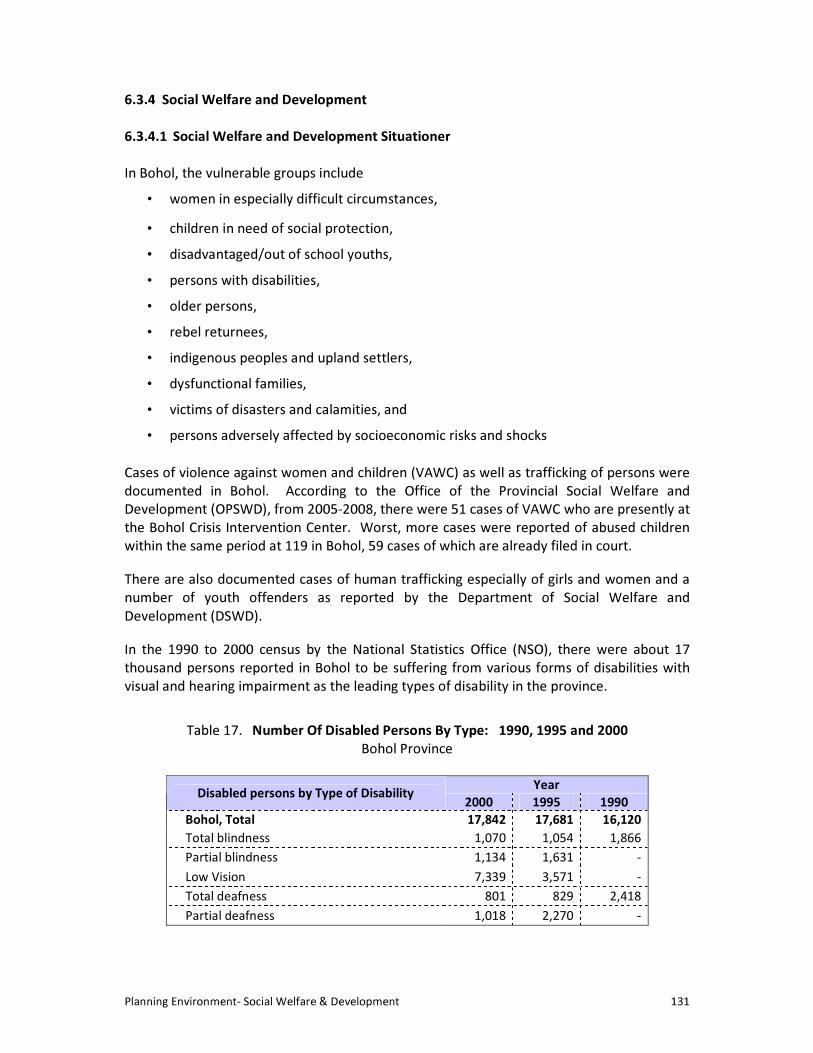
Planning Environment- Social Welfare & Development 131
6.3.4 Social Welfare and Development 6.3.4.1 Social Welfare and Development Situationer In Bohol, the vulnerable groups include
• women in especially difficult circumstances, • children in need of social protection, • disadvantaged/out of school youths, • persons with disabilities, • older persons, • rebel returnees, • indigenous peoples and upland settlers, • dysfunctional families, • victims of disasters and calamities, and • persons adversely affected by socioeconomic risks and shocks
Cases of violence against women and children (VAWC) as well as trafficking of persons were documented in Bohol. According to the Office of the Provincial Social Welfare and Development (OPSWD), from 2005-2008, there were 51 cases of VAWC who are presently at the Bohol Crisis Intervention Center. Worst, more cases were reported of abused children within the same period at 119 in Bohol, 59 cases of which are already filed in court. There are also documented cases of human trafficking especially of girls and women and a number of youth offenders as reported by the Department of Social Welfare and Development (DSWD). In the 1990 to 2000 census by the National Statistics Office (NSO), there were about 17 thousand persons reported in Bohol to be suffering from various forms of disabilities with visual and hearing impairment as the leading types of disability in the province.
Table 17. Number Of Disabled Persons By Type: 1990, 1995 and 2000
Bohol Province
Year Disabled persons by Type of Disability 2000 1995 1990 Bohol, Total 17,842 17,681 16,120 Total blindness 1,070 1,054 1,866 Partial blindness 1,134 1,631 - Low Vision 7,339 3,571 - Total deafness 801 829 2,418 Partial deafness 1,018 2,270 -
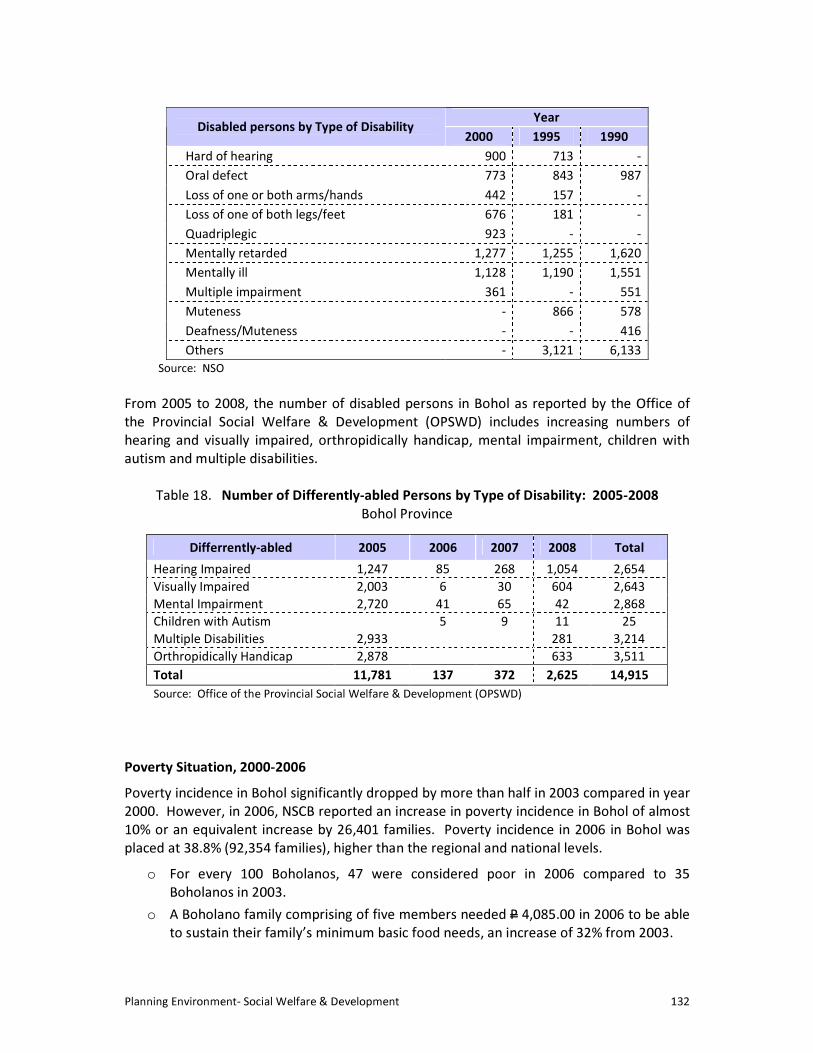
Planning Environment- Social Welfare & Development 132
Year Disabled persons by Type of Disability 2000 1995 1990
Hard of hearing 900 713 - Oral defect 773 843 987 Loss of one or both arms/hands 442 157 - Loss of one of both legs/feet 676 181 - Quadriplegic 923 - - Mentally retarded 1,277 1,255 1,620 Mentally ill 1,128 1,190 1,551 Multiple impairment 361 - 551 Muteness - 866 578 Deafness/Muteness - - 416 Others - 3,121 6,133
Source: NSO From 2005 to 2008, the number of disabled persons in Bohol as reported by the Office of the Provincial Social Welfare & Development (OPSWD) includes increasing numbers of hearing and visually impaired, orthropidically handicap, mental impairment, children with autism and multiple disabilities.
Table 18. Number of Differently-abled Persons by Type of Disability: 2005-2008 Bohol Province
Differrently-abled 2005 2006 2007 2008 Total
Hearing Impaired 1,247 85 268 1,054 2,654 Visually Impaired 2,003 6 30 604 2,643 Mental Impairment 2,720 41 65 42 2,868 Children with Autism 5 9 11 25 Multiple Disabilities 2,933 281 3,214 Orthropidically Handicap 2,878 633 3,511 Total 11,781 137 372 2,625 14,915 Source: Office of the Provincial Social Welfare & Development (OPSWD)
Poverty Situation, 2000-2006 Poverty incidence in Bohol significantly dropped by more than half in 2003 compared in year 2000. However, in 2006, NSCB reported an increase in poverty incidence in Bohol of almost 10% or an equivalent increase by 26,401 families. Poverty incidence in 2006 in Bohol was placed at 38.8% (92,354 families), higher than the regional and national levels.
o For every 100 Boholanos, 47 were considered poor in 2006 compared to 35 Boholanos in 2003.
o A Boholano family comprising of five members needed P 4,085.00 in 2006 to be able to sustain their family’s minimum basic food needs, an increase of 32% from 2003.
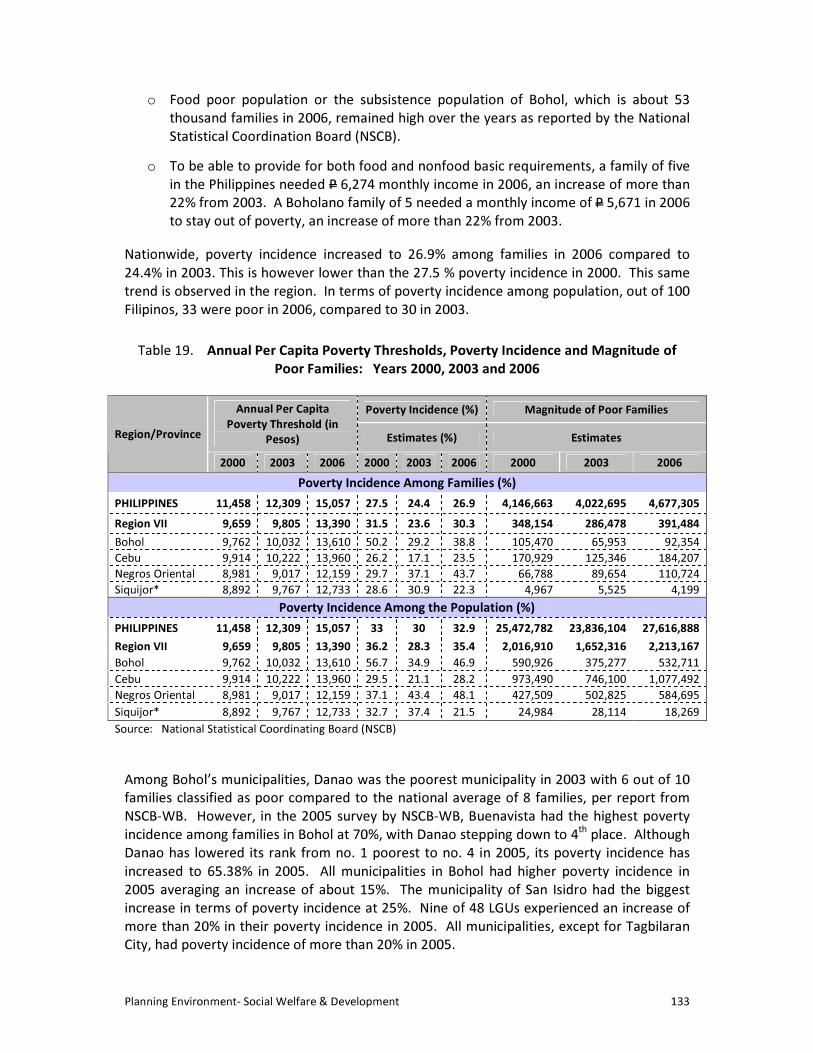
Planning Environment- Social Welfare & Development 133
o Food poor population or the subsistence population of Bohol, which is about 53 thousand families in 2006, remained high over the years as reported by the National Statistical Coordination Board (NSCB).
o To be able to provide for both food and nonfood basic requirements, a family of five in the Philippines needed P 6,274 monthly income in 2006, an increase of more than 22% from 2003. A Boholano family of 5 needed a monthly income of P 5,671 in 2006 to stay out of poverty, an increase of more than 22% from 2003.
Nationwide, poverty incidence increased to 26.9% among families in 2006 compared to 24.4% in 2003. This is however lower than the 27.5 % poverty incidence in 2000. This same trend is observed in the region. In terms of poverty incidence among population, out of 100 Filipinos, 33 were poor in 2006, compared to 30 in 2003.
Table 19. Annual Per Capita Poverty Thresholds, Poverty Incidence and Magnitude of Poor Families: Years 2000, 2003 and 2006
Poverty Incidence (%) Magnitude of Poor Families Annual Per Capita
Poverty Threshold (in Pesos) Estimates (%) Estimates Region/Province
2000 2003 2006 2000 2003 2006 2000 2003 2006 Poverty Incidence Among Families (%)
PHILIPPINES 11,458 12,309 15,057 27.5 24.4 26.9 4,146,663 4,022,695 4,677,305 Region VII 9,659 9,805 13,390 31.5 23.6 30.3 348,154 286,478 391,484 Bohol 9,762 10,032 13,610 50.2 29.2 38.8 105,470 65,953 92,354 Cebu 9,914 10,222 13,960 26.2 17.1 23.5 170,929 125,346 184,207 Negros Oriental 8,981 9,017 12,159 29.7 37.1 43.7 66,788 89,654 110,724 Siquijor* 8,892 9,767 12,733 28.6 30.9 22.3 4,967 5,525 4,199
Poverty Incidence Among the Population (%) PHILIPPINES 11,458 12,309 15,057 33 30 32.9 25,472,782 23,836,104 27,616,888 Region VII 9,659 9,805 13,390 36.2 28.3 35.4 2,016,910 1,652,316 2,213,167 Bohol 9,762 10,032 13,610 56.7 34.9 46.9 590,926 375,277 532,711 Cebu 9,914 10,222 13,960 29.5 21.1 28.2 973,490 746,100 1,077,492 Negros Oriental 8,981 9,017 12,159 37.1 43.4 48.1 427,509 502,825 584,695 Siquijor* 8,892 9,767 12,733 32.7 37.4 21.5 24,984 28,114 18,269 Source: National Statistical Coordinating Board (NSCB)
Among Bohol’s municipalities, Danao was the poorest municipality in 2003 with 6 out of 10 families classified as poor compared to the national average of 8 families, per report from NSCB-WB. However, in the 2005 survey by NSCB-WB, Buenavista had the highest poverty incidence among families in Bohol at 70%, with Danao stepping down to 4th place. Although Danao has lowered its rank from no. 1 poorest to no. 4 in 2005, its poverty incidence has increased to 65.38% in 2005. All municipalities in Bohol had higher poverty incidence in 2005 averaging an increase of about 15%. The municipality of San Isidro had the biggest increase in terms of poverty incidence at 25%. Nine of 48 LGUs experienced an increase of more than 20% in their poverty incidence in 2005. All municipalities, except for Tagbilaran City, had poverty incidence of more than 20% in 2005.
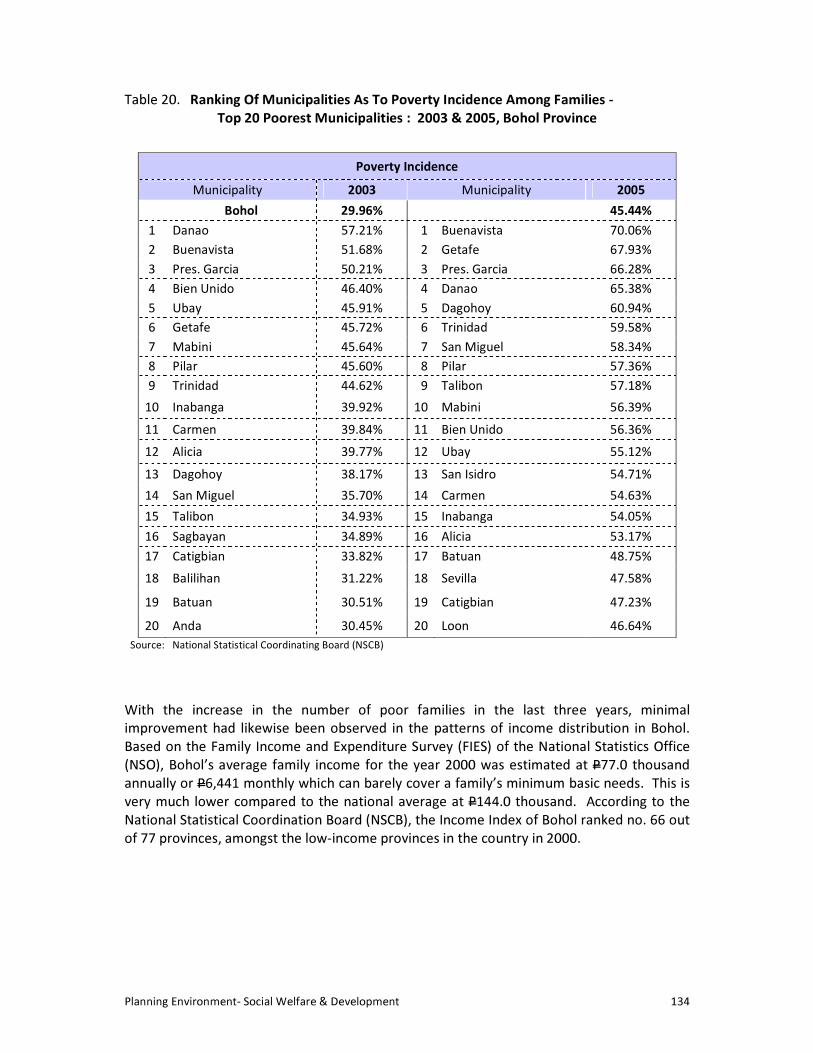
Planning Environment- Social Welfare & Development 134
Table 20. Ranking Of Municipalities As To Poverty Incidence Among Families - Top 20 Poorest Municipalities : 2003 & 2005, Bohol Province
Poverty Incidence Municipality 2003 Municipality 2005
Bohol 29.96% 45.44% 1 Danao 57.21% 1 Buenavista 70.06% 2 Buenavista 51.68% 2 Getafe 67.93% 3 Pres. Garcia 50.21% 3 Pres. Garcia 66.28% 4 Bien Unido 46.40% 4 Danao 65.38% 5 Ubay 45.91% 5 Dagohoy 60.94% 6 Getafe 45.72% 6 Trinidad 59.58% 7 Mabini 45.64% 7 San Miguel 58.34% 8 Pilar 45.60% 8 Pilar 57.36% 9 Trinidad 44.62% 9 Talibon 57.18%
10 Inabanga 39.92% 10 Mabini 56.39% 11 Carmen 39.84% 11 Bien Unido 56.36% 12 Alicia 39.77% 12 Ubay 55.12% 13 Dagohoy 38.17% 13 San Isidro 54.71% 14 San Miguel 35.70% 14 Carmen 54.63% 15 Talibon 34.93% 15 Inabanga 54.05% 16 Sagbayan 34.89% 16 Alicia 53.17% 17 Catigbian 33.82% 17 Batuan 48.75% 18 Balilihan 31.22% 18 Sevilla 47.58% 19 Batuan 30.51% 19 Catigbian 47.23% 20 Anda 30.45% 20 Loon 46.64%
Source: National Statistical Coordinating Board (NSCB) With the increase in the number of poor families in the last three years, minimal improvement had likewise been observed in the patterns of income distribution in Bohol. Based on the Family Income and Expenditure Survey (FIES) of the National Statistics Office (NSO), Bohol’s average family income for the year 2000 was estimated at P77.0 thousand annually or P6,441 monthly which can barely cover a family’s minimum basic needs. This is very much lower compared to the national average at P144.0 thousand. According to the National Statistical Coordination Board (NSCB), the Income Index of Bohol ranked no. 66 out of 77 provinces, amongst the low-income provinces in the country in 2000.
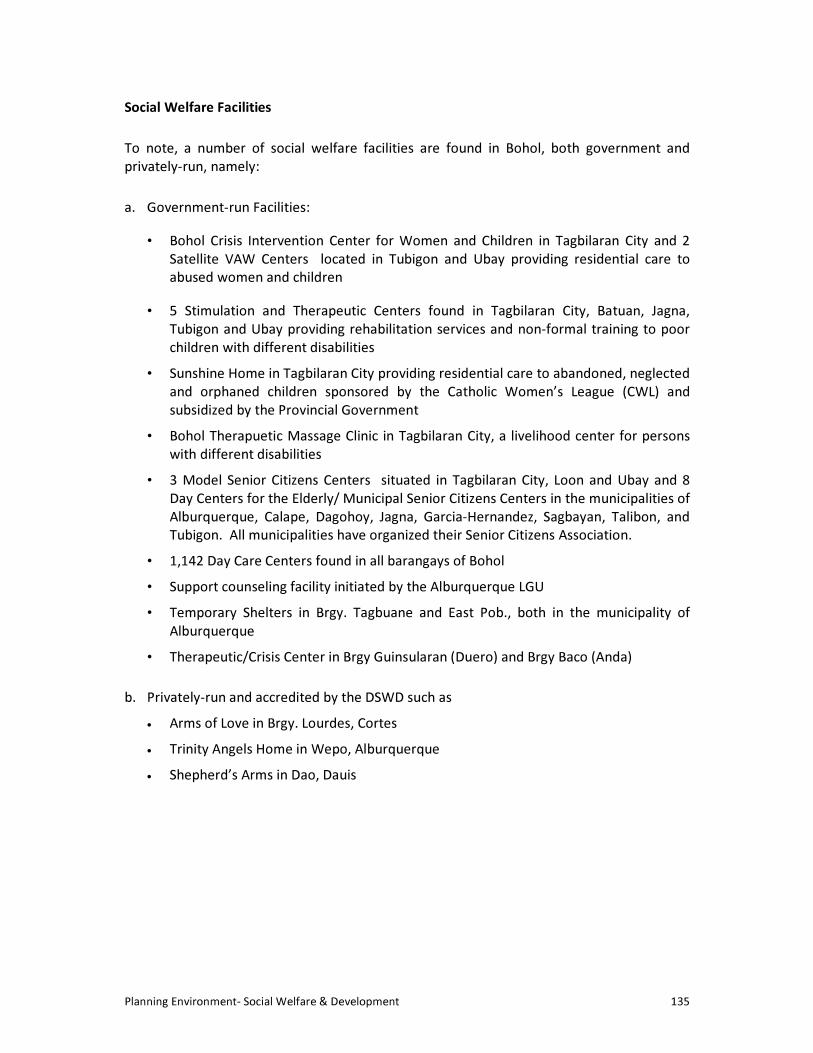
Planning Environment- Social Welfare & Development 135
Social Welfare Facilities
To note, a number of social welfare facilities are found in Bohol, both government and privately-run, namely:
a. Government-run Facilities: • Bohol Crisis Intervention Center for Women and Children in Tagbilaran City and 2
Satellite VAW Centers located in Tubigon and Ubay providing residential care to abused women and children
• 5 Stimulation and Therapeutic Centers found in Tagbilaran City, Batuan, Jagna, Tubigon and Ubay providing rehabilitation services and non-formal training to poor children with different disabilities
• Sunshine Home in Tagbilaran City providing residential care to abandoned, neglected and orphaned children sponsored by the Catholic Women’s League (CWL) and subsidized by the Provincial Government
• Bohol Therapuetic Massage Clinic in Tagbilaran City, a livelihood center for persons with different disabilities
• 3 Model Senior Citizens Centers situated in Tagbilaran City, Loon and Ubay and 8 Day Centers for the Elderly/ Municipal Senior Citizens Centers in the municipalities of Alburquerque, Calape, Dagohoy, Jagna, Garcia-Hernandez, Sagbayan, Talibon, and Tubigon. All municipalities have organized their Senior Citizens Association.
• 1,142 Day Care Centers found in all barangays of Bohol • Support counseling facility initiated by the Alburquerque LGU • Temporary Shelters in Brgy. Tagbuane and East Pob., both in the municipality of
Alburquerque • Therapeutic/Crisis Center in Brgy Guinsularan (Duero) and Brgy Baco (Anda)
b. Privately-run and accredited by the DSWD such as • Arms of Love in Brgy. Lourdes, Cortes • Trinity Angels Home in Wepo, Alburquerque • Shepherd’s Arms in Dao, Dauis
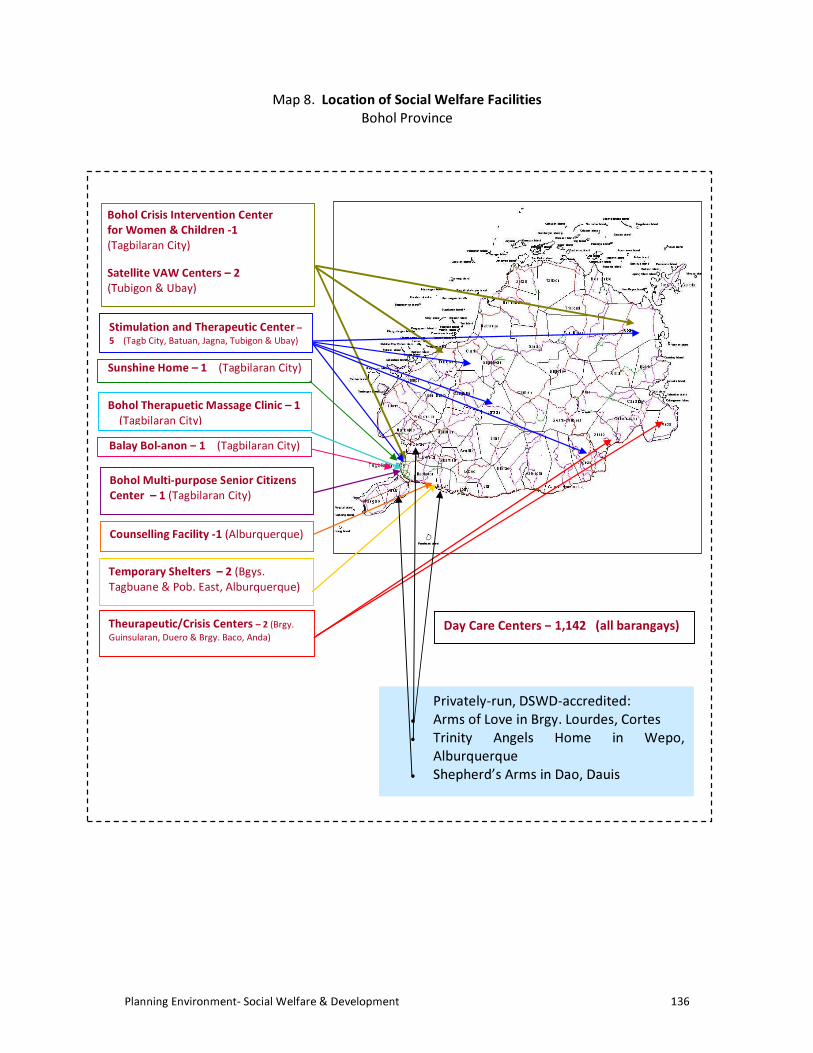
Planning Environment- Social Welfare & Development 136
Map 8. Location of Social Welfare Facilities Bohol Province
Bohol Crisis Intervention Center for Women & Children -1 (Tagbilaran City) Satellite VAW Centers – 2 (Tubigon & Ubay)
Bohol Therapuetic Massage Clinic – 1 (Tagbilaran City)
Day Care Centers – 1,142 (all barangays)
Bohol Multi-purpose Senior Citizens Center – 1 (Tagbilaran City)
Counselling Facility -1 (Alburquerque)
Temporary Shelters – 2 (Bgys. Tagbuane & Pob. East, Alburquerque)
Theurapeutic/Crisis Centers – 2 (Brgy. Guinsularan, Duero & Brgy. Baco, Anda)
Sunshine Home – 1 (Tagbilaran City)
Privately-run, DSWD-accredited: • Arms of Love in Brgy. Lourdes, Cortes • Trinity Angels Home in Wepo,
Alburquerque • Shepherd’s Arms in Dao, Dauis
Stimulation and Therapeutic Center – 5 (Tagb City, Batuan, Jagna, Tubigon & Ubay)
Balay Bol-anon – 1 (Tagbilaran City)
Planning Environment- Social Welfare & Development 137
6.3.4.2 Key Development Challenges For the Welfare Sub-sector, the following are the major concerns:
• Continued incidence of poverty - Inadequate income distribution/ high percentage of population below “poverty
line” - Worsening poverty among families due to lack of productive skills and
opportunities and lack of resources • Alarming number of juvenile offenders (high incidence of cases of minors in conflict
with the law) • High number of mentally-ill persons • A number of families in difficult situation and in crisis situation
• Increasing incidence of violence against women (VAWC) and children and trafficking of persons
• Increasing number of children needing pre-school education
• Increasing number of Children In Need of Special Protection (CNSP) - Abused, Abandoned, Neglected, Exploited Children
• Absence of a Provincial Youth Detention Home for the Province for Children In Conflict with the Law (Balay Batang Bol-anon established by the Tagbilaran City Gov’t. will not accept minors referred from the municipalities)
• Very minimal numbers of Adoptive Applicants / Parents and Foster Parents to abandoned children in Bohol in need of immediate and temporary care as well as adoptive parents to legally adopt abandoned/neglected children despite the conduct of an Adoption and Foster Forum
• Absence of Crisis Intervention Units in most of the municipalities of Bohol to immediately respond/answer the needs of clients in the municipality.
• Rebel returnees’ reintegration into the mainstream of society 6.3.4.3 Development Framework
Sub-Sector Vision: Improved quality of life of Boholanos by the year 2015 Development Goals:
1. Reduced number of households living below the poverty line 2. Enhanced delivery of basic social services 3. Improved access to essential services and facilities 4. Protection of the vulnerable, i.e., the children, youth with special needs,
women in difficult circumstances, persons with disabilities, and the elderly 5. Expanded residential care to victims of violence especially among women and
children
Planning Environment- Social Welfare & Development 138
Strategies Strategies formulated were based on the principle of self-reliance targeting basic social services for the poor – those involving human capital development and social protection. These include
1. Improved access to human and social development services thru social protection/welfare and assistance
2. Anti-poverty reduction strategies to be pursued through the following: a. livelihood assistance and opportunities; b. provision of essential services; c. protection of the vulnerable; and d. empowerment
2. Commitment to eliminate poverty exemplified in the Millennium Development Goals (MDGs).
3. Assisting those with developmental disabilities (people with difficulty in language, mobility, learning, self-help, and independent living)
4. Establishment of Day Care Centers (DCC) in barangays without DCC 5. Creation of Municipal Crisis Units/Intervention Centers in major urban
growth centers of Bohol a. Involve the participation and fund commitment of congressmen in the
construction of VAWC Centers. 6. Establishment of a Provincial Rehabilitation Center for Youth Offenders 7. Providing rehabilitative and developmental programs and services 8. Advocate for the implementation of RA 8980 or Early Childhood Care and
Development 9. Implement the mandates and provisions of the Gender and Development
(GAD) Code of Bohol 10. Providing full support and commitment to former rebels especially in
mobilizing funds to assist them in their livelihood projects and their children’s scholarships a. Provide capitol assistance to 50 former rebels for various income
generating projects b. Access 20 out-of-school youths for college education scholarships thru
partnerships with the Provincial Government and CHED/OPAPP
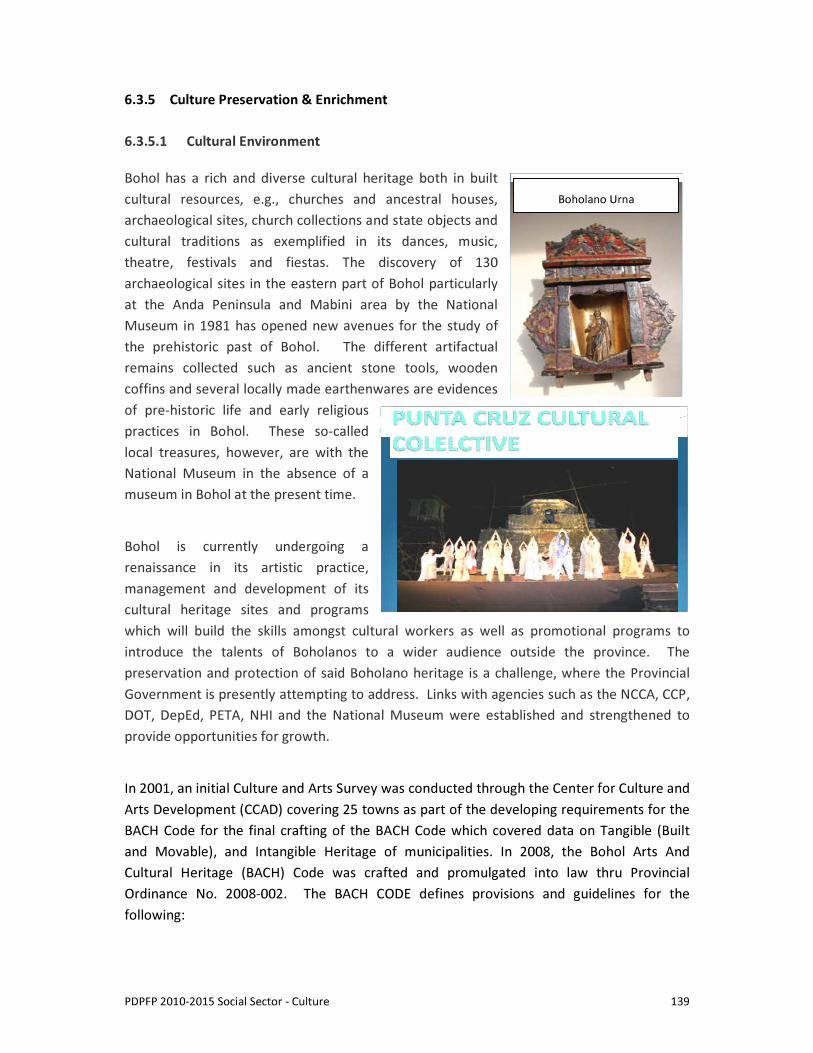
PDPFP 2010-2015 Social Sector - Culture 139
Boholano Urna
6.3.5 Culture Preservation & Enrichment 6.3.5.1 Cultural Environment Bohol has a rich and diverse cultural heritage both in built cultural resources, e.g., churches and ancestral houses, archaeological sites, church collections and state objects and cultural traditions as exemplified in its dances, music, theatre, festivals and fiestas. The discovery of 130 archaeological sites in the eastern part of Bohol particularly at the Anda Peninsula and Mabini area by the National Museum in 1981 has opened new avenues for the study of the prehistoric past of Bohol. The different artifactual remains collected such as ancient stone tools, wooden coffins and several locally made earthenwares are evidences of pre-historic life and early religious practices in Bohol. These so-called local treasures, however, are with the National Museum in the absence of a museum in Bohol at the present time. Bohol is currently undergoing a renaissance in its artistic practice, management and development of its cultural heritage sites and programs which will build the skills amongst cultural workers as well as promotional programs to introduce the talents of Boholanos to a wider audience outside the province. The preservation and protection of said Boholano heritage is a challenge, where the Provincial Government is presently attempting to address. Links with agencies such as the NCCA, CCP, DOT, DepEd, PETA, NHI and the National Museum were established and strengthened to provide opportunities for growth. In 2001, an initial Culture and Arts Survey was conducted through the Center for Culture and Arts Development (CCAD) covering 25 towns as part of the developing requirements for the BACH Code for the final crafting of the BACH Code which covered data on Tangible (Built and Movable), and Intangible Heritage of municipalities. In 2008, the Bohol Arts And Cultural Heritage (BACH) Code was crafted and promulgated into law thru Provincial Ordinance No. 2008-002. The BACH CODE defines provisions and guidelines for the following:
PDPFP 2010-2015 Social Sector - Culture 140
a. Assessment, Designation and Registration of Cultural Properties b. Licensing, Conservation, Restoration, and Protection of the same c. Cultural Property Incentives d. Designation of Cultural Heritage Zones and Intangible Heritage e. Creative Industries, Cultural Workers, and Cultural Education f. Culture and Tourism g. Cultural Heritage Trust Fund h. Violations and sanctions. i. Establishment of a Provincial Heritage Assessment and Designation Commission
Key restoration programs were also implemented by the Diocesan Commission for the Cultural Patrimony of the Church in 2008 such as:
a. Redevelopment of the Dauis Church and Convent Complex through the Dauis Renaissance Program under the auspices of the Ayala Foundation
b. Restoration of the Baclayon Pipe Organ also through the Ayala Foundation The cultural sector has effectively advocated for the cause of arts and cultural heritage across different dimensions of society (governance, business, and civil society) and through this strategy of partnership and linkage, was able to realize significant projects with relative success. Some LGUs now have clear cultural agenda or significant cultural programs, e.g., Loon, Loboc, Baclayon, Dauis, Jagna, Anda and Maribojoc municipalities. Also, local NGOs have cultural agenda or significant cultural programs. National agencies who were partners in cultural development include NCCA, Metropolitan Museum, Ayala Foundation, Philippine Australian Community Assisted Program, National Historical Institute, National Museum, DSWD and Department of Tourism. To support its vision and development thrust, the Provincial Government established the Center for Culture and Arts Development (CCAD) in 1997 to ensure that the cultural renaissance in Bohol will be sustained. It has been initiating programs and projects aimed at preserving, conserving, and revitalizing the Boholano arts and culture, consistent with its development vision of making Bohol an Eco-Cultural Heritage Province, Artistic Center, and Destination in the Country. 6.3.5.2 Ethnic/Cultural Communities The Boholano is one of the major mainstream ethnic groups in the Philippines and speaks a variation of Cebuano. There are three (3) main ethnic groups in the province as reported by the National Commission on Indigenous Peoples (NCIP), namely, the Eskaya, the Badjao and the Ati. They
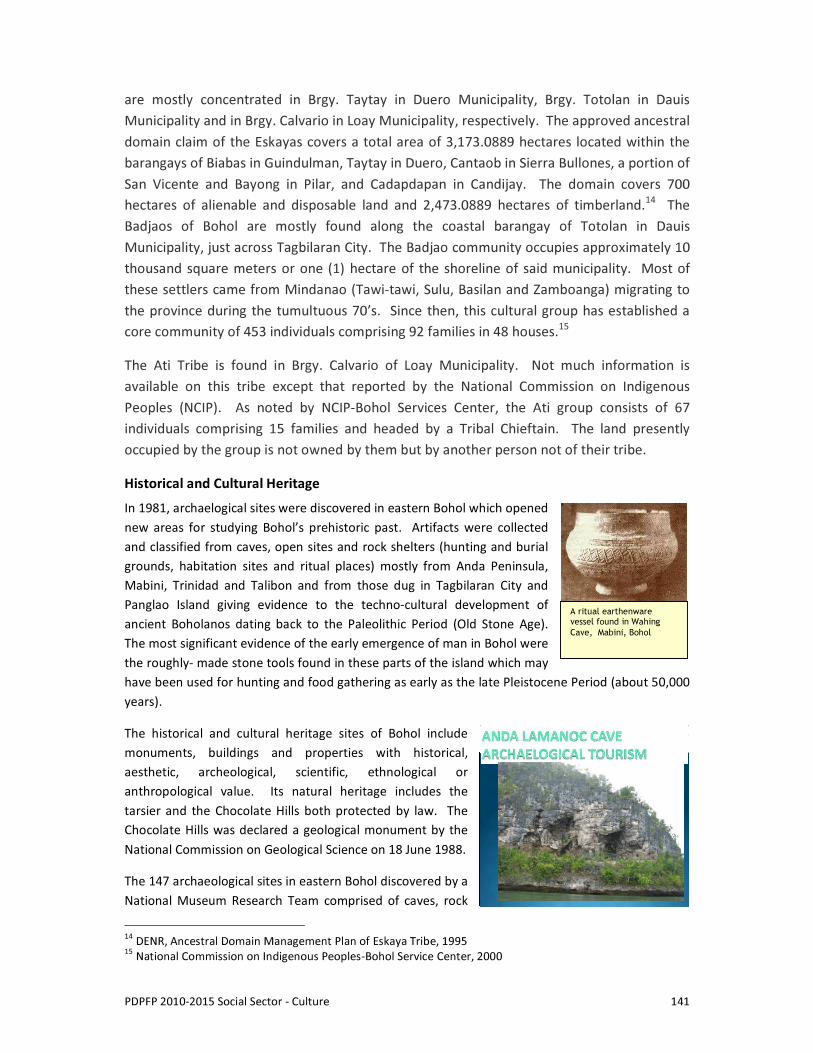
PDPFP 2010-2015 Social Sector - Culture 141
A ritual earthenware vessel found in Wahing Cave, Mabini, Bohol
are mostly concentrated in Brgy. Taytay in Duero Municipality, Brgy. Totolan in Dauis Municipality and in Brgy. Calvario in Loay Municipality, respectively. The approved ancestral domain claim of the Eskayas covers a total area of 3,173.0889 hectares located within the barangays of Biabas in Guindulman, Taytay in Duero, Cantaob in Sierra Bullones, a portion of San Vicente and Bayong in Pilar, and Cadapdapan in Candijay. The domain covers 700 hectares of alienable and disposable land and 2,473.0889 hectares of timberland.14 The Badjaos of Bohol are mostly found along the coastal barangay of Totolan in Dauis Municipality, just across Tagbilaran City. The Badjao community occupies approximately 10 thousand square meters or one (1) hectare of the shoreline of said municipality. Most of these settlers came from Mindanao (Tawi-tawi, Sulu, Basilan and Zamboanga) migrating to the province during the tumultuous 70’s. Since then, this cultural group has established a core community of 453 individuals comprising 92 families in 48 houses.15 The Ati Tribe is found in Brgy. Calvario of Loay Municipality. Not much information is available on this tribe except that reported by the National Commission on Indigenous Peoples (NCIP). As noted by NCIP-Bohol Services Center, the Ati group consists of 67 individuals comprising 15 families and headed by a Tribal Chieftain. The land presently occupied by the group is not owned by them but by another person not of their tribe. Historical and Cultural Heritage In 1981, archaelogical sites were discovered in eastern Bohol which opened new areas for studying Bohol’s prehistoric past. Artifacts were collected and classified from caves, open sites and rock shelters (hunting and burial grounds, habitation sites and ritual places) mostly from Anda Peninsula, Mabini, Trinidad and Talibon and from those dug in Tagbilaran City and Panglao Island giving evidence to the techno-cultural development of ancient Boholanos dating back to the Paleolithic Period (Old Stone Age). The most significant evidence of the early emergence of man in Bohol were the roughly- made stone tools found in these parts of the island which may have been used for hunting and food gathering as early as the late Pleistocene Period (about 50,000 years). The historical and cultural heritage sites of Bohol include monuments, buildings and properties with historical, aesthetic, archeological, scientific, ethnological or anthropological value. Its natural heritage includes the tarsier and the Chocolate Hills both protected by law. The Chocolate Hills was declared a geological monument by the National Commission on Geological Science on 18 June 1988. The 147 archaeological sites in eastern Bohol discovered by a National Museum Research Team comprised of caves, rock 14 DENR, Ancestral Domain Management Plan of Eskaya Tribe, 1995 15 National Commission on Indigenous Peoples-Bohol Service Center, 2000
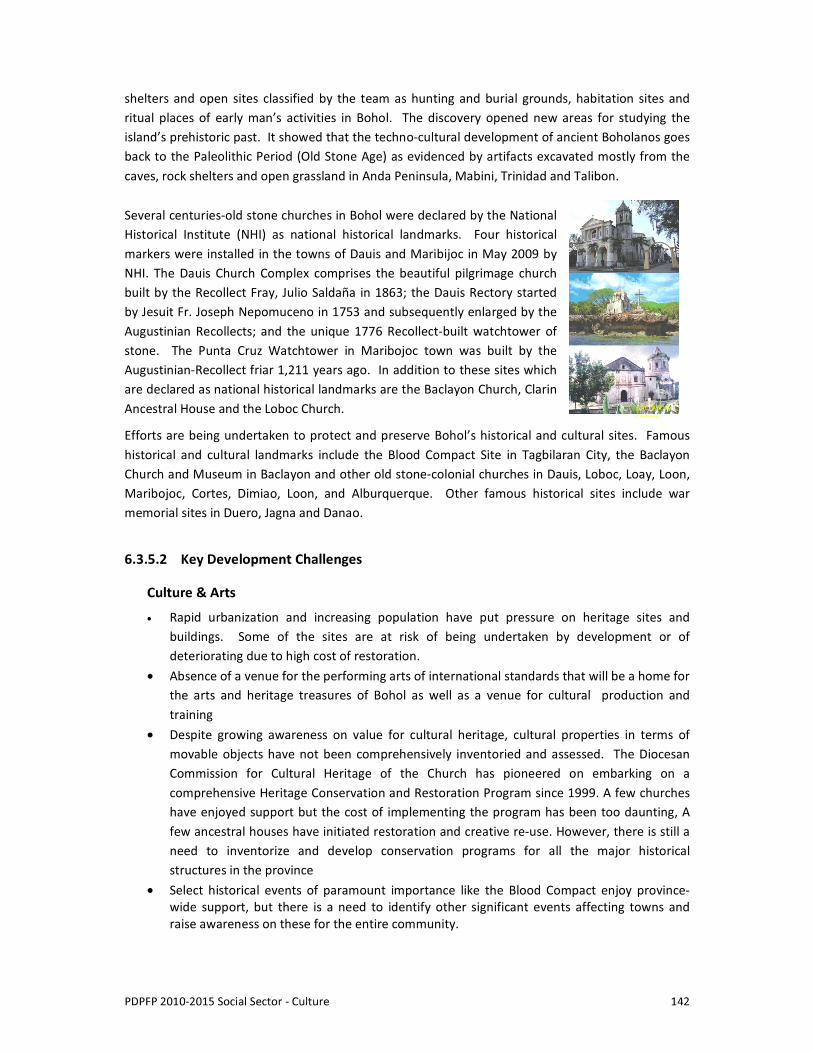
PDPFP 2010-2015 Social Sector - Culture 142
BACLAYON Church
shelters and open sites classified by the team as hunting and burial grounds, habitation sites and ritual places of early man’s activities in Bohol. The discovery opened new areas for studying the island’s prehistoric past. It showed that the techno-cultural development of ancient Boholanos goes back to the Paleolithic Period (Old Stone Age) as evidenced by artifacts excavated mostly from the caves, rock shelters and open grassland in Anda Peninsula, Mabini, Trinidad and Talibon.
Several centuries-old stone churches in Bohol were declared by the National Historical Institute (NHI) as national historical landmarks. Four historical markers were installed in the towns of Dauis and Maribijoc in May 2009 by NHI. The Dauis Church Complex comprises the beautiful pilgrimage church built by the Recollect Fray, Julio Saldaña in 1863; the Dauis Rectory started by Jesuit Fr. Joseph Nepomuceno in 1753 and subsequently enlarged by the Augustinian Recollects; and the unique 1776 Recollect-built watchtower of stone. The Punta Cruz Watchtower in Maribojoc town was built by the Augustinian-Recollect friar 1,211 years ago. In addition to these sites which are declared as national historical landmarks are the Baclayon Church, Clarin Ancestral House and the Loboc Church. Efforts are being undertaken to protect and preserve Bohol’s historical and cultural sites. Famous historical and cultural landmarks include the Blood Compact Site in Tagbilaran City, the Baclayon Church and Museum in Baclayon and other old stone-colonial churches in Dauis, Loboc, Loay, Loon, Maribojoc, Cortes, Dimiao, Loon, and Alburquerque. Other famous historical sites include war memorial sites in Duero, Jagna and Danao.
6.3.5.2 Key Development Challenges
Culture & Arts • Rapid urbanization and increasing population have put pressure on heritage sites and
buildings. Some of the sites are at risk of being undertaken by development or of deteriorating due to high cost of restoration.
• Absence of a venue for the performing arts of international standards that will be a home for the arts and heritage treasures of Bohol as well as a venue for cultural production and training
• Despite growing awareness on value for cultural heritage, cultural properties in terms of movable objects have not been comprehensively inventoried and assessed. The Diocesan Commission for Cultural Heritage of the Church has pioneered on embarking on a comprehensive Heritage Conservation and Restoration Program since 1999. A few churches have enjoyed support but the cost of implementing the program has been too daunting, A few ancestral houses have initiated restoration and creative re-use. However, there is still a need to inventorize and develop conservation programs for all the major historical structures in the province
• Select historical events of paramount importance like the Blood Compact enjoy province-wide support, but there is a need to identify other significant events affecting towns and raise awareness on these for the entire community.
PDPFP 2010-2015 Social Sector - Culture 143
• Each town has started to map out key historical personages but need guidance in proper identification, validation and analysis in terms of historicity and significance.
• Various cultural organizations have arisen in the past 4 years and enriched the cultural life of the province. However, these are still few considering the number of towns whose communities definitely possess innate creativity and considering the growth of tourism in the province. There is a need to increase the number of cultural groups in all the towns to raise greater pride of place and culture and to enhance cultural tourism.
• Need to hire a trained and competent Provincial Archaeologist who will serve the needs of the archaeological programs of Bohol
• Arts and Culture must put food on the table by mobilizing its potentials as sources for livelihood for sustainable development, thus answering the need for reducing and eradicating poverty
• Lack of an integrated and comprehensive education and training in arts and heritage to strengthen the arts as a profession and raise the levels of cultural excellence.
Indigenous Peoples (IPs) • Need to identify permanent resettlement sites for Bohol’s IPs • No delineation yet of ancestral domains for Bohol’s Indigenous Peoples (IPs)/cultural
communities 6.3.5.3 Development Plan Framework
Recognizing the importance of culture in its broadest sense, the Plan has programs to uplift the Boholano’s awareness of his own culture and promote positive values and sustainable heritage conservation.
Sub-sector Vision: Bohol as an Eco-cultural Heritage Province, Artistic Center and Destination in the Country, continuously preserving and developing its cultural heritage, actively nurturing Boholano cultural talents towards heights of artistic excellence, brimming with dynamic community-based cultural groups and institutions, continuously being utilized as an exquisite venue for local, national and international cultural events
Sub-Sector Goal: Cultural heritage enhancement and revitalization of the cultural life of the Boholanos Objectives 1. To promote sustainable heritage conservation approach 2. To awaken pride and appreciation of Bohol’s cultural heritage 3. To continue to restore and preserve cultural and natural heritage sites 4. To advance cultural enrichment, excellence, promotions and diplomacy
PDPFP 2010-2015 Social Sector - Culture 144
5. To preserve and develop the culture, traditions and institutions of cultural communities as well as promote their general well-being
Strategies 1. Mainstreaming Culture and Development in plans, policies, programs and projects 2. Institutionalize culture in education and in good governance 3. Promote cultural awareness, cultural heritage preservation and protection 4. Continue the implementation of programs for the promotion of culture and artistic
development 5. Encourage the generation of jobs or livelihood from cultural industries 6. Continue and sustain partnership with the private sector towards the conservation of
cultural heritage, enhancement and revitalization of the cultural life of the Boholano people 7. Encourage greater cultural scholarship 8. Expand cultural exchanges and agreements with other countries 9. Promote programs/projects for the advancement of cultural communities, including the
establishment of their settlements 10. Support economic development through livelihood programs 11. Preserve and develop historical and cultural heritage of cultural communities such as
museums and libraries 12. Pursue appropriate programs that would facilitate the educational advancement of cultural
communities 13. Provide medical assistance, nutrition and other health services to IPs 14. Exhibit more of Boholano’s indigenous culture materials 15. Mobilize Boholanos for more interesting collections and find an adequate storage space 16. Develop more imaginative programs and better displays 17. Mount overviews of heritage and tourism clusters 18. Hire a trained and competent provincial archaeologist who will serve the needs of the
archaeological programs of Bohol 19. Facilitate the delineation of ancestral lands for Bohol’s IPs/cultural communities 20. Prioritize the formulation of ancestral domain sustainable and protection plans 21. Promote the identification of settlement/resettlement sites 22. Provide livelihood programs to IPs and disadvantaged groups to uplift them from social and
economic marginalization and socio-cultural displacement. 23. Establish cultural venues as centers for holding local and international performances
productions, exhibits and conferences 24. Establish an Academy of the Arts, a multi-disciplinary training center for the professional
education in heritage and the arts, music, theatre, dance, literature with state-of-the-art facilities. This will equip artists and tourism workers with professional skills in arts heritage tourism and creative industries.
Province of Bohol
Provincial Development and Physical Framework Plan (PDPFP) 2010-2015
EEEcccooonnnooommmiiiccc DDDeeevvveeelllooopppmmmeeennnttt SSSeeeccctttooorrr
________________________________________________________________________________________________
Provincial Development and Physical Framework Plan, Bohol: 2010-2015 (PDPFP: 2010-2015)
146
CONTENTS PDPFP 2010-2015
ECONOMIC DEVELOPMENT SECTOR
Contents Page � AGRICULTURE AND RURAL DEVELOPMENT
� SITUATIONER o LAND UTILIZATION……………………………………………………………………….….. o CROPS PRODUCTION AND DEVELOPMENT
� Palay……………………………………………………………………………………… � Corn………………………………………………………………………………………. � Fruit crops…………………………………………………………………………….. � Commercial Crops…………………………………………………………………. � Vegetables…………………………………………………………………………….. � Rootcrops……………………………………………………………………………….
o LIVESTOCK DEVELOPMENT � Ruminant Production…………………………………………………………….. � Hog Production……………………………………………………………………… � Poultry Production…………………………………………………………………
o FISH PRODUCTION � Municipal Fishing…………………………………………………………………… � Commercial Fishing……………………………………………………………….. � Aquaculture……………………………………………………………………………
o FOOD SUPPLY AND DEMAND ANALYSIS � Population Growth………………………………………………………………… � Food Situation……………………………………………………………………….. � Projected Agricultural Production and Demand……………………..
o IDENTIFIED KEY PRODUCTION AREAS.……………………………………………… o COOPERATIVE DEVELOPMENT………………………………………………………… o AGRARIAN REFORM…………………………………………………………………..…… o PRODUCTION SUPPORT FACILITIES
� Irrigation Support………………………………………………………………….. � Support Facilities……………………………………………………………………
� DEVELOPMENT CHALLENGES……………………………………………………………….. � DEVELOPMENT PLAN FRAMEWORK
o Sub-Sector Vision………………………………………………………………………………. o Sub-Sector Goals……………………………………………………………………………….. o Sub-Sector Objectives and Targets……………………………………………………. o Sub-Sector Strategies………………………………………………………………………... o Priority Programs and Projects…………………………………………………………..
153
154 158 159 162 163 164
166 170 172
174 174 175
176 177 178 179 181 181
182 183 184
185 185 185 187 189
� TOURISM DEVELOPMENT � SITUATIONER
o TOURIST ARRIVALS……………………………………………………………………………. o TOURISM SUPPORT FACILITIES AND SERVICES……………………………………
� Tourism Accommodation Establishments …………………………….. � Ancillary Tourism Facilities and Services ……………………………….. � Tourism Infrastructure Support Facilities ………………………………
192 194 194 197 197
________________________________________________________________________________________________
Provincial Development and Physical Framework Plan, Bohol: 2010-2015 (PDPFP: 2010-2015)
147
o BOHOL’S MAJOR TOURISM ATTRACTIONS………………………………………… o TOURISM DEVELOPMENT INITIATIVES AND MANAGEMENT TOOLS
� Development of Tourism Clusters in the Province…………………. � Development of Ecotourism and Biodiversity Framework…….. � Quality Tourism Services Standards………………………………………. � Development of Tourism Highway………………………………………... � Panglao Island Tourism Estate……………………………………………….. � Anda Peninsula Tourism Development………………………………….. � Panglao Airport Development……………………………………………….. � Other Infrastructure Development to Support Tourism………….
� DEVELOPMENT CHALLENGES………………….……………………………………………… � DEVELOPMENT PLAN FRAMEWORK
o Sub-Sector Vision………………………………………………..……………………………. o Sub-Sector Goals……………………………………………………………………………… o Sub-Sector Objectives and Targets…………………………..……………………… o Sub-Sector Strategies……………………………………………………………………… o Priority Programs and Projects…………………………………………………………
197
199 202 202 203 203 204 205 205 206
207 207 207 207 208
� TRADE AND INDUSTRY
� SITUATIONER o EMPLOYMENT
� Labor Force and Employment……………………………………………….. � Employment and Unemployment………………………………………….. � Employment by Sector……………………………………………………………
o ECONOMY AND PRIORITY INDUSTRIES……………………………………………… o INCOME/ ECONOMIC WELL-BEING
� Income and Expenditure Situation…………………………………………. � Prices Indicators……………………………………………………………………. � Poverty Indicators…………………………………………………………………. � Over-all Human Development………………………………………………..
o TRADE AND INDUSTRY � Investments………………………………………………………………………….. � Business Establishments………………………………………………………… � Special Economic Zone/ Industrial Estates Development………. � Land Industry Standards………………………………………………………… � Investment Opportunities in the Province……………………………..
� DEVELOPMENT CHALLENGES………………………………………………………………… � DEVELOPMENT PLAN FRAMEWORK
� Sub-Sector Vision………………………………………………………………….. � Sub-Sector Goals…………………………………………………………………… � Sub-Sector Objectives and Targets………………………………………… � Sub-Sector Strategies…………………………………………………………….. � Priority Programs and Projects……………………………………………….
210 211 212 212
215 216 216 218
218 219 222 223 224 225
226 226 226 227 228
________________________________________________________________________________________________
Provincial Development and Physical Framework Plan, Bohol: 2010-2015 (PDPFP: 2010-2015)
148
LIST OF FIGURES
Figure 1. Area Harvested of Major Crops, Bohol, 2008. Figure 2. Service Areas of Irrigation Facilities, Bohol, 2008 Figure 3. Palay Production, Bohol, 2005-2008 Figure 4.1. Rice Supply and Demand Pattern, Bohol, 2005-2008 Figure 4.2. Rice Sufficiency Level, Bohol, 2005-2008 Figure 5. Central Visayas Rice Production, 2008 Figure 6. Corn Production, Bohol, 2005-2008 Figure 7.1. Corn Supply and Demand Pattern, Bohol, 2005-2008 Figure 7.2. Corn Sufficiency Level, Bohol, 2005-2008 Figure 8. Production of Selected Fruit Crops, 2005-2008 Figure 9. Area Harvested of Major Fruit Crop, Bohol, 2008 Figure 10. Fruit Sufficiency Level, Bohol, 2005-2008 Figure 11.1. Vegetables Supply and Demand Pattern, Bohol, 2008 Figure 11.2. Vegetable Sufficiency Level, Bohol, 2005-2008 Figure 12. Rootcrops Production, Bohol, 2005-2008 Figure 13.1. Rootcrop Supply and Demand Pattern, Bohol, 2005-2008 Figure 13.2. Rootcrop Sufficiency Level, Bohol, 2005-2008 Figure 14. Area Harvested of Selected Rootcrops, Bohol, 2008 Figure 15. Ruminant Inventory, Bohol, 2005-2008 Figure 16. Supply–Demand of Carabeef, Bohol, 2005-2008 Figure 17. Carabeef Sufficiency Level, Bohol, 2005-2008 Figure 18. Chevon Sufficiency Level, Bohol, 2005-2008 Figure 19. Supply-Demand of Beef, Bohol, 2005-2008 Figure 20. Beef Sufficiency Level, Bohol, 2005-2008 Figure 21. Supply-Demand of Chevon, Bohol, 2005-2008 Figure 22. Hog Inventory, Bohol, 2005-2008 Figure 23. Pork Sufficiency Level, Bohol, 2005-2008 Figure 24. Supply – Demand of Pork, Bohol, 2005-2008 Figure 25. Chicken Inventory, Bohol, 2005-2008 Figure 26. Supply–Demand of Chicken, Bohol, 2005-2008 Figure 27. Chicken Sufficiency Level, Bohol, 2005-2008 Figure 28. Supply–Demand of Egg, Bohol, 2005-2008 Figure 29. Egg Sufficiency Level, Bohol, 2005-2008 Figure 30. Fish Supply and Demand, Bohol, 2005-2008 Figure 31. Fish Sufficiency Level, Bohol, 2005-2008 Figure 32. Volume of Fish Catch: Municipal Fishing, Bohol, 2005-2008 Figure 33. Volume of Fish Catch: Commercial Fishing, Bohol, 2005-2008 Figure 34. Aquaculture Production, Bohol, 2005-2008 Figure 35. Average Annual Population Growth Rate (%) of Bohol at Various Censuses,
1948-2007 Figure 36. Production and Consumption of Major Commodities, Bohol, 2008 Figure 37. Domestic and Foreign Tourist Arrivals, Bohol, 2003-2008 Figure 38. Tourist Arrivals, Bohol, 2003-2008.
________________________________________________________________________________________________
Provincial Development and Physical Framework Plan, Bohol: 2010-2015 (PDPFP: 2010-2015)
149
Figure 39. Tourist Arrivals, Region-7, 2008 Figure 40. Projected Room Demand, Bohol, 2009-2015 Figure 41. Total Pop., 15 Years and Over and in the Labor Force, Bohol, 2004-2008 Figure 42. Employed and Unemployed Persons in the Labor Force, Bohol, 2004-2008 Figure 43. Employment by Type of Industry, Bohol, 2003 Figure 44. Bohol Shares of Employed Persons by Type of Industry, 2003 Figure 45. Shares of Total Family Income by HH Head Kind of Business/
Industry, 2000 Figure 46. Capitalization of New Businesses, Bohol, 2005-2008 Figure 47. New Businesses, Bohol, 2005-2008 Figure 48. Registered Businesses by Capitalization, Bohol, 2005-2008 Figure 48. Type of Business Establishments, Bohol, 2005-2008
LIST OF mAPS
Map 1. Palay Production Area (In Hectares) Map 2. Corn Production Area (In Hectares) Map 3. Banana Production Area (In Hectares Map 4. Mango Production Area (In Hectares) Map 5. Coconut Production Area (In Hectares) Map 6. Palm Oil Production Area (In Hectares) Map 7. Vegetables Production Area (In Hectares) Map 8. Irrigation Facilities, Bohol, 2008 Map 9. Accommodation and Tourism Support Facilities Map 10. Major Tourist Attractions and Packaged Destinations Map 11. Proposed Bohol Tourism Clusters Map 12. DTI Registered Businesses, 2008 Map 13. One-Town One-Product (OTOP), Bohol Map 14. Special Economic Zones, Bohol Map Network of Protected Areas for Agriculture and Agro-Industrial Development
(NPAAD) Map Agri-Support Facilities Map Financial Institutions Map Opportunities Map
________________________________________________________________________________________________
Provincial Development and Physical Framework Plan, Bohol: 2010-2015 (PDPFP: 2010-2015)
150
LIST OF Tables
Table 1. Aquaculture Production, Bohol, 2005-2008 Table 2. Population Increase Per Year, Bohol Province Table 3. Food Situation of Major Food Commodities, Bohol, 2006-2008 Table 4. Projected Production and Consumption, Bohol, Years 2009, 2011 and 2013 Table 5. Coop Situationer, Bohol, 2004 – 2008 Table 6. Top 10 Foreign Travelers, Bohol, 2008 Table 7. Projected Tourist Arrivals and Room Demand, Bohol, 2009-2015 Table 8. Projected Room Demand and Jobs to be Generated, Bohol, 2011-2015 Table 9. Labor Force and Employment, Bohol, 2004 – 2008 Table 10. Data Matrix Table: Employed Persons by Type of Industry
from Primary Occupation, 2003 Table 11. Joint Probability Table: Shares of Employed Persons by
Type of Industry from Primary Occupation, 2003 Table 12. Concentration: Employed Persons by Type of Industry
from Primary Occupation, 2003 Table 13. Specialization: Employed Persons by Type of Industry
From Primary Occupation, 2003 Table 14. Shares of Total Family Income by Household Head
Kind of Business/ Industry 2000 Table 15. Percentage of Source of Family Income in Relation to
Regional Totals, 2000 Table 16. Location Quotient, Total Family Income by Business/
by Industry, 2000 Table 17. Poverty Indicators, Bohol, 2000 – 2006 Table 18. Poverty Threshold and Food Threshold, Bohol, 2000 – 2007 Table 19. Human Development Indicators by Sex, Bohol Table 20. Current and Projected Industrial Area Requirement, Bohol
2000-2020
________________________________________________________________________________________________
Provincial Development and Physical Framework Plan, Bohol: 2010-2015 (PDPFP: 2010-2015)
151
ABBREVIATIONS & ACRONYMS AFS Audited Financial Statement AI Artificial Insemination ARB Agrarian Reform Beneficiary ARC Agrarian Reform Community ARCDP Agrarian Reform Communities Development Project ARISP Agrarian Reform Infrastructure Support Project AusAID Australian Agency for International Development BALA Barangay Livetock Aide BAMP Bohol Agriculture Master Plan BAPC Bohol Agriculture Promotion Center BAPC Bohol Agriculture Promotion Center BAS Bureau of Agricultural Statistics BCRIP Bohol Circumferential Road Improvement Project BEPO Bohol Employment Office BES Bohol Experiment Station BFAR Bureau of Fisheries and Aquatic Resources BHIP Bohol Irrigation Project BIPC Bohol Investment Promotion Center BOATech Bohol Organic Agriculture Technology BOFAMCO Bohol Farmers Multipurpose Cooperative BOSS Bohol Business One-Stop Shop BTMP Bohol Tourism Master Plan BTO Bohol Tourism Office CADC Certificate of Ancestral Domain Claim CAPR Cooperative Annual Performance Report CARP Comprehensive Agrarian Reform Program CBU Capital Build-Up CDA Cooperative Development Authority CES Central Experiment Station CIS Communal Irrigation System DA Department of Agriculture DAR Department of Agrarian Reform DOLE Department of Labor and Employment DOT Department of Tourism DTI Department of Trade and Industry FAP Foreign Assisted Project FCS Food Consumption Survey FIES Family Income and Expenditure Survey GMA Ginintuang Masaganang Ani HDI Human Development Index HUDC Housing and Urban Development Council HVC High Variety Crops ICT Information Communications Technology IEC Information Education Campaign IT Information Technology ITES Information Technology (IT)-Enabled Services LGU Local Government Unit LIFE Livestock Integration for Food Enterprise
________________________________________________________________________________________________
Provincial Development and Physical Framework Plan, Bohol: 2010-2015 (PDPFP: 2010-2015)
152
LOM Livestock Oksyon Market MPDP Multi-Purpose Drying Pavement MQSST Manual on Quality Standards for Sustainable Tourism MSME Micro, Small Medium Enterprise NEDA National Economic Development Authority NFA National Food Authority NFA National Food Authority NFS Natural Farming System NGO Non-Government Organization NIS National Irrigation System NSCB National Statistical Coordination Board NSO National Statistics Office OPA Office of Provincial Agriculture OPV Office of Provincial Veterinarian OTOP One-Town One-Product PACAP Philippines-Australia Community Assistance Program PAHRDF Phillipines-Australia Human Resource Development Facility PATCO Provincial Agriculture and Technology Coordinating Office PBIA Panglao Bohol International Airport PCA Philippine Coconut Authority PCC Philippine Carabao Center PGB Provincial Government of Bohol PITE Panglao Island Tourism Estate PO People’s Organization QSST Quality Standards for Sustainable Tourism RACER Rice Accelerated Enhancement Response RSPL Rajah Sikatuna Protected Landscape SCFO Small Coconut Farmers Organization SIAP Sustainable Integrated Agribusiness Program T&B Toilet and Bath TMP Tourism Master Plan UNDP United Nations Development Program UNESCO United Nations Educational, Scientific and Cultural Organization USF Ubay Stock Farm
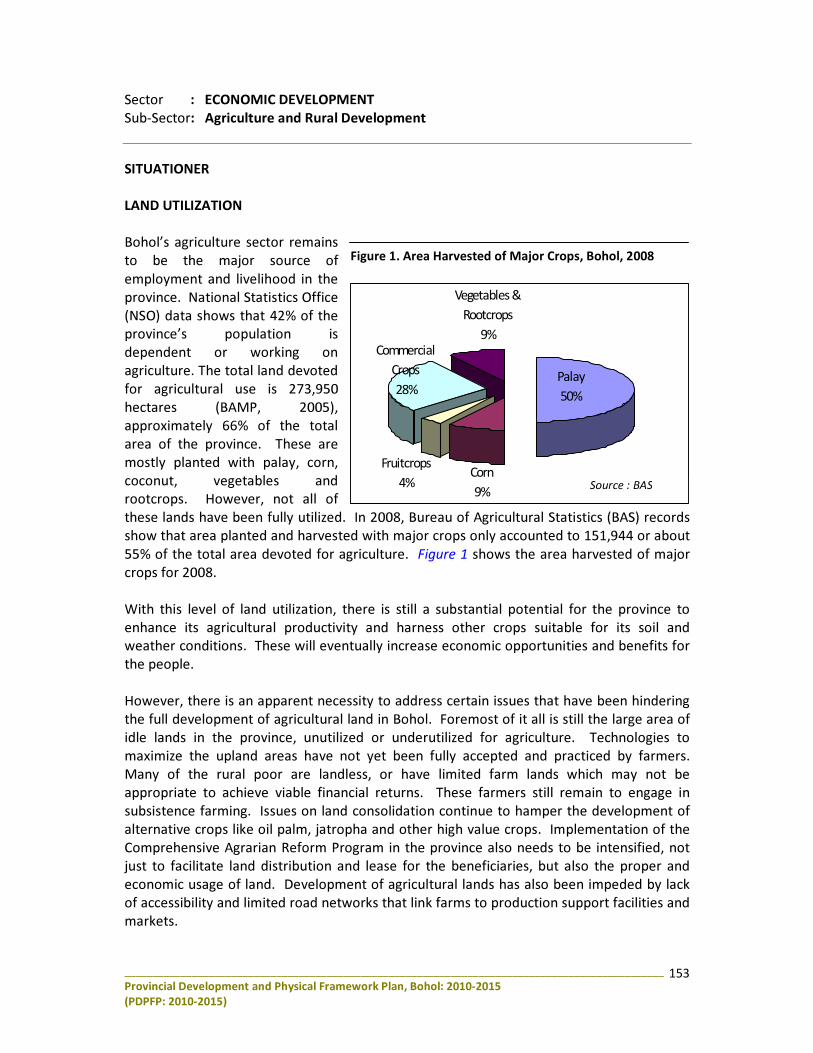
________________________________________________________________________________________________
Provincial Development and Physical Framework Plan, Bohol: 2010-2015 (PDPFP: 2010-2015)
153
Sector : ECONOMIC DEVELOPMENT Sub-Sector: Agriculture and Rural Development
SITUATIONER LAND UTILIZATION Bohol’s agriculture sector remains to be the major source of employment and livelihood in the province. National Statistics Office (NSO) data shows that 42% of the province’s population is dependent or working on agriculture. The total land devoted for agricultural use is 273,950 hectares (BAMP, 2005), approximately 66% of the total area of the province. These are mostly planted with palay, corn, coconut, vegetables and rootcrops. However, not all of these lands have been fully utilized. In 2008, Bureau of Agricultural Statistics (BAS) records show that area planted and harvested with major crops only accounted to 151,944 or about 55% of the total area devoted for agriculture. Figure 1 shows the area harvested of major crops for 2008. With this level of land utilization, there is still a substantial potential for the province to enhance its agricultural productivity and harness other crops suitable for its soil and weather conditions. These will eventually increase economic opportunities and benefits for the people. However, there is an apparent necessity to address certain issues that have been hindering the full development of agricultural land in Bohol. Foremost of it all is still the large area of idle lands in the province, unutilized or underutilized for agriculture. Technologies to maximize the upland areas have not yet been fully accepted and practiced by farmers. Many of the rural poor are landless, or have limited farm lands which may not be appropriate to achieve viable financial returns. These farmers still remain to engage in subsistence farming. Issues on land consolidation continue to hamper the development of alternative crops like oil palm, jatropha and other high value crops. Implementation of the Comprehensive Agrarian Reform Program in the province also needs to be intensified, not just to facilitate land distribution and lease for the beneficiaries, but also the proper and economic usage of land. Development of agricultural lands has also been impeded by lack of accessibility and limited road networks that link farms to production support facilities and markets.
Figure 1. Area Harvested of Major Crops, Bohol, 2008
Palay50%
Vegetables & Rootcrops
9%Commercial
Crops28%
Corn9%
Fruitcrops4% Source : BAS
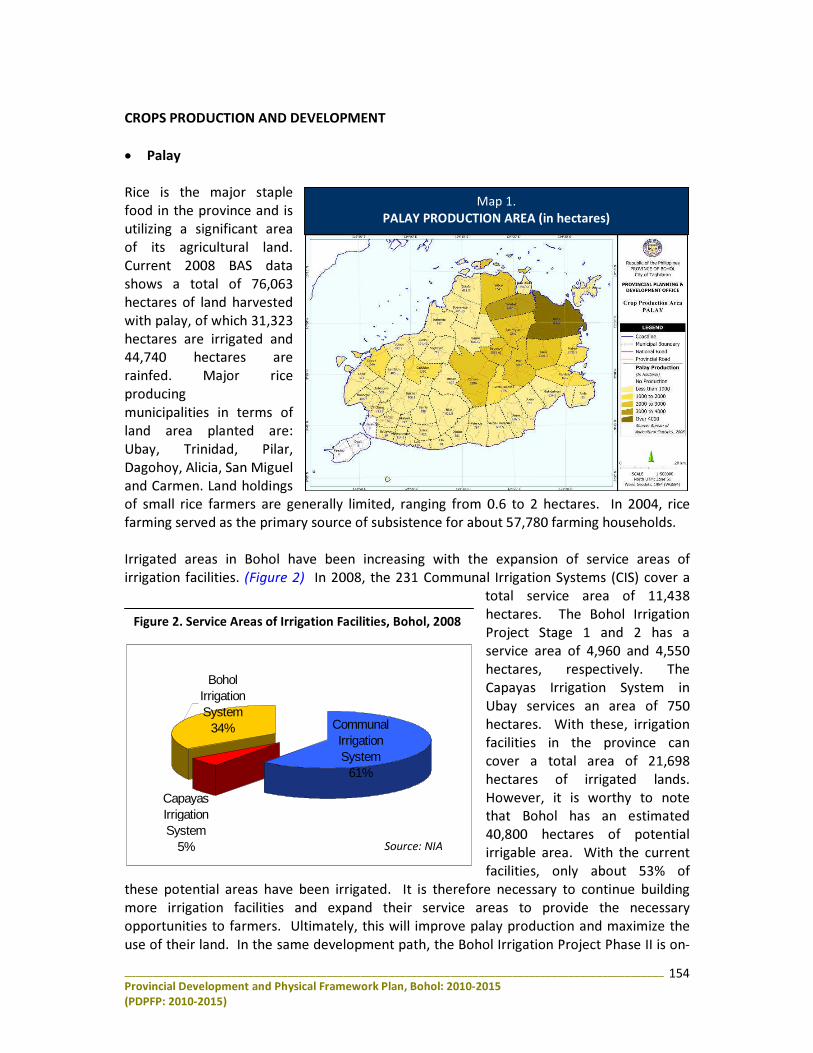
________________________________________________________________________________________________
Provincial Development and Physical Framework Plan, Bohol: 2010-2015 (PDPFP: 2010-2015)
154
CROPS PRODUCTION AND DEVELOPMENT • Palay Rice is the major staple food in the province and is utilizing a significant area of its agricultural land. Current 2008 BAS data shows a total of 76,063 hectares of land harvested with palay, of which 31,323 hectares are irrigated and 44,740 hectares are rainfed. Major rice producing municipalities in terms of land area planted are: Ubay, Trinidad, Pilar, Dagohoy, Alicia, San Miguel and Carmen. Land holdings of small rice farmers are generally limited, ranging from 0.6 to 2 hectares. In 2004, rice farming served as the primary source of subsistence for about 57,780 farming households. Irrigated areas in Bohol have been increasing with the expansion of service areas of irrigation facilities. (Figure 2) In 2008, the 231 Communal Irrigation Systems (CIS) cover a
total service area of 11,438 hectares. The Bohol Irrigation Project Stage 1 and 2 has a service area of 4,960 and 4,550 hectares, respectively. The Capayas Irrigation System in Ubay services an area of 750 hectares. With these, irrigation facilities in the province can cover a total area of 21,698 hectares of irrigated lands. However, it is worthy to note that Bohol has an estimated 40,800 hectares of potential irrigable area. With the current facilities, only about 53% of
these potential areas have been irrigated. It is therefore necessary to continue building more irrigation facilities and expand their service areas to provide the necessary opportunities to farmers. Ultimately, this will improve palay production and maximize the use of their land. In the same development path, the Bohol Irrigation Project Phase II is on-
Map 1. PALAY PRODUCTION AREA (in hectares)
Figure 2. Service Areas of Irrigation Facilities, Bohol, 2008
Bohol Irrigation System
34%
Capayas Irrigation System
5%
Communal Irrigation System
61%
Source: NIA
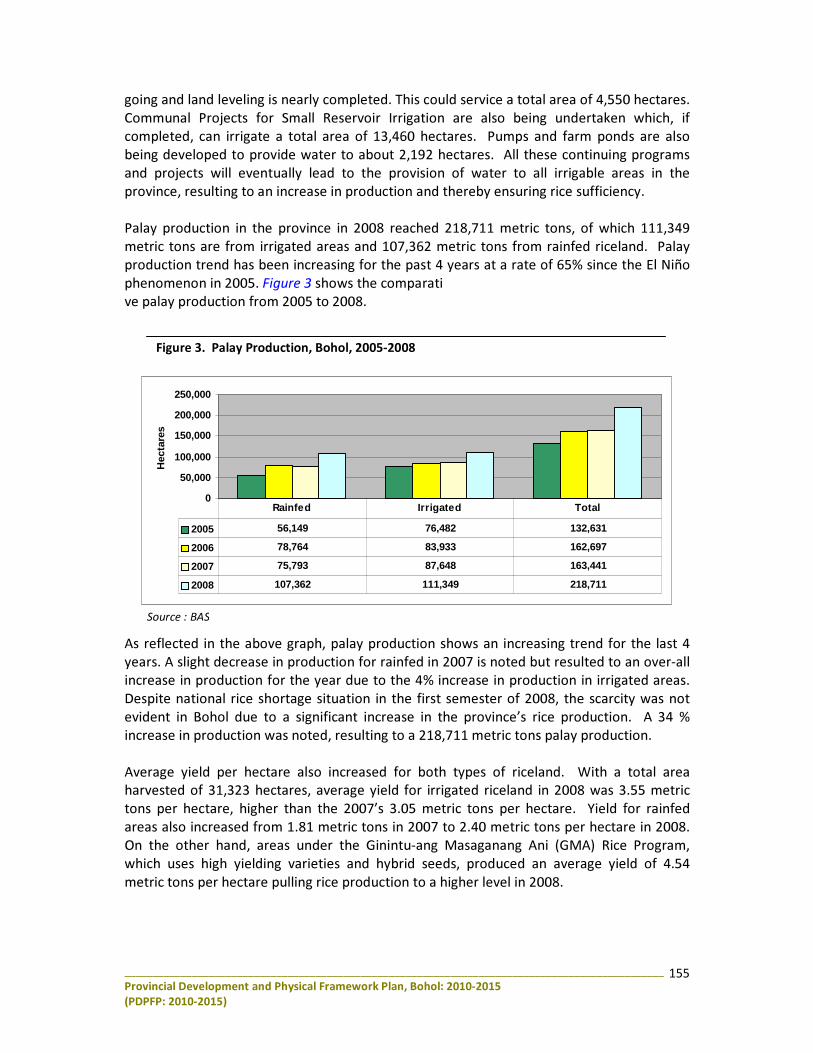
________________________________________________________________________________________________
Provincial Development and Physical Framework Plan, Bohol: 2010-2015 (PDPFP: 2010-2015)
155
going and land leveling is nearly completed. This could service a total area of 4,550 hectares. Communal Projects for Small Reservoir Irrigation are also being undertaken which, if completed, can irrigate a total area of 13,460 hectares. Pumps and farm ponds are also being developed to provide water to about 2,192 hectares. All these continuing programs and projects will eventually lead to the provision of water to all irrigable areas in the province, resulting to an increase in production and thereby ensuring rice sufficiency. Palay production in the province in 2008 reached 218,711 metric tons, of which 111,349 metric tons are from irrigated areas and 107,362 metric tons from rainfed riceland. Palay production trend has been increasing for the past 4 years at a rate of 65% since the El Niño phenomenon in 2005. Figure 3 shows the comparati ve palay production from 2005 to 2008. As reflected in the above graph, palay production shows an increasing trend for the last 4 years. A slight decrease in production for rainfed in 2007 is noted but resulted to an over-all increase in production for the year due to the 4% increase in production in irrigated areas. Despite national rice shortage situation in the first semester of 2008, the scarcity was not evident in Bohol due to a significant increase in the province’s rice production. A 34 % increase in production was noted, resulting to a 218,711 metric tons palay production. Average yield per hectare also increased for both types of riceland. With a total area harvested of 31,323 hectares, average yield for irrigated riceland in 2008 was 3.55 metric tons per hectare, higher than the 2007’s 3.05 metric tons per hectare. Yield for rainfed areas also increased from 1.81 metric tons in 2007 to 2.40 metric tons per hectare in 2008. On the other hand, areas under the Ginintu-ang Masaganang Ani (GMA) Rice Program, which uses high yielding varieties and hybrid seeds, produced an average yield of 4.54 metric tons per hectare pulling rice production to a higher level in 2008.
Source : BAS
Figure 3. Palay Production, Bohol, 2005-2008
0
50,000
100,000
150,000
200,000
250,000
Hec
tare
s
2005 56,149 76,482 132,631
2006 78,764 83,933 162,697
2007 75,793 87,648 163,441
2008 107,362 111,349 218,711
Rainfed Irrigated Total
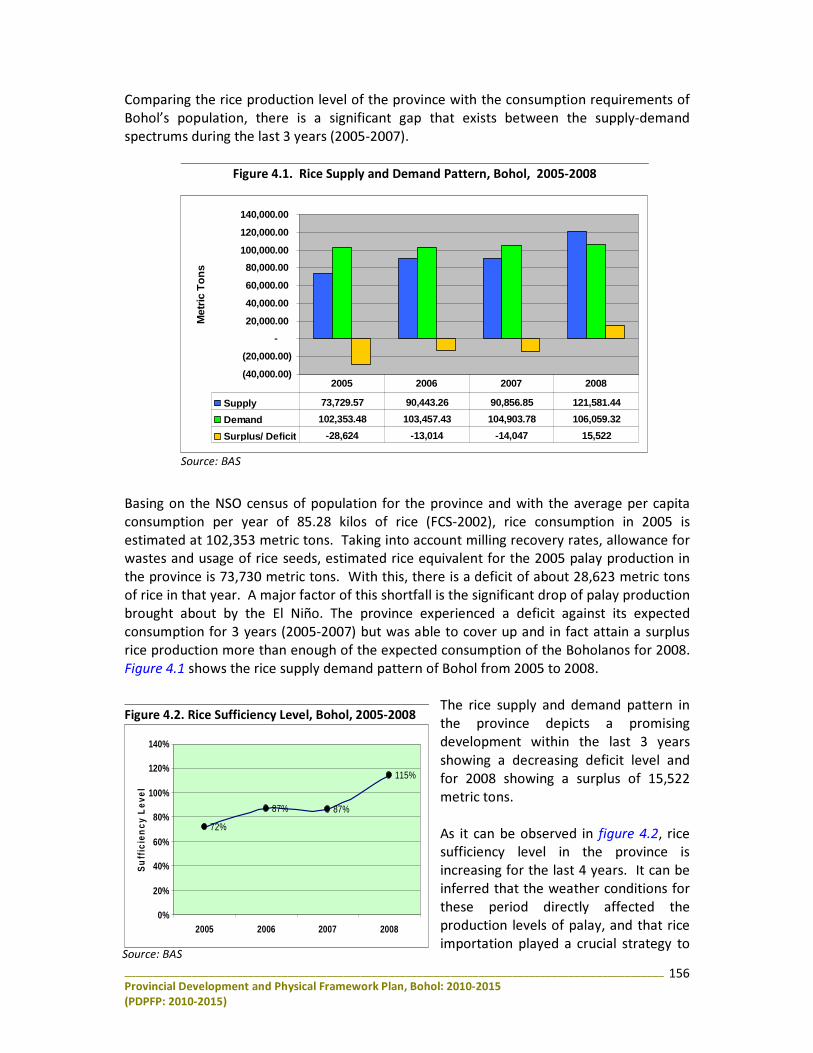
________________________________________________________________________________________________
Provincial Development and Physical Framework Plan, Bohol: 2010-2015 (PDPFP: 2010-2015)
156
Comparing the rice production level of the province with the consumption requirements of Bohol’s population, there is a significant gap that exists between the supply-demand spectrums during the last 3 years (2005-2007). Basing on the NSO census of population for the province and with the average per capita consumption per year of 85.28 kilos of rice (FCS-2002), rice consumption in 2005 is estimated at 102,353 metric tons. Taking into account milling recovery rates, allowance for wastes and usage of rice seeds, estimated rice equivalent for the 2005 palay production in the province is 73,730 metric tons. With this, there is a deficit of about 28,623 metric tons of rice in that year. A major factor of this shortfall is the significant drop of palay production brought about by the El Niño. The province experienced a deficit against its expected consumption for 3 years (2005-2007) but was able to cover up and in fact attain a surplus rice production more than enough of the expected consumption of the Boholanos for 2008. Figure 4.1 shows the rice supply demand pattern of Bohol from 2005 to 2008.
The rice supply and demand pattern in the province depicts a promising development within the last 3 years showing a decreasing deficit level and for 2008 showing a surplus of 15,522 metric tons. As it can be observed in figure 4.2, rice sufficiency level in the province is increasing for the last 4 years. It can be inferred that the weather conditions for these period directly affected the production levels of palay, and that rice importation played a crucial strategy to
Figure 4.1. Rice Supply and Demand Pattern, Bohol, 2005-2008
Source: BAS
(40,000.00)
(20,000.00)
-
20,000.00
40,000.00
60,000.00
80,000.00
100,000.00
120,000.00
140,000.00M
etri
c T
on
s
Supply 73,729.57 90,443.26 90,856.85 121,581.44
Demand 102,353.48 103,457.43 104,903.78 106,059.32
Surplus/ Deficit -28,624 -13,014 -14,047 15,522
2005 2006 2007 2008
Source: BAS
Figure 4.2. Rice Sufficiency Level, Bohol, 2005-2008
72%
87% 87%
115%
0%
20%
40%
60%
80%
100%
120%
140%
2005 2006 2007 2008
Su
ffic
ien
cy L
evel
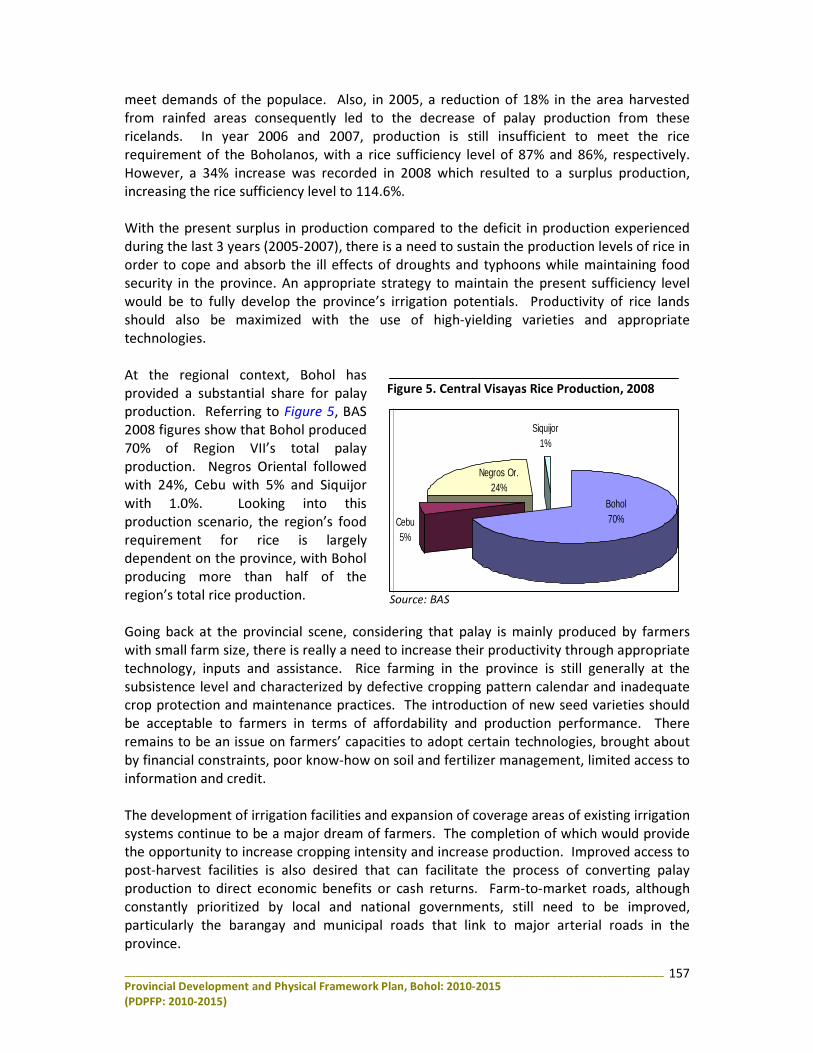
________________________________________________________________________________________________
Provincial Development and Physical Framework Plan, Bohol: 2010-2015 (PDPFP: 2010-2015)
157
meet demands of the populace. Also, in 2005, a reduction of 18% in the area harvested from rainfed areas consequently led to the decrease of palay production from these ricelands. In year 2006 and 2007, production is still insufficient to meet the rice requirement of the Boholanos, with a rice sufficiency level of 87% and 86%, respectively. However, a 34% increase was recorded in 2008 which resulted to a surplus production, increasing the rice sufficiency level to 114.6%. With the present surplus in production compared to the deficit in production experienced during the last 3 years (2005-2007), there is a need to sustain the production levels of rice in order to cope and absorb the ill effects of droughts and typhoons while maintaining food security in the province. An appropriate strategy to maintain the present sufficiency level would be to fully develop the province’s irrigation potentials. Productivity of rice lands should also be maximized with the use of high-yielding varieties and appropriate technologies. At the regional context, Bohol has provided a substantial share for palay production. Referring to Figure 5, BAS 2008 figures show that Bohol produced 70% of Region VII’s total palay production. Negros Oriental followed with 24%, Cebu with 5% and Siquijor with 1.0%. Looking into this production scenario, the region’s food requirement for rice is largely dependent on the province, with Bohol producing more than half of the region’s total rice production. Going back at the provincial scene, considering that palay is mainly produced by farmers with small farm size, there is really a need to increase their productivity through appropriate technology, inputs and assistance. Rice farming in the province is still generally at the subsistence level and characterized by defective cropping pattern calendar and inadequate crop protection and maintenance practices. The introduction of new seed varieties should be acceptable to farmers in terms of affordability and production performance. There remains to be an issue on farmers’ capacities to adopt certain technologies, brought about by financial constraints, poor know-how on soil and fertilizer management, limited access to information and credit. The development of irrigation facilities and expansion of coverage areas of existing irrigation systems continue to be a major dream of farmers. The completion of which would provide the opportunity to increase cropping intensity and increase production. Improved access to post-harvest facilities is also desired that can facilitate the process of converting palay production to direct economic benefits or cash returns. Farm-to-market roads, although constantly prioritized by local and national governments, still need to be improved, particularly the barangay and municipal roads that link to major arterial roads in the province.
Figure 5. Central Visayas Rice Production, 2008
Siquijor1%
Bohol70%
Negros Or.24%
Cebu5%
Source: BAS

________________________________________________________________________________________________
Provincial Development and Physical Framework Plan, Bohol: 2010-2015 (PDPFP: 2010-2015)
158
• Corn Being an alternative food for rice, corn is consumed by about 16% of Bohol’s population. The industrial demand for this crop is also increasing, as the livestock sector in the province continues to prosper. In 2008, there are about 14,325 hectares of land harvested with corn. Much of these lands are utilized for white corn production (13,949 hectares – 97.4%) and some lands for yellow corn production (376 hectares – 2.6%). Farmers engaged in corn production have limited farm size with land holdings between 0.5 hectares to 1.5 hectares. There are about 19 municipalities identified as key production areas for corn in Bohol. Corn production in the province is characterized by a fluctuating trend. With the El Niño in 2005, corn production in the province decreased from its 2004 levels. That year, corn lands produced a total of 11,690 metric tons of corn, marking a 15% decrease from the 13,831 metric ton production in 2004. With the mentioned area harvested, average corn yield was about 0.77 metric ton per hectare, much lower than the 0.93 metric ton per hectare in 2004. (Figure 6) In totality, there is a deficit in corn production to satisfy the consumption needs of the Boholanos. With consideration on milling recovery rates, allowance for waste and usage of corn seeds and feeds, corn grits production in 2008 was estimated at 7,055 metric tons. However, with an estimated per capita consumption of 8.74 kilos per year (FCS, 2002), total corn requirement in 2008 was estimated at 10,870 metric tons. A deficit therefore exists for
Source: BAS
Figure 6. Corn Production, Bohol, 2005-2008
0
5,000
10,000
15,000
20,000
Met
ric
To
ns
White Corn 9,385 10,118 13,267 11,181
Yellow Corn 2,305 457 3,405 1,164
Total 11,690 10,575 16,672 12,345
2005 2006 2007 2008
Map 2. CORN PRODUCTION AREA (in hectares)
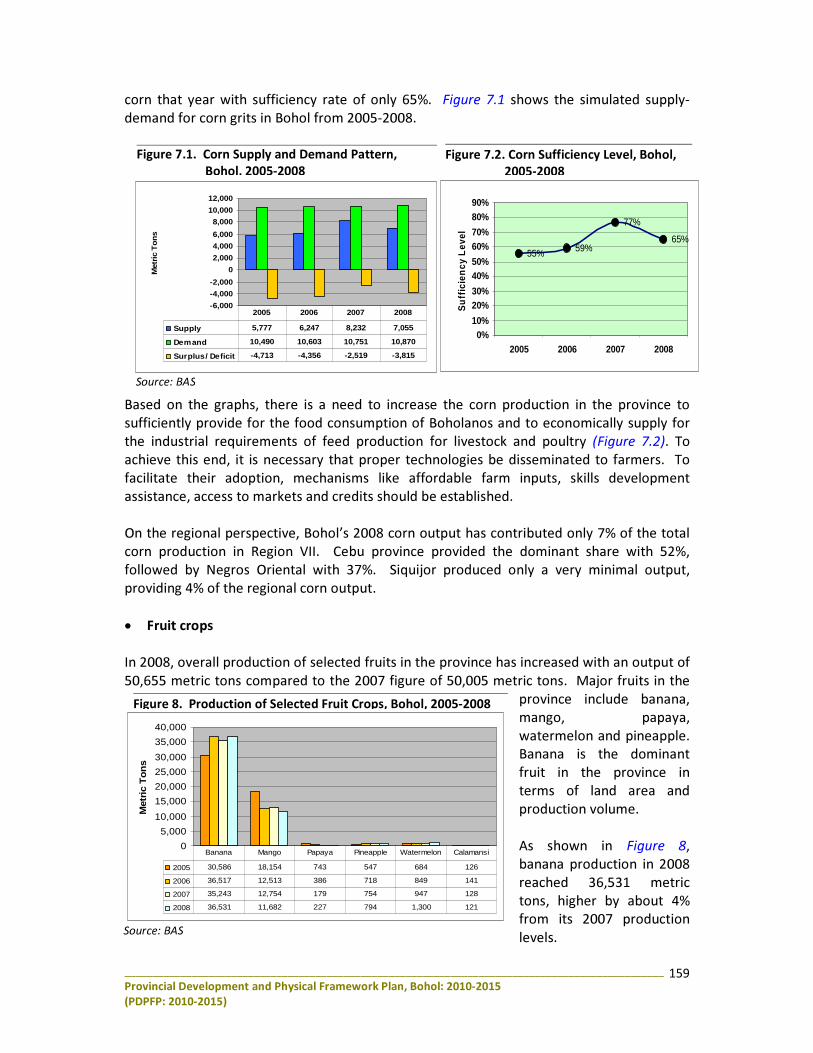
________________________________________________________________________________________________
Provincial Development and Physical Framework Plan, Bohol: 2010-2015 (PDPFP: 2010-2015)
159
corn that year with sufficiency rate of only 65%. Figure 7.1 shows the simulated supply-demand for corn grits in Bohol from 2005-2008.
Based on the graphs, there is a need to increase the corn production in the province to sufficiently provide for the food consumption of Boholanos and to economically supply for the industrial requirements of feed production for livestock and poultry (Figure 7.2). To achieve this end, it is necessary that proper technologies be disseminated to farmers. To facilitate their adoption, mechanisms like affordable farm inputs, skills development assistance, access to markets and credits should be established. On the regional perspective, Bohol’s 2008 corn output has contributed only 7% of the total corn production in Region VII. Cebu province provided the dominant share with 52%, followed by Negros Oriental with 37%. Siquijor produced only a very minimal output, providing 4% of the regional corn output. • Fruit crops In 2008, overall production of selected fruits in the province has increased with an output of 50,655 metric tons compared to the 2007 figure of 50,005 metric tons. Major fruits in the
province include banana, mango, papaya, watermelon and pineapple. Banana is the dominant fruit in the province in terms of land area and production volume. As shown in Figure 8, banana production in 2008 reached 36,531 metric tons, higher by about 4% from its 2007 production levels.
Figure 8. Production of Selected Fruit Crops, Bohol, 2005-2008
0
5,000
10,000
15,000
20,000
25,000
30,000
35,000
40,000
Met
ric
To
ns
2005 30,586 18,154 743 547 684 126
2006 36,517 12,513 386 718 849 141
2007 35,243 12,754 179 754 947 128
2008 36,531 11,682 227 794 1,300 121
Banana Mango Papaya Pineapple Watermelon Calamansi
Source: BAS
Figure 7.2. Corn Sufficiency Level, Bohol, 2005-2008
Figure 7.1. Corn Supply and Demand Pattern, Bohol, 2005-2008
-6,000
-4,000
-2,000
0
2,000
4,000
6,000
8,000
10,000
12,000
Met
ric
To
ns
Supply 5,777 6,247 8,232 7,055
Demand 10,490 10,603 10,751 10,870
Surplus/ Deficit -4,713 -4,356 -2,519 -3,815
2005 2006 2007 2008
55% 59%
77%
65%
0%10%
20%30%
40%50%
60%70%
80%90%
2005 2006 2007 2008
Su
ffic
ien
cy L
evel
Source: BAS
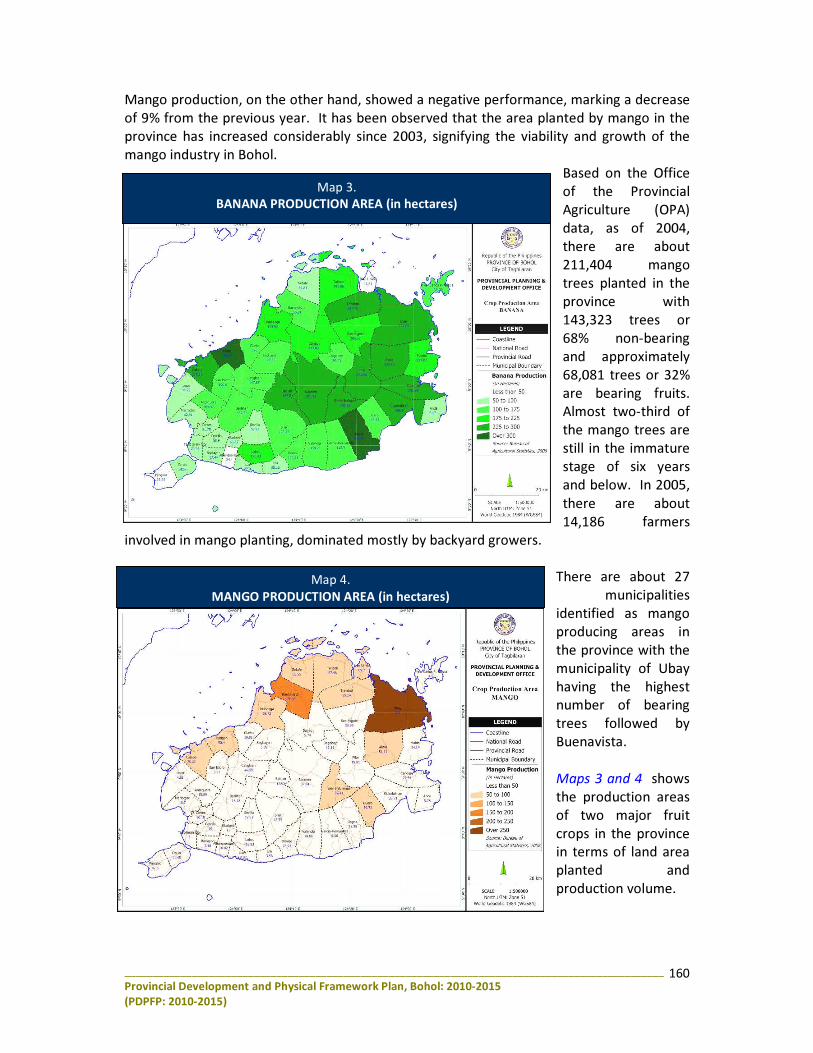
________________________________________________________________________________________________
Provincial Development and Physical Framework Plan, Bohol: 2010-2015 (PDPFP: 2010-2015)
160
Mango production, on the other hand, showed a negative performance, marking a decrease of 9% from the previous year. It has been observed that the area planted by mango in the province has increased considerably since 2003, signifying the viability and growth of the mango industry in Bohol.
Based on the Office of the Provincial Agriculture (OPA) data, as of 2004, there are about 211,404 mango trees planted in the province with 143,323 trees or 68% non-bearing and approximately 68,081 trees or 32% are bearing fruits. Almost two-third of the mango trees are still in the immature stage of six years and below. In 2005, there are about 14,186 farmers
involved in mango planting, dominated mostly by backyard growers. There are about 27
municipalities identified as mango producing areas in the province with the municipality of Ubay having the highest number of bearing trees followed by Buenavista. Maps 3 and 4 shows the production areas of two major fruit crops in the province in terms of land area planted and production volume.
Map 3. BANANA PRODUCTION AREA (in hectares)
Map 4. MANGO PRODUCTION AREA (in hectares)
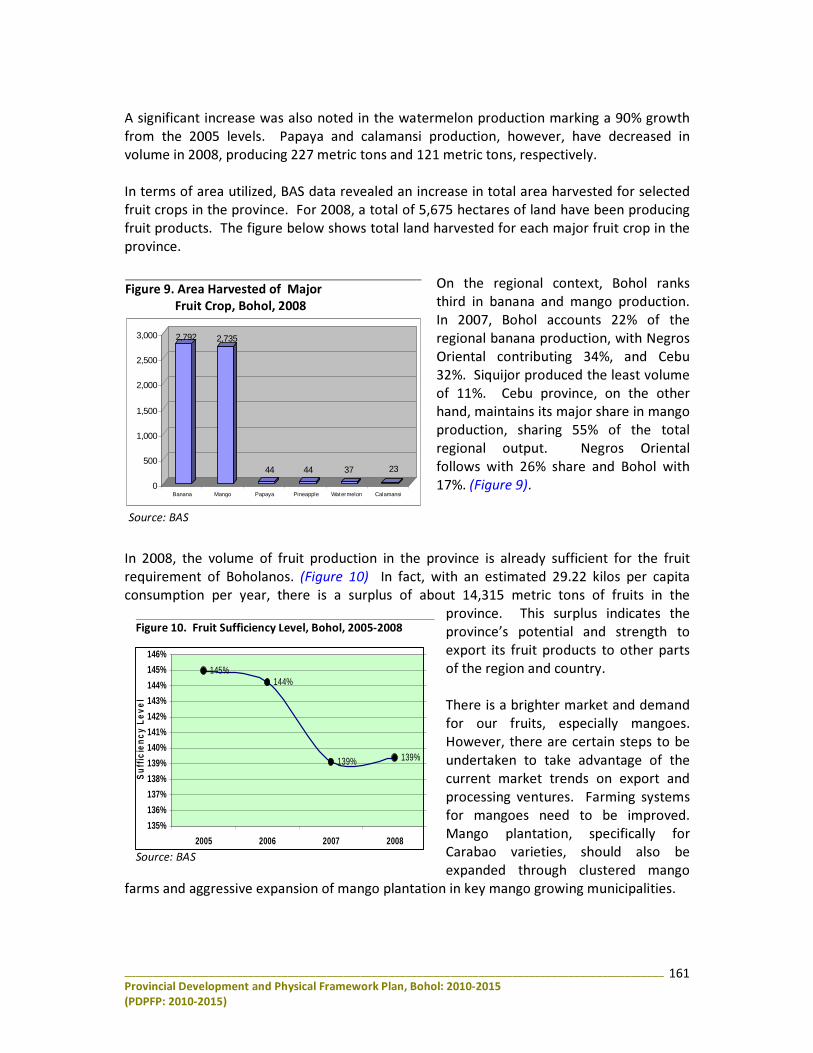
________________________________________________________________________________________________
Provincial Development and Physical Framework Plan, Bohol: 2010-2015 (PDPFP: 2010-2015)
161
A significant increase was also noted in the watermelon production marking a 90% growth from the 2005 levels. Papaya and calamansi production, however, have decreased in volume in 2008, producing 227 metric tons and 121 metric tons, respectively. In terms of area utilized, BAS data revealed an increase in total area harvested for selected fruit crops in the province. For 2008, a total of 5,675 hectares of land have been producing fruit products. The figure below shows total land harvested for each major fruit crop in the province.
On the regional context, Bohol ranks third in banana and mango production. In 2007, Bohol accounts 22% of the regional banana production, with Negros Oriental contributing 34%, and Cebu 32%. Siquijor produced the least volume of 11%. Cebu province, on the other hand, maintains its major share in mango production, sharing 55% of the total regional output. Negros Oriental follows with 26% share and Bohol with 17%. (Figure 9).
In 2008, the volume of fruit production in the province is already sufficient for the fruit requirement of Boholanos. (Figure 10) In fact, with an estimated 29.22 kilos per capita consumption per year, there is a surplus of about 14,315 metric tons of fruits in the
province. This surplus indicates the province’s potential and strength to export its fruit products to other parts of the region and country. There is a brighter market and demand for our fruits, especially mangoes. However, there are certain steps to be undertaken to take advantage of the current market trends on export and processing ventures. Farming systems for mangoes need to be improved. Mango plantation, specifically for Carabao varieties, should also be expanded through clustered mango
farms and aggressive expansion of mango plantation in key mango growing municipalities.
2,792 2,735
44 44 37 23
0
500
1,000
1,500
2,000
2,500
3,000
Banana Mango Papaya Pineapple Watermelon Calamansi
Figure 9. Area Harvested of Major Fruit Crop, Bohol, 2008
Source: BAS
Figure 10. Fruit Sufficiency Level, Bohol, 2005-2008
Source: BAS
145%144%
139% 139%
135%
136%
137%
138%
139%
140%
141%
142%
143%
144%
145%
146%
2005 2006 2007 2008
Suf
ficie
ncy
Leve
l
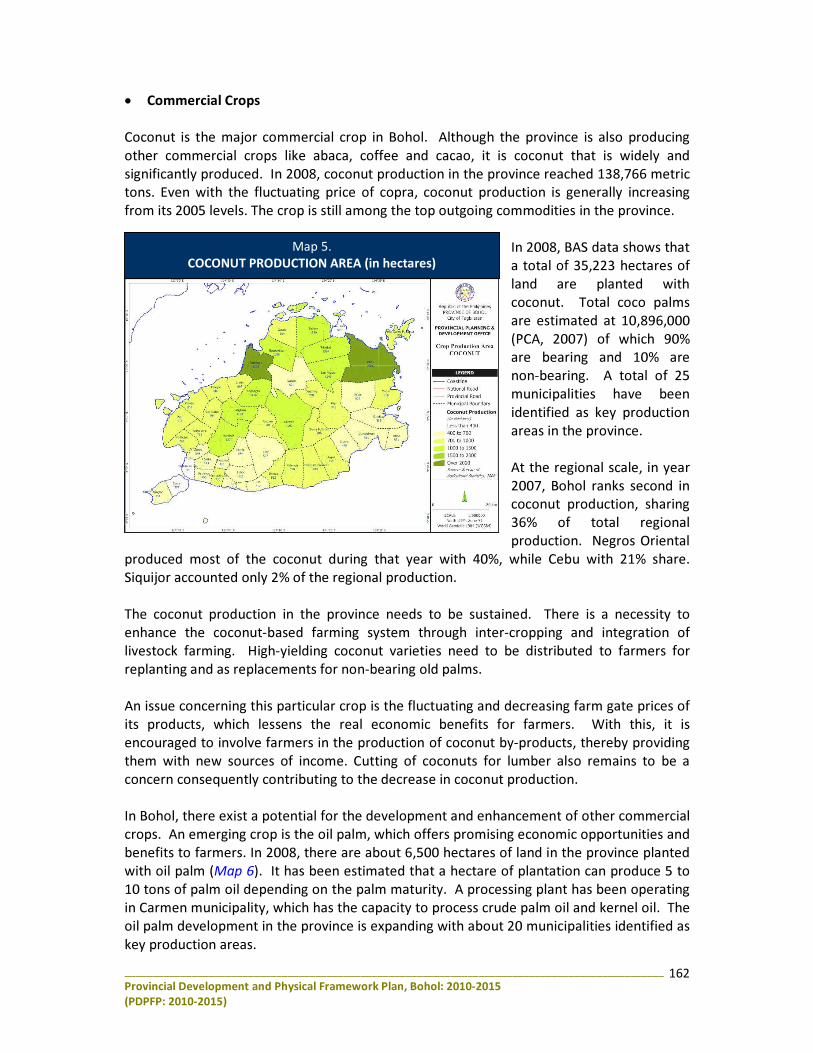
________________________________________________________________________________________________
Provincial Development and Physical Framework Plan, Bohol: 2010-2015 (PDPFP: 2010-2015)
162
• Commercial Crops Coconut is the major commercial crop in Bohol. Although the province is also producing other commercial crops like abaca, coffee and cacao, it is coconut that is widely and significantly produced. In 2008, coconut production in the province reached 138,766 metric tons. Even with the fluctuating price of copra, coconut production is generally increasing from its 2005 levels. The crop is still among the top outgoing commodities in the province.
In 2008, BAS data shows that a total of 35,223 hectares of land are planted with coconut. Total coco palms are estimated at 10,896,000 (PCA, 2007) of which 90% are bearing and 10% are non-bearing. A total of 25 municipalities have been identified as key production areas in the province. At the regional scale, in year 2007, Bohol ranks second in coconut production, sharing 36% of total regional production. Negros Oriental
produced most of the coconut during that year with 40%, while Cebu with 21% share. Siquijor accounted only 2% of the regional production. The coconut production in the province needs to be sustained. There is a necessity to enhance the coconut-based farming system through inter-cropping and integration of livestock farming. High-yielding coconut varieties need to be distributed to farmers for replanting and as replacements for non-bearing old palms. An issue concerning this particular crop is the fluctuating and decreasing farm gate prices of its products, which lessens the real economic benefits for farmers. With this, it is encouraged to involve farmers in the production of coconut by-products, thereby providing them with new sources of income. Cutting of coconuts for lumber also remains to be a concern consequently contributing to the decrease in coconut production. In Bohol, there exist a potential for the development and enhancement of other commercial crops. An emerging crop is the oil palm, which offers promising economic opportunities and benefits to farmers. In 2008, there are about 6,500 hectares of land in the province planted with oil palm (Map 6). It has been estimated that a hectare of plantation can produce 5 to 10 tons of palm oil depending on the palm maturity. A processing plant has been operating in Carmen municipality, which has the capacity to process crude palm oil and kernel oil. The oil palm development in the province is expanding with about 20 municipalities identified as key production areas.
Map 5. COCONUT PRODUCTION AREA (in hectares)
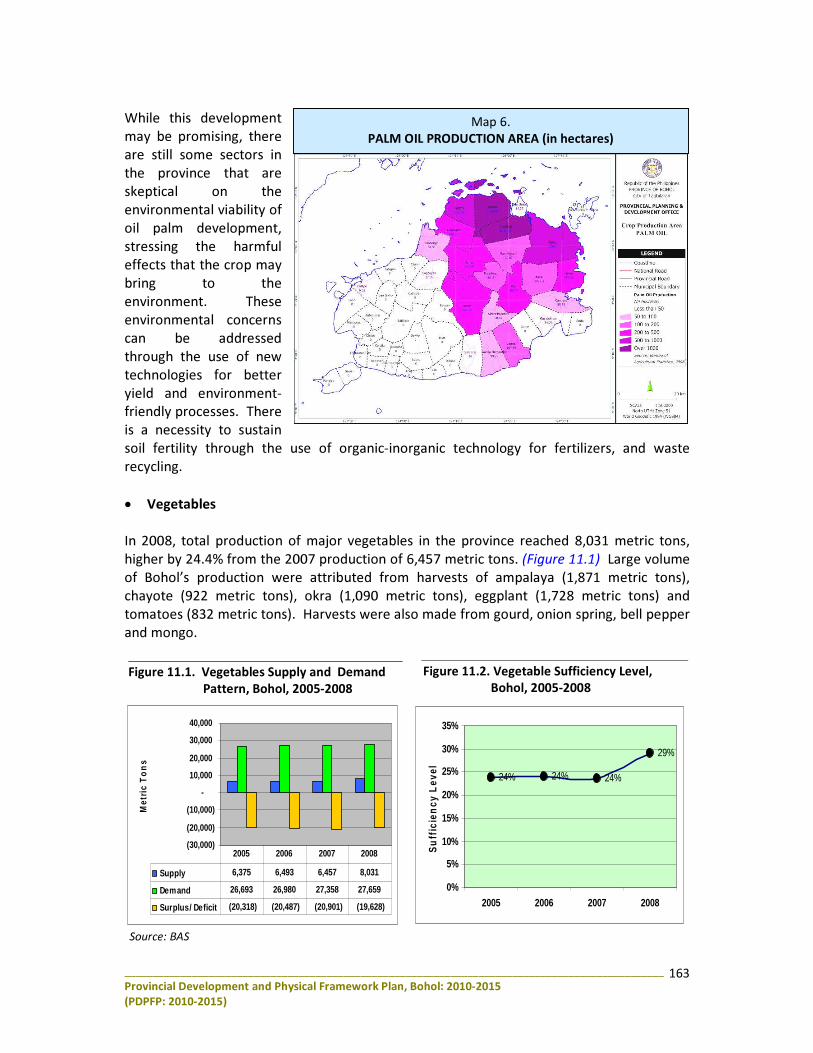
________________________________________________________________________________________________
Provincial Development and Physical Framework Plan, Bohol: 2010-2015 (PDPFP: 2010-2015)
163
While this development may be promising, there are still some sectors in the province that are skeptical on the environmental viability of oil palm development, stressing the harmful effects that the crop may bring to the environment. These environmental concerns can be addressed through the use of new technologies for better yield and environment-friendly processes. There is a necessity to sustain soil fertility through the use of organic-inorganic technology for fertilizers, and waste recycling. • Vegetables In 2008, total production of major vegetables in the province reached 8,031 metric tons, higher by 24.4% from the 2007 production of 6,457 metric tons. (Figure 11.1) Large volume of Bohol’s production were attributed from harvests of ampalaya (1,871 metric tons), chayote (922 metric tons), okra (1,090 metric tons), eggplant (1,728 metric tons) and tomatoes (832 metric tons). Harvests were also made from gourd, onion spring, bell pepper and mongo.
Map 6. PALM OIL PRODUCTION AREA (in hectares)
Figure 11.2. Vegetable Sufficiency Level, Bohol, 2005-2008
Figure 11.1. Vegetables Supply and Demand Pattern, Bohol, 2005-2008
24% 24% 24%
29%
0%
5%
10%
15%
20%
25%
30%
35%
2005 2006 2007 2008
Su
ffic
ien
cy L
evel
Source: BAS
(30,000)
(20,000)
(10,000)
-
10,000
20,000
30,000
40,000
Met
ric
To
ns
Supply 6,375 6,493 6,457 8,031
Demand 26,693 26,980 27,358 27,659
Surplus/ Deficit (20,318) (20,487) (20,901) (19,628)
2005 2006 2007 2008
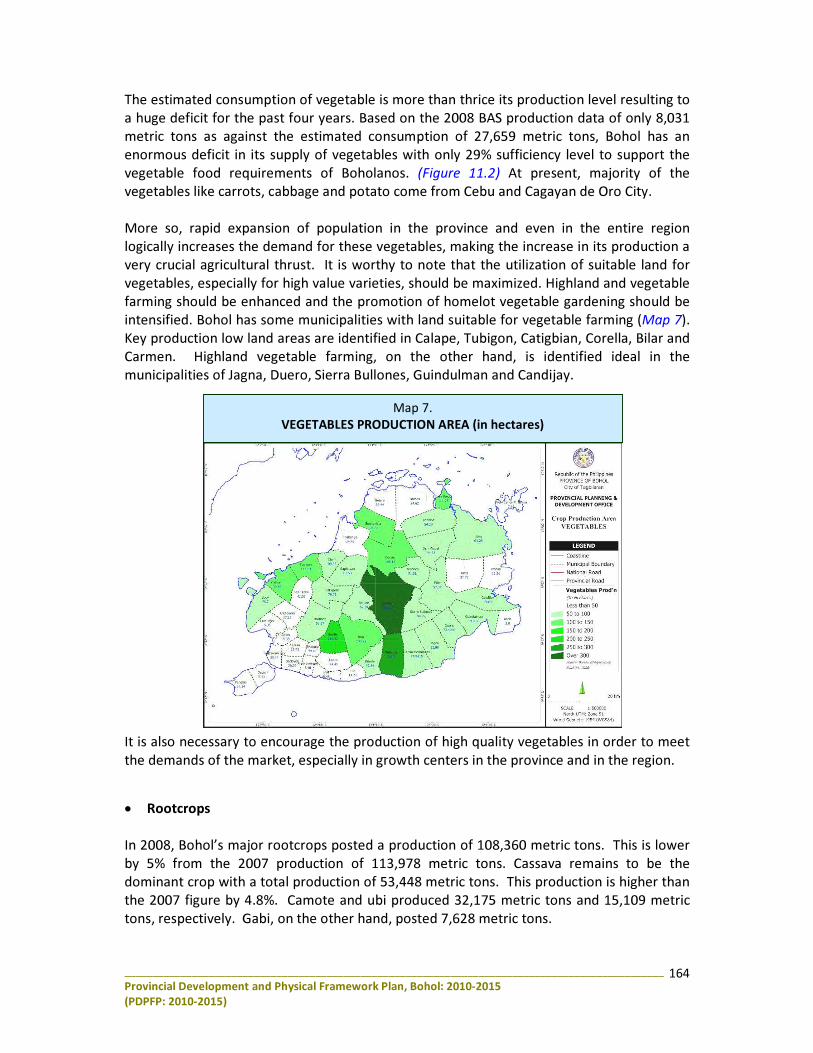
________________________________________________________________________________________________
Provincial Development and Physical Framework Plan, Bohol: 2010-2015 (PDPFP: 2010-2015)
164
Map 7. VEGETABLES PRODUCTION AREA (in hectares)
The estimated consumption of vegetable is more than thrice its production level resulting to a huge deficit for the past four years. Based on the 2008 BAS production data of only 8,031 metric tons as against the estimated consumption of 27,659 metric tons, Bohol has an enormous deficit in its supply of vegetables with only 29% sufficiency level to support the vegetable food requirements of Boholanos. (Figure 11.2) At present, majority of the vegetables like carrots, cabbage and potato come from Cebu and Cagayan de Oro City. More so, rapid expansion of population in the province and even in the entire region logically increases the demand for these vegetables, making the increase in its production a very crucial agricultural thrust. It is worthy to note that the utilization of suitable land for vegetables, especially for high value varieties, should be maximized. Highland and vegetable farming should be enhanced and the promotion of homelot vegetable gardening should be intensified. Bohol has some municipalities with land suitable for vegetable farming (Map 7). Key production low land areas are identified in Calape, Tubigon, Catigbian, Corella, Bilar and Carmen. Highland vegetable farming, on the other hand, is identified ideal in the municipalities of Jagna, Duero, Sierra Bullones, Guindulman and Candijay. It is also necessary to encourage the production of high quality vegetables in order to meet the demands of the market, especially in growth centers in the province and in the region.
• Rootcrops In 2008, Bohol’s major rootcrops posted a production of 108,360 metric tons. This is lower by 5% from the 2007 production of 113,978 metric tons. Cassava remains to be the dominant crop with a total production of 53,448 metric tons. This production is higher than the 2007 figure by 4.8%. Camote and ubi produced 32,175 metric tons and 15,109 metric tons, respectively. Gabi, on the other hand, posted 7,628 metric tons.
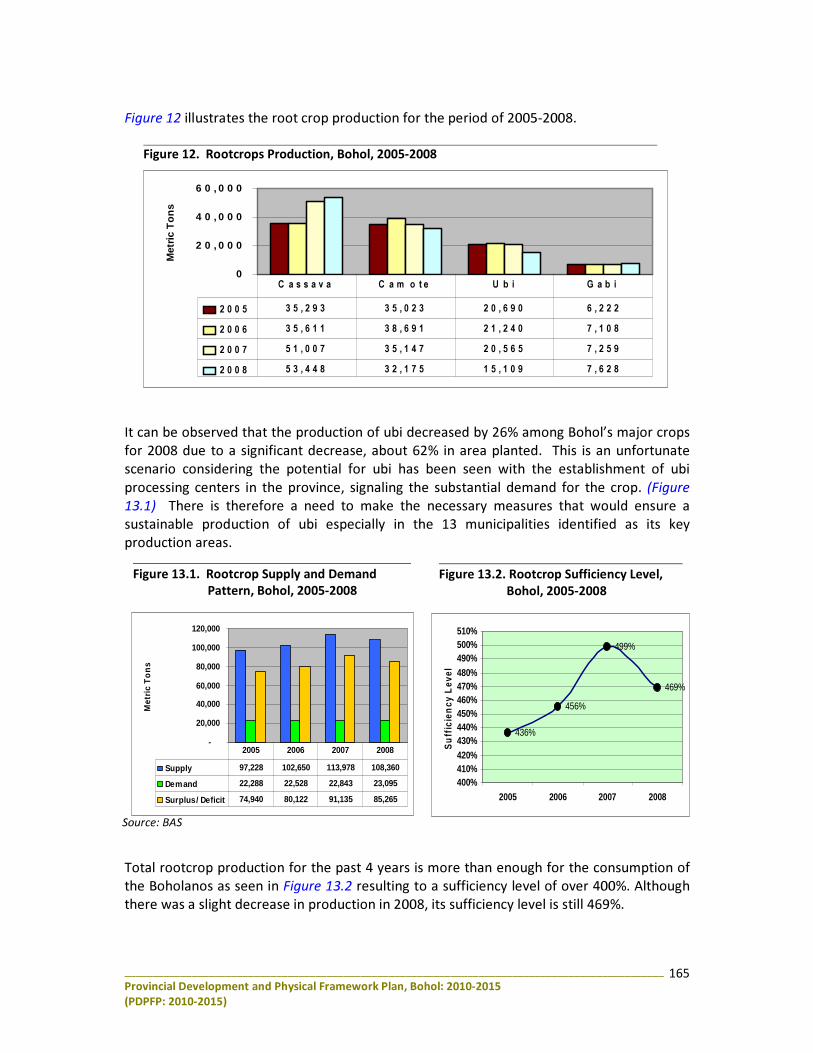
________________________________________________________________________________________________
Provincial Development and Physical Framework Plan, Bohol: 2010-2015 (PDPFP: 2010-2015)
165
Figure 12 illustrates the root crop production for the period of 2005-2008.
It can be observed that the production of ubi decreased by 26% among Bohol’s major crops for 2008 due to a significant decrease, about 62% in area planted. This is an unfortunate scenario considering the potential for ubi has been seen with the establishment of ubi processing centers in the province, signaling the substantial demand for the crop. (Figure 13.1) There is therefore a need to make the necessary measures that would ensure a sustainable production of ubi especially in the 13 municipalities identified as its key production areas.
Total rootcrop production for the past 4 years is more than enough for the consumption of the Boholanos as seen in Figure 13.2 resulting to a sufficiency level of over 400%. Although there was a slight decrease in production in 2008, its sufficiency level is still 469%.
Source: BAS
Figure 12. Rootcrops Production, Bohol, 2005-2008
0
2 0 , 0 0 0
4 0 , 0 0 0
6 0 , 0 0 0
Met
ric
To
ns
2 0 0 5 3 5 , 2 9 3 3 5 , 0 2 3 2 0 , 6 9 0 6 , 2 2 22 0 0 6 3 5 , 6 1 1 3 8 , 6 9 1 2 1 , 2 4 0 7 , 1 0 82 0 0 7 5 1 , 0 0 7 3 5 , 1 4 7 2 0 , 5 6 5 7 , 2 5 9 2 0 0 8 5 3 , 4 4 8 3 2 , 1 7 5 1 5 , 1 0 9 7 , 6 2 8
C a s s a v a C a m o t e U b i G a b i
Figure 13.2. Rootcrop Sufficiency Level, Bohol, 2005-2008
Figure 13.1. Rootcrop Supply and Demand Pattern, Bohol, 2005-2008
436%
456%
499%
469%
400%410%420%430%440%450%460%470%480%490%500%510%
2005 2006 2007 2008
Su
ffic
ien
cy L
evel
-
20,000
40,000
60,000
80,000
100,000
120,000
Met
ric
To
ns
Supply 97,228 102,650 113,978 108,360
Demand 22,288 22,528 22,843 23,095
Surplus/ Deficit 74,940 80,122 91,135 85,265
2005 2006 2007 2008
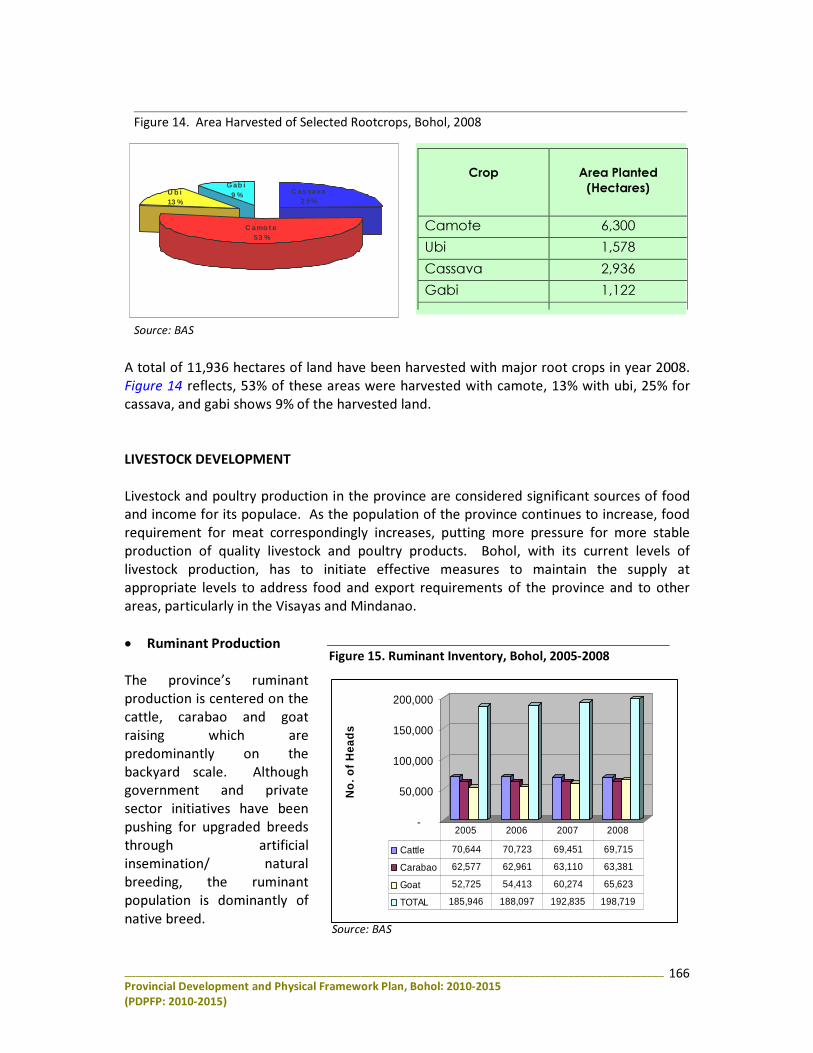
________________________________________________________________________________________________
Provincial Development and Physical Framework Plan, Bohol: 2010-2015 (PDPFP: 2010-2015)
166
A total of 11,936 hectares of land have been harvested with major root crops in year 2008. Figure 14 reflects, 53% of these areas were harvested with camote, 13% with ubi, 25% for cassava, and gabi shows 9% of the harvested land. LIVESTOCK DEVELOPMENT Livestock and poultry production in the province are considered significant sources of food and income for its populace. As the population of the province continues to increase, food requirement for meat correspondingly increases, putting more pressure for more stable production of quality livestock and poultry products. Bohol, with its current levels of livestock production, has to initiate effective measures to maintain the supply at appropriate levels to address food and export requirements of the province and to other areas, particularly in the Visayas and Mindanao. • Ruminant Production The province’s ruminant production is centered on the cattle, carabao and goat raising which are predominantly on the backyard scale. Although government and private sector initiatives have been pushing for upgraded breeds through artificial insemination/ natural breeding, the ruminant population is dominantly of native breed.
Figure 14. Area Harvested of Selected Rootcrops, Bohol, 2008
Crop
Area Planted
(Hectares)
Camote 6,300 Ubi 1,578 Cassava 2,936 Gabi 1,122
C amo t e53 %
C assava2 5%
G ab i9 %U b i
13 %
Source: BAS
Figure 15. Ruminant Inventory, Bohol, 2005-2008
-
50,000
100,000
150,000
200,000
No
. of
Hea
ds
Cattle 70,644 70,723 69,451 69,715
Carabao 62,577 62,961 63,110 63,381
Goat 52,725 54,413 60,274 65,623
TOTAL 185,946 188,097 192,835 198,719
2005 2006 2007 2008
Source: BAS
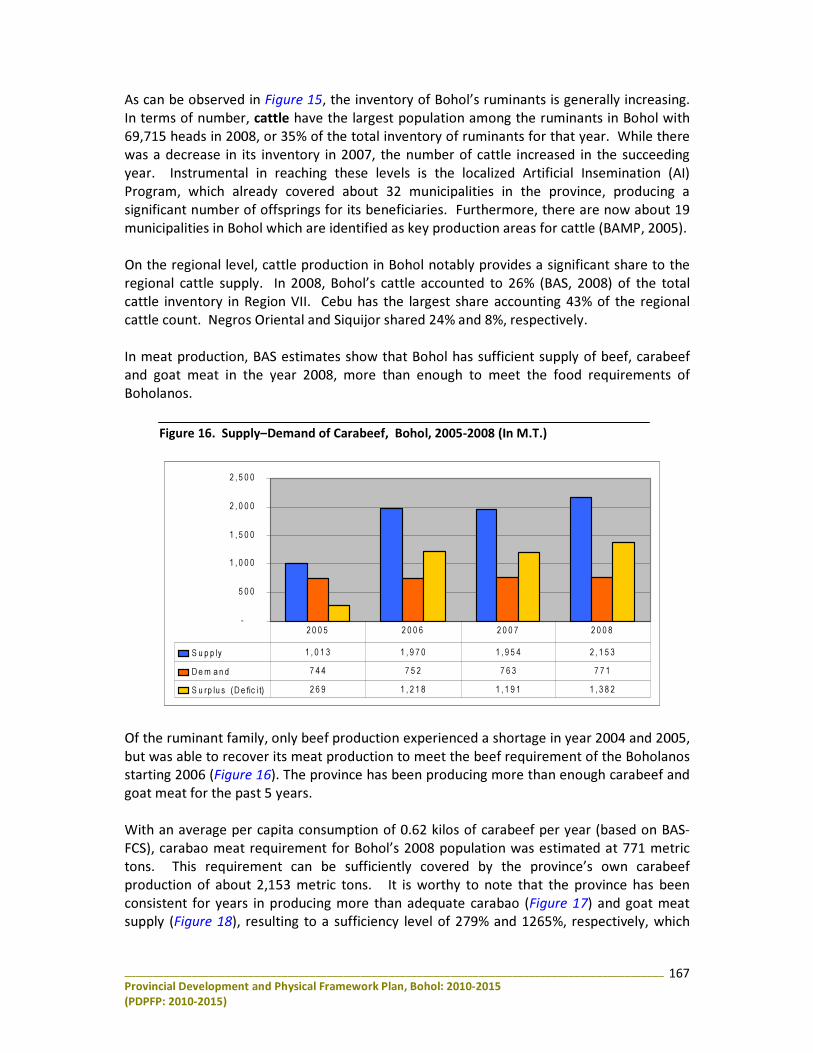
________________________________________________________________________________________________
Provincial Development and Physical Framework Plan, Bohol: 2010-2015 (PDPFP: 2010-2015)
167
As can be observed in Figure 15, the inventory of Bohol’s ruminants is generally increasing. In terms of number, cattle have the largest population among the ruminants in Bohol with 69,715 heads in 2008, or 35% of the total inventory of ruminants for that year. While there was a decrease in its inventory in 2007, the number of cattle increased in the succeeding year. Instrumental in reaching these levels is the localized Artificial Insemination (AI) Program, which already covered about 32 municipalities in the province, producing a significant number of offsprings for its beneficiaries. Furthermore, there are now about 19 municipalities in Bohol which are identified as key production areas for cattle (BAMP, 2005). On the regional level, cattle production in Bohol notably provides a significant share to the regional cattle supply. In 2008, Bohol’s cattle accounted to 26% (BAS, 2008) of the total cattle inventory in Region VII. Cebu has the largest share accounting 43% of the regional cattle count. Negros Oriental and Siquijor shared 24% and 8%, respectively. In meat production, BAS estimates show that Bohol has sufficient supply of beef, carabeef and goat meat in the year 2008, more than enough to meet the food requirements of Boholanos.
Of the ruminant family, only beef production experienced a shortage in year 2004 and 2005, but was able to recover its meat production to meet the beef requirement of the Boholanos starting 2006 (Figure 16). The province has been producing more than enough carabeef and goat meat for the past 5 years. With an average per capita consumption of 0.62 kilos of carabeef per year (based on BAS-FCS), carabao meat requirement for Bohol’s 2008 population was estimated at 771 metric tons. This requirement can be sufficiently covered by the province’s own carabeef production of about 2,153 metric tons. It is worthy to note that the province has been consistent for years in producing more than adequate carabao (Figure 17) and goat meat supply (Figure 18), resulting to a sufficiency level of 279% and 1265%, respectively, which
Figure 16. Supply–Demand of Carabeef, Bohol, 2005-2008 (In M.T.)
-
5 0 0
1 , 0 0 0
1 , 5 0 0
2 , 0 0 0
2 , 5 0 0
S u p p ly 1 , 0 1 3 1 , 9 7 0 1 , 9 5 4 2 , 1 5 3 D e m a n d 7 4 4 7 5 2 7 6 3 7 7 1 S u rp lu s (D e fic it) 2 6 9 1 , 2 1 8 1 , 1 9 1 1 , 3 8 2
2 0 0 5 2 0 0 6 2 0 0 7 2 0 0 8
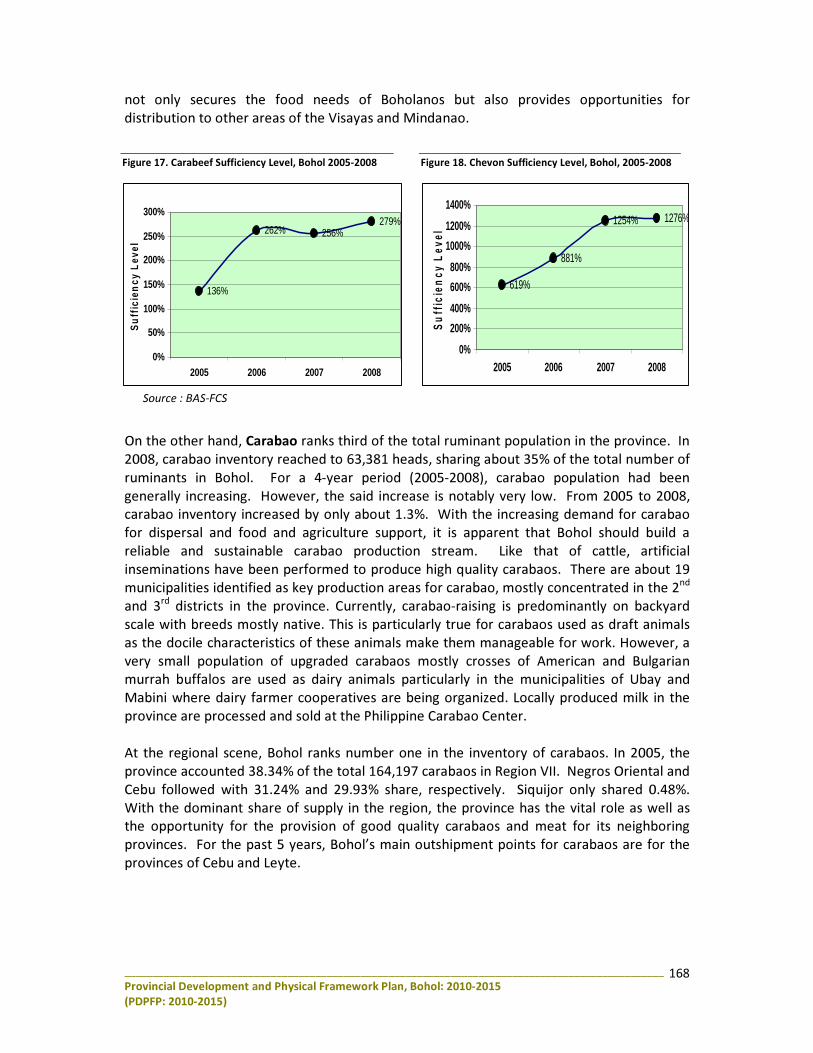
________________________________________________________________________________________________
Provincial Development and Physical Framework Plan, Bohol: 2010-2015 (PDPFP: 2010-2015)
168
not only secures the food needs of Boholanos but also provides opportunities for distribution to other areas of the Visayas and Mindanao.
On the other hand, Carabao ranks third of the total ruminant population in the province. In 2008, carabao inventory reached to 63,381 heads, sharing about 35% of the total number of ruminants in Bohol. For a 4-year period (2005-2008), carabao population had been generally increasing. However, the said increase is notably very low. From 2005 to 2008, carabao inventory increased by only about 1.3%. With the increasing demand for carabao for dispersal and food and agriculture support, it is apparent that Bohol should build a reliable and sustainable carabao production stream. Like that of cattle, artificial inseminations have been performed to produce high quality carabaos. There are about 19 municipalities identified as key production areas for carabao, mostly concentrated in the 2nd and 3rd districts in the province. Currently, carabao-raising is predominantly on backyard scale with breeds mostly native. This is particularly true for carabaos used as draft animals as the docile characteristics of these animals make them manageable for work. However, a very small population of upgraded carabaos mostly crosses of American and Bulgarian murrah buffalos are used as dairy animals particularly in the municipalities of Ubay and Mabini where dairy farmer cooperatives are being organized. Locally produced milk in the province are processed and sold at the Philippine Carabao Center. At the regional scene, Bohol ranks number one in the inventory of carabaos. In 2005, the province accounted 38.34% of the total 164,197 carabaos in Region VII. Negros Oriental and Cebu followed with 31.24% and 29.93% share, respectively. Siquijor only shared 0.48%. With the dominant share of supply in the region, the province has the vital role as well as the opportunity for the provision of good quality carabaos and meat for its neighboring provinces. For the past 5 years, Bohol’s main outshipment points for carabaos are for the provinces of Cebu and Leyte.
Source : BAS-FCS
Figure 17. Carabeef Sufficiency Level, Bohol 2005-2008 Figure 18. Chevon Sufficiency Level, Bohol, 2005-2008
619%
881%
1254% 1276%
0%
200%
400%
600%
800%
1000%
1200%
1400%
2005 2006 2007 2008
Su
ffic
ien
cy L
evel
136%
262% 256%279%
0%
50%
100%
150%
200%
250%
300%
2005 2006 2007 2008
Su
ffic
ien
cy L
evel
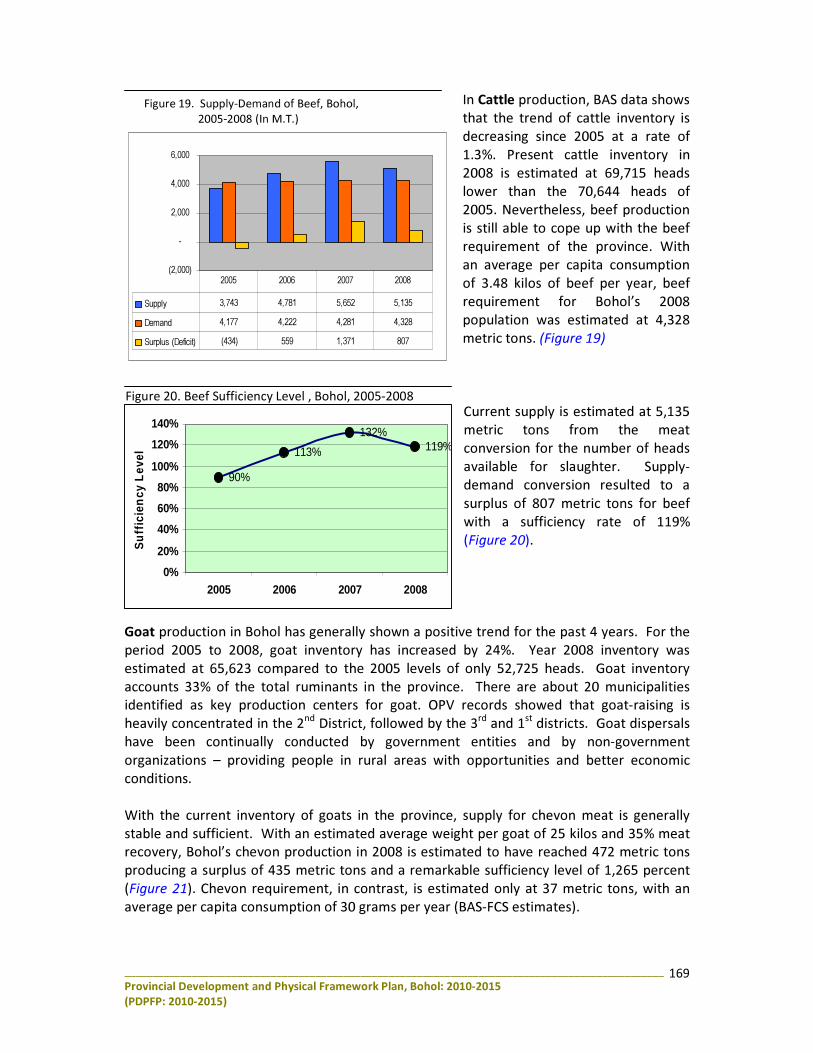
________________________________________________________________________________________________
Provincial Development and Physical Framework Plan, Bohol: 2010-2015 (PDPFP: 2010-2015)
169
In Cattle production, BAS data shows that the trend of cattle inventory is decreasing since 2005 at a rate of 1.3%. Present cattle inventory in 2008 is estimated at 69,715 heads lower than the 70,644 heads of 2005. Nevertheless, beef production is still able to cope up with the beef requirement of the province. With an average per capita consumption of 3.48 kilos of beef per year, beef requirement for Bohol’s 2008 population was estimated at 4,328 metric tons. (Figure 19) Current supply is estimated at 5,135 metric tons from the meat conversion for the number of heads available for slaughter. Supply-demand conversion resulted to a surplus of 807 metric tons for beef with a sufficiency rate of 119% (Figure 20).
Goat production in Bohol has generally shown a positive trend for the past 4 years. For the period 2005 to 2008, goat inventory has increased by 24%. Year 2008 inventory was estimated at 65,623 compared to the 2005 levels of only 52,725 heads. Goat inventory accounts 33% of the total ruminants in the province. There are about 20 municipalities identified as key production centers for goat. OPV records showed that goat-raising is heavily concentrated in the 2nd District, followed by the 3rd and 1st districts. Goat dispersals have been continually conducted by government entities and by non-government organizations – providing people in rural areas with opportunities and better economic conditions. With the current inventory of goats in the province, supply for chevon meat is generally stable and sufficient. With an estimated average weight per goat of 25 kilos and 35% meat recovery, Bohol’s chevon production in 2008 is estimated to have reached 472 metric tons producing a surplus of 435 metric tons and a remarkable sufficiency level of 1,265 percent (Figure 21). Chevon requirement, in contrast, is estimated only at 37 metric tons, with an average per capita consumption of 30 grams per year (BAS-FCS estimates).
Figure 19. Supply-Demand of Beef, Bohol, 2005-2008 (In M.T.)
(2,000)
-
2,000
4,000
6,000
Supply 3,743 4,781 5,652 5,135 Demand 4,177 4,222 4,281 4,328 Surplus (Deficit) (434) 559 1,371 807
2005 2006 2007 2008
Figure 20. Beef Sufficiency Level , Bohol, 2005-2008
90%
113%
132%119%
0%
20%
40%
60%
80%
100%
120%
140%
2005 2006 2007 2008
Su
ffic
ien
cy L
evel
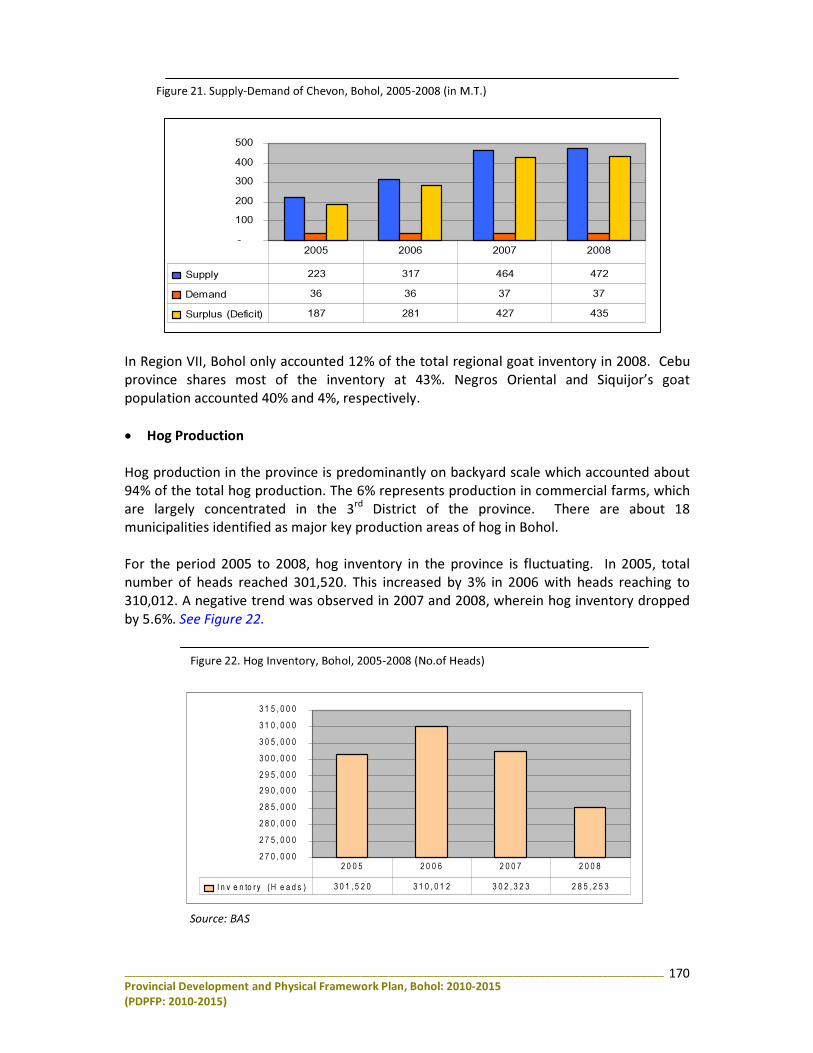
________________________________________________________________________________________________
Provincial Development and Physical Framework Plan, Bohol: 2010-2015 (PDPFP: 2010-2015)
170
In Region VII, Bohol only accounted 12% of the total regional goat inventory in 2008. Cebu province shares most of the inventory at 43%. Negros Oriental and Siquijor’s goat population accounted 40% and 4%, respectively. • Hog Production Hog production in the province is predominantly on backyard scale which accounted about 94% of the total hog production. The 6% represents production in commercial farms, which are largely concentrated in the 3rd District of the province. There are about 18 municipalities identified as major key production areas of hog in Bohol.
For the period 2005 to 2008, hog inventory in the province is fluctuating. In 2005, total number of heads reached 301,520. This increased by 3% in 2006 with heads reaching to 310,012. A negative trend was observed in 2007 and 2008, wherein hog inventory dropped by 5.6%. See Figure 22.
Figure 21. Supply-Demand of Chevon, Bohol, 2005-2008 (in M.T.) Figure 21. Supply-Demand of Chevon (In MT)
-100200300400500
Supply 223 317 464 472 Demand 36 36 37 37 Surplus (Deficit) 187 281 427 435
2005 2006 2007 2008
Figure 22. Hog Inventory, Bohol, 2005-2008 (No.of Heads)
2 7 0 , 0 0 02 7 5 , 0 0 02 8 0 , 0 0 02 8 5 , 0 0 02 9 0 , 0 0 02 9 5 , 0 0 03 0 0 , 0 0 03 0 5 , 0 0 03 1 0 , 0 0 03 1 5 , 0 0 0
I n v e n to r y ( H e a d s ) 3 0 1 , 5 2 0 3 1 0 , 0 1 2 3 0 2 , 3 2 3 2 8 5 , 2 5 3 2 0 0 5 2 0 0 6 2 0 0 7 2 0 0 8
Source: BAS
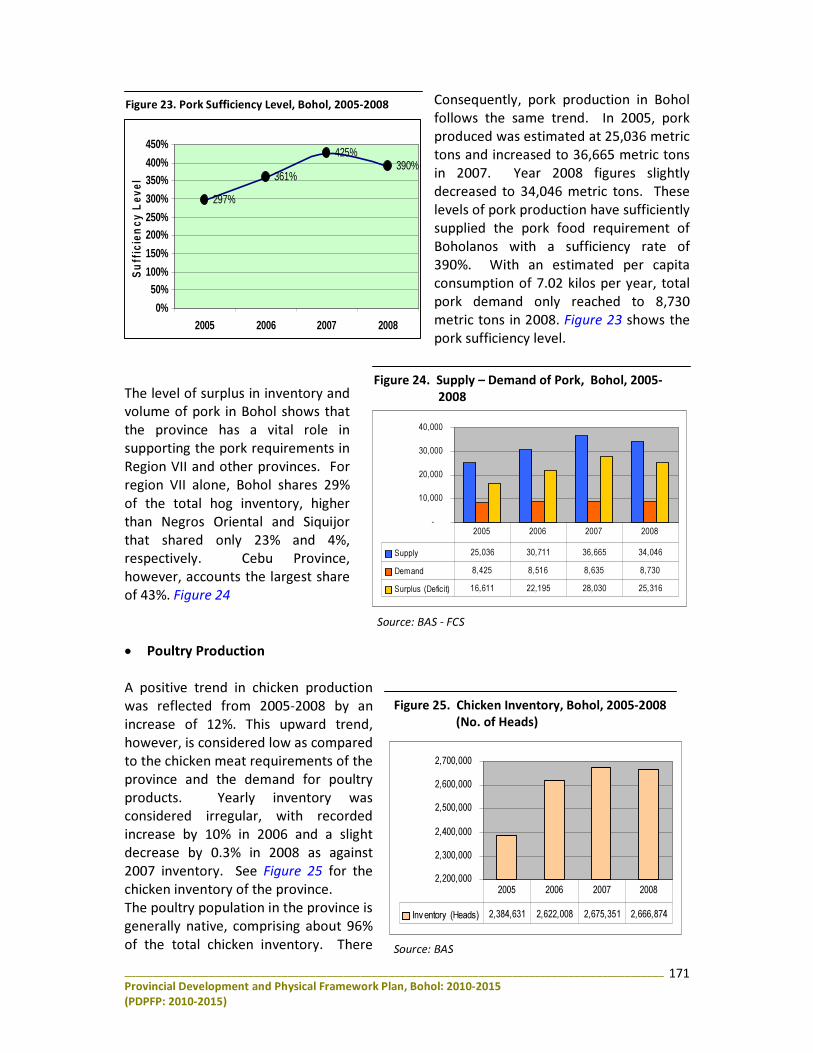
________________________________________________________________________________________________
Provincial Development and Physical Framework Plan, Bohol: 2010-2015 (PDPFP: 2010-2015)
171
Consequently, pork production in Bohol follows the same trend. In 2005, pork produced was estimated at 25,036 metric tons and increased to 36,665 metric tons in 2007. Year 2008 figures slightly decreased to 34,046 metric tons. These levels of pork production have sufficiently supplied the pork food requirement of Boholanos with a sufficiency rate of 390%. With an estimated per capita consumption of 7.02 kilos per year, total pork demand only reached to 8,730 metric tons in 2008. Figure 23 shows the pork sufficiency level.
The level of surplus in inventory and volume of pork in Bohol shows that the province has a vital role in supporting the pork requirements in Region VII and other provinces. For region VII alone, Bohol shares 29% of the total hog inventory, higher than Negros Oriental and Siquijor that shared only 23% and 4%, respectively. Cebu Province, however, accounts the largest share of 43%. Figure 24 • Poultry Production A positive trend in chicken production was reflected from 2005-2008 by an increase of 12%. This upward trend, however, is considered low as compared to the chicken meat requirements of the province and the demand for poultry products. Yearly inventory was considered irregular, with recorded increase by 10% in 2006 and a slight decrease by 0.3% in 2008 as against 2007 inventory. See Figure 25 for the chicken inventory of the province. The poultry population in the province is generally native, comprising about 96% of the total chicken inventory. There
Figure 23. Pork Sufficiency Level, Bohol, 2005-2008
297%
361%
425%390%
0%
50%100%
150%
200%250%
300%
350%400%
450%
2005 2006 2007 2008
Su
ffic
ien
cy L
evel
Figure 24. Supply – Demand of Pork, Bohol, 2005-2008
-
10,000
20,000
30,000
40,000
Supply 25,036 30,711 36,665 34,046 Demand 8,425 8,516 8,635 8,730 Surplus (Deficit) 16,611 22,195 28,030 25,316
2005 2006 2007 2008
Source: BAS - FCS
Figure 25. Chicken Inventory, Bohol, 2005-2008 (No. of Heads)
2005-2008
2,200,0002,300,0002,400,0002,500,0002,600,0002,700,000
Inv entory (Heads) 2,384,631 2,622,008 2,675,351 2,666,874 2005 2006 2007 2008
Source: BAS
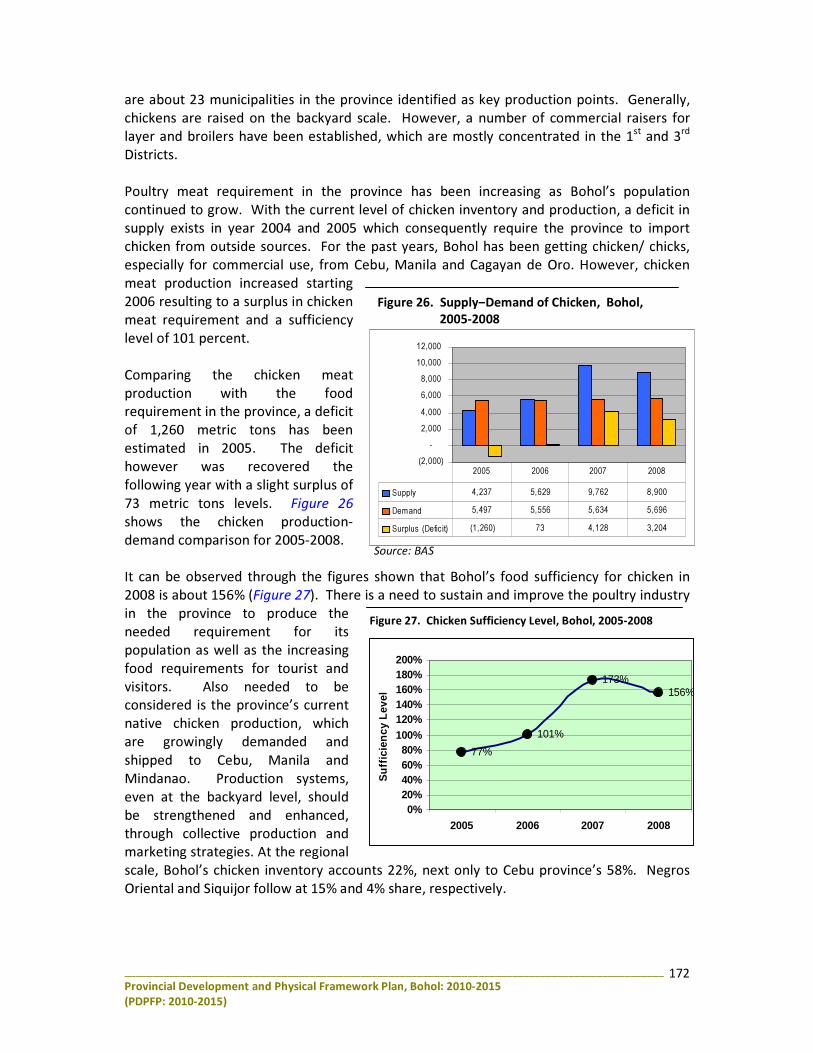
________________________________________________________________________________________________
Provincial Development and Physical Framework Plan, Bohol: 2010-2015 (PDPFP: 2010-2015)
172
are about 23 municipalities in the province identified as key production points. Generally, chickens are raised on the backyard scale. However, a number of commercial raisers for layer and broilers have been established, which are mostly concentrated in the 1st and 3rd Districts. Poultry meat requirement in the province has been increasing as Bohol’s population continued to grow. With the current level of chicken inventory and production, a deficit in supply exists in year 2004 and 2005 which consequently require the province to import chicken from outside sources. For the past years, Bohol has been getting chicken/ chicks, especially for commercial use, from Cebu, Manila and Cagayan de Oro. However, chicken meat production increased starting 2006 resulting to a surplus in chicken meat requirement and a sufficiency level of 101 percent. Comparing the chicken meat production with the food requirement in the province, a deficit of 1,260 metric tons has been estimated in 2005. The deficit however was recovered the following year with a slight surplus of 73 metric tons levels. Figure 26 shows the chicken production-demand comparison for 2005-2008. It can be observed through the figures shown that Bohol’s food sufficiency for chicken in 2008 is about 156% (Figure 27). There is a need to sustain and improve the poultry industry in the province to produce the needed requirement for its population as well as the increasing food requirements for tourist and visitors. Also needed to be considered is the province’s current native chicken production, which are growingly demanded and shipped to Cebu, Manila and Mindanao. Production systems, even at the backyard level, should be strengthened and enhanced, through collective production and marketing strategies. At the regional scale, Bohol’s chicken inventory accounts 22%, next only to Cebu province’s 58%. Negros Oriental and Siquijor follow at 15% and 4% share, respectively.
Source: BAS
Figure 27. Chicken Sufficiency Level, Bohol, 2005-2008
77%
101%
173%156%
0%20%40%60%80%
100%120%140%160%180%200%
2005 2006 2007 2008
Su
ffic
ien
cy L
evel
Source: BAS
Figure 26. Supply–Demand of Chicken, Bohol, 2005-2008 (In Metric Ton)
(2,000)-
2,0004,0006,0008,000
10,00012,000
Supply 4,237 5,629 9,762 8,900 Demand 5,497 5,556 5,634 5,696 Surplus (Deficit) (1,260) 73 4,128 3,204
2005 2006 2007 2008
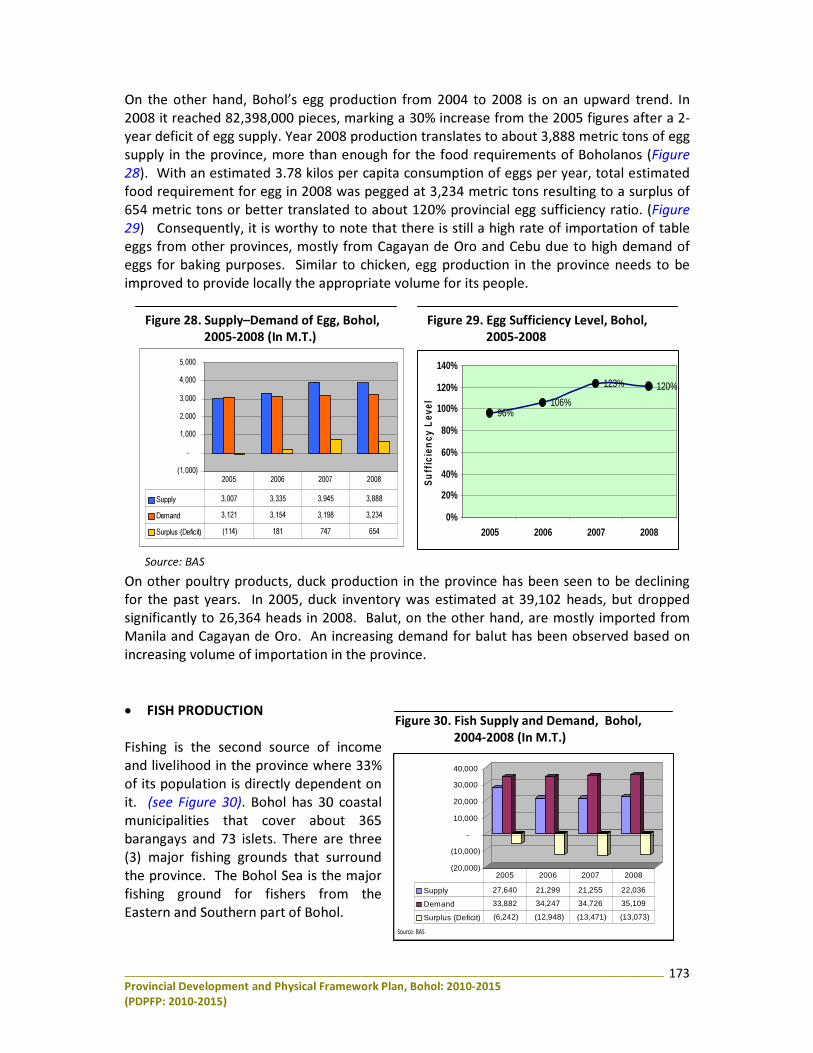
________________________________________________________________________________________________
Provincial Development and Physical Framework Plan, Bohol: 2010-2015 (PDPFP: 2010-2015)
173
On the other hand, Bohol’s egg production from 2004 to 2008 is on an upward trend. In 2008 it reached 82,398,000 pieces, marking a 30% increase from the 2005 figures after a 2-year deficit of egg supply. Year 2008 production translates to about 3,888 metric tons of egg supply in the province, more than enough for the food requirements of Boholanos (Figure 28). With an estimated 3.78 kilos per capita consumption of eggs per year, total estimated food requirement for egg in 2008 was pegged at 3,234 metric tons resulting to a surplus of 654 metric tons or better translated to about 120% provincial egg sufficiency ratio. (Figure 29) Consequently, it is worthy to note that there is still a high rate of importation of table eggs from other provinces, mostly from Cagayan de Oro and Cebu due to high demand of eggs for baking purposes. Similar to chicken, egg production in the province needs to be improved to provide locally the appropriate volume for its people.
On other poultry products, duck production in the province has been seen to be declining for the past years. In 2005, duck inventory was estimated at 39,102 heads, but dropped significantly to 26,364 heads in 2008. Balut, on the other hand, are mostly imported from Manila and Cagayan de Oro. An increasing demand for balut has been observed based on increasing volume of importation in the province. • FISH PRODUCTION Fishing is the second source of income and livelihood in the province where 33% of its population is directly dependent on it. (see Figure 30). Bohol has 30 coastal municipalities that cover about 365 barangays and 73 islets. There are three (3) major fishing grounds that surround the province. The Bohol Sea is the major fishing ground for fishers from the Eastern and Southern part of Bohol.
Figure 30. Fish Supply and Demand, Bohol, 2004-2008 (In M.T.)
(20,000)
(10,000)
-
10,000
20,000
30,000
40,000
Table 30. Fish Supply and Demand: CY 2004-2008
Supply 27,640 21,299 21,255 22,036
Demand 33,882 34,247 34,726 35,109
Surplus (Deficit) (6,242) (12,948) (13,471) (13,073)
2005 2006 2007 2008
Source: BAS
Figure 28. Supply–Demand of Egg, Bohol, 2005-2008 (In M.T.)
Figure 29. Egg Sufficiency Level, Bohol, 2005-2008
Source: BAS
96%106%
123% 120%
0%
20%
40%
60%
80%
100%
120%
140%
2005 2006 2007 2008
Su
ffic
ien
cy L
evel
(1,000)-
1,0002,0003,0004,0005,000
Supply 3,007 3,335 3,945 3,888 Demand 3,121 3,154 3,198 3,234 Surplus (Deficit) (114) 181 747 654
2005 2006 2007 2008
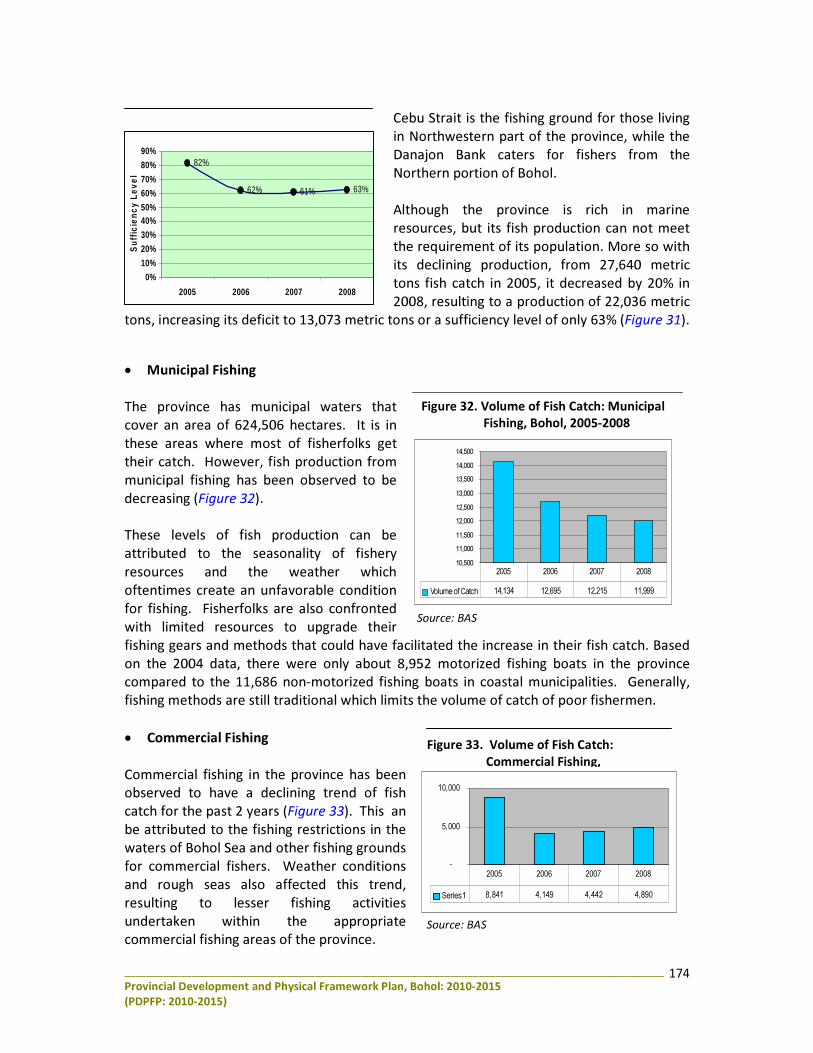
________________________________________________________________________________________________
Provincial Development and Physical Framework Plan, Bohol: 2010-2015 (PDPFP: 2010-2015)
174
Cebu Strait is the fishing ground for those living in Northwestern part of the province, while the Danajon Bank caters for fishers from the Northern portion of Bohol. Although the province is rich in marine resources, but its fish production can not meet the requirement of its population. More so with its declining production, from 27,640 metric tons fish catch in 2005, it decreased by 20% in 2008, resulting to a production of 22,036 metric
tons, increasing its deficit to 13,073 metric tons or a sufficiency level of only 63% (Figure 31).
• Municipal Fishing The province has municipal waters that cover an area of 624,506 hectares. It is in these areas where most of fisherfolks get their catch. However, fish production from municipal fishing has been observed to be decreasing (Figure 32). These levels of fish production can be attributed to the seasonality of fishery resources and the weather which oftentimes create an unfavorable condition for fishing. Fisherfolks are also confronted with limited resources to upgrade their fishing gears and methods that could have facilitated the increase in their fish catch. Based on the 2004 data, there were only about 8,952 motorized fishing boats in the province compared to the 11,686 non-motorized fishing boats in coastal municipalities. Generally, fishing methods are still traditional which limits the volume of catch of poor fishermen. • Commercial Fishing Commercial fishing in the province has been observed to have a declining trend of fish catch for the past 2 years (Figure 33). This an be attributed to the fishing restrictions in the waters of Bohol Sea and other fishing grounds for commercial fishers. Weather conditions and rough seas also affected this trend, resulting to lesser fishing activities undertaken within the appropriate commercial fishing areas of the province.
82%
62% 61% 63%
0%
10%
20%
30%
40%50%
60%
70%
80%
90%
2005 2006 2007 2008
Suf
ficie
ncy
Leve
l
Source: BAS
Figure 32. Volume of Fish Catch: Municipal Fishing, Bohol, 2005-2008
10,50011,00011,50012,00012,50013,00013,50014,00014,500
Volume of Catch 14,134 12,695 12,215 11,999 2005 2006 2007 2008
Source: BAS
Figure 33. Volume of Fish Catch: Commercial Fishing, Bohol, 2004-2008
-
5,000
10,000
Series1 8,841 4,149 4,442 4,890
2005 2006 2007 2008
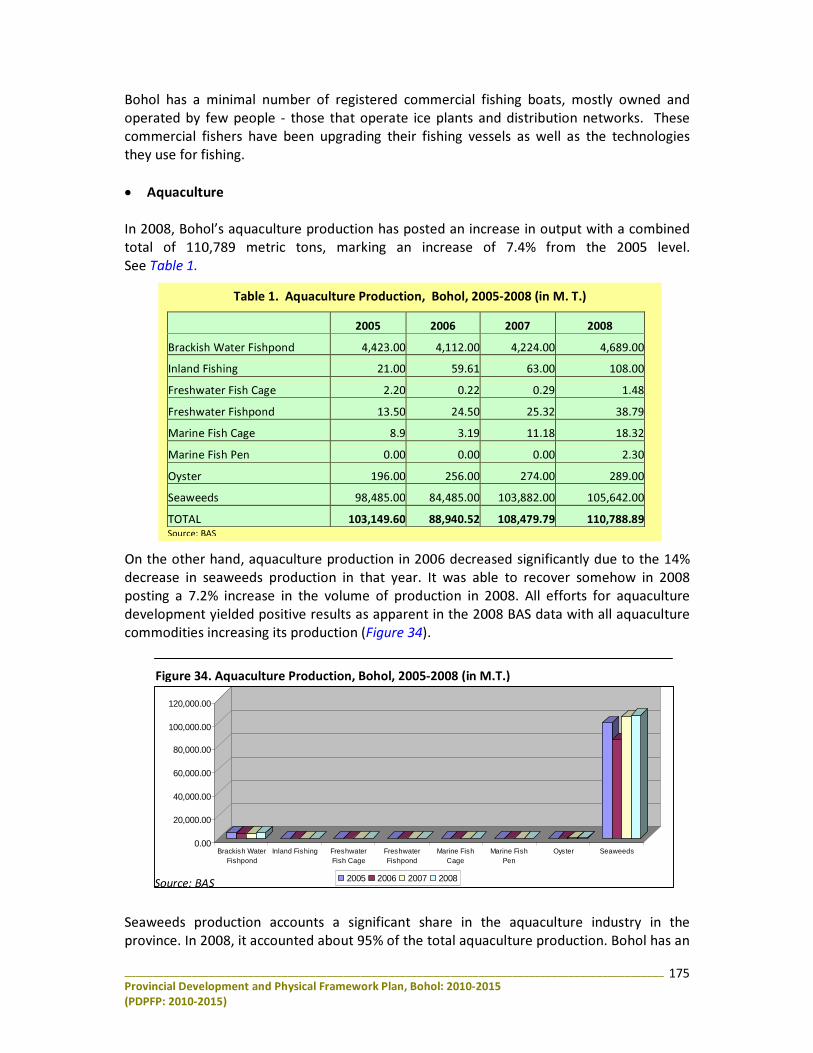
________________________________________________________________________________________________
Provincial Development and Physical Framework Plan, Bohol: 2010-2015 (PDPFP: 2010-2015)
175
Table 1. Aquaculture Production, Bohol, 2005-2008 (in M. T.)
2005 2006 2007 2008 Brackish Water Fishpond 4,423.00 4,112.00 4,224.00 4,689.00Inland Fishing 21.00 59.61 63.00 108.00Freshwater Fish Cage 2.20 0.22 0.29 1.48Freshwater Fishpond 13.50 24.50 25.32 38.79Marine Fish Cage 8.9 3.19 11.18 18.32Marine Fish Pen 0.00 0.00 0.00 2.30Oyster 196.00 256.00 274.00 289.00Seaweeds 98,485.00 84,485.00 103,882.00 105,642.00TOTAL 103,149.60 88,940.52 108,479.79 110,788.89Source: BAS
Bohol has a minimal number of registered commercial fishing boats, mostly owned and operated by few people - those that operate ice plants and distribution networks. These commercial fishers have been upgrading their fishing vessels as well as the technologies they use for fishing. • Aquaculture
In 2008, Bohol’s aquaculture production has posted an increase in output with a combined total of 110,789 metric tons, marking an increase of 7.4% from the 2005 level. See Table 1. On the other hand, aquaculture production in 2006 decreased significantly due to the 14% decrease in seaweeds production in that year. It was able to recover somehow in 2008 posting a 7.2% increase in the volume of production in 2008. All efforts for aquaculture development yielded positive results as apparent in the 2008 BAS data with all aquaculture commodities increasing its production (Figure 34).
Seaweeds production accounts a significant share in the aquaculture industry in the province. In 2008, it accounted about 95% of the total aquaculture production. Bohol has an
Figure 34. Aquaculture Production, Bohol, 2005-2008 (in M.T.)
0.00
20,000.00
40,000.00
60,000.00
80,000.00
100,000.00
120,000.00
Brackish WaterFishpond
Inland Fishing FreshwaterFish Cage
FreshwaterFishpond
Marine FishCage
Marine FishPen
Oyster Seaweeds
2005 2006 2007 2008Source: BAS
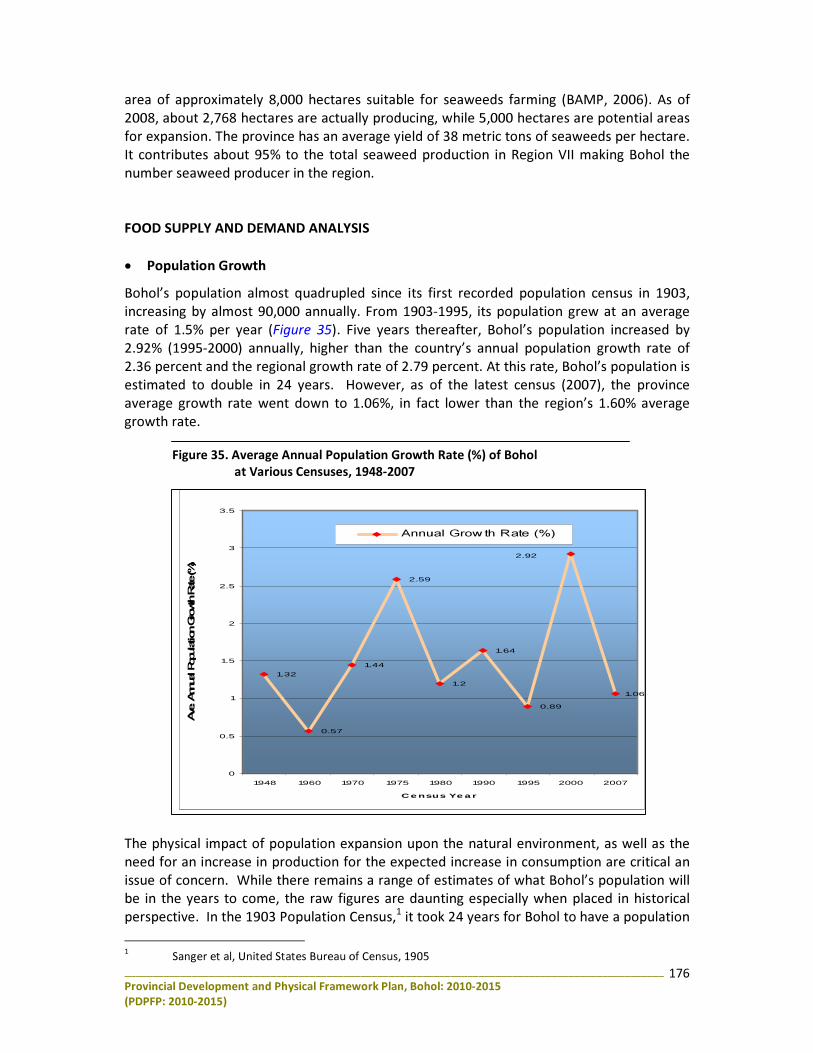
________________________________________________________________________________________________ Provincial Development and Physical Framework Plan, Bohol: 2010-2015 (PDPFP: 2010-2015)
176
area of approximately 8,000 hectares suitable for seaweeds farming (BAMP, 2006). As of 2008, about 2,768 hectares are actually producing, while 5,000 hectares are potential areas for expansion. The province has an average yield of 38 metric tons of seaweeds per hectare. It contributes about 95% to the total seaweed production in Region VII making Bohol the number seaweed producer in the region. FOOD SUPPLY AND DEMAND ANALYSIS • Population Growth Bohol’s population almost quadrupled since its first recorded population census in 1903, increasing by almost 90,000 annually. From 1903-1995, its population grew at an average rate of 1.5% per year (Figure 35). Five years thereafter, Bohol’s population increased by 2.92% (1995-2000) annually, higher than the country’s annual population growth rate of 2.36 percent and the regional growth rate of 2.79 percent. At this rate, Bohol’s population is estimated to double in 24 years. However, as of the latest census (2007), the province average growth rate went down to 1.06%, in fact lower than the region’s 1.60% average growth rate. The physical impact of population expansion upon the natural environment, as well as the need for an increase in production for the expected increase in consumption are critical an issue of concern. While there remains a range of estimates of what Bohol’s population will be in the years to come, the raw figures are daunting especially when placed in historical perspective. In the 1903 Population Census,1 it took 24 years for Bohol to have a population 1 Sanger et al, United States Bureau of Census, 1905
Figure 35. Average Annual Population Growth Rate (%) of Bohol at Various Censuses, 1948-2007
1.32
0.57
1.44
2.59
1.2
1.64
0.89
1.06
2.92
0
0.5
1
1.5
2
2.5
3
3.5
1948 1960 1970 1975 1980 1990 1995 2000 2007
Ce nsus Ye a r
Ave.
Annu
al Po
pulat
ion Gr
owth
Rate
(%)
Annual Grow th Rate (%)
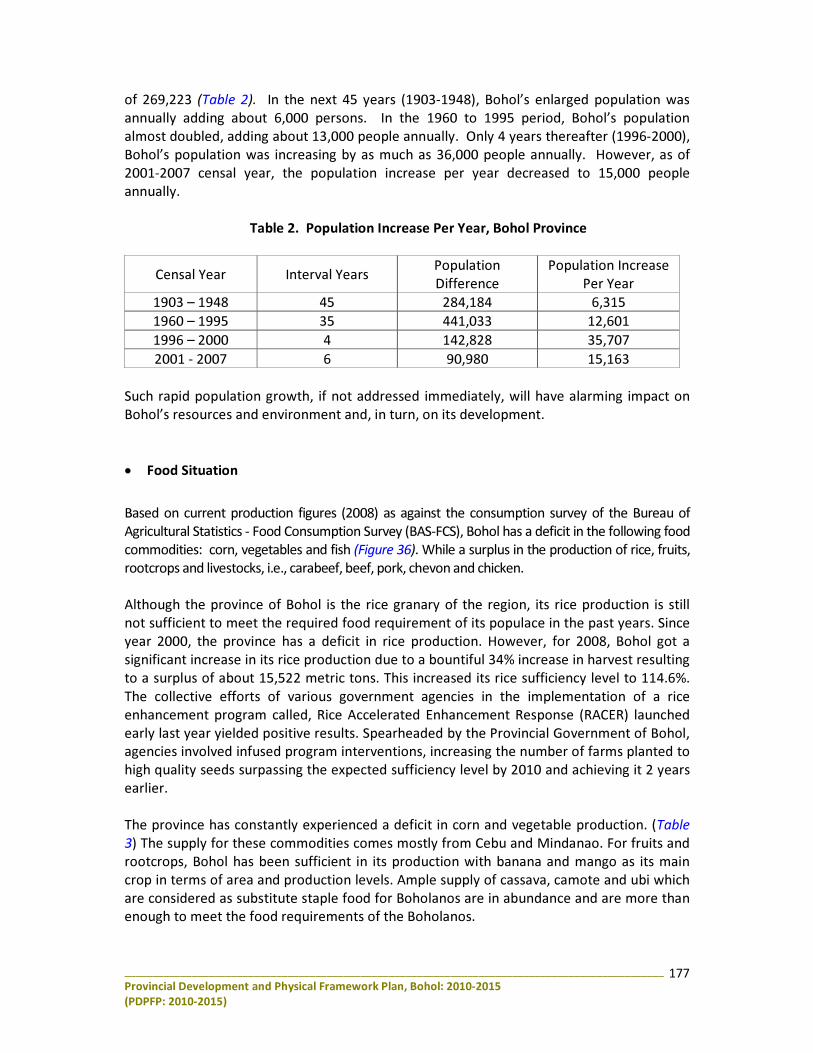
________________________________________________________________________________________________ Provincial Development and Physical Framework Plan, Bohol: 2010-2015 (PDPFP: 2010-2015)
177
of 269,223 (Table 2). In the next 45 years (1903-1948), Bohol’s enlarged population was annually adding about 6,000 persons. In the 1960 to 1995 period, Bohol’s population almost doubled, adding about 13,000 people annually. Only 4 years thereafter (1996-2000), Bohol’s population was increasing by as much as 36,000 people annually. However, as of 2001-2007 censal year, the population increase per year decreased to 15,000 people annually.
Table 2. Population Increase Per Year, Bohol Province
Censal Year Interval Years Population Difference
Population Increase Per Year
1903 – 1948 45 284,184 6,315 1960 – 1995 35 441,033 12,601 1996 – 2000 4 142,828 35,707 2001 - 2007 6 90,980 15,163
Such rapid population growth, if not addressed immediately, will have alarming impact on Bohol’s resources and environment and, in turn, on its development. • Food Situation
Based on current production figures (2008) as against the consumption survey of the Bureau of Agricultural Statistics - Food Consumption Survey (BAS-FCS), Bohol has a deficit in the following food commodities: corn, vegetables and fish (Figure 36). While a surplus in the production of rice, fruits, rootcrops and livestocks, i.e., carabeef, beef, pork, chevon and chicken. Although the province of Bohol is the rice granary of the region, its rice production is still not sufficient to meet the required food requirement of its populace in the past years. Since year 2000, the province has a deficit in rice production. However, for 2008, Bohol got a significant increase in its rice production due to a bountiful 34% increase in harvest resulting to a surplus of about 15,522 metric tons. This increased its rice sufficiency level to 114.6%. The collective efforts of various government agencies in the implementation of a rice enhancement program called, Rice Accelerated Enhancement Response (RACER) launched early last year yielded positive results. Spearheaded by the Provincial Government of Bohol, agencies involved infused program interventions, increasing the number of farms planted to high quality seeds surpassing the expected sufficiency level by 2010 and achieving it 2 years earlier. The province has constantly experienced a deficit in corn and vegetable production. (Table 3) The supply for these commodities comes mostly from Cebu and Mindanao. For fruits and rootcrops, Bohol has been sufficient in its production with banana and mango as its main crop in terms of area and production levels. Ample supply of cassava, camote and ubi which are considered as substitute staple food for Boholanos are in abundance and are more than enough to meet the food requirements of the Boholanos.
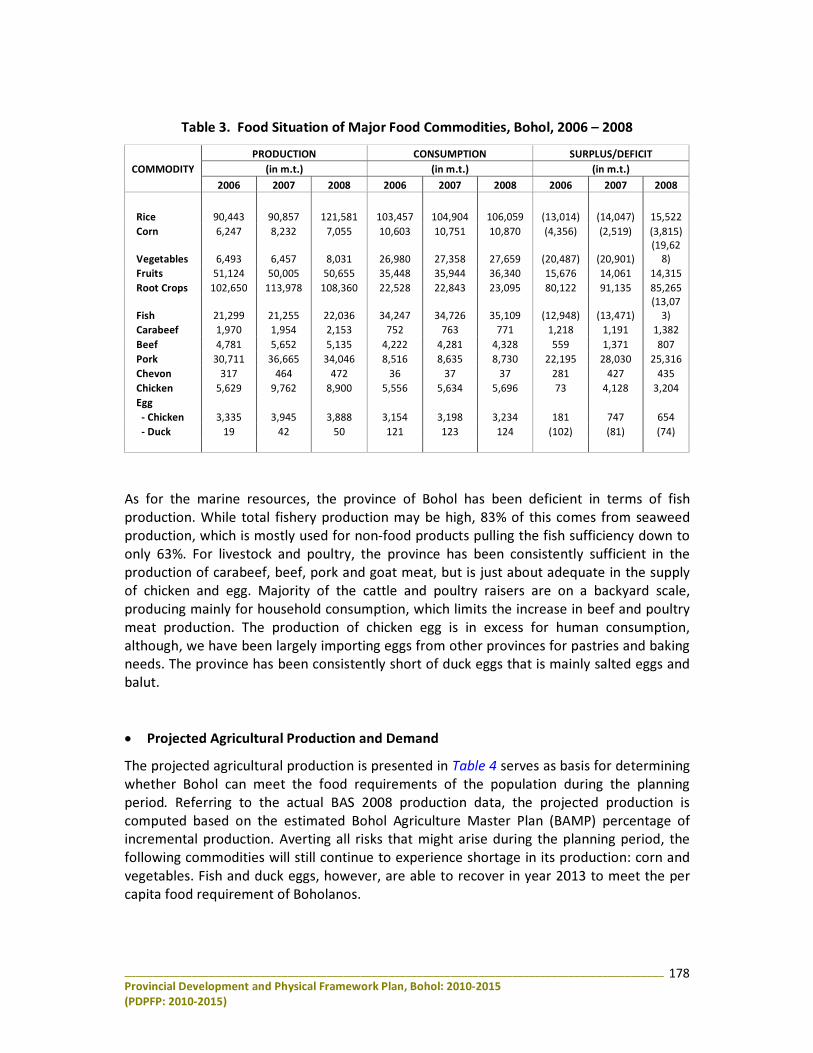
________________________________________________________________________________________________ Provincial Development and Physical Framework Plan, Bohol: 2010-2015 (PDPFP: 2010-2015)
178
Table 3. Food Situation of Major Food Commodities, Bohol, 2006 – 2008
PRODUCTION CONSUMPTION SURPLUS/DEFICIT COMMODITY (in m.t.) (in m.t.) (in m.t.) 2006 2007 2008 2006 2007 2008 2006 2007 2008 Rice 90,443 90,857 121,581 103,457 104,904 106,059 (13,014) (14,047) 15,522 Corn 6,247 8,232 7,055 10,603 10,751 10,870 (4,356) (2,519) (3,815)
Vegetables 6,493 6,457 8,031 26,980 27,358 27,659 (20,487) (20,901) (19,62
8) Fruits 51,124 50,005 50,655 35,448 35,944 36,340 15,676 14,061 14,315 Root Crops 102,650 113,978 108,360 22,528 22,843 23,095 80,122 91,135 85,265
Fish 21,299 21,255 22,036 34,247 34,726 35,109 (12,948) (13,471) (13,07
3) Carabeef 1,970 1,954 2,153 752 763 771 1,218 1,191 1,382 Beef 4,781 5,652 5,135 4,222 4,281 4,328 559 1,371 807 Pork 30,711 36,665 34,046 8,516 8,635 8,730 22,195 28,030 25,316 Chevon 317 464 472 36 37 37 281 427 435 Chicken 5,629 9,762 8,900 5,556 5,634 5,696 73 4,128 3,204 Egg - Chicken 3,335 3,945 3,888 3,154 3,198 3,234 181 747 654 - Duck 19 42 50 121 123 124 (102) (81) (74)
As for the marine resources, the province of Bohol has been deficient in terms of fish production. While total fishery production may be high, 83% of this comes from seaweed production, which is mostly used for non-food products pulling the fish sufficiency down to only 63%. For livestock and poultry, the province has been consistently sufficient in the production of carabeef, beef, pork and goat meat, but is just about adequate in the supply of chicken and egg. Majority of the cattle and poultry raisers are on a backyard scale, producing mainly for household consumption, which limits the increase in beef and poultry meat production. The production of chicken egg is in excess for human consumption, although, we have been largely importing eggs from other provinces for pastries and baking needs. The province has been consistently short of duck eggs that is mainly salted eggs and balut. • Projected Agricultural Production and Demand The projected agricultural production is presented in Table 4 serves as basis for determining whether Bohol can meet the food requirements of the population during the planning period. Referring to the actual BAS 2008 production data, the projected production is computed based on the estimated Bohol Agriculture Master Plan (BAMP) percentage of incremental production. Averting all risks that might arise during the planning period, the following commodities will still continue to experience shortage in its production: corn and vegetables. Fish and duck eggs, however, are able to recover in year 2013 to meet the per capita food requirement of Boholanos.
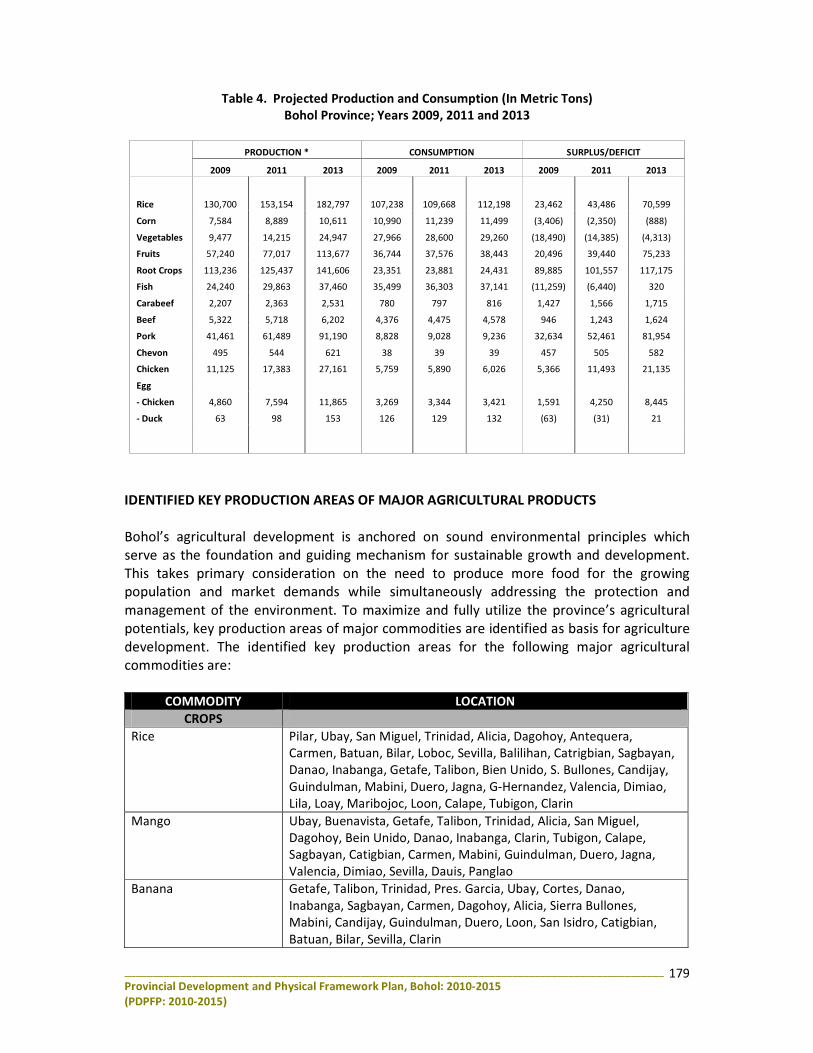
________________________________________________________________________________________________ Provincial Development and Physical Framework Plan, Bohol: 2010-2015 (PDPFP: 2010-2015)
179
Table 4. Projected Production and Consumption (In Metric Tons) Bohol Province; Years 2009, 2011 and 2013
PRODUCTION * CONSUMPTION SURPLUS/DEFICIT
2009 2011 2013 2009 2011 2013 2009 2011 2013 Rice 130,700 153,154 182,797 107,238 109,668 112,198 23,462 43,486 70,599 Corn 7,584 8,889 10,611 10,990 11,239 11,499 (3,406) (2,350) (888) Vegetables 9,477 14,215 24,947 27,966 28,600 29,260 (18,490) (14,385) (4,313) Fruits 57,240 77,017 113,677 36,744 37,576 38,443 20,496 39,440 75,233 Root Crops 113,236 125,437 141,606 23,351 23,881 24,431 89,885 101,557 117,175 Fish 24,240 29,863 37,460 35,499 36,303 37,141 (11,259) (6,440) 320 Carabeef 2,207 2,363 2,531 780 797 816 1,427 1,566 1,715 Beef 5,322 5,718 6,202 4,376 4,475 4,578 946 1,243 1,624 Pork 41,461 61,489 91,190 8,828 9,028 9,236 32,634 52,461 81,954 Chevon 495 544 621 38 39 39 457 505 582 Chicken 11,125 17,383 27,161 5,759 5,890 6,026 5,366 11,493 21,135 Egg - Chicken 4,860 7,594 11,865 3,269 3,344 3,421 1,591 4,250 8,445 - Duck 63 98 153 126 129 132 (63) (31) 21
IDENTIFIED KEY PRODUCTION AREAS OF MAJOR AGRICULTURAL PRODUCTS Bohol’s agricultural development is anchored on sound environmental principles which serve as the foundation and guiding mechanism for sustainable growth and development. This takes primary consideration on the need to produce more food for the growing population and market demands while simultaneously addressing the protection and management of the environment. To maximize and fully utilize the province’s agricultural potentials, key production areas of major commodities are identified as basis for agriculture development. The identified key production areas for the following major agricultural commodities are:
COMMODITY LOCATION CROPS
Rice Pilar, Ubay, San Miguel, Trinidad, Alicia, Dagohoy, Antequera, Carmen, Batuan, Bilar, Loboc, Sevilla, Balilihan, Catrigbian, Sagbayan, Danao, Inabanga, Getafe, Talibon, Bien Unido, S. Bullones, Candijay, Guindulman, Mabini, Duero, Jagna, G-Hernandez, Valencia, Dimiao, Lila, Loay, Maribojoc, Loon, Calape, Tubigon, Clarin
Mango Ubay, Buenavista, Getafe, Talibon, Trinidad, Alicia, San Miguel, Dagohoy, Bein Unido, Danao, Inabanga, Clarin, Tubigon, Calape, Sagbayan, Catigbian, Carmen, Mabini, Guindulman, Duero, Jagna, Valencia, Dimiao, Sevilla, Dauis, Panglao
Banana Getafe, Talibon, Trinidad, Pres. Garcia, Ubay, Cortes, Danao, Inabanga, Sagbayan, Carmen, Dagohoy, Alicia, Sierra Bullones, Mabini, Candijay, Guindulman, Duero, Loon, San Isidro, Catigbian, Batuan, Bilar, Sevilla, Clarin
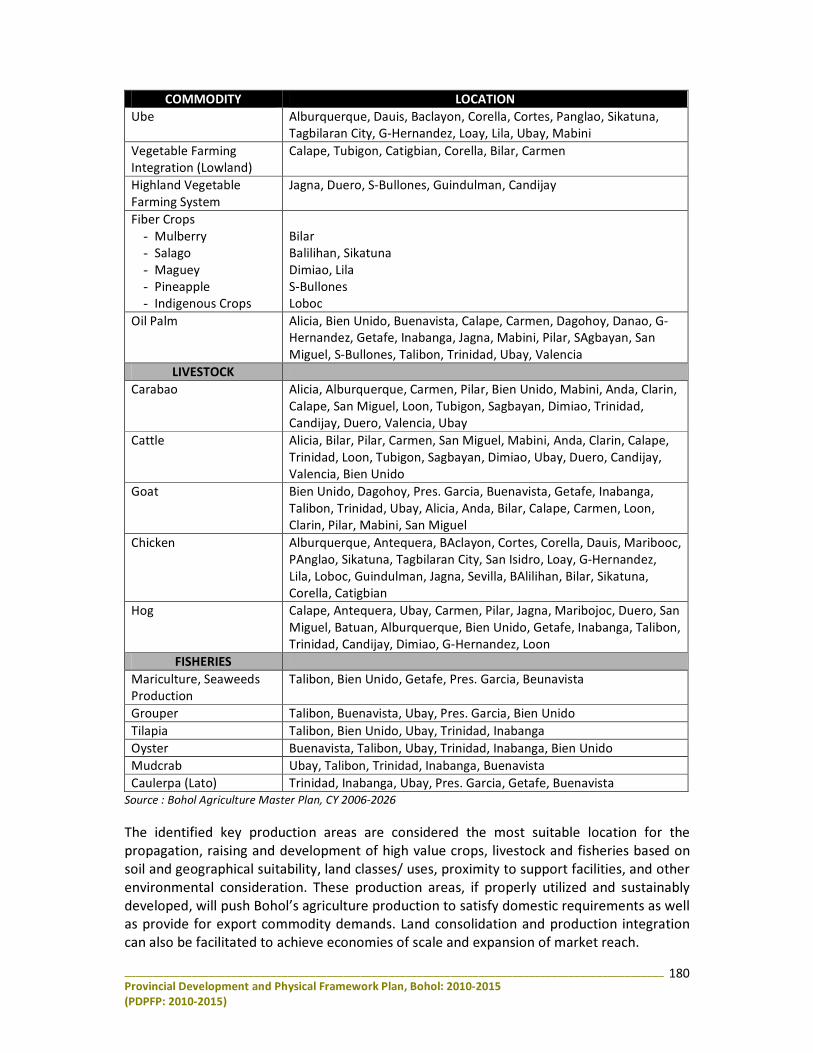
________________________________________________________________________________________________ Provincial Development and Physical Framework Plan, Bohol: 2010-2015 (PDPFP: 2010-2015)
180
COMMODITY LOCATION Ube Alburquerque, Dauis, Baclayon, Corella, Cortes, Panglao, Sikatuna,
Tagbilaran City, G-Hernandez, Loay, Lila, Ubay, Mabini Vegetable Farming Integration (Lowland)
Calape, Tubigon, Catigbian, Corella, Bilar, Carmen
Highland Vegetable Farming System
Jagna, Duero, S-Bullones, Guindulman, Candijay
Fiber Crops - Mulberry - Salago - Maguey - Pineapple - Indigenous Crops
Bilar Balilihan, Sikatuna Dimiao, Lila S-Bullones Loboc
Oil Palm Alicia, Bien Unido, Buenavista, Calape, Carmen, Dagohoy, Danao, G-Hernandez, Getafe, Inabanga, Jagna, Mabini, Pilar, SAgbayan, San Miguel, S-Bullones, Talibon, Trinidad, Ubay, Valencia
LIVESTOCK Carabao Alicia, Alburquerque, Carmen, Pilar, Bien Unido, Mabini, Anda, Clarin,
Calape, San Miguel, Loon, Tubigon, Sagbayan, Dimiao, Trinidad, Candijay, Duero, Valencia, Ubay
Cattle Alicia, Bilar, Pilar, Carmen, San Miguel, Mabini, Anda, Clarin, Calape, Trinidad, Loon, Tubigon, Sagbayan, Dimiao, Ubay, Duero, Candijay, Valencia, Bien Unido
Goat Bien Unido, Dagohoy, Pres. Garcia, Buenavista, Getafe, Inabanga, Talibon, Trinidad, Ubay, Alicia, Anda, Bilar, Calape, Carmen, Loon, Clarin, Pilar, Mabini, San Miguel
Chicken Alburquerque, Antequera, BAclayon, Cortes, Corella, Dauis, Maribooc, PAnglao, Sikatuna, Tagbilaran City, San Isidro, Loay, G-Hernandez, Lila, Loboc, Guindulman, Jagna, Sevilla, BAlilihan, Bilar, Sikatuna, Corella, Catigbian
Hog Calape, Antequera, Ubay, Carmen, Pilar, Jagna, Maribojoc, Duero, San Miguel, Batuan, Alburquerque, Bien Unido, Getafe, Inabanga, Talibon, Trinidad, Candijay, Dimiao, G-Hernandez, Loon
FISHERIES Mariculture, Seaweeds Production
Talibon, Bien Unido, Getafe, Pres. Garcia, Beunavista
Grouper Talibon, Buenavista, Ubay, Pres. Garcia, Bien Unido Tilapia Talibon, Bien Unido, Ubay, Trinidad, Inabanga Oyster Buenavista, Talibon, Ubay, Trinidad, Inabanga, Bien Unido Mudcrab Ubay, Talibon, Trinidad, Inabanga, Buenavista Caulerpa (Lato) Trinidad, Inabanga, Ubay, Pres. Garcia, Getafe, Buenavista
Source : Bohol Agriculture Master Plan, CY 2006-2026 The identified key production areas are considered the most suitable location for the propagation, raising and development of high value crops, livestock and fisheries based on soil and geographical suitability, land classes/ uses, proximity to support facilities, and other environmental consideration. These production areas, if properly utilized and sustainably developed, will push Bohol’s agriculture production to satisfy domestic requirements as well as provide for export commodity demands. Land consolidation and production integration can also be facilitated to achieve economies of scale and expansion of market reach.
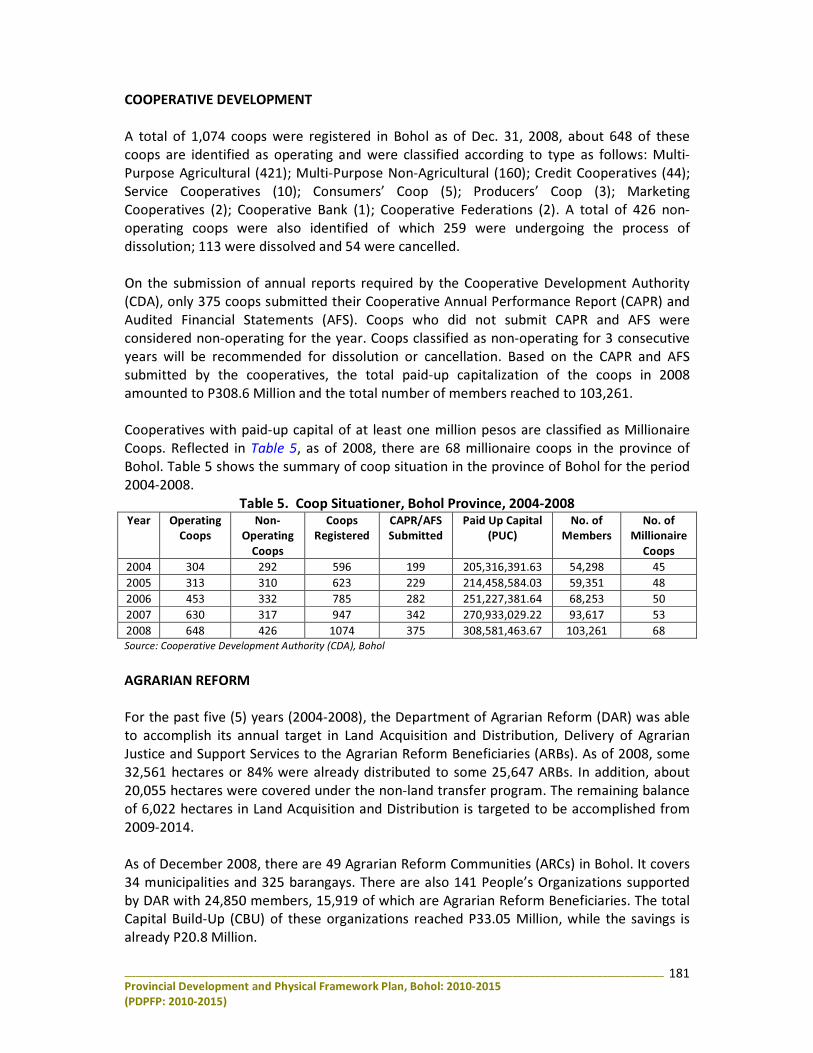
________________________________________________________________________________________________ Provincial Development and Physical Framework Plan, Bohol: 2010-2015 (PDPFP: 2010-2015)
181
COOPERATIVE DEVELOPMENT A total of 1,074 coops were registered in Bohol as of Dec. 31, 2008, about 648 of these coops are identified as operating and were classified according to type as follows: Multi-Purpose Agricultural (421); Multi-Purpose Non-Agricultural (160); Credit Cooperatives (44); Service Cooperatives (10); Consumers’ Coop (5); Producers’ Coop (3); Marketing Cooperatives (2); Cooperative Bank (1); Cooperative Federations (2). A total of 426 non-operating coops were also identified of which 259 were undergoing the process of dissolution; 113 were dissolved and 54 were cancelled. On the submission of annual reports required by the Cooperative Development Authority (CDA), only 375 coops submitted their Cooperative Annual Performance Report (CAPR) and Audited Financial Statements (AFS). Coops who did not submit CAPR and AFS were considered non-operating for the year. Coops classified as non-operating for 3 consecutive years will be recommended for dissolution or cancellation. Based on the CAPR and AFS submitted by the cooperatives, the total paid-up capitalization of the coops in 2008 amounted to P308.6 Million and the total number of members reached to 103,261. Cooperatives with paid-up capital of at least one million pesos are classified as Millionaire Coops. Reflected in Table 5, as of 2008, there are 68 millionaire coops in the province of Bohol. Table 5 shows the summary of coop situation in the province of Bohol for the period 2004-2008.
Table 5. Coop Situationer, Bohol Province, 2004-2008 Year Operating
Coops Non-
Operating Coops
Coops Registered
CAPR/AFS Submitted
Paid Up Capital (PUC)
No. of Members
No. of Millionaire
Coops 2004 304 292 596 199 205,316,391.63 54,298 45 2005 313 310 623 229 214,458,584.03 59,351 48 2006 453 332 785 282 251,227,381.64 68,253 50 2007 630 317 947 342 270,933,029.22 93,617 53 2008 648 426 1074 375 308,581,463.67 103,261 68 Source: Cooperative Development Authority (CDA), Bohol AGRARIAN REFORM For the past five (5) years (2004-2008), the Department of Agrarian Reform (DAR) was able to accomplish its annual target in Land Acquisition and Distribution, Delivery of Agrarian Justice and Support Services to the Agrarian Reform Beneficiaries (ARBs). As of 2008, some 32,561 hectares or 84% were already distributed to some 25,647 ARBs. In addition, about 20,055 hectares were covered under the non-land transfer program. The remaining balance of 6,022 hectares in Land Acquisition and Distribution is targeted to be accomplished from 2009-2014. As of December 2008, there are 49 Agrarian Reform Communities (ARCs) in Bohol. It covers 34 municipalities and 325 barangays. There are also 141 People’s Organizations supported by DAR with 24,850 members, 15,919 of which are Agrarian Reform Beneficiaries. The total Capital Build-Up (CBU) of these organizations reached P33.05 Million, while the savings is already P20.8 Million.
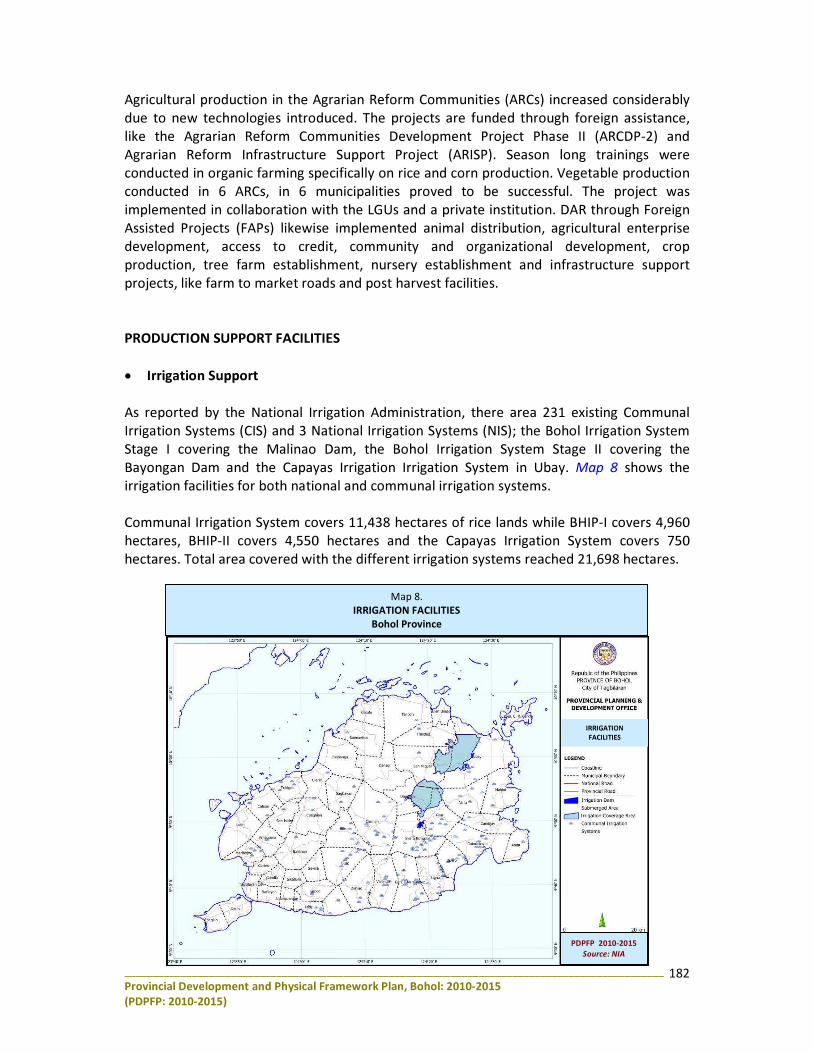
________________________________________________________________________________________________ Provincial Development and Physical Framework Plan, Bohol: 2010-2015 (PDPFP: 2010-2015)
182
IRRIGATION FACILITIES
Bohol
PDPFP 2010-2015 Source: NIA
Map 8. IRRIGATION FACILITIES
Bohol Province
Agricultural production in the Agrarian Reform Communities (ARCs) increased considerably due to new technologies introduced. The projects are funded through foreign assistance, like the Agrarian Reform Communities Development Project Phase II (ARCDP-2) and Agrarian Reform Infrastructure Support Project (ARISP). Season long trainings were conducted in organic farming specifically on rice and corn production. Vegetable production conducted in 6 ARCs, in 6 municipalities proved to be successful. The project was implemented in collaboration with the LGUs and a private institution. DAR through Foreign Assisted Projects (FAPs) likewise implemented animal distribution, agricultural enterprise development, access to credit, community and organizational development, crop production, tree farm establishment, nursery establishment and infrastructure support projects, like farm to market roads and post harvest facilities. PRODUCTION SUPPORT FACILITIES • Irrigation Support As reported by the National Irrigation Administration, there area 231 existing Communal Irrigation Systems (CIS) and 3 National Irrigation Systems (NIS); the Bohol Irrigation System Stage I covering the Malinao Dam, the Bohol Irrigation System Stage II covering the Bayongan Dam and the Capayas Irrigation Irrigation System in Ubay. Map 8 shows the irrigation facilities for both national and communal irrigation systems. Communal Irrigation System covers 11,438 hectares of rice lands while BHIP-I covers 4,960 hectares, BHIP-II covers 4,550 hectares and the Capayas Irrigation System covers 750 hectares. Total area covered with the different irrigation systems reached 21,698 hectares.
________________________________________________________________________________________________ Provincial Development and Physical Framework Plan, Bohol: 2010-2015 (PDPFP: 2010-2015)
183
The of the total arable area (273,950 has.) of the province, only 28% (76,063 has.) is devoted to rice. As identified by the National Irrigation Administration (NIA), the potential irrigable area of the province is estimated to be 40,800 hectares. As of 2008, the firmed-up service area is 21,698 hectares, with more than half of the identified potential irrigable area already irrigated attaining an irrigation development status of 53%. • Support Facilities The Bohol Experiment Station (BES) in Gabi, Ubay now Central Experiment Station (CES), has enough rice production areas on new rice varieties, from Registered to Certified Seed production, to cater the needed seed requirements of the seed growers and some farmers in the province. CES is also producing seedlings on fruit trees and ornamentals as planting materials. Plant tissue laboratory for banana and ubi is also operating in CES for the supply of tissue cultured banana and ubi. Bohol Agricultural Promotion Center (BAPC) is conducting researches on different varieties of rice that are suitable to the province. Likewise on-farm studies and technology demonstration in different sites within the province to promote package of technology like the Palay Check, Nutrient Management and Water-Saving Technology. BAPC likewise serves as the Provincial Agriculture and Technology Coordinating Office (PATCO) to implement the National Programs on agriculture. Through this, hybrid and certified seeds distribution with government subsidy was facilitated. Also the availment of postharvest facilities like MPDP, flatbed dryers, shredding machines, farm to market roads, construction of water impounding and small farm reservoirs, repair and rehabilitation of irrigation facilities, fish ports, green houses for vegetables and bagsakan centers, hand tractor, corn sheller and corn mill funded by the Department of Agriculture Central Office was facilitated. The Bohol Organic Agriculture Technology (BOATech) in Gabi, Ubay was recently inaugurated to cater the needs for organic production technologies, Like Natural farming System (NFS) and the production of organic fertilizer, like Bio-N and vermi-compost. Trichoderma and metarhizium laboratory are also available to help in the control of rice bug and other fungal infection on rice and corn. Bohol Farmers Multipurpose Cooperative (BOFAMCO) in Pilar, Bohol, operates as marketing arm and rice seed trading. They cater the rice seed planting materials to the farmers all throughout the province. The facility also offers drying facility for rice produce like the mechanical flatbed dryer and the multipurpose drying pavement. The National Food Authority (NFA) in Tagbilaran City secures the supply of rice grains requirement need for the entire populace in the province. They also purchase rice palay at Php 17.00 per kilo as the government support to local produces like the farmers. They see to it that they have enough buffer stock of rice (grain) in time of food crisis. Establishment of farm and hatcheries by government and private institutions provided support in the fishery sector. Government institution like the Bureau of Fisheries and Aquatic Resources (BFAR) operated the Clarin Freshwater Fish Farm in Clarin, Panggangan
________________________________________________________________________________________________ Provincial Development and Physical Framework Plan, Bohol: 2010-2015 (PDPFP: 2010-2015)
184
Multi-species Marine Fish Hatchery and the Calape Fishery Complex in Calape, Ubay Brakishwater Fish Farm and Ubay Tilapia Hatchery in Ubay and Mariculture Park in Talibon. Post production and marketing of fish and fishery products domestically and for export were mostly operated and managed by private institutions. Among the private institutions were; Alturas Group of Companies having prawn/bangus/tilapia farm in Calape and Loon and Frontier Hatchery for prawn and bangus fry in Lila, Akiat Family Prawn Hatchery in Dimiao. Presence of livestock facility centers in the province provides services on animal health, upgrading and distribution of stocks. Facilities include the Ubay Stock Farm (USF), and Philippine Carabao Center (PCC) in Lomangog, Ubay and the Carmen Breeding Station. DEVELOPMENT CHALLENGES � Crops
• Low agricultural productivity • High cost of farm inputs • Farm gate price of farm products is very low • Limited capitalization for agri-based enterprises • Limited farm machinery and post-harvest facilities • Lack of entrepreneurial knowledge of farmers • Poor adoption of new agricultural technologies • Limited farm size and land holding • Declining soil fertility • Farmer migration for job opportunity
� Livestock
a) Production ••• Conversion of forage and pasture areas to residential and industrial zone or
planted with high-value crops ••• High cost of commercial feeds for swine and poultry ••• Dwindling livestock breeder base
b) Animal and Public Health ••• Emerging and re-emerging diseases causing risk to animal and public health ••• Most meat sold at local markets come from non-accredited abattoir
c) Marketing and Enterprise Development ••• Livestock products and by-products produced by backyard raisers are not
commercially competitive d) Waste Management ••• Livestock-based waste contributing to environmental pollution
� Fishery
• Dwindling fish catch • Intrusion of commercial fishers to municipal fishing grounds • Presence of illegal fishing and use of destructive methods of fishing
________________________________________________________________________________________________ Provincial Development and Physical Framework Plan, Bohol: 2010-2015 (PDPFP: 2010-2015)
185
• Non-observance of “open and closed season” fishing that prohibits fishing during spawning period
• Poor enforcement of fishery law • Lack of proper waste management disposal • Inadequate facilities and post harvest technologies
� Agri Enterprise
• Poor market linkages • Lack of adequate promotion of locally produced agri products
DEVELOPMENT PLAN FRAMEWORK
Sub-Sector Vision A developed and dynamic province with farmers and fisherfolks adequately reached
by extension and other services, utilizing cost-effective and appropriate technologies and infrastructure facilities, and participating fully towards a more productive and sustainable agriculture.
Sub-Sector Goals
• Improved quality of life of Boholano farmers, farm workers and fisherfolks. • Reduced poverty incidence in the province through increased productivity and
profitability by providing greater access to basic services, agricultural extension, technologies and markets.
• Increased agricultural productivity and income of Boholano farmers.
Sub-Sector Objectives and Targets
� Crops
• To increase rice yield Target: Irrigated - from 3.5 m.t. to 4.0 m.t. Rainfed - from 2.4 m.t. to 3.0 m.t.
• To sustain the rice sufficiency level of 114% • To meet the demand of corn by 80% • To increase high-value commercial crop production
- increase vegetable production by 25% - meet local demand of the peanut industry by 90% - meet the 70% of the national demand for violet ubi - increase organic bongan banana production by 100%
• To fully utilize idle and fallow areas by 25% • To increase area planted to oil palm and jatropha by 40% • To generate jobs by 20%
________________________________________________________________________________________________ Provincial Development and Physical Framework Plan, Bohol: 2010-2015 (PDPFP: 2010-2015)
186
• To establish/ strengthen corn, peanut and ubi seed system • To establish agri-support facilities
- 1 aflatoxin testing laboratory - 1 violet ubi tissue culture laboratory - 2 banana packing centers in strategic areas - 1 cardava processing plant - 1 macapuno embryo culture laboratory - 1 rice processing complex - 1 calamay processing - 3 bagsakan centers
• To promote organic agriculture - 5,000 hectares of organic agricultural farms
� Livestock
••• To utilize non-arable areas for forage development - sloping agricultural areas - forage under orchard/coco /forest trees plantation - areas along irrigation canals
••• To promote organic swine and poultry raising - Production demo established:
3 organic swine production 3 organic poultry production
• To increase breeder base a) Goat – 15% b) Swine – 15% c) Carabao – 15% d) Cattle – 10% e) Native Chicken – 25% f) Ducks – 10% g) 1 liquid nitrogen plant established
• To prevent entrance and control the spread of diseases of economic and public health importance
- increase vaccination coverage by30% - increase deworming coverage by 30% - increase IEC campaign on prevention of emerging and re-emerging diseases
by 50% - 100% of ports, sub-ports & airport manned by trained veterinary
quarantine officers/inspectors - 1 animal diagnostic laboratory established
• To prevent and control sale of hot and unsafe meat - 80% of meat sold at local markets passed meat inspection - all LGU operating abattoir have local accreditation - 2 “AA” abattoir established
• To provide support to small hold/backyard livestock raisers in marketing and product development
- existing LOM upgraded
________________________________________________________________________________________________ Provincial Development and Physical Framework Plan, Bohol: 2010-2015 (PDPFP: 2010-2015)
187
- additional 5 Livestock Oksyon Market (LOM)/ livestock pooling centers - 1 livestock and livestock product development and processing center
established - 5 PO-based dairy project established
• To manage and utilize livestock wastes - 12 biogas digester established - 1 rendering plant established
� Fishery • To increase fishery production by at least 20%. • To establish new and expand existing marine sanctuaries and fish cages
- 5 techno demo sites • To establish and operationalize mariculture zones
- 3 mariculture zones • To meet local consumption/ demand of fish and fishery products by 20% • To harness the potential of seaweeds in the vast coasts of the province • To harness the potential of oysters in the vast river network in the province • To establish fishery support facilities
- 1 seaweed seedling bank - 1 carageenan processing plant - 1 oyster processing plant
� Agri Enterprise
• To establish market linkages for agri products • To promote enterprise development and management
- establish 100 community-based micro food enterprises
Sub-Sector Strategies � Crops
a) Production • Adoption of crops diversification and integrated farming systems • Deliberate promotion of home lot vegetable gardening • Promotion of appropriate farm technologies through Farmers-Field-School
and Season-Long Training • Adoption of organic farming • Production of CFA tricotherma, plant residues, fermented juices as sources of
organic fertilizer • Production of bio-control pesticides to replace chemicals • Promotion of BOATech Center • Sustain Learning Centers and demo farms • Create/ strengthen the seed system and seed producers’ associations • Sustain and maintain roll-over schemes for seeds and fertilizer subsidies • Information dissemination on oil palm and jatropha production • Utilization of idle or marginal lands for oil palm and jatropha production
________________________________________________________________________________________________ Provincial Development and Physical Framework Plan, Bohol: 2010-2015 (PDPFP: 2010-2015)
188
• Strengthening efforts on soil enrichment and conservation • Establishment of agri-support facilities
b) Marketing and Enterprise Development • Provide access to microfinance and financing institutions • Increase production of ubi, banana, peanut and ginger for agri-enterprise • Development of agri-based enterprises by POs and/or cooperatives
� Livestock a) Production • Intensify campaign on forage and pasture development • Provide forage planting materials • Lease contract agreement with private owners of idle, sloping lands and
under plantations • Conduct forage and pasture management training • Establishment of seed banks and nurseries • Conduct training of implementers and project participants • Intensify campaign on organic swine and poultry production • Conduct baseline survey of breeder base • Infuse breeders • Adoption of Artificial Insemination (AI) and natural breeding services • Provision of buy-back fund • Livestock mortuary in place
b) Animal and Public Health • Adoption of roll-over scheme in vaccination and deworming • Develop and implement disease preparedness program • Strengthen Bohol Livestock Aide (BALA) program • Strict implementation of intra and inter provincial quarantine services • Establishment of Provincial Meat Control and Safety Services • Conduct training of meat inspectors, butchers and meat vendors • Development of policies on local accreditation of abattoir • Conduct baseline survey on existing abattoir operation
c) Marketing and Enterprise Development • Conduct baseline survey • Provision of updated price monitor thru:
- Installation of price monitoring board - Development of e-marketing info system for livestock
• Organize backyard commodity raisers • Conduct of market studies/ research • Conduct training on product development and processing
d) Waste Management • Conduct baseline survey • Conduct related trainings
________________________________________________________________________________________________ Provincial Development and Physical Framework Plan, Bohol: 2010-2015 (PDPFP: 2010-2015)
189
• Adoption of vermi-composting • Promote utilization of manure as organic fertilizer • Promote development of livestock by-products (skin, hooves, horns, blood,
hairs) � Fishery
• Establishment of marine sanctuaries and strengthening of existing marine or fish sanctuaries
• Intensify enforcement of fishery laws • Establishment of additional hatcheries in strategic areas • Promote aquaculture in inland bodies of water • Establishment of seaweed seedling bank and processing plants • Application of modified technology in increasing productivity and income of
seaweed farmers • Continued provision of trainings and technical assistance on municipal fishing
technologies, coastal resource management and deputation of fish wardens and fishery law enforcement
� Agri Enterprise
• Provision of agribusiness and entrepreneurial trainings • Intensify promotion of locally produced agri-products • Improved packaging and shelf-life of agri-processed foods • Conduct frequent agri fair and market matching • Creation of a pool of business service providers • Establishment of a business incubator for food enterprises • Cooperativize growers to venture into unified marketing directly to processors
PRIORITY PROGRAMS AND PROJECTS 1) Sustainable Integrated Agribusiness Program (SIAP)
Strategies and Project Packages for Bohol (BAMP 2006-2026)
Strategies for developing appropriate farming systems using environment-friendly and innovative technologies that would lead to agri-based enterprises over the long-term takes into consideration topographic variations and limitations, climatic factors, institutional limitations and the socio-economic aspects affecting farmers and/or their POs decisions on technology and investments.
SHORT TERM (Years 1 to 5)
MEDIUM TO LONGER TERM (Years 6-20)
Enhanced grain crops production Intensive grain crops farming systems
________________________________________________________________________________________________ Provincial Development and Physical Framework Plan, Bohol: 2010-2015 (PDPFP: 2010-2015)
190
SHORT TERM (Years 1 to 5)
MEDIUM TO LONGER TERM (Years 6-20)
Highland vegetables farming system (integration of project into Certificate of Ancestral Domain Claim (CADC) management plan)
Diversified highland HVCs enterprise of Tribal Coops/Corporatives
Coconut-based farming systems Small Coconut Farmers Organizations (SCFO) cluster farms coconut-based enterprises
Expand mango-based farming systems Mango-based (Cluster Farms) Enterprise Development
Hillyland Resource Development Sustainable Hillyland Farming Systems
2) Livestock Integration for Food Enterprise
Livestock and poultry integration into the existing farming systems are viable options to small farmholders. Such integration in crop production will mutually complement both production systems. Animals can serve as high protein food, source of draft power for farm operations and as a good source of organic fertilizer. On the other hand, crops and its by-products can provide the animals its feed requirement. Aside from such advantage, livestock raising generates income regardless of season unlike crops which can only be harvested at certain times of the year. It can also maximize space utilization as areas not suited for crops can be used for pasture or range areas.
3) Development and Management of Fishery Resources
The development and management of fishery resources aims to address the prevailing issues on illegal and destructive fishing practices that recur in municipal waters. Covering an estimated area of 6,245 km2, the LGUs have the legal mandate to manage the municipal waters. Aside from the LGUs responsibility of ensuring food security, the protection and management of its fishery resources is also essential.
4) Development and Management of Natural Resources
The present situation of the province’s timberland which comprises 25% of the total land area is in a bad state and is in need of proper protection and conservation measures. Of the 10 major watersheds in Bohol, only three (3) have been assessed and rehabilitation programs identified, namely: The Inabanga-Wahig watershed, the Duero-Cansuhay watershed and the Caroud watershed. Another concern is the area covered by a Certificate of Ancestral Domain Claim (CADC) of the Eskayas, an indigenous people. Covering a total area of 3,170 hectares located in the barangays of Taytay, Duero; Bayabas and Mayuga in Guindulman, and portion of the municipality of Sierra Bullones. Suitable areas within the CADC are presently utilized to subsistence vegetable production, and proposed for the expansion under the highland HVCs farming systems.
________________________________________________________________________________________________ Provincial Development and Physical Framework Plan, Bohol: 2010-2015 (PDPFP: 2010-2015)
191
5) Establishment of Agriculture Support Facilities
a) Crops 1. Aflatoxin Testing Laboratory (Carmen) 2. Violet Ubi Tissue Culture Laboratory (BOATech, Gabi, Ubay) 3. Banana Packing Centers (Carmen, Jagna) 4. Cardava Processing Plant (Carmen) 5. Macapuno Embryo Culture Laboratory (Ubay) 6. Bohol Integrated Rice Processing Complex (Pilar) 7. Calamay Processing Complex (Jagna) 8. Bagsakan Centers (Corella, Balilihan, Carmen, Guindulman, Anda) 9. Establishment of Tramline (Garcia Hernandez, Jagna, Carmen)
b) Livestock
1. Livestock Production Demo - 3 organic swine production (San Miguel, Catigbian, Baclayon) - 3 organic poultry production (Antequera, Corella, San Isidro)
2. Liquid Nitrogen Plant (Ubay) 3. Animal Diagnostic Laboratory (Tagbilaran City) 4. “AA” Abattoir (Tagbilaran City, Dauis) 5. “A” Abattoir (Tubigon, Sagbayan, Carmen, Talibon, Guindulman) 6. Livestock Oksyon Market (LOM)/ Livestock Pooling Center (Sagbayan,
Carmen, Baclayon, Loay, San Miguel) 7. Livestock Product Development and Processing Center (Ubay) 8. Dairy Project (Danao, Carmen, Bilar, Mabini) 9. Biogas Digester (Tubigon, Sagbayan, Carmen, Talibon, Guindulman,
Tagbilaran City, Trinidad, Inabanga, Loon, Antequera, Bilar, Mabini) 10. Rendering Plant (Tagbilaran City)
c) Fishery
1. Seaweed Seedling Bank (Talibon, Bohol) 2. Carageenan Processing Plant (Talibon, Bohol) 3. Oyster Processing Plant (Talibon, Bohol) 4. Mariculture Zone (Research and Techno Demo Sites – 594 has.)
- Talibon Mariculture Park (Talibon Group of Islands Protected Landscape/Seascape - 217.47 has.)
- Mabini Mariculture Zone (114 has.) - Candijay Mariculture Zone (Cogtong Bay – 116 has.) - Calape Mariculture park (Pangangan and Mantatao Islands - 146.5 has.) - Basiao Channel, between Ubay and Carlos P. Garcia - Banacon and Jandayan Islands, Getafe
5. Municipal Mariculture Parks - Maribojoc Bay - Getafe Bay - Loon Bay
6. Seaweed Bio-energy Research and Development Center (Talibon)
________________________________________________________________________________________________ Provincial Development and Physical Framework Plan, Bohol: 2010-2015 (PDPFP: 2010-2015)
192
Sector : ECONOMIC DEVELOPMENT Sub-Sector: Tourism Development
SITUATIONER • Tourist Arrivals
Bohol’s tourism industry has grown and developed significantly over the past 5 years. The current trend and the clear potential for its steady growth has been seen as the number of tourist arrivals soars high and investments for tourism development continue to pour in the island province. The Department of Tourism (DOT), Regional Office-VII (RO-VII) reported that visitor arrivals in Bohol registered a steady increase from 2003 to 2008, as shown in Figure 37. Excluding day trippers who come to Bohol for a day tour, DOT RO-VII reported2 a total of 282,498 arrivals in 2008, marking a 15% increase from the 2007 figure of 244,718. This latest figure is far greater than the 2003 visitor arrivals of only 128,899, registering a 119% increase in a span of 6 years or an average yearly increase of 19.9%.
Bohol visitor arrivals, although still dominated by domestic market, has shown increasing preference by foreigners. In 2008, DOT reported that foreign tourists shared 29% of the total tourist arrivals in the province, higher than the 23% and 27% share in 2006 and 2007, respectively. Domestic tourist, which accounted 73% in 2007, decreased to 71% in 2008. However, the provincial entry count, conducted by the Bohol Tourism Office (BTO) showed a higher and more promising tourism statistics as shown in Figure 38. For 2008, visitor entry reached to 567,174 higher by 6.65% from the 2007 visitor arrival figures of 531,812. Based on BTO’s count from 2003 to 2008, visitor arrivals increased by 495%. 2 Tourist count from DOT-accredited tourism facilities in Bohol
Source : DOT–R7
0
100,000
200,000
300,000
Domestic 110,514 137,740 152,873 169,058 179,246 199,610
Foreign 18,385 26,921 35,118 50,253 65,472 82,888
Total 128,899 164,661 187,991 219,311 244,718 282,498
2003 2004 2005 2006 2007 2008
86% 84%
81% 77%
73%
14% 16% 19% 23%
27% 29%
71%
Figure 37. Domestic and Foreign Visitor Arrivals, Bohol, 2003-2008
________________________________________________________________________________________________ Provincial Development and Physical Framework Plan, Bohol: 2010-2015 (PDPFP: 2010-2015)
193
Of the 2008 foreign travel market in the province, Taiwan has the largest number of visitor coming in with 23,413 visitors. (Table 6) On the other hand, about 13,956 Europeans and 9,357 from America visited Bohol on that year. Table 6 shows Bohol’s top 10 foreign travelers in 2008. On the regional context, Bohol consistently shares significant part of the total number of visitor arrivals among the 4 provinces in Region VII (Figure 39). It remains to be the second most frequently visited province in the region, sharing 13% of the total foreign and domestic markets.
Cebu Province still registered the biggest share with 76% of the total regional tourist arrivals. However, Bohol is increasingly attracting more visitors and gaining tourism market in the region as its share grows from 6% in 2003 to 13% in 2008. Disaggregating this, the province shares 11% of the total foreign market, while getting a 15% share in the local market.
Table 6. Top 10 Foreign Travelers, Bohol, 2008
Country of Origin No. of Visitors Taiwan 23,413 China (PROC) 10,311 Korea 8,778 USA 7,480 Japan 4,502 Germany 4,269 Australia 1,903 Canada 1,877 France 1,826 United Kingdom 1,521 Source: DOT RO-VII
Source : Bohol Tourism Office
0
100,000
200,000
300,000
400,000
500,000
600,000
Arrivals 95,311 249,729 393,941 418,030 531,812 567,174
2003 2004 2005 2006 2007 2008
Figure 38. Visitor Arrivals, Bohol, 2003-2008
Figure 39. Visitor Arrivals, Region-7, 2008
Siquijor1%Negros Or.
10%Bohol13%
Cebu76%
Source: DOT RO-VII
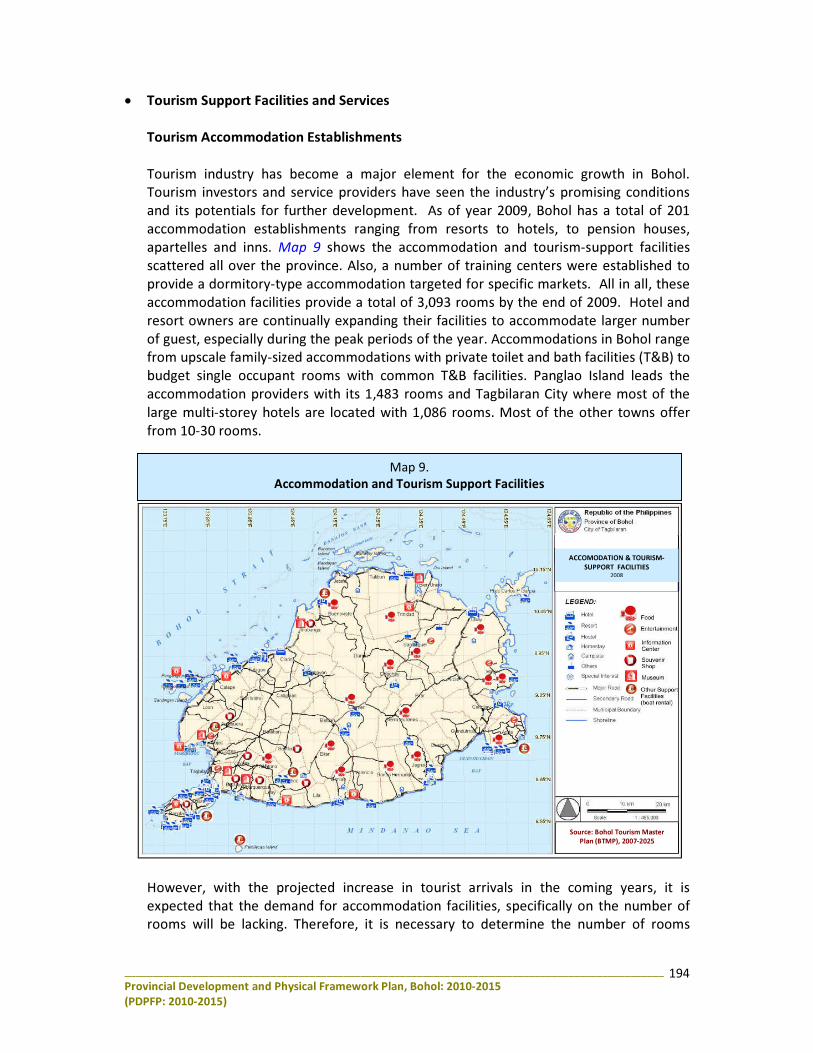
________________________________________________________________________________________________ Provincial Development and Physical Framework Plan, Bohol: 2010-2015 (PDPFP: 2010-2015)
194
ACCOMODATION & TOURISM-SUPPORT FACILITIES
2008
Source: Bohol Tourism Master Plan (BTMP), 2007-2025
Map 9. Accommodation and Tourism Support Facilities
• Tourism Support Facilities and Services
Tourism Accommodation Establishments Tourism industry has become a major element for the economic growth in Bohol. Tourism investors and service providers have seen the industry’s promising conditions and its potentials for further development. As of year 2009, Bohol has a total of 201 accommodation establishments ranging from resorts to hotels, to pension houses, apartelles and inns. Map 9 shows the accommodation and tourism-support facilities scattered all over the province. Also, a number of training centers were established to provide a dormitory-type accommodation targeted for specific markets. All in all, these accommodation facilities provide a total of 3,093 rooms by the end of 2009. Hotel and resort owners are continually expanding their facilities to accommodate larger number of guest, especially during the peak periods of the year. Accommodations in Bohol range from upscale family-sized accommodations with private toilet and bath facilities (T&B) to budget single occupant rooms with common T&B facilities. Panglao Island leads the accommodation providers with its 1,483 rooms and Tagbilaran City where most of the large multi-storey hotels are located with 1,086 rooms. Most of the other towns offer from 10-30 rooms.
However, with the projected increase in tourist arrivals in the coming years, it is expected that the demand for accommodation facilities, specifically on the number of rooms will be lacking. Therefore, it is necessary to determine the number of rooms
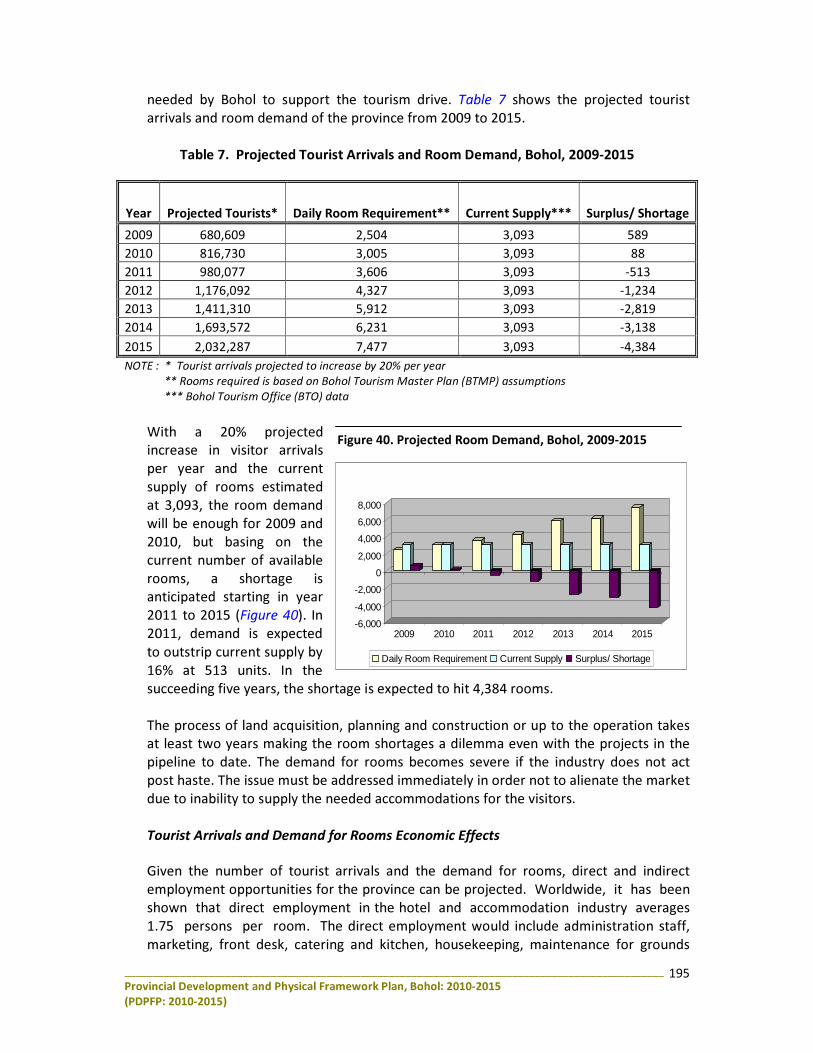
________________________________________________________________________________________________ Provincial Development and Physical Framework Plan, Bohol: 2010-2015 (PDPFP: 2010-2015)
195
-6,000
-4,000
-2,000
0
2,000
4,000
6,000
8,000
2009 2010 2011 2012 2013 2014 2015
Daily Room Requirement Current Supply Surplus/ Shortage
Figure 40. Projected Room Demand, Bohol, 2009-2015
needed by Bohol to support the tourism drive. Table 7 shows the projected tourist arrivals and room demand of the province from 2009 to 2015.
Table 7. Projected Tourist Arrivals and Room Demand, Bohol, 2009-2015
With a 20% projected increase in visitor arrivals per year and the current supply of rooms estimated at 3,093, the room demand will be enough for 2009 and 2010, but basing on the current number of available rooms, a shortage is anticipated starting in year 2011 to 2015 (Figure 40). In 2011, demand is expected to outstrip current supply by 16% at 513 units. In the succeeding five years, the shortage is expected to hit 4,384 rooms. The process of land acquisition, planning and construction or up to the operation takes at least two years making the room shortages a dilemma even with the projects in the pipeline to date. The demand for rooms becomes severe if the industry does not act post haste. The issue must be addressed immediately in order not to alienate the market due to inability to supply the needed accommodations for the visitors. Tourist Arrivals and Demand for Rooms Economic Effects
Given the number of tourist arrivals and the demand for rooms, direct and indirect employment opportunities for the province can be projected. Worldwide, it has been shown that direct employment in the hotel and accommodation industry averages 1.75 persons per room. The direct employment would include administration staff, marketing, front desk, catering and kitchen, housekeeping, maintenance for grounds
Year Projected Tourists* Daily Room Requirement** Current Supply*** Surplus/ Shortage 2009 680,609 2,504 3,093 589 2010 816,730 3,005 3,093 88 2011 980,077 3,606 3,093 -513 2012 1,176,092 4,327 3,093 -1,234 2013 1,411,310 5,912 3,093 -2,819 2014 1,693,572 6,231 3,093 -3,138 2015 2,032,287 7,477 3,093 -4,384 NOTE : * Tourist arrivals projected to increase by 20% per year ** Rooms required is based on Bohol Tourism Master Plan (BTMP) assumptions *** Bohol Tourism Office (BTO) data
________________________________________________________________________________________________ Provincial Development and Physical Framework Plan, Bohol: 2010-2015 (PDPFP: 2010-2015)
196
and buildings, and security. It also includes restaurants and banquet service staff on a full and part-time basis, entertainers, spa and sports management personnel. On the other hand, indirect employment generated by the industry averages 2 persons per hotel room. These include jobs created in the sectors, which provide goods and services to the tourism industry. These include food and beverage suppliers, toiletries, housekeeping supplies, laundry services, printing and related services, car hire services, tour operators, souvenir shop suppliers, beauty shops and barbers, flower shop supplies and personnel. The resulting picture for jobs created as a direct result of additional rooms constructed and operated for the industry is shown as follows:
Table 8. Projected Room Demand and Jobs to be Generated, Bohol, 2011-2015
JOBS TO BE GENERATED
Year Rooms
Required Current Supply
Room Demand
Direct Jobs (1.75)
Indirect Jobs (2.0) Total
2011 3,606 3,093 513 898 1,026 1,924 2012 4,327 3,093 1,234 2,160 2,468 4,628 2013 5,912 3,093 2,819 4,933 5,638 10,571 2014 6,231 3,093 3,138 5,492 6,276 11,768 2015 7,477 3,093 4,384 7,672 8,768 16,440
Using the same factors and the additional rooms, tourism should be currently employing by 2011 over 898 persons directly in the hotel and accommodation sector and accounts for 1,026 indirect jobs. The total jobs provided by the industry would be over 1,924 additional full time persons. The opportunities created by the tourism boom will be largely felt in the job market. In the moderate projections by the year 2015 another 16,440 jobs would be created bringing the industry total to over 45,000 persons employed by tourism and affiliated concerns. The optimistic view, which factors-in the various government responses to the industry needs, including the operation of the international airport, the expected new employment is expected to soar. The job generation of the industry includes other food and restaurant outlets, which will necessarily sprout up to serve the growing need of the tourism industry. Given the income opportunities provided by the industry, private sector investments in this area is expected to be as brisk as those in the provision of hotel rooms. A key concern with the existing rooms however is the range of quality i.e. some are international standard, some satisfy Department of Tourism (DoT) standards while many appear to fall below DoT standards. To get all of these rooms in under a provincial accreditation program that can successfully monitor their quality, quantity and level of service, the evolution of separate sets of physical standards may need to be considered i.e. a provincial/ city level and a municipal level of standards. A system of promotions can then be set to allow the operators to improve from a lower to higher physical standard with the corresponding incentives. This will be possible with the implementation of the formulated Quality Standards for Sustainable Tourism in the province.
________________________________________________________________________________________________ Provincial Development and Physical Framework Plan, Bohol: 2010-2015 (PDPFP: 2010-2015)
197
Ancillary Tourism Facilities and Services Food services and restaurants have also become a viable and profitable business to boost tourism development in Bohol. Owing to the increasing influx of visitor availing tour packages to different sites in the province, the number of tour operators as well as transport/ vehicle-for-hire ventures has also increased. In 2007, about 400 units of vans for hire and 12 tour buses operate in the province. Tour guiding services have also become an attractive income source for some Boholanos leading to the establishment of a number of associations and groups for this purpose.
Tourism Infrastructure Support Facilities
Major entry points to the province, like the airport and seaport in Tagbilaran City, seaports in Tubigon, Ubay, Jagna and Talibon, are key tourism infrastructures that link Bohol to Manila, the Visayas and Mindanao. In 2008, shipcalls have increased by 8.3% a total of 392 shipcalls for fastcrafts and 552 for conventional sea vessels. There are already nine (9) daily trips of fastcrafts plying the Cebu-Tagbilaran route. On the other hand, there is a dramatic increase to air traffic in the province as a result of the growing number of incoming and outgoing flights, for the year 2008 at 17.5% and 15.51%, respectively. Flights to and from Manila in 2008 reached to 1,760, carrying a total of 100,056 passengers to the province. Passenger arrivals have increased by 16.6% from the 2007 figure. Currently, there are five (5) flights to Tagbilaran from Manila daily. Communication facilities are continually undergoing improvements in the province that kept tourist and visitors linked to the world. Three (3) telephone companies operate in Bohol, while at least three (3) cellular phone networks have installed their cellular sites all over the province. Internet service providers also abound providing wi-fi broad-band, cable internet and dial-up connections to subscribers.
• Bohol’s Major Tourism Attractions Tourism more than any other industry, relies upon the integrity of a locale’s natural and man-made environment, and cultural underpinnings, the sum total of which could be called a locale’s heritage. In the Province of Bohol, its rich heritage consisting of beautiful landscapes, coastlines, diversified flora and fauna, religious/ historic landmarks and archaeological artifacts are the very foundation of Bohol tourism. A noteworthy example of Bohol’s heritage is its unique and best known karst feature, the famous “Chocolate Hills” which has been declared by the National Commission on Geological Science as a geological monument. Another is the indigenous and Spanish heritage consisting of archeological sites and religious monuments which gives the province a welcome opportunity to vie to be listed by UNESCO in its world heritage list. The province was also declared as an eco-cultural tourism zone under Republic Act No. 9446 dated May 9, 2007. The Act recognizes the province as a national tourism zone that shall protect and enhance the natural features and cultural heritage of the tourism zone, while providing sustainable economic opportunities for the local community.
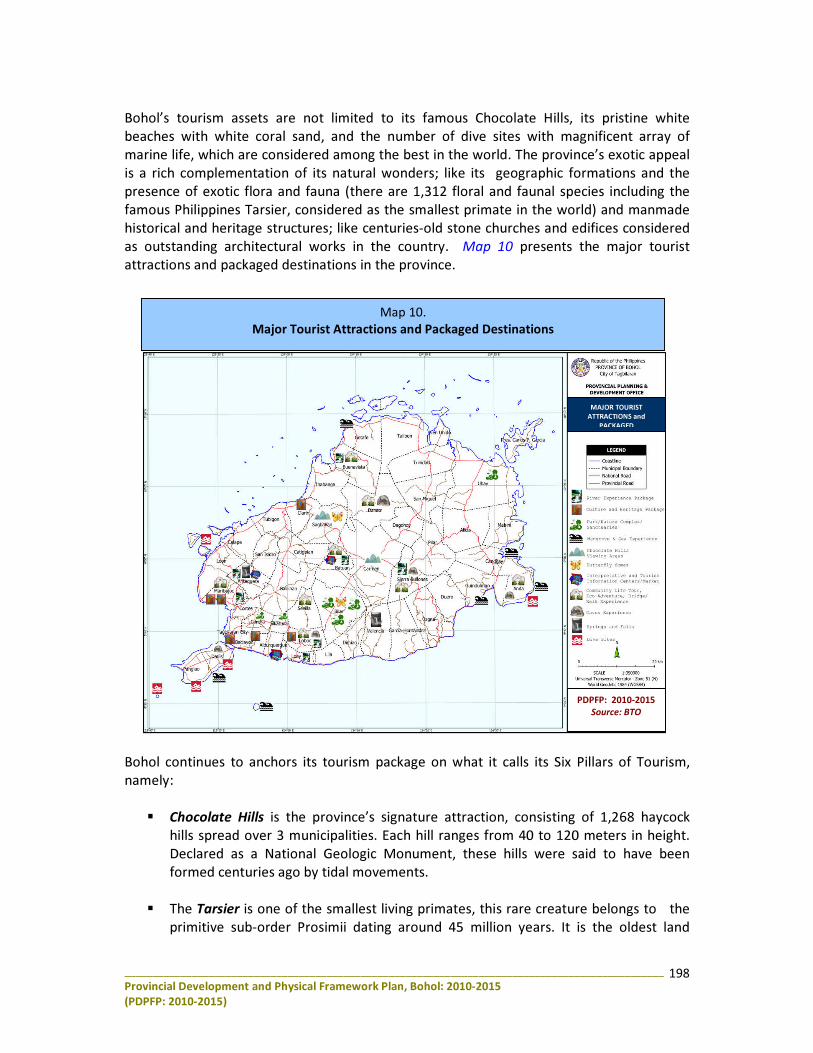
________________________________________________________________________________________________ Provincial Development and Physical Framework Plan, Bohol: 2010-2015 (PDPFP: 2010-2015)
198
PDPFP: 2010-2015 Source: BTO
MAJOR TOURIST ATTRACTIONS and
PACKAGED
Map 10. Major Tourist Attractions and Packaged Destinations
Bohol’s tourism assets are not limited to its famous Chocolate Hills, its pristine white beaches with white coral sand, and the number of dive sites with magnificent array of marine life, which are considered among the best in the world. The province’s exotic appeal is a rich complementation of its natural wonders; like its geographic formations and the presence of exotic flora and fauna (there are 1,312 floral and faunal species including the famous Philippines Tarsier, considered as the smallest primate in the world) and manmade historical and heritage structures; like centuries-old stone churches and edifices considered as outstanding architectural works in the country. Map 10 presents the major tourist attractions and packaged destinations in the province.
Bohol continues to anchors its tourism package on what it calls its Six Pillars of Tourism, namely:
� Chocolate Hills is the province’s signature attraction, consisting of 1,268 haycock
hills spread over 3 municipalities. Each hill ranges from 40 to 120 meters in height. Declared as a National Geologic Monument, these hills were said to have been formed centuries ago by tidal movements.
� The Tarsier is one of the smallest living primates, this rare creature belongs to the
primitive sub-order Prosimii dating around 45 million years. It is the oldest land
________________________________________________________________________________________________ Provincial Development and Physical Framework Plan, Bohol: 2010-2015 (PDPFP: 2010-2015)
199
species in continuous existence in the Philippines. It measures 4-5 inches long, with its tail longer than its body.
� Dive Sites off the coast of Panglao, Balicasag, Cabilao in Loon, where one can marvel
at one of the most colorful and exotic displays of marine life are considered among of the bests in the country. The undersea terrain is predominantly limestone creating overhangs, crevices and declivitous walls that contribute to the underwater beauty of the province’s dive sites.
� Beaches of Panglao and Anda towns, has soft powdery and white sand, palm-fringed
and clear-blue seawaters. � Heritage structures made of coralline stones dating back to the colonial era, erected
at the instigation of the Spanish friars, include churches, convents, watchtowers, escuelas, cabildos and precidencias, that even today speak well of their adaptation and usefulness.
� Bohol’s history and culture, doubtlessly rich in texture and topography, provided the
fertile ground for the development of the people’s dynamic arts, traditions and cultural expressions evident in their music, dance, literature, theater, sculpture, paintings and other visual arts forms.
• Tourism Development Initiatives and Management Tools
a) Development of Tourism Clusters in the Province
To establish the long-term overall direction for tourism development in the province, the Bohol Provincial Government has initiated the development of the Bohol Tourism Master Plan (BTMP), 2007-2025. This undertaking will eventually establish the tourism commonalities among the different municipalities and develop their potential tourism sites by means of clustering strategy. Investments for site development will now cover a broader scope and will be a concerted effort by municipalities within the clusters. Pooling of resources and counter-parting will be an appropriate scheme to finance the overall development of the clusters. Tourism sites of municipalities will complement with other sites, providing a diversified attraction to tourist. This master plan will also enhance the existing tourism assets in the province and develop new infrastructures that would improve the accessibility and networks of its tourism sites. In order to properly guide the development of the tourism industry in Bohol and grant equal socio-economic opportunities to municipalities that have potential and similar tourism assets, clustering of municipalities was narrowed down to five (5) clusters (Map 11) Strategically grouping the municipalities provides an effective mechanism for a more focused tourism promotion activities, strengthening inter-municipal coordination and sharing common service facilities. These clusters are delineated based on land and water forms/ characteristics, geography and linkages, land use and settlement patterns, available infrastructure, type/quality/quantity of tourism assets (whether nature-based
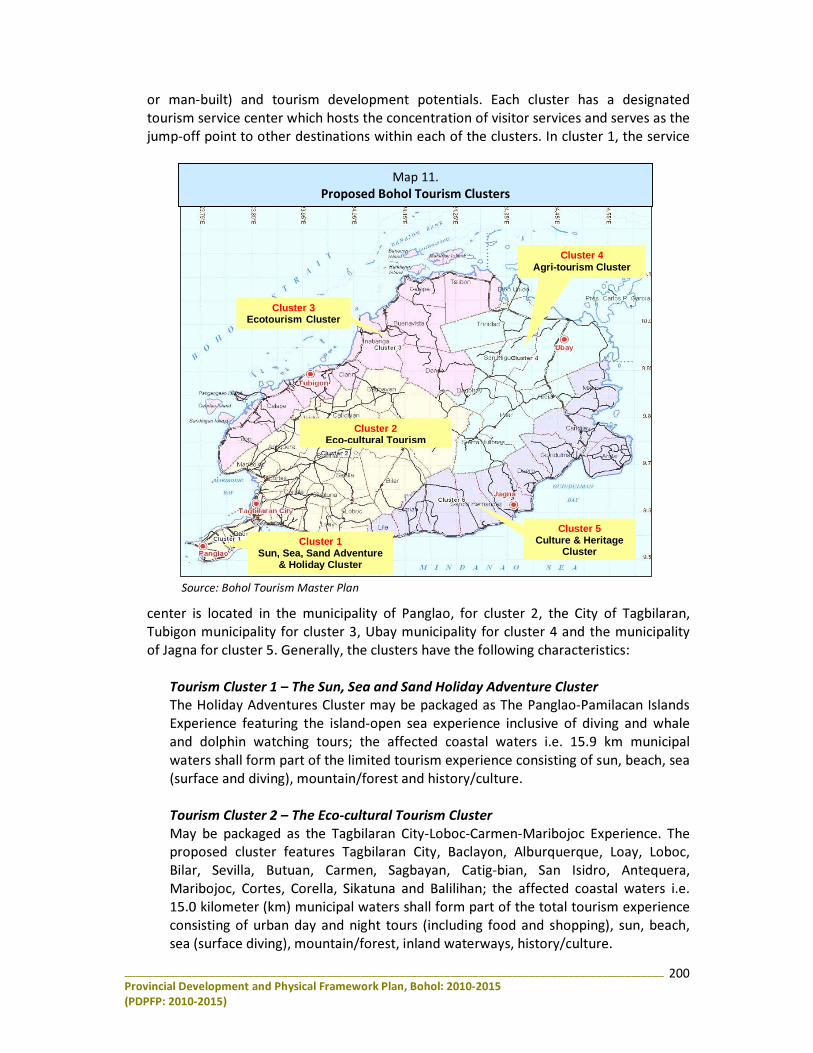
________________________________________________________________________________________________ Provincial Development and Physical Framework Plan, Bohol: 2010-2015 (PDPFP: 2010-2015)
200
Source: Bohol Tourism Master Plan
Map 11. Proposed Bohol Tourism Clusters
Cluster 3 Ecotourism Cluster
Cluster 1 Sun, Sea, Sand Adventure
& Holiday Cluster
Cluster 2 Eco-cultural Tourism
Cluster 4 Agri-tourism Cluster
Cluster 5 Culture & Heritage
Cluster
or man-built) and tourism development potentials. Each cluster has a designated tourism service center which hosts the concentration of visitor services and serves as the jump-off point to other destinations within each of the clusters. In cluster 1, the service
center is located in the municipality of Panglao, for cluster 2, the City of Tagbilaran, Tubigon municipality for cluster 3, Ubay municipality for cluster 4 and the municipality of Jagna for cluster 5. Generally, the clusters have the following characteristics:
Tourism Cluster 1 – The Sun, Sea and Sand Holiday Adventure Cluster The Holiday Adventures Cluster may be packaged as The Panglao-Pamilacan Islands Experience featuring the island-open sea experience inclusive of diving and whale and dolphin watching tours; the affected coastal waters i.e. 15.9 km municipal waters shall form part of the limited tourism experience consisting of sun, beach, sea (surface and diving), mountain/forest and history/culture. Tourism Cluster 2 – The Eco-cultural Tourism Cluster May be packaged as the Tagbilaran City-Loboc-Carmen-Maribojoc Experience. The proposed cluster features Tagbilaran City, Baclayon, Alburquerque, Loay, Loboc, Bilar, Sevilla, Butuan, Carmen, Sagbayan, Catig-bian, San Isidro, Antequera, Maribojoc, Cortes, Corella, Sikatuna and Balilihan; the affected coastal waters i.e. 15.0 kilometer (km) municipal waters shall form part of the total tourism experience consisting of urban day and night tours (including food and shopping), sun, beach, sea (surface diving), mountain/forest, inland waterways, history/culture.
________________________________________________________________________________________________ Provincial Development and Physical Framework Plan, Bohol: 2010-2015 (PDPFP: 2010-2015)
201
Tourism Cluster 3 – The Ecotourism Cluster May be packaged as The Northwestern Bohol Experience and shall feature the towns of Loon, Calape, Tubigon, Clarin, Inabanga, Buenavista, Jetafe, Talibon and Danao, the island group of Loon and Calape and the Danahon Double Reef; the affected coastal waters i.e. 15.0 km municipal waters shall form part of the limited tourism experience consisting o sun, beach, sea (surface and diving). Tourism Cluster 4 – The Agri-Tourism and Heritage Cluster May be packaged as the Northeastern Bohol Experience featuring the coastal towns of Trinidad, Bien Unido and Ubay, the inland towns of Alicia, Sierra Bullones, Pilar, Dagohoy and San Miguel and the island municipality of Carlos P. Garcia; the affected coastal waters i.e. 15.0 km municipal waters shall form part of the limited tourism experience consisting of sun, beach, sea (surface and diving), mountain/forest, inland water bodies, and history/culture. Tourism Center 5 – The Culture and Heritage Cluster (Southeast Coast Cluster) May be packaged as the Southeastern Bohol Experience featuring the coastal towns of Mabini, Anda, Guindulman, Jagna, Garcia Hernandez, Valencia, Dimiao and Lila, the inland towns of Sierra Bullones and Candijay; the affected coastal waters i.e. 15.0 km municipal waters shall form part of the limited tourism experience consisting of sun, beach, sea (surface and diving), mountain/forest and history/culture.
Various development strategies are proposed to address the key issues pervading the three (3) levels of the Tourism Cluster Framework, namely: Tourism Assets/ Products; Supplier Industries; and Tourism Cluster Foundations.
1. Develop and Expand Tourism Attractions/Product Bohol’s unique and diverse tourism attractions/products (assets and activities) are not optimized as it is focused only on certain geographical areas/sites. There are potential/existing products and/or activities that still have to be tapped and/or repackaged and to develop new additional niche market ecotourism products.
2. Rationalize, Improve and Expand Supplier Industries Supplier industries cover all types of tourist accommodation. Presently there are not enough of these to meet the current demand and the compliance of these facilities to existing DOT standards leaves much to be desired. Supplier industries also include access (soft infrastructure), specifically transportation i.e. car rentals, car (with driver) rentals, shuttle services, medium to long haul commuter services, tourist bus operations, boat rentals, cruise ships, dive boats, etc.
3. Strengthen Tourism Cluster Foundations The key foundations of a tourism cluster include the people of Bohol representing the human assets or resources; the physical infrastructure (access and ancillary facilities); tourism image promotion; the policy/regulatory framework and sustainable environment.
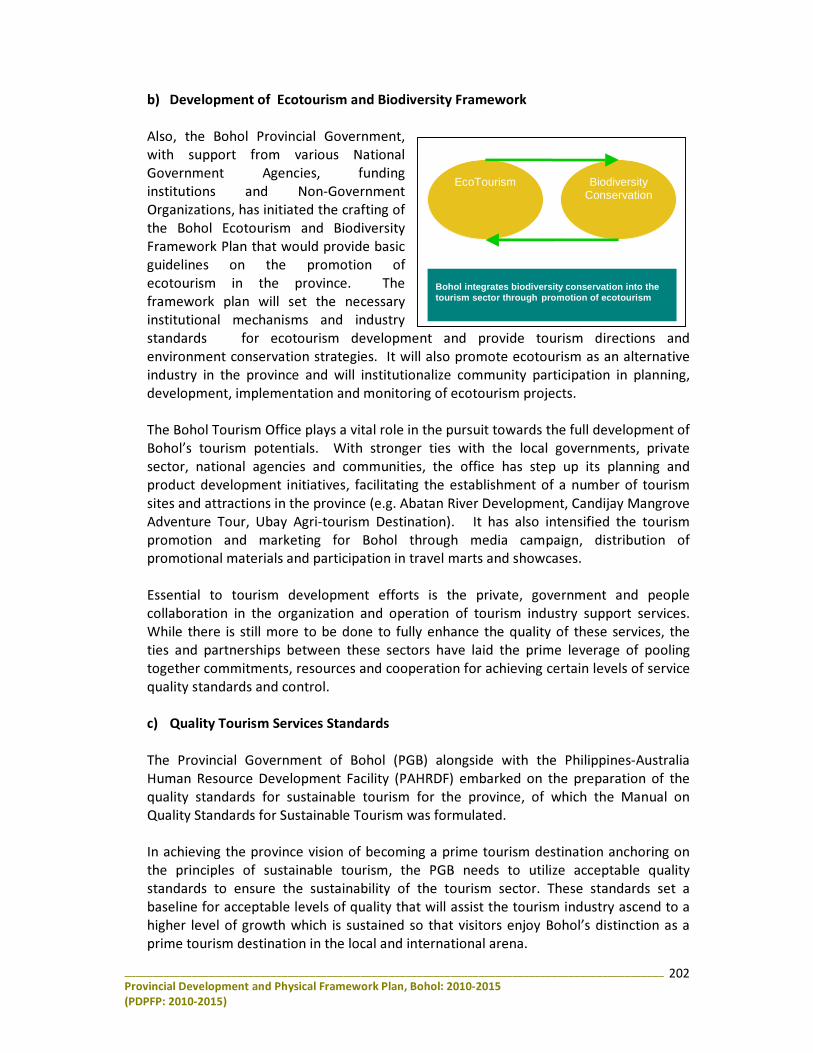
________________________________________________________________________________________________ Provincial Development and Physical Framework Plan, Bohol: 2010-2015 (PDPFP: 2010-2015)
202
EcoTourism Biodiversity Conservation
Bohol integrates biodiversity conservation into the tourism sector through promotion of ecotourism
b) Development of Ecotourism and Biodiversity Framework
Also, the Bohol Provincial Government, with support from various National Government Agencies, funding institutions and Non-Government Organizations, has initiated the crafting of the Bohol Ecotourism and Biodiversity Framework Plan that would provide basic guidelines on the promotion of ecotourism in the province. The framework plan will set the necessary institutional mechanisms and industry standards for ecotourism development and provide tourism directions and environment conservation strategies. It will also promote ecotourism as an alternative industry in the province and will institutionalize community participation in planning, development, implementation and monitoring of ecotourism projects. The Bohol Tourism Office plays a vital role in the pursuit towards the full development of Bohol’s tourism potentials. With stronger ties with the local governments, private sector, national agencies and communities, the office has step up its planning and product development initiatives, facilitating the establishment of a number of tourism sites and attractions in the province (e.g. Abatan River Development, Candijay Mangrove Adventure Tour, Ubay Agri-tourism Destination). It has also intensified the tourism promotion and marketing for Bohol through media campaign, distribution of promotional materials and participation in travel marts and showcases. Essential to tourism development efforts is the private, government and people collaboration in the organization and operation of tourism industry support services. While there is still more to be done to fully enhance the quality of these services, the ties and partnerships between these sectors have laid the prime leverage of pooling together commitments, resources and cooperation for achieving certain levels of service quality standards and control. c) Quality Tourism Services Standards The Provincial Government of Bohol (PGB) alongside with the Philippines-Australia Human Resource Development Facility (PAHRDF) embarked on the preparation of the quality standards for sustainable tourism for the province, of which the Manual on Quality Standards for Sustainable Tourism was formulated. In achieving the province vision of becoming a prime tourism destination anchoring on the principles of sustainable tourism, the PGB needs to utilize acceptable quality standards to ensure the sustainability of the tourism sector. These standards set a baseline for acceptable levels of quality that will assist the tourism industry ascend to a higher level of growth which is sustained so that visitors enjoy Bohol’s distinction as a prime tourism destination in the local and international arena.
________________________________________________________________________________________________ Provincial Development and Physical Framework Plan, Bohol: 2010-2015 (PDPFP: 2010-2015)
203
The rationale behind the setting up of a Manual on Quality Standards for Sustainable Tourism (MQSST) for Bohol Province is to sustain the economic gains resulting from the phenomenal growth of its tourism industry that will foster an increase in visitor arrivals and their continued patronage; and an increase and expansion of investments in the tourism sector. Parallel to this, the sustainability of the natural and cultural resources of the province is given equal importance. Under the rubric of the QSST, the quality in all tourism products and services are engendered to support and stimulate the sustainable growth of Bohol’s tourism industry. Along with the infusion of the QSST, the enactment of Republic Act 9446, declaring Bohol as an Eco-cultural Tourism Zone, and the inclusion of Chocolate Hills among key ecotourism sites in the National Ecotourism Strategy reinforced the province’s efforts on its advocacy on sustainable development. The QSST of the PGB is an accreditation system that lays down basic requisites that form part the set of rules, conditions or requirements governing the standardization of all tourism establishments, tourism-related services and or tourism sites and activities in the province. The accreditation system functions in such a way that a establishment or a service provider submits to an independent review and pass an annual assessment showing that it meets the minimum standard requirements of product quality, safety, and efficient service in order to vie for a seal of distinction as proof of meeting set standards stipulated in the MQSST. With the adoption of the Tourism Code of the province that incorporates the guidelines for Quality Services Standard for Tourism, it sets in place the direction of standard tourism operation in Bohol.
d) Development of Tourism Highway
Accessibility to major tourism destinations has greatly improved with the continuing upgrading and development of roads that link entry points, service and commercial centers in the province. The road network has increased as new roads connecting barangay, municipal, provincial roads and national highways are constructed. This development also supports the clustering of tourism destinations and encourages the establishment of tourism-based facilities in other areas of the province. Tourism highways are expected to be upgraded to cater to the increasing number of road users and tourism-related activity vehicles. e) Panglao Island Tourism Estate
Panglao Island Tourism Estate project is one of the pilot tourism estates established in the Philippines as embodied in the Tourism Master Plan (TMP CY-1991). This tourism project covers a total land area of 2,000 hectares within the barangays of Libaong, Tawala, Bolod, Danao, San Isidro and Biking. The tourism estate alone has an area of 120 hectares located in the southern part of Panglao Island with about 5-6 kilometers of white sand beach. The whole tourism estate calls for the construction of integrated resort development and cluster-type residential villas which can accommodate around 7,000 tourists at a
________________________________________________________________________________________________ Provincial Development and Physical Framework Plan, Bohol: 2010-2015 (PDPFP: 2010-2015)
204
time, retirement village, marina, sports and leisure facilities, restaurants and other tourism support facilities. Rural buffer (nature tourism zone), urban service area, agricultural, conservation and reforestation areas are also to be developed. The development of an international standard domestic airport to service large aircraft operations is a major component of the project. Similarly, other tourism zones are identified in the province, among them the Anda Peninsula, the Ubay Agri-park and the Abatan River Development areas. f) Anda Peninsula Tourism Development
The Municipality of Anda has been envisioned by the provincial leadership in consultation with development key players as an alternative tourism destination in the Province of Bohol. In contrast to Panglao Island which has now become the principal tourist destination in Bohol and gradually in the makings of a haven for mass tourism, Anda has remained unscathed in terms of its natural ecological and cultural assets. These unaltered states on its eco-cultural assets underpin Anda’s potential as an eco-cultural tourism destination. Anda is considered as an eco-cultural and heritage tourism site in the eastern peninsula. One can find there apart from the beautiful white beaches, the hanging coffins, relics of old Bohol, cave writings that dates back to antiquity. President Gloria Macapagal-Arroyo and the Department of Tourism have considered Bohol as a stand alone tourism destination in the global roadmap which necessitated the construction of the Panglao Is. Bohol International Airport (PBIA). The province, by reason of its eco-cultural heritage endowments and agri-tourism potentials which includes the Anda Peninsula, has been projected as a major player in the development of the Central Philippines Super Region tourism industry. Side by side with the airport construction will be undertaken the road and causeway improvement projects to avoid traffic gridlock once the airport will be operational. It will be followed by the establishment of drainage and sewerage system, water and power development. It is even expected to trigger the early implementation of the Bohol Circumferential Road Improvement Project Phase 3 (BCRIP 3) which work covers the Panglao-Tagbilaran-Baclayon road links as Package 1 and the Anda Peninsula highways (Guindulman-Anda-Cogtong-Candijay-Mabini-Ubay) as Package 2. Although Anda will be the next tourism destination to be developed, dubbed as the Anda Peninsula Tourism Development Project as proposed by the Provincial leadership, the Australian Agency for International Development (AusAID) through the Philippines-Australia Community Assistance Program (PACAP) with counterpart funding from the National Economic Development Authority (NEDA) have been initiating projects supporting poor communities in the form of tourism projects in Bohol, Anda in particular. These projects include:
________________________________________________________________________________________________ Provincial Development and Physical Framework Plan, Bohol: 2010-2015 (PDPFP: 2010-2015)
205
1. The Lamanok Island Mystic Experience Tour (The adventure tour entails the construction of an interpretive center, boardwalk and site development in the island)
2. Food Processing for Polvoron, Tabliya and Butter (Products developed in support to the tourism enterprise) 3. Mongo Crop Production (Products developed in support to the tourism enterprise)
g) Bohol Tourism Enterprise Through Cooperatives The cooperative sector of the province is having a cooperative tourism enterprise program. It is the sector’s way of mainstreaming with the booming tourism industry in the province. Among the ways on how it will operate is for Bohol coops to invite other coops outside of the province to conduct benchmarking activities, Lakbay Aral/ educational tours in Bohol through identified circuits highlighting community-based enterprises of recognized multi-purpose cooperatives. h) Panglao Airport Development
In anticipation of a significant growth in passenger and cargo traffic brought by the province’s tourism and agri-based industries, Bohol is venturing for the construction of an airport in Panglao Island that provides international standard facilities and services. With its expected completion in 2010, the airport will boost further the tourism sector of Bohol, strengthening its position in the local and global tourism market. This will also become the centerpiece of the Panglao Island Tourism Estate (PITE) that would catalyze all further socio-economic developments of Bohol.
i) Other Infrastructure Development to Support Tourism and Economic Development
A number of large infrastructure projects are proposed for implementation in Bohol to support its local requirements and economic growth. Clear on its vision, the province wants to install the appropriate facilities necessary for its growing population as well as proactively provide the economy with the right support infrastructure ideal for business ventures. With the end view of expanding its infrastructure capacities and market reach on tourism, agriculture and light industries, the province is pursuing the following:
1) Improvement of sea ports in strategic locations to support tourism and commerce; development of the Bohol Inter-municipal Water Supply System, utilizing surface water as the source of water for domestic, tourism and industry use.
2) Construction of the Bohol-Cebu Friendship Bridge, linking the two provinces and providing a platform for the development of land-based transport systems, power transmission, water distribution and fiber optic communication system.
3) Establishment of the Panglao Island Sewerage and Drainage System, to cater to the growing tourism industry in the island, in support to proper waste management and environmental protection. Other high density areas/tourism zones in the province will also establish this system.
4) Implementation of the Bohol Backbone Transmission Project, to improve the system integrity and reliability of power transmission lines to accommodate
________________________________________________________________________________________________ Provincial Development and Physical Framework Plan, Bohol: 2010-2015 (PDPFP: 2010-2015)
206
growing power demand in the province. This will, improve operational flexibility and extend power service areas in Bohol.
DEVELOPMENT CHALLENGES The economic activities that the tourism industry brings in the province generated significant benefits to the Boholanos, in form of employment to workers and profits for investors and facility owners. However, growth of tourism industry in Bohol has some constraints that hamper its full development. Foremost, there is limited investment to high-end tourist infrastructures and facilities. This explicates the shortage of rooms during tourism peak seasons and on large conventions and gatherings held in the province. There is also a need for continued investments for access facilities like roads, airport, and seaports that could improve travel efficiencies and capacities. The quality of tourism services and facilities needs to be continually enhanced to focus more on tourist satisfaction and welfare, rather than on economic returns only. With this, it is imperative to control and impose commonly-acceptable standards to regulate the quality of tourism sites, products and services, which will eventually enhance visitor experience and promote tourism patronage for Bohol. To ensure proper disposal and management of waste brought by increasing tourism activities, it is necessary for the province to develop or improve sewerage and solid waste systems in key tourism centers and zones. There are also insufficiencies in the development and promotion of new tourist products to visitors, which, if addressed, could enhance the array of tourism sites and boost the industry in the province. Equally significant is to seriously consider the environmental effects of tourism, with the call for strictly enforcing the laws and regulations to protect and preserve the natural resources of the province. All these mentioned issues and their general strategies are necessary aspects to look at and deal with to strengthen and sustain the foundation which puts Bohol at the limelight of the country’s tourism map. It is, however, important to note that all of these are ultimately geared towards improving the lives of the Boholanos, ensuring that economic benefits brought by tourism should trickle down, in equitable manner, to the poor.
� Inadequacy / inefficiency of tourism services and support facilities
• Inadequate and inefficient provision of tourism services. • Not enough accommodations to sustain tourism development. • Inaccessibility of tourism destinations due to poor road networks especially in
interior towns. • Insufficient water supply in tourist areas. • Lack of attractive investment package to lure business investors. • Land availability (i.e. clean land titles) that could spur interests on prospective
investors particularly in Panglao Island.
� Improper policy/ regulatory framework implementation • Laxity on the strict imposition of existing regulations regarding solid waste
management and non-compliance of the zoning ordinance. • Lack of information dissemination at the grassroots level in support to
economic development through sustainable tourism and environmental protection.

________________________________________________________________________________________________ Provincial Development and Physical Framework Plan, Bohol: 2010-2015 (PDPFP: 2010-2015)
207
• No proper policing on marine life extractions and poaching intended for souvenir collections of tourists.
DEVELOPMENT PLAN FRAMEWORK
Sub-Sector Vision
A sustainable and competitive tourism industry that provides world class tourism facilities and services.
Sub-Sector Goals
• Quality standards in tourism services and facilities. • Increased economic growth. • Accessibility to all facilities within the province. • Sufficient water supply, especially in tourist areas • Proper solid waste management system. • Compliance on the 20-meter salvage zone and zoning ordinance. • A community of active guardians to our wildlife and habitats.
Sub-Sector Objectives and Targets • To professionalize and standardize tourism services and facilities for global
competitiveness in the province within 5 years. • To increase income generating support to our community. • To prioritize concreting of road networks based on growing traffic to and from
the locality. • To improve supply of water especially in tourist areas. • To implement solid waste management regulations in the locality. • To enforce adherence to the 20-meter salvage zone regulation and compliance
of zoning laws for better utilization and preservation of resources. • To create and sustain an open communication line and a consultative
relationship between LGUs and NGOs/ POs. • To educate ordinary folks about tourism and its effects. • To help preserve and protect our wildlife and habitats.
Sub-Sector Strategies
a) Develop and Expand Tourism Attractions/ Product • Encourage developments in tourism sites that have good linkages to
Tagbilaran City. • Develop further tourism sites that are unique to the Southern Bohol
Seaboard to decongest Panglao Island. • Develop tourism sites that are close to tourism developments in Cebu. • Develop/ enhance the emerging agri-tourism industry of Bohol. • Support the tourism industry by sustainably developing tourism economic
zones (Panglao Island Tourism Estate, Anda Peninsula, Agri-Tourism Park, Abatan River Development).
________________________________________________________________________________________________ Provincial Development and Physical Framework Plan, Bohol: 2010-2015 (PDPFP: 2010-2015)
208
b) Rationalize, Improve and Expand Supplier Industries • Provide/ Rationalize additional accommodations. • Institutionalize home stay program and other services. • Improve internal linkages. • Standardization Program of tourism facilities and services. • Offer tax exemption, assistance and other benefits even to small investors.
c) Strengthen Tourism Cluster Foundations
• Develop entrepreneurs or business-oriented persons who will generate job opportunities.
• General improvement of physical infrastructure. • Promotion of tourism image. • Consolidate private sector investment programs. • Foster sustainable development. • Capability programs for industry players and stakeholders. • Expedite the facilitation of providing water supply in tourist areas • Educate locals about solid waste management and its relation to the
environment and tourism. • Salvage zones identified and marked, serving as constant warning and
invoking awareness. • Strict compliance of the 20-meter salvage zone. • Establishment and strengthening of Municipal Tourism Councils with active
involvement of NGOs, private sectors and other stakeholders.
Priority Programs and Projects A. New Tourism Attraction/ Product
1. Development of Rajah Sikatuna Protected Landscape (RSPL) as eco-tour destination
2. Development of marine-based ecotour circuits in the northern coast of Bohol (Calape, Tubigon, Getafe, Inabanga)
3. Integrated community-based eco-tourism development project (waterfalls, cave and river hopping adventure in Antequera)
4. Coastal road tour project 5. Bohol agri-tourism project (Ubay and dam sites) 6. Development of Badiang Spring Falls in Valencia as an eco-resort 7. Binaliw falls development project in Clarin 8. Development/ promotion of Abatan River Tour 9. Anda Peninsula Tourism Development
B. Supplier Industries
B.1 Accommodations and Support Facilities Development 1. Budget hotel-resort facility/ Coastal Accommodation (Anda, Dimiao, Jagna,
Loon, Calape, Talibon, Ubay) 2. Hotel-resort facility (international standard) in Panglao and Dauis
________________________________________________________________________________________________ Provincial Development and Physical Framework Plan, Bohol: 2010-2015 (PDPFP: 2010-2015)
209
3. Budget hotel/ Inland Accommodation (Loboc, Sagbayan, Danao, Bilar, Carmen)
4. Mountain hotel and resort complex (Tubigon) 5. Tourism Sub-service Center (Carmen, Talibon)
B.2 Access: Soft Infrastructure
1. Multi-faceted tourist shuttle services 2. Route-based tourism-oriented public transport modes 3. Training and accreditation system of drivers for tourist transport services 4. Bohol tourist-stop-shop and information facilities
B.3 Utilities Development 1. Alternative-source electrification project 2. Integrated water resource development project 3. Waste management project 4. Fiber optic system development
C. Tourism Cluster Foundations C.1 Entrepreneurship Development through Ecotourism
1. Integrated Entrepreneurship development program for Bohol ecotourism projects
2. Tourism Enterprises through Cooperatives
C.2 Accessibility and Facility Development Program 1. Panglao airport development project 2. Bohol seaports development project 3. Bohol tourist cruise in Bohol Strait, Maribojoc Bay and Abatan River 4. Road improvements for the Bohol tourism development project (provincial
roads that traverse the municipalities of Clarin, Sagbayan, Carmen, Sierra Bullones, Jagna, Getafe, Buenavista, Danao, Alicia, Pilar, Guindulman, Anda, Candijay, Tubigon, San Isidro, Balilihan, Sikatuna, Baclayon, Sagbayan and Cortes)
C.3 Sustainable Development Program
1. Provincial Accreditation Program for Quality Standards for Sustainable Tourism (QSST)
2. Monitoring program for sustainable tourism 3. Restoration of selected priority heritage structures 4. Restoration/rehabilitation of selected priority heritage objects (like indoor
museum things), structures and sites 5. Fabrication and installation of markers and signages for all heritage sites in
the province. 6. Bohol engineering landfills 7. Panglao Island sewerage master plan
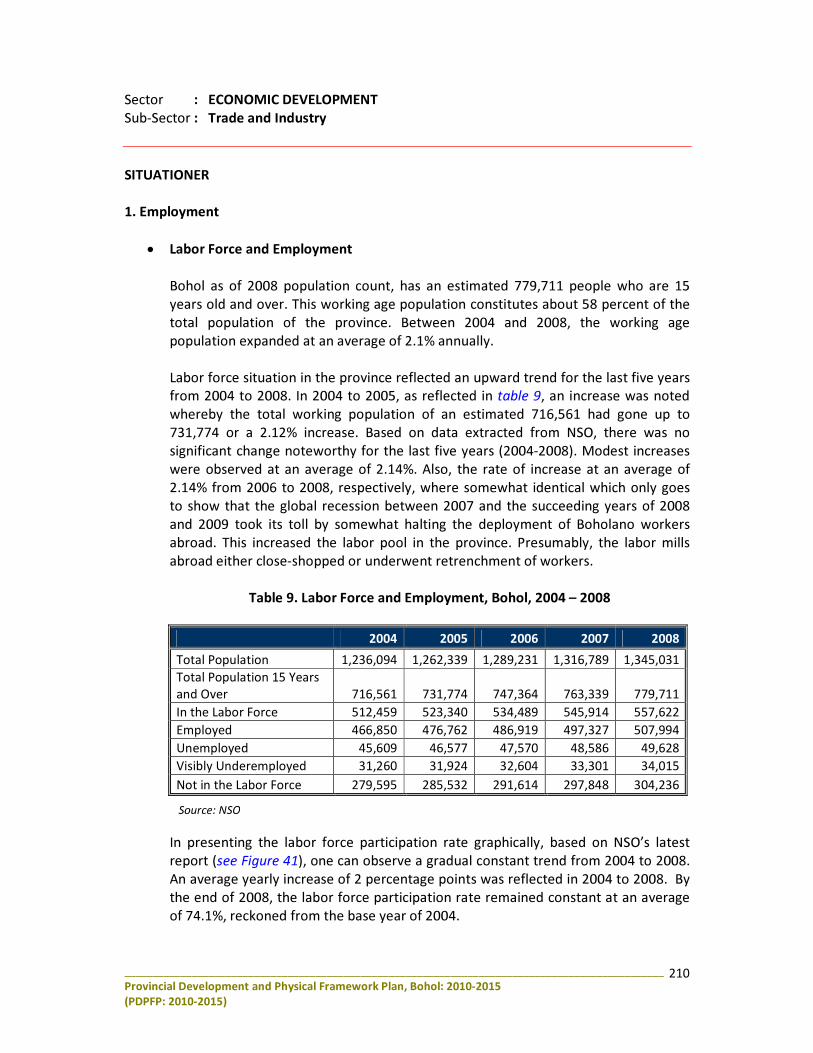
________________________________________________________________________________________________ Provincial Development and Physical Framework Plan, Bohol: 2010-2015 (PDPFP: 2010-2015)
210
Sector : ECONOMIC DEVELOPMENT Sub-Sector : Trade and Industry SITUATIONER 1. Employment
• Labor Force and Employment
Bohol as of 2008 population count, has an estimated 779,711 people who are 15 years old and over. This working age population constitutes about 58 percent of the total population of the province. Between 2004 and 2008, the working age population expanded at an average of 2.1% annually.
Labor force situation in the province reflected an upward trend for the last five years from 2004 to 2008. In 2004 to 2005, as reflected in table 9, an increase was noted whereby the total working population of an estimated 716,561 had gone up to 731,774 or a 2.12% increase. Based on data extracted from NSO, there was no significant change noteworthy for the last five years (2004-2008). Modest increases were observed at an average of 2.14%. Also, the rate of increase at an average of 2.14% from 2006 to 2008, respectively, where somewhat identical which only goes to show that the global recession between 2007 and the succeeding years of 2008 and 2009 took its toll by somewhat halting the deployment of Boholano workers abroad. This increased the labor pool in the province. Presumably, the labor mills abroad either close-shopped or underwent retrenchment of workers.
Table 9. Labor Force and Employment, Bohol, 2004 – 2008
2004 2005 2006 2007 2008 Total Population 1,236,094 1,262,339 1,289,231 1,316,789 1,345,031 Total Population 15 Years and Over 716,561 731,774 747,364 763,339 779,711 In the Labor Force 512,459 523,340 534,489 545,914 557,622 Employed 466,850 476,762 486,919 497,327 507,994 Unemployed 45,609 46,577 47,570 48,586 49,628 Visibly Underemployed 31,260 31,924 32,604 33,301 34,015 Not in the Labor Force 279,595 285,532 291,614 297,848 304,236
In presenting the labor force participation rate graphically, based on NSO’s latest report (see Figure 41), one can observe a gradual constant trend from 2004 to 2008. An average yearly increase of 2 percentage points was reflected in 2004 to 2008. By the end of 2008, the labor force participation rate remained constant at an average of 74.1%, reckoned from the base year of 2004.
Source: NSO
________________________________________________________________________________________________ Provincial Development and Physical Framework Plan, Bohol: 2010-2015 (PDPFP: 2010-2015)
211
• Employment and Unemployment
From 2004 to 2008, the employment rate of Bohol averaged 91.1 percent, while the unemployment rate averaged at 8.89 percent. The unemployment rate of the province had been slightly increasing from 2004 to 2008, to an average of 2.13%. The increases in the figures of unemployment could possibly be the result of the events that lead to the recent global recession in 2007, consequently stacking the labor force comprising several overseas foreign workers, industrial workers (local and foreign) who are either terminated or retrenched from their jobs and the already existing unemployed persons. Underemployment rate for the province is at 6.1 percent in 2008, with an average increase of 2.13% from 2004 to 2008.
The number of employed persons in recent statistics is 507,994 based on a 91.1% employment rate posting in year 2008, the unemployment rate at 8.89%, translates to an estimated 49,628 unemployed persons and the underemployment rate at 6.1 percent
corresponds into an estimated 34,015 underemployed persons (Figure 42). This relatively high figure of unemployment in the province compared to previous years from 1998 up to present only implies that additional job opportunities are necessary to accommodate labor force increase in Bohol, to minimize, if not eliminate the unemployment problem in the province. The number of jobless persons has increased primarily due to the rise in the number of working-age population in Bohol rather than due to closure of business establishments. The lack of big businesses to
Figure 42. Employed and Unemployed Persons in the Labor Force, Bohol, 2004-2008 Labor Force, Province of Bohol, 2004-2008
466,850
45,609
476,762
46,577
486,919
47,570
497,327
48,586
507,994
49,628
420,000
440,000
460,000
480,000
500,000
520,000
540,000
560,000
2004 2005 2006 2007 2008
Employed UnemployedSource: NSO
Source: NSO
0200,000400,000600,000800,000
1,000,0001,200,0001,400,000
Num
ber
2004 2005 2006 2007 2008
Year
Total Population Total Population 15 Years and Over In the Labor Force
Figure 41. Total Pop., 15 Years and Over and in the Labor Force, Bohol, 2004-2008
________________________________________________________________________________________________ Provincial Development and Physical Framework Plan, Bohol: 2010-2015 (PDPFP: 2010-2015)
212
absorb existing labor force in the province is also a factor that needs to be considered if the province has to reduce its unemployment rate. Conversely, an increase in annual population growth will automatically mean an increase in the working age population for the province (15 years old and over) who are either employed or unemployed. Based on projections for working age population, the year 2009 indicates a figure of 796,561 or a 2% increase from 779,711 in 2008 and is projected to further increase to 888,124 at the end of the planning period. Likewise, projected increases in the province’s total population and its total working age population will have proportionate natural increases in the labor force. In 2008, an estimated 49,628 were unemployed and this figure is relatively high compared to previous years. The number of unemployed and underemployed will reach 56,523 and 38,741, respectively in 2014 as projected. These increases would surely affect the economic situation of the province if left unheeded.
• Employment by Sector
The agriculture sector continues to account for a greater portion of provincial employment (See Figure 43). On the average, the agriculture sector provides employment to 42 percent of the total employed persons in the province. Following this is the 36 percent share represented by the services sector and the industry sector at 22 percent. Majority of these workers were categorized as “own account” or self-employed workers in the labor force. The “wage and salary workers” and the unpaid family workers followed.
2. Economy and Priority Industries
The economy of Bohol is largely agri-based with agricultural activities focused on the cultivation of food crops. While the economy of Bohol is predominantly an agricultural province, home-based industries, which are mostly of the micro and cottage types, play a vital role in the economy. Tourism is another industry, which is increasingly gaining influence on the province’s economy. The province of Bohol is a growing favorite destination not only of domestic but also of foreign tourists.
Figure 43. Employment by Type of Industry, 2003
Agriculture42%
Industry22%
Services36%
Source : NSO
________________________________________________________________________________________________ Provincial Development and Physical Framework Plan, Bohol: 2010-2015 (PDPFP: 2010-2015)
213
Table 10. Data Matrix Table: Employed Persons by Type of Industry from Primary Occupation, 2003
31 31 11 11 3 3 16 16 SiquijorSiquijor403 403 163 163 35 35 206 206 Negros OrientalNegros Oriental
1,211 1,211 601 601 322 322 288 288 CebuCebu395 395 141 141 89 89 165 165 BoholBohol
2,041 2,041 916 916 449 449 675 675 Region VII Region VII
30,418 30,418 14,404 14,404 4,859 4,859 11,155 11,155 PhilippinesPhilippines
ServicesServicesIndustryIndustryAgricultureAgricultureTOTALTOTALEmployment by Industry (in 000s)Employment by Industry (in 000s)
Table 11. Joint Probability Table: Shares of Employed Persons by Type of Industry from Primary Occupation, 2003
Source : NSOSource : NSO
1.52%1.52%0.54%0.54%0.15%0.15%0.78%0.78%SiquijorSiquijor19.75%19.75%7.99%7.99%1.71%1.71%10.09%10.09%Negros OrientalNegros Oriental59.33%59.33%29.45%29.45%15.78%15.78%14.11%14.11%CebuCebu
19.35%19.35%6.91%6.91%4.36%4.36%8.08%8.08%BoholBohol100.00%100.00%44.88%44.88%22.00%22.00%33.07%33.07%Region VII Region VII
100.00%100.00%47.35%47.35%15.97%15.97%36.67%36.67%PhilippinesPhilippines
ServicesServicesIndustryIndustryAgricultureAgricultureTOTALTOTALType of IndustryType of Industry
Table 12. Concentration: Employed Persons by Type of Industry From Primary Occupation, 2003
1.52%1.52%1.20%1.20%0.67%0.67%2.37%2.37%SiquijorSiquijor19.75%19.75%17.79%17.79%7.80%7.80%30.52%30.52%Negros OrientalNegros Oriental59.33%59.33%65.61%65.61%71.71%71.71%42.67%42.67%CebuCebu19.35%19.35%15.39%15.39%19.82%19.82%24.44%24.44%BoholBohol100.00%100.00%100.00%100.00%100.00%100.00%100.00%100.00%Region VII Region VII
ServicesServicesIndustryIndustryAgricultureAgricultureTOTALTOTALType of IndustryType of Industry
In the regional context, Bohol’s dependence on agriculture even in terms of employment is still vey evident, although the services sector is catching up fast (Table 10). Bohol accounts for only 1/5 of the region’s total employed persons. Agricultural employment in Bohol accounts for 8% of the total employed persons in the region. Bohol contributes 19% of the region’s total employed as shown in table 11, persons with the highest concentration in agriculture at 24% as reflected in table 12.
________________________________________________________________________________________________ Provincial Development and Physical Framework Plan, Bohol: 2010-2015 (PDPFP: 2010-2015)
214
The province’s labor force in terms of type of industry is dominated by agriculture at 42%, with services a close 2nd at 36% (refer to table 13 and figure 44).
Table 14 generally corresponds to the table and figures shown earlier above, with Bohol’s employment/ income at 15% of the regional total.
As a percentage of source of family income in relation to regional totals, Agriculture in Bohol accounts for only 3.73%, as opposed to Services which contribute 5.38% and Undefined Sources which contribute 4.88%. Similar patterns hold true to the other provinces in Region 7. See table 15 below
100.00%100.00%35.48%35.48%9.68%9.68%51.61%51.61%SiquijorSiquijor100.00%100.00%40.45%40.45%8.68%8.68%51.12%51.12%Negros OrientalNegros Oriental100.00%100.00%49.63%49.63%26.59%26.59%23.78%23.78%CebuCebu100.00%100.00%35.70%35.70%22.53%22.53%41.77%41.77%BoholBohol100.00%100.00%44.88%44.88%22.00%22.00%33.07%33.07%Region VII Region VII
ServicesServicesIndustryIndustryAgricultureAgricultureTOTALTOTALType of IndustryType of Industry
Table 13. Specialization: Employed Persons by Type of Industry From Primary Occupation, 2003
Source: NSO
Figure 44. Bohol Shares of Employed Persons by Type of Industry, 2003
41.77%
22.53%
35.70%
0.00%
10.00%
20.00%
30.00%
40.00%
50.00%
Sh
are
of
To
tal
Em
plo
yed
Per
son
s
Agriculture Industry Services
Business/Industry
Table 14. Shares of Total Family Income by Household Head Kind of Business/Industry, 2000
Source: FIES
1.25%0.05%0.08%0.27%0.02%0.01%0.01%0.00%.035%Siq uijor
18.29 %0.88%1.39%3.00%0.61%0.31%0.02%0.02%6.25%Negros Or.
65.65 %5.88%10.87%8.90%2.71%6.89%0.16%0.16%7.13%Cebu14.81%0.98%0.98%3.4 2%0.17%0.66%0.00%0.00%3.7 3%Boh ol100.0 0%7.80%13.32%15.60%3.51%7.88%0.18%0.18%17.46%REGION 7
TOTALNot Defin ed
Tran spo/Co mm.
Wholesale/Retail
ServicesConstruc-tion
Manufac-turing
Mining/Quarrying
Agri-fishery
Province
Table 15. Percentage of Source of Family Income in Relation to Regional Totals, 2000
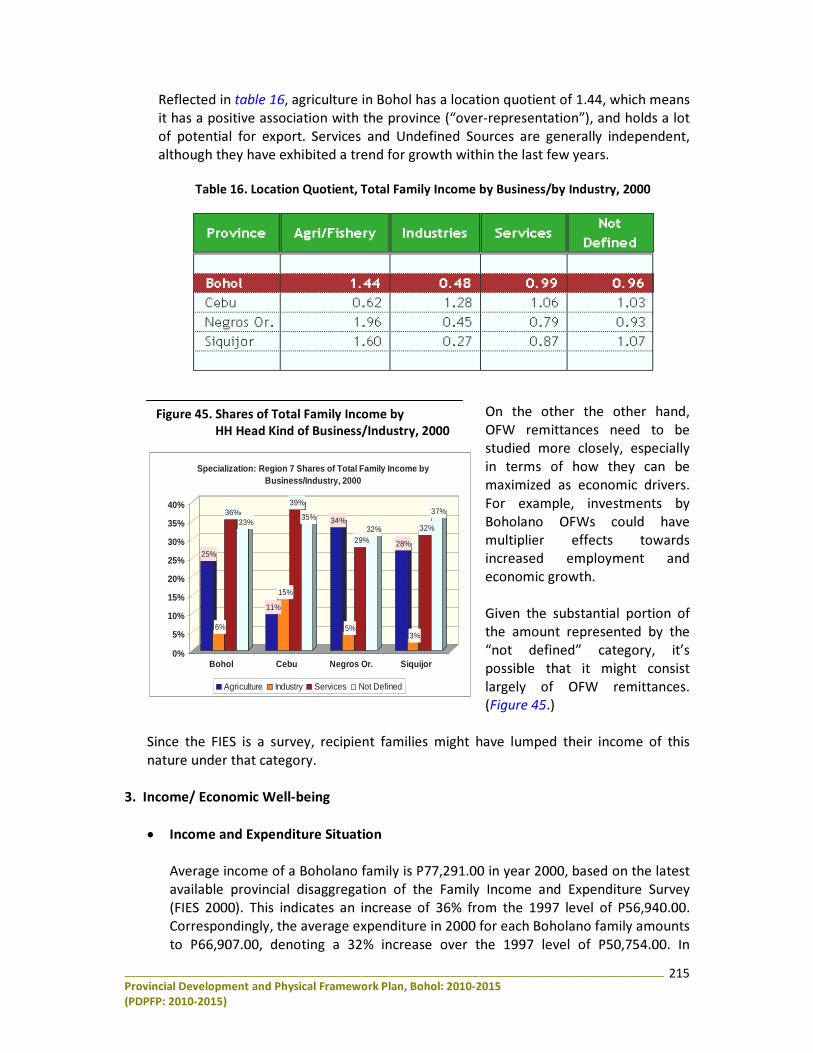
________________________________________________________________________________________________ Provincial Development and Physical Framework Plan, Bohol: 2010-2015 (PDPFP: 2010-2015)
215
Reflected in table 16, agriculture in Bohol has a location quotient of 1.44, which means it has a positive association with the province (“over-representation”), and holds a lot of potential for export. Services and Undefined Sources are generally independent, although they have exhibited a trend for growth within the last few years.
On the other the other hand, OFW remittances need to be studied more closely, especially in terms of how they can be maximized as economic drivers. For example, investments by Boholano OFWs could have multiplier effects towards increased employment and economic growth. Given the substantial portion of the amount represented by the “not defined” category, it’s possible that it might consist largely of OFW remittances. (Figure 45.)
Since the FIES is a survey, recipient families might have lumped their income of this nature under that category.
3. Income/ Economic Well-being
• Income and Expenditure Situation Average income of a Boholano family is P77,291.00 in year 2000, based on the latest available provincial disaggregation of the Family Income and Expenditure Survey (FIES 2000). This indicates an increase of 36% from the 1997 level of P56,940.00. Correspondingly, the average expenditure in 2000 for each Boholano family amounts to P66,907.00, denoting a 32% increase over the 1997 level of P50,754.00. In
25%
6%
36%33%
11%
15%
39%
35% 34%
5%
29%32%
28%
3%
32%
37%
0%
5%
10%
15%
20%
25%
30%
35%
40%
Bohol Cebu Negros Or. Siquijor
Specialization: Region 7 Shares of Total Family Income by Business/Industry, 2000
Agriculture Industry Services Not Defined
Figure 45. Shares of Total Family Income by HH Head Kind of Business/Industry, 2000
Table 16. Location Quotient, Total Family Income by Business/by Industry, 2000
________________________________________________________________________________________________ Provincial Development and Physical Framework Plan, Bohol: 2010-2015 (PDPFP: 2010-2015)
216
contrast, the average income of a Boholano family compared to the average annual expenditures in that same year is almost nearly equal with the average family income higher by 15% compared to the average family spending. This would mean that if this trend will continue, time would come when families are inclined to spend below their means. In hindsight of the existing situation, the fall of the peso is evident, that could mean more peso is needed to buy a certain commodity. Inflation is high which would lay a burden to the Boholano people.
• Prices Indicators There was a gradual decrease in the purchasing power of the peso from 0.73 in 2005 to 0.68 in 2007, an average of .03-centavo decrease was noted. The province inflation rate exhibited a downtrend during the last 3 years. This was after it hit double digit in 2000, following the Asian financial crisis. Since then, Bohol’s inflation rate remained at single digit hovering at about 7.2 percent during the last 3 years, higher than the national inflation rate of 6.4 percent.
• Poverty Indicators
Poverty reduction remains the main development thrust of the Provincial Government. Although, the poverty reduction and development initiatives in the province have paid off as the poverty incidence3 in terms of families improved from 50.2 % in 2000 to 29.2% in 2003 (Table 17). However, the poverty incidence went up to 38.8% in 2006. The poverty incidence in terms of population went up to 46.9% in 2006 from 34.9% in 2003 and 56.6% in 2000, as reported by the National Statistical Coordinating Board (NSCB) 2.
Table 17. Poverty Indicators, Bohol, 2000 – 2006
Poverty Indicators 2000 2003 2006
Annual Per Capita Poverty Threshold (in Pesos) 9,762 10,032 13,610
Poverty Incidence Among Families (%), Estimates 50.2 29.2 38.8 Poverty Incidence Among the Population (%), Estimates 56.7 34.9 46.9 Magnitude of Poor Families4 105,470 65,953 92,354
3 Poverty incidence refers to the proportion of families/individuals with per capita income/expenditure less
than the per capita poverty threshold to the total number of families/individuals 2 Poverty statistics used in this report are taken from the latest releases by the National Statistical
Coordination Board (NSCB), the official government agency for poverty statistics 4 Magnitude of the Poor - refers to the number of families or the population whose annual per capita income
falls below the subsistence/poverty threshold
________________________________________________________________________________________________ Provincial Development and Physical Framework Plan, Bohol: 2010-2015 (PDPFP: 2010-2015)
217
Poverty Indicators 2000 2003 2006 Income Gap5 34.7 27.5 32.5 Poverty Gap6 17.4 8 12.6 Severity of Poverty7 7.5 3 5.5 Source: National Statistical Coordination Board (NSCB)
The number of poor families in Bohol has increased by 26 thousand families between 2003-2006, as reported by NSCB. However, poverty incidence among families in 2006 was lower than in year 2000 in Bohol. Out of 100 Boholanos, 47 were considered poor in 2006 compared to 35 Boholanos in 2003.
A Filipino family of five needed PhP 6,274 monthly income in 2006 in order not to be classified as poor while a Boholano family of five needed to earn at least PhP 5,671 monthly in 2006, an increase of more than 36% from 2003, to stay out of poverty. But in 2007, this family will need to earn more than PhP5,460 a month to meet its basic needs, 74% of this amount will be for their food requirements (Table 18). In 2006, a family comprising of five members in Bohol needed a monthly income of PhP4,084 to be able to sustain their family’s minimum basic food needs, an increase of 32% from 2003. Income shortfall of the poor and severity of poverty in Bohol increased between 2003 and 2006. Looking at the urban-rural disparity, families residing in urban areas in Bohol needed to earn 10 percent more than the families living in rural areas.
Table 18. Poverty Threshold and Food Threshold, Bohol, 2000 – 2007
Poverty Threshold Food Threshold Year Monthly Daily Monthly Daily 2007 5,460.00 182.00 4,040.42 134.68 2003 4,174.17 137.23 3,867.08 127.14 2000 4,052.50 133.23 2,810.83 92.41
Source: National Statistical Coordination Board (NSCB)
5 Income Gap (I) – refers to the average income shortfall (expressed in proportion to the poverty line) of
families with income below the poverty threshold 6 Poverty Gap (PG) – is the total income shortfall (expressed in proportion to the poverty line) of families with
income below the poverty threshold, divided by the total number of families 7 Severity of Poverty (SP) – is the total of the squared income shortfall (expressed in proportion to the poverty
line) of families with income below the poverty threshold, divided by the total number of families. This is equal to the Foster-Greer-Thorbecke (FGT) family of measures with a= 2. It is a poverty measure which is sensitive to the income distribution among the poor – the worse this distribution is, the more severe poverty is.
________________________________________________________________________________________________ Provincial Development and Physical Framework Plan, Bohol: 2010-2015 (PDPFP: 2010-2015)
218
Figure 44. Capitalization of New Businesses, 2005-2008
• Over-all Human Development
In the latest Human Development Report8, Bohol ranked 41st among 77 provinces in terms of human development, placing it in the upper half per inter-provincial comparison with middle human development.9 Over the years, the province’s HDI10 has been steadily improving from 0.531 in 1994 to 0.544 in 2003. Across countries, Bohol’s HDI is slightly lower than that of Indonesia, but higher than those of Mongolia, Honduras and South Africa. Statistics shown in table 19 indicate that, in 2003, the women of Bohol are better off than the men in terms of life expectancy and education variables, but worse off in terms of estimated earned income.
Table 19. Human Development Indicators by Sex, Bohol
Human Development Indicators Male Female Provincewide
Life Expectancy at Birth, 2003 67.4 72.6 70.0 % High School Graduates (18 & Above), 2003 35.8 37.1 36.5 Primary & High School Enrolment Rate (%), 2002 85.5 100.1 89.9 Estimated Annual Earned Income (PPP US$), 2003 2,194.00 1,116.00 1,581.00 Source: Philippine Human Development Report 2005, UNDP
4. Trade and Industry • Investments
Data culled from the local Department of Trade and Industry show that new investments resulting from Business Name Registrations grew by 108.4% in 2008, a hefty P2.147 billion, surpassing the 2007 figure of P1.03 billion. This increase is primarily attributed to the department’s mobile business name registration campaign province wide, which started in 2008 (Figure 46).
8 Philippine Human Development Report: 2005, United Nations Development Programme (UNDP) 9 based on three basic human dimensions, namely, 1) longevity (Life Expectancy), 2) knowledge (Educational Attainment) and 3) decent standard of living (Per Capita Income) 10 HDI – Human Development Index; measures average achievement in human development in the 3 basic human dimensions
Figure 46.Capitalization of New Businesses,Bohol, 2005-2008
Source: DTI
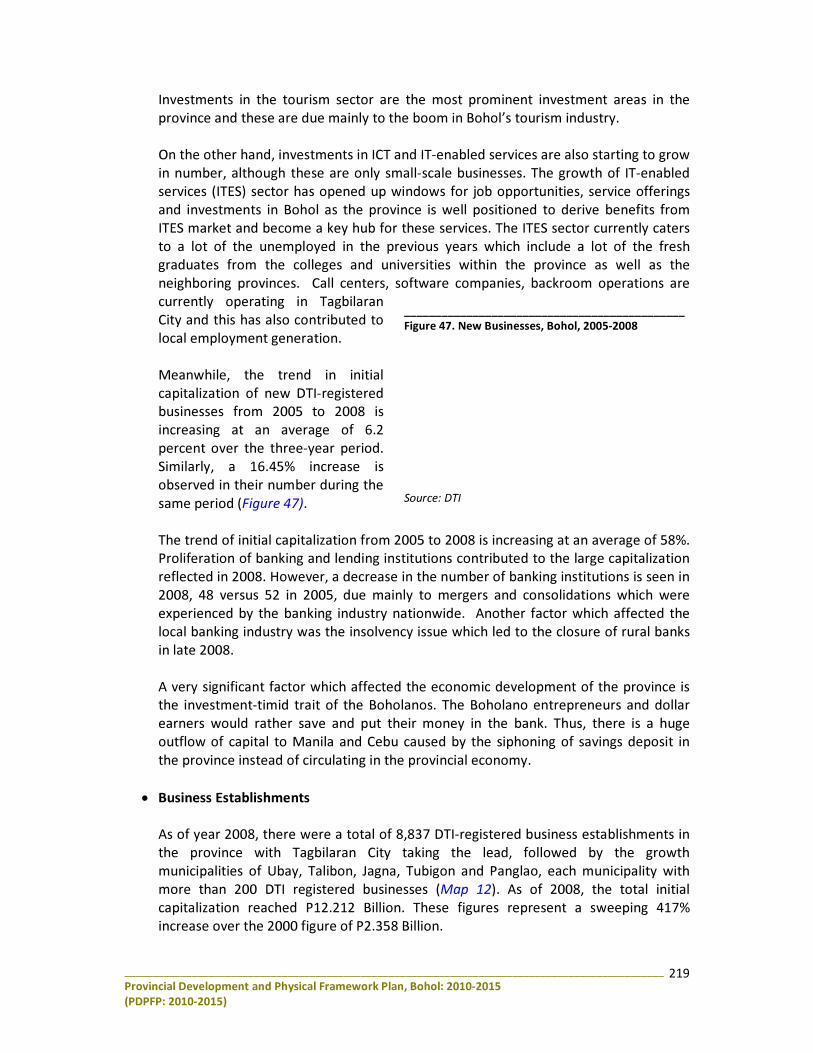
________________________________________________________________________________________________ Provincial Development and Physical Framework Plan, Bohol: 2010-2015 (PDPFP: 2010-2015)
219
Investments in the tourism sector are the most prominent investment areas in the province and these are due mainly to the boom in Bohol’s tourism industry. On the other hand, investments in ICT and IT-enabled services are also starting to grow in number, although these are only small-scale businesses. The growth of IT-enabled services (ITES) sector has opened up windows for job opportunities, service offerings and investments in Bohol as the province is well positioned to derive benefits from ITES market and become a key hub for these services. The ITES sector currently caters to a lot of the unemployed in the previous years which include a lot of the fresh graduates from the colleges and universities within the province as well as the neighboring provinces. Call centers, software companies, backroom operations are currently operating in Tagbilaran City and this has also contributed to local employment generation. Meanwhile, the trend in initial capitalization of new DTI-registered businesses from 2005 to 2008 is increasing at an average of 6.2 percent over the three-year period. Similarly, a 16.45% increase is observed in their number during the same period (Figure 47).
The trend of initial capitalization from 2005 to 2008 is increasing at an average of 58%. Proliferation of banking and lending institutions contributed to the large capitalization reflected in 2008. However, a decrease in the number of banking institutions is seen in 2008, 48 versus 52 in 2005, due mainly to mergers and consolidations which were experienced by the banking industry nationwide. Another factor which affected the local banking industry was the insolvency issue which led to the closure of rural banks in late 2008. A very significant factor which affected the economic development of the province is the investment-timid trait of the Boholanos. The Boholano entrepreneurs and dollar earners would rather save and put their money in the bank. Thus, there is a huge outflow of capital to Manila and Cebu caused by the siphoning of savings deposit in the province instead of circulating in the provincial economy.
• Business Establishments
As of year 2008, there were a total of 8,837 DTI-registered business establishments in the province with Tagbilaran City taking the lead, followed by the growth municipalities of Ubay, Talibon, Jagna, Tubigon and Panglao, each municipality with more than 200 DTI registered businesses (Map 12). As of 2008, the total initial capitalization reached P12.212 Billion. These figures represent a sweeping 417% increase over the 2000 figure of P2.358 Billion.
_____________________________________________ Figure 47. New Businesses, Bohol, 2005-2008
Source: DTI
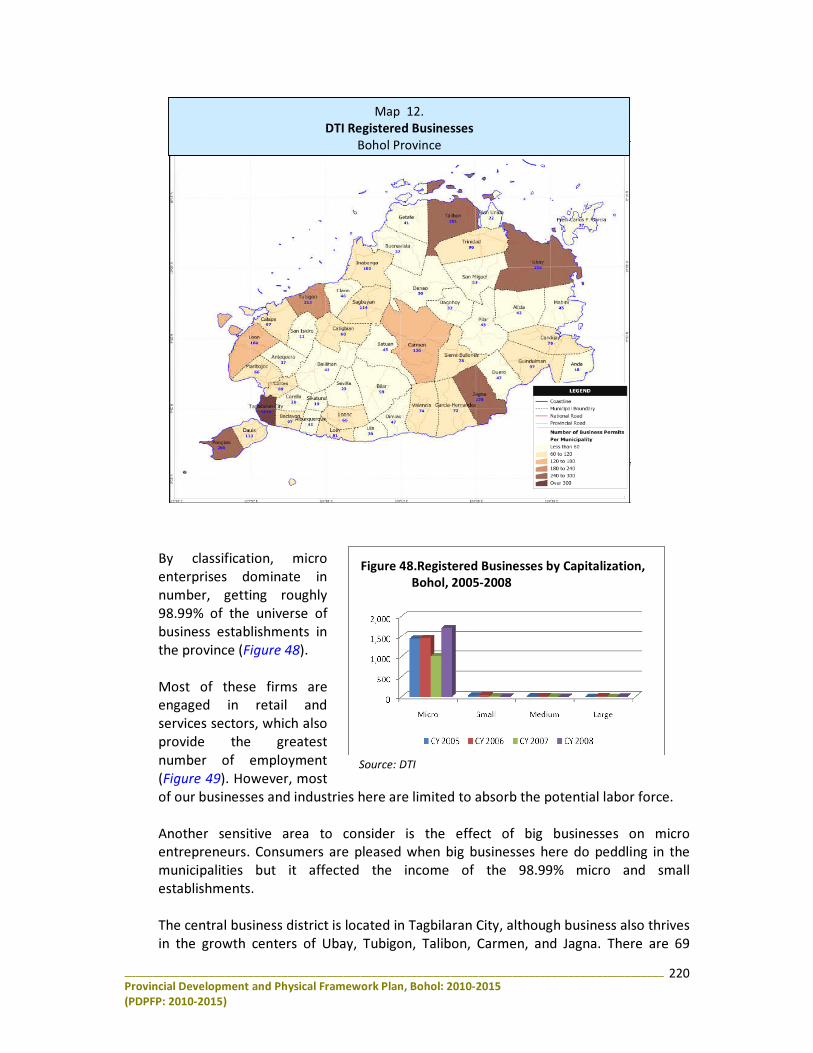
________________________________________________________________________________________________ Provincial Development and Physical Framework Plan, Bohol: 2010-2015 (PDPFP: 2010-2015)
220
Map 12. DTI Registered Businesses
Bohol Province
By classification, micro enterprises dominate in number, getting roughly 98.99% of the universe of business establishments in the province (Figure 48). Most of these firms are engaged in retail and services sectors, which also provide the greatest number of employment (Figure 49). However, most of our businesses and industries here are limited to absorb the potential labor force. Another sensitive area to consider is the effect of big businesses on micro entrepreneurs. Consumers are pleased when big businesses here do peddling in the municipalities but it affected the income of the 98.99% micro and small establishments. The central business district is located in Tagbilaran City, although business also thrives in the growth centers of Ubay, Tubigon, Talibon, Carmen, and Jagna. There are 69
Figure 48.Registered Businesses by Capitalization, Bohol, 2005-2008
Source: DTI
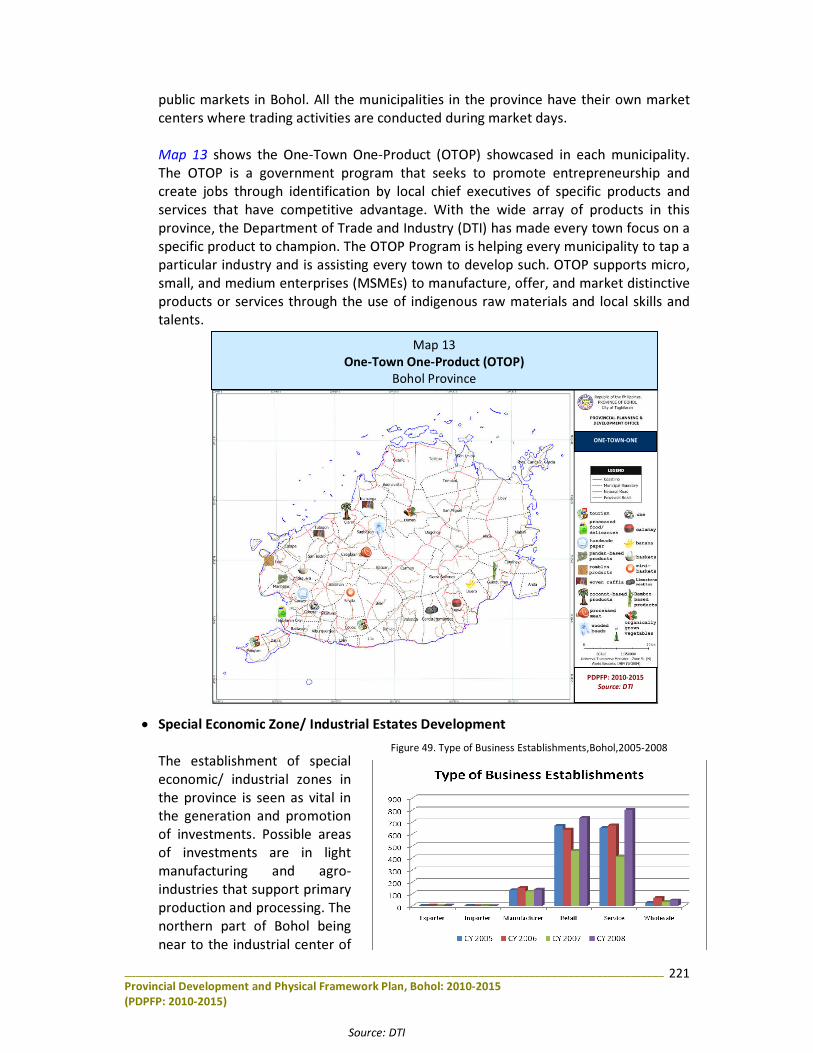
________________________________________________________________________________________________ Provincial Development and Physical Framework Plan, Bohol: 2010-2015 (PDPFP: 2010-2015)
221
Source: DTI
Figure 49. Type of Business Establishments,Bohol,2005-2008
public markets in Bohol. All the municipalities in the province have their own market centers where trading activities are conducted during market days. Map 13 shows the One-Town One-Product (OTOP) showcased in each municipality. The OTOP is a government program that seeks to promote entrepreneurship and create jobs through identification by local chief executives of specific products and services that have competitive advantage. With the wide array of products in this province, the Department of Trade and Industry (DTI) has made every town focus on a specific product to champion. The OTOP Program is helping every municipality to tap a particular industry and is assisting every town to develop such. OTOP supports micro, small, and medium enterprises (MSMEs) to manufacture, offer, and market distinctive products or services through the use of indigenous raw materials and local skills and talents.
• Special Economic Zone/ Industrial Estates Development
The establishment of special economic/ industrial zones in the province is seen as vital in the generation and promotion of investments. Possible areas of investments are in light manufacturing and agro-industries that support primary production and processing. The northern part of Bohol being near to the industrial center of
PDPFP: 2010-2015 Source: DTI
ONE-TOWN-ONE (OTOP) PRODUCT
Map 13 One-Town One-Product (OTOP)
Bohol Province
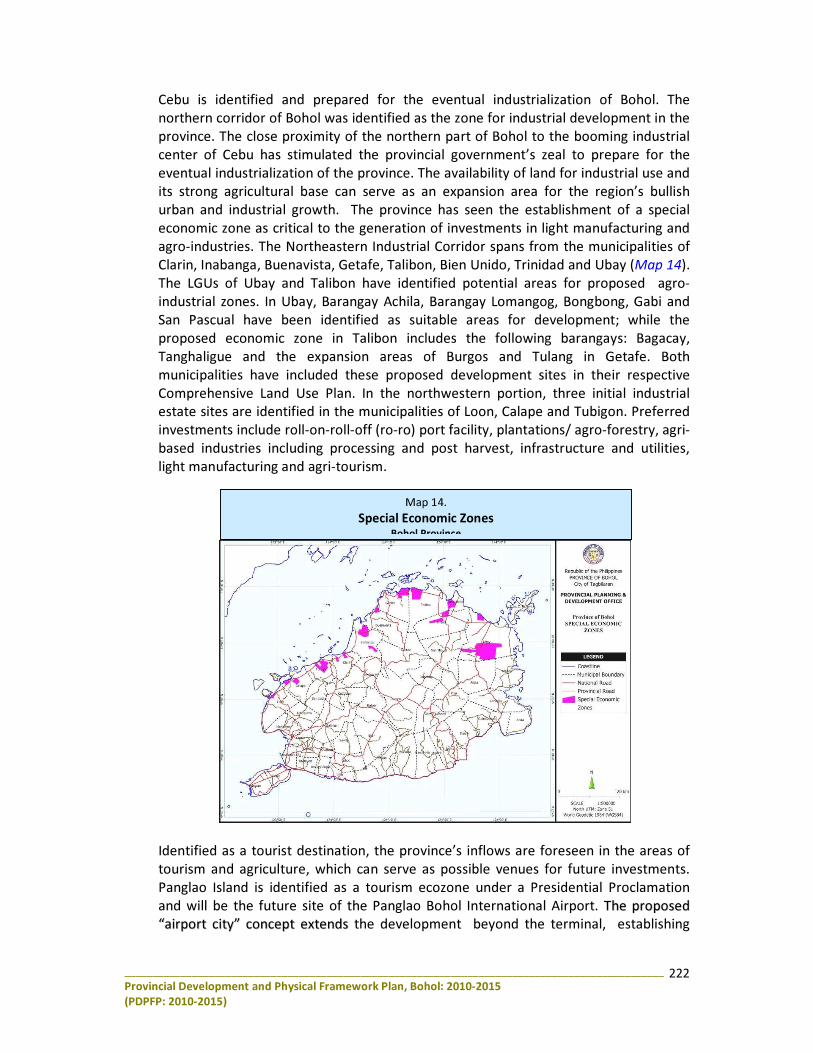
________________________________________________________________________________________________ Provincial Development and Physical Framework Plan, Bohol: 2010-2015 (PDPFP: 2010-2015)
222
Map 14. Special Economic Zones
Bohol Province
Cebu is identified and prepared for the eventual industrialization of Bohol. The northern corridor of Bohol was identified as the zone for industrial development in the province. The close proximity of the northern part of Bohol to the booming industrial center of Cebu has stimulated the provincial government’s zeal to prepare for the eventual industrialization of the province. The availability of land for industrial use and its strong agricultural base can serve as an expansion area for the region’s bullish urban and industrial growth. The province has seen the establishment of a special economic zone as critical to the generation of investments in light manufacturing and agro-industries. The Northeastern Industrial Corridor spans from the municipalities of Clarin, Inabanga, Buenavista, Getafe, Talibon, Bien Unido, Trinidad and Ubay (Map 14). The LGUs of Ubay and Talibon have identified potential areas for proposed agro-industrial zones. In Ubay, Barangay Achila, Barangay Lomangog, Bongbong, Gabi and San Pascual have been identified as suitable areas for development; while the proposed economic zone in Talibon includes the following barangays: Bagacay, Tanghaligue and the expansion areas of Burgos and Tulang in Getafe. Both municipalities have included these proposed development sites in their respective Comprehensive Land Use Plan. In the northwestern portion, three initial industrial estate sites are identified in the municipalities of Loon, Calape and Tubigon. Preferred investments include roll-on-roll-off (ro-ro) port facility, plantations/ agro-forestry, agri-based industries including processing and post harvest, infrastructure and utilities, light manufacturing and agri-tourism.
Identified as a tourist destination, the province’s inflows are foreseen in the areas of tourism and agriculture, which can serve as possible venues for future investments. Panglao Island is identified as a tourism ecozone under a Presidential Proclamation and will be the future site of the Panglao Bohol International Airport. TThhee pprrooppoosseedd ““aaiirrppoorrtt cciittyy”” ccoonncceepptt eexxtteennddss the development beyond the terminal, establishing
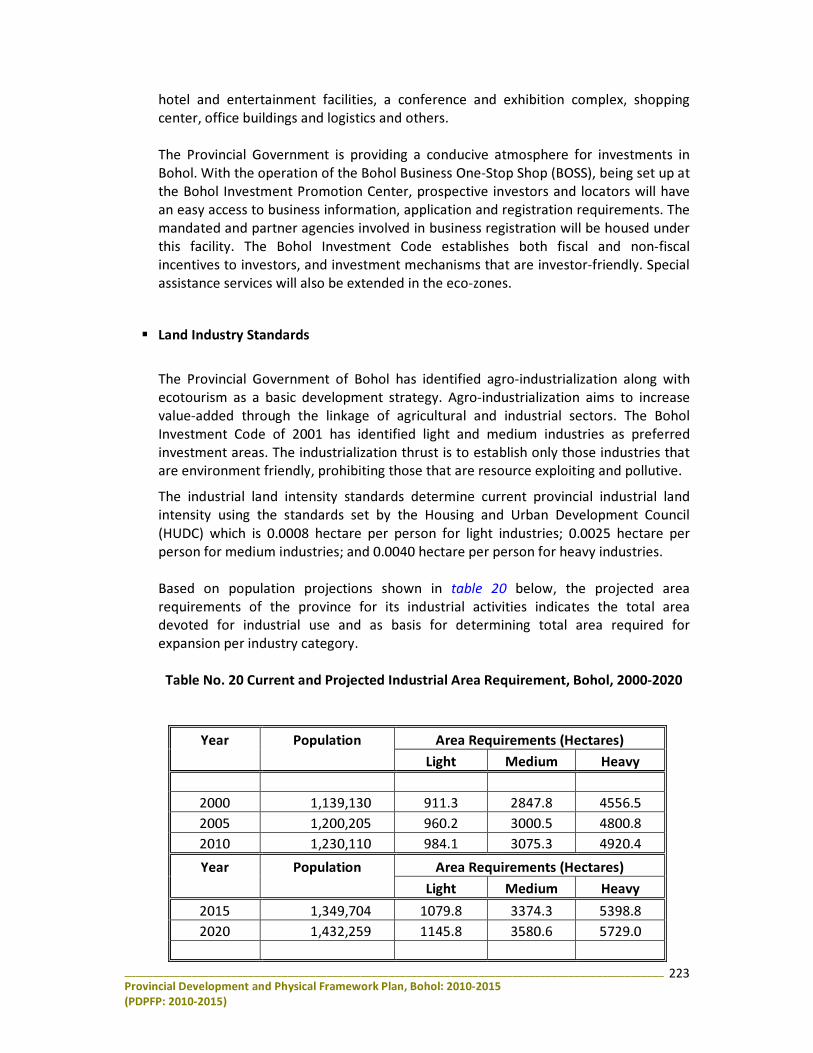
________________________________________________________________________________________________ Provincial Development and Physical Framework Plan, Bohol: 2010-2015 (PDPFP: 2010-2015)
223
hotel and entertainment facilities, a conference and exhibition complex, shopping center, office buildings and logistics and others. The Provincial Government is providing a conducive atmosphere for investments in Bohol. With the operation of the Bohol Business One-Stop Shop (BOSS), being set up at the Bohol Investment Promotion Center, prospective investors and locators will have an easy access to business information, application and registration requirements. The mandated and partner agencies involved in business registration will be housed under this facility. The Bohol Investment Code establishes both fiscal and non-fiscal incentives to investors, and investment mechanisms that are investor-friendly. Special assistance services will also be extended in the eco-zones.
� Land Industry Standards
The Provincial Government of Bohol has identified agro-industrialization along with ecotourism as a basic development strategy. Agro-industrialization aims to increase value-added through the linkage of agricultural and industrial sectors. The Bohol Investment Code of 2001 has identified light and medium industries as preferred investment areas. The industrialization thrust is to establish only those industries that are environment friendly, prohibiting those that are resource exploiting and pollutive. The industrial land intensity standards determine current provincial industrial land intensity using the standards set by the Housing and Urban Development Council (HUDC) which is 0.0008 hectare per person for light industries; 0.0025 hectare per person for medium industries; and 0.0040 hectare per person for heavy industries. Based on population projections shown in table 20 below, the projected area requirements of the province for its industrial activities indicates the total area devoted for industrial use and as basis for determining total area required for expansion per industry category.
Table No. 20 Current and Projected Industrial Area Requirement, Bohol, 2000-2020
Year Population Area Requirements (Hectares) Light Medium Heavy
2000 1,139,130 911.3 2847.8 4556.5 2005 1,200,205 960.2 3000.5 4800.8 2010 1,230,110 984.1 3075.3 4920.4 Year Population Area Requirements (Hectares)
Light Medium Heavy 2015 1,349,704 1079.8 3374.3 5398.8 2020 1,432,259 1145.8 3580.6 5729.0
________________________________________________________________________________________________ Provincial Development and Physical Framework Plan, Bohol: 2010-2015 (PDPFP: 2010-2015)
224
� Investment Opportunities in the Province To push its economic development, the province has identified preferred growth areas. The following sectors have been identified to be accorded “primary growth focus” in terms of incentives, assistance and public investment support by the province:
Tourism • Accommodation facilities • Health and wellness tourism facilities • Retirement villages • Agri-tourism establishments • Nature park / Mountain resort • Transportation services • Restaurant / Food outlet • Other tourism-related services
Agri-Business • High-value crop production • Aquaculture • Post-harvest facilities • Fruit / Meat processing • Feed mill • Tree farming
Light Manufacturing • Crafts • Processed food • Farm implements • Furniture / Furnishings • Precision assembly • Semiconductors
Services • Information technology • Media / Advertising • Medical services / Facilities • Financial services • Engineering / Architectural services • Training and sports facilities • Human resource development; i.e., training facilities, educational institutions
Energy • Development of indigenous and off- grid power sources • Power generation, transmission and other activities using environment-
friendly technologies
________________________________________________________________________________________________ Provincial Development and Physical Framework Plan, Bohol: 2010-2015 (PDPFP: 2010-2015)
225
DEVELOPMENT CHALLENGES • Inadequacy of Employment Opportunities
Bohol’s rapid population growth rate at 2.9 percent will automatically mean proportionate increases in the labor force. The labor force shows an upward trend in the 15 and over population, while the employment rate continues to decrease. As the labor force increases demand for employment and means of livelihood to sustain life also increases which would in turn affect the economy of the province. Unemployment figures will rise in the next six years unless the government shall undertake measures in addressing the problem.
• Low Level of Investments
While investments in tourism related services particularly in accommodation facilities, restaurants, travel and tour operations, and land transportation services, have been noted to have surged over the past years, the agribusiness sector, either in production and/or processing, has experienced a snail-paced growth. Investments in manufacturing continue to remain sluggish with only very few, if any, taking place. Retail and service businesses continue to be the primary economic activities throughout the province as Boholanos are timid to go into manufacturing and processing ventures.
• Uncompetitive Business Environment of LGUs Development challenges also lie in the absence or lack of support mechanisms to warrant an enabled and business-friendly environment in Bohol and among LGUs. The province needs to make in place the necessary framework conditions so that more investments will be visible in Bohol within the next five years.
• High Poverty Incidence
With 38.8% families below the poverty line, as of 2006 Bohol ranks number 35 among the country’s provinces in terms of poverty incidence. This is higher than the regional figure of 30.3% and the national incidence of 26.9%. In terms of population, poverty incidence in the province is 46.9%, higher than the regional figure of 35.4%, and that of the entire country’s 32.9%.
• Culture of entrepreneurship is very low among rural poor • Women’s sector has not been tapped to its full potential as an engine for economic
growth
________________________________________________________________________________________________ Provincial Development and Physical Framework Plan, Bohol: 2010-2015 (PDPFP: 2010-2015)
226
DEVELOPMENT PLAN FRAMEWORK
Sub-Sector Vision
A Province with globally competitive business friendly economic governance where people and communities benefit from the economic gains, thereby having equitable growth with upward and upscaled environmental management and protection.
Sub-Sector Goals • Increase employment opportunities • Increase investments generation, specifically in the priority sectors • Provide conducive business climate through investor-friendly policies • Contribute to poverty reduction through provision of more jobs and support to
micro-enterprises • Provide livelihood programs/ opportunities to Boholanos • Create an improved business and investment enabling environment in LGUs. • Promote higher efficiency and transparency in local governance. • Improve service delivery. • Adopt advanced technology • Build the capacity of LGUs to develop vibrant rural communities • Important reforms pressed ahead to improve the availability and adequacy of
infrastructure • Lower cost of doing business • Develop more entrepreneurs
Sub-Sector Objectives and Targets
• To increase the number of investments in priority sectors by at least 50% in 2015
• To increase and expand the tax base of LGUs by at least 25% at the end of 2015 • To develop and provide financing opportunities to women entrepreneurs • To capture market niches • To identify areas for intervention • To capture and promote best practices • To integrate LED-WEE in Local Development Planning • To formally organize women entrepreneurs • To develop and build-up entrepreneurial capability of women • To provide 50,000 jobs per year • To generate 1 Billion outside investment for the next five years • To develop competitive products/services • To provide more employment opportunities to Boholanos • To entice local and foreign investors to locate in Bohol • To streamline business processes and licensing systems of LGUs • To help improve the household income of Boholanos
________________________________________________________________________________________________ Provincial Development and Physical Framework Plan, Bohol: 2010-2015 (PDPFP: 2010-2015)
227
Sub-Sector Strategies � Enterprise/ Industry Development
• Facilitate Establishment of special ecozones/ industrial sites • Develop entrepreneurial spirit among all sectors of society • Develop functional business centers in the province and towns that will cater to
MSME needs • Investment promotion and generation. • Provision of fiscal and non-fiscal incentives to investors and entrepreneurs • Ensure that Bohol sustain distinct, localized and quality products and services • Attract foreign direct investments in tourism, agriculture and IT • Set up intensive promotion and marketing programs to penetrate international
mainstream markets • Growth center development • Development of One-Town-One-Product (OTOP) • Set-up of One-Stop Shop, where prospective investors and locators will have an
easy access to business • Establish community-based livelihood development projects • Strengthen and develop industries in the countryside
� Support Systems for Business
• Provision of easy access to credit facilities for MSMEs • Marketing and productivity assistance for MSMEs • Education and training programs for business enhancement • Establishment of business incubator and packaging center • Research and development • Conduct/ participate in promotional missions/ trade events/ exhibitions • Update Municipal and Provincial Land Use Plans • Enact Municipal Investment Code • Streamline LGU civil application processes through BPLS • Implement E-tracks in LGUs in cooperation with provincial government • Harmonize registration/ application forms from LGUs, NGAs and other institutions • Resource generation/mobilization and access to finance
� Human Resource Development
• Develop education and training programs to build an enterprising culture • Provide adequate labor resources equipped with appropriate education and
technology • Provide continuous skills development trainings suitable to prioritized areas of
investment • Encourage private sector participation in the establishment of quality and
responsive learning (educational, training and out-sourcing) institutions • Provide appropriate skills enhancement activities for skills required abroad • Match skill requirement with curriculum • Monitoring and Evaluation • Knowledge Management • Organization and institutional strengthening of women’s enterprises • Capacity development
________________________________________________________________________________________________ Provincial Development and Physical Framework Plan, Bohol: 2010-2015 (PDPFP: 2010-2015)
228
� Employment Generation • Provide venue where people could explore simultaneously various employment
options and actually seek assistance • Establish strong networking/ linkage with all accredited recruitment agencies and
business establishments • Invite agencies to conduct job fairs in the province • Encourage locators/ investors in Bohol to hire Boholanos
� Information, Communication technologies (ICT)
• Private sector to establish IT products and services for development • Incorporate IT in all levels of education • Investment in technical training schools to enhance technical competences of the
labor force • Develop IT industry • Fiber optic system development
� Infrastructure support facilities
• Development of infra support facilities (water, power, roads, ports, sewerage and drainage, waste water treatment)
• Establishment of public access to common resources and facilities (beaches, rivers, natural parks)
• Ensure Bohol’s connectivity to the fiber optic backbone
Priority Programs and Projects
1) MSME Development Program - Community-based Enterprise Development Program - Small Enterprise Technology Upgrading Program - Product Development Program for Food and Crafts 2) Special Economic Zone Development - Proposed Agri-industrial Economic Zone (Loon, Calape, Tubigon, Clarin, Inabanga, Buenavista, Getafe, Talibon, Trinidad, Bien
Unido, Ubay) - Proposed Tourism Economic Zone (Panglao) - Bohol Business Park (Tagbilaran City) 3) Tourism Investment Development 4) Agribusiness Investment Development
PPrroovviinncciiaall DDeevveellooppmmeenntt && PPhhyyssiiccaall FFrraammeewwoorrkk PPllaann DDEEVVEELLOOPPMMEENNTT AADDMMIINNIISSTTRRAATTIIOONN
SSEECCTTOORR PPLLAANN:: 22001100--22001155 PDPFP
2010-2015
PDPFP 2010-2015 – Development Administration Sector 230
Table of Contents PDPFP 2010-2015
DEVELOPMENT ADMINISTRATION
List of Tables 231 List of Maps 231 List of Figures 232 Acronyms 233 Sub-Sector: Public Finance … 235
Issues and Concerns of the Sub-Sector … 246 Development Framework … 247
Sub-Sector: Local Governance … 251
Issues and Concerns of the Sub-Sector … 265 Development Framework … 267
Sub-Sector: Justice & Safety … 270 Issues and Concerns of the Sub-Sector … 282 Development Framework … 283
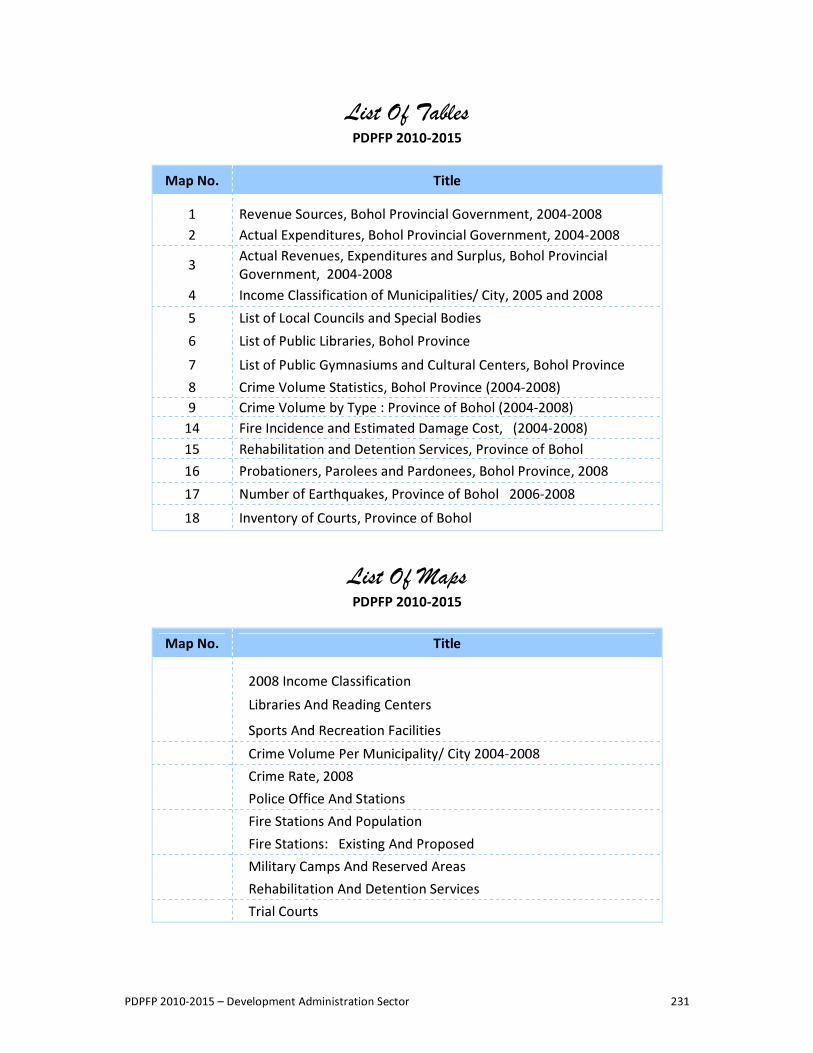
PDPFP 2010-2015 – Development Administration Sector 231
List Of Tables PDPFP 2010-2015
Map No. Title
1 Revenue Sources, Bohol Provincial Government, 2004-2008 2 Actual Expenditures, Bohol Provincial Government, 2004-2008 3 Actual Revenues, Expenditures and Surplus, Bohol Provincial
Government, 2004-2008 4 Income Classification of Municipalities/ City, 2005 and 2008 5 List of Local Councils and Special Bodies 6 List of Public Libraries, Bohol Province 7 List of Public Gymnasiums and Cultural Centers, Bohol Province 8 Crime Volume Statistics, Bohol Province (2004-2008) 9 Crime Volume by Type : Province of Bohol (2004-2008)
14 Fire Incidence and Estimated Damage Cost, (2004-2008) 15 Rehabilitation and Detention Services, Province of Bohol 16 Probationers, Parolees and Pardonees, Bohol Province, 2008 17 Number of Earthquakes, Province of Bohol 2006-2008 18 Inventory of Courts, Province of Bohol
List Of Maps PDPFP 2010-2015
Map No. Title
2008 Income Classification Libraries And Reading Centers Sports And Recreation Facilities Crime Volume Per Municipality/ City 2004-2008 Crime Rate, 2008 Police Office And Stations Fire Stations And Population Fire Stations: Existing And Proposed Military Camps And Reserved Areas Rehabilitation And Detention Services Trial Courts
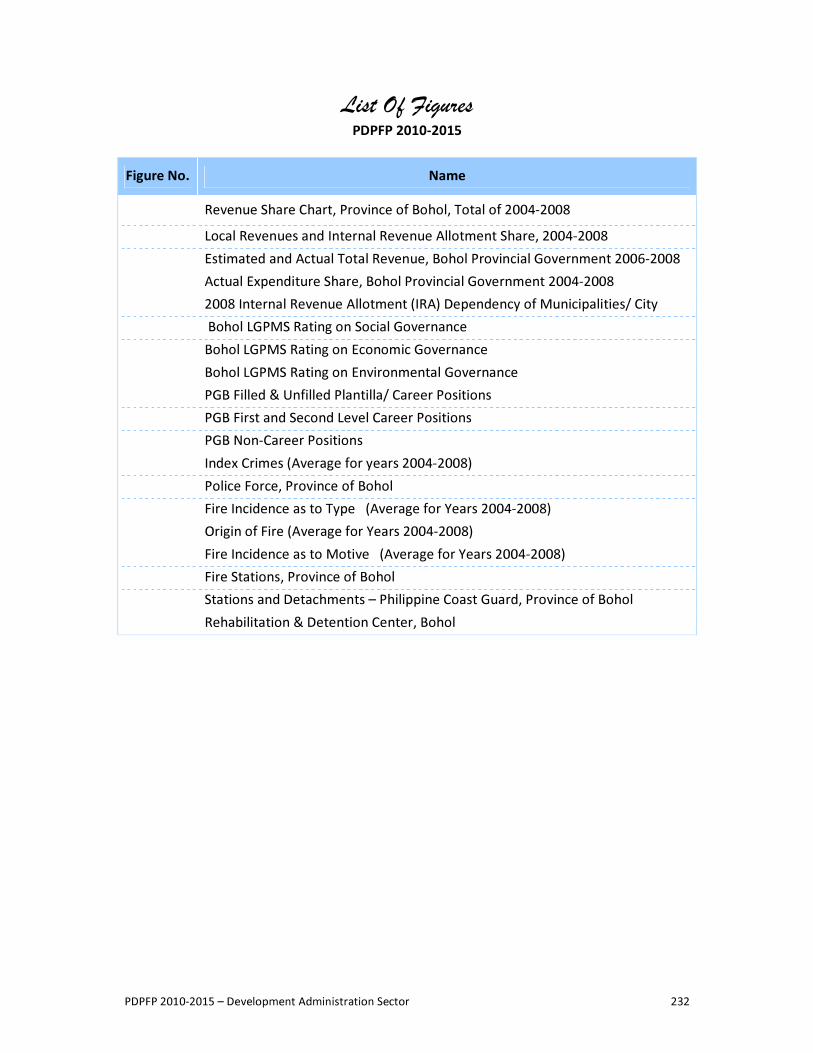
PDPFP 2010-2015 – Development Administration Sector 232
List Of Figures PDPFP 2010-2015
Figure No. Name
Revenue Share Chart, Province of Bohol, Total of 2004-2008 Local Revenues and Internal Revenue Allotment Share, 2004-2008 Estimated and Actual Total Revenue, Bohol Provincial Government 2006-2008 Actual Expenditure Share, Bohol Provincial Government 2004-2008 2008 Internal Revenue Allotment (IRA) Dependency of Municipalities/ City Bohol LGPMS Rating on Social Governance Bohol LGPMS Rating on Economic Governance Bohol LGPMS Rating on Environmental Governance PGB Filled & Unfilled Plantilla/ Career Positions PGB First and Second Level Career Positions PGB Non-Career Positions Index Crimes (Average for years 2004-2008) Police Force, Province of Bohol Fire Incidence as to Type (Average for Years 2004-2008) Origin of Fire (Average for Years 2004-2008) Fire Incidence as to Motive (Average for Years 2004-2008) Fire Stations, Province of Bohol Stations and Detachments – Philippine Coast Guard, Province of Bohol Rehabilitation & Detention Center, Bohol
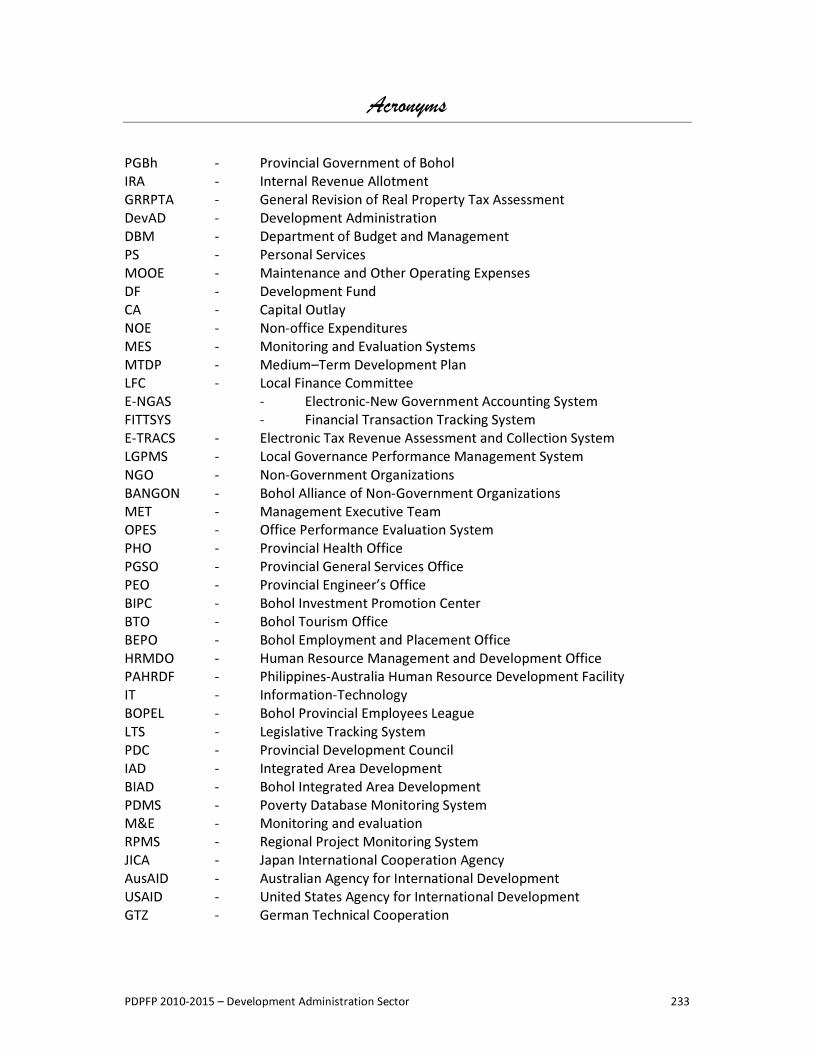
PDPFP 2010-2015 – Development Administration Sector 233
Acronyms PGBh - Provincial Government of Bohol IRA - Internal Revenue Allotment GRRPTA - General Revision of Real Property Tax Assessment DevAD - Development Administration DBM - Department of Budget and Management PS - Personal Services MOOE - Maintenance and Other Operating Expenses DF - Development Fund CA - Capital Outlay NOE - Non-office Expenditures MES - Monitoring and Evaluation Systems MTDP - Medium–Term Development Plan LFC - Local Finance Committee E-NGAS - Electronic-New Government Accounting System FITTSYS - Financial Transaction Tracking System E-TRACS - Electronic Tax Revenue Assessment and Collection System LGPMS - Local Governance Performance Management System NGO - Non-Government Organizations BANGON - Bohol Alliance of Non-Government Organizations MET - Management Executive Team OPES - Office Performance Evaluation System PHO - Provincial Health Office PGSO - Provincial General Services Office PEO - Provincial Engineer’s Office BIPC - Bohol Investment Promotion Center BTO - Bohol Tourism Office BEPO - Bohol Employment and Placement Office HRMDO - Human Resource Management and Development Office PAHRDF - Philippines-Australia Human Resource Development Facility IT - Information-Technology BOPEL - Bohol Provincial Employees League LTS - Legislative Tracking System PDC - Provincial Development Council IAD - Integrated Area Development BIAD - Bohol Integrated Area Development PDMS - Poverty Database Monitoring System M&E - Monitoring and evaluation RPMS - Regional Project Monitoring System JICA - Japan International Cooperation Agency AusAID - Australian Agency for International Development USAID - United States Agency for International Development GTZ - German Technical Cooperation
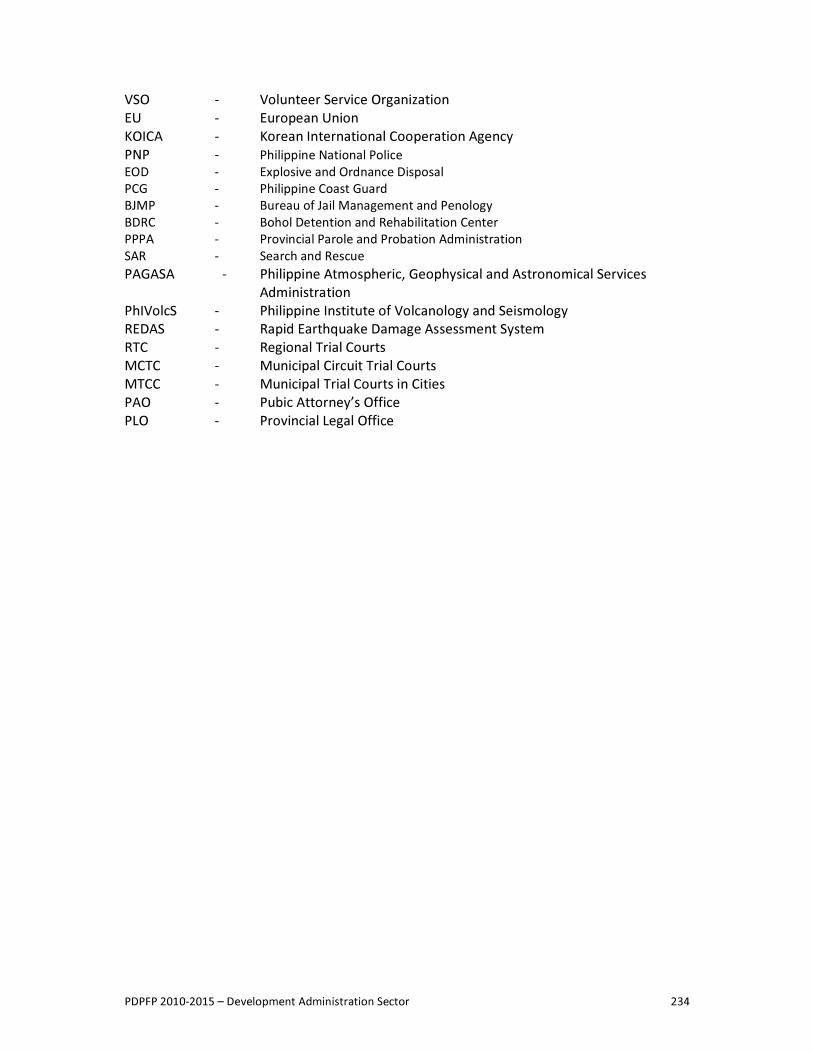
PDPFP 2010-2015 – Development Administration Sector 234
VSO - Volunteer Service Organization EU - European Union KOICA - Korean International Cooperation Agency PNP - Philippine National Police EOD - Explosive and Ordnance Disposal PCG - Philippine Coast Guard BJMP - Bureau of Jail Management and Penology BDRC - Bohol Detention and Rehabilitation Center PPPA - Provincial Parole and Probation Administration SAR - Search and Rescue PAGASA - Philippine Atmospheric, Geophysical and Astronomical Services
Administration PhIVolcS - Philippine Institute of Volcanology and Seismology REDAS - Rapid Earthquake Damage Assessment System RTC - Regional Trial Courts MCTC - Municipal Circuit Trial Courts MTCC - Municipal Trial Courts in Cities PAO - Pubic Attorney’s Office PLO - Provincial Legal Office
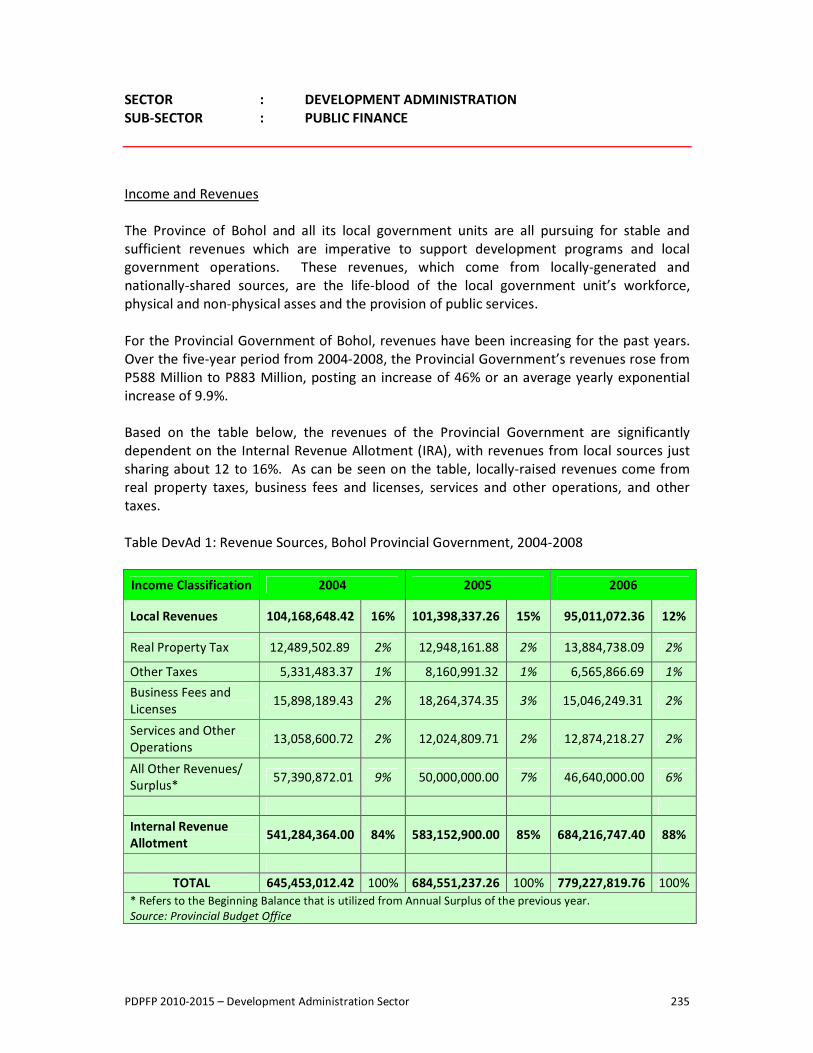
PDPFP 2010-2015 – Development Administration Sector 235
SECTOR : DEVELOPMENT ADMINISTRATION SUB-SECTOR : PUBLIC FINANCE Income and Revenues The Province of Bohol and all its local government units are all pursuing for stable and sufficient revenues which are imperative to support development programs and local government operations. These revenues, which come from locally-generated and nationally-shared sources, are the life-blood of the local government unit’s workforce, physical and non-physical asses and the provision of public services. For the Provincial Government of Bohol, revenues have been increasing for the past years. Over the five-year period from 2004-2008, the Provincial Government’s revenues rose from P588 Million to P883 Million, posting an increase of 46% or an average yearly exponential increase of 9.9%. Based on the table below, the revenues of the Provincial Government are significantly dependent on the Internal Revenue Allotment (IRA), with revenues from local sources just sharing about 12 to 16%. As can be seen on the table, locally-raised revenues come from real property taxes, business fees and licenses, services and other operations, and other taxes. Table DevAd 1: Revenue Sources, Bohol Provincial Government, 2004-2008
Income Classification 2004 2005 2006 Local Revenues 104,168,648.42 16% 101,398,337.26 15% 95,011,072.36 12% Real Property Tax 12,489,502.89 2% 12,948,161.88 2% 13,884,738.09 2%
Other Taxes 5,331,483.37 1% 8,160,991.32 1% 6,565,866.69 1% Business Fees and Licenses 15,898,189.43 2% 18,264,374.35 3% 15,046,249.31 2%
Services and Other Operations 13,058,600.72 2% 12,024,809.71 2% 12,874,218.27 2%
All Other Revenues/ Surplus* 57,390,872.01 9% 50,000,000.00 7% 46,640,000.00 6%
Internal Revenue Allotment 541,284,364.00 84% 583,152,900.00 85% 684,216,747.40 88%
TOTAL 645,453,012.42 100% 684,551,237.26 100% 779,227,819.76 100% * Refers to the Beginning Balance that is utilized from Annual Surplus of the previous year. Source: Provincial Budget Office
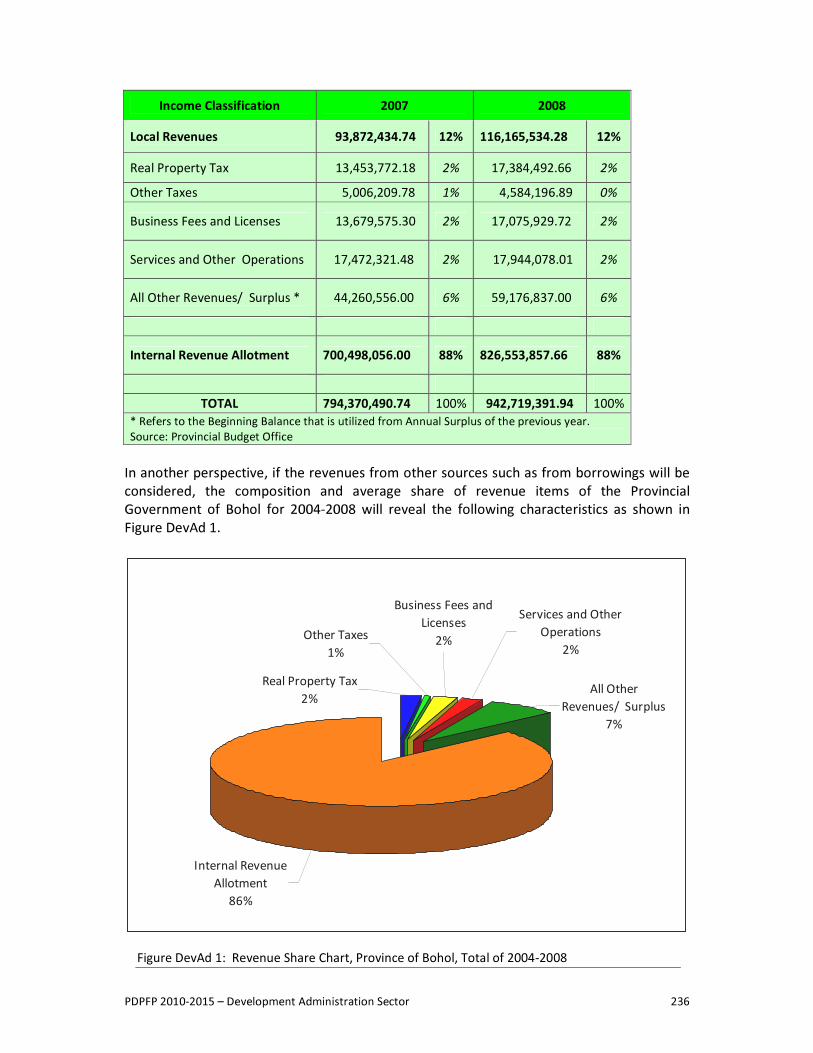
PDPFP 2010-2015 – Development Administration Sector 236
Income Classification 2007 2008 Local Revenues 93,872,434.74 12% 116,165,534.28 12% Real Property Tax 13,453,772.18 2% 17,384,492.66 2%
Other Taxes 5,006,209.78 1% 4,584,196.89 0%
Business Fees and Licenses 13,679,575.30 2% 17,075,929.72 2%
Services and Other Operations 17,472,321.48 2% 17,944,078.01 2%
All Other Revenues/ Surplus * 44,260,556.00 6% 59,176,837.00 6%
Internal Revenue Allotment 700,498,056.00 88% 826,553,857.66 88%
TOTAL 794,370,490.74 100% 942,719,391.94 100% * Refers to the Beginning Balance that is utilized from Annual Surplus of the previous year. Source: Provincial Budget Office
In another perspective, if the revenues from other sources such as from borrowings will be considered, the composition and average share of revenue items of the Provincial Government of Bohol for 2004-2008 will reveal the following characteristics as shown in Figure DevAd 1.
Figure DevAd 1: Revenue Share Chart, Province of Bohol, Total of 2004-2008
Other Taxes1%
Services and Other Operations
2%
All Other Revenues/ Surplus
7%
Business Fees and Licenses
2%
Real Property Tax2%
Internal Revenue Allotment
86%
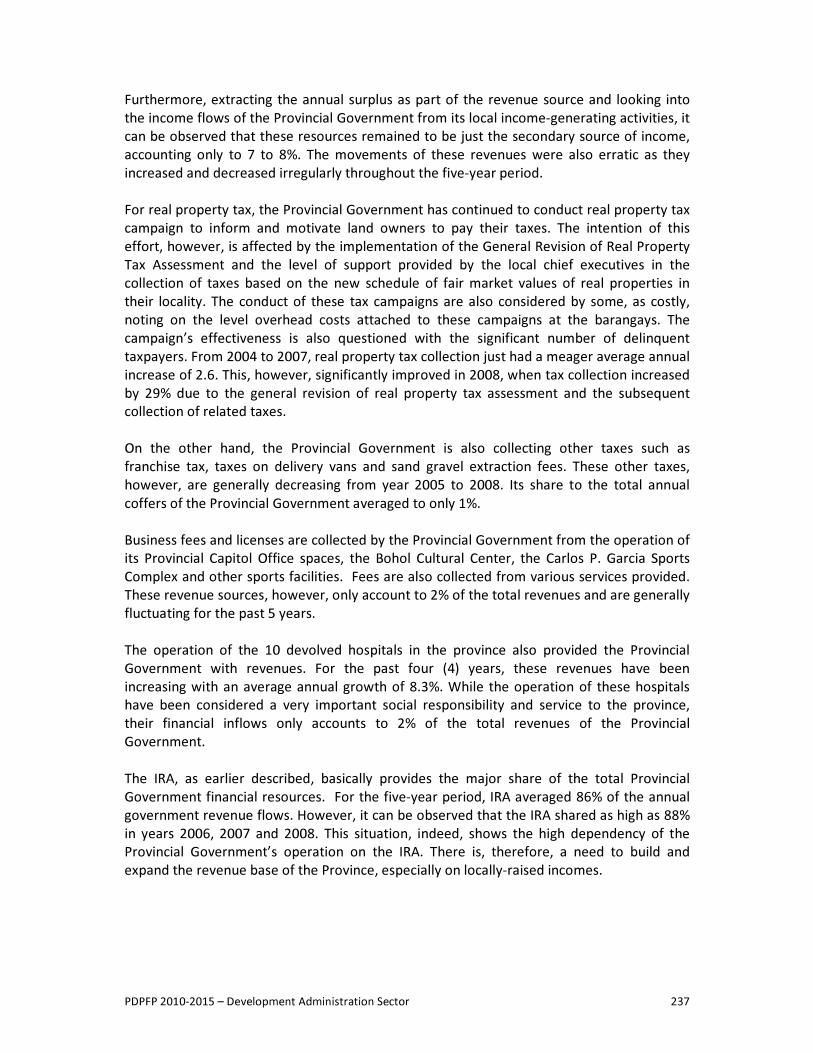
PDPFP 2010-2015 – Development Administration Sector 237
Furthermore, extracting the annual surplus as part of the revenue source and looking into the income flows of the Provincial Government from its local income-generating activities, it can be observed that these resources remained to be just the secondary source of income, accounting only to 7 to 8%. The movements of these revenues were also erratic as they increased and decreased irregularly throughout the five-year period. For real property tax, the Provincial Government has continued to conduct real property tax campaign to inform and motivate land owners to pay their taxes. The intention of this effort, however, is affected by the implementation of the General Revision of Real Property Tax Assessment and the level of support provided by the local chief executives in the collection of taxes based on the new schedule of fair market values of real properties in their locality. The conduct of these tax campaigns are also considered by some, as costly, noting on the level overhead costs attached to these campaigns at the barangays. The campaign’s effectiveness is also questioned with the significant number of delinquent taxpayers. From 2004 to 2007, real property tax collection just had a meager average annual increase of 2.6. This, however, significantly improved in 2008, when tax collection increased by 29% due to the general revision of real property tax assessment and the subsequent collection of related taxes. On the other hand, the Provincial Government is also collecting other taxes such as franchise tax, taxes on delivery vans and sand gravel extraction fees. These other taxes, however, are generally decreasing from year 2005 to 2008. Its share to the total annual coffers of the Provincial Government averaged to only 1%. Business fees and licenses are collected by the Provincial Government from the operation of its Provincial Capitol Office spaces, the Bohol Cultural Center, the Carlos P. Garcia Sports Complex and other sports facilities. Fees are also collected from various services provided. These revenue sources, however, only account to 2% of the total revenues and are generally fluctuating for the past 5 years. The operation of the 10 devolved hospitals in the province also provided the Provincial Government with revenues. For the past four (4) years, these revenues have been increasing with an average annual growth of 8.3%. While the operation of these hospitals have been considered a very important social responsibility and service to the province, their financial inflows only accounts to 2% of the total revenues of the Provincial Government. The IRA, as earlier described, basically provides the major share of the total Provincial Government financial resources. For the five-year period, IRA averaged 86% of the annual government revenue flows. However, it can be observed that the IRA shared as high as 88% in years 2006, 2007 and 2008. This situation, indeed, shows the high dependency of the Provincial Government’s operation on the IRA. There is, therefore, a need to build and expand the revenue base of the Province, especially on locally-raised incomes.
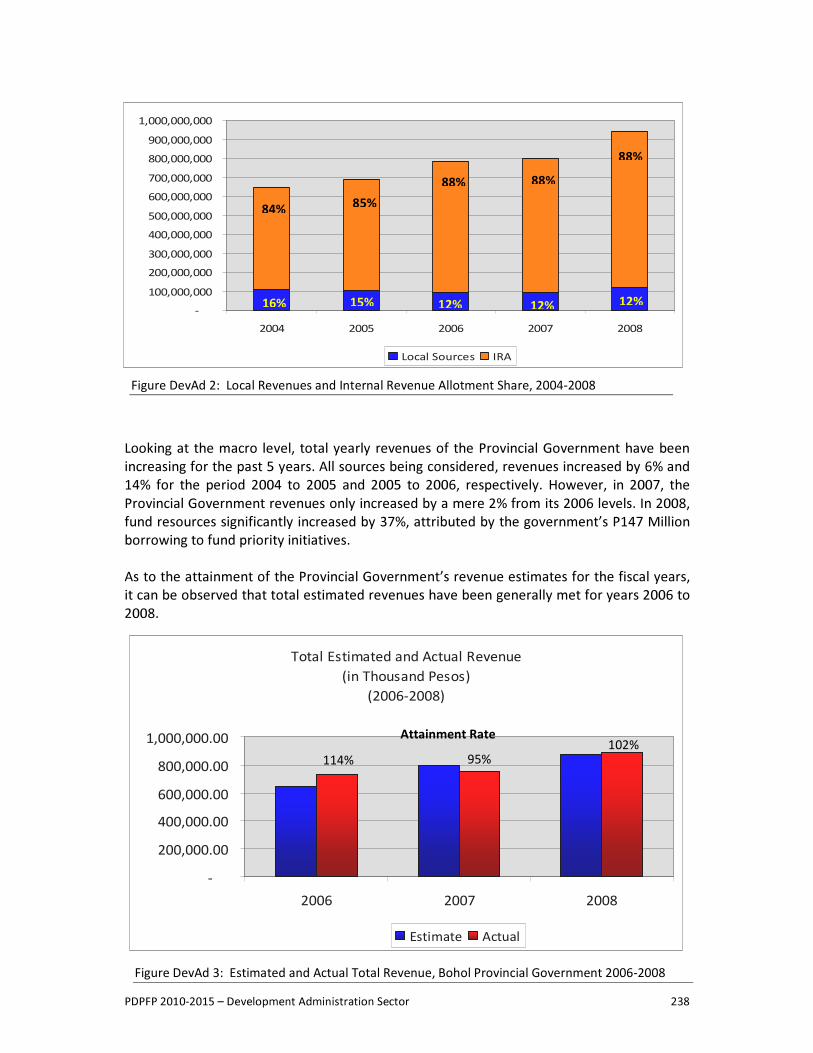
PDPFP 2010-2015 – Development Administration Sector 238
-100,000,000200,000,000300,000,000400,000,000500,000,000600,000,000700,000,000800,000,000900,000,000
1,000,000,000
2004 2005 2006 2007 2008
Local Sources IRA
84% 85% 88% 88%
88%
16% 15% 12% 12% 12%
Figure DevAd 2: Local Revenues and Internal Revenue Allotment Share, 2004-2008
Looking at the macro level, total yearly revenues of the Provincial Government have been increasing for the past 5 years. All sources being considered, revenues increased by 6% and 14% for the period 2004 to 2005 and 2005 to 2006, respectively. However, in 2007, the Provincial Government revenues only increased by a mere 2% from its 2006 levels. In 2008, fund resources significantly increased by 37%, attributed by the government’s P147 Million borrowing to fund priority initiatives. As to the attainment of the Provincial Government’s revenue estimates for the fiscal years, it can be observed that total estimated revenues have been generally met for years 2006 to 2008.
Total Estimated and Actual Revenue(in Thousand Pesos)
(2006-2008)
-200,000.00400,000.00600,000.00800,000.00
1,000,000.00
2006 2007 2008
Estimate Actual
114% 95% 102% Attainment Rate
Figure DevAd 3: Estimated and Actual Total Revenue, Bohol Provincial Government 2006-2008
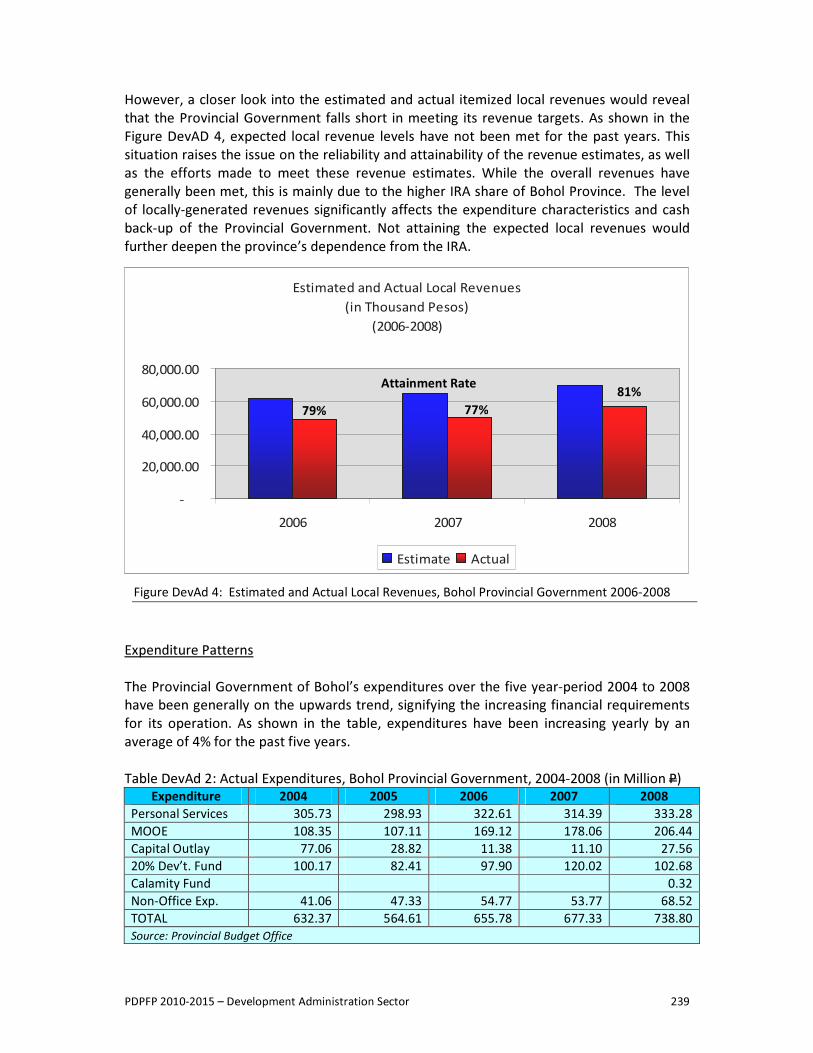
PDPFP 2010-2015 – Development Administration Sector 239
Estimated and Actual Local Revenues(in Thousand Pesos)
(2006-2008)
-
20,000.00
40,000.00
60,000.00
80,000.00
2006 2007 2008
Estimate Actual
79% 77% 81% Attainment Rate
Figure DevAd 4: Estimated and Actual Local Revenues, Bohol Provincial Government 2006-2008
However, a closer look into the estimated and actual itemized local revenues would reveal that the Provincial Government falls short in meeting its revenue targets. As shown in the Figure DevAD 4, expected local revenue levels have not been met for the past years. This situation raises the issue on the reliability and attainability of the revenue estimates, as well as the efforts made to meet these revenue estimates. While the overall revenues have generally been met, this is mainly due to the higher IRA share of Bohol Province. The level of locally-generated revenues significantly affects the expenditure characteristics and cash back-up of the Provincial Government. Not attaining the expected local revenues would further deepen the province’s dependence from the IRA.
Expenditure Patterns The Provincial Government of Bohol’s expenditures over the five year-period 2004 to 2008 have been generally on the upwards trend, signifying the increasing financial requirements for its operation. As shown in the table, expenditures have been increasing yearly by an average of 4% for the past five years. Table DevAd 2: Actual Expenditures, Bohol Provincial Government, 2004-2008 (in Million P)
Expenditure 2004 2005 2006 2007 2008 Personal Services 305.73 298.93 322.61 314.39 333.28 MOOE 108.35 107.11 169.12 178.06 206.44 Capital Outlay 77.06 28.82 11.38 11.10 27.56 20% Dev’t. Fund 100.17 82.41 97.90 120.02 102.68 Calamity Fund 0.32 Non-Office Exp. 41.06 47.33 54.77 53.77 68.52 TOTAL 632.37 564.61 655.78 677.33 738.80 Source: Provincial Budget Office
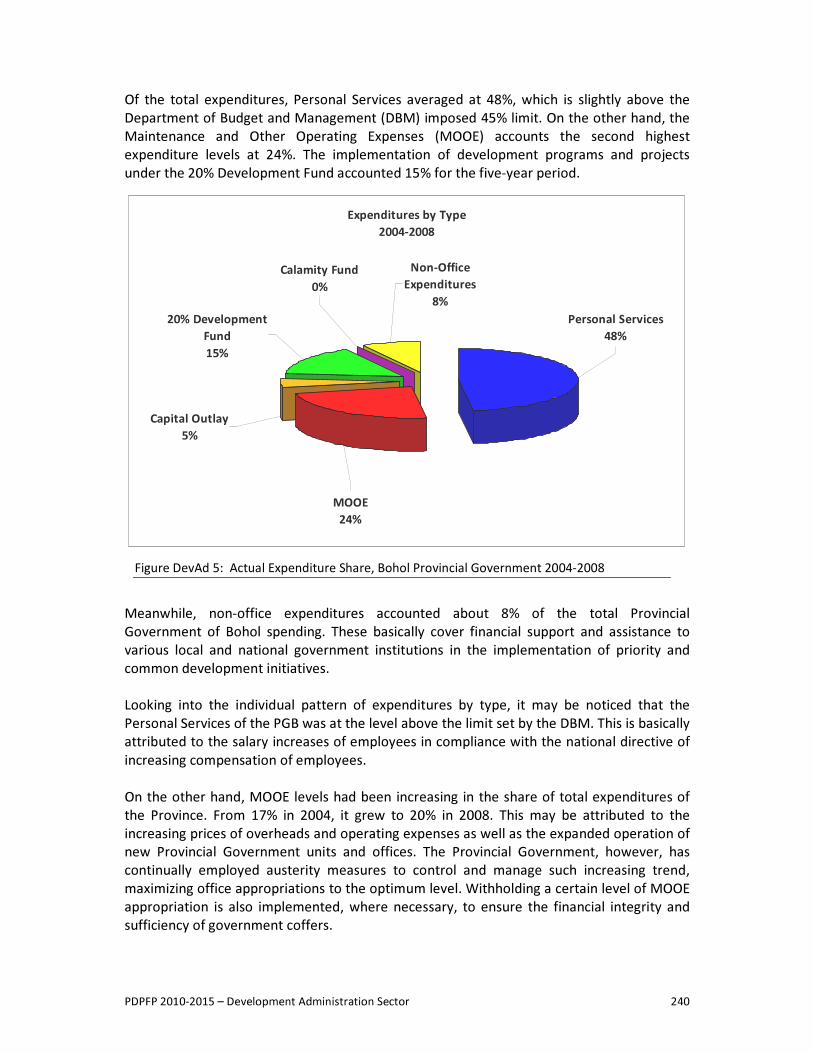
PDPFP 2010-2015 – Development Administration Sector 240
Expenditures by Type 2004-2008
Personal Services48%
MOOE24%
Capital Outlay5%
20% Development Fund15%
Calamity Fund0%
Non-Office Expenditures
8%
Figure DevAd 5: Actual Expenditure Share, Bohol Provincial Government 2004-2008
Of the total expenditures, Personal Services averaged at 48%, which is slightly above the Department of Budget and Management (DBM) imposed 45% limit. On the other hand, the Maintenance and Other Operating Expenses (MOOE) accounts the second highest expenditure levels at 24%. The implementation of development programs and projects under the 20% Development Fund accounted 15% for the five-year period.
Meanwhile, non-office expenditures accounted about 8% of the total Provincial Government of Bohol spending. These basically cover financial support and assistance to various local and national government institutions in the implementation of priority and common development initiatives. Looking into the individual pattern of expenditures by type, it may be noticed that the Personal Services of the PGB was at the level above the limit set by the DBM. This is basically attributed to the salary increases of employees in compliance with the national directive of increasing compensation of employees. On the other hand, MOOE levels had been increasing in the share of total expenditures of the Province. From 17% in 2004, it grew to 20% in 2008. This may be attributed to the increasing prices of overheads and operating expenses as well as the expanded operation of new Provincial Government units and offices. The Provincial Government, however, has continually employed austerity measures to control and manage such increasing trend, maximizing office appropriations to the optimum level. Withholding a certain level of MOOE appropriation is also implemented, where necessary, to ensure the financial integrity and sufficiency of government coffers.
PDPFP 2010-2015 – Development Administration Sector 241
With the general intention and goal of improving government facilities and equipment, the Provincial Government spends an average of 5% of its total expenditures for capital outlay for the period 2004-2008. On an annual basis, the Capital Outlay, however, shows a generally declining trend, from 12% in 2004 moving down to 2% in 2007 and slightly increasing to 4% in 2008. This downward trend is attributed to the periodic but sustained upgrading of equipment and facilities of provincial government offices. Considering the limitation of financial resources, capital outlay requirements of offices have been addressed on a staggered basis. This strategy has been seen to be effective, allowing offices to prioritize their capital expenditures. Looking into the 20% Development Fund expenditures, it can be observed that levels have stayed within 14 to 18% share of the total Provincial Government spending. Its trend is somehow erratic with intermittent upwards and downward trend within the 5 year period. Furthermore, considering the 14 to 18% share in total expenditures, it would show that the development fund has not been fully utilized for the implementation of programs and projects. It can be observed that some projects remained continuing for two years, thus not fully using up the appropriation for the current year. On the other hand, non-office expenditures have been increasing its share over the last 5-year period from 6% in 2004 moving up by 9% in 2008. Non-office expenses cover all other expenditures such as calamity fund, financial aids to national agencies and bureaus, leagues and federations and other activities of the provincial government. Considering the expenditure trends and the level of financial resources available, it is necessary to set priorities and policies that would ensure maximization and value for money for every government spending. The Provincial Government is moving towards this direction with the re-institutionalization of its Monitoring and Evaluation Systems and focusing more on outcomes and impacts of government operations and projects. Income: Comparing the actual revenue and financial resources and its actual expenditures, the Provincial Government of Bohol has gained net surplus for the past 5 years. The surplus, however, covers continuing appropriations, especially for development projects that normally cut across multiple years of implementation. The table below shows the actual revenues, actual/earmarked expenditures and surplus of the Provincial Government. Table DevAd3: Actual Revenues, Expenditures and Surplus, Bohol Provincial Government,
2004-2008 (in Million Pesos) Year Actual Revenues Actual Expenditures Surplus 2004 645.453 632.346 13.086 2005 684.551 564.611 119.939 2006 779.227 655.781 123.445 2007 794.370 677.328 117.042 2008 1,090.179 * 738.803 351.379
* Includes borrowings Source: Provincial Budget Office
PDPFP 2010-2015 – Development Administration Sector 242
It is stressed that the expenditure figures include earmarked allocations for obligations that are incurred during the current year. With the level of unutilized resources, it would be necessary to come up with effective expenditure program that would fully utilize resources. Furthermore, the Provincial Government can also place its free resources to long-term and high-earning investments to maximize return opportunities. Provincial Government’s Economic Enterprises The Provincial Government is operating a number of economic enterprises that provide revenue flows to its coffers. Taking advantage of its facilities and real properties, the Provincial Government has been raising revenues from the operation of the Provincial Capitol Commercial Spaces, the Bohol Cultural Center and Sports Complex and other sports center. The Province also shares in the revenues derived from the operation of the Chocolate Hills Complex in partnership with the LGU of Carmen. Rentals from its heavy equipment are also being collected from LGUs and private entities that use these equipments for road development projects. Furthermore, operations of the 10 devolved hospitals also provided revenue flows to the Province. The government, however, still has high potential to develop and operate other income-generating initiatives with its available real properties, facilities and human resources. It is in this context that there is a need to establish a stand-alone office within the Provincial Government that will focus on studying the development, management and operation of viable economic enterprises. This is necessary to ensure the eventual attainment of the goal of the Provincial Government to raise the level of internally-generated revenues and reduce its IRA-dependency. Provincial and Municipal Income Classification Bohol Province maintains its first class status in terms of income classification, with its level of revenues both from external and internal sources. On the other hand, City/ Municipal Government have shown improvements in their income classes. Referring to the following Table DevAd4, in 2005, there were 19 municipalities, representing 40% of the total number of municipalities that were classified as 5th class municipalities. This significantly improved in 2008 wherein there were only 12 municipalities or 25% that remained at the said income class. 7 of the municipalities have improved and risen to the higher 4th income classification. Related to this, there were 22 4th class municipalities in year 2005. This also improved to 24 owing to the 7 municipalities that improved from the 5th class as well as the further improvement of 5 municipalities that moved to the higher 3rd class level.
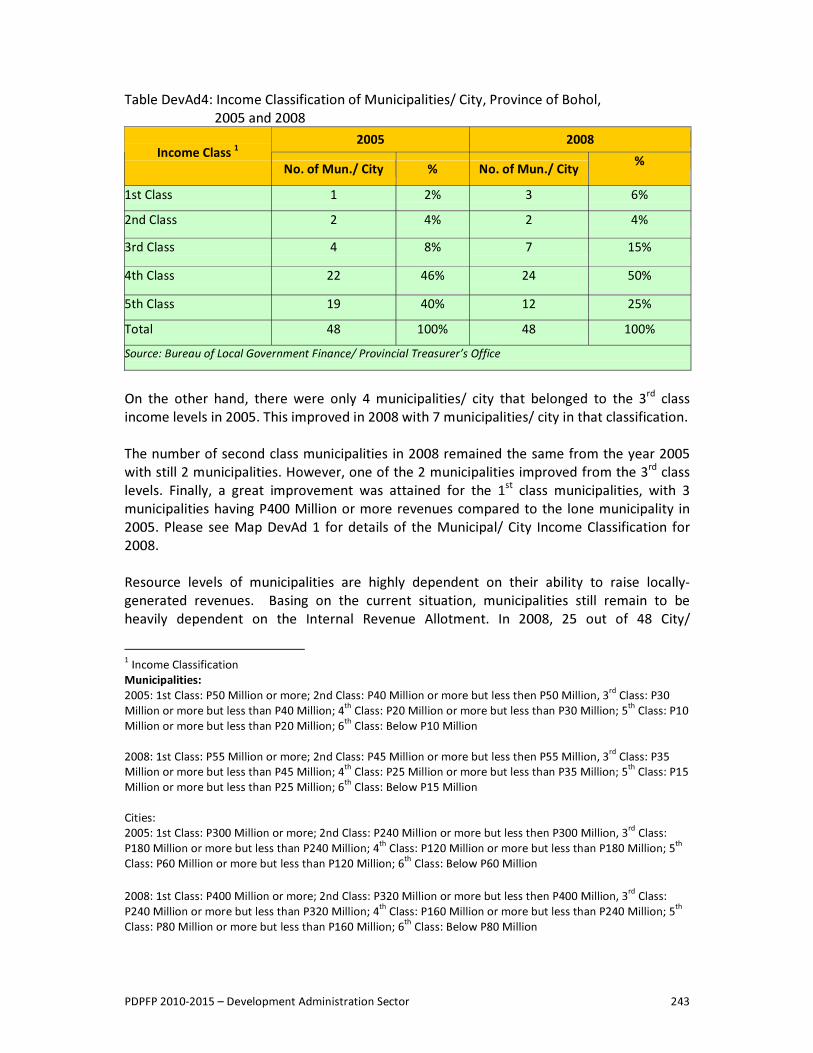
PDPFP 2010-2015 – Development Administration Sector 243
Table DevAd4: Income Classification of Municipalities/ City, Province of Bohol, 2005 and 2008
2005 2008 Income Class 1
No. of Mun./ City % No. of Mun./ City %
1st Class 1 2% 3 6% 2nd Class 2 4% 2 4% 3rd Class 4 8% 7 15% 4th Class 22 46% 24 50% 5th Class 19 40% 12 25% Total 48 100% 48 100% Source: Bureau of Local Government Finance/ Provincial Treasurer’s Office On the other hand, there were only 4 municipalities/ city that belonged to the 3rd class income levels in 2005. This improved in 2008 with 7 municipalities/ city in that classification. The number of second class municipalities in 2008 remained the same from the year 2005 with still 2 municipalities. However, one of the 2 municipalities improved from the 3rd class levels. Finally, a great improvement was attained for the 1st class municipalities, with 3 municipalities having P400 Million or more revenues compared to the lone municipality in 2005. Please see Map DevAd 1 for details of the Municipal/ City Income Classification for 2008. Resource levels of municipalities are highly dependent on their ability to raise locally-generated revenues. Basing on the current situation, municipalities still remain to be heavily dependent on the Internal Revenue Allotment. In 2008, 25 out of 48 City/ 1 Income Classification Municipalities: 2005: 1st Class: P50 Million or more; 2nd Class: P40 Million or more but less then P50 Million, 3rd Class: P30 Million or more but less than P40 Million; 4th Class: P20 Million or more but less than P30 Million; 5th Class: P10 Million or more but less than P20 Million; 6th Class: Below P10 Million 2008: 1st Class: P55 Million or more; 2nd Class: P45 Million or more but less then P55 Million, 3rd Class: P35 Million or more but less than P45 Million; 4th Class: P25 Million or more but less than P35 Million; 5th Class: P15 Million or more but less than P25 Million; 6th Class: Below P15 Million Cities: 2005: 1st Class: P300 Million or more; 2nd Class: P240 Million or more but less then P300 Million, 3rd Class: P180 Million or more but less than P240 Million; 4th Class: P120 Million or more but less than P180 Million; 5th Class: P60 Million or more but less than P120 Million; 6th Class: Below P60 Million 2008: 1st Class: P400 Million or more; 2nd Class: P320 Million or more but less then P400 Million, 3rd Class: P240 Million or more but less than P320 Million; 4th Class: P160 Million or more but less than P240 Million; 5th Class: P80 Million or more but less than P160 Million; 6th Class: Below P80 Million
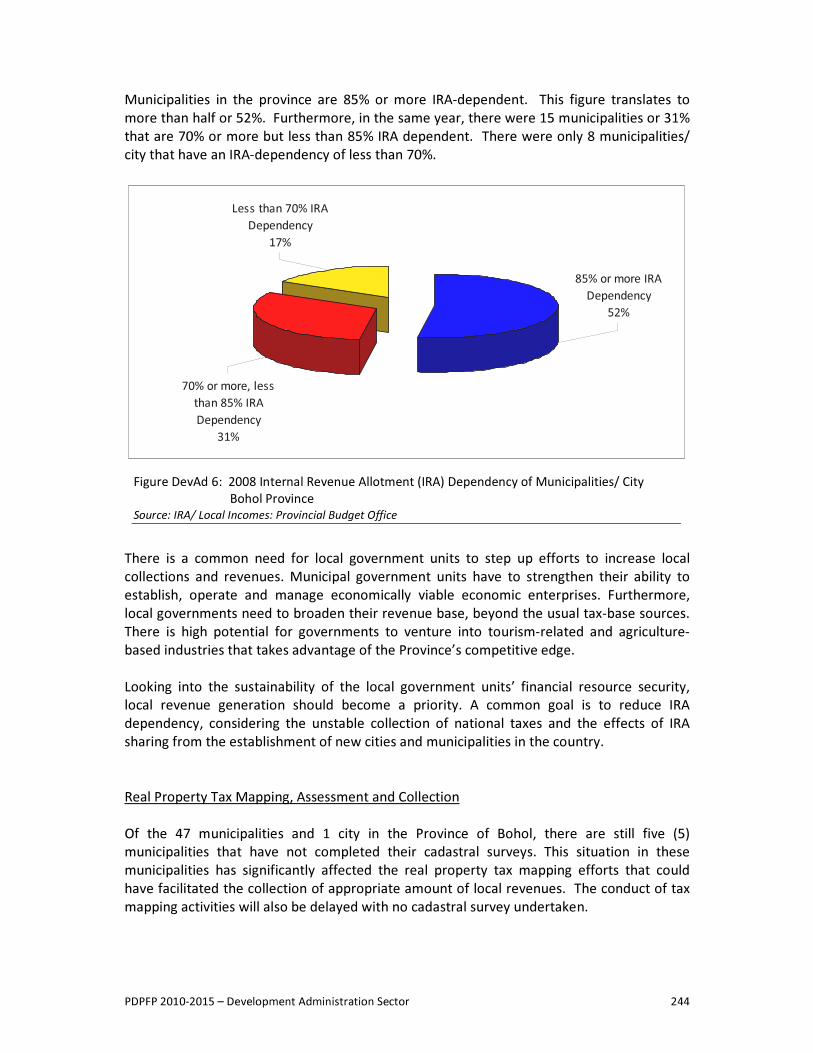
PDPFP 2010-2015 – Development Administration Sector 244
85% or more IRA Dependency
52%
70% or more, less than 85% IRA Dependency
31%
Less than 70% IRA Dependency
17%
Figure DevAd 6: 2008 Internal Revenue Allotment (IRA) Dependency of Municipalities/ City Bohol Province Source: IRA/ Local Incomes: Provincial Budget Office
Municipalities in the province are 85% or more IRA-dependent. This figure translates to more than half or 52%. Furthermore, in the same year, there were 15 municipalities or 31% that are 70% or more but less than 85% IRA dependent. There were only 8 municipalities/ city that have an IRA-dependency of less than 70%.
There is a common need for local government units to step up efforts to increase local collections and revenues. Municipal government units have to strengthen their ability to establish, operate and manage economically viable economic enterprises. Furthermore, local governments need to broaden their revenue base, beyond the usual tax-base sources. There is high potential for governments to venture into tourism-related and agriculture-based industries that takes advantage of the Province’s competitive edge. Looking into the sustainability of the local government units’ financial resource security, local revenue generation should become a priority. A common goal is to reduce IRA dependency, considering the unstable collection of national taxes and the effects of IRA sharing from the establishment of new cities and municipalities in the country. Real Property Tax Mapping, Assessment and Collection Of the 47 municipalities and 1 city in the Province of Bohol, there are still five (5) municipalities that have not completed their cadastral surveys. This situation in these municipalities has significantly affected the real property tax mapping efforts that could have facilitated the collection of appropriate amount of local revenues. The conduct of tax mapping activities will also be delayed with no cadastral survey undertaken.
PDPFP 2010-2015 – Development Administration Sector 245
On the other hand, there are 7 municipalities that have not yet completed their tax mapping. This has led to non-documentation and non-appraisal of parcels of land for tax assessment and collection purposes. Planning and Budgeting Linkages Crucial to the Provincial Government’s financial resource prioritization and utilization are its planning and budgeting systems. Plans are guided by the development agenda set for a particular planning period. From 2004-2009, Bohol has been using its Medium–Term Development Plan (MTDP) as the beacon for economic growth and poverty reduction. Annual plans of various offices/ units are culled out from the MTDP and are often influenced by the priorities set by the provincial leadership based on current opportunities and problems of the province. The plans are operationalized through proper procedures that link the planning and budgeting process streams. Through the implementation of the Joint Memorandum Circular No. 1 - 2007 of the Department of Budget and Management, Department of the Interior and Local Government, National Economic and Development Authority and the Department of Finance, the Bohol Provincial Government has continuously worked to improve its planning, budgeting and expenditure management through harmonization and synchronization of flows and schedules. The Provincial Development Council has been reconstituted, development agenda were set, planning – budgeting timetables were established, and the participation of the Local Finance Committee (LFC) in the review and prioritization of development programs, projects and activities has been strengthened. While the goal of effectively linking office plans to budget remains to be a challenge, the Province has made efforts to achieve this end through schedule synchronization in the preparation/ prioritization of Annual Investment Plans, Budgets and the Work, Financial and Implementation Plans of Offices/ Units. Financial Control and Management and Accounting System It has been an effort of the Provincial Government to improve its financial management systems through the use of Information-Technology-based processes. Consistent with the national directive, the Province is already implementing the Electronic-New Government Accounting System (E-NGAS) which, if fully functional, will facilitate the proper recording, updating and generation of financial reports. The E-NGAS is also expected to improve the recording of financial transactions related to the maintenance of properties and facilities of the Provincial Government. Necessary to this endeavor, however, is the augmentation of human resources for the Financial Offices who are technically capable to operate and run the systems. Future outlook of the E-NGAS implementation is the interfacing of financial data from the treasury, budget, accounting and the property management functions. Separate initiatives that can run parallel with the system are the Financial Transaction Tracking System (FITTSYS), Real Property tax Information System, Computerized Billing System and the Electronic Tax Revenue Assessment and Collection System (E-TRACS).
PDPFP 2010-2015 – Development Administration Sector 246
On the otherhand, the auditing system is currently operating under the generally accepted auditing procedures and ensures the appropriateness and propriety of all financial transactions. To enhance the system, initiatives are currently undertaken to set common and uniform auditing procedures and requirements for each financial transactions. In this manner, audit processing is facilitated for all offices concerned. In related matter, the Local Finance Committee (LFC) has been actively operating to manage the financial operation of the Provincial Government and tackle/resolve issues with financial concern. With the expanded membership of the LFC, its effectiveness has been enhanced to encompass real property assessment, human resource development and legal parameters of the finance sector. ISSUES AND CONCERNS OF THE SUB-SECTOR
� IRA-Dependent Provincial and Municipal Government Operations � Low-level locally-generated taxes and revenues, unrealized income estimates for
local revenues � Limited local revenue –generation activities � Increasing operational expenditures and budgetary requirements of government
offices � Resources and appropriations not maximized nor fully utilized � Local Governments’ economic enterprises not fully maximized nor effectively
operating � Some Provincial Government real property/ fixed assets remained underutilized for
operational, economic and income-generating activities � Lack of appreciation among PGB offices on planning-budgeting linkages and project
prioritization � Most of the municipalities are heavily IRA-dependent and remained as 5th and 4th
class municipalities � Several municipalities have incomplete or unapproved cadastral surveys and tax
maps � Outdated Provincial Medium-term Financial Plan � No dedicated and stand alone office at the PGB to handle the development and
management of PGB economic enterprises � High delinquency rate of real property taxpayers and high cost of real property tax
campaign � Incomplete inventory of government properties, facilities and equipment � Inconsistencies in the application of audit and internal control systems � Lack of coordination between offices, LGUs and National Government Agencies
concerning databases, documents, public information and policy implementation � Limited human resource technical capacities and competencies � Unmet building, office space, facilities and equipment requirements for the public
finance sector � Delayed full implementation of Electronic New Government Accounting System (E-
NGAS), and interfacing of the Real Property Tax Information System – Billing Collection System
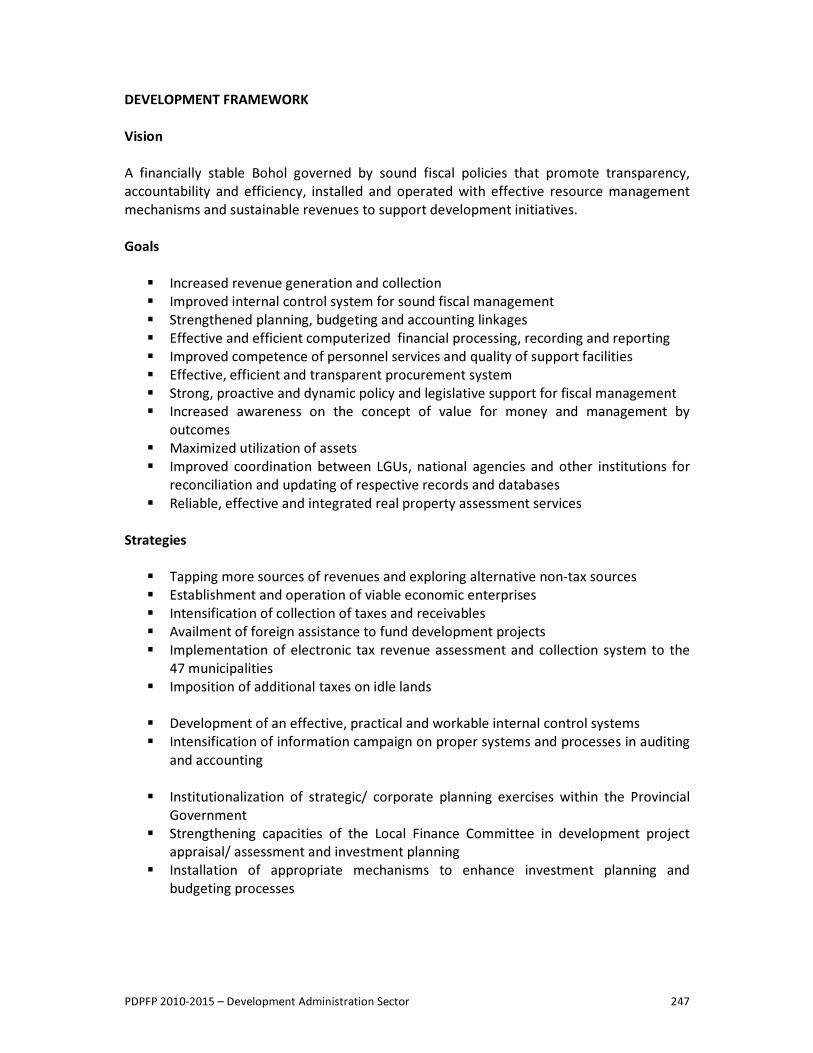
PDPFP 2010-2015 – Development Administration Sector 247
DEVELOPMENT FRAMEWORK Vision A financially stable Bohol governed by sound fiscal policies that promote transparency, accountability and efficiency, installed and operated with effective resource management mechanisms and sustainable revenues to support development initiatives. Goals
� Increased revenue generation and collection � Improved internal control system for sound fiscal management � Strengthened planning, budgeting and accounting linkages � Effective and efficient computerized financial processing, recording and reporting � Improved competence of personnel services and quality of support facilities � Effective, efficient and transparent procurement system � Strong, proactive and dynamic policy and legislative support for fiscal management � Increased awareness on the concept of value for money and management by
outcomes � Maximized utilization of assets � Improved coordination between LGUs, national agencies and other institutions for
reconciliation and updating of respective records and databases � Reliable, effective and integrated real property assessment services
Strategies
� Tapping more sources of revenues and exploring alternative non-tax sources � Establishment and operation of viable economic enterprises � Intensification of collection of taxes and receivables � Availment of foreign assistance to fund development projects � Implementation of electronic tax revenue assessment and collection system to the
47 municipalities � Imposition of additional taxes on idle lands
� Development of an effective, practical and workable internal control systems � Intensification of information campaign on proper systems and processes in auditing
and accounting
� Institutionalization of strategic/ corporate planning exercises within the Provincial Government
� Strengthening capacities of the Local Finance Committee in development project appraisal/ assessment and investment planning
� Installation of appropriate mechanisms to enhance investment planning and budgeting processes
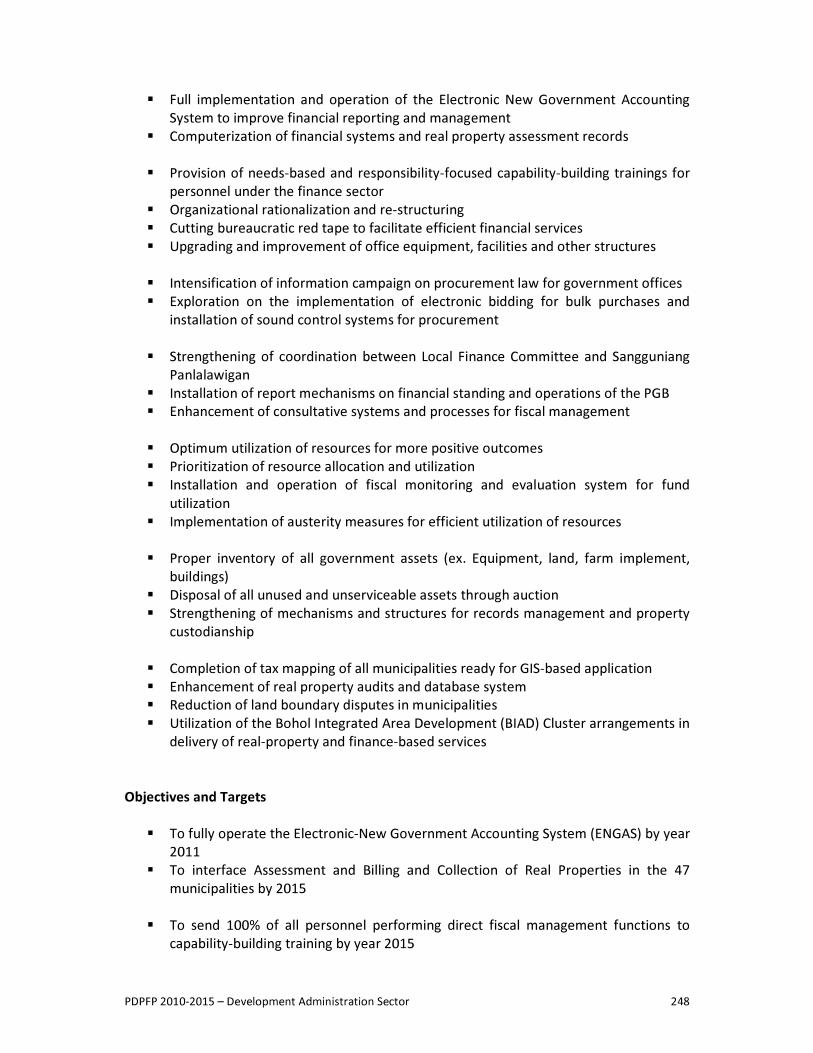
PDPFP 2010-2015 – Development Administration Sector 248
� Full implementation and operation of the Electronic New Government Accounting System to improve financial reporting and management
� Computerization of financial systems and real property assessment records
� Provision of needs-based and responsibility-focused capability-building trainings for personnel under the finance sector
� Organizational rationalization and re-structuring � Cutting bureaucratic red tape to facilitate efficient financial services � Upgrading and improvement of office equipment, facilities and other structures
� Intensification of information campaign on procurement law for government offices � Exploration on the implementation of electronic bidding for bulk purchases and
installation of sound control systems for procurement
� Strengthening of coordination between Local Finance Committee and Sangguniang Panlalawigan
� Installation of report mechanisms on financial standing and operations of the PGB � Enhancement of consultative systems and processes for fiscal management
� Optimum utilization of resources for more positive outcomes � Prioritization of resource allocation and utilization � Installation and operation of fiscal monitoring and evaluation system for fund
utilization � Implementation of austerity measures for efficient utilization of resources
� Proper inventory of all government assets (ex. Equipment, land, farm implement,
buildings) � Disposal of all unused and unserviceable assets through auction � Strengthening of mechanisms and structures for records management and property
custodianship
� Completion of tax mapping of all municipalities ready for GIS-based application � Enhancement of real property audits and database system � Reduction of land boundary disputes in municipalities � Utilization of the Bohol Integrated Area Development (BIAD) Cluster arrangements in
delivery of real-property and finance-based services Objectives and Targets
� To fully operate the Electronic-New Government Accounting System (ENGAS) by year 2011
� To interface Assessment and Billing and Collection of Real Properties in the 47 municipalities by 2015
� To send 100% of all personnel performing direct fiscal management functions to
capability-building training by year 2015
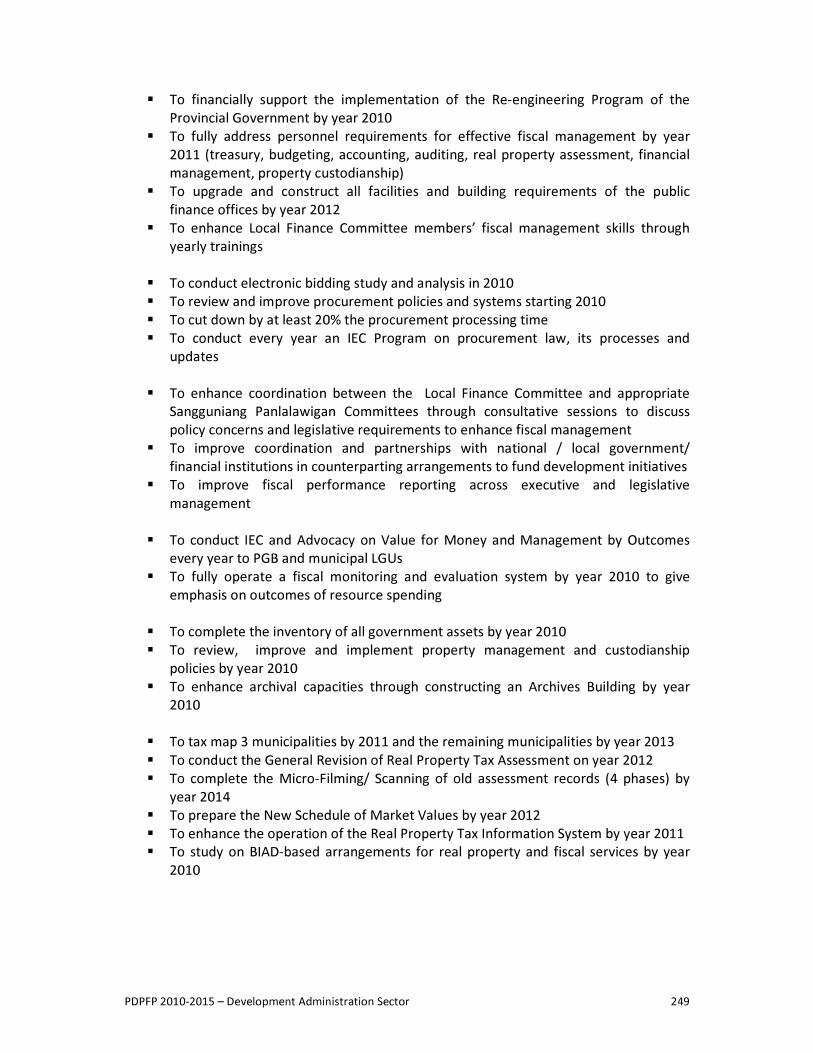
PDPFP 2010-2015 – Development Administration Sector 249
� To financially support the implementation of the Re-engineering Program of the Provincial Government by year 2010
� To fully address personnel requirements for effective fiscal management by year 2011 (treasury, budgeting, accounting, auditing, real property assessment, financial management, property custodianship)
� To upgrade and construct all facilities and building requirements of the public finance offices by year 2012
� To enhance Local Finance Committee members’ fiscal management skills through yearly trainings
� To conduct electronic bidding study and analysis in 2010 � To review and improve procurement policies and systems starting 2010 � To cut down by at least 20% the procurement processing time � To conduct every year an IEC Program on procurement law, its processes and
updates
� To enhance coordination between the Local Finance Committee and appropriate Sangguniang Panlalawigan Committees through consultative sessions to discuss policy concerns and legislative requirements to enhance fiscal management
� To improve coordination and partnerships with national / local government/ financial institutions in counterparting arrangements to fund development initiatives
� To improve fiscal performance reporting across executive and legislative management
� To conduct IEC and Advocacy on Value for Money and Management by Outcomes
every year to PGB and municipal LGUs � To fully operate a fiscal monitoring and evaluation system by year 2010 to give
emphasis on outcomes of resource spending
� To complete the inventory of all government assets by year 2010 � To review, improve and implement property management and custodianship
policies by year 2010 � To enhance archival capacities through constructing an Archives Building by year
2010
� To tax map 3 municipalities by 2011 and the remaining municipalities by year 2013 � To conduct the General Revision of Real Property Tax Assessment on year 2012 � To complete the Micro-Filming/ Scanning of old assessment records (4 phases) by
year 2014 � To prepare the New Schedule of Market Values by year 2012 � To enhance the operation of the Real Property Tax Information System by year 2011 � To study on BIAD-based arrangements for real property and fiscal services by year
2010
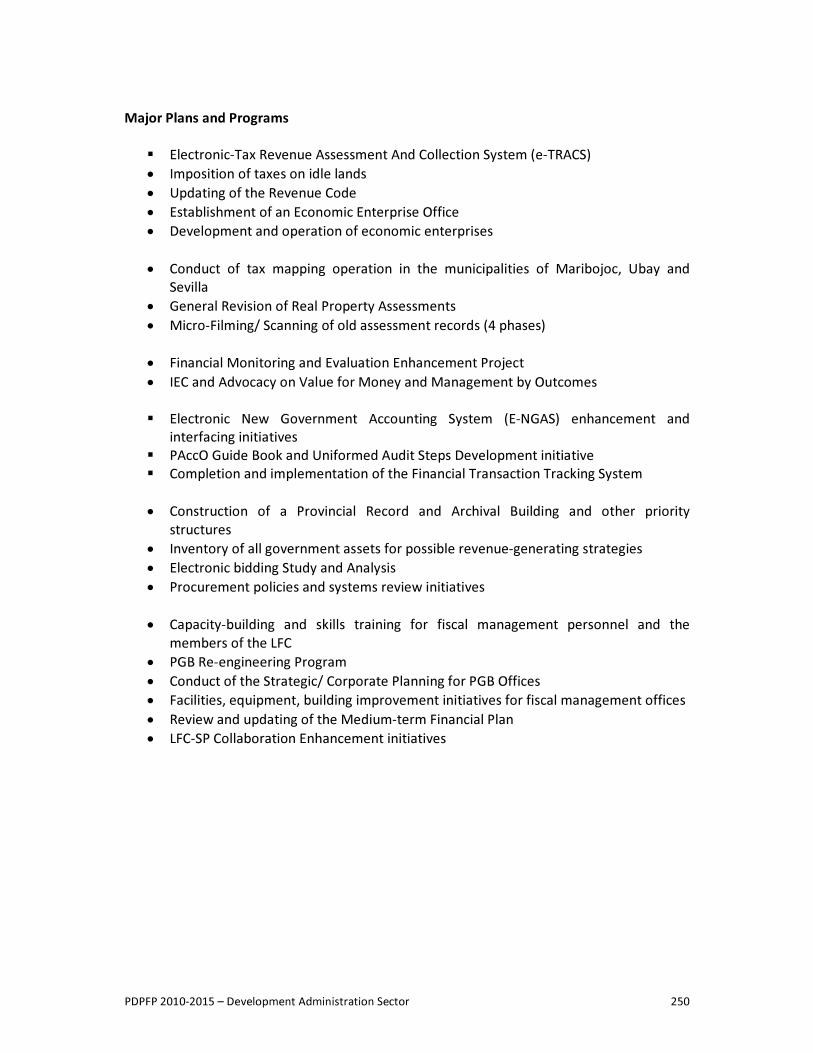
PDPFP 2010-2015 – Development Administration Sector 250
Major Plans and Programs
� Electronic-Tax Revenue Assessment And Collection System (e-TRACS) • Imposition of taxes on idle lands • Updating of the Revenue Code • Establishment of an Economic Enterprise Office • Development and operation of economic enterprises
• Conduct of tax mapping operation in the municipalities of Maribojoc, Ubay and
Sevilla • General Revision of Real Property Assessments • Micro-Filming/ Scanning of old assessment records (4 phases)
• Financial Monitoring and Evaluation Enhancement Project • IEC and Advocacy on Value for Money and Management by Outcomes
� Electronic New Government Accounting System (E-NGAS) enhancement and
interfacing initiatives � PAccO Guide Book and Uniformed Audit Steps Development initiative � Completion and implementation of the Financial Transaction Tracking System
• Construction of a Provincial Record and Archival Building and other priority
structures • Inventory of all government assets for possible revenue-generating strategies • Electronic bidding Study and Analysis • Procurement policies and systems review initiatives
• Capacity-building and skills training for fiscal management personnel and the
members of the LFC • PGB Re-engineering Program • Conduct of the Strategic/ Corporate Planning for PGB Offices • Facilities, equipment, building improvement initiatives for fiscal management offices • Review and updating of the Medium-term Financial Plan • LFC-SP Collaboration Enhancement initiatives
PDPFP 2010-2015 – Development Administration Sector 251
Sector : DEVELOPMENT ADMINISTRATION Sub-Sector : Local Governance The Provincial Government of Bohol (PGB), in the performance of its responsibilities authorized by the Local Government Code of 1991, has continued to perform its functions to promote the general welfare of the people. Through its 15 front line offices, 13 satellite units and 10 hospitals, the PGB provided the overall supervision for the implementation of programs, projects and provision of basic services throughout the province’s 47 municipalities and 1 component city. With the close coordination and collaboration between the executive and legislative branches, the PGB has managed to push through its executive and legislative agenda and development priorities and managed initiatives for agriculture and tourism development, social welfare and health services enhancement, environmental protection and preservation, infrastructure facilities build-up, investment promotion and industrial development. Revenue generation measures and financial management practices are implemented to sufficiently support government operations. Furthermore, the PGB has continued to enhance the organization’s human resources as well as its physical assets and facilities to correspondingly perform and address the growing and multifaceted needs and demands of the Boholano people. Guided by the set Vision, Mission and Goals of Bohol and the Provincial Government organization, which were crafted and adopted in 1998 through months of consultation and collaboration with all sectors of society, the PGB continues to initiate efforts to fully attain its aspiration to become a prime eco-cultural tourism destination and an agro-industrial province. The PGB also works on making its organization as responsive and dynamic as possible to deliver quality and effective services. PGBs Performance on Governance As the PGB manages all its businesses and operations within the province, sustained efforts are made to maintain high levels of participation among all stakeholders, steered by the principles of accountability, transparency and responsiveness. Looking into the Local Governance Performance Management System (LGPMS) Report in 2008, Bohol Province has attained considerably high performance ratings in upholding the appropriate fundamentals of governance. Bohol has been successful in promoting people participation in decision-making, planning, and consultative processes in government. This is through the significant representation of the civil society and the marginalized groups in various special bodies and advisory councils. In 2008, there were about 22 special bodies/ councils that were organized and actively operating in the province. The table below shows the list of these Councils.
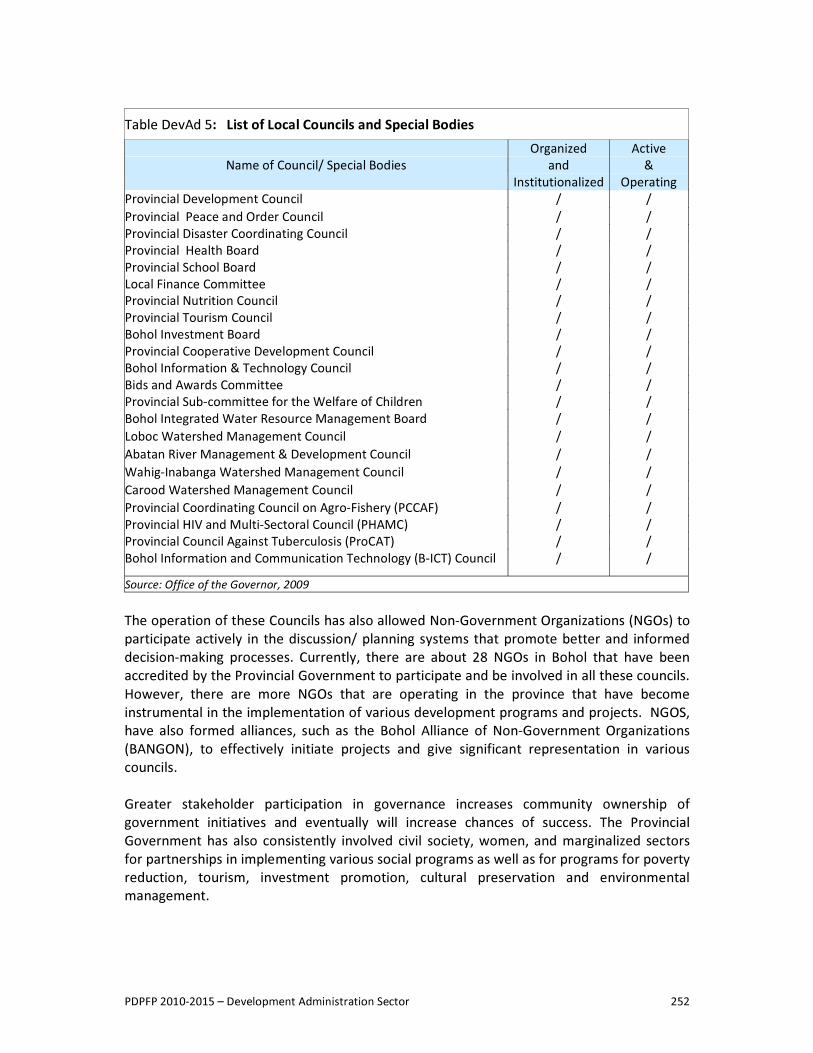
PDPFP 2010-2015 – Development Administration Sector 252
Table DevAd 5: List of Local Councils and Special Bodies
Name of Council/ Special Bodies Organized
and Institutionalized
Active &
Operating Provincial Development Council / / Provincial Peace and Order Council / / Provincial Disaster Coordinating Council / / Provincial Health Board / / Provincial School Board / / Local Finance Committee / / Provincial Nutrition Council / / Provincial Tourism Council / / Bohol Investment Board / / Provincial Cooperative Development Council / / Bohol Information & Technology Council / / Bids and Awards Committee / / Provincial Sub-committee for the Welfare of Children / / Bohol Integrated Water Resource Management Board / / Loboc Watershed Management Council / / Abatan River Management & Development Council / / Wahig-Inabanga Watershed Management Council / / Carood Watershed Management Council / / Provincial Coordinating Council on Agro-Fishery (PCCAF) / / Provincial HIV and Multi-Sectoral Council (PHAMC) / / Provincial Council Against Tuberculosis (ProCAT) / / Bohol Information and Communication Technology (B-ICT) Council / / Source: Office of the Governor, 2009 The operation of these Councils has also allowed Non-Government Organizations (NGOs) to participate actively in the discussion/ planning systems that promote better and informed decision-making processes. Currently, there are about 28 NGOs in Bohol that have been accredited by the Provincial Government to participate and be involved in all these councils. However, there are more NGOs that are operating in the province that have become instrumental in the implementation of various development programs and projects. NGOS, have also formed alliances, such as the Bohol Alliance of Non-Government Organizations (BANGON), to effectively initiate projects and give significant representation in various councils. Greater stakeholder participation in governance increases community ownership of government initiatives and eventually will increase chances of success. The Provincial Government has also consistently involved civil society, women, and marginalized sectors for partnerships in implementing various social programs as well as for programs for poverty reduction, tourism, investment promotion, cultural preservation and environmental management.
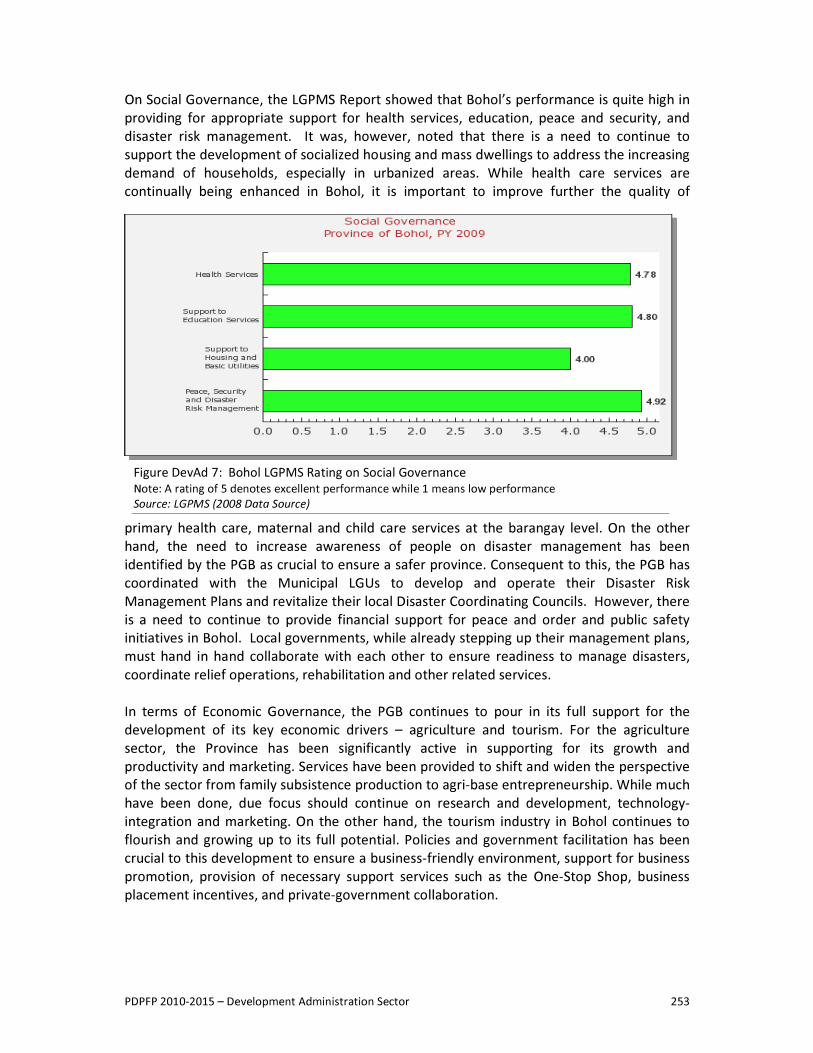
PDPFP 2010-2015 – Development Administration Sector 253
Figure DevAd 7: Bohol LGPMS Rating on Social Governance Note: A rating of 5 denotes excellent performance while 1 means low performance Source: LGPMS (2008 Data Source)
On Social Governance, the LGPMS Report showed that Bohol’s performance is quite high in providing for appropriate support for health services, education, peace and security, and disaster risk management. It was, however, noted that there is a need to continue to support the development of socialized housing and mass dwellings to address the increasing demand of households, especially in urbanized areas. While health care services are continually being enhanced in Bohol, it is important to improve further the quality of
primary health care, maternal and child care services at the barangay level. On the other hand, the need to increase awareness of people on disaster management has been identified by the PGB as crucial to ensure a safer province. Consequent to this, the PGB has coordinated with the Municipal LGUs to develop and operate their Disaster Risk Management Plans and revitalize their local Disaster Coordinating Councils. However, there is a need to continue to provide financial support for peace and order and public safety initiatives in Bohol. Local governments, while already stepping up their management plans, must hand in hand collaborate with each other to ensure readiness to manage disasters, coordinate relief operations, rehabilitation and other related services. In terms of Economic Governance, the PGB continues to pour in its full support for the development of its key economic drivers – agriculture and tourism. For the agriculture sector, the Province has been significantly active in supporting for its growth and productivity and marketing. Services have been provided to shift and widen the perspective of the sector from family subsistence production to agri-base entrepreneurship. While much have been done, due focus should continue on research and development, technology-integration and marketing. On the other hand, the tourism industry in Bohol continues to flourish and growing up to its full potential. Policies and government facilitation has been crucial to this development to ensure a business-friendly environment, support for business promotion, provision of necessary support services such as the One-Stop Shop, business placement incentives, and private-government collaboration.
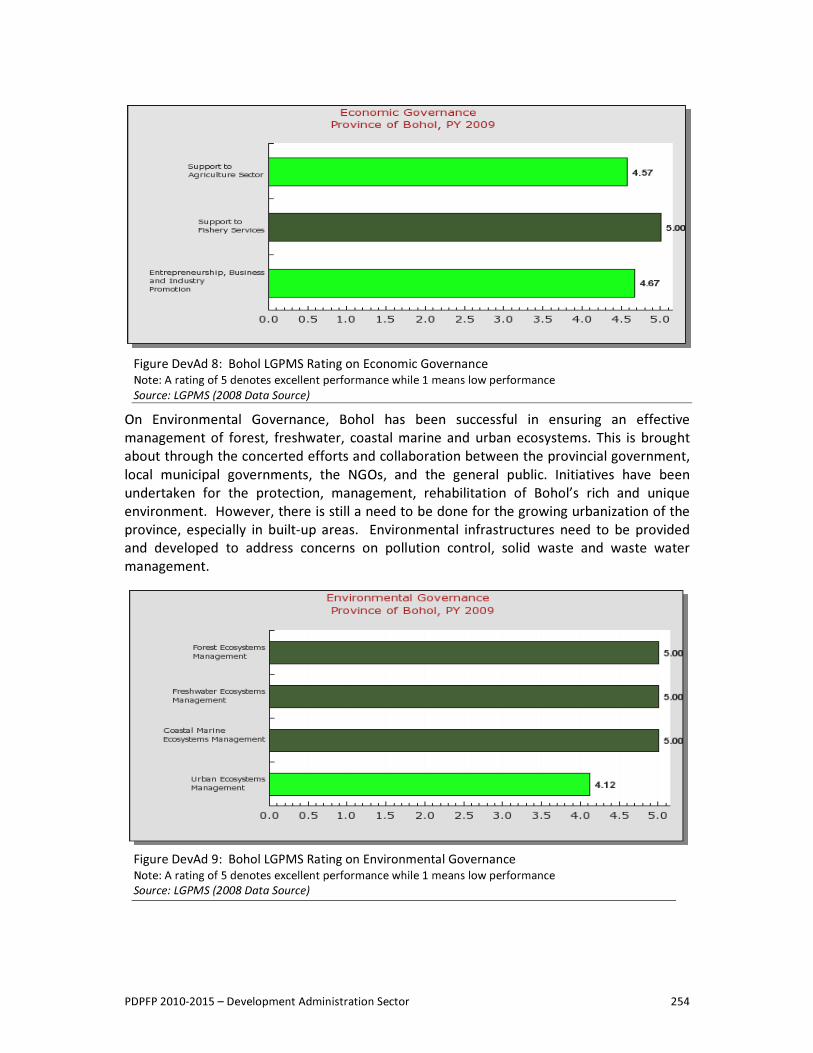
PDPFP 2010-2015 – Development Administration Sector 254
Figure DevAd 8: Bohol LGPMS Rating on Economic Governance Note: A rating of 5 denotes excellent performance while 1 means low performance Source: LGPMS (2008 Data Source) On Environmental Governance, Bohol has been successful in ensuring an effective
management of forest, freshwater, coastal marine and urban ecosystems. This is brought about through the concerted efforts and collaboration between the provincial government, local municipal governments, the NGOs, and the general public. Initiatives have been undertaken for the protection, management, rehabilitation of Bohol’s rich and unique environment. However, there is still a need to be done for the growing urbanization of the province, especially in built-up areas. Environmental infrastructures need to be provided and developed to address concerns on pollution control, solid waste and waste water management.
Figure DevAd 9: Bohol LGPMS Rating on Environmental Governance Note: A rating of 5 denotes excellent performance while 1 means low performance Source: LGPMS (2008 Data Source)
PDPFP 2010-2015 – Development Administration Sector 255
In the area of public finance, the promotion of financial accountability has been pursued by the PGB through the operation of sound financial system and internal controls. Electronic-based systems have been installed in all of the financial offices performing budgeting, accounting and treasury functions. These initiatives can be improved further through the integration of these electronic-based systems for financial information consolidation and effective report generation to facilitate sound decision-making processes and promotion of fiscal transparency. Specific guidelines on financial transaction accounting, internal control and auditing as well as on procurement must continually be observed. Process flows and systems studies shall also be conducted to find ways to enhance and improve the current systems. For policy-making and implementation, the PGB has employed participatory processes to ensure broader discussion on the rationale as well as the foreseen effects of initiatives. Policies should be responsive and aligned with the development fundamental of the province. There is, however, a need for inter-office coordination and stakeholder consultation in the implementation and enforcement of these policies for better and effective participation and support. Coordination is also necessary especially when the implementation of said policies will affect and involve several local governments, agencies and stakeholders. Several noteworthy initiatives and systems have also been implemented in the Provincial Government that contributed to the effective management of its operations. The Management Executive Team (MET), to cite one, was created with the vision of increasing transparency at the top management level, improving inter-office collaboration and policy-decision-making. The MET is also an appropriate body to enhance coordination between the executive and legislative departments of the PGB. It is, however, important that the members of the MET discuss, on regular basis, policy implementation issues and concerns and provide the necessary mitigating strategies to improve PGB operations. Policy and systems review also needs to be undertaken by the team. In accordance with the Anti-Red Tape Act of 2007, the PGB has also initiated the crafting of the Citizen’s Charter that officially provides the general public the service standards of all frontline services of the Provincial Government. The Charter, which identifies the step-by-step procedures of availing specific services, is a management tool geared towards promoting transparency and preventing graft and corruption in government offices. Each PGB Office/ Unit has prepared their individual charters and has posted the same in conspicuous area of their office for the guidance of the public. This strategy will also help in encouraging greater efficiency among government workers. Local governments throughout the province are also undertaking this initiative, appreciating the benefits of such charter for its constituents. Correspondingly, the evaluation of performance of PGB offices and employees is enhanced through the introduction of the new Office Performance Evaluation System (OPES) that provides a more logical and clearer evaluation tools to fully account for employee and office accomplishments. Standard performance ratings were developed and approved for each type of work or output for uniform implementation and consideration across all PGB offices
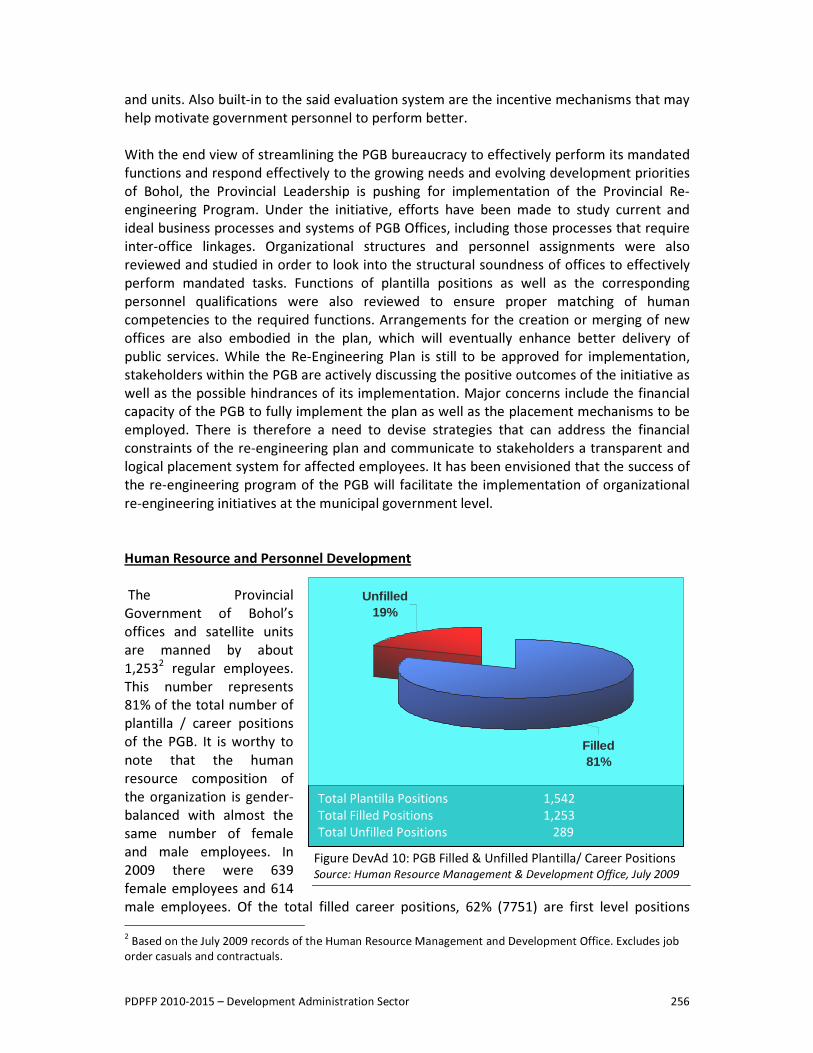
PDPFP 2010-2015 – Development Administration Sector 256
Total Plantilla Positions 1,542 Total Filled Positions 1,253 Total Unfilled Positions 289
Figure DevAd 10: PGB Filled & Unfilled Plantilla/ Career Positions Source: Human Resource Management & Development Office, July 2009
Filled81%
Unfilled19%
and units. Also built-in to the said evaluation system are the incentive mechanisms that may help motivate government personnel to perform better. With the end view of streamlining the PGB bureaucracy to effectively perform its mandated functions and respond effectively to the growing needs and evolving development priorities of Bohol, the Provincial Leadership is pushing for implementation of the Provincial Re-engineering Program. Under the initiative, efforts have been made to study current and ideal business processes and systems of PGB Offices, including those processes that require inter-office linkages. Organizational structures and personnel assignments were also reviewed and studied in order to look into the structural soundness of offices to effectively perform mandated tasks. Functions of plantilla positions as well as the corresponding personnel qualifications were also reviewed to ensure proper matching of human competencies to the required functions. Arrangements for the creation or merging of new offices are also embodied in the plan, which will eventually enhance better delivery of public services. While the Re-Engineering Plan is still to be approved for implementation, stakeholders within the PGB are actively discussing the positive outcomes of the initiative as well as the possible hindrances of its implementation. Major concerns include the financial capacity of the PGB to fully implement the plan as well as the placement mechanisms to be employed. There is therefore a need to devise strategies that can address the financial constraints of the re-engineering plan and communicate to stakeholders a transparent and logical placement system for affected employees. It has been envisioned that the success of the re-engineering program of the PGB will facilitate the implementation of organizational re-engineering initiatives at the municipal government level. Human Resource and Personnel Development The Provincial Government of Bohol’s offices and satellite units are manned by about 1,2532 regular employees. This number represents 81% of the total number of plantilla / career positions of the PGB. It is worthy to note that the human resource composition of the organization is gender-balanced with almost the same number of female and male employees. In 2009 there were 639 female employees and 614 male employees. Of the total filled career positions, 62% (7751) are first level positions 2 Based on the July 2009 records of the Human Resource Management and Development Office. Excludes job order casuals and contractuals.
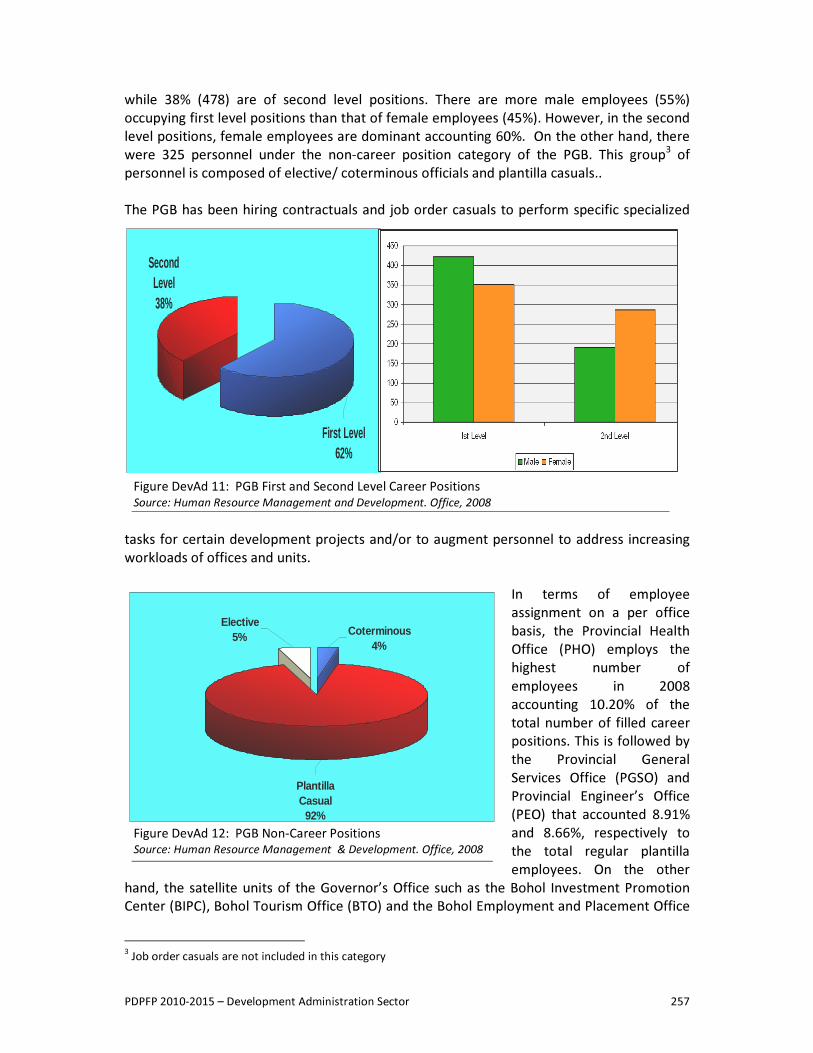
PDPFP 2010-2015 – Development Administration Sector 257
while 38% (478) are of second level positions. There are more male employees (55%) occupying first level positions than that of female employees (45%). However, in the second level positions, female employees are dominant accounting 60%. On the other hand, there were 325 personnel under the non-career position category of the PGB. This group3 of personnel is composed of elective/ coterminous officials and plantilla casuals.. The PGB has been hiring contractuals and job order casuals to perform specific specialized
tasks for certain development projects and/or to augment personnel to address increasing workloads of offices and units.
In terms of employee assignment on a per office basis, the Provincial Health Office (PHO) employs the highest number of employees in 2008 accounting 10.20% of the total number of filled career positions. This is followed by the Provincial General Services Office (PGSO) and Provincial Engineer’s Office (PEO) that accounted 8.91% and 8.66%, respectively to the total regular plantilla employees. On the other
hand, the satellite units of the Governor’s Office such as the Bohol Investment Promotion Center (BIPC), Bohol Tourism Office (BTO) and the Bohol Employment and Placement Office 3 Job order casuals are not included in this category
Second Level38%
First Level62%
Figure DevAd 11: PGB First and Second Level Career Positions Source: Human Resource Management and Development. Office, 2008
Figure DevAd 12: PGB Non-Career Positions Source: Human Resource Management & Development. Office, 2008
Coterminous4%
Plantilla Casual
92%
Elective5%
PDPFP 2010-2015 – Development Administration Sector 258
(BEPO) employed the least number of regular career personnel, each accounting only less than 0.50% of all regular personnel. With these characteristics on employee deployment and assignment, it is necessary to review the appropriateness on the number of these personnel as well as their capacities to effectively perform the mandated functions of each office or unit. The current Re-engineering Program of the PGB directly addresses these concerns as it looks into the required personnel complement of each office and the most appropriate structures that will best suit the human resource requirements. The Re-engineering Plan also takes into consideration the relationship and collaborative linkages of each office/ unit to attain the development agenda of the Province. Personnel capacity-building efforts of the PGB are continuing with the goal of enhancing employee competencies and skills to effectively provide government services. Through the Human Resource Management and Development Office (HRMDO), initiatives have been undertaken to assess the training needs of employees and mechanisms have been developed to properly address these needs with due consideration to the financial and technical resources of the PGB. Training programs, through the Training and Development Management System, have been implemented by each office as well as those sponsored by governments and funding agencies. Most notable is the assistance from the Philippines-Australia Human Resource Development Facility (PAHRDF) that provides short and long-term trainings and scholarships to qualified PGB employees. A system of monitoring these trainings is also installed and operated, requiring each beneficiary employee to implement their re-entry plans. Other forms of capacity-building strategies such as informal coaching and mentoring are also employed by the PGB. Furthermore, to maximize and tap internal human resources, a pool of PGB trainors has been formed to provide training programs to employees for a particular field of expertise. To promote better welfare and help employees go through the prevailing economic crisis, the Provincial Government has implemented the salary standardization. Through the years, regular salary increases have been given to employees in accordance with appropriate national laws. Step increments on salaries were also afforded to employees based on their years of service. Furthermore, the employees’ awards and incentives mechanism is already installed, although its full implementation is still to be pushed by the provincial leadership. The introduction of Information-Technology (IT) – based systems to promote better employee services and support mechanisms are also being undertaken by the PGB. Through the Bohol IT Group, the electronic logging system to record an employee’s daily time of work has been installed and operated. This will enable the system to produce electronically-generated daily time records. Also, the IT team has developed the Online Leave Administration System, which is envisioned to enhance and hasten the leave application and approval processes. Another system introduced is the Centralized Payroll System that is expected to speed-up the payroll preparation process. While all of these new systems are already in placed and are gradually implemented, continuing education and information campaign efforts should be undertaken. Assessment and consultation should also be made as feedback mechanisms to ensure the effectiveness and practicality of these systems and how well they are received by all PGB personnel.
PDPFP 2010-2015 – Development Administration Sector 259
On the otherhand, the role of the employees’ organization – Bohol Provincial Employees League (BOPEL) has become evidently important in ensuring that employees’ welfare are promoted and protected. The League has been active and is representing the employees’ interests in several management committees and bodies within the Provincial Government. However, further pro-active participation of the league is necessary to enhance employee productivity and to promote human resource efficiency. The need to lobby for the provision of other employee welfare facilities and services in the organization is also recognized as important. Looking into Bohol’s performance on Human Resource Management and Development, the Province has earned high ratings under the LGPMS parameters. However, further enhancement can be made in the areas of recruitment/ selection, recognition of employees’ performance, promotion of professional growth and operation of personnel grievance system. Local Legislation The Provincial Government of Bohol, through the Sangguniang Panlalawigan (SP), has been seen to be pro-active in enacting relevant legislative measures to respond to various socio-economic issues and opportunities in Bohol. Though the years, the august body has passed relevant resolutions and ordinances, to include the Environment Code, Tourism Code, Gender and Development Code and Bohol Arts Cultural Heritage Code. Essential to the effective local legislation is the harmonization of the executive and legislative agenda which will ensure the execution, implementation or enforcement of applicable local laws and directives. With the multiplicity of local special bodies in Bohol, there is a need for continuing collaboration and coordination with the Sangguniang Panlalawigan, especially on matters relating to social health and welfare, public finance, peace and order, tourism and agriculture development, environmental protection and infrastructure development. Consultation processes should be heightened with the various stakeholders of society, which is essential in crafting legislative agenda. The use of information technology is also being employed by the SP with the development and operation of their Legislative Tracking System (LTS). The system is being used as an effective tool for data banking, monitoring, tracking and retrieval of all SP resolutions and ordinances. However, there is still a need to improve the functionality of the LTS, allowing it to be more accessible by users. Correspondingly, coordination with the different Sangguniang Bayans should also be improved especially on referrals of ordinances and other legislative requests. This will ensure the harmonization and synchronization of legislative measures local governments. On the otherhand, it is essential to continually uplift the human resource capacities of the legislative branch in order to enact quality legislation. This may be done through competency-building trainings, utilization of proper legislative tools and exposures on agenda development.
PDPFP 2010-2015 – Development Administration Sector 260
Planning Mechanisms and Strategies The planning system and processes of the PGB are operating and following appropriate national directives and provisions of the Local Government Code. Current planning timeframes are derived from the Joint Memorandum Circular No. 1 – 2007 that sets the required schedules and processes to harmonize local plans to regional/ national plans as well as synchronize planning initiatives with the local budgeting systems. Collaborative efforts of all offices, spearheaded by the Planning and Budget departments, have improved the planning and budgeting cycles of the PGB, leading to the on time preparation and approval of Annual Plans and Budgets. The PGB has set its medium-term plans for the year 2004-2009 through the crafting and operation of the Bohol Medium-Term Development Plan (MTDP). This plan has become one of the bases for the preparation of each office’s annual plans and operating budgets. Development thrusts of Bohol has always gone through and approved by the Provincial Development Council (PDC) and the Sangguniang Panlalawigan. These avenues for discussions have allowed multi-stakeholder and gender-sensitive participation in the planning and decision-making processes. In recent years, Bohol’s development path has been set through its “10 in 2010” Development Agenda, which not only guided the priorities of the PGB but also the other local governments of the province. In the said agenda, priorities are set for poverty reduction, economic growth, tourism and agriculture development, environmental sustainability, social welfare development and good governance. As a means of promoting transparency and creating an environment with well-informed constituents, these development agenda are disseminated to the general stakeholders and partners for their information and support. These plans have become a beacon for success for the Provincial Government and correspondingly as guides for the Boholano people to determine whether the government has accomplished what it has vowed to performed. On the operational point of view, offices and units of the PGB has crafted and implemented their own Strategic Plans to plot their medium-term strategies. However, on the organizational perspective, the Provincial Government has yet to develop its corporate strategic plan to ensure that the organization is moving towards the same direction and those activities/ projects of component offices/ units are complementing and supporting each other. As a strategy to encourage inter-LGU collaboration and alliances, the PGB is advocating and pushing for the Integrated Area Development (IAD) approach to spur economic growth and address development concerns of the province. The Bohol Integrated Area Development (BIAD) clusters have been formed to encourage local governments to work together in pursuing their common development priorities, thereby promoting cost-counterparting arrangements and responsibility-sharing in the implementation of development interventions such as common service facilities. The IAD strategy can therefore be used to strengthen less progressive local governments as they collaborate with other more progressive municipalities. Along this line, the cluster itself can develop its own growth centers and urban areas that all the member municipalities can collectively benefit. While some level of initiatives have been made towards this trend, it is important to fully institutionalize and formalize the alliances between the LGUs. This will ensure a more
PDPFP 2010-2015 – Development Administration Sector 261
sustainable and stable partnership among governments that goes beyond political administrations. On another aspect of the planning system, the PGB has emphasized the importance of building a reliable and updated database system that allows clients, stakeholders and the general public to access the wide spectrum of Bohol’s socio-economic information, poverty indicators and environmental and physical features. The presence of such database will enhance planning processes, facilitate the crafting of better quality project proposals and improve project evaluation and monitoring. Some of the database systems currently available include the Poverty Database Monitoring System (PDMS), the Natural Resource Database System, Socio-Economic Profile Database System and database on Agriculture and Infrastructure. However, it can be noted that these databases are not yet integrated and not readily accessible. Users also have not fully maximized the use of these databases for research and planning purposes. It is therefore important that an integrated web-based database system be developed to increase the utility, effectiveness and accessibility of available information. Equally important is the monitoring and evaluation (M&E) system of the PGB that facilitates the determination of a project’s accomplishments, financial utilization and more essentially its effects to the socio-economic environment. It can be noted, however, that the M & E mechanisms of the PGB need to be upgraded to cover all types of development initiatives in the Province and to allow greater the participation of stakeholders in the conduct of a more objective and practical monitoring processes. This can be made through the adoption and implementation of M&E mechanisms and structures under the Regional Project Monitoring System (RPMS). As to the human resource aspect of planning and development, there needs to be a continuing professional skills upgrading among practitioners. Planning officers in PGB offices as well as in municipal local governments need to be updated on the tools, processes and systems for physical and environmental planning, project packaging, fund-sourcing and monitoring and evaluation. Partnerships and Cooperation with Local and International Organizations Bohol’s growth and development has been attributed to on-going partnerships and cooperation between the Provincial Government and municipal, national governments, foreign countries and international funding institutions. Alliances have been formed and strengthened with the consistent successful implementation of development programs and projects by the Provincial Government of Bohol. With the PGB being able to deliver all of the deliverables required of a local/ foreign funded project, the province has already establish a name as a worthwhile and effective partner in pushing for various development agenda. Some of the notable foreign organizations that significantly assisted Bohol in its plight towards development are the Japan International Cooperation Agency (JICA), Australian Agency for International Development (AusAID), United States Agency for International Development (USAID), German Technical Cooperation (GTZ), EcoBudget Asia, Volunteer
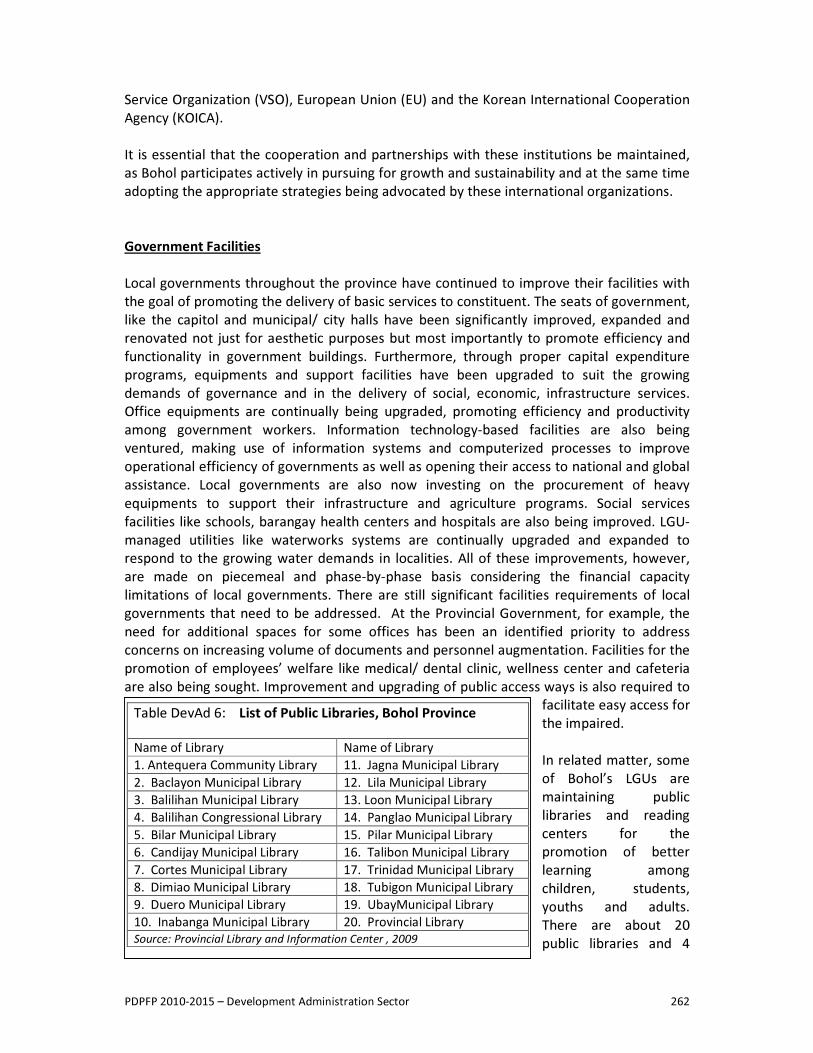
PDPFP 2010-2015 – Development Administration Sector 262
Service Organization (VSO), European Union (EU) and the Korean International Cooperation Agency (KOICA). It is essential that the cooperation and partnerships with these institutions be maintained, as Bohol participates actively in pursuing for growth and sustainability and at the same time adopting the appropriate strategies being advocated by these international organizations. Government Facilities Local governments throughout the province have continued to improve their facilities with the goal of promoting the delivery of basic services to constituent. The seats of government, like the capitol and municipal/ city halls have been significantly improved, expanded and renovated not just for aesthetic purposes but most importantly to promote efficiency and functionality in government buildings. Furthermore, through proper capital expenditure programs, equipments and support facilities have been upgraded to suit the growing demands of governance and in the delivery of social, economic, infrastructure services. Office equipments are continually being upgraded, promoting efficiency and productivity among government workers. Information technology-based facilities are also being ventured, making use of information systems and computerized processes to improve operational efficiency of governments as well as opening their access to national and global assistance. Local governments are also now investing on the procurement of heavy equipments to support their infrastructure and agriculture programs. Social services facilities like schools, barangay health centers and hospitals are also being improved. LGU-managed utilities like waterworks systems are continually upgraded and expanded to respond to the growing water demands in localities. All of these improvements, however, are made on piecemeal and phase-by-phase basis considering the financial capacity limitations of local governments. There are still significant facilities requirements of local governments that need to be addressed. At the Provincial Government, for example, the need for additional spaces for some offices has been an identified priority to address concerns on increasing volume of documents and personnel augmentation. Facilities for the promotion of employees’ welfare like medical/ dental clinic, wellness center and cafeteria are also being sought. Improvement and upgrading of public access ways is also required to
facilitate easy access for the impaired. In related matter, some of Bohol’s LGUs are maintaining public libraries and reading centers for the promotion of better learning among children, students, youths and adults. There are about 20 public libraries and 4
Table DevAd 6: List of Public Libraries, Bohol Province Name of Library Name of Library 1. Antequera Community Library 11. Jagna Municipal Library 2. Baclayon Municipal Library 12. Lila Municipal Library 3. Balilihan Municipal Library 13. Loon Municipal Library 4. Balilihan Congressional Library 14. Panglao Municipal Library 5. Bilar Municipal Library 15. Pilar Municipal Library 6. Candijay Municipal Library 16. Talibon Municipal Library 7. Cortes Municipal Library 17. Trinidad Municipal Library 8. Dimiao Municipal Library 18. Tubigon Municipal Library 9. Duero Municipal Library 19. UbayMunicipal Library 10. Inabanga Municipal Library 20. Provincial Library Source: Provincial Library and Information Center , 2009
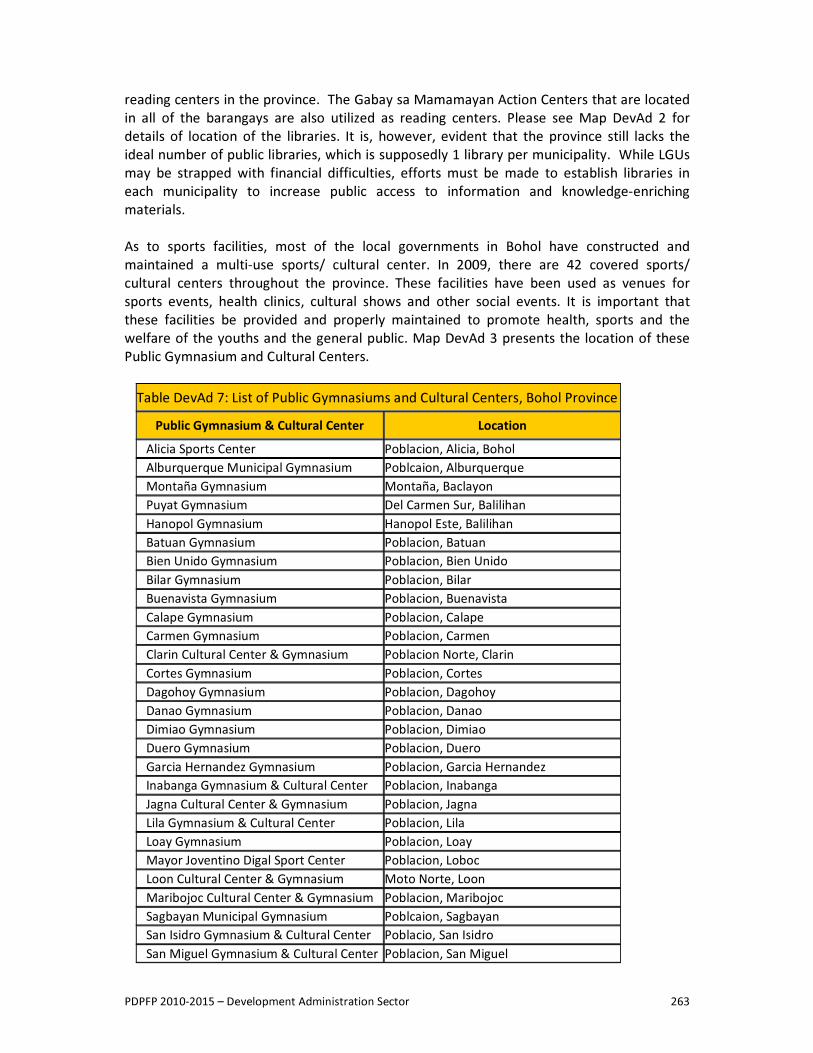
PDPFP 2010-2015 – Development Administration Sector 263
reading centers in the province. The Gabay sa Mamamayan Action Centers that are located in all of the barangays are also utilized as reading centers. Please see Map DevAd 2 for details of location of the libraries. It is, however, evident that the province still lacks the ideal number of public libraries, which is supposedly 1 library per municipality. While LGUs may be strapped with financial difficulties, efforts must be made to establish libraries in each municipality to increase public access to information and knowledge-enriching materials. As to sports facilities, most of the local governments in Bohol have constructed and maintained a multi-use sports/ cultural center. In 2009, there are 42 covered sports/ cultural centers throughout the province. These facilities have been used as venues for sports events, health clinics, cultural shows and other social events. It is important that these facilities be provided and properly maintained to promote health, sports and the welfare of the youths and the general public. Map DevAd 3 presents the location of these Public Gymnasium and Cultural Centers.
Table DevAd 7: List of Public Gymnasiums and Cultural Centers, Bohol Province Public Gymnasium & Cultural Center Location
Alicia Sports Center Poblacion, Alicia, Bohol Alburquerque Municipal Gymnasium Poblcaion, Alburquerque Montaña Gymnasium Montaña, Baclayon Puyat Gymnasium Del Carmen Sur, Balilihan Hanopol Gymnasium Hanopol Este, Balilihan Batuan Gymnasium Poblacion, Batuan Bien Unido Gymnasium Poblacion, Bien Unido Bilar Gymnasium Poblacion, Bilar Buenavista Gymnasium Poblacion, Buenavista Calape Gymnasium Poblacion, Calape Carmen Gymnasium Poblacion, Carmen Clarin Cultural Center & Gymnasium Poblacion Norte, Clarin Cortes Gymnasium Poblacion, Cortes Dagohoy Gymnasium Poblacion, Dagohoy Danao Gymnasium Poblacion, Danao Dimiao Gymnasium Poblacion, Dimiao Duero Gymnasium Poblacion, Duero Garcia Hernandez Gymnasium Poblacion, Garcia Hernandez Inabanga Gymnasium & Cultural Center Poblacion, Inabanga Jagna Cultural Center & Gymnasium Poblacion, Jagna Lila Gymnasium & Cultural Center Poblacion, Lila Loay Gymnasium Poblacion, Loay Mayor Joventino Digal Sport Center Poblacion, Loboc Loon Cultural Center & Gymnasium Moto Norte, Loon Maribojoc Cultural Center & Gymnasium Poblacion, Maribojoc Sagbayan Municipal Gymnasium Poblcaion, Sagbayan San Isidro Gymnasium & Cultural Center Poblacio, San Isidro San Miguel Gymnasium & Cultural Center Poblacion, San Miguel
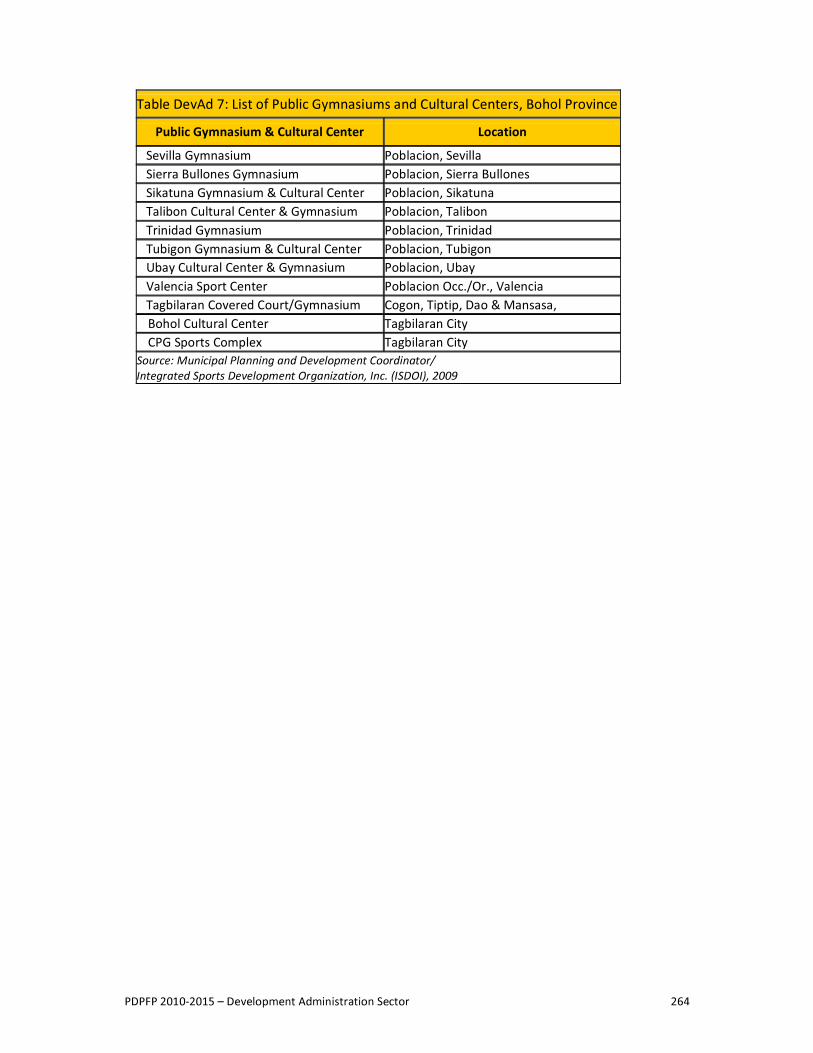
PDPFP 2010-2015 – Development Administration Sector 264
Table DevAd 7: List of Public Gymnasiums and Cultural Centers, Bohol Province Public Gymnasium & Cultural Center Location
Sevilla Gymnasium Poblacion, Sevilla Sierra Bullones Gymnasium Poblacion, Sierra Bullones Sikatuna Gymnasium & Cultural Center Poblacion, Sikatuna Talibon Cultural Center & Gymnasium Poblacion, Talibon Trinidad Gymnasium Poblacion, Trinidad Tubigon Gymnasium & Cultural Center Poblacion, Tubigon Ubay Cultural Center & Gymnasium Poblacion, Ubay Valencia Sport Center Poblacion Occ./Or., Valencia Tagbilaran Covered Court/Gymnasium Cogon, Tiptip, Dao & Mansasa,
Bohol Cultural Center Tagbilaran City CPG Sports Complex Tagbilaran City
Source: Municipal Planning and Development Coordinator/ Integrated Sports Development Organization, Inc. (ISDOI), 2009
PDPFP 2010-2015 – Development Administration Sector 265
ISSUES AND CONCERNS OF THE SUB-SECTOR
� Delayed completion and implementation of the Provincial Government Re-Engineering Program
� Employees awards and incentives system not fully implemented � Multiplicity of various mandated local councils that hinders the conduct of regular
meetings � Lack of coordination between offices, LGUs and National Government Agencies in
policy development, implementation and enforcement � Project Monitoring and Evaluation System not fully supported by PGB offices � Poverty Database Monitoring System not fully utilized by LGUs and NGAs as a tool
for project identification, implementation and monitoring. � Limited capacities of Municipal LGUs in revenue generation, project development ,
fund sourcing and accessing external funds � Management Executive Team (MET) Meetings not regularly conducted to discuss
policy and management matters � Need for LFC representation in SP Sessions and Committee hearings for better
coordination and early resolution of matters regarding appropriation and resource utilization
� Limited functionality and accessibility of the Legislative Tracking System � Need to improve consultation process for the crafting of the Legislative Agenda � Lack of coordination with Sangguniang Bayans and Panlalawigan regarding referrals
of ordinances and other requests � No overall PGB Organizational Strategic Plan; Offices’ strategic plans are fragmented � Lack of public libraries and reading centers in the province (ideal is 1 Library per
Municipality) � Limited budgetary support for library operations and a general lack of interest of
LGUs to establish local libraries and information centers � Lack of sports centers in the province � Unmet building, office space, facilities and equipment requirements for some local
governance offices and employees’ groups � Provincial Government lacks the necessary facilities and services for the promotion
of employee welfare (e.g. medical/ dental clinic, cafeteria, wellness center, medical insurance, elevator and appropriate accessways)
PDPFP 2010-2015 – Development Administration Sector 266
DEVELOPMENT FRAMEWORK Vision Bohol is a role model for responsive, transparent and accountable Local Government run by professional public servants Goals
� Enhanced transparency and accountability in governance � Institutionalized planning and budgeting linkage and improved resource
prioritization and utilization � Harmonized Executive-Legislative Agenda � Professionalized public service and improved institutional capacities in all levels of
Local Governance � Increased access to information and library services � Increased effectiveness of mandated Local Councils and Special Bodies � Modernized and functional buildings, equipment and facilities � Institutionalized participatory and gender-sensitive planning and policy-making
Strategies
� Clear delineation of government functions � Utilization of Information-Communication-Technology in government service � Advocacy for Good Governance � Institutionalization of Monitoring and Evaluation System for resource utilization � Operationalization of Citizen’s Charter � Standardization of Performance Management System � Provision of awards and rewards for best LGU practices
� Institutionalization on the conduct of corporate planning exercises for the Provincial
Government � Capacities enhancement for planning and budgeting processes � Prioritization and integration of major cross-cutting themes in all PGBh programs and
projects - poverty reduction, equitable local economic development, gender and women’s empowerment, sustainable development
� Capacity development for newly-elected local officials � Strengthening executive-legislative collaboration � Organizational rationalization and re-engineering � Sustaining human resource capacity development and cascading to other levels of
local governments � Policies, systems and processes review � Salaries and compensation standardization � Full implementation of employees’ Awards and Incentives System
PDPFP 2010-2015 – Development Administration Sector 267
� Expansion and improvement of library services in municipalities � Development and updating of integrated database system � Information Technology-based upgrading and facilities improvement
� Strengthening the operational effectiveness of local councils and special bodies � Assessment and evaluation of performance of local councils and special bodies
� Improvement of facilities, structures and equipment to enhance working
environment and promote employees’ welfare and development
� Sustaining participation in policy and decision-making by all stakeholders (especially women, marginalized sectors)
� Strengthening of the Management Executive Team � More participation of employees’ league in policy and decision-making in relation to
employees welfare and development Objectives and Targets
� To fully implement Performance Management System - Office Performance Evaluation System by 2010
� To monitor and sustain the implementation of Local Government’s Citizens’ Charter starting year 2010
� To implement and operate a Monitoring and Evaluation System that focuses on resource utilization and outcomes
• To formulate and develop by the end of 2010 a Provincial Government Integrated Strategic Plan – which is a corporate medium-term plan for Provincial Government Offices
� To conduct yearly the PGB Assessment Workshop � To capacitate PGB and Municipal development stakeholders in project development,
planning and budgeting harmonization and monitoring/evaluation � To conduct Information and Education Campaign (IEC) for Poverty Database
Management System (PDMS) updating and utilization at the PGB, MLGU and NGA level
� To conduct the Bohol Poverty Fair and other related workshops for project packaging every year
� To sustain assistance for the indigents, the poor & deserving students through the Aid Initiatives and Scholarship Programs
� To formulate an Executive-Legislative Agenda for 2010-2012 by year 2010 � To establish within the Sangguniang Panlalawigan a Section to focus on review of
Municipal Ordinances by 2011 � To orient and train 1,115 City and Municipal Officials and 24,398 Barangay Officials � To operate a fully functional Legislative Tracking System by 2010
� To fully implement the Provincial Government Re-engineering Program by year 2010
PDPFP 2010-2015 – Development Administration Sector 268
� To send 100% of employees that require training to capability-building sessions by 2015
� To develop and implement a fully functional HRD program by 2015 � To operate a fully functional Human Resource Information System by 2011 � To establish the Medical/Health care program for Provincial Government employees
by 2011 � To fully implement the PGB Awards and Rewards System by 2010 � To implement the PGB Employees’ Scholarship Program by 2011 � To establish the PGB Learning Center by 2011 � To cascade HRD programs and introduce the reengineering program to selected
MLGUs by 2011 � To implement salary and compensation standardization by 2010 � To provide employee assistance and support through the employee’s league and
cooperative � To facilitate and assist in the establishment of municipal libraries municipalities
starting 2010 � To upgrade and acquire a mobile library by 2011 � To expand Provincial Library spaces by 2012 � To have an efficient, effective, accessible and integrated database system by 2010 � To fully utilize and maximize the systems and facilities of the Bohol-IT unit beginning
2010 � To review and enhance operational procedures and structures of local councils � To conduct performance evaluation of local council/special bodies every June and
December of the year � To uplift capacities of local council and special body secretariat services � To upgrade all PGB structures, facilities and equipment that require improvement by
year 2015 � To construct employee welfare facilities (clinic and cafeteria) in 2011 and provide
appropriate office space for PGB Employees League � To expand membership of policy-making bodies and planning committees to
enhance participation and consultative processes by 2012 � To re-activate and improve functionality of the Management Executive Team
through the conduct of regular monthly meeting by 2010 Major Plans and Programs
� Performance Management System - Office Performance Evaluation System Implementation
� Local Government’s Citizens’ Charter Full Implementation � Project/ Program Monitoring and Evaluation System implementation
� Provincial Government Integrated Strategic Planning
PDPFP 2010-2015 – Development Administration Sector 269
� Yearly the PGB Assessment Workshop � Conduct of Training Programs for PGB and Municipal development stakeholders in
project development, planning and budgeting harmonization and monitoring/evaluation
� Information and Education Campaign (IEC) for Poverty Database Management System (PDMS) updating and utilization at the PGB, MLGU and NGA level
� Bohol Poverty Fair and other related workshops for project packaging � Aid Initiatives and Scholarship Programs for the indigents, the poor & deserving
students
� Formulation of an Executive-Legislative Agenda for 2010-2012 � Establishment of a dedicated section within the Sangguniang Panlalawigan to focus
on review of Municipal Ordinances � Training and Orientation Programs for City/ Municipal/ Barangay Officials � Full implementation of the Legislative Tracking System
� Provincial Government Re-engineering Program � Capability-building Program for Government Employees � Human Resource Development Program (HRDP) � Human Resource Information System (HRIS) Program � Medical/Health Care Program for Provincial Government � PGB Awards and Rewards System Program � PGB Employees’ Scholarship Program � PGB Learning Center Establishment � Introduction and cascading of HRD programs/ re-engineering program to MLGUs � To implement salary and compensation standardization by 2010 � To provide employee assistance and support through the employee’s league and
cooperative � Establishment of municipal libraries � Upgrading/ Acquisition of a mobile library � Provincial Library Expansion Project � Integrated Database System Development Project � Bohol-IT Enhancement Program � Review and Enhancement Program for the Procedures/ Systems of Local Councils � Periodic Performance Evaluation System for Local Councils and Special Bodies � Capacity Enhancement Program for Local Councils and Respective Secretariat Offices � PGB structures, facilities and equipment Upgrading Program � PGB Employees’ Welfare Program, including the Construction/ Provision of PGB
Employees League � Participation and consultation Enhancement Initiatives for Policy-making bodies � Management Executive Team Strengthening Project
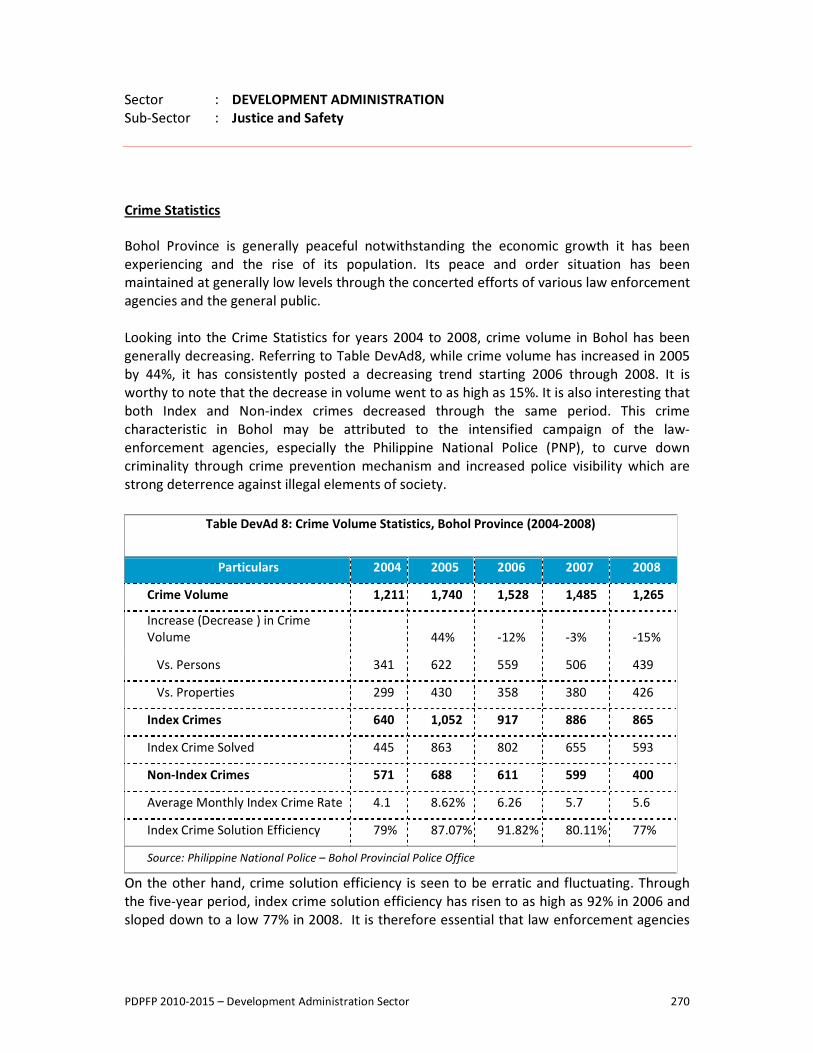
PDPFP 2010-2015 – Development Administration Sector 270
Sector : DEVELOPMENT ADMINISTRATION Sub-Sector : Justice and Safety Crime Statistics Bohol Province is generally peaceful notwithstanding the economic growth it has been experiencing and the rise of its population. Its peace and order situation has been maintained at generally low levels through the concerted efforts of various law enforcement agencies and the general public. Looking into the Crime Statistics for years 2004 to 2008, crime volume in Bohol has been generally decreasing. Referring to Table DevAd8, while crime volume has increased in 2005 by 44%, it has consistently posted a decreasing trend starting 2006 through 2008. It is worthy to note that the decrease in volume went to as high as 15%. It is also interesting that both Index and Non-index crimes decreased through the same period. This crime characteristic in Bohol may be attributed to the intensified campaign of the law-enforcement agencies, especially the Philippine National Police (PNP), to curve down criminality through crime prevention mechanism and increased police visibility which are strong deterrence against illegal elements of society.
On the other hand, crime solution efficiency is seen to be erratic and fluctuating. Through the five-year period, index crime solution efficiency has risen to as high as 92% in 2006 and sloped down to a low 77% in 2008. It is therefore essential that law enforcement agencies
Table DevAd 8: Crime Volume Statistics, Bohol Province (2004-2008)
Particulars 2004 2005 2006 2007 2008 Crime Volume 1,211 1,740 1,528 1,485 1,265 Increase (Decrease ) in Crime Volume 44% -12% -3% -15% Vs. Persons 341 622 559 506 439 Vs. Properties 299 430 358 380 426 Index Crimes 640 1,052 917 886 865 Index Crime Solved 445 863 802 655 593 Non-Index Crimes 571 688 611 599 400 Average Monthly Index Crime Rate 4.1 8.62% 6.26 5.7 5.6 Index Crime Solution Efficiency 79% 87.07% 91.82% 80.11% 77% Source: Philippine National Police – Bohol Provincial Police Office
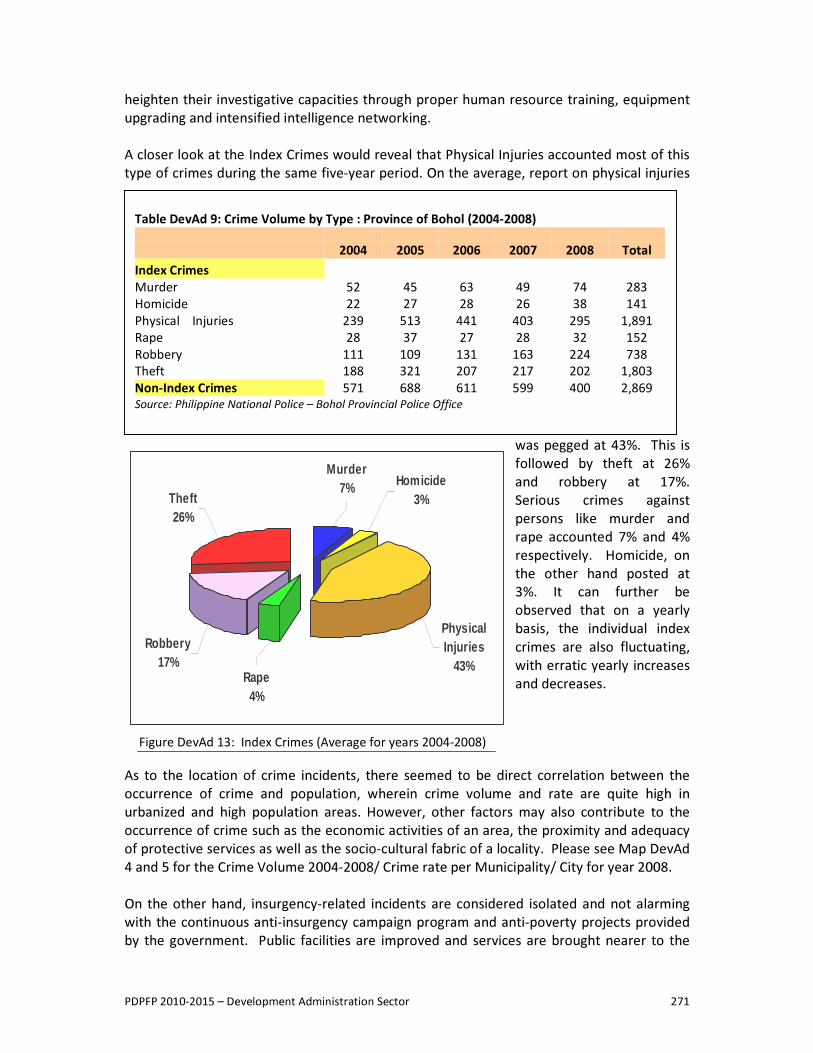
PDPFP 2010-2015 – Development Administration Sector 271
heighten their investigative capacities through proper human resource training, equipment upgrading and intensified intelligence networking. A closer look at the Index Crimes would reveal that Physical Injuries accounted most of this type of crimes during the same five-year period. On the average, report on physical injuries
was pegged at 43%. This is followed by theft at 26% and robbery at 17%. Serious crimes against persons like murder and rape accounted 7% and 4% respectively. Homicide, on the other hand posted at 3%. It can further be observed that on a yearly basis, the individual index crimes are also fluctuating, with erratic yearly increases and decreases.
As to the location of crime incidents, there seemed to be direct correlation between the occurrence of crime and population, wherein crime volume and rate are quite high in urbanized and high population areas. However, other factors may also contribute to the occurrence of crime such as the economic activities of an area, the proximity and adequacy of protective services as well as the socio-cultural fabric of a locality. Please see Map DevAd 4 and 5 for the Crime Volume 2004-2008/ Crime rate per Municipality/ City for year 2008. On the other hand, insurgency-related incidents are considered isolated and not alarming with the continuous anti-insurgency campaign program and anti-poverty projects provided by the government. Public facilities are improved and services are brought nearer to the
Table DevAd 9: Crime Volume by Type : Province of Bohol (2004-2008) 2004 2005 2006 2007 2008 Total Index Crimes Murder 52 45 63 49 74 283 Homicide 22 27 28 26 38 141 Physical Injuries 239 513 441 403 295 1,891 Rape 28 37 27 28 32 152 Robbery 111 109 131 163 224 738 Theft 188 321 207 217 202 1,803 Non-Index Crimes 571 688 611 599 400 2,869 Source: Philippine National Police – Bohol Provincial Police Office
Physical Injuries
43%Rape4%
Robbery17%
Theft26%
Murder7% Homicide
3%
Figure DevAd 13: Index Crimes (Average for years 2004-2008)
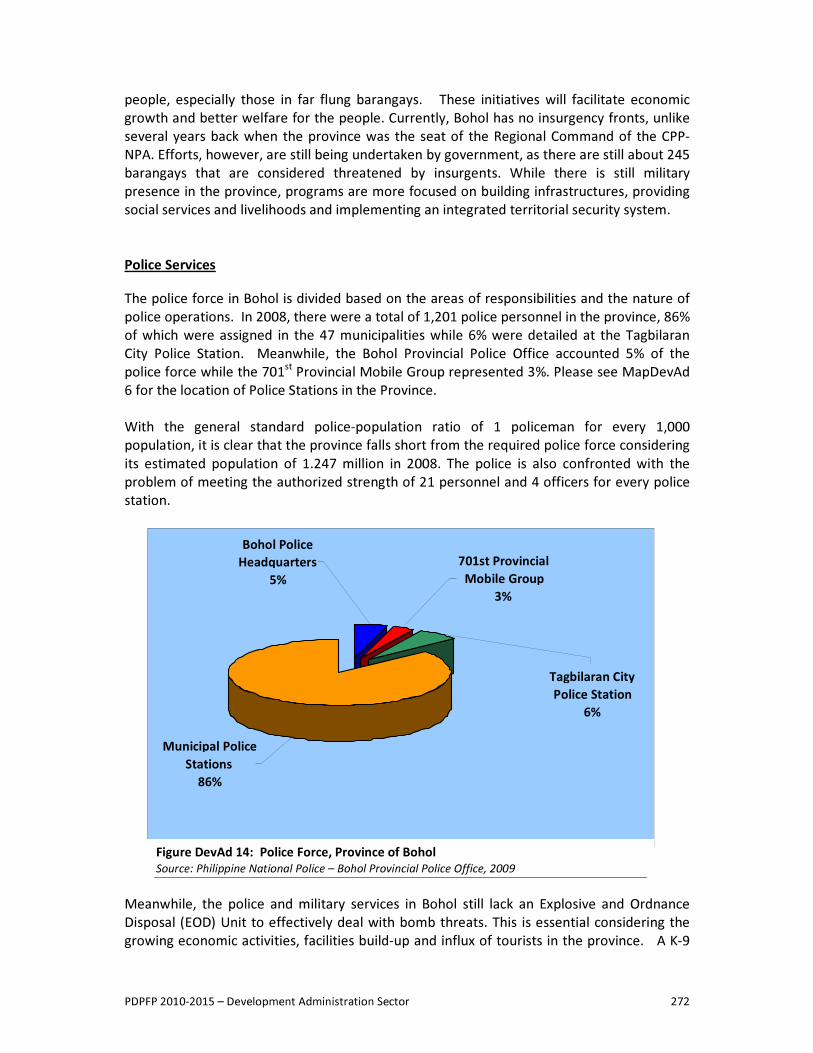
PDPFP 2010-2015 – Development Administration Sector 272
people, especially those in far flung barangays. These initiatives will facilitate economic growth and better welfare for the people. Currently, Bohol has no insurgency fronts, unlike several years back when the province was the seat of the Regional Command of the CPP-NPA. Efforts, however, are still being undertaken by government, as there are still about 245 barangays that are considered threatened by insurgents. While there is still military presence in the province, programs are more focused on building infrastructures, providing social services and livelihoods and implementing an integrated territorial security system. Police Services
The police force in Bohol is divided based on the areas of responsibilities and the nature of police operations. In 2008, there were a total of 1,201 police personnel in the province, 86% of which were assigned in the 47 municipalities while 6% were detailed at the Tagbilaran City Police Station. Meanwhile, the Bohol Provincial Police Office accounted 5% of the police force while the 701st Provincial Mobile Group represented 3%. Please see MapDevAd 6 for the location of Police Stations in the Province. With the general standard police-population ratio of 1 policeman for every 1,000 population, it is clear that the province falls short from the required police force considering its estimated population of 1.247 million in 2008. The police is also confronted with the problem of meeting the authorized strength of 21 personnel and 4 officers for every police station.
Meanwhile, the police and military services in Bohol still lack an Explosive and Ordnance Disposal (EOD) Unit to effectively deal with bomb threats. This is essential considering the growing economic activities, facilities build-up and influx of tourists in the province. A K-9
Bohol Police Headquarters
5% 701st Provincial
Mobile Group 3%
Tagbilaran City Police Station
6%
Municipal Police Stations
86%
Figure DevAd 14: Police Force, Province of Bohol Source: Philippine National Police – Bohol Provincial Police Office, 2009
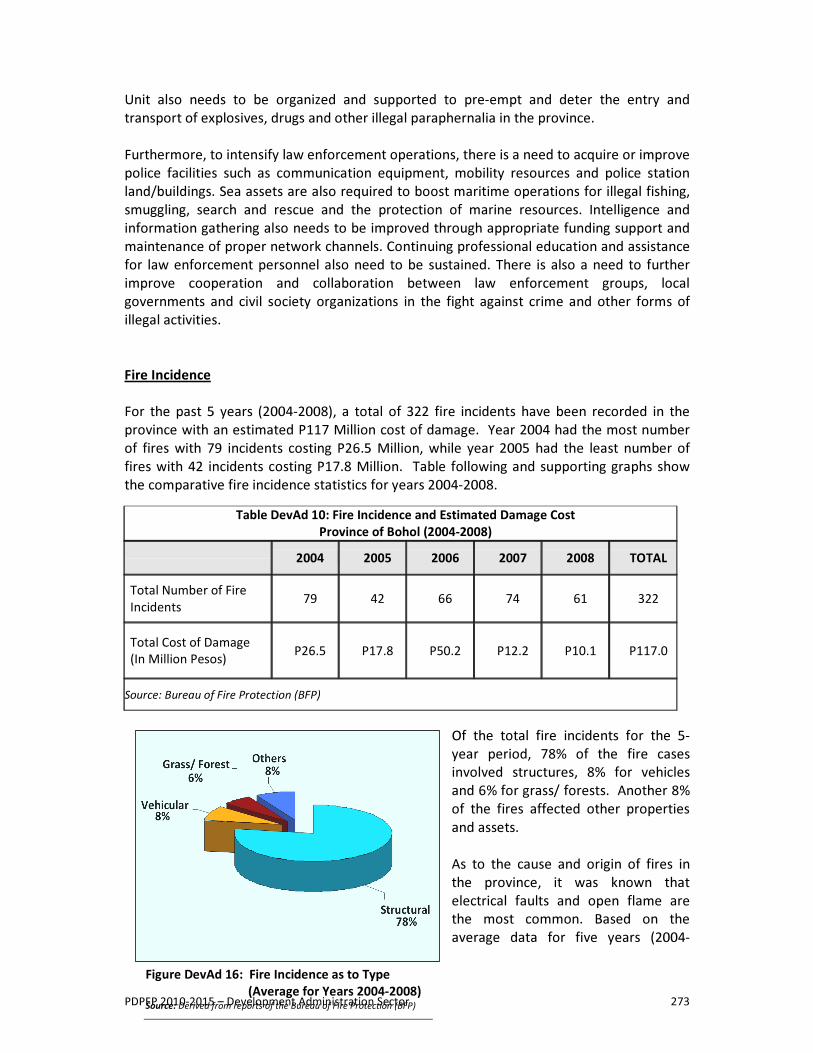
PDPFP 2010-2015 – Development Administration Sector 273 Figure DevAd 16: Fire Incidence as to Type (Average for Years 2004-2008) Source: Derived from reports of the Bureau of Fire Protection (BFP)
Unit also needs to be organized and supported to pre-empt and deter the entry and transport of explosives, drugs and other illegal paraphernalia in the province. Furthermore, to intensify law enforcement operations, there is a need to acquire or improve police facilities such as communication equipment, mobility resources and police station land/buildings. Sea assets are also required to boost maritime operations for illegal fishing, smuggling, search and rescue and the protection of marine resources. Intelligence and information gathering also needs to be improved through appropriate funding support and maintenance of proper network channels. Continuing professional education and assistance for law enforcement personnel also need to be sustained. There is also a need to further improve cooperation and collaboration between law enforcement groups, local governments and civil society organizations in the fight against crime and other forms of illegal activities. Fire Incidence For the past 5 years (2004-2008), a total of 322 fire incidents have been recorded in the province with an estimated P117 Million cost of damage. Year 2004 had the most number of fires with 79 incidents costing P26.5 Million, while year 2005 had the least number of fires with 42 incidents costing P17.8 Million. Table following and supporting graphs show the comparative fire incidence statistics for years 2004-2008.
Of the total fire incidents for the 5-year period, 78% of the fire cases involved structures, 8% for vehicles and 6% for grass/ forests. Another 8% of the fires affected other properties and assets. As to the cause and origin of fires in the province, it was known that electrical faults and open flame are the most common. Based on the average data for five years (2004-
Table DevAd 10: Fire Incidence and Estimated Damage Cost Province of Bohol (2004-2008)
2004 2005 2006 2007 2008 TOTAL
Total Number of Fire Incidents 79 42 66 74 61 322
Total Cost of Damage (In Million Pesos) P26.5 P17.8 P50.2 P12.2 P10.1 P117.0
Source: Bureau of Fire Protection (BFP)
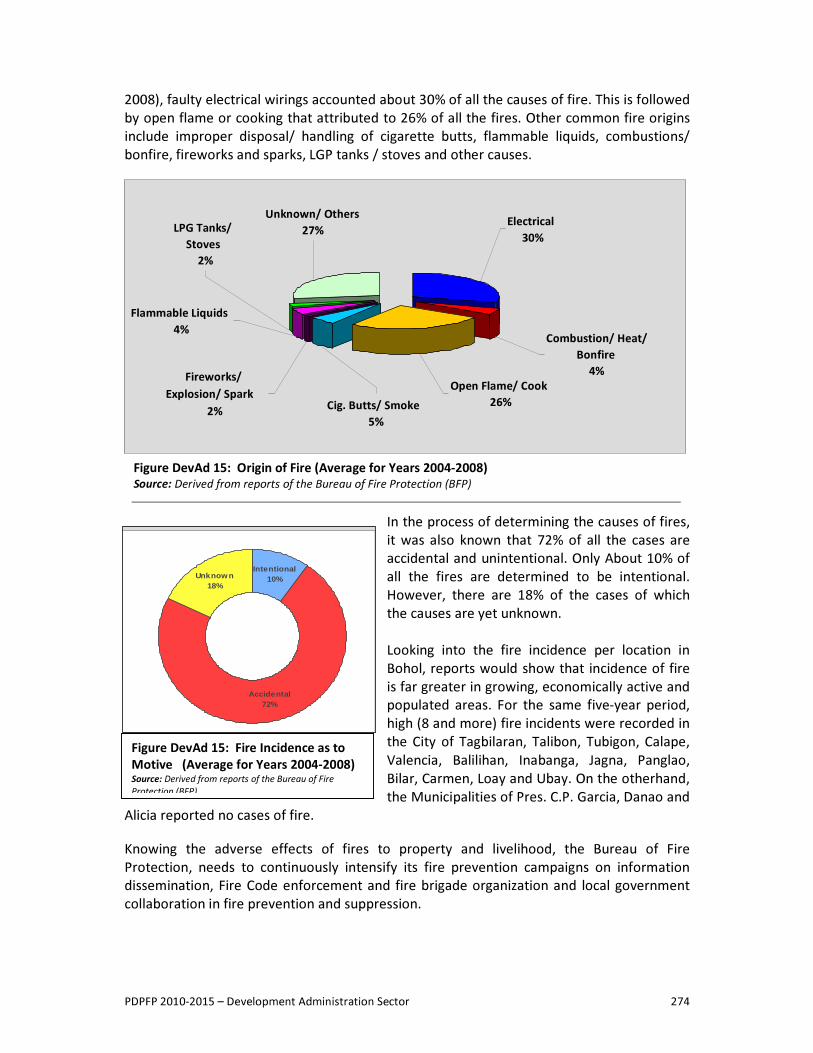
PDPFP 2010-2015 – Development Administration Sector 274
Unknown/ Others 27% LPG Tanks/
Stoves 2%
Cig. Butts/ Smoke 5%
Fireworks/ Explosion/ Spark
2%
Flammable Liquids 4%
Open Flame/ Cook 26%
Combustion/ Heat/ Bonfire
4%
Electrical 30%
Figure DevAd 15: Origin of Fire (Average for Years 2004-2008) Source: Derived from reports of the Bureau of Fire Protection (BFP)
2008), faulty electrical wirings accounted about 30% of all the causes of fire. This is followed by open flame or cooking that attributed to 26% of all the fires. Other common fire origins include improper disposal/ handling of cigarette butts, flammable liquids, combustions/ bonfire, fireworks and sparks, LGP tanks / stoves and other causes.
In the process of determining the causes of fires, it was also known that 72% of all the cases are accidental and unintentional. Only About 10% of all the fires are determined to be intentional. However, there are 18% of the cases of which the causes are yet unknown. Looking into the fire incidence per location in Bohol, reports would show that incidence of fire is far greater in growing, economically active and populated areas. For the same five-year period, high (8 and more) fire incidents were recorded in the City of Tagbilaran, Talibon, Tubigon, Calape, Valencia, Balilihan, Inabanga, Jagna, Panglao, Bilar, Carmen, Loay and Ubay. On the otherhand, the Municipalities of Pres. C.P. Garcia, Danao and
Alicia reported no cases of fire.
Knowing the adverse effects of fires to property and livelihood, the Bureau of Fire Protection, needs to continuously intensify its fire prevention campaigns on information dissemination, Fire Code enforcement and fire brigade organization and local government collaboration in fire prevention and suppression.
Intentional10%
Accidental72%
Unknow n18%
Figure DevAd 15: Fire Incidence as to Motive (Average for Years 2004-2008) Source: Derived from reports of the Bureau of Fire Protection (BFP)
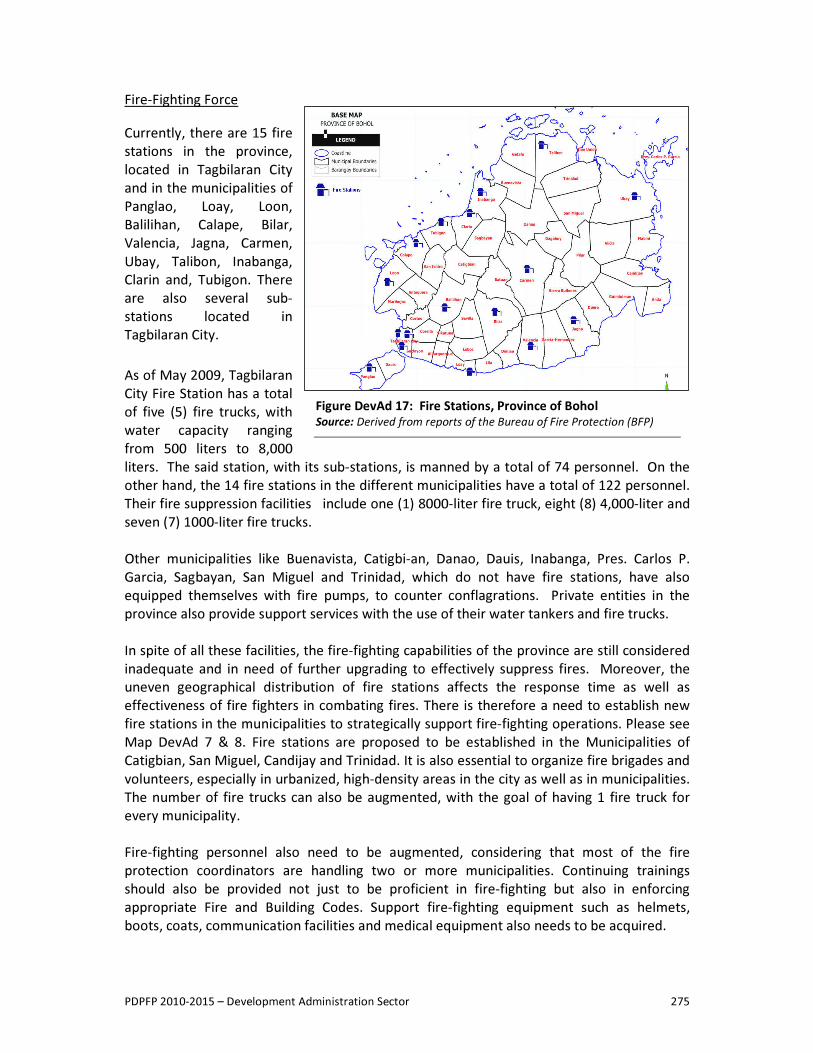
PDPFP 2010-2015 – Development Administration Sector 275
Figure DevAd 17: Fire Stations, Province of Bohol Source: Derived from reports of the Bureau of Fire Protection (BFP)
Fire-Fighting Force Currently, there are 15 fire stations in the province, located in Tagbilaran City and in the municipalities of Panglao, Loay, Loon, Balilihan, Calape, Bilar, Valencia, Jagna, Carmen, Ubay, Talibon, Inabanga, Clarin and, Tubigon. There are also several sub-stations located in Tagbilaran City. As of May 2009, Tagbilaran City Fire Station has a total of five (5) fire trucks, with water capacity ranging from 500 liters to 8,000 liters. The said station, with its sub-stations, is manned by a total of 74 personnel. On the other hand, the 14 fire stations in the different municipalities have a total of 122 personnel. Their fire suppression facilities include one (1) 8000-liter fire truck, eight (8) 4,000-liter and seven (7) 1000-liter fire trucks. Other municipalities like Buenavista, Catigbi-an, Danao, Dauis, Inabanga, Pres. Carlos P. Garcia, Sagbayan, San Miguel and Trinidad, which do not have fire stations, have also equipped themselves with fire pumps, to counter conflagrations. Private entities in the province also provide support services with the use of their water tankers and fire trucks.
In spite of all these facilities, the fire-fighting capabilities of the province are still considered inadequate and in need of further upgrading to effectively suppress fires. Moreover, the uneven geographical distribution of fire stations affects the response time as well as effectiveness of fire fighters in combating fires. There is therefore a need to establish new fire stations in the municipalities to strategically support fire-fighting operations. Please see Map DevAd 7 & 8. Fire stations are proposed to be established in the Municipalities of Catigbian, San Miguel, Candijay and Trinidad. It is also essential to organize fire brigades and volunteers, especially in urbanized, high-density areas in the city as well as in municipalities. The number of fire trucks can also be augmented, with the goal of having 1 fire truck for every municipality. Fire-fighting personnel also need to be augmented, considering that most of the fire protection coordinators are handling two or more municipalities. Continuing trainings should also be provided not just to be proficient in fire-fighting but also in enforcing appropriate Fire and Building Codes. Support fire-fighting equipment such as helmets, boots, coats, communication facilities and medical equipment also needs to be acquired.
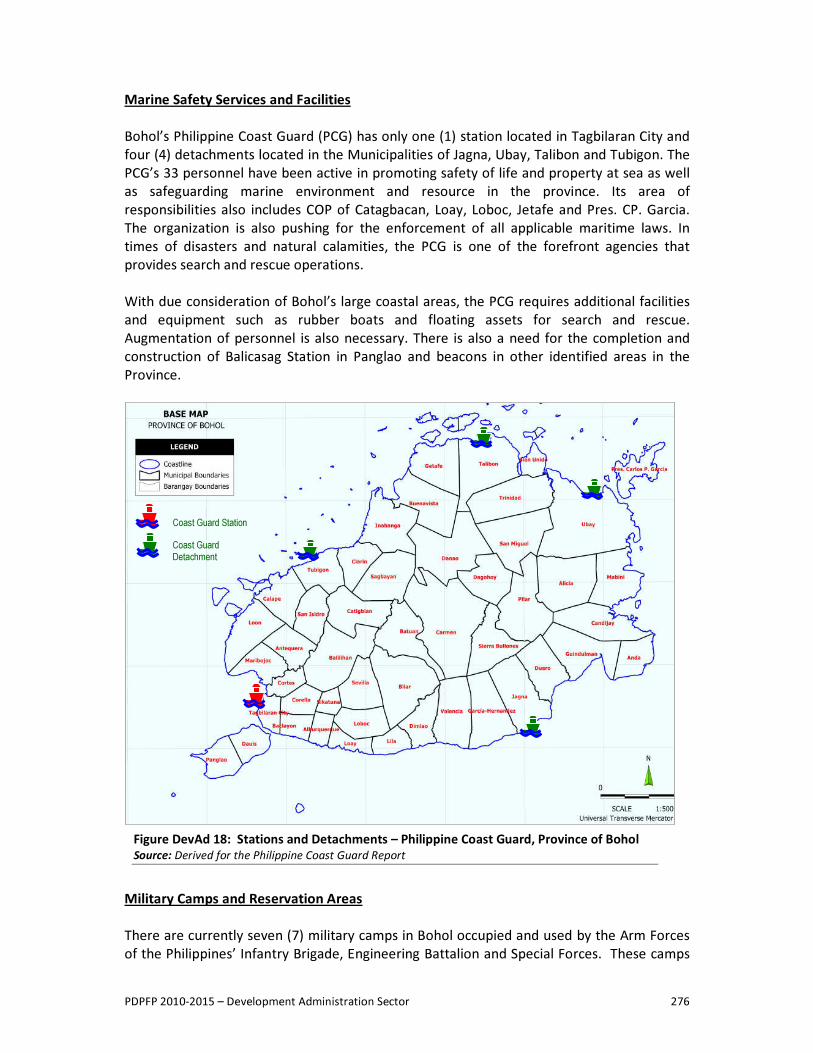
PDPFP 2010-2015 – Development Administration Sector 276
Marine Safety Services and Facilities Bohol’s Philippine Coast Guard (PCG) has only one (1) station located in Tagbilaran City and four (4) detachments located in the Municipalities of Jagna, Ubay, Talibon and Tubigon. The PCG’s 33 personnel have been active in promoting safety of life and property at sea as well as safeguarding marine environment and resource in the province. Its area of responsibilities also includes COP of Catagbacan, Loay, Loboc, Jetafe and Pres. CP. Garcia. The organization is also pushing for the enforcement of all applicable maritime laws. In times of disasters and natural calamities, the PCG is one of the forefront agencies that provides search and rescue operations. With due consideration of Bohol’s large coastal areas, the PCG requires additional facilities and equipment such as rubber boats and floating assets for search and rescue. Augmentation of personnel is also necessary. There is also a need for the completion and construction of Balicasag Station in Panglao and beacons in other identified areas in the Province.
Military Camps and Reservation Areas There are currently seven (7) military camps in Bohol occupied and used by the Arm Forces of the Philippines’ Infantry Brigade, Engineering Battalion and Special Forces. These camps
Coast Guard Station
Coast Guard Detachment
Figure DevAd 18: Stations and Detachments – Philippine Coast Guard, Province of Bohol Source: Derived for the Philippine Coast Guard Report
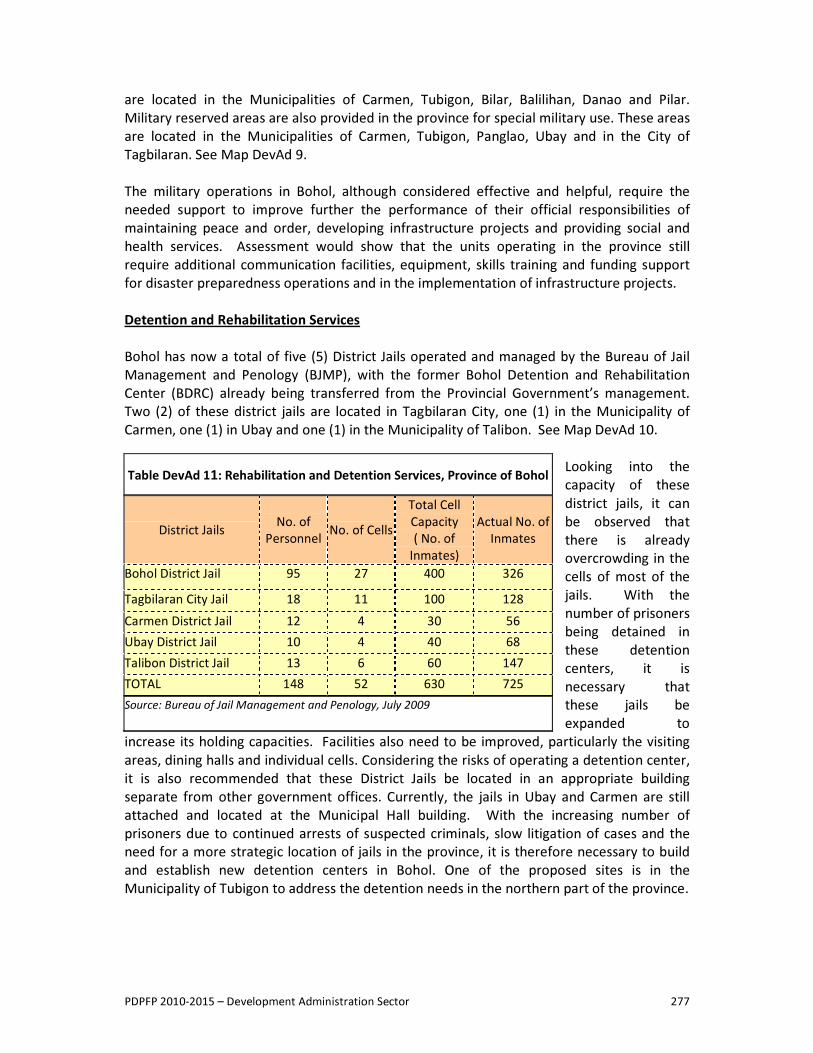
PDPFP 2010-2015 – Development Administration Sector 277
are located in the Municipalities of Carmen, Tubigon, Bilar, Balilihan, Danao and Pilar. Military reserved areas are also provided in the province for special military use. These areas are located in the Municipalities of Carmen, Tubigon, Panglao, Ubay and in the City of Tagbilaran. See Map DevAd 9. The military operations in Bohol, although considered effective and helpful, require the needed support to improve further the performance of their official responsibilities of maintaining peace and order, developing infrastructure projects and providing social and health services. Assessment would show that the units operating in the province still require additional communication facilities, equipment, skills training and funding support for disaster preparedness operations and in the implementation of infrastructure projects. Detention and Rehabilitation Services Bohol has now a total of five (5) District Jails operated and managed by the Bureau of Jail Management and Penology (BJMP), with the former Bohol Detention and Rehabilitation Center (BDRC) already being transferred from the Provincial Government’s management. Two (2) of these district jails are located in Tagbilaran City, one (1) in the Municipality of Carmen, one (1) in Ubay and one (1) in the Municipality of Talibon. See Map DevAd 10.
Looking into the capacity of these district jails, it can be observed that there is already overcrowding in the cells of most of the jails. With the number of prisoners being detained in these detention centers, it is necessary that these jails be expanded to
increase its holding capacities. Facilities also need to be improved, particularly the visiting areas, dining halls and individual cells. Considering the risks of operating a detention center, it is also recommended that these District Jails be located in an appropriate building separate from other government offices. Currently, the jails in Ubay and Carmen are still attached and located at the Municipal Hall building. With the increasing number of prisoners due to continued arrests of suspected criminals, slow litigation of cases and the need for a more strategic location of jails in the province, it is therefore necessary to build and establish new detention centers in Bohol. One of the proposed sites is in the Municipality of Tubigon to address the detention needs in the northern part of the province.
Table DevAd 11: Rehabilitation and Detention Services, Province of Bohol
District Jails No. of Personnel No. of Cells
Total Cell Capacity ( No. of
Inmates)
Actual No. of Inmates
Bohol District Jail 95 27 400 326 Tagbilaran City Jail 18 11 100 128 Carmen District Jail 12 4 30 56 Ubay District Jail 10 4 40 68 Talibon District Jail 13 6 60 147 TOTAL 148 52 630 725 Source: Bureau of Jail Management and Penology, July 2009
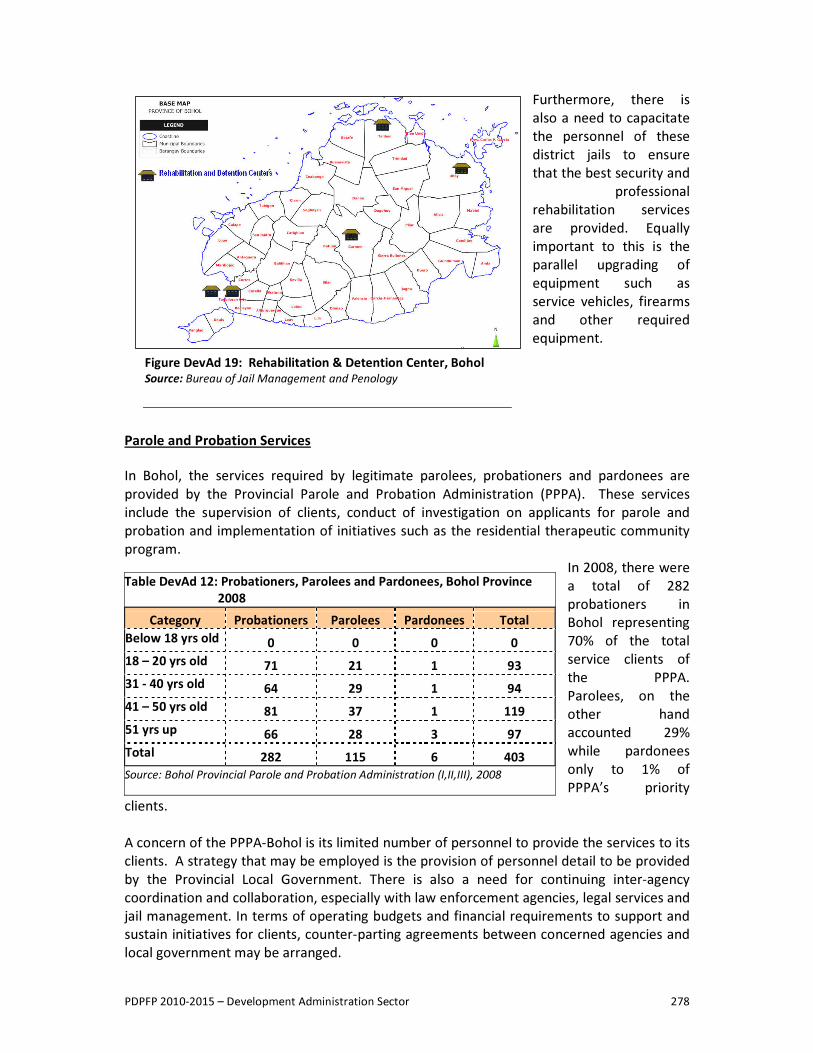
PDPFP 2010-2015 – Development Administration Sector 278
Figure DevAd 19: Rehabilitation & Detention Center, Bohol Source: Bureau of Jail Management and Penology
Furthermore, there is also a need to capacitate the personnel of these district jails to ensure that the best security and
professional rehabilitation services are provided. Equally important to this is the parallel upgrading of equipment such as service vehicles, firearms and other required equipment.
Parole and Probation Services In Bohol, the services required by legitimate parolees, probationers and pardonees are provided by the Provincial Parole and Probation Administration (PPPA). These services include the supervision of clients, conduct of investigation on applicants for parole and probation and implementation of initiatives such as the residential therapeutic community program.
In 2008, there were a total of 282 probationers in Bohol representing 70% of the total service clients of the PPPA. Parolees, on the other hand accounted 29% while pardonees only to 1% of PPPA’s priority
clients. A concern of the PPPA-Bohol is its limited number of personnel to provide the services to its clients. A strategy that may be employed is the provision of personnel detail to be provided by the Provincial Local Government. There is also a need for continuing inter-agency coordination and collaboration, especially with law enforcement agencies, legal services and jail management. In terms of operating budgets and financial requirements to support and sustain initiatives for clients, counter-parting agreements between concerned agencies and local government may be arranged.
Table DevAd 12: Probationers, Parolees and Pardonees, Bohol Province 2008
Category Probationers Parolees Pardonees Total Below 18 yrs old 0 0 0 0 18 – 20 yrs old 71 21 1 93 31 - 40 yrs old 64 29 1 94 41 – 50 yrs old 81 37 1 119 51 yrs up 66 28 3 97 Total 282 115 6 403 Source: Bohol Provincial Parole and Probation Administration (I,II,III), 2008
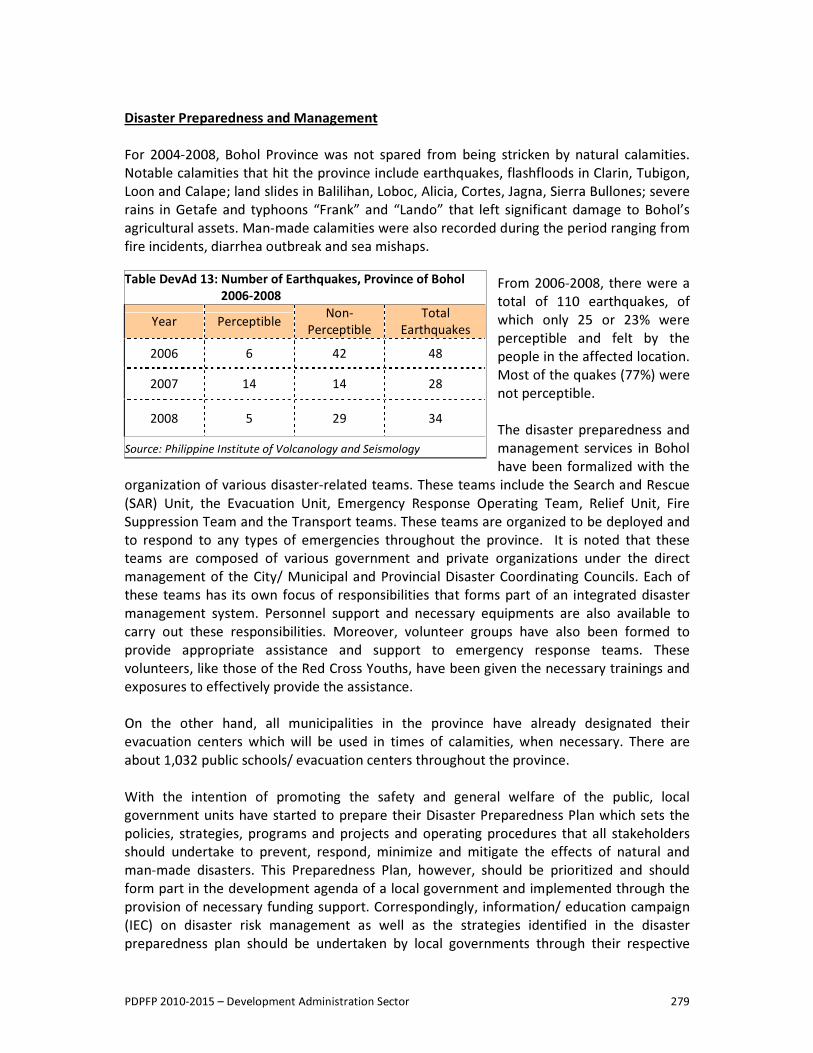
PDPFP 2010-2015 – Development Administration Sector 279
Disaster Preparedness and Management For 2004-2008, Bohol Province was not spared from being stricken by natural calamities. Notable calamities that hit the province include earthquakes, flashfloods in Clarin, Tubigon, Loon and Calape; land slides in Balilihan, Loboc, Alicia, Cortes, Jagna, Sierra Bullones; severe rains in Getafe and typhoons “Frank” and “Lando” that left significant damage to Bohol’s agricultural assets. Man-made calamities were also recorded during the period ranging from fire incidents, diarrhea outbreak and sea mishaps.
From 2006-2008, there were a total of 110 earthquakes, of which only 25 or 23% were perceptible and felt by the people in the affected location. Most of the quakes (77%) were not perceptible. The disaster preparedness and management services in Bohol have been formalized with the
organization of various disaster-related teams. These teams include the Search and Rescue (SAR) Unit, the Evacuation Unit, Emergency Response Operating Team, Relief Unit, Fire Suppression Team and the Transport teams. These teams are organized to be deployed and to respond to any types of emergencies throughout the province. It is noted that these teams are composed of various government and private organizations under the direct management of the City/ Municipal and Provincial Disaster Coordinating Councils. Each of these teams has its own focus of responsibilities that forms part of an integrated disaster management system. Personnel support and necessary equipments are also available to carry out these responsibilities. Moreover, volunteer groups have also been formed to provide appropriate assistance and support to emergency response teams. These volunteers, like those of the Red Cross Youths, have been given the necessary trainings and exposures to effectively provide the assistance. On the other hand, all municipalities in the province have already designated their evacuation centers which will be used in times of calamities, when necessary. There are about 1,032 public schools/ evacuation centers throughout the province. With the intention of promoting the safety and general welfare of the public, local government units have started to prepare their Disaster Preparedness Plan which sets the policies, strategies, programs and projects and operating procedures that all stakeholders should undertake to prevent, respond, minimize and mitigate the effects of natural and man-made disasters. This Preparedness Plan, however, should be prioritized and should form part in the development agenda of a local government and implemented through the provision of necessary funding support. Correspondingly, information/ education campaign (IEC) on disaster risk management as well as the strategies identified in the disaster preparedness plan should be undertaken by local governments through their respective
Table DevAd 13: Number of Earthquakes, Province of Bohol 2006-2008
Year Perceptible Non-Perceptible
Total Earthquakes
2006 6 42 48 2007 14 14 28
2008 5 29 34 Source: Philippine Institute of Volcanology and Seismology
PDPFP 2010-2015 – Development Administration Sector 280
Disaster Coordinating Councils. The Office of the Civil Defense is currently initiating the IEC on community-based disaster preparedness program. It is also important that different high risk areas in the province be identified and communicated to the general public to build awareness and prevent or at least minimize the after- effects of disasters. High risk areas may include those places that are prone to floods, earthquakes, landslides, fires, typhoons and heavy waves. Necessary preventive/ mitigating infrastructure programs as well as information drives should be implemented in these areas. Along these lines, there is a need to establish a Provincial Disaster Emergency Management Office to coordinate all disaster preparedness programs and initiatives in the province. The said office shall become the strategic operational arm of the Provincial Disaster Coordinating Council. Furthermore, Disaster Operation Centers at the municipal and barangay levels need to be strengthened through effective training programs for their personnel and improvement of collaborative linkages with other government agencies. Advocacies for volunteering services for emergency preparedness also need to be reinforced and conducted at the barangay level. In related matter, it is essential to build a reliable databanking system that will contain information like high risk areas, inventory of disaster management resources and services available in each municipality. Hazard and disaster response facilities maps shall also be developed for easy guidance and reference. This database and the maps, if developed and completed, should be readily accessible by emergency/ disaster response services and the general public. On the other hand, the ability to pro-actively prepare and respond to eminent dangers of calamities is usually dependent on the availability of reliable and updated environmental and geophysical information and forecasts. In Bohol, the Philippine Atmospheric, Geophysical and Astronomical Services Administration (PAGASA) – Tagbilaran Station has been the main source of information on weather forecasts and climatological and atmospheric conditions that become the basis of decisions for the promotion of general safety and welfare of the public and economy. Seismic activities in Bohol are also being continually monitored by the Philippine Institute of Volcanology and Seismology (PhIVolcS) through their short period seismographs and broadband seismometer. With Bohol in proximity with three (3) active fault lines, the importance of monitoring and observing seismic activities can never be discounted. Training sessions on Rapid Earthquake Damage Assessment System (REDAS) were also conducted for local government units in the province to build capability to simulate earthquake hazard scenarios as well as prepare multi-hazard maps and risks database. These components of the early warning mechanisms and initiatives in the province, however, need some level of improvement and support through personnel augmentation, equipment / facilities upgrading and continuous build-up of database. Support Legislation and Policies Legislative measures are very essential in ensuring sustainability and viability of initiatives for crime prevention, public safety and disaster preparedness. The Provincial Government, to cite one, has already enacted an ordinance for the establishment of an integrated fire
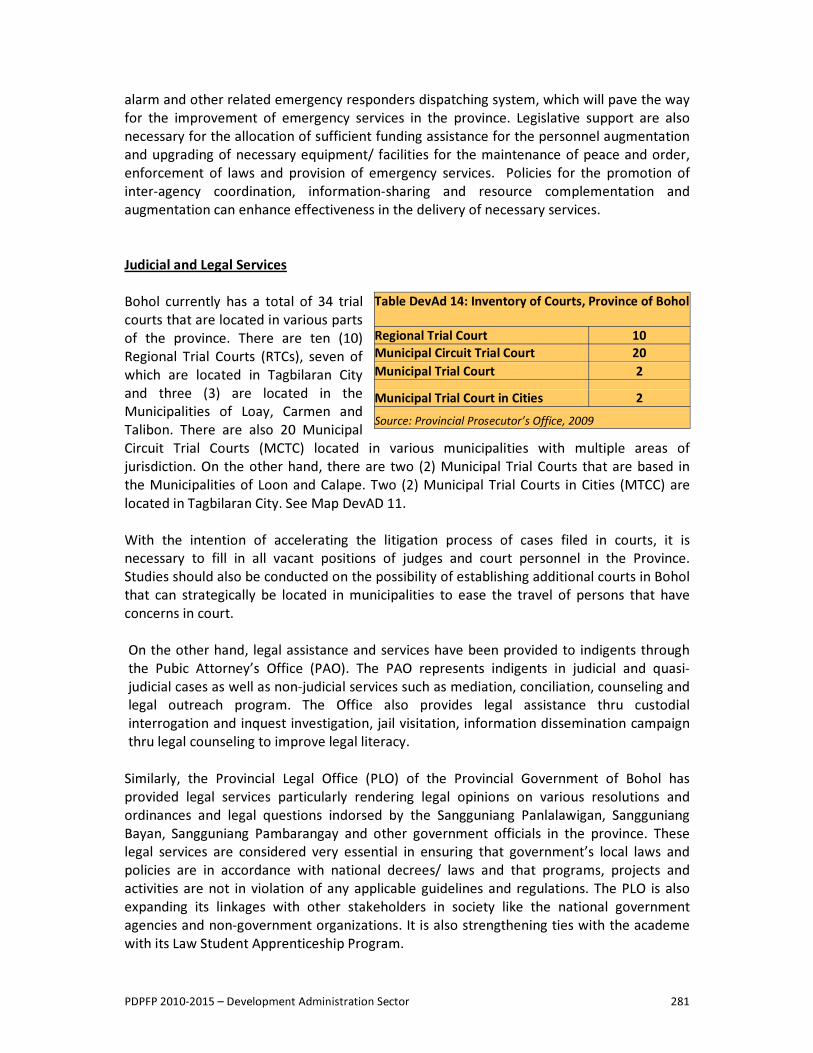
PDPFP 2010-2015 – Development Administration Sector 281
alarm and other related emergency responders dispatching system, which will pave the way for the improvement of emergency services in the province. Legislative support are also necessary for the allocation of sufficient funding assistance for the personnel augmentation and upgrading of necessary equipment/ facilities for the maintenance of peace and order, enforcement of laws and provision of emergency services. Policies for the promotion of inter-agency coordination, information-sharing and resource complementation and augmentation can enhance effectiveness in the delivery of necessary services. Judicial and Legal Services Bohol currently has a total of 34 trial courts that are located in various parts of the province. There are ten (10) Regional Trial Courts (RTCs), seven of which are located in Tagbilaran City and three (3) are located in the Municipalities of Loay, Carmen and Talibon. There are also 20 Municipal Circuit Trial Courts (MCTC) located in various municipalities with multiple areas of jurisdiction. On the other hand, there are two (2) Municipal Trial Courts that are based in the Municipalities of Loon and Calape. Two (2) Municipal Trial Courts in Cities (MTCC) are located in Tagbilaran City. See Map DevAD 11. With the intention of accelerating the litigation process of cases filed in courts, it is necessary to fill in all vacant positions of judges and court personnel in the Province. Studies should also be conducted on the possibility of establishing additional courts in Bohol that can strategically be located in municipalities to ease the travel of persons that have concerns in court. On the other hand, legal assistance and services have been provided to indigents through the Pubic Attorney’s Office (PAO). The PAO represents indigents in judicial and quasi-judicial cases as well as non-judicial services such as mediation, conciliation, counseling and legal outreach program. The Office also provides legal assistance thru custodial interrogation and inquest investigation, jail visitation, information dissemination campaign thru legal counseling to improve legal literacy.
Similarly, the Provincial Legal Office (PLO) of the Provincial Government of Bohol has provided legal services particularly rendering legal opinions on various resolutions and ordinances and legal questions indorsed by the Sangguniang Panlalawigan, Sangguniang Bayan, Sangguniang Pambarangay and other government officials in the province. These legal services are considered very essential in ensuring that government’s local laws and policies are in accordance with national decrees/ laws and that programs, projects and activities are not in violation of any applicable guidelines and regulations. The PLO is also expanding its linkages with other stakeholders in society like the national government agencies and non-government organizations. It is also strengthening ties with the academe with its Law Student Apprenticeship Program.
Table DevAd 14: Inventory of Courts, Province of Bohol
Regional Trial Court 10 Municipal Circuit Trial Court 20 Municipal Trial Court 2 Municipal Trial Court in Cities 2 Source: Provincial Prosecutor’s Office, 2009
PDPFP 2010-2015 – Development Administration Sector 282
In terms of public prosecution, the Prosecutors Office is responsible for the conduct of preliminary investigations and inquest of criminal cases filed in courts for prosecution. Considering the number of cases being handled by the office, it is necessary to augment the number of prosecutors in Bohol. It is also essential to enhance the coordination between the Prosecutor’s Office and the Philippine National Police, especially in the conduct of investigation and other court-related activities. Siilar with other public offices, the Prosecutor’s Office needs sufficient office space and equipment to improve the performance of their functions. ISSUES AND CONCERNS OF THE SUB-SECTOR
� Presence in the Province of illegal gambling, illegal fishing, drug abuse, incidence of human trafficking
� Non-participation of some local officials in crime prevention/ enforcement efforts of the local police force
� Limited opportunities for personnel development and training (for justice, safety, peace and order offices)
� Limited budget to support operations on crime prevention, disaster management, emergency services, safety, peace and order, intelligence gathering, prosecution, search and rescue, counter-insurgency, legal services
� Absence of trained Explosive and Ordnance Disposal (EOD) unit, K-9 unit to deal with bomb threats in the province (PNP, Phil. Army)
� Non-incorporation of disaster management plans into the development plan � No permanent disaster and emergency office – the Public Safety and Emergency
Management Office to handle the affairs of the Provincial Disaster Coordinating Council � Slow litigation processes of inmates’ cases – causing detention beyond maximum penalties
and congestion in local jails � Limited databank on disaster-related information (e.g. high risk areas, emergency services
available) � Limited support mechanisms for volunteer groups, emergency responders and community
organizations � Absence of calamity insurance for public infrastructure and facilities � Insufficient equipment support for emergency, search and rescue and other justice and
safety functions (BDJ, PCG, BFP, Parole & Prob., PCG, PNP, PNRC, Prosecutor, PNP –Marine, Phil. Army, PAO, PLO, PhiVolcs, OCD)
� Lack of regular and qualified personnel for the Justice and Safety Sector (Provincial District Jail, Provincial Parole & Probation Administration, Office of the Civil Defense, PCG, PAGASA, PhiVolcs, PNP, PNRC, Prosecutors, PNP-Maritime Police, PAO
� Lack of necessary building/ office spaces (BDJ, PAGASA, BFP, Prosecutor, PLO) � Non-compliance with safety laws such as building code, fire code, land use zoning � Need to improve inter-office coordination and support (PLO-LGUs, PNP-Parole, Prosecutor -
CIDT/Military, PNP-Prosecutor, RedCross – Health Services, Emergency Services) � Implementation of new laws that somehow hinder the execution of functions (PNP difficulty
in operating anti-illegal drugs campaign with the passage of new-anti-illegal drugs law that requires several requisites and procedures before any action is made; DepEd Memorandum preventing students/ parents from giving donations/ aids to Red Cross)
� Threat of not sustaining programs and projects to address all types of disaster
PDPFP 2010-2015 – Development Administration Sector 283
DEVELOPMENT FRAMEWORK Vision Towards a progressive, safe, and peaceful environment in the Province of Bohol with the active support of all sectors of the community
Goals
� Maintained peaceful and safe environment conducive to living and socio-economic development
� Enhanced overall quality of public safety, law enforcement, legal and justice services and facilities in the Province
� Improved community’s level of disaster awareness and preparedness
� Improved level of intelligence efforts in thwarting crime and insurgency � Strengthened operations of local disaster coordinating councils � Sufficient financial resources to support operations and programs of the justice and safety
sector
Objectives and Targets • To reduce or maintain crime rate lower than the regional/ national average
• To reduce yearly fire incidence and improve public awareness on fire prevention in all municipalities of Bohol
• To strengthen enforcement of all laws, policies and safety regulations
• To upgrade all structures, facilities and equipment of all offices/ agencies performing protective services, law enforcement, disaster management, emergency services, jail management, parole services, legal and justice services by year 2015
• To fully establish and operate necessary protective/ emergency units and systems by year 2013 (Explosive Ordnance Disposal (EOD) and K-9 Unit, EMS SRU, Emergency Dispatching System)
• To send 100% of justice and safety personnel that require training to capability-building sessions by 2015
• To provide the necessary personnel benefits to all justice and safety personnel as required by law
PDPFP 2010-2015 – Development Administration Sector 284
• To address 100% of hiring requirements to augment personnel performing protective services, law enforcement, disaster management, emergency services, jail management, parole services, legal and justice services by 2015
• To conduct coordination meetings with law enforcement and justice and safety agencies on a regular basis or at least every semester of the year
• To increase community awareness on disaster risk management and preparedness of all barangays in the province
• To prepare and fully implement Disaster Management Plan by year 2010
• To obtain 100% of local official’s cooperation in the campaign against illegal activities throughout the province
• To obtain 100% information sharing between intelligence and law enforcement agencies
� To develop standard templates as tools for inventory of Disaster Management Resources by 2010
� To develop Community-based Disaster Preparedness Plan in all local governments by 2011
� To establish a fully functional disaster database system by 2010 � To establish a fully functional Disaster Management Office by 2011 • To enhance fund counterparting arrangements between LGUs, National Government
Agencies and the private sector to appropriately fund yearly priority programs of the justice and safety sector offices and agencies
• To simplify and streamline procedures in fund releases to support crime prevention and disaster management by year 2011
Strategies
� Enforcement of laws, policies and safety regulations � Intensification of information, education campaign for crime / fire prevention,
emergency services, legal assistance services, parole & probation services � Strengthening linkages and coordination with Local Government Units, Government
Agencies, NGOs and the private sector for crime prevention, emergency preparedness and disaster risk management
PDPFP 2010-2015 – Development Administration Sector 285
� Promotion of moral standards and appropriate societal behavior among all sectors of society
� Development and enhancement of capabilities of personnel � Recruitment, augmentation and hiring of competent personnel � Service delivery improvement through provision/upgrading of equipment & facilities,
lot acquisition and building and structures improvement � Improvement of crime solving capacities of law enforcement personnel � Expansion of Emergency Medical Services (EMS) and Special Rescue Unit (RSU) � Enhancement of inter-office coordination in the enforcement of laws and case
litigation � Provision of quality technical and legal assistance to clients � Granting of appropriate personnel allowances and benefits enhancing personnel
motivation � Enactment of quality legislative measures to support promotion of peace and order
and disaster management � Continuing advocacy on disaster risk management � Inclusion of Disaster Management Plan in the Provincial Development Plan � Installation of support mechanisms for volunteer groups and community responders � Establishment of a Provincial Disaster Management Office � Strengthening relationships and linkages with LGUs, NGAs, NGOs & other
stakeholders � Activation and skills enhancement for local disaster coordination councils � Fund sourcing and counter-parting arrangements with local governments/national
agencies
Major Plans & Programs
� Crime prevention and enforcement program (2010-2015) � Enforcement of laws, policies and safety regulations (2010-2015) � Conduct trainings on Anti-terrorism and disaster (2010)
PDPFP 2010-2015 – Development Administration Sector 286
� Continuing information dissemination on geologic hazards (2010-2015) � Advocacy for public and private partnership on crime prevention and disaster risk
management (2010-2015) � Enactment of legislative measures supporting peace, order and public safety (2010-
2015) � Capability Building Skills Enhancement Training (802nd , BFP, PNRC, BDJ, PLO, Parole
& Probation) (2010-2015) � Upgrading of office and tactical equipment/ facilities/ buildings and structures (802
PA, BFP, PNRC, BDJ, PhiVolcs, PAGASA, PNP, PLO, OCD, PDCC, 703 Maritime Police, BPPPO, PAO, PPO, CGS) (2010-2015)
� Hiring of personnel (PNP, BPPPO, PPO, PDCC, PAGASA, PAO) (2010-2015) � PNP Explosive Ordnance Disposal (EOD) and K-9 Unit Program � Deployment of permanent AFP Explosive Ordnance Disposal (EOD) team in Bohol � Implementation of discipline zone at least in five municipalities by 2015 � Acquisition of fire trucks � Establishment of new fire stations in the municipalities of Catigbian, San Miguel,
Candijay and Trinidad � Construction of new District Jails � Rehabilitation Programs for inmates � Prosecutors Office Building construction � Construction of CGS detachment in Balicasag Island, Panglao, Bohol � Business Process Enhancement Program (ARTA/CITIZEN’S CHARTER) � BFP Emergency Medical Services and Special Rescue Unit Program (2013) � Provision of non-judicial and legal services to indigents in judicial and quasai-judicial
cases � Legal Outreach Program � Institutionalization of the Public Safety and Emergency Management Office � Development of standard templates as tools for inventory of Disaster Management
Resources � Facilitate trainings on Disaster Risk Management, cluster Approach, Incident
Command System, Contingency Planning Formulation (2010-2011) � Massive Information Education Campaign on Disaster Risk Management � Community-based type of Disaster Preparedness Program � Preparation of the Disaster Preparedness Plans and Programs for the inclusion in the
development plan of the province � Strengthening of the 24-hour manning of the Disaster Operation Center from PDC
down to BDCC � Data banking program � Establishment of communication flow on warning information and feedback
mechanism from PDCC CDCC/ MDCC, BDCC and community level � Community-based Disaster Preparedness Program
PDPFP 2010-2015 Infrastructure Development Sector
Provincial Development and Physical Framework Plan 2010-2015
INFRASTRUCTURE DEVELOPMENT SECTOR
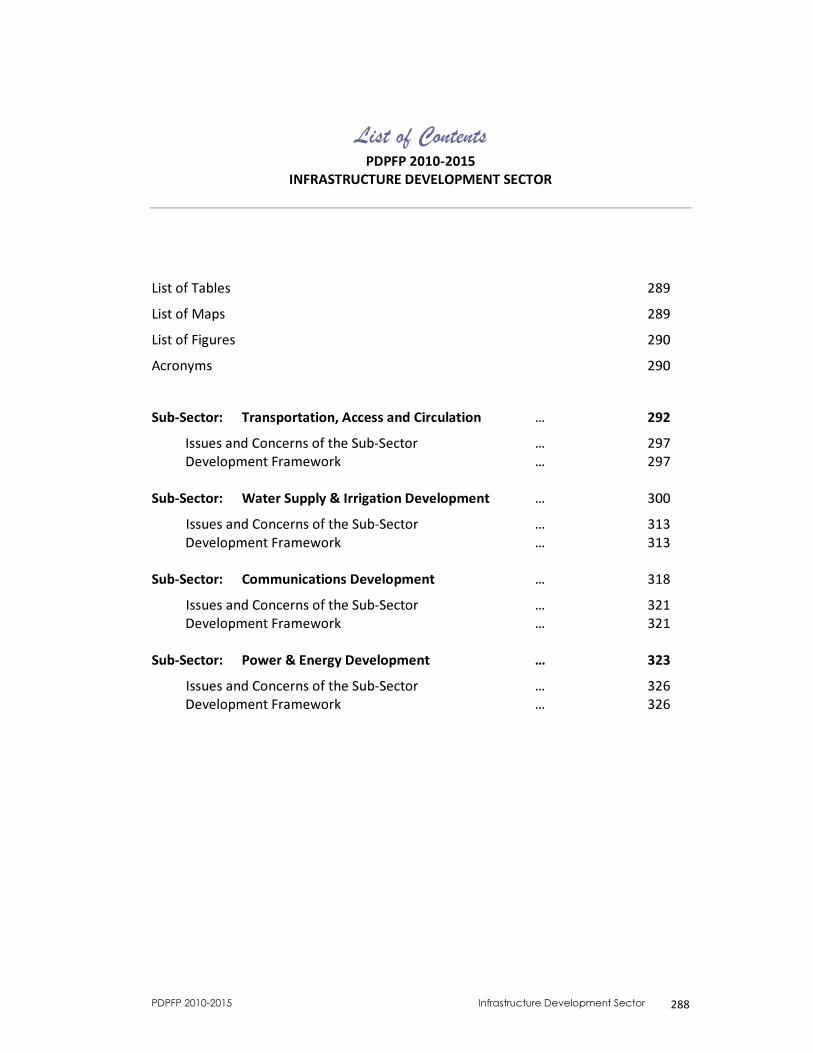
PDPFP 2010-2015 Infrastructure Development Sector 288
List of Contents
PDPFP 2010-2015 INFRASTRUCTURE DEVELOPMENT SECTOR
List of Tables 289 List of Maps 289 List of Figures 290 Acronyms 290 Sub-Sector: Transportation, Access and Circulation … 292
Issues and Concerns of the Sub-Sector … 297 Development Framework … 297
Sub-Sector: Water Supply & Irrigation Development … 300
Issues and Concerns of the Sub-Sector … 313 Development Framework … 313
Sub-Sector: Communications Development … 318
Issues and Concerns of the Sub-Sector … 321 Development Framework … 321
Sub-Sector: Power & Energy Development … 323
Issues and Concerns of the Sub-Sector … 326 Development Framework … 326
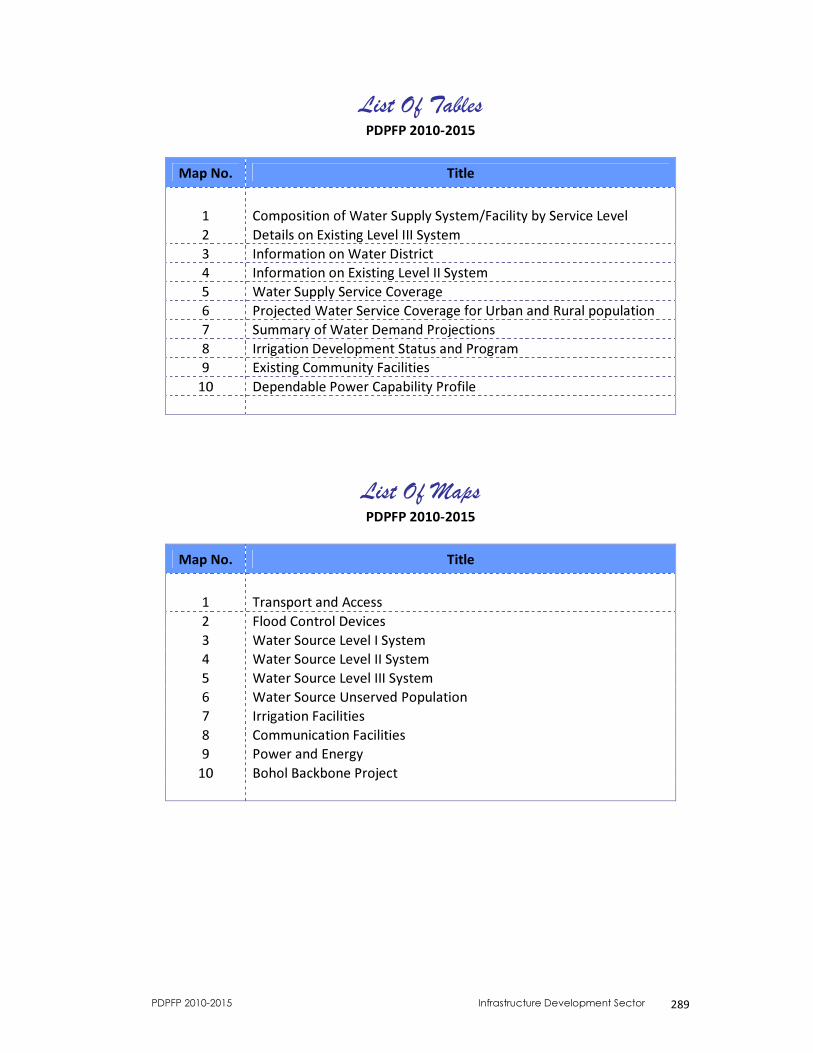
PDPFP 2010-2015 Infrastructure Development Sector 289
List Of Tables PDPFP 2010-2015
Map No. Title
1 Composition of Water Supply System/Facility by Service Level 2 Details on Existing Level III System 3 Information on Water District 4 Information on Existing Level II System 5 Water Supply Service Coverage 6 Projected Water Service Coverage for Urban and Rural population 7 Summary of Water Demand Projections 8 Irrigation Development Status and Program 9 Existing Community Facilities
10 Dependable Power Capability Profile
List Of Maps PDPFP 2010-2015
Map No. Title
1 Transport and Access 2 Flood Control Devices 3 Water Source Level I System 4 Water Source Level II System 5 Water Source Level III System 6 Water Source Unserved Population 7 Irrigation Facilities 8 Communication Facilities 9 Power and Energy
10 Bohol Backbone Project
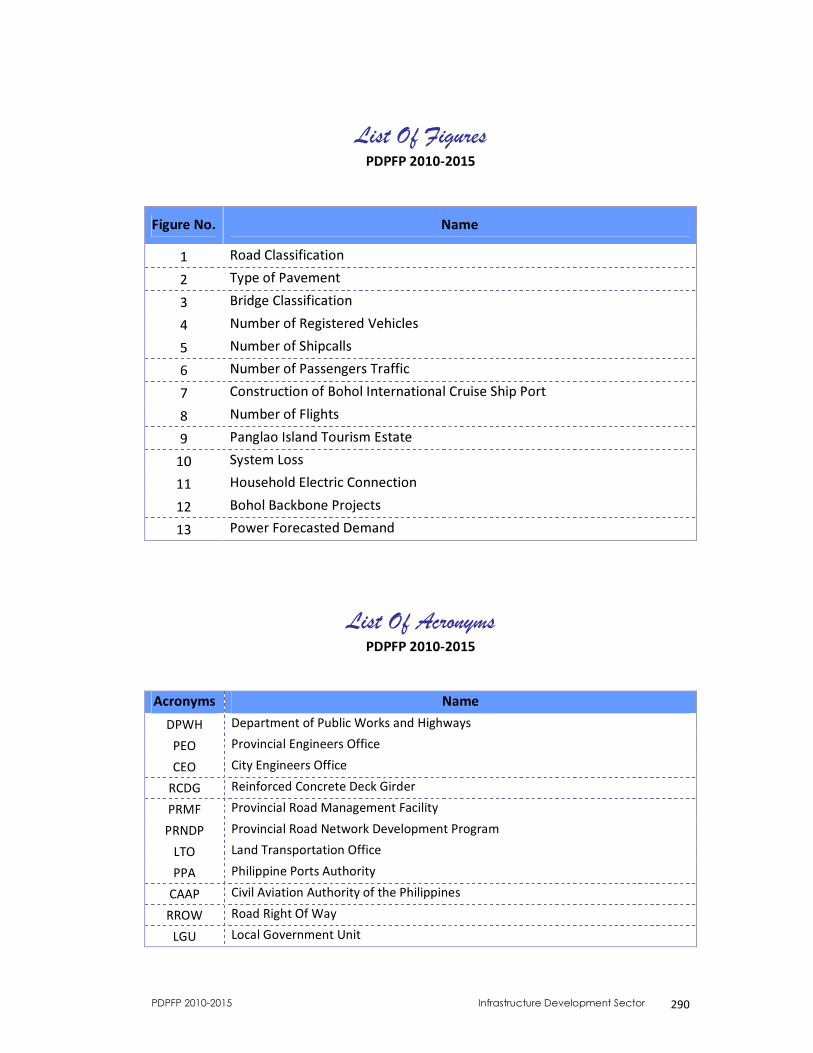
PDPFP 2010-2015 Infrastructure Development Sector 290
List Of Figures
PDPFP 2010-2015
Figure No. Name 1 Road Classification 2 Type of Pavement 3 Bridge Classification 4 Number of Registered Vehicles 5 Number of Shipcalls 6 Number of Passengers Traffic 7 Construction of Bohol International Cruise Ship Port 8 Number of Flights 9 Panglao Island Tourism Estate
10 System Loss 11 Household Electric Connection 12 Bohol Backbone Projects 13 Power Forecasted Demand
List Of Acronyms
PDPFP 2010-2015
Acronyms Name DPWH Department of Public Works and Highways
PEO Provincial Engineers Office CEO City Engineers Office
RCDG Reinforced Concrete Deck Girder PRMF Provincial Road Management Facility
PRNDP Provincial Road Network Development Program LTO Land Transportation Office PPA Philippine Ports Authority
CAAP Civil Aviation Authority of the Philippines RROW Road Right Of Way
LGU Local Government Unit
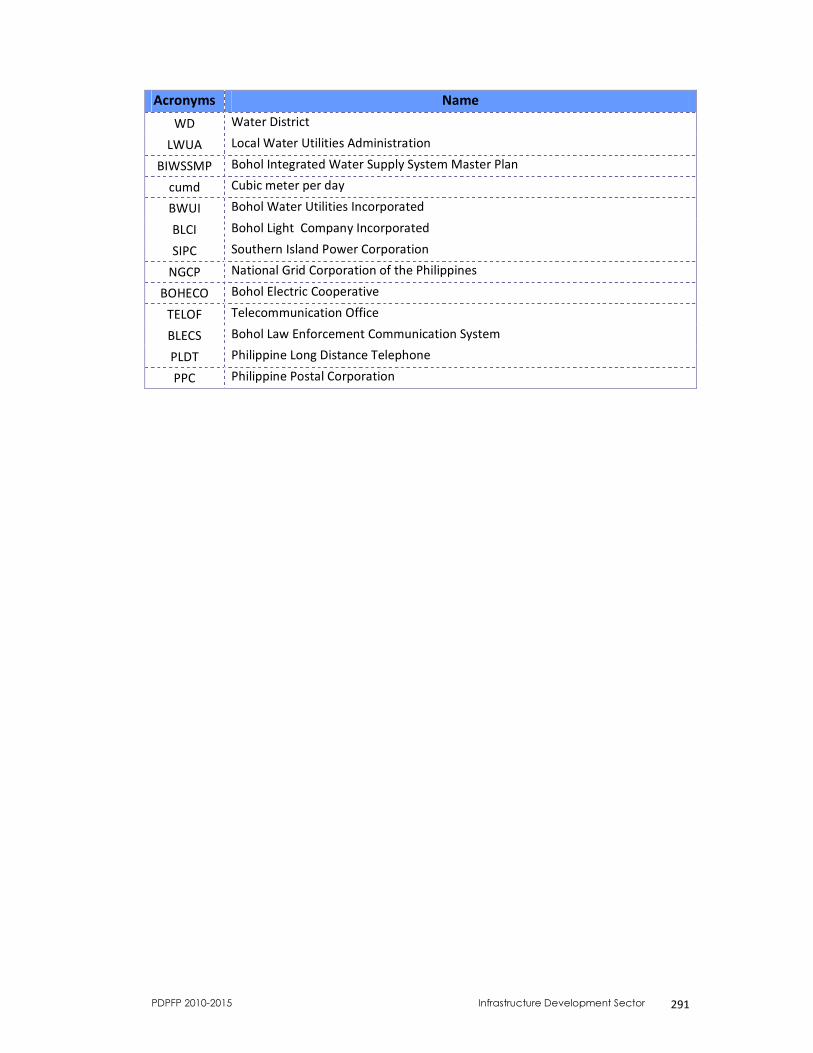
PDPFP 2010-2015 Infrastructure Development Sector 291
Acronyms Name WD Water District
LWUA Local Water Utilities Administration BIWSSMP Bohol Integrated Water Supply System Master Plan
cumd Cubic meter per day BWUI Bohol Water Utilities Incorporated BLCI Bohol Light Company Incorporated SIPC Southern Island Power Corporation
NGCP National Grid Corporation of the Philippines BOHECO Bohol Electric Cooperative
TELOF Telecommunication Office BLECS Bohol Law Enforcement Communication System PLDT Philippine Long Distance Telephone PPC Philippine Postal Corporation
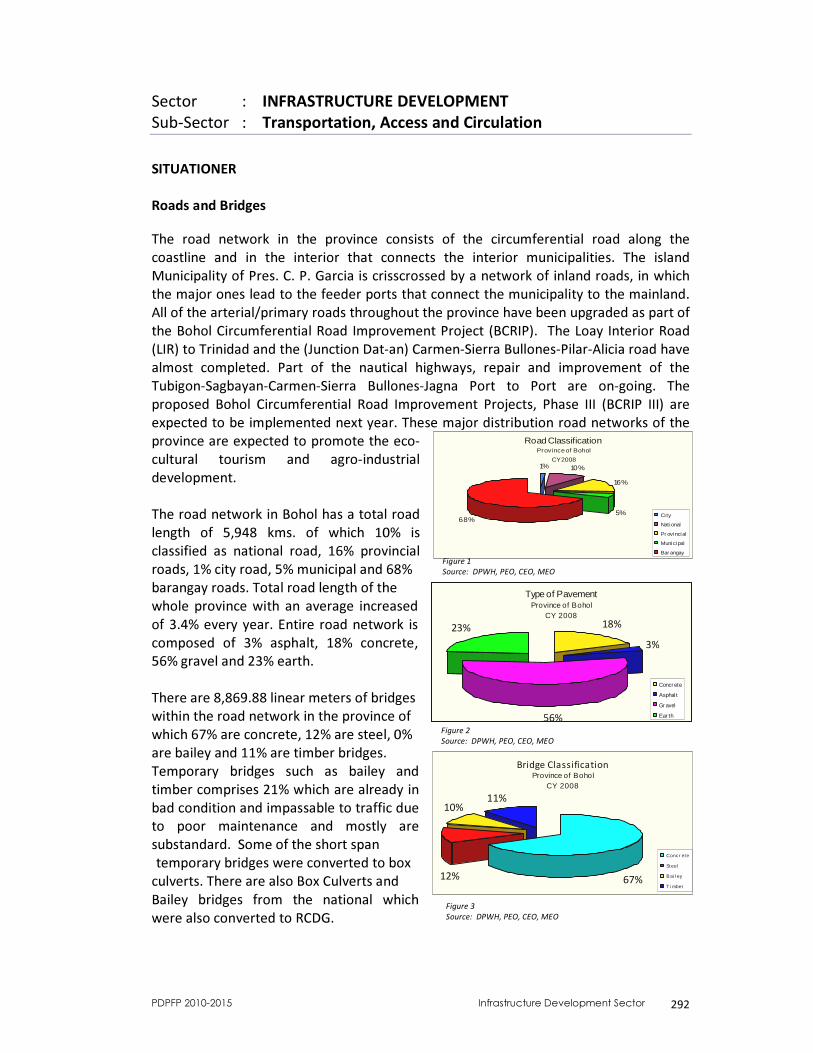
PDPFP 2010-2015 Infrastructure Development Sector 292
Road ClassificationProvince of Bohol
CY 2008
68%
10%1%
16%
5% Ci ty
National
Pr ovincial
Municipal
Bar angay
Type of PavementProvince of Bohol
CY 200818%
3%
56%
23%
Concr ete
Asphal t
Gr avel
Ear th
Bridge ClassificationProvince of Bohol
CY 2008
11%10%
12% 67%
Concr ete
Steel
Bai l ey
T i mber
Figure 1 Source: DPWH, PEO, CEO, MEO
Figure 2 Source: DPWH, PEO, CEO, MEO
Figure 3 Source: DPWH, PEO, CEO, MEO
Sector : INFRASTRUCTURE DEVELOPMENT Sub-Sector : Transportation, Access and Circulation SITUATIONER Roads and Bridges The road network in the province consists of the circumferential road along the coastline and in the interior that connects the interior municipalities. The island Municipality of Pres. C. P. Garcia is crisscrossed by a network of inland roads, in which the major ones lead to the feeder ports that connect the municipality to the mainland. All of the arterial/primary roads throughout the province have been upgraded as part of the Bohol Circumferential Road Improvement Project (BCRIP). The Loay Interior Road (LIR) to Trinidad and the (Junction Dat-an) Carmen-Sierra Bullones-Pilar-Alicia road have almost completed. Part of the nautical highways, repair and improvement of the Tubigon-Sagbayan-Carmen-Sierra Bullones-Jagna Port to Port are on-going. The proposed Bohol Circumferential Road Improvement Projects, Phase III (BCRIP III) are expected to be implemented next year. These major distribution road networks of the province are expected to promote the eco-cultural tourism and agro-industrial development. The road network in Bohol has a total road length of 5,948 kms. of which 10% is classified as national road, 16% provincial roads, 1% city road, 5% municipal and 68% barangay roads. Total road length of the whole province with an average increased of 3.4% every year. Entire road network is composed of 3% asphalt, 18% concrete, 56% gravel and 23% earth. There are 8,869.88 linear meters of bridges within the road network in the province of which 67% are concrete, 12% are steel, 0% are bailey and 11% are timber bridges. Temporary bridges such as bailey and timber comprises 21% which are already in bad condition and impassable to traffic due to poor maintenance and mostly are substandard. Some of the short span temporary bridges were converted to box culverts. There are also Box Culverts and Bailey bridges from the national which were also converted to RCDG.
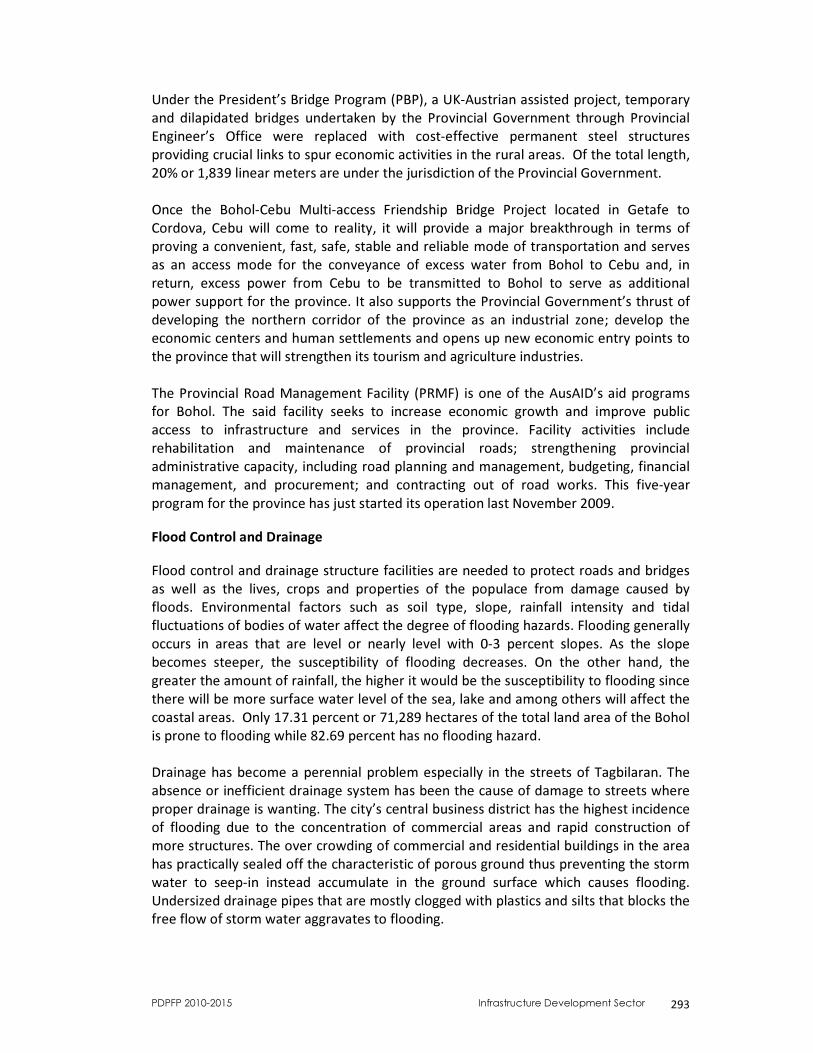
PDPFP 2010-2015 Infrastructure Development Sector 293
Under the President’s Bridge Program (PBP), a UK-Austrian assisted project, temporary and dilapidated bridges undertaken by the Provincial Government through Provincial Engineer’s Office were replaced with cost-effective permanent steel structures providing crucial links to spur economic activities in the rural areas. Of the total length, 20% or 1,839 linear meters are under the jurisdiction of the Provincial Government. Once the Bohol-Cebu Multi-access Friendship Bridge Project located in Getafe to Cordova, Cebu will come to reality, it will provide a major breakthrough in terms of proving a convenient, fast, safe, stable and reliable mode of transportation and serves as an access mode for the conveyance of excess water from Bohol to Cebu and, in return, excess power from Cebu to be transmitted to Bohol to serve as additional power support for the province. It also supports the Provincial Government’s thrust of developing the northern corridor of the province as an industrial zone; develop the economic centers and human settlements and opens up new economic entry points to the province that will strengthen its tourism and agriculture industries. The Provincial Road Management Facility (PRMF) is one of the AusAID’s aid programs for Bohol. The said facility seeks to increase economic growth and improve public access to infrastructure and services in the province. Facility activities include rehabilitation and maintenance of provincial roads; strengthening provincial administrative capacity, including road planning and management, budgeting, financial management, and procurement; and contracting out of road works. This five-year program for the province has just started its operation last November 2009. Flood Control and Drainage Flood control and drainage structure facilities are needed to protect roads and bridges as well as the lives, crops and properties of the populace from damage caused by floods. Environmental factors such as soil type, slope, rainfall intensity and tidal fluctuations of bodies of water affect the degree of flooding hazards. Flooding generally occurs in areas that are level or nearly level with 0-3 percent slopes. As the slope becomes steeper, the susceptibility of flooding decreases. On the other hand, the greater the amount of rainfall, the higher it would be the susceptibility to flooding since there will be more surface water level of the sea, lake and among others will affect the coastal areas. Only 17.31 percent or 71,289 hectares of the total land area of the Bohol is prone to flooding while 82.69 percent has no flooding hazard. Drainage has become a perennial problem especially in the streets of Tagbilaran. The absence or inefficient drainage system has been the cause of damage to streets where proper drainage is wanting. The city’s central business district has the highest incidence of flooding due to the concentration of commercial areas and rapid construction of more structures. The over crowding of commercial and residential buildings in the area has practically sealed off the characteristic of porous ground thus preventing the storm water to seep-in instead accumulate in the ground surface which causes flooding. Undersized drainage pipes that are mostly clogged with plastics and silts that blocks the free flow of storm water aggravates to flooding.
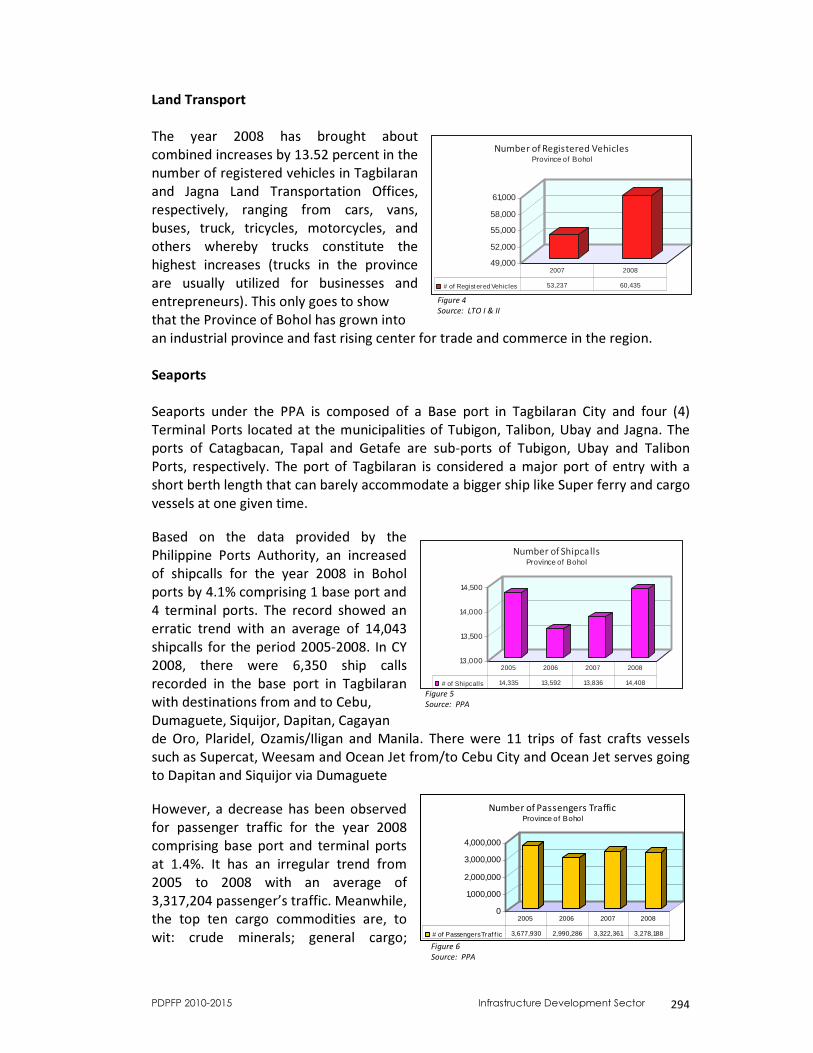
PDPFP 2010-2015 Infrastructure Development Sector 294
49,000
52,000
55,000
58,000
61,000
Number of Registered VehiclesProvince of Bohol
# of Regist ered Vehicles 53,237 60,435
2007 2008
Figure 4 Source: LTO I & II
13,000
13,500
14,000
14,500
Number of ShipcallsProvince of Bohol
# of Shipcalls 14,335 13,592 13,836 14,408
2005 2006 2007 2008
Figure 5 Source: PPA
0
1,000,000
2,000,000
3,000,000
4,000,000
Number of Passengers TrafficProvince of Bohol
# of Passengers Traf f ic 3,677,930 2,990,286 3,322,361 3,278,188
2005 2006 2007 2008
Figure 6 Source: PPA
Land Transport The year 2008 has brought about combined increases by 13.52 percent in the number of registered vehicles in Tagbilaran and Jagna Land Transportation Offices, respectively, ranging from cars, vans, buses, truck, tricycles, motorcycles, and others whereby trucks constitute the highest increases (trucks in the province are usually utilized for businesses and entrepreneurs). This only goes to show that the Province of Bohol has grown into an industrial province and fast rising center for trade and commerce in the region. Seaports Seaports under the PPA is composed of a Base port in Tagbilaran City and four (4) Terminal Ports located at the municipalities of Tubigon, Talibon, Ubay and Jagna. The ports of Catagbacan, Tapal and Getafe are sub-ports of Tubigon, Ubay and Talibon Ports, respectively. The port of Tagbilaran is considered a major port of entry with a short berth length that can barely accommodate a bigger ship like Super ferry and cargo vessels at one given time. Based on the data provided by the Philippine Ports Authority, an increased of shipcalls for the year 2008 in Bohol ports by 4.1% comprising 1 base port and 4 terminal ports. The record showed an erratic trend with an average of 14,043 shipcalls for the period 2005-2008. In CY 2008, there were 6,350 ship calls recorded in the base port in Tagbilaran with destinations from and to Cebu, Dumaguete, Siquijor, Dapitan, Cagayan de Oro, Plaridel, Ozamis/Iligan and Manila. There were 11 trips of fast crafts vessels such as Supercat, Weesam and Ocean Jet from/to Cebu City and Ocean Jet serves going to Dapitan and Siquijor via Dumaguete
However, a decrease has been observed for passenger traffic for the year 2008 comprising base port and terminal ports at 1.4%. It has an irregular trend from 2005 to 2008 with an average of 3,317,204 passenger’s traffic. Meanwhile, the top ten cargo commodities are, to wit: crude minerals; general cargo;
PDPFP 2010-2015 Infrastructure Development Sector 295
cement; grains; petroleum products; copra; animal feeds; bottled cargo; fertilizer; and fruits and vegetables. The other ports of Talibon, Tubigon and Ubay served conventional passenger-cargo vessels from/ to Cebu City. Ubay Port is the gateway to Metro Manila, it served regular trips of RORO vessel going from/to Manila by land trip via Bato, Leyte and motor bancas from/ to Maasin, Southern Leyte, and Bato, Leyte due to its proximity to Leyte. All of these ports need additional support facilities like transit sheds, passenger terminals, parking areas and berthing areas. Jagna Port offers services that ply between Bohol to Cagayan, Nasipit and Camiguin with roll-on, roll-off route. The Port of Tubigon is the busiest among the terminal ports and the second highest number of ship calls after Tagbilaran with 4,783 ship calls. It offers more than ten daily round trips plying the Cebu-Bohol route. While Tapal Port has the lowest number of ship calls at only 73. Only small vessels can dock on these ports except at the port of Jagna where bigger ones can be accommodated. All of the existing seaport facilities are inadequate for future demand. The existing traffic for the municipal/fish ports consists mainly of small vessels, motor bancas, pump boats and fishing boats used for transporting agricultural, fishery products and live animals from and to the nearby islands and Cebu City. However, Lighterage Cargo Transport (LCT) vessels in unloading aggregates and heavy equipments also utilize Manga Fishport, an alternate port to accommodate LCT Barge/Vessels and other low draft vessels to decongest the base port. The Port of Bien Unido, Alburquerque Causeway and Loay River Quay are used for loading silica to other provinces. The Philippine Ports Authority (PPA) constructed the International Cruise Ship Port in Catagbacan Port in Loon, Bohol. The project commenced last May 2009 with the project cost of P80-million for phase I. This means a big boost to Bohol economy, especially to the tourism industry, since the cruise industry is a fast-growing sector of global tourism. The said port is modern and one of its kinds. Aside from the ports in Metro Manila, this will be “usable” in time for huge global luxury liners to dock. The Port officials identified the project contractor as the WTG Construction and Development Corporation. The project is expected to be inaugurated in April-May this year.
Figure 7, Phase 1 Construction of Bohol International Cruise Ship Port, Catagbacan Port, Loon Source : PPA
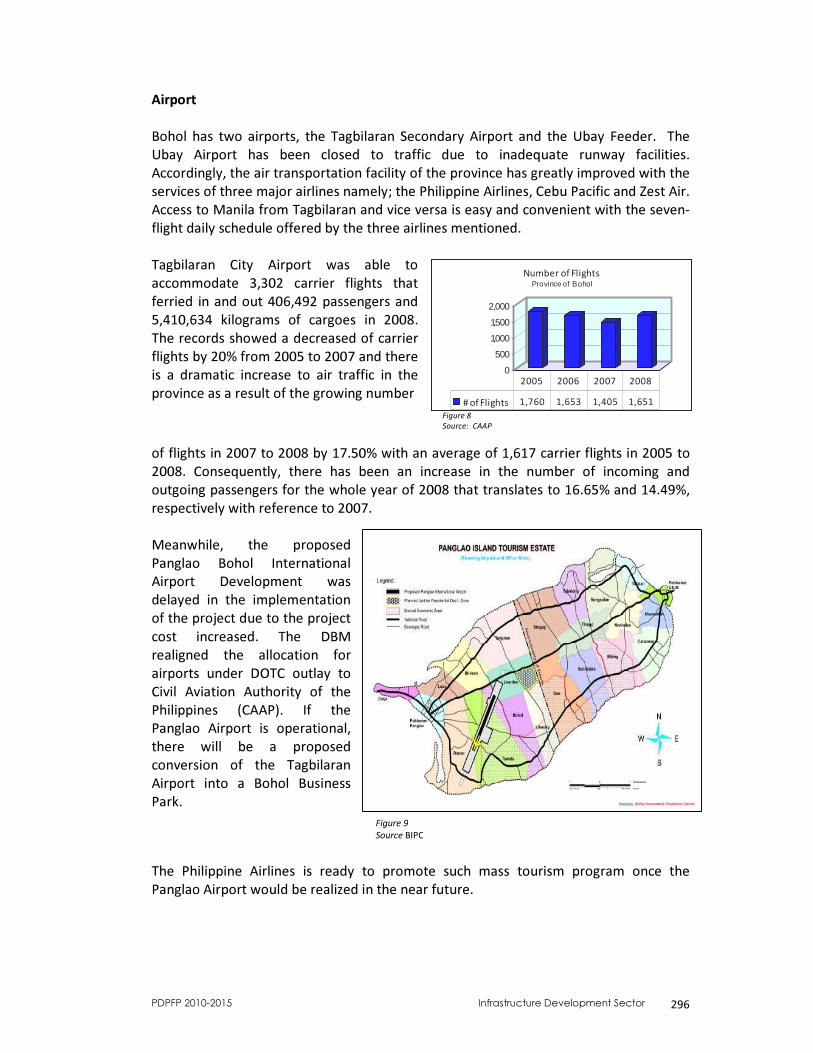
PDPFP 2010-2015 Infrastructure Development Sector 296
0
500
1,000
1,500
2,000
Number of FlightsProvince of Bohol
# of Flights 1,760 1,653 1,405 1,6512005 2006 2007 2008
Figure 8 Source: CAAP
Airport Bohol has two airports, the Tagbilaran Secondary Airport and the Ubay Feeder. The Ubay Airport has been closed to traffic due to inadequate runway facilities. Accordingly, the air transportation facility of the province has greatly improved with the services of three major airlines namely; the Philippine Airlines, Cebu Pacific and Zest Air. Access to Manila from Tagbilaran and vice versa is easy and convenient with the seven-flight daily schedule offered by the three airlines mentioned. Tagbilaran City Airport was able to accommodate 3,302 carrier flights that ferried in and out 406,492 passengers and 5,410,634 kilograms of cargoes in 2008. The records showed a decreased of carrier flights by 20% from 2005 to 2007 and there is a dramatic increase to air traffic in the province as a result of the growing number of flights in 2007 to 2008 by 17.50% with an average of 1,617 carrier flights in 2005 to 2008. Consequently, there has been an increase in the number of incoming and outgoing passengers for the whole year of 2008 that translates to 16.65% and 14.49%, respectively with reference to 2007. Meanwhile, the proposed Panglao Bohol International Airport Development was delayed in the implementation of the project due to the project cost increased. The DBM realigned the allocation for airports under DOTC outlay to Civil Aviation Authority of the Philippines (CAAP). If the Panglao Airport is operational, there will be a proposed conversion of the Tagbilaran Airport into a Bohol Business Park. The Philippine Airlines is ready to promote such mass tourism program once the Panglao Airport would be realized in the near future.
Figure 9 Source BIPC
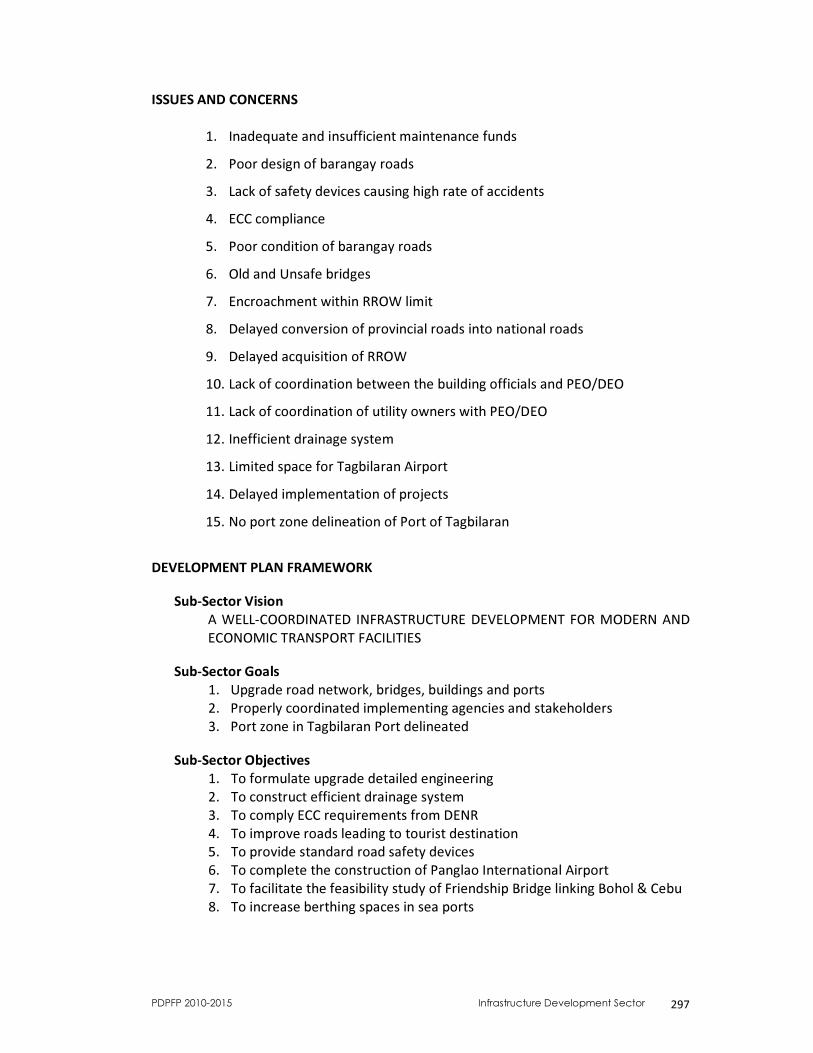
PDPFP 2010-2015 Infrastructure Development Sector 297
ISSUES AND CONCERNS
1. Inadequate and insufficient maintenance funds 2. Poor design of barangay roads 3. Lack of safety devices causing high rate of accidents 4. ECC compliance 5. Poor condition of barangay roads 6. Old and Unsafe bridges 7. Encroachment within RROW limit 8. Delayed conversion of provincial roads into national roads 9. Delayed acquisition of RROW 10. Lack of coordination between the building officials and PEO/DEO 11. Lack of coordination of utility owners with PEO/DEO 12. Inefficient drainage system 13. Limited space for Tagbilaran Airport 14. Delayed implementation of projects 15. No port zone delineation of Port of Tagbilaran
DEVELOPMENT PLAN FRAMEWORK
Sub-Sector Vision A WELL-COORDINATED INFRASTRUCTURE DEVELOPMENT FOR MODERN AND ECONOMIC TRANSPORT FACILITIES
Sub-Sector Goals
1. Upgrade road network, bridges, buildings and ports 2. Properly coordinated implementing agencies and stakeholders 3. Port zone in Tagbilaran Port delineated
Sub-Sector Objectives
1. To formulate upgrade detailed engineering 2. To construct efficient drainage system 3. To comply ECC requirements from DENR 4. To improve roads leading to tourist destination 5. To provide standard road safety devices 6. To complete the construction of Panglao International Airport 7. To facilitate the feasibility study of Friendship Bridge linking Bohol & Cebu 8. To increase berthing spaces in sea ports
PDPFP 2010-2015 Infrastructure Development Sector 298
Sub-Sector Strategies 1. Complying the standard design, specification and other requirements for
roads, bridges, building and ports 2. Strengthening of coordination with the stakeholders, implementing agency
and other concerned agencies 3. Upgrading transport system and facilities
Plans, Programs/ Activities
PEO : • Improvement of Long Span Provincial Bridges • Conversion of Short Span Bridges into Box Culvert • Improvement of Roads Leading to Tourist Spots and Ports • Concreting/Asphalting/Soil Stabilization of Steep Grades & Flood Prone Areas • Fortification of Causeways and Problems Roads • Linkage Roads DPWH I: • Improvement (concreting) of Access Roads Panglao Airport • Bateria Bridge, Tubigon, Bohol • Jct. (TNR) Cortes-Balilihan-Catigbian Road • Jct. (TNR) Maribojoc-Antequera-Catagbacan Road (Loon) • Concreting of Panglao Road leading to beaches (Dauis) • Reconstruction of TNR along Cortes-Calape (Broken Section) • Reconstruction of Jct. (TER) Dauis-Panglao Road • Panglao Island Circumferentail Road Project (Dauis-Panglao) • Tagbilaran-Corella-Sikatuna Road Section • Balilihan-Corella Road • Widening of Causeway of Jct. (TER) Dauis-Panglao Road (J. Borja Bridge & Vaño Br.) • Improv./concreting and Widening of Panglao Island Central Spur Road • Balilihan River Control • Calunasan River Control • Improvement of DPWH Building • Various VILP Projects DPWH II: • Urgent National Arterial/Secondary Roads & Bridges • Rehabilitation, Reconstruction of Damaged National Roads Generated From Pavement Management System/Highway Development and Management (HDM-4) • Road Upgrading (Gravel to Concrete) based on Gravel Road Strategies Traffic Benchmark for Upgrading to Paved National Road Standards (HDM-4 Project Analysis) • Flood Control and Drainage • Local Roads and Bridges • Farm to Market Roads
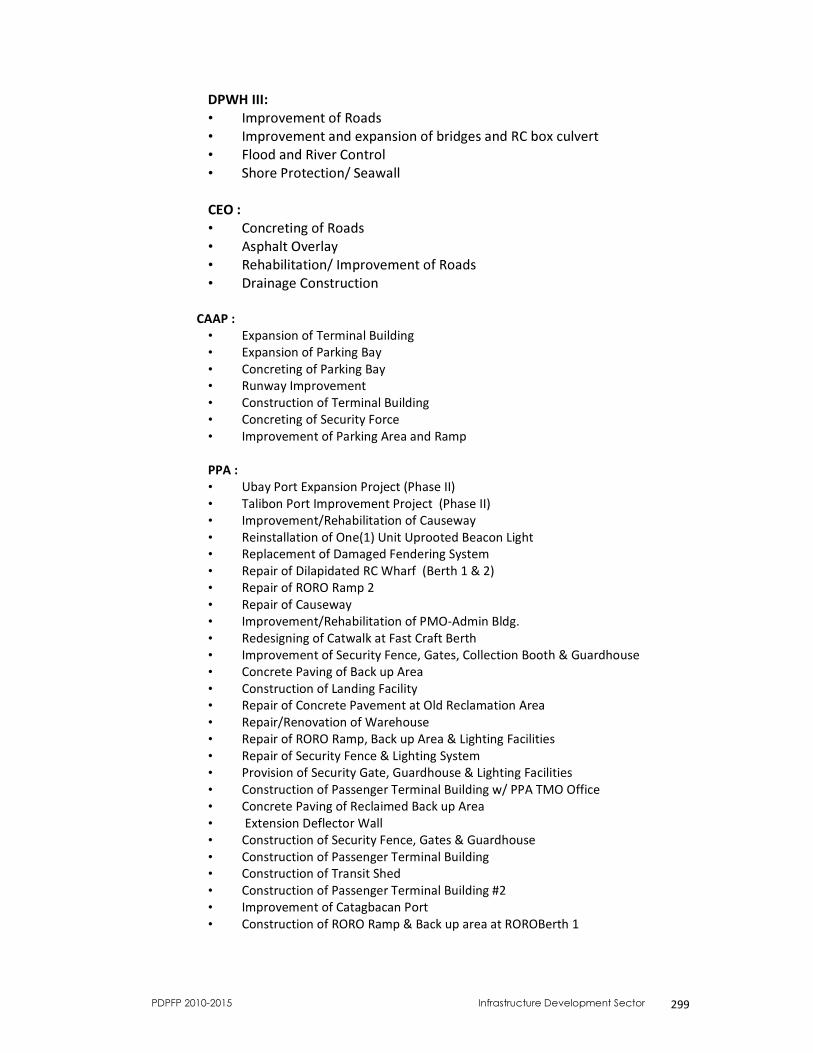
PDPFP 2010-2015 Infrastructure Development Sector 299
DPWH III: • Improvement of Roads • Improvement and expansion of bridges and RC box culvert • Flood and River Control • Shore Protection/ Seawall CEO : • Concreting of Roads • Asphalt Overlay • Rehabilitation/ Improvement of Roads • Drainage Construction
CAAP :
• Expansion of Terminal Building • Expansion of Parking Bay • Concreting of Parking Bay • Runway Improvement • Construction of Terminal Building • Concreting of Security Force • Improvement of Parking Area and Ramp PPA : • Ubay Port Expansion Project (Phase II) • Talibon Port Improvement Project (Phase II) • Improvement/Rehabilitation of Causeway • Reinstallation of One(1) Unit Uprooted Beacon Light • Replacement of Damaged Fendering System • Repair of Dilapidated RC Wharf (Berth 1 & 2) • Repair of RORO Ramp 2 • Repair of Causeway • Improvement/Rehabilitation of PMO-Admin Bldg. • Redesigning of Catwalk at Fast Craft Berth • Improvement of Security Fence, Gates, Collection Booth & Guardhouse • Concrete Paving of Back up Area • Construction of Landing Facility • Repair of Concrete Pavement at Old Reclamation Area • Repair/Renovation of Warehouse • Repair of RORO Ramp, Back up Area & Lighting Facilities • Repair of Security Fence & Lighting System • Provision of Security Gate, Guardhouse & Lighting Facilities • Construction of Passenger Terminal Building w/ PPA TMO Office • Concrete Paving of Reclaimed Back up Area • Extension Deflector Wall • Construction of Security Fence, Gates & Guardhouse • Construction of Passenger Terminal Building • Construction of Transit Shed • Construction of Passenger Terminal Building #2 • Improvement of Catagbacan Port • Construction of RORO Ramp & Back up area at ROROBerth 1
PDPFP 2010-2015 Infrastructure Development Sector 300
Sector : INFRASTRUCTURE DEVELOPMENT Sub-Sector : Water Supply & Irrigation Development SITUATIONER Existing Water Supply Situation About 80.95% of the total populations of Bohol have access to safe water sources which are either provided by Level I, II or III facilities while the remaining 19.05% rely on unsafe water sources (PW4SP Updating, 2008). In addition, proper water treatment and purification is not regularly practiced in most of the municipalities. Inadequate safe water sources and water treatment are the possible causes of water-borne diseases such as diarrhea and acute gastro-enteritis. Incidence of water-borne diseases in the province was prevalent for the past six years (2001-2006) with diarrhea/gastroenteritis being one of the top ranking causes of morbidity. In a rapid assessment conducted by the Consultant through field surveys and interviews in July and August 2007, about 523 barangays of the 1109 barangays in Bohol, have Level III water systems that are being managed by the LGUs Water Districts or Water Cooperatives. The estimated population served by these Level III facilities is about 413,000 comprising of more or less 75,000 households. These figures represent roughly 32% of the 1,293,400 projected population of Bohol in 2007. The existing sources are comprised of wells (shallow/deep/dug) and springs. There are no reliable records of production from the sources in most municipalities. Water production quantity measurement should be undertaken to have an estimate of the groundwater abstraction. There are two municipal water systems utilizing surface water sources, namely Dagohoy (Mas-ing Creek) and Ubay (Calanggaman Catchment Area) but both are experiencing water quality problems due to inadequate treatment process. The municipalities in the southwestern part of the province like Garcia Hernandez, Valencia and Lila have abundant spring sources while municipalities in the north such as Getafe, Buenavista, Trinidad and San Miguel have very scarce water resource. The waterworks system managed by LGU operates as an economic enterprise usually under the office of the Municipal Planning and Development Coordinator. The Municipal Health Office is in-charge of the treatment of the water system’s sources and facilities. Bill collections from water usage are undertaken by the Municipal Treasurers Office or remitted to the said office. There average consumption varies from 60 lpcd in rural municipalities to 200 lpcd in the highly urbanized city of Tagbilaran. The water rates vary from a low of PhP15.00 for the first 10 cum to a high of PhP70 for the first 3 cum. Most of the municipalities do not have records of non-revenue water, however information gathered from few municipalities who have available records showed that NRW varies from a low of about 5% (Antequera) to a high 48% (Tubigon). The municipal waterworks offices should keep and maintain a record of water production and consumption to have an estimate of NRW. Municipal waterworks systems with high
PDPFP 2010-2015 Infrastructure Development Sector 301
NRW should improve individual system and implement measures to reduce NRW in order to maximize supply and reduce cost of operation. Based on the result survey, the waterworks personnel need institutional trainings (administrative, financial and technical) to improve the capacity to manage and operate the systems. Level III (individual house connection) systems at municipal level are usually established and operated by the LGUs and waterworks associations. Some LGUs also implement and operate Level III systems commonly at barangay level. There are 90 service providers for Level III systems in the province under different kinds of ownership. The Bohol Water Utilities is the largest system in the province, covering 14 urban barangays in the City of Tagbilaran with a served population of approximately 49,000. The Bohol Water Utilities covers about 90% of the urban barangays in the capital city. Water source of the Bohol Water Utilities is deep well. The remainder of the population in the capital city is served by Tagbilaran City WWS. Next to Bohol Water Utilities is the Loon LGU. This water system covers 10 urban and 8 rural barangays in the municipality of Loon with a total served population of 29,165. Water from this system mainly comes from spring and deep well water sources. In the municipalities of Antequera, Batuan, Danao, Dimiao, G. Hernandez, Lila, Loon, San Isidro, Sevilla, and portions of Sikatuna, and Valencia, the Level III systems are managed by the LGU. There are only two water districts (WD) in the province, the Talibon Water District and the Clarin Water District. These systems are under the technical and financial assistance of LWUA. Chlorination is practiced in all Level III systems. According to local officials, Level III systems undergo disinfection once a month. The different service providers have not been able to come up with a complete detail with regard to production capacity of the spring and deep well sources as well as the daily consumption. It is recommended that a proper monitoring and accounting with regard to the monthly production and consumption of water be institutionalized so as to determine if the consumption exceeds the production or vice versa and sound management strategies can be enforced and implemented. There are a total of 96 operating bodies providing Level II systems in 26 municipalities in the province. Majority of these is utilizing spring sources (69 systems), while the remaining systems are using deep well sources. Types of Facilities and Definition of Service Level Standard (1) Composition of Water Supply System/Facility The National Sector Master Plan (NSMP) defines service level and system components of the water supply systems as shown in Table 1 NEDA Board Resolution No. 12 (s. 1995) also provides the approved definition of terms relative to water supply including levels of service (Table 2). These terms are to be adopted by all government agencies including LGUs.
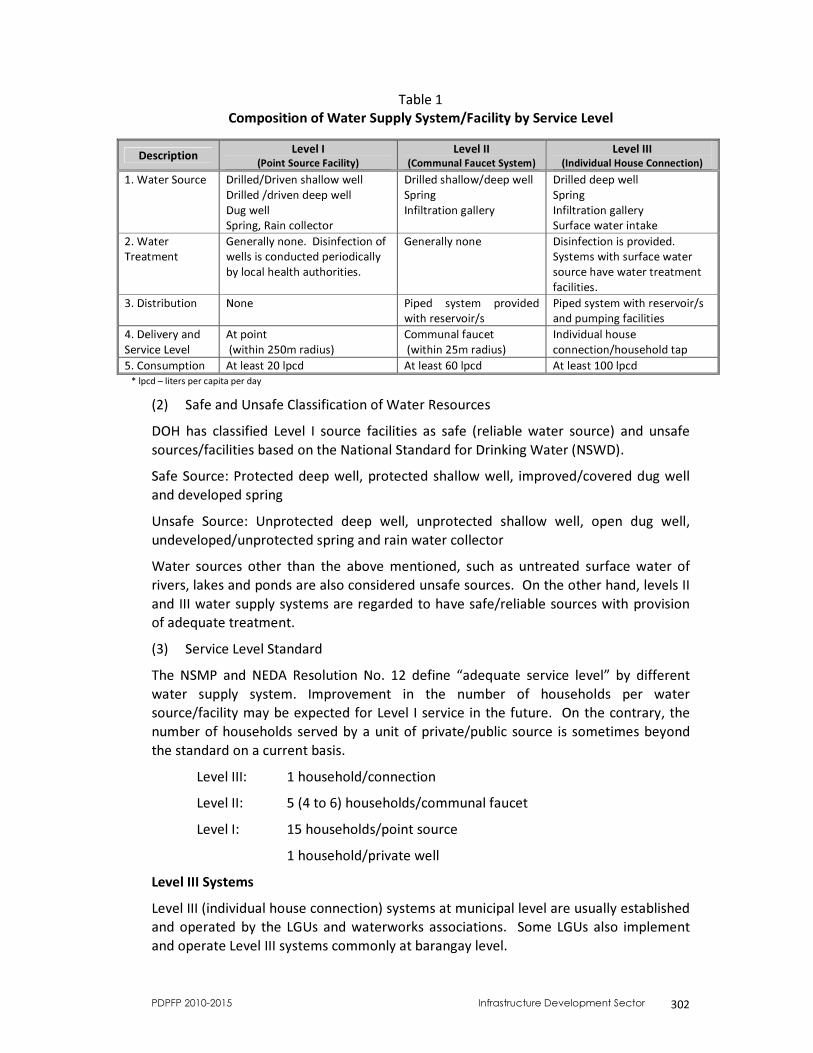
PDPFP 2010-2015 Infrastructure Development Sector 302
Table 1 Composition of Water Supply System/Facility by Service Level
Description Level I (Point Source Facility)
Level II (Communal Faucet System)
Level III (Individual House Connection)
1. Water Source Drilled/Driven shallow well Drilled /driven deep well Dug well Spring, Rain collector
Drilled shallow/deep well Spring Infiltration gallery
Drilled deep well Spring Infiltration gallery Surface water intake
2. Water Treatment
Generally none. Disinfection of wells is conducted periodically by local health authorities.
Generally none Disinfection is provided. Systems with surface water source have water treatment facilities.
3. Distribution None Piped system provided with reservoir/s
Piped system with reservoir/s and pumping facilities
4. Delivery and Service Level
At point (within 250m radius)
Communal faucet (within 25m radius)
Individual house connection/household tap
5. Consumption At least 20 lpcd At least 60 lpcd At least 100 lpcd * lpcd – liters per capita per day
(2) Safe and Unsafe Classification of Water Resources DOH has classified Level I source facilities as safe (reliable water source) and unsafe sources/facilities based on the National Standard for Drinking Water (NSWD). Safe Source: Protected deep well, protected shallow well, improved/covered dug well and developed spring Unsafe Source: Unprotected deep well, unprotected shallow well, open dug well, undeveloped/unprotected spring and rain water collector Water sources other than the above mentioned, such as untreated surface water of rivers, lakes and ponds are also considered unsafe sources. On the other hand, levels II and III water supply systems are regarded to have safe/reliable sources with provision of adequate treatment. (3) Service Level Standard The NSMP and NEDA Resolution No. 12 define “adequate service level” by different water supply system. Improvement in the number of households per water source/facility may be expected for Level I service in the future. On the contrary, the number of households served by a unit of private/public source is sometimes beyond the standard on a current basis. Level III: 1 household/connection Level II: 5 (4 to 6) households/communal faucet Level I: 15 households/point source 1 household/private well Level III Systems Level III (individual house connection) systems at municipal level are usually established and operated by the LGUs and waterworks associations. Some LGUs also implement and operate Level III systems commonly at barangay level.
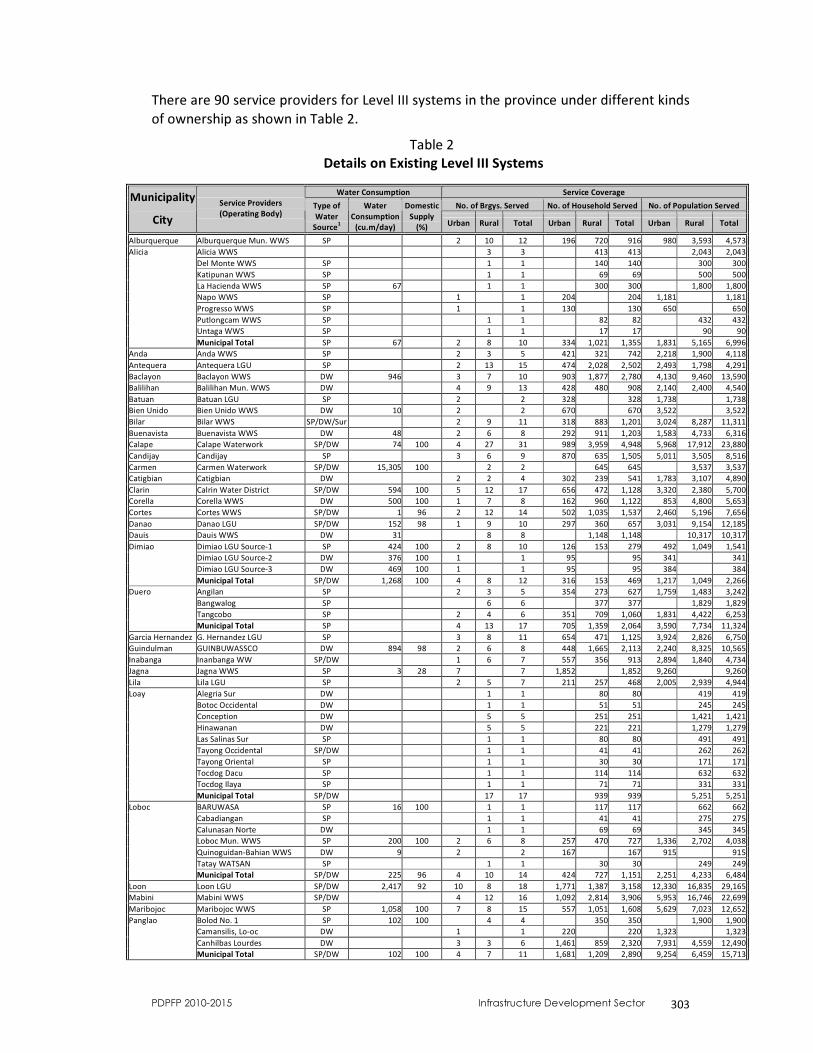
PDPFP 2010-2015 Infrastructure Development Sector 303
There are 90 service providers for Level III systems in the province under different kinds of ownership as shown in Table 2.
Table 2 Details on Existing Level III Systems
Water Consumption Service Coverage
No. of Brgys. Served No. of Household Served No. of Population Served Municipality City
Service Providers (Operating Body) Type of
Water Source1
Water Consumption
(cu.m/day)
Domestic Supply
(%) Urban Rural Total Urban Rural Total Urban Rural Total Alburquerque Alburquerque Mun. WWS SP 2 10 12 196 720 916 980 3,593 4,573 Alicia Alicia WWS 3 3 413 413 2,043 2,043 Del Monte WWS SP 1 1 140 140 300 300 Katipunan WWS SP 1 1 69 69 500 500 La Hacienda WWS SP 67 1 1 300 300 1,800 1,800 Napo WWS SP 1 1 204 204 1,181 1,181 Progresso WWS SP 1 1 130 130 650 650 Putlongcam WWS SP 1 1 82 82 432 432 Untaga WWS SP 1 1 17 17 90 90 Municipal Total SP 67 2 8 10 334 1,021 1,355 1,831 5,165 6,996 Anda Anda WWS SP 2 3 5 421 321 742 2,218 1,900 4,118 Antequera Antequera LGU SP 2 13 15 474 2,028 2,502 2,493 1,798 4,291 Baclayon Baclayon WWS DW 946 3 7 10 903 1,877 2,780 4,130 9,460 13,590 Balilihan Balilihan Mun. WWS DW 4 9 13 428 480 908 2,140 2,400 4,540 Batuan Batuan LGU SP 2 2 328 328 1,738 1,738 Bien Unido Bien Unido WWS DW 10 2 2 670 670 3,522 3,522 Bilar Bilar WWS SP/DW/Sur 2 9 11 318 883 1,201 3,024 8,287 11,311 Buenavista Buenavista WWS DW 48 2 6 8 292 911 1,203 1,583 4,733 6,316 Calape Calape Waterwork SP/DW 74 100 4 27 31 989 3,959 4,948 5,968 17,912 23,880 Candijay Candijay SP 3 6 9 870 635 1,505 5,011 3,505 8,516 Carmen Carmen Waterwork SP/DW 15,305 100 2 2 645 645 3,537 3,537 Catigbian Catigbian DW 2 2 4 302 239 541 1,783 3,107 4,890 Clarin Calrin Water District SP/DW 594 100 5 12 17 656 472 1,128 3,320 2,380 5,700 Corella Corella WWS DW 500 100 1 7 8 162 960 1,122 853 4,800 5,653 Cortes Cortes WWS SP/DW 1 96 2 12 14 502 1,035 1,537 2,460 5,196 7,656 Danao Danao LGU SP/DW 152 98 1 9 10 297 360 657 3,031 9,154 12,185 Dauis Dauis WWS DW 31 8 8 1,148 1,148 10,317 10,317 Dimiao Dimiao LGU Source-1 SP 424 100 2 8 10 126 153 279 492 1,049 1,541 Dimiao LGU Source-2 DW 376 100 1 1 95 95 341 341 Dimiao LGU Source-3 DW 469 100 1 1 95 95 384 384 Municipal Total SP/DW 1,268 100 4 8 12 316 153 469 1,217 1,049 2,266 Duero Angilan SP 2 3 5 354 273 627 1,759 1,483 3,242 Bangwalog SP 6 6 377 377 1,829 1,829 Tangcobo SP 2 4 6 351 709 1,060 1,831 4,422 6,253 Municipal Total SP 4 13 17 705 1,359 2,064 3,590 7,734 11,324 Garcia Hernandez G. Hernandez LGU SP 3 8 11 654 471 1,125 3,924 2,826 6,750 Guindulman GUINBUWASSCO DW 894 98 2 6 8 448 1,665 2,113 2,240 8,325 10,565 Inabanga Inanbanga WW SP/DW 1 6 7 557 356 913 2,894 1,840 4,734 Jagna Jagna WWS SP 3 28 7 7 1,852 1,852 9,260 9,260 Lila Lila LGU SP 2 5 7 211 257 468 2,005 2,939 4,944 Loay Alegria Sur DW 1 1 80 80 419 419 Botoc Occidental DW 1 1 51 51 245 245 Conception DW 5 5 251 251 1,421 1,421 Hinawanan DW 5 5 221 221 1,279 1,279 Las Salinas Sur SP 1 1 80 80 491 491 Tayong Occidental SP/DW 1 1 41 41 262 262 Tayong Oriental SP 1 1 30 30 171 171 Tocdog Dacu SP 1 1 114 114 632 632 Tocdog Ilaya SP 1 1 71 71 331 331 Municipal Total SP/DW 17 17 939 939 5,251 5,251 Loboc BARUWASA SP 16 100 1 1 117 117 662 662 Cabadiangan SP 1 1 41 41 275 275 Calunasan Norte DW 1 1 69 69 345 345 Loboc Mun. WWS SP 200 100 2 6 8 257 470 727 1,336 2,702 4,038 Quinoguidan-Bahian WWS DW 9 2 2 167 167 915 915 Tatay WATSAN SP 1 1 30 30 249 249 Municipal Total SP/DW 225 96 4 10 14 424 727 1,151 2,251 4,233 6,484 Loon Loon LGU SP/DW 2,417 92 10 8 18 1,771 1,387 3,158 12,330 16,835 29,165 Mabini Mabini WWS SP/DW 4 12 16 1,092 2,814 3,906 5,953 16,746 22,699 Maribojoc Maribojoc WWS SP 1,058 100 7 8 15 557 1,051 1,608 5,629 7,023 12,652 Panglao Bolod No. 1 SP 102 100 4 4 350 350 1,900 1,900 Camansilis, Lo-oc DW 1 1 220 220 1,323 1,323 Canhilbas Lourdes DW 3 3 6 1,461 859 2,320 7,931 4,559 12,490 Municipal Total SP/DW 102 100 4 7 11 1,681 1,209 2,890 9,254 6,459 15,713
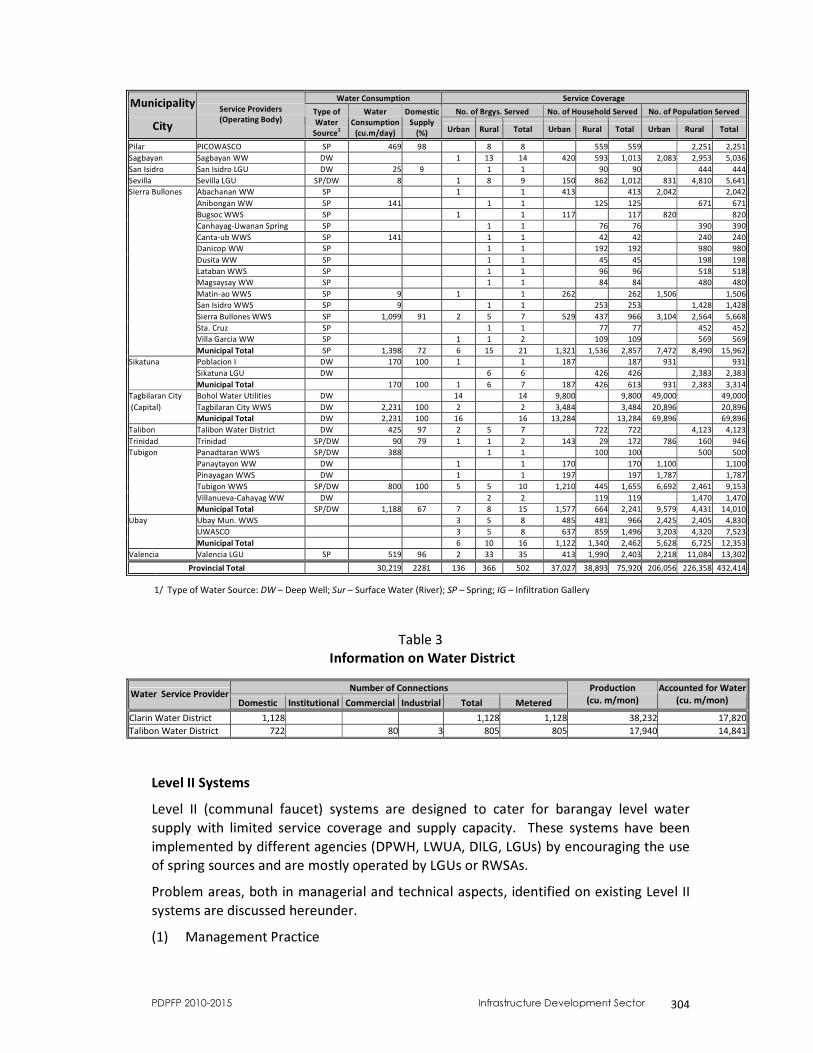
PDPFP 2010-2015 Infrastructure Development Sector 304
Water Consumption Service Coverage No. of Brgys. Served No. of Household Served No. of Population Served Municipality
City Service Providers (Operating Body) Type of
Water Source1
Water Consumption
(cu.m/day)
Domestic Supply
(%) Urban Rural Total Urban Rural Total Urban Rural Total Pilar PICOWASCO SP 469 98 8 8 559 559 2,251 2,251 Sagbayan Sagbayan WW DW 1 13 14 420 593 1,013 2,083 2,953 5,036 San Isidro San Isidro LGU DW 25 9 1 1 90 90 444 444 Sevilla Sevilla LGU SP/DW 8 1 8 9 150 862 1,012 831 4,810 5,641 Sierra Bullones Abachanan WW SP 1 1 413 413 2,042 2,042 Anibongan WW SP 141 1 1 125 125 671 671 Bugsoc WWS SP 1 1 117 117 820 820 Canhayag-Uwanan Spring SP 1 1 76 76 390 390 Canta-ub WWS SP 141 1 1 42 42 240 240 Danicop WW SP 1 1 192 192 980 980 Dusita WW SP 1 1 45 45 198 198 Lataban WWS SP 1 1 96 96 518 518 Magsaysay WW SP 1 1 84 84 480 480 Matin-ao WWS SP 9 1 1 262 262 1,506 1,506 San Isidro WWS SP 9 1 1 253 253 1,428 1,428 Sierra Bullones WWS SP 1,099 91 2 5 7 529 437 966 3,104 2,564 5,668 Sta. Cruz SP 1 1 77 77 452 452 Villa Garcia WW SP 1 1 2 109 109 569 569 Municipal Total SP 1,398 72 6 15 21 1,321 1,536 2,857 7,472 8,490 15,962 Sikatuna Poblacion I DW 170 100 1 1 187 187 931 931 Sikatuna LGU DW 6 6 426 426 2,383 2,383 Municipal Total 170 100 1 6 7 187 426 613 931 2,383 3,314 Tagbilaran City Bohol Water Utilities DW 14 14 9,800 9,800 49,000 49,000 (Capital) Tagbilaran City WWS DW 2,231 100 2 2 3,484 3,484 20,896 20,896 Municipal Total DW 2,231 100 16 16 13,284 13,284 69,896 69,896 Talibon Talibon Water District DW 425 97 2 5 7 722 722 4,123 4,123 Trinidad Trinidad SP/DW 90 79 1 1 2 143 29 172 786 160 946 Tubigon Panadtaran WWS SP/DW 388 1 1 100 100 500 500 Panaytayon WW DW 1 1 170 170 1,100 1,100 Pinayagan WWS DW 1 1 197 197 1,787 1,787 Tubigon WWS SP/DW 800 100 5 5 10 1,210 445 1,655 6,692 2,461 9,153 Villanueva-Cahayag WW DW 2 2 119 119 1,470 1,470 Municipal Total SP/DW 1,188 67 7 8 15 1,577 664 2,241 9,579 4,431 14,010 Ubay Ubay Mun. WWS 3 5 8 485 481 966 2,425 2,405 4,830 UWASCO 3 5 8 637 859 1,496 3,203 4,320 7,523 Municipal Total 6 10 16 1,122 1,340 2,462 5,628 6,725 12,353 Valencia Valencia LGU SP 519 96 2 33 35 413 1,990 2,403 2,218 11,084 13,302
Provincial Total 30,219 2281 136 366 502 37,027 38,893 75,920 206,056 226,358 432,414
1/ Type of Water Source: DW – Deep Well; Sur – Surface Water (River); SP – Spring; IG – Infiltration Gallery
Table 3
Information on Water District
Number of Connections Water Service Provider Domestic Institutional Commercial Industrial Total Metered Production
(cu. m/mon) Accounted for Water
(cu. m/mon) Clarin Water District 1,128 1,128 1,128 38,232 17,820Talibon Water District 722 80 3 805 805 17,940 14,841
Level II Systems Level II (communal faucet) systems are designed to cater for barangay level water supply with limited service coverage and supply capacity. These systems have been implemented by different agencies (DPWH, LWUA, DILG, LGUs) by encouraging the use of spring sources and are mostly operated by LGUs or RWSAs. Problem areas, both in managerial and technical aspects, identified on existing Level II systems are discussed hereunder. (1) Management Practice
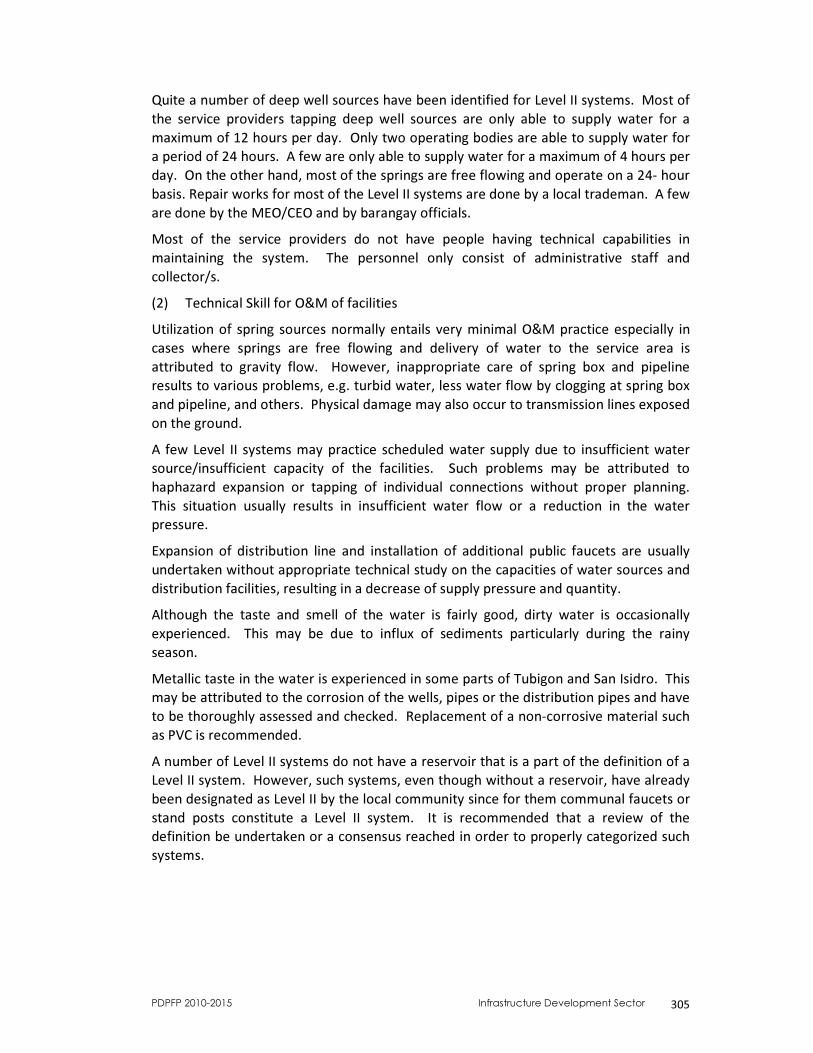
PDPFP 2010-2015 Infrastructure Development Sector 305
Quite a number of deep well sources have been identified for Level II systems. Most of the service providers tapping deep well sources are only able to supply water for a maximum of 12 hours per day. Only two operating bodies are able to supply water for a period of 24 hours. A few are only able to supply water for a maximum of 4 hours per day. On the other hand, most of the springs are free flowing and operate on a 24- hour basis. Repair works for most of the Level II systems are done by a local trademan. A few are done by the MEO/CEO and by barangay officials. Most of the service providers do not have people having technical capabilities in maintaining the system. The personnel only consist of administrative staff and collector/s. (2) Technical Skill for O&M of facilities Utilization of spring sources normally entails very minimal O&M practice especially in cases where springs are free flowing and delivery of water to the service area is attributed to gravity flow. However, inappropriate care of spring box and pipeline results to various problems, e.g. turbid water, less water flow by clogging at spring box and pipeline, and others. Physical damage may also occur to transmission lines exposed on the ground. A few Level II systems may practice scheduled water supply due to insufficient water source/insufficient capacity of the facilities. Such problems may be attributed to haphazard expansion or tapping of individual connections without proper planning. This situation usually results in insufficient water flow or a reduction in the water pressure. Expansion of distribution line and installation of additional public faucets are usually undertaken without appropriate technical study on the capacities of water sources and distribution facilities, resulting in a decrease of supply pressure and quantity. Although the taste and smell of the water is fairly good, dirty water is occasionally experienced. This may be due to influx of sediments particularly during the rainy season. Metallic taste in the water is experienced in some parts of Tubigon and San Isidro. This may be attributed to the corrosion of the wells, pipes or the distribution pipes and have to be thoroughly assessed and checked. Replacement of a non-corrosive material such as PVC is recommended.
A number of Level II systems do not have a reservoir that is a part of the definition of a Level II system. However, such systems, even though without a reservoir, have already been designated as Level II by the local community since for them communal faucets or stand posts constitute a Level II system. It is recommended that a review of the definition be undertaken or a consensus reached in order to properly categorized such systems.
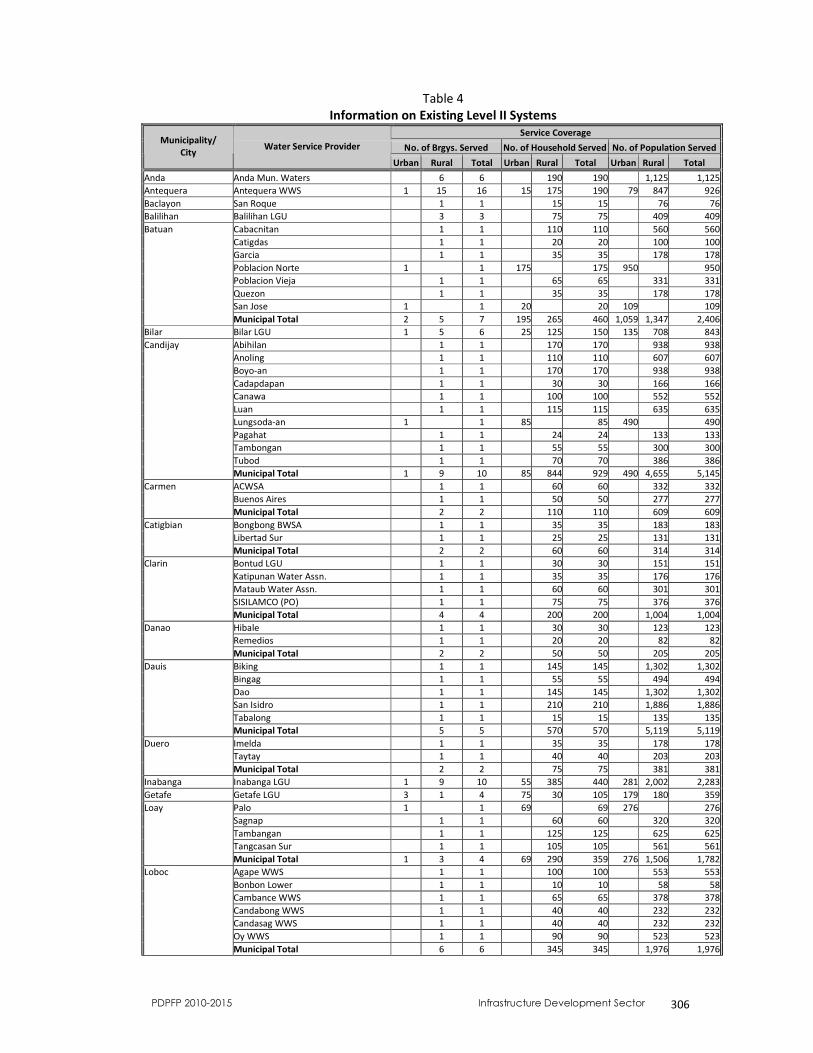
PDPFP 2010-2015 Infrastructure Development Sector 306
Table 4 Information on Existing Level II Systems
Service Coverage No. of Brgys. Served No. of Household Served No. of Population Served Municipality/
City Water Service Provider Urban Rural Total Urban Rural Total Urban Rural Total
Anda Anda Mun. Waters 6 6 190 190 1,125 1,125 Antequera Antequera WWS 1 15 16 15 175 190 79 847 926 Baclayon San Roque 1 1 15 15 76 76 Balilihan Balilihan LGU 3 3 75 75 409 409 Batuan Cabacnitan 1 1 110 110 560 560 Catigdas 1 1 20 20 100 100 Garcia 1 1 35 35 178 178 Poblacion Norte 1 1 175 175 950 950 Poblacion Vieja 1 1 65 65 331 331 Quezon 1 1 35 35 178 178 San Jose 1 1 20 20 109 109 Municipal Total 2 5 7 195 265 460 1,059 1,347 2,406 Bilar Bilar LGU 1 5 6 25 125 150 135 708 843 Candijay Abihilan 1 1 170 170 938 938 Anoling 1 1 110 110 607 607 Boyo-an 1 1 170 170 938 938 Cadapdapan 1 1 30 30 166 166 Canawa 1 1 100 100 552 552 Luan 1 1 115 115 635 635 Lungsoda-an 1 1 85 85 490 490 Pagahat 1 1 24 24 133 133 Tambongan 1 1 55 55 300 300 Tubod 1 1 70 70 386 386 Municipal Total 1 9 10 85 844 929 490 4,655 5,145 Carmen ACWSA 1 1 60 60 332 332 Buenos Aires 1 1 50 50 277 277 Municipal Total 2 2 110 110 609 609 Catigbian Bongbong BWSA 1 1 35 35 183 183 Libertad Sur 1 1 25 25 131 131 Municipal Total 2 2 60 60 314 314 Clarin Bontud LGU 1 1 30 30 151 151 Katipunan Water Assn. 1 1 35 35 176 176 Mataub Water Assn. 1 1 60 60 301 301 SISILAMCO (PO) 1 1 75 75 376 376 Municipal Total 4 4 200 200 1,004 1,004 Danao Hibale 1 1 30 30 123 123 Remedios 1 1 20 20 82 82 Municipal Total 2 2 50 50 205 205 Dauis Biking 1 1 145 145 1,302 1,302 Bingag 1 1 55 55 494 494 Dao 1 1 145 145 1,302 1,302 San Isidro 1 1 210 210 1,886 1,886 Tabalong 1 1 15 15 135 135 Municipal Total 5 5 570 570 5,119 5,119 Duero Imelda 1 1 35 35 178 178 Taytay 1 1 40 40 203 203 Municipal Total 2 2 75 75 381 381 Inabanga Inabanga LGU 1 9 10 55 385 440 281 2,002 2,283 Getafe Getafe LGU 3 1 4 75 30 105 179 180 359 Loay Palo 1 1 69 69 276 276 Sagnap 1 1 60 60 320 320 Tambangan 1 1 125 125 625 625 Tangcasan Sur 1 1 105 105 561 561 Municipal Total 1 3 4 69 290 359 276 1,506 1,782 Loboc Agape WWS 1 1 100 100 553 553 Bonbon Lower 1 1 10 10 58 58 Cambance WWS 1 1 65 65 378 378 Candabong WWS 1 1 40 40 232 232 Candasag WWS 1 1 40 40 232 232 Oy WWS 1 1 90 90 523 523 Municipal Total 6 6 345 345 1,976 1,976
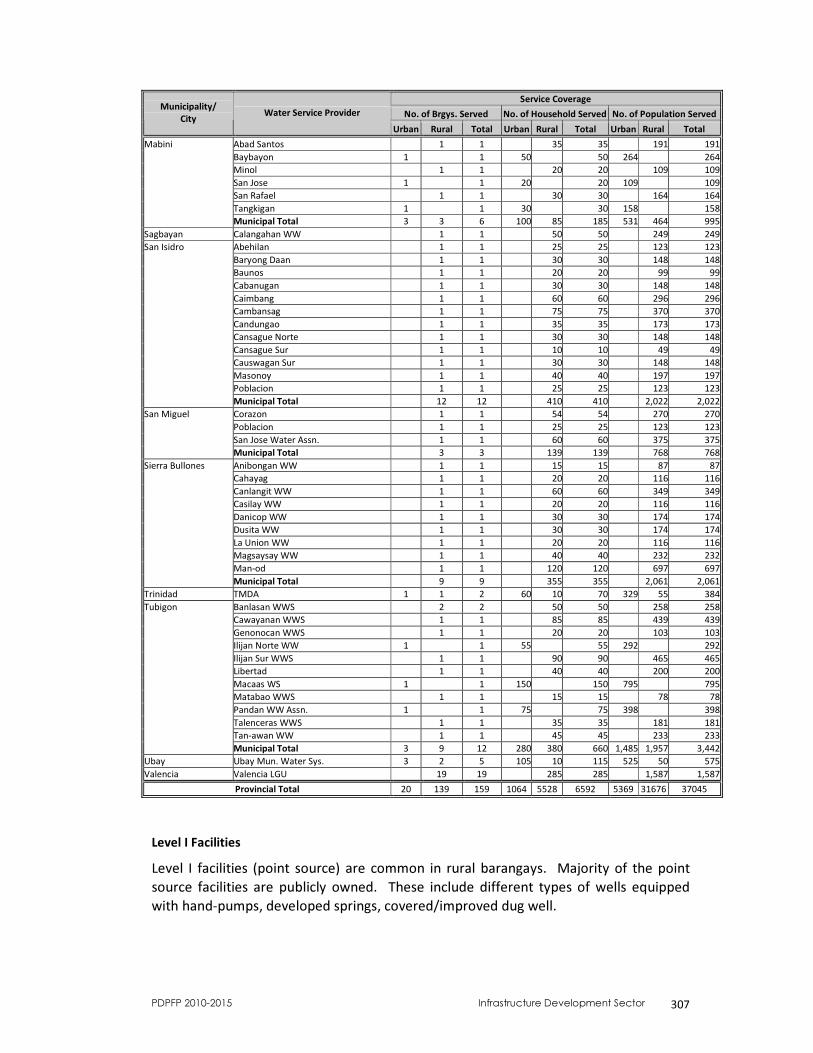
PDPFP 2010-2015 Infrastructure Development Sector 307
Service Coverage No. of Brgys. Served No. of Household Served No. of Population Served Municipality/
City Water Service Provider Urban Rural Total Urban Rural Total Urban Rural Total
Mabini Abad Santos 1 1 35 35 191 191 Baybayon 1 1 50 50 264 264 Minol 1 1 20 20 109 109 San Jose 1 1 20 20 109 109 San Rafael 1 1 30 30 164 164 Tangkigan 1 1 30 30 158 158 Municipal Total 3 3 6 100 85 185 531 464 995 Sagbayan Calangahan WW 1 1 50 50 249 249 San Isidro Abehilan 1 1 25 25 123 123 Baryong Daan 1 1 30 30 148 148 Baunos 1 1 20 20 99 99 Cabanugan 1 1 30 30 148 148 Caimbang 1 1 60 60 296 296 Cambansag 1 1 75 75 370 370 Candungao 1 1 35 35 173 173 Cansague Norte 1 1 30 30 148 148 Cansague Sur 1 1 10 10 49 49 Causwagan Sur 1 1 30 30 148 148 Masonoy 1 1 40 40 197 197 Poblacion 1 1 25 25 123 123 Municipal Total 12 12 410 410 2,022 2,022 San Miguel Corazon 1 1 54 54 270 270 Poblacion 1 1 25 25 123 123 San Jose Water Assn. 1 1 60 60 375 375 Municipal Total 3 3 139 139 768 768 Sierra Bullones Anibongan WW 1 1 15 15 87 87 Cahayag 1 1 20 20 116 116 Canlangit WW 1 1 60 60 349 349 Casilay WW 1 1 20 20 116 116 Danicop WW 1 1 30 30 174 174 Dusita WW 1 1 30 30 174 174 La Union WW 1 1 20 20 116 116 Magsaysay WW 1 1 40 40 232 232 Man-od 1 1 120 120 697 697 Municipal Total 9 9 355 355 2,061 2,061 Trinidad TMDA 1 1 2 60 10 70 329 55 384 Tubigon Banlasan WWS 2 2 50 50 258 258 Cawayanan WWS 1 1 85 85 439 439 Genonocan WWS 1 1 20 20 103 103 Ilijan Norte WW 1 1 55 55 292 292 Ilijan Sur WWS 1 1 90 90 465 465 Libertad 1 1 40 40 200 200 Macaas WS 1 1 150 150 795 795 Matabao WWS 1 1 15 15 78 78 Pandan WW Assn. 1 1 75 75 398 398 Talenceras WWS 1 1 35 35 181 181 Tan-awan WW 1 1 45 45 233 233 Municipal Total 3 9 12 280 380 660 1,485 1,957 3,442 Ubay Ubay Mun. Water Sys. 3 2 5 105 10 115 525 50 575 Valencia Valencia LGU 19 19 285 285 1,587 1,587
Provincial Total 20 139 159 1064 5528 6592 5369 31676 37045
Level I Facilities Level I facilities (point source) are common in rural barangays. Majority of the point source facilities are publicly owned. These include different types of wells equipped with hand-pumps, developed springs, covered/improved dug well.
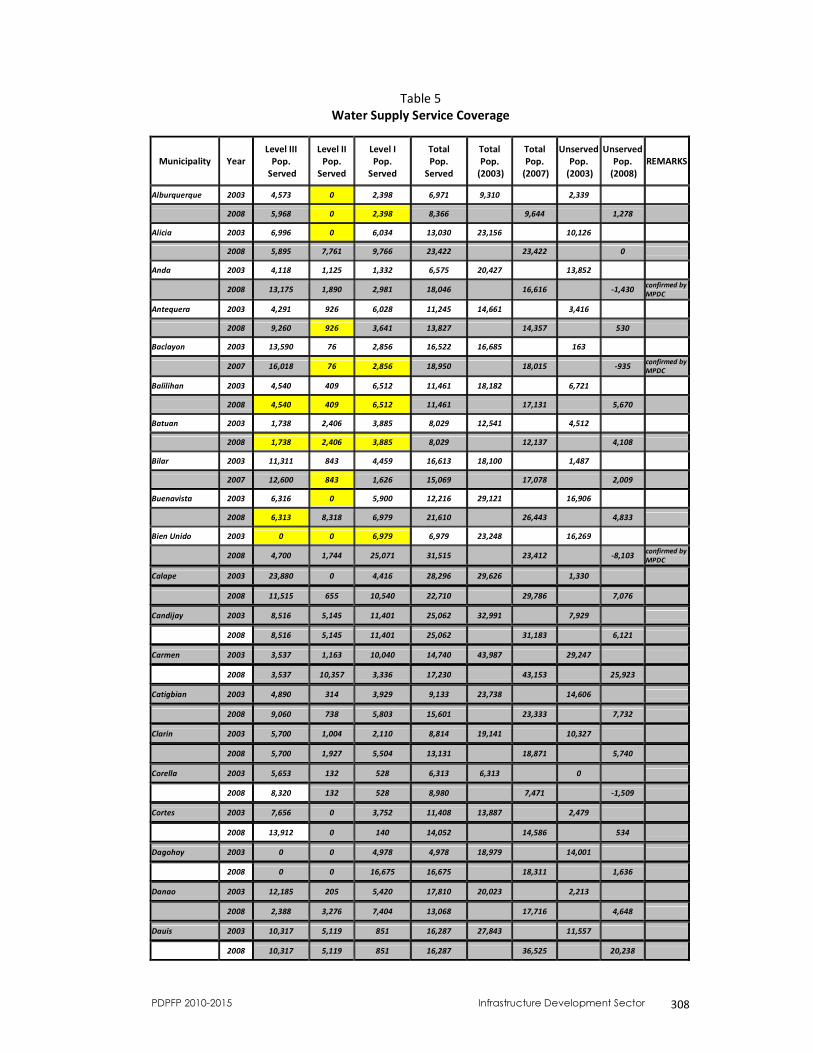
PDPFP 2010-2015 Infrastructure Development Sector 308
Table 5 Water Supply Service Coverage
Municipality Year Level III
Pop. Served
Level II Pop.
Served
Level I Pop.
Served
Total Pop.
Served
Total Pop.
(2003)
Total Pop.
(2007)
Unserved Pop.
(2003)
Unserved Pop.
(2008) REMARKS
Alburquerque 2003 4,573 0 2,398 6,971 9,310 2,339
2008 5,968 0 2,398 8,366 9,644 1,278
Alicia 2003 6,996 0 6,034 13,030 23,156 10,126
2008 5,895 7,761 9,766 23,422 23,422 0
Anda 2003 4,118 1,125 1,332 6,575 20,427 13,852
2008 13,175 1,890 2,981 18,046 16,616 -1,430 confirmed by MPDC
Antequera 2003 4,291 926 6,028 11,245 14,661 3,416
2008 9,260 926 3,641 13,827 14,357 530
Baclayon 2003 13,590 76 2,856 16,522 16,685 163
2007 16,018 76 2,856 18,950 18,015 -935 confirmed by MPDC
Balilihan 2003 4,540 409 6,512 11,461 18,182 6,721
2008 4,540 409 6,512 11,461 17,131 5,670
Batuan 2003 1,738 2,406 3,885 8,029 12,541 4,512
2008 1,738 2,406 3,885 8,029 12,137 4,108
Bilar 2003 11,311 843 4,459 16,613 18,100 1,487
2007 12,600 843 1,626 15,069 17,078 2,009
Buenavista 2003 6,316 0 5,900 12,216 29,121 16,906
2008 6,313 8,318 6,979 21,610 26,443 4,833
Bien Unido 2003 0 0 6,979 6,979 23,248 16,269
2008 4,700 1,744 25,071 31,515 23,412 -8,103 confirmed by MPDC
Calape 2003 23,880 0 4,416 28,296 29,626 1,330
2008 11,515 655 10,540 22,710 29,786 7,076
Candijay 2003 8,516 5,145 11,401 25,062 32,991 7,929
2008 8,516 5,145 11,401 25,062 31,183 6,121
Carmen 2003 3,537 1,163 10,040 14,740 43,987 29,247
2008 3,537 10,357 3,336 17,230 43,153 25,923
Catigbian 2003 4,890 314 3,929 9,133 23,738 14,606
2008 9,060 738 5,803 15,601 23,333 7,732
Clarin 2003 5,700 1,004 2,110 8,814 19,141 10,327
2008 5,700 1,927 5,504 13,131 18,871 5,740
Corella 2003 5,653 132 528 6,313 6,313 0
2008 8,320 132 528 8,980 7,471 -1,509
Cortes 2003 7,656 0 3,752 11,408 13,887 2,479
2008 13,912 0 140 14,052 14,586 534
Dagohoy 2003 0 0 4,978 4,978 18,979 14,001
2008 0 0 16,675 16,675 18,311 1,636
Danao 2003 12,185 205 5,420 17,810 20,023 2,213
2008 2,388 3,276 7,404 13,068 17,716 4,648
Dauis 2003 10,317 5,119 851 16,287 27,843 11,557
2008 10,317 5,119 851 16,287 36,525 20,238
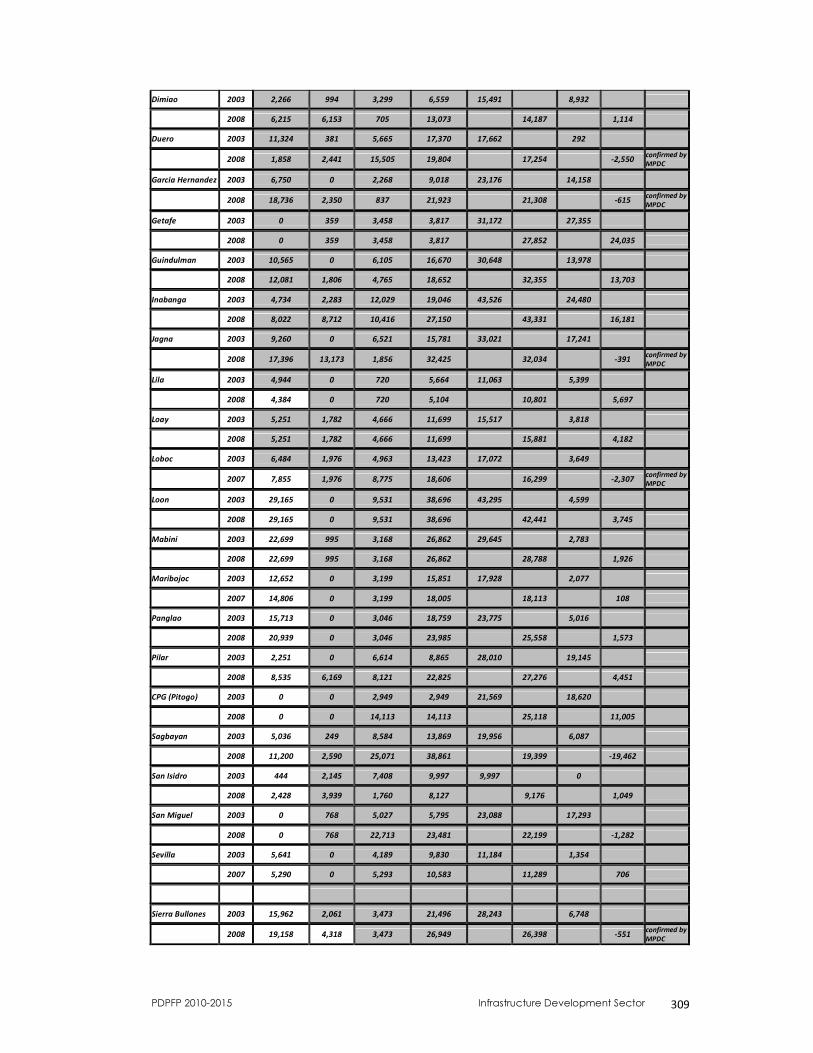
PDPFP 2010-2015 Infrastructure Development Sector 309
Dimiao 2003 2,266 994 3,299 6,559 15,491 8,932
2008 6,215 6,153 705 13,073 14,187 1,114
Duero 2003 11,324 381 5,665 17,370 17,662 292
2008 1,858 2,441 15,505 19,804 17,254 -2,550 confirmed by MPDC
Garcia Hernandez 2003 6,750 0 2,268 9,018 23,176 14,158
2008 18,736 2,350 837 21,923 21,308 -615 confirmed by MPDC
Getafe 2003 0 359 3,458 3,817 31,172 27,355
2008 0 359 3,458 3,817 27,852 24,035
Guindulman 2003 10,565 0 6,105 16,670 30,648 13,978
2008 12,081 1,806 4,765 18,652 32,355 13,703
Inabanga 2003 4,734 2,283 12,029 19,046 43,526 24,480
2008 8,022 8,712 10,416 27,150 43,331 16,181
Jagna 2003 9,260 0 6,521 15,781 33,021 17,241
2008 17,396 13,173 1,856 32,425 32,034 -391 confirmed by MPDC
Lila 2003 4,944 0 720 5,664 11,063 5,399
2008 4,384 0 720 5,104 10,801 5,697
Loay 2003 5,251 1,782 4,666 11,699 15,517 3,818
2008 5,251 1,782 4,666 11,699 15,881 4,182
Loboc 2003 6,484 1,976 4,963 13,423 17,072 3,649
2007 7,855 1,976 8,775 18,606 16,299 -2,307 confirmed by MPDC
Loon 2003 29,165 0 9,531 38,696 43,295 4,599
2008 29,165 0 9,531 38,696 42,441 3,745
Mabini 2003 22,699 995 3,168 26,862 29,645 2,783
2008 22,699 995 3,168 26,862 28,788 1,926
Maribojoc 2003 12,652 0 3,199 15,851 17,928 2,077
2007 14,806 0 3,199 18,005 18,113 108
Panglao 2003 15,713 0 3,046 18,759 23,775 5,016
2008 20,939 0 3,046 23,985 25,558 1,573
Pilar 2003 2,251 0 6,614 8,865 28,010 19,145
2008 8,535 6,169 8,121 22,825 27,276 4,451
CPG (Pitogo) 2003 0 0 2,949 2,949 21,569 18,620
2008 0 0 14,113 14,113 25,118 11,005
Sagbayan 2003 5,036 249 8,584 13,869 19,956 6,087
2008 11,200 2,590 25,071 38,861 19,399 -19,462
San Isidro 2003 444 2,145 7,408 9,997 9,997 0
2008 2,428 3,939 1,760 8,127 9,176 1,049
San Miguel 2003 0 768 5,027 5,795 23,088 17,293
2008 0 768 22,713 23,481 22,199 -1,282
Sevilla 2003 5,641 0 4,189 9,830 11,184 1,354
2007 5,290 0 5,293 10,583 11,289 706
Sierra Bullones 2003 15,962 2,061 3,473 21,496 28,243 6,748
2008 19,158 4,318 3,473 26,949 26,398 -551 confirmed by MPDC
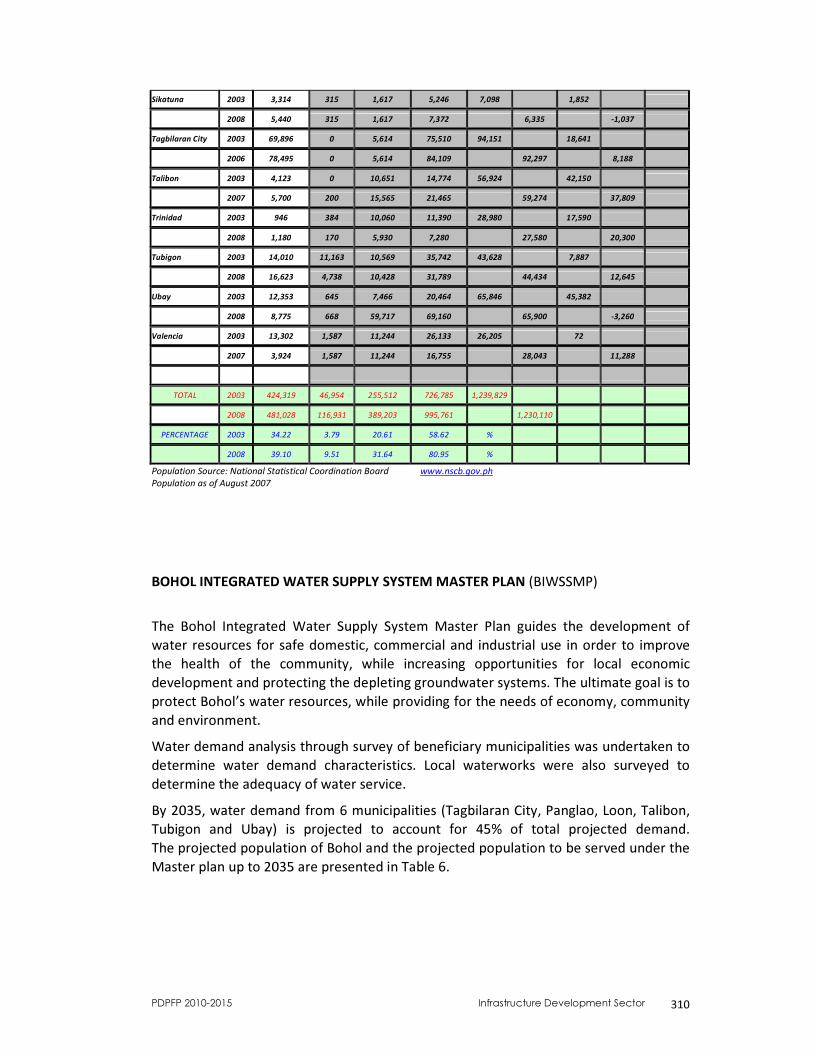
PDPFP 2010-2015 Infrastructure Development Sector 310
Sikatuna 2003 3,314 315 1,617 5,246 7,098 1,852
2008 5,440 315 1,617 7,372 6,335 -1,037
Tagbilaran City 2003 69,896 0 5,614 75,510 94,151 18,641
2006 78,495 0 5,614 84,109 92,297 8,188
Talibon 2003 4,123 0 10,651 14,774 56,924 42,150
2007 5,700 200 15,565 21,465 59,274 37,809
Trinidad 2003 946 384 10,060 11,390 28,980 17,590
2008 1,180 170 5,930 7,280 27,580 20,300
Tubigon 2003 14,010 11,163 10,569 35,742 43,628 7,887
2008 16,623 4,738 10,428 31,789 44,434 12,645
Ubay 2003 12,353 645 7,466 20,464 65,846 45,382
2008 8,775 668 59,717 69,160 65,900 -3,260
Valencia 2003 13,302 1,587 11,244 26,133 26,205 72
2007 3,924 1,587 11,244 16,755 28,043 11,288
TOTAL 2003 424,319 46,954 255,512 726,785 1,239,829
2008 481,028 116,931 389,203 995,761 1,230,110
PERCENTAGE 2003 34.22 3.79 20.61 58.62 %
2008 39.10 9.51 31.64 80.95 %
Population Source: National Statistical Coordination Board www.nscb.gov.ph Population as of August 2007
BOHOL INTEGRATED WATER SUPPLY SYSTEM MASTER PLAN (BIWSSMP) The Bohol Integrated Water Supply System Master Plan guides the development of water resources for safe domestic, commercial and industrial use in order to improve the health of the community, while increasing opportunities for local economic development and protecting the depleting groundwater systems. The ultimate goal is to protect Bohol’s water resources, while providing for the needs of economy, community and environment. Water demand analysis through survey of beneficiary municipalities was undertaken to determine water demand characteristics. Local waterworks were also surveyed to determine the adequacy of water service. By 2035, water demand from 6 municipalities (Tagbilaran City, Panglao, Loon, Talibon, Tubigon and Ubay) is projected to account for 45% of total projected demand. The projected population of Bohol and the projected population to be served under the Master plan up to 2035 are presented in Table 6.
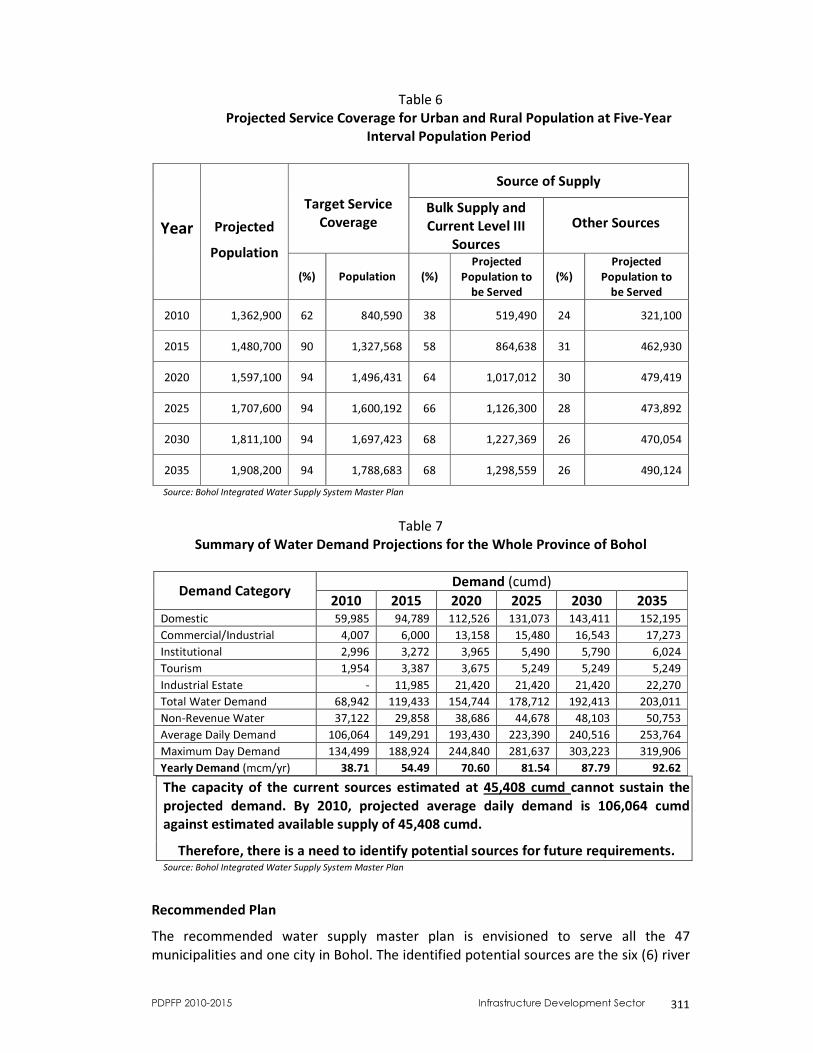
PDPFP 2010-2015 Infrastructure Development Sector 311
Table 6 Projected Service Coverage for Urban and Rural Population at Five-Year
Interval Population Period
Source of Supply Target Service
Coverage Bulk Supply and Current Level III
Sources Other Sources
Year
Projected Population
(%) Population (%) Projected
Population to be Served
(%) Projected
Population to be Served
2010 1,362,900 62 840,590 38 519,490 24 321,100
2015 1,480,700 90 1,327,568 58 864,638 31 462,930
2020 1,597,100 94 1,496,431 64 1,017,012 30 479,419
2025 1,707,600 94 1,600,192 66 1,126,300 28 473,892
2030 1,811,100 94 1,697,423 68 1,227,369 26 470,054
2035 1,908,200 94 1,788,683 68 1,298,559 26 490,124 Source: Bohol Integrated Water Supply System Master Plan
Table 7
Summary of Water Demand Projections for the Whole Province of Bohol
Demand (cumd) Demand Category 2010 2015 2020 2025 2030 2035 Domestic 59,985 94,789 112,526 131,073 143,411 152,195 Commercial/Industrial 4,007 6,000 13,158 15,480 16,543 17,273 Institutional 2,996 3,272 3,965 5,490 5,790 6,024 Tourism 1,954 3,387 3,675 5,249 5,249 5,249 Industrial Estate - 11,985 21,420 21,420 21,420 22,270 Total Water Demand 68,942 119,433 154,744 178,712 192,413 203,011 Non-Revenue Water 37,122 29,858 38,686 44,678 48,103 50,753 Average Daily Demand 106,064 149,291 193,430 223,390 240,516 253,764 Maximum Day Demand 134,499 188,924 244,840 281,637 303,223 319,906 Yearly Demand (mcm/yr) 38.71 54.49 70.60 81.54 87.79 92.62 The capacity of the current sources estimated at 45,408 cumd cannot sustain the projected demand. By 2010, projected average daily demand is 106,064 cumd against estimated available supply of 45,408 cumd.
Therefore, there is a need to identify potential sources for future requirements. Source: Bohol Integrated Water Supply System Master Plan
Recommended Plan The recommended water supply master plan is envisioned to serve all the 47 municipalities and one city in Bohol. The identified potential sources are the six (6) river
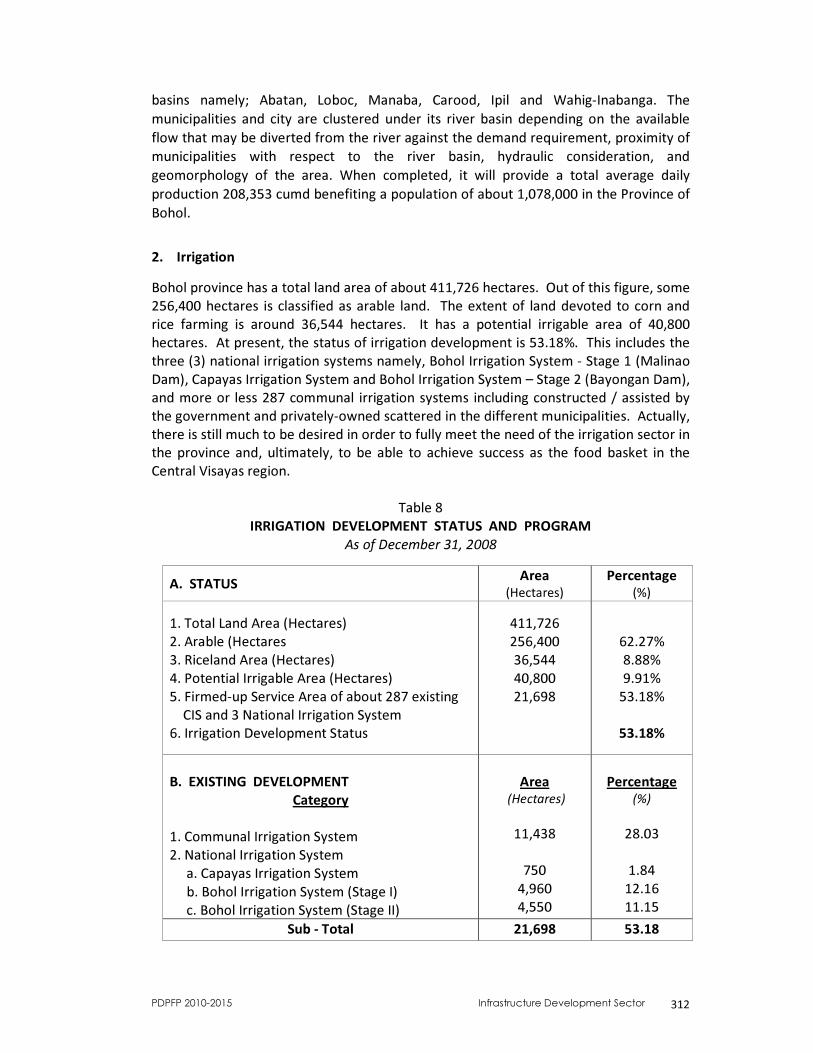
PDPFP 2010-2015 Infrastructure Development Sector 312
basins namely; Abatan, Loboc, Manaba, Carood, Ipil and Wahig-Inabanga. The municipalities and city are clustered under its river basin depending on the available flow that may be diverted from the river against the demand requirement, proximity of municipalities with respect to the river basin, hydraulic consideration, and geomorphology of the area. When completed, it will provide a total average daily production 208,353 cumd benefiting a population of about 1,078,000 in the Province of Bohol.
2. Irrigation Bohol province has a total land area of about 411,726 hectares. Out of this figure, some 256,400 hectares is classified as arable land. The extent of land devoted to corn and rice farming is around 36,544 hectares. It has a potential irrigable area of 40,800 hectares. At present, the status of irrigation development is 53.18%. This includes the three (3) national irrigation systems namely, Bohol Irrigation System - Stage 1 (Malinao Dam), Capayas Irrigation System and Bohol Irrigation System – Stage 2 (Bayongan Dam), and more or less 287 communal irrigation systems including constructed / assisted by the government and privately-owned scattered in the different municipalities. Actually, there is still much to be desired in order to fully meet the need of the irrigation sector in the province and, ultimately, to be able to achieve success as the food basket in the Central Visayas region.
Table 8 IRRIGATION DEVELOPMENT STATUS AND PROGRAM
As of December 31, 2008
A. STATUS Area (Hectares)
Percentage (%)
1. Total Land Area (Hectares) 2. Arable (Hectares 3. Riceland Area (Hectares) 4. Potential Irrigable Area (Hectares) 5. Firmed-up Service Area of about 287 existing CIS and 3 National Irrigation System 6. Irrigation Development Status
411,726 256,400 36,544 40,800 21,698
62.27% 8.88% 9.91%
53.18%
53.18%
B. EXISTING DEVELOPMENT Category
1. Communal Irrigation System 2. National Irrigation System a. Capayas Irrigation System b. Bohol Irrigation System (Stage I) c. Bohol Irrigation System (Stage II)
Area (Hectares)
11,438
750
4,960 4,550
Percentage (%)
28.03
1.84
12.16 11.15
Sub - Total 21,698 53.18
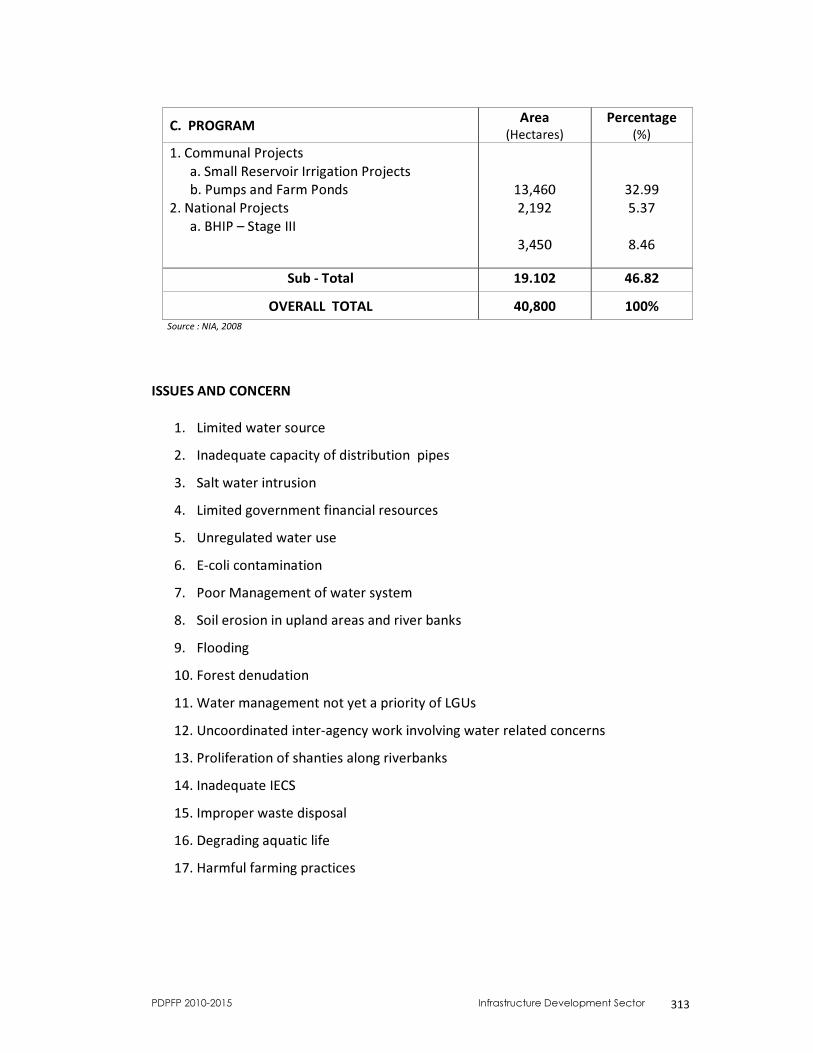
PDPFP 2010-2015 Infrastructure Development Sector 313
C. PROGRAM Area (Hectares)
Percentage (%)
1. Communal Projects a. Small Reservoir Irrigation Projects b. Pumps and Farm Ponds 2. National Projects a. BHIP – Stage III
13,460 2,192
3,450
32.99 5.37
8.46
Sub - Total 19.102 46.82 OVERALL TOTAL 40,800 100%
Source : NIA, 2008 ISSUES AND CONCERN
1. Limited water source 2. Inadequate capacity of distribution pipes 3. Salt water intrusion 4. Limited government financial resources 5. Unregulated water use 6. E-coli contamination 7. Poor Management of water system 8. Soil erosion in upland areas and river banks 9. Flooding 10. Forest denudation 11. Water management not yet a priority of LGUs 12. Uncoordinated inter-agency work involving water related concerns 13. Proliferation of shanties along riverbanks 14. Inadequate IECS 15. Improper waste disposal 16. Degrading aquatic life 17. Harmful farming practices
PDPFP 2010-2015 Infrastructure Development Sector 314
DEVELOPMENT PLAN FRAMEWORK Sub-Sector Vision A FULLY DEVELOPED, SUSTAINABLE AND QUALITY WATER SUPPLY AND IRRIGATION FACILITIES THROUGH PROPER UTILIZATION AND CONSERVATION OF WATER RESOURCES Sector Goals:
1. Properly utilized major water resources for greener Bohol 2. Enhanced tourism industry through improved water supply, sewerage and
irrigation facilities 3. Self-sufficient province in rice and water supply
Sector Objectives
1. To provide adequate drainage system in Tagbilaran City and rapidly urbanizing areas
2. To provide a sustainable potable water supply in each municipalities 3. To increase the storage capacity of the systems in Tagbilaran City 4. To develop, rehabilitate and or upgrade irrigation facilities 5. To construct additional distribution main lines and lateral lines 6. To develop 3 major water sources
Sub-Sector Strategies
1. Improvement of drainage, irrigation and water facilities 2. Integrating the approach in the equitable provision of potable water supply, sanitation and hygiene 3. Formulation of policy and advocacy by LGU 4. Mobilization of resources
Plans, Programs/Activities
TCWS : • Additional pumping Unit No. 21 & 600 m 4" dia Transmission Pipeline • Replacement of 1,200 m. distribution pipeline along Doldol and Salazar St. • 19 units Chlorinator Machines for each of the 19 pumping units • Additional Pumping unit No. 22 & 200 m. transmission pipeline 4” diameter • 26,500 gal. Concrete water reservoir (Elevated from the ground) • 200,000 gal. Concrete water reservoir • Replacement of distribution pipeline to 4” diameter-1,500 m. along Tiptip- San Isidro Road and 1,700 m. along Purok V Road • Replacement of distribution pipeline to 6” diameter-1,980 m. along C.P.G. North Avenue • Replacement of distribution pipeline to 4” dia.-1,600 m. along San Isidro- Cabawan Road • Replacement of distribution pipeline to 4” dia.-1,800 m. along Binayran Road
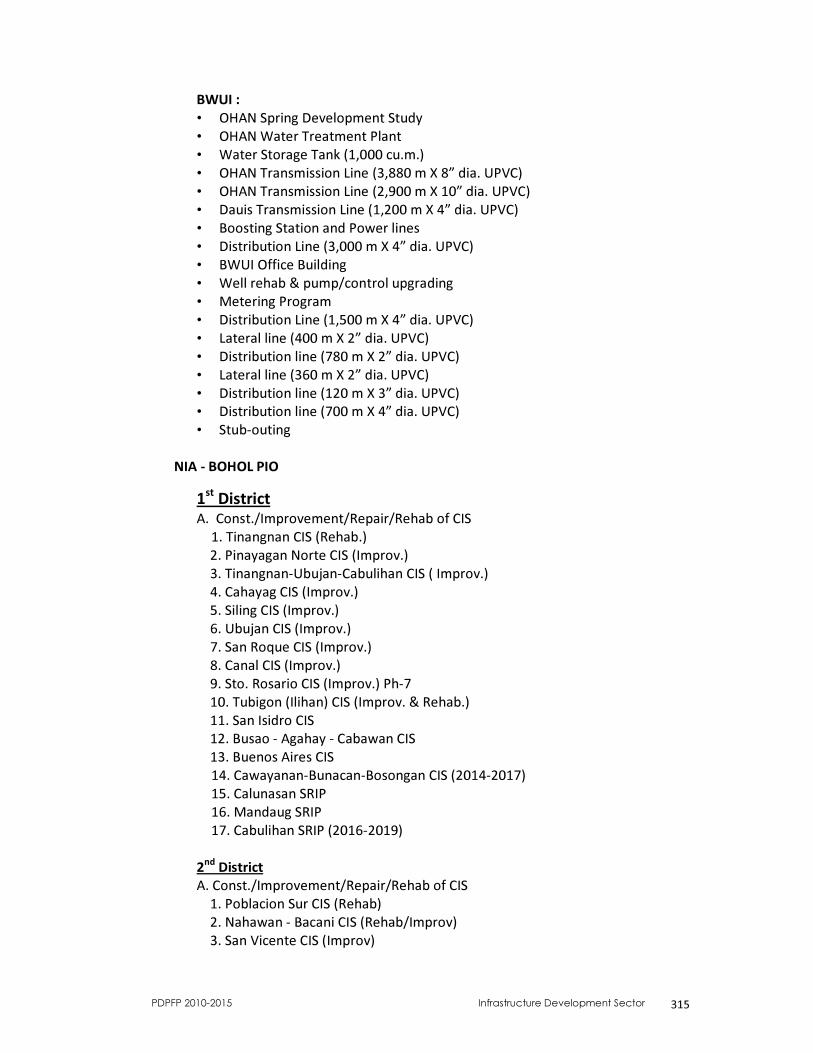
PDPFP 2010-2015 Infrastructure Development Sector 315
BWUI : • OHAN Spring Development Study • OHAN Water Treatment Plant • Water Storage Tank (1,000 cu.m.) • OHAN Transmission Line (3,880 m X 8” dia. UPVC) • OHAN Transmission Line (2,900 m X 10” dia. UPVC) • Dauis Transmission Line (1,200 m X 4” dia. UPVC) • Boosting Station and Power lines • Distribution Line (3,000 m X 4” dia. UPVC) • BWUI Office Building • Well rehab & pump/control upgrading • Metering Program • Distribution Line (1,500 m X 4” dia. UPVC) • Lateral line (400 m X 2” dia. UPVC) • Distribution line (780 m X 2” dia. UPVC) • Lateral line (360 m X 2” dia. UPVC) • Distribution line (120 m X 3” dia. UPVC) • Distribution line (700 m X 4” dia. UPVC) • Stub-outing
NIA - BOHOL PIO
1st District
A. Const./Improvement/Repair/Rehab of CIS 1. Tinangnan CIS (Rehab.)
2. Pinayagan Norte CIS (Improv.) 3. Tinangnan-Ubujan-Cabulihan CIS ( Improv.) 4. Cahayag CIS (Improv.) 5. Siling CIS (Improv.) 6. Ubujan CIS (Improv.) 7. San Roque CIS (Improv.) 8. Canal CIS (Improv.) 9. Sto. Rosario CIS (Improv.) Ph-7 10. Tubigon (Ilihan) CIS (Improv. & Rehab.) 11. San Isidro CIS 12. Busao - Agahay - Cabawan CIS 13. Buenos Aires CIS
14. Cawayanan-Bunacan-Bosongan CIS (2014-2017) 15. Calunasan SRIP 16. Mandaug SRIP 17. Cabulihan SRIP (2016-2019)
2nd District A. Const./Improvement/Repair/Rehab of CIS 1. Poblacion Sur CIS (Rehab) 2. Nahawan - Bacani CIS (Rehab/Improv) 3. San Vicente CIS (Improv)
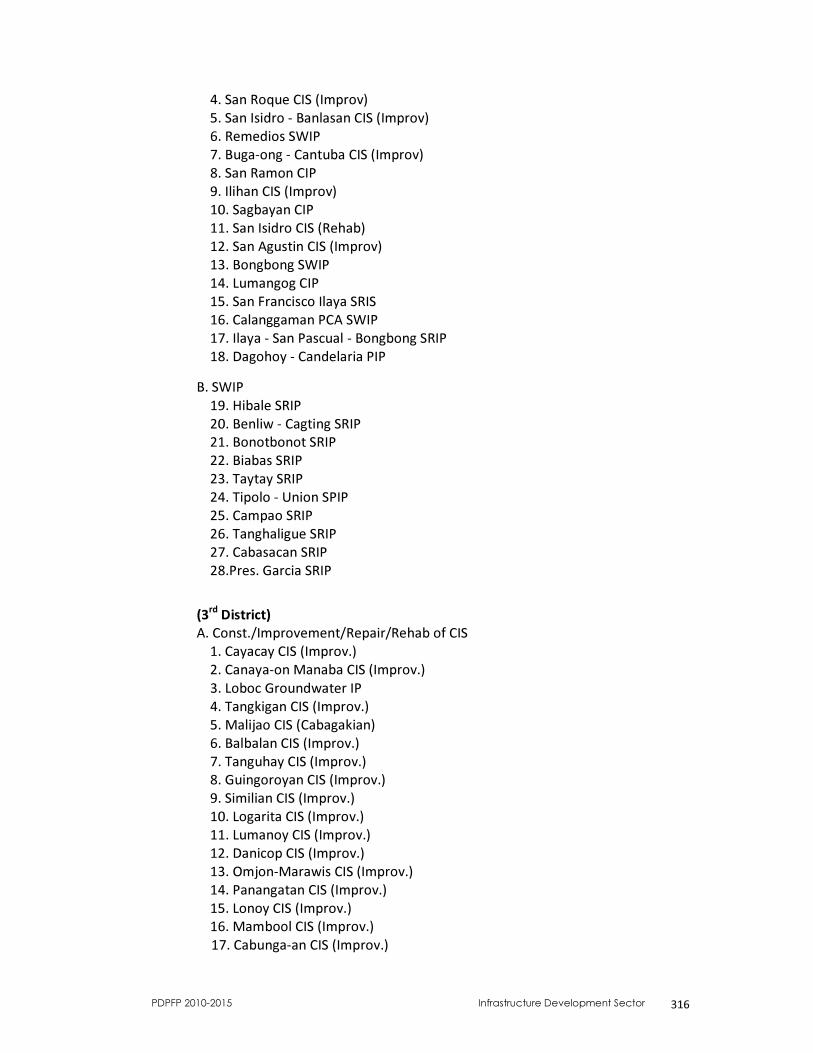
PDPFP 2010-2015 Infrastructure Development Sector 316
4. San Roque CIS (Improv) 5. San Isidro - Banlasan CIS (Improv) 6. Remedios SWIP 7. Buga-ong - Cantuba CIS (Improv) 8. San Ramon CIP 9. Ilihan CIS (Improv) 10. Sagbayan CIP 11. San Isidro CIS (Rehab) 12. San Agustin CIS (Improv) 13. Bongbong SWIP 14. Lumangog CIP 15. San Francisco Ilaya SRIS 16. Calanggaman PCA SWIP 17. Ilaya - San Pascual - Bongbong SRIP 18. Dagohoy - Candelaria PIP B. SWIP 19. Hibale SRIP 20. Benliw - Cagting SRIP 21. Bonotbonot SRIP 22. Biabas SRIP 23. Taytay SRIP 24. Tipolo - Union SPIP 25. Campao SRIP 26. Tanghaligue SRIP 27. Cabasacan SRIP 28.Pres. Garcia SRIP
(3rd District) A. Const./Improvement/Repair/Rehab of CIS 1. Cayacay CIS (Improv.) 2. Canaya-on Manaba CIS (Improv.) 3. Loboc Groundwater IP 4. Tangkigan CIS (Improv.) 5. Malijao CIS (Cabagakian) 6. Balbalan CIS (Improv.) 7. Tanguhay CIS (Improv.) 8. Guingoroyan CIS (Improv.) 9. Similian CIS (Improv.) 10. Logarita CIS (Improv.) 11. Lumanoy CIS (Improv.) 12. Danicop CIS (Improv.) 13. Omjon-Marawis CIS (Improv.) 14. Panangatan CIS (Improv.) 15. Lonoy CIS (Improv.) 16. Mambool CIS (Improv.)
17. Cabunga-an CIS (Improv.)
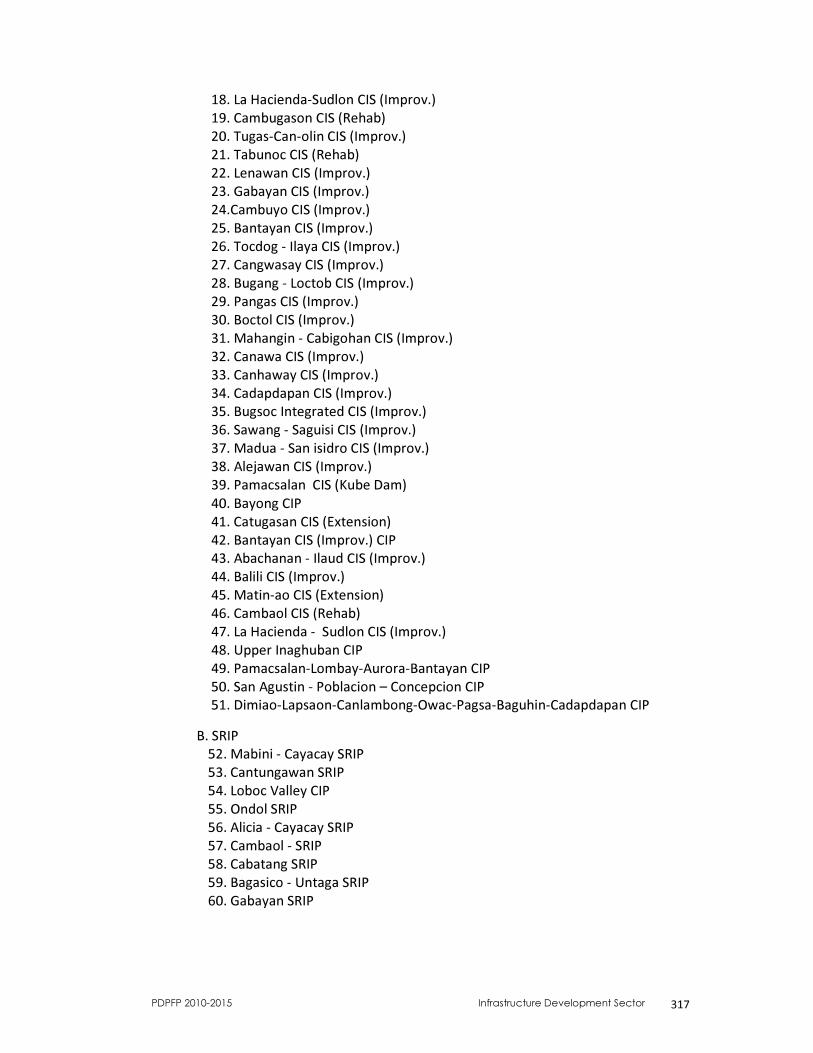
PDPFP 2010-2015 Infrastructure Development Sector 317
18. La Hacienda-Sudlon CIS (Improv.) 19. Cambugason CIS (Rehab) 20. Tugas-Can-olin CIS (Improv.) 21. Tabunoc CIS (Rehab) 22. Lenawan CIS (Improv.) 23. Gabayan CIS (Improv.) 24.Cambuyo CIS (Improv.) 25. Bantayan CIS (Improv.) 26. Tocdog - Ilaya CIS (Improv.) 27. Cangwasay CIS (Improv.) 28. Bugang - Loctob CIS (Improv.) 29. Pangas CIS (Improv.) 30. Boctol CIS (Improv.) 31. Mahangin - Cabigohan CIS (Improv.) 32. Canawa CIS (Improv.) 33. Canhaway CIS (Improv.) 34. Cadapdapan CIS (Improv.) 35. Bugsoc Integrated CIS (Improv.) 36. Sawang - Saguisi CIS (Improv.) 37. Madua - San isidro CIS (Improv.) 38. Alejawan CIS (Improv.) 39. Pamacsalan CIS (Kube Dam) 40. Bayong CIP 41. Catugasan CIS (Extension) 42. Bantayan CIS (Improv.) CIP 43. Abachanan - Ilaud CIS (Improv.) 44. Balili CIS (Improv.) 45. Matin-ao CIS (Extension) 46. Cambaol CIS (Rehab) 47. La Hacienda - Sudlon CIS (Improv.) 48. Upper Inaghuban CIP 49. Pamacsalan-Lombay-Aurora-Bantayan CIP 50. San Agustin - Poblacion – Concepcion CIP 51. Dimiao-Lapsaon-Canlambong-Owac-Pagsa-Baguhin-Cadapdapan CIP
B. SRIP 52. Mabini - Cayacay SRIP 53. Cantungawan SRIP 54. Loboc Valley CIP 55. Ondol SRIP 56. Alicia - Cayacay SRIP 57. Cambaol - SRIP 58. Cabatang SRIP 59. Bagasico - Untaga SRIP 60. Gabayan SRIP
PDPFP 2010-2015 Infrastructure Development Sector 318
Sector : INFRASTRUCTURE DEVELOPMENT Sub-Sector : Communications Development SITUATIONER
1. Telephone Services
Recent developments in modern communications have kept the Boholano community abreast with technology, helping propel Bohol’s economy. This modern communication system provides Bohol with greater accessibility both local and international linkages. This is made possible by three (3) service providers namely: PLDT, Cruzteco and Globelines. Access to telecommunication can also be made easily in the towns through the 31 public calling stations. CRUZTELCO concentrates their telephone services in Tagbilaran City, Jagna and Tubigon. PLDT has a total of 21 stations in the entire province spread in all municipalities in Bohol. PLDT and CRUZTELCO also provide payphones capable of international direct dialing. The Digital Telephone Exchange funded of the DOTC operates in the municipality of Tubigon, Talibon and Ubay.
The Fiber Optic Network projects in Bohol are on-going. These projects will be our entry into information technology (IT) highway that augurs well for the establishment of call centers in the province.
The PLDT Company is expected to complete the laying out fiber optic cables within this year and also the submarine fiber optic cable connection from Clarin, Bohol to Marigondon, Mactan, Cebu. This will link Bohol to PLDT’s domestic fiber optic networks.
However, Globelines had commissioned Ericsson Network Philippines to undertake its telecommunications expansion program. The work involves the construction of underground ducts and conduits by manual and mechanical trenching for the laying out and installation of fiber optic cables, bridge attachments, handholes and manholes. The Fiber Optic Network projects from Duero town through Tagbilaran City and northward all the way to Inabanga town are on-going while the Panglao Island going to Dumaguete is still on negotiation.
2. Telegraph Services
Telegraph Services is one of communication system use in the province. At present, there are three (3) telegraph companies that provide telegraph services in the entire province. The government operates One (1) company and a private company operates the other two (2). These two (2) private telegraph providers are Radio Communication of the Philippines Incorporated (RCPI) and Philippine Telephone and Telegraph (PT&T) which is located in Tagbilaran City. With the presence of facsimile machines and the internet, the patronage of telegram services has obviously decreased.
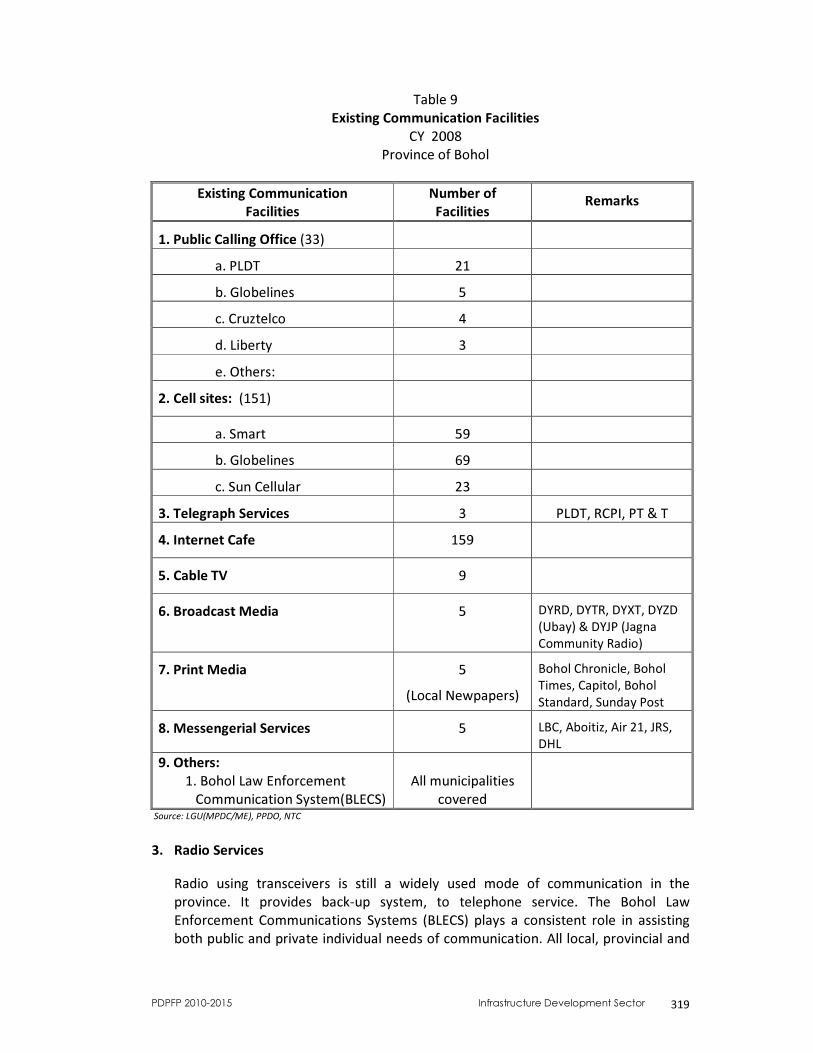
PDPFP 2010-2015 Infrastructure Development Sector 319
Table 9 Existing Communication Facilities
CY 2008 Province of Bohol
Existing Communication Facilities
Number of Facilities Remarks
1. Public Calling Office (33) a. PLDT 21 b. Globelines 5 c. Cruztelco 4 d. Liberty 3 e. Others:
2. Cell sites: (151)
a. Smart 59 b. Globelines 69 c. Sun Cellular 23
3. Telegraph Services 3 PLDT, RCPI, PT & T 4. Internet Cafe 159
5. Cable TV 9
6. Broadcast Media 5 DYRD, DYTR, DYXT, DYZD (Ubay) & DYJP (Jagna Community Radio)
7. Print Media 5 (Local Newpapers)
Bohol Chronicle, Bohol Times, Capitol, Bohol Standard, Sunday Post
8. Messengerial Services 5 LBC, Aboitiz, Air 21, JRS, DHL
9. Others: 1. Bohol Law Enforcement
Communication System(BLECS)
All municipalities
covered
Source: LGU(MPDC/ME), PPDO, NTC 3. Radio Services
Radio using transceivers is still a widely used mode of communication in the province. It provides back-up system, to telephone service. The Bohol Law Enforcement Communications Systems (BLECS) plays a consistent role in assisting both public and private individual needs of communication. All local, provincial and
PDPFP 2010-2015 Infrastructure Development Sector 320
national government offices have operational radios. The PNP/Military and civilian sector assist them especially during emergency cases like insurgency related incidents, commission of crimes and occurrences of natural calamities such as earthquake, typhoon, fire and flood and among others.
4. Broadcast and Print Media There are three (3) AM stations in Bohol namely: DYRD, DYTR and DYXT and two (2) FM stations (DYTR and DYRD) that are all operating in the city and are providing information and entertainment. The coverage for station DYRD is limited up to Clarin and Jagna with 5,000 watts capacity; DYXT has only 1,000 watts capacity, covers only up to Antequera and Loay and DYTR has 10,000 watts capacity, has the widest coverage area equivalent to 80% provincewide. There is one relaying station based in Ubay, the station DYZD and one local station DYJP in Jagna,Bohol. In the year 2008, Bohol has five (5) cable TV stations. The Bohol Community Cable Television (BCCTV) situated in Tagbilaran City, the Mantle Cable Station which started its operation since 2000 in the municipality of Talibon, the Alcyber Cable System which is located in the municipality of Loay also starts its operation in the year 2001, the Real Speed Cable TV Inc. and Southseas Vision both are situated in Calape and Tubigon respectively. In Bohol, there are five (5) weekly local newspapers, namely, Bohol Chronicle, Bohol Times, Capitol, Bohol Standard and Sunday Post. They provide local news coverage and information within the province as well as in the neighboring provinces while regular subscription of 11 national dailies provides national and international information and news coverage.
5. Postal and Messengerial Services In Bohol, the Philippine Postal Corporation (PPC) has fifty (50) postal offices, one for each municipality and the other three are located in Tagbilaran City. Mailing services in the city are operated by the Philippine Postal Office through its main office at the old city hall compound and two (2) sub-offices. Tagbilaran City is the transit point for inland dispatches exchanged among the different post offices in the Province of Bohol. Aside from the Philippine Postal Office, there are five (5) messengerial services in the city, namely the LBC, Aboitiz, Air 21, JRS and DHL that handle package forwarding. Most of these offices are located in Tagbilaran City with branches in some major urban centers of the province such as in Talibon, Jagna, Loon and Tubigon.
6. Internet Access
With the presence of facsimile machines and the internets, the patronage of telegram services has obviously decreased. There are two internet providers
PDPFP 2010-2015 Infrastructure Development Sector 321
operating in Tagbilaran City and neighboring towns; the Bohol On-Line and the BQ Link Moscom Tagbilaran. The BQ Link Internet Connection covers the municipalities of Antequera, Batuan, Bilar, Buenavista, Calape, Carmen, Clarin, Cortes, Dauis, Inabanga, Jetafe, Loay, Loboc, Loon, Tagbilaran, Talibon, Tubigon, Maribojoc, Sagbayan and Panglao.
ISSUES AND CONCERN Among the challenges facing the Sub-sector include:
1. Poor communication access 2. Very poor postal delivery services 3. Outdated/obsolete communication facilities 4. Lack of coordination and cooperation between providers and LGUs
DEVELOPMENT PLAN FRAMEWORK Sub-Sector Vision A SUPERIOR AND STATE-OF-THE-ART COMMUNICATION FACILITIES PROVIDING EFFICIENT SERVICES AND TO PROVIDE BETTER OPPORTUNITIES TO THE BOHOLANO PEOPLE. Sub-Sector Goals
1. Full-access to efficient communication 2. Fast and efficient postal mail services 3. State-of-the art communication facilities available 4. Establish proper, effective and efficient communication system to LGUs 5. IT-hub ready Bohol
Sector Objectives
1. To have an improved cell signal coverage province wide 2. To improve and strengthen communications capabilities and facilities of
LGUs 3. To institute productive cooperation between providers and LGUs 4. To advance the postal mailing services province wide
PDPFP 2010-2015 Infrastructure Development Sector 322
Sub-Sector Strategies
1. Proper and wide information dissemination 2. Expansion and improvement of existing communication facilities 3. Generation and proper data banking for references and networking 4. Development of a competitive promotion and marketing campaign for
the province 5. Installation of fiber-optic lines/cables
Plans, Programs/Activities
GLOBELINES : • Bohol Fiber Optic Network Project • Network Expansion in Tagbilaran City (Lindaville Subd.) • Landline Expansion – Jagna • LandlineExpansion (Guindulman, Dauis, Lila, Garcia, Valencia, Trinidad) • 36 upgrade of the following cellsites (San Pascual, Ubay, Pob., Ubay, Pob. Carmen & Macaas, Tubigon) PLDT : • Installation of Next Generation Network (NGN) Cabinets in 10 location within Tagbilaran City (5,304 voice/data lines) • Rehabilitation and expansion of cable facilities • Laying out of submarime fiber optic cable to include Bohol in the existing PLDT DFON (Domestic Fiber Optic Network) BLECS : • Upgrading of office facilities • Equipments and supplies • Maintenance of Antennae System
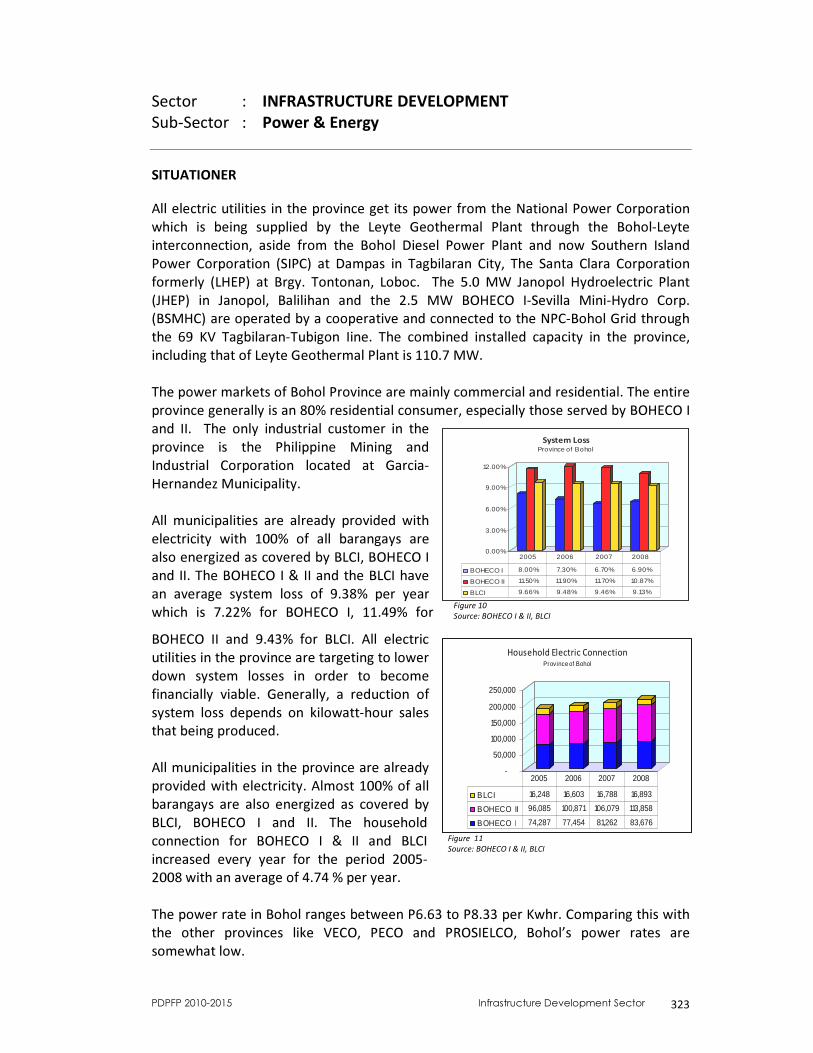
PDPFP 2010-2015 Infrastructure Development Sector 323
0.00%
3.00%
6.00%
9.00%
12.00%
System LossProvince of Bohol
BOHECO I 8.00% 7.30% 6.70% 6.90%
BOHECO II 11.50% 11.90% 11.70% 10.87%
BLCI 9.66% 9.48% 9.46% 9.13%
2005 2006 2007 2008
-
50,000
100,000
150,000
200,000
250,000
Household Electric ConnectionProvince of Bohol
BLCI 16,248 16,603 16,788 16,893
BOHECO II 96,085 100,871 106,079 113,858
BOHECO I 74,287 77,454 81,262 83,676
2005 2006 2007 2008
Sector : INFRASTRUCTURE DEVELOPMENT Sub-Sector : Power & Energy SITUATIONER
All electric utilities in the province get its power from the National Power Corporation which is being supplied by the Leyte Geothermal Plant through the Bohol-Leyte interconnection, aside from the Bohol Diesel Power Plant and now Southern Island Power Corporation (SIPC) at Dampas in Tagbilaran City, The Santa Clara Corporation formerly (LHEP) at Brgy. Tontonan, Loboc. The 5.0 MW Janopol Hydroelectric Plant (JHEP) in Janopol, Balilihan and the 2.5 MW BOHECO I-Sevilla Mini-Hydro Corp. (BSMHC) are operated by a cooperative and connected to the NPC-Bohol Grid through the 69 KV Tagbilaran-Tubigon Iine. The combined installed capacity in the province, including that of Leyte Geothermal Plant is 110.7 MW.
The power markets of Bohol Province are mainly commercial and residential. The entire province generally is an 80% residential consumer, especially those served by BOHECO I and II. The only industrial customer in the province is the Philippine Mining and Industrial Corporation located at Garcia-Hernandez Municipality.
All municipalities are already provided with electricity with 100% of all barangays are also energized as covered by BLCI, BOHECO I and II. The BOHECO I & II and the BLCI have an average system loss of 9.38% per year which is 7.22% for BOHECO I, 11.49% for BOHECO II and 9.43% for BLCI. All electric utilities in the province are targeting to lower down system losses in order to become financially viable. Generally, a reduction of system loss depends on kilowatt-hour sales that being produced.
All municipalities in the province are already provided with electricity. Almost 100% of all barangays are also energized as covered by BLCI, BOHECO I and II. The household connection for BOHECO I & II and BLCI increased every year for the period 2005-2008 with an average of 4.74 % per year. The power rate in Bohol ranges between P6.63 to P8.33 per Kwhr. Comparing this with the other provinces like VECO, PECO and PROSIELCO, Bohol’s power rates are somewhat low.
Figure 10 Source: BOHECO I & II, BLCI
Figure 11 Source: BOHECO I & II, BLCI
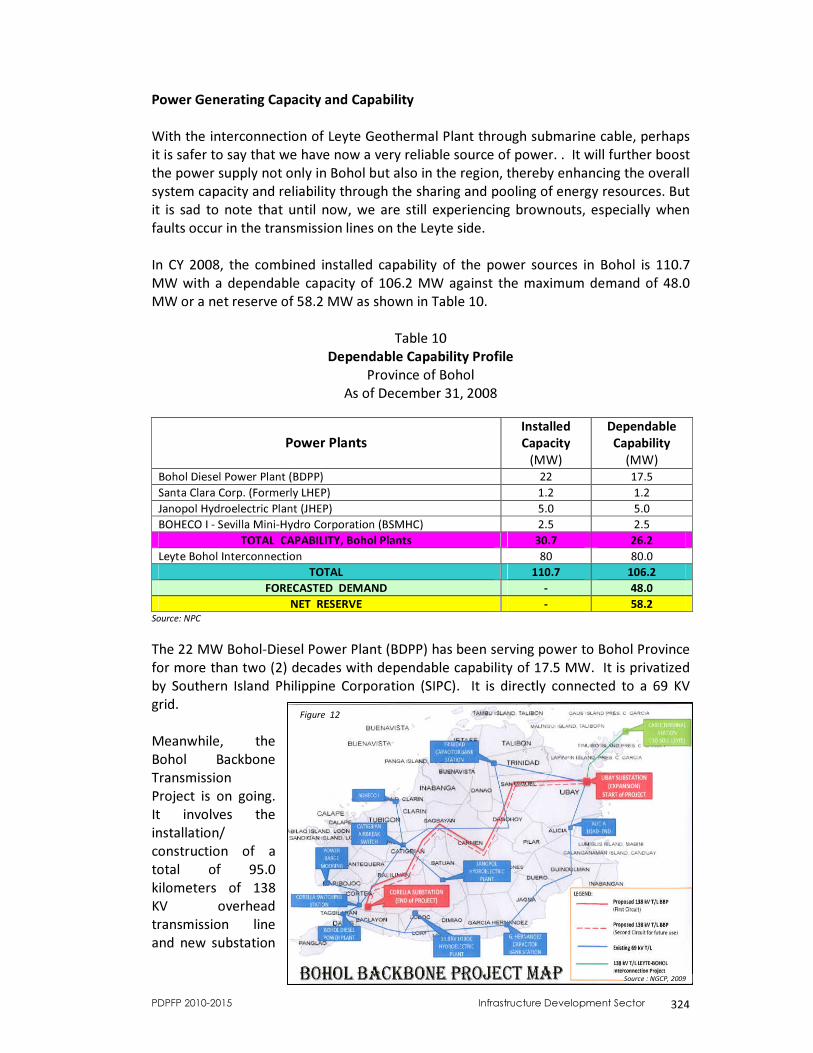
PDPFP 2010-2015 Infrastructure Development Sector 324
Power Generating Capacity and Capability
With the interconnection of Leyte Geothermal Plant through submarine cable, perhaps it is safer to say that we have now a very reliable source of power. . It will further boost the power supply not only in Bohol but also in the region, thereby enhancing the overall system capacity and reliability through the sharing and pooling of energy resources. But it is sad to note that until now, we are still experiencing brownouts, especially when faults occur in the transmission lines on the Leyte side. In CY 2008, the combined installed capability of the power sources in Bohol is 110.7 MW with a dependable capacity of 106.2 MW against the maximum demand of 48.0 MW or a net reserve of 58.2 MW as shown in Table 10.
Table 10 Dependable Capability Profile
Province of Bohol As of December 31, 2008
Power Plants Installed Capacity
(MW)
Dependable Capability
(MW) Bohol Diesel Power Plant (BDPP) 22 17.5 Santa Clara Corp. (Formerly LHEP) 1.2 1.2 Janopol Hydroelectric Plant (JHEP) 5.0 5.0 BOHECO I - Sevilla Mini-Hydro Corporation (BSMHC) 2.5 2.5
TOTAL CAPABILITY, Bohol Plants 30.7 26.2 Leyte Bohol Interconnection 80 80.0
TOTAL 110.7 106.2 FORECASTED DEMAND - 48.0
NET RESERVE - 58.2 Source: NPC
The 22 MW Bohol-Diesel Power Plant (BDPP) has been serving power to Bohol Province for more than two (2) decades with dependable capability of 17.5 MW. It is privatized by Southern Island Philippine Corporation (SIPC). It is directly connected to a 69 KV grid. Meanwhile, the Bohol Backbone Transmission Project is on going. It involves the installation/ construction of a total of 95.0 kilometers of 138 KV overhead transmission line and new substation
Source : NGCP, 2009
Figure 12
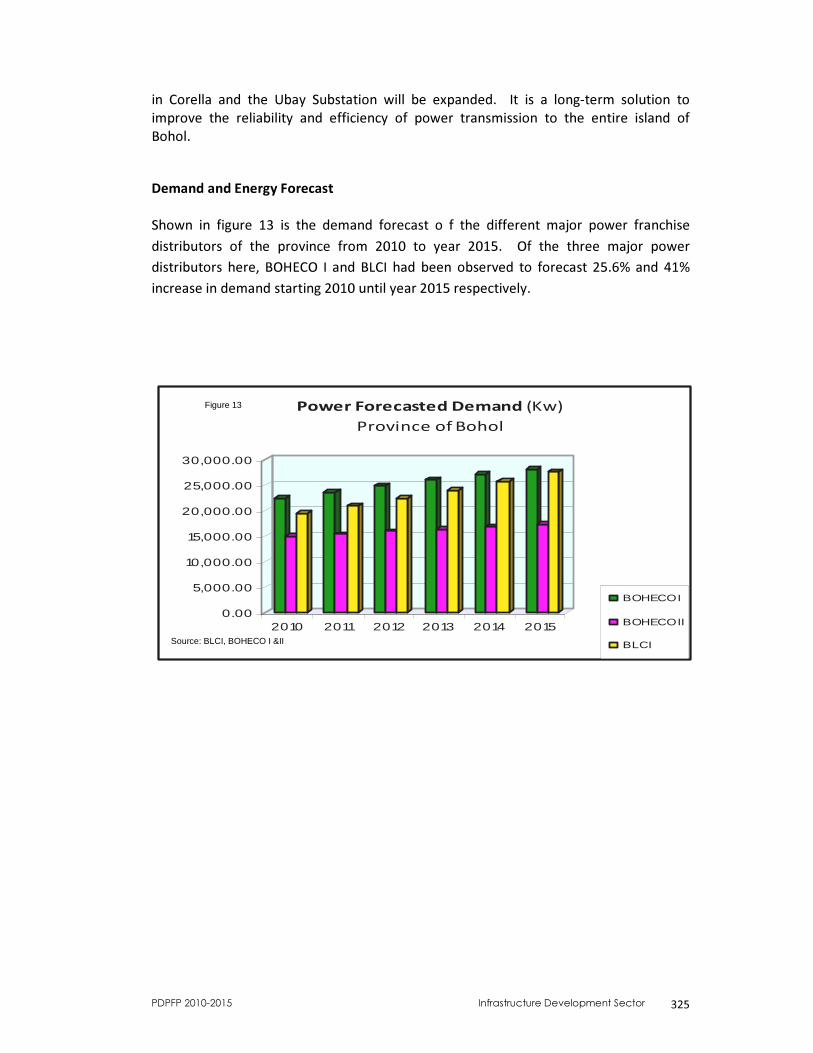
PDPFP 2010-2015 Infrastructure Development Sector 325
in Corella and the Ubay Substation will be expanded. It is a long-term solution to improve the reliability and efficiency of power transmission to the entire island of Bohol. Demand and Energy Forecast
Shown in figure 13 is the demand forecast o f the different major power franchise distributors of the province from 2010 to year 2015. Of the three major power distributors here, BOHECO I and BLCI had been observed to forecast 25.6% and 41% increase in demand starting 2010 until year 2015 respectively.
0.00
5,000.00
10,000.00
15,000.00
20,000.00
25,000.00
30,000.00
2010 2011 2012 2013 2014 2015
Power Forecasted Demand (Kw)Province of Bohol
BOHECO I
BOHECO II
BLCI
Figure 13
Source: BLCI, BOHECO I &II
PDPFP 2010-2015 Infrastructure Development Sector 326
DEVELOPMENT CHALLENGES
1. Capacity of Power (c/o SIPC) 2. Reliability of Power (c/o NGCP) 3. Forecasted Demand especially in Panglao Island for the next 5 years 4. Affordability of Power Rates (BOHECO I & II and BLCI) 5. Sub-standards lines
DEVELOPMENT PLAN FRAMEWORK Sub-Sector Vision
ADEQUATE, QUALITY, RELIABLE AND AFFORDABLE POWER SUPPLY INTHE PROVINCE OF BOHOL AT COMPETITIVE RATES GIVING DUE CONCERN TO CUSTOMERS SATISFACTION, SOCIETY AND THE ENVIRONMENT
Sub-Sector Goals
1. Adequate generation capacity during Bohol islanding operation 2. Reliability Standards complied 3. Met Forecasted demand especially in Panglao Island 4. Fully rehabilitated lines
Sub-Sector Objectives
1. To build land-based power plant 2. To interconnect Negros-Bohol or Cebu-Bohol 3. To install 138 KV transmission lines from Ubay to Corella 4. To install 10 MVA substation solely for Panglao Island 5. To upgrade medium voltage distribution lines 6. To allocate budget and transfer poles affected by road widening 7. To rehabilitate the over extended and sub-standard lines 8. To energize all households in the franchise area
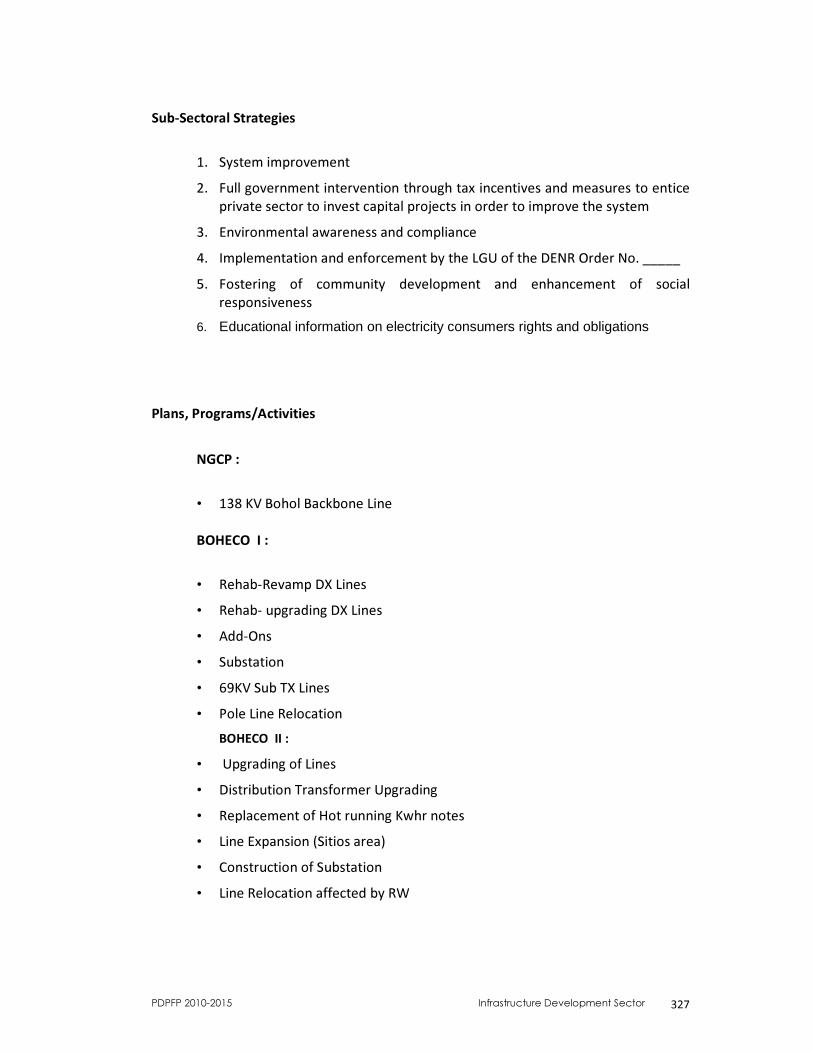
PDPFP 2010-2015 Infrastructure Development Sector 327
Sub-Sectoral Strategies
1. System improvement 2. Full government intervention through tax incentives and measures to entice
private sector to invest capital projects in order to improve the system 3. Environmental awareness and compliance 4. Implementation and enforcement by the LGU of the DENR Order No. _____ 5. Fostering of community development and enhancement of social
responsiveness 6. Educational information on electricity consumers rights and obligations
Plans, Programs/Activities
NGCP : • 138 KV Bohol Backbone Line BOHECO I : • Rehab-Revamp DX Lines • Rehab- upgrading DX Lines • Add-Ons • Substation • 69KV Sub TX Lines • Pole Line Relocation BOHECO II : • Upgrading of Lines • Distribution Transformer Upgrading • Replacement of Hot running Kwhr notes • Line Expansion (Sitios area) • Construction of Substation • Line Relocation affected by RW
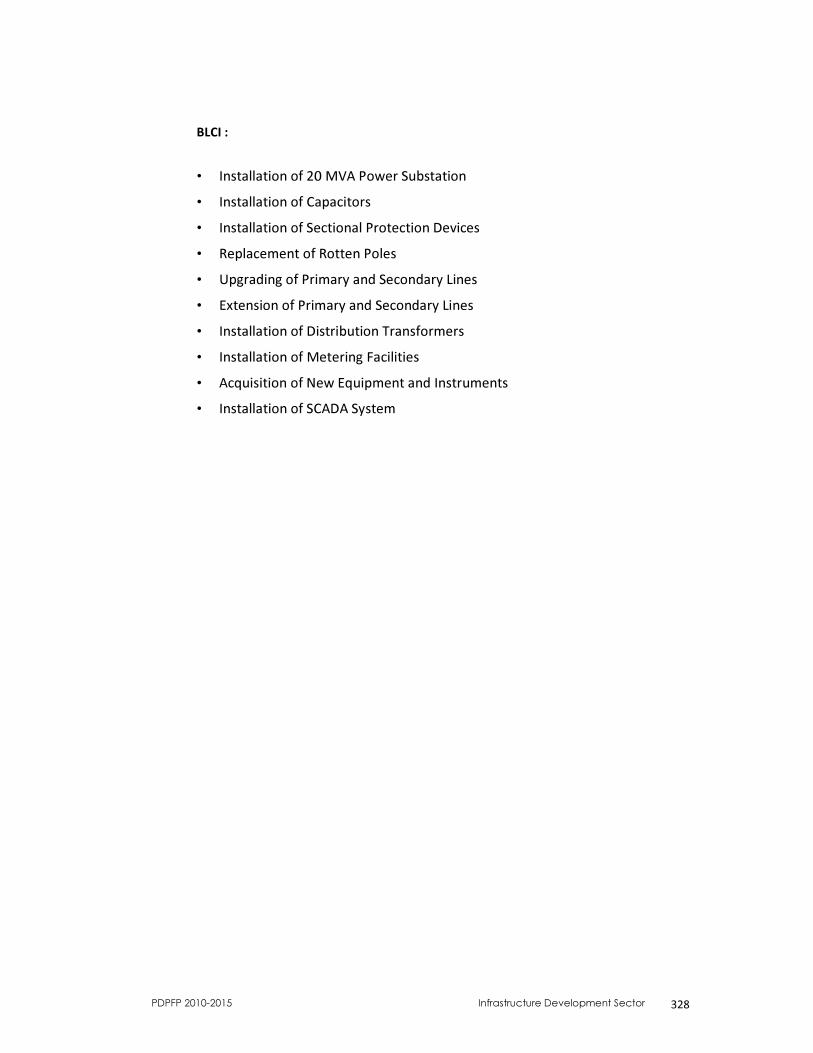
PDPFP 2010-2015 Infrastructure Development Sector 328
BLCI : • Installation of 20 MVA Power Substation • Installation of Capacitors • Installation of Sectional Protection Devices • Replacement of Rotten Poles • Upgrading of Primary and Secondary Lines • Extension of Primary and Secondary Lines • Installation of Distribution Transformers • Installation of Metering Facilities • Acquisition of New Equipment and Instruments • Installation of SCADA System


