Embed Size (px)
Citation preview
Walden University Walden University
ScholarWorks ScholarWorks
Walden Dissertations and Doctoral Studies Walden Dissertations and Doctoral Studies Collection
2021
Public Investment, Foreign Direct Investment, and Budget Deficit Public Investment, Foreign Direct Investment, and Budget Deficit
Komi Koutche Walden University
Follow this and additional works at: https://scholarworks.waldenu.edu/dissertations
Part of the Finance and Financial Management Commons
This Dissertation is brought to you for free and open access by the Walden Dissertations and Doctoral Studies Collection at ScholarWorks. It has been accepted for inclusion in Walden Dissertations and Doctoral Studies by an authorized administrator of ScholarWorks. For more information, please contact [email protected].
Walden University
College of Management and Technology
This is to certify that the doctoral study by
Komi Koutche
has been found to be complete and satisfactory in all respects,
and that any and all revisions required by
the review committee have been made.
Review Committee
Dr. Natalie Casale, Committee Chairperson, Doctor of Business Administration Faculty
Dr. Frank Bearden, Committee Member, Doctor of Business Administration Faculty
Dr. Thomas Schaefer, University Reviewer, Doctor of Business Administration Faculty
Chief Academic Officer and Provost
Sue Subocz, Ph.D.
Walden University
2021
Abstract
Public Investment, Foreign Direct Investment, and Budget Deficit
by
Komi Koutche
MBA, George Washington University, 2017
MS, University of Abomey Calavi, 2005
Doctoral Study Submitted in Fulfillment
of the Requirements for the Degree of
Doctor of Business Administration
Walden University
July 2021
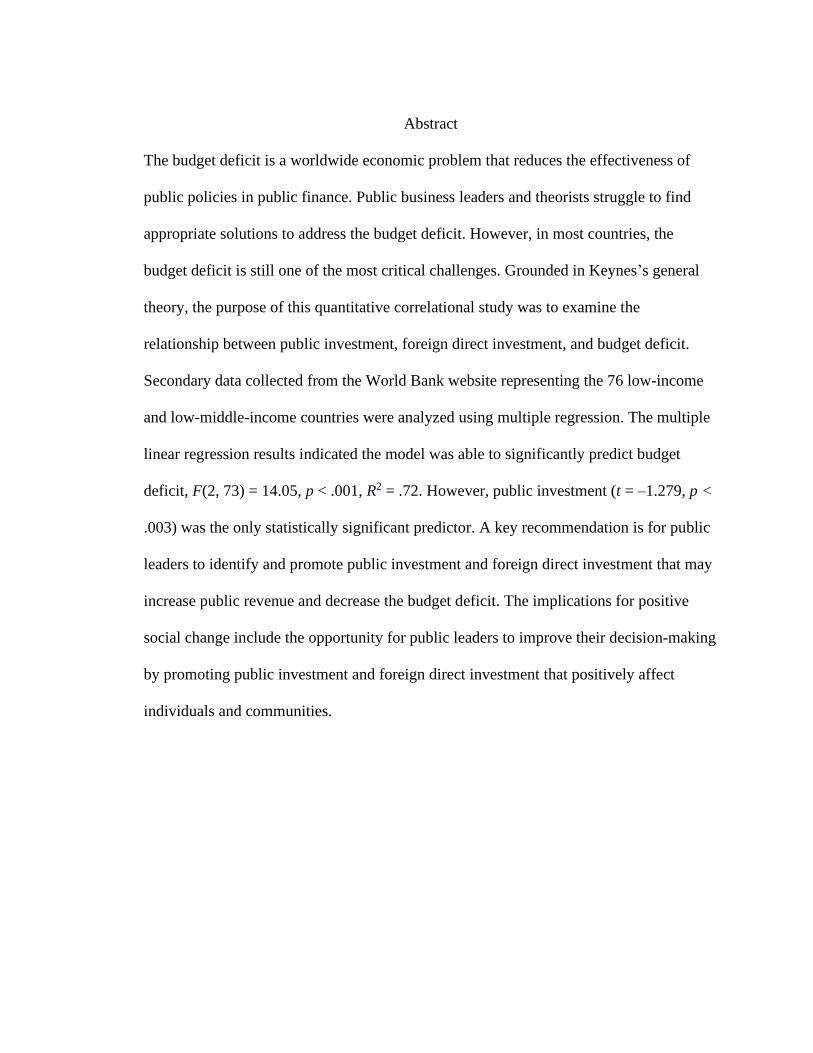
Abstract
The budget deficit is a worldwide economic problem that reduces the effectiveness of
public policies in public finance. Public business leaders and theorists struggle to find
appropriate solutions to address the budget deficit. However, in most countries, the
budget deficit is still one of the most critical challenges. Grounded in Keynes’s general
theory, the purpose of this quantitative correlational study was to examine the
relationship between public investment, foreign direct investment, and budget deficit.
Secondary data collected from the World Bank website representing the 76 low-income
and low-middle-income countries were analyzed using multiple regression. The multiple
linear regression results indicated the model was able to significantly predict budget
deficit, F(2, 73) = 14.05, p < .001, R2 = .72. However, public investment (t = –1.279, p <
.003) was the only statistically significant predictor. A key recommendation is for public
leaders to identify and promote public investment and foreign direct investment that may
increase public revenue and decrease the budget deficit. The implications for positive
social change include the opportunity for public leaders to improve their decision-making
by promoting public investment and foreign direct investment that positively affect
individuals and communities.
Public Investment, Foreign Direct Investment, and Budget Deficit
by
Komi Koutche
MBA, George Washington University, 2017
MS, University of Abomey Calavi, 2005
Doctoral Study Submitted in Fulfillment
of the Requirements for the Degree of
Doctor of Business Administration
Walden University
July 2021

Dedication
I dedicate the study to my spouse Zenabou Obinin Koutche and to my children
Esperance, Peace, Love, and Komi-Junior for their moral support, love, and daily acts of
encouragement. I thank my father and mother for their prayers, good intentions, and
encouragement to push me to go far in life even though they did not have the chance to
go to school in their life. To all my friends and supporters, I know how strong your
wishes were to see me become Dr. Koutche one day. Here we are, and I want to consider
the results of this study to be the fruit of our joint efforts. One step has been achieved. Let
us keep our focus on the next steps to achieve our own biggest goals and dreams, and our
goals for a new Africa and a new world. Let us move on to the next step.

Acknowledgments
First, this study is a result of God’s will, who protects me, inspires me, and gave
me all the resources that I needed to complete this study, despite all the events that I
faced during my doctoral journey. God, all thanks be to you. Special thanks to Dr. Casale,
my chair, without whom this study could not have been completed. She gave more than
her best and showed throughout the journey an unlimited willingness to help. I can also
not forget my second chair, Dr. Bearden, who was not involved in the daily tasks of this
study like Dr. Casale, but whose actions were prompt anytime he was needed. To all the
actors who were involved in the process of improving and approving the study, especially
my URR, I lack the words to convey my thanks. Now that all of you have helped me to
achieve this important step, it is my turn to make you proud of me by moving forward
and showing that you have contributed through this study to creating a new change agent
who will impact the community and maybe even the world. You will not be disappointed,
by God’s grace.
i
Table of Contents
List of Tables ..................................................................................................................... iv
List of Figures ......................................................................................................................v
Section 1: Foundation of the Study ......................................................................................1
Background of the Problem ...........................................................................................1
Problem Statement .........................................................................................................2
Purpose Statement ..........................................................................................................3
Nature of the Study ........................................................................................................3
Research Question .........................................................................................................4
Hypotheses .....................................................................................................................4
Theoretical Framework ..................................................................................................5
Operational Definitions ..................................................................................................6
Assumptions, Limitations, and Delimitations ................................................................7
Assumptions ............................................................................................................ 7
Limitations .............................................................................................................. 7
Delimitations ........................................................................................................... 7
Significance of the Study ...............................................................................................8
Contribution to Business Practice ........................................................................... 8
Implications for Social Change ............................................................................... 8
Review of the Professional and Academic Literature ....................................................9
Literature Search Strategy............................................................................................10
Application to the Applied Business Problem ...................................................... 10
ii
Low-Income Countries (LIC) and Low-Middle-Income Countries (LMIC) ........ 11
Theoretical Foundation of Study .................................................................................12
Keynes’s General Theory ..................................................................................... 12
Alternative Theories to Keynes’s General Theory ............................................... 18
Justification for the Keynes Theory in the Present Study ..................................... 25
Overview of Findings Related to Key Variables .........................................................27
Public Investment.................................................................................................. 27
Foreign Direct Investment .................................................................................... 32
Budget Deficits ..................................................................................................... 40
Transition .....................................................................................................................54
Section 2: The Project ........................................................................................................56
Purpose Statement ........................................................................................................56
Role of the Researcher .................................................................................................56
Participants ...................................................................................................................58
Research Method and Design ......................................................................................59
Research Method .................................................................................................. 59
Research Design.................................................................................................... 60
Population and Sampling .............................................................................................61
Ethical Research...........................................................................................................64
Data Collection Instruments ........................................................................................64
Data Collection Technique ..........................................................................................65
Data Analysis ...............................................................................................................66
iii
Study Validity ..............................................................................................................71
Transition and Summary ..............................................................................................74
Section 3: Application to Professional Practice and Implications for Change ..................75
Introduction ..................................................................................................................75
Presentation of the Findings.........................................................................................75
Tests of Assumptions ............................................................................................ 76
Descriptive Statistics ............................................................................................. 83
Inferential Results ................................................................................................. 83
Applications to Professional Practice ..........................................................................88
Implications for Social Change ....................................................................................89
Recommendations for Action ......................................................................................91
Recommendations for Further Research ......................................................................93
Reflections ...................................................................................................................94
Conclusion ...................................................................................................................96
References ..........................................................................................................................98
Appendix A: World Bank’s 2019 Countries Categorization ...........................................127
Appendix B: G*Power for Minimum Sample Size .........................................................129
Appendix C: G*Power for Maximum Sample Size .........................................................130
iv
List of Tables
Table 1. Reliability Test .................................................................................................... 76
Table 2. Multicollinearity Statistics .................................................................................. 77
Table 3. Test of Normality ................................................................................................ 81
Table 4. Mean and Standard Deviation for Predictor and Criterion Variables ................. 83
Table 5. Regression Analysis Summary for Predictor Variables ..................................... 84
v
List of Figures
Figure 1. Normal Probability Plot (P-P) of the Standardized Regression ........................ 78
Figure 2. Scatterplot of the Standardized Residuals ......................................................... 78
Figure 3. Histogram of Outlier for Public Investment ...................................................... 79
Figure 4. Outlier Histogram for FDI ................................................................................. 79
Figure 5. Histogram of Outlier for Budget Deficit ........................................................... 80
Figure 6. Normal (Q-Q) Plot of Public Investment .......................................................... 81
Figure 7. Normal (Q-Q) Plot of FDI ................................................................................. 82
Figure 8. Normal (Q-Q) Plot of Budget Deficit ................................................................ 82
1
Section 1: Foundation of the Study
The public budget refers to the total annual amount of public revenues and public
spending (Keynes, 1936). Public revenues entail taxes and other resources that a
government collects from different sources. In contrast, public spending is the different
ways through which governments spend public revenues to develop socioeconomic
projects that benefit communities and create economic growth (Dornean & Oanea, 2014).
Governments have limited resources, but the needs to satisfy are unlimited (Marshall &
Rochon, 2019). Therefore, the problem of a budget deficit is one of the critical indicators
of the efficiency of public budget management.
The budget deficit is a macroeconomic indicator widely used to assess the fiscal
policies of the countries. However, the budget deficit is a result of the allocation of the
budget, which is a management decision. Therefore, was essential to analyze the budget
deficit beyond a simple view of the macroeconomy. My aim in this study was to analyze
the budget deficit with a management perspective by examining the relationship between
public investment, foreign direct investment (FDI), and budget deficit. The findings of
the study can serve as a guide to help leaders of public agencies to make better decisions
of budget allocation.
Background of the Problem
The budget deficit is one of the most critical challenges in the management of
public finance (Bayraktar, 2019). In most countries of the world, the budget deficit’s
standard is 3% of the gross domestic product (GDP; Dou & Ye, 2018). The social and
economic needs that the government must satisfy may increase in the context of scarcity
2
of resources to meet those needs (Keynes, 1936). In such a circumstance, public spending
overcomes public revenues, and this leads to a budget deficit, which has become almost a
systemic problem (Ntembe et al., 2018).
The budget deficit is a serious economic problem in the field of the public finance
and represents a perpetual challenge that public leaders try to address (Abdullah et al.,
2018). Although the budget deficit is the result of management decisions, there is no
practical framework that leaders of the public financial agencies can reference to ground
their daily decision. Therefore, it is important to analyze the budget deficit from the
perspective of management. Providing leaders of the public agencies with a guide that
can help them to improve the management of the public budget is an important gap to fill
in the field of the public finance. In this quantitative correlational study, my aim was to
contribute to filling that gap.
Problem Statement
The budget deficit is a critical macroeconomic problem in developing countries,
which affects the efficiency of governments’ public policies (Pegkas, 2018). Data from
the 2018 report of the World Bank showed that, in more than 80% of the low-income
countries (LIC) and low-middle-income countries (LMIC), public authorities have failed
to achieve the set threshold of 3% of GDP, which is the established standard. The general
business problem was that the increasing budget deficits in the LIC and LMIC is a threat
to the achievement of social and economic goals. The specific business problem was that
some leaders of the public agencies involved in the process of management do not know
the relationship between public investment spending, FDI, and budget deficit.
3
Purpose Statement
The purpose of this quantitative correctional study was to examine the
relationship between public investment spending, FDI, and budget deficit. The
independent variables were public investment and FDI. The dependent variable was the
budget deficit. The target population comprised leaders of public agencies who held a
position of decision making in the process of the management of the public budget in the
LIC and LMIC. In terms of social change, the leaders of the public agencies can gain a
better understanding of the relationship between the three variables of the present study.
Leaders may use the results of this study to adopt a strategy to allocate public money to
public investment efficiently and to promote the inflows of FDI in projects that may
generate a positive impact on the communities.
Nature of the Study
The three basic methodologies to conduct scientific inquiries are qualitative,
quantitative, and mixed methods (Korstjens & Morser, 2017). The quantitative method is
appropriate to examine the relationship between variables, predict outcomes, or seek
cause and effect relationships to generalize to a broader population (Saunders et al.,
2015). The qualitative method is appropriate to answer how and why questions by using
narrative input as the primary data collection source (Yin, 2018). The mixed method is
appropriate when research uses both quantitative and qualitative approaches (Fisher &
Bloomfield, 2019). The qualitative was not appropriate for this study due to the
nonnumeric data collection approach. Furthermore, the mixed method was not
appropriate because I did not intend to combine both the qualitative and qualitative
4
approaches. Therefore, the quantitative method was the most suitable for this study
because I sought to use numerical data to examine the relationships between variables.
This study was a correlational design. Other quantitative research design options
include experimental and quasi-experimental. The correlational design consists of the use
of surveys, classification, and data reduction techniques, and assessments of relations
among variables (Watson, 2015). The experimental design involves extreme control of
the test environment and random assignment to conditions to control the outcome
(Watson, 2015). The quasi-experimental design entails variables of study without random
assignment (Saunders et al., 2015). The experimental and quasi-experimental designs
were inappropriate because of the lack of random data sampling and the statistical
significance of relationships among variables. The correlational design was appropriate to
this study because I sought to examine the relationship between independent and
dependent variables.
Research Question
What is the relationship between public investment spending, FDI, and budget
deficit?
Hypotheses
Null Hypothesis (H0): There is no statistically significant relationship between
public investment spending, FDI, and the budget deficit.
Alternative Hypothesis (H1): There is a statistically significant relationship
between public investment spending, FDI, and budget deficit.
5
Theoretical Framework
The British economist Keynes advocated the concept of deficit spending as fiscal
policy. To ground the present study, I chose the general theory that Keynes developed in
1936. In the general theory, Keynes (1936) contended that a decline in consumer
spending could be balanced by a corresponding increase in government deficit spending,
which would, therefore, maintain the correct balance of demand to avoid high
unemployment. According to Keynes, once full employment was reached, the market
could return to a more relaxed approach, and a reverse of the budget deficit could be
effective. However, the use of the budget deficit through public spending can induce
some economic deregulation (Irwin, 2015). Therefore, Keynes argued that if extra
government spending caused inflation, the government could raise taxes and drain
additional capital out of the economy.
Applied to this study, Keynes’s general theory allowed me to anticipate a
potential influence of public spending and FDI on the budget deficit for two essential
reasons. First, although the over public spending can induce budget deficit, budget deficit
is necessary to expand the economy, and consequently to generate more revenues that
will furthermore ensure the balance (Nicoloski & Nedanovski, 2018). Second, Keynes
(1936) asserted that raising additional taxes or attracting FDI to expand the economy
creates economic deregulations such as inflation. These two crucial statements of
Keynes’s theory revealed that there is a relationship between public investment, foreign
investment, and budget deficit that I examined in this study.
6
Operational Definitions
Budget deficit: Budget deficit refers to the difference between the total spending
and the total revenue of a government for a given year (Keynes, 1936).
Foreign direct investment (FDI): Public spending refers to the total annual
amount of money that foreign investors spend in a given economy through different
sectors of activities (Dornean & Oanea, 2014).
Gross domestic product: Nicoloski and Nedanovski (2018) defined the GDP as
the total value of goods produced and services provided in a country for 1 year.
Public current spending: Public current spending refers to the total annual amount
of money that the governments spend in public needs other than economic infrastructures
and other productive needs (Keynes, 1936).
Public investment: Public investment refers to the total annual amount of money
that governments spend in economic infrastructures like energy and road and other
productive projects (Keynes, 1936). Public investment refers to investments that
governments make in the expectation of economic growth and increase of the national
revenues (Barisiki & Baris, 2017).
Public spending: Public spending refers to the total annual amount of money that
governments spend to produce goods and services or to purchase goods and services that
are needed to fulfill the government’s economic and social objectives (Dornean & Oanea,
2014). The two components of public spending are public investment spending and
current public spending (Keynes, 1936).
7
Assumptions, Limitations, and Delimitations
Assumptions
Assumptions are circumstances and factors in a study that researchers assume to
be true (Polit & Beck, 2012). According to Saunders et al. (2015), assumptions are a set
of suppositions that are the closest possible reality that researchers can assume to be the
truth. The only assumption of this study was that the data I collected from the secondary
official sources on the variables of the study were reliable.
Limitations
A limitation is a weakness that potentially limits the validity of the results of a
study (Patton, 2015). According to Akaeze (2016), limitations are external conditions that
restrict the scope and have the potential to affect the outcome of the study. I identified
two possible limitations for the present study. The first limitation was that the data were
from secondary sources. Although I could rely on the reliability of the official sources
such as the reports of the World Bank and the international monetary fund, some reports
may have had some biases at their origin. The fact that the data for this study were
exclusively from secondary sources supposed that the eventual bias that those sources
may contain may also affect the outcome of the study. The second limitation was the
scope of the study, the LIC and LMIC. Such a reality may limit the potential to generalize
the results.
Delimitations
A delimitation is a boundary and parameter to which a study is deliberately
confined (Saunders et al., 2015). In this study, delimitations included collecting data only
8
on the economies of the LIC and LMIC. I focused the study on the relationship between
public investment, FDI, and budget deficit. I used only data from secondary sources to
proceed with the analysis.
Significance of the Study
Contribution to Business Practice
Mastering the budget deficit is one of the most challenging aspects of the
management of the budget deficit (Abdullah et al., 2018). Leaders of public agencies who
have the responsibilities of the management of the public budget can use the predictive
model to anticipate the level of the budget deficit by developing a relevant policy to
attract investment. Significant predictors can become the focus of those leaders to predict
the level of the budget deficit from a forecast of the public investment and the FDI. Thus,
this study may serve as a model for the leaders of public financial agencies to improve
the process of allocation of the limited resources between public investment and the other
components of public spending. The model may also help build relevant to attract the
FDI in a way that anticipates the budget deficit at its set level.
Implications for Social Change
Public spending and FDI are two important levers of social impacts in developing
countries (Liu et al., 2014). The implications of this study for positive social change
include the opportunity for the leaders of the public financial agencies to gain an
understanding of the relationship between public investment spending and FDI.
Promoting public investment and attracting FDI may improve the life conditions of the
communities if public projects target social sectors like healthcare, education, energy, and
9
water. Moreover, public investment and FDI may create jobs and other business
opportunities may help the communities to improve their lives conditions (Dornean &
Oanea, 2014).
Review of the Professional and Academic Literature
Budget deficit is a relatively recent national and global economic concept. Before
the 20th century, economists and advisers of governments advocated for a balanced
budget where expenditures matched revenues (Mariana, 2016). The goal was a surplus
rather than a deficit budget. However, the Keynesian revolution coupled with the rise of
demand-led macroeconomics legitimized deficit budgets, allowing governments to spend
more than their anticipated revenues (Banday & Aneja, 2016). Subsequently,
governments, including the U.S. government, borrowed funds to increase their
expenditure. Today, there are very few countries that have an equilibrium budget
(Muhammad et al., 2016). Creating deficits has become intentional in many nations
because researchers and practitioners believe that doing so can stimulate economic
growth through spending (Bonizzi, 2017).
Despite the wide adoption and implementation of budget deficits in many
economies, differing views about the pros and cons of budget deficits remain. The
perspectives of economic scholars on strategies for creating, addressing, and maximizing
budget deficit for economic gains also differ widely, as do theoretical worldviews on
when and how national and global economic leaders may leverage budgets to strengthen
their economy and bounce back in the event of a downturn. This section includes a
discussion of these perspectives as presented in published literature. First, I present the
10
literature search strategy and discuss the theoretical foundation for this study in the
context of related theories. I then present a review of the literature related to the three
central variables for this study: public investment, FDI, and budget deficit. I conclude by
sharing my analysis of the relationship between these three variables as inferred from the
literature.
Literature Search Strategy
Publications examined in this review include scholarly peer-reviewed journal
articles published within the last 5 years and a few nonpeer-reviewed publications
relevant to the topic. I located relevant literature by searching the following databases:
Academic Source Premier, EBSCOhost, ProQuest, Hein Online, Emerald, Sage, and
Business Source Premier, Questia, and Google Scholar. The keywords employed for the
search included public investment, foreign direct investment, budget deficit, public
expenditure, foreign investment, current account deficit, budget deficit and economic
growth, budget deficit and public investment, budget deficit and foreign investment,
public investment and foreign direct investment, foreign investment in Africa, public
investment in Africa, budget deficit in Africa, budget deficit in Europe, and budget deficit
in North America.
Application to the Applied Business Problem
The purpose of this quantitative correctional study was to examine the
relationship between public investment spending, FDI, and budget deficit. The literature
review involved extensive research with critical analysis and synthesis of the themes
using Keynes's theory to ground the study. This study's target population included the
11
leaders of the public financial agencies of the eight countries members of the LIC and
LMIC, which is the economic bloc of the French speaking countries of the West African
region.
Low-Income Countries (LIC) and Low-Middle-Income Countries (LMIC)
According to the World Bank, the four categories of countries in the world are
LIC, LMIC, upper-middle-income countries (UMIC), and high-income countries (HIC).
The LIC have a per capita gross national income (GNI) of less than $1,036, and the
LMIC have per capita GNI from $1,036 to $4,045 (World Bank, 2019). The UMIC have
a per capital GNI between $4,046 and $ 12,535, and the HIC have a per capita GNI above
$12,535. LIC and LMIC are developing countries that receive development aid from HIC
governments and international agencies to boost their development.
Per capita GNI is the dollar value of a given country divided by the population
(Abdullah et al., 2018). Using per capita GNI as a criterion to classify countries allows
researchers to determine the level of development in countries around the world and to
assess the level of the living conditions of the populations (Mariana, 2016). Per capita
GNI is an indicator of the distribution of the national income and serves as a means to
compare the level of poverty between countries (Barisiki & Baris, 2017). Per capita GNI
is also an indicator to public leaders to develop public policies that may improve the lives
and conditions of the communities (World Bank, 2020).
12
Theoretical Foundation of Study
Keynes’s General Theory
Keynes developed the theory of economics in the 1930s during the Great
Depression, which began in 1929 (Keynes, 1936; O’Connell, 2016). The central premise
of the theory is that increasing aggregate demand boosts economic growth by optimizing
economic performance and preventing economic collapse (Keynes, 1936). In the event of
an economic depression, governments can stimulate demand and end the depression by
increasing expenditure and lowering taxes (O’Connell, 2016). Monetary and fiscal
policies serve as fundamental tools that public leaders can use to stimulate aggregate
demand in the economy (Samuels & Medema, 2019). In his theory, Keynes suggested
increasing government spending in the event of an economic depression to stimulate the
economy and recommended monetary and fiscal policies to stimulate aggregate demand
in depressed economies.
Keynes’s fiscal policy centers on the multiplier effect. The multiplier effect means
that a dollar spent as a fiscal stimulus ends up producing more than a dollar of economic
growth (Dillard, 2018; Keynes, 1936). Introducing government funds into an economy as
an economic stimulus leads to increased business activities and more spending in the
country (Dillard, 2018; Keynes, 1936). Keynes (1936) proposed that when there is more
spending in the economy, aggregate output and income increase. Extra income means
that workers will be more willing to spend their surplus income, which results in higher
growth in GDP compared to the initial stimulus amount injected by the government
(Armstrong, 2019; Driessen & Gravelle, 2019). Because spending by one consumer
13
means income for another worker, Keynes’s fiscal policy posits an increase in
government spending during an economic crisis, which can boost aggregate demand and
increase revenues. For Keynes, an increase in individuals’ income may increase GDP
because of the spending of the surplus of income in goods and services. Thus, Keynes
encouraged more spending and less saving during an economic recession.
Interest and demand are two critical focus of Keynes’s theory. Keynes wrote that
a government can increase demand by lowering interest rates (as cited in Driessen &
Gravelle, 2019; Walsh, 2017). Keynes based his support for this type of government
intervention on the assumption that an economy in crisis requires radical interventions to
recover, and factors such as wages and employment are slow to respond to market forces
that shape the economy (as cited in Driessen & Gravelle, 2019; Keynes, 1936; Walsh,
2017). Keynes recommended short-term government interventions to stimulate the
economy (as cited in Barisiki & Baris, 2017). According to Keynes, increasing public
spending may be an essential way to boost growth for the economy.
Application of Keynesian Theory in Previous Studies
Authors of existing studies have applied the Keynes theory for economic
development research in various countries. Al-Fawwaz (2016), for instance, researched
the impact of government expenditure on the economic growth of Jordan between 1980
and 2013 and pointed out that public investment is the most effective component of
public spending on economic growth. Musa and Jelilov (2016) conducted a similar study
to determine the impact of government expenditure but with a focus on economic growth
in Nigeria. Musa and Jelilov sought to determine why government expenditure in Nigeria
14
had not resulted in proportionate economic growth between 1981 and 2012. In another
study, Sriyalatha and Torii (2019) compared Singapore and Sri Lanka to determine the
long-term impact of fiscal policy on economic growth between 1972 and 2017.
Moreover, Gatawa et al. (2017) examined the impact of money supply, interest rates, and
inflation on economic growth. Additionally, Laosebikan et al. (2018) analyzed the impact
of public debt on the economy of Nigeria and analyzed each category to isolate the
category of debt that had the largest impact on GDP. Furthermore, Maurya and Singh
(2017) examined the growth effects of public expenditure in India. The findings of the
preceding two studies revealed the substantial interest in the scholarly community in
validating the propositions of the Keynesian theory.
In addition, many authors have supported the central assertion of Keynesian
theory. Al-Fawwaz (2016) found that total government expenditure and current
government expenditure had a positive impact on economic growth. However, Al-
Fawwaz was not specific about the categories of the current government expenditures
that positively affect the economic growth. Musa and Jelilov (2016) determined that the
relationship between government expenditure and economic growth was positive, and
Hussain and Haque (2017) observed a positive and significant relationship between
budget deficit and GDP growth rate in Bangladesh. Sriyalatha and Torii (2019) found that
government revenue, expenditure, and investment expenditure had a positive and
significant effect on the economic growth of Singapore and Sri Lanka. Gatawa et al.
(2017) found a positive effect of money supply and a negative effect of interest rate and
inflation on economic growth in the long term. Findings from Maurya and Singh’s (2017)
15
study revealed that increased public expenditure leads to growth in the economy.
Laosebikan et al. (2018) determined that external and domestic government debts were
statistically significant to the economy’s growth. Laosebikan et al. also found that the
coefficients of domestic debt, external debt, fixed capital, and interest rates had a positive
effect on the GDP, and domestic debt had the most significant impact because it had the
highest coefficient. The findings support Keynes’s economic theory by indicating that
mechanisms such as government expenditures, fiscal deficit, government revenue, public
investment, external debt money supply through FDI, domestic debt money supply, and
interest rates positively influenced economic growth.
Criticism of the Keynesian Theory of Economics
An often-cited gap in Keynesian theory relates to its propensity to stimulate an
increase in debt, which may result in a further downward turn for an economy in crisis.
Keynes (1936) proposed that to break an economic crisis cycle, public leaders may
borrow funds to intervene by pumping monies into its economy. Keynes assumed that
governments could easily repay public debt if they increased spending to stimulate the
economy. Therefore, for Keynes, budget deficit may generate public revenue to pay
public debt that public leaders create when they decide to increase public spending.
However, Keynes did not specify the type of spending that may generate public revenue,
and that is the main weakness of Keynes’s perspective of the relationship between public
spending and budget deficit. Ajudua and Davis (2015) acknowledged that public
investment affects economic growth positively. Also, Keynes ignored the fact that
borrowing and budget deficits lead to high interest rates and financial crowding-out
16
(Laosebikan et al., 2018). Crowding-out results when public leaders increase borrowing
from the private sector to finance higher social investment (Hussain & Haque, 2017).
When public leaders increase borrowing from the private sector to finance public
projects, the interest rates increase and the private investment decreases (Sriyalatha &
Torii, 2019). Keynesians did not consider the effect of budget deficit on high interest
rates and crowding-out in the economy in the assumption on borrowing, stimulus
spending, and debt repayment. Also, Keynes did not consider the effects of gaps in
lending processes that may delay the deployment of funds necessary for economic
stimulation.
Critics of Keynes’s theory also argued that because of the bureaucratic necessities
that accompany borrowing and stimulus spending, fiscal expansion in an economy
usually comes too late (i.e., when the economy has started to recover). Fiscal expansion
results in an upward change in aggregate demand such that when the economy starts to
recover, the demand becomes difficult to halt and may lead to inflation in the
marketplace (Gatawa et al., 2017; Sriyalatha & Torii, 2019). Additionally, predicting the
output gap, which is the difference between aggregate demand and aggregate production,
may be difficult because it varies (Li, 2017), but Keynesian theory includes an
assumption that it is possible to determine how much demand is necessary to match the
output gap (Li, 2017; Tang & Bethencourt, 2017). Implementing the Keynesian theory
may create an imbalance economic situation (Gatawa et al., 2017). Keynesian theory fails
to account for the spike and often uncontrollable demand and mismatched output gap that
results from bureaucratic delays associated with stimulus spending (Li, 2017). Keynesian
17
theory may also ignore changes in the political environment of a country after an
economic crisis (Laosebikan et al., 2018).
Keynesian and Ricardian economists have some essential points of divergence.
According to Li (2017), Keynesian economists did not consider the concepts of
equivalence and change in the political environment in a country, which are the heart of
Ricardian theory. In Ricardian theory, once the economy has reached equilibrium, the
taxes will increase to pay off the debt (Boundless Economics, 2020). However,
implementing an expansionary fiscal policy by a government may not be a solution to
finance tax cuts through borrowing (Ahmad & Rahman, 2017). The reason is that people
will be less likely to spend their tax cut because they expect taxes to rise again (Li, 2017).
In such cases, the expansionary fiscal policy will not deliver the desired effect on the
economy and may increase unemployment (Heimberger et al., 2017).
Keynes’s theory of economics serves as a way to encourage public leaders to
spend more during recessions (Ajudua & Davis, 2015). However, after the recession,
spending by the government does not reduce (Ajudua & Davis, 2015). The result is that
the public leaders that follow recessions impose high taxes and have high spending
standards, and hence bigger governments (Ahmad & Rahman, 2017). Governments tend
to hold onto spending projects that they design for short-term purposes, and they end up
serving long-term goals (Boundless Economics, 2020). The application of Keynesian
theory fails to consider that public leaders may maintain the increase in spending
recommended by the Keynesian theory policy during and after an economic crisis, which
leads to increased tax rates and government expenditure rates.
18
Keynes also faced other types of critics. Critics argue that Keynes’s theory fails to
account for consequences of budget deficits that relate to high interest rates and decreases
in private sector investment that may sink the economy in the long run (Hussain &
Haque, 2017; Laosebikan et al., 2018; Sriyalatha & Torii, 2019). The typical time lag
between the onset of a crisis and the implementation of a fiscal policy can result in an
imbalance between demand and output (Gatawa et al., 2017; Li, 2017; Sriyalatha & Torii,
2019). Keynes did not consider the feasibility and the implications of sustaining fiscal
expansion projects and expenditures after an economic crisis is over (Boundless
Economics, 2020; Li, 2017). Keynes’s fiscal and monetary policy solutions can lead to
high interest rates and reduced private investment, which are disadvantageous to an
economy (Sriyalatha & Torii, 2019). Critics also believe that the theory does not include
consideration of the consequences of the increased government spending and expenditure
proposed after an economic crisis (Li, 2017). However, Keynes’s framework has the
advantage of offering a lens to examine how public investment and FDI can affect the
budget deficit.
Alternative Theories to Keynes’s General Theory
The individuals who criticize Keynes’s theory oppose the monetarist, Austrian,
and neoclassical theories as alternative theories to Keynes’s theory. The applicability of
the alternative theories to the present study depended on how focused the theorists were
on the study variables and the relationships between variables. Although Keynesian,
Autrian, monetarists, and neoclassical theorists developed different approaches to address
19
an economic depression, the developments below show that only Keynes’s theory
includes a focus on the variables of the present study.
Monetarist Theory
Monetary theory is one of the major economic theories of the 19th century.
Milton Friedman put the monetarist theory forward in 1956 to restate the quantity theory
of money (Brunner & Meltzer, 1972). The focus of the monetarist theory is the idea that
the main driver of economic activities in a country is a change in its money supply.
Central banks have the most critical role in economic growth (Driessen & Gravelle, 2019;
Ibrahim, 2017); therefore, leaders of central banks can exert power over an economy’s
growth by tampering with the amount of currency and liquid instruments in circulation
within an economy. If a country’s money supply increases, economic activities also
increase. The theory follows the formula MV = PQ, where M is monetary supply, V is
velocity, and Q is number of goods and services. When the money supply increased,
velocity holding constant, P or Q or P and Q also increase (Armstrong, 2019). In
practice, public leaders of some countries implement the monetarist theory. For example,
Miranda (2018) claimed that the monetarist theory inspired the monetary policy of the
central bank of Mexico. The monetarists posit that money supply is the primary
determinant of economic growth. The theory recognizes the role of central banks in
increasing the money supply during an economic crisis and subsequently influencing
economic growth in a country.
Monetarist theory has both strengths and weaknesses. One strength of the theory
is that it includes a strategy to counter inflation (Walsh, 2017). In the short-term, the
20
interest rate increases when central banks acquire governments bonds and reduce money
supply (Obeng & Sakyi, 2017). A long-term increase in lending institutions’ interest rates
slows consumer spending by barring access to credit (Walsh, 2017). The theory’s
weakness is that it fails to consider the subjectivity involved in capital valuation
(Boundless Economics, 2020). Hülsmann (2018) found that the money supply’s artificial
expansion tends to result in intertemporal imbalances in a production structure. However,
the theory has limits because it assumes the capital’s objective value in the economy and
its effects on demand.
Both monetarist theory and Keynesian theory have a specific approach to fixing
an economy in crisis. The monetarist theory relates to Keynes’s theory of economics in
that both theories advocate for an increase in money supply to stimulate the economy
during recessions (Armstrong, 2019). However, while the Keynes theory is flexible about
the money supply source, the monetary theory disputes the borrowing of money to
increase spending (Miranda, 2018). According to monetarists, central banks should print
more money to feed the economy instead of raising additional taxes, which is one of
Keynes’s critical solutions when an economy is subject to deregulation.
Monetarist and Keynesian theories have both differences and similarities.
According to Driessen and Gravelle (2019), monetarists acknowledge the quantity theory
of money and consider money supply a critical determinant of economic growth.
Furthermore, monetarist economists recognize the role of essential institutions such as
central banks in controlling the money supply and subsequent economic growth
(Driessen & Gravelle, 2019). The similarity between Keynesians’ and monetarists’
21
perspectives is that the economists of both theories advocated an increase in money
supply in an economic crisis (Miranda, 2018). The main point of difference between both
theories is the source of funds for the money supply (Driessen & Gravelle, 2019).
Whereas the monetarist theory recommends that central banks supply the money needed
and advocates against borrowing, the Keynesian theory recommends a flexible source of
funds that may include borrowed funds (Driessen & Gravelle, 2019). Walsh (2017)
emphasized that the monetarist theory can effectively regulate inflation by deploying
bond issuance measures and increased interest rates. Monetarist economists also pointed
out the value of capital in the economy and the effects of the capital on demand and
supply (Hülsmann, 2018).
Austrian Economic Theory
Austrian economic theory is another major economic theory of the 19th century.
Austrian economists based their theory on methodological individualism, which includes
an assumption that people act in meaningful ways that can undergo analysis (Schumpeter,
2017). Early contributors to its foundation include Carl Menger, Frederich Von Weise,
and Eugene Von-Bawerk (Boundless Economics, 2020; Smith, 1994). According to
Menger, value is subjective (Smith, 1994). The ability to satisfy human needs determines
the value of a product (Schumpeter, 2017). The Austrian economists based their theory
on human behavior and emphasized utility as a measure of a product’s value to determine
the extent of application and support to an economy in crisis (Smith, 1994).
Economists have divergent positions about the Austrian theory. For example,
Pham (2017) examined the unification of the Austrian theory with mainstream economics
22
and compared the methodology of Austrian economic theory with two methods from
mainstream economics. Focusing on the orthodox and the revealed preference
methodologies from mainstream economics, Pham recommended that the Austrian
economists give due importance to empirical work within their research program. Pham
believed the empirical work in the research body on the Austrian theory demonstrates the
agreements between mainstream economics and Austrian research paradigms. Elert and
Henrekson (2019) contended that economists who agree with the Austrian school of
thought need to incorporate collaborative innovation into their research on an
unstructured market order. For Elert and Henrekson, a lack of innovation is an obstacle to
the success of entrepreneurship. To demonstrate a new paradigm for Austrian economic
thought, Elert and Henrekson identified evolutionary innovation blocks of five pools of
economic skills necessary for building collaborative teams. The Austrian theory approach
aligns with mainstream economics; however, a collaborative innovation to strengthen the
theory and make it more relevant in the modern economic environment is necessary
(Schumpeter, 2017).
The Austrian theory differs from Keynesian theory in terms of approach.
According to Pham (2017), the Austrian economists disagreed with Keynes on
government intervention in the economy during a recession to restore equilibrium. The
Austrian economists advocated emphasizing the product and the buyer as a viable way to
restore an economy in crises. The Austrian economic theory’s weakness is that Austrian
economists have ignored statistical or mathematical methods for measuring and analyzing
economics variables and failed to consider experimental economics, aggregate
23
macroeconomic analysis, and econometrics (Boundless Economics, 2020). Instead,
Austrian economists based their theory on the observation of people’s actions and
therefore borrowed from social sciences (Beck & Witt, 2019). Additionally, the Austrian
perspectives lack clarity and models to analyze macroeconomic concepts, such as budget
deficit and foreign investment, which makes it unsuitable for the current study (Beck &
Witt, 2019; Boundless Economics, 2020).
The Austrian theory and the Keynesian theory also have another difference.
According to Schumpeter (2017), the Austrian economists focused on analyzing human
behaviors for economic development. In contrast, Keynesian economists focus on the
role of other factors, such as money, investment, employment, and interest rate.
Moreover, Austrian economists prioritized utility, products, and buyers as viable means
for stimulating an economy in a crisis, whereas Keynesian theory recommends
government intervention through deficit spending to stimulate an economy (Pham, 2017;
Schumpeter, 2017; Smith, 1994). Thus, the key difference between the Austrian and
Keynesian theories is the distinct approaches to responding to an economic recession.
Neoclassical Economics Theory
Another alternative economic theory to Keynes’s theory is the neoclassical
economic theory. Adam Smith and David Ricardo developed the neoclassical theory in
the early 19th century (Bernheim, 1989; Boundless Economics, 2020; Hollander, 1973).
The neoclassical theorists posited that competition leads to an efficient allocation of
resources in an economy. The forces of supply and demand create market equilibrium
(Pham, 2017). The neoclassical economists stated that savings determine investment;
24
therefore, equilibrium in the market and growth at full employment should be a
government’s primary economic priorities (Boundless Economics, 2020). Neoclassical
economists assume that consumers’ first concern is to maximize their satisfaction (von
Hauff, 2020). Making economic decision involves dealing with rationality, and people
make purchasing decisions considering the products’ perceived utility (von Hauff, 2020;
Hollander, 1973; Sredojević et al., 2016; Vlados, 2019). The neoclassical theorists
highlighted the importance of market forces of demand and supply in creating market
equilibrium and noted the effects of human perceptions on economic decisions
(Hollander, 1973). Therefore, the difference that makes the neoclassical theory, which is
an alternative theory to the Keynesian theory, is the place of market forces in the
neoclassical theory.
The neoclassical theory differs from the Keynes theory in that, whereas Keynes’s
theory proposes the management of aggregate demand by the government during a
recession, neoclassical economists advocate for minimum involvement by the
government in the economy (Beck & Witt, 2019; Sajjad et al., 2018). Neoclassical
theorists assigned the government a limited role in providing essential services (Vlados,
2019). A decrease in aggregate demand would lead to a decrease in production, which
would consequently accelerate a decline in wages and prices (Inoua & Smith, 2019). The
cyclical swings would induce an adjustment of the economy and restore economic growth
(O’Brien, 2017). However, Keynes drew from experiences in the great recession to
establish that characteristics of market economies and their structural rigidity can worsen
economic weaknesses and cause a further decline in aggregate demand. Keynes (1936)
25
argued that lower wages could not restore full employment because employers cannot be
willing to encourage employees to produce more goods without a change in demand.
Additionally, in a depression, business conditions do not allow for an incentive
for firms to make more investment; instead, capital investment decreases (O’Connell,
2016; Samuels & Medema, 2019; Stockhammer, 2017; Tily, 2016). The neoclassical
theorists limited government intervention in economic crises and posited the self-
regulation of economies through market forces (Tily, 2016), in contrast with the
Keynesian theorists who advocated for government intervention to stimulate economic
growth in economic crises (Samuels & Medema, 2019). Furthermore, the neoclassical
theorists did not consider the adverse effects of the economic crisis on business climate
and the subsequent impact on capital investment (Stockhammer, 2017), which makes the
theory unsuitable for this study. Therefore, the critical difference between neoclassical
and Keynesian perspectives is the government’s role in an economic crisis. The
neoclassical economists failed to consider that although the market forces are essential in
the functioning of an economy, government interventions are necessary to adjust
regulation and stimulus to boost the economy.
Justification for the Keynes Theory in the Present Study
The Keynesian theory aligns with the concepts under focus in this study for two
reasons. First, the Keynesian theorists center their analysis on budget deficit, which is the
dependent variable for this study, and explain pathways through which budget deficit
may serve to help economies recover from a crisis (Tanzi & Schuknecht, 1997). Second,
FDI and public investment have macroeconomic components related to Keynes’s theory
26
(Onuoha et al., 2018). FDI induces new markets in the recipient country and increased
spending in the economy (Paul & Singh, 2017). Keynes (1936) noted that an increase in
spending in the economy causes the multiplier effect that stimulates economic growth.
Furthermore, Abu and Karim (2016) posited a positive correlation exists between
economic growth and public revenues, and all other factors remain the same. An increase
in public revenues leads to a reduction in the budget deficit. Therefore, there may be an
implicit relationship between budget public investment, which, according to Ahmad and
Rahman (2017), is an essential factor of economic growth, FDI, and budget deficit.
Furthermore, analyzing some essential factors that characterize an economic
depression is another way to demonstrate Keynes’s perspective in the present study. Low
output and unemployment in the marketplace are the most critical manifestations of
economic depression (Dillard, 2018; Keynes, 1936). In Keynes’s perspective, injecting a
stimulus to increase production and employment, attracting FDI, and increasing public
investment and FDI are essential solutions to boost the economy in a depression, and
consequently improve individual and public revenues (Dillard, 2018). According to
Dillard (2018), an increase in individuals’ revenues may increase public revenues through
taxes, and an increase in public revenue may reduce the budget deficit. Therefore, the
application of Keynes’s theory to the context of a depression helps to anticipate a
possible relationship between public investment, FDI, and budget deficit.
Unlike the Keynes perspective, the monetarist, Austrian, and neoclassical
economists focused their analysis on factors that do not align with the present study.
Monetarist economists emphasized the place of money supply in an economic crisis
27
(Armstrong, 2019), the Austrian economists posited the importance of human behavior in
an economic crisis (Schumpeter, 2017), and the neoclassical economists advocated the
role of market forces to address the consequences of an economic crisis (Vlados, 2019).
Although money supply, human behavior, and market forces are three essential factors
that theorists may use to build relevant solutions to an economy in crisis, those three
factors cannot serve as variables for the present study. In contrast, Keynes’s perspective
has an implicit or explicit focus on public investment, FDI, and budget deficit, which are
the three variables in this study. Therefore, Keynes provided a lens to conduct a more in-
depth examination of the relationship between public investment, FDI, and budget deficit.
Keynesian constructs can serve as a framework for explaining the budget deficit concept
and as pathways for government intervention in public investment and FDI to manage the
budget deficit efficiently.
Overview of Findings Related to Key Variables
Public Investment
Impact of Public Investment on Private Investment
The impact of public investment on the economy is subject to debate. Different
positions exist on the effects of public investment on private investment. According to
Makuyana and Odhiambo (2016), public investment can encourage private investment.
National connectivity and infrastructure and public services are essential for the growth
of private investment and the consequent creation of sustained employment (Ahmad,
2017). The use of public debt to finance public investment in energy, roads infrastructure,
and information technologies, may stimulate private investments (Mabula & Mutasa,
28
2019). Dash (2016) evaluated the relationship between public and private investment in
India from 1970 to 2013. Findings from Dash’s study showed that, in the short run,
public investment has a positive effect on private investment and crowds out private
investment, depending on governments’ options of investment.
Different angles of analysis on the effects of public investment on private
investment exist in the literature. Nguyen and Trinh (2018) reported that the crowd-in or
crowd-out effect depends on the time lag and claimed that public investment crowds in
private investment in the short term but has long-term crowding-out effects. Using annual
data from 1960–1961 to 2017–2018 in India, Mallick (2019) examined whether public
investment crowds out or crowds in private investment. Findings from the study indicated
that a crowd-in resulted after a few quarters of crowding-out private investment. In
Brazil, from 1982 to 2013, there was a crowding-in effect of private investment by public
investment (de Borja Reis et al., 2019). Crowding-in impacts of public investment on
private investment may be influenced by the effect of demand, increase in productivity,
increase in private capital, and favorable structure policies (de Borja Reis et al., 2019). A
market-friendly incumbent and increase in FDI can dampen the crowding-out effect of
public investment. Public investment may favor or deter private investment. Public
investment may create crowding-in effects and crowding-out effects to private investment
with evidence of crowding-in in the short run appearing more prevalent than in the long
term (Mallick, 2019). According to Nguyen and Trinh (2018), enabling the environment
of infrastructure, national connectivity, and public service may determine the effect of
public investment on private investment.
29
Impact of Public Investment on Economic Growth
The relationship between public investment and economic growth is a subject of
interest. Public investment is an essential precursor for economic growth (Bayraktar,
2019; Junquera-Varela et al., 2017; Savage, 2019; Zergawu et al., 2018). Public
investment supports an increase in revenue and induces an accumulation of private and
infrastructure capital, which furthers economic growth and stability (Junquera-Varela et
al., 2017; Savage, 2019; Zergawu et al., 2018). However, the effectiveness of public
investment in supporting economic growth is mixed and differs from economy to
economy (Bengtsson & Stockhammer, 2018; Schwartz, 2015). Public investment may
also induce the growth of the industrial sector and the broader economy (de Borja Reis et
al., 2019). Truger (2016) also observed that through public investment in infrastructure,
innovations, green investments, and education, countries experience increased job
opportunities, high living standards, and ripple productivity.
Critics argue against public investment as a significant facilitator of economic
growth. From a study on Chile, Ahmad (2017) pointed out that public investment alone
did not generate sustainable growth in Chile. In a similar study on Vietnam, Nguyen and
Trinh (2018) indicated that public investment did not encourage economic growth in the
country. Furthermore, Nguyen and Trinh posited that investment from the private sector,
FDI, and state-owned enterprises positively affected growth in the short term. Although
public investment leads to higher growth rates in some economies, the impact of others is
limited (Nguyen & Trinh, 2018). However, with other micro- and macroeconomic
variables such as private investment and FDI, the effectiveness of public investment may
30
become more evident (Ahmad, 2017). Therefore, public investment alone might not
sustain economic growth in some economies.
Factors Influencing Public Investment Effectiveness
Some essential factors determine public investment effectiveness in supporting
economic growth. Those factors include quality of the investing and recipient institutions,
conditions in financial markets, effects of macroeconomic variables, crowding-out effects
of public spending, the income level of countries, and the threshold level or volatility of
public investment (Bayraktar, 2016; Makuyana & Odhiambo, 2016; Yilmaz, 2018).
Makuyana and Odhiambo (2016) pointed out that, in developed economies, an
association exists between an increase in public investment and economic growth, but
they did not observe the same for developing economies. For Bayraktar (2016), the
influence of public investment on economic growth is dependent on the economic and
institutional factors of investing institutions or countries and recipient countries. The
level of economic development in a country may determine the influence of public
investment in that country and its economic growth. Investment rates determine their
effectiveness in beneficiary countries.
The volatility or threshold of public investment may determine the impact on
economic growth. Bayraktar (2016) observed that returns on public investment were
exponentially higher in economies where public investment increased beyond a threshold
level. A low level of public investment may not stimulate public capital accumulation
and, as a result, economic growth because such an investment can barely cover the
maintenance expenses of available public capital (Bayraktar, 2016). Bayraktar and
31
Moreno-Dodson (2015) noted that public spending could be a significant determinant of
growth only for productive purposes. According to Bayraktar and Moreno-Dodson, the
investment level may determine the impact on economic growth, and low investment
rates may lead to an insignificant effect on economic growth. The effective use of public
investment may also determine its efficiency within recipient countries.
The sectoral focus of public investment and political life cycles includes two
factors that condition the impact of public investment. According to Yilmaz (2018),
overinvesting in communication and transportation services, and underinvesting in
education, energy infrastructure, health security services, and city infrastructure, may not
positively impact economic growth. The frequency and effectiveness of public
investment can also depend on political cycles. Elections influence public investment and
the resultant economic growth. Gupta et al. (2016) observed that nominal public
investment increases at a higher rate at the beginning of electoral cycles and reduces
afterward. Gupta et al. also noted that the peak period of public investment growth is 28
months before elections, and a decrease of 0.7 percentage points occurs every month after
that. Factors such as misallocation of funds and changing political cycles may determine
the effectiveness and frequency of public investment.
Public investment plays an essential role in the growth and economic
development. Public investment may induce significant increases in revenue, private and
infrastructure capital, and investments (Ahmad, 2017; Dash, 2016). However, these
benefits are not universal, as some countries experience them significantly more often
than other countries (Makuyana & Odhiambo, 2016). The ability of public investment to
32
produce maximum benefits depends on several factors, including the volatility of the
investment (Bayraktar, 2016), quality of the investing or recipient institutions, investment
threshold, sectors in which the government invests (Bayraktar & Moreno-Dodson, 2015),
and the country’s political cycles (Gupta et al., 2016; Yilmaz, 2018). Public investment
may also influence the growth of FDI in host countries.
Foreign Direct Investment
FDI is an essential economic factor of the relationship between a country and the
rest of the world. FDI is a form of foreign investment that involves buying lasting assets
in another country (Malik, 2015). According to Babu et al. (2020), FDI is an investment
from investors who hold at least 10% of a foreign firm’s voting power. FDI may be in the
form of a new establishment in a target country or might involve acquiring shares,
expanding a firm’s operations in the target nation, being part of a joint venture and
merger, or completing the purchase of a foreign company (Onuoha et al., 2018).
According to Malik (2015), FDI may include other investment forms, such as setting up
production plants or buying buildings and machinery in another country. FDI may be
horizontal when investors embrace different industries and vertical when investors buy
shares in other domains within the same industry (Paul & Singh, 2017). FDI involves
purchasing foreign assets and is a long-term investment through which investors aim to
grow and increase capital and technology investments within host nations and to make a
profit (Bosanac & Požega, 2016). However, the effectiveness of the impact of FDI on the
host country is subject to debate.
33
Pros and Cons of Foreign Direct Investment
FDI is beneficial to both investors and recipient nations. For example, FDI is a
form of long-term investment by foreign investors in a host country that have a potential
benefit for both the originating and the receiving country (Bosanac & Požega, 2016).
Countries’ leaders strive to encourage investment to and from foreign nations because of
benefits such as improved economy and revenue and the accompanying development
(Shuaib et al., 2015). To a host country, FDI induces expertise and enhanced technology,
as the process allows a resource transfer from foreign investors, including the exchange
of new skills and technology (Malik, 2015). FDI also generates employment
opportunities in the receiving country, which leads to more human capital development
(Bosanac & Požega, 2016; Malik, 2015).
FDI may induce human capital development, expertise, and knowledge from new
foreign establishments in host countries (Onuoha et al., 2018). FDI supports financial
liberation and increases employment opportunities and human capital development
(Pettifor, 2019; Samwel, 2016). According to Samwel (2016), FDI can result in
technological advancement and increased productivity levels. FDI may also improve
knowledge management and human capital development, work efficiency, and
competence in host countries because it enables foreign investors to share resources with
host countries (Samwel, 2016).
FDI is essential in the economic connection and the promotion of international
trade between countries. FDI is a significant part of growth in international trade around
the world (Samwel, 2016). Such investment is also a way for investors to provide
34
incentives to reduce the disparity between revenues and costs, which researchers have
proven increase productivity through the provision of new facilities and equipment in a
target country (Babu et al., 2020). Such incentives result in economic improvements
(Pettifor, 2019). For instance, Thaker et al. (2017) acknowledged that FDI is a significant
and dominant factor in a country’s development and economic diversification and
observed positive effects on real GDP, nominal exchange rate, current account balance,
and industrial production index.
FDI may also have adverse effects on the economy and political structure of host
countries. According to Maleki (2016), FDI may harm domestic investment, change a
target country’s political structure, and induce economic colonization and expropriation
(Maleki, 2016). Moreover, FDI may lead to debt accumulation and deepen the budget
deficit, contrary to Keynes’s perspectives (Wangui, 2019). In Africa, the number of
countries with a debt ratio of more than 75% increased twofold between 2011 and 2017,
and FDI was among the causes (United Nations Economic Commission for Africa, 2019).
In a comparison of situations in Kenya and Singapore, Wangui (2019) revealed that the
impact of the public debt is more effective in Southeast Asia tan in the African countries.
Therefore, despite the positive effects of FDI on host countries, public authorities should
also care about the types of transactions to avoid adverse effects.
Researchers use two strategies to monitor public debts that may result from FDI.
First, a country’s fiscal sustainability prospects depend mainly on the structure and
composition of domestic and external debt (United Nations Conference on Trade and
Development, 2016). Second, in most sub-Saharan African countries, outsized public
35
debts increase because of factors such as regulatory laxity, weak fiscal discipline, absence
of clear policy direction, poor resource allocation, and fiscal slippage (World Bank,
2018). In support of these caveats, Dao and Bui (2016) contended that borrowing is not a
problem; instead, spending borrowed funds on recurrent expenditures is the problem
(Akinola, 2017). Bangladesh had large negative balances from 1981 to 2017, yet it
witnessed a positive economic growth, similar to the case of Vietnam, because of the
appropriate allocation of the money borrowed (Ferrero, 2015). Despite the substantial
debt relief to the heavily indebted poor countries, some countries still accumulate debts at
alarming rates (Chauhan & Kumar, 2017). Monitoring public debts that may result from
FDI is essential to avoid the host economy’s adverse effects.
Factors Attracting Foreign Direct Investment
The inflow of FDI in an economy depends on both economic and political factors.
Corporate governance, political risk, trade openness, exchange rate, and size of the GDP
are factors that significantly determine the growth of FDI in a country (Njoroge, 2016).
Bosanac and Požega (2016) cited the reasons for investment and the types of companies
involved as essential determinants of the various forms of FDI a country receives.
Economic viability and political factors predict the growth of FDI in a country (Dao &
Bui, 2016). Foreign investors evaluate the recipient economy’s suitability against these
factors to ensure the host countries’ and investor parties’ interests are maximized and to
predict growth (Njoroge, 2016). The political stability and market size of a host country
may also predict the presence and growth of FDI (Bosanac & Požega, 2016).
36
Political Stability and Market Size
The political and economic stability of recipient countries may influence FDI in
target countries (Bosanac & Požega, 2016). A politically stable country is likely to
motivate investors from various countries to establish multinational organizations
(Shuaib et al., 2015). Investments from foreign investors benefit host countries in terms
of economic health, revenue source, and accompanied development (Shuaib et al., 2015).
Consequently, some public leaders enhance their political stability and economy to
encourage foreign nations (Shuaib et al., 2015). Durmaz (2017) found that, in Turkey,
improved democracy increased FDI flows, even though FDI inflows had spillover effects.
Malik (2015) also noted that a stable economy allows the establishment of new foreign
ventures, which provides an avenue to boost the economy and create employment.
Therefore, stable economic and political climates in host countries are two critical
determinants of FDI inflow in an economy.
Market size also plays an essential role in attracting FDI. Small market size can
make host countries less attractive for establishing new firms but does not affect existing
firms (Dreger et al., 2017). Analyzing the determinants of Chinese FDI activities in the
European Union, Dreger et al. (2017) found that market size and bilateral trade were the
main factors for Chinese investment in the European Union. Also, business-friendly
institutions do not foster FDI (Dreger et al., 2017). Moreover, Dreger et al. (2017)
advised that sectoral dispersion of Chinese FDI in the European Union did not change
much after the global financial crisis. Although small markets may deter new investors,
37
the above findings reveal that foreign investors may prioritize market size above
economic stability and landscape to determine recipient economies.
Foreign Investment Regulations
Foreign investment regulations are essential in the decision to invest abroad.
Comparing the situations of Ghana and China, Ayangbah and Sun (2017) found that
differences in regulations affected FDI. Ayangbah and Sun attributed the success of FDI
in China to policies that attracted foreign investment and approval of market-oriented
development growth. Ghanaian public leaders similarly tried to adopt progressive foreign
investment policies, but Ghana’s development declined as China developed. Comparing
the two countries’ laws, Ayangbah and Sun acknowledged that Ghana had more
bureaucratic business acquiring abilities than China.
Analyzing the options that led to sustainable investment in African countries,
Manfredi (2017) observed that investment favored countries with policies that would lead
to a mutual coexistence between the investor and the country of residence. Vietnamese
also promoted FDI by providing a favorable business environment for multinational
companies (Pettifor, 2019). Fair policy regulations with business-friendly environments
may determine the growth of FDI (Pettifor, 2019; Seid, 2018). Target policies to
explicitly attract investors may also positively impact FDI (Marka & Prakash, 2018; Wall
et al., 2017). Moreover, Wall et al. advised that factors such as the sovereign credit
rating, branding, and international financial reporting standards (IFRS) may also
determine FDI in emerging markets.
38
Sovereign Credit Rating, Branding, and IFRS
Sovereign credit ratings are essential determinants of FDI in emerging markets.
The use of the sovereign credit rating, branding, and IFRS to view economic situations,
include information about the risks that investors can bear in a host country (Mah, 2018).
In general, FDI flow from low-rated donor countries to high-rated recipient countries
(Lungu et al., 2017; Pettifor, 2019). Emerging market FDI investors invest more in high-
rating advanced countries, and only invest in low-rating emerging market countries when
the ratings of those countries improve (Cai et al., 2019).
Budget Deficit and Debt
Budget deficit and public debt are two factors that investors consider before
venturing into new establishments. According to Samwel (2016), a constant increase in
an economy’s fiscal deficits may dissuade private investors and induce massive
crowding-out of FDI. Public debts may attract FDI and harm FDI (Ncanywa & Masoga,
2018). Moreover, Ncanywa and Masoga (2018) observed that an increase in public debt
in a country led to a rise in FDI. Olaoye (2019) found that the debt overhang in Nigeria
did not affect private investment; investors thought it was safe to invest despite the debt
overhang. However, over time, public debts led to a depreciation of the currency value or
high exchange rates, which made it difficult for investors to recover their investments and
making an economy less competitive (Coccia, 2017; Ncanywa & Masoga, 2018; Olaoye,
2019). Foreign investors consider fiscal deficits and public debts to be determinants of
investment, as the two factors may motivate or discourage foreign investors.
39
Recommendations for Attracting Foreign Direct Investment
FDI is essential for economic growth. Appiah et al. (2019) noted that FDI
positively impacts economic growth when governments target sectors with connections
that are relevant to the national economy. Critical factors determine foreign investors’
decisions to invest overseas and induce the needs to adopt policies that attract public
foreign investors in a host country. According to Akinola (2017), regulations, policies,
and institutional factors are the most prominent factors.
Regulations and Policies. Economic regulations and policies are critical factors
for attracting FDI. Davaakhuu et al. (2015), for instance, found that implementing the
right policies can attract employment-intensive growth in the manufacturing and
agriculture sectors. However, to make policies responsive to foreign investors,
policymakers should consider traditional and institutional determinants of FDI (Njoroge,
2016). Furthermore, Topal and Gül (2016) suggested governments avoid regulatory
inconsistencies at all costs. Stable government policies, more civil freedom, and sustained
institutional politics are critical factors in foreign investors (Durmaz, 2017).
Institutional Factors. Institutional factors within host countries can facilitate FDI
in emerging markets. Cai et al. (2019) noted that to attract FDI from other emerging
markets, emerging market recipients need a more robust institutional environment, and
the institutional quality of developed market recipients matters less. Liberalization is an
essential factor, as seen in China’s case (Davaakhuu et al., 2015; Durmaz, 2017; Yao et
al., 2016). Liberalization was significant for cost adjustments and provided Chinese
multinational enterprises more information about the host countries (Yao et al., 2016).
40
Finally, Wall et al. (2017) recommended significant investment in renewable energy
technologies to reduce greenhouse gas emissions, mitigate climate change, and fuel
economic development. According to Yao et al. (2016), institutional factors such as the
quality of markets and investment in an economy’s relevant sectors are also crucial to
improving FDI.
In conclusion, FDI is an essential component of economic relationships between
countries. FDI has significant positive effects on both host countries and investors
(Appiah et al., 2019; Ferrero, 2015). However, foreign investors may also lead to adverse
effects, deepen the budget deficit, and contrast with Keynes’s perspectives (Muhammad
et al., 2016). Therefore, public leaders need to have a relevant national framework for
managing FDI.
Budget Deficits
The budget deficit is a relatively new economic concept. Before the 20th century,
economists and advisers of governments advocated for a balanced budget where
expenditures matched revenues (Mariana, 2016). The goal was a surplus rather than a
deficit. Keynes advocated for a budget deficit and allowed governments to spend more
than their anticipated revenues (Banday & Aneja, 2016). Few countries have a balanced
budget in the 21st century, and developing nations have larger deficits because of their
lack of a stable private sector (Arjomand et al., 2016; Muhammad et al., 2016). Although
the concept of a budget deficit is relatively new, the Keynesian revolution inspired many
public leaders to embrace the concept, notwithstanding gaps and instability in their
economy.
41
Determinants of Budget Deficits
There are different reasons for budget deficits. Budget deficits occur when
governments make budgets for spending more than their revenue or more than they make
(Sajjad et al., 2018; Yetunde & Olasunkanmi, 2016). A country’s GDP, exchange rate,
assets, and profits can predict its budget deficit. Other determinants of budget deficit
include personal stocks and price increase (Eze & Ogiji, 2016; Muhammad et al., 2016).
An increase in government spending and a reduction in collected taxes may also
influence a country’s budget deficit (Dillard, 2018). Several macroeconomic indicators
can make a government spend more than it makes. However, the extent to which these
indicators predict a country’s budget deficit appears to vary over time. While the
performance of some economic indicators predicts a budget deficit in the short term,
others are better predictors in the long term. Njoroge (2016), for instance, demonstrated
that an ongoing decrease in the national government deficit and an increase in the actual
exchange rates led to a decreased national government deficit in the long run. The long-
run analysis also indicated a price increase and national investment were determinants.
Alternatively, Muhammad et al. (2016) found that, in the short run, actual GDP, assets,
and profits were the main determinants of the budget deficit. A country’s deficiency in a
single economic indicator is insufficient to predict an increase or decrease in its budget
deficit. Instead, an increase or decrease in a country’s budget deficit results from a
complex interplay of macroeconomic indices (Muhammad et al., 2016; Njoroge, 2016).
Benefits of Budget Deficits. Although budget deficits have become a popular
concept, economists disagree on their benefits to several aspects of the economy. For
42
example, Akinola (2017), Biplob (2019), Dao and Bui (2016), Oprișan (2019), Sahin
(2019), and Van and Sudhipongpracha (2015) noted that a budget deficit does not
adversely affect a country’s economic growth, but rather, a budget deficit may cause
critical economic deregulations. Van and Sudhipongpracha, and Biplob observed that the
budget deficit furthered economic growth, especially in the long run. Dao and Bui
determined that negative balances did not affect economic growth because they were
associated with increased productive expenditures, which impacted the economy
positively. Budget deficits also increase the availability of loans and the money supply to
the populace, which in turn improves profits and prices (Sahin, 2019). For example,
despite having a huge budget deficit, Vietnam was able to grow its economy (Pettifor,
2019). Vietnam had a leading negative balance from 1989 to 2011 but managed to
enhance its economy during this period. Another example of the positive effect of a
budget deficit on economic growth is the case of Bangladesh. Bangladesh had large
negative balances from 1981 to 2017, yet it witnessed a positive economic growth similar
to Vietnam because of the appropriate allocation of the borrowed money (Ferrero, 2015).
Although several researchers agree that, despite having substantial negative balances,
some countries have experienced significant economic growth typically preceded by an
increase in productive expenditure (Akinola, 2017; Oprișan, 2019), others argue
otherwise.
Disadvantages of Budget Deficits. Budget deficits have evident problems in
economies. Although budget deficits can have some positive effects on an economy, the
negative side outweighs the positive side (Abubakar, 2016; Akinola, 2017; Mah, 2018).
43
Akinola (2017) noted that budget deficits crowd out private borrowing and interest rates.
For Abubakar (2016), budget deficits harm the economy because they result in inflation
and increased unemployment. To address vast negative balances, public leaders raise
taxes on goods and services; however, such a strategy may increase prices (Zengin et al.,
2018). Mah (2018) found that negative balances were inversely related to economic
development in South Africa. Gisore and Jepchumba (2017) and Kamiguchi and Tamai
(2019) observed that budget deficits negatively affected GDP in East African countries.
Budget deficit adversely affects inflation, interest rates, unemployment rates, and private
borrowing potential. Owing to the different positions noted above, the budget deficit may
harm an economy, especially if there are no other policies to master inflation.
The increase in public debt is another downside of the budget deficit. The budget
deficit is a negative balance of a budget. At the same time, debt (also referred to as public
debt) is the money that nations owe governmental and nongovernmental organizations,
other nations, and the private sector (Durmaz, 2017). Public debt and fiscal deficit have a
close relationship, in that the latter leads to the former (Muhammad et al., 2016). To
address the budget, governments borrow money from the private sector, other countries,
and international money-lending entities, such as the World Bank and the International
Monetary Fund, to fund projects (Akinola, 2017). As budget deficits increase, public debt
also increases. Oprișan (2019) explored the effects of budget deficits in European
countries such as Bulgaria, Romania, and Poland between 1990 and 2000 and found that,
during this period, the nations were struggling to balance their account books as fears of
public debt increased. During the 10-year period, public debt increased due to an increase
44
in the budget deficit each year. By 1998, Romania’s public debt had grown to almost
40% of the country’s GDP (Eze & Ogiji, 2016). As a result, Romania was blocked from
accessing external financial assistance from the international market, which nearly
doubled the country’s problems. Central and Eastern European nations such as Poland,
Bulgaria, Hungary, and the Czech Republic also suffered from the debt crisis (Oprișan,
2019). For instance, while Romania struggled with a debt of $240 million in 1990,
Hungary, Bulgaria, and the Czech Republic had debts of $21.3 billion, $10.9 billion, and
$4.4 billion, respectively (Oprișan, 2019). Poland’s public debt was much larger:
approximately $50 billion. The public debt posed a massive problem for these nations,
for their borrowing power had reduced as a result of debt sustainability (Akinola, 2017).
Findings from Woja’s (2017) study in Poland also affirmed that the budget deficit
adversely affected its public debt.
Economists have demonstrated that, like public debt, budget deficits can lead to
current account deficits. An existing account comprises net income such as dividends and
interest, foreign aid, and revenue from exports (Ferrero, 2015; Jafar et al., 2016;
Muhammad et al., 2016). An existing account reflects a nation’s foreign transactions
(Muhammad et al., 2016). Some studies show a bidirectional relationship between budget
deficit and current account deficit. Topalli and Dogan (2016) contended that budget
deficits caused current account deficits in some contexts, but existing accounts also
caused budget deficits in other contexts. Reed et al. (2019) determined that there was a
long-term relationship between budget deficits, current account, and public debt
sustainability in Iran. The inverse relationship between budget deficits and economic
45
growth appears evident from multiple studies, but it is also clear that the impact of budget
deficits on an economy differs from one sector to another (Abdullah et al., 2018).
Sectoral Differences in the Impact of Budget Deficits. Budget deficits help
certain sectors as land prices thrive, but impede the growth of other sectors, including
amenities, structural unemployment, income, and cost of housing. Wu et al. (2015), for
example, suggested that budget deficits at local government levels had a progressive
influence on the prices of land but an adverse influence on factors such as amenities,
income, and cost of constructing houses. Additionally, in their study to determine the
effects of the national budget deficit on the joblessness rate in Nigeria from 1986 to 2015,
Ayogueze and Anidiobu (2017) found that the national budget deficit had an influential
and nonefficient effect on the joblessness rate in Nigeria during the time of their review.
Fedeli et al.’s (2015) trend study of 1980 to 2009 also confirmed the negative correlation
between budget deficit and structural joblessness. The impact of budget deficits on an
economy varies by differences in sectoral characteristics and is more evident at
subnational levels.
Impact Pathways for Budget Deficits. One major pathway is that budget deficits
lead to an increase in money supply, which results in inflation. Zengin et al. (2018)
determined that a short-term, one-directional relationship exists between inflation and
money supply and a two-directional correlation exists between money supply and budget
deficits. Another impact pathway that economists propose is that a budget deficit leads to
an increase in taxes, and a consequent increase in market prices, and to inflation. A
negative balance forces the government to increase taxes on goods and services to
46
generate revenue, which results in rising prices (Zengin et al., 2018). A third pathway that
researchers highlight is that when money becomes easily accessible, its value will drop,
and people will have to pay more for fewer goods (Ayogueze & Anidiobu, 2017). Lastly,
budget deficits result in amplified long-term interest rates (Akinola, 2017). In one study,
attempts to increase budget deficits resulted in increased interest rates in the short term,
with a significant effect on the economy (Palley, 2015). Akinola (2017) observed that
increased interest rates led to increased future budget deficits, lowered domestic
investment, and reduced future output levels because they minimized the private sector’s
need for capital in the form of loans. A few things are evident from the various pathways
that economists propose: the pathways through which a budget deficit affects a nation’s
economy are multidirectional, are interconnected, and involve indices such as money
supply, interest rates, market prices, and inflation. These indices reduce the need for
commercial and retail borrowing.
Strategies for Managing and Maximizing Budget Deficits
Even with contrary views on the influence of budget deficits on an economy,
research has shown that, with effective investment, debts cannot hurt the economy
(Akinola, 2017; Chukwuani & Osita, 2018). The budget deficit is a problem of public
budget management. Vovchenko et al. (2015) recommended creating effective and
sustainable budget management systems to address a budget deficit. A sustainable budget
system may mean applying algorithms that ensure the sustainability of the budget system
based on macroeconomic indicators, necessary conditions of the internal debt-paying
capability of the country, an aggregated index of fiscal stress, and an aggregated indicator
47
of the openness of the country’s budget (Vovchenko et al., 2015). An effective and
sustainable budget management system, when implemented correctly, can play a
significant role in improving income generation and reducing a budget deficit
(Vovchenko et al., 2015). In the case of Russia, Vovchenko et al. suggested that
implementing a sustainable budget system could result in several key benefits, including
the gradual reduction of oil and gas deficits on the federal budget. A working
management system could also help the country preserve the volume of Russia’s national
debt on a safe level and regularize the analysis and formation of budget parameters based
on current expenditure obligations. Sustainable budget management systems can address
budget deficits with internal regulations to maintain sustainable debt levels, increase
income generation, and reduce budget deficits. Public investment can also address budget
deficits.
Public Investment. Public investment is a fundamental component of the budget
deficit. Public leaders can regulate their public investment to minimize consequent
deficits and inflation (Trang et al., 2017). For example, in 2019, Kenyan public leaders
decided to decrease its budget deficit to 3.8% of the GDP by the end of the 2023 fiscal
year. To accomplish this, Kenyan authorities added approximately $4.51 billion into the
economy to boost security, food, housing, and manufacturing (Dessus et al., 2016). After
an economic crisis, France’s government decided to restore its public funds through
national sovereignty and justice for future generations (Chakraborty, 2016). The steps
taken to make this growth possible included increasing labor in the economy and
pioneering business productivity and competition (Keho, 2016a). In France, public
48
leaders cut spending by focusing on the competitive sectors of the economy, such as
labor improvement (Keho, 2016b). The country’s government believes that when labor
increases in an economy, revenues increase and working ranks will increase (Boeri,
2019).
Revenue Expenditure Tracking and Regulations. Tracking and regulating
public expenditure is an efficient approach to anticipate the budget deficit. Okafor et al.
(2017) recommended that public leaders master the trend of the public revenue
expenditures and microeconomic strategies because revenue expenditures and
nonrefundable personal returns affect the efficacy of a deficit economy. Revenue
expenditures may trigger a country’s tax to contribute extensively to decreasing the
budget deficit (Okafor et al., 2017).
Regulating public expenditures is the focus of some public leaders. On how
revenue expenditures may be regulated, Pettifor (2019) suggested that economies that
have spare capacity and idle resources can increase expenditure to generate income,
which would reduce the budget deficit. However, an increase in expenditure in weak
economies should also be aimed solely at increasing income (Eze & Ogiji, 2016). When
implemented in a deficit economy, revenue expenditures should yield enough money to
cover the deficits (Keho, 2016a). Finally, revenue expenditure should target the
productive sectors of the economy because it will likely result in economic stability (Eze
& Ogiji, 2016). Revenue expenditure tracking is a microeconomic strategy that can
generate income, which public leaders can use to cover deficits in a deficit economy.
When combined with sound policies, this strategy can be effectively used in productive
49
sectors to promote economic stability. Deficit financing is another strategy that
governments can deploy to improve economic stability.
Deficit Financing. Financing the deficit is an important decision in the process of
managing the public budget. Eze and Ogiji (2016) identified external source of deficit
financing, nonbanking public source of deficit financing, and exchange rate as metrics
with significant and positive implications on economic stability, as indicated by GDP.
Metrics with negative impacts include ways and means, source of deficit financing,
banking system source of deficit financing, and interest rate. The private sector,
especially banks and private individuals, are the major investors or buyers of the bonds
(Keho, 2016b). The private sector, such as banks, can buy short-term gilts from the
government because they often consider gilts as ready money that can help them maintain
their lending to customers (Keho, 2016b). Deficit financing metrics can significantly
influence economic stability; public leaders may finance deficits with bonds and short-
term gilts, which private sector investors purchase, thus making loans available. Debt
servicing can also mitigate budget deficit effects on an economy.
Foreign Direct Investment. FDI is a resilient source of external finance to
economic and financial shocks (UNCTAD, 2018). FDI represents more than a source of
funds, as it is also a package of tangible and intangible assets public leaders in developing
countries may apply to build capacity (UNCTAD, 2018). Mah (2018) suggested that
countries with budget deficits should promote FDI by creating an enabling environment
for foreign businesses to invest and local businesses to export and invest in foreign
countries. China has a high FDI (Muhammad et al., 2016) and provides multinational
50
companies such as Apple Inc. with cheaper labor compared with the United States. In
return, it earns revenue in the form of taxes from the sales of Apple products on the
international market (Ferrero, 2015). Taiwan and Bangladesh also benefit from FDI to
balance their current account. FDI can finance economies with budget deficits and can be
an efficient source of finance for economies in crisis.
Spending Cuts and Strict Fiscal Rules. Managing or maximizing budget deficits
can also directly curb money supply and corresponding expenditure in the general
population (Akinola, 2017). The approach to addressing budget deficit in South Africa
was to cut spending by $10.3 billion in 3 years and increase GDP from 0.9% to 1.2%,
even though debts and tax collection increased (Chakraborty, 2017). The central bank can
reduce the printing of money (Njoroge, 2016) and discourages commercial banks from
giving loans to people to reduce the money in supply (Ibadula et al., 2017). Finally,
budget deficits will likely advance an economy if a public leader invest the money it
borrows in development projects, such as building roads or generating electricity to run
manufacturing industries (Akinola, 2017). Public leaders can close their deficit gap by
reducing money supply and cutting down on government spending. A strategy for
lowering the money supply includes reducing cash and loan availability. However, public
leaders may maximize the benefits of budget deficits to stimulate economic growth if
borrowed funds or revenue obtained are deployed to development projects.
Monetary Policies. Countries may employ monetary policies to improve their
currency (Dow et al., 2018). African countries, such as Zimbabwe in the 2000s, and
developed countries, such as Germany in the 1920s, increased their money supply to pay
51
their debt (Kaplan & Thomsson, 2017). Despite being a developed country, Germany was
living beyond its means until 2009, when it enforced strict fiscal rules in its constitution.
It required the national government to operate on a structural deficit of not more than
0.35% by 2016; by 2020, it operated on no structural deficit (Arjomand et al., 2016).
Public investments can yield a lot of revenue, especially when a budget deficit is under
control (Boeri, 2019).
Additionally, value-added tax impact may impact positively the GDP. In countries
such as Sri Lanka, public leaders used value-added tax to improve the GDP and reduce
the budget deficit (Muhammad et al., 2016). However, with this strategy, the
reinforcement of strict measures such as cost control and financial consolidation to
guarantee effective enhancement of growth of the nation’s economy is also
recommended. Monetary policies such as an increase in money supply, fiscal regulations,
and value-added taxes can aid debt repayment, which consequently improves GDP and
budget deficits. These strategies can influence budget deficit efficiency and mitigate their
negative impact.
Summarily, public leaders may can use budget deficits to encourage economic
growth (Akinola, 2017). Some strategies discussed in this regard include the productive
investment of funds into development projects, human capital, and labor to increase
revenue to tackle budget deficits (Boeri, 2019; Chakraborty, 2016; Dessus et al., 2016;
Keho, 2016a). Additionally, public leaders should consider implementing budget
management systems to monitor budgets and debts and address debt sustainability
(Vovchenko et al., 2015). Governments can also regulate public investments and focus
52
expenditures on productive sectors of the economy to minimize budget deficits and
reduce inflation caused by deficit spending (Trang et al., 2017). Public leaders may also
use this strategy to generate income to reduce the deficit and ensure economic stability
(Eze & Ogiji, 2016; Keho, 2016b). Selling government bonds, increasing the value of
export products, increasing exports, and restricting imports are other strategies to finance
a budget deficit. Leaders may use FDI to finance economies with a budget deficit, which
indicates that a relationship might exist between FDI and budget deficit (Arjomand et al.,
2016; Kaplan & Thomsson, 2017; UNCTAD, 2018).
Relationships Between the Variables of the Study. Public investment and FDI
appear to reinforce each other. Public investment improves the attractiveness of a country
to foreign investors (Zergawu et al., 2018), and FDI improves the efficiency of
government spending in terms of both quality and quantity (Zhang et al., 2019). Findings
from earlier studies show that both public investments and FDI can improve GDP and
lead to economic growth, even though the noninfrastructure component of public
investment had a more significant and favorable influence on GDP than the infrastructure
component did (Ajudua & Davis, 2015; Mallick, 2019). Public investment and FDI are
complementary measures of economic stimulation and development, and they influence
government expenditure and GDP, with a consequent effect on economic growth. FDI
may be a response to budget deficits.
In terms of the relationship between FDI and budget deficit, the literature
indicates that a budget deficit can facilitate or impede FDI. Although some foreign
investors find countries with huge budget deficits attractive, others do not (Ncanywa &
53
Masoga, 2018; Samwel, 2016). FDI also relates to the budget deficit because FDI helps
improves savings in the receiving country, which can serve to finance its budget deficit.
Abu and Karim (2016) examined the relationship between FDI and domestic savings,
domestic investment, and economic growth in 16 sub-Saharan Africa countries using data
from 1981 to 2011, and they found unidirectional causality between FDI and domestic
savings. Muzurura (2016) conducted a study on developing countries and found that FDI
augmented domestic savings. Budget deficits in host economies may attract FDI, which
improves savings in the host country to finance budget deficits; budget deficits may also
deter foreign investors.
Public Investment and Budget Deficits. The relationship between public
investment and the budget deficit is not straightforward. Yovo (2017) noted that public
investment can positively affect and negatively affect a budget deficit. During the phase
of investment, public investment may aggravate the budget deficit. And after the
investments relate to a productive sector, they may generate revenues in the years
following the investment to reduce the extent of the budget deficit (Yovo, 2017). The
activities deplete the revenue and compel them to opt for a deficit budget and acquire
more debt to finance their budget (Gisore & Jepchumba, 2017).
A budget deficit may stimulate public investment. Budget deficits and resulting
debts can facilitate public investment by serving as a source of income for capital
development (Ncanywa & Masoga, 2018). Sánchez-Juárez and García-Almada (2016)
concluded that public debt positively correlates with public investment, and this, in turn,
stimulates economic growth because public leaders acquire loans to finance multiple
54
public investment activities. Pellens et al. (2018) also found that budget surpluses and
deficits significantly influenced public spending on research and development (R&D). In
Pellens et al.’s study, there was a robust pro-cyclical effect on public R&D investments,
although a country’s heterogeneity had an influence (Pellens et al., 2018). One factor that
influences the extent to which budget deficit affects public investment is debt level. In
studying how the budget deficit affects public investment in Senegal, Ndour (2017)
observed that the effect varies according to the debt level. When public debt is greater
than the threshold of 80% of GDP, an increase in deficit reduces public investment
(Ndour, 2017). The public debt to GDP ratio increases over time (Kamiguchi & Tamai,
2019).
Finally, public investment is among the many strategies’ economists recommend
for managing and maximizing budget deficits (Ndour, 2017). Once monitored and
regulated effectively, and used for capital and tax-generating activities, public investment
can become a viable source for financing budget deficits and reducing debts. Budget
deficits can result from an increase in government spending on development projects
(Abu & Karim, 2016), and budget deficits in the economy can spur an increase in public
investment for income generation. Thus, an increase in public debts may be associated
with public investment and indicative of a government’s economic stimulation efforts.
Transition
In Section 1 of the present study, I developed the foundation of the study. The
foundation of the study included the background of the problem, problem statement,
purpose statement, research questions, and hypothesis. Also, Section 1 consisted of the
55
significance of the study, the nature of the study, theoretical framework, operational
definitions, and assumptions, limitations and delimitations of the study. I ended the
foundation of the study by a critical analysis of the professional literature on the topic of
the study.
In Section 2, I outlined my role as the researcher, the research method and design,
and participant sampling methods. Section 2 also included discussions on ethical
research; data collection instruments, techniques, and analysis; and the validity of the
research instruments that I will employ. I applied the components discussed in Section 2
to report the findings and future action recommendations in Section 3.
56
Section 2: The Project
Section 2 of this study includes the problem statement, the description of the
critical components and instruments of the process of the research, and the quality of the
final output. I introduce the role of the researcher, the participants of the study, the
research method, and the research design. Moreover, the section includes the population
sampling, data collection instruments, technique of collection, and data organization and
analysis. The section also includes ethical considerations and analysis of the validity and
reliability of the study.
Purpose Statement
The purpose of this quantitative correctional study was to examine the
relationship between public investment spending, FDI, and budget deficit. The
independent variables were public investment and FDI. The dependent variable was the
budget deficit. The target population comprised leaders of the public agencies who held a
position of decision making in the process of the management of the public budget in the
LIC and LMIC. In terms of social change, the leaders of the public agencies may gain a
better understanding of the relationship between the three variables of the present study.
Leaders may use the results of this study to adopt a strategy to allocate public money to
public investment efficiently and to promote the inflows of FDI in projects that may
generate a positive impact on the communities.
Role of the Researcher
The role of the researcher in a quantitative study is to identify the participants and
the sources of data, collect and analyze the data, and present findings (Kyvik, 2013).
57
Saunders et al. (2015) acknowledged that quantitative researchers should use empirical
data to test theoretically derived research hypotheses. I used my understanding of the
latest development of the quantitative research method to address the specific business
problem of the present study.
In the Belmont Report, the U.S. Department of Health & Human Services (1979)
pointed out three key ethical principles that researchers must observe in their
relationships with the participants during the process of a study: (a) respect for persons,
(b) beneficence, and (c) justice. Researchers observe the principle of respect for persons
when they recognize the importance of freedom of choice (Saunders et al., 2015).
Beneficence involves the actions researchers take to ensure the well-being of participants
(Patton, 2015). Justice refers to the belief that researchers should fairly consider the risks
and benefits of the study and anticipate the eventual externalities (Bromley et al., 2015).
Although there were no participants in the present study to consider the principle of
respect for persons and beneficence, I observed the principle of justice by assessing and
focusing on the benefits of the present study, especially in terms of social change.
According to Greaney et al. (2012), there is no need for informed consent to take
place in collecting secondary data when the sources are official and accessible to the
public. The source of data for this study met Greaney et al.’s definition, so my study did
not require any consent process. However, the use of secondary sources also requires a
minimum of precaution to avoid biases. I conducted the process of collection and analysis
of the data with rigor and attention to avoid eventual biases.
58
I have over 15 years of professional experience in the field of finance at different
public positions of public finance management. I have been a senior minister of finance
and have served as a country governor for international financial organizations such as
the World Bank, International Monetary Fund (IMF), and the West African Development
Bank. In those positions, I have developed, implemented, and overseen many public
policies of public finance management, and specifically policies that related to the three
variables of the present study. Therefore, my background has a relevant link to the
present research. Guo (2015) recommended that quantitative researchers create an
opportunity for interaction with the participants and to be professional and objective in
the collection of the data. Although there were no participants in the present study, I
observed the principle of objectivity and avoided influencing the analysis by my
professional experiences.
Participants
The most critical requirement when selecting research participants is to ensure
alignment with the research question (Saunders et al., 2015). Researchers must establish
selection criteria that have a relevant link with the topic and the research question
(Watson, 2015). Furthermore, Denzin and Lincoln (2015) recommended establishing a
respectful relationship with the participants and being fair and honest with them. There
were no participants in the study because the data needed came from official and publicly
accessible secondary sources. Watson (2015) recommended researchers use secondary
data to observe rigor and objectivity to avoid manipulating of information. I collected
secondary data from the website of the World Bank. To ensure the robustness of the
59
findings, I collected data from the 2019 annual report of the World Bank, which is the
most recent publication available and likely gave the most relevant information about the
variables.
Research Method and Design
Research Method
The first research approach I explored for this study was the quantitative method.
The quantitative research method allows researchers to use measurable variables from
consistent processes and procedures test hypotheses and address research questions
(Saunders et al., 2015). Researchers employ the quantitative research method to examine
relationships between variables in the form of correlation or comparison (Frels &
Onwuegbuzie, 2013). In the quantitative method, researchers use numerical data
representing independent and dependent variables to respond to research questions and
hypotheses to address a business problem (Yilmaz, 2018). Researchers use correlation
analysis to examine the relationship between independent and dependent variables (Faul
et al., 2009). My aim in this study was to examine the relationship between public
investment, FDI, and budget deficit, so the quantitative method with a correlation
analysis was the most appropriate.
Researchers use the qualitative method to answer how and why questions by
using narrative input as the primary data collection source and principles of deductive
reasoning (Yin, 2018). Moreover, quantitative studies imply some essential aspects such
as participant observation, field study, and discovering and mapping multiple
60
perspectives to gain a better understanding of a phenomenon (Gay et al., 2009), which
did not apply to the present study. Therefore, the qualitative method was not appropriate.
The mixed method is a combination of qualitative and quantitative methods
(Fisher & Bloomfield, 2019). Researchers use the mixed method when neither the
quantitative nor qualitative approaches can address the research questions individually
(Faul et al., 2009). The quantitative method was sufficient to address my research
questions and hypotheses without the support of a second research method (see Saunders
et al., 2015). Because there was no need for a combination with a second research
method, the mixed method approach was not appropriate.
Research Design
The three research design choices for a quantitative study are (a) experimental
design, (b) quasi-experimental design, (c) and correlational or nonexperimental design
(Zellmer-Bruhn et al., 2016). Researchers use an experimental design to explore the
cause-and-effect relationship between variables (Watson, 2015). An experimental design
includes a control group and an experimental group (Saunders et al., 2015). A researcher
assigns subjects randomly to either group (Watson, 2015). Researchers using the
experimental design can manipulate a specific independent variable to determine what
effect the manipulation would have on dependent variables (Klenke, 2016). There were
not control and experimental groups for the present study. Moreover, I did not need to
manipulate data. Therefore, the experimental design was not appropriate.
Researchers use quasi-experimental design when they seek to make inferences
about the cause-and-effect relationships between independent and dependent variables
61
(Watson, 2015). There are some similarities between quasi-experimental studies and
experimental research studies; for example, both involve some controls over extraneous
variables when full experimental control is not practical (Leedy & Ormrod, 2013). I did
not seek to make inferences about the cause-and-effect relationship between independent
and dependent variables in the present study. Therefore, experimental, and quasi-
experimental designs were not appropriate for this study.
Researchers use a correlational design for efficient examination of relationships
between variables using numeric data (Watson, 2015) to address stated research questions
and hypotheses (Faul et al., 2009). In a correlational design, the researcher determines
how a change in one variable correlates with another variable (Watson, 2015). Still,
correlation does not allow researchers to establish a cause-and-effect relationship, with
the possibility of manipulation of variables and the use of random sampling (Saunders et
al., 2015). In this study, I sought to examine the relationship between independent and
dependent variables. Therefore, the correlational design was the most appropriate design
to address the research question of this study.
Population and Sampling
The population of a study is a group of individuals sharing the same
characteristics (Yin, 2018). The target population of this study included the LIC and
LMIC. The LIC have a per capita GNI of less than $1,036, and the LMIC have a per
capita GNI between $1,036 and $4,035 (World Bank, 2019). The 2019 annual report of
the World Bank, which is latest report available that provides information on per capita
GNI, revealed a total of 26 LIC and 50 LMIC (see Appendix A). The population of the
62
study comprised the LIC and the LMIC as noted in the 2019 annual report of the World
Bank.
The impossibility of contacting every person in a large population causes
researchers to use sampling methods (Yin, 2018). A sample refers to the selected
elements from a population for a study (Saunders et al., 2015). Researchers use samples
when the size of a population is so large that interacting with everyone is not possible
(Watson, 2015). Because sampling consists of choosing only a few individuals for a
study that will be generalized to the whole population, researchers must use the
appropriate sampling approach to avoid possible biases that may affect the quality of the
findings (Aggarwal & Ranganathan, 2017). Palinkas et al. (2015) advised using the
approach to sampling that most closely matches the objective of the study and the nature
of the study.
There are several different approaches to sampling. The most common approach
is random sampling, in which researchers select individuals from a population at random
which gives the same probability for everyone to be part of a sample (Tyrer & Heyman,
2016). Researchers use stratified sampling to ensure equal representation of the
population in the sample when they can identify and divide the sample into strata (Yin,
2018). Cluster sampling is appropriate when there are different identifiable groups in a
population that is large (Tyrer & Heyman, 2016). Finally, researchers may choose
purposeful sampling and snowball sampling when probability sampling (i.e., random,
stratified, and clustered samplings) is not applicable (Saunders et al., 2015). Seventy six
cases formed the population of the present study and I considered the entire population
63
for the study. As the sample and the population were the same, I did not need to refer to a
particular sampling approach; however, a G*Power analysis was necessary. According to
Green and Salkind (2017), researchers use G*Power analysis to determine the appropriate
sample size for a multiple linear regression. I ran a G*Power analysis to determine the
appropriate sample size for this study. I used two independent predictor variables and a
priori power analysis, assuming a moderate effect size (f = .15) and alpha = .05, with a
minimum power of .80 and a maximum power of .99. The resulting minimum sample
size was 68 cases to achieve a power of .80, and the maximum sample size to achieve a
power of .99 was 146 cases (see Appendices B and C). Therefore, 76 LIC and LMIC was
an appropriate sample size for the study. When the population and the sample are the
same, there is no risk of bias that can result from the sampling method (Calmettes et al.,
2012).
The data were from secondary official sources. For each country in the study, I
collected data from the 2019 annual report of the World Bank, which was the latest
publication available and was likely to give the most relevant information about the
variables. According to the standards of the national accounts set up by the World Bank
and IMF, the data for each variable were in relative terms that represented a percentage of
GDP. Saunders et al. (2015) recommended using bootstrapping when there is a violation
of a statistical assumption that can result from the sampling method of the data collection
approach. As there was no need for a sampling method in the present study and the data
were from credible official sources, I did not need to use bootstrapping to resample data
when testing the research hypothesis.
64
Ethical Research
According to Saunders et al. (2015), ethical considerations of a study include the
protection of sensitive data, respect for the study population, and approval to protect the
participant. The present study did not require human involvement and sensitive or
confidential data. I collected data from secondary official sources, which, according to
Connelly (2014), do not require the consent of a stakeholder. I complied with the
guidelines of Walden University and use necessary ethical considerations in the conduct
of the study and the confirmation process. I pursued the approval of the Institutional
Review Board and follow the orientations to enhance scholar compliance and adherence
to the institution’s rubric requirements.
Other ethical considerations in a study include the storage of data on an external
hard drive for secure storage (Connelly, 2014). Yin (2018) recommended securing data
against unauthorized access to preserve participants. Although I did not have participants
to protect in this study, I saved all the data in secured devices and secure and follow the
same process as if there were participants in the study. Khan (2014) recommended saving
and protecting files on hard drive with a password for five years after the study’s
completion. I saved and protected files on the hard drive with a password until the
deletion occurs 5 years after the study’s completion.
Data Collection Instruments
For this study, I did collect secondary data from the website of the World Bank.
Only financial performance instruments were appropriate for the present study. Public
investment, FDI, and budget deficit are three essential components of a country’s
65
economic and financial performance (Cingolani, 2019). The management of public
finance is subject to a set of indicators that serve as a guide to appreciate the wealth of an
economy and to judge the quality of the political option of each government. Beyond the
economic perception that seems to be the general trend when talking about those three
components, the performance indicators resulting from each one of those variables are
also important for management decisions (Makuyana & Odhiambo, 2016).
According to Lerner (2013), the ratios of the public investment, FDI, and budget
deficit are three critical indicators of the performance of an economy and traduce the
perspective of the public finance management. The ratios are in terms of the percentage
of the gross domestic product (GDP; Hayo & Neumeier, 2016). The ratio of the public
investment (PI) is equal to 100* annual amount of public investment/annual amount of
GDP. The ratio of FDI is equal to 100* total yearly amount of FDI/total annual amount of
GDP. The ratio of budget deficit (BD) is equal to 100* (total annual revenues-total
annual public spending)/total annual amount of GDP. The data were already available as
ratios in the sources from which I collected them. Therefore, there were not a need for
further calculations and data collection instruments.
Data Collection Technique
The data for public investment, FDI, and budget deficit was computed and
reported on an annual basis in the websites of the World Bank for each of the 76 cases,
forming the population and the sample of the study. As a result, there was no need to use
data collection approaches, such as a survey or observation. The performance of a pilot
study was not required for the present research study because the data were from the
66
international and regional organizations that have a reliable system of data production to
generate trustworthy information widely accessible to the public.
After completing the data retrieval for the study, the saving of the information
retrieved on an external drive was the first safety precaution. The storage of the data for
five years after completion of the study is another safety measure (Shaw, 2017).
Organizing the data required constant storage of all rough drafts and other useful
material. I saved the data on an external drive for five years after the study completion.
Data Analysis
The research question of this study was as follows: What is the relationship
between public investment spending, FDI, and budget deficit?
H0: There is no statistically significant relationship between public investment
spending, FDI, and the budget deficit?
H1: There is a statistically significant relationship between public investment
spending, FDI, and budget deficit?
The examination of such a correlational relationship implied the use of IBM SPSS
version 27.0 for Windows. This software offers the appropriate statistical package and
table results complying with the APA format, provides Pearson’s correlation coefficient
analysis, multiple regression analysis, and descriptive statistics to describe the general
distribution by frequency and percentage (Green & Salkind, 2017). According to
Brezavscek et al. (2014), SPSS is the most effective software to analyze large data sets
that predict a linear relationship between two or multiple independent variables and
dependent variables. SPSS offers the advantage of using descriptive statistics to identify
67
central tendency measures, such as minimum, mean, maximum, and standard deviation
(Green & Salkind, 2017). Those measures of tendency are essential for the analysis
during the statistical test. The three variables were in the form of ratios.
The variables in the present study included the two independent variables (public
investment and FDI), and the dependent variable (budget deficit). Green and Salkind
(2017) recommended the use of linear regression for studies in which there are more than
two quantitative variables and the in which there is a clear distinction between the
independent and dependent variables, but there are different forms of regression.
Researchers use hierarchical multiple regression analysis when they have control of the
variables (Watson, 2015). When the aim of a study is to identify the independent variable
with the strongest relationship with the dependent variable, stepwise multiple regression
analysis is the most appropriate (Elzamly & Hussin, 2014). Green and Salkind (2017)
recommended the bivariate multiple regression analysis to researchers who aim to predict
the effect of one variable versus multiple variables. Multiple linear regression analysis is
the statistical technique to evaluate the relationship between multiple independent
variables and the dependent variable to explain variances among independent variables
and their relationship to a dependent variable, and to evaluate explanatory variables when
used to predict the outcome of a response variable (Chen et al., 2014). When the aim of a
study is to identify the independent variable that has the strongest relationship with the
dependent variable, stepwise multiple regression analysis is the most appropriate
statistical technique. My aim in this study was to evaluate the extent to which public
68
investment and FDI predict budget deficit. Therefore, hierarchical, stepwise, and
bivariate multiple regression analysis were not appropriate for this study.
Multiple linear regression analysis will imply the validation of five critical
assumptions, which are multi-collinearity, normality of errors, homoscedasticity,
linearity, and independence of error (Guo & Fraser, 2014). If there is a violation of the
assumptions the tests can lead to erroneous findings: Type 1 errors and type 2 errors
(Green & Salkind, 2017). It is essential to carefully assess each of the assumptions and
analyze the data and the results of the test. I used SPSS to test those five assumptions
associated with multiple regression analysis. There was any serious violation of
assumption. Therefore, I did not need to proceed with an alternative that negates
violations of the multiple linear regression. According to Chen et al. (2014), the activities
to perform if there is a violation in case of violations of assumptions are (a) using a
different linear model, (b) performing transformations to correct non-normality, (c) non-
linearity, and multi-collinearity, (e) removing outliers, and (f) using weighted linear
regression model. Saunders et al. (2015) recommended bootstrapping in case of violation
of the assumption of data violation.
Multicollinearity occurs when there is a correlation between two or more
independent variables (Saunders et al., 2015). The assumption of multiple regression is
that there is no collinearity among independent variables (Zainodin & Yap, 2013). There
is multicollinearity if a correlation coefficient is ≥ .01, and a tolerance close to 0 means
there is multiple collinearities (Green & Salkind, 2017). In this study, I used a cutoff of 0
69
and assume that there is no multicollinearity among the independent variables if the
tolerance is >.1
An assumption of normality of errors occurs when there is a normal distribution
of the variables of the sample of the population (Green & Salkind, 2017), and a violation
of normality may induce biases in the inferential statements from the researcher (Imai et
al., 2013). In this study, I assessed normality by plotting data in SPSS. In a normal
distribution, data are close to the diagonal line. However, if data is far to the diagonal line
in no-linear positions there is not a normal distribution. Bootstrapping technique is a
means to address the violation of the assumption of normality (Saunders et al., 2015).
Homoscedasticity is the assumption when the variance of error terms is similar
across the independent variables (Saunders et al., 2015). Homoscedasticity refers to the
situations in which all the values of the predictor variable have the same variance around
the regression line (McCusker & Gunayadin, 2015). Violation of homoscedasticity occurs
if there are growing dispersions of the residuals with larger or lower values of outliers,
the use of an enhanced data collection technique, and the omission of a variable from
dataset care factors (Green & Salkind, 2017). Standard errors and wrong inference can
result from a violation of homoscedasticity (Saunders et al., 2015). I used a scatter plot
chart in SPSS to assess homoscedasticity visually. I considered the scores above the
regression line as a normal distribution.
Linearity is the assumption of expectation that the value of the dependent variable
will be a linear function of each independent variable, when the other variables remain
the same (Green & Salkind, 2017). When using the linearity, researchers assume that the
70
relationship between the research variables is linear (Harrell, 2015). There is a linear
relationship when a change of the standard deviation in any of the parameter values
induces the same change to the dependent variable (Green & Salkind, 2017). To assess
the assumption of linearity, I used SPSS to calculate the changes in the standard deviation
and the dependent variable.
Independence of errors refers to a situation in which the distribution of errors is
random without influence from errors in existing observation (Harrell, 2015).
Independence of errors is the assumption that researchers check the probability that a
standalone variable may have in other variable in the case of error (Watson, 2015). I used
SPSS calculation to test the independence of errors if necessary. The data for the present
study were certified data from credible international organizations; therefore, the
likelihood of the occurrence of error is low and I will not be necessary to proceed with
the test of the assumption of independence of errors.
Data cleaning is essential to achieve the quality of a study (Saunders et al., 2015).
Data cleansing or data cleaning is the process of detecting and correcting (or removing)
corrupt or inaccurate records from a record set, table, or database and refers to identifying
incomplete, incorrect, inaccurate, or irrelevant parts of the data and then replacing,
modifying, or deleting the dirty or coarse data (Cai & Zhu, 2015). The data for this study
were from credible secondary sources. I did not need to proceed a data cleaning as if it
was data collected from a survey.
71
Study Validity
Reliability and validity are the two crucial components of quality research
(Saunders et al., 2015). Reliability refers to the necessity to produce consistent results
with a tool or an assessment instrument and validity refers to the degree of accuracy of an
instrument of measure (Kelly et al., 2016). Validity and reliability are the two criteria that
quantitative researchers establish to ensure rigor and trustworthiness of the findings
(Claydon, 2015). Heale and Twycross (2015) noted that although research findings are
significant, it is critical not to ignore rigor of the research. Heale and Twycross (2015)
recommended quantitative researcher to use homogeneity, convergence, and evidence of
science the types of evidence to measure the validity and reliability of quantitative
findings.
Since the present study was quantitative, only the criteria of validity will be
applied. Validity includes internal validity and external validity (Claydon, 2015). There is
internal validity when researchers can simultaneously eliminate viral hypotheses and
inference causal relationships among variables, without a high risk of error (Green &
Salkind, 2016). Therefore, whether the study is experimental or nonexperimental, in the
internal validity, researchers focus on whether the independent variable predicts or is the
cause of the dependent variable. This study was a nonexperimental design (i.e.,
correlation) and threats to internal validity was not applicable.
Although the threat of internal validity did not apply to this nonexperimental
study, there was a need to focus on the threats to statistical conclusion validity. Statistical
conclusion validity is a measure of how reasonable research or experimental conclusion
72
is (Saunders et al., 2015). Threats to statistical conclusion validity are conditions that
reject the null hypothesis when it is true and accept the null hypothesis when it is false.
The threats to statistical conclusion validity included (a) reliability of the instrument, (b)
data assumptions, and (c) sample size (Heale & Twycross, 2015).
The reliability of the instrument is the degree to which the results obtained by
measurement can apply to similar studies (Bolarinwa, 2015). One of the crucial
requirements for the instruments of data collection in research studies is the instruments’
reliability or consistency of eliciting data from participants. Cronbach’s α is the most
used test by researchers to determine the reliability of an instrument (Heale & Twycross,
2015). Researchers use indices of internal consistency of instruments to infer reliability
and report indices as reliability of coefficients using a scale of 0 to 1(Heale & Twycross,
2015). Reliability coefficients closer to 1 indicate the high internal consistency of the
instruments and thus an indication of reliability. Therefore, I analyzed the independent
variables’ coefficient values to infer the indices of internal consistency. The financial
data I collected from the official sources for this study are under law and regulations,
including the national fiscal laws of the countries forming the population and the sample
of the study apply to their fiscal policies. The existence of legal frameworks for the
financial data used in the study was a support to the assurance of the content validity of
the instruments. The assumptions about a multi linear regression are multicollinearity,
normality of errors, linearity, homoscedasticity, and independence of errors. A violation
of those assumptions could cause serious biases to the results of the study and lead me to
inaccurate statistical inference. Depending on the assumption, I used probability or
73
descriptive statistics to check the different assumptions. For example, there is
multicollinearity if a correlation coefficient is ≥ .01, and tolerance close to 0 means there
is multiple collinearity (Green & Salkind, 2017). In this study, I used a cutoff of 0 and
assume that there is no multicollinearity among the independent variable if the tolerance
is >.1. I used the SPSS graphics and especially, scatter plot to check the assumption of
normality, homoscedasticity, and independence of errors by analyzing the dispersion of
the observation to the central line. For the assumption of linearity, I used the SPSS
calculation to calculate the reaction of the observed value to any change in the standard
deviation. If a change of a given number to the standard deviation leads to the same
number of changes in the observed variable, then I would conclude that there is linearity.
The sample size can harm the validity of the study (Yin, 2018). A larger sample
size is a factor in the mitigation of sampling errors (Uronu Lameck, 2013). Therefore, the
size of the population of the study of 76 LIC and LMIC will be a validity issue. Although
the literature supports larger samples for quantitative studies, Gay et al. (2009) posited if
a population is less than 100, there should be no sampling. The study analysis of the
whole number of the LIC and LMIC as it resulted from the 2019 report of the World
Bank assisted in mitigating the low number of individuals in the study since all the
selected countries comprise the actual population-related of the research.
External validity refers to the generalizability of the results to the population
sample (Saunders et al., 2015). When the findings of a study cannot apply to other
contexts than the context of the study, then the study has limited external validity
(Saunders et al., 2015). The sampling method is essential in the research process to
74
ensure external validity, which determines the generalizability of the results (Watson,
2015). In the present study, I selected all the available units of the study (the LIC and
LMIC). There was not a problem with sampling since the population and the sample are
the same. The findings will be generalizable in other contexts with the integration of a
mediator variable that reflects each new context to which the study will be applied.
Transition and Summary
The purpose of this study quantitative correlational study was to examine the
relationship between public investment, FDI, and budget deficit. The study covered the
76 LIC and LMIC as it resulted from the 2019 report of the World Bank. From the
analysis on the data on the variables for each one of the studies, I made the inference to
answer the research question and confirmed or infirmed the hypothesis.
In this section, I described my role as a researcher, and the need to avoid biases
and to observe ethical practices throughout the process. I discussed the target population
and the sampling. I exposed the sources of data, data collection instruments, data
collection techniques, and data analysis. I explained the reason for selecting multiple
linear regression to test the hypothesis regarding the relationship between public
investment, FDI, and budget deficit.
In Section 3, I provided an overview of the research study, the findings of the
study, and the interpretation and analysis of the results. I exposed how I intend to apply
the results to real-life applications and strategies for implementing change in the field of
public finance. Finally, I made recommendations for future research as well as personal
research reflections of this study.
75
Section 3: Application to Professional Practice and Implications for Change
Introduction
The purpose of this quantitative correlational study was to examine the
relationship between public investment, FDI, and budget deficit. The independent
variable was public investment and FDI. The dependent variable was budget deficit. The
study was conducted on the 76 LIC and LMIC that represented the entire population of
the geographical scope of the study. To have an expressive value of each variable, I
collected data from 2019, which represented the latest publication of the World Bank
about the classification of the countries. Results of the multiple linear regression analysis
showed that the model was able to predict budget deficit significantly, F(2, 73) = 1405, p
<.001, and R2 = .72. Results also revealed that public investment was the only significant
predictor of the budget deficit, with t = -1.279 and p< .003.
In this section, I present the findings of the study. First, I present the applications
to professional practice, the implications for social change, and recommendations for
action. Second, I make recommendations for further research and reflect on my
experience in the doctoral study process. Finally, I test the assumptions using SPSS
Version 27.
Presentation of the Findings
Before the statistical testing, I evaluated the reliability of the model using
Cronbach’s alpha. The reliability of the variable is acceptable. The overall level of
reliability for the model is .78. Cronbach’s alpha for public investment, FDI, and budget
deficit are .702, .721, and .858, respectively. Although the accepted value of Cronbach’s
76
alpha is .7, values above .6 are acceptable (Taber, 2018). Cronbach’s alpha for each of
the three variables of the study was above .7, which is the accepted value. The study
included 76 countries, which represented the entire population of the geographical scope
of the study. Table 1 depicts the values of Cronbach’s alpha for each variable.
Table 1
Reliability Test
Variables Cronbach’s alpha
Foreign direct investment .721
Budget deficit .858
Public investment .702
Note. N = 76
Tests of Assumptions
I tested and evaluated each assumption, using SPSS, to ensure there was no
violation. The six assumptions I tested were multicollinearity, outlier, normality,
linearity, homoscedasticity, and independence of residuals. It is paramount to test the
assumptions of multiple regression analysis to ensure there is no violation that could
induce data bias and affect the findings negatively (Green & Salkind, 2017).
Multicollinearity
There is multicollinearity when tolerance value levels (1 – R2) are less than .01,
and the variance inflation factors (VIFs), which is the reciprocity of the tolerance, are
greater than 5 (Green & Salkind, 2017). For the present study, I used a cutoff of 0 and
assumed there was no collinearity if the tolerance was greater than .1. As depicted in
Table 2, the results revealed that there is no evidence of collinearity between the
77
independent variables. Therefore, I did not need an additional test such as the bootstrap
process.
Table 2
Multicollinearity Statistics
Variable Tolerance VIF
Public investment .93 1.075
FDI .98 1.020
Outlier, Normality, Linearity, Homoscedasticity, and Independence of Residuals
To evaluate outliers, normality, linearity, homoscedasticity, and independence of
residuals, I analyzed the normal probability plot (P-P) of the regression standardized
residual and the scatterplot of the standardized residuals. Figures 1–2 show that there was
no major violation of assumptions. Figure 1 shows that the data points do not have a
major dispersion from the diagonal from the bottom left to the top right. Therefore, there
was no major violation of the assumption of normality. Figure 2 does not show the
existence of a clear and systematic pattern in the scatterplot. The number of cases in the
study, which represented the entire number of cases in the scope of the study, is the main
reason that some of the points are relatively far from others. It was therefore reasonable
to conclude there was no violation of the assumption. I used an outlier histogram (see
Figures 3–5) to test for outliers. The figures show no outlier, which means that the
assumption of the outlier was not violated.
78
Figure 1
Normal Probability Plot (P-P) of the Standardized Regression
Figure 2
Scatterplot of the Standardized Residuals
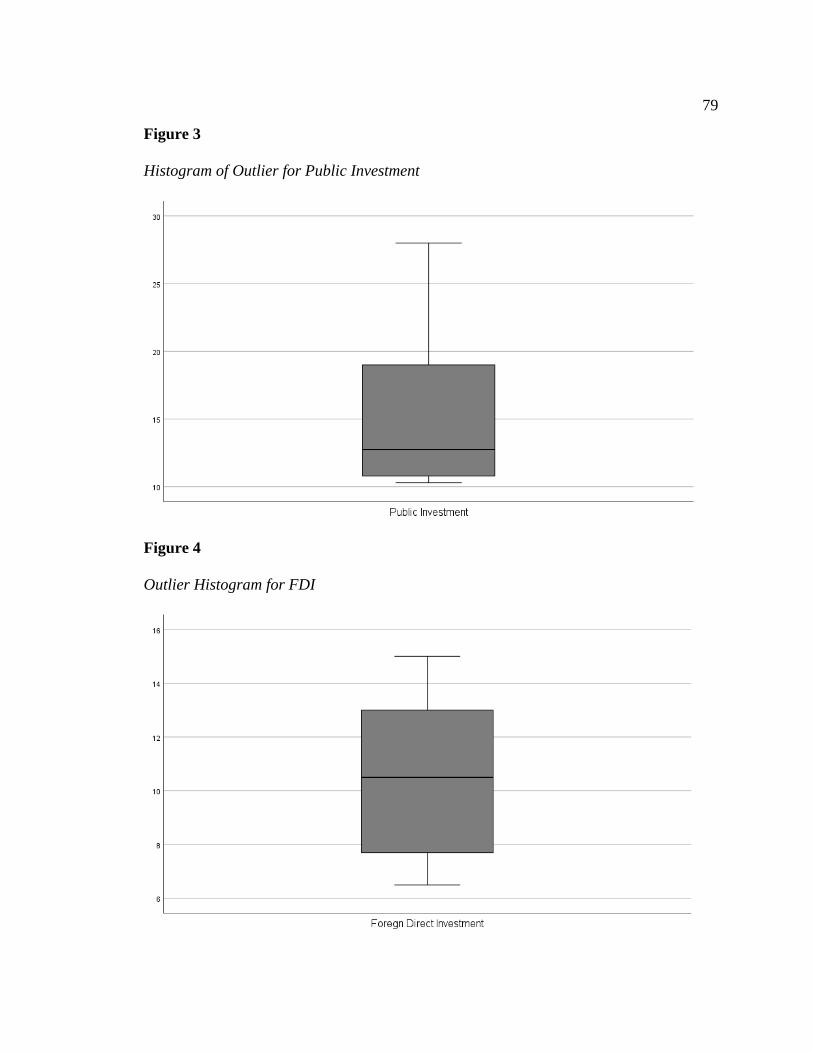
79
Figure 3
Histogram of Outlier for Public Investment
Figure 4
Outlier Histogram for FDI

80
Figure 5
Histogram of Outlier for Budget Deficit
Although the results above were sufficient to confirm there was no serious
violation of the assumption, I also ran the Kolmogorov-Shapiro test of normality. The
results confirmed that FDI is not a statistically significant predictor of the budget deficit.
However, the values of significance for public investment were p = .066 for Shapiro-
Wilk and p = .081 for Kolmogorov-Smirnov. I also assessed the normal (Q-Q) plot for
each variable, and the results showed there was no major violation of the assumption of
normality that contrasted with the overall result of the model. All the points were close to
the diagonal except one point on the (Q-Q) plot of public investment and budget deficit,
which did not represent a major violation. Table 3 and Figures 6 to 8 depict the results of
the additional test of normality.
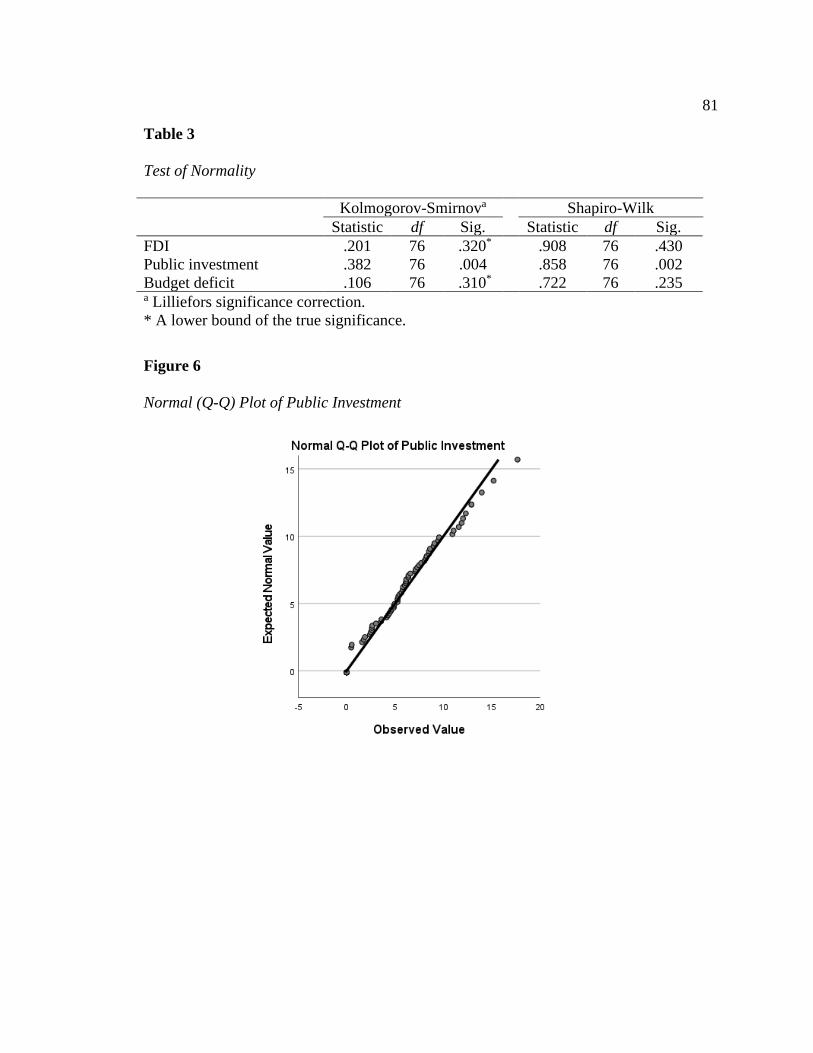
81
Table 3
Test of Normality
Kolmogorov-Smirnova Shapiro-Wilk
Statistic df Sig. Statistic df Sig.
FDI .201 76 .320* .908 76 .430
Public investment .382 76 .004 .858 76 .002
Budget deficit .106 76 .310* .722 76 .235 a Lilliefors significance correction.
* A lower bound of the true significance.
Figure 6
Normal (Q-Q) Plot of Public Investment
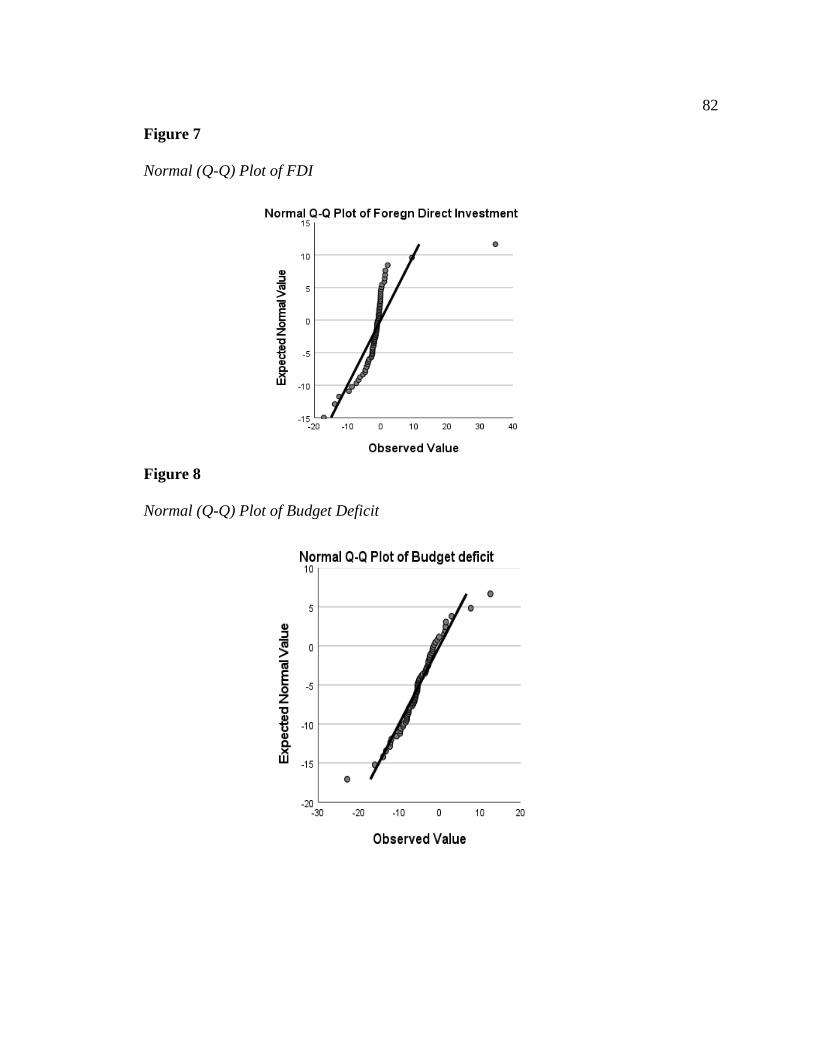
82
Figure 7
Normal (Q-Q) Plot of FDI
Figure 8
Normal (Q-Q) Plot of Budget Deficit
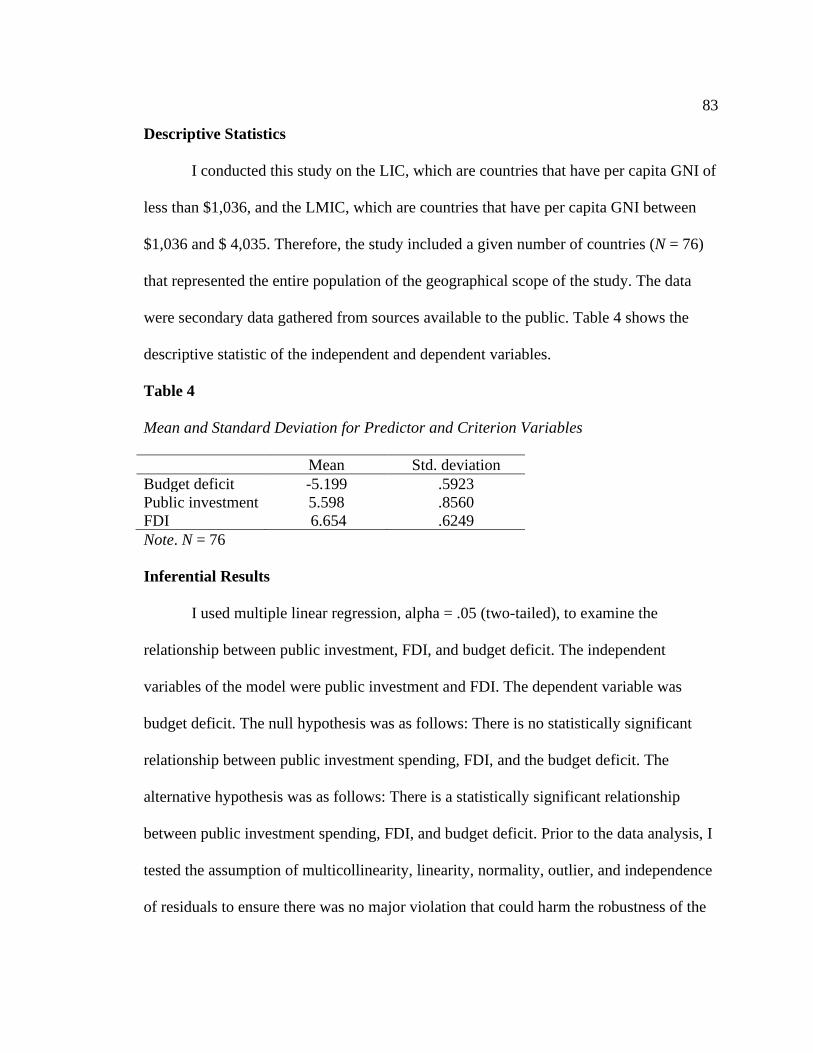
83
Descriptive Statistics
I conducted this study on the LIC, which are countries that have per capita GNI of
less than $1,036, and the LMIC, which are countries that have per capita GNI between
$1,036 and $ 4,035. Therefore, the study included a given number of countries (N = 76)
that represented the entire population of the geographical scope of the study. The data
were secondary data gathered from sources available to the public. Table 4 shows the
descriptive statistic of the independent and dependent variables.
Table 4
Mean and Standard Deviation for Predictor and Criterion Variables
Mean Std. deviation
Budget deficit -5.199 .5923
Public investment 5.598 .8560
FDI 6.654 .6249
Note. N = 76
Inferential Results
I used multiple linear regression, alpha = .05 (two-tailed), to examine the
relationship between public investment, FDI, and budget deficit. The independent
variables of the model were public investment and FDI. The dependent variable was
budget deficit. The null hypothesis was as follows: There is no statistically significant
relationship between public investment spending, FDI, and the budget deficit. The
alternative hypothesis was as follows: There is a statistically significant relationship
between public investment spending, FDI, and budget deficit. Prior to the data analysis, I
tested the assumption of multicollinearity, linearity, normality, outlier, and independence
of residuals to ensure there was no major violation that could harm the robustness of the
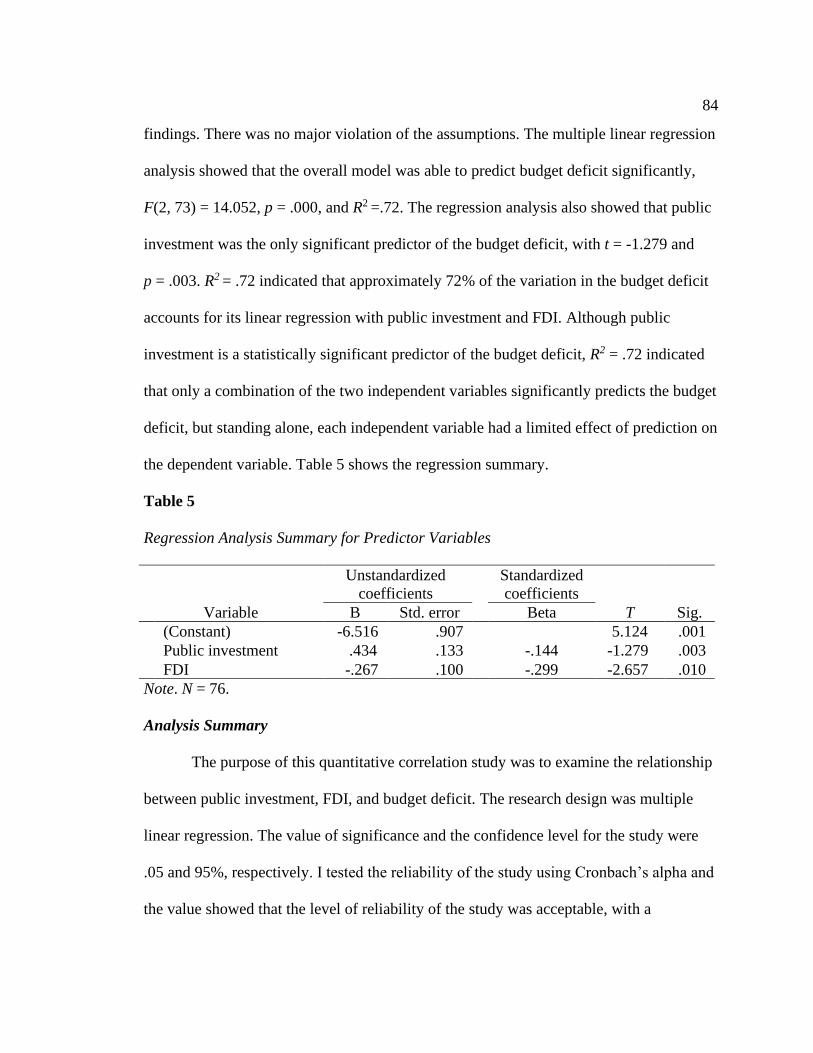
84
findings. There was no major violation of the assumptions. The multiple linear regression
analysis showed that the overall model was able to predict budget deficit significantly,
F(2, 73) = 14.052, p = .000, and R2 =.72. The regression analysis also showed that public
investment was the only significant predictor of the budget deficit, with t = -1.279 and
p = .003. R2 = .72 indicated that approximately 72% of the variation in the budget deficit
accounts for its linear regression with public investment and FDI. Although public
investment is a statistically significant predictor of the budget deficit, R2 = .72 indicated
that only a combination of the two independent variables significantly predicts the budget
deficit, but standing alone, each independent variable had a limited effect of prediction on
the dependent variable. Table 5 shows the regression summary.
Table 5
Regression Analysis Summary for Predictor Variables
Variable
Unstandardized
coefficients
Standardized
coefficients
T Sig. B Std. error Beta
(Constant) -6.516 .907 5.124 .001
Public investment .434 .133 -.144 -1.279 .003
FDI -.267 .100 -.299 -2.657 .010
Note. N = 76.
Analysis Summary
The purpose of this quantitative correlation study was to examine the relationship
between public investment, FDI, and budget deficit. The research design was multiple
linear regression. The value of significance and the confidence level for the study were
.05 and 95%, respectively. I tested the reliability of the study using Cronbach’s alpha and
the value showed that the level of reliability of the study was acceptable, with a
85
Cronbach’s alpha of .858 for budget deficit, .702 for public investment, and .721 for FDI.
The accepted value of Cronbach’s alpha is .7, but values above .6 are reasonable (Taber,
2018).
I tested the five key assumptions surrounding multiple regression using different
approaches. I tested multicollinearity using the values of tolerance and the VIF.
According to Green and Salkind (2017), there is collinearity if the tolerance value levels
are less than .1 and the values of the VIF are greater than 5. The tolerance value levels
were greater than .1 and the VIF value levels were less than 5 for both variables. I tested
the assumption of linearity, normality, homoscedasticity, and independence of residuals
using a combination of descriptive statistics with tables and figures. Although the results
showed no serious violation of the assumptions, I ran the Kolmogorov-Smirnov and
Shapiro-Wilk tests of normality, and the results also confirmed no major violation.
Therefore, there was no evidence of a violation for any of the five assumptions.
The lack of evidence of a violation of the assumptions supports the
trustworthiness of the results of the study. The multiple linear regression analysis showed
that the model was able to predict budget deficit significantly, F(2, 73) = 14.052, p<
.001, and R2 = .72. R2 = .72 indicated that approximatively 72% of the variation in the
budget deficit accounts for its linear regression with public investment and FDI. The
research question was as follows: What is the relationship between public investment,
FDI, and budget deficit? The results provided sufficient evidence to respond that there is
a linear relationship between public investment, FDI, and budget deficit. Also, the results
support the rejection of the null hypothesis and confirm the alternative hypothesis, which
86
is as follows: There is a statistically significant relationship between public investment
spending, FDI, and budget deficit.
Theoretical Discussion of the Findings
The results of the study revealed a statistically significant relationship between
public investment, FDI, and budget deficit. Such a result is congruent with Paul and
Singh (2017), who posited that investing in public projects in the sectors that facilitate
private initiatives may induce an inflow of FDI and lower the budget deficit. Bosanac and
Požega (2016) noted that public leaders may address a budget deficit by investing in
infrastructure, such as roads, energy, and information technology, and by developing
public–private partnerships. Bosanac and Požega noted that a combination of public
investment facilitates private investment and the development of a public–private
partnership may decrease the level of budget deficit. Bosanac and Požega’s research
aligns with the finding of the study. The results of the study are also congruent with
Keynes’s general theory, which is the theory that grounded the present study. According
to Keynes (1936), public leaders may overspend in public investment to generate
economic growth and raise additional capital abroad when the budget deficit becomes
high. Keynes implicitly recommended a combination of public investment and FDI as a
strategy to reduce the budget deficit.
Also, the results revealed a positive correlation between public investment and
budget deficit (t = -1.279, p< .003). Such a result serves as evidence to support the
positions of theorists who think that overspending on public projects may lead to a high
level of debt and deepen the budget deficit. For example, Ajudua and Davis (2015)
87
acknowledged that public investment affects economic growth positively but warned
about the consequences of uncontrolled public spending that may lead to further
economic problems. Furthermore, Laosebikan et al. (2018) pointed out that borrowing
and budget deficits lead to high interest rates and financial crowding out. A crowding out
may occur when public leaders increase borrowing from the private sector to finance
higher social investment (Hussain & Haque, 2017). Investing in public projects can have
a positive impact on economic growth in the long term; however, when public leaders
increase borrowing from the private sector to finance public projects, interest rates
increase, which increases the budget deficit as a result (Maurya & Singh, 2017).
However, Yovo (2017) posited that investments relate to a productive sector and may
generate revenues in the years following an investment to reduce the extent of the budget
deficit. Therefore, Yovo acknowledged implicitly the possibility of an inverse correlation
between public investment and budget deficit. Yovo’s position contrasts with the findings
of the present study but is congruent with the logic driving Keynes’s general theory,
which grounded the theoretical framework of the study.
The results revealed a negative but not statistically significant correlation between
FDI and budget deficit (t = –2.657, p< .010). Although the correlation is not statistically
significant, the negative coefficient indicated that the inflow of FDI may reduce the
budget deficit. Such a result supports Keynes’s general theory. According to Keynes
(1936), public leaders may use a budget deficit to create economic growth and raise
additional capital abroad when the use of the budget deficit induces economic issues. In
stating such a position, Keynes acknowledged implicitly that FDI correlates inversely
88
with budget deficit. Babu et al. (2020) and Malik (2015) stated that the inflow of FDI in
an economy may reduce public investment, and public leaders may allocate additional
revenues to new projects that may improve communities’ living conditions, thereby
supporting the finding of the study at that point. Sriyalatha and Torii (2019) posited that
when public leaders increase public debts to develop public projects, the interest rate
increases, which limits both national and foreign private investment. Therefore,
Sriyalatha and Torii supported the negative relationship between FDI and budget deficit.
Applications to Professional Practice
The purpose of this quantitative correlational study was to examine the
relationship between public investment, FDI, and budget deficit. The independent
variable was public investment and FDI. The dependent variable was budget deficit. The
findings provided strong evidence to reject the null hypothesis because the overall model
showed a statistically significant relationship between public investment, FDI, and budget
deficit. Public leaders, especially those who manage public finance and the economy,
may use the findings to initiate more relevant fiscal and budgetary policies. According to
Ahmad and Rahman (2017), public investment in the sectors that improve the business
environment and in infrastructures that support and facilitate economic activities may
induce an inflow of FDI. Furthermore, Makuyana and Odhiambo (2016) emphasized that
a combination of public investment and FDI may reduce the propensity of public leaders
to borrow and thus reduce the budget deficit. With a better understanding of the
relationship between public investment, FDI, and budget deficit, public leaders can
improve their decisions regarding the allocation of public resources. Public leaders can
89
develop relevant combinations of public investment and FDI to create economic growth,
which can increase public revenue and reduce the budget deficit.
The findings from the study may affect the process used by the authorities of the
LIC and LMIC to make regional laws and may serve as guidelines for business leaders
beyond the geographical scope of this study. As explained in this study, the eight
countries involved in the present study follow the same economic, fiscal, budgetary, and
trade policies because they are part of the same economic union. However, only a few of
the countries in the world meet the standards set in the law for the most critical indicators
such as the budget deficit. This may be because the lawmakers set those standards
without using scientifically and practically reasonable factors. The findings from this
study may help the lawmakers to use relevant factors in their decision making that may
help them to initiate regional laws with more objective standard values for the most
critical indicators.
Implications for Social Change
The budget deficit is an issue for public leaders and other individuals in the
present and the future. In the present, the budget deficit limits the capacities of public
leaders to develop more projects that can accelerate development and improve
individuals’ living conditions. The budget deficit compromises the chance of success for
future generations, as they will have to pay the public debts resulting from loans that
present authorities take to address the budget deficit. By providing findings that help to
understand the relationship between public investment, FDI, and budget deficit, public
leaders can improve the process of making decisions. Public leaders can use the finding
90
in this study to manage the budget deficit more efficiently, as they will have a better
understanding of some of the predictor variables. More specifically, the findings can help
public leaders to (a) avoid investing in public projects that do not have an interest for
their country, (b) save public revenue, (c) improve the quality of the law, and (d) reduce
public debts and increase public revenues.
The second dimension of the social change of this study is about communities and
individuals. With a better understanding of the relationship between the three variables in
the study, public leaders might improve their decision making and positively affect
individuals and communities. Public leaders also might avoid wasting public money,
create more public revenue, and reduce the public debt. Subsequently, public leaders will
be able to target projects that improve the living conditions of communities and the
individuals therein. For example, better allocation of the public revenue resulting from
the application of the findings of the study can help to (a) develop economic and social
projects (schools, hospitals, water, and energy) in the interest of the communities, (b)
improve the quality of education and create jobs, and (c) reduce the burden of the present
public debt on the future generation. The development of economic and social projects
can positively affect living conditions and behaviors in the communities. For example, if
there is more public revenue, providing electricity to communities that have never had
access to modern sources of energy can lead to positive changes in lifestyle and
behaviors.
91
Recommendations for Action
This study’s overall model showed a statistically significant correlation between
public investment, FDI, and budget deficit. Public investment was the only statistically
significant predictor; however, FDI also had an influence on the budget deficit. The
findings showed that the high and significant correlation between the independent and the
dependent variables of the model resulted from the combination of the two independent
variables. In terms of public policy, a combination of public investment and FDI must
reduce the budget deficit (Keynes, 1936). According to Makuyana and Odhiambo (2016),
a combination of public investment and FDI may reduce public leaders’ propensity for
borrowing and reduce the budget deficit. The fact that this study’s findings revealed the
contrast with such a high and statistically significant positive correlation between public
investment, FDI, and budget deficit calls for a set of actions.
I have identified three major actions that may reduce the budget deficit with a
combination of public investment and FDI. The actions are (a) hire independent experts
to determine the objective criteria of choosing public projects and sectors of interest for
FDI and the conditions of access to public debt, (b) develop a training program for
stakeholders in the process of public management, and (c) revise legislation to enforce
the criteria of identifying domains of interest for public investment and FDI and the
conditions to access public debt. According to Bonizzi (2017), when public leaders use
objective criteria to identify the domains of interest for investment, it may reduce the
budget deficit over time. However, in the short term, public debt may increase.
Identifying objective criteria for public investment and FDI and conditions of access to
92
the public debt will improve transparency in the choice of public actions and ensure a
relevant combination of public investment and FDI that may negatively impact the
budget deficit.
Developing a training program and enforcing the criteria are also two critical
actions. The development of a training program could improve stakeholders’ capacity in
the management of public finance in the choice of the domains of interest for public
investment and FDI. The enforcement of new legislation criteria will increase
transparency, reduce the possibilities of fraud, and lower the opportunity costs of project
choice. When public leaders chose public actions with lower opportunity costs, public
spending and the budget deficit decreased (Mariana, 2016). The enforcement of the
criteria resulting from independent experts’ work will increase the spirit of duty to make
the right decisions regarding stakeholders’ management of the public budget. Public
leaders will ensure the choice minimizes the debt burden in public revenue and reduces
the budget deficit.
The implementation of the three actions requires a rigorous organization and
relevant strategies. Public leaders must establish a checklist of the actions and processes
needed to achieve each action, turn it into a strategy with clear goals, and gain the
adherence of key stakeholders before the implementation phase. Therefore, the next step
will be to work toward achieving each action. To hire independent experts, it is
paramount to identify the best experts at the international level, referring to shortlists of
experts whom international organizations such as the World Bank and IMF use for
procurement. For the training program, it will be critical to identify many stakeholders to
93
train. In turn, the stakeholders will duplicate the knowledge received in their respective
country. Public leaders could use webinars to oversee and evaluate the training program.
Finally, enforcing the criteria identification of projects and conditions to access public
debt will involve helping lawmakers to first understand what they will enforce.
Recommendations for Further Research
This study contributes to the literature on the relationship between public
investment, FDI, and budget deficit. The findings help to increase understanding of the
influence that public investment and FDI may have on budget deficit. However, the
findings showed that the standardized coefficient beta of FDI in the overall model was
negative (beta = - 2.657), but in the same model, a combination of public investment and
FDI has a high positive and statistically significant correlation with the budget deficit.
My first recommendation for further study is to study the relationship between FDI and
budget deficit only. The second recommendation is to conduct a study to develop a
deeper understanding of the influence of FDI on budget deficit by examining the partial
correlation between the variables in this study.
The study had two limitations. The first limitation resulted from the fact that the
data were from a secondary source and any error from the source may have led to bias in
the results. The second limitation was the size of the sample, which was the same as the
population of the study. The study was the 76 LIC and LMIC. According to Saunders et
al. (2015), limitations are factors that induce biases in the findings of a study or limit the
generality of the findings. My recommendation for further study to address the biases that
may result from the sources of data is to conduct a study on the determinants of
94
investments and budget deficit in each country. According to Banday and Aneja (2016), a
budget deficit is the difference between total public spending and total public revenue.
Conducting a study on the determinants of investment and budget deficit could help to
collect data from each country and to calculate the values of each variable. My
recommendation to address the limitation about the size of the sample is to examine the
relationship between the same variable on a wider level, especially extending the scope of
the study to the upper middle income and high income countries. According to Yin
(2018), studies with larger samples are likely to have more robust findings than studies
with smaller samples. Conducting a study on the relationship between public investment,
FDI, and budget deficit among the 76 countries in the world could lead to more relevant
findings.
Reflections
This doctoral journey has been an impactful experience in my life. My aim when I
decided to begin the journey was to earn a degree in an English-speaking system,
especially from the United States. For someone like me with a French-speaking
background, it is a critical comparative advantage to my peers of the same background in
my country and my region. My aim was also to enhance my expertise in finance, which is
my field of expertise. However, throughout the journey, I discovered and gained far more
than my initial expectations. The doctoral journey has improved my writing skills and, in
addition to the knowledge I acquired from conducting the literature review and my
participation in class sessions, I have improved my skills in self-organization, time
management, structuring ideas, and even in daily life. The learning-by-doing method
95
used at Walden University was beneficial for me. I have developed my skills in many
domains that were not my domains of expertise. For example, I can run any type of test
and statistical analysis with SPSS, even though I had never been strong in statistics.
I also experienced challenges trying to meet all the Walden University
requirements, such as the Doctor in Business Administration rubric, the standards of the
American Psychological Association publication style, and addressing different types of
feedback. I also experienced working with an amazing chair in Dr. Casale with her
unlimited willingness to help and to push me forward in the journey. Without her
patience and her willingness to help, I, with my French-speaking background who started
practicing English actively only in 2016, would not have been able to complete a doctoral
degree and write a dissertation.
In addition to my experience during the journey, the findings in my study gave me
a new understanding of public finance. As a practitioner of public finance through my
experience as a minister of finance in my country, I had thought about the theoretical
reasons that might explain why countries are not able to achieve the standard of the
budget deficit despite the existence of a set standard ratio. By choosing to examine the
relationship between public investment, FDI, and budget deficit, my first aim was to find
scientific evidence of the influence of each independent variable on the dependent
variable. The results would then help me to suggest how public leaders could use the two
independent variables to manage the budget deficit more efficiently. However, the results
of the study were surprising and contrasted with my preconceived ideas. I was aware that
public investment, as a critical component of public spending, would have a positive
96
impact on the budget deficit. I also was aware that the inflow of the budget deficit might
have a negative influence on the budget deficit. However, I did not think that the
combination of public investment and FDI would have a positive and statistically
significant correlation with the budget deficit.
My wish was to finish my doctorate and to move toward achieving more goals in
my life. However, I will miss working with Dr. Casale and interacting with my
classmates. I am now used to writing emails to Dr. Casale and receiving feedback just
minutes later, including words of encouragement. I am also used to having discussions
with my classmates. I will miss those warm and exciting interactions. My doctoral
journey was beneficial for the knowledge I have acquired and for the persons I have had
the chance to meet.
Conclusion
Managing the budget deficit is one of the most critical challenges in the field of
the public finance. There is a set standard of the ratio of the budget deficit, but in most
the cases, public leaders fail to achieve the standard of the budget deficit because they
lack understanding of some of the essential factors that determine the budget deficit. The
purpose of this quantitative correlational study was to examine the relationship between
public investment, FDI, and budget deficit. I focused on the 76 LIC and LMIC, as it
resulted from the 2019 publication of the World Bank. I used SPSS Version 27 to test the
hypotheses, and I analyzed descriptive statistics, tested the assumptions, and performed
multiple linear regression. Before testing the assumption, I evaluated the reliability of the
study using Cronbach’s alpha and found that the reliability of the study was reasonably
97
acceptable. The model confirmed the alternative hypothesis and rejected the null
hypothesis, therefore confirming that a statistically significant relationship exists between
public investment, FDI, and budget deficit. However, public investment was the only
statistically significant predictor of the budget deficit. The findings also showed a
negative but not statistically significant relationship between FDI and budget deficit.
The negative correlation between FDI and budget deficit and the positive
correlation between public investment and budget deficit support Keynes’s theory that
grounded the study. However, the results of the model were a confirmation of the
thoughts of the challengers of Keynes’s theory, who posited that using the budget deficit
as a means to create economic growth may be potentially harmful to the economy. I
found the need to conduct further research to deepen some of the aspects of the questions
regarding the limitations of the study. I concluded from the study that having a good
strategy for allocating public revenue to public projects and determining objective criteria
for identifying the domains of attraction of FDI need to be a priority for public business
leaders. I hope this study’s contribution to the literature on public finance will be useful
and will provide public leaders with additional and new information to improve their
strategy of allocating public revenue.
98
References
Abdullah, S. M., Azad, A. K., & Siddiqua, S. (2018). Budget deficit and growth: In
search of ceiling for Bangladesh. Business & Economic Horizons, 14(4), 743-765.
https://doi.org/10.15208/beh.2018.52
Abu, N., & Karim, M. Z. A. (2016). The relationships between foreign direct investment,
domestic savings, domestic investment, and economic growth: The case of Sub-
Saharan Africa. Society and Economy in Central and Eastern Europe, 38(2), 193-
217. https://doi.org/10.1556/204.2016.38.2.4
Abubakar, A. B. (2016). Dynamic effects of fiscal policy on output and unemployment in
Nigeria: An econometric investigation. CBN Journal of Applied Statistics, 7(2),
101-122. http://hdl.handle.net/10419/191690
Ahmad, E. (2017). Public investment for sustainable development: Working paper
commissioned by the G-24 as part of its work program on financing for
development. G-24 Intergovernmental Group of Twenty-Four.
http://www.g24.org/wp-
content/uploads/2017/09/Public_Investment_for_Sustainable_Development.pdf
Ahmad, F., & Rahman, B. (2017). The relationship between budget deficit and economic
growth: A study on Bangladesh. ASA University Review, 11(2), 1-13.
https://www.researchgate.net/publication/326689582_the_relationship_between_b
udget_deficit_and_economic_growth_a_study_on_bangladesh
Ajudua, E. I., & Davis, O. J. P. (2015). Government expenditure, foreign direct
investment and economic growth in Nigeria. Journal of Economics and
99
Sustainable Development, 6(8), 79-84.
http://citeseerx.ist.psu.edu/viewdoc/download?doi=10.1.1.981.7029&rep=rep1&t
ype=pdf
Aggarwal, R., & Ranganathan, P. (2017). Common pitfalls in statistical analysis: Linear
regression analysis. Perspectives in Clinical Research, 8(2), 100-102.
https://doi.org/10.4103/2229-3485.203040
Akaeze, C. (2016). Small business sustainability strategies in competitive environments:
Small business and competition. Lambert Academic Publishing.
Akinola, F. (2017). The economic performance of budget deficit in Nigeria. Research
Journal of Finance and Accounting, 8(8), 128-135.
https://www.iiste.org/Journals/index.php/RJFA/article/view/36780/37797
Al-Fawwaz, T. M. (2016). The impact of government expenditures on economic growth
in Jordan (1980-2013). International Business Research, 9(1), 99-105.
https://doi.org/10.5539/ibr.v9n1p99
Appiah, M., Li, F., Frowne, D. I., & Donkor, D. T. (2019). Foreign investment and
growth: A case of selected African economies. International Entrepreneurship
Review, 5(3), 7-18. https://doi.org/10.15678/ier.2019.0503.01
Arjomand, M., Emami, K., & Salimi, F. (2016). Growth and productivity: The role of
budget deficit in the MENA selected countries. Procedia Economics and Finance,
36, 345-352. https://doi.org/10.1016/s2212-5671(16)30046-6
100
Armstrong, P. (2019). Keynes’s view of deficits and functional finance: A modern
monetary theory perspective. International Review of Applied Economics, 33(2),
241-253. https://doi.org/10.1080/02692171.2018.1475139
Ayangbah, S., & Sun, L. (2017). Comparative study of foreign investment laws: The case
of China and Ghana. Cogent Social Sciences, 3(1), 2-20.
https://doi.org/10.1080/23311886.2017.1355631
Ayogueze, N. F., & Anidiobu, G. A. (2017). Assessment of impact of government budget
deficits on unemployment rate in Nigeria. Journal of Economics and Finance,
8(6), 18-26. https://doi.org/10.9790/5933-0806021826
Babu, W. A., Pantaleo, I. M., & Ndanshau, M. O. (2020). Econometric analysis of the
impact of taxes on private investment in Sub-Sahara Africa. African Journal of
Economic Review, 8(1), 176-197.
https://www.ajol.info/index.php/ajer/article/view/192204
Banday, U. J., & Aneja, R. (2016). The link between budget deficit and current account
deficit in Indian economy. Jindal Journal of Business Research, 4(1-2), 1-10.
https://doi.org/10.1177/2278682116649844
Barisiki, S., & Baris, A. (2017). Impact of governance on budget deficit in developing
countries. Theoretical & Applied Economics, 24(2), 111-130.
https://doi.org/10.28933/JTAE
Bayraktar, N. (2016). Tax simplification and tax efficiency. EcoMod Network.
https://ecomod.net/system/files/Bayraktar.pdf
101
Bayraktar, N. (2019). Effectiveness of public investment on growth in sub-Saharan
Africa. Eurasian Economic Review, 9(4), 421-457.
https://doi.org/10.1007/s40822-018-0119-z
Bayraktar, N., & Moreno‐Dodson, B. (2015). How can public spending help you grow?
An empirical analysis for developing countries. Bulletin of Economic Research,
67(1), 30-64. https://doi.org/10.1111/j.1467-8586.2012.00473.x
Beck, N., & Witt, U. (2019). Austrian economics and the evolutionary paradigm. Studies
in Logic, Grammar and Rhetoric, 57(1), 205-225. https://doi.org/10.2478/slgr-
2019-0013
Bengtsson, E., & Stockhammer, E. (2018). Wages, income distribution and economic
growth in Scandinavia (Working Paper No. 1811).
https://pdfs.semanticscholar.org/f3c0/a5fa913cb963020d6655f96b9de02df2cb3b.
Bernheim, B. D. (1989). A neoclassical perspective on budget deficits. Journal of
Economic Perspectives, 3(2), 55-72. https://doi.org/10.1257/jep.3.2.55
Biplob, N. K. (2019). Does budget deficit impede economic growth? Evidence from
Bangladesh. Journal of Management, Economics, and Industrial Organization,
3(2), 66-94. http://doi.org/10.31039/jomeino.2019.3.2.5
Boeri, T. (2019). Beyond the rule of thumb: Methods for evaluating public investment
projects. Routledge.
102
Bolarinwa, O. A. (2015). Principles and methods of validity and reliability testing of
questionnaires used in social and health science research. Nigerian Postgraduate
Medical Journal, 22(4), 195. https://doi.org/10.4103/1117-1936.173959
Bonizzi, B. (2017). An alternative post-Keynesian framework for understanding capital
flows to emerging markets. Journal of Economic Issues, 51(1), 137-162.
https://doi.org/10.1080/00213624.2017.1287502
Bosanac, S., & Požega, Ž. (2016). Impacts of foreign investment on economic growth in
transition countries. Ekonomski vjesnik: Review of Contemporary
Entrepreneurship, Business, and Economic Issues, 29(2), 501-520.
https://hrcak.srce.hr/170478
Boundless Economics. (2020). Major theories in macroeconomics. Lumen.
https://courses.lumenlearning.com/boundless-economics/chapter/major-theories-
in-macroeconomics/
Brezavscek, A., Sparl, P., & Znidarsic, A. (2014). Extended technology acceptance
model for SPSS acceptance among Slovenian students of social sciences.
Organizacija, 47(2), 116-127. https://doi.org/10.2478/orga-2014-0009
Bromley, E., Mikesell, L., Jones, F., & Khodyakov, D. (2015). From subject to
participant: Ethics and the evolving role of community in health research.
American Journal of Public Health, 105(5), 900-908.
https://doi.org/10.2105/AJPH.2014.302403
Brunner, K., & Meltzer, A. H. (1972). Money, debt, and economic activity. Journal of
Political Economy, 80(5), 951-977. https://doi.org/10.1086/259945
103
Cai, L., & Zhu, Y. (2015). The challenges of data quality and data quality assessment in
the big data era. Data Science Journal, 14(2), 1-10. https://doi.org/10.5334/dsj-
2015-002
Cai, P., Kim, S. J., & Wu, E. (2019). Foreign direct investments from emerging markets:
The push-pull effects of sovereign credit ratings. International Review of
Financial Analysis, 61, 110-125. https://doi.org/10.1016/j.irfa.2018.10.006
Calmettes, G., Drummond, G. B., & Vowler, S. L. (2012). Making do with what we have:
Use your bootstraps. Clinical and Experimental Pharmacology and Physiology,
39, 747-750. https://doi.org/10.1111/j.1440-1681.2012. 05739.x
Chakraborty, L. S. (2016). Fiscal consolidation, budget deficits and the macro economy.
Sage Publishing India.
Chakraborty, P. (2017). Federalism, fiscal space, and public investment spending: Do
fiscal rules impose hard-budget constraints? (Working Paper No. 872). Levy
Economics Institute of Bard College.
https://www.econstor.eu/handle/10419/17348
Chauhan, Y., & Kumar, S. (2017). Does founder ownership affect foreign investments?
Evidence from India. Emerging Markets Review, 32, 116-129.
https://doi.org/10.1016/j.ememar.2017.06.001
Chukwuani, V. N., & Osita, N. M. (2018). Impact of financial development on
investment in government treasury bills in Nigeria. International Digital
Organization for Scientific Research (IDOSR) Journal of Arts and Management,
104
3(2), 31-41. https://www.idosr.org/wp-content/uploads/2018/05/idosr-jam-3231-
41-2018-ol.pdf
Cingolani, M. (2019). Necessary public investment: The role of the public banks.
International Journal of Political Economic, 48, 275-300.
https://doi.org/10.1080/08911916.2019.1655955
Chen, Y., Li, Y., Wu, H., & Liang, L. (2014). Data envelopment analysis with missing
data: A multiple linear regression analysis approach. International Journal of
Information Technology & Decision Making, 13, 137-153.
https://doi.org/10.1142/S0219622014500060
Claydon, L. S. (2015). Rigor in quantitative research. Nursing Standard, 29, 43-48.
https://doi.org/10.7748/ns.29.47.43.e8820
Coccia, M. (2017). Asymmetric paths of public debts and of general government deficits
across countries within and outside the European monetary unification and
economic policy of debt dissolution. Journal of Economic Asymmetries, 15, 17-
31. https://doi.org/10.1016/j.jeca.2016.10.003
Connelly, L. M. (2014, January-February). Ethical considerations in research studies.
MedSurg Nursing, 23, 54-55. http://go.galegroup.com
Dao, B., & Bui, T. (2016). Budget deficit and economic growth prediction in the case of
Vietnam. http://doi.org/10.2139/ssrn.2816710
Dash, P. (2016). The impact of public investment on private investment: Evidence from
India. Vikalpa: The Journal for Decision Makers, 41(4), 288-307.
https://doi.org/10.1177/0256090916676439
105
Davaakhuu, O., Sharma, K., & Bandara, Y. M. (2015). Determinants of foreign direct
investment during economic transition in Mongolia. Australasian Journal of
Regional Studies, 21(1), 138-158.
https://search.informit.com.au/documentsummary;dn=097286873354793;res=ieln
zc
de Borja Reis, C. F., de Araújo, E. C., & Gonzales, E. O. (2019). Public investment
boosted private investment in Brazil between 1982 and 2013. Journal of
Economic Issues, 53(3), 813-840.
https://doi.org/10.1080/00213624.2019.1644931
Denzin, N. K., & Lincoln, Y. S. (2015). The Sage handbook of qualitative research (4th
ed.). Sage.
Dessus, S., Diaz‐Sanchez, J. L., & Varoudakis, A. (2016). Fiscal rules and the
pro‐cyclicality of public investment in the West African Economic and Monetary
Union. Journal of International Development, 28(6), 887-901.
https://doi.org/10.1002/jid.3047
Dillard, D. (2018). The economics of John Maynard Keynes: The theory of a monetary
economy. Pickle Partners Publishing.
Dornean, A., & Oanea, D. C. (2014). The impact of fiscal policy on FDI in the context of
crisis. Evidence from Central Eastern European countries. Emerging Markets
Queries in Finance and Business, 2014(15), 406-413.
https://doi.org/10.1016/S2212-5671914000468-7
106
Dou, J., & Ye, B. (2018). Informal institutions and local public investment in rural China.
Singapore Economics Review, 63(4), 899-916.
https://doi.org/10.1142/S02175908817420012
Dow, S., Jespersen, J., & Tily, G. (Eds.). (2018). The general theory and Keynes for the
21st century. Edward Elgar Publishing.
Dreger, C., Schüler-Zhou, Y., & Schüller, M. (2017). Determinants of Chinese direct
investments in the European Union. Applied Economics, 49(42), 4231-4240.
https://doi.org/10.2139/ssrn.2605831
Driessen, G. A., & Gravelle, J. G. (2019). Deficit financing, the debt, and “modern
monetary theory.” Congressional Research Service.
Durmaz, N. (2017). Foreign direct investments, democracy, and economic growth in
Turkey. International Journal of Social Economics, 44(2), 232-252.
https://doi.org/10.1108/ijse-01-2015-0015
Elert, N., & Henrekson, M. (2019). The collaborative innovation bloc: A new mission for
Austrian economics. Review of Austrian Economics, 32(4), 295-320.
https://doi.org/10.1007/s11138-019-00455-y
Elzamly, A., & Hussin, B. (2014). Managing software project risks (analysis phase) with
proposed fuzzy regression analysis modelling techniques with fuzzy concept.
Journal of Computing and Information Technology, 22(2), 131-144.
https://doi.org/10.2498/cit.1002324
107
Eze, O. R., & Ogiji, F. O. (2016). Impact of deficit financing on economic stability in
Nigeria: Analysis of economic growth. Journal of Applied Finance and Banking,
6(1), 111-125. http://www.scienpress.com/upload/jafb/vol%206_1_7.pdf
Faul, F., Erdfelder, E., Buchner, A., & Lang, A. G. (2009). Statistical power analysis
using G*Power 3.1: Tests for correlation and regression analyses. Behavior
Research Methods, 41(4), 1149-1160. https://doi.org/10.3758/BRM.41.4.1149
Fedeli, S., Forte, F., & Ricchi, O. (2015). The long term negative relationship between
public deficit and structural unemployment: An empirical study of OECD
countries (1980–2009). Atlantic Economic Journal, 43(1), 39-54.
https://doi.org/10.1007/s11293-014-9437-z
Ferrero, A. (2015). House price booms, current account deficits, and low interest rates.
Journal of Money, Credit and Banking, 47(S1), 261-293.
https://doi.org/10.1111/jmcb.12202
Fisher, M., & Bloomfield, J. (2019). Understanding the research process. Journal of the
Australian Rehabilitation Nurses’ Association, 22(1), 22-27.
https://doi.org/10.1093/ageing/26.1.21 PMID:9143433
Frels, R. K., & Onwuegbuzie, A. J. (2013). Administering quantitative instruments with
qualitative interviews: A mixed research approach. Journal of Counseling &
Development, 91, 184 -194. https://doi.org/10.1002/j.1556-6676.2013. 00085.x
Gay, L. R., Mills, G. E., & Airasian, P. (2009). Educational research: Competencies for
analysis and application (9th ed.). Upper Saddle River, NJ: Prentice Hall.
108
Gatawa, N. M., Abdulgafar, A., & Olarinde, M. O. (2017). Impact of money supply and
inflation on economic growth in Nigeria (1973-2013). IOSR Journal of
Economics and Finance (IOSR-JEF), 8(3), 26-37. https://doi.org/10.9790/5933-
0803042637
Gisore, N., & Jepchumba, I. (2017). Effect of budget deficit on private investment in East
African community for the period 1981-2015: A panel data analysis. International
Journal of Business, 4(1), 26-37.
https://doi.org/10.18488/journal.62.2017.42.26.37
Greaney, A., Sheehy, A., Heffernan, C., Murphy, J., Mhaolrúnaigh, S. N., Heffernan, E.,
& Brown, G. (2012). Research ethics application: A guide for the novice
researcher. British Journal of Nursing, 21, 38-43.
http://www.markallengroup.com/ma-healthcare
Green, S. B., & Salkind, N. J. (2017). Using SPSS for Windows and Macintosh:
Analyzing and understanding data (8th ed.). Pearson Education Unlimited.
Guo, S. (2015). Shaping social work science: What should quantitative researchers do?
Research on Social Work Practice, 25, 370-381.
https://doi.org/10.1177/10497733151452717
Guo, S., & Fraser, M. V. (2014). Propensity score analysis : Statistical methods and
application (Vol.11). Sage Publications.
Gupta, S., Liu, E. X., & Mulas-Granados, C. (2016). Now or later? The political economy
of public investment in democracies. European Journal of Political Economy, 45,
101-114. https://doi.org/10.1016/j.ejpoleco.2016.10.004
109
Harrell, F. (2015). Regression modeling strategies: with applications to linear models,
logistic and ordinal regression, and survival analysis (2nd ed.). New York, NY:
Springer.
Hayo, B., & Neumeier, F. (2016). Political leaders’ socioeconomic background and
public budget deficit: evidence from OECD countries. Economics & Politics,
28(1), 55-78. https://doi.org/10.1111/ecpo.12071
Heale, R., & Twycross, A. (2015). Validity in quantitative studies. Evid Based Nurs, 8(3),
66-67. https://ebn.bmj.com/content/ebnurs/18/3/66.full.pdf
Heimberger, P., Kapeller, J., & Schütz, B. (2017). The NAIRU determinants: What’s
structural about unemployment in Europe? Journal of Policy Modeling, 39(5),
883-908. https://doi.org/10.1016/j.jpolmod.2017.04.003
Hollander, S. (1973). The economics of Adam Smith. University of Toronto Press.
Hülsmann, J. G. (2018). Mises’ monetary theory. In A. Godart-van der Kroon and P.
Vonlanthen (Eds.), Banking and monetary policy from the perspective of Austrian
economics (pp. 25-48). Springer.
Hussain, M. E., & Haque, M. (2017). Empirical analysis of the relationship between
money supply and per capita GDP growth rate in Bangladesh. Journal of
Advances in Economics and Finance, 2(1), 54-66.
https://doi.org/10.22606/jaef.2017.21005
Ibadula, B., Vlad, C., Ioniță, C., & Brezeanu, P. (2017). Direct taxation trends in
European Union and Romania, the influence of direct taxation on budget deficit.
Revista Economica, 69(4), 118-128.
110
http://economice.ulbsibiu.ro/revista.economica/archive/69411ibadula&vlad&ionit
a&brezeanu.pdf
Ibrahim, T. (2017). Budget deficit-money demand nexus in Nigeria: A myth or reality?
(MPRA Paper No. 86265). University Library of Munich. https://mpra.ub.uni-
muenchen.de/86265/1/mpra_paper_86265.pdf
Imai, K., Tingley, D., & Yamamoto, T. (2013). Experimental designs for identifying
causal mechanisms. Journal of the Royal Statistical Society: Series A (Statistics in
Society), 176, 5-51. https://doi.org/10.1111/j.1467-985X.2012.01032.x
Inoua, S. M., & Smith, V. (2019). Classical economics: Lost and found (Economics
Science Institute (ESI) Working Paper). Chapman University, Economic Science
Institute.
Irwin, T. C. (2015). Defining the government’s debt and deficit. Journal of Economic
Surveys, 29(4), 711-732. https://doi.org/101111éjoes.12123
Jafar, G., Hossein, S. A., & Batool, G. S. (2016). The effect of budget deficit shock on
the current account deficit in the presence of output shocks: The twin divergence
phenomenon in Iran (1990:1-2011:4). Majlis & Rahbord, 23(85), 223-246.
https://www.sid.ir/en/Journal/ViewPaper.aspx?ID=513499
Junquera-Varela, R. F., Verhoeven, M., Shukla, G. P., Haven, B., Awasthi, R., &
Moreno-Dodson, B. (2017). Strengthening domestic resource mobilization:
Moving from theory to practice in low-and middle-income countries. World Bank.
111
Kamiguchi, A., & Tamai, T. (2019). Public investment, public debt, and population aging
under the golden rule of public finance. Journal of Macroeconomics, 60, 110-122.
https://doi.org/10.1016/j.jmacro.2019.01.011
Kaplan, S. B., & Thomsson, K. (2017). The political economy of sovereign debt: Global
finance and electoral cycles. Journal of Politics, 79(2), 605-623.
https://doi.org/10.1086/688441
Keho, Y. (2016a). Budget deficits, money supply and price level in West Africa. Journal
of Economic & Financial Studies, 4(5), 1-8.
https://doi.org/10.18533/jefs.v4i05.209
Keho, Y. (2016b). Impact of budget deficit on private consumption in WAEMU
countries: Evidence from pooled mean group estimation. International Journal of
Economics and Finance, 8(3), 189-195. https://doi.org/10.5539/ijef.v8n3p189
Kelly, P., Fitzsimons, C., & Baker, G. (2016). Should we reframe how we think about
physical activity and sedentary behaviour measurement? Validity and reliability
reconsidered. International Journal of Behavioral Nutrition and Physical Activity,
13(1), 32-34. https://doi.org/10.1186/s12966-016-0351-4
Keynes, J. M. (1936). The general theory of employment, interest and money. Palgrave
Macmillan.
Khan, S. (2014). Qualitative research method: Grounded theory. International Journal of
Business and Management, 9, 224-233. https://doi.org/10.5539/ijbm. v9n11p224
Klenke, K. (2016). Qualitative research in the leadership. Emerral Group Publishing.
112
Korstjens, I., & Morser, A. (2017). Practical guidance to qualitative research. Part 2:
Context, research questions, and designs. European Journal of General Practice,
23(1), 274-279. https://doi.org/10.1080/13814788.2017.1375090
Kyvik, S. (2013). The academic researcher role: Enhancing expectations and improved
performance. Higher Education, 65, 525-538. https://doi.org/10.1007/s10734-
012-9561-0
Laosebikan, J. O., Alao, J. A., Ajani, J. O., Alabi, F. A., & David, J. O. (2018). Federal
government domestic and external debt: Implications on Nigeria’s economic
growth (1981-2015). International Journal of Innovative Finance and Economics
Research, 6(4), 95-106. https://seahipaj.org/journals-ci/dec-2018/ijifer/full/ijifer-
d-8-2018.pdf
Leedy, P. D., & Ormrod, J. E. (2013). The nature and tools of research. Boston, MA:
Pearson.
Lerner, A. P. (2013). Keynes’ general theory of employment, interest and money.
International Labor Review, 152, 36-46. https://doi.org/10.1111/j.1564-
913X.2013. 00159.x
Li, J. (2017). The economic cycle and the growth of the Chinese economy. Routledge.
Liu, X., Luo, Y., Qiu, Z., & Zhang, R. (2014). FDI and economic development: Evidence
from China’s regional growth. Emerging Markets Finance & Trade, 50, 87-106.
https://doi.org/10.1080/1540496X.2014.1013852
Loaba, S., & Zahonogo, P. (2019). Effects of information sharing on banking credit and
economic growth in developing countries: Evidence from the West African
113
Economic and Monetary Union. International Journal of Finance & Economic,
24(3), 1079-1090. https://doi.org/10.1002/ijfe.1706
Lungu, C. I., Caraiani, C., & Dascălu, C. (2017). The impact of IFRS adoption on foreign
direct investments: Insights for emerging countries. Accounting in Europe, 14(3),
331-357. https://doi.org/10.1080/17449480.2017.1374546
Mabula, S., & Mutasa, F. (2019). The effect of public debt on private investment in
Tanzania. African Journal of Economic Review, 7(1), 109-135.
https://www.ajol.info/index.php/ajer/article/view/182553
Mah, G. (2018, October). Determinants of budget deficit in South Africa: A bounds
cointegration. In Proceedings of Economics and Finance Conferences (No.
6909931). International Institute of Social and Economic Sciences.
https://doi.org/10.20472/efc.2018.010.021
Makuyana, G., & Odhiambo, N. M. (2016). Public and private investment and economic
growth: A review. Journal of Accounting and Management, 6(2), 25-42.
https://doi.org/10.2478/subboec-2018-0010
Maleki, S. (2016). Investigation of foreign direct investment impact on Iran’s government
budget deficit. In Proceedings of the 6th International Conference on Modern
Research’s in Management, Economics, and Accounting (pp. 1682-1695). Evaco
International.
Malik, K. (2015). Impact of foreign direct investment on economic growth of Pakistan.
American Journal of Business and Management, 4(4), 190-202.
https://doi.org/10.11634/216796061706624
114
Mallick, J. (2019). The effects of government investment shocks on private investment:
Empirical evidence from the developing economy. Indian Economic Review,
54(2), 291-316. https://doi.org/10.1007/s41775-019-00052-7
Manfredi, M. (2017). Foreign direct investments in African lands: The Chinese and EU
different approach. DPCE Online, 30(2), 193–213.
http://www.dpceonline.it/index.php/dpceonline/article/view/385
Mariana, P. (2016). Current risk of budget deficit. Eco-Economics Review, 2(2), 37-45.
http://eer.ueb.ro/2016_no2/2016_no2_papers03.pdf
Marka, B., & Prakash, Y. (2018). A study on foreign direct investments, role of federal
states, incentives, and arbitrations in India. i-Manager’s Journal on Management,
13(1), 55-66. https://doi.org/10.26634/jmgt.13.1.14117
Marshall, W. C., & Rochon, L. P. (2019). Public banking and pots-Keynesian economic
theory. International Journal of Political Economy, 48(10), 60-75.
https://doi.org/10,1080/08911916.2018.1550947
Maurya, R., & Singh, B. P. (2017). Nexus of economic growth and public expenditure in
India. Indian Journal of Economics and Development, 13(1), 165–170.
http://doi.org/10.5958/2322-0430.2017.00022.1
McCusker, K., & Gunayadin, S. (2015). Research using qualitative, quantitative, or
mixed methods and choice based on research. Perfusion, 20, 537-542.
https://doi.org/10.1177/0267659114559116
115
Miranda, M. R. (2018). Modern monetary theory and practice in Mexico. Revista Chilena
de Economía y Sociedad, 12, 26–39. https://rches.utem.cl/wp-
content/uploads/sites/8/2019/01/revista-CHES-vol12-n2-2018-Rojas.pdf
Muhammad, S. D., Zafar, S., Noman, M., & Arfeen, N. (2016). The nexuses between
budget deficit and price inflation in Pakistan: An ARDL bound testing approach.
Pakistan Journal of Commerce and Social Sciences, 10(3), 606-614.
https://www.econstor.eu/handle/10419/188270
Musa, M., & Jelilov, G. (2016). The impact of government expenditure on economic
growth in Nigeria. Sacha Journal of Policy and Strategic Studies, 15(2), 15-23.
https://www.researchgate.net/profile/muhammad_musa11/publication/304659717
_the_impact_of_government_expenditure_on_economic_growth_in_nigeria/links
/57765acb08aead7ba071c52c/the-impact-of-government-expenditure-on-
economic-growth-in-nigeria
Muzurura, J. (2016). Determinants of foreign direct investment (FDI) in Zimbabwe:
What factors matter? Research in Business and Economics Journal, 11(2016), 1–
19. https://mpra.ub.uni-muenchen.de/99873/1/mpra_paper_99873.pdf
Ncanywa, T., & Masoga, M. M. (2018). Can public debt stimulate public investment and
economic growth in South Africa? Cogent Economics & Finance, 6(1).
https://doi.org/10.1080/23322039.2018.1516483
Ndour, C. T. (2017). How does public deficit affect public investment in Senegal? World
Scientific News, 67(2), 102-112.
116
http://yadda.icm.edu.pl/yadda/element/bwmeta1.element.psjd-0edb6e60-cb71-
4688-9b52-ff2ade6688c5/c/WSN_67_2___2017__102-112.pdf
Nguyen, C. T., & Trinh, L. T. (2018). The impacts of public investment on private
investment and economic growth: Evidence from Vietnam. Journal of Asian
Business and Economic Studies, 25(1), 15-32. https://doi.org/10.1108/jabes-04-
2018-0003
Njoroge, S. M. (2016). Determinants of foreign direct investment growth in Kenya
(Doctoral dissertation, Jomo Kenyatta University of Agriculture and Technology).
http://hdl.handle.net/123456789/2114
Nicoloski, A., & Nedanovski, P. (2018). Implication of budget deficit on economic
growth: Case study of the Republic of Macedonia. Economic Development /
Ekonomiski Razvoj, 20(1/5), 171-185. http://www.jed.or.kr
Ntembe, A., Ajab, A. A., & Tawa, R. (2018). Analysis of public investment and growth
in Cameroon. Journal of Economics & Finance, 42(3), 591-614.
https://doi.org/10.1007/s12.197-017-9411-0
O’Brien, D. P. (2017). The classical economists revisited. Princeton University Press.
O’Connell, J. (2016). On Keynes on inflation and unemployment. European Journal of
the History of Economic Thought, 23(1), 82-101.
https://doi.org/10.1080/09672567.2013.824998
Obeng, S. K., & Sakyi, D. (2017). Macroeconomic determinants of interest rate spreads
in Ghana. African Journal of Economic and Management Studies, 8(1), 76-88.
https://doi.org/10.1108/ajems-12-2015-0143
117
Okafor, S. O., Maduka, O. D., Ike, A. N., Uzoechina, B. I., & Ohachosim, C. I. (2017).
Tax-budget deficit relationships: Fiscalists’ platform for deficit financing policy.
Business and Management Studies, 3(3), 53-68.
https://doi.org/10.11114/bms.v3i3.2531
Olaoye, O. O. (2019). External debt and private investment in Nigeria. BVIMSR’s
Journal of Management Research, 11(1), 19-28.
https://search.proquest.com/openview/3bf805df1b7d4ccec3184690d04468d7/1?p
q-origsite=gscholar&cbl=2042844
Onuoha, F. C., Okonkwo, I. C., Okoro, P., & Okere, K. (2018). The causal relationship
between foreign direct investment (FDI) and the macro-economy of selected west
African countries: Panel ARDL/Granger Causality Analysis. African Research
Review, 12(1), 140-163. https://doi.org/10.4314/afrrev.v12i1.15
Oprișan, O. (2019). Romania’s budget deficit between 2017-2018. Ovidius University
Annals, Series Economic Sciences, 19(2), 833-839. http://stec.univ-
ovidius.ro/html/anale/RO/wp-
content/uploads/2020/02/Full%20Vol.%20XIX%20Issue%202.pdf
Palley, T. I. (2015). Money, fiscal policy, and interest rates: A critique of Modern
Monetary Theory. Review of Political Economy, 27(1), 1-23.
https://doi.org/10.1080/09538259.2014.957466
Palinkas, L. A., Horwitz, S. M., Green, C. A., Wisdom, J. P., Duan, N., & Hoagwood, K.
(2015). Purposeful sampling for qualitative data collection and analysis in mixed
method implementation research. Administration and Policy in Mental Health and
118
Mental Health Services Research, 42, 533-544. https://doi.org/10.1007/s10488-
013-0528-y
Patton, M. Q. (2015). Qualitative research and methods: Integrating theory and practice.
Sage.
Paul, J., & Singh, G. (2017). The 45 years of foreign direct investment research:
Approaches, advances and analytical areas. The World Economy, 40(11), 2512-
2527. https://doi.org/10.1111/twec.12502
Pegkas, P. (2018). The effect of government debt and other determinants on economic
growth: The Greek experience. Economies, 6(1), 10.
https://doi.org/10.3390/economies6010010
Pellens, M., Peters, B., Hud, M., Rammer, C., & Licht, G. (2018). Public investment in
R&D in reaction to economic crises-a longitudinal study for OECD countries
(ZEW-Centre for European Economic Research Discussion Paper no. 18-005).
http://dx.doi.org/10.2139/ssrn.3122254
Pettifor, A. (2019). ‘Deficit financing’ or ‘Deficit-reduction financing? ‘Debates in
contemporary economics: Origins, confusions and clarity. Journal of King
Abdulaziz University: Islamic Economics, 32(1).
https://ssrn.com/abstract=3465613
Pham, A. K. (2017). Mainstream economics and the Austrian school: Toward
reunification. Erasmus Journal for Philosophy and Economics, 10(1), 41-63.
https://doi.org/10.23941/ejpe.v10i1.267
119
Polit, D. F., & Beck, C. T. (2012). Nursing research: Generating and assessing evidence
for nursing practice (9th ed.). Lippincott Williams & Wilkins.
Reed, M., Najarzadeh, R., & Sadati, S. Z. (2019). Analyzing the relationship between
budget deficit, current account deficit, and government debt sustainability.
Journal of WEI Business and Economics, 8(1), 20-31.
https://doi.org/10.36739/jweibe.2019.v8.i1.15
Sahin, B. E. (2019). Analysis of the relationship between inflation, budget deficit and
money supply in Turkey by ARDL approach: 1980-2017. Journal of Life
Economics, 6(3), 297-306. https://doi.org/10.15637/jlecon.6.018
Sajjad, I., Bilal, M., & Khan, D. M. A. (2018). Investigating the impact of external debt
on economic growth: A case study of Pakistan. Journal of Business and Tourism,
4(2), 53-63.
https://www.researchgate.net/profile/muhammad_azam_khan2/publication/33196
2637_investigating_the_impact_of_external_debt_on_economic_growth_a_case_
study_of_pakistan/links/5c951edb299bf11169408f14/investigating-the-impact-of-
external-debt-on-economic-growth-a-case-study-of-pakistan.pdf
Samuels, W. J., & Medema, S. G. (2019). Gardiner C. Mean’s institutional and post-
Keynesian economics: An interpretation and assessment. Routledge.
Samwel, M. (2016). Do budget deficit crowds out private investment: A case of
Tanzanian economy. International Journal of Business and Management, 11(6),
183-193. http://doi.org/10.5539/ijbm.v11n6p183
120
Sánchez-Juárez, I., & García-Almada, R. (2016). Public debt, public investment and
economic growth in Mexico. International Journal Financial Studies, 4(2), 6.
https://doi.org/10.3390/ijfs4020006
Saunders, M. N. K., Lewis, P., & Thornhill, A. (2015). Research methods for business
students (7th ed.). Pearson Education Unlimited.
Savage, J. (2019). Balanced budgets and American politics. Cornell University Press.
https://doi.org/10.1086/ahr/94.5.1511-a
Schumpeter, J. A. (2017). The nature and essence of economic theory. Routledge.
Schwartz, G. (2015). Making public investment more efficient. Washington, DC:
International Monetary Fund.
https://www.mof.go.jp/pri/research/seminar/fy2015/tff2015_s4_01.pdf
Seid, S. H. (2018). Global regulation of foreign direct investment. Routledge.
Shaw, J. A. (2017). Reflexivity and the “acting subject”. Conceptualizing the unit of
analysis in qualitative research. Qualitative Health research, 26(13), 1737-1744.
https://doi.org/10.1177/10497323166657813
Shuaib, I. M., Dania, E. N., Imaogene, I., & Pogoson, O. O. (2015). The impact of
Foreign Direct Investment (FDI) on the growth of the Nigerian economy.
International Journal of Research in Business Studies and Management, 2(3), 38-
55. https://www.ijrbsm.org/pdf/v2-i3/6.pdf
Smith, B. (1994). The philosophy of Austrian economics (review to D. Gordon). Review
of Austrian Economics, 7(2), 127-132.
121
https://www.researchgate.net/publication/226016159_The_philosophy_of_Austria
n_economics
Sredojević, D., Cvetanović, S., & Bošković, G. (2016). Technological changes in
economic growth theory: Neoclassical, endogenous, and evolutionary-institutional
approach. Economic Themes, 54(2), 177-194. https://doi.org/10.1515/ethemes-
2016-0009
Sriyalatha, M. A. K., & Torii, H. (2019). Impact of fiscal policy on economic growth: A
comparison between Singapore and Sri Lanka. Kelaniya Journal of Management,
8(1), 37-56.
https://kjm.sljol.info/articles/10.4038/kjm.v8i1.7559/galley/5895/download/
Stockhammer, E. (2017). Post-Keynesian economics. In L. Fischer, J. Hasell, J. C.
Proctor, D. Uwakwe, Z. W. Perkins, & C. Watson (Eds.), Rethinking economics:
An introduction to pluralist economics (pp. 6-18). Routledge.
Taber, K. S. (2018). The use of Cronbach’s alpha when developing and reporting
research instruments in science education. Research in Science Education, 48(6),
1273-1296. https://doi.org/10.1007/s11165-017-9653-z.
Tang, B., & Bethencourt, C. (2017). Asymmetric unemployment-output tradeoff in the
Eurozone. Journal of Policy Modeling, 39(3), 461-481.
https://doi.org/10.1016/j.jpolmod.2017.01.003
Tanzi, V., & Schuknecht, L. (1997). Reconsidering the fiscal role of government: The
international perspective. The American Economic Review, 87(2), 164-168.
https://www.jstor.org/stable/2950906?seq=1
122
Thaker, H. M. T., Ee, T. S., & Narayanan, S. (2017). Foreign direct investments (FDI) in
Malaysia: Determinants and policy issues. Skyline Business Journal, 13(1), 1-14.
Tily, G. (2016). Keynes’s general theory, the rate of interest and Keynesian’ economics.
Springer.
Topal, M. H. (2016). The effect of country risk on foreign direct investment: A dynamic
panel data analysis for developing countries. Journal of Economics Library, 3(1),
141-155. http://dx.doi.org/10.1453/jel.v3i1.771
Topalli, N., & Dogan, İ. (2016). The structure and sustainability of current account
deficit: Turkish evidence from regime switching. Journal of International Trade
& Economic Development, 25(4), 570-589.
https://doi.org/10.1080/09638199.2015.1090472
Trang, N. T. N., Tho, T. N., & Hong, D. T. T. (2017). The impact of oil price on the
growth, inflation, unemployment and budget deficit of Vietnam. International
Journal of Energy Economics and Policy, 7(3), 42-49.
https://dergipark.org.tr/en/pub/ijeeep/issue/31922/351222
Truger, A. (2016). The golden rule of public investment: A necessary and sufficient
reform of the EU fiscal framework? (IMK Working Paper No. 168).
https://www.econstor.eu/handle/10419/144925
Tyrer, S., & Heyman, B. (2016). Sampling in epidemiological research: Issues, hazards,
and pitfalls. Psychological Bulletin, 40, 57-60.
https://doi.org/10.1192/pb.bp.114.050203
123
United Nations Conference on Trade and Development. (2016). Economic development
in Africa report.
https://unctad.org/en/pages/PublicationWebflyer.aspx?publicationid=1567#:~:text
=The%20Economic%20Development%20in%20Africa,development%20alternati
ves%20and%20overall%20debt
United Nations Conference on Trade and Development. (2018). World investment report
2018. https://doi.org/10.18356/ebb78749-en
United Nations Economic Commission for Africa. (2019). Economic report on Africa
2019. https://www.uneca.org/publications/economic-report-africa-2019
Uronu Lameck, W. (2013). Sampling design, validity, and reliability in general social
survey. International Journal of Academic Research in Business & Social
Sciences, 3(7), 212-218. https://doi.org/10.6007/IJARBSS/v3-i7/27
U.S. Department of Health & Human Services. (1979). The Belmont report: Ethical
principles and guidelines for protection of human subjects of research.
https://www.hhs.gov/
Van, V. B., & Sudhipongpracha, T. (2015). Exploring government budget deficit and
economic growth: Evidence from Vietnam’s economic miracle. Asian Affairs: An
American Review, 42(3), 127-148.
https://doi.org/10.1080/00927678.2015.1048629
Vlados, C. (2019). The classical and neoclassical theoretical traditions and the
evolutionary study of the dynamics of globalization. Journal of Economics and
124
Political Economy, 6(3), 257-280.
https://papers.ssrn.com/sol3/papers.cfm?abstract_id=3475555
von Hauff M. (2020). Progress in economic thought: Neoclassical economics versus
Sustainable Economics. In: Omran A., Schwarz-Herion O. (eds) Sustaining our
Environment for Better Future. https://doi.org/10.1007/978-981-13-7158-5_1
Vovchenko, N. G., Ivanova, O. B., Kostoglodova, E. D., & Romanova, T. F. (2015).
Institutional aspects of provision of sustainability of budget system of the Russian
Federation. Asian Social Science, 11(20), 235-243.
https://doi.org/10.5539/ass.v11n20p235
Wall, R., Grafakos, S., Gianoli, A., & Stavropoulos, S. (2017). Which policy instruments
attract foreign direct investments in renewable energy? Climate Policy, 19(1), 59-
72. https://doi.org/10.1080/14693062.2018.1467826
Walsh, C. E. (2017). Monetary theory and policy. MIT Press.
Wangui, A. M. (2019). External debt and economic growth: Lessons for Africa from
South East Asia (Doctoral dissertation, University of Nairobi).
http://erepository.uonbi.ac.ke/bitstream/handle/11295/108934/EXTERNAL%20A
LEX%20PROJECT%20final.pdf?sequence=1&isAllowed=y
Watson, R. (2015). Quantitative research. Nursing Standard, 29(31), 44-52.
https://doi.org/10.7748/ns.29.31.44.e868
Woja, K. (2017). Budget deficit and public debt in Poland in 2012-2015 [Bachelor thesis,
Warsaw University of Technology].
125
http://repo.bg.pw.edu.pl/index.php/en/r#/info/bachelor/WUT1f16c283e3b14ddc8
3efeb6643b87c5f/
World Bank. (2018). Annual report. http://www.worldbank.org
World Bank. (2019). Annual report. http://www.worldbank.org
Wu, G. L., Feng, Q., & Li, P. (2015). Does local governments’ budget deficit push up
housing prices in China? China Economic Review, 35, 183-196.
https://doi.org/10.1016/j.chieco.2020.101538
Yao, S., Wang, P., Zhang, J., & Ou, J. (2016). Dynamic relationship between China’s
inward and outward foreign direct investments. China Economic Review, 40, 54-
70. https://doi.org/10.1016/j.chieco.2016.05.005
Yetunde, S. H., & Olasunkanmi, O. I. (2016). Does fiscal deficit granger cause
impulsiveness in inflation rate in Nigeria? Acta Universitatis Danubius.
Œconomica, 12(4), 208–216. https://www.ceeol.com/search/article-
detail?id=511800
Yilmaz, G. (2018). Composition of public investment and economic growth: Evidence
from Turkish provinces, 1975-2001. Public Sector Economics, 42(2), 187-214.
https://doi.org/10.3326/pse.42.2.10
Yin, R. K. (2018). Case study research and applications: Design and methods (6th ed.).
Sage.
Yovo, K. (2017). Public expenditures, private investment and economic growth in Togo.
Theoretical Economics Letters, 7, 193-209.
https://doi.org/10.4236/tel.2017.72017
126
Zainodin, H. J., & Yap, S. J. (2013). Overcoming multicollinearity in multiple regression
using correlation coefficient. In Proceedings of the International Conference on
Mathematical Sciences and Statistics 2013. AIP Conference Proceedings, 1557,
416-419. https://doi.org/10.1063/1.4823947
Zellmer-Bruhn, M., Caligiuri, P., & Thomas, D. C. (2016). From the editors:
Experimental designs in international business research. Journal of International
Business Studies, 47, 399-407. https://doi.org/10.1057/jibs.2016.12
Zengin, S., Yüksel, S., & Kartal, M. T. (2018). Understanding the factors that affect
foreign direct investment in Turkey by using MARS method. Finansal
Araştırmalar ve Çalışmalar Dergisi, 10(18), 1309-1123.
https://doi.org/10.14784/marufacd.460693
Zergawu, Y. Z., Walle, Y. M., & Giménez Gómez, J. M. (2018). The joint impact of
infrastructure and institutions on economic growth (CREIP-working paper).
https://www.recercat.cat/bitstream/handle/2072/332584/201822.pdf?sequence=1
Zhang, J., Qu, Y., Zhang, Y., Li, X., & Miao, X. (2019). Effects of FDI on the efficiency
of government expenditure on environmental protection under fiscal
decentralization: A spatial econometric analysis for China. International Journal
of Environmental Research and Public Health, 16(14), 2496.
https://doi.org/10.3390/ijerph16142496
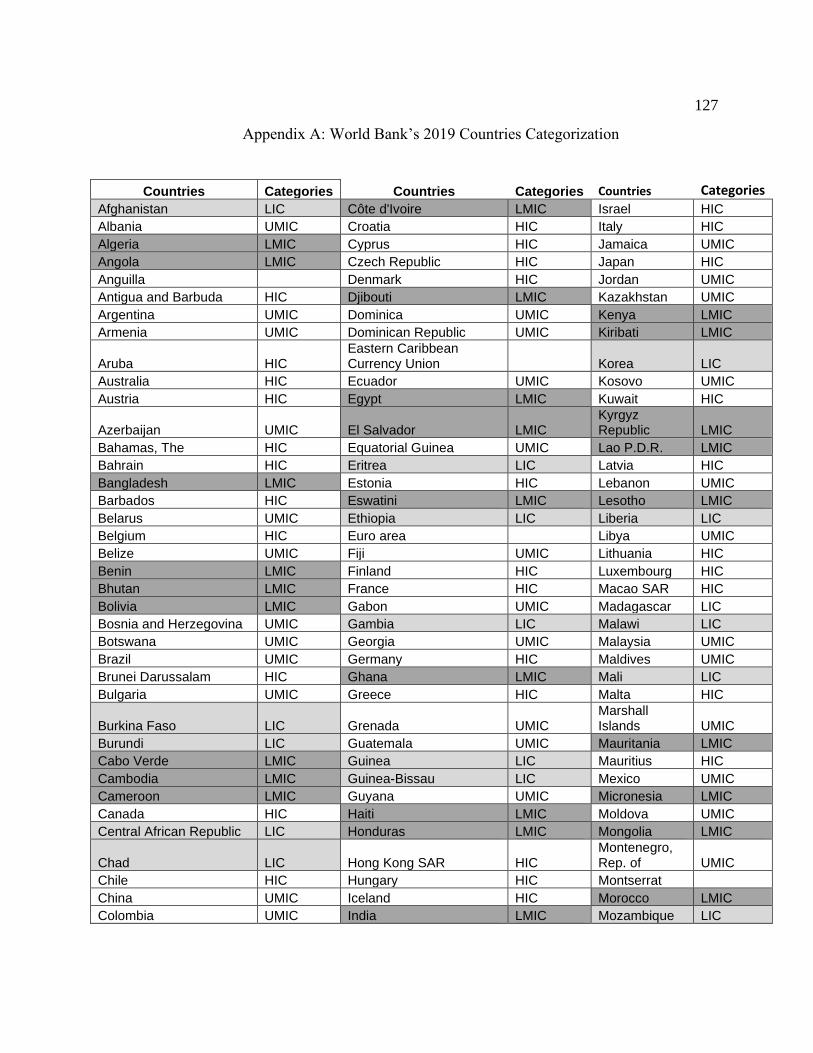
127
Appendix A: World Bank’s 2019 Countries Categorization
Countries Categories Countries Categories Countries Categories
Afghanistan LIC Côte d'Ivoire LMIC Israel HIC
Albania UMIC Croatia HIC Italy HIC
Algeria LMIC Cyprus HIC Jamaica UMIC
Angola LMIC Czech Republic HIC Japan HIC
Anguilla Denmark HIC Jordan UMIC
Antigua and Barbuda HIC Djibouti LMIC Kazakhstan UMIC
Argentina UMIC Dominica UMIC Kenya LMIC
Armenia UMIC Dominican Republic UMIC Kiribati LMIC
Aruba HIC Eastern Caribbean Currency Union Korea LIC
Australia HIC Ecuador UMIC Kosovo UMIC
Austria HIC Egypt LMIC Kuwait HIC
Azerbaijan UMIC El Salvador LMIC Kyrgyz Republic LMIC
Bahamas, The HIC Equatorial Guinea UMIC Lao P.D.R. LMIC
Bahrain HIC Eritrea LIC Latvia HIC
Bangladesh LMIC Estonia HIC Lebanon UMIC
Barbados HIC Eswatini LMIC Lesotho LMIC
Belarus UMIC Ethiopia LIC Liberia LIC
Belgium HIC Euro area Libya UMIC
Belize UMIC Fiji UMIC Lithuania HIC
Benin LMIC Finland HIC Luxembourg HIC
Bhutan LMIC France HIC Macao SAR HIC
Bolivia LMIC Gabon UMIC Madagascar LIC
Bosnia and Herzegovina UMIC Gambia LIC Malawi LIC
Botswana UMIC Georgia UMIC Malaysia UMIC
Brazil UMIC Germany HIC Maldives UMIC
Brunei Darussalam HIC Ghana LMIC Mali LIC
Bulgaria UMIC Greece HIC Malta HIC
Burkina Faso LIC Grenada UMIC Marshall Islands UMIC
Burundi LIC Guatemala UMIC Mauritania LMIC
Cabo Verde LMIC Guinea LIC Mauritius HIC
Cambodia LMIC Guinea-Bissau LIC Mexico UMIC
Cameroon LMIC Guyana UMIC Micronesia LMIC
Canada HIC Haiti LMIC Moldova UMIC
Central African Republic LIC Honduras LMIC Mongolia LMIC
Chad LIC Hong Kong SAR HIC Montenegro, Rep. of UMIC
Chile HIC Hungary HIC Montserrat
China UMIC Iceland HIC Morocco LMIC
Colombia UMIC India LMIC Mozambique LIC
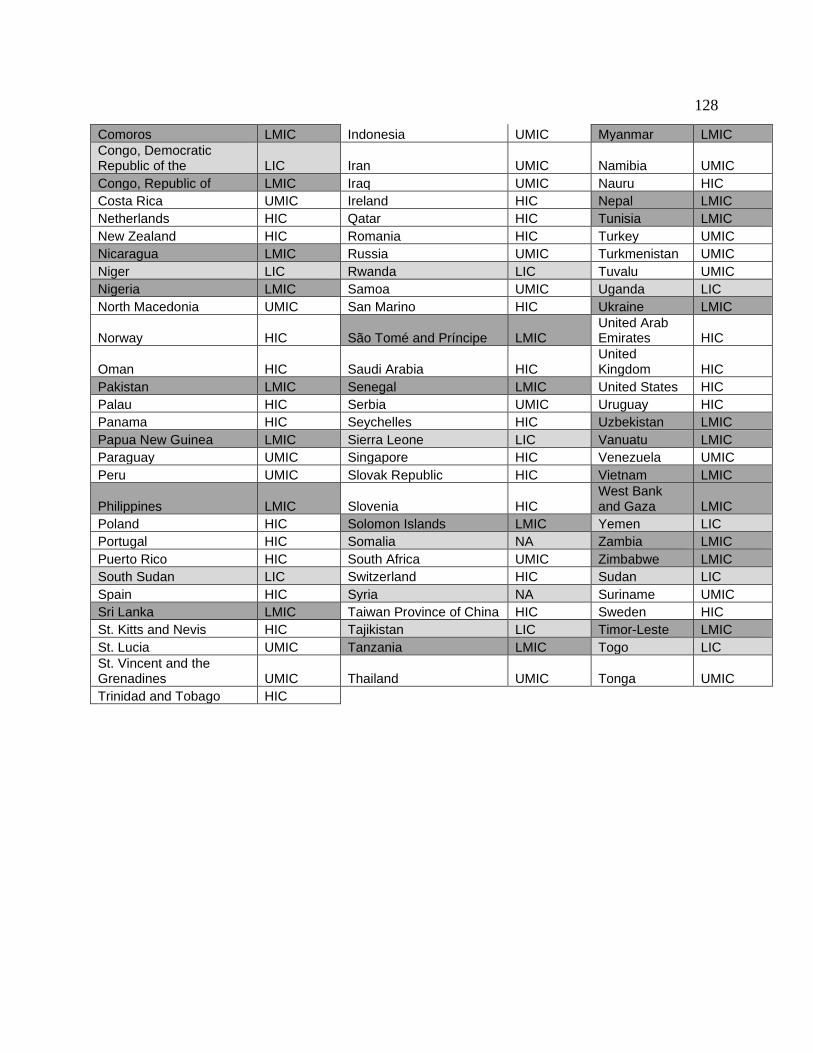
128
Comoros LMIC Indonesia UMIC Myanmar LMIC
Congo, Democratic Republic of the LIC Iran UMIC Namibia UMIC
Congo, Republic of LMIC Iraq UMIC Nauru HIC
Costa Rica UMIC Ireland HIC Nepal LMIC
Netherlands HIC Qatar HIC Tunisia LMIC
New Zealand HIC Romania HIC Turkey UMIC
Nicaragua LMIC Russia UMIC Turkmenistan UMIC
Niger LIC Rwanda LIC Tuvalu UMIC
Nigeria LMIC Samoa UMIC Uganda LIC
North Macedonia UMIC San Marino HIC Ukraine LMIC
Norway HIC São Tomé and Príncipe LMIC United Arab Emirates HIC
Oman HIC Saudi Arabia HIC United Kingdom HIC
Pakistan LMIC Senegal LMIC United States HIC
Palau HIC Serbia UMIC Uruguay HIC
Panama HIC Seychelles HIC Uzbekistan LMIC
Papua New Guinea LMIC Sierra Leone LIC Vanuatu LMIC
Paraguay UMIC Singapore HIC Venezuela UMIC
Peru UMIC Slovak Republic HIC Vietnam LMIC
Philippines LMIC Slovenia HIC West Bank and Gaza LMIC
Poland HIC Solomon Islands LMIC Yemen LIC
Portugal HIC Somalia NA Zambia LMIC
Puerto Rico HIC South Africa UMIC Zimbabwe LMIC
South Sudan LIC Switzerland HIC Sudan LIC
Spain HIC Syria NA Suriname UMIC
Sri Lanka LMIC Taiwan Province of China HIC Sweden HIC
St. Kitts and Nevis HIC Tajikistan LIC Timor-Leste LMIC
St. Lucia UMIC Tanzania LMIC Togo LIC
St. Vincent and the Grenadines UMIC Thailand UMIC Tonga UMIC
Trinidad and Tobago HIC
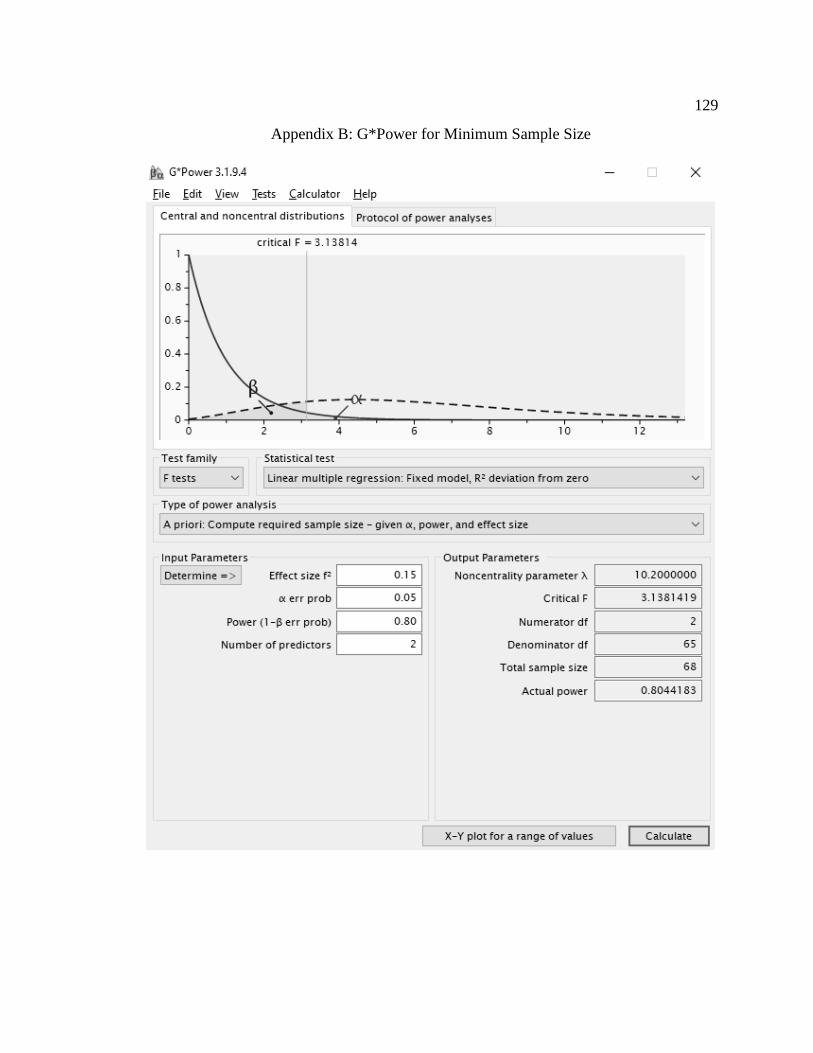
129
Appendix B: G*Power for Minimum Sample Size
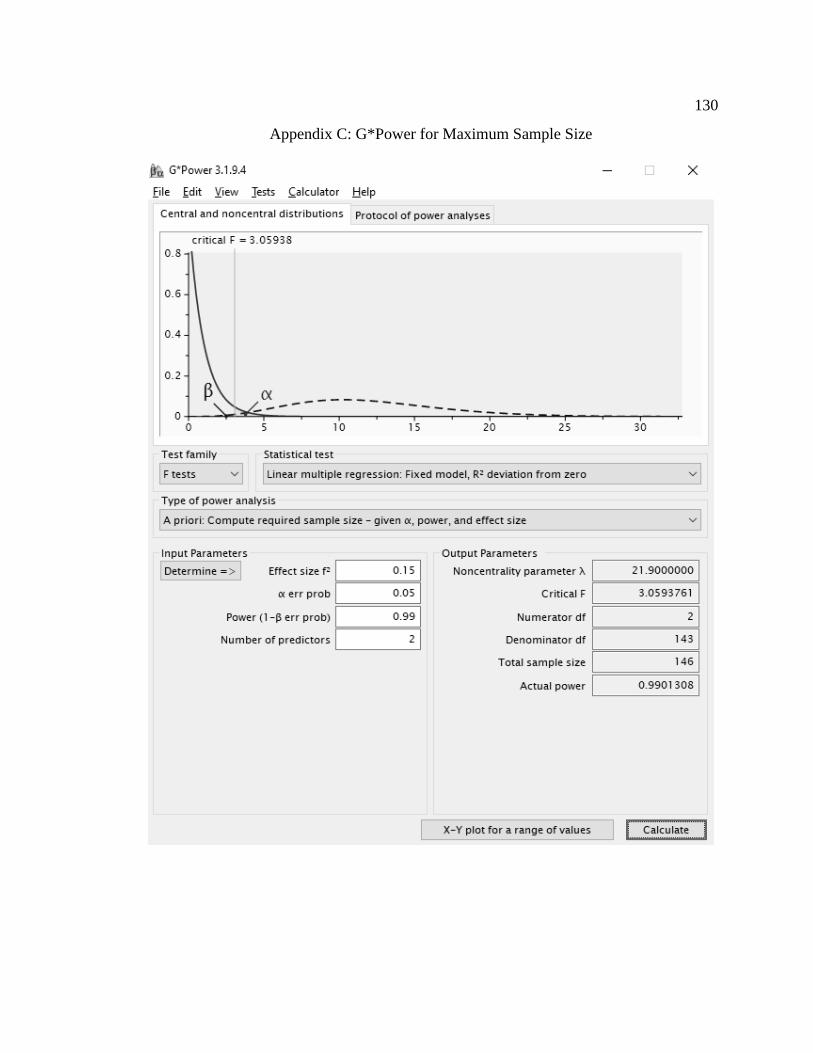
130
Appendix C: G*Power for Maximum Sample Size


