Embed Size (px)
Citation preview
1 23
Tropical Plant BiologyAn International Journal devoted tooriginal research in tropical plants ISSN 1935-9756 Tropical Plant Biol.DOI 10.1007/s12042-012-9095-8
QTL Analysis for Root Protein in aBackcross Family of Cassava Derived fromManihot esculenta ssp flabellifolia
O. Akinbo, M. T. Labuschagne, J. Marín,C. Ospina, L. Santos, E. Barrera,J. Gutiérrez, F. Ewa, E. Okogbenin &M. Fregene

1 23
Your article is protected by copyright and
all rights are held exclusively by Springer
Science+Business Media, LLC. This e-offprint
is for personal use only and shall not be self-
archived in electronic repositories. If you
wish to self-archive your work, please use the
accepted author’s version for posting to your
own website or your institution’s repository.
You may further deposit the accepted author’s
version on a funder’s repository at a funder’s
request, provided it is not made publicly
available until 12 months after publication.

QTL Analysis for Root Protein in a Backcross Familyof Cassava Derived from Manihot esculenta ssp flabellifolia
O. Akinbo & M. T. Labuschagne & J. Marín & C. Ospina &
L. Santos & E. Barrera & J. Gutiérrez & F. Ewa &
E. Okogbenin & M. Fregene
Received: 25 May 2011 /Accepted: 26 January 2012# Springer Science+Business Media, LLC 2012
Abstract Root protein content of elite cassava is very low,largely due to breeder’s selection for other agronomic traitsmainly fresh weight yield and disease resistance. Increasedprotein content in the root of cassava will improve itsusefulness as a more complete food source in the developingworld. An inter-specific F1 hybrid CW 198 - 11 was earlierdeveloped at International Center for Tropical Agriculture(CIAT), Cali, Colombia by genetic crosses of OW 230 - 1(FLA 441 - 5) and CW 30–65 (an inter-specific hybridbetween an improved cassava variety SG 427 - 87 and anaccession of Manihot esculenta ssp flabellifolia (MESC-FLAX – 80)). The inter-specific cross was ‘backcrossed’,in the sense of another cross to cassava (MTAI – 8) togenerate a B1P2 family with 225 progenies in which majorquantitative trait loci (QTL) for root protein in the backcrosspopulation of cassava were identified. A linkage map fromthe female parent of the backcross population was used for
QTL detection. A total of three QTL (protg.7, protg.13 andprotg.23) controlling protein were identified in three differ-ent environments. One QTL was expressed across all threeenvironments. These results demonstrated high broad senseheritability of 61.6% for protein over 2 years, in two differ-ent locations. The individual effects of alleles at these QTLexplained from 15% to 25% of the phenotypic variance. Theconsistency of QTL controlling protein across environmentsreveals their potential for use in marker-assisted recurrentselection.
Keywords Cassava . Backcross . Protein . Genetic map .
QTL (quantitative trait loci)
Introduction
Cassava (Manihot esculenta Crantz.) is a staple for morethan 800 million of the world’s poorest people and is pro-duced primarily by smallholder farmers. Cassava has poten-tial to reduce hunger and malnutrition in millions of peoplein sub-Saharan Africa (Burns et al. 2010). Despite achieve-ments in cassava improvement, many challenges remainincluding the low protein content of the storage roots, pres-ence of toxic cyanogenic glucosides, susceptibility to bioticstresses, and the need to tailor the cassava crop to themyriads of agro-ecosystems under which it is produced(Fregene et al. 2007).
Low protein content in the roots of cassava has been amajor factor for the unfavorable image of cassava whencompared with other staples like potato, rice, soybean andcowpea. Cassava root protein content ranges between 2%and 3% (dry weight basis) (Ceballos et al. 2006). In spite oflow protein content, the quality of this protein is fairly goodin having a balanced proportion of amino acids except for
Communicated by: Paul Moore
O. Akinbo : J. Marín :C. Ospina : L. Santos : E. Barrera :J. Gutiérrez : E. Okogbenin :M. FregeneCentro Internacional de Agricultura Tropical (CIAT),Km 17 Recta Cali - Palmira,Cali, Colombia
O. Akinbo :M. T. LabuschagneDepartment of Plant Sciences, University of the Free State,P.O. Box 339, Bloemfontein, South Africa
O. Akinbo (*) : F. Ewa : E. OkogbeninNational Root Crops Research Institute,Umudike PMB 7006 Abia State, Nigeriae-mail: [email protected]
M. FregeneDonald Danforth Plant Science Center,975 North Warson Road,St. Louis, MO 63132, USA
Tropical Plant Biol.DOI 10.1007/s12042-012-9095-8
Author's personal copy

the two amino acids methionine and lysine being present insmall amounts (Ceballos et al. 2006). Concentration of totalfree amino acids (free protein amino acids plus free non-protein amino acids) was higher in cassava leaves than in theroots (Diasolua Ngudi et al. 2002). If varieties with higherquantities of protein and free amino acids can be developed,the nutritional level of cassava as a food would be enhanced(Diasolua Ngudi et al. 2003).
Genetic mapping in allogamous crops is complicated bythe absence of complete homozygosity in the parents and
subsequent mixture of genotypic classes in the progeny(Williams 1998). The heterogeneity of mating types makesQTL detection more complex and less efficient in outcross-ing heterozygous plants compared to inbreds (Śliwka et al.2008). Several efforts have been made in other crops toidentify the QTL responsible for protein content, for exam-ple in crops like maize (Holding et al. 2008), wheat (Chee etal. 2001), and soybean (Panthee et al. 2005).
The use of molecular markers to introgress a target regionof the genome saves time compared to traditional
OW 230 - 3 CW 30 - 65 X
High Protein Content and Disease resistance
High Dry Matter and Disease resistance
CW 198 - 11 X MTAI - 8
SG 427 – 87 ( ) MESCFLAX – 80 ( )X
High dry matter Disease resistance
MCOL 1684 X Rayong 1
Rayong 60 (op)
High Dry Matter, Good Tuber Formation
B1P2
a
b
Fig. 1 Pedigree of the plantingmaterials used for the B1P2family. a 0 introgression ofhigh protein content and diseaseresistance to F1 progenies;b 0 backcrossing of the F1 intocultivated cassava; SG 427 – 87X MESCFLAX – 80 0 parentalpedigree of CW 30 – 65 (maleparent); OW 230 – 3 0 M.esculenta ssp flabellifolia highprotein gene source; MCOL1684 X Rayong 1 0 parentalpedigree of Rayong 60; CW198 – 11 0 interspecific F1high protein source;MTAI – 8 0 cultivatedcassava
Tropical Plant Biol.
Author's personal copy

backcrossing strategies (Frisch et al. 1999). It has beenshown that tremendous genetic potential locked up in wildrelatives can be made available in several crops throughadvanced backcross quantitative traits loci mappingschemes (Blair et al. 2006). Wassom et al. (2008) in identi-fied genomic regions controlling kernel oil, protein, andstarch concentration in BC1-derived S1 lines of maize. Theseauthors detected QTLs that explained 46.9, 45.2, 44.3, and17.7% of phenotypic variance for oil, protein, starch, andmass, respectively by composite interval mapping and17.5%, 22.9%, 40.1%, and 28.7% for oil, protein, starch,and yield, respectively, in top cross hybrids.
Wild Manihot species were examined for storage rootformation and root protein content. A wild accession of M.esculenta ssp flabellifolia collected in Brazil was found tohave a protein content of between 10% and 18% (dry weightbasis) in storage roots (Fregene et al. 2007). Manihot escu-lenta ssp flabellifolia was found to have high protein contentfor an interspecific hybrid suitable for use in backcrossingpopulation. The objectives of this study were to identifyQTL controlling protein content in cassava roots and todetermine the effects of each QTL in a backcrosspopulation.
Materials and Methods
Plant Material
Choice of Parental Lines
A number of expeditions have been carried out by CentroInternacional de Agricultura Tropical (CIAT), to collectseeds of M. esculenta ssp flabellifolia, M. esculenta sspperuviana, and M. tristis (Bonierbale et al. 1995; Roa etal. 1997). These collections were from the same populationsused by Olsen and Schaal (1999) in their phylogeographicstudy of the origin of cassava. In May 2000, more than 2000of these seeds were germinated in seedling nurseries andevaluated for crude protein, dry matter content, crude fiber,ash, amylose and storage root production (data not shown).Controlled pollinations were performed following thestandard procedure described by Kawano (1980) be-tween selected accessions of M. esculenta ssp flabelli-folia and four of the current elite parents of the cassavagene pools for the development of F1 populations (datanot shown) adapted to the three major agro-ecologieswhere cassava is grown.
Development of a Mapping Population
The mapping population for this study was a BC1 (B1P2)family consisting of 225 genotypes as described by Akinboet al. (2011). The male parent (MTAI-8) is a successful eliteThailand cultivar with high dry matter content, good tuberformation, and cream colored roots. The female parent usedto generate the B1P2 mapping population was an inter-specific F1 hybrid CW 198-11. Its selection was based onits high root protein content, high dry matter content, goodtuber formation, and resistance to whitefly at the trial loca-tion of CIAT, headquarters, Palmira (Fig. 1). Embryo cultureof mature seed was used to enhance seed germination and to
Table 1 Meteorological data at Palmira and Quilichao in 2006 and2007
Climatic factors Palmira Quilichao
2006 2007 06 2007
Precipitation (mm) 104.5 82.85 – 171.42
Evaporation (mm) 135.73 135.08 – 117.35
Radiation (MJ m−2) 17.68 16.86 – 14.87
Maximum temperature (°C) 30.14 30.23 – 28.90
Minimum temperature (°C) 19.32 18.94 – 18.51
Mean relative humidity (%) 76.79 76.72 – 79.69
Mean wind velocity (m/sec.) 56.58 58.96 – 30.62
Table 2 Percentage polymorphism found with respect to CW 198-11, MTAI-8 and four selected B1P2 progenies with the 817 microsatellitemarkers at the CIAT cassava genetics laboratory
Markers Total (%) % Polymorphism detected
PolyMa MonoMb NoLc Psized AnnTe
SSRYf 41.98 49.20 17.75 33.05 100–500 45.0–62.5
(NS)SSRYg 36.23 39.52 13.17 47.29 100–579 40.0–60.0
(ESTs)SSRYh 21.78 38.76 14.60 46.62 100–500 52.0–55.0
∑/MEAN 100.00 43.45 15.42 41.12
a Polymorphic markers (%); bMonomorphic markers (%); c No amplification (%); d Product size; e Annealing Temperature (°C); f Simple sequencerepeat; g Non-survivors simple sequence repeat; h Expressed sequence tag simple sequence repeat.
Tropical Plant Biol.
Author's personal copy

produce in vitro plantlets. The population and the parents weremaintained by in vitro propagation (Akinbo et al. 2010).
Field Experiments
The in vitro plants were transferred to the screen house in2005, and after 60 days planted in the field at CorporacionColombiana de Investigacion Agropecuaria (CORPOICA),Palmira, Colombia. At 10 months after planting (MAP),matured stem cuttings from the harvested plants were usedto establish a preliminary yield trial experiment made up of225 genotypes, in a randomized complete block design withthree replicates of 12 blocks, eight plants per row. Fieldtrials were conducted in Palmira in Valle del Cauca (eleva-tion 965 m, 3°49′N, 76°36′W) in 2006, and repeated in 2007at Palmira and at Santander de Quilichao in Cauca (eleva-tion 990 m, 3°30′N, 76°36′W), both located in the midaltitude tropics of Colombia. Both sites have bimodal rain-fall, although there are yearly variations, with peaks usuallybetween March–June and between October–December. Thesoil in Palmira is a fertile alluvial clay loam, distinct fromthe soil type in Quilichao, which is sandy loam, less fertileand acidic. The planting was done in July 2006 for the firstyear in Palmira, and May and June 2007 in the second yearin Palmira and Quilichao respectively and harvested May2007 for the first year and March 2008 in the second year.The plants were not fertilized, but weeded when necessary.Meteorological data at the locations during experimentationare presented in Table 1.
Root Protein Evaluation
Only plants of the inside rows, to avoid border effects,within each plot were harvested for data collection and rootanalysis. The samples from each replication were analyzedseparately. Root protein analyses were done using two rootsper plant. The selected roots were peeled and washed. Aslice was taken from the proximal, central, and distal sec-tions of each root. Samples from roots of all plants of eachgenotype were mixed and chopped into small pieces.Resulting chips were mixed well to obtain a uniform sam-ple. A 100 g sample was taken and dried in an oven withforced ventilation at 60 C for 24 h. Dried samples wereground in a mill with a stainless steel grinding tool. Allsamples were analyzed at the plant tissue analytical labora-tory at CIAT. Nitrogen determination was based on a mod-ification of the Kjeldahl method (Skalar 1995). Rootsamples were digested with a mixture of sulphuric acid, sele-nium and salicylic acid. The salicylic acid forms a compoundwith the nitrates present to prevent loss of nitrate nitrogen.Digestion of the samples was initiated with hydrogen peroxidewhich is oxidized. After decomposition of the excess H2O2,the digestion was completed with concentrated sulphuric acid
at elevated temperature (330°C) using selenium as a catalyst(Novozamsky et al. 1983; Walinga et al. 1989). Nitrogen wasquantified colorimetrically on a segmented flow analyz-er. In the coloring process, salicylate, nitroprusside (cat-alyst) and active chlorine were added to form a greencolored complex with the ammonium ion. Light absorp-tion was measured at 660 nm (Krom 1980; Searle1984). Hock-Hin and Van-Den (1996) reported the con-version factor to estimate protein contents based on Nconcentrations in cassava roots should range between4.75 and 5.87. An average of 5.31 was the standardbeing established and used for cassava roots in CIAT.
Dry matter content (DMC) assessment was done by peel-ing the fresh tubers from seven plants, mixed thoroughly forhomogeneity using a sub sample from the combined tubers.
Table 3 Linkage group size, number of markers, and the averagemarker interval per linkage group of a cassava backcross (B1P2)linkage map
Linkagegroup
Size (cM) No. ofmarkers
Average markerInterval (cM)
1 44.77 3 14.92
2 32.01 2 32.01
3 7.39 2 7.39
4 80.00 6 13.33
5 43.84 4 10.96
6 10.90 2 10.90
7 62.61 6 10.43
8 29.45 2 29.45
9 23.78 3 7.92
10 63.00 7 9.00
11 51.05 7 7.29
12 83.01 7 11.85
13 81.86 5 16.37
14 28.84 4 7.21
15 16.98 2 16.98
16 27.27 2 27.27
17 20.92 4 5.23
18 20.21 2 20.21
19 119.45 6 19.91
20 19.71 2 19.71
21 64.67 4 16.17
22 25.23 2 25.23
23 109.91 6 18.31
24 13.30 3 4.43
25 63.58 4 15.89
26 15.40 2 15.40
27 30.08 2 30.08
28 33.46 2 33.46
29 26.87 2 26.87
∑/mean 1249.55 105 16.69
Tropical Plant Biol.
Author's personal copy

The samples were oven dried at 60°C for 48 h after which theweight difference between the fresh weight and dry weightwas measured and the percentage dry matter was calculatedusing the formula:
% DMC ¼ Weight of the oven dried sample
Weight of the fresh sample� 100
The dry root yield was calculated as:%DMC x fresh rootyield.
Data Analysis
Frequency distribution of the mean protein content of back-cross population data were examined with Sigmaplot (10.0).Analyses of variance (ANOVA) of yield and protein datawere performed using general linear model procedure in theSAS software (SAS Institute Inc. 2003). A box plot of theresiduals was generated using the SAS univariate procedure.Broad sense heritability was estimated using Agrobase(2000).
Simple Sequent Repeat (SSR) Analysis
Total genomic DNA was isolated from the young leaves ofthe parents and the four randomly picked genotypes (B1P2-1, B1P2-111, B1P2-220, B1P2-322) of the B1P2 family usinga DNA miniprep extraction protocol based on a modifiedDellaporta extraction procedure (Dellarporta et al. 1983).
A total of 817 SSR markers for cassava at CIATwere thesource of markers for screening the parents and the selectedfour backcross individuals. These markers include thosedeveloped for cassava by Mba et al. (2001). Only poly-morphic markers were screened on the entire backcrosspopulation of 225 genotypes with the parents CW 198-11and MTAI-8. The female parent (CW 198-11) was loadedfirst onto the Polyacrylamide Gel Electrophoresis (PAGE)followed by male parent (MTAI-8) and subsequently theprogenies (B1P2-1 to B1P2-327). Amplification reactionswere carried out as described in Akinbo (2008). After PCRamplification, 15 μl of PCR product was mixed with 10 μlof 50% loading dye (formamide: 98% (v/v). The mixture wasdenatured at 94°C for 4 min, and 10 μl was loaded on a 4%
Fig. 2 A genetic linkage map of cassava backcross based on a B1P2 family and SSR markers
Tropical Plant Biol.
Author's personal copy

PAGE gel. The samples were resolved by electrophoresis in1X TBE at 70 W for 30–60 min (depending on the weight ofthe marker), using a BioRad sequencing gel rig (BIORAD,California, USA). DNA was visualized by silver stainingaccording to the manufacturer’s guide (Promega, Madison,USA).
Map Construction and Data Analysis
SSR marker data was used to construct a BC1 framework mapusing the single point genetic linkage analysis computer pack-age MapDisto 1.7.0 (http://mapdisto.free.fr). The group com-mand, with log10 of odds ratio (LOD) threshold of 4.0 and arecombination fraction of 0.30 was used to assign SSRmarkers to linkage groups. Map units, in centiMorgans,(cM) were derived using the Kosambi function (Kosambi1944). Maximum likelihood orders of markers were verifiedby the “ripple” function, and markers were said to belong tothe same framework map if the LOD value as calculated bythe ripple command was greater or equal to 2.5.
QTL Mapping
QTL mapping was based on 105 markers from the geneticmap of the B1P2 population. Each of the markers was tested
for normal Mendelian segregation using chi-square testswith a significance level of 0.05. Adjusted means of proteincontent were employed in single marker analysis for QTLmapping of the B1P2 segregating population using the soft-ware package MapDisto (Lorieux 2007). QTL analysis wasdone for each environment by using the average of the threereplications. Simple interval mapping and composite inter-val mapping was also conducted using the computer pack-age Window QTL Cartographer version 2.5 (Wang et al.2010). The cassava genome was scanned for the presence ofa QTL at 2.0 cM intervals. A LOD score of 2.5 was chosenas the minimum to declare the presence of a QTL (Rector etal. 1998). Threshold values for significance at p00.05 wereestimated from 1,000 permutation of the data for the trait(Churchill and Doerge 1994). The resulting R2 representsthe proportion of the phenotypic variance explained.
Results
Microsatellite Marker Analysis
Of the 817 microsatellite markers screened, 43.45% werepolymorphic, 15.42% were monomorphic and the remain-ing 41.12% showed no amplification in the tested material(Table 2).
A total of 105 polymorphic microsatellite markers segre-gating as single-dose markers were chosen for the linkageanalysis based on consistency of allelic pattern. The segre-gation of markers which are heterozygous in both parentswith a shared allele, were used to identify analogous linkagegroups drawn based on independent segregation of markersin female and male gametes.
Genetic Linkage Map Construction
Table 3 provides a summary of microsatellite marker distri-bution on different linkage groups, showing the size, num-ber of markers and the average marker interval of eachlinkage group. The number of linkage groups in this map(29) exceeded the haploid number of chromosomes forcassava (n018), indicating that the map is far from beingsaturated.
One hundred and five SSR markers were employed in thelinkage analysis. These markers could be assigned to 29linkage groups, each containing two to seven markers.Linkage group length varied from 7.39 cM to 119.45 cM(Fig. 2). The linkage map of the B1P2 population spanned atotal of genetic distance of 1249.55 cM, with 46 markersremaining unlinked. The average markers distance was16.69 cM, with intervals between loci ranging from4.43 cM to 33.46 cM (Table 3).
Table 4 Chi square values and chromosome location of microsatellitemarkers showing segregation distortion among 225 a cassava back-cross line derived from the cross CW 198-11 X MTAI-8
Marker Chromosome χ2 Probability F Chromosomeposition
rNS82 1 23.68 0.0000 0.00
EST105 2 13.02 0.0003 0.00
NS347 2 8.64 0.00328 32.00
EST47 7 4.35 0.037 0.00
SSRY113 10 10.77 0.00103 18.00
NS57 10 7.88 0.00501 10.3
NS80 10 6.69 0.0097 0.00
SSRY21 10 9.53 0.00202 19.80
SSRY230 13 9.16 0.00247 81.60
SSRY34 13 4.05 0.04407 30.4
SSRY52 18 4.93 0.02643 20.20
rSSRY226 19 33.64 0.00000 119.30
NS656 21 5.49 0.01909 0.00
OS112 21 4.65 0.03097 64.60
SSRY170 23 9.25 0.00236 0.00
SSRY74 23 5.94 0.01476 54.30
SSRY194 25 5.59 0.01803 63.6
SSRY271 25 4.74 0.02946 47.9
rSSRY31 27 41.82 0.000000 30.10
SSRY92 29 6.08 0.01364 26.90
Tropical Plant Biol.
Author's personal copy
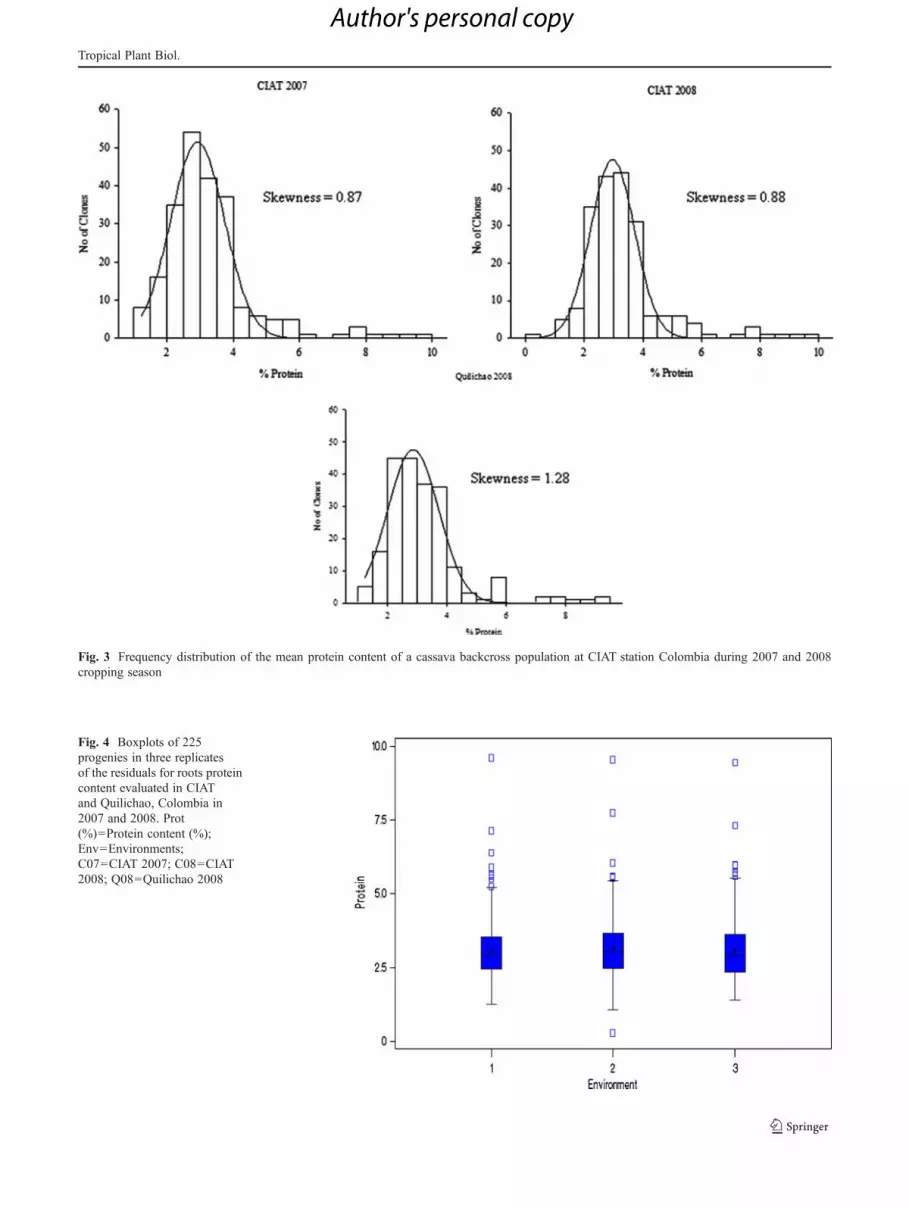
Fig. 3 Frequency distribution of the mean protein content of a cassava backcross population at CIAT station Colombia during 2007 and 2008cropping season
Fig. 4 Boxplots of 225progenies in three replicatesof the residuals for roots proteincontent evaluated in CIATand Quilichao, Colombia in2007 and 2008. Prot(%)0Protein content (%);Env0Environments;C070CIAT 2007; C080CIAT2008; Q080Quilichao 2008
Tropical Plant Biol.
Author's personal copy

Of the 105 SSR markers used for the detection of QTL inthis mapping population, 21 markers showed varyingdegrees of segregation distortion on linkage group 14. Fiveof the markers (rNS82, EST105, rSSRY226, rSSRY31 andSSRY149) had chi square values of 23.68, 13.02, 33.64,41.82 and 15.61 (Table 4).
Phenotypic Segregation in the Mapping Population
The distribution frequencies of protein content in the threetrials varied between 0.77% and 9.61%, 0.17%–9.11% and0.69%–7.75% with skewness values of 0.87, 0.88, 1.28 andshowed normal distribution, indicating that the trait is quanti-tatively inherited (Fig. 3). Themajority of the protein values inthe three environments was high. Only the CIAT 2008 trialhad values below the box plot graph while others were normaloutliers (Fig. 4). Low to high broad sense heritability wasrecorded for all traits for the three trials. Broad sense herita-bility was estimated for fresh root yield, dry root yield, harvestindex, dry matter content, and protein content (Table 5). Theanalysis of variance combined over the three trials revealedhighly significant differences (p<0.0001) among clones forprotein content in the roots and provided evidence for geneticvariation for root protein (Table 6)
Quantitative Traits Loci Analysis
A total of six putative QTL were identified on linkagegroups 6, 7, and 23 respectively using MapDisto (Fig. 5).Genotype by environment interaction was significant foryield related traits. Composite interval mapping using theWindow Cartographer program, was consistent with resultsfrom MapDisto and revealed linkage groups 7 and 23 hav-ing QTL and also detected another QTL on linkage group 13(Fig. 6). All the QTL for protein content in the root showeda LOD score above 2.5. QTL protg.7 found on linkagegroup 7 in the interval EST47 - rSSRY110, accounted for15% of phenotypic variance for protein content in the trial atQuilichao 2008 with a LOD of 33.4 whereas QTL protg.13found on linkage group 13 in interval NS59 - SSRY230explained 15% of phenotypic variance in the Quilichao2008 experiment with LOD 81.9. QTL protg.23 on linkage
Table 5 Mean squares from the ANOVA, combined across years for the backcross family evaluated in CIAT, Palmira, 2006 to 2008
Source of variation dfa Mean squares
FRYd DRYe HIf DMCg PCh
Year (Y) 1 218.73**** 127.53**** 4.34**** 5.55**** 5.38****
Clone (G) 224 1.26**** 0.36**** 0.08**** 0.25** 0.23****
Replication 2 1.76** 0.52** 0.13** 5.27**** 2.95****
G x Y 208 0.70*** 0.23**** 0.04 ns 0.19 ns 0.11 ns
Error 1152 0.46 0.13 0.03 0.19 0.12
CVi 27.04 22.66 51.13 6.92 21.12
Hj 0.565 0.593 0.585 0.339 0.616
a Degree of freedom; b Roots per plant; c Root weight (kg); d Fresh root yield (t/ha); e Dry root yield (t/ha); f Harvest index (0–1); g Dry mattercontent (%); h Protein content (%); ns0not significant; *0significant at P≤0.05, **0significant at P≤0.01, ***0significant at P≤0.001; ****0significant at P≤0.0001; ii Co-efficient of variation; jj Broad-sense heritability
Table 6 Analysis of variance for protein content in roots from acassava backcross population in three environments in Colombia be-tween 2007 and 2008
Source ofvariation
df Sum ofsquares
Meansquare
F-value Pr>F
Clones 274 45.60 0.17 1.84 <0.0001
Error 544 49.13 0.09
Total 818 94.73
CV019.23%; data has been transformed by the √ (% protein) function
*EST295
*EST35
Group 6
protg.6
*EST47
*SSRY250
*rSSRY185
*rNS720*rSSRY20
*rSSRY110
Group 7
protg.7a
protg.7b
*NS664
*rSSRY88
Group 23
protg.23 ^Ciat07
^Ciat08
^Quil 08
Legend
Fig. 5 The likelihood plots of QTL associated with root proteincontent of cassava in B1P2 population
Tropical Plant Biol.
Author's personal copy
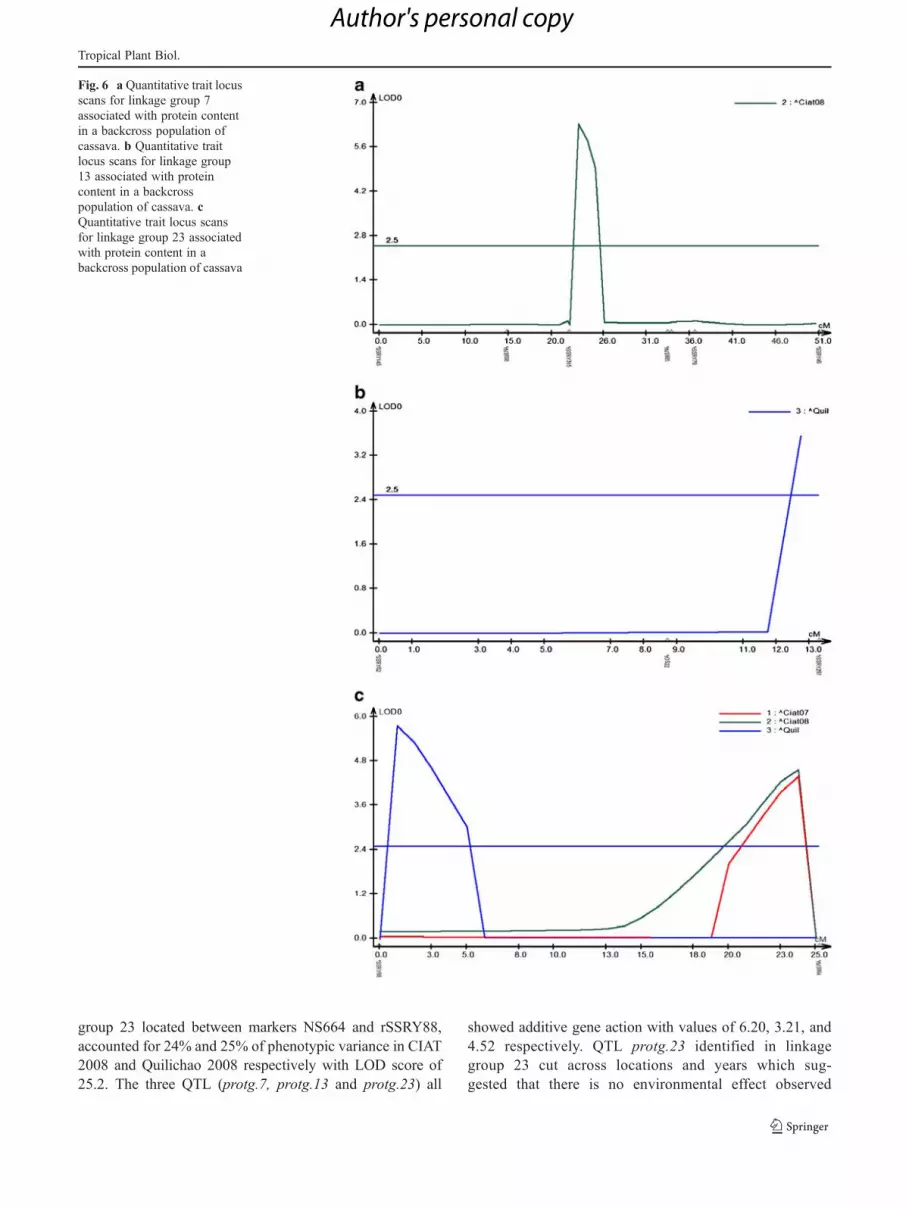
group 23 located between markers NS664 and rSSRY88,accounted for 24% and 25% of phenotypic variance in CIAT2008 and Quilichao 2008 respectively with LOD score of25.2. The three QTL (protg.7, protg.13 and protg.23) all
showed additive gene action with values of 6.20, 3.21, and4.52 respectively. QTL protg.23 identified in linkagegroup 23 cut across locations and years which sug-gested that there is no environmental effect observed
Fig. 6 a Quantitative trait locusscans for linkage group 7associated with protein contentin a backcross population ofcassava. b Quantitative traitlocus scans for linkage group13 associated with proteincontent in a backcrosspopulation of cassava. cQuantitative trait locus scansfor linkage group 23 associatedwith protein content in abackcross population of cassava
Tropical Plant Biol.
Author's personal copy

for protein for this QTL. The additive effects in thesethree QTL all came from the female parent which isalso the protein donor parent, suggesting that these QTLare strongly associated with protein content. The indi-vidual effects of alleles at these QTL explained from15% to 25% of the phenotypic variance.
Discussion
Low protein content in the roots of cassava cultivars ismainly due to lack of sufficient breeder attention toscreening and selection of germplasm for high proteincontent (Ceballos et al. 2006). This situation at leastpartially arose from breeders selecting primarily forhigher fresh weight yield, plant architecture, and diseaseresistance. Results reported by Ceballos et al. (2006), onscreening cassava germplasm at CIAT for protein con-tent was done under the same laboratory conditionsusing the same protocol as was used in the currentstudy. Although different protocols have been reportedfor the determination of protein in the roots of cassava,the current protocol used is considered effective (Fregene andOkogbenin personal communication).
Wild Manihot germplasm offers a wealth of usefulgenes for cultivated M. esculenta, but its use in regularbreeding programs is restricted by linkage drag and along reproductive breeding cycle (Nassar 2000; Hajjarand Hodgkin 2007). New technologies in the area ofmolecular biology have made positive contributions tocrop improvement and more efficient breeding (Fregeneet al. 1997; Devries and Toenniessen 2001; Okogbeninet al. 2008).
A joint genetic map for cassava would have been helpfulfor mapping of the protein markers (Okogbenin personalcommunication). The B1P2 map produced in the presentwork covers 1249.55 cM of the cassava genome with 105SSR markers. The QTL approach used in this study identi-fied three loci that determine protein content in cassavaroots. Different QTL were identified on linkage groups 7(one environment), 13 (one environment), and 23 (twoenvironments). The QTL identified in more than one envi-ronment supports stability for that linkage group acrossenvironments.
Okogbenin and Fregene (2002) in their earlier studies ofearly root bulking of cassava reported a total of 18 and 27QTL controlling dry foliage weight, harvest index and rootdiameter in two experiments. A year later, the same worker(Okogbenin and Fregene 2003) reported a number of QTLdetected in more than one trial: 29 QTL in two trials and 11QTL in three trials for plant height, branching height,branching level, branching index, stem portion with leaves,leaf area index, fresh root yield, fresh shoot yield, harvest
index and number of storage roots. Balyejusa Kizito et al.(2007) also reported two QTL for cyanogenic glucosidepotential and six QTL for dry matter content from an S1population of cassava in a single environment. Okogbenin etal. (2008) also identified three QTL each for dry root yield,fresh foliage and harvest index, which explained phenotypicvariances of 33.0%, 43.5%, and 36.0% respectively in asingle environment.
Jorge et al. (2001) identified eight QTL that were in-volved in resistance of cassava to Xanthomonas axonopodispv manihotis from an intra-specific population cross be-tween two non-inbred cassava lines where one QTL, locatedon linkage group D of their map was observed over two cropcycles. In another backcross population, Wydra et al. (2004)reported eleven markers, which explained between 16.0%and 33.3% of phenotypic variance of area under a diseaseprogress curve for cassava bacterial blight from differentlocations in Africa.
None of the earlier studies considered the protein contentof cassava roots because it was not part of the breedingobjectives. QTL for protein content in cassava found in thisstudy are comparable with that reported for durum wheat(Chee et al. 2001), soybean (Panthee et al. 2005), and maize(Holding et al. 2008; Wassom et al. 2008) showing stabilityof QTL to different environmental conditions. The magni-tude of the QTL is also similar to that identified for othertraits, such as early yield and root quality traits in cassava(Okogbenin and Fregene 2003; Balyejusa Kizito et al.2007).
The broad sense heritability estimate for protein of 0.61indicates that protein content has higher heritability thanyield (Dixon et al. 1994; Benesi et al. 2004; BalyejusaKizito et al. 2007). The three QTL detected in this studyshowed additive effects suggesting this gene action plays amore important role for protein content in this cassavabackcross population. Cach et al. (2005) reported thatadditive effects play an important role in determinationof dry matter content. Likewise Balyejusa Kizito et al.(2007) identified QTL for cyanogenic glucosides in theirpopulation with additive effects.
The three QTL found for high protein content can be thebasis for marker-assisted recurrent introgression of high rootprotein content into adapted gene pools that have low pro-tein content (Chávez et al. 2005; Ceballos et al. 2006). Useof high protein alleles for cultivar improvement would allowfor selection of progenies with high protein concentrationabove the current cassava value in available commercialcassava cultivars.
Acknowledgements This research work was supported by a pre-doctoral fellowship granted to CIAT from Rockefeller Foundation.Kirkhouse trust fund and Generation Challenge Programme supportedmy training in QTL mapping courses at NC State, summer courses.
Tropical Plant Biol.
Author's personal copy

References
Agronomix Software, Inc. and Agrobase 1998 Addendum (2000)Agrobase™, 71Waterloo St. Winnipeg, Manitoba, Canada
Akinbo OA (2008) Introgression of high protein and pest resistancegenes from inter-specific hybrids of Manihot esculenta ssp fla-bellifolia into cassava (Manihot esculenta Crantz) PhD thesis,University of the Free State, Bloemfontain, South Africa. 266p.
Akinbo O, Labuschagne M, Fregene M (2010) Embryo rescue as amethod to develop and multiply a backcross population of cassava(M. esculenta Crantz) from an interspecific cross of Manihotesculenta ssp flabellifolia. Afr J Biotechnol 9:7058–7062
Akinbo O, Labuschagne M, Fregene M (2011) Introgression of white-fly (Aleurotrachelus socialis) resistance gene from F1 inter-specific hybrids into commercial cassava. Euphytica 183:19–26
Balyejusa Kizito EB, Rönnberg-Wästiljung A-C, Egwang T, GullbergU, Fregene M, Westerbergh A (2007) Quantitative trait locicontrolling cyanogenic glucoside and dry matter content incassava (Manihot esculenta Crantz) roots. Hereditas 00:00–00. doi:10.1111/j.2007.0018-0661.01975.x
Benesi IRM, Labuschagne MT, Dixon AGO, Mahungu NM (2004)Genotype X environment interaction effects on native cassavastarch quality and potential for starch in the commercial sector.Afr Crop Sci J 12:205–216
Blair MW, Giraldo MC, Buendía HF, Tovar E, Duque MC, Beebe SE(2006) Microsatellite marker diversity in common bean (Phaseo-lus vulgaris L.). Theor Appl Genet 113:100–109
Bonierbale M, Iglesias C, Kawano K (1995) Genetic resources man-agement of cassava at CIAT. In: Root and Tuber Crops, ResearchCouncil Secretariat of MAFF and National Institute of Agrobio-logical Resources, Tsukuba, Japan 39–52p.
Burns A, Gleadow R, Cliff J, Zacarias A, Cavagnaro T (2010) Cassa-va: the drought, war and famine crop in a changing world. Sustain2:3572–3607
Cach NT, Lenis JI, Pérez JC, Morante N, Calle F, Ceballos H (2005)Inheritance of useful traits in cassava grown in sub-humid con-ditions. Plant Breed 125:177–182
Ceballos H, Sánchez T, Chávez AL, Iglesias C, Debouck D, Mafla G,Tohme J (2006) Variation in crude protein content in cassava (Man-ihot esculenta Crantz) roots. J Food Compos Anal 19:589–593
Chávez AL, Sánchez T, Jaramillo G, Bedoya JM, Echeverry J, BolanosEA, Ceballos H, Iglesias CA (2005) Variation of quality traits incassava evaluated in landraces and improved clones. Euphytica143:125–133
Chee W, Elias EM, Anderson JA, Kianian SF (2001) Evaluation of ahigh grain protein QTL from Triticum turgidum L. var. dicoccoiesin an adapted Durum wheat background. Crop Sci 41:295–301
Churchill GA, Doerge RW (1994) Empirical threshold values forquantitative trait mapping. Genetics 138:963–971
Dellarporta SL, Wood J, Hicks JB (1983) A plant DNA miniprepara-tion: version II. Plant Mol Biol Rep 1:19–21
DeVries J, Toenniessen G (2001) Securing the harvest: biotechnology,breeding and seed systems for African crops. Chapter 13: Cassa-va. CABI Publishing Oxon, UK, pp 147–156
Diasolua Ngudi D, Kuo YH, Lambien F (2002) Food safety and aminoacid balance in processed cassava roots “cossettes”. J Agric FoodChem 50:3042–3049
Diasolua Ngudi D, Kuo YH, Lambien F (2003) Cassava cyanogensand free amino acids in raw and cooked leaves. Food ChemToxicol 41:1193–1197
Dixon AGO, Asiedu R, Bokanga M (1994) Breeding of cassava forlow cyanogenic potential: problems, progress and perspective.Acta Horticulture 375:153–161
Fregene M, Angel F, Gomez R, Rodriguez F, Chavarriago P, Roca W,Tohme J, Bonierbale M (1997) A molecular genetic map of
cassava (Manihot esculenta Crantz). Theor Appl Genet 95:431–441
Fregene MA, Blair MW, Beebe SE, Ceballos H (2007) Marker-assistedselection in common beans and cassava. In: Marker-assisted se-lection (MAS) in crops, livestock, forestry and fish: current statusand the way forward. FAO Publishing, 471p.
Frisch M, Bohn M, Melchinger AE (1999) Comparison of selectionstrategies for marker-assisted backcrossing of a gene. Crop Sci39:1295–1301
Hajjar R, Hodgkin T (2007) The use of wild relatives in crop improve-ment: A survey of developments over the last 20 years. Euphytica156:1–13
Hock-Hin Y, Van-Den T (1996) Protein contents, amino acid compo-sitions and nitrogen-to protein conversion factors for cassavaroots. J Sci Food Agric 70:51–54
Holding DR, Hunter BG, Chung T, Gibbon BC, Ford CF, Bharti AK,Messing J, Hamaker BR, Larkins BA (2008) Genetic analysis ofopaque 2 modifier loci in quality protein maize. Theor Appl Genet117:157–170
Jorge V, Fregene M, Velez CM, Durque MC, Tohme J, Verdier V(2001) QTL analysis of field resistance to Xanthomonas axono-podis pv. manihotis in cassava. Theor Appl Genet 102:564–571
Kawano K (1980) Cassava. In: Fehr WR, Hadley HH (eds) Hybridiza-tion of crop plants. American Society of Agronomy and CropScience Society of America, Madison, Wisconsin, USA, pp 225–233
Kosambi DD (1944) The estimation of map distance from recombina-tion values. Ann Eugen 12:172–175
Krom M (1980) Spectrophotometric determination of ammonia; astudy of modified Bethelot reaction using salicylate and cichlor-oisicyanurate. The Analyist 105:305–316
Lorieux M (2007) MapDisto, A free user-friendly program for com-puting genetic maps. Computer demonstration (P958) given at theplant and animal genome XV conference, January 13–17, SanDiego, CA URL: http://mapdisto.free.fr/.
Mba REC, Stephenson P, Edwards K, Mezer S, Nkumbira J, GulbergU, Apel K, Gale M, Tohme J, Fregene MA (2001) Simple se-quence repeat (SSR) marker survey of the cassava (Manihotesculenta Crantz) genome: toward a SSR-based molecular geneticmap of cassava. Theor Appl Genet 102:21–31
Nassar NMA (2000) Wild cassava, Manihot spp.: Biology andpotentialities for genetic improvement. Genet Mol Biol 23(1):201–212
Novozamsky I, Houba VJG, van Eck R, van Vark W (1983) A noveldigestion technique for multi-element analysis. Comm Soil SciPlant Anal 14:239–249
Okogbenin E, Fregene M (2002) Genetic analysis and QTL mappingof early root bulking in an F1 population of non-inbred parents incassava (Manihot esculenta Crantz). Theor Appl Genet 106:58–66
Okogbenin E, Fregene M (2003) Genetic mapping of QTLs affectingproductivity and plant architecture in a full-sib cross from non-inbred parents in cassava (Manihot esculenta Crantz). Theor ApplGenet 107:1452–1462
Okogbenin E, Marin J, Fregene M (2008) QTL analysis for early yieldin a pseudo F2 population of cassava. Afr J Biotechnol 7:131–138
Olsen KM, Schaal BA (1999) Evidence on the origin of cassava:Phylogeography of Manihot esculenta. Proc Natl Acad Sci,USA 96:5586–5591
Panthee DR, Pantalone VR, West DR, Saxton AM, Sams CE (2005)Quantitative trait loci for seed protein and oil concentration, andseed size in soybean. Crop Sci 45:2015–2022
Rector BG, All JN, Parrott WA, Boerma HR (1998) Identificationof molecular markers associated with quantitative trait locifor soybean resistance to corn earworm. Theor Appl Genet96:786–790
Tropical Plant Biol.
Author's personal copy

Roa AC, Maya MM, Durque MC, Tohme J, Allem AC, BonierbaleMW (1997) AFLP analysis of relationships among cassava andother Manihot species. Theor Appl Genet 95:741–750
SAS Institute Inc (2003) SAS/STAT software: changes and enhance-ment for release 9.1. SAS Institute Inc, Cary, NC, p 158
Searle PL (1984) The Berthelot or indophenol reaction and its use inthe analysis chemistry of nitrogen. The Analyist 109:549–565
Skalar (1995) The SANplus segmented flow analyzer. Soil and PlantAnalysis. Skalar Analytical B.V, De Breda, The Netherlands, 70–72p
Śliwka J, Wasilewicz-Flis I, Jakuczun H, Gebhardt C (2008) Taggingquantitative trait loci for dormancy, tuber shape, regularity oftuber shape, eye depth and fresh colour in diploid potato origi-nated from six Solanum species. 127:49–55
Walinga I, van VarkW, Houba VJG, van der Lee JJ (1989) Plant analysisprocedures, Part 7. Department of Soil Science and Plant Nutrition,Wageningen Agricultural University, Syllabus 1989, 197–200p
Wang S, Basten CJ, Zeng Z-B (2010) Windows QTL Cartographer 2.5.Department of Statistics, North Carolina State University,Raleigh, NC. (http://stat.ncsu.edu/qtlcart/WQTLCart.htm).
Wassom JJ, Wong JC, Martinez E, King JJ, DeBaene J, Hotchkiss JR,Mikkilineni V, Bohn MO, Rocheford TR (2008) QTL associatedwith Maize kernel oil, protein, and starch concentrations; Kernelmass; and grain yield in Illinois high oil x B73 backcross-derivedlines. Crop Sci 48:243–252
Williams CG (1998) QTL mapping in outbreed pedigrees. In: PattersonAH (ed) Molecular dissection of complex traits. CRC Press LLC,Florida, USA, pp 81–94p
Wydra K, Zinsou V, Jorge V, Verdier V (2004) Identification ofpathotypes of Xanthomonas axonopodis pv. Manihotis inAfrica and detection of quantitative trait loci and markersfor resistance to Bacterial Blight if cassava. Phytopathology94:1084–1093
Tropical Plant Biol.
Author's personal copy


