Embed Size (px)
Citation preview

'^r J p r- [- P p rj p r
I ,, 111 r j
1
TïTiT •TTn 1 1 r r r 1 j «■
r
—\.— [— Landscape"! B| Food MarkJBl »plytion^igsdHil
r 1 ■ ' ' j 1
r II iriTn rm^-i Mil 1
X r I - . X___.X_ r , r r, r r
r X I IT r ^-—
f" f
I r J
r :. i
I r X. ._ X X_ r r F
r X X X r r r r r
I r X _-_ X_—X. r r r r
r r .__x____ X X_ r r r r i'

Rearranging the Economic Landscape: The Food Marketing Revoiution, 1950-91. By AkJen C. Manchester. Commodity Economics Division, Economic Research Sen/ice, U.S. Departnrient of Agriculture. Agricultural Economic Report No. 660.
Abstract
Changes in food marketing have been pervasive since Worid War II. Changes in the makeup of the populatton. lifestyles, incomes, and attitudes on food safety, health, and convenience have drastically altered the conditk>ns facing farmers and marketers of food products. Food manufacturers and distributors have made vigorous efforts to meet changing consumer wants and needs.
Keywords: Food marketing, market structure, food consumptk>n
Acknowledgments
The author thanks Henry Myers of the Wall Street Journal for his felicitous phrase "rearranging the economic landscape," used here in the title (Myers, 1988). It captures the spirit of this report.
Extensive use has been made of the writings of colleagues in the Economy Research Service (ERS) in this work. Each is appropriately referenced. However, the author alone is responsible for the present reading.
Thanks are also due to Lester Myers and Robert Bohall of ERS, Walter Armbruster of the Farm Foundation. Dennis Henderson of Ohk> State University, Rrchard King of North Carolina State University, and Milton Hallberg of Pennsylvania State University for reviewing the manuscript; to Diana Claytor for highly professtonal word processing; to Sandra Suddendorf for mfcrocomputer support; to Jane Allshouse for the charts; and to Florence Maupin, Economes Management Staff, for editing the report.
Note: Use of commercial or trade names is for informatk)n only and does not imply approval or endorsement by the U.S. Department of Agriculture.
Washington, DC 20005-4788 September 1992

Contents
Page
Summary iv
Introduction 1
The Economic Climate 4 The Consumer World 4 The Corporate World 13 Characteristics of the Food Industries 17
Food Retailing 20 Chains as Competitors 24 Chain Procurement 29
Food Service 31 Getting the Chef Out of the Kitchen 34 Growth and Change 35 Carryout: Fast Food versus Grocery Stores 38
Wholesale Food Distribution 39 Merchant Wholesalers 41 Large Companies 41
Food Manufacturing 42 Turnover of Large Companies 45 The Move Abroad 48 Foreign Companies 56 Directions of Diversification 57 Channels of Trade 62 Industries 69
Product Changes and Merchandising 78 Changing Food Products 79 From Commodities to Differentiated Products 85 Ingredient Substitution Using Engineered Foods 87
Health Consciousness 91 Fat 92 Fiber 95

Contents-Continued
Page
Food Safety Concerns 96 Microbial Contamination 97 Pesticide Residues 98
Food Programs 99
Comnxxlity Programs 101 Basic Commodities 102 The Sugar Program 103 Pricing the Components of Milk 110
Milk Marketing Orders 112 Classified Pricing 116
lmplicatk)ns for Prfcing and Demand 120 More Through Food Servfce 120 More as Ingredients 122 More Disassembly 124 The Changing Demand for Beef 128
Conclusk>ns 131 The Consumer Worid 132 Changes in Marketing 133 Food System Response 137 Effects of Government Policy 138 Implicatbns for Prfcing and Demand 139 Continuing Change 141
References 142
Appendix A: Measurement and Classifk^ation of Large Companies 152
Appendix B: Tables 157
III

Summary
Changes in food marketing have been pen/asive since Worid War II. Changes in the makeup of the populatton, lifestyles, incomes, and attitudes on food safety, health, and convenience have drastk^ally altered the conditbns facing farmers and marketers of food products. Manufacturers and distributors have made vigorous efforts to meet changing consumer wants and needs.
HousehoW and family size have declined due to later maniages, more divorces, smaller families, and less doubling-up (two families in one househoW). The proportion of families with nriore than one earner began to increase sharply after Worid War II: from 39 percent in 1950 to 58 percent in 1990. As incomes and the number of multiple-earner families rose, Amerfcans ate out nwre often. The share of food expenditures away from home rose from 25 percent in 1954 to 46 percent in 1990.
More nfK)ney and less time for food shopping, pre|>aratk>n, and eating in many households have made convenience the key. In families where all the adult members work outskle the home, time for meal preparation has shrunk from 30 minutes a few years ago to 20 minutes today.
Interest in convenience and health has altered what Amerk^ns eat at home. Between the early 1970's and the mid-1980's. consumers began eating nrx>re poultry, cheese, fresh fruits and vegetables, processed fruit and jufces. cereal products, and other prepared foods and less beef and pork, processed vegetables, bakery products, sugar and sweets, and coffee and tea.
Responding to consumers' desires for convenience and healthfulness, food manufacturers have reshaped the compositk>n of the food basket. Technotogfcal devek>pments have created whole new industries and transformed all the okJ ones.
These changes mean that manufacturers now kx)k for altered or new products from farmers and that farmers must adjust to the changing demands. Farmers are paki increasingly on the basis of their ability to provkJe comnrnxiities that meet buyers' speciffcattons.
The supermarket boom was the dominant development in food retailing from the end of Work! War II to the mid-1960's. Since then, retailers have used increasingly diverse strategies to attract consumers.
IV

The dominance of chains, owned or franchised, in fast-food and, to a lesser extent, in full-sen/ice restaurants means that menus do not change from day to day. So, demand for specific foods is not very responsive to price. Fixed-menu eating places now do much more business than restaurants with more flexible menus that can adapt to rising prices by choosing less costly items.
The economic landscape in food manufacturing has been drastically rearranged. Large companies are manufacturing a greater share of food and are more diversified in a variety of food products and nonfood products, although there has been some withdrawal from nonfoods in recent years. Large food companies are also moving toward specialization in a single segment of the market: products for the grocery store trade, products for food service, or ingredients for other manufacturers. Many of these changes have taken place through mergers, acquisitk>ns, leveraged buyouts, and divestitures.
Major Postwar Changes in Food Marketing
Causes of change: • Smaller households: fewer children, more single-person
households.
• Higher incomes; more multiple-earner households.
• Desire for convenience and quality.
• Concems about health and food.
• Corporate restructuring through mergers and divestitures.
Changes in marketing: • Supermarket boom through the mid-1960's.
• Diversity among supermarkets since then; low prices versus greater assortment.
• Away-from-hofTte eating share nearly doubled; growth mostly in fast food wKh fixed menus.
• Food wholesaling became dominated by large firms.
• Large, diversified firms dominate food manufacturing.
• Manufacturing internationalized.

Rearranging the Economic Landscape
The Food Marketing Revolution, 1950-91
Alden C. Manchester*
Introduction
Marketing the Nation's food and fiber embodies a variety of functions, employs 17 percent of the U.S. workforce, and contributes 16 percent of the total gross national product. Marketing food-processing, wholesaling, retailing, and food service-cost $415 billion in 1990. Markets for agricultural products have been rapkily changing throughout the post-World War II perkxJ. Major forces of change originate with consumers. Other major changes result from the competitive efforts of marketing firms to adapt to the economk: climate around them.
Markets now offer a wkie choice of products, various systems of distribution, and many built-in servies, such as precooked meats or mfcrowave meals. Much of the present market diversity results from keen awareness by food manufacturers, wholesalers, and retailers that the nriarket is consumer driven.
Consumers vote every day in the marketplace with their dollars, and the market listens carefully to their votes. There is continuous feedback from consumers, who respond to the offerings of marketers trying to meet the perceived wants of consumers. Finding out what consumers want and how they feel about varbus product
*Alden C. Manchester is the senior economist with the Commodity Economics Division, Economic Research Service. U.S. Department of Agriculture.

characteristics has become big business. Managements study changes in consumer lifestyles and preferences and adjust their products and practices to meet those wants.
This report examines the changes in the marketing of farm and food products since 1950 and the factors that have caused such change. Basic economic relationships have been altered in many ways. Only by understanding the developments in the marketing system can we begin to grasp what has taken place and, more important, gauge the probabilities of future change.
Important changes have involved:
• Denrx>graphk;s and populatk>n shifts. • Consumer lifestyles. • Economk: conditions: income, inflation, unemptoyment. • WorW financial conditk>ns that alter the competitiveness of
Amerk^an and foreign firms. • Farm pofcy and programs. • Food programs. • Publk: policy and private attitudes on food safety, nutritk>nal
labeling, environmental concerns, and other food-related issues.
Farnriers, manufacturers, and marketers have adjusted, sometimes defensively, to these changes. But, such changes have also created opportunities. As more specialized retail market segments have devek>ped, the wholesale and food manufacturing sectors have responded. Some manufacturers that once supplied all parts of the market now specialize in a single segment, such as branded consumer products, foodsen/ice products, or ingredients for food manufacturers. Only very large finns generally have the resources to market a broad line of branded consumer foods, since this undertaking requires continuous product development and promotk>n. Because most new products fail, only firms with extensive resources are equipped to compete in the natk>nal brand area.
Amerfcans' view of the whole food scene has changed dramatically as the baby-boom generatbn has matured. More money and less time for food buying, preparatton, and eating in many househokis has made convenience one key to success in the marketplace. Health concerns have also become increasingly influential in food choices, reaching a high level in the 1980's. Interest in convenience and health has played a major role in aKering the foods eaten at home. Responding to consumers' desires for convenient and healthful foods.
food manufacturers have reshaped the composition of the food basket. Technotogical developments have created whole new industries and have transformed every one.
A massive restructuring of corporate America and the food sector has been going on for 30 years; the pace is accelerating. Mergers have been a major force in changing the organization and lines of business of food manufacturers. Large companies increasingly handle a broader line of products.
The farm and food programs of the Federal Government have changed significantly over the years. The programs have expanded the opportunities of farmers in marketing their products, opportun- ities once largely confined to discovering the best place and time to market. Arrangements such as fon/vard contracting and futures markets had earlier been devek)ped in an attempt to transfer price risk to others, and some firms had become vertically integrated to manage risk. But, indivkiual producers had previously pakJ little attention to influencing demand or to devetoping new products to satisfy a changing martcet.
With the changes of the past 40 years, manufacturers now want rTKxJified products or different products from farmers, and farmers must adjust. Farmers are increasingly paki on the basis of their performance in provkling comnrxxJities that meet buyers' specificatk>ns.
Farmers now must produce comnrKxlities that marketers want for the changing wants of consumers. Leaner pork brings higher returns to farmers. Fruit and vegetable growers must conskJer the preferences of many consumers for peslickle-free or organk: produce, with higher prices weighed against the costs of meeting such preferences. Promotional activities by comnrKxJity organizatk>ns, with generk: advertising funded by producer assessments, inform consumers of the merits of vark)us foods while emphasizing to farmers the importance of responding to changing consumer derroinds.
The internationalizing of food markets, with U.S. and foreign food firms becoming multinational, has added new dimensions to food marketing. Marketing strategy and tactics must be adapted to a much broader range of situatk>ns around the world.

The Economic Climate
The changes in the food business in the postwar period have been striking and multidimensional and have taken many directkwis. Major shifts in demand have come from higher incomes, demographic changes, and altered lifestyles. The internal dynamics of the corporate world have concurrently changed drastfcally. In this sectk>n, we conskler these broad changes in the world beyond the farm and food system as well as some of the effects of these changes on food marketing.
The Consumer World
Growing populatton, higher incomes, changing denrK>graphk:s, and different lifestyles have all played a part in creating very different consumer wants from those of 1950. The diversity of wants is greater, too, as vark)us groups diverge further from the average, demanding specialized products to match cun-ent tastes and preferences.
Real income (inflation adjusted) rose dramatically in the postwar period, with a few dips during recesstons or sharp inflation (fig. 1). Incomes increased due to a combinatbn of causes:
• The proportton of families with more than one earner rose sharply during and after Worid War II, from 39 percent in 1950 to 54 percent in 1970 and to 58 percent in 1990 (fig. 2).
• Family and household sizes declined because of fewer chiWren at home and wore young adults and senk>rs living alone.
• The proportton of children in househokls rose sharply with the baby boom, peaked in 1962, and went down from 29 percent in 1967 to 22 percent in 1990.
• The share of persons with an income rose from 55 percent in 1967 to 73 percent in 1990 (fig. 3).
These demographk: developments and rising real incomes per earner raised average real income per person in households 155 percent between 1947 and 1990.

ñgurel
Real income of families, houeeholdt, and per capita
Percent of 1947
CXßJ
260 - /^ Per capita
240 - / 220 - r^ /^ Famies
200 - / ^
/
180 - / / x^ Households
160 - A /" ^^
140 - 4^ 120
100
1 1
^
^ T 1 iBHi 1 1 1 1 1 1 1 111 11111 1111111
1947 50 60 70 80 90
Source: Henton, 1000 (tM i^. table 3).
Consumer Spending
Consumers, with higher incomes and fewer children, are spending less on food and more on shelter and transportation (table 1). Total expenditures for health care have grown even though consumers spend less on health care than 30 years ago, as employers and governments have sharply increased their health care contributions. The rising share for shelter reflects widespread housing purchases, rising interest rates, and larger housing units. More spending on transportation reflects multiple vehicle ownership by nfiore households, more air travel by families and individuals, and higher prices for automobiles and gasoline.
Overall, consumers now have more discretion over available resources from both current income and credit. But, many longer run decisions commit a household to fixed expenditures for years to come. Home ownership is a major ambition of most American families. A purchase ensures that mortgage [payments (principal and interest) are set for many years unless the home is sold or

Rgure2
Share of families with more than one earner
Percent of families
701
60
50
1950 eO 70 80
Source: U.S. Dept of Commerce, Bureau of the Census, 1991b.
refinanced. The commitments for property taxes, utilities, insurance, and other expenses are nearly as final; the amounts are níK>re flexible but seldom decline. Purchases of autonrK)biles, second homes, boats, and other large items produce similar commitments for extended periods. In such a situation, flexibility is alrTX>st entirely in the original purchase decision. New purchases can be deferred, but payments on those already made will continue as scheduled.
Because of this, a recession has little visible effect on many consumer expenditures, even though sales of cars and TV's decrease. Food spending, especially for food away from home, is more flexible. One can decide to forgo eating out during hard times or shift to less expensive foods at home. Food spending is therefore sensitive to recessions, although in good times it grows, though more slowly than income.

Rgure3
Income-earners in householder
Percent
1001
40-
20
Children 14 years old and under
Above 14 years old with income
I I I I 1 I 1 I I I I I I
1967 70 75 80 85 90
'Exdüöes t>0M in inslrtulions kke nursing homes, prisons, and military barracks.
Souro«: U.S. Dept. o( Commerce, Bureau ot the Census. I9d1b.
I
Food Spending
Food spending rose more than sevenfold between 1954 and 1989. Much of the ir^rease was due to population growth (39 percent) arxJ price ir^reases (47 percent). To measure the change in real per capita spending for food, we can value all food at retail store prices and then deflate for food price changes and the irK:rease in population. The resulting series measures food experxiitures per capita at 1989 retail foodstore prices (fig. 4).
The trend in real (deflated) food expenditures valued at retail store prices has been upward since the end of the Great Depression: 24 percent from 1939 to 1989 and 17 percent from a low point in 1963 to 1989. Food spending, thus measured, reflects economic conditions rather well. Real food expenditures declined in every postwar recession but one: the brief recession of December 1969- November 1970.

Table 1-Consumption expenditures by type
Item 1960-61 1972-73 1986-87
Dollars
Expenditures^ 5,054 8,271
Percent
19,576
Total 100.0 100.0 100.0 Food and alcoholic beverages 26.0 21.6 18.8 Shelter^ 13.1 16.6 20.6 Transportation^ 15.2 20.7 23.7 Health care 6.7 6.4 5.2 Recreation and reading 4.9 5.5 6.0 Other 34.1 29.2 25.7
^Expenditures for current consumption of all consumer units, excluding persoruil insurance and pension contributions.
^Does not include the outlay for housing purchased during the year. Mortgage interest is included but not mortgage principal repayment.
includes the purchase pnce (less trade-in) of new vehicles purchased during the year. Major appliances, boats, and other large items are handled similarly.
The ir»creases in real food experxJitures, using this measure, reflect nfx>stly shifts toward higher priced foods rather than an increased quantity of food in an individuars diet. The old cliche about the limited size of the hunrtan stomach still applies. For instance, the great increase in higher priced microwavable foods, both at home and in food service, has pushed up food expenditures but not the quantity of food purchased.
Food Service Growing
The HTKDst striking change in food consumption and marketing has been in away-from-home eating. The foodservice market (eating out) has been growing faster than the offpremise market (eating at home) ever since the Great Depressbn. Food servk:e accounted for 46 percent of all food dollars in 1990, compared with 25 F)ercent in 1954 (fig. 5). The nriargins (the spread between buying and selling prices) in the foodservice market (such as restaurants) are substantially higher than those in the offpremise nnarket (such as grocery stores). For this reason, the share of food (quantities) in food servk:e when

Rgure4
Food expenditures per capita at 1989 food store prices
Note: Shaded areas indícale recessions.
Source: Manchester, 1991.
measured at the same price level is somewhat less than the share of total dollars, 33.5 percent in 1990 and 22 percent in 1954.
Most of the growth in the away-from-home market has been in the fast-food segment. Its share of the away-from-home market grew from 4 percent in 1954 to 34 percent in 1990. Over the same time, the share of table-service restaurants, lunchrooms, and cafeterias- the more traditional eating places-declined from 48 to 37 percent.
A major factor leading to the rising share of food servrce in food sales has been growth in consumer income, which has increased both in nominal and real terms alnriost continually since the Great Depression. The sharp increase in the proportion of women working outskJe the home has contributed both to the rise in income and to the demand for eating out.
Increased emphasis on parenting has led to many parents spending more time with their children, including eating out with them more often than was usual in the mid-1970's (Otten, 1991).

ñgureS
Food service ae a share of all food
Percent
501
Share of total food (quantities)
10
Q' I ' ' ' I 1 ' ' ' I I ' I I I I I I I I I I I I I I I I 1
1964 60 70 80 90
Source: Manchester, 1991.
Larger households generally spend less per person on eating out than do smaller households. However, the nfx>re earners in a household, the niore is spent on food away from home. Some of this spending involves more lunches away from home, sometimes brown- bagged and prepared in the office microwave. Single, employed (persons living alone spend much more on eating out than any other group (fig. 6), but they also spend more per person on food at home than alnrx)st any other group.
Food at Home
Americans' views of meals have changed dramatically as the baby- boom generation has matured. Higher incomes and multiple earners have mandated convenience in food buying, preparing, and eating for many households.
The time available for these tasks has shrunk. Trips to the super- market declined from an average of 2.6 per week in 1981 to 2.2 in 1990. In families where all the adult members worked outside the
10

RgureS
Average expenditures for food away from home, by size of household and number of earners, 1988 Dollars per person per week
25
20-
1-person household
2-person household
3-person household
person household
6-person household or larger
0 1 2
Number of earners
Source: Calculated from U.S. Departnent of Labor, 1990a.
4 or more
home, the goal for meal preparation time shrank from 30 minutes a few years ago to 20 minutes today. The microwave oven, now in 91 percent of U.S. households, has been discovered by the authors of gourmet cookbooks, who emphasize its ability to preserve freshness and flavor and use less fat (Sokok>v, 1991).
Health concerns increasingly influenced food choices throughout the postwar period. Growing concern about fat and cholesterol prompted many consumers to switch to tower fat foods. The 1980's also brought reports of the benefits of fiber in cancer prevention.
Such convenience and health concerns meant that foods for home consumptton changed between the early 1970's and the 1980's (fig. 7). Avoidance of fat, for example, contributed to gains in poultry consumptton and declines in that of beef and pork. The perceived benefits of fiber helped boost cereal, fresh fruit, and fresh vegetable consumptton. At the same time, consumers' desire for convenience meant more prepared foods.
11

Rgure7
Consumer expenditures for food at home by food group
Percent of food at home'
Red meat ■ 1972-74
01986
products Processed
Sugar
^ Processed and juices vegetables sweets
4.0 oc 4.3
<At constant 1082-84 prices.
Source: App.tables.
Consumers started eating:
More • Poultry. • Cheese. • Fresh fruits and vegetables. • Processed fruit and juices. • Cereal products. • Other prepared foods.
.and less Beef and pork. Processed vegetables. Bakery products. Sugar and sweets. Coffee.
Except in the "other prepared foods" category, the above changes reflect mostly health concerns. Of course, prices also play a part in shifting demand. For example, real broiler prices (inflation-adjusted) have trended downward since the mid-1950's, while per capita broiler consumptton has quadrupled. Technological advances through genetic research, equipment development, improved nutrition, and better management practices have made it possible to produce broilers in less time using substantially less feed and labor. Such developments have made broilers cheaper than other meats and this.
12

along with health and convenience factors, has raised broiler consumption (Lasley and others, 1988).
The Corporate World
Many of the changes in the food sector were proactive as marketing firms made strenuous efforts to shape demand and thus to enhance profits and stock prices.
The corporate work! in the food sector, like all other sectors, is also driven by its own internal imperatives. In the postwar era, the ability to raise prices on the stock market has increasingly come to dominate the corporate workl. The time is past when a modest growth in sales-keeping up with, or slightly exceeding, the industry average-and a respectable profit rate were enough to satisfy the stockhokJers. In the 1960's and 1970's, growth became the imperative of the large, publicly hekJ corporatk>n. With stocks hekJ in large bkxîks by institutional investors, the standards by which such investors, securities analysts, and other stockholders judged corporate performance became very different and much harder to satisfy. "The future value of the securities they own, which stocks to buy and whk:h to sell, and whether a given company (is) nroving or standing still are the criteria by which these institutional owners of securities judge corporations" (Hoffman, 1969, p. 61). In addition, the pressure for rapid growth and quick returns was increased in the 1970's by inflation and the desire for capital gains.
In the 1960's and 1970's, strategies turned toward diversification, both into related lines and, rrx^st prominently, into conglomerate acquisition of unrelated businesses. Much of the attraction of mergers arose from the nfx>ney to be made in the stock market, not from any economies of the firm itself. A number of methods of financial "pyramkiing" made mergers very profitable with no change at all in the sales or profits of the companies involved (Hoffman, 1969, pp. 58-59).
Then, in the late 1970's and 1980's, emphasis shifted to shortrun movements in stock prices. The performance of the managers of institutk>nal funds-mutual funds, trust funds, investment funds, and pension funds-was judged on a very short-term basis: how much have the prices of your holdings risen this month? Dividends were largely irrelevant. In one of the classic ironies of recent years (which he intended), management guru Peter Drucker described the growth of pension fund holdings of corporate equities as "Pension Fund Socialism." But, the behavior of their managers can only be
13

characterized as the last hurrah of 19th-century capitalism (Drucker, 1976; 1988, pp. 75-76). The horizon of such managers extended only to the end of the month.
The postwar period saw a quantum leap in diversification by nearly all large firms. The conglomerates, by definition, were highly diversified into unrelated lines. But, almost every large firm, even those entirely in the food business, expanded into multiple lines. This was the only avenue of growth by merger open to large firms through the 1970's; the antitrust authorities forbade significant mergers in existing lines of business.
The large rrxxJern firm is made up of multiple divisions, groups, or segments, each of which produces and nr^rkets one line. Each divisk>n is effectively a separately organized business that acts in many respects like an independent, specialized firm in the same line. Decentralized organization makes each of the units a candidate for sale or purchase, since acquisition of such a unit by another firm or by a leveraged buyout has only minimal effect on either the selling or the buying company (Penrose, 1959, pp. 174-45).
In consequence, there has been an accelerating trend to buying and selling the constituent parts of companies both in the United States and abroad. The plethora of pure conglomerates in the 1960's and 1970's led to numerous acquisitions of unrelated businesses and the subsequent selk)ffs of many, often only recently acquired.
In 68 large mergers which took place between 1950 and 1970, about a third of the lines of business assignable to mergers on the basis of shipments in 1950 were no longer being operated by the acquiring firm in 1975 (Weiss, 1983, p. 440).
A subsequent and perhaps ultimate stage in the evolution of the large corporatk>n as a collectk)n of separable business units became the buying of a large company in order to sell off all the parts, the sum of the parts being perceived to be worth more than the whole. Quaker bought Anderson Clayton in 1986 with the expressed intention of keeping only Gaines pet food. As things worked out, Quaker was able to sell off the unwanted businesses of Anderson Clayton for enough to tower the cost of Gaines from the $250 million that Quaker had offered earlier to only $50 million (Bhagat, Shieifer, and Vishny, 1990, p. 59). In another case, Beatrice was sold in a leveraged buyout, and many of its constituent businesses were then sold, with the remainder being sold to ConAgra in 1990 {Wall Street Journal, March 11, 1988, April 10. 1989, and June 8, 1990).
14

The so-called market for corporate control in the 1970's and 1980's was singularly focused on shortrun profits to be made in that market. Hostile takeovers and leveraged buyouts (LBO's) were principal tools, with seltoffs of constituent businesses the other major component. The consequences, beskles some quick profits for the players, were major corporate restructuring and greatly increased debt load. Liabilities of all manufacturing corporattons increased from 88 percent of net worth at the end of 1974 to 135 percent by September 1990, with most of the increase appearing in the 1980's. (For food and tobacco corporatk)ns, liabilities averaged double equity, reflecting the large LBO's in the fiekJ.) This provided much greater leverage for acquirers and investors. But, it also put businesses at much greater risk: with interest costs half of pretax profits in good times, how much drop in earnings can a highly leveraged firm withstand in a major recessk>n?
The sharply increased use of "junk bonds" (high-yield, high-risk bonds) in leveraged buyouts and mergers not only created a new class of industrial bonds but also changed the status of other bonds issued by the same companies. The major rating services routinely reevaluate all the bonds of companies issuing junk bonds, and the existing bonds are often downgraded. Many mutual funds have soW industrial bonds as too risky, concentrating on bonds issued by governments, utilities, banks, and foreign companies (Siconolfi and Jasen, 1988).
Some analysts who believe in the "market for corporate control" argue that the events of the 1970's and 1980's have given a warning to less-than-competent management that others more able are ready to take over. But, the competence of their potential rivals lies in maximizing "value" in the short run-by raising stock prices-and such moves ignore the tonger run. The need for a company to put a signifiant portion of its profits into investments for future growth in sales and profits, which drove successful businesses until fairly recently, is no tonger a priority. The importance of research and devetopment, investment in plant and equipment, and the building up of tong-term customer loyalty are often no longer seen as necessary to success.
The acquiring company, since the 1960's, has seldom provided the better management envisioned in the theory. The increased sharehokler value (that is, higher stock prices) has usually benefited the sharehoWers of the acquired company but seldom those of the acquirer, except for corporate raiders who thrive on the failures of
15

acquirers (Porter, 1987; Scherer, 1988; Ravenscraft and Scherer, 1987).
On the other hand, the threat of takeover has pushed many companies into efficiency-enhancing measures, such as layoffs of white-collar workers, the ctosing of marginal plants, construction of superplants using the latest technotogy, and introduction of strrct quality control and inventory management.
New products are increasingly "me-too" products, only slightly different from those of competitors. The consulting firm. Product Initiatives, rated only 12 percent of 1986 introductions of grocery and drug store products as truly innovative, down from 16.4 percent in 1985. Some firrDs have made efforts to go beyond this practice. Colgate and General Foods are experimenting with small separate departments that are assigned to develop truly innovative products that the regular research and marketing departments would immediately reject as too risky (Alsop, 1988).
Some companies attempted to return to the pattern of an earlier era when some relatbnship existed between the constituent activities of a firm. A lessening of the unrelatedness of the parts of many conglomerates was the result. Having learned the hard way the difference between commodities and branded products, conglomerates left the fresh meat business in a near-stampede, and those who had essayed fluid milk found buyers for such units.
In the 1990's, emphasis has begun to switch from maximizing sharehokJer value in the short run to tonger run goals. Dividends are again acquiring importance, research and development is reemerging, and efficiency of operations and concentration on more profitable operatbns are receiving increased attention.
Another aspect of the corporate world is the globalization of business in the past 20 years. This has extended the reach of many giant firms into other devetoped countries. All means of expansion, such as mergers, acquisitbns, and leveraged buyouts, are now employed by firms headquartered in the United States, Europe, Canada, Japan, Australia, and elsewhere.
We will examine the effects that the changing economic climate has had in food retailing, food service, wholesaling, and manufacturing.
16

Characteristics of the Food Industries^
The corporate world, driven by the stock market, international competition, and tighter economic conditions, has shaped the food industries. The changes in the consumer workJ-demographic, economic, and social with its varied lifestyles-strongly affect the parameters within whkîh the food industries operate at all levels.
Slowly Growing Market
The market for U.S.-produced farm products is primarily donfiestk:: only 16 percent of U.S. farm output was exported in 1989, much of it unprocessed products, primarily grain. Exports of processed foods were 4 percent of output, approximately equal to imports. The U.S. food market grows sk>wly, since in the long run it is driven by populatk>n growth and by growth in real per capita disposable income. But, population is growing less than 1 percent per year. Overall, each 1 percent increase in real disposable income, per person, is estimated to expand the demand for all foods by only 0.18 percent. During the 1980's, income growth averaged 1.5 percent per year. If everything else were constant, the growth in domestk: demand for all food, due to increases in income and population, would have been less than 1.3 percent per year during the 1980's.
Between 1967 and 1988, per capita food consumptton grew 9.8 percent and population 24 percent, so aggregate consumption in quantitative terms (the product of per capita consumption tinf>es population) increased 36.1 percent. Over the same period, food expenditures at constant retail store prrces increased 40.8 percent, so there was a modest shift in spending to higher priced and value- added products.
Small Margina
Individual food firms trying to achieve the growth needed to remain competitive in capital markets have few options: increase market share, take on value-added activities, or expand into foreign markets. Competitton for market share leads to a pervasive characteristic of the food sector: lower returns per dollar of sales than in many other lines of business.
^ This section draws on Myers, 1991.
17

Net margins vary among firms, but the following averages for 1987 indicate the importance of high-volume sales to a firm's ability to generate competitive returns on shareholders' equity:
Sector Net margins
Percent of sales
Food retailing 1.0 Food processing 3.7 Food wholesaling 4.1 Eating and drinking places 1.0
Source: U.S. Internal Revenue Service, 1991.
Since the aggregate market grows slowly, pressures to expand volume provkle incentives for mergers and consolidation of firms, decreasing the number of firms and increasing market concentration.
Technology and Economies of Size
With such k)w price/cost margins in food production and marketing, firms have strong incentives to seek cost savings from new technology. Especially in production agriculture and in food processing, technology has tended to shift resources from labor to capital-intensive inputs. This shift has increased the optimal firm size, since capital inputs tend to lower unit costs of production only at higher levels of output. Thus, technological change increases incentives for larger fimis and rooxe concentrated market shares.
Classic examples of technobgical breakthroughs in U.S. industrial history are the introductk>n of continuous-process production by James Duke with the Bonsack cigarette-rolling machine and Henry Crowell's continuous-process oatmeal production in the 1880's. Their firms suddenly could produce many times the output of their entire industries. Both turned to massive advertising to create markets and, within a few years, both had merged with their major competitors (Chandler, 1977, pp. 290-94).
Since World War II, new technology has created numerous new food industries, which developed vigorous advertising and pronrtotion programs and, eventually, led to mergers and acquisitions.
18

Production, Quaihy, and Market Uncertainty
The severe economic penalties of operating at less than full capacity move nr^nufacturers to seek ways to reduce uncertainty in commodity supplies and market demand. For example, an ERS study shows that, in beef slaughtering and processing, fixed and variable costs per unit in the largest plant modeled are 10 percent higher at 80 percent of capacity than when the plant operates at full capacity. Unit costs are nearly twice as high in the smallest plant modeled as they are in the largest (Duewer and Nelson, 1991).
Uncertainties of weather and fragmentatk>n of production over many farms combine to produce uncertainties about supply: in quantities, in the stability of quality, and in raw commodity prices. For some commodities, Government farm programs serve to reduce price and output risk and thus reduce the need for private coordinating initiatives. However, as farm policy becomes more market-oriented, price risks increase, and we may see pressures for more formal vertk:al coordir^ation in some commodities. In particular, forward contracting of grains and cotton has waxed and waned in the 1970's and 1980's with variation in prospective farm prices.
The economic incentives to increase market share and to capture size economies have also led to the nationalizatk>n and, more recently, the internatk>nalization of final product markets. This introduces a whole new set of scale and scope economies that favor large firms. Such economies include investment in large, well- coordinated distributk^n systems, volume discounts on advertising and promotk>n, and the market power to vie for increasingly scarce shelf space in retail foodstores. Emphasis on stock prices as an indicator of corporate performance accentuates pressures to increase efficiency and to concentrate on the most profitable activities of the large corporation, whrch often involve branded, value-added products.
As the prevk>us sectk>n indicates, many changes have taken place at all levels of marketing during the past 40 years. Changes in food retailing, food servk^e. wholesaling, and manufacturing are discussed in the next four sectk>ns of this report. Then product changes are discussed, followed by the effects of health consciousness and food safety concems on food marketing.
19

Food Retailing
Food retailing has been rearranged drastically since World War II. The present system is barely recognizable as the distant descendant of that of 1950. Contributing factors include technology (especially in transportation), altered lifestyles, and rising consumer incomes.
The most striking feature of the food retailing story is the supermarket's growth to dominance. The supermarket was an offspring of the Depressbn, brought forth by the increasing availability of automobiles. Constructk>n of new supermarkets, restrained during World War II by shortages of building materials and labor, exploded in the late 1940's. With only a brief pause during the Korean conflict, the supermarket share of foodstore sales leaped upward year after year into the 1960's.^ Then growth slowed. Real food sales in supermarkets (adjusted for inflation) increased 13-15 percent per year into the mid-1960's, and nonfood sales rose even faster, mostly because of new and larger stores. During the late 1960*s, the rate of increase stowed to 4-5 percent per year. Overstoring (a saturation of available supermarket sites and of the market for their wares) became a problem.
When the postwar supermarket building boom ended, competitive strategies changed. Trading stamps and other promotions became common. Private brands, long used by large chains for dry grocery items, appeared for a wider variety of products. Other types of retail stores were tried: convenience foodstores, discount houses, drive-in dairies, and many others.
In the 1970's, as inflation surged, consumers became much rr\ore sensitive to prtoes than they had been for some time. Supermarket operators, striving to improve their image and to obtain a competitive edge, turned to discounting, "every-day-low-pricing," and other price-conscious strategies. Trading stamps, which were found in two-thirds to three-quarters of all supermarkets in the mid-1960's, by 1970 were back at the level of the mid-1950's. Since then, the stamps have neariy disappeared.
^ Supermarkets completed the conversion to self-service in the meat department during the 1950's. In 1951, only 41 percent of supemnarkets were completely self- service in meat and 21 percent were partially self-service. By 1957, 87 percent were all self-service and 10 percent partially self-sen/ice (Supermarket Institute, 1954 and 1958).
20

The 1970's brought a further stowing of the supermarket growth rate, which fell below 1 percent per year in real sales of both food and nonfood products. The supermarket boom ended; thereafter, growth was by means other than building additional supermarkets. Rapid food price inflatton in the mid-1970's created a variety of different opportunities for supermari<et operators. Many opened warehouse stores that emphasized minimal sen/ices, lower costs, and tower prices than conventional supermari<ets.
Since the mid-1970's, several new store formats have appeared, each appealing to a different market segment. The trend toward larger stores continues, as indtoated by the increasing importance of the superstore, oombinatton store, superwarehouse store, and hypermarket (table 2). The share of superstores nearly doubled in the 1980's, as dkJ that of combination food and drug stores. The number of superwarehouse stores, including the new hypermarkets, nearly tripled. The hypermarket is a one-stop shopping supermarket that brings together a broad variety of food and nonfood products in a single store of about 120,000 square feet, roughly five times the size of a conventtonal supermarket. Conventional supermarkets, the largest single sales segment, decreased from 73 percent of supermarket sales in 1980 to 42 percent in 1989.
The share of warehouse, supen^/arehouse, and limited assortment stores-whtoh feature tower prices-rose from 5 to 16 percent, while superstores, combinatton stores, and hypermarkets increased from 22 to 42 percent. Not every supermarket chain has put its emphasis in one of these options. Food Lion, a conventional supermarket chain that emphasizes tower prices, also sharply increased its sales.
Food retailers continue to experiment and synthesize successful elements of supermarket formats, so that distinctions among formats are becoming blurred. For example, the products and services offered by superstores and combination stores are often very similar, but margins and prtoes are different. The instore pharmacy, universal in combinatton stores, has been introduced to supen/varehouse stores. And, the tow-margin strategy of warehouse stores has been applied to the grocery products of very large combination stores with extensive service and specialty departments.
As some warehouse stores have tried to broaden their appeal by expanding product variety and adding service departments, such stores have become vulnerable to competitors that emphasize rock- bottom prices, such as the wholesale club/cash-and-carry outlets, limited assortment stores, and traditional warehouse stores.
21

Table 2-Share of supermarket sales by store format
Type of supermarket ^ 1980 1982 1984 1986 1988 1989
Percent
Conventional supermarket Superstore Combinatk)n food and
73.1 17.7
47.9 28.9
49.7 28.3
47.4 27.5
42.9 30.2
42.0 30.6
drug store Warehouse or limited
4.0 8.3 8.0 8.0 8.6 8.8
assortment store Superwarehouse store Hypermarket
4.2 1.0
14.9 11.9 1.7
.4
12.3 3.2 1.6
12.2 3.9 2.2
12.3 4.0 2.3
All supermarkets 100.0 100.0 100.0 100.0 100.0 100.0
- s Not available. ^ See box, on p. 23, for definitions.
Source: Galk), 1992.
Wholesale club stores, originally meant to serve businesses, emphasized volume purchases, such as larger sized containers or case lots, and operated on a cash-and-carry basis.^ In recent years, such stores have extended participation to the public through membership fees or through affiliation with a credit union or similar consumer group, but sales of food products are still nnore commonly made to restaurants and institutions than to individuals. Although food products are the largest category in number of items, variety is limited to about 4,000 nonperishable items, often sold in larger institutional packages, multipacks, or by the case. Other major categories include clothing and linen, housewares and hardware, electronics, and appliances.
' Wholesale club store: A membership retail/wholesale hybrid with a varied selection and limited variety of products presented in a warehouse-style atmosphere. These 90,000-plus square foot units have 60-70 percent of sales in general merchandise and health and beauty aids as well as a grocery line dedicated to large sizes and bulk sales. Memberships include both business accounts and consumer groups.
22
Store Formats
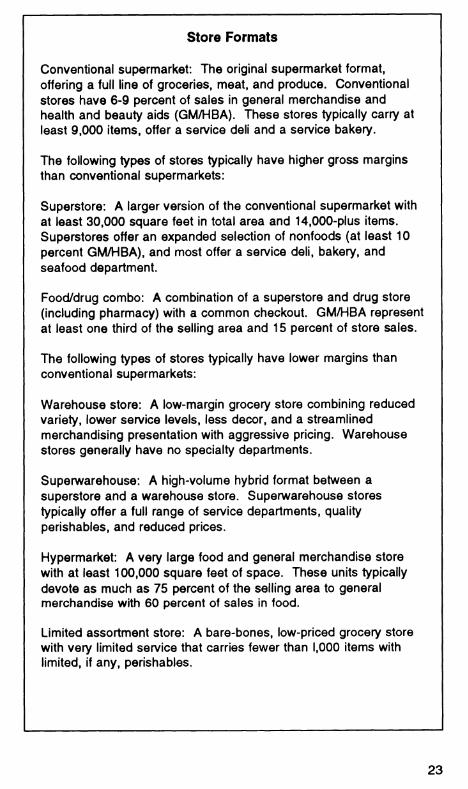
Conventional supermarket: The original supermarket format, offering a full line of groceries, meat, and produce. Conventional stores have 6-9 percent of sales in general merchandise and health and beauty aids (GM/HBA). These stores typically carry at least 9,000 items, offer a service deli and a service bakery.
The following types of stores typically have higher gross margins than conventional supermarkets:
Superstore: A larger version of the conventional supermarket with at least 30,000 square feet in total area and 14,000-plus items. Superstores offer an expanded selection of nonfoods (at least 10 percent GM/HBA), and most offer a service deli, bakery, and seafood department.
Food/drug combo: A combination of a superstore and drug store (including pharmacy) with a common checkout. GM/HBA represent at least one third of the selling area and 15 percent of store sales.
The following types of stores typically have lower margins than conventional supermarkets:
Warehouse store: A low-margin grocery store combining reduced variety, lower service levels, less decor, and a streamlined merchandising presentation with aggressive pricing. Warehouse stores generally have no specialty departments.
Superwarehouse: A high-volume hybrid format between a superstore and a warehouse store. Superwarehouse stores typically offer a full range of service departments, quality perishables, and reduced prices.
Hypermarket: A very large food and general merchandise store with at least 100,000 square feet of space. These units typically devote as much as 75 percent of the selling area to general merchandise with 60 percent of sales in food.
Limited assortment store: A bare-bones, low-priced grocery store with very limited service that carries fewer than 1,000 items with limited, if any, perishables.
23

Supermarkets have been defined by industry practice in terms of a minimum level of annual sales. Originally $250,000 in the 1930's, the level has most recently been raised to $2 million. Adjustments have been made at discrete intervals, with resulting discontinuities in the definition of a supermarket. This report uses an alternative approach, defining a supermarket as a grocery store with annual sales of $1 million or more in 1972. An index of the prices of all items sold in grocery stores was constructed, and minimum sales in all other years are defined in then-current dollars. Thus, the minimum sales for a supermarket in 1990 was $3.1 million, while in 1939, it was $287,500 (app. table 7). (By definitbn, no change takes place in real terms.) Since 1977, 61-64 percent of all food sales for home use have been by supermarkets (fig. 8).
Convenience stores were developed in the late 1950's, starting in the South and West. To some extent, they filled the same role in the expanding suburbs that mom-and-pop grocery stores had filled in older communities. A number started as dairy stores, with milk accounting for as much as 40-50 percent of sales. These helped to fill the niche of home delivery of milk, which was declining.
In the 1970*s and 1980's, with skyrocketing gasoline prices, many convenience stores added self-service gasoline pumps. More recently, carryout foods, hot sandwiches, and in-store eating have boomed, increasing from 3-4 percent of nongasoline sales in the 1970's and early 1980's to 13 percent in 1989.^* Many large retailers of gasoline have added convenience store operations, so we now have convenience stores with and without gasoline and gasoline stations with food (table 3). Convenience stores in gasoline stations are generally smaller than conventional convenience stores.
Other grocery stores-superettes and mom-and-pop stores-made half of food sales for home use in 1948 and 14-18 percent since 1977. The share of specialty foodstores-meat markets, retail bakeries, fruit and vegetable stores, health or natural food nnarkets, ice cream stores, and others-declined from 15 percent in 1948 to 6-7 percent in the 1980's.
Chains as Competitors
Grocery store chains increased sales from 35 percent of U.S. grocery store sales in 1948 to 64 percent in 1987 (table 4), dropping to 62 percent in 1989.
* Data from National Association of Convenience Stores.
24

RgureS
At-home food sales by type of store
Percent of expenditures
lOOF
75-
B Others'
■ Specialty foodstores
E Other grocery stores
0 Convenience St ores
1 Supermarkets
50-
25-
1948 54 58 63 67 72 77 82 87 90
■Includes other flores, home deliveries, mail order, and sales by famws, manufacturers, and v^olesalers.
National chains (A&P, Safeway, and Kroger) have lost share during the past 30 years to regional, sectional, and local chains.
Grocery chains play important roles in the food business both as sellers and buyers. But, the geographic scope of the markets in which chains sell differs markedly from that in which they buy.
Chains as Sellers
The selling range of a chain is typically smaller than the range of its buying efforts. An individual urban supermarket usually draws its customers from within a 5-mile radius. Warehouse stores and superstores reach somewhat farther. Large chains space their supermarkets at 3- to 10-mile intervals to cover a metropolitan area, while smaller chains often concentrate in one area within the market.
Since the major means of contacting potential customers is the weekly or more frequent ad in the daily newspaper, the circulation area of those newspapers (where they are home-delivered) defines the retail market. This delineation is often used by commercial agencies. In publicly generated statistics, this territory overlaps the
25

Table S-Number, sales, and sales distribution of convenience stores and gasoline stations, 1987
Establish- ments Sales
Sales distribution
Type Food Meals and
snacks
Packaged alcoholk) beverages
Other grocery items'
III
Number Million
dollars - - - Percent -
Convenience foodstores: Without gasoline With gasoline
30,900 18,700
15,400 12,400
34.8 14.9
13.1 11.3
14.9 12.9
37.2 31.3
0 29.6
Gasoline stations: With convenience store
Other with
groceries
15,700
65,200
16,100
67,200
17.3
2.7
6.5
.3
6.1
.6
17.5
3.4
52.6
93.0
^Nonfood groceries, tobacco, drugs, health and beauty aids.
^Automotive fuel, lubricants, tires, batteries, and accessories; repairs and sen/ice; other.
metropolitan statistical area, which is typically somewhat smaller. Some indication of the state of competition on the selling side is given by the average share of grocery store sales by the four largest chains in metropolitan areas during 1954-82 (table 5). No earlier or later figures are available.
Four-firm concentration^ in U.S. marl<ets has risen slowly during the postwar years. This does not mean that the major supermarket groups in a market are increasingly able to get together and raise prices, as one theory proposes. In the world postulated by this theory, such colluston is regarded as the inevitable result of high levels of concentration. In the actual markets, effective levels of competition restrain such price enhancement.
* The share of grocery store sales in a particular mar1<et that is made by the four largest companies in that marlcet.
26

Table 4-Share of sales of grocery store chains by type of chain
Type of chain
All Year chains National Regional Sectional Local Wholesalers Other
Percent
1948 34.5 18.7 3.9 3.1 5.6^ 3 3.2 1954 38.8 19.1 6.3 2.9 7.6^ 3 2.9
1958 46.7 20.9 8.7 4.5 11.1^ 3 1.5 1963 49.4 18.8 9.6 6.6 11.4 1.4 1.6
1967 51.4 16.2 8.5 6.6 13.4 1.6 5.1
1972 55.9 15.4 9.2 11.7 11.2 1.5 6.9 1977 58.7 15.4 10.1 11.1 14.5 1.3 6.3
1982 61.5 12.2 11.1 10.8 20.2 3.5 3.7 1987 63.5 13.3 12.7 6.8 23.5 2.7 4.5
^National: Stores in three or more geographic divisions (A&P, Safeway, and Kroger in all years). Regional: Stores in two or more geographic divisions. Sectional: Multimarket; stores in one or more geographic divisions. Local: Single market. Wholesalers: Chains owned by grocery wholesalers. Other Chains of convenience stores and grocery stores smaller than supermarkets.
^Includes chains owned by wholesalers. ^Included with k>cal chains.
A comprehensive study of supermarket prices in a random sample of markets, stores, and products found no evidence that a high firm market share, which could, in theory, result in unilaterally raised prices, signiffcantly affected supermarket prices. The leading firms had diverse prrcing patterns, with no apparent relationship to four-firm concentration within the market or to the market share of the individual firm (Kaufman and Handy, 1989). Each firm adopted a somewhat different market strategy to maintain its place in the market or to improve it.
Chains as Buyers
As buyers, chains operate in a much larger market, always regional and often national in scope. Since every chain usually buys some nationally branded products, such chains are necessarily participants in national markets. Therefore, changes in the shares of national grocery store sales made by the various types of chains reveal much
27

Table 5-Average share of sales of four leading retail grocery store firms in metropolitan statistical areas
Population dass^ 1954 1958 1963 1967 1972 1977 1982
Fewer than 250.000 250,000-499,999 500,000-999,999 1 million or more
25.6 36.8 37.4 43.5
30.1 40.4 41.4 45.6
31.9 41.7 41.1 45.8
Percent
36.5 42.5 43.8 45.4
48.2 45.7 47.4 49.9
58.2 48.8 50.9 52.9
61.2 55.5 54.1 54.9
^A metropolitan statistical area (MSA) defines an integrated economic and social unit such as a city and its suburbs. Population as of 1980.
Sources: Special tabulations from Census of Retail Trade, U.S. Department of Commerce, Bureau of the Census, and ERS. Total sales of grocery stores (the denominator) indude stores without employees.
about the relative status of buyers and sellers in the wholesale market for grocery store products.
The largest chains maintain large staffs of buyers who purchase most products, including perishables, directly from manufacturers or shippers. The large chains also manufacture significant anfX)unts of their own private label products, although this is less true than in earlier years. Such chains also operate their own warehouse and distribution systems. Small chains, however, typically obtain most or all of their supplies from full-service grocery wholesalers, thereby attaining similar economies of size to those of larger chains but assigning much of the buying function to the wholesaler. Chains intermediate in size have a variety of buying patterns, combining large-chain and small-chain procurement methods.
In this study, chains are grouped as supermarket chains which operate their own distribution centers at least for dry groceries, supermarket chains operated by grocery wholesalers, and all other chains. Such groups vary in composition from year to year. Other chains include those supermarket chains not operating a warehouse, convenience store chains (including 7-Eleven, which operates some warehouses), as well as chains of other grocery stores.
28
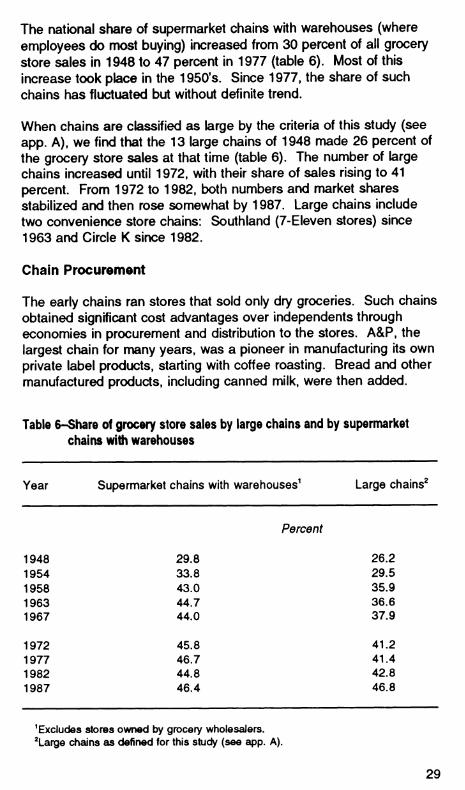
The national share of supermarket chains with warehouses (where employees do most buying) increased from 30 percent of all grocery store sales in 1948 to 47 percent in 1977 (table 6). Most of this increase took place in the 1950's. Since 1977, the share of such chains has fluctuated but without definite trend.
When chains are classified as large by the criteria of this study (see app. A), we find that the 13 large chains of 1948 made 26 percent of the grocery store sales at that time (table 6). The number of large chains increased until 1972, with their share of sales rising to 41 percent. From 1972 to 1982, both numbers and market shares stabilized and then rose somewhat by 1987. Large chains include two convenience store chains: Southland (7-Eleven stores) since 1963 and Circle K since 1982.
Chain Procurement
The early chains ran stores that sold only dry groceries. Such chains obtained significant cost advantages over independents through economies in procurement and distribution to the stores. A&P, the largest chain for many years, was a pioneer in manufacturing its own private label products, starting with coffee roasting. Bread and other manufactured products, including canned milk, were then added.
Table 6-Share of grocery store sales by large chains and by supermarket chains with warehouses
Year Supermarket chains with warehouses^ Large chains^
Percent
1948 1954 1958 1963 1967
29.8 33.8 43.0 44.7 44.0
26.2 29.5 35.9 36.6 37.9
1972 1977 1982 1987
45.8 46.7 44.8 46.4
41.2 41.4 42.8 46.8
^Excludes stores owned by grocery wholesalers. ^Large chains as defined for this study (see app. A).
29

In the mid-1920's, A&P began to develop its national buying organization with canned fruits and vegetables. Produce and meat were added as these became important. The Atlantic Commission Co. (ACCO). the produce-buying agency of A&P, sold to the trade as well as to A&P from the 1920's until a 1949 court decision forbade such outside sales. The National Meat Department was organized in 1931 to buy meat for all divisions. During the 1930's, this agency resold to outside trade about 25 percent of the meat it bought (Adelman, 1959, p. 125).
The procurement of advertised brands of dry grocery products by chains and voluntary and cooperative groups was early stopped from fully exploiting the economies of mass buying by the Robinson- Patman Act. This act forced large chains to pay the same prices as small grocers. Many chains then turned to private label brands, and some began to manufacture selected items in their own plants.
Quality assurance for dry grocery products can be obtained fairly simply by specification buying or by buying national brands, but quality problems are not so easily solved in the procurement of perishables. During World War II, compulsory grading of meat freed many chains from dependence upon the few national packers. Such chains switched from advertising Armour's Star or Swift's Premium to promoting U.S. Choice beef. Hundreds of middle-sized meatpackers became potential sources of supply in this way. Retailers found the strategy so successful that it became the dominant practice in meat departments after the war. This development contributed to the decline in the sales and power of national packers and to the growth of regional packers.
In the postwar perkxJ, egg procurement shifted to more direct buying. Some chains purchased directly from cooperatives or country shippers. Others built their own assembly, grading, and packing facilities. More recently, procurement has been direct from large producer-shippers. Chains that had earlier gone into egg assembly and packing have found such steps unnecessary to obtain eggs of the quality desired at competitive prices.
Broiler and turkey enterprises were largely postwar developments. The dominant marketing method changed from New York dressed birds (feathers and blood removed) to those eviscerated (legs, head, and viscera renrx>ved), and chains then switched to direct buying from processing plants in the production areas. Quality variation in this market is small, and chain buyers have little difficulty in buying grade A broilers or turkeys.
30

Changes in the procurement of fresh milk and bread are more recent. Except for Safeway and Kroger, which started building their own milk plants before World War II, the chains operated much like small grocery stores until relatively recently, carrying several brands of milk from major kxîal milk processors. Milk and bread were handled by grocery stores on consignment. The processor's deliveryman, working on commisston, delivered the milk and bread to the store, arranged it in the case, and picked up returns. The process might be repeated one or more times during the day. Prrces were set by the processor (see Holdren, 1960; Harris, 1966 and 1967; Manchester, 1983). But, in the 1960's and 1970's, procurement shifted almost completely to one where chains and voluntary and cooperative groups featured private label milk. Each chain, by contracting with one processor to supply private label milk to an entire division, could obtain its supplies at a minimum price. Substantial economies in delivery were frequently possible by eliminating costly sen/ices. For example, delivery could be taken at the processor's dock or at the chain warehouse and the milk distributed in the same trucks used for other perishable products. Often, processors of private label milk were permitted to furnish their own brands as well. Pricing decisions, made by chain management, usually set prices of processor brands at a differential above private label. The change in methods of bread procurement was generally similar.
Direct buying of fresh fruits and vegetables from the shipping point has been the practice of large chains since the early 1920's. In the postwar period, many more chains became large enough for such direct buying, and the share bought direct increased sharply until it leveled off in the late 1960's and early 1970's (fig. 9). The share declined somewhat in the 1980's, as more chains bought through full- sen/ice wholesalers, and the foodservice share increased. Quality is probably more crucial for fresh fruits and vegetables than for other perishables. Chain procurement methods reflect this. First emphasis is on quality-not necessarily top quality, but a consistently acceptable level-with secondary emphasis on price. The chains have appar- ently achieved little, if any, price advantage over other types of buyers at shipping point, but they have achieved lower costs at the warehouse by eliminating wholesale market costs.
Food Service
The most striking change in food nriarketing and consumption has been in away-from-home eating. Food service (away from home) has nearly doubled, in dollar terms, its share of the final food market,
31

RgureQ
Direct receipts of fresh fruits and vegetables by retail chains
Percent'
40
35-
30-
25- •■
20
151 I I I I I I I I I I I I I I I I
1936 58 60 70
I I I I I I I I I I I I I I I
80 90
'Percent of total arrivals (i^cads). A(|usted for varying coverage of martots In the survey.
Sources: MarK^hester. 1064, for1936 and 1958. U.S. Dept. of Agriculture. Agricultural Marlceting Service, Fruit and Vegetable Division, for 1960-90.
largely due to rising incomes and changing lifestyles. Much of the growth within food service is in fast food, again as a response to rising incomes, the demographics of the baby boom, and changing lifestyles.
From 1954 to 1990, the share of total food dollars spent away from home increased from 25 percent to 46 percent and the share of total food quantities from 22 percent to 33.5 percent (see fig. 5). During this period, prices of food away from home rose 32 percent more than prices of food bought for use at home, which accounts for the difference between the growth rates for expenditures and quantities. Two major factors affecting the choice between food at home and away from home are rising real incomes and the increase in multiple- earner households, which boost family income and provide incentives for eating out.
Fast food accounted for two-thirds of the growth in the away-from- home market (fig. 10). Fast-food restaurants were largely a creation of the 1950's. Their rapid penetration into every community in the
32

RgurelO
Foodservice and fast-food sales as share of all food expenditures
Percent of food expenditures
/\j
45.7
60 -
50 39.4
40 - 33.7
30 24.2
1 1
26.6
20 - 15.7
11.0 ^B 10
1.5 1.9 62 ■ 1
80 1
1950 60 70 90
iFast-lood D Foodservice
1960's and 1970's led to market saturation by the late 1970's. Building additional outlets was no longer the profitable means of growth for the major fast-food organizations. Instead, many have tried other means of growth, such as salad bars and breakfasts. Hamburger chains have added chicken itenris. Pizza establishments that serve only the takeout trade are now common, and some of these have large delivery networks.
Fast-food establishments include not only the familiar hamburger and hotdog stands but also the rrore recent pizza parlors, fried chicken establishments, fish places, Mexican food establishments, and an ainrïost unending variety of others. Some are developed partly as fully owned chain outlets, but franchised outlets are more important (table 7). Much of their business is not for onpremise consumption but for takeout (fig. 11).
33

Table /-Franchise systems in eating places
Share of sales of Year Share of sales of eating places by franchise systems by
franchise systems^ franchised outlets
Percent
1969 17.9 76.5 1972 25.1 74.2 1977 35.0 68.9 1979 36.2 68.2 1982 37.6 65.1 1988 45.1 65.3
MncludGS fully owned chain outlets and franchised outlets. Eating places excluding contract feeding and caterers.
Sources: U.S. Department of Commerce, 1990b, and Kostecka, 1981, 1989.
Getting the Chef Out of the Kitchen
A major aim in all types of food service has been to reduce labor inputs. In fast-food establishments, streamlined menus mean less l<itchen labor, and self-sen/ice reduces the labor out front. Even in many conventional restaurants, full sen/ice is now maintained only in the dining room, while the reduction in labor in the kitchen has become nearly as great as in fast-food emporiums.
However, not all restaurants are moving in this direction. There is an opposing trend with emphasis on quality and service. For patrons willing to pay the price, many new restaurants emphasize quality, variety, and service. But even among quality restaurants, many- especially the chain operators-provide only a limited line. Such places, of course, appeal to a different segment of the market than do the purveyors of fast food. These patrons may be people who are differentiated by income and tastes, or at times may be the same people in different circumstances. A family with all the kids in tow may patronize a hamburger stand or a pizza place, while the husband and wife, on another occasion, may dine at a full-service restaurant.
Such changes have markedly affected suppliers to the away-from- home market. The emphasis on decreasing labor in restaurant and
34

Rgurell
Takeout a8 share of sales of eating places
Percert
601
50
30
20
10
Fast-food places'
Restaurants and lunchrooms'
1972 77
'Exiudes Ice cream and frozen dessert stands.
'Excludes cafeterias.
82 87
institutional kitchens has created a strong demand for a new class of supplier.
These new suppliers are known by many names; a common term is "fabricators." Fabrk:ators supply growing amounts of prepared and semiprepared foods, which lets the restaurant or institution serve the item with a minimum of labor input. For example, meats are being cut, wrapped, and boxed at the packing plant and delivered oven- or grill-ready. Operators can buy steaks, roasts, or hamburger as needed. Other suppliers prepare main courses or complete meals in a fashion analogous to the TV dinners available in the supermarket. Complete meals or at least main courses needing only heating are particularly comniX)n on airlines and in other establishments with limited kitchen space.
Growth and Change
The modern fast-food business got its start in the 1950's. although, of course, hamburger and hotdog stands existed before then. For 20
35

years, the number of fast-food units and sales rose sharply in most years. From 1968 to 1976, real sales (adjusted for inflation) rose an average of 11.6 percent per year. By the mid-1970's, most of the suitable sites for fast-food operations had been filled, and overstoring then became a problem, as it had become for the supermarkets a decade earlier. From 1977 to 1989, real sales rose only 4.4 percent per year, on average.
Driven by the lure of instant market penetration and the waning availability of high-trafffc primary site locations, foodsen^ice chains turned to acquisitions. Although new store constructk>n continued at a quick pace, some chains significantly extended their geographk: reach by acquiring struggling competitors, which they converted to their own concept. Since it cost at least as much to acquire and convert existing sites as to build freestanding units, the motive clearly was to expand rapkJIy and to acquire prime locations.
The growing importance of food service in food marketing and of public eating places within food service has meant that the performance and behavior of the food marketing system have greatly changed over the past 20 years. The present dominance of chains- owned and franchised~in fast-food and, to a lesser extent, in full- service restaurants means that menu items are unvarying from day to day. A hamburger emporium will always serve hamburger, and a pizza place will offer pizza. Thus, demand for specific foods has become much less responsive to changing price. Fixed-menu eating places now do much more business than do restaurants with more flexible menus that can be adjusted away from items with rising prices. Eating places with fixed menus nr^de 56 percent of sales in 1966, rising to 73 percent in 1979 and 80 percent in 1988 (table 8). However, the dominance of hamburger places in the fast-food business has grown somewhat less.
Business relationships between suppliers and their customers are quite different for food service from those for grocery stores. Contracts, agreements, and established practices differ.
In order to assure dependable supplies for their outlets, some food- service chains contract with shippers for price, quantity, quality, and product form for some produce. The product is sometimes bought partially prepared. Lettuce, for example, is shipped in 1,000-pound bins and then shredded for fast-food chains to use in sandwiches and salads. Contract prices are less variable than open market prices, and quantities are relatively fixed. Thus, residual quantities in the
36

Table 8-Share of sales of eating places by menu specialty^
Menu specialty 1966 1979 1988
Percent
Varied American plate meals 44.1 26.8 20.2 Cafeterias 5.1 3.5 2.8 Other 39.0 23.3 17.5
Fixed menu 55.9 73.2 79.8 Steaks, full menu 8.1 14.0 11.8 Chicken 3.9 4.0 3.5 Seafood 3.8 5.7 2.1
Sandwiches, hamburgers, and the like 23.0 33.3 36.8 Hamburgers, hot dogs - 25.5 25.0 Sandwrches -- 6.4 10.4 Frozen dessert stands -- 1.4 1.4
Nationality foods: Italian 2.7 2.2 -- Mexican -- 4.2 7.0 Other 7.7 -- --
Other: 6.7 Pizza -- 6.5 11.4 Pancakes, waffles -- 1.0 2.2 Miscellaneous -- 2.3^ 5.0^
Total 100.0 100.0 100.0
- m Not available. ^Excludes contract feeding and caterers. ^Includes those nationality foods for which data are not available.
Sources: 1966: Van Dress and Freund, 1968. 1979: Estimated from Van Dress, 1982, and Kostecka, 1981. 1968: Estimated from Kostecka, 1989.
free nnarket become more variable, in turn causing price variability to increase.
37

Carryout: Fast Food versus Grocery Stores
In recent years, the competitive battle among food outlets has increasingly become a three-way contest among fast-food outlets, supermarkets, and convenience stores. This contest centers on the carryout segment of the market, which has long been important to fast-food outlets, but which is now growing anrK>ng convenience stores and supemiarkets as well.
The stowdown in growth of supermarkets in the 1960's and of fast foods and convenience stores in the 1970's prompted all segments to seek other sources of sales growth. Fast-food places added drive- through lanes. Many pizza outlets specialized in delivery or pickup, with no eating facilities. Half of the sales of fast-food places are now for consumptk>n offpremise, that is, carryout or home delivery. Most recently, some fast-food places have added convenience store foods, such as bread, milk, and eggs, to their carryout lines.
Convenience stores have expanded their lines of hot sandwiches and other fast foods, using microwave technology. Some have joined forces with fast-food chains to offer, say, Hardee's hamburgers in 7- Eleven stores.
Supermarkets have added salad bars and service delicatessen de- partments. Two-thirds of all supermarkets now have a service deikîatessen, with 43 percent selling hot pizza (Price, 1990). Many salad bars have added soup or other hot foods. Sitdown eating areas are provkied in 19 percent of supermarkets, mostly in con- nection with the deli. The salad bars in fast-food places compete with those in supermarkets.
When data from the USDA 1977-78 Nationwide Food Consumption Survey were compared with census figures for offpremise sales of eating places, about 7 percent of carryout foods was shown to be taken home to be eaten. The most important of these foods were fried chicken and pizza. Pizza has almost certainly increased its sales sharply since 1978.
Thus, supemiarkets, fast-food places, and convenience stores are finding that they are competing both with others in the same market segment and, increasingly, with those in other segments. Market boundaries are expanding to encompass many once separate markets. Operators of supermarkets, convenience stores, and fast- food places must expand their strategic planning to include the actions and reactions of operators in all groups.
38

Wholesale Food Distribution
Food must be moved physically from manufacturer (or shipper, for produce and eggs) to retailer or foodservice outlet, and a transaction must take place. More often than not, this operation involves one or more wholesalers. As retailing, food service, and manufacturing have changed, wholesaling has been transformed from a quiet stretch of the market where necessary functions were performed by many small firms without attracting much notice into an aggressive market segment dominated by 32 large firms.
Changes in the economrc landscape of the food sector have each played a role in the changing relative importance of various types of wholesale distributors. Since foodsen/ice operators buy most of their supplies from wholesalers, the increase in food service has provided increased opportunity for wholesalers. From 1948 to 1987, the foodservice share of all food (measured at the wholesale level) increased from 24 to 33 percent (table 9). But, only a few foodservice operators maintain their own wholesale distribution facilities. Wholesalers increasingly specialize in either distribution to food service or to supermarkets, and some who distribute to both have separate divisions and facilities for each kind. Some large manufacturers, such as Kraft, distribute to food service with much of what they sell being purchased from other manufacturers. Wholesalers who specialize in distribution to fast-food outlets also have become prominent; some deal with the outlets of a single chain, such as McDonald's.
Many perishable foods, such as fluid milk, ice cream, soft drinks, and bread, are usually delivered direct to retail stores or consumers by the manufacturers. These foods have declined in share of wholesale level sales since the 1930's but have not decreased further since 1948 (table 9).
Supermarkets have increased their market share sharply from 12 percent in 1948 to 42 percent in 1987 (table 9). Since many grocery chains distribute rTX)stly through their own warehouses, the growth of chains decreases the opportunities for wholesalers. Grocery store chains with their own warehouses increased their market share from 18 percent in 1948 to 35-37 percent in 1967-87. But, not all food sold by such chains is supplied through their own warehouses. Perishables are often delivered direct to retail stores by manufacturers, some of which may be part of the chains, especially for bread, milk, and \ce cream. Other foods are sold to chains by manufacturers* sales offices or by brokers.
39

Table S-Wholesale distribution: How the setting has changed and marlcet shares of types of wholesalers
Item 1948 1958 1967 1977 1982 1987
Percent
The setting: Through food service 24 23 27 28 30 33 Foods usually delivered by manufacturers^ 21 23 22 21 20 22
Through supermarkets 12 30 38 43 43 42 Grocery chains wrth warehouses^ 18 29 35 37 36 37
Market share:^ Merchant wholesalers 48 47 59 64 70 80 Manufacturers' sales branches 20 13 13 15 12 15
Manufacturers' sales offices 3 7 8 13 16 19
Agents and brokers 20 22 25 21 23 27
^All measured as a percentage of total wholesale level purchases of consumer foods and pet food (shipments by manufacturers and shippers plus transportation).
^Fluid milk products, ice cream and frozen desserts, fresh juice and drinks, soft drinks, bread and other bakery products (excluding cookies and crackers).
^Excludes convenience store chains. ^Total sales less gross margin (for merchant wholesalers), operating expenses (for
sales branches and offices), or commissions (for agents and brokers). Excludes assemblers.
Responding to these developments and others, the share of foods handled by merchant wholesalers increased from a range of 47-48 percent in 1948-58 to 80 percent in 1987 (table 9). The share of manufacturers' sales branches declined from 20 percent in 1948 to 15 percent in 1987 as distribution of meat, butter, and eggs shifted to other channels. Direct shipment of meat from meatpackers to chain warehouses increased sharply.
Sales through nr^nufacturers' sales offices-which take orders, with distribution made directly to the customer-rose sharply from 3 percent in 1948 to 19 percent in 1987. This increase partly reflects a shift from manufacturers' sales branches that keep stocks to sales
40

Offices without stocks, but more comes from the shift from selling through brokers and agents to using the manufacturer's own sales staff. Sales of agents and brokers fluctuated throughout the perkxJ.
Merchant Wholesalers
Merchant wholesalers, unlike agents and brokers, physically handle the goods and take title to the merchandise. They are distinguished from manufacturers' sales branches because they are not owned by the manufacturing company. Importers and exporters who handle the goods and take title are also wholesale merchants, but these firms do not account for much of the merchant wholesaler business.
Total sales of merchant wholesalers of groceries and other foods were divkled about equally between groceries and perishables from 1948 to 1987 (table 10). Perishables now include nrx)re frozen foods and meat and less dairy products and fresh fruits and vegetables.
Large Compani<»s
Food wholesaling was typically a local business until recently, although a few earlier companies operated several units, usually within a few hundred miles of each other. Until the 1950's, general- line grocery wholesalers typically did not handle perishables. But, such firms began to expand into produce, frozen foods, and--to a lesser extent-into meat during the 1950's and 1960's to offer a complete line to their retailer customers. Other firms specialized in dealing with foodservk:e establishments, the so-called institutional business.
Few wholesale companies were large until recent years by our definition, whk^h is based on natk>nal volumes (see app. A). In the 1980's, near-natk>nal chains of wholesalers were put together by numerous acquisitions.
In 1954, only five general-line grocery wholesalers had sales of $93 million or more and were classified as large by our criteria. Those five companies made 9 percent of the sales of all general-line grocery establishments. But, the number and sales share of large companies have greatly increased since then (fig. 12). In 1987, 32 large companies accounted for 65 percent of the sales of all general- line grocery wholesale establishments. In addition, 12 percent of the sales of these 32 companies were from other types of wholesale establishments, such as those handling fruits and vegetables, meat, and frozen foods.
41

Table 10-Share of sales of merchant wholesalers by type of establishment
Type of establishment 1948 1958 1967 1977 1982 1987
Percent
Dry groceries: General-line groceries 33.6 33.3 37.4 34.5 36.3 34.7 Grocery specialties 14.8 16.6 14.7 19.0 15.4 18.0
Perishables: Frozen foods 1.4 3.4 4.3 7.3 8.8 9.6 Dairy products 10.2 7.7 6.4 5.2 6.2 6.2 PouKry and products 5.2 5.8 5.2 3.9 4.5 2.9 Meat and products 11.6 15.4 17.8 16.8 15.9 14.2 Fish and seafood 2.3 2.5 2.1 3.2 3.0 4.0 Fresh fruits and vegetables 18.7 12.3 9.6 7.9 7.9 8.3
Confectionery 2.2 3.0 2.5 2.2 2.0 2.1
Total 100.0 100.0 100.0 100.0 100.0 100.0
^Each establishment is classified by its main type of goods. Thus, if a general-line grocery wholesale company also operates one or more establishments distributing meat, sales of such establishments are shown as meat. Excludes assemblers.
The transition from relatively small local organizations to near-national firms is apparent from these figures. But, the figures do not reflect expansion into perishable lines, for these types of products are often handled through separate warehouses.
As this overview shows, grocery wholesaling has now been transformed from a local business to one of near-national dimensions. Natior^al wholesalers have gained in market power both as buyers and sellers.
Food Manufacturing
The economic landscape in food manufacturing has also vastly changed during the postwar period, and this strongly affects the other
42

Rguie12
Large grocery wholesalers' share of sales of all gerieraNlne grocery wholesalers
Percenl 1001
80
GO
40
20
31
23 I
Í. i 11 1954 58 63 72 77 82 87
segments of the food system. Major elements of change were the following:
• Large companies are manufacturing a larger share of food.®
• Large companies are rTX)re diversified in variety of food products, and they have moved into nonfood and foreign operations. There has been, however, some withdrawal from nonfoods in recent years.
• Large food companies are increasingly niX)ving to specialization in fewer segments of the market, for example, to products for the grocery store trade, products for food service, or ingredients for other manufacturers. A number of companies are moving toward specializing in a single segment of the food market.
* Large companies are defined in terms of total sales (see app. A).
43

• Much of the change occurred through mergers, acquisitions, leveraged buyouts, and divestitures.
In 1950, most food and tobacco (80 percent) was manufactured by specialized companies, which operated almost entirely within a single industry, such as meat, dairy products, flour, or bakery. Only 21 companies with 19 percent of food and tobacco sales were diversified into other food or nonfood industries (tables 11 and 12 and fig. 13). Only two conglomerate companies operated in food and also in unrelated industries: Glidden in fats and oils as well as paint and Wilson in meat and also sporting goods.
In the 1960's and 1970's, mergers becanrie the preferred route to growth among large companies, and this meant diversification. The numbers of diversified and conglomerate companies jumped from 21 in 1950 to 119 in 1975, and their share of food and tobacco sales moved from 19 to 48 percent. In 1989, the number of diversified companies had declined to 100, but their share of sales rose to 56 percent.
The number of large companies in food, feed, pet food, alcoholic beverages, and tobacco manufacturing almost doubled from 87 in 1950 to 171 in 1975 and then dropped to 155 in 1989 (table 13). Large companies also became significantly larger, on average.
The share of U.S. food sales accounted for by large companies increased from 42 percent in 1950 to 67 percent in 1975 and to 68 percent in 1989 (table 14). The share of the largest four groups (with sales of $1.5 billion or more in 1975 and equivalent anfX)unts in other years) rose from 20 percent in 1950 to 29 percent in 1975 and 44 percent in 1989, largely due to mergers among large companies.
The 10 very large companies of 1950 (those in groups 1-4 in tables 13 and 14) were mainly food companies. The four large meat- packers accounted for 70 percent of the food sales of these companies, although they are classified here as diversified consumer product or congtomerate companies because of their other products, mostly extensions of byproduct lines. Two large dairy companies (Kraft and Borden) were diversified into other foods, but most of their sales remained in dairy products. Among food companies, only General Foods was widely diversified. Procter & Gamble and Lever Brothers were primarily soap and detergent companies. The 10th very large company was Anderson Clayton because of its cotton ginning and trading business.
44

Table 11-Number of companies in the food and tobacco business by type of company
Type of company^ 1950 1960 1968 1975 1985 1989
Number
Conglomerate: Food 2 4 9 18 17 16 Nonfood 0 7 26 36 30 21
Diversified consumer product Tobacco and other 0 1 7 11 7 6 Other 8 10 10 15 15 14
Diversified food 11 21 26 39 41 43 All diversified companies 21 43 78 119 110 100
Large specialized food 75 56 52 59 58 54 Other specialized food 38,389 33,535 25.684 21.159 15.933 15.047
Integrated retailer 20 35 55 47 39 42 Large specialized tobacco 7 7 3 1 0 1 Other specialized tobacco 720 308 193 143 93 93
Total 39.232 33.984 26.063 21.524 16.233 15.337
^See app. A for a description of each type of company.
The 50 very large companies of 1989 included 18 diversified food firms with 35 percent of the food sales of very large companies, 21 congbmerates with 34 percent of such sales, the diversified tobacco companies (2 of which had 18 percent of these sales), and 7 other diversified consumer product companies. Companies with nrx>re than half of their sales in food and kindred products or tobacco accounted for 83 percent of the food sales of very large companies, compared with only 17 percent by very large companies principally in nonfood businesses.
Turnover of Large Companies
Mergers, acquisitions, and divestitures have drastically changed the identities of companies in the U.S. food business since 1950. There were 82 large specialized food, alcoholic beverage, feed, or tobacco companies in 1950 that made 23 percent of the domestic sales of
45

Table 12-Share of domestic sales of food and tobacco by type of company
Type of company 1950 1960 1968 1975 1985 1989
Percent
Conglomerate: Food Nonfood
1.6 0
2.7 .6
7.4 3.9
13.5 6.0
13.1 5.9
11.0 5.6
Diversified consumer product: Tobacco and other 0 Other 10.7 7.4
3.5 5.0
4.5 4.9
8.1 5.0
12.1 6.2
Diversified food Large specialized food Other specialized food
6.7 19.4 54.6
12.4 11.8 55.7
15.7 12.1 48.0
19.5 14.7 33.6
21.5 12.5 31.6
24.0 10.4 26.8
Integrated retailer Large specialized tobacco Other specialized tobacco
2.1 3.6 1.3
2.4 4.2 .7
2.5 1.3 .6
2.4 .4 .5
2.2 0
.1
2.3 .1
1.5
Total 100.0 100.0 100.0 100.0 100.0 100.0
- Less than 0.05 percent.
these prcxlucts. Twenty-two diversified companies accounted for 19 percent of the sales of these products. Since then, 52 percent of the large specialized firnris of 1950 have been sold (table 15). Most of the others are now diversified. As for the diversified firms of 1950, 81 percent of them have been sold, most by 1975 and the rest since that time.
A striking feature of the quarter century between 1950 and 1975 was diversification through acquisition. After 1975, the turnover accelerated. The conglomerates began trading around the various parts of their businesses, selling off food and other units. A number of these companies learned that managing a diverse assortment of unrelated businesses was beyond the mind of man, even with the aid of the computer. They then adopted a strategy of concentrating their businesses into fewer fields, with which the top management could acquire the necessary familiarity. Two-thirds of the food
46

Rgure13
Large manufacturers' share of sales of food, alcoholic beverages, feed, and pet food
Percent
100
80
60
40
20
64.0
16.0
¡20.0
37.4
15.3
47.5
32.1
11.4
56.5
Bother' H Large specialized
BlJirge diversified
1950 75 89
'Includes integraled retailers and wtfidesalers and all smaller companies.
conglomerates of 1975 (sales were more than 50 percent food and related products) were still in the food business in 1989. Since 1975, half of the nonfood conglomerates sold off their food units but are still in business.
Only 36 percent of the large companies of 1989 had been in business as the same company in 1950 (table 16). Only 16 percent were small food or tobacco companies in that year, 17 percent were large specialized companies, and 3 percent were diversified. The remaining 64 percent of these large companies of 1989 were newcomers to the food or tobacco business, although most of them entered the field by acquiring one or wore companies already ensconced there.
Two-thirds of the 1989 companies were in the food or tobacco business in 1975 (table 17). Eleven percent were small companies, 17 percent were large specialized companies, and 39 percent were diversified companies.
47

Table 13-Number of large companies In U.S. food, alcoholic beverage, feed, pet food, and tobacco manufacturing by total sales^
Group 1950 1960 1968 1975 1985 1989
Number
Largest 0 1 1 3 4 7 2 3 1 5 5 8 10 3 2 4 7 12 16 15 4 5 4 13 14 14 18 5 11 20 29 37 31 29 6 29 30 38 47 45 32 Minimally large 37 43 29 53 45 44
Total 87 103 122 171 163 155
^Companies grouped by total sales. See appendix table 2 for minimum sales of each group.
In the conglomerate lxx>m of the 1960's and 1970's, a number of large firms acquired food or tot>acco businesses, sometimes as a relatively minor part of a larger acquisition. Some firms subsequently sold off their food or tobacco units as a part of the streamlining that accompanied concentrating on core businesses. Thirty-nine companies can be identified as falling in this category. The large acquisitions were in meat, bakery, confectionery, and baby food. Taking each company's peak year as a percentage of total domestic sales, we find that these 39 companies accounted at various times for 7.5 percent of total sales of food and kindred products and tobacco.
The Move Abroad
Most 1950 operations of U.S. food connpanies were located in the United States. But, since that time, many firms have diversified and moved abroad (table 18). The total internatk>nal operatbns of the large U.S.-based companies with half or more of their sales in food and kindred products and tobacco increased from 6 percent of sales in 1950 and 1960 to 12 percent in 1975 and 14 percent in 1989.
48

Table 14-Share of sales of U.S. food by large companies, by size group
Groupe 1950 1960 1968 1975 1985 1989
Percent^
Largest 0 0.4 0.5 3.0 3.7 11.9 2 11.3 4.1 6.6 2.0 11.4 14.0 3 2.6 6.1 8.8 15.7 14.4 iai 4 6.5 3.2 5.6 8.2 7.5 8.4 5 4.7 11.7 13.3 14.9 8.9 9.7 6 10.9 8.1 9.0 9.0 8.3 7.1 Minimally large 6.6 5.7 3.3 14.0 8.0 6.7
Subtotal 41.8 39.3 47.1 66.8 62.2 67.9
Integrated grocery chains 2.6 2.9 3.1 3.2 2.5 2.8
Other companies 55.6 57.8 49.8 30.0 35.3 29.3
Total 100.0 100.0 100.0 100.0 100.0 100.0
^Companies grouped by total sales. See appendix table 2 for minimum sales of each group.
^Share of sales only of food manufactured in U.S. plants, excluding alcoholic beverages, feed, pet food, and nonfoods.
Figures for large companies that have less than half their sales in food and kindred products and tobacco, which includes some conglomerates and some diversified consunrier products companies, do not exhibit a trend (table 19).
The number of these firms is small, especially in the 1950's and 1960's. and the totals depend on only a few companies* figures.
There are many alternative strategies that firms can use to enter foreign markets/ Some of these methods involve considerably more investment of time, money, risk, and expertise than others. Figure 14 orders these strategies roughly by degree of investment and involvement required by U.S. food marketing firms.
^ This section was prepared by Charles Handy (see Handy and Manchester, 1990).
49

Table 15-Statu8 in 1989 of large companies that were in the food and tol)acco iHisiness in 1950
Specialized companies Share of
Diversified companies Share of
status Companies 1950 sales' Companies 1950 sales'
Number Percent Number Percer)t
In business in 1950 82 100.0 22 100.0
Ouf 7 7.6 2 .4
Company sold 50 51.8 14 80.7
Still operating as: Large food company Diversified food
3 2.8 0 0
cxxnpany Diversified consumer
13 20.5 1 1.7
products company Conglomerate Total still
8 1
15.6 1.7
3 2
11.0 6.2
operating 25 40.6 6 18.9
'Domestic sales of food and kindred products and tobacco in 1950 by this type of company.
%ut of business, out of food manufacturing, or became small.
The first two strategies are methods of exporting U.S.-produced products, while the last three involve production abroad and varying degrees of direct investment. Most firms enter the export market by using foreign agents or brokers. As export sales increase, many firms then take the next step of setting up a separate U.S.-based export office or divisk>n. U.S. processors can also decide to pack under contract for a foreign firm. For example, several Japanese manufacturers of soda and fruit drinks contract out productbn of their Japanese brands to American bottlers. Firms may also choose to have their branded products produced and marketed in foreign countries under a licensing agreement with a foreign firm. While this strategy generally requires no direct investment in foreign production facilities, conskJerable investment is required to identify appropriate licensees, devek>p production and marketing procedures, and establish quality controls. Joint ventures allow a U.S. firm to tap into the production, marketing, and regulatory know-how of a host-country firm without the expense of acquiring a wholly owned subsidiary.
50

Table 16-Share of large companies of 1989 that were in food or tot>acco manufacturing in 1950
Status in 1950 Type of company in 1969
Small specialized
company
Large specialized
company Diversified company Total
Percent
Conglomerates: Food 12.5 6.3 6.3 25.1 Nonfood 5.6 0 5.6 11.2
Diversified consumer product: Tobacco and other 33.3 66.7 0 100.0 Other 7.1 28.6 14.3 50.0
Diversified food 14.3 38.1 2.4 54.8
All diversified companies 12.5 26.0 5.2 43.7
Large specialized food Large specialized tobacco
19.3 100.0
3.5 0
0 0
22.8 100.0
All specialized companies 20.7 3.4 0 24.1
All large companies 15.6 17.5 3.2 36.3
Finally, a U.S. processor can acquire or build foreign manufacturing facilities to operate as a wholly owned subsidiary. In practice, a firm can use any combination or, indeed, all of these strategies in businesses undertaken in different parts of the world.
From a trade perspective, the U.S. food processing industry is still domestic-market oriented. Exports accounted for only about 4 percent of U.S. production of processed foods in 1990. Since 1972, the United States has imported only 3.5-4.5 percent of its processed food. While imports and exports of processed food are small compared with domestic production, in absolute terms, the United States is the worW's largest importer and exporter of processed food.
Japan is by far our largest export market for processed food, followed by Canada and Mexico. Mexk:o became our fourth largest export market in 1988 and third largest in 1989.
51

Table 17-Shar9 of large companies of 1989 that were in food or tobacco manufacturing In 1975
Status in 1975 Type of company in 1989
Small specialized
company
Large specialized
company Diversified company Total
Percent
Conglomerates: Food Nonfood
0 0
18.8 5.6
37.5 55.6
56.3 61.2
Diversified consumer product: Tobacco and other Other
0 0
0 7.1
100.0 78.6
100.0 85.7
Diversified food 7.1 2.4 64.3 73.8
All diversified companies 3.1 6.3 62.5 71.9
Large specialized food Large specialized tobacco
22.8 100.0
35.1 0
0 0
57.9 100.0
All specialized companies 24.1 34.5 0 58.6
All large companies 11.0 16.9 39.0 66.9
However, exports are only a small fraction of the total presence of U.S. firms in foreign markets, and imports do not reflect the total presence of foreign firms in the U.S. food system. U.S. firms had sales of $50 billion from their foreign food marketing affiliates in 1989, and foreign firms had sales of $40 billion from their food marketing affiliates here (table 20), according to the U.S. Department of Commerce. In a ranking of the workl's largest food processing firms in 1989, U.S. firms dominated the list. Of the world's 10 largest food processors, 6 were U.S. firms. In addition, 12 of the world's 20 largest and 21 of the world's 50 largest food processors were U.S. firms.
Data for 64 of the largest U.S. food processing firms, which account for nearly half of all U.S. food processing, give us insight into their international activities. Total processed food sales for these firms
52

Table 18-Foreign and domestic distribution of sales of large U.S. companies with 50 percent or more of company sales in food and kindred products and tobacco^
Location and product group 1950 1960 1968 1975 1985 1989
Percent
U.S. operations: Food and kindred products and tobacco 82.7 83.3 70.3 61.9 54.6 59.1
Other 11.0 11.1 19.7 25.8 32.1 26.9
International operations: Food and kindred products and tol)acco
Other 5.7
.6 5.3
.3 8.7 1.3
10.0 2.3
10.7 1.0
12.4 1.6
Total sales 100.0 100.0 100.0 100.0 100.0 100.0
^Excludes foreign companies and integrated grocery store chains. International operations include only majority-owned subsidiaries abroad.
were $182 billion in 1988. Of this total, 78 percent came from U.S. processing plants, while 22 percent came from foreign subsidiaries owned by these U.S. firms. These 64 firms' exports amounted to only 2.7 percent of their domestic sales. Thus, large U.S. food processors received an average of 22 percent of their sales from foreign subsidiaries, while exports accounted for less than 3 percent of sales.
Thus, many large food processors use mainly foreign investment to gain sales in international markets, rather than relying on exports. Indeed, 38 of these 64 firms owned food processing plants in foreign countries. These 64 firnr^ operated a total of 2,518 processing plants, 27 percent abroad.
Two companies, CPC International and Coca Cola, make over 50 percent of their processed food sales from their foreign subsidiaries. And, 14 U.S. food processors make over $1 billion each in annual sales from their foreign subsidiaries.
Even export sales combined with sales from foreign subsidiaries understate the full international presence of U.S. food marketing firms. International licensing, joint venture, and franchising operations
53

Table 19-Foreign and domestic distribution of sales of large U.S. companies with less than 50 percent of company sales in food and kindred products and tobacco^
Location and product group 1950 1960 1968 1975 1985 1989
Forcent
U.S. operations: Food and kindred products and tot)acco 17.5 27.7 15.5 14.6 17.5 12.2
Other 49.0 58.4 68.1 59.9 64.1 60.7
International operations: Food and kindred products and tobacco 3.2 1.3 1.8 2.0 1.0 2.8
Other 30.3 12.6 14.6 23.5 17.4 24.3
Total sales 100.0 100.0 100.0 100.0 100.0 100.0
^Excludes foreign companies and integrated grocery store chains. International operations include only majority-owned subsidiaries abroad.
are not included in foreign sales. For example, niany U.S. brewers license Canadian and British firms to produce their brands in the United Kingdom and Canada. Joint ventures will continue to expand rapidly in the 1990's. General Mills recently entered the European cereal market through a joint venture with the Swiss firm Nestlé to produce and market its ready-to-eat cereal brands. Many food processors evkJently find nrx)re profit in exporting capital, know-how, and tradenr^rks than in exporting branded products from their U.S. facilities.
Food processing companies give several reasons, besides trade bamers, for producing finished consumer products in foreign plants rather than exporting from domestic plants. First, transportation costs are reduced, especially where consumer packaging adds considerable weight. Second, dealing with kx:al governments and regulatory agencies is easier when the product is produced in the host country. Third, for consumer value-added products, keeping abreast of local tastes and opportunities for new product development or reformulation is easier with local production. Fourth, some firms acquire established brands in foreign countries and use the facilities as a base for further expansion. Fifth, foreign manufacturing may improve access to k>cal distribution and thus facilitate marketing and
54

promotion of a branded product. Finally, a firm that initially exported to a market may decide to switch to foreign production when the volume grows sufficiently to make operatbn as a separate unit profitable.
Many of the largest U.S. food processors report very modest export sales of finished consumer food products. They generally do not expect large growth in their exports of these products. Rather, these firms continue to expand aggressively in foreign markets by increasing their investment in foreign plants, devetoping joint ventures, or expanding Sensing arrangements with foreign firms to produce and distribute their branded products in foreign markets. The planned complete integration of the European Community by the end of 1992 provides growing incentives in these directions.
However, most U.S. exports of processed foods are in tower value- added and bulk semifinished products such as grain mill products, cattle hkies, bulk fats and oils, and fresh or frozen fish and seafood. These goods are likely to continue to dominate exports.
Figure 14
Strategies for selling in foreign markets
Fof eign agents or brokers
i Domestic export office
i Conlracl for foreign firm
i License foreign firm
i Jointventures
1 Foreign subsidiaries
55
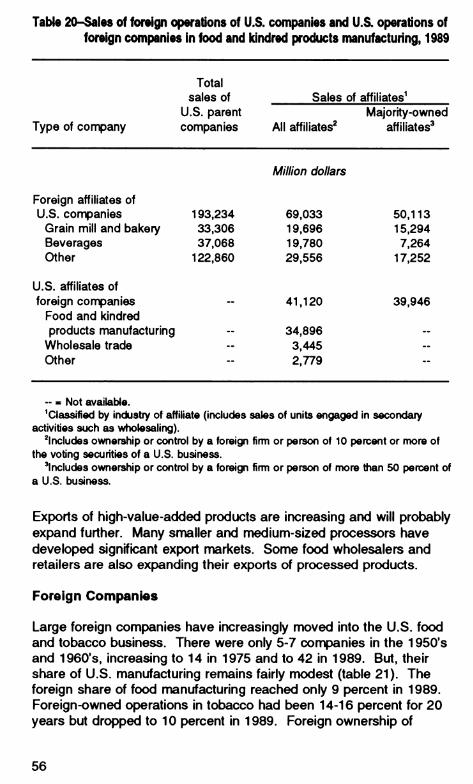
Table 20-Sale8 of foreign operations of U.S. companies and U.S. operations of foreign companies in food and Idndred products manufacturing, 1989
Total sales of
U.S. parent Sales of affiliates^
Majority-owned Type of company companies All affiliates'" affiliates'
Million dollars
Foreign affiliates of U.S. connpanies 193.234 69,033 50,113
Grain mill and bakery 33,306 19,696 15,294 Beverages 37,068 19,780 7,264 Other 122,860 29,556 17,252
U.S. affiliates of foreign connpanies -- 41,120 39,946
Food and kindred products manufacturing -- 34,896 --
Wholesale trade -- 3,445 - Other " 2,779 "
» « Not available. ^Classified by industry of affiliate (includes sales of units engaged in secondary
activities such as wholesaling). ^Includes ownership or control by a foreign firm or person of 10 percent or íDore of
the voting securities of a U.S. business. 'Includes ownership or control by a foreign firm or person of more than 50 percent of
a U.S. business.
Exports of high-value-added products are increasing and will probably expand further. Many snnaller and niedium-sized processors have developed signifiant export markets. Some food wholesalers and retailers are also expanding their exports of processed products.
Foreign Companies
Large foreign companies have increasingly moved into the U.S. food and tobacco business. There were only 5-7 companies in the 1950's and 1960's, increasing to 14 in 1975 and to 42 in 1989. But, their share of U.S. manufacturing remains fairly modest (table 21). The foreign share of food manufacturing reached only 9 percent in 1989. Foreign-owned operations in tobacco had been 14-16 percent for 20 years but dropped to 10 percent in 1989. Foreign ownership of
56

Table 21-Share of sales of large foreign-owned operations in U.S. food and kindred products and tobacco nuinufacturing
Foreign-owned operations 1950 1960 1968 1975 1985 1989
Percent 1
Food 0.5 0.6 1.1 2.6 5.4 8.8 Alcoholic beverages 10.1 14.2 11.4 14.3 12.6 17.7 Feed and pet food 0 0 0 .1 7.2 15.5 Tobacco 4.2 6.1 14.0 14.9 15.9 9.9
Food and kindred products and tobacco 1.3 1.5 2.2 3.6 6.5 9.6
^Percentage of sales of each category made by foreign-owned fiims (majority ownership of U.S. subsidiary).
alcoholic beverage confipanies has been higher throughout because two of the major liquor companies have been Canadian. There was almost no foreign ownership in feed manufacturing until 1985.
Foreign companies' operations in U.S. food and kindred products and tobacco accounted for 1-2 percent of the total in the 1950*s and 1960's and had increased to only 10 percent by 1989.
Directions of Diversification
More of the food and tobacco business is now carried out by diversified firnr^ than was the case in 1950, but average levels of diversification within food and tobacco manufacturing rose only nrKxJestly until 1975, and these levels have since declined (table 22). All of the large tobacco firms diversified into branded food, beer, or both. Fewer specialized food firms remained in 1989; those remaining became more specialized.
While kinds of diversification vary tremendously, some patterns are more common among large companies in the food business:
• Few have tried operating supermarkets.
• More have tried convenience stores, with at least one (Fairmont, which was a large dairy company for many years) eventually concentrating there and selling off its
57
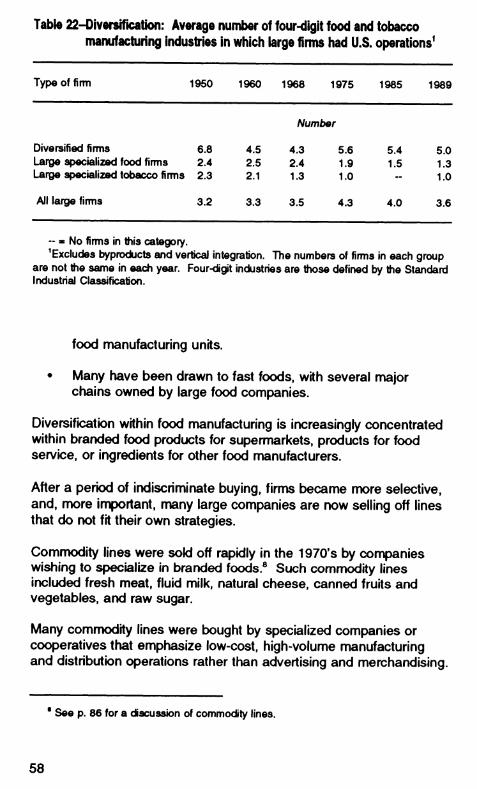
Table 22-Diversif¡cation: Average nuinber of four-digit food and tobacco nuinufacturing industries in wliicli iarge finns had U.S. operations^
Type of firm 1950 1960 1968 1975 1985 1989
Number
4.5 4.3 5.6 5.4 5.0 2.5 2.4 1.9 1.5 1.3 2.1 1.3 1.0 ~ 1.0
Diversified firms 6.8 Large specialized food firms 2.4 Large specialized tobacco firms 2.3
AJI large firms 3.2 3.3 3.5 4.3 4.0 3.6
- * No firms in this category. ^Excludes byproducts and vertical integration. The numbers of firms in each group
are not the same in each year. Four-digit industries are those defined by the Standard Industrial Classification.
food nnanufacturing units.
• Many have been drawn to fast foods, with several major chains owned by large food companies.
Diversification within food manufacturing is increasingly concentrated within branded food products for supermarkets, products for food service, or ingredients for other food manufacturers.
After a period of indiscriminate buying, firms became nrx)re selective, and, nfK>re important, many large companies are now selling off lines that do not fit their own strategies.
Commodity lines were sold off rapidly in the 197ffs by companies wishing to specialize in branded foods.® Such commodity lines included fresh meat, fluid milk, natural cheese, canned fruits and vegetables, and raw sugar.
Many comnrKxJity lines were bought by specialized companies or cooperatives that emphasize low-cost, high-volume manufacturing and distribution operations rather than advertising and merchandising.
' See p. 86 for a discussion of commodity lines.
58

When basic processing is shifted to cooperatives, farmers through their cooperatives bear more of the price and income risks arising from production uncertainties. These risks had previously been shared with processors through contracts (Bonnen, 1983, p. 964; Hamm, 1981, pp. 500-20).
In 1950, most food and all tobacco companies operated within the area defined by a minor industry (see Minor Industries, app. A). The large meatpackers were extensively involved in byproducts (which are not counted in table 22), and a number of firms producing fats and oils were involved in related chemical industries (nonfood oils, such as linseed oil, as well as nonfood uses of edible oils). Most other nonfood manufacturing operations were of inputs, such as packaging materials. A few companies produced soaps and detergents (Procter & Gamble and Lever Brothers), and one produced sporting goods (Wilson, the meatpacker). The basis for most such diversification was technical (the same or similar processes) or involved vertrcal integratk>n (inputs or byproducts). A few diversified food companies were based on economies of scope, where a comrTx>n distribution system or marketing expertise was used for a variety of branded food products (for example, General Foods).
In the past 40 years, nr^ny more companies have sought to exploit the economies of scope in marketing.® As stated earlier, all of the tobacco companies diversified into branded foods or beer or both. All of the dairy companies diversified into other foods; several included nonfoods. Most canners and many meatpackers also diversified (see MacDonakl, 1985).
But, the latest concentration of large companies on food manufacturing attracted Borden's interest once more to the fluid milk business, and this company acquired a number of operations from firms that were divesting milk operations. Most recently, Borden has sold several fluid milk plants, thus shrinking domestic milk and ice cream operatk^ns from 34 percent of company sales in 1987 to only 20 percent in 1990, with further reductions planned. In a somewhat similar fashion, ConAgra has built a large meat and poultry business with acquisitk>ns from firms desiring to exit from fresh meat operations.
* Economies of scope in marlteting are the lower costs from joint distribution of products wtiich may be unrelated in production (see Chandler, 1990).
59

Some cases of integration were reversed. The large meatpackers had all become highly integrated Into byproducts in the 1880's and 1890's. These companies developed many of the applications themselves, since there were, no independent firms to which they could turn. The large packers were still highly integrated in 1950, but by 1975, they had disposed of most, if not all, of their byproduct operations (MacDonakl, 1987, pp. 167-8).
Forward Integration
Forward integratk)n has appealed to some food manufacturers since the 1960's. Large manufacturers with broad lines of supeniwirket products are strongly inclined toward operating their own distributk>n systems. Such operatk>ns involve substantial economies of scope. Distributk)n to food sen/k:e appealed to fewer firms, although Kraft has devek)ped one of the largest operatk>ns of this type, whk;h sells many products of other manufacturers.
No large private food manufacturer acquired a supermarket chain of any size, although every few years some farm organizatk>n advocated "buying A&P", when A&P was the largest chain. A cooperative or two bought kx:al chains, but in time, they sokj them. They discovered that control of retail space for their limited line in a few stores did not repay the management and investment required. Supemnarkets owned by food manufacturers have made only a small share of total supermarket sales since 1950 (table 23).
Convenience stores have been somewhat more attractive to manufacturers, primarily to milk and k)e cream companies. Many chains of dairy stores were started by flukl milk processors in the 1960's, when 40 percent of the sales of such stores were of dairy products. The pk>neer was Southland, a dairy and k:e company that started its 7-Eleven chain in the 1930's, although its growth came after World War II. Over the years, the share of dairy product sales declined in all these stores, and they gradually became convenience stores. Fairmont, one of the large dairy companies of the 1950's and 1960's, went heavily into convenience stores and eventually sokJ off its dairy operations.
Manufacturer-owned convenience stores accounted for a signifk:ant share of total sales. This is because the largest convenience store company, Southland with its 7-Eleven stores, was also a rnajor dairy company (table 23). However, in 1988, Southland sokl its manufacturing operations and several divisk>ns of stores in an effort to reduce the debt it had incurred in a leveraged buyout.
60

Table 23-Share of sales of large food manufacturers' operations in food retailing, wholesaling, and food service
Percentage of sales of that tvoe of business in-
Type of operation 1950 1960 1968 1975 1985 1989
Percent
Food stores: Supermarkets 0.5 0.8 1.1 2.4 1.3 0.4 Convenience stores 0 22.9 38.0 33.5 22.8 0'
Food service: Fast-food places 0 0 4.0 6.0 12.2 8.7 Other restaurants 0 0 3.2 5.0 6.7 2.5
Wholesaling:* Groceries and food 2.6 2.7 2.6 3.0 5.0 3.8 Alcoholic beverages .2 .1 6.2 3.7 2.3 .9 Farm product raw materials' 4.9 4.0 9.1 17.8 21.5 44.9
^Southland sold its manufacturing plants. 'Percentage of sales of merchant wholesalers. ^Mostly grain.
Food service has been attractive to a number of large food manufacturers. Both fast-food and full-service restaurants have been acquired by manufacturers, but fast food is more common (table 23). In the 1960's. the fast-food business was booming, and several large manufacturers bought in. In 1967, General Foods purchased Burger Chef, then the second-largest hamburger chain, to the acclaim of those quoted in the business press. Burger Chef boomed and then shrunk and was sold to Hardees in the early 1980's (Mueller, 1983). Pillsbury was more successful with Burger King. Pepsico is the largest restaurant operator in the world, with Kentucky Fried Chicken, Taco Bell, and Pizza Hut. General Mills' Red Lobster and Olive Garden are industry leaders in their fields. By 1989, 9 percent of fast-food sales were made by units owned by food manufacturers, with an additional 11 percent made by their franchisees.
61

Wholesaling attracted a number of manufacturers. In some cases, grocery wholesalers, such as Consolidated Foods (now Sara Lee), integrated into food manufacturing. Meatpackers and dairy products manufacturers were the major assemblers and wholesalers of butter and eggs in the 1920's and 1930's, but that business declined by 1950 and has since disappeared.
Several large grain companies, especially Cargill and Continental Grain, have become major food manufacturers in recent years, but they continue to maintain strong positions in grain trading. Increasing shares of their grain buying are for use in their own milling and manufacturing operations.
Channels of Trade
The strategies used by food manufacturers vary among industries and channels of trade (fig. 15). The share of manufactured foods used as ingredients has been about 20 percent for 30-odd years, while the share going to food service has risen from 17.5 percent to 25.5 percent (table 24). The share going to retail stores has consequently declined from 63 percent to 55 percent.
Among foods sold to retail stores, the share of unbranded fresh meat and poultry dropped from 19-21 percent in the 1960*s to 13 percent in 1987 as an increasing share of poultry was branded and as poultry sales increased more than did sales of red meat (table 25).
The share of retailer and wholesaler private labels grew fairly sharply through the 1960's, largely because supermarket chains discovered the advantages of concentrating their milk purchases, including private label, with one supplier. During the rapid food price inflation of the 1970's. supermarket operators discovered the merits of generic labels for plain-Jane products at substantial discounts. Generics peaked in 1981 and then declined as price increases slowed and generics lost power as a merchandising tool. The 1990-92 recession brought a resurgence in private label sales, especially for dry cereals, as consumers became more price conscious.
The share of manufacturers' brands declined during the 1960*s as private labels increased but then rose during the 1980's, when much more chicken was packaged, branded, and advertised.
62

ñgure 15
Channels of trade for U.S. food manufacturing companies
Ingredients for further processing
19%-
Food service
The Ingredient Channel
The products of some industries, such as sugar and soybean milling, are used as ingredients by other manufacturers. The ingredient channel accounts for about 19 percent of shipments by food manufacturers. Direct buyers are few, and purchases are made in larger quantities. The products, though they may meet rigid specifications, are generally undifferentiated and thus are not heavily advertised. Narrow margins place a premium on efficiency. A few ingredients are highly differentiated, such as aspartame, produced by the NutraSweet Company. Several companies have become differentiated preferred suppliers in specialized ingredient markets by superior technology, cost control, quality control, or customer service.
The Foodservice Channel
The 700,000 foodservice establishments vary from snack bars to large plant cafeterias; their product and service requirements are equally diverse. Brands are often unimportant to foodservice firms, but rigid product specifications, including portion control, may be
63

Table 24-Share of sales of manufactured foods by type of market
Used for Sold to Sold to Year ingredients food service retail stores
Percont
1958 19.6 17.5 62.9 1963 20.9 18.4 60.7 1967 19.4 21.7 58.9
1972 19.9 20.7 59.4 1977 20.0 23.0 57.0 1982 19.1 23.5 57.4 1987 19.2 25.5 55.3
required by institutional buyers and fast-food chains. Price competition is intense for these large accounts. The volume required to serve large foodservice firms may be beyond the capacity of small processors, which thus concentrate on firms where sen/ice is especially important. About 25 percent of food manufacturer sales are in the foodservice channel.
The Private Label and Unbranded Products Channel
Entry into the private label and unbranded products (fresh meat and poultry) channel is relatively easy. About 18 percent of food manufacturer sales are in this channel. Product differentiation is moderate, with little or no advertising. Shelf space does not have to be won by overcoming the brand loyalty of competing products. Buyers specify product quality and packaging requirements for many private label products. Price competition here is intense and resembles bidding for a contract. Manufacturers, who do not pay to establish a consumer franchise, will accept lower prices. Such manufacturers have little involvement with marketing decisions and relatively little power in negotiations with buyers.
Some food retailers have integrated back into food manufacturing. These firms process their own brands, especially in dairy and bakery products. Such integration occurs where food retailers can achieve
64
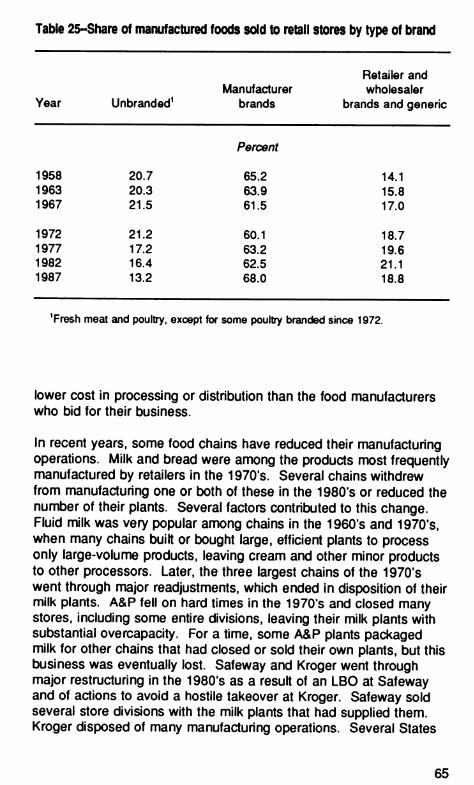
Table 25-Share of manufactured foods sold to retail stores by type of brand
Retailer and Manufacturer wholesaler
Year Unbranded^ brands brands and generic
Percent
1958 20.7 65.2 14.1 1963 20.3 63.9 15.8 1967 21.5 61.5 17.0
1972 21.2 60.1 18.7 1977 17.2 63.2 19.6 1982 16.4 62.5 21.1 1987 13.2 68.0 18.8
Tresh meat and poultry, except for some poultry branded since 1972.
lower cost in processing or distribution than the food manufacturers who bid for their business.
In recent years, some food chains have reduced their manufacturing operations. Milk and bread were among the products most frequently manufactured by retailers in the 1970's. Several chains withdrew from manufacturing one or both of these in the 1980's or reduced the number of their plants. Several factors contributed to this change. Fluid milk was very popular among chains in the 1960's and 1970's, when many chains built or bought large, efficient plants to process only large-volume products, leaving cream and other minor products to other processors. Later, the three largest chains of the 1970's went through major readjustments, which ended in disposition of their milk plants. A&P fell on hard times in the 1970's and closed many stores, including some entire divisions, leaving their milk plants with substantial overcapacity. For a time, some A&P plants packaged milk for other chains that had closed or sold their own plants, but this business was eventually lost. Safeway and Kroger went through major restmcturing in the 1980's as a result of an LBO at Safeway and of actions to avoid a hostile takeover at Kroger. Safeway sold several store divisions with the milk plants that had supplied them. Kroger disposed of many manufacturing operations. Several States
65
withdrew from retail price fixing, thus removing guaranteed margins for milk and reducing incentives for integration into milk processing. In addition, integrated milk plants built during the 1960's and early 1970's had used that era's technology. By the late 1980's, such plants required investment in up-to-date equipment.
Similar conskleratk)ns applied to bread baking for some companies. In 1989, Winn-Dixie sokl its bread plants to Ftowers, a regk>nal baker in Winn-Dixie's territory, to avoid updating its bakeries at considerable cost.
The Branded Product Channel
In contrast with the other channels, the branded products channel emphasizes marketing strategies to establish a consumer franchise. The consumer franchise is the basis for favorable location and shelf space in retail stores. Smaller companies can and do succeed in the branded products channel, developing products for regional or niche markets. A new brand that succeeds may be purchased by a large food manufacturer, whk:h greatly increases marketing expenditures and can expand the acquired brand into national and even international markets.
Manufacturers continually engage in new product devetopment and promotion to nriaintain or improve their positions in the marketplace. Branding provkles the basis for consumer identification of packaged food products and helps to differentiate products among manufacturers. Product development and differentiation provide manufacturers with a partially protected place in the market, with somewhat higher returns.
Processors make tremendous outlays on product development for dry grocery items to differentiate their products sufficiently to ensure a better grip on a share of the market. Their efforts are continuous, since a successful new product leads to numerous imitations or slight variations by other processors. A really successful new product leads almost inevitably to private label versions under chainstore or wholesaler brands. Constant erosion of margins, profits, and sales of each successful new product-not to mention the numerous failures- sends manufacturers on a continuous round of new product development so as never to be without several new products.
Over 13,200 new food and grocery products were introduced in 1990, 10,300 of them food products. This more than doubled the number in 1983 and is many times that of the early 1960's. But, even a
66
superstore can stock only about 60,000 itenis and a conventional supermarket, perhaps 15,000. Because of these odds, 90 percent or nnore of new products fail.
The rnanufacturers' product marketing rnanagers coordinate new product research, package design, test marketing, and introductbn of new food items. Such nr^anagers are also responsible for managing established products in the retail outlets. They attempt to achieve targeted market shares and sales by using selective promotion and pricing strategies. The salespeople of large manufacturers negotiate with retail buyers and merchandisers. These sellers try to persuade buyers to purchase additk>nal products and also try to induce merchandisers to give special attention to the manufacturer's products. Most smaller manufacturers use food brokers instead of their own sales force. Brokers use similar tactics, but they deal simultaneously with several manufacturers' products.^°
Manufacturers use a variety of tools to persuade retailers not only to carry their products but also to employ merchandising techniques that will gain sales. Chief among these techniques are media advertising, couponing, and manufacturers' deals. Advertising seeks to persuade consumers to kx>k for the product in the store, ask for it if it isn't there, and purchase the product. Food manufacturers spent about $8.5 billion for advertising and couponing in 1989.
Manufacturers' cents-off coupons appear in the mail, in printed advertising, and on the package. Coupons encourage consumers to try new products; they also provide some advertising, which maintains brand loyalty, and help manufacturers meet sales and inventory goals. Coupons can "force" retailers to add a new product or to continue to carry an existing product. When consumers cannot redeem a coupon, they often blame the store for not carrying the product. In ackJitton, using coupons in an introductory campaign enables manufacturers to offer a special introductory pr\ce without disturbing the planned future price and rr^argin. Coupons also differentiate prrce-sensitive consumers from those who are not. Sales revenue can be increased by offering tower prices by coupon to price-sensitive consumers who might otherwise buy a cheaper store brand. Less price-sensitive consumers without a coupon pay the regular prtoe of the product.
^ This section draws on Hamm and Handy, 1984, and Han^ood, 1991.
67

If coupons build volume on the pronfX)ted ¡tenis and draw consumers to a store, participating retailers benefit. However, retailers must manage, redeem, handle, and police the use of the coupons. If double couponing strategies are used, the retailers must also finance the additional costs. Coupons weaken retailers' control over their shelf space, forcing the stocking of particular items. Coupons can also make manufacturers* couponed products nfx>re price-competitive with the retailer's own brands.
Retailers' pricing, promotk)n, and shelving actions can substantially influence the success of a food product. Choice shelf kx)atk>ns, end- of-aisle display space, and retailer advertising are limited. Few of the 8,000-10,000 grocery items can receive such favored treatment in any given week. Similarly, the retail pricing pattern established for the product influences consumers' perception of its quality and value.
Manufacturers have developed elaborate "deals" or structured marketing contracts to influence retailers' merchandising and marketing decisions. These manufacturer deals usually have two basic features. First, the manufacturer bwers the wholesale price(s) for one or a group of products. Second, in return for towered prtoes through altowances reducing retailers' cost per case, retailers undertake certain merchandising tasks for the products. Such deals often also specify payment conditions, wholesaler notiftoation provisions, and precise dates for price concessions and retailer merchandising performance.
A representative deal might be arranged as foltows. A retailer in a given market area will receive a discount of 10 percent from current list price for all orders during a certain pertod. In return, the retailer agrees to some or all of the foltowing: (1) to provide a large end-of- aisle display of the product for at least one week, (2) to place a newspaper advertisement for the product, and (3) to put a cents-off coupon in the ad reflecting the retailer's price decrease. Thus, by tying a wholesale prtoe decrease to merchandising strategies, manufacturers can shift marketing resources to their products.
Manufacturers and retailers have always negotiated the costs of introducing a new product. With growing product proliferation, retailers have gained power in relation to manufacturers. "Slotting fees," a term appearing in the late 1980's, extends the range of trade negotiattons. Some retailers have charged from $15,000 to $40,000 per product per store to cover the costs of stocking selected new items. Manufacturers might pay $2-$3 million in slotting fees to introduce a new product across the country.
68

Slotting fees depend largely on the balance of power between the retailer and the manufacturer, the expected popularity of the new product, and the unique characteristics of the new product. If a snnall retailer charged a large slotting fee for a popular new product, that retailer might find itself lacking an item that consumers request.
Only very large companies generally have the resources to concentrate on national brands of major products. Smaller companies concentrate on niche products or on regional markets. High-market-share companies were constrained by fear of antitrust actk)n from acquisitk>ns adding to already-high shares through the 1970's (see Bkx)m and Kotier, 1975). But, nrK>re relaxed attitudes of the antitrust authorities during most of the 1980's allowed a number of high-market-share companies to acquire competitors. The experiences in boxed beef (see the folbwing section) and pasta are instructive. However, antitrust policy in the 1990's has returned to a more activist stance, and leading brand companies are again being restrained from acquisitk)ns in their primary lines.
Being number one can be hazardous for reasons other than antitrust. McDonald's often serves as a target for health and environmental concerns about the fast-food industry. Leading n^anufacturers can be boycotted on behalf of a wkie variety of causes.
Industries
None of the food industries are now what they used to be. In 1950, a food industry was made up of a discrete set of companies which were specialized in that industry. But now, many subskJiaries of large diversified companies are identified with a particular industry. The two industries discussed in this section provkle instructive case studies.
Meatpacking*^
Meatpacking was shaped from the beginning by technology, by scale economies, and by procurement methods. The fresh (chilled) beef and hog business began with the devek>pment and introduction of refrigerated raibars in the 1870's. Since both assembly of livestock
^^ This section draws on Nelson, 1985; Fanis and Fanis, 1966; Marion and others, 1986; Handy and Manchester, 1990; Williams, 1958; Williams and others, 1959; and Ward, 1979 and 1988.
69

and distribution of meat were wholly dependent on railroad transportation, Chicago-the railroad hub of the Midwest-was the natural location for large-scale slaughter of beef and hogs. The Chicago terminal market (Union Stockyards) drew livestock from the heart of the Com Belt, providing a massive supply for the large packing plants that operated there. Unequaled rail connectons then distributed meat to nr)ost of the Nation.
The large packers buiK or bought packing plants in other major mkJwestern cities; these, too, had large stockyards and good rail connectons. These packers established branchhouses in all major meat markets. Car routes served smaller markets that lacked sufficient volume for a branchhouse.
Thus, a dual system was established: the large interstate packers located at major stockyards with their own distribution systems and the tocal packers who had no branchhouse. In addition, butchers still slaughtered for the kx:al trade.
The large plants of the major packers had a considerable cost advantage from economies of scale: lower unit costs from larger volume. The large packers also had major economies of scope because they were big enough to use the byproducts to produce fertilizer and leather. Swift and Armour, further, canned their own meat. The branchhouses expanded into butter, cheese, eggs, and poultry, taking advantage of their available refrigerated storage and shipment facilities.
In 1916, the five largest packers slaughtered 52 percent of the cattle and 51 percent of the hogs (excluding farm slaughter) in the Nation. This was 79 percent of all federally inspected cattle slaughter (that is, of the meat eligible for interstate shipment).
The advantages of tocating slaughter in terminal markets were eroded by improved technology in truck manufacture, especially pneumatic tires, and by the rapid increase in paved highways in the 1920's. Smaller packers at lnterk>r points began to cut into the position of the major packers. By 1935, the four large packers (Swift, Armour, Wilson, and Cudahy; Morris had merged with Armour in 1923) had 47 percent of commercial cattle slaughter and 41 percent of that of hogs. The advantages of integration into distribution through branchhouses were similarly eroded by the transportation revolution that nrx)ved dressed meat rapidly by highway to any point in the country.
70

The large, muKispecies plants at terminal markets became costly to operate. New plants located in the production areas could use newer technology and, often, lower wage rates. Although the big four packers remained in business, their combined share of cattle slaughter fell from 43 percent in 1940 to 36 percent in 1950 and to 21 percent in 1970.
Most of the new plants kxîated in the interk)r--some in the new cattle feeding areas of the High Plains-were established by new companies. Only a single species was slaughtered, using such technology as the on-the-rail system, which was replacing the okier bed-type plants. Many such companies grew rapklly in the 1950's and 1960's, as beef productfon expanded sharply, and cattle feeding increased faster. Plants in new cattle feeding areas often grew even more rapidly.
During the congtomerate boom of the 1970*s, the big four meatpackers began to leave the fresh meat business. Swift became a congtomerate through widespread acquisitions and then sold off its fresh meat business as SIPCO in 1981 and its processed meats to congtomerate Beatrice in 1983. Both businesses eventually were sold to ConAgra.
Armour (whfch had made itself into a conglomerate) and Cudahy were soW to General Host, a diversifying baker, Armour in 1969, and Cudahy in 1971. General Host then soW Armour to Greyhound, the bus company, in 1970. Greyhound became conglomerate and divested Cudahy, part in 1981 and the remainder in 1983. Greyhound then sold ArnfX)ur to ConAgra in 1983.
In 1967, Wilson was sold to LTV, a leading conglomerate of the 1960's, which spun it off in 1981. Burdened by debt and high-cost labor contracts, Wilson disposed of three-quarters of its hog slaughter capacity in 1982-86, mostly to new firms. From some, Wilson buys carcasses for its processing operations and, for others, it markets under contract. Wilson was later acquired by Doskocil, a smaller meat processor, in a 1988 hostile takeover. Doskocil had planned to divest much of Wilson, but Doskocil could not find a buyer and went into Chapter 11 bankruptcy reorganization.
In 1950, there were eight other large meatpackers. Two went out of business in the early 1980's. Only Hormel retained its corporate identity in 1989. The others went as follows:
71

• One to a nonfood conglomerate. After passing through several hands, it became part of Chiquita Brands.
• One to a diversified food firm, General Foods. It is now part of Philip Morris.
• One to a British firm, Hanson, which sold it to Sara Lee in 1989.
• Two to another packer.
ConAgra, a small old-line flour and feed miller, went into poultry in the early 1960's, but it did not become large (by the measure of this study) until 1968. ConAgra began to diversify in earnest with the acquisition of Banquet Foods (frozen prepared meats and poultry) in 1981. By the end of the 1980's, ConAgra had become one of the three major firms in the meat business by acquiring the divested portions of conglomerates, including ArrDour Foods from Greyhound, SIPCO, and newer regional packers such as Monfort and E. A. Miller. With broilers, turkey, and catfish, it now has a full line of meat, somewhat reminiscent of the original big packers.
IBP was created by several mergers and became one of the prominent regk>nal beefpackers. It was sokl to Occidental Petroleum in 1981. Unable to find a buyer in 1991, Occkiental sokJ stock to stockhoklers or the underwriters. The fimi is the leader in the boxed beef business. More recently, it expanded rapkJIy into pork processing. It now slaughters more hogs than cattle.
The third major beefpacker today is Excel, acquired by Cargill, the grain trader and miller, in 1977. Excel started out as one of the new regional packers of the 1960's.
These three are currently the leaders in the boxed beef business, which is significantly more concentrated than beef slaughter in general. The four largest companies accounted for 81 percent of the boxed beef business in 1988, compared with 70 percent of all steers and heifers slaughtered and 18 percent of cows and bulls slaughtered.
The two-tier beef industry of the early years has evolved into a different two-tier configuration. The local sector has shrunk to insignificance. The large firms dominate the production of boxed beef. They sell rrwre U.S. Select and other lean beef than the smaller companies and are big in many niche markets. For example.
72

IBP sells certified Angus beef. The smaller companies operate smaller plants and sell to market niches.
The terminal martlets, which until 1920 supplied three-quarters of all cattle, have faded away. Chicago's terminal is gone entirely. Most livestock are now bought directly by the packers' empk>yees or by agents for smaller packers. Packers are not custom feeding or feeding in their own tots on a wide scale. In the 1970's and 1980's. packer feeding of cattle varied from 3-8 percent of fed cattle marketings, much as in earlier years. However, a few packers still rely heavily on such custom feeding, especially in areas of relatively thin supply. Custom feeding provides a backup of cattle to keep operations at an efftoient level when supplies are thin.
In the pork industry, slaughter has become separated from processing to a considerable extent. Some large processor- slaughterers, such as Wilson, reduced their slaughter capacity to what they needed for their own processing use. By so doing, they got out of the fresh pork business. In the process, they also escaped high-wage unton contracts.
Citrus Processing^'
The nfKHJern citrus processing industry began in the late 1940's with the devetopment of technotogy for the manufacture of frozen concentrated orange juice (FCOJ). Both jutoe and fruit segments had been canned for years, but canned products had never accounted for a major share of Ftorida productton. The pack (productton) of FCOJ jumped upward from 10 millton pounds in 1946 to over 500 millton in 1952 and rTX)re than 1 billton in 1959 with only one interruption, whtoh was caused by a freeze. Frozen concentrate rapkJIy captured the major share of FtorkJa orange production, replacing both fresh fruit and canned juice.
The Ftorida orange jutoe concentrate industry was built largely by local firms with already-established connecttons to the citrus industry. Some were farmer cooperatives. In 1958-59, five cooperatives accounted for 25 percent of FCOJ production, and in 1964, six
^* This section draws heavily on the expertise of Lester Myers of ERS and on Godwin and others, 1966; Goldberg. 1968; Lassiterand Capel, 1959; Parker, 1964; Purcell, 1965; U.S. Federal Trade Commission, 1962; Ward and Kilmer, 1989.
73

cooperatives for 51 percent (Goldberg, 1968, pp. 167 and 175). Most had been canning juice.
The original process for FCOJ used a low-temperature, high-vacuum process to reduce fresh orange juice to a concentrate with a soluble solid content of 55 percent. Then, freshly squeezed orange juice was added back for flavor and to bring solids to 42 percent. The resulting product was then packaged and frozen (Parker. 1964, p. 14). By the 1952-53 season, about 80 percent of FCOJ was packaged in 6- ounce consumer cans, 6 percent in 12-ounce consumer cans, 7 percent in 32-ounce institutk>nal cans, and 1 percent in 5-galk)n containers (Purcell, 1955, p. 2). At this time, almost all FCOJ was packaged in FtorkJa by the original processor, which had to be located so as to acquire not only the juice for concentration but also the fresh (cutback) jurce added for flavor.
Technotogy in the mkJ-1960's developed methods of orange essence recovery that made it possible to obtain the desired flavor without adding fresh juice. With this development, FCOJ could be concentrated in Ftorida, shipped in bulk, and reconstituted for chilled juice in any k>catk>n.
The can manufacturers built large plants in Florida to supply cans for concentrate. To discourage FCOJ processors from building their own can plants when they became large enough, the can manufacturers gave a special "FtorkJa altowance" on FlorkJa-made cans, making concentrate cans tower prtoed in Ftorida than elsewhere in the country. Thus, FCOJ packaging tended to stay in Florida, instead of concentrate being hauled in tank cars or by barge to, say. New Jersey for packaging. A number of FCOJ processors eventually decided that they could make money on cans, and they invested individually or jointly in can manufacture.
A major freeze in 1962 cut FCOJ output in Florida by 55 percent. The resulting high prices for fruit stimulated extensive plantings both in Ftorida and in Brazil. Concern over growing local output and potential imports led to raising the Florida State standards for solids in FCOJ from 42 percent^^ to 45 percent for the 1965-66 season, thus effectively reducing the supply of FCOJ by 7 percent because the same amount of solids made less juice.
^^ Expressed as '42 degrees bnx.'
74
In the early 1950's, improved methods of quality stabilization made possible the preparation and distribution of chilled juice.^^ Producing chilled citrus juices with desirable flavor and aroma presented difficult problems in quality control. The equipment was almost identical to that used in concentrate and canning operations, but freshly squeezed juice deteriorated rapidly in quality even under refrigeration. The juice had to be processed with extreme care: strict sanitation procedures were followed, and the juice was stabilized by pumping it through heat exchangers to reduce bacterio- logical content and enzymic and flavor changes. The juice was then immediately cooled to 32°F or betow, and such temperatures were needed until the juice passed into the hands of consumers.
Quality variations in chilled juice were also caused by different varieties of fruit and by weather and crop conditions. When fresh fruit was of poor quality the juice was standardized by adding frozen concentrate or, in some cases, frozen^ single-strength juice. When fresh fruit was not available, chilled juice was produced from reconstituted concentrate.
The same containers were used for chilled juice as for milk. Thus, any dairy plant could process citrus juice or drinks (drinks used less juice) from concentrate. The tie between concentrate production and packaging was broken. Similarly, much of the fresh chilled juice (not made from concentrate) processed in Florida moved out-of-State by tank truck, tank car, and ship. By 1957-58, 37 percent of the volume nrK)ved in bulk.
Imports from Brazil, where the high prices resulting from the 1962 FlorkJa freeze had stimulated production, made additional supplies of FCOJ available for reconstituting concentrate into single-strength juice. In response, Fk>rida FCOJ increasingly moved out of State in bulk form: up from 18 percent in 1975-76 to 49 percent in 1985-86 (Ward and Kilmer, 1989, p. 31, from the Florida Citrus Processors Association). In the 1980's, about a third of chilled juice was from
^* This section makes extensive use of Lassiter and Capel, 1959, for the early years.
75

non-Florida (níx>stly Brazilian) juice. And,.a substantial but unknown share of Florida juice used imported FCOJ.
Conpetition from Brazilian juice and domestic supply shortages (due to freezes) led to lowering the Florida FCOJ standards in 1980 back to the pre-1965 level, which increased the effective quantity of FCOJ from Fk>rida oranges.
From the early days, the market for FCOJ has been much rTX)re in private label than is the case with many consumer foods. Private labels were introduced in 1952 by A&P and Grand Unk>n. The fact that most of the early processors were k)cal firms, including cooperatives, without experience in branded product markets no doubt shaped their concentratbn on production rather than brand development. The Florida Citrus Commission started generic advertising very early. Minute Maid was almost the only FCOJ processor with a strong brand devetopment program in the 1950's. Minute Maki felt that other manufacturers treated FCOJ as a comnrxxiity rather than as a specialized consumer product (Goldberg, 1968, p. 176). Private label accounted for 43 percent of retail store sales in 1990, about the same as in the late 1980's and down from 52 percent in 1979. In chilled juice, more competing brands exist, and private label sales are 23 percent of the total.
All of the Florkla citrus processors started out as local firms. Minute Maid acquired several other firms before it was itself sokJ to Coca Cola. Tropicana was sold to Beatrk:e in 1978 and eventually to Seagram, the Canadian liquor firm, in 1988. Procter & Gamble, the basic business of whk:h is detergents and diapers, bought Ben Hill Griffin's processing business in 1981 and set out to create a third national brand. Therefore, three major players are based outside the citrus industry.
Procurement. Procurement methods for oranges reflect the distinctive features of Ftorida orange production, chief among which is the incidence of freezes. A major freeze creates a shortrun situatbn with much frozen but salvageable fruit on the trees and insufficient capacity to process all of it before it spoils. The grower's problem is to find a processor who will pay a prrce which exceeds costs of picking and hauling the fruit, unless the grower has a contract which guarantees such an outlet. But, once the freeze-damaged fruit is processed or abandoned, prk:es soar, and growers with undamaged fruit that is not committed to a processor can pick and choose among processors, seeking the maximum price.
76

The processor's problems, after a freeze, are twofold: at first, rationing capacity in using freeze-damaged fruit, and thereafter, relatively scarce supplies.
Various arrangements have evolved to deal with these problems. Cooperative processors have used pooling arrangements, which, in effect, yield their grower-members the season average price. There are typically two pools, one for early and midseason fruit and another for late oranges.
In the early 1950's, Minute Maid bought large acreages of groves in order to guarantee about one third of its supply. Other processors also bought groves, and sometimes the principal owners or officers of a processing company personally owned substantial acreages. Other growers raised questions as to equality of treatment by processors: was the price for their own fruit higher than that paid to independent growers? To deal with such questions, the processors entered into participation agreements covering both fruit from their own groves and fruit bought under contract from independent growers. In nr^ny respects, such agreements were similar to cooperative pooling arrangements.
Buying arrangements have changed frequently, with a major change often following a freeze. Oranges for concentrate are divided into "priced" and "nonpriced" (fig. 16). Priced fruit includes that bought on the spot market and that bought under contract at a determinable price. Nonpriced fruit is bought on a deferred formula price basis, with the grower's final return not known until the pool closes. Nonprk)ed fruit includes fruit in cooperative pools and under partrcipation agreements as well as fruit from the processor's own groves.
In 1950-51, 96 percent of oranges used for FCOJ were nonpriced, probably mostly in cooperative pools. The nonprrced share dropped to about 60 percent, where it stayed, although with variatbn. After the 1962 freeze, when much salvageable fruit was rejected, the share of nonprk^ed fruit jumped from 61 to 72 percent, because pooling or participation plans gave the grower some return on salvageable fruit even iif it could not be processed. The nonpriced share then rose gradually to around 80 percent in the 1970's, when there were few freezes, dropping after the 1977 freeze from 82 to 70 percent. Five freezes in the 1980's and the resulting excess processing capacity drove the nonprk^ed share down to 43 percent in 1989-90 as processors strove to lock up fruit under contract at determinable prices.
77

Product Changes and Merchandising
The history of the food industry during the past century has been one of demand creation, accelerating in the postwar era. Developments in the technology of production, processing, packaging, and distribution and in merchandising have made possible the introduction of thousands of new products and new forms of old ones. More consumers, with increasing affluence, availed themselves of the opportunities afforded by the new products. As a result, the larger supemr^rket of today typfcally handles 5 or 10 times as many items as did the grocery store of 40 years ago.
The change in the diversity of products available is revolutbnary. The variety offered to meet the expanding wants is much greater, so the demand for any good or service is much more elastic. Every food product competes not only with other food products but also with nonfood items and services. Many more products are now available in whkîh the basic product is combined with varying degrees of built-
Rgureie
ProcuromMit arrangements for Florida orangea used in frozen concentrated orange juice PeroenI
'Priced indud«t ipot tná oontrect wHh a determinabt« price. 'Nonpriced indudet cooperative pooling, parUdpaUon plans, and prooessor-ovwted fruit.
Source: Dala from Horida CitruB Processor« Association.
78

in service. Thus, in choosing foods, the customer now selects not only from nutritional categories, flavors, and textures but also from varying degrees of sen/ice that have already been performed for the meal préparer.
Changing Food Products
Food manufacturers have responded to consumers' desires for convenience and healthfulness and have thus reshaped the composition of the food basket. Technological developments have created whole new industries and transformed every one. New product lines and industries-some of which, such as frozen fruits and vegetables, corn sweeteners, and egg products, appeared before the war but got their growth in later years-include:
Broilers. Frozen fmits and vegetables. Frozen concentrated fruit juices. Fresh fruit juices. Frozen prepared foods, including entrees and complete meals. Frozen baked goods. Dehydrated vegetables and soups. Refrigerated doughs. Com sweeteners. Processed egg products. Fresh, prepared foods. Shelf-stable foods (vacuum packed in plastic containers).
In other industries, technok>gical and other changes have drastically altered the mix of products. Milk, broilers, and beef provide some examples.
Milk
In milk, product mix, container size and type, and methods of distributk>n have changed greatly in the postwar period. In 1954, about half of all milk was home delivered, usually by the processor's employees. But, the rapid spread of supennarkets, increasing automobile ownership, the use of paper containers, enhanced shelf life, and k>wer costs and prk^es boosted supermarket sales of milk. Newly devek)ped dairy stores (which later became convenience stores) emphasized even bwer prk^es than supernriarkets, using cheaper returnable glass containers. Home delivery is now only 2 percent of milk sales.
79

The mix of milk containers has changed greatly in 30 years. Glass bottles gave way to paper cartons and then to plastic containers. Nearly 30 percent of milk soki for home use in the early 1950's was sold in quarts, about 60 percent was sokJ in half galbns, and about 10 percent was sokJ in galbns. The paper gallon was never a satisfactory container and the glass gallon was too heavy, so widespread use of galtons awaited development of technology for producing plastk: galk>n jugs in milk plants. By 1989, only 4 percent was sold in quarts, 21 percent in half galbns, and 61 percent in gallons.
The mix of whole milk products also changed. Creamline milk (nonhomogenized) was soki in nix>st markets in 1954, often at a lower prbe than horTX)genized milk. Creamline has virtually disappeared. Homogenized milk with vitamin D supplements often carried a premium over plain homogenized milk in 1954. Now, alrTX)st all whole milk has vitamin D and other vitamins added.
Lowfat and skim milk have become increasingly popular as the public has shied away from fat. Lowfat and skim milk now outsell whole milk, in marked contrast to 35 years ago (fig. 17).
ñgure 17
Sales of milk by type^
Flavored and buttermilk 6%
Lowfat milk
0.1%
Whole milk 02%
Whole milk . 39%
Fia\A3red and buttermilk 6%
. Lowfat milk 45%
'Product weight.
80

Broilers^'
The modern broiler industry was created in the late 1930's and grew to substantial volume in the 1940's and 1950's. Most broilers, at that time, were sold as whole birds, originally New York dressed (only the feathers and blood removed) and later as ready-to-cook (legs, head, and viscera removed). But. by the mkl-1960's, the market for whole broilers, driven by technok>gical improvements in productk>n and by declining prk^es, was becoming saturated, and the search for new forms was on.
In the 1960's and 1970's, sharply increasing shares of broilers were cut up and sokl with all the parts of one bird in a tray pack or as individual parts (breasts or legs) (fig. 18). The share of whole birds dropped below 50 percent in the 1980's and fell to 19 percent by the end of the decade. Many new products were developed, for example, frozen prepared dinners using chicken, frozen breaded chicken entrees, poultry frankfurters, and poultry-meat frankfurters.
Increasing quantities of broilers went to the growing number of fast food chicken outlets (fig. 19). Kentucky Fried Chicken and others continued to sell complete cut-up chk:kens, but they also soki orders only of breasts or only of wings or legs. The demand was increasingly for white meat. Hamburger chains that added chicken items in the 1980's wanted only certain parts of the bird, and they needed the convenience of a boned, precut product. The number of chicken rtems on these menus increased as such chains broadened their selection beyond hamburgers and french fries.
Americans generally prefer white meat to dark. Thus, prices are higher for chrcken breasts than for legs. In 1960, chicken legs averaged 81 percent of the prk^e of breasts at wholesale, but by 1987, legs were valued at 37 percent of breast meat. Many of the newer consumer and fast-food products use boneless chk:ken breasts. At the wholesale level, prices of this value-added item have been volatile, while at retail, boneless, skinless breasts cost about the same as the better cuts of beefsteak.
Chicken legs and thighs (dark meat) have had to seek new outlets. Together with wings, legs now find specialized export markets, making up most of U.S. exports of chicken. But, the largest domestic outlet for dark meat is mechanically deboned meat in chicken franks
^^ This section draws on Bishop and Chnstensen, 1989, and Lasley and others, 1988.
81

RgurelB
Broilers told by major product form
Percent
1001
Whole birds
1962 €7 70 74 78 81 83 85 87 89
Source: Weknar and StiHman, 1090.
and other products. The less desirable chicken parts, especially necks, backs, and giblets, are now largely used by pet food nfianufacturers, with some large broiler operations having constructed their own rendering operations to handle such items.
Beef'
Dramatk: changes in the form and way in which beef moves from packers to consumers have occurred during the past 30 years. In the past, cattle were slaughtered at the packing plant and sold mostly as carcasses. The carcass skies, though usually divided into forequarters and hindquarters, were sold as a unit to wholesalers or purveyors. Wholesalers sokl the sides to retail foodstores, where the skies were cut to retail cuts. Pun/eyors cut the sides and sold the cuts to food servbe. Major retail chains performed the wholesale functbn through their meat warehouses, and some broke carcasses
^*This section is based on Crawford and others, 1988; Duewer, 1984 and 1989; and Nelson. 1985.
82

RgurelQ
Broilers sold in major market outlets
Percent
ou
70
60
,,^^^^ Retail stores
^^\
50 -
40 -
30
20
Eating places
^'^
10 - Petfood ^^^.^-^
(9 .^——1 "'^ y
0 19 70 74 78 81 83 85 87 6
Source: Weimar and Stilknan. 1990.
Into primal and subprimal cuts.^^ Some retailers even aged the beef.
The "boxed beef" revolution began in the 1960's. Pork packers had for many years cut hog carcasses into smaller cuts for further processing into bacon, ham, and sausage. Iowa Beef (now IBP) was a pioneer, in 1967, in cutting beef carcasses into primais or subprimals, packing these in multilayer plastic films, and shipping boxes of primal or subprimal cuts. Assembly line procedures were used in disassembly, shipping weight was reduced, handling eased, and shelf life improved. Purchasers' alternatives were broadened and the product better met the needs of retail chains. Many other packers quickly followed suit, especially the independents.
^^ Primal cuts are the major cuts from the carcass: chuck, rib, loin, round, shank, brisket, short plate, and flank. Subprimal cuts are smaller cuts from the primais. For instance, a primal round may be cut into top round, bottom round, and knuckle.
83

For a while, some retailers built central fabricating plants to divide carcasses and so still bought carcasses for several years longer. But now, nfiost retailers have switched to buying the already divided boxed beef.
Wholesalers without meat rails in their warehouses (and therefore without the means to handle carcass beef) who served independent grocers and smaller chains began to use boxed beef to add meat to their lines. These dealers thus replaced specialized meat wholesalers who had been supplying independent grocers. Meat pun/eyors have also found less demand for their cutting services, as all types of retailers can buy boxed beef already broken into primais or subprinr^ls. Many smaller meat wholesalers went out of business when their services were no longer needed.
The shift to boxed beef thus nx)ved nrx)st cutting and trimming to earlier points in the marketing channel and so eliminated much of the processing in retail foodstores. This altowed retailers to better match product mix to consumer demand. In order to sell all the cuts from a carcass, retailers prevk>usly sokl less popular cuts at bwer prices or themselves ground the renr^ining meat for hamburger. Retailers no longer have to sell cuts in carcass proportions. With boxed beef or more retail-ready cuts, market allocation can direct products to meet more specific consumer demands.
Along with the shift to earlier cutting and trimming, a nriove has occurred toward more boneless cuts and closer fat trim. The change to more boneless cuts has been slow, but some stores now sell only boneless beef, except for some T-bone steaks and standing ribs. Boneless cuts accounted for 45 percent of all cut beef sales at foodstores in 1986, up from 23 percent in 1979.
A few years ago, tray-ready beef appeared as a new product; processors trim and cut subprimals into retail-size portions at the packing plant but ship the portions together as one subprimal unit. Recently, case-ready beef appeared from a few packers; retail cuts are individually vacuum packed for sale before shipment and can be placed by the retailer directly in the display case. Case-ready beef is an obvious candkJate for branding by the manufacturer. Excel began a test of branded vacuum-packaged beef in 1986. Two chains- Kroger and Spartan Stores-tried the product but recently discontinued it. The beef's dark purple color discouraged purchasers, although those who tried it liked the product (Food Institute, 1991).
84

The vacuum wrapping used for boxed beef (whether primal or case- ready cuts) is a tough, multilayered film that acts as an oxygen barrier and shrinks well during vacuum packaging. Shelf life can be extended at least 2-3 weeks if the product is properly refrigerated.
Boxed beef, then, has many advantages. The mix of cuts is more customized to the demand, and retailers do not need to reduce prices to sell less popular cuts. There is also less chance of meat spoilage, since vacuum-packaged meat has a tonger shelf life. Also, with boxed beef, fewer pounds must be kept cool, lowering refrigeration costs. Furthermore, beef in boxes is easier to handle than carcass skJes or quarters hanging from a rail, and such beef requires less investment in facilities.^®
Another form of beef in t)oxes (although often frozen rather than vacuum packaged) is portbn-controlled meat cuts, ranging from hamburger to filet mignon. These products also nix>ve the cutting and trimming back to the wholesaler, processor, or packer, which altows foodservice outlets to provide uniform and consistent meat portk)ns.
From Commodities to Differentiated Products
Over the past century the process of demand creation through the differentiation of products has changed most foods from commodities to differentiated products. In trade parlance, "commodities" are those products either unbranded or with weak branding that are subject to the fairly full play of changes in supply and demand, especially supply. Prices of comnxxJities fluctuate more wkiely than those of differentiated products. The distinctbn is a matter of degree, not an either-or categorization.
The archetypal transformatk>n of a commodity to a differentiated, strongly branded product is the 1897 movement of crackers from the ban-el to a package labeled "Uneeda Biscuits." This was accompanied by a large-scale advertising program to create demand for the brand and by strenuous efforts by Nabisco's sales representatives to be sure that grocers had Uneeda Biscuits on the shelf when the newly motivated consumer asked for them by name.
^' Smithfield Foods began marketing case-ready pork to the Atlanta division of Kroger Company in September 1990. Fresh pork chops and k>in items (mostly roasts) are cut. packaged, and prepriced by Smithfield to Kroger's specifications. They are shipped in specially sealed, atmospherKally controlled cartons. This program applies the principles of boxed beef and carries through to final packaging (SmithfiekJ Foods, 1991, p. 14).
85
Nearly all dry groceries are now packaged, branded, and differentiated, although not all are characterized by strong brands. The only "commodities" left are perishables, and not even all perishables fall into this category. Fresh fruits and vegetables, broilers, turkeys, eggs, and fresh meat are alnix)sl the only products remaining, at least in part, in the commodity category.
Milk changed from a commodity in the 1960's, as supermarkets became major outlets for milk. Milk had, of course, been packaged and labeled for many years, but home-delivered milk-the dominant form until the 1960's-depended more on personal servie than on advertising. Before this time, except for Safeway, Kroger, Ralphs, and a few others, who built their own milk plants around 1930, milk had been sold on consignment with several milk companies per store. All the retailers did was collect at the cash register.
In the 1960's, most larger supermarket chains installed central milk programs. Some built their own milk plants, especially in those States where wholesale and retail prices of milk were set by a State agency. The others contracted with one milk company for private label milk at significantly lower prices, made possible both by the larger volume (one processor instead of three or four) and limited servrce (delivery to the retailer's platform instead of arranging indivkJual cartons in the case). Thus, milk became less of a comnrKxJity, although even now it is not strongly branded.
The changes in poultry have been multifaceted. Both broilers and turkeys were newly created industries. Broiler and turkey production, because of the relatively short production period and the relatively large number of integrated firms, were characterized by production cycles with frequent perkxis of little or no profit. Turkeys also faced a strongly seasonal demand during the Thanksgiving and Christmas holkJays. In the early 1960's, half of all turkeys were sold during these two holklay nfX)nths. Turkey processors set out to create year- round demand through new products from turkey meat, starting with such parts as breasts and legs but rapidly progressing to turkey rolls, hot dogs, and salami. All of these were, of course, branded products. Swift differentiated their whole turkeys as Butterball, a self- basting product. Others have followed similar strategies.
Product devetopment in broilers also got underway in the early 1960's, with stronger enrphasis on cut-up, complete birds and parts. But, at first, these chicken products remained undifferentiated commodities. However, Frank Perdue started advertising his broilers in 1969, and Holly Farms foltowed suit in 1970. Nowadays, the
86

customer can choose among breasts, legs, wings, a complete cut-up bird, or a whole bird, branded or unbranded, as well as many further- processed products. Broilers and their products are no longer strictly a commodity, but, even now, they are not completely differentiated. The prices of comnrxxlity broilers still respond to supply and demand in the traditional sense, while prices of the (somewhat) differentiated products remain higher, although at nearly fixed differentials.
The conversion of more product groups from commodities to differentiated products means that retail prices have become less sensitive to changes in farm prices, and therefore, wider swings in prices are now needed to clear a market. Breakfast cereals have long been insensitive to the change in grain prrces, and the prices of perishables have become less sensitive than they were 30 years ago.
Ingredient Substitution Using Engineered Foods^^
In many products, traditk>nally used ingredients are being replaced (partially or totally) by a variety of substitutes. These range from k>w- calorie sweeteners to fat substitutes and protein substitutes. Many of these products are still in the devebpmental stage. But, in the 1990's, the food marketing system will have a wide range of new ingredient substitutes available. The use of fat and other ingredient substitutes could cause major intercommodity effects. Two examples follow, whk^h illustrate this development: the changes in the sweetener industry and the introduction of fat substitutes.
Sweeteners
The sweetener industry, at one time primarily sugar, now consists of sugar, corn sweetener, and low-calorie sweetener segments. Sugar accounted for 72 percent of U.S. sweetener consumption (calculated in sugar-sweetness equivalent) in 1975, corn sweeteners 22 percent, and saccharin 5 percent. Honey and edible syrups made up the other 1 percent. By 1988, refined sugar's share of the sweetener market had declined to 40 percent, while corn sweeteners' share rose to 46 percent and k>w-calorie sweeteners supplied an estimated 13 percent. (See the section on Commodity Programs for a discussion of the role of Government programs in the sweetener industries.)
U.S. consumptbn of corn sweeteners surpassed sugar in 1985, as lower prk)ed high fructose corn syrup (HFCS) replaced sugar, mainly in soft drinks. Per caprta sugar use has leveled off since then, while
^*This section was prepared by Charles Handy (see Handy and Manchester, 1990).
87

corn sweetener consuniption has crept up further, largely because of increasing sales of soft drinks.
A key devebpment for k>w-calorie sweeteners will occur after December 1992, when NutraSweet Compan/s U.S. patent on aspartame expires. The prbe for aspartame is likely to drop, and competitk^n will intensify as other companies begin marketing aspartame, whfch they already do in Europe. Competitk>n couki drive the price of aspartame much k)wer, resulting in faster adoption of low-cak>rie sweeteners, partbularly in place of MFCS. NutraSweet is working on a new sweetener whrch will not reach the market for several more years.
Fat Substitutes^^
For general heafth as well as for weight control, consumers are being urged to eat less fat. The fat present in foods such as milk, meats, eggs, and nuts occurs naturally but may be altered through breeding or feeding practk^es. Other fats and oils are added to foods, either directly, such as salad dressings or butter on bread, or as ingredients, such as shortening or cooking oils in bakery products and other processed items. Processed foods, like cheeses, \ce cream, shortenings, and salad dressings, are obvk)us candidates for fat substitutes because food processors can control the fat content. Three types of fat substitutes in current use or under devetopment are cartx>hydrate based, protein based, or fatty acid based.
Carbohydrate-Based Substitutes. Most of the low-fat products recently introduced use a carbohydrate-based ingredient, sometimes mixed with water, to replace the fat. These mixtures can replace only part of the fats and oils without a k>ss in quality. These products include N-OIL, a tapk>ca dextrin, and maltodextrins made from corn starch. Such substitutes, partially replacing the fat in salad dressings, margarines, and frozen desserts, can cut calories in these products by a third.
Kraft General Foods uses a cellulose gel called Avicel in their Sealtest Free frozen dessert. Avrcel is produced by FMC Corporation.
In February 1991, Pfizer introduced an improved version of their polydextrose product called Litesse. Polydextrose is a bw-calorie bulking agent nrx>st commonly used to replace sugar. Rizer says
^his section draws heavily on Monison, 1990.
88

Litesse can also reduce fat in ice cream, salad dressings, and baked goods.
Protein-Based Substitutes. Mixtures of protein and water are also used as partial fat substitutes. Thomas J. Upton, Inc., developed a technology using erther gelatin or milk proteins to halve the number of cak>ries in margarine. Lipton test-marketed a low-fat "butter" made with the fat substitute. The product can withstand sonie heat, so it can be used for baking and light frying and sauteing. However, Lipton withdrew their k)w-fat "butter," since demand dki not appear strong, and they had legal problems with it.
Another protein-based substitute, whbh has received considerable publk)ity, is Simplesse, devek>ped by the NutraSweet Company. Simplesse is made from egg whites and skim milk or whey. Simplesse can be added to dairy products (ice cream, yogurt, cheese, sour cream, and dips) and to oil-based foods like salad dressing and mayonnaise. However, the compound cannot be used for cooked foods because heat makes the protein gel and lose its creamy texture. The Food and Drug Administratk>n (FDA) approved the use of Simplesse in frozen desserts in February 1990.
Substituting Simplesse for most of the fat in leading premium (high- fat) products reduces cak>ries by 50-80 percent and fat content by 85-97 percent. The declines are dramatk; because 1 gram of fat has 9 calories, where Simplesse has only 1-2 cak>ries. NutraSweet introduced Simple Pleasures, a frozen dessert made with Simplesse, in 1990, but the company now offers a whey protein concentrate formulatk>n for products other than ice cream.
In May 1989, Kraft General Foods petitk>ned the FDA for GRAS (generally recognized as safe) status for its new fat substitute in frozen desserts. According to the company's petition, a frozen dessert with this new fat substitute will have less than two-thirds the calories and 5-10 percent of the cholesterol of an average ice cream product.
Fatty-Acid-Based Substitutes. Other fat substitutes use fatty acids that have been chemk:ally altered to provide fewer or no calories. Many of these are still under developrrient.
Polyglycerol esters have 6-6.5 calories per gram, about one-third less than a gram of fat. They are used in low-calorie versions of \ce cream, other frozen desserts, margarines, shortenings, peanut butter, whipped toppings, and bakery items.
89

Another type of fatty-acid-based substitute functions and tastes like fat but passes through the body unabsorbed because the molecules are too large for the body's enzymes to break down. The most important of these undigestible fatty acid sugars is olestra. The Procter & Gamble Company (P&G) has been devetoping olestra since the 1960's. In 1987, P&G petittoned the FDA for permission to use olestra in shortenings and oils for home and commercial use, including deep fat frying in restaurants and in commercially prepared snack foods. Olestra can also replace some fat in rce cream, margarine, salad dressings, and processed meats. To speed up the approval, P&G more recently narrowed the petitton to the use of 100- percent olestra in the manufacture of savory snacks: potato chips, corn chips, cheese puffs, and the like. In the first petition, P&G had asked for 75-percent fat-substitute usage, but at 100-percent usage, the snacks can be marketed as altogether fat free. The FDA has not approved the petitton at this writing.
The ARCO Chemical Company is working on another fat substitute called esterified propoxylated glycerol (EPG). Like olestra, EPG is undigestible. The company is testing it in a wide range of foods, including frying oils, toe cream, baked goods, and dressings.
Whether products containing new fat substitutes will replace existing low-fat items and perhaps expand the popularity of tow-fat foods in general depends on several factors. Among these are FDA approval, the substitutes' quality and versatility, the strength of consumer demand, the publto's willingness to pay for reduced-fat products, and the marketing strategies of the companies using these ingredients in consumer products.
The likelihood of a plethora of reduced-fat products raises several nutritional and food safety concerns. Many nutritionists are wary of fat substitutes. They would rather see Americans eat low-fat, nutrient-dense foods, such as fruits, vegetables, and grains, instead of tow-fat cheese puffs. Nutritionists also fear that the consumption of fatty foods could follow the same pattern as did sweetener consumptton over the last decade. Despite a growing array of foods and beverages containing artiftoial sweeteners, U.S. consumption of sugar and corn sweeteners rose from 125 to 136 pounds per capita between 1977 and 1990.
Labeling issues will also cause some problems. Many of the target foods for fat substitutes, such as margarine, mayonnaise, and ice cream, are covered by FDA-enforced standards of kJentity, Such standards specify what ingredients and quantities these products
90

must contain to be called by their traditional names. For example, a frozen dairy product containing less than 10 percent milkfat cannot be called ice cream.
Another set of issues would involve the intercomnrxxJity effects of fat substitutes. A growing market for fat substitutes would increase the demand for the ingredients used in their manufacture, but it would displace demand for traditional fats and oils. Compounds such as olestra made from traditional vegetable oils would have less economic impact on the oils industry than those made from oil-free ingredients.
But if, on the other hand, a protein-based substitute, such as Simplesse, is used in lieu of vegetable oils, the effect on the vegetable oils market could be striking. For example, if Simplesse were used in retail low-calorie salad dressings, it would displace about 9.5 million pounds of vegetable oil. If 10 percent of regular salad dressings, which contain nriore than five times as much oil, also switched to Simplesse, another 17.6 million pounds of vegetable oil would be displaced. About 9 million pounds of egg whites and skim milk or whey would be used in place of 27 million pounds of oil. Other materials for the compounds would also rise in value. In the case of olestra, for example, this would be sugar.
Simplesse's use in ice cream would not affect the vegetable oil market but would displace milkfat. For example, if Simplesse were used in 25 percent of U.S. k:e cream, about 123 million pounds of milkfat wouki be displaced by 40 million pounds of milk and egg protein, adding to the existing surplus of milkfat.
The potential for fat, sugar, and other ingredient substitutes is promising. Food manufacturers perceive a growing market for fat substitutes as consumers seek to follow the health guidelines without changing their eating habits.
Health Consciousness
Since the 1970's, the Amerrcan public has become increasingly health consctous in its choice of foods, rearranging the dietary choices of the populatton. The effects of diets on health is now constantly in the news, and Government and private efforts at dietary education have increased sharply. The proliferatbn of such informatk>n has had the perverse effect of divkling foods into "good foods" and "bad foods" in the minds of many consumers. More than
91

two-thirds of the adults surveyed by Gallup in a 1990 survey sponsored by the American Dietetic Association were choosing foods based on "good" or "bad" perceptions (Wellnian, 1990). The "good" food of 1989 was oat bran, but its popularity faded in 1990. High-fat products are perceived as "bad." Red meat was perceived as high- fat and thus as "bad" by many.
Nutritionists and Government agencies have strongly resisted this trend to categorize foods as "good" or "bad." An effort to set up a "Heartwise" seal to be added to the label of approved brands of specific foods was forbidden by the Food and Drug Administration. Not only would this plan have identified particular foods as "good," it would also have labeled only those brands of the food for which an application for certification was submitted.^^
Marketers responded to these health perceptions, both in grocery store foods and in food sen/ice. Fast-food places are changing their selections: salads, carrots instead of cheese, lowfat milk, yogurt sundaes, and lowfat hamburgers. In this section, we review some of these changes. The introductbn of fat and sugar substitutes has already been discussed.
Fat
The hazards of too much fat and cholesterol are arTX)ng the nfx>st important health concerns of consumers. Increased consciousness of such concerns has generated changes at all levels of the production and marketing system, both for products containing fats occurring naturally and for those in which fat is added in preparatbn. Many fat- free products including baked goods have been devebped. In the following sectk>ns, we discuss changes in beef and dairy products.
Beef
As beef consumptk>n has declined in response to growing health concerns, most retailers now provkJe much ctoser fat trim of beef cuts. Many trim to about one-fourth inch of fat, and some trim off all visible surface fat. A recent sun/ey of the 200 largest U.S. food retailers showed that 86 percent now have a 1/4-inch trim policy for most of their beef cuts (Nelson and others, 1989).
^^A comparable program for a 'green' seal to label products as environmentally 'good' faces problems with the analytical metfiods to be used in evaluating the environmental costs and benefits throughout the life cyde of a product (Hayes, 1990- 91, andCooney, 1991).
92

Marketers have also lowered the fat content of hamburger. Many retailers now offer two or three kinds of ground beef with progressively tower fat content (at progressively higher prices). The fat content of the towest prfce offering has generally been reduced. ERS estimates that the fat content of ground beef and processed beef decreased from about 28 percent in 1975 to 22 percent in 1988 (Nelson and others, 1989, p. 9). Lowfat hamburger (9-10 percent fat) has recently been introduced by hamburger chains and has been tested for use in school lunches.
Tight supplies of fed cattle in the mkl-1970's led to greater quantities of grass-fed and short-fed beef. A number of retailers then introduced their own labels for lean beef. Much of this wouki have qualified for the USDA Good grade, but it was not "rolled" (stamped with a grade designatton visible to the buyer, using a roller) because the "good" label was not viewed as a useful merchandising tool. USDA beef grades were revised in 1976 to reduce the fat levels in all the top grades and to make more uniform the taste and appearance of the vartous cuts within grades, including within the Good grade. However, because consumers were thought to view the Good name as a sign of mediocre quality, the industry still did not use the Good grade. Less than 2 percent of the beef graded in 1986 was Good; a far greater amount was "no-roll" (ungraded). At the urging of consumer, industry, and medtoal groups, the name of the Good grade was changed to Select in 1987 (see Clarke and Wise, 1988). In 1990, 15 percent of steers and heifers were graded Select.
Fast-food chains have increasingly felt the pressure to reduce the fat content of their products. Hamburger is an obvtous candkJate for change because it contains considerable fat even after cooking, but the fat contributes flavor to the meat and also hokis the hamburger together. Vartous hamburger chains have tried lean verstons, using different technkjues to overcome the problems of flavor and consistency. McDonald's introduced a hamburger that uses carrageenan, a derivative of seaweed, based on a process devetoped by researchers at Auburn University (with funding from the National Beef Promotion Board). This process reduces the fat content to 9 percent from the usual 20 percent (Shellenbarger, 1991).
School foodservice offtoials have felt the pressure to reduce the fat content of their lunches. USDA's Food and Nutritton Servtoe has purchased tow-fat hamburger from four suppliers, each made by a different method (including the Auburn process), and these have been tested in schools in six States.
93

Dairy Products
Processors now offer dairy products with a wider range of fat content. Lowfat milks were introduced in the 1950's and 1960's and were available in nearly all niarkets by 1970. Products with 1 percent or 2 percent butterfat (compared with the then-typical 3.5 percent for whole milk) were available. Then, k>wfat replaced much whole milk. Skim milk became more generally available. However, skim milk sales did not climb nearly as rapidly as had those of k>wfat milk until the1980's{seefig. 17).
In addition, the average butterfat content of whole milk was reduced from 3.65 percent in 1954 to 3.30 percent in 1989. Minimum butterfat content was set by State regulatbn until State standards that differed from the Federal standard were preempted by the Nutrittonal Labeling and Educatk>n Act of 1990. In 1954, many States had a minimum 3.5-percent butterfat standard, and some required 3.7 percent. Since then, minimums have been reduced everywhere; they were typk^ally 3.25 percent in 1990, like the Federal standard. The high-fat milks of the 1950's are now almost entirely gone from the market.
Lower fat versk>ns of cottage cheese, sour cream, and yogurt have become common and have captured considerable shares of the market. Lowfat versk)ns of some cheeses have also been introduced. Butter blends have been marketed to meet concerns about fat. For ice cream, a bwfat version (ice milk) has been marketed for many years, long before towfat was "in," but its share of the market has shown no trend in 20 years. New lowfat versions of ice milk are becoming increasingly available under the name of "frozen dairy desserts." The butterfat content of standard brands has probably edged downward, since these brands compete in price, but high-fat specialty ice creams have lx)omed at the same time. Consumer chotees are not driven uniformly by a desire to reduce fat intake at the expense of flavor.
Declining demand for butterfat has changed prtee relationships between butterfat and nonfat solids. Since these are closely related to the Federal dairy programs, they are discussed later in this report.
94

Fast-Food ou''
For years, most fast-food chains cooked their french fries in beef tallow. Beef talbw not only gives french fries the familiar, desirable taste but it also costs considerably less than vegetable oils. In addition, beef tallow is durable in fat fryers. But, tallow is high in saturated fat. This fat content brought increasing pressure for replacement.
Three of the largest fast-food chains-McDonald's, Wendy's, and Burger King-switched from beef tallow to vegetable oils in 1990. The change in frying fats reduced the saturated fat content of their french fries by about 50 percent. Corn oil and cottonseed oil are the new oils of choice for Wendy's and McDonald's. Wendy's will use 100-percent com oil for cooking its fries and other selections. McDonald's will use a blend of corn oil and cottonseed oil for all of its fried products. Burger King, the other major chain, switched from an animal-vegetable shortening to a soybean oil-cottonseed oil blend for its french fries. All of its other fried foods are cooked in soybean oil.
Com oil is attractive to fast-food operators because it has desirable frying properties, especially when blended with cottonseed oil. Fries cooked in corn oil, or especially in a blend of com oil and cottonseed oil, have good color, appearance, and taste. And. the corn-cotton- seed oil blend hokis its desirable cooking properties longer in the fryers.
Use of beef taltow for food frying will decline sharply with the change to vegetable oils. Adjustments in the edible taltow market will include an increase in exports and a diversion from edible to inedible uses, such as displacing a small amount of the tropical oils used in soap.
The shifts in demand among fats and oils will alter price relationships. Talbw prices will decline as less is used for frying, although increasing exports may slow the fall. Corn oil prices will rise because of the increased demand and the relative insensitivity of supply to price increases.
Fiber
Awareness of the role of fiber in the diet increased demand for some products during the 1970's and 1980's, especially bran cereal.
^his section is based on information from James Schaub and Roger Hoskins, ERS.
95

Cereal manufacturers responded with new bran products and with promotion of existing products, such as oatmeal, which had not been vigorously merchandized for many years. In 1984, Kellogg began advertising its bran cereals, citing the National Cancer Institute on the link between increased bran consumption and decreased probability of colon cancer. The other cereal manufacturers quickly foltowed suit.
Between 1967 and 1989, per capita consumptk>n of ready-to-eat (dry) cereal rose 34 percent, while ready-to-cook cereal more than doubled in 1967-77, dropped, and then rose again, ending 146 percent above the 1967 level (table 26). Some of the increases in cereal purchases can be attributed to the fiber phenomenon. Some are related to longer term trends in eating habits, such as the desires for convenience and k>w cholesterol.
The average fiber content of cereals increased somewhat in the mid- 1970's when the connection between fiber intake and health was first announced, but then remained nearly unchanged from 1978 to 1984. Then, with the advent of brand advertising emphasizing the health connectbn, average fiber content rose as consumers changed to high-fiber brands (fig. 20).
Whole grain products became "good" foods. Between 1967 and 1987, whole wheat flour production nearly tripled, while production of white fbur rose 38 percent. Pasta also acquired a "good" reputation. Production of durum and semolina fk>ur (used in pasta) more than doubled in 20 years.
Food Safety Concerns^^
Concerns about food safety have been on the rise in recent years, with marked effects on food producers and marketers. Advocacy groups and the media have devoted increased attention to such issues as pestk^kie residues and salmonella in chickens. Risks to the safety of the food supply can arise from mk^robial contamination, such as salnx)nella, or from hazardous chemicals, such as pestickie residues, food additives, or animal drug residues.
^ This section draws on Roberts and Van Ravenswaay, 1989; Greene and Zepp, 1989; Kaufman and Newton, 1990; Morgan, Bart)our, and Greene, 1990; and Van Ravenswaay, 1989.
96
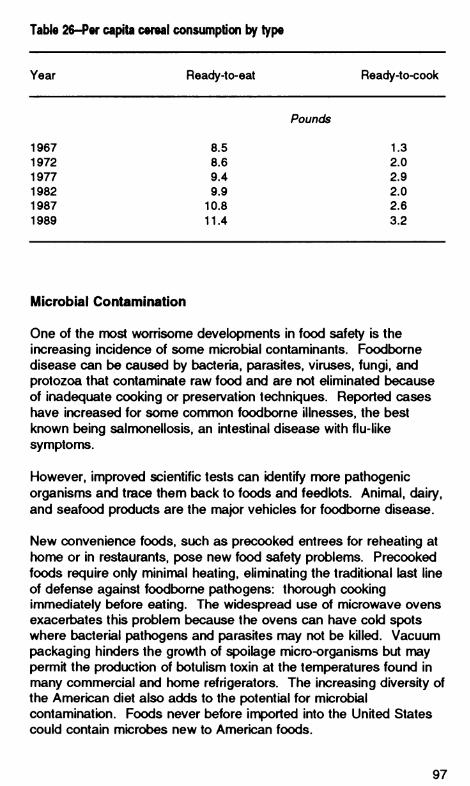
Table 26-Per capita cereal consumption by type
Year Ready-to-eat Ready-to-cook
Pounds
1967 8.5 1.3 1972 8.6 2.0 1977 9.4 2.9 1982 9.9 2.0 1987 10.8 2.6 1989 11.4 3.2
MIcrobial Contamination
One of the most worrisome developments in food safety is the increasing incidence of some microbial contaminants. Foodborne disease can be caused by bacteria, parasites, viruses, fungi, and protozoa that contaminate raw food and are not eliminated because of inadequate cooking or preservatk>n technkjues. Reported cases have increased for some common foodborne illnesses, the best known being salmonellosis, an intestinal disease with flu-like symptoms.
However, improved scientific tests can kientify nnore pathogenic organisms and trace them back to foods and feedk)ts. Animal, dairy, and seafood products are the major vehicles for foodborne disease.
New convenience foods, such as precooked entrees for reheating at home or in restaurants, pose new food safety problems. Precooked foods require only minimal heating, eliminating the traditbnal last line of defense against foodborne pathogens: thorough cooking immediately before eating. The widespread use of microwave ovens exacert>ates this problem t>ecause the ovens can have cokl spots where bacterial pathogens and parasites may not be killed. Vacuum packaging hinders the growth of spoilage micro-organisms but may permit the productbn of botulism toxin at the temperatures found in many commercial and home refrigerators. The increasing diversity of the Amerk^an diet also adds to the potential for microbial contaminatk)n. Foods never before imported into the United States could contain mk:rot>es new to Amerk^an foods.
97

Rgure20
Average fiber content of cereals
Grams'
1.761
1.72
1.68-
1.60 1978 81 84 87
'Grams of fber p«r ounce of »real.
Source: IppoNto md MattHoe, 1080.
Pesticide Residues
Consumers worry nrK>re over pesticide residues than over microbial contamination, although scientists rate the risks the other way around. The 1989 scares over Alar on apples and poisoned Chilean grapes were well publicized and heightened such fears. However, 2 years later, a survey found that a majority thought media coverage of the Alar scare "overblown," and 31 percent were eating nK>re fresh fruits and vegetables, compared with 7 percent eating less (Gasparello, 1991).
The food industry has recently begun responding in new ways to consumers' fears about pesticides. Some firms are advertising that their fresh produce has been specially tested for pesticide residues. Others are capitalizing on the rise in demand for organically grown produce. Firms at all levels are albcating nfx>re resources to consumer education about the safeguards that industry and the Government are using.
98

Private firms are testing fresh produce for pesticide residues. In May 1987, Raley*s, a 55-store supernnarket chain based in Sacramento, CA, contracted with NutriClean of Oakland, CA, to test its fresh produce for pestk:ide reskJues. By the end of 1989, 14 retail chains with níK>re than 740 stores around the country had testing and certiffcation programs (Kaufman and Newton, 1990).
Such testing has increased interest in organic produce (fruits and vegetables grown without pesticides). Fourteen States presently have standards to define what qualifies as organic produce. The 1990 farm act directed USDA to devebp a natk>nal certificatbn program and standards for organic produce. Organb produce sells at a substantial premium over conventional produce and thus costs nrK>re than many consumers are willing to pay (see Prrce, 1985). Some supermarket chains have tried operating a separate organic produce sectk:>n but have given it up because of unsatisfactory sales, perhaps because of weak merchandising.
Concern over pestkîkJe reskJues is not confined to fresh fruits and vegetables but carries over to processed foods, especially those consumed by chifclren. A number of apple juk^e manufacturers started to buy only pestk:ide-free apples after the Alar scare. Beechnut recently announced a line of organrc baby foods produced from pesticide-free fruits and vegetables.
Food Programs
Up to this point, we have been discussing the changes in the marketing system during the past 40 years in terms of changes generated by consumer concerns for convenience, health, or safety or by the marketing system responding to those desires. In the next sections, we kx)k at the effects of Government programs on marketing and the implbations of all these changes for pricing and demand.
Federal domestrc food programs are meant to improve diets by increasing consumptk>n either of food in general or of specific foods. The mix of Federal food programs has changed over the years, with varying effects on food demand. In this sectbn, we discuss changes in food programs in the postwar period and the effects of those changes on demand.
The first Federal food programs began during the Depressbn to distribute surplus foods to the needy. Direct distribution continued as
99

the principal means of family food assistance until it was replaced by the national food stamp program in 1970. The principal food program since 1970 has been food stamps. The original food stamp program had as its basic feature a purchase requirement. Each participant had to pay an amount representing average food expenditures. Then, the participant received food stamps, including a bonus. Because the participant spent a considerable amount on food before receiving the Government contribution, perhaps 60-70 percent of the Government's contribution resulted in irx^reased food expenditures.
The welfare reform movement of the 1970's first attempted to abolish all the existing inconrie support and categorical programs (like food stamps) and to replace them with an income support program, such as the negative income tax. When this proposal failed, the strategy changed to one of cashing out food stamps, which had the broadest coverage of any assistance program. The cashed-out food stamp program-which would no longer be a food program, of course-was meant to become the tool which could be expanded into a general income assistance program. This proposal also failed, so again the strategy shifted, this Wme to abolishing the purchase requirement for food stamps. Now, the Governnrient merely gives bonus stamps to the recipients.
With the purchase requirement removed, food stamps raise food expenditures only for the poorest of the poor. Persons above the minimum poverty level effectively receive an income supplement, and the effect on their food purchases is no different from that of a cash payment. They simply substitute food stamps for cash at the grocery store and use the cash for rent or something else. So, in total, the food expenditures of participants are increased by only 5-10 percent by the present program and total U.S. food expenditures by 0.3-0.7 percent (see Levedahl, 1991, for further discussion).
While these increases are nrxxJest in percentages, they add up to millions of dollars. In fiscal year 1988, the extra farm sales generated by the food stamp program were on the order of $350- $750 million, with additional benefits to those in the food marketing system (except for food service) (see Levedahl and Matsumoto, 1990). Effective demand for food is increased in total. However, the choice of foods depends on the preferences of the consumers receiving the food stamps.
Direct food distributbn came back in 1982 with the buildup in Government stocks, primarily of dairy products acquired under the support program. Temporary Emergency Food Assistance Program
100

(TEFAP) donations were over $1 billion in 1983 and 1984 and stayed over $800 million through 1987. With the disappearance of surplus stocks at the end of the 1980's, TEFAP expired, but rt was revived by congressional action with the requirement that USDA purchase commodities for distribution.
Food distribution to feeding programs for the elderly, such as Meals on Wheels, child daycare, soup kitchens, food banks, orphanages, summer camps, and nursing homes is more modest (fig. 21). Such distribution increased in the 1980's but not to the extent of TEFAP at its peak.
The school feeding programs started in the 1930's by distributing surplus foods. Soon, some cash was also distributed to partk^ipating school systems. In recent years, comnrxxJities have made up about 20 percent of Federal assistance for child nutrition programs.
Products that USDA buys for surplus removal or distributk>n bypass the wholesale and retail markets. Distribution to househokis or to institutk>ns replaces purchases that woukJ have been made in the commercial sector. Large cheese donations in 1982-87 displaced commercial cheese sales by about 35 pounds for every 100 pounds of TEFAP donatk)ns. Butter donations at somewhat more nrxxJest levels displaced margarine sales pound for pound, since very few TEFAP recipients prevk)usly bought butter. Products distributed to schools and institutions probably displace purchases on the commercial market nearly one-to-one except when very large quantities of one product are distributed; then, some other product is displaced.
Commodity Programs
USDA commodity programs are intended to support prices or incomes of the producers of certain products. But, the programs have side effects on marketing, as well. With a similar objective of raising the incomes of producers, each of the programs has somewhat different effects on the marketing of the commodity in question. In recent years, the programs for grains and cotton have operated by restrrcting supply and letting prk:es clear the market and then supplementing producer income by means of direct payments. The sugar program restricts imports in order to raise prices to dorDestic sugar producers. The dairy suppoil program sets a minimum price to farmers by offering to buy butter, powder (nonfat dry milk), and cheese at fixed prices. This section examines the
101

RgurB21
Domestic food donation costs
BiNion dollars
1.2
■ Schools
_ 0TEFAP'
Qother
0.8-
0.6-
0.4-
0.2-
1978 81
'Twnporaiy Emergency Food Aetistanoe Program.
Source: Data from U.S. DepL of Agr, Food arid Nutrttlon Service, Program Information DI\^flion.
effects of the relative prices for butter and powder on the marketing system.
Basic Commodities
The means of supporting farm income for basic commodities, such as grains and cotton, have been changing over the years. These changes have affected marketing strategies of farmers, first handlers (operators of country grain elevators, for instance), and users of these comnrxxlities. Farm programs since the 1960's have been níKxJified by successive farm bills to give markets a greater part in setting prk)es, while provkiing part of farmer income support through direct payments and other tools. Other changes have altered the choices facing martlet partk:ipants, including whether or not to participate in the programs. Until the 1960's, acreage control programs had been mandatory. As the programs moved toward a greater role for markets, the programs became voluntary, with the farmer weighing benefits like direct payni)ents against the restrictions on productk)n. Each year, a farmer faces a set of program
102

provisions, which must be considered in light of expected market conditions and of the situation on that particular farm, before deciding whether and how to participate.
Since the 1960's, some of the changing program features include:
• Diversion payment-A direct payment for agreeing to divert a portion of the acreage from production.
• Direct price support payment-An addition to the diversion payment. The loan rate was reduced by an equal amount.
• Payment limitation-A limit on the amount of direct payments per person. The amount and the types of payment covered vary. What constitutes a "person" has varied.
• Planting flexibility.
• Target prices and deficiency payments.
• Farmer-owned reserve (FOR)"Farmers who comply with the set-aside requirements can place their grain in the reserve for a stated period, usually after the regular within-season Comrrxxlity Credit Corporation (CCC) loan matured, and wait for prices to rise.
• Payment-in-kind (PIK) program.
• Generkî certificates-Payment by certifiâtes redeemable in CCC stocks of comnrKxJities rather than cash.
• Marketing k>ans for rice and cotton and now oilseeds, which alk>w producers to repay CCC k>ans at less than loan rates.
The sweetener and dairy industries discussed below have been much influenced by comnxxJity programs and their changes.
The Sugar Program"
The U.S. Government's involvement with sugar began 200 years ago with tariffs. During the Depression, comprehensive regulatk^n of sugar production, imports, and prices was introduced and lasted 40
' This section is based on Barry and others, 1990.
103

years to 1974. Since then, sugar support programs have been re- established (although less comprehensively) whenever the world price has fallen so low as to threaten the viability of U.S. sugar production. Since 1974, Government support was absent only in 1975/76 and 1980/81, when world prices climbed to cyclical highs. The world market price for sugar is formed in a residual or marginal market. In most years, the worki market prk:e is well bek>w the average price of all sugar.
The U.S. sugar program is the key determinant of the domestb sugar price, which directly affects producers and processors of sugarcane in 4 States and sugar beets in 14 States. Several means have been used to raise the prk^e of domestically produced sugar relative to sugar from abroad and to restrbt imports of sugar.
The Sugar Price Cycle
Sugar prices are among the most unstable in international trade, principally because even incremental changes in the worki crop or in Government polfcy tend to have disproporttonate effects in a small reskJual market. In perkxJs of crop failure, governments may temporarily restrk^t exports to meet domestk) needs, thus intensifying the rise in the worki price. Similarly, in perkxJs of bumper harvests, when output exceeds domestk: needs, supplying natbns may sell their surpluses on the world market, thus exerting downward pressure on the workJ prrce.
Superimposed on the day-to-day prk:e variability of the worki sugar market is a broad pattern of high prk^es for 1 or 2 years folk>wed by a long perkxJ of k)wer prk^es (fig. 22). In this cycle, intermittent large investments in workJ sugar productton and government interventk>n play key roles.
Increases in production capacity during the high-prk:e phase of the sugar cycle take several seasons to be absorbed by relatively steady but slow growth in consumptk^n. Processing facilities are expensive and require large size to capture scale economies. Consequently, once in place, there is a strong incentive to use plants fully to spread out fixed costs. Then, global sugar productton tends to exceed consumptbn, stocks accumulate, and prices fall. After 5-10 years of low prices and sbw growth in consumption, world sugar demand catches up with processing capacity. At this point, a disruption to production couki trigger an explosive prk:e rise, and a new sugar cycle begins.
104

Rgure 22
Raw sugar prices
Cents per pound
351
30
25
20-
15-
10-
o' ' ■ ' ' ■ ' 1950 56 60 66 70 75 80 86 90
DoiDestic sugar production replaced imports in the 1980's (fig. 23), reflecting both higher productivity and the assurance of relatively high prices through the support program. Prices were maintained and costs of production declined, so net cash returns for sugar crops improved compared with alternative crops (including Government deficiency and diversion payments for corn, cotton, rice, and wheat).
Alternative Sweeteners
Under the umbrella of high sugar support prices, alternative sweeteners have replaced much sugar in the domestic nr^arket (figs. 24 and 25). The nrx>st important alternative sweetener was high fructose corn syrup (MFCS).
Corn Sweeteners. Corn sweeteners consist of high fructose corn syrup (MFCS), glucose com syrup, dextrose, and crystalline fructose. Expanding use of corn sweeteners came largely from explosive growth in the use of MFCS. MFCS was introduced in 1967, but significant growth began in 1972, when a technobgical breakthrough
105

HgurtZS
U.S. tugar production, consumption, and imports
MUton short tons
12i
10-
1975 80 86 90
'BM«d on tfiiprntnli to primary dittributori.
permitted continuous use of an enzyme to convert glucose to fructose at low cost. HFCS-55 (55-percent fructose) is as sweet as sugar and, after its commercial introduction in 1977, it rapidly displaced liquid sugar in beverages. HFCS-42 (42-percent fructose), about 90 percent as sweet as sugar, is also used in beverages but is used more in baking, canning, dairy products, and processed foods. In 1988, HFCS-42 accounted for 40 percent of total MFCS use.
The rapid rise in use of MFCS came from its technical ability to substitute for sugar in many products, especially soft drinks, and from its k>wer production cost, which enabled MFCS to be priced strategbally bek>w refined sugar. MFCS prk^es folk>wed changes in sugar prk^es but at discounts of 10-30 percent (fig. 26).
MFCS had captured most of the market for calork) sweeteners in beverages by 1985, and its growth sk>wed conskJerably during 1985- 88. MFCS cun-ently constitutes 45 percent of the combined HFCS- sugar use in the United States, a proportion ctose to HFCS's present ability to substitute for sugar. Because MFCS is a liquki sweetener,
106

Rgure24
U.S. total consumption of sugar and sweeteners
Million short tons
¿yj
All sweeteners ^^/^
15 ^____^^-^^
10 Sugar
5 Ccrnsweëeners ^^^^^--^^'^
^— Low-calorie
0'—'—'—'—'—'—'—'—'—'—'—'—'—'—'—"^—'—'—'—'—' 1970 75 80 85 90
its use in nnajor food products is constrained; however, in 1987, a crystalline fructose was introduced for industrial use in some "niche- products. Further development of a high-quality and low-cost crystalline fructose or dry MFCS could substantially deepen the market loss of sugar.
Low-calorie Sweeteners. Low-calorie sweeteners have a sweetness so intense that only a fraction is needed to provide the same degree of sweetness as sugar. U.S. per capita consumption of low-calorie sweeteners (mainly aspartame and saccharin) increased faster than use of caloric sweeteners in the 1980's. By 1988, low-calorie use was about 20 pounds per capita in sugar sweetness equivalent (SSE), accounting for about 13 percent of overall caloric and low- calorie sweetener consumption, compared with 6 percent in 1980.
The rapid rise of low-calorie sweetener use reflects the accelerated adoption of aspartame (ARM) after 1981. ARM is 180-200 times as sweet as sucrose, compared with saccharin at 300 SSE, but has a taste considered superior to saccharin. Another high-intensity, low-
107

Rgure 25
Sweetener sales by type
other 1%
1975
1QGO
calorie sweetener, acesulfame-k (ace-k), entered U.S. commercial use in 1989. Ace-k is equal to APM in sweetness but, unlike APM, does not tose its sweetness when heated; its taste quality, however, is said to be betow both sucrose and APM.
Although per capita consumptton of both catorto and tow-calorie sweeteners increased in the 1980's, both sugar and corn sweeteners may tose markets as tow-calorie alternatives increasingly substitute at competitive prtoes. Food and beverage manufacturers may well adopt a multisweetener policy in whtoh sweeteners are cornbined for an optimal mix of price, sweetness, taste, texture, and stability.
Effects on Sugar Marketing
The U.S. sugar program affects U.S. sugar producers, processors, and others in the marketing channel.
Cane Sugar Refiners. Most cane sugar consumed domestically is refined here from raw sugar produced either in the United States or
108

Rgure26
Wholesale HFCS-55 and refined sugar prices
Cents per pound
00
30 ^^-"^^
25 ""^""---^^^^ Refined sugar /^ \
20 HFCS-55^^«-'-"'"^
15 -
10 -
5
1 1 1 1 1 1 1 1 1
1 1981 83 85 87 89 9
abroad. In addition, U.S. refining companies refine sugar for re- export. Between 1982-84 and 1987-89, refining volume declined over 20 percent, as quota imports of raw sugar fell more than 50 percent. Ten U.S. refineries have ceased operations since 1981, and refining capacity has declined 35 percent. Only 12 refineries remain, with an annual capacity of about 5.5 million tons of raw sugar. Increasing domestic cane sugar production provided only a small offset to the decline in raw sugar imports for refining. Still, the interest of cane sugar refiners in U.S. sugar policy is complicated because some companies own their own sugarcane acreage and others have both beet and cane processing facilities.
Manufacturers of Sugar-Containing Products. After passage of the 1981 farm act, and particularly after restrictive quotas were imposed in May 1982 (when world prices were declining rapidly), the U.S.-world sugar price differential climbed from a 1977-82 average of 5 cents a pound to 14.7 cents during 1983-88. This dranr^tically raised the incentive to ship sugar-containing products to the United States.
109

The sugar content of the increase in iniported products in the 1980's was about 175,000 tons a year. Domestic deniand for industrial sugar fell by that amount, as U.S. manufacturing of the products declined. The tosses to U.S. manufacturers would have been even greater without the import restricltons placed on selected categories of sugar-containing products, blends, and mixtures after 1982.
Corn Sweetener Manufacturers and Corn Growers. Corn sweet- ener manufacturers also benefit from the U.S. sugar program, since higher prices are received for their products. The sugar program's guarantee of stable minimum prices stimulated investment in corn wet milling, particularly MFCS facilities, and encouraged rapid acquisitton of a nr^jor share in the U.S. sweetener market. Further, the considerable revenues generated in MFCS have made possible substantial research, development, and promotion of corn wet milling products.
Rising productton of corn sweeteners increased the demand of corn wet millers for No. 2 yellow corn. The equivalent corn grind for MFCS productton increased from 131 million bushels in 1980 to 352 millton bushels in 1988. The equivalent corn grind for all corn sweeteners increased from 276 millton bushels in 1980 to 510 millton bushels in 1988. About 7 percent of a normal crop and 10.4 percent of the small 1988 crop were used by the wet milling industry to produce corn sweeteners.
Traders. Most imports of raw sugar are obtained through sugar operators, traders, or brokers, although cane sugar refiners occastonally contract directly for imports. The servtoes of sugar importers include: financing the transaction; chartering transportation; arranging for toading, import and export documentatton, and delivery to the buyer's docks; and, in the case of operators or traders, assuming the risk of prtoe changes. Sugar importers also trade in futures markets and may trade outside the United States. Changes in sugar imports due to the prtoe support program will affect sugar operators, traders, and brokers.
Pricing the Components of Miik
Because milk is often disassembled into components, whtoh are then used in many products, the values of the components are major factors in prtoe making. The dairy support program plays a signiftoant role in determining values. This section discusses changes in the Government program and the effects of such changes on dairy product markets.
110

Milk varies in its solids content, and from eariy days, pricing systems attempted to reflect the value of the components. Until Worid War II, butterfat was the most valuable component, with the skim portk>n being a byproduct of relatively low value. However, development of the milk drying business during and since Worki War II brought increased value to the nonfat solids portion. Early pricing plans provided a basic prfce of milk with a variatton depending on the butterfat content, and similar plans have generally been used, both in fluid milk and manufacturing milk markets, from the 1920's to date. In recent years, plans assigning a specify value to solkJs-not-fat or protein have been adopted by the State of California, by some cooperatives in other areas, and in two Federal orders. Such plans are under conskleration in three other Federal orders.
Since the 1960's, many observers have urged changes in the pricing of milk components. Such critk:s believed that the prk^e of butterfat shoukJ be lowered and the price of solkJs-not-fat increased. It has been nrx)st strongly contended that valuing the nonfat components of milk more and butterfat less woukJ cure nr^ny of the ills of the dairy industry and woukJ also contribute to improved diets.
It has been said that:
• The consumption of butter and cream declined substantially, due largely to competitbn from k>wer priced vegetable fats. Weight conscbusness and concern about the tie of butterfat and cholesterol to heart disease have also affected the consumptk>n of butterfat.
• Consumptk>n of skim milk and bwfat milk and certain other skim milk items is increasing. Raising the cost of nonfat solids wouW inhibit further growth in the sales of these items.
• Present prk^ing arrangements using butterfat differentials understate the nutritk>nal value of nonfat solids and overstate the nutritk^nal value of butterfat.
The relative value of butterfat and solids-not-fat is usually determined by the support purchase prk^es for butter and milk powder under the Government prk)e support program. Until 1971. USDA's discretbn in determining the relative value of butterfat and solids-not-fat was limited by the law that required support both of milk for manufacturing uses and of butterfat (in farm-separated cream) between 75 and 90 percent of parity. Since 1971, however, the Department can set
111

support purchase prices in any relationship which will provide the desired support price of milk.
The relative prices offered by the CCC for butter and nonfat dry milk (NFDM) are typically adjusted when support prrces for milk change. After the milk support is determined, CCC deckles what share will be reflected in the butter prfce and what share in the price of NFDM. In the 1970's and 1980's, most of the increase has been reflected in the NFDM prrce and most or all of the decrease in the prrce of butter.
The relative prices of butter and NFDM have changed markedly since 1960, largely because of prfce support actions. The prkîe per pound of butter was 4.3 times that of NFDM in 1960. The ratk> stayed about 4 to 1 through 1965 and then declined to 1.1 in 1974 during a shortage of NFDM. In the early 1980's. the price for a pound of butter was 1.6 times the price of NFDM. In 1990 and 1991, the price of butter averaged alniX)st the same as the prrce of NFDM. Thus, butterfat is now valued relatively much less than it was 30 years ago, and the nonfat portion of milk is worth much more.
In 1990, USDA changed the method of computing the butterfat differential under Federal orders. The change recognized that the butterfat differential shoukJ reflect both the price of butter and that of the nonfat solids associated with the butterfat in 40-percent cream. This change towers the butterfat differential compared to eariier methods.
Thus, in the past 20 years, the Federal dairy programs have substantially altered the relative value of butterfat and nonfat solkls, reflecting the market's evaluatton of these relative values quite well. Further changes for nutritional reasons run into the dilemma that one would need to tower the prtoe of butterfat to discourage farmers from producing it while, at the same time, raising that prtoe to discourage consumers from buying products containing butterfat.
Milk Marketing Orders
The marketing of flukJ milk is in sum different from any other agricultural commodity, although most indivklual characteristics can be found in some other product. This combination of characteristtos gave rise to the Federal milk mari<eting order program in the 1930's. Since then, dramatic changes have occurred in both milk production
112

and marketing.^^ At first glance, it would appear that nothing has remained the same. In this section, we examine these changes and their effects to see whether classified pricing and pooling, the basic tools of milk marketing orders, still serve a purpose.
Dairy farming is now the business of 150,000 commercial dairy farms, each producing several times as much milk as the typical dairy farm of the 1930's. But, except in Fk>rida, Hawaii, and the Pacific Coast States, farnns are still one- to three-person operattons.
The dominance by processors of fluid milk processing and distribution that characterized the 1930's has changed radk^ally. Supermarket groups now set the pace of prk^es and competitk>n in the mari<eting of fluid milk products, with processors much less powerful than they once were.
Cooperatives have grown larger and more powerful since the De- pression. Those involved with flukJ milk have grown from single- market or area cooperatives (in which several markets were ck>sely interrelated) to those of regbnal or multiregional scope. The function of balancing and managing the raw milk supply for fluki markets is now nrvDStly handled by these larger cooperatives, in contrast with the 1930's, when such functk>ns were performed mainly by each proprietary processor.
Changes in the scope of operations of flukJ milk cooperatives reflect the changes in the scope of markets. Formerly independent local markets for raw milk are now a part of an interrelated system of markets covering the entire country. Raw milk regularly níK)ves several thousand miles. On a smaller scale, packaged milk markets have also grown. Formerly independent markets 40 miles apart now make a single rr^rket, and packaged milk regularly moves 200 miles or more. Thus, the competitive relatk>nships of the sellers of packaged milk are greatly changed.
Supermarket groups now buy milk very differently, even those who do not process milk, as some do. Where these groups formerly handled fluid milk on a commissbn basis, they now buy private-label milk under contract. These contracts easily move from one processor to another and bring minimal profits.
^ See Manchester. 1983, chapters 2, 5-7, and 13 for more on these changes.
113

Processing of basic manufactured milk products is done less often by the sellers of branded goods. Such sellers now concentrate on merchandising and distribution, while contracting with others-usually cooperatives-for basic processing. Hard cheese, cottage cheese, and butter are often handled this way.
Many basic characteristics of the dairy industry have changed little or not at all during these developments. The dairy industry still has very different characteristics from those of other agricultural and nonagricuKural industries.
Production still requires specialized inputs that are of limited, if any, use in other activities. The inputs are many times more expensive than they were in the 1930's. The rate of milk output is still controlled chiefly by varying the number of cows being milked, so milk production can be reduced by slaughtering cows but increased only by breeding and raising more cows. Entry into and exit from milk production are still expensive. Inspectk)n of milk output for quality and safety is still required.
Milk is still produced every day and must move to market at least every other day. While this is only half as often as it moved during the 1930's, milk is a flow commodity, and marketing and prk:ing must deal with that fact.
In the short run (day to day), supply is not tuned to derr^nd. The cows produce every day, and milk must go to market, even if the demand is tow on that day. Demand for milk for bottling is almost zero on Sundays and small on Saturdays and Wednesdays, since nrx)st plants ctose down on those days. But, the milk is still produced and can be discarded only at a high cost. Substantial economies of scale exist in the management of milk supplies to deal with these day-to-day variattons. A single manager is more efficient than several firms, whtoh encourages centralizatton of the management of milk movement and supplies. The task has now largely been taken over by cooperatives.
Such changes in the past 30 years have contributed greatly to the growth of large regtonal cooperatives. These cooperatives couki manage the milk supply more efficiently than the processors to whom they sokl, which created consklerable incentive for both cooperatives and processors to move toward centralizatton. As a result, individual cooperatives often supply a high percentage of the milk in a given market: in small markets, 100 percent; in larger markets, often two- thirds or three-quarters.
114

In most industrial markets, a manufacturer who controlled three- quarters of all sales would soon be called a monopolist by the antitrust agencies. But, control of 75 percent of the supply of a raw agricultural product such as milk hardly confers the same market power as a similar percentage of the supply of a differentiated consumer product. The market share of the cooperative seller of agricultural products has a quite different base than is found in markets for industrial products. Manufacturers of steel or automobiles have virtually complete, legal control both over output and over the productive resources used to create that output. Manufacturers who conskler it to their economic advantage have both the power and the right to restrict productk)n. In the imperfectly competitive industrial mari<ets of today and yesterday, barriers to entry on the part of potential competitors make power to restrk)t productk)n a meaningful index of market power.
But, ni)ost agrk^uKural marketing cooperatives lack such power. Productk>n decisk>ns are in the hands of farmers, sonne-perhaps most--of whom are members of the cooperative. Many cooperatives have marketing agreements with their members that require the cooperative to nriarket all of a member's productton. But, such contracts provide no means of control by the cooperative over the volume of that productk>n.
The firm buying from that cooperative, on the other hand, is under no such obligatk^n to accept supplies. The buying firm may specify the quantity wanted, or it may accept the product only at reduced prices. Thus, the market power of a marketing cooperative with, say, 75 percent of the supply cannot be equated with the market power of a buyer-say, a processor-who buys 75 percent of the product.
The "free-rider" problem is basically unchanged from the 1930's. A limited-sen/k)e cooperative or proprietary milk supplier can avoid the costs of managing and balancing supplies for the entire mari<et by letting large, full-service cooperatives "carry the surplus" and cover the costs. With overorder charges in most Federal order markets to cover the costs of managing and balancing supplies plus the proceeds, if any, of market power, a limited-sen/rce supplier can sell at minimum order prices and effectively undercut the larger full- servfce supplier. This effectively provkies a limit on the power of the large cooperative to exptoit its apparent position of "control" of the market. Without minimum order prrces, the possibilities would be even greater.
115

Grades and Classes of Milk
Grades of milk depend on meeting the sanitary (health) standards, usually set by the State health department.
Grade A milk meets the sanitary standards for use in fluid milk products and can be used for any dairy product- Class I, II. or III.
Grade B milk meets somewhat lower sanitary standards and can be used only for manufactured products such as cheese, butter, nonfat dry milk, and canned milk-Class III products.
The class depends on the use of the milk-that is, whrch products come from the milk. Class I is used for beverage milk. Class II is used for ice cream, cottage cheese, and other "soft products." Class III is used for "hard" products, such as butter, nonfat dry milk, cheese, and condensed milk.
Other situatk>ns of the "free-rkJer" type (where costs and benefits do not accrue to the same groups) still exist, some of them in a more heightened form than 50 years ago. All possible substitutes for Class I milk products have this potential. Federal order market pools that carry the reserves for other markets also have this characteristic.
Classified Pricing
Classified prk^ing and pooling are the major instmrDents of milk marketing orders. These practices were used in fluid milk marketing long before Federal milk orders appeared in the 1930*s. Use of these instruments nK>re nearly ensures that similarly situated milk producers and milk processors receive or pay the same prk^es. The sway of an order over all processors selling in a given market thus solves the free-rider problem.
116

Understanding pooling is relatively straightfon/vard: all producers at approximately the sanne location (in practice, the same mileage zone from the center of the market) receive the same price, which is an average of market use of milk. Understanding classified prk:ing is more involved. Charging different prices for the same milk, depend ing on the use to which it is put, is what economists kJentify as prk^e discrimination.
But, all that glitters is not price discrimination. Econome prk:e discrimination is defined as charging different net prrces to different buyers for the same product (Waugh, 1964, p. 65; Phlips, 1987, p. 952). Nominal prk^es are easy to compare. Net prices are much more difficult, since these require cost information as well as quoted prices. Comparison of prices for the same product requires that the product be identical in space, time, and form utility or that differences in these utilities be costed out into net prk:es.
Some have argued that any difference in the price for milk from, say, a given tankload whk:h is used for different purposes is conclusive evidence of prk:e discriminatk>n and of excessive market power on the part of the seller (see Massen and others, 1978, p. 66). In a given tankload of milk, the physical characteristics of the parts used for fluid milk or for k:e cream or butter-powder are certainly kJentk^al. But, in economk: terms the value of the milk used for the ice cream is significantly less than that used for the packaged milk.
The economic principles of k)catk>n theory tell us that, in a perfect market, the value of milk for fluki use at a city plant is determined by the cost of transportatk>n of bulk milk from the outer reaches of the milkshed. But, the value of milk for use in k^e cream is limited by the cost of transporting ice cream or tee cream mix from plants in the surplus productk^n area. The economic forces represented by these principles are at work with or without the interventbn of public regulation.
Thus, milk for use in tee cream can move to a city plant only at a price which does not exceed the cost of alternative ingredients-for example, ice cream mix-from somewhere else, providing there are no restrtettens on movement or requirements that only kx^al milk can be used to manufacture ice cream.
But, in this free-fk>w market, there will be no milk for use in fluid products if the higher prtee, including transportation, is not paid, since it would obvteusly then pay the producer more to sell to a manufacturing plant in the outer reaches of the milkshed.
117

In terms of demand cun/es, the demand for raw milk for use in ice cream is zero if priced the same as that used in fluid products, since the entire demand has already been met by ice cream mix from more distant areas.
In such a situation, in a perfectly planned world, precisely as much milk woukJ be produced in the kx^al milkshed as was needed for fluid milk products, and all ice cream would be made from shipped-in mix. But, since cows produce varying anrKHjnts, storms interrupt assembly and hauling, and consumers seldom behave according to plan, some misnr^atch between farm productk>n and plant use for packaged milk is inevitable. It is obviously less wasteful to use surplus milk (the resen/e against running out) for manufactured products than to put it down the drain (which, in any case, is now illegal in most jurisdk:tk>ns because it creates additk>nal k>ad at the sewage plant).
Thus, that whk)h seems so clear when one kx>ks at a single, isolated tankk>ad of milk takes on very different dimensk)ns when one looks instead at the fbwoi milk day after day. Because it is the fk>w of milk that must be priced rather than a single k)t, the dimensk>ns of space, time, and form utility are changed. The "market" for that isolated tankbad of milk at the dock of the city milk plant is only an inckJent in an interconnected set of markets for milk in all its forms and for all its products.
Classified pricing of milk was invented to deal with these problems, whk:h have been bask^ally unchanged in 100 years. The additional possibility of prk)e discriminatk)n was discovered much later. That had to await the devek>pment of market power. The original term for what is now called classified prk^ing was "use pricing." As an akJ to understanding the problem and the system devek)ped to deal with it, there is much to commend the okier term.
On the demand skie, the value of bulk milk for use in manufactured products is limited by the cost of, say, competing \ce cream mix, as seen in the preceding example. But, the value of bulk milk for use in packaged fluid milk is limited only by the competitk>n of bulk milk shipped in from other areas.
On the supply side, there were and are substantial costs of producing and marketing Grade A milk for use in flukJ milk products that are not incurred in producing and marketing Grade B milk for use in manufactured products (see box). A supply curve at the fluid milk plant must reflect all of these costs. Since the prk)e of milk for use in
118

manufactured products ("surplus" milk) is limited by the cost of ingredients, all of the costs will be reflected in the Class I price.
When sanitary regulations first required farmers to meet higher standards in milk for sale as flukl milk products, the additk>nal costs of meeting such standards were the major cost factor. These costs were about 17 percent of the average Class I price in 1935 (Black, 1935, p. 118). But, nowadays, such added costs are ck>se to zero.
In the 1930's, fluid milk processors incurred most of the additional costs of marketing bulk milk. The additional costs of operating a receiving and balancing system were incurred largely by these processors. Thus, the added costs were not reflected in Class I prices, since the processor met the costs over and above the prrces paid to farmers (although such costs were reflected in wholesale and retail prk^es of packaged milk). As these functk>ns nioved from processors to cooperatives in the past 30 years, prices paid by processors to cooperatives for milk used in fluid milk products came to reflect many of the costs of balancing. These costs were reflected largely in overorder payments.
These costs exist and must be covered by the marketing system in some way. They are not the result of monopoly power. On the contrary, such costs wouki be much higher if large cooperatives were broken up and the system coukJ no k>nger benefit from economies of size.
Significant additk>nal costs are involved in marketing bulk milk for use in flukJ milk products, costs whk:h are not incurred if the only use is for manufactured products. If the system were designed solely for manufactured products, most milk would nfx>ve directly from the farm to the manufacturing plant to be manufactured promptly into butter, powder, cheese, or other manufactured products. The only constraint woukJ be the capacity of the manufacturing plant to handle the volume of milk shipped from farms on a given day. This constraint woukJ only be serk>us in the flush productk)n season of a year of heavy milk output. Manufactured products can all be stored, and mismatches between short-term supply and demand coukJ be met by varying the volume in storage (see Christensen and others, 1979).
But, storage is not feasible for flukJ milk products and soft products except, to a limited extent, for k:e cream. Reserves of milk are therefore needed to have enough milk available each day to meet the needs of flukl milk processors. The costs of supply-demand balancing and coordination include extra hauling costs to move milk
119

to short-supply areas and also to divert reserve supplies to manufacturing and balancing plants, costs of bulk storage used to hold milk supplies to meet peak demand days, personnel and offk^e expenses involved in delivery coordinatk)n and rerouting bulk tank trucks, shrinkage resulting from splitting k>ads and rek>ading to divert milk to manufacturing plants, general administratk>n, health and quality inspectk>n fees on reserve milk, market administratk>n fees on resen/e milk, and plant give-up costs. Plant give-up costs are the increase in unit costs whk)h occur when reserve milk is withdrawn from balancing plants to make supplemental shipments of milk to market milk haridlers.
To sum up, any pricing system for milk meeting the sanitary requirements for flukJ use must deal with the bask) fact that milk which is indistinguishable at the farm is no longer the same, in an economic sense, when it reaches the flukJ milk plant rather than the manufactured products plant. Thus, a classified prk^ing system, or something akin to it, is necessitated by the economics of the milk market. The additional costs of producing and marketing milk for fluid products as compared with milk for manufactured products must be covered by the prkîing system, either in Federal order minimum class prices or in service charges of cooperatives.
Implications for Pricing and Demand
Many of the food system changes already described have signifbantly affected the ways in which market prk^es are formed through the multiple levels of the food system. The relatbnships arTK)ng farm prices, manufacturers' prices, wholesalers' prices, grocery store prices, and restaurant prk^es have been altered, and demand relationships are different. In this sectk>n, we conskJer several aspects of those changes in price and demand relatbnships.
More Through Food Service
The dramatic increase in the foodservice share of food spending in the postwar years (see fig. 5) has altered the relationships between farm prk^es and consumer prk:es in several ways. Foodsen/ice margins are much wkJer than those for food soki through stores. In 1990, farm value accounted for 16 percent of the foodsen/rce dollar, compared with 30 percent of that for foodstores (Dunham, 1991). Thus, restaurant prk^es are substantially nrx>re insulated from farm price changes than are those of foodstores. Farm prices thus often
120

react less to changes in restaurant prices than to changes in retail store price.
Restaurant prices have trended upward conipared with store prices, although in periods of rapid food price inflation, as during 1972-74, store prices rose more rapidly (fig. 27). Since 1953, restaurant prices have risen relative to store prices in 27 years and declined relatively in 10 years. A rule of thumb that is often useful is that restaurant prices will tend to rise at about the rate of the consumer price index for nonfood goods and sen/ices. In other words, cost increases for labor and other nonfood items are nx>re important than food costs in determining restaurant prices.
Relationships between foodstore prices and those of their suppliers (manufacturers and shippers) are somewhat more variable (that is, change direction from year to year), on average, with margins trending upward. However, margins for individual food products often behave quite differently from the averages.
Most fast-food places have a fixed menu. The share of full-service restaurants with fixed menus (though specials n^ay vary) is also growing (see table 8). For such restaurants, changes in relative prices of different foods can have only limited effects on what is offered and how much is sold. Thus, the demand of food service becomes more inelastic; quantities purchased are much less responsive to price change.
The salad bar has become alniX)st a standard feature in restaurants, including many fast-food places, in recent years. And, any salad bar must have lettuce. Salad bar lettuce, shipped in 1,000-pound bins under contract, accounts for 12-15 percent of California lettuce. Contract prices include a premium over normal prices, which provides the foodsen/ice buyer with guaranteed supplies and some protection against wide price swings {The Packer, 1991. pp. 1, 2A). When weather or disease sharply reduces the crop in one California district, prices shoot up to ration the remaining supply. Many households will temporarily quit buying lettuce until prices fall, but an eating place with a salad bar cannot do this. So, grower prices rise sharply. Lettuce production was cut nearly in half by weather and insect damage in the winter of 1987-88, and iceberg lettuce prices rose from typical levels of $4-$6 per carton to $42 per carton in some eastern terminal markets.
Massed introduction of chicken items by hamburger chains in 1988, during a period of declining broiler productk>n, drove wholesale prk:es
121

ñgur»27
Relative prices of food at three stages of the system
Percent of retail store prices
Cf^Kf
Restaurant prices ^^,/"A y/^—'^"'^
150 ^^^^"^^^
100 Retail store prices
50
Manufacturers' and shippers' prices
1 1 1 1 1 1 1 1 1 1 1 1 1 1 1 1 1 1 1 1 1 1 1 1 1 1 1 1 1 1 1 1 1 1 1
1964 59 64 69 74 79 84 89
of boneless chicken breasts (the principal source of the white meat needed for nuggets, fillets, and similar cuts) from $1.55 per pound in January 1988 to $2.79 in June. Although not so extrenr)e a case as that of lettuce, denr^nd became much more inelastic.
More as Ingredients
Overall, the share of food products that are used as ingredients has woX changed much since 1958 (see table 24). But, for some products, the change has been enough to alter price relationships. The story of processed eggs illustrates this kind of devebpment.
The commercial processed egg industry started about 1900 but got its big boost from Worid War II demand for an egg product that could be shipped overseas. In 1944, 27.5 percent of eggs were com- mercially broken, with much of the product dried or frozen (table 27). After the war, military demand declined sharply, and by 1955, only 7 percent of eggs were broken. At that time, egg breaking was either a salvage operatk>n for eggs sorted out as substandard in grading and
122

Table 27-Productk)n and relative prices of processed eggs
Relative prices Frozen egg
Processed eggs as Frozen whole whites as percentage of domestic eggs as percentage percentage of
Year disappearance of eggs of shell eggs^ frozen whole eggs^
Percent
1944 27.5 1950 10.7 1955 6.7 1960 6.8 1965 9.4
1970 10.6 1975 11.1 1960 14.2 1965 16.0 1969 19.4 1990 21.3
73.3 31.4 77.6 54.6
69.6 65.6 77.2 53.0 67.6 59.2 67.2 54.3 66.3 102.1 94.0 64.5
- « Not available. ^ Price per pound at wholesale in New York City and Philadelphia of frozen whole
eggs as a percentage of price to U.S. retailers of 0.759 dozen shell eggs. ^Price per pound of frozen egg whites as a percentage of price of frozen whole eggs,
both wholesale at New Yoric City and Philadelphia.
packaging shell eggs or a seasor^l operation in parts of the Midwest where egg production was highly seasonal. A gradual increase in the share of eggs broken began in the late 1950's and has continued, with 21 percent of all eggs being processed in 1990.
In the early days, most eggs used as ingredients were purchased by the nianufacturer in shell form. Buying processed eggs relieved the food manufacturer of the expense of a breaking enterprise, and it kept egg supplies readily available. Also, pasteurization (required by law) helped deal with the salnrK>nella problem. Food product manufacturers increasingly used processed eggs. Egg processing has now changed from a salvage or seasonal operatbn to an industry that competes with shell eggs on nrx>re nearly comparable terms.
123

Prices of frozen whole eggs have risen from 73 percent of a comparable quantity of shell eggs in 1960 to 94 percent in 1990. Health-conscious consumers have increasingly avoided the cholesterol in egg yolks, and unique uses of egg whites have boosted demand for whites. Relative price per pound of egg whites soared from 31 percent of the price of whole eggs in 1960 to 85 percent in 1990.
More Disassembly
Some foods retain the same form throughout the marketing process. Although cleaned, graded, polished, or waxed, fresh fruits and vegetables and shell eggs are the same products at retail as they are when harvested. Other foods are processed but are not basically changed. Fruits and vegetables are canned, frozen, dried, or dehydrated. Milk is pasteurized and packaged. Still other foods are manufactured into quite different products from the primary raw food ingredient. Sugarcane and sugar beets are made into refined sugar, wheat into ftour, and milk into cheese. Often, some byproducts are produced, but these are usually of minor value.
Some agricultural products are disassembled into several components, each of whk^h has significant value. Oilseeds are the best example of this type of transformation. Soybeans, except for a few sokJ whole for food use, are pressed to extract the oil and meal remains. The soyoil is used nrx>stly to manufacture margarine, shortening, or salad oil. Some soymeal is made into edible protein products, but most is used as a component of animal feed. The relative value of oil and meal varies, depending on supply and demand, but the value of meal from a bushel of soybeans has exceeded the value of the oil in recent years.
In the postwar perkxJ, other products have moved toward more disassembly, or else the disassembly operatbn has moved to an earlier level in the marketing system. Pork has been disassembled (the carcass broken into cuts) by the manufacturer for more than a century. Some of the cuts, such as bacon and ham, are then cured. The disassembly of beef carcasses into retail cuts has nrx)ved to earlier stages in the marketing channel in the past 25 years. Chickens and turkeys were originally soki as whole birds (that is, not disassembled), but since the early 1960's, more and rTX>re birds have been cut up, and some are further processed by the manufacturer. More than half of all poultry is now cut up by the manufacturer.
124

Table 28-Change in milk prices by various measures
Change Item 1954-73 1954-87
Percent
Whole milk:' Store bought 57.4 185.7 Home delivered 68.4
Average prices: Whole milk 44.2 157.0 Whole, lowfat, and skim milk 42.2 151.8
- = Not available. ^Bureau of Labor Statistics index.
Milk is now routinely disassembled into the butterfat and skim portions, and the latter is often further disassembled into a variety of products. The manufacture of butter and nonfat dry milk became a viable operatk>n on a large scale due to encouragement by the Federal Government during WorkJ War II.
The increased prevalence of disassembly has changed prkîe relationships, leading to problems in prrce measurement in such analyses as those of demand. Changes in product mix, containers, and services (home delivery versus store sale) for flukJ milk have caused quite different nfx>vements in milk prices from those in measures of pure price change such as the Bureau of Labor Statistics (BLS) prfce indexes (fig. 28).
The average prfce for all milk has risen much less than the prrce of whole milk bought in stores in containers of a single size-157 percent from 1954 to 1987, compared with 186 percent (table 28). The average prrce of all beverage milk (whole, lowfat, and skim) has risen even less.
Dramatic changes in the past 30 years in the form in whfch chicken is sold (fig. 29) created substantial differences in prfce movements between individual products, such as whole chrcken, and the average
125

Rgure28 Milk prices by variou« measures
Percent of 1954 3001
250-
200-
150-
Whole milk, store and home
Whole milk, store'
Whde milk, home'
Whole, bwfat. and skim milk; store and home
100 1954 eo 66
'Bureau of labor StabtUct indexe«.
Source: Manchester. 1900.
prices of all chicken. The wholesale price of whole broilers rose 67 percent during this period, and prices of cut-up broilers rose 63 percent. But, prices of young chicken in all forms rose 134 percent because of major shifts to higher prk:ed forms (fig. 30).
Retail prk^es rose more than wholesale prices because margins also rose (fig. 31). But the spliced series for chicken parts (breasts for 1964-77 and all parts for 1978-87) rose substantially niX)re than for whole birds, in contrast to the behavior of wholesale prrces.
In a simple demand analysis using nominal prk:es, nominal incomes, and per capita consumptbn of all chicken, the different prk^e series gave these results:
126

Price series Own-price elasticity
Income elasticity
Retail prices of whole birds -0.32 +0.49
Wholesale prices of whole birds -.26 +.44
Wholesale prices of all chicken -.27 +.48
Rgure 29
Per capita consumption of young chicken by form
Percent of 1962
LuoU >
1.060 /
850 /
660
450
Cut-up ^^
250 ^/^ Whole bifds
^^^^^ Aliforme \
1 1 1 1 1 1 1 1 1 1 1 1 1 1 1 1 1 1 1 1 "i- T - r «.I-.
7 50 19 62 67 72 77 82 fi
Sourca: Mvtch«ttor. 1090.
127

ñgure 30
Wholesale prices of chicken by various measures
Percent erf 1962
3001
250
Cut-up broüers
50' ''''''■ ' 1962 67
Source: Manchester, 1900.
72 77 '''■■■'
82 87
The Changing Demand for Beef ^^
Questions about shifts in consumer demand for beef surfaced in the late 1970's, when U.S. per capita beef consumption stopped trending upward. Consumption grew throughout the 1960*s and early 1970's but peaked in 1976. In the late 1970's, per capita consumption dropped, and it failed to rebound in the 1980's. Throughout the 1980's, both beef consumption and prices were tower than analysts had expected based on previous price-quantity relationships. So, many analysts postulated that the demand for beef had declined.
The amount of a product bought is related to (1) its price, (2) the prices of related goods, (3) incomes, and (4) consumer tastes. Changes in any of these four factors can alter consumptton. In the short run, people buy what is produced at whatever price will clear
^ The first portion of this section draws on Hahn and Nelson, 1990.
128

Rgure31
Retail prices of chicken
Percent of 1962
<JM
250 - /■/
200 - Parts .••'' ^ /
150 / ^^^ Wholebirds
100
1 1 1 1 1 1 1 1 1 1 1 1 1 1 1 1 1 1 1 1 1 1 1 1
1962 67 72 77 82 87
Source: Manchester, 1000.
the market. In the tong run, consumer demand drives output decisions.
We use the term "demand" to describe the relationship between the price of an item and the anriount of it people would buy at given levels of other prices, incomes, and tastes. Demand changes when other prices, incomes, or tastes change.
The demand for beef has changed since the mid-1970's. Consumption of beef has declined, and people are now willing to purchase less beef at a given constant-dollar price than they were in the mid-1970's. One important reason is that chicken has become more affordable, relative to beef. In addition, income changes have done little to strengthen the demand for beef in the 1980's. In 1988, 13 percent more households had incomes of $25,000 per year or more (in 1988 dollars) than was true in 1967. But, per capita purchases of beef for home use would have increased only 1 percent as a result of such changes in incomes.
129
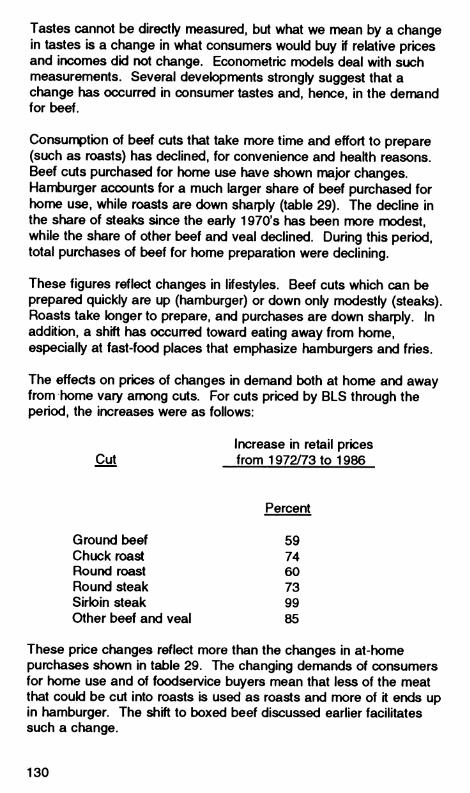
Tastes cannot be directly measured, but what we mean by a change in tastes is a change in what consumers would buy if relative prices and incomes did not change. Econometric models deal with such measurements. Several developments strongly suggest that a change has occurred in consumer tastes and, hence, in the demand for beef.
Consumption of beef cuts that take more time and effort to prepare (such as roasts) has declined, for convenience and health reasons. Beef cuts purchased for home use have shown major changes. Hamburger accounts for a much larger share of beef purchased for home use, while roasts are down sharply (table 29). The decline in the share of steaks since the early 1970's has been more modest, while the share of other beef and veal declined. During this period, total purchases of beef for home preparatbn were declining.
These figures reflect changes in lifestyles. Beef cuts which can be prepared quickly are up (hamburger) or down only nrKxIestly (steaks). Roasts take k)nger to prepare, and purchases are down sharply. In addition, a shift has occurred toward eating away from home, especially at fast-food places that emphasize hamburgers and fries.
The effects on prk:es of changes in demand both at home and away from home vary among cuts. For cuts priced by BLS through the period, the increases were as follows:
Increase in retail prices Cut from 1972/73 to 1986
Percent
Ground beef 59 Chuck roast 74 Round roast 60 Round steak 73 Sirk>in steak 99 Other beef and veal 85
These prk:e changes reflect more than the changes in at-home purchases shown in table 29. The changing demands of consumers for home use and of foodservice buyers mean that less of the meat that coukJ be cut into roasts is used as roasts and more of it ends up in hamburger. The shift to boxed beef discussed earlier facilitates such a change.
130

Table 29-Shar8 of spending by urban consumers for beef and veal cuts at constant prices
Cut 1972-74 1980-81 1982-83 1984-85 1986 1987-88
Percent of beef and veal
Ground beef 26.0 37.1 38.4 39.3 41.3 46.3
Roasts: Chuck roast 12.0 9.5 8.7 7.2 8.0 6.5 Round roast 10.0 5.7 5.3 5.3 5.3 4.8 Other roasts 6.2 5.2 4.9 5.9 5.7 5.0
All roasts 28.2 20.4 18.9 18.4 19.0 16.3
Steaks: Round steak 6.2 9.5 8.3 8.5 7.3 6.0 Sirloin steak 6.9 6.0 7.7 7.5 7.3 6.6 Other steak 22.2 17.8 18.0 17.1 17.2 17.8
All steak 35.3 33.3 34.0 33.1 31.8 30.4
Other t)eef and veal 10.5 9.2 8.7 9.2 7.9 7.0
Thus, the evidence supports the conclusion that the demand for beef has changed since the 1970's. Price-quantity relationships are different, with significant changes in the cuts purchased.
Conclusions
The markets for agricultural products have changed rapidly throughout the post-Worid War II period. Markets now offer a wide choice of products, a variety of distribution systems, and many built-in servk^es, such as precooked meats and mrcrowave meals. Much of this diversity resulted from the keen awareness by food manufacturers, wholesalers, retailers, and foodservice firms that the market is consumer-driven and from the competitive efforts of marketing firms to adapt. Consumer spending provides constant feedback on how ck>sely marketers have met perceived wants. Discovering consumer wants and reactions toward various product characteristfcs has become big business. Management practices
131

now involve studying changes in consumer lifestyles and preferences and adjusting to capitalize on those changes.
Changes that have influenced the way food is niarketed include the following:
• Denx)graphics-the niakeup of the population.
• Consumer lifestyles-especially the demand for convenience.
• Economic conditions-income and inflation.
• Public policy and private attitudes on food and health, food safety, nutritbnal labeling, and other food-related issues.
• Food programs.
• Farm policies and programs.
The Consumer World
Demographic shifts involve declining household and family size because of later marriages, more divorces, smaller families, and less doubling-up (two families in one household). With more young and old people maintaining their own residences, single-person households went from 11 percent of all households in 1950 to 24 percent in the late 1980's. The proportion of families with nrx)re than one earner began to increase sharply after World War II, from 39 percent in 1950 to 58 percent in 1990. With the combined effects of rising real income per wage earner and declining family and household size, average real income per person in households rose 155 percent between 1947 and 1990.
More money and less time for food procurement, preparation, and consumption in many households has made convenience the key. In families where all the adult members work outside the home, time allotted for meal preparatk>n has shrunk from 30 minutes a few years ago to 20 minutes today. The mk^rowave oven has become the standard appliance in more than 90 percent of U.S. homes.
As incomes and the number of multiple-earner families rise, individuals eat out more often. The share of food expenditures away from home rose from 25 percent in 1954 to 46 percent in 1990. Most of the growth in the away-from-home market was in fast-food places. The share of these places rose from 4 percent in 1954 to 34 percent
132

in 1990. while the share of table service restaurants. Iunchrcx)ms, and cafeterias declined from 48 percent to 37 percent.
These deniographic changes caused the demand for various foods to change, since different population groups vary in what and where they eat and how they shop. Young, higher income households eat out more often and purchase different foods than older, less prosperous people. Households with children spend nfK>re of their at- home food dollars on milk and sweets; the elderly spend nfX)re on fruits and vegetables. Higher income families spend more on fish, cheese, and butter. Food demand also differs annong races and geographic regions.
The influence of health concerns on food choices reached a high level in the 1980's and is still rising. In the 1980's. foods were increasingly perceived as "good" or "bad," depending on popular perceptions of health consequences. For example, fears about the health effects of cholesterol became a major influence on food choices, and the supposed beneficial effects of fiber boosted demand for certain products.
Interest in convenience and health played major roles in altering the foods eaten at home. Between the early 1970's and the mid-1980's, consumers began eating:
More ...and less • Poultry. • Beef and pork. • Cheese. • Processed vegetables. • Fresh fruits and vegetables. • Bakery products. • Processed fruit and juices. • Sugar and sweets. • Cereal products. • Coffee and tea. • Other prepared foods.
Changes in Marketing
Farmers, manufacturers, and marketers have adjusted, sometimes defensively, to these changes. But, such changes also create opportunities. As more specialized retail market segments have developed, the wholesale and food manufacturing sectors have had to respond. Some manufacturers who once supplied all parts of the market are now specializing in one segment, such as branded consumer products, foodservice products, or ingredients for other food manufacturers. In general, only very large firms have the resources to supply and market a broad line of nationally branded consumer foods, which requires continuous product devetopment and
133

promotion. Since 90 percent or more of new products fail, only firms with extensive resources can compete in the national brand area.
Other manufacturers emphasize products developed for food service or for particular segments of that market. For example, some specialize in products for a particular hamburger chain, like McDonald's. Several manufacturers have gone extensively into wholesaling to foodservk:e outlets, with only a part of their products made in their own factories. Still others specialize in nk^he markets such as ethnic foods.
A massive restructuring of corporate Amerba, whk:h includes the food sector, has been occurring for 30 years, and the pace is accelerating. Mergers have greatly changed the organization of food manufacturing and the kinds of business manufacturers do. Companies increasingly handle a broader line of products. Specialized canners of fruits and vegetables have expanded their lines to a wkle array of food and nonfood products, as have dairy firms and meatpackers.
Food manufacturing, like many other lines, has gone international since World War II. Many large food companies are now both manufacturing and selling abroad; some of these sell more in foreign countries than in the United States. Exports of U.S.-made processed food products have grown less rapidly than total sales of food products by U.S. companies in foreign markets.
U.S. companies have moved into other countries, often by acquiring local firms. Similarly, European, Canadian, and Australian companies have acquired U.S. food firms. After decades of folbwing a quiet course in the United States for fear of antitrust actk>n, world companies, such as Nestlé and Unilever, have made major U.S. acquisitions.
Manufacturers in this changed market are looking for altered or different products from farmers, and farmers must adjust to the changing demands. Farmers are increasingly pakl on the basis of how well they perform in providing commodities that meet the buyer's specificattons. Procurement arrangements for many commodities have changed, as farmers and rr^nufacturers try to shift the incidence of risk of crop failure or price change to each other. For example, Florkia citrus is mostly sold to processors under pooling arrangements with both cooperatives and proprietary processors.
134

Consumer level changes have forced marketing changes. As a result, retailers have identified and devetoped profitable market segments (groups of customers) within both the home and away- from-home food markets.
Retailing
The supermarket boom dominated developments in food retailing from the end of WorW War II to the mkl-1960's. Then, retailers had to find increasingly diverse strategies to attract consumers. Supermarkets' share of grocery store sales jumped from 23 percent in 1948 to 60 percent in 1963, foltowed by stower growth until the late 1970's and by no growth in the 1980's. In the past 15 years, diverse store formats have appeared, each appealing to a different market segment. In the 1980's, the market share of conventtonal supem^rkets fell from 73 percent to 43 percent, while the share of larger stores with broader merchandise assortments increased. Stores emphasizing k>w prfces increased their market share from 5 percent to 16 percent of all supernr^rket sales, while those emphasizing broader selection raised their market share from 22 percent to 42 percent.
The natbnal share of supermarket chains with warehouses-those that have staffs for most of their buying-increased from 30 percent of all grocery store sales in 1948 to 47 percent in 1977. Most of the increase came in the 1950's. Since 1977, the market share of such chains has shown no trend.
Food Service
The dominance of chains, both owned and franchised, in fast-food places and, to a lesser extent, in full-service restaurants means that menu items are fixed from day to day. A hamburger emporium will always serve hamburger, and a pizza place, pizza. So, demand for specify foods responds little to changes in price. Such fixed-menu eating places now sell much more than do restaurants with more flexible menus, which can avoid items with rising prices. Eating places with fixed menus made 56 percent of all sales in 1966, rising to 73 percent in 1979 and 80 percent in 1988.
Wholesaling
Changes in retailing and food servfce on one side and in food manufacturing on the other side forced wholesalers into major changes. Large supermarket chains have long done their own wholesaling through their warehouses, and they still generally do, but
135

smaller chains have increasingly relied for their supplies on independent wholesalers.
Food sen/ice has now grown to more than half the market for independent wholesalers, and specialization in foodservice wholesaling has l>ecome typical. Mergers anrx>ng wholesalers in the 1970's and 1980's transformed grocery wholesaling from a local or regional enterprise into a near-national business, aimed largely at either foodsen/ice or supermarket customers. Although food wholesaling had typk^ally been local, a few companies had operated a number of units, generally within a few hundred miles of each other. Until the 1950's. general-line grocery wholesalers typfcally did not handle perishables. But, such firms began to expand into produce, frozen foods, and. to a lesser extent, meat during the 1950's and 1960's in order to offer a complete line to retail customers. Other wholesalers specialized in serving foodservk^e establishments.
Few wholesale companies, by the definition of this study, whk^h is based on natk>nal volumes, were large until recent years. Especially in the 1980's, numerous acquisitions were made by wholesalers, which put together near-national chains of wholesalers.
In 1954, only five general-line grocery wholesalers qualified as large. Those five companies made 9 percent of the sales of all general-line grocery establishments. The number and sales share of large companies have jumped since then. In 1987, 32 large companies made 65 percent of the sales of merchant wholesalers of general-line groceries.
Manufacturing
The economic landscape in food manufacturing has been drastically rearranged in the postwar perkxJ. Major changes include the following:
• Large companies are manufacturing a larger share of food.
• Large companies are more diversified in food products and nonfood products, although there has been some withdrawal from nonfoods in recent years. Such companies have expanded abroad.
• Large food companies are rTX>ving toward specialization in a single segment of the market, such as products for the grocery
136

Store trade, products for food service, or ingredients for other manufacturers.
• Much of the change has been through niergers, acquisitions, leveraged buyouts, and divestitures.
Food System Response
Food manufacturers have reshaped the composition of the food basket. Technological developments have created whole new industries and transformed all the old ones. New product lines and industries, some of which started before World War II but grew in later years, include:
Broilers.
Frozen fruits and vegetables.
Frozen concentrated fruit juices.
Fresh fruit juices.
Frozen prepared foods, including entrees and complete meals.
Frozen baked goods.
Dehydrated vegetables and soups.
Refrigerated doughs.
Com sweeteners.
Processed egg products.
Fresh, prepared foods.
Shelf-stable foods (vacuum-packed in plastk) containers).
In other industries, such as fluid milk, chicken, beef, and ingredients for processed foods, technological and other changes have drastically altered the mix of products.
Among the most important current health concerns of consumers are those regarding fat and cholesterol. Such concerns have generated changes at all levels of production and marketing for products
137

containing fats: for fats occurring naturally in the product, such as in beef and dairy products, and for fats used as ingredients.
Manufacturers' efforts to deal with these issues have created technologies to produce fat substitutes which, in turn, have generated a whole set of new product lines. Success of these new and, as yet, untested products could replace some of the demand for fats and oils with demand for substitute materials.
Concerns for food safety, especially over pesticide residues, have increased in recent years. Marketers have dealt with these concerns in several ways. For example, they have introduced pesticide-free products and organic produce. The use of pesticides is more closely monitored, with some withdrawn from use because of risks.
Effects of Government Policy
Changes in Government policy affect food marketing in different ways, depending on the type of program involved. Among such programs are those for food, basic comnfx>dities, and sugar; milk price supports; and milk marketing orders.
Food Programs
Domestic food programs have different effects on food markets, depending on the nature of the program. Food stamps rrxxJestly raise demand for food but do not influence food choices. But, products purchased by USDA for surplus removal or distribution bypass the wholesale and retail markets. Distributk>n to househokJs or to institutions tends to replace purchases that the recipients wouki have made in the commercial market. Products distributed to schools and institutk>ns probably tend to displace purchases on the commercial market nearly one-to-one, except when very large quantities of one product are distributed, and then some other product will be displaced.
Basic Commodities
Farm programs that support the income of producers of basfc comrTKxJities, such as grains and cotton, have also changed. Farmers, first handlers (country grain elevator operators, for instance), and users of these products have had to alter their marketing strategies. Since the 1960's, successive farm legislatbn has allowed markets to play a greater part in setting prices, while still altowing the Government to provide part of the income support through direct payments to producers. Chorces have also changed
138

for market participants, particularly farmers. Some programs that were formerly compulsory are now voluntary, so that farmers must decide whether or not to participate, and, if so, in what way.
Sugar Program
Under the high-price umbrella provided by the sugar program, the technology for alternative sweeteners has developed, and these new products have taken major shares of the sweetener market. High- fructose corn syrup has taken over alnrx)st the entire market for calork: sweeteners in soft drinks, and tow-catorie sweeteners have also captured a major market share.
Milk Price Supports
The prrce support program for milk effectively determines minimum prices for the major components of milk (butterfat and solids-not-fat) by setting prices at whfch USDA will buy butter and nonfat dry milk. Those purchase prices have been adjusted over the past 20 years so as to substantially alter the relative value of butterfat and nonfat solids. The price of a pound of butter was about four times the prfce of a pound of nonfat dry milk 20 years ago. In 1990 and 1991, the price of butter was the same as the price of nonfat dry milk. The support purchase prfce of nonfat dry milk exceeds the butter prfce in 1992.
Mille Marketing Orders
The productk)n and marketing of milk have changed in many ways since the Federal milk marketing order program began in the 1930's. Everything seems to have changed except the fundamentals, indicating that a classified pricing system, or something similar, is still required.
Implications for Pricing and Demand
Many of the changes described have significantly affected the ways in which market prfces are established through the multiple levels of the food system. The relationships between farm prices, manufacturers' prrces, wholesalers' prk:es, grocery store prrces, and restaurant prfces have been altered, and denr^nd relationships are also different.
139

Growth in Food Senfice
The foodservice share of food spending and consumption has dramatically risen since Worid War II. This rise has altered the relationships between farm prices and consumer prices in several ways. Foodservice margins (the charge for preparing and serving a meal) are much wider than those for food sold through stores, which involves less service. Restaurant prices tend to be much nrx)re insulated from farm price changes than are foodstore prices.
More Disassembly
Some agricultural products are disassembled into several components, each of which has significant value. Many products have nrx)ved toward rooxe disassembly in the postwar period, or the disassembly operation has moved to an eariier level in the mari<eting system. For example, the disassembly of beef carcasses into retail cuts has moved to eariier stages in the marketing channel during the past 25 years. Chickens and turkeys were sold as whole birds (not disassembled) for many years, but since the early 1960*s, nx)re and more birds have been cut up, and some are further processed by the manufacturer or distributor. More then half of all poultry is now cut up by the manufacturer.
The dramatk: change in the form in whk:h chkîken is sold during the past 30 years has created substantial differences in price nrK)vements between individual products, such as whole chkîken, and measures of average prfces of all chicken, including parts.
Milk is now routinely disassembled into the butterfat and skim portions, and the latter is often further disassembled into a variety of products. The prevalence of disassembly in milk has changed price relationships, leading to difficulties in the measurement of prfces for use in deniand analyses as well as in other subjects. For flukJ milk, changes in product mix, containers, and servies (such as milk delivery versus store purchase) have caused prrce movements to differ from the movements in measures of pure prrce change, such as those shown by Bureau of Labor Statistics prrce indexes.
In addition to eating out more often, especially at fast-food places that feature hamburgers and fries, consumers have changed the types of beef they buy for home use. Consumers are buying more beef cuts that are quickly and easily prepared and fewer cuts that need more time and effort. Hamburger purchases have significantly increased since the early 1970's, and purchases of steaks have fallen only modestly; both of these are easy to prepare. Purchases of roasts,
140

which take longer to cook, have dropped sharply. The changing demand both for home use and foodsen/ice means that much beef that coufcl have been cut into roasts ends up as hamburger. The shift to boxed beef has facilitated this change.
Continuing Change
The only certainty in the food market is that change will continue. But, some changes are much nrx)re likely than others. For example, bamng major disaster, the U.S. populatton will continue to grow oWer. It is also highly probable that incomes will continue to rise, as they have in most years since the Depressk>n. Changes in the populatk>n nr^keup, populatton growth, and rising incomes are likely to mean that away-from-home eating will further outpace at-home eating. If Amerfcans continue to choose foods that they favor now, at-home consumptk)n of fish, cheese, fresh fruit, and vegetables will rise faster than the consumptton of eggs and milk.
Marketing firms, from first handlers through manufacturers, wholesalers, retailers, and foodservrce firms, will continually need to adjust. All segments of the food industry will continue to operate under conditk)ns of tow net margins per unit and rising unit costs when operating betow capacity, and the pressures to maintain volume will continue, while the pressures for change mount Buffeted by changing consumer demands on the one hand and the pressures of their suppliers on the other, marketing firms will continue to contend vigorously with their competitors for market share and profits.
141

References
Adelman. M. A. (1959). A & P: A Study in Price-Cost Behavior and Public Policy. Cambridge: Harvard Univ. Press.
Alsop. Ronald (1988). "Consumer-Product Giants Relying on Intrapreneurs in New Ventures," The Wall Street Journal, Apr. 22, p. 35.
Barry, Robert D., Luigi Angelo, Peter J. Buzzanell, and Fred Gray (1990). Sugar Background for 1990 Farm Legislation. Staff Report No. AGES-9006. U.S. Dept. Agr, Econ. Res. Serv. Feb.
Bhagat, Sanjai, Andrei Shieifer, and Robert W. Vishny (1990). "Hostile Takeovers in the 1980's: The Return to Corporate Specialization," Brookings Papers on Economh Activity: Mhroeconomics. Washington, DC: The Brookings Institutton.
Bishop, Robert V., and Lee A. Christensen (1989). "America's Poultry Industry," National Food Review 12(1): 9-12. U.S. Dept. Agr.. Econ. Res. Serv.
Black, John D. (1935). The Dairy Industry and the AAA. Washington, DC: The Brookings Institution.
Bkx)m, Paul N., and Philip Kotier (1975). "Strategies for High Market-Share Companies," Harvard Business Review, Nov.-Dec., pp. 63-72.
Bonnen, James T. (1983). "Historkîal Sources of U.S. Agrrcultural Productivity: lmplfcatk)ns for R&D Polrcy and Social Science Research," American Journal of Agrhultural Economics, 65: 964.
Chandler. Alfred D.. Jr. (1977). The Visible Hand: The Managerial Revolution in American Business. Cambrklge: Han/ard Univ. Press.
(1990). Scale and Scope. The Dynamics of Industrial Capitalism. Cambridge: Han/ard Univ. Press.
Christensen, Rondo A., Douglas E. Petterson, and A. H. Swainston (1979). The Function and Cost of Market Milk Resen/es and Balancing Supply with Demand. Study Paper 79-8. Utah State Univ., Econ. Res. Institute.
142

Clarke, George, and Jim W. Wise (1988). "USDA Adopts Select Beef Grade Name." National Food Review 11(1): 26-7. U.S. Dept. Agr., Econ. Res. Serv.
Connor, John M., and Loys L. Mather (1978). Directory of the 200 Largest U.S. Food and Tobacco Processing Firms, 1975. NC-117 Spec. Rpt. No. 2. July.
Cooney, Catherine (1991). "Analyzing a Product's Environmental Impact from Cradle to Grave," Food and Drink Daily 1 (21 ): 1, 4, Apr. 8.
Crawford, Terry L., and others (1988). Issues and Options Related to the Reporting and Analysis of Retail Prices and Price Spreads for Beef. Staff Report No. AGES-871102. U.S. Dept. Agr., Econ. Res. Serv. Jan.
Drucker, Peter F. (1976). "Pensbn Fund Socialism," The Public Interest, Winter, 42: 3-46.
(1988). "Management and the WorW's Work," Harvard Business Review, Sept.-Oct., pp. 65-76.
Duewer, Lawrence A. (1984). Changing Trends in the Red Meat Distribution System. AER-509. U.S. Dept. Agr., Econ. Res. Serv. Feb.
(1989). "Changes in the Beef and Pork Industries," National Food Review 12(1): 5-8. U.S. Dept. Agr., Econ. Res. Serv.
, and Kenneth E. Nelson (1991). Beefpacking and Processing Plants: Computer-Assisted Cost Analysis. Staff Report No. AGES-9115. U.S. Dept. Agr, Econ. Res. Sen/. Apr.
Dunham, Denis (1991). Food Costs...From Farm to Retail in 1990. AIB-619. U.S. Dept. Agr., Econ. Res. Sen/. Mar.
Farris, Paul L.. and DonaW E. Farris (1966). Organization and Competithn in the Livestock and Meat Industry. Tech. Study No. 1, National Commissk)n on Food Marketing. June.
Food Institute (1991). Food Institute Report, Feb. 16.
Gallo, Anthony, ed. (1990). Food Marketing Review, 1989-90. AER- 639. U.S. Dept. Agr., Econ. Res. Sen/. Nov.
143

(1992). Food Marketing Review, 1991, AER-657. U.S. Dept. Agr., Econ. Res. Serv. Jan.
Gasparello. Linda (1991). "New Survey Shows Public Confidence Restored After Alar Debacle," Food and Drink Daily 1 (15). Mar. 28: 1, 4.
Godwin, Marshall R., Allan S. Johnson, Jerome M. Stein, Joseph N. Uhl, and Kenneth R. Fan-ell (1966). Organization and Competithn in the Fruit and Vegetable Industry. Tech. Study No. 4, National Commissbn on Food Marketing. June.
Goldberg, Ray A. (1968). Agribusiness Coordination: A Systems Approach to the Wheat, Soybean, and Florida Citrus Economies. Han/ard Univ., Grad. Sch. of Bus. Admin.
Greene, Catherine, and Glenn Zepp (1989). "Changing Pesticide Regulations: A Promise for Safer Produce," National Food Review 12(3): 12-6. U.S. Dept. Agr., Boon. Res. Serv.
Hahn, William, and Ken Nelson (1990). "Demand for Beef: Has It Changed?" Agricultural Outkx)k, June. U.S. Dept. Agr., Econ. Res. Serv.
Hamm, Larry G. (1981). Food Distribution Procurement Practices: Their Implications for Food System Structure and Performance. Ph.D. thesis, Michigan State Univ.
» and Charles R. Handy (1984). Merchandising: Its Role in Food System Coordination and Performance. FS-31. Michigan State Univ.
Handy, Charles R., and Alden C. Manchester (1990). Structure and Performance of the Food Marketing System Beyond the Farm Gate. NC-194 Occasional Paper 12, North Central Regional Research Project. June.
Han-is, Edmond S. (1966). Price Wars in City Milk Markets. AER- 100. U.S. Dept. Agr., Agr. Mktg. Sen/. Oct.
(1967). "Impact of Transportation Changes on Price Structures in City Milk Markets," Journal of Farm Economics 49(4): 844-51.
144

Harwood, Joy (1991). "U.S. Baking Industry Responds to Consumers' Demand," The Food Review, 14(2); U.S. Dept. Agr., Econ. Res. Serv.
Hayes, Denis (1990-91). "Hamessing Market Forces to Protect the Earth," Issues in Science and Technology, Winter. Washington, DC: Natk)nal Academy of Sciences.
Henson, Mary F. (1990). Trends in Income, by Selected Characteristics: 1947 to 1986. Series P-60, No. 167. U.S. Dept. of Commerce, Bur. of the Census. Apr.
Hoffman, A. C. (1969). "The Economy Ratbnale for Congtomerate Growth from a Management Perspective," Economics of Conglomerate Growth. Ed. L. Garoian. Oregon State Univ.. pp. 57-62.
HoWren. Bob R. (1960). 777e Structure of a Retail Market and the Market Behavhr of Retail Units. Englewood Cliffs. NJ: Prentice-Hall, Inc.
Ippolito, Pauline M., and Alan D. Mathios (1989). Health Claims in Advertising and Labeling: A Study of the Cereal Market. Staff Report, U.S. Fed. Trade Comm.
Jacobs, Eva, and Stephanie Shipp (1990). "How Family Spending Has Changed in the U.S.," Monthly Labor Review. U.S. Dept. of Labor, Bur. of Labor Statistrcs. Mar., p. 21.
Kaufman, Phillip R., and Charles R. Handy (1989). Supermarket Prices and Prhe Differences. City, Firm, and Store-Level Determinants. TB-1776. U.S. Dept. Agr, Econ. Res. Serv. Dec.
, and Doris Newton (1990). "Retailers Exptore Food Safety and Quality Assurance Optbns," National Food Review 13(4): 11-3. U.S. Dept. Agr., Econ. Res. Serv.
Kostecka, Andrew (1981). Franchising in the Economy, 1979-1981. U.S. Dept. of Comm., Bur. of Industrial Economes. Also other years.
(1989). Franchising in the Economy, 1988-1990. International Franchise Associatk>n.
145

Lasley, Floyd A.. Harold B. Jones, Jr., Edward H. Easterling, and Lee A. Christensen (1988). The U.S. Broiler Industry. AER-591. U.S. Dept. Agr., Econ. Res. Sen/. Nov.
Lassiter, Roy L., Jr., and George L. Capel (1959). Economic Characteristics of the Florida Chilled Citrus Juice Industry. MRR-305. U.S. Dept. Agr., Agr. Mklg. Sen/., in cooperation with Univ. of Florida.
Levedahl, J. William (1991 ). The Effect of Food Stanips and Income on Household Food Expenditures. TB-794. U.S. Dept. Agr., Econ. Res. Sen/. July.
_, and Masao Matsumoto (1990). U.S. Domestic Food Assistance Programs. Lessons from the Past. AIB-570. U.S. Dept. Agr., Econ. Res. Sen/. Jan.
MacDonald, James M. (1985). Product Diversificatbn Trends in U.S. Food Manufacturing. AER-521. U.S. Dept. Agr., Econ. Res. Serv. Mar.
(1987). "Economies of Scope, Contestability Theory, and Economic Efficiency," Economic Efficiency in Agricultural and Food Marketing. Eds. Richard L. Kilmer and Walter J. Armbruster. Ames: Iowa State Univ. Press.
Manchester, Alden C. (1964). The Structure of Wholesale Produce Markets. AER-45. U.S. Dept. Agr., Econ. Res. Sen/. Apr.
(1983). The Public Role in the Dairy Economy. Boulder, CO: Westview Press.
(1990). Data for Food Demand Analysis. AER-613. U.S. Dept. Agr., Econ. Res. Sen/. Apr.
(1991). Food Spending and Income. AIB-618. U.S. Dept. Agr., Econ. Res. Serv. Jan.
Marion, Bruce W., and others (1986). The Organization and Performance of the U.S. Food System. Lexington, MA: Lexington Books.
Massen, Robert, Roger Fones, and Janet C. Hall (1978). Response to the USDA Comments on the Department of Justice Report on Milk Marketing. U.S. Dept. Justice, Antitrust Div. Oct.
146

Morgan, Jennifer, Bruce Bartx>ur, and Catherine Greene (1990). "Expanding the Organic Produce Niche: Issues and Obstacles," Vegetables and Specialties: Situation and Outlook Yearbook, Nov., pp. 55-60. U.S. Dept. Agr., Econ. Res. Serv.
Morrison. Rosanna M. (1990). "The Market for Fat Substitutes," Nathnal Food Review 12(2): 24-30. U.S. Dept. Agr.. Econ. Res. Sen/.
Mueller, Willard F. (1983). "Market Power and Its Control in the Food System," American Journal of Agricultural Economics 65: 855-63, Dec.
Myers. Henry F. (1988). "Will Mergers Help or Hurt in the Long Run?" The Wall Street Journal, May 2. p. 1.
Myers, Lester H. (1991). "Economic Incentives for Food Industry Concentratbn and Integration: Economic Implicatbns." Paper for Institute for Alternative Agrfculture Symposium, Mar. 5. U.S. Dept. Agr., Econ. Res. Serv.
Natk>nal Association of Convenience Stores. Data on distribution of sales by type of product.
Nelson, Kenneth E. (1985). Issues and Developments in the U.S. Meatpacking Industry. Staff Report No. AGES-850502. U.S. Dept. Agr., Econ. Res. Sen/. Aug.
, Lawrence A. Duewer, and Terry L. Crawford (1989). Réévaluation of the Beef Carcass-to-Retail Weight Conversbn Factor. AER-623. U.S. Dept. Agr, Econ. Res. Sen/.
Nutter, G. Warren, and Henry Adler Einhorn (1969). Enterprise Monopoly in the United States: 1899-1958. New York: Columbia Univ. Press.
Often, Alan L. (1991). "More Time for Parenting Means Stress Over Work," Wall Street Journal, Mar. 13, p. 81.
The Packer {^99^). Nov. 23. The Packer Publishing Company.
Parker, Russell C. (1964) The Frozen Concentrated Orange Juice Industry. An Economic Analysis of the Price Increases Following the Major Freeze of December 1962. U.S. Fed. Trade Comm., Bur. of Econ. Aug.
147

Penrose, Edith Tilton (1959). The Theory of the Growth of the Firm. New York: John Wiley and Sons.
Perez, Agnes M., Mark R. Weimar, and Shauna Cromer (1991). U.S. Egg and Poultry Statistical Series, 1960-90. SB-833. U.S. Dept. Agr., Econ. Res. Serv. Dec.
Phlips, Louis (1987). "Price Discrimination," The New Palgrave: A Dictionary of Economics. Ed. John Eatwell and others. London: The MacMillan Press Ltd., Ill: 952-4.
Porter, Michael E. (1987). "From Competitive Advantage to Corporate Strategy," Hansard Business Review, May-June, pp. 43-59.
Price, Charlene (1985). "Eating Natural Gains Popularity," National Food Review, NFR-28. pp. 14-8. U.S. Dept. Agr., Econ. Res. Serv.
(1990). "Supermarkets Seek Growth in Foodservice," National Food Review, 13(4): 6-9, Oct.-Dec. U.S. Dept. Agr, Econ. Res. Serv.
Purcell, Margaret R. (1955). Transportation of Florida Orange Juice Concentrate. AMS-50. U.S. Dept. Agr, Agr. Mktg. Sen/. May.
Ravenscraft, DavkJ J., and F. M. Scherer (1987). Mergers, Sell-Offs, and Economic Efficiency. Washington, DC: The Brookings Institution.
Roberts, Tanya, and Eileen Van Ravenswaay (1989). "The Economics of Food Safety," National Food Review, 12(3): 1-8. U.S. Dept. Agr., Econ. Res. Sen/.
Scherer, F. M. (1988). "Corporate Takeovers: The Efficiency Arguments," Journal of Economic Perspectives, 2: 69-82.
Shellenbarger, Sue (1991). "McDonald's Low-fat Burger To Go National," Wall Street Journal, Mar. 13. p. B1.
Siconolfi, Michael, and Georgette Jasen (1988). "Takeovers Speed Exit from Corporates." 77îe Wall Street Journal, Oct. 28, p. C21.
SmithfiekJ Foods, Inc. (1991). Annual Report.
Sokolov, Raymond (1991). "Brave New World of Zapping," Natural History. Mar., pp. 92-6.
148

Supermarket Institute (1954). Survey of supermarket characteristics. Also 1958.
U.S. Department of Commerce, Bureau of Economy Analysis (1991a). Survey of Current Business, July. Also other years.
Bureau of Economic Analysis (1991b). U.S. Direct Investment Abroad: 1989 Benchniark Survey, Preliminary Results, Oct.
, Bureau of the Census (1989). 1987 Census of Wholesale Trade. WC87-A-52. Also other years.
Bureau of the Census (1990a). 1987 Census of Wholesale Trade: Commodity Line Sales, WC87-S-3. Also other years.
Bureau of the Census (1990b). 1987 Census of Retail Trade: Miscellaneous Subjects, RC87-S-4. Also other years.
Bureau of the Census (1991a). 1987 Census of Wholesale Trade: Miscellaneous Subjects, WC87-S-4. Also other years.
Bureau of the Census (1991 b). Money Income of Households, Families, and Persons in the United States: 1990. Series P-60, No. 174. Also prevk)us reports.
U.S. Department of Labor, Bureau of Labor Statistics (1977). Consumer Expenditure Survey: Diary Survey, July 1972-June 1974. Bull. 1959.
_, Bureau of Labor Statistics (1989). Consumer Expenditure Sun/ey: Integrated Survey Data, 1984-86. Bull. 2333.
, Bureau of Labor Statistics (1990a). Consumer Expenditure Sun/ey data tape.
_, Bureau of Labor Statistics (1990b). Consumer Expenditures in 1989. Press Release 90-616. Nov. 30.
U.S. Federal Trade Commission (1962). Economic Inquiry Into Food Marketing, Part II: The Frozen Fruit, Juice, and Vegetable Industry. Staff Report, Dec.
149

(1972). Statistical Report: Value of Shipments Data by Product Class for the 1,000 Largest Manufacturing Companies of 1950. Jan.
U.S. Internal Revenue Service (1991). Corporation Source Book of Statistics of Income, 1987.
Van Dress, Michael G. (1982). The Food Sen/ice Industry: Structure, Organization, and Use of Food, Equipment, and Supplies. SB-690. U.S. Dept. Agr.. Econ. Res. Sen/. Sept.
^ and William H. Freund (1968). The Food Sen/ice Industry: Its Structure and Characteristics, 1966. SB-416. U.S. Dept. Agr., Econ. Res. Serv. Feb.
Van Ravenswaay, Eileen (1989). "The Food Industry Responds to Consumers' Pesticide Fears," National Food Review, 12(3): 17-20. U.S. Dept. Agr.. Econ. Res. Serv.
Ward, Clement E. (1979). Slaughter-Cattle Pricing and Procurement Practices of Meatpackers. AIB-432. U.S. Dept. Agr., Econ., Stat., and Coop. Serv. Dec.
(1988). Meatpacking Competition and Pricing. Blacksburg, VA: Research Inst, on Livestock Prkîing. July.
Ward, RonakJ W., and Richard L. Kilmer (1989). The Citms Industry: A Domestic and Internatk^nal Perspective. Ames: Iowa State Univ. Press.
Waugh, Frederic V. (1964). Demand and Price Analysis: Some Examples From Agriculture. TB-1316. U.S. Dept. Agr., Econ. Res. Sen/. Nov. Reprinted 1990 by ERS.
Weimar, Mark R., and Richard P. Stillman (1990). "Market Trends Driving Broiler Consumption," Livestock and Poultry: Situation and Outlook Report, Nov., pp. 44-7. U.S. Dept. Agr., Econ. Res. Sen/.
Weiss, Leonard W. (1983). "The Extent and Effects of Aggregate Concentratk>n," Journal of Law and Economics, XXXI: 429-55, June.
Wellman, Nancy (1990). Quoted in Priscilla Smith, "Consumers Search for a Food Fix," World Food and Drink Report, May 17, pp. 1, 7.
150

Williams, Willard F. (1958). "Structural Changes in the Meat Wholesaling Industry." Journal of Farm Economics, 40: 315-29, May.
Earl K. Brown, and Frank C. Genovese (1959). Economic Effects of U.S. Grades for Beef MRR-298. U.S. Dept. Agr., Agr. Mktg. Serv. Jan.
151

Appendix A: Measurement and Classification of Large Companies
The problem of definition is one of drawing lines that nature has omitted: "nature makes no leap." Hence some arbitrariness is involved in all definition. The primary objectives of a particular enquiry will dictate the way in which lines should be drawn.
-Nutter and Einhorn, 1969, pp. 2-3.
Type of Firms
The classification of manufacturers used in this study is as follows:
Diversified food firm-Those engaged in three or more minor industries which do not have common production practices (for example, a milk packaging company that also packages fruit drinks uses common production practices). Most sales are of food and kindred products.
Diversified consumer-product tirm-Those engaged in two or rDore major industries whfch do not have comnfx>n productk)n practrces (for example, a liquor company that also produces industrial ak^ohol has common productton practices). A distinguishing characteristic is distribution through supermarkets and drug stores. "Tobacco-and-other" companies and "Others" are distinguished.
Congiomerate-Companies operating in two or more major industries which are unrelated (that is, not a diversified consumer product firm). Congtomerates are divided into those with more than half of their sales in food and kindred products and those with less.
Speciaiized food firm-All other firms, most of whose sales are of food products.
The following are not considered diversificatk>n for this analysis:
• A combinatk)n of grain and oilseeds (two different three-digit industries), including manufacturers and merchants.
• A combinatbn of farm supplies and farm products.
• Byproducts.
• Food service.
152

• Convenience stores.
• Supermarkets.
• Manufacturers of inputs, such as cans.
Major industries include:
• Food and kindred products (kindred products are feed, pet food, alcoholic beverages, and k^e).
• Tobacco products.
Minor industries in food and kindred products which are four-digit industries in the SIC include:
• Meatpacking and processing.
• Poultry and egg products.
• Sugar.
• Confectk>nery products.
• Soft drinks.
• Flavorings and extracts.
• Malt.
• Beer.
• Wine.
• Distilled spirits.
Minor industries whk^h are three-digit industries in the SIC include:
• Dairy products.
• Processed fruits, vegetables, and specialties.
• Grain mill products.
• Bakery products.
153

• Fats and oils.
• Other food and kindred products.
Defining Large Companies
The extensive conipiiation of data on individual food manufacturing companies for 1975 (Connor and Mather, 1978) were the beginning of the database for this study. So, 1975 became the base year for the definition of "large." Sales of $250 million in 1975 were defined as the minimum for a firm to be considered a large manufacturer. This definition included nearly all diversified food, diversified consumer product, and conglomerate food manufacturers in 1975. Firms with somewhat lesser sales were checked to see if some might have assets or value added as large as did the smallest firms whk)h qualified on sales, but none did.
For earlier years, minimum sales to qualify as a large company were considered to be the same proportbn of total food expenditures as $250 million was in 1975 (app. table 1). This standard takes into account changes in both prices arxi quantities. For the years after 1975, the "mover" is manufacturers' shipments of food and kindred products. The change in movers was made because the rapkJ rise in spending for food away from home raised total food expenditures more rapidly than manufacturers' shipments.
By this reckoning, a large company would have had sales of at least $68.1 millk>n in 1950. For the smallest firm that qualified as large on
Appendix table 1-Minimums to qualify as a large company
Grocery Manufacturers store
sales Restaurant
sales Wholesaler
Year Sales Value added Assets sales
Million dollars
1950 68.1 18.0 44.2 87.3 111.7 77.8 1960 97.6 25.8 63.3 137.7 198.6 111.5 1966 132.4 35.0 85.9 191.3 309.5 151.2 1975 250.0 66.1 162.3 352.1 553.9 285.5 1985 433.1 114.5 281.2 687.5 1.052.8 494.6 1989 524.1 142.4 349.8 873.1 1.597.0 598.5
154

the basis of sales, the value added by manufacture was calculated using the shipments data for each company and industry-average ratios. Thirteen firms with sales less than $68.1 million but value added greater than $18 million qualified as large. There was one such firm in 1960 and 1968 and none in 1975.
For companies operating stores and restaurants and for food wholesalers, the minimum sales were calculated that would equal the sales of manufacturers at manufacturers' prices.
Methods and Data
The data on large manufacturers are built up from data on each company for each of the years 1950, 1960, 1968, 1975, 1985, and 1989. For each year, each company's sales were broken down into the folbwing categories:
Sales from domestic operations: Manufactured products-
Food Alcoholic beverages Feed and pet food Tobacco Nonfood
Wholesaling food Retailing food Food service Other
Sales from foreign operations- Manufactured products:
Food Alcoholic beverages Feed and pet food Tobacco Other
All other sales
For each company in each year, a listing of the company's manufacturing activities in terms of four-digit product classes in food and kindred products was compiled.
155

The data regarding each company was obtained from a wide variety of sources, including, but not limited to, the following:
Moody's Industrial Manual. Moody's OTC Industrial Manual. Moody's International Manual. Company annual reports and Form 10-K's. Fortune magazine listings. Forbes magazine listings. Meat Industry magazine listings. Meat and Poultry magazine listings. Company histories. Trade magazines. Food Institute Reports. Connor and Mather, 1978. Federal Trade Commission, 1972 (for 1950 data).
For food wholesalers and retailers, additional sources included:
Progressive Grocer Marketscope. Chain Store Guide Directory.
Sales data and the listing of four-digit product classes provided the basis for classifying each firm in terms of the definitions laid out previously. For each company, a history was constructed which included its sales breakdown in each of the indicated years, the classes of products manufactured, acquisitions of other companies, divestitures, and, on occasion, its own fate: sale to another company, bankruptcy, or ctosing down.
The data for the individual companies were summarized by type of firm for each year, providing the data for tables 11-17 and 20-22.
156

Appendix B: Tables
Appendix tabi« 2--Mlnlmum sales for each size group of large manufacturers
Group 1950 1960 1968 1975 1985 1989
Million dollars
Largest 2.724 3.904 5,296 10.000 17.324 20,964 2 1.362 1,952 2,648 5.000 8.662 10.482 3 817 1.172 1,589 3.000 5,197 6.289 4 545 782 1,059 2,000 3,465 4.193 5 272 391 530 1,000 1,732 2.096 6 136 196 265 500 866 1.480 Minimally large 68 98 132 250 433 524
157

Appendix table 3-Average incomes in 1988 dollars
Mean income of- Consumer CPI-U
price index Year Households Families Per capita CPI-U-XI
. . IQRfí HnlLtr^^ ... laao-Oji^inn
1947 18.029
• - I900 iA/ffard - - -
17,274 5,100 22.3 1948 17,096 16,593 4,933 24.1 ~ 1949 16,534 16,290 4,868 23.8 ~ 1950 17,385 17,244 5,194 24.1 ~ 1951 17,756 17.568 5,353 26.0 ~ 1952 18,058 18.271 5,477 26.5 — 1953 18,503 19.147 5,681 26.7 -. 1954 18.321 18,963 5,524 26.9 ~
1955 19,637 20,163 5,938 26.8 .. 1956 20,562 21,383 6,236 27.2 — 1957 20,249 21.042 6,123 28.1 ~ 1958 20.162 20.942 6,079 28.9 ~ 1959 21,371 22,309 6.443 28.1 ~ 1960 21,764 22.879 6.581 29.6 ~ 1961 22,746 23,536 6.858 29.9 ~ 1962 22,724 23,993 6.913 30.2 ~ 1963 23.427 24,870 7,230 30.6 ~ 1964 24.250 25.735 7,333 31.0 ~
1965 24,959 26.568 7,639 31.5 .. 1966 25,767 28.147 7.935 32.4 — 1967 26.036 28.682 8,030 33.4 36.3 1968 27,488 30.344 8.570 34.8 37.7 1969 29.656 31,758 9,029 36.7 39.4 1970 28.647 31,812 9,100 38.8 41.3 1971 28,499 31,793 9,379 405 43.1 1972 30,071 33,638 10,042 41.8 44.4 1973 30,470 34,142 10,379 44.4 47.2 1974 29.846 33,532 10.132 49.3 51.9
1975 29,005 32,724 10,142 53.8 56.2 1976 29,718 33,598 10,498 56.9 59.4 1977 30,137 34,187 10,829 60.6 63.2 1978 31,073 35,211 11,313 65.2 67.5 1979 31.260 35,675 11,459 72.6 74.0 1980 30.276 34,461 11,193 82.4 82.3 1981 29.919 33,925 11,129 90.9 90.1 1982 30,081 33,895 11.112 96.5 95.6 1983 30,417 34,231 11,341 99.6 99.6 1984 31,270 35,356 11,759 103.9 103.9
1985 31,956 36,220 12,108 107.6 107.6 1986 33,201 37,696 12.596 109.6 109.6 1987 33,751 38,410 12.904 113.6 113.6 1988 34,017 38.608 13.123 118.3 118.3 1989 34,841 39.598 13,410 124.0 124.0 1990 33,854 38.605 12,872 130.7 130.7
~ * Not available. 'Deflated by CPI-U-XI. 1967-90, and by CPI-U (linked with CPI-U-XI at 1967),
1947-66. CPI-U - Consumer price index for urban areas. CPI-U-XI « A specially constructed consumer price index which uses, as far as possible, the techniques which have been used since 1983 in handling housing.
Source: Henson. 1990.
158

Appendix table 4-Relative prices of food at three stages of the system
Restaurant Retail store Manufacturers' and Year prices prices shippers' prices
Percent of retail store prices
1954 129.6 100.0 71.3
70.6 70.5 70.6 71.6 70.0
70.9 70.3 70.1 68.3 67.6 68.9 70.8 69.0 69.2 70.1
68.9 68.3 69.0 71.4 70.9 71.0 69.3 68.8 68.0 67.0
65.7 64.8 64.0 64.0 64.4 63.0 62.8 61.5 60.7 60.0 59.1
159
1955 133.6 100.0 1956 135.7 100.0 1957 136.3 100.0 1958 134.6 100.0 1959 141.7 100.0
1960 144.2 100.0 1961 146.0 100.0 1962 148.9 100.0 1963 150.2 100.0 1964 151.4 100.0 1965 151.0 100.0 1966 150.5 100.0 1967 158.7 100.0 1968 161.8 100.0 1969 163.7 100.0
1970 167.3 100.0 1971 171.9 100.0 1972 171.1 100.0 1973 158.7 100.0 1974 155.8 100.0 1975 157.3 100.0 1976 162.8 100.0 1977 167.1 100.0 1978 164.9 100.0 1979 165.5 100.0
1980 168.5 100.0 1981 171.1 100.0 1982 174.2 100.0 1983 179.9 100.0 1984 180.8 100.0 1985 185.3 100.0 1986 187.2 100.0 1987 186.5 100.0 1988 186.3 100.0 1989 182.9 100.0 1990 179.8 100.0

Appendix table 5-Share of food sales for home use by type of outlet
Farmers, Conven- Other Specialty Home- processors,
Super- ience grocery food Other delivered. wholesalers, Year markets stores stores stores stores mailorder other
Percent
1929 0 0 48.0 17.0 13.3 13.8 7.9 1939 5.8 0 52.4 14.1 7.7 14.9 5.1 1948 14.9 0 51.1 14.6 5.1 112 3.1 1954 28.1 0 42.9 11.8 4.5 8.9 3.8 1958 36.5 .1 37.0 11.2 4.7 7.3 3.2
1963 45.4 .7 31.1 8.4 5.9 5.3 3.2 1967 522 1.2 25.8 8.3 5.6 4.2 2.7 1972 56.0 2.3 22.9 8.6 5.1 2.9 2.2 1977 61.6 3.2 18.2 7.7 5.4 1.7 2.2 1982 62.1 3.9 17.9 7.2 5.5 1.3 2.1
1983 64.3 3.8 15.3 6.9 6.3 1.3 2.1 1984 63.2 3.8 16.2 6.5 6.9 1.3 2.1 1985 63.7 3.6 15.7 6.2 7.6 1.2 2.0 1986 63.9 3.7 14.3 6.3 8.6 1.2 2.0 1987 63.1 3.6 14.0 6.9 8.9 1.4 2.1 1988 61.3 3.7 15.8 6.9 8.8 1.4 2.1 1989 60.6 3.9 16.0 7.0 8.9 1.5 2.1 1990 602 4.1 16.0 7.4 8.8 1.5 2.0
160

Appendix table 6-Share of sales of food away-from4K>me by type of outlet
Restaurants, Stores, Others lunchrooms, Fast- All Hotels Schools bars, and Recrea- including cafeterias, food eating and and vending tional mihtary
Year caterers* places' places motels colleges^ machines places outlets
Percent
1929 51.1 9.0 60.1 10.4 5.0 18.8 1.0 4.7 1939 46.6 7.1 53.7 10.8 6.8 21.1 1.9 5.7 1948 48.3 8.4 56.7 8.4 9.8 17.7 1.4 6.0 1954 54.9 4.3 59.2 6.0 10.4 16.1 2.2 6.1 1958 53.5 5.4 58.9 6.1 12.0 14.7 2.4 5.9
1963 50.1 9.7 59.8 6.2 13.5 12.4 2.5 5.6 1967 46.3 14.3 60.6 6.1 13.7 11.4 2.1 6.1 1972 41.3 212 62.5 5.8 13.0 11.4 2.0 5.3 1977 39.1 27.8 66.9 5.4 11.0 8.8 3.4 4.5 1982 40.3 29.6 69.9 5.4 9.8 8.2 2.2 4.5
1990 37.0 34.3 71.3 6.0 9.1 7.1 2.7 3.8
^Excludes contract feeding and concessions. ^Includes child nutrition subsidies.
161

Appendix table 7-Number and sales of supermarkets
Annual sales to be classed Share of all
asa grocerv Stores Year supermarket^ Supermarkets Sales' Number Sales
7,000 dollars Number Million dollars - - Percent - -
1935 302.9 386 202 0.1 3.2 1939 287.5 1.699 772 .4 10.0 1948 635.6 5.600 5,654 1.6 22.8 1954 703.4 10.506 14.214 3.8 41.3 1958 747.0 15.282 23.562 5.9 53.9
1963 762.9 21,167 31.484 8.6 59.9 1967 825.7 23.808 43.433 10.9 66.7 1972 1.000.0 27,231 64.960 14.0 69.6 1977 1,515.0 30,831 113,111 17.2 75.0
1982 2,265.6 26.640 175.655 14.4 74.5 1987 2.659.3 24.980 224.947 14.1 75.6 1988 2,786.1 24.614 230.640 14.1 75.1 1989 2.966.0 24,083 247.312 14.3 75.1 1990 3,109.9 23,813 260,127 14.2 76.8
M 972 - $1 million; other years calculated using an index of prices of all products sold in grocery stores. Sales exclude sales taxes.
'Includes foods and nonfoods.
162

Appendix table 8-Share of consumer expenditures for food at home by product group at constant prices
Food group 1972-74 1984-86 1987 1988
Percent
Meat, pouhry, fish, and eggs Beef and veal Pork Other meats Poultry Seafood Eggs
31.7 12.8
7.1 4.0 3.2 3.1 1.5
30.0 10.4 6.3 4.3 4.1 3.2 1.7
28.3 10.1 5.6 4.2 4.0 2.9 1.5
26.7 9.1 5.4 4.1 3.9 2.6 1.6
Dairy products Milk and cream Other dairy products
12.7 6.8 5.9
13.3 6.7 6.6
13.8 6.8 7.0
13.6 7.0 6.6
Fruits and vegetables Fresh fruit Fresh vegetables Processed fruit and juices Processed vegetables
15.0 4.1 4.1 3.3 3.5
15.7 4.6 4.6 3.7 2.8
16.9 5.0 5.3 3.8 2.8
16.2 4.7 4.7 4.0 2.8
Cereal and bakery products Cereal products Bakery products
13.1 3.3 9.8
13.6 4.4 9.2
14.0 4.9 9.1
14.1 4.9 9.2
Sugar and sweets 4.3 3.8 3.5 3.8
Fats and oils 2.7 2.7 2.5 3.1
Other prepared foods 8.8 11.5 11.8 10.1
Nonalcoholk: beverages 11.7 9.4 9.2 12.4
Total 100.0 100.0 100.0 100.0
^Consumer expenditures for food at home at 1982-84 prices.
Sources: U.S. Department of Labor, 1977. 1989. and 1990a.
163
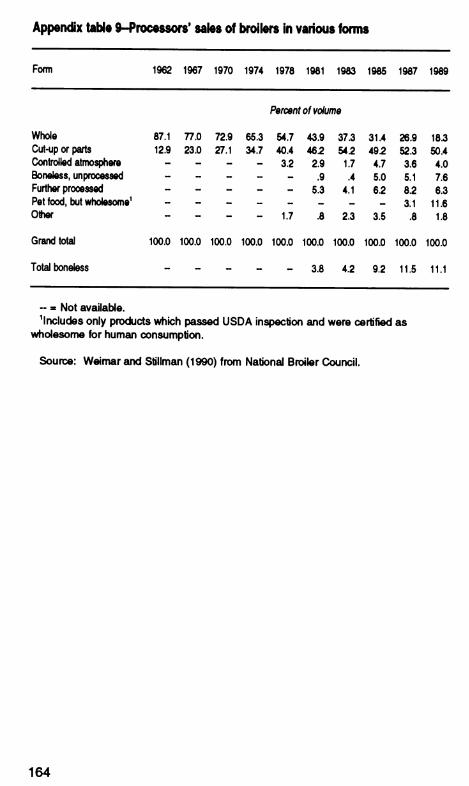
Appendix table 9-Processors' sales of broilers In various forms
Form 1962 1967 1970 1974 1978 1981 1983 1985 1987 1989
Percent of volume
Whole 87.1 77.0 72.9 65.3 54.7 43.9 37.3 31.4 26.9 18.3 Cut-up or parts 12.9 23.0 27.1 34.7 40.4 462 SA2 492 52.3 50.4 Controlled atmosphere - - - - 3.2 2.9 1.7 4.7 3.6 4.0 Boneless, unprocessed - - - - - .9 .4 5.0 5.1 7.6 Further processed - - - - - 5.3 4.1 6.2 8.2 6.3 Pet food, but wholesome' - - - - - - - - 3.1 11.6 Other - - - - 1.7 .8 2.3 3.5 .8 1.8
Grand total 100.0 100.0 100.0 100.0 100.0 100.0 100.0 100.0 100.0 100.0
Total boneless - ~ - - - 3.8 4.2 9.2 11.5 11.1
- » Not available.
^Includes only products which passed USDA inspection and were certified as wholesome for human consumption.
Source: Weimar and Stillman (1990) from National Broiler Council.
164

Appendix table 10-Final broiler market outlets
Outlet 1970 1974 1978 1981 1983 1985 1987 1989
Percenf
Domestic food markets: Retail grocery store 69.9 67.0 64.2 63.6 60.6 53.8 52.4 51.2 Food service 31.1 30.5 29.5 27.6 30.0 38.2 35.5 32.7 Restaurants 17.7 19.8 6.7 8.0 9.8 13.1 8.4 11.4 Fast food 9.2 8.2 17.5 15.5 16.1 17.9 22.1 18.2 Govemment and institutions 3.1 2.5 5.3 4.1 4.1 7.2 3.0 1.9 Brokers^ - - - -- -- -- 2.0 2.2
Exports 2.3 1.6 6.3 7.1 4.4 2.8 5.4 3.5 Renderers and pet food " ~ ~ 1.7 5.0 5.2 6.7 11.6
Total 100.0 100.0 100.0 100.0 100.0 100.0 100.0 100.0
- s Not available. ^Ready-to-cook (r.t.c.) weight basis (r.t.c. broiler weight is the entire dressed bird,
including bones, skin, fat, liver, heart, gizzard, and neck). Includes only products which passed USDA inspection and were certified as wholesome for human consumption.
^Brokers are not a final market; products shipped through brokers were assumed to be shipped to foodservice operators.
Source: National Broiler Council.
165


