Embed Size (px)
Citation preview
Reducing the risk for water biota by adsorption of pharmaceuticals and heavy metals
using a fixed-bed column with a novel biochar
Mehdi Heidari
A Thesis
In the
Department of
Building, Civil, and Environmental Engineering
Presented in Partial Fulfillment of the Requirements
for the Degree of Master of Applied Science (Civil Engineering) at
Concordia University,
Montreal, Quebec, Canada
June 2020
© Mehdi Heidari, 2020
CONCORDIA UNIVERSITY
School of Graduate Studies
This is to certify that the thesis prepared
By: Mehdi Heidari
Entitled: Reducing the risk for water biota by adsorption of pharmaceuticals and
heavy metals using a fixed-bed column with a novel biochar
and submitted in partial fulfillment of the requirements for the degree of
Master of Applied Science (Civil Engineering)
complies with the regulations of the University and meets the accepted standards with respect to
originality and quality.
Signed by the final Examining Committee:
___________________________________________Chair
Dr. F. Nasiri
___________________________________________External to program
Dr. K. Schmitt
___________________________________________Examiner
Dr. C. An
___________________________________________Examiner
Dr. F. Nasiri
___________________________________________Co-Supervisor
Dr. M. Elektorowicz
___________________________________________Co-Supervisor
Dr. J. Hadjinicolaou
Approved by ___________________________________________
Dr. Michelle Nokken, Graduate Program Director
July 07, 2020 ___________________________________________
Dr. Amir Asif, Dean
Gina Cody School of Engineering and Computer Science
iii
Abstract
Reducing the risk for water biota by adsorption of pharmaceuticals and heavy metals
using a fixed-bed column with a novel biochar
Mehdi Heidari, 2020
Pharmaceuticals and heavy metals derived from point sources and non-point sources find their
ways into water bodies. One of the important sources of such pollutants is wastewater or effluents
from wastewater treatment plants. The presence of pharmaceuticals and heavy metals in the water
bodies causes irreversible damages to flora, fauna and human health. Risk assessment plays a vital
role in identifying the pollution intensity. The adsorption process is one of the most appropriate
processes in eliminating such pollutants from wastewater. In this study, a fixed-bed column is used
to verify the feasibility of using a novel biochar material to remove organic (pharmaceuticals) and
inorganic (heavy metals) compounds. This study was conducted in 3 phases. In the first phase, the
pollution intensity of pollutants in wastewater effluent was evaluated by risk assessment formulas.
In the second phase, the impact of the initial concentration, flow rate and bed depth on the
laboratory-scale adsorption column performance were investigated. In the third phase, the Adam-
Bohart model was used to design the large-scale fixed-bed column. Moreover, the pollution
intensity of pollutants was determined. The results clearly indicated that the presence of
venlafaxine and heavy metals in wastewater effluent poses adverse effects on aquatic and marine
organisms. The adsorption of venlafaxine, Ni, Pb and Cu on biochar in a laboratory-scale column
was observed as well as in the larger-scale column. Increasing the initial concentration and bed
depth along with decreasing the flow rate caused the adsorption capacity to be on the rise. The
removal over 90% of venlafaxine, Ni, Pb and Cu was found at the breakthrough point where the
adsorption capacity was increased from 0.8 to 5.4 mg/g for venlafaxine, from 1.92 to 18.24 µg/g
for Ni, from 3.84 to 30.72 µg/g for Pb, and from 2.88 to 24 µg/g for Cu. The large-scale column,
tested on real effluent at wastewater treatment plant, confirmed the feasibility of using biochar to
eliminate 95% of venlafaxine and 90% of Ni, Pb and Cu at the breakthrough point. The adsorption
capacity at the breakthrough point was 3051.406 ng/g for venlafaxine, 24.364 µg/g for Ni, 0.1296
µg/g for Pb, and 7.115 µg/g for Cu. The pollution intensity of venlafaxine, Ni, Pb and Cu to aquatic
and marine organisms decreased from a high to low risk due to the utilization of novel biochar in
the fixed-bed column.
iv
Acknowledgment
Foremost, I am deeply grateful to my supervisor Professor Maria Elektorowicz for her attention,
time and support. Not only has Professor Maria Elektorowicz given aid to me as a mother in being
faced with abrupt and unexpected changes during such a project, more importantly but she also
has conveyed worthwhile knowledge, experience, guidance and proposals to me in conducting
such a project in an accurate manner.
I am deeply grateful to my co-supervisor Professor John Hajinicolaou for his time, attention and
support.
Also, I wish to acknowledge the financial support from Environment and Climate Change
Canada (ECCC) [grant number EDF-PQ-2017G005].

v
Dedication
To:
My beloved mother: Fatemeh
For nursing me with affection and love and her endless support in my life
vi
Table of contents
viii......................................................................................................................................List of Figures
xi..........................................................................................................................................List of Tables
xiv......................................................................................................List of abbreviations and symbols
Chapter 1: Introduction
1 ................................................................................................................ 1.1. Problem statement
2 .............................................................................................................. 1.2. Research objectives
2 ........................................................................................................... 1.3. Organization of thesis
Chapter 2: Literature review
4 .................................................................................................................... 2.1. Pharmaceuticals
8 ........................................................................................................................ 2.2. Heavy metals
20 ............................................................................................................. 2.3. Adsorption process
23 ............................................................................................................ 2.4. Breakthrough curve
Chapter 3: Methods and materials
30 ........................................................................................................................... 3.1. Sampling
30 .............................................................................................3.2. Production of a novel biochar
30 .............................................................................................................. 3.2.1. Laboratory-scale
30 ...................................................................................................................... 3.2.2. Large-scale
32 ........................................................................................................................... 3.3. Analyzing
32 .................................................................................................................... 3.4. Column study
32 ....................................................................................... 3.4.1. Laboratory-scale column study
34 ....................................................................... 3.4.2. MultiVariate Statistical Package (MVSP)
34 ................................................................................................ 3.4.3. Large-scale column study
35 .................................................................................................................. 3.5. Risk assessment
35 ............................................................................................................... 3.5.1. Pharmaceuticals
37 ................................................................................................................... 3.5.2. Heavy metals
Chapter 4: Results and discussions
39 .................................................................................................................. 4.1. Risk assessment
vii
39 ............................................................................................................... 4.1.1. Pharmaceuticals
40 ................................................................................................................... 4.1.2. Heavy metals
41 ............................................ 4.2. Laboratory-scale fixed-bed adsorption column (venlafaxine)
42 .................................................................................... 4.2.1. Effect of the initial concentration
44 ...................................................................................................... 4.2.2. Effect of the flow rate
46 ................................................................................................... 4.2.3. Effect of the bed height
48 ............................ 4.2.4. Comparison the effect of different factors on the adsorption capacity
50 ............................................................. 4.3. Design the large-scale PVC column (venlafaxine)
54 ........................................ 4.4. Laboratory-scale fixed-bed adsorption column (Ni, Pb and Cu)
54 .................................................................................... 4.4.1. Effect of the initial concentration
59 ...................................................................................................... 4.4.2. Effect of the flow rate
63 .................................................................................................... 4.4.3. Effect of the bed depth
67 ............................ 4.4.4. Comparison the effect of different factors on the adsorption capacity
72 ......................................................... 4.5. Design the large-scale PVC column (Ni, Pb and Cu)
Chapter 5: Conclusion and future work
80 .......................................................................................................................... 5.1. Conclusion
81 ...................................................................................................................... 5.2. Contribution
82 ........................................................................................................................ 5.3. Future work
83 ................................................................................................................................ References
viii
List of Figures
4..............................................Fig. 1 Conceptual model of the fate of pharmaceuticals in the water bodies
8.......................................................Fig. 2 Conceptual model of the heavy metals fate in the water bodies
23....................................................................................Fig. 3 Breakthrough curve of adsorption process
29............................................................................................................Fig. 4 Methodological approach
31......................................................................................Fig. 5 Primary materials for biochar production
31...................................................................Fig. 6 Sustainable process to produce novel biochar on-site
32...........................................................................................Fig. 7 Schematic diagram of column system
34..............................................................................................................Fig. 8 Large-scale PVC column
42..............................................Fig. 9 Breakthrough curve at the initial concentration of 10 mg/L……...
43.............................................Fig. 10 Breakthrough curve at the initial concentration of 20 mg/L……...
43.............................................Fig. 11 Breakthrough curve at the initial concentration of 30 mg/L……...
45......................................................Fig. 12 Breakthrough curve at the volumetric flow rate of 2 mL/min
45......................................................Fig. 13 Breakthrough curve at the volumetric flow rate of 5 mL/min
45....................................................Fig. 14 Breakthrough curve at the volumetric flow rate of 10 mL/min
47............................................................................Fig. 15 Breakthrough curve at the bed depths of 3 cm
47............................................................................Fig. 16 Breakthrough curve at the bed depths of 4 cm
48........................Fig. 17 Cluster analysis of the initial concentration variations at the breakthrough point
48..........................................Fig. 18 Cluster analysis of the flow rate variations at the breakthrough point
48........................................Fig. 19 Cluster analysis of the bed depth variations at the breakthrough point
49............................Fig. 20 Cluster analysis of the initial concentration variations at the exhaustion point
49..............................................Fig. 21 Cluster analysis of the flow rate variations at the exhaustion point
49............................................Fig. 22 Cluster analysis of the bed depth variations at the exhaustion point
50....................................Fig. 23 Bed-depth service time (BDST) curve at the removal efficiency of 90%
52........................................................................Fig. 24 Breakthrough curve for large-scale PVC column
56................................................Fig. 25 Breakthrough curve of Ni at the initial concentration of 60 µg/L
56................................................Fig. 26 Breakthrough curve of Ni at the initial concentration of 70 µg/L
56................................................Fig. 27 Breakthrough curve of Ni at the initial concentration of 80 µg/L
ix
56................................................Fig. 28 Breakthrough curve of Pb at the initial concentration of 60 µg/L
57................................................Fig. 29 Breakthrough curve of Pb at the initial concentration of 70 µg/L
57................................................Fig. 30 Breakthrough curve of Pb at the initial concentration of 80 µg/L
57................................................Fig. 31 Breakthrough curve of Cu at the initial concentration of 60 µg/L
57................................................Fig. 32 Breakthrough curve of Cu at the initial concentration of 70 µg/L
58................................................Fig. 33 Breakthrough curve of Cu at the initial concentration of 80 µg/L
60.............................................Fig. 34 Breakthrough curve of Ni at the volumetric flow rate of 2 mL/min
61.............................................Fig. 35 Breakthrough curve of Ni at the volumetric flow rate of 5 mL/min
61...........................................Fig. 36 Breakthrough curve of Ni at the volumetric flow rate of 10 mL/min
61.............................................Fig. 37 Breakthrough curve of Pb at the volumetric flow rate of 2 mL/min
61.............................................Fig. 38 Breakthrough curve of Pb at the volumetric flow rate of 5 mL/min
62...........................................Fig. 39 Breakthrough curve of Pb at the volumetric flow rate of 10 mL/min
62............................................Fig. 40 Breakthrough curve of Cu at the volumetric flow rate of 2 mL/min
62............................................Fig. 41 Breakthrough curve of Cu at the volumetric flow rate of 5 mL/min
62..........................................Fig. 42 Breakthrough curve of Cu at the volumetric flow rate of 10 mL/min
65....................................................................Fig. 43 Breakthrough curve of Ni at the bed depth of 3 cm
65....................................................................Fig. 44 Breakthrough curve of Ni at the bed depth of 4 cm
65....................................................................Fig. 45 Breakthrough curve of Pb at the bed depth of 3 cm
65....................................................................Fig. 46 Breakthrough curve of Pb at the bed depth of 4 cm
66...................................................................Fig. 47 Breakthrough curve of Cu at the bed depth of 3 cm
66...................................................................Fig. 48 Breakthrough curve of Cu at the bed depth of 4 cm
67............Fig. 49 Cluster analysis of the initial concentration variations at the breakthrough point of Ni
67............Fig. 50 Cluster analysis of the initial concentration variations at the breakthrough point of Pb
67............Fig. 51 Cluster analysis of the initial concentration variations at the breakthrough point of Cu
68..............................Fig. 52 Cluster analysis of the flow rate variations at the breakthrough point of Ni
68..............................Fig. 53 Cluster analysis of the flow rate variations at the breakthrough point of Pb
68..............................Fig. 54 Cluster analysis of the flow rate variations at the breakthrough point of Cu
68.............................Fig. 55 Cluster analysis of the bed depth variations at the breakthrough point of Ni
x
69.............................Fig. 56 Cluster analysis of the bed depth variations at the breakthrough point of Pb
69............................Fig. 57 Cluster analysis of the bed depth variations at the breakthrough point of Cu
70................Fig. 58 Cluster analysis of the initial concentration variations at the exhaustion point of Ni
70................Fig. 59 Cluster analysis of the initial concentration variations at the exhaustion point of Pb
70................Fig. 60 Cluster analysis of the initial concentration variations at the exhaustion point of Cu
70..................................Fig. 61 Cluster analysis of the flow rate variations at the exhaustion point of Ni
71..................................Fig. 62 Cluster analysis of the flow rate variations at the exhaustion point of Pb
71..................................Fig. 63 Cluster analysis of the flow rate variations at the exhaustion point of Cu
71.................................Fig. 64 Cluster analysis of the bed depth variations at the exhaustion point of Ni
71.................................Fig. 65 Cluster analysis of the bed depth variations at the exhaustion point of Pb
72................................Fig. 66 Cluster analysis of the bed depth variations at the exhaustion point of Cu
73..............................................Fig. 67 Bed-depth service time (BDST) curve at the 90% removal of Ni
73..............................................Fig. 68 Bed-depth service time (BDST) curve at the 90% removal of Pb
74..............................................Fig. 69 Bed-depth service time (BDST) curve at the 90% removal of Cu
76...............................................................Fig. 70 Breakthrough curve of Ni for large-scale PVC column
76...............................................................Fig. 71 Breakthrough curve of Pb for large-scale PVC column
77..............................................................Fig. 72 Breakthrough curve of Cu for large-scale PVC column
xi
List of Tables
5.........................................................................Table 1 Effects of pharmaceuticals on marine organisms
9..........................................................................................................................Table 2 Effects of arsenic
10....................................................................................................................Table 3 Effects of cadmium
11.........................................................................................................................Table 4 Effects of cobalt
12........................................................................................................................Table 5 Effects of copper
13.............................................................................................................................Table 6 Effects of lead
13......................................................................................................................Table 7 Effects of mercury
15...................................................................................................................Table 8 Effects of vanadium
16.............................................................................................................................Table 9 Effects of zinc
17.......................................................................................................................Table 10 Effects of nickel
17.................................................................................................................Table 11 Effects of chromium
18...............................................................................................................Table 12 Effects of manganese
21....................................................................................Table 13 Different methods of preparing biochar
22........................................................................................Table 14 Different stages of Pyrolysis process
24..................................................Table 15 Mathematical models in describing the fixed-bed adsorption
33.....................Table 16 Column tests for venlafaxine adsorption at the various experimental conditions
33..................Table 17 Column tests for Ni, Pb and Cu adsorption at the various experimental conditions
36..........................................................................................Table 18 Classification of risk quotient (RQ)
36...................................................................................................................Table 19 Assessment factors
40..............................................................................................Table 20 Risk assessment of heavy metals
41...................................Table 21 Effects of different factors on breakthrough time and exhaustion time
42.......................... Table 22 Breakthrough and exhaustion points at the initial concentration of 10 mg/L.
42.......................... Table 23 Breakthrough and exhaustion points at the initial concentration of 20 mg/L.
42.......................... Table 24 Breakthrough and exhaustion points at the initial concentration of 30 mg/L.
44.......................................... Table 25 Breakthrough and exhaustion points at the flow rate of 2 mL/min.
44.......................................... Table 26 Breakthrough and exhaustion points at the flow rate of 5 mL/min.
44........................................ Table 27 Breakthrough and exhaustion points at the flow rate of 10 mL/min.
xii
46......................................... Table 28 Breakthrough and exhaustion points at the bed depth of 3 cm…….
46......................................... Table 29 Breakthrough and exhaustion points at the bed depth of 4 cm…….
50....... Table 30 Bed-depth service time (BDST) for at the removal efficiency of 90%…………..……....
51........................................ Table 31 Removal efficiency of venlafaxine in the large-scale column …….
52.............. Table 32 Breakthrough and exhaustion points of venlafaxine in the large-scale column …….
54........ Table 33 Breakthrough and exhaustion points of Ni at the initial concentration of 60 µg/L ….….
54........ Table 34 Breakthrough and exhaustion points of Ni at the initial concentration of 70 µg/L ……..
54........ Table 35 Breakthrough and exhaustion points of Ni at the initial concentration of 80 µg/L ……..
55....... Table 36 Breakthrough and exhaustion points of Pb at the initial concentration of 60 µg/L …..….
55....... Table 37 Breakthrough and exhaustion points of Pb at the initial concentration of 70 µg/L …..….
55....... Table 38 Breakthrough and exhaustion points of Pb at the initial concentration of 80 µg/L …..….
55....... Table 39 Breakthrough and exhaustion points of Cu at the initial concentration of 60 µg/L …..….
55....... Table 40 Breakthrough and exhaustion points of Cu at the initial concentration of 70 µg/L ……...
55....... Table 41 Breakthrough and exhaustion points of Cu at the initial concentration of 80 µg/L ……...
59......................... Table 42 Breakthrough and exhaustion points of Ni at the flow rate of 2 mL/min…….
59......................... Table 43 Breakthrough and exhaustion points of Ni at the flow rate of 5 mL/min…….
59....................... Table 44 Breakthrough and exhaustion points of Ni at the flow rate of 10 mL/min…….
59......................... Table 45 Breakthrough and exhaustion points of Pb at the flow rate of 2 mL/min…….
60......................... Table 46 Breakthrough and exhaustion points of Pb at the flow rate of 5 mL/min…….
60....................... Table 47 Breakthrough and exhaustion points of Pb at the flow rate of 10 mL/min…….
60........................ Table 48 Breakthrough and exhaustion points of Cu at the flow rate of 2 mL/min…….
60........................ Table 49 Breakthrough and exhaustion points of Cu at the flow rate of 5 mL/min…….
60.................... Table 50 Breakthrough and exhaustion points of Cu at the flow rate of 10 mL/min…….
64........................... Table 51 Breakthrough and exhaustion points of Ni at the bed depth of 3 cm ……….
64........................... Table 52 Breakthrough and exhaustion points of Ni at the bed depth of 4 cm ……….
64.............................. Table 53 Breakthrough and exhaustion points of Pb at the bed depth of 3 cm …….
64.............................. Table 54 Breakthrough and exhaustion points of Pb at the bed depth of 4 cm …….
64.............................. Table 55 Breakthrough and exhaustion points of Cu at the bed depth of 3 cm …….
xiii
64.............................. Table 56 Breakthrough and exhaustion points of Cu at the bed depth of 4 cm …….
72....................... Table 57 Bed-depth service time (BDST) for Ni at the removal efficiency of 90%…….
72....................... Table 58 Bed-depth service time (BDST) for Pb at the removal efficiency of 90%…….
73..................... Table 59 Bed-depth service time (BDST) for Cu at the removal efficiency of 90% …….
75... Table 60 Equation of Bed-depth service time (BDST) curve at the removal efficiency of 90% …….
75.................................................... Table 61 Adsorbent utilization in the large-scale PVC column …….
75............................ Table 62 Removal efficiency of Ni in the large-scale column …………….......…….
75............................ Table 63 Removal efficiency of Pb in the large-scale column ……………...……....
75............................ Table 64 Removal efficiency of Cu in the large-scale column …………...……...….
77............................. Table 65 Breakthrough and exhaustion points of Ni in the large-scale column …….
77............................ Table 66 Breakthrough and exhaustion points of Pb in the large-scale column …….
77............................ Table 67 Breakthrough and exhaustion points of Cu in the large-scale column …….
78................................... Table 68 Risk assessment of heavy metals………………….………………….
xiv
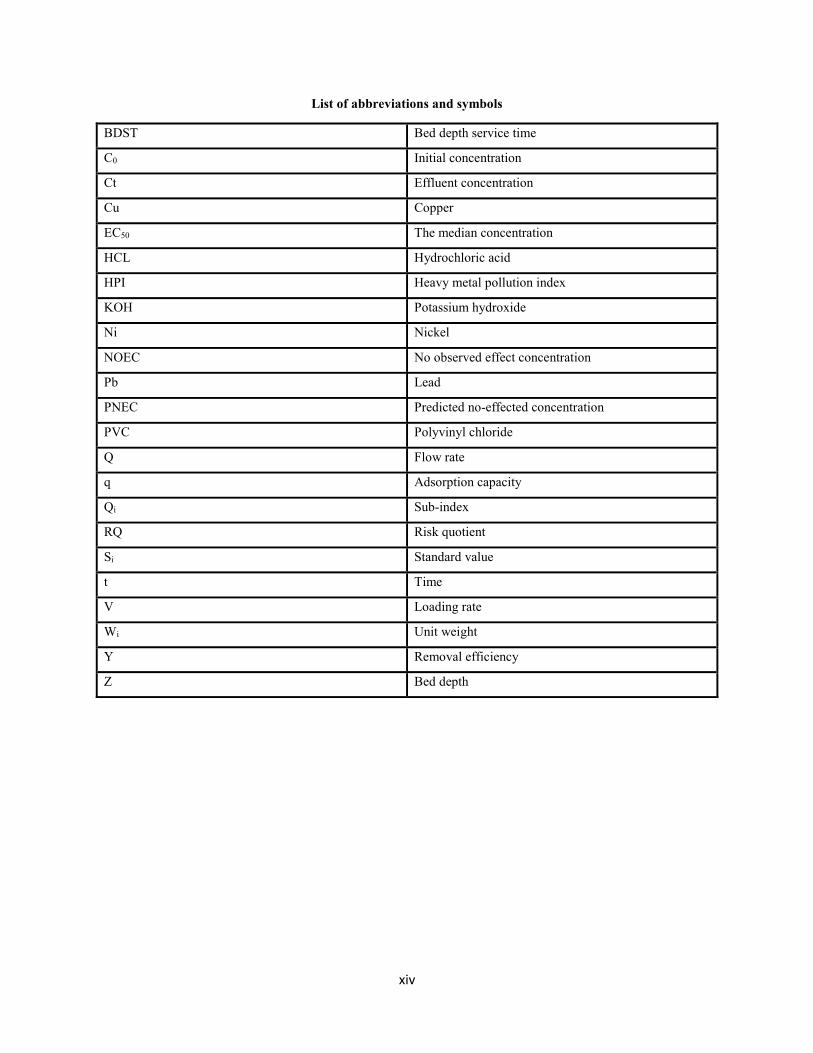
List of abbreviations and symbols
BDST Bed depth service time
C0 Initial concentration
Ct Effluent concentration
Cu Copper
EC50 The median concentration
HCL Hydrochloric acid
HPI Heavy metal pollution index
KOH Potassium hydroxide
Ni Nickel
NOEC No observed effect concentration
Pb Lead
PNEC Predicted no-effected concentration
PVC Polyvinyl chloride
Q Flow rate
q Adsorption capacity
Qi Sub-index
RQ Risk quotient
Si Standard value
t Time
V Loading rate
Wi Unit weight
Y Removal efficiency
Z Bed depth

Chapter 1: Introduction
1
1.1. Problem statement
Pharmaceuticals and heavy metals derived from different point sources and non-point sources are
eventually carried by rivers into water bodies including oceans, seas and lakes (Fakhraee et al.
2015; Heidari 2019; Karbassi and Heidari 2015; Vaezi 2016). The accumulation of such pollutants
in the aquatic and marine environments has been on the increase which poses a serious threat to
the flora, fauna and human health (Heidari 2019; Karbassi et al., 2013; Valikhani Samani et al.,
2014). Pharmaceuticals and heavy metals have been detected in the liver, kidney and gill of fishes.
DNA damage, impairment of reproductive capacity, oxidative stress, cell death, hair cell death,
delay in maturation, reduction in fecundity, mortality etc. are considered as deleterious impacts of
pharmaceuticals and heavy metals (Duarte et al., 2020Gautam et al., 2018; Ghosh et al., 2018; Li
et al., 2018; Liu et al., 2018; Mezzelani et al., 2020; Nunes et al., 2020). One of the important
sources of pharmaceuticals and heavy metals is wastewater or effluent of wastewater. As a result,
the elimination of these pollutants from wastewater plays a vital role in enriching the condition of
water bodies. There are diverse processes including adsorption process, biological process,
filtration, advanced oxidation process and chlorination, and the combination of different processes
which can be used for water purification and wastewater treatment (Abazari 2019; Fang et al.,
2018; Liu et al., 2018a; Nasseh et al., 2019; Xu et al., 2018a; Zhang et al., 2019b; Zhu et al., 2017;
Zhu et al., 2015). Among such methods, the adsorption process is well-known for simplicity of
operation and cost-effectiveness (Ahmed et al., 2017a; Appavu et al., 2018; Mandal et al., 2019;
Okoli and Ofomaja, 2019; Tien et al. 2018). Batch and column studies are considered as two ways
to adsorption studies. The data gained from a batch study is limited to the laboratory scale and thus
cannot be applied in industrial systems. Nevertheless, the column study provides data for direct
applications in industrial systems. In the last few years, the adsorption of pharmaceuticals and
heavy metals on the different adsorbents in the fixed-bed column has been conducted (Abdolali et
al., 2017; Alimohammadi et al., 2016; Bakar et al., 2019; Guocheng et al., 2011; Hajilari et al.,
2019). On the other hand, the results have indicated that the risk of such pollutants in water bodies
is high. As a consequence, comprehensive investigations on utilizing appropriate adsorbent in the
column and the column performance should be conducted in producing a pivotal remedy to
eliminate pharmaceuticals and heavy metals from different types of wastewaters or effluent of
wastewaters.
2
1.2. Research objectives
The main objective of this study was to assess the feasibility of using a novel biochar for the
emerging pollutant removal at a wastewater treatment plant. The specific objectives were:
1. Assessing adsorption capacity of a representative pharmaceutical using fixed-bed column
2. Assessing adsorption of representative heavy metals on biochar in a fixed-bed column
3. Defining parameters affecting the adsorption efficiency
4. Designing a large-scale column based on a model
5. Conducting risk assessment to aquatic biota before and after treatment
1.3. Organization of thesis
The thesis consists of five chapters. The problem statement along with research objectives were
described in chapter 1. A comprehensive literature review about the sources, effects, elimination
method and column study of pharmaceuticals and heavy metals were provided in chapter 2.
Sampling and analysis, installation of laboratory-scale column, design of large-scale column and
risk assessment methods were explained as method and materials in chapter 3. The results of
utilizing laboratory-scale column under various experimental conditions, designing of large-scale
column and risk assessment of pollutants are explained and discussed in chapter 4. Conclusion of
research novelty and recommendations for future work are provided in chapter 5.

Chapter 2: Literature review
4
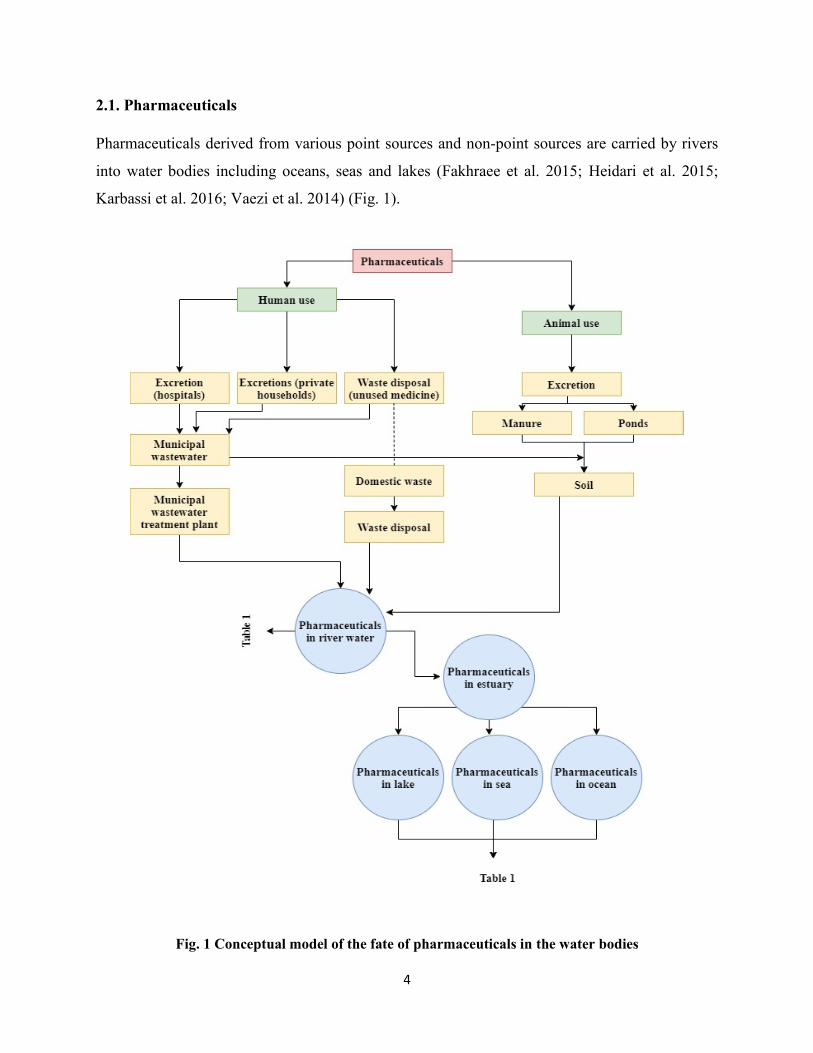
2.1. Pharmaceuticals
Pharmaceuticals derived from various point sources and non-point sources are carried by rivers
into water bodies including oceans, seas and lakes (Fakhraee et al. 2015; Heidari et al. 2015;
Karbassi et al. 2016; Vaezi et al. 2014) (Fig. 1).
Fig. 1 Conceptual model of the fate of pharmaceuticals in the water bodies
5
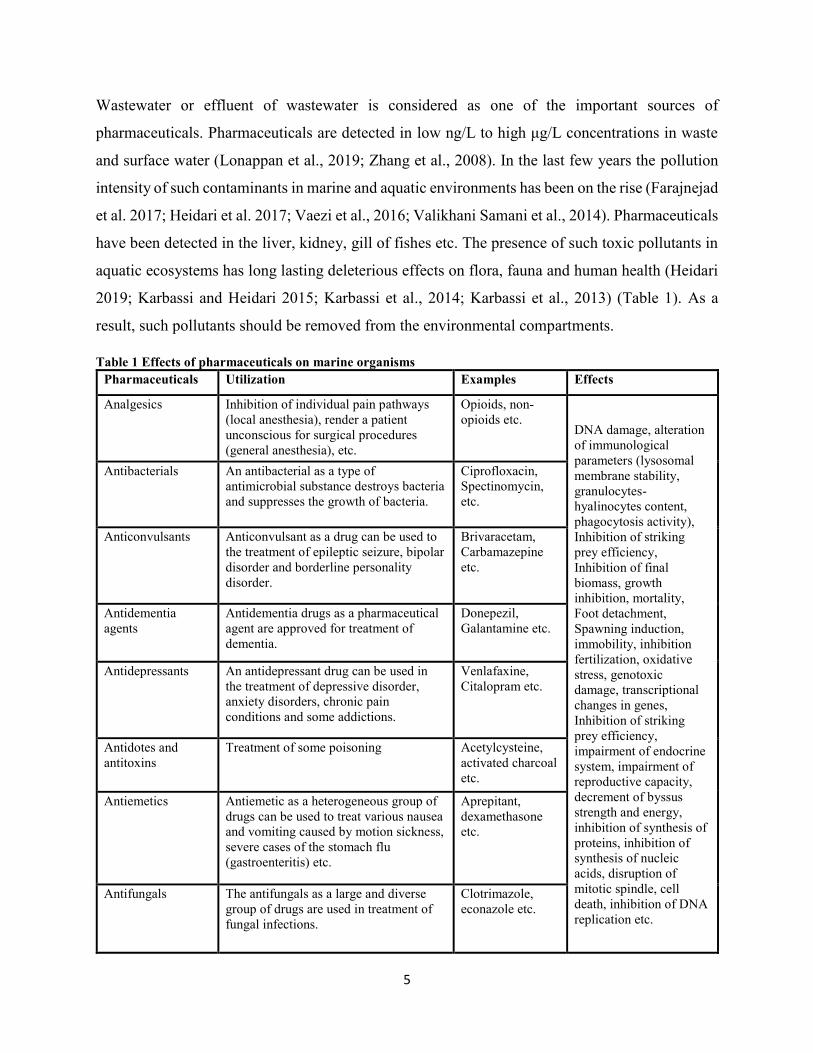
Wastewater or effluent of wastewater is considered as one of the important sources of
pharmaceuticals. Pharmaceuticals are detected in low ng/L to high μg/L concentrations in waste
and surface water (Lonappan et al., 2019; Zhang et al., 2008). In the last few years the pollution
intensity of such contaminants in marine and aquatic environments has been on the rise (Farajnejad
et al. 2017; Heidari et al. 2017; Vaezi et al., 2016; Valikhani Samani et al., 2014). Pharmaceuticals
have been detected in the liver, kidney, gill of fishes etc. The presence of such toxic pollutants in
aquatic ecosystems has long lasting deleterious effects on flora, fauna and human health (Heidari
2019; Karbassi and Heidari 2015; Karbassi et al., 2014; Karbassi et al., 2013) (Table 1). As a
result, such pollutants should be removed from the environmental compartments.
Table 1 Effects of pharmaceuticals on marine organisms
Pharmaceuticals Utilization Examples Effects
Analgesics Inhibition of individual pain pathways
(local anesthesia), render a patient
unconscious for surgical procedures
(general anesthesia), etc.
Opioids, non-
opioids etc. DNA damage, alteration
of immunological
parameters (lysosomal
membrane stability,
granulocytes-
hyalinocytes content,
phagocytosis activity),
Inhibition of striking
prey efficiency,
Inhibition of final
biomass, growth
inhibition, mortality,
Foot detachment,
Spawning induction,
immobility, inhibition
fertilization, oxidative
stress, genotoxic
damage, transcriptional
changes in genes,
Inhibition of striking
prey efficiency,
impairment of endocrine
system, impairment of
reproductive capacity,
decrement of byssus
strength and energy,
inhibition of synthesis of
proteins, inhibition of
synthesis of nucleic
acids, disruption of
mitotic spindle, cell
death, inhibition of DNA
replication etc.
Antibacterials An antibacterial as a type of
antimicrobial substance destroys bacteria
and suppresses the growth of bacteria.
Ciprofloxacin,
Spectinomycin,
etc.
Anticonvulsants Anticonvulsant as a drug can be used to
the treatment of epileptic seizure, bipolar
disorder and borderline personality
disorder.
Brivaracetam,
Carbamazepine
etc.
Antidementia
agents
Antidementia drugs as a pharmaceutical
agent are approved for treatment of
dementia.
Donepezil,
Galantamine etc.
Antidepressants An antidepressant drug can be used in
the treatment of depressive disorder,
anxiety disorders, chronic pain
conditions and some addictions.
Venlafaxine,
Citalopram etc.
Antidotes and
antitoxins
Treatment of some poisoning Acetylcysteine,
activated charcoal
etc.
Antiemetics Antiemetic as a heterogeneous group of
drugs can be used to treat various nausea
and vomiting caused by motion sickness,
severe cases of the stomach flu
(gastroenteritis) etc.
Aprepitant,
dexamethasone
etc.
Antifungals The antifungals as a large and diverse
group of drugs are used in treatment of
fungal infections.
Clotrimazole,
econazole etc.
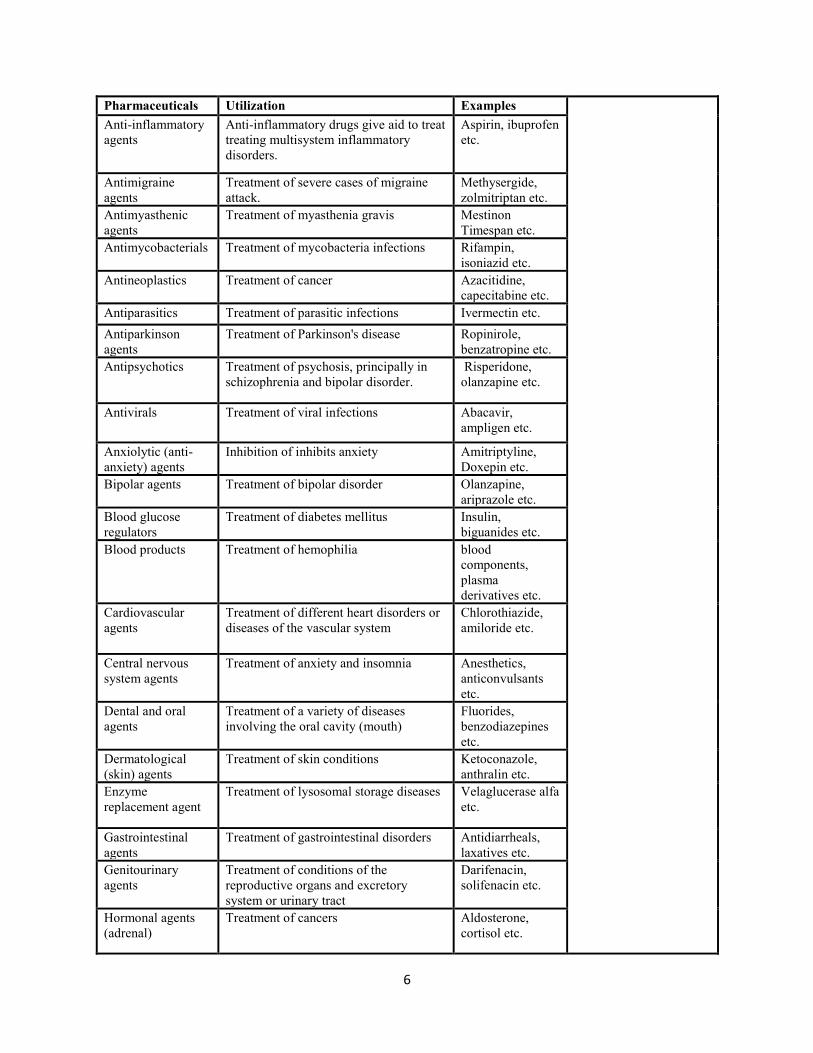
6
Pharmaceuticals Utilization Examples
Anti-inflammatory
agents
Anti-inflammatory drugs give aid to treat
treating multisystem inflammatory
disorders.
Aspirin, ibuprofen
etc.
Antimigraine
agents
Treatment of severe cases of migraine
attack.
Methysergide,
zolmitriptan etc.
Antimyasthenic
agents
Treatment of myasthenia gravis Mestinon
Timespan etc.
Antimycobacterials Treatment of mycobacteria infections Rifampin,
isoniazid etc.
Antineoplastics Treatment of cancer Azacitidine,
capecitabine etc.
Antiparasitics Treatment of parasitic infections Ivermectin etc.
Antiparkinson
agents
Treatment of Parkinson's disease Ropinirole,
benzatropine etc.
Antipsychotics Treatment of psychosis, principally in
schizophrenia and bipolar disorder.
Risperidone,
olanzapine etc.
Antivirals Treatment of viral infections Abacavir,
ampligen etc.
Anxiolytic (anti-
anxiety) agents
Inhibition of inhibits anxiety Amitriptyline,
Doxepin etc.
Bipolar agents Treatment of bipolar disorder Olanzapine,
ariprazole etc.
Blood glucose
regulators
Treatment of diabetes mellitus Insulin,
biguanides etc.
Blood products Treatment of hemophilia blood
components,
plasma
derivatives etc.
Cardiovascular
agents
Treatment of different heart disorders or
diseases of the vascular system
Chlorothiazide,
amiloride etc.
Central nervous
system agents
Treatment of anxiety and insomnia Anesthetics,
anticonvulsants
etc.
Dental and oral
agents
Treatment of a variety of diseases
involving the oral cavity (mouth)
Fluorides,
benzodiazepines
etc.
Dermatological
(skin) agents
Treatment of skin conditions Ketoconazole,
anthralin etc.
Enzyme
replacement agent
Treatment of lysosomal storage diseases Velaglucerase alfa
etc.
Gastrointestinal
agents
Treatment of gastrointestinal disorders Antidiarrheals,
laxatives etc.
Genitourinary
agents
Treatment of conditions of the
reproductive organs and excretory
system or urinary tract
Darifenacin,
solifenacin etc.
Hormonal agents
(adrenal)
Treatment of cancers Aldosterone,
cortisol etc.
7
Pharmaceuticals Utilization Examples
Immunological
agents
Preventing graft rejection Immune
globulins,
immunostimulants
etc.
Inflammatory
agents
Reduction in inflammation Celecoxib,
diclofenac etc.
Antimetabolite
drugs
Treatment of leukemia, cancers of the
breast, ovary, and the gastrointestinal
tract, as well as other types of cancers
Floxuridine,
fludarabine etc.
Ophthalmic (eye)
agents
Treatment of eye infections Moxifloxacin,
besifloxacin etc.
Otic (ear) agents Treatment of outer ear infections Ciprofloxacin,
hydrocortisone
etc.
Respiratory tract
agents
Preventing respiratory diseases Antiasthmatic
combinations
Sedatives and
hypnotics
Treatment of insomnia Barbiturates,
benzodiazepines
etc.
Skeletal muscle
relaxants
Reducing tension in muscles Baclofen,
methocarbamol
etc.
Therapeutic
nutrients, minerals,
and electrolytes
Preventing vitamin deficiency, renal
problems, diarrhea and vomiting
Magnesium
sulfate, calcium
carbonate etc.
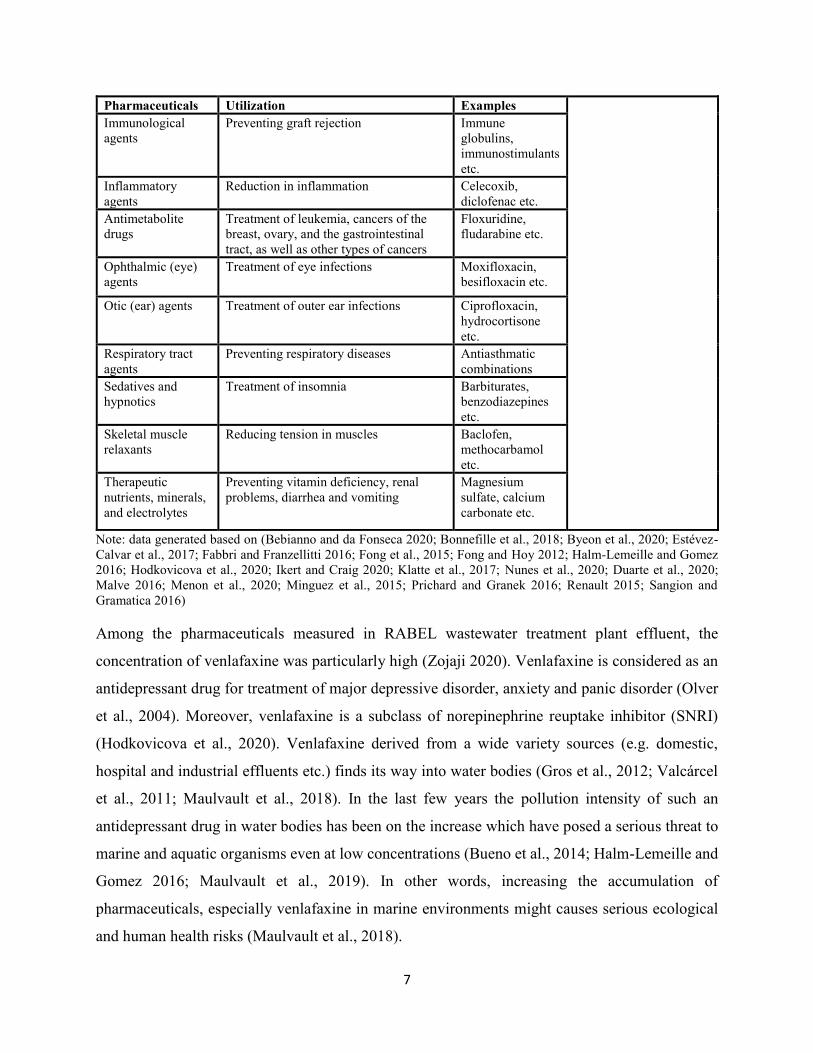
Note: data generated based on (Bebianno and da Fonseca 2020; Bonnefille et al., 2018; Byeon et al., 2020; Estévez-
Calvar et al., 2017; Fabbri and Franzellitti 2016; Fong et al., 2015; Fong and Hoy 2012; Halm-Lemeille and Gomez
2016; Hodkovicova et al., 2020; Ikert and Craig 2020; Klatte et al., 2017; Nunes et al., 2020; Duarte et al., 2020;
Malve 2016; Menon et al., 2020; Minguez et al., 2015; Prichard and Granek 2016; Renault 2015; Sangion and
Gramatica 2016)
Among the pharmaceuticals measured in RABEL wastewater treatment plant effluent, the
concentration of venlafaxine was particularly high (Zojaji 2020). Venlafaxine is considered as an
antidepressant drug for treatment of major depressive disorder, anxiety and panic disorder (Olver
et al., 2004). Moreover, venlafaxine is a subclass of norepinephrine reuptake inhibitor (SNRI)
(Hodkovicova et al., 2020). Venlafaxine derived from a wide variety sources (e.g. domestic,
hospital and industrial effluents etc.) finds its way into water bodies (Gros et al., 2012; Valcárcel
et al., 2011; Maulvault et al., 2018). In the last few years the pollution intensity of such an
antidepressant drug in water bodies has been on the increase which have posed a serious threat to
marine and aquatic organisms even at low concentrations (Bueno et al., 2014; Halm-Lemeille and
Gomez 2016; Maulvault et al., 2019). In other words, increasing the accumulation of
pharmaceuticals, especially venlafaxine in marine environments might causes serious ecological
and human health risks (Maulvault et al., 2018).
8
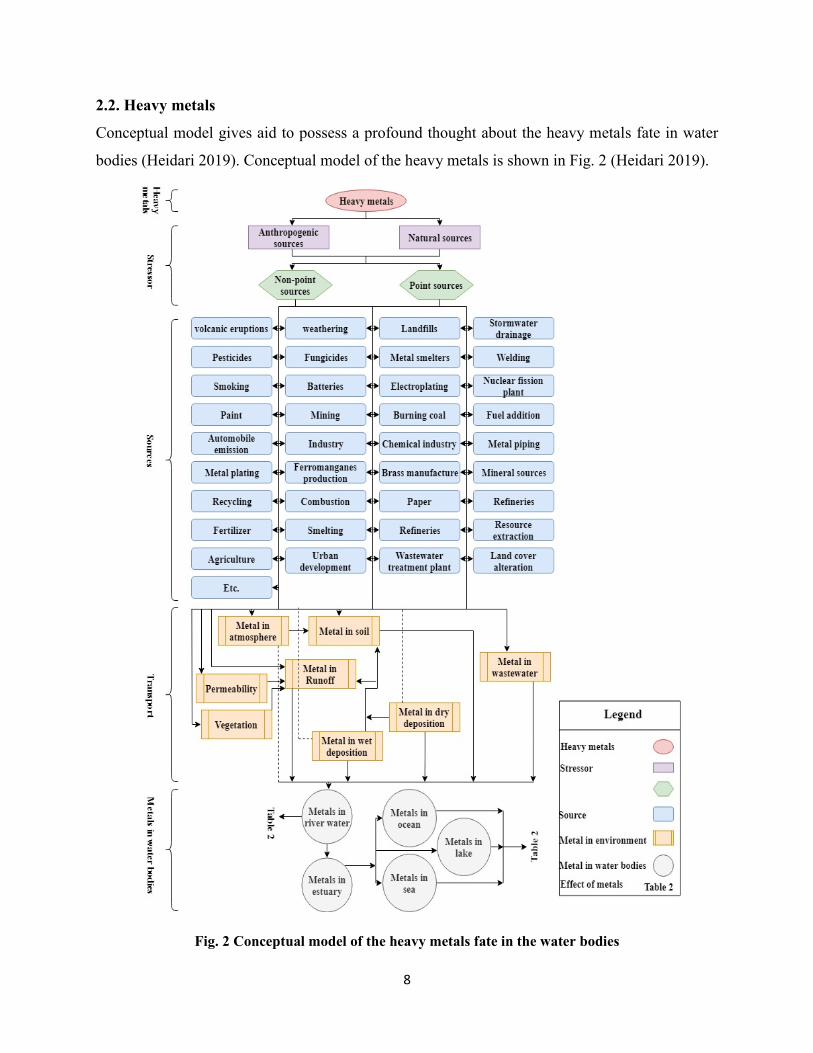
2.2. Heavy metals
Conceptual model gives aid to possess a profound thought about the heavy metals fate in water
bodies (Heidari 2019). Conceptual model of the heavy metals is shown in Fig. 2 (Heidari 2019).
Fig. 2 Conceptual model of the heavy metals fate in the water bodies
9
Heavy metals derived from different natural and anthropogenic sources are eventually carried by
rivers into oceans, seas and lakes (Heidari 2019; Fakhraee et al., 2015; Vaezi et al., 2016; Vaezi et
al., 2014). The presence of heavy metals as dangerous environmental pollutants in marine
ecosystems poses serious ecological risk concerns for aquatic organisms (Billah et al., 2017; Fu et
al., 2017; Naifar et al., 2018). Due to rapid population growth, industrialization, urbanization and
economic development in a wide variety of countries all across the world, high concentration of
essential elements in conjunction with low concentration of non-essential elements have become
a serious problem in marine ecosystems (Cipro et al., 2018; Frontalini et al., 2018; Fuentes-
Gandara et al., 2018; Souza et al., 2018; Stankovic et al., 2014). The characteristics of heavy metals
including toxicity, bio-concentration and non-degradation play an important role in posing
irreversible damages to marine organisms, especially fish (Green et al., 2018; Rajeshkumar et al.,
218). Moreover, the human health condition can be impacted by exposure to toxic elements (Ding
et al., 2018; Fuentes-Gandara et al., 2018; Wang et al., 2018). As a consequence, such pollutants
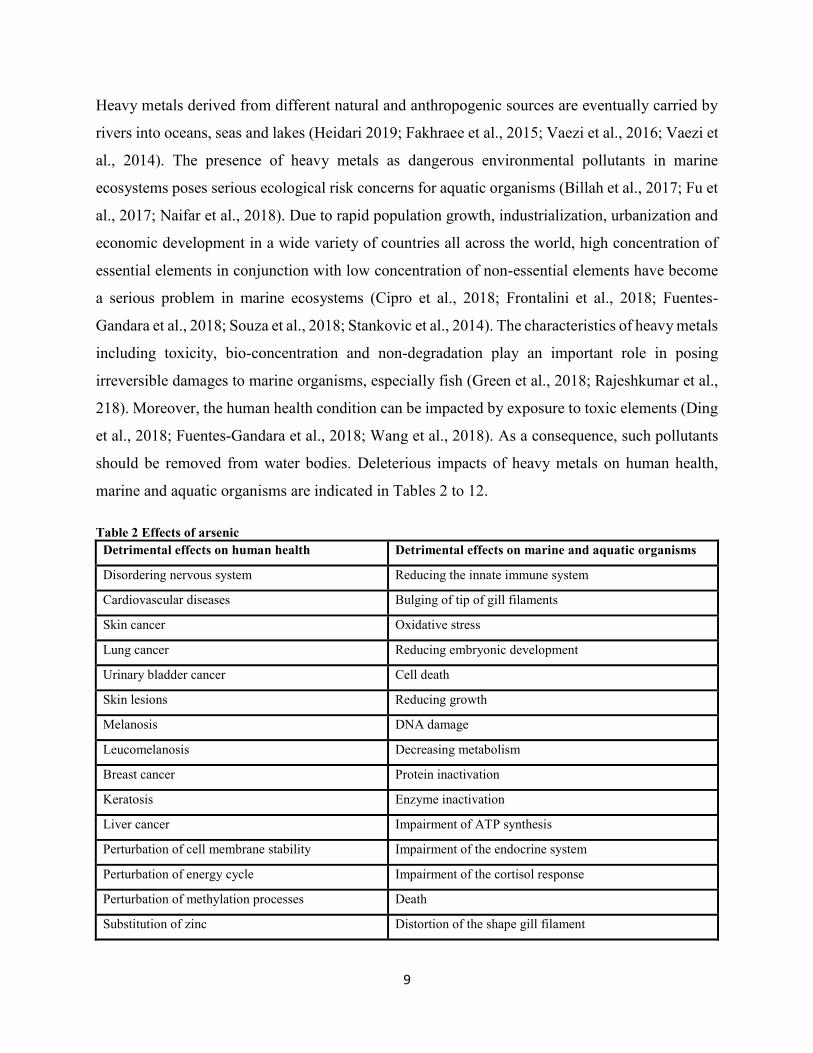
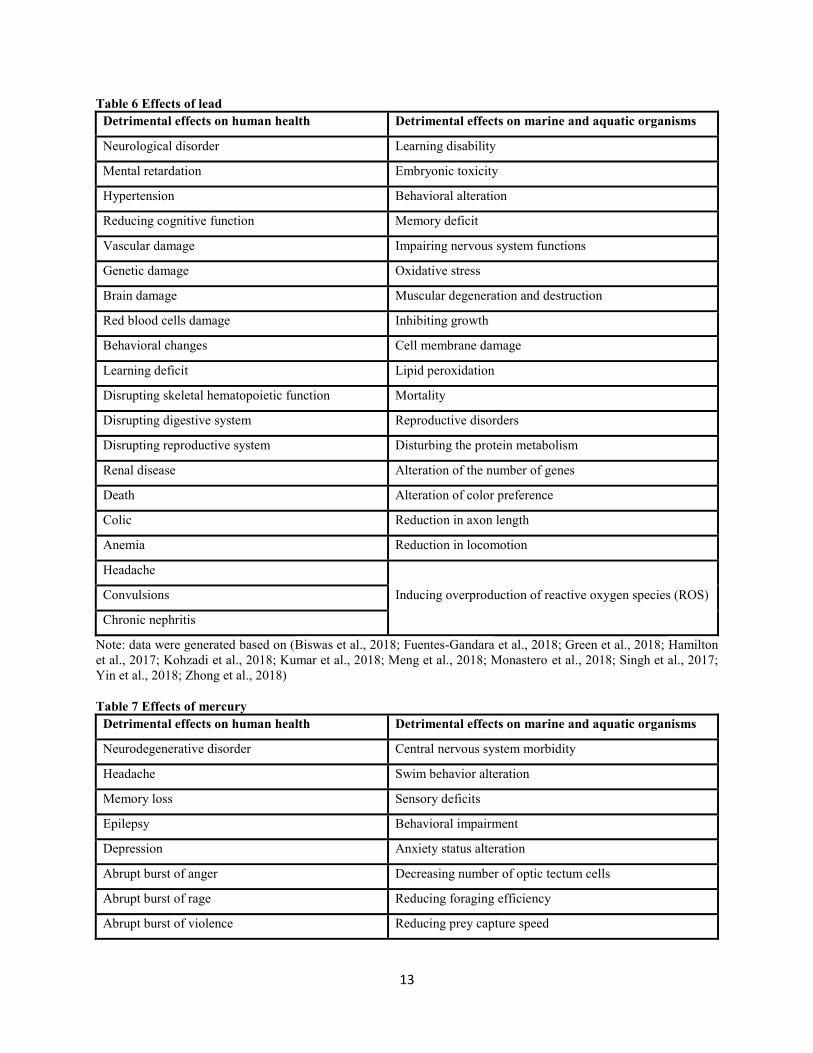
should be removed from water bodies. Deleterious impacts of heavy metals on human health,
marine and aquatic organisms are indicated in Tables 2 to 12.
Table 2 Effects of arsenic Detrimental effects on human health Detrimental effects on marine and aquatic organisms
Disordering nervous system Reducing the innate immune system
Cardiovascular diseases Bulging of tip of gill filaments
Skin cancer Oxidative stress
Lung cancer Reducing embryonic development
Urinary bladder cancer Cell death
Skin lesions Reducing growth
Melanosis DNA damage
Leucomelanosis Decreasing metabolism
Breast cancer Protein inactivation
Keratosis Enzyme inactivation
Liver cancer Impairment of ATP synthesis
Perturbation of cell membrane stability Impairment of the endocrine system
Perturbation of energy cycle Impairment of the cortisol response
Perturbation of methylation processes Death
Substitution of zinc Distortion of the shape gill filament
10
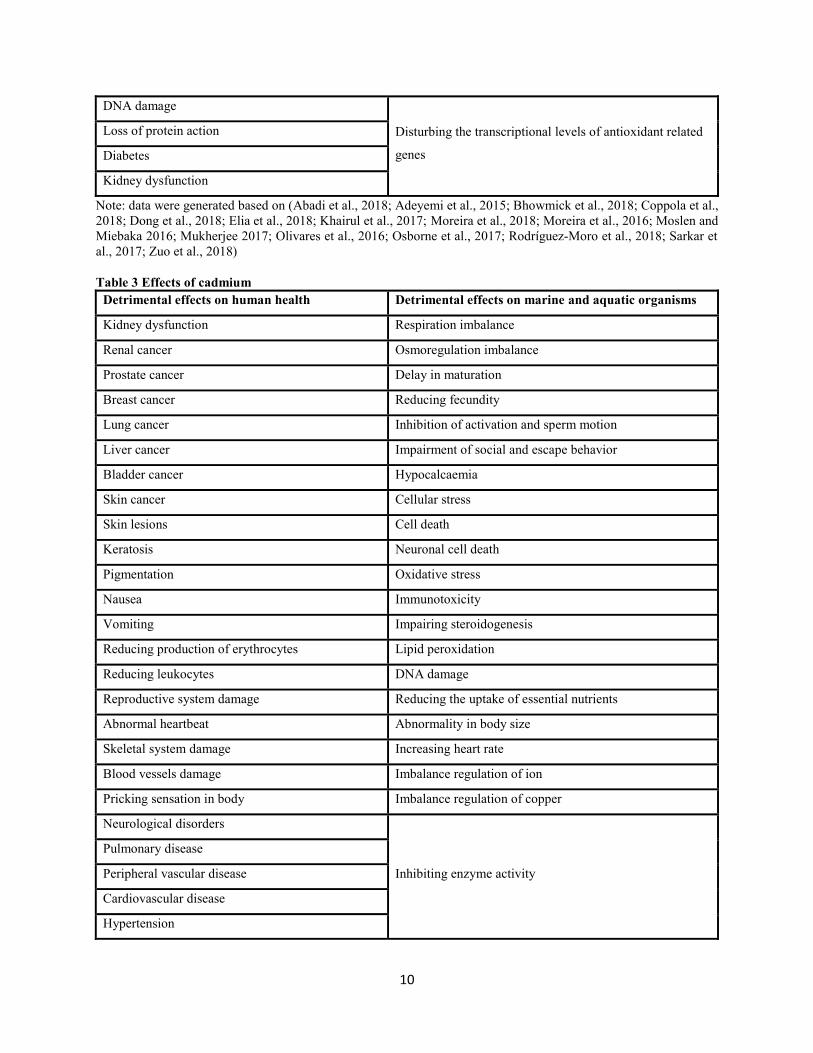
DNA damage
Disturbing the transcriptional levels of antioxidant related
genes
Loss of protein action
Diabetes
Kidney dysfunction
Note: data were generated based on (Abadi et al., 2018; Adeyemi et al., 2015; Bhowmick et al., 2018; Coppola et al.,
2018; Dong et al., 2018; Elia et al., 2018; Khairul et al., 2017; Moreira et al., 2018; Moreira et al., 2016; Moslen and
Miebaka 2016; Mukherjee 2017; Olivares et al., 2016; Osborne et al., 2017; Rodríguez‐Moro et al., 2018; Sarkar et
al., 2017; Zuo et al., 2018)
Table 3 Effects of cadmium
Detrimental effects on human health Detrimental effects on marine and aquatic organisms
Kidney dysfunction Respiration imbalance
Renal cancer Osmoregulation imbalance
Prostate cancer Delay in maturation
Breast cancer Reducing fecundity
Lung cancer Inhibition of activation and sperm motion
Liver cancer Impairment of social and escape behavior
Bladder cancer Hypocalcaemia
Skin cancer Cellular stress
Skin lesions Cell death
Keratosis Neuronal cell death
Pigmentation Oxidative stress
Nausea Immunotoxicity
Vomiting Impairing steroidogenesis
Reducing production of erythrocytes Lipid peroxidation
Reducing leukocytes DNA damage
Reproductive system damage Reducing the uptake of essential nutrients
Abnormal heartbeat Abnormality in body size
Skeletal system damage Increasing heart rate
Blood vessels damage Imbalance regulation of ion
Pricking sensation in body Imbalance regulation of copper
Neurological disorders
Inhibiting enzyme activity
Pulmonary disease
Peripheral vascular disease
Cardiovascular disease
Hypertension
11
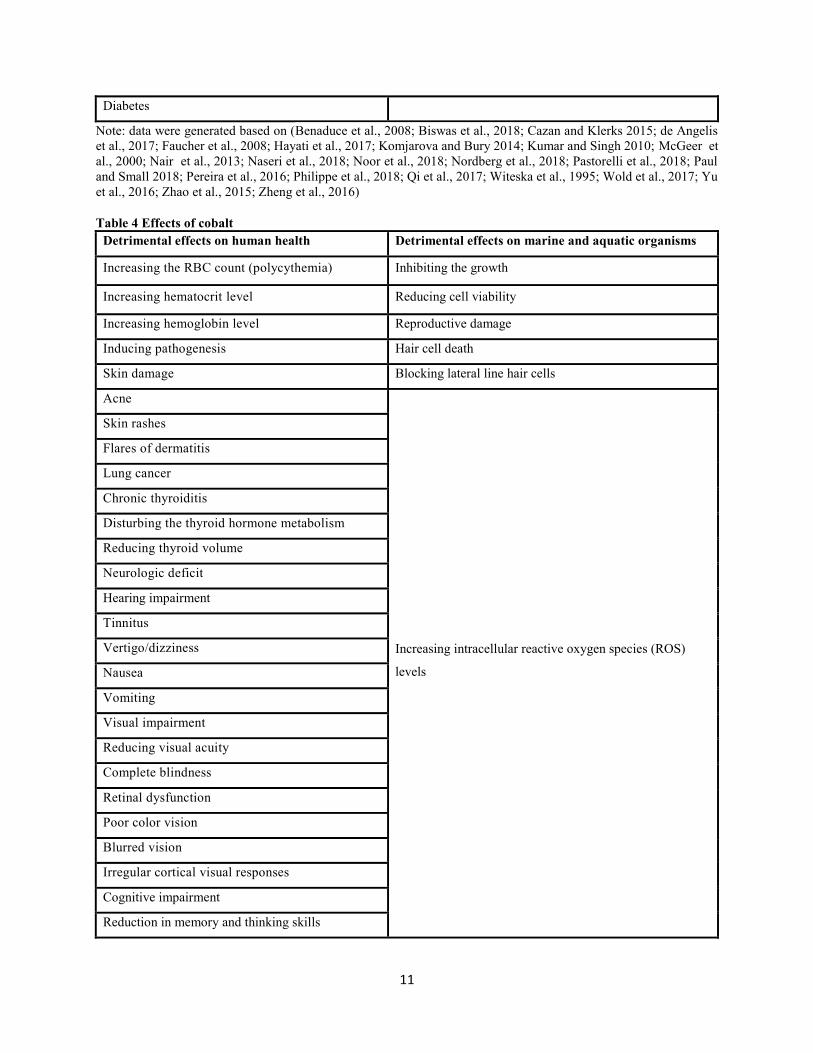
Diabetes
Note: data were generated based on (Benaduce et al., 2008; Biswas et al., 2018; Cazan and Klerks 2015; de Angelis
et al., 2017; Faucher et al., 2008; Hayati et al., 2017; Komjarova and Bury 2014; Kumar and Singh 2010; McGeer et
al., 2000; Nair et al., 2013; Naseri et al., 2018; Noor et al., 2018; Nordberg et al., 2018; Pastorelli et al., 2018; Paul
and Small 2018; Pereira et al., 2016; Philippe et al., 2018; Qi et al., 2017; Witeska et al., 1995; Wold et al., 2017; Yu
et al., 2016; Zhao et al., 2015; Zheng et al., 2016)
Table 4 Effects of cobalt
Detrimental effects on human health Detrimental effects on marine and aquatic organisms
Increasing the RBC count (polycythemia) Inhibiting the growth
Increasing hematocrit level Reducing cell viability
Increasing hemoglobin level Reproductive damage
Inducing pathogenesis Hair cell death
Skin damage Blocking lateral line hair cells
Acne
Increasing intracellular reactive oxygen species (ROS)
levels
Skin rashes
Flares of dermatitis
Lung cancer
Chronic thyroiditis
Disturbing the thyroid hormone metabolism
Reducing thyroid volume
Neurologic deficit
Hearing impairment
Tinnitus
Vertigo/dizziness
Nausea
Vomiting
Visual impairment
Reducing visual acuity
Complete blindness
Retinal dysfunction
Poor color vision
Blurred vision
Irregular cortical visual responses
Cognitive impairment
Reduction in memory and thinking skills
12
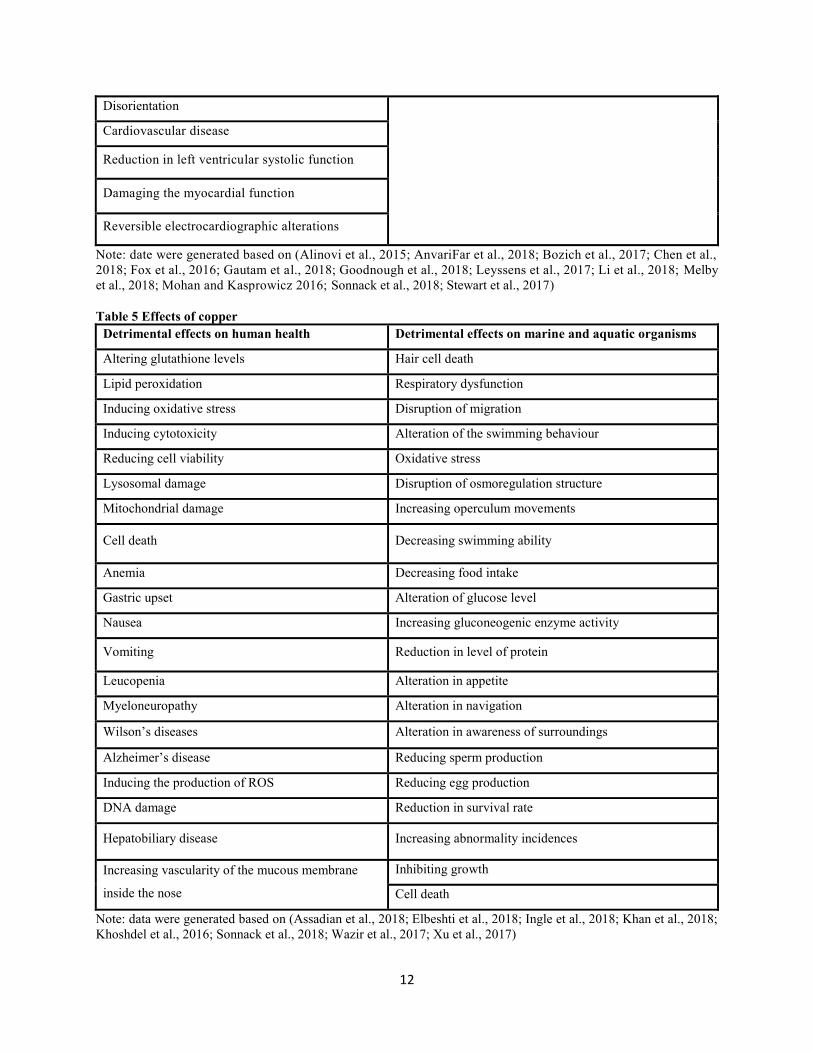
Disorientation
Cardiovascular disease
Reduction in left ventricular systolic function
Damaging the myocardial function
Reversible electrocardiographic alterations
Note: date were generated based on (Alinovi et al., 2015; AnvariFar et al., 2018; Bozich et al., 2017; Chen et al.,
2018; Fox et al., 2016; Gautam et al., 2018; Goodnough et al., 2018; Leyssens et al., 2017; Li et al., 2018; Melby
et al., 2018; Mohan and Kasprowicz 2016; Sonnack et al., 2018; Stewart et al., 2017)
Table 5 Effects of copper
Detrimental effects on human health Detrimental effects on marine and aquatic organisms
Altering glutathione levels Hair cell death
Lipid peroxidation Respiratory dysfunction
Inducing oxidative stress Disruption of migration
Inducing cytotoxicity Alteration of the swimming behaviour
Reducing cell viability Oxidative stress
Lysosomal damage Disruption of osmoregulation structure
Mitochondrial damage Increasing operculum movements
Cell death Decreasing swimming ability
Anemia Decreasing food intake
Gastric upset Alteration of glucose level
Nausea Increasing gluconeogenic enzyme activity
Vomiting Reduction in level of protein
Leucopenia Alteration in appetite
Myeloneuropathy Alteration in navigation
Wilson’s diseases Alteration in awareness of surroundings
Alzheimer’s disease Reducing sperm production
Inducing the production of ROS Reducing egg production
DNA damage Reduction in survival rate
Hepatobiliary disease Increasing abnormality incidences
Increasing vascularity of the mucous membrane
inside the nose
Inhibiting growth
Cell death
Note: data were generated based on (Assadian et al., 2018; Elbeshti et al., 2018; Ingle et al., 2018; Khan et al., 2018;
Khoshdel et al., 2016; Sonnack et al., 2018; Wazir et al., 2017; Xu et al., 2017)
13
Table 6 Effects of lead
Detrimental effects on human health Detrimental effects on marine and aquatic organisms
Neurological disorder Learning disability
Mental retardation Embryonic toxicity
Hypertension Behavioral alteration
Reducing cognitive function Memory deficit
Vascular damage Impairing nervous system functions
Genetic damage Oxidative stress
Brain damage Muscular degeneration and destruction
Red blood cells damage Inhibiting growth
Behavioral changes Cell membrane damage
Learning deficit Lipid peroxidation
Disrupting skeletal hematopoietic function Mortality
Disrupting digestive system Reproductive disorders
Disrupting reproductive system Disturbing the protein metabolism
Renal disease Alteration of the number of genes
Death Alteration of color preference
Colic Reduction in axon length
Anemia Reduction in locomotion
Headache
Inducing overproduction of reactive oxygen species (ROS) Convulsions
Chronic nephritis
Note: data were generated based on (Biswas et al., 2018; Fuentes-Gandara et al., 2018; Green et al., 2018; Hamilton
et al., 2017; Kohzadi et al., 2018; Kumar et al., 2018; Meng et al., 2018; Monastero et al., 2018; Singh et al., 2017;
Yin et al., 2018; Zhong et al., 2018)
Table 7 Effects of mercury
Detrimental effects on human health Detrimental effects on marine and aquatic organisms
Neurodegenerative disorder Central nervous system morbidity
Headache Swim behavior alteration
Memory loss Sensory deficits
Epilepsy Behavioral impairment
Depression Anxiety status alteration
Abrupt burst of anger Decreasing number of optic tectum cells
Abrupt burst of rage Reducing foraging efficiency
Abrupt burst of violence Reducing prey capture speed
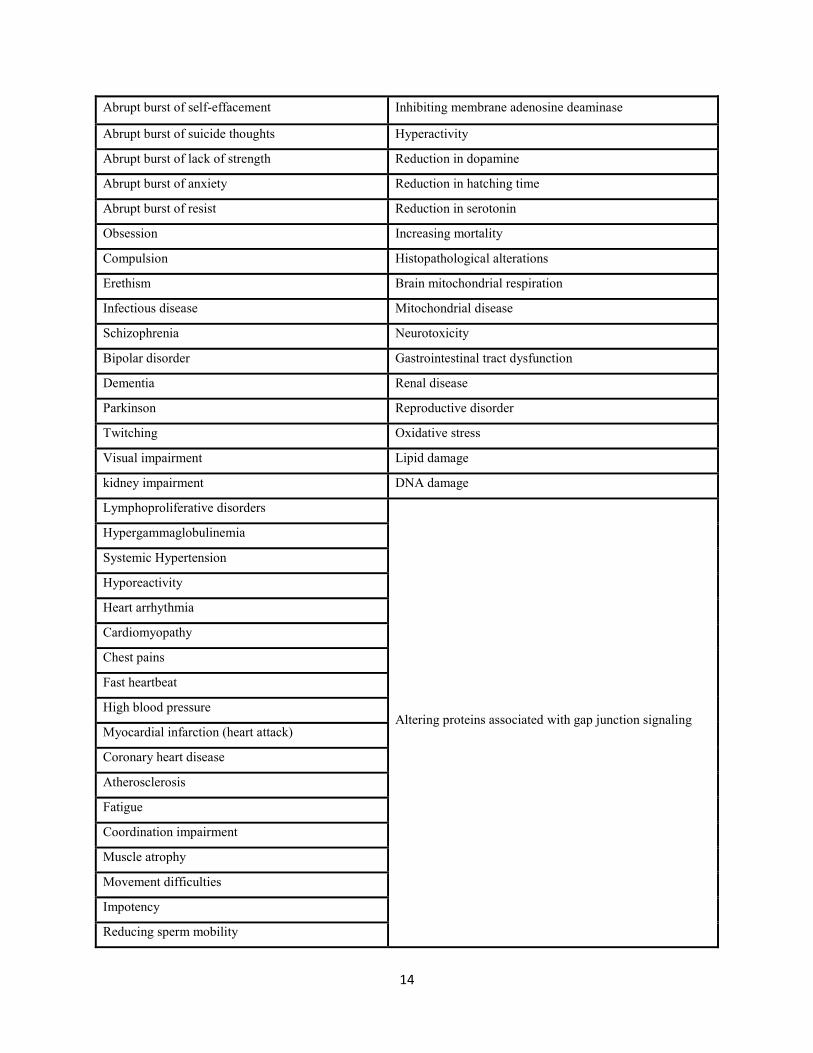
14
Abrupt burst of self-effacement Inhibiting membrane adenosine deaminase
Abrupt burst of suicide thoughts Hyperactivity
Abrupt burst of lack of strength Reduction in dopamine
Abrupt burst of anxiety Reduction in hatching time
Abrupt burst of resist Reduction in serotonin
Obsession Increasing mortality
Compulsion Histopathological alterations
Erethism Brain mitochondrial respiration
Infectious disease Mitochondrial disease
Schizophrenia Neurotoxicity
Bipolar disorder Gastrointestinal tract dysfunction
Dementia Renal disease
Parkinson Reproductive disorder
Twitching Oxidative stress
Visual impairment Lipid damage
kidney impairment DNA damage
Lymphoproliferative disorders
Altering proteins associated with gap junction signaling
Hypergammaglobulinemia
Systemic Hypertension
Hyporeactivity
Heart arrhythmia
Cardiomyopathy
Chest pains
Fast heartbeat
High blood pressure
Myocardial infarction (heart attack)
Coronary heart disease
Atherosclerosis
Fatigue
Coordination impairment
Muscle atrophy
Movement difficulties
Impotency
Reducing sperm mobility
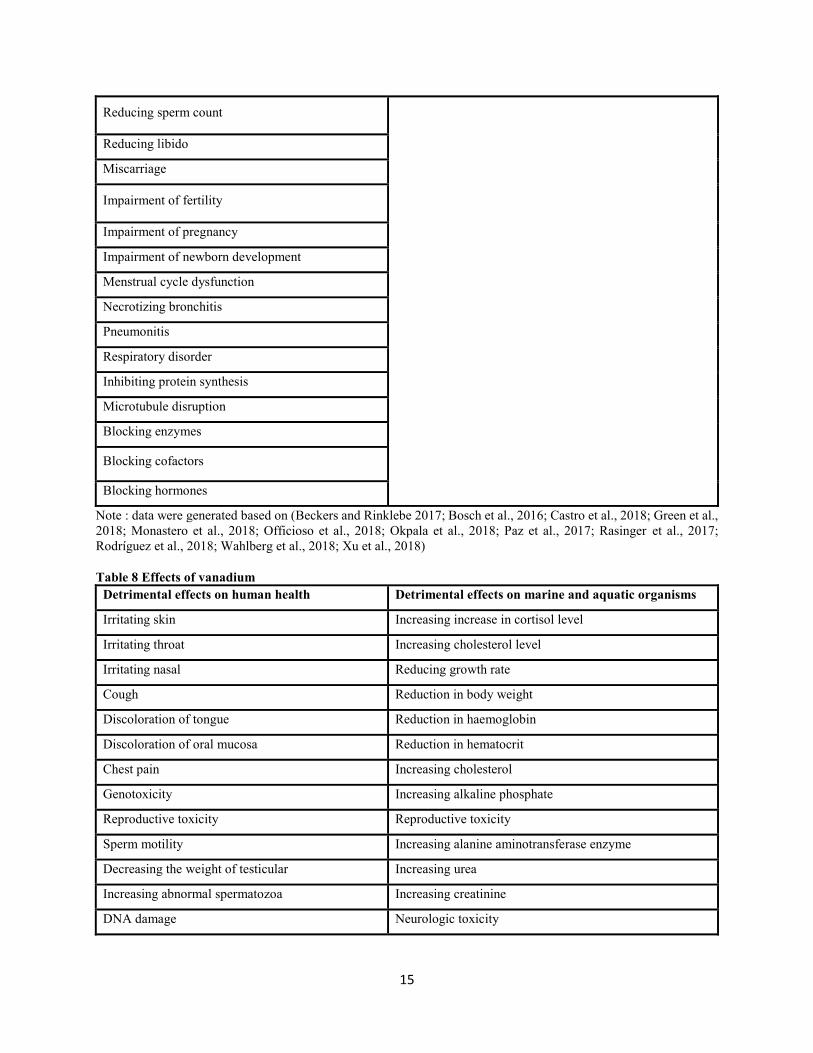
15
Reducing sperm count
Reducing libido
Miscarriage
Impairment of fertility
Impairment of pregnancy
Impairment of newborn development
Menstrual cycle dysfunction
Necrotizing bronchitis
Pneumonitis
Respiratory disorder
Inhibiting protein synthesis
Microtubule disruption
Blocking enzymes
Blocking cofactors
Blocking hormones
Note : data were generated based on (Beckers and Rinklebe 2017; Bosch et al., 2016; Castro et al., 2018; Green et al.,
2018; Monastero et al., 2018; Officioso et al., 2018; Okpala et al., 2018; Paz et al., 2017; Rasinger et al., 2017;
Rodríguez et al., 2018; Wahlberg et al., 2018; Xu et al., 2018)
Table 8 Effects of vanadium
Detrimental effects on human health Detrimental effects on marine and aquatic organisms
Irritating skin Increasing increase in cortisol level
Irritating throat Increasing cholesterol level
Irritating nasal Reducing growth rate
Cough Reduction in body weight
Discoloration of tongue Reduction in haemoglobin
Discoloration of oral mucosa Reduction in hematocrit
Chest pain Increasing cholesterol
Genotoxicity Increasing alkaline phosphate
Reproductive toxicity Reproductive toxicity
Sperm motility Increasing alanine aminotransferase enzyme
Decreasing the weight of testicular Increasing urea
Increasing abnormal spermatozoa Increasing creatinine
DNA damage Neurologic toxicity
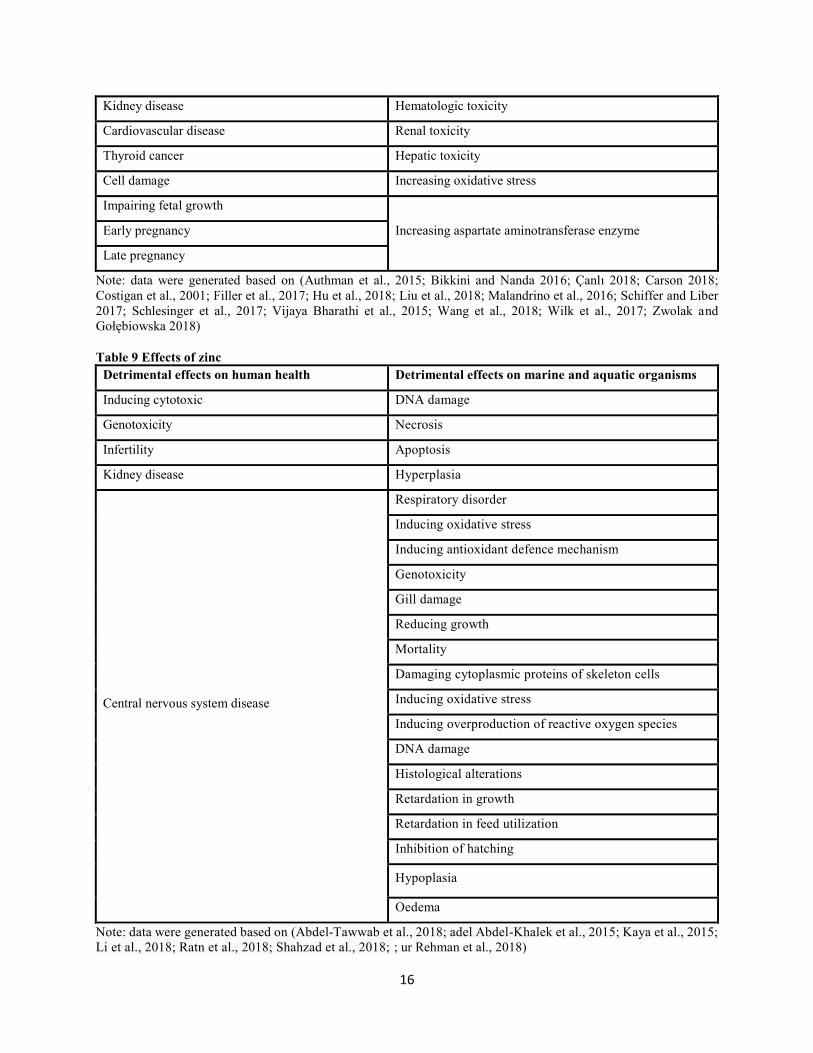
16
Kidney disease Hematologic toxicity
Cardiovascular disease Renal toxicity
Thyroid cancer Hepatic toxicity
Cell damage Increasing oxidative stress
Impairing fetal growth
Increasing aspartate aminotransferase enzyme Early pregnancy
Late pregnancy
Note: data were generated based on (Authman et al., 2015; Bikkini and Nanda 2016; Çanlı 2018; Carson 2018;
Costigan et al., 2001; Filler et al., 2017; Hu et al., 2018; Liu et al., 2018; Malandrino et al., 2016; Schiffer and Liber
2017; Schlesinger et al., 2017; Vijaya Bharathi et al., 2015; Wang et al., 2018; Wilk et al., 2017; Zwolak and
Gołębiowska 2018)
Table 9 Effects of zinc
Detrimental effects on human health Detrimental effects on marine and aquatic organisms
Inducing cytotoxic DNA damage
Genotoxicity Necrosis
Infertility Apoptosis
Kidney disease Hyperplasia
Central nervous system disease
Respiratory disorder
Inducing oxidative stress
Inducing antioxidant defence mechanism
Genotoxicity
Gill damage
Reducing growth
Mortality
Damaging cytoplasmic proteins of skeleton cells
Inducing oxidative stress
Inducing overproduction of reactive oxygen species
DNA damage
Histological alterations
Retardation in growth
Retardation in feed utilization
Inhibition of hatching
Hypoplasia
Oedema
Note: data were generated based on (Abdel‐Tawwab et al., 2018; adel Abdel-Khalek et al., 2015; Kaya et al., 2015;
Li et al., 2018; Ratn et al., 2018; Shahzad et al., 2018; ; ur Rehman et al., 2018)
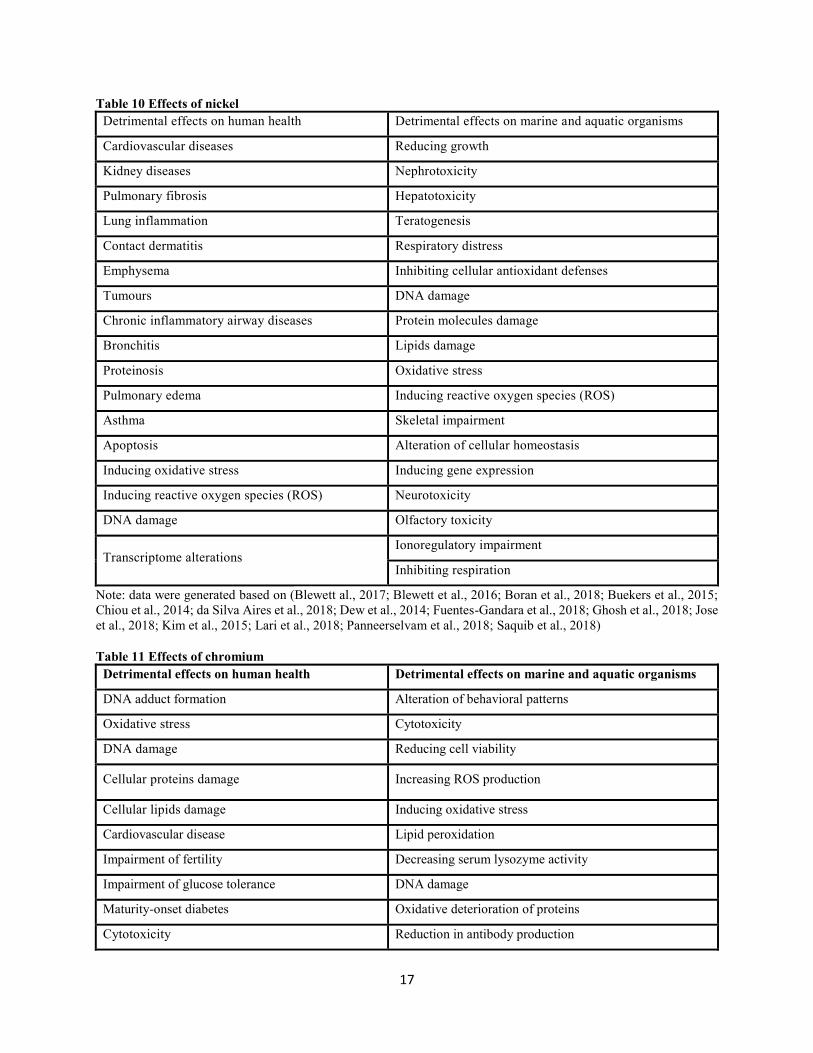
17
Table 10 Effects of nickel
Detrimental effects on human health Detrimental effects on marine and aquatic organisms
Cardiovascular diseases Reducing growth
Kidney diseases Nephrotoxicity
Pulmonary fibrosis Hepatotoxicity
Lung inflammation Teratogenesis
Contact dermatitis Respiratory distress
Emphysema Inhibiting cellular antioxidant defenses
Tumours DNA damage
Chronic inflammatory airway diseases Protein molecules damage
Bronchitis Lipids damage
Proteinosis Oxidative stress
Pulmonary edema Inducing reactive oxygen species (ROS)
Asthma Skeletal impairment
Apoptosis Alteration of cellular homeostasis
Inducing oxidative stress Inducing gene expression
Inducing reactive oxygen species (ROS) Neurotoxicity
DNA damage Olfactory toxicity
Transcriptome alterations Ionoregulatory impairment
Inhibiting respiration
Note: data were generated based on (Blewett al., 2017; Blewett et al., 2016; Boran et al., 2018; Buekers et al., 2015;
Chiou et al., 2014; da Silva Aires et al., 2018; Dew et al., 2014; Fuentes-Gandara et al., 2018; Ghosh et al., 2018; Jose
et al., 2018; Kim et al., 2015; Lari et al., 2018; Panneerselvam et al., 2018; Saquib et al., 2018)
Table 11 Effects of chromium
Detrimental effects on human health Detrimental effects on marine and aquatic organisms
DNA adduct formation Alteration of behavioral patterns
Oxidative stress Cytotoxicity
DNA damage Reducing cell viability
Cellular proteins damage Increasing ROS production
Cellular lipids damage Inducing oxidative stress
Cardiovascular disease Lipid peroxidation
Impairment of fertility Decreasing serum lysozyme activity
Impairment of glucose tolerance DNA damage
Maturity-onset diabetes Oxidative deterioration of proteins
Cytotoxicity Reduction in antibody production
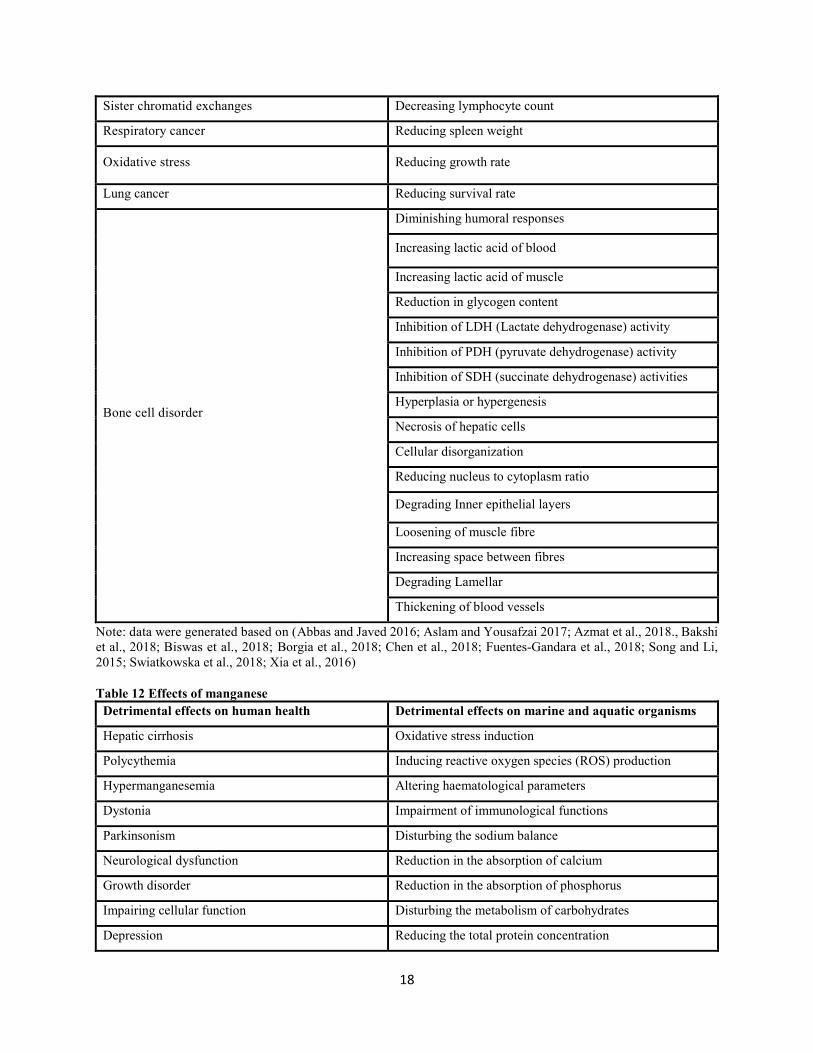
18
Sister chromatid exchanges Decreasing lymphocyte count
Respiratory cancer Reducing spleen weight
Oxidative stress Reducing growth rate
Lung cancer Reducing survival rate
Bone cell disorder
Diminishing humoral responses
Increasing lactic acid of blood
Increasing lactic acid of muscle
Reduction in glycogen content
Inhibition of LDH (Lactate dehydrogenase) activity
Inhibition of PDH (pyruvate dehydrogenase) activity
Inhibition of SDH (succinate dehydrogenase) activities
Hyperplasia or hypergenesis
Necrosis of hepatic cells
Cellular disorganization
Reducing nucleus to cytoplasm ratio
Degrading Inner epithelial layers
Loosening of muscle fibre
Increasing space between fibres
Degrading Lamellar
Thickening of blood vessels
Note: data were generated based on (Abbas and Javed 2016; Aslam and Yousafzai 2017; Azmat et al., 2018., Bakshi
et al., 2018; Biswas et al., 2018; Borgia et al., 2018; Chen et al., 2018; Fuentes-Gandara et al., 2018; Song and Li,
2015; Swiatkowska et al., 2018; Xia et al., 2016)
Table 12 Effects of manganese
Detrimental effects on human health Detrimental effects on marine and aquatic organisms
Hepatic cirrhosis Oxidative stress induction
Polycythemia Inducing reactive oxygen species (ROS) production
Hypermanganesemia Altering haematological parameters
Dystonia Impairment of immunological functions
Parkinsonism Disturbing the sodium balance
Neurological dysfunction Reduction in the absorption of calcium
Growth disorder Reduction in the absorption of phosphorus
Impairing cellular function Disturbing the metabolism of carbohydrates
Depression Reducing the total protein concentration
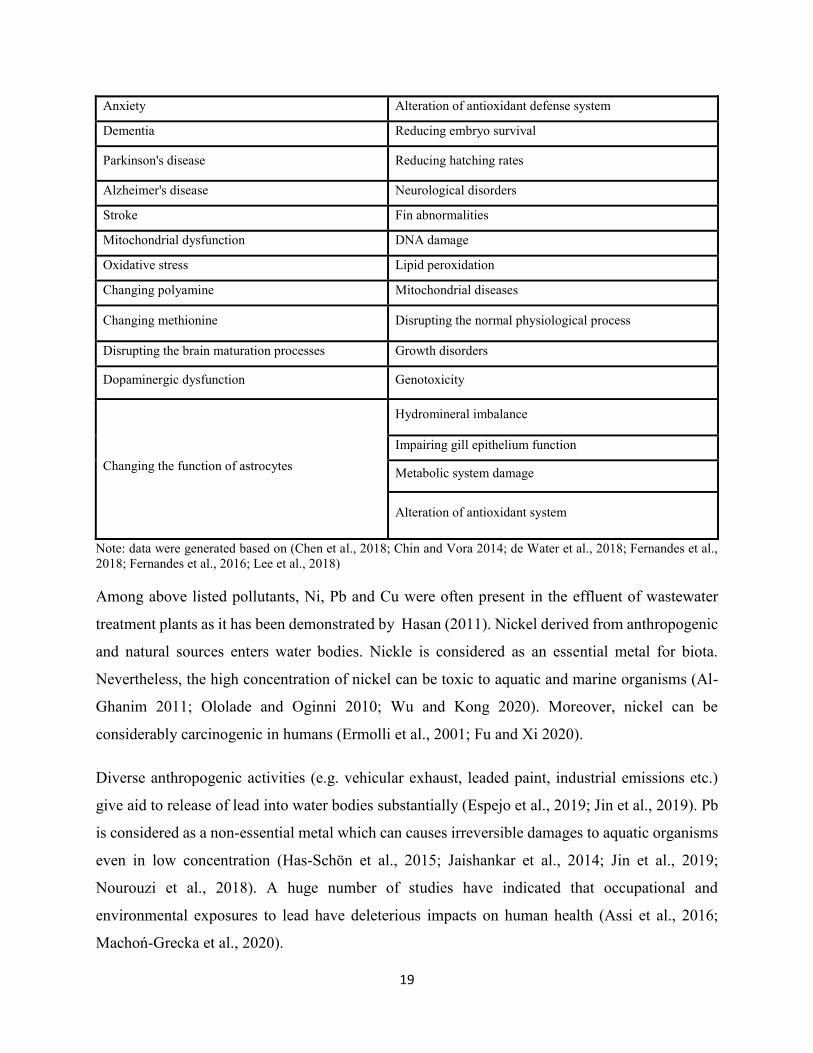
19
Anxiety Alteration of antioxidant defense system
Dementia Reducing embryo survival
Parkinson's disease Reducing hatching rates
Alzheimer's disease Neurological disorders
Stroke Fin abnormalities
Mitochondrial dysfunction DNA damage
Oxidative stress Lipid peroxidation
Changing polyamine Mitochondrial diseases
Changing methionine Disrupting the normal physiological process
Disrupting the brain maturation processes Growth disorders
Dopaminergic dysfunction Genotoxicity
Changing the function of astrocytes
Hydromineral imbalance
Impairing gill epithelium function
Metabolic system damage
Alteration of antioxidant system
Note: data were generated based on (Chen et al., 2018; Chin and Vora 2014; de Water et al., 2018; Fernandes et al.,
2018; Fernandes et al., 2016; Lee et al., 2018)
Among above listed pollutants, Ni, Pb and Cu were often present in the effluent of wastewater
treatment plants as it has been demonstrated by Hasan (2011). Nickel derived from anthropogenic
and natural sources enters water bodies. Nickle is considered as an essential metal for biota.
Nevertheless, the high concentration of nickel can be toxic to aquatic and marine organisms (Al-
Ghanim 2011; Ololade and Oginni 2010; Wu and Kong 2020). Moreover, nickel can be
considerably carcinogenic in humans (Ermolli et al., 2001; Fu and Xi 2020).
Diverse anthropogenic activities (e.g. vehicular exhaust, leaded paint, industrial emissions etc.)
give aid to release of lead into water bodies substantially (Espejo et al., 2019; Jin et al., 2019). Pb
is considered as a non-essential metal which can causes irreversible damages to aquatic organisms
even in low concentration (Has-Schön et al., 2015; Jaishankar et al., 2014; Jin et al., 2019;
Nourouzi et al., 2018). A huge number of studies have indicated that occupational and
environmental exposures to lead have deleterious impacts on human health (Assi et al., 2016;
Machoń-Grecka et al., 2020).
20
Copper finds its way to marine ecosystems because of domestic and industrial activities (Corcoll
et al., 2019; Edosa et al., 2019; Misson et al., 2016). Copper is considered as an essential
micronutrient, whereas it might be toxic to aquatic and marine organisms at exceeded available
levels (Kim et al., 2018; Wang et al., 2020; Zimmer et al., 2012). Copper is one of the first metals
used by humans, while at high concentration might be lethal for living beings (de Namor et al.,
2012; Izah et al., 2016).
2.3. Adsorption process
There are diverse processes including adsorption, biological, filtration, advanced oxidation and
chlorination, as well as the combination of different processes, which can be used for water
purification and wastewater treatment (Abazari 2019; Fang et al., 2018; Liu et al., 2018; Nasseh
et al., 2019; Xu et al., 2018; Zhang et al., 2019b; Zhu et al., 2017; Zhu et al., 2015). Among such
methods, the adsorption process is well-known for simplicity of operation and cost-effectiveness
(Ahmed et al., 2017; Appavu et al., 2018; Mandal et al., 2019; Okoli and Ofomaja, 2019; Tien et
al. 2018).
Adsorption is a process by which an adsorbate moves from the liquid phase to the surface of a
solid across some boundaries (Blair Crawford and Quinn 2017). During such a mass transfer
process liquid-solid intermolecular forces of attraction give aid to some of the solute molecules
from the solution to be concentrated or deposited at the solid surface due to interaction between a
solution containing absorbable solute and a highly porous solid material (Thomas et al. 2018). The
molecule or pollutant adsorbed on the solid surface is defined as an adsorbate, whereas, the surface
on which the process of adsorption takes place is defined as an adsorbent (Rashed 2013).
Moreover, the surface accumulation of pollutants (adsorbate) on the solid surface (adsorbent) can
be referred to as the adsorption process (Tareq et al., 2019).
The degree as to which adsorption occurs can be determined by analyzing the physiochemical
properties of an adsorbate (Apul and Karanfil 2015). Occurring the adsorption process through
chemisorption is far more stable in comparison with physisorption (Das et al., 2018). Physisorption
involves the intermolecular forces and a substantial change in the electronic orbital patterns of the
species, whereas, chemisorption is a chemical process in which a reacting molecule forms a
21
definite chemical bond with an unsaturated atom, or a group of atoms on an adsorbent surface, and
electron transfer is included (Das et al., 2018; Tareq et al., 2019).
Carbon-based materials, clay and minerals, polymeric resins, chitosan and gels etc. have been
utilized as adsorbents (Ahmed and Theydan, 2012; Ashiq et al., 2019; Erşan et al., 2013; Fakhri
and Behrouz, 2015; Wang et al., 2015; Wu et al., 2016; Xing et al., 2016; Yi et al., 2018; Yu et al.,
2016). Carbon-based materials such as activated carbon, biochar etc. have been widely used due
to characteristics including abundant pore structures, high specific surface areas, and tunable
surface functionality (Ashiq et al., 2019; Xiang et al., 2019; Yi et al., 2018). Among such
adsorbents, biochar as a type of carbonaceous material is well-known for adsorption of organic
and inorganic contaminants (Lonappan et al., 2019).
Biochar has exhibited a greater potential for eliminating pollutants from wastewater in comparison
with other adsorbents (activated carbon, clay and minerals etc.) (Deng et al., 2017; Shaheen et al.,
2019). Since biochar contains micro- and/or meso-porous structures, diverse surface functional
groups (carboxylic, hydroxyl etc.), and the stable molecular structure, biochar is considerably
capable of eliminating pollutants from wastewater (Deng et al., 2017; Yargicoglu et al., 2015).
Recently, biochar has received an attention for eliminating pharmaceuticals and heavy metals from
wastewater due to high surface area, large pore volume, plentiful functional groups, and
environmental stability (Beesley et al., 2011; Rosales et al., 2017; Zama et al., 2017). A huge
number of studies utilized different types of biochar in eliminating pollutants (Afzal et al., 2018;
Ahmed et al., 2017b; Ahmed et al., 2017c; Boni et al., 2020; Chen et al., 2018a).
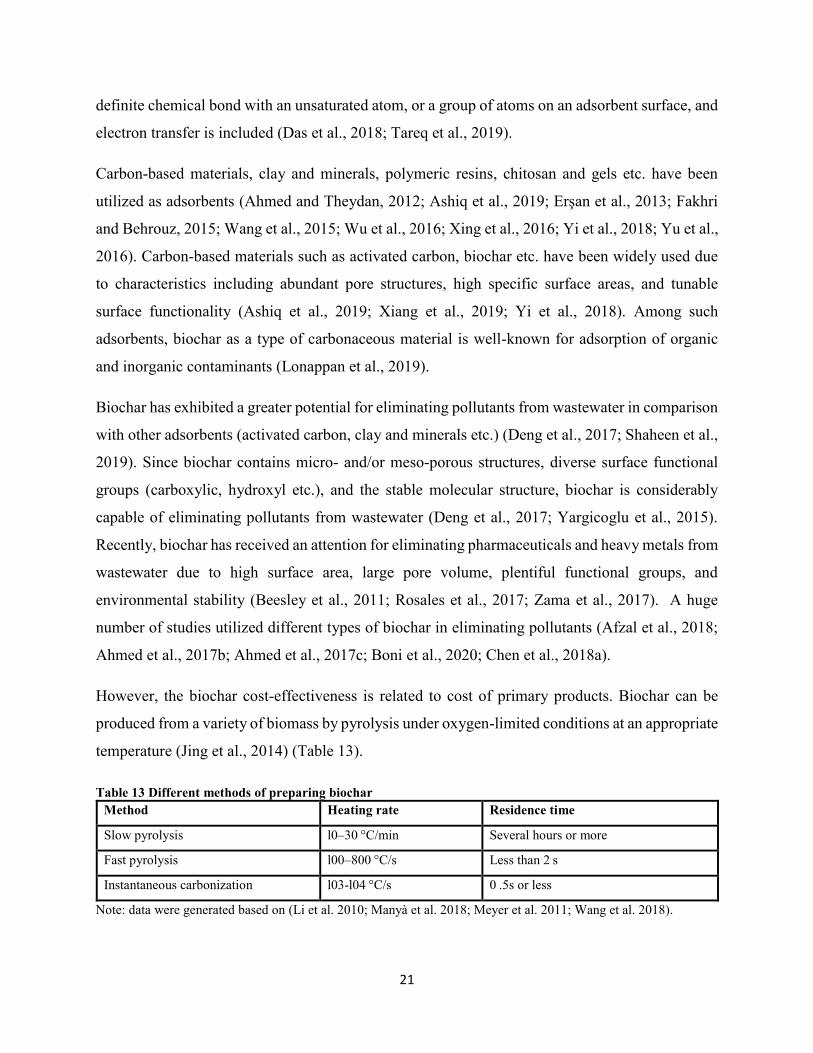
However, the biochar cost-effectiveness is related to cost of primary products. Biochar can be
produced from a variety of biomass by pyrolysis under oxygen-limited conditions at an appropriate
temperature (Jing et al., 2014) (Table 13).
Table 13 Different methods of preparing biochar
Method Heating rate Residence time
Slow pyrolysis l0–30 °C/min Several hours or more
Fast pyrolysis l00–800 °C/s Less than 2 s
Instantaneous carbonization l03-l04 °C/s 0 .5s or less
Note: data were generated based on (Li et al. 2010; Manyà et al. 2018; Meyer et al. 2011; Wang et al. 2018).
22
Pyrolysis is necessary for the chemical decomposition of a carbon-based material by heating (Dai
et al., 2019). Under oxygen-free or limited conditions, biochar can be prepared in different methods
including slow pyrolysis, fast pyrolysis and instantaneous carbonization. Increasing the
temperature in such methods causes the surface area, pore volume and stability of biochar to be on
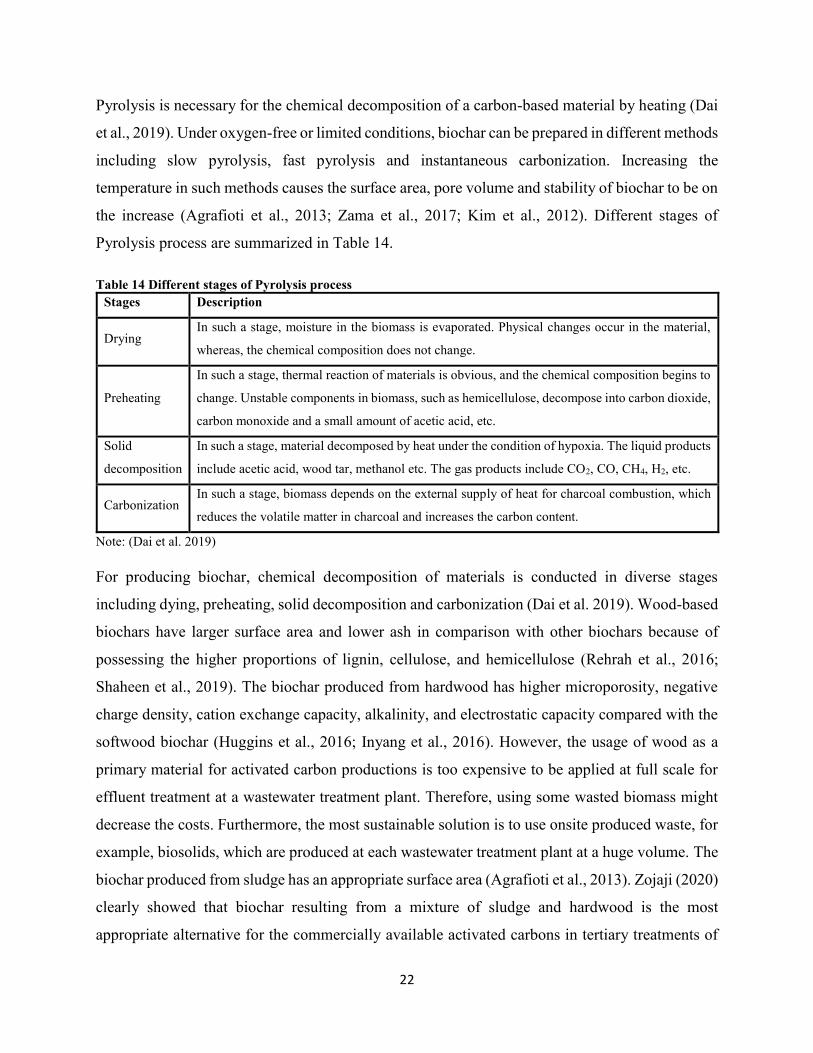
the increase (Agrafioti et al., 2013; Zama et al., 2017; Kim et al., 2012). Different stages of
Pyrolysis process are summarized in Table 14.
Table 14 Different stages of Pyrolysis process
Stages Description
Drying In such a stage, moisture in the biomass is evaporated. Physical changes occur in the material,
whereas, the chemical composition does not change.
Preheating
In such a stage, thermal reaction of materials is obvious, and the chemical composition begins to
change. Unstable components in biomass, such as hemicellulose, decompose into carbon dioxide,
carbon monoxide and a small amount of acetic acid, etc.
Solid
decomposition
In such a stage, material decomposed by heat under the condition of hypoxia. The liquid products
include acetic acid, wood tar, methanol etc. The gas products include CO2, CO, CH4, H2, etc.
Carbonization In such a stage, biomass depends on the external supply of heat for charcoal combustion, which
reduces the volatile matter in charcoal and increases the carbon content.
Note: (Dai et al. 2019)
For producing biochar, chemical decomposition of materials is conducted in diverse stages
including dying, preheating, solid decomposition and carbonization (Dai et al. 2019). Wood-based
biochars have larger surface area and lower ash in comparison with other biochars because of
possessing the higher proportions of lignin, cellulose, and hemicellulose (Rehrah et al., 2016;
Shaheen et al., 2019). The biochar produced from hardwood has higher microporosity, negative
charge density, cation exchange capacity, alkalinity, and electrostatic capacity compared with the
softwood biochar (Huggins et al., 2016; Inyang et al., 2016). However, the usage of wood as a
primary material for activated carbon productions is too expensive to be applied at full scale for
effluent treatment at a wastewater treatment plant. Therefore, using some wasted biomass might
decrease the costs. Furthermore, the most sustainable solution is to use onsite produced waste, for
example, biosolids, which are produced at each wastewater treatment plant at a huge volume. The
biochar produced from sludge has an appropriate surface area (Agrafioti et al., 2013). Zojaji (2020)
clearly showed that biochar resulting from a mixture of sludge and hardwood is the most
appropriate alternative for the commercially available activated carbons in tertiary treatments of
23
the wastewater treatment industry. In the present study, the novel biochar was produced from the
sustainable combination of municipal sludge, hardwood waste and KOH.
Batch and column studies are considered as two ways to adsorption studies. The data gained from
a batch study is limited to the laboratory scale and thus cannot be applied in industrial systems.
Nevertheless, perform column studies play a vital role in providing data for direct applications in
industrial systems. In such an investigation, the performance of the fixed-bed column was studied.
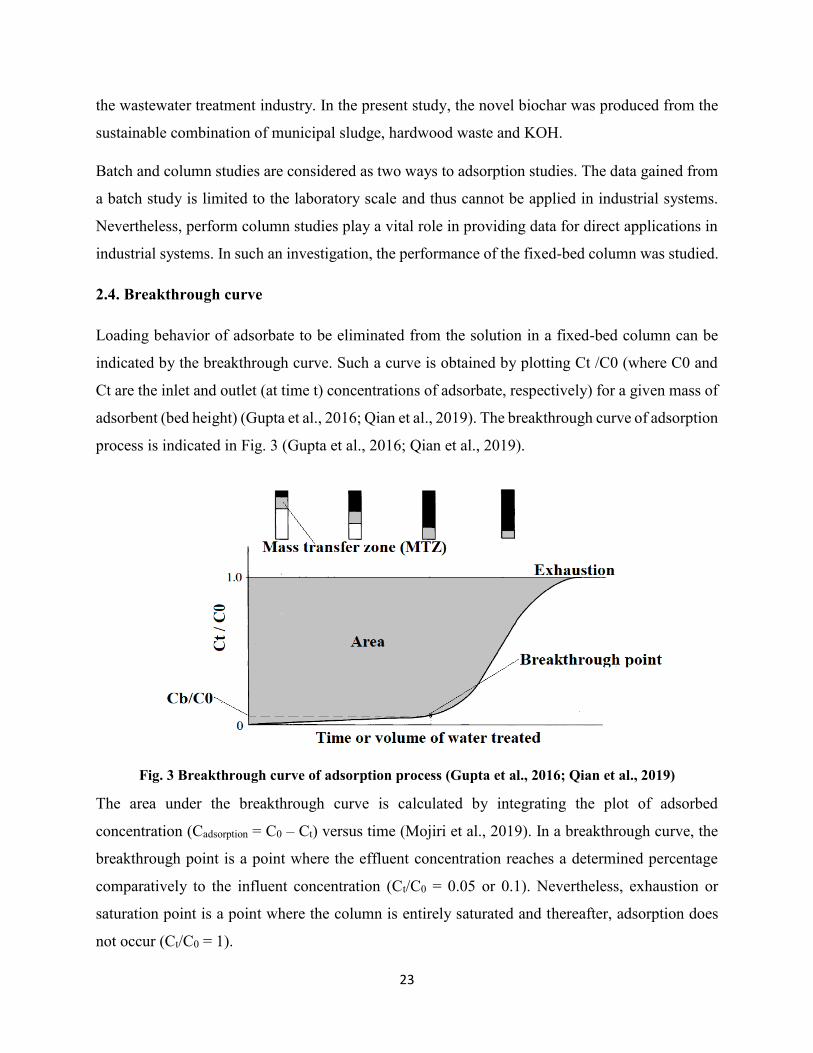
2.4. Breakthrough curve
Loading behavior of adsorbate to be eliminated from the solution in a fixed-bed column can be
indicated by the breakthrough curve. Such a curve is obtained by plotting Ct /C0 (where C0 and
Ct are the inlet and outlet (at time t) concentrations of adsorbate, respectively) for a given mass of
adsorbent (bed height) (Gupta et al., 2016; Qian et al., 2019). The breakthrough curve of adsorption
process is indicated in Fig. 3 (Gupta et al., 2016; Qian et al., 2019).
Fig. 3 Breakthrough curve of adsorption process (Gupta et al., 2016; Qian et al., 2019)
The area under the breakthrough curve is calculated by integrating the plot of adsorbed
concentration (Cadsorption = C0 – Ct) versus time (Mojiri et al., 2019). In a breakthrough curve, the
breakthrough point is a point where the effluent concentration reaches a determined percentage
comparatively to the influent concentration (Ct/C0 = 0.05 or 0.1). Nevertheless, exhaustion or
saturation point is a point where the column is entirely saturated and thereafter, adsorption does
not occur (Ct/C0 = 1).
24
The volume within the adsorbent bed where adsorption takes place is defined as mass transfer zone
(MTZ) (Beji et al., 2018; Mojiri et al., 2019; Shahid et al., 2019). MTZ starts moving down the
column when adsorbent becomes exhausted (Nidheesh et al., 2013). At V = V1 or t = t1, a small
portion of the adsorbent at the top is exhausted (dark shading) and MTZ (light shading) is near the
top of the column due to low concentration of effluent. At breakthrough point (V = Vb, t = tb and
C = Cb), MTZ reaches the bottom of the fixed-bed column.
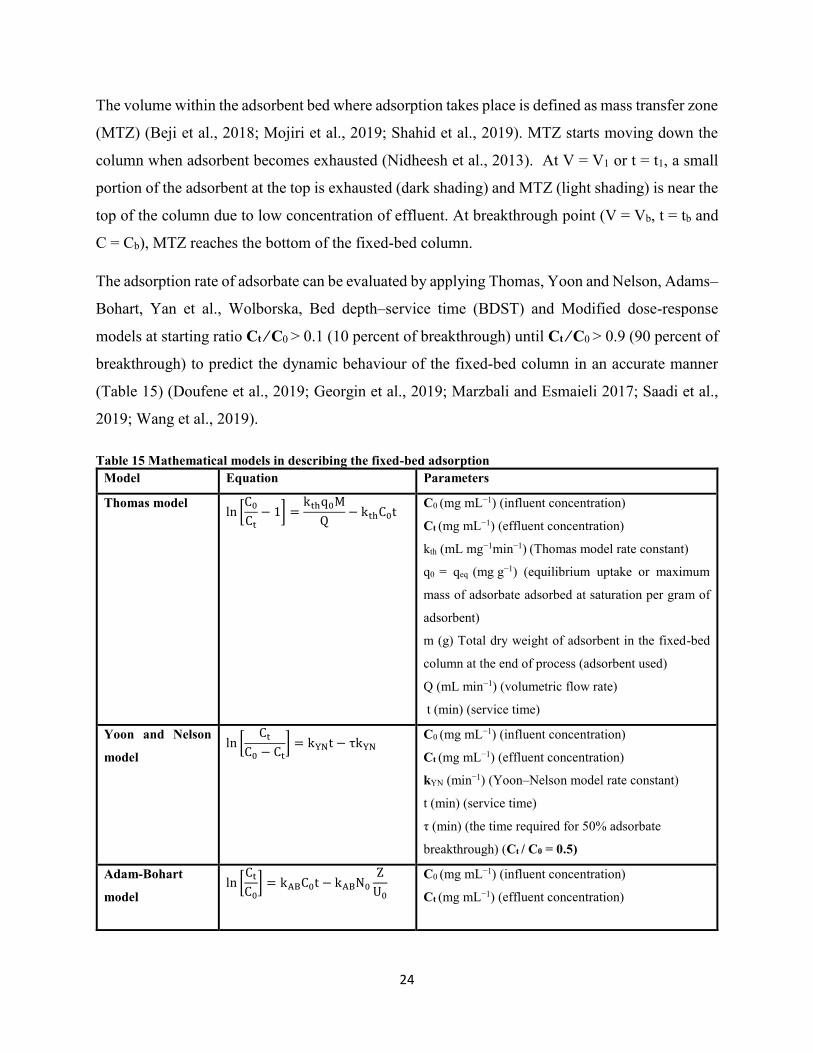
The adsorption rate of adsorbate can be evaluated by applying Thomas, Yoon and Nelson, Adams–
Bohart, Yan et al., Wolborska, Bed depth–service time (BDST) and Modified dose-response
models at starting ratio Ct / C0 > 0.1 (10 percent of breakthrough) until Ct / C0 > 0.9 (90 percent of
breakthrough) to predict the dynamic behaviour of the fixed-bed column in an accurate manner
(Table 15) (Doufene et al., 2019; Georgin et al., 2019; Marzbali and Esmaieli 2017; Saadi et al.,
2019; Wang et al., 2019).
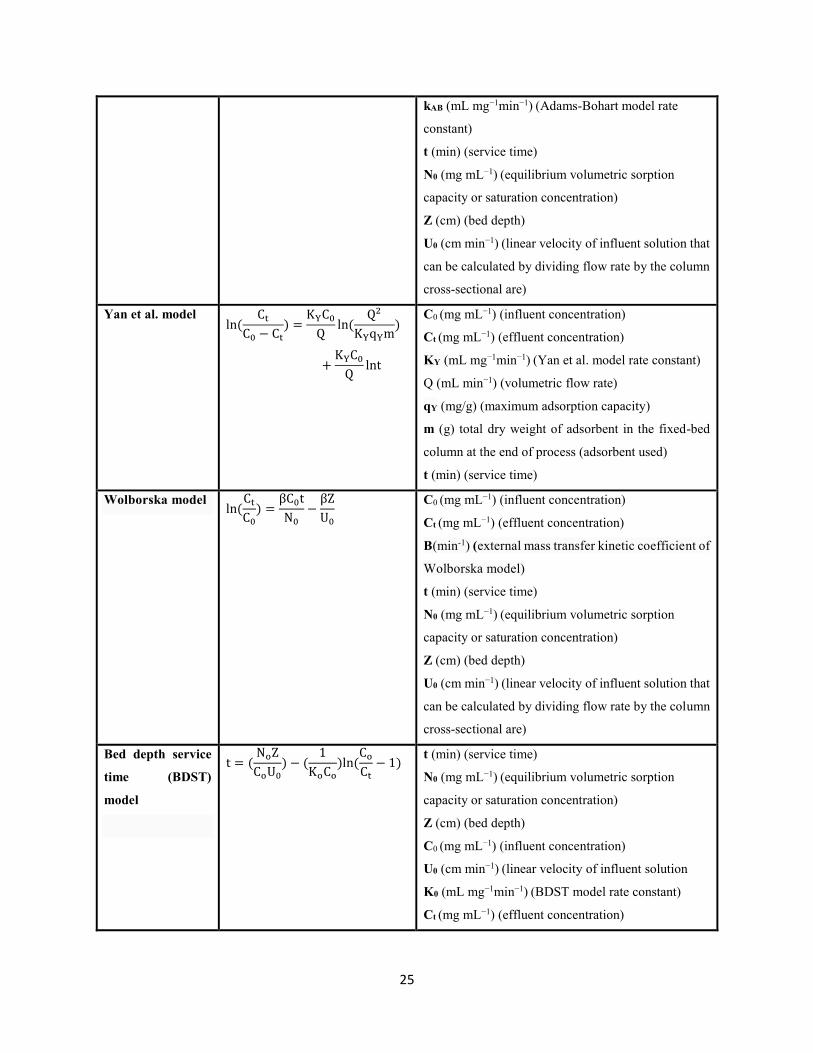
Table 15 Mathematical models in describing the fixed-bed adsorption
Model Equation Parameters
Thomas model
ln [
C0Ct− 1] =
kthq0M
Q− kthC0t
C0 (mg mL−1) (influent concentration)
Ct (mg mL−1) (effluent concentration)
kth (mL mg−1min−1) (Thomas model rate constant)
q0 = qeq (mg g−1) (equilibrium uptake or maximum
mass of adsorbate adsorbed at saturation per gram of
adsorbent)
m (g) Total dry weight of adsorbent in the fixed-bed
column at the end of process (adsorbent used)
Q (mL min−1) (volumetric flow rate)
t (min) (service time)
Yoon and Nelson
model ln [
CtC0 − Ct
] = kYNt − τkYN
C0 (mg mL−1) (influent concentration)
Ct (mg mL−1) (effluent concentration)
kYN (min−1) (Yoon–Nelson model rate constant)
t (min) (service time)
τ (min) (the time required for 50% adsorbate
breakthrough) (Ct / C0 = 0.5)
Adam-Bohart
model ln [
CtC0] = kABC0t − kABN0
Z
U0
C0 (mg mL−1) (influent concentration)
Ct (mg mL−1) (effluent concentration)
25
kAB (mL mg−1min−1) (Adams-Bohart model rate
constant)
t (min) (service time)
N0 (mg mL−1) (equilibrium volumetric sorption
capacity or saturation concentration)
Z (cm) (bed depth)
U0 (cm min−1) (linear velocity of influent solution that
can be calculated by dividing flow rate by the column
cross-sectional are)
Yan et al. model
ln(
CtC0 − Ct
) =KYC0Q
ln(Q2
KYqYm)
+KYC0Q
lnt
C0 (mg mL−1) (influent concentration)
Ct (mg mL−1) (effluent concentration)
KY (mL mg−1min−1) (Yan et al. model rate constant)
Q (mL min−1) (volumetric flow rate)
qY (mg/g) (maximum adsorption capacity)
m (g) total dry weight of adsorbent in the fixed-bed
column at the end of process (adsorbent used)
t (min) (service time)
Wolborska model
ln(CtC0) =
βC0t
N0
−βZ
U0
C0 (mg mL−1) (influent concentration)
Ct (mg mL−1) (effluent concentration)
Β(min-1) (external mass transfer kinetic coefficient of
Wolborska model)
t (min) (service time)
N0 (mg mL−1) (equilibrium volumetric sorption
capacity or saturation concentration)
Z (cm) (bed depth)
U0 (cm min−1) (linear velocity of influent solution that
can be calculated by dividing flow rate by the column
cross-sectional are)
Bed depth service
time (BDST)
model
t = (NoZ
CoU0) − (
1
KoCo)ln(
CoCt
− 1)
t (min) (service time)
N0 (mg mL−1) (equilibrium volumetric sorption
capacity or saturation concentration)
Z (cm) (bed depth)
C0 (mg mL−1) (influent concentration)
U0 (cm min−1) (linear velocity of influent solution
K0 (mL mg−1min−1) (BDST model rate constant)
Ct (mg mL−1) (effluent concentration)
26
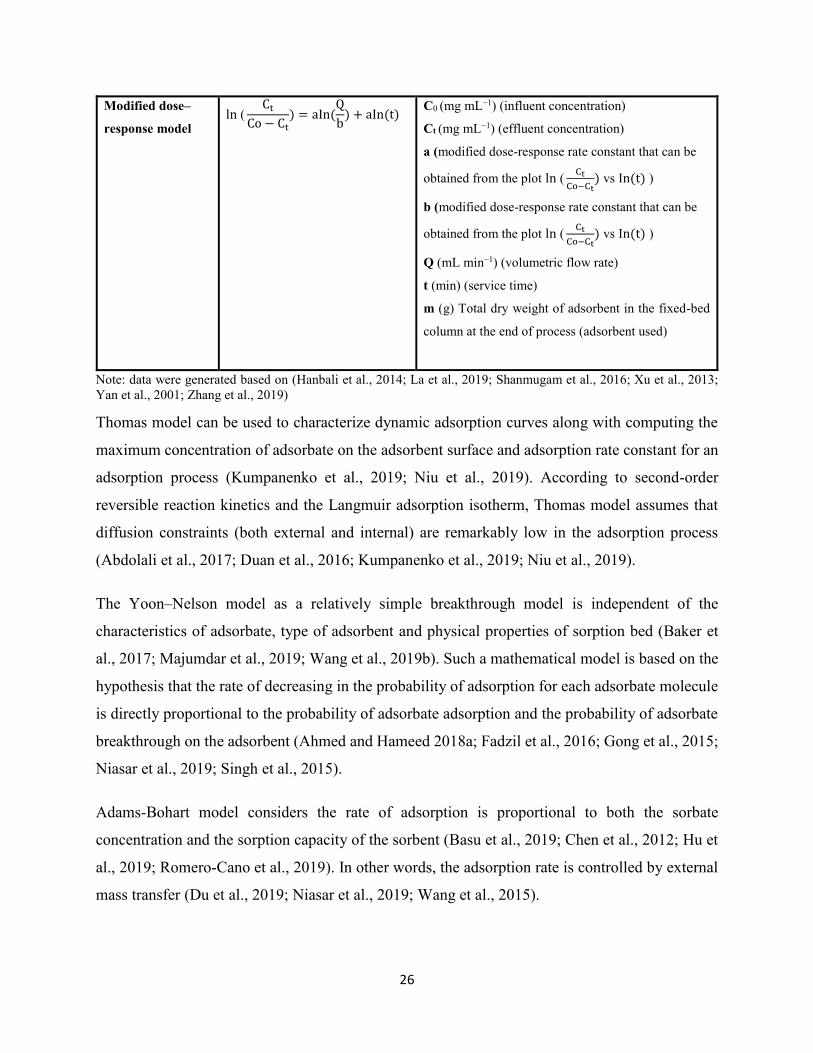
Modified dose–
response model
ln (Ct
Co − Ct) = aIn(
Q
b) + aIn(t)
C0 (mg mL−1) (influent concentration)
Ct (mg mL−1) (effluent concentration)
a (modified dose-response rate constant that can be
obtained from the plot ln (Ct
Co−Ct) vs In(t) )
b (modified dose-response rate constant that can be
obtained from the plot ln (Ct
Co−Ct) vs In(t) )
Q (mL min−1) (volumetric flow rate)
t (min) (service time)
m (g) Total dry weight of adsorbent in the fixed-bed
column at the end of process (adsorbent used)
Note: data were generated based on (Hanbali et al., 2014; La et al., 2019; Shanmugam et al., 2016; Xu et al., 2013;
Yan et al., 2001; Zhang et al., 2019)
Thomas model can be used to characterize dynamic adsorption curves along with computing the
maximum concentration of adsorbate on the adsorbent surface and adsorption rate constant for an
adsorption process (Kumpanenko et al., 2019; Niu et al., 2019). According to second-order
reversible reaction kinetics and the Langmuir adsorption isotherm, Thomas model assumes that
diffusion constraints (both external and internal) are remarkably low in the adsorption process
(Abdolali et al., 2017; Duan et al., 2016; Kumpanenko et al., 2019; Niu et al., 2019).
The Yoon–Nelson model as a relatively simple breakthrough model is independent of the
characteristics of adsorbate, type of adsorbent and physical properties of sorption bed (Baker et
al., 2017; Majumdar et al., 2019; Wang et al., 2019b). Such a mathematical model is based on the
hypothesis that the rate of decreasing in the probability of adsorption for each adsorbate molecule
is directly proportional to the probability of adsorbate adsorption and the probability of adsorbate
breakthrough on the adsorbent (Ahmed and Hameed 2018a; Fadzil et al., 2016; Gong et al., 2015;
Niasar et al., 2019; Singh et al., 2015).
Adams-Bohart model considers the rate of adsorption is proportional to both the sorbate
concentration and the sorption capacity of the sorbent (Basu et al., 2019; Chen et al., 2012; Hu et
al., 2019; Romero‐Cano et al., 2019). In other words, the adsorption rate is controlled by external
mass transfer (Du et al., 2019; Niasar et al., 2019; Wang et al., 2015).
27
The erroneous of Thomas model in predicting the effluent concentration at time zero can be
eradicated by Yan et al. model (de Franco et al., 2017; Hadavifar et al., 2014; Liu et al., 2019; Su
et al., 2012; Wu et al., 2010). The quantity adsorbed cannot be predicted by Yan et al. model.
The Wolborska model has some similarities with Adams–Boharts model and considers mass
transfer phenomenon for the inner diffusion mechanism at low concentration range of influents
(Lau et al., 2016; Mitra et al., 2019; Nag et al., 2019). The first period of the breakthrough curve
can be described by Wolborska model in an accurate manner (Alalwan et al., 2019; Swapna Priya
and Radha 2016; Ye et al., 2019).
Bed depth service time (BDST) model as an empirical model can be used to predict the relationship
between bed height (Z, cm) and service time (t, h), in terms of process concentrations and
adsorption parameters (Brassesco et al., 2019; Dabbagh et al., 2019; Jain et al., 2013; Zulfadhly et
al., 2001). In such a model, the rate of adsorption is properly controlled by the surface reaction
between adsorbate and the residual capacity of the adsorbent (Igberase and Osifo 2019; Jang et al.,
2018; Metwally et al., 2019). The deficiencies of the Thomas model can be overcome using the
modified dose-response model to predict the breakthrough curve at higher and lower periods
(Banerjee et al., 2019; Palágyi 2019; Shanmugam et al., 2016; Yan et al., 2001). In the present
study, adsorption of pharmaceuticals on biochar in a fixed-bed column has been investigated.

Chapter 3: Methods and Materials
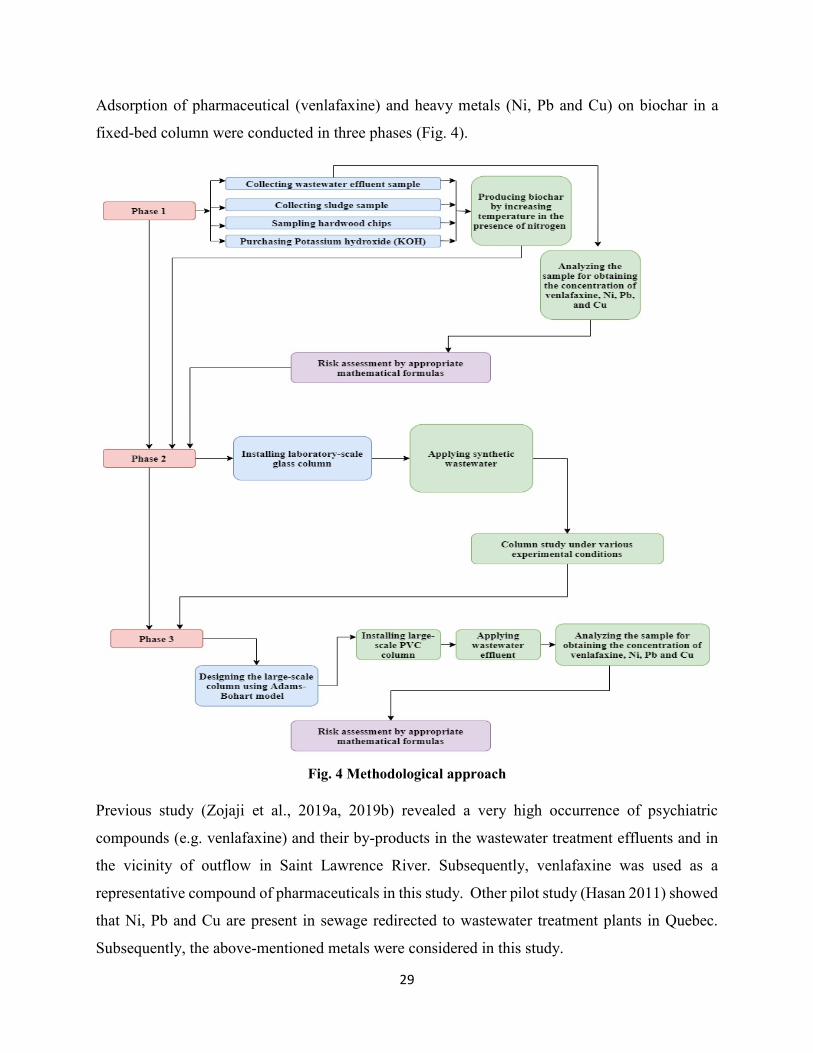
29
Adsorption of pharmaceutical (venlafaxine) and heavy metals (Ni, Pb and Cu) on biochar in a
fixed-bed column were conducted in three phases (Fig. 4).
Fig. 4 Methodological approach
Previous study (Zojaji et al., 2019a, 2019b) revealed a very high occurrence of psychiatric
compounds (e.g. venlafaxine) and their by-products in the wastewater treatment effluents and in
the vicinity of outflow in Saint Lawrence River. Subsequently, venlafaxine was used as a
representative compound of pharmaceuticals in this study. Other pilot study (Hasan 2011) showed
that Ni, Pb and Cu are present in sewage redirected to wastewater treatment plants in Quebec.
Subsequently, the above-mentioned metals were considered in this study.
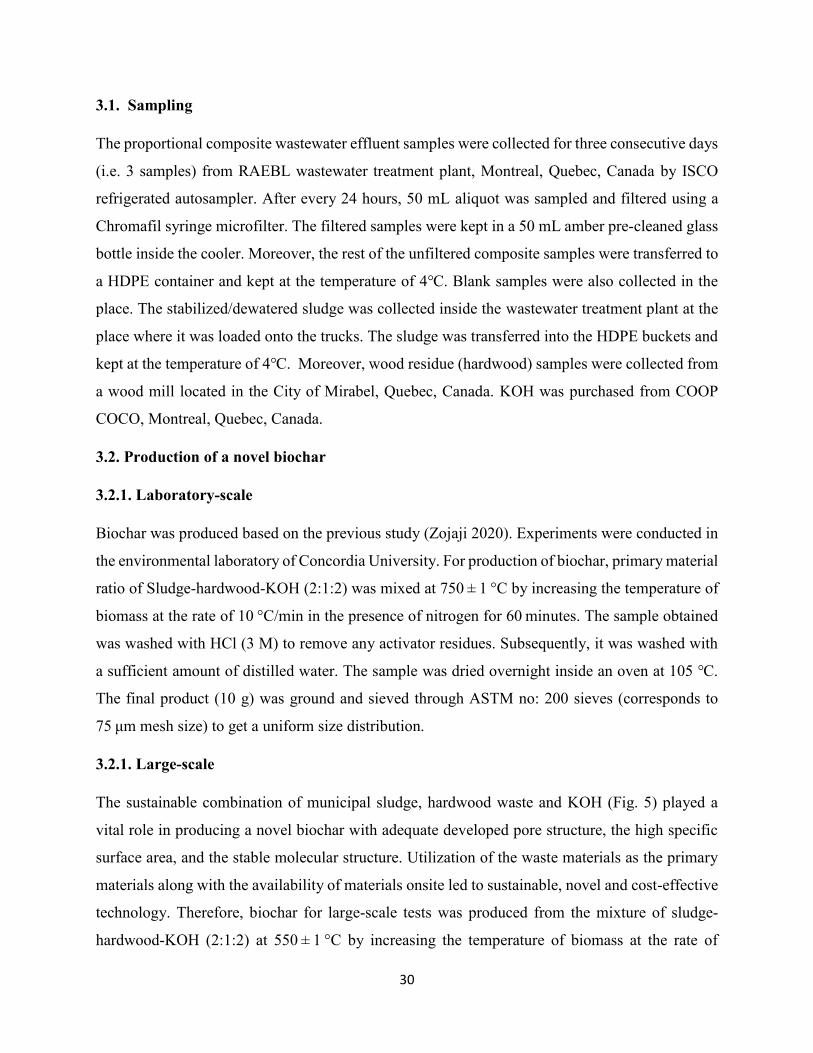
30
3.1. Sampling
The proportional composite wastewater effluent samples were collected for three consecutive days
(i.e. 3 samples) from RAEBL wastewater treatment plant, Montreal, Quebec, Canada by ISCO
refrigerated autosampler. After every 24 hours, 50 mL aliquot was sampled and filtered using a
Chromafil syringe microfilter. The filtered samples were kept in a 50 mL amber pre-cleaned glass
bottle inside the cooler. Moreover, the rest of the unfiltered composite samples were transferred to
a HDPE container and kept at the temperature of 4℃. Blank samples were also collected in the
place. The stabilized/dewatered sludge was collected inside the wastewater treatment plant at the
place where it was loaded onto the trucks. The sludge was transferred into the HDPE buckets and
kept at the temperature of 4℃. Moreover, wood residue (hardwood) samples were collected from
a wood mill located in the City of Mirabel, Quebec, Canada. KOH was purchased from COOP
COCO, Montreal, Quebec, Canada.
3.2. Production of a novel biochar
3.2.1. Laboratory-scale
Biochar was produced based on the previous study (Zojaji 2020). Experiments were conducted in
the environmental laboratory of Concordia University. For production of biochar, primary material
ratio of Sludge-hardwood-KOH (2:1:2) was mixed at 750 ± 1 °C by increasing the temperature of
biomass at the rate of 10 °C/min in the presence of nitrogen for 60 minutes. The sample obtained
was washed with HCl (3 M) to remove any activator residues. Subsequently, it was washed with
a sufficient amount of distilled water. The sample was dried overnight inside an oven at 105 ℃.
The final product (10 g) was ground and sieved through ASTM no: 200 sieves (corresponds to
75 μm mesh size) to get a uniform size distribution.
3.2.1. Large-scale
The sustainable combination of municipal sludge, hardwood waste and KOH (Fig. 5) played a
vital role in producing a novel biochar with adequate developed pore structure, the high specific
surface area, and the stable molecular structure. Utilization of the waste materials as the primary
materials along with the availability of materials onsite led to sustainable, novel and cost-effective
technology. Therefore, biochar for large-scale tests was produced from the mixture of sludge-
hardwood-KOH (2:1:2) at 550 ± 1 °C by increasing the temperature of biomass at the rate of
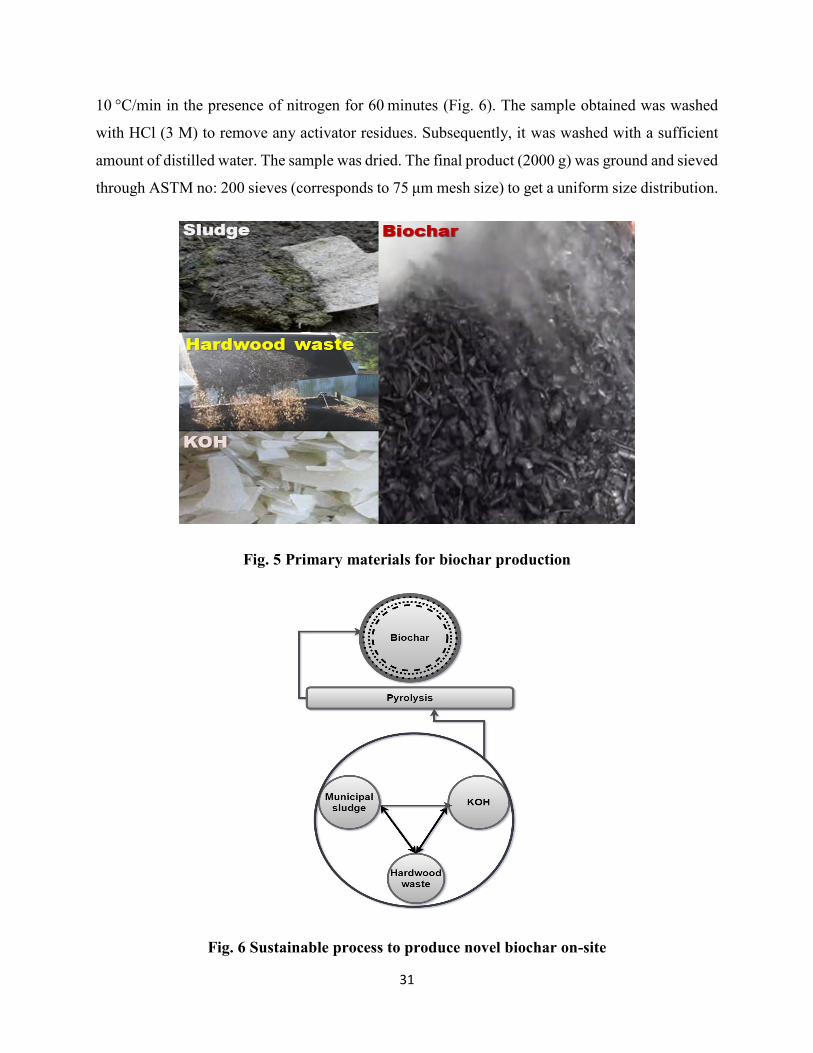
31
10 °C/min in the presence of nitrogen for 60 minutes (Fig. 6). The sample obtained was washed
with HCl (3 M) to remove any activator residues. Subsequently, it was washed with a sufficient
amount of distilled water. The sample was dried. The final product (2000 g) was ground and sieved
through ASTM no: 200 sieves (corresponds to 75 μm mesh size) to get a uniform size distribution.
Fig. 5 Primary materials for biochar production
Fig. 6 Sustainable process to produce novel biochar on-site
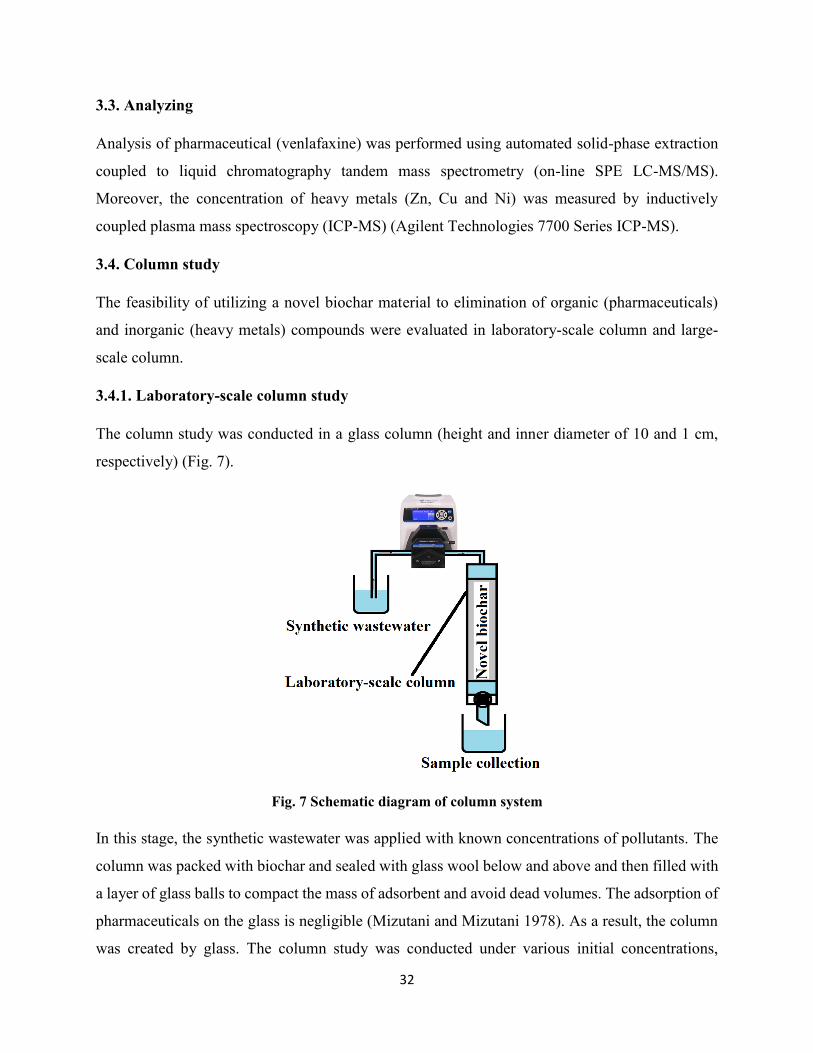
32
3.3. Analyzing
Analysis of pharmaceutical (venlafaxine) was performed using automated solid-phase extraction
coupled to liquid chromatography tandem mass spectrometry (on-line SPE LC-MS/MS).
Moreover, the concentration of heavy metals (Zn, Cu and Ni) was measured by inductively
coupled plasma mass spectroscopy (ICP-MS) (Agilent Technologies 7700 Series ICP-MS).
3.4. Column study
The feasibility of utilizing a novel biochar material to elimination of organic (pharmaceuticals)
and inorganic (heavy metals) compounds were evaluated in laboratory-scale column and large-
scale column.
3.4.1. Laboratory-scale column study
The column study was conducted in a glass column (height and inner diameter of 10 and 1 cm,
respectively) (Fig. 7).
Fig. 7 Schematic diagram of column system
In this stage, the synthetic wastewater was applied with known concentrations of pollutants. The
column was packed with biochar and sealed with glass wool below and above and then filled with
a layer of glass balls to compact the mass of adsorbent and avoid dead volumes. The adsorption of
pharmaceuticals on the glass is negligible (Mizutani and Mizutani 1978). As a result, the column
was created by glass. The column study was conducted under various initial concentrations,
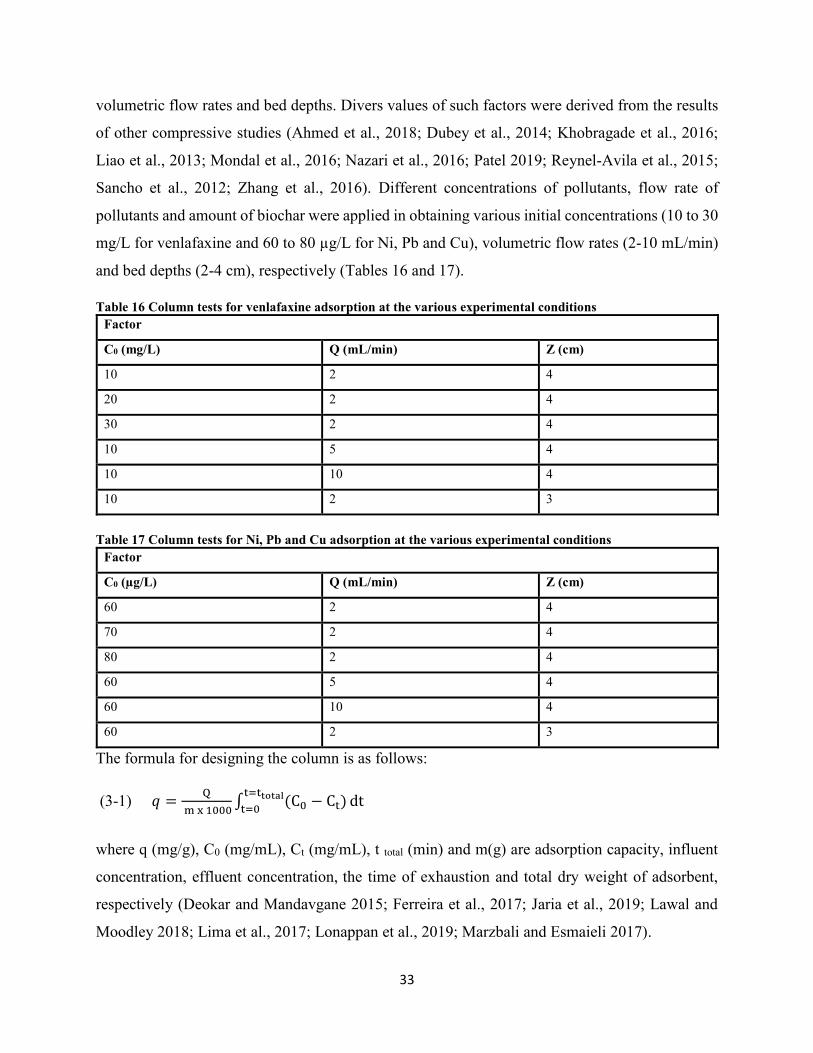
33
volumetric flow rates and bed depths. Divers values of such factors were derived from the results
of other compressive studies (Ahmed et al., 2018; Dubey et al., 2014; Khobragade et al., 2016;
Liao et al., 2013; Mondal et al., 2016; Nazari et al., 2016; Patel 2019; Reynel-Avila et al., 2015;
Sancho et al., 2012; Zhang et al., 2016). Different concentrations of pollutants, flow rate of
pollutants and amount of biochar were applied in obtaining various initial concentrations (10 to 30
mg/L for venlafaxine and 60 to 80 µg/L for Ni, Pb and Cu), volumetric flow rates (2-10 mL/min)
and bed depths (2-4 cm), respectively (Tables 16 and 17).
Table 16 Column tests for venlafaxine adsorption at the various experimental conditions
Factor
C0 (mg/L) Q (mL/min) Z (cm)
10 2 4
20 2 4
30 2 4
10 5 4
10 10 4
10 2 3
Table 17 Column tests for Ni, Pb and Cu adsorption at the various experimental conditions
Factor
C0 (µg/L) Q (mL/min) Z (cm)
60 2 4
70 2 4
80 2 4
60 5 4
60 10 4
60 2 3
The formula for designing the column is as follows:
(3-1) 𝑞 =Q
mx1000∫ (C0 − Ct)t=ttotalt=0
dt
where q (mg/g), C0 (mg/mL), Ct (mg/mL), t total (min) and m(g) are adsorption capacity, influent
concentration, effluent concentration, the time of exhaustion and total dry weight of adsorbent,
respectively (Deokar and Mandavgane 2015; Ferreira et al., 2017; Jaria et al., 2019; Lawal and
Moodley 2018; Lima et al., 2017; Lonappan et al., 2019; Marzbali and Esmaieli 2017).
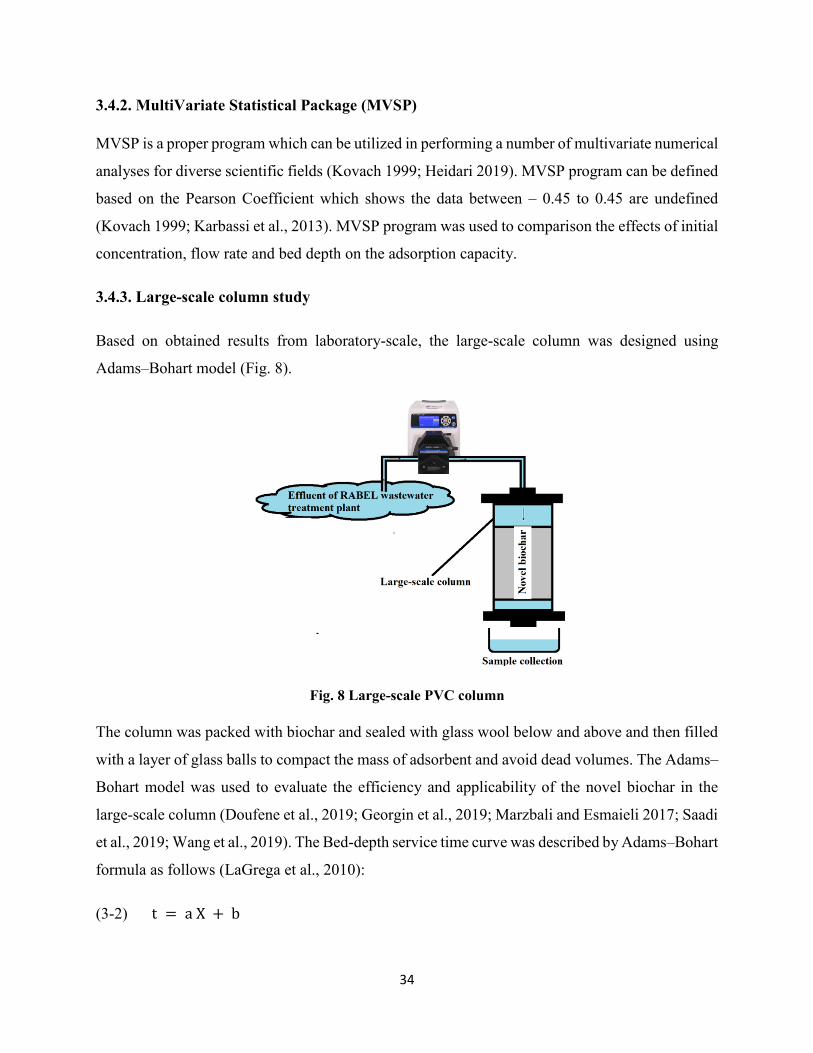
34
3.4.2. MultiVariate Statistical Package (MVSP)
MVSP is a proper program which can be utilized in performing a number of multivariate numerical
analyses for diverse scientific fields (Kovach 1999; Heidari 2019). MVSP program can be defined
based on the Pearson Coefficient which shows the data between – 0.45 to 0.45 are undefined
(Kovach 1999; Karbassi et al., 2013). MVSP program was used to comparison the effects of initial
concentration, flow rate and bed depth on the adsorption capacity.
3.4.3. Large-scale column study
Based on obtained results from laboratory-scale, the large-scale column was designed using
Adams–Bohart model (Fig. 8).
Fig. 8 Large-scale PVC column
The column was packed with biochar and sealed with glass wool below and above and then filled
with a layer of glass balls to compact the mass of adsorbent and avoid dead volumes. The Adams–
Bohart model was used to evaluate the efficiency and applicability of the novel biochar in the
large-scale column (Doufene et al., 2019; Georgin et al., 2019; Marzbali and Esmaieli 2017; Saadi
et al., 2019; Wang et al., 2019). The Bed-depth service time curve was described by Adams–Bohart
formula as follows (LaGrega et al., 2010):
(3-2) t = aX + b
35
where X = depth in column (m)
(3-3) a =F1𝑁
Cin𝑉
where a = slope (h/m)
F1 = conversion factor for units = 103 for metric units
N = adsorptive capacity of adsorbent (mass of contaminant removed per volume of adsorbent in
the column, kg/m3)
Cin = influent contaminant concentration (mg/L)
V = superficial velocity through column (m/h) (m3/h per m2 of column)
(3-4) b = (F2/KCin)XIn[(Cn/Cout) − 1]
where b = intercept (h)
F2 = conversion factor = 103 for metric units
K = adsorption rate constant required to move an adsorption zone through the critical depth [m3 /
(kg. h)] (m3 of liquid treated per kg impurity fed per hour)
Cout = contaminant concentration at breakthrough (mg / L)
The rate of adsorbent utilization can be determined by using this velocity:
(3-5) Adsorbentutilization = areax(l/a)xunitweight
where a = slope (h/m)
3.5. Risk assessment
Based on the obtained concentration of pollutants in wastewater effluent before and after utilizing
large-scale column, risk assessment can be calculated in identifying the pollution intensity of
pollutants.
3.5.1. Pharmaceuticals
The detrimental effects of pharmaceutical compounds on marine and aquatic ecosystems can be
evaluated through risk assessment measurements. Based on the guidelines issued by the European
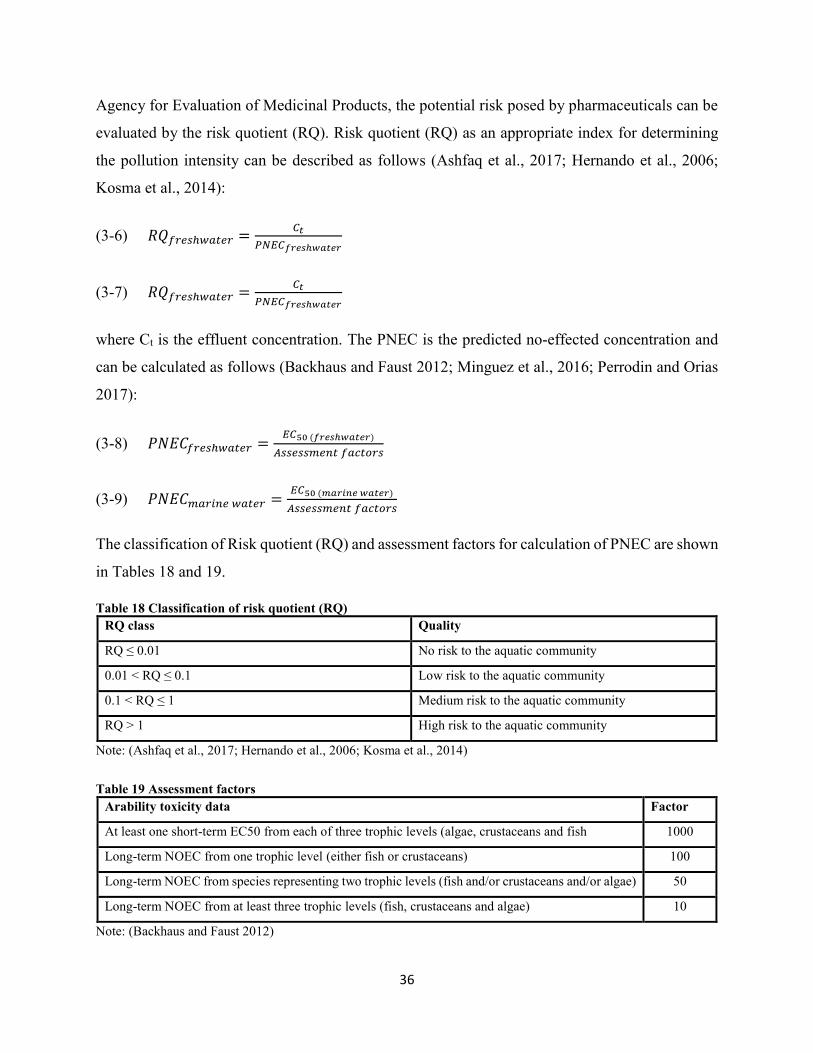
36
Agency for Evaluation of Medicinal Products, the potential risk posed by pharmaceuticals can be
evaluated by the risk quotient (RQ). Risk quotient (RQ) as an appropriate index for determining
the pollution intensity can be described as follows (Ashfaq et al., 2017; Hernando et al., 2006;
Kosma et al., 2014):
(3-6) 𝑅𝑄𝑓𝑟𝑒𝑠ℎ𝑤𝑎𝑡𝑒𝑟 =𝐶𝑡
𝑃𝑁𝐸𝐶𝑓𝑟𝑒𝑠ℎ𝑤𝑎𝑡𝑒𝑟
(3-7) 𝑅𝑄𝑓𝑟𝑒𝑠ℎ𝑤𝑎𝑡𝑒𝑟 =𝐶𝑡
𝑃𝑁𝐸𝐶𝑓𝑟𝑒𝑠ℎ𝑤𝑎𝑡𝑒𝑟
where Ct is the effluent concentration. The PNEC is the predicted no-effected concentration and
can be calculated as follows (Backhaus and Faust 2012; Minguez et al., 2016; Perrodin and Orias
2017):
(3-8) 𝑃𝑁𝐸𝐶𝑓𝑟𝑒𝑠ℎ𝑤𝑎𝑡𝑒𝑟 =𝐸𝐶50(𝑓𝑟𝑒𝑠ℎ𝑤𝑎𝑡𝑒𝑟)
𝐴𝑠𝑠𝑒𝑠𝑠𝑚𝑒𝑛𝑡𝑓𝑎𝑐𝑡𝑜𝑟𝑠
(3-9) 𝑃𝑁𝐸𝐶𝑚𝑎𝑟𝑖𝑛𝑒𝑤𝑎𝑡𝑒𝑟 =𝐸𝐶50(𝑚𝑎𝑟𝑖𝑛𝑒𝑤𝑎𝑡𝑒𝑟)
𝐴𝑠𝑠𝑒𝑠𝑠𝑚𝑒𝑛𝑡𝑓𝑎𝑐𝑡𝑜𝑟𝑠
The classification of Risk quotient (RQ) and assessment factors for calculation of PNEC are shown
in Tables 18 and 19.
Table 18 Classification of risk quotient (RQ) RQ class Quality
RQ ≤ 0.01 No risk to the aquatic community
0.01 < RQ ≤ 0.1 Low risk to the aquatic community
0.1 < RQ ≤ 1 Medium risk to the aquatic community
RQ > 1 High risk to the aquatic community
Note: (Ashfaq et al., 2017; Hernando et al., 2006; Kosma et al., 2014)
Table 19 Assessment factors
Arability toxicity data Factor
At least one short-term EC50 from each of three trophic levels (algae, crustaceans and fish 1000
Long-term NOEC from one trophic level (either fish or crustaceans) 100
Long-term NOEC from species representing two trophic levels (fish and/or crustaceans and/or algae) 50
Long-term NOEC from at least three trophic levels (fish, crustaceans and algae) 10
Note: (Backhaus and Faust 2012)
37
3.5.2. Heavy metals
A wide variety of pollution indexes have been used to evaluate the source and contamination extent
of heavy metals in water system; e.g. Heavy metal pollution index (HPI). (Abdullah, 2013; Cengiz
et al., 2017; Milivojević et al., 2016; Tiwari et al., 2017). Thus, heavy metal pollution index (HPI)
is used to assess the quality of water with respect to the concentration of metals (Abdullah et al.,
2013; Milivojević et al., 2016; Qu et al., 2018). The HPI as a proper index in evaluating the
pollution intensity can be calculated by the following formula (Abdullah et al., 2013; Milivojević
et al., 2016; Qu et al., 2018):
(3-9) HPI =∑ 𝑊𝑖𝑄𝑖
𝑛
𝑖=1
∑ 𝑊𝑖𝑛
𝑖=1
where Qi (sub-index) and Wi (unit weight) are calculated by the given formulas (Wanda et al.,
2012; Yang et al., 2015):
(3-10) 𝑄𝑖 =𝐶𝑡
𝑆𝑖× 100
(3-11) 𝑊𝑖 =1
𝑆𝑖
where Ct and Si are the monitored heavy metal and standard values, respectively. Three classes of
heavy metal pollution index (HPI) are high risk (HPI ≥ 30), medium risk (15 < HPI < 30) and low
risk (HPI ≤ 15) (Mahato et al., 2017).

Chapter 4: Results and discussions
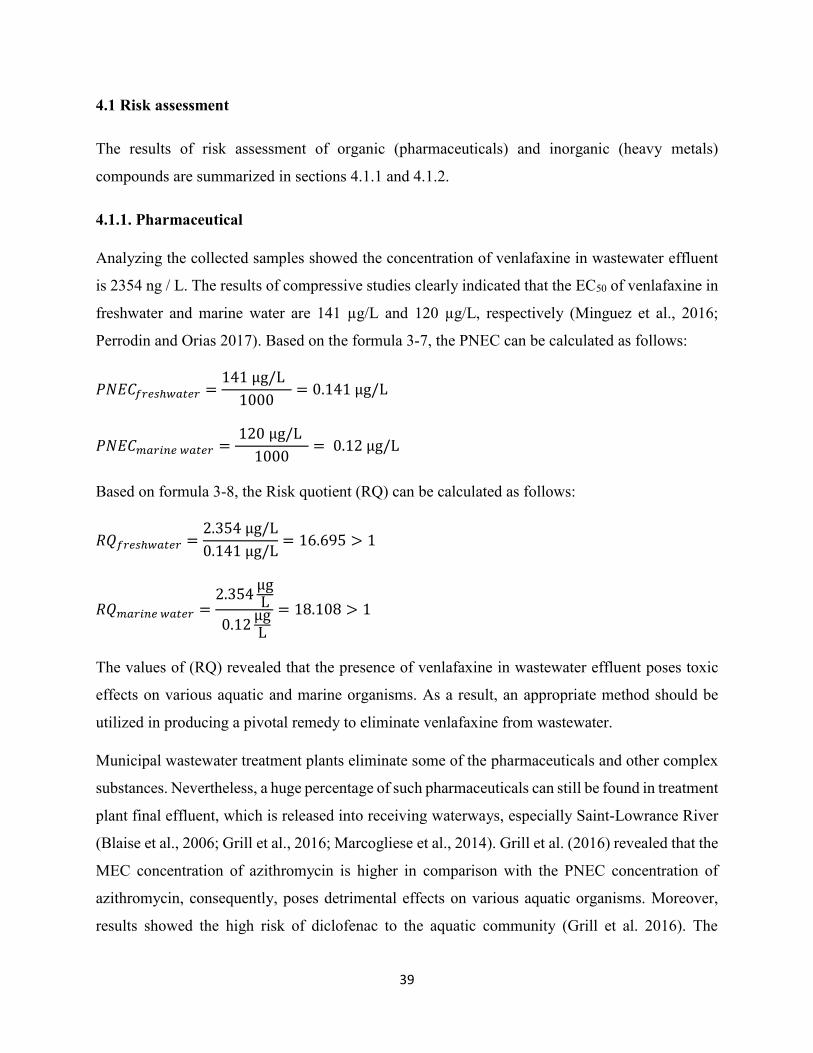
39
4.1 Risk assessment
The results of risk assessment of organic (pharmaceuticals) and inorganic (heavy metals)
compounds are summarized in sections 4.1.1 and 4.1.2.
4.1.1. Pharmaceutical
Analyzing the collected samples showed the concentration of venlafaxine in wastewater effluent
is 2354 ng / L. The results of compressive studies clearly indicated that the EC50 of venlafaxine in
freshwater and marine water are 141 µg/L and 120 µg/L, respectively (Minguez et al., 2016;
Perrodin and Orias 2017). Based on the formula 3-7, the PNEC can be calculated as follows:
𝑃𝑁𝐸𝐶𝑓𝑟𝑒𝑠ℎ𝑤𝑎𝑡𝑒𝑟 =141μg/L
1000= 0.141μg/L
𝑃𝑁𝐸𝐶𝑚𝑎𝑟𝑖𝑛𝑒𝑤𝑎𝑡𝑒𝑟 =120μg/L
1000= 0.12μg/L
Based on formula 3-8, the Risk quotient (RQ) can be calculated as follows:
𝑅𝑄𝑓𝑟𝑒𝑠ℎ𝑤𝑎𝑡𝑒𝑟 =2.354μg/L
0.141μg/L= 16.695 > 1
𝑅𝑄𝑚𝑎𝑟𝑖𝑛𝑒𝑤𝑎𝑡𝑒𝑟 =2.354
μgL
0.12μgL
= 18.108 > 1
The values of (RQ) revealed that the presence of venlafaxine in wastewater effluent poses toxic
effects on various aquatic and marine organisms. As a result, an appropriate method should be
utilized in producing a pivotal remedy to eliminate venlafaxine from wastewater.
Municipal wastewater treatment plants eliminate some of the pharmaceuticals and other complex
substances. Nevertheless, a huge percentage of such pharmaceuticals can still be found in treatment
plant final effluent, which is released into receiving waterways, especially Saint-Lowrance River
(Blaise et al., 2006; Grill et al., 2016; Marcogliese et al., 2014). Grill et al. (2016) revealed that the
MEC concentration of azithromycin is higher in comparison with the PNEC concentration of
azithromycin, consequently, poses detrimental effects on various aquatic organisms. Moreover,
results showed the high risk of diclofenac to the aquatic community (Grill et al. 2016). The
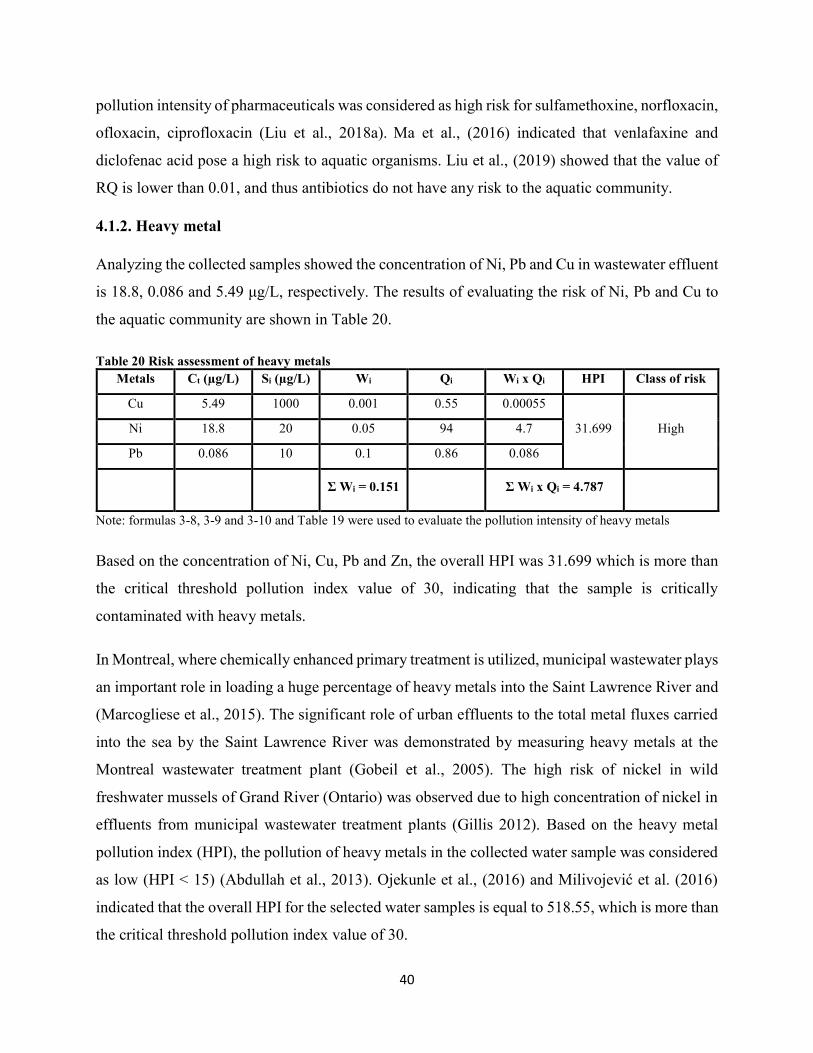
40
pollution intensity of pharmaceuticals was considered as high risk for sulfamethoxine, norfloxacin,
ofloxacin, ciprofloxacin (Liu et al., 2018a). Ma et al., (2016) indicated that venlafaxine and
diclofenac acid pose a high risk to aquatic organisms. Liu et al., (2019) showed that the value of
RQ is lower than 0.01, and thus antibiotics do not have any risk to the aquatic community.
4.1.2. Heavy metal
Analyzing the collected samples showed the concentration of Ni, Pb and Cu in wastewater effluent
is 18.8, 0.086 and 5.49 μg/L, respectively. The results of evaluating the risk of Ni, Pb and Cu to
the aquatic community are shown in Table 20.
Table 20 Risk assessment of heavy metals
Metals Ct (µg/L) Si (µg/L) Wi Qi Wi x Qi HPI Class of risk
Cu 5.49 1000 0.001 0.55 0.00055
31.699 High Ni 18.8 20 0.05 94 4.7
Pb 0.086 10 0.1 0.86 0.086
Σ Wi = 0.151 Σ Wi x Qi = 4.787
Note: formulas 3-8, 3-9 and 3-10 and Table 19 were used to evaluate the pollution intensity of heavy metals
Based on the concentration of Ni, Cu, Pb and Zn, the overall HPI was 31.699 which is more than
the critical threshold pollution index value of 30, indicating that the sample is critically
contaminated with heavy metals.
In Montreal, where chemically enhanced primary treatment is utilized, municipal wastewater plays
an important role in loading a huge percentage of heavy metals into the Saint Lawrence River and
(Marcogliese et al., 2015). The significant role of urban effluents to the total metal fluxes carried
into the sea by the Saint Lawrence River was demonstrated by measuring heavy metals at the
Montreal wastewater treatment plant (Gobeil et al., 2005). The high risk of nickel in wild
freshwater mussels of Grand River (Ontario) was observed due to high concentration of nickel in
effluents from municipal wastewater treatment plants (Gillis 2012). Based on the heavy metal
pollution index (HPI), the pollution of heavy metals in the collected water sample was considered
as low (HPI < 15) (Abdullah et al., 2013). Ojekunle et al., (2016) and Milivojević et al. (2016)
indicated that the overall HPI for the selected water samples is equal to 518.55, which is more than
the critical threshold pollution index value of 30.
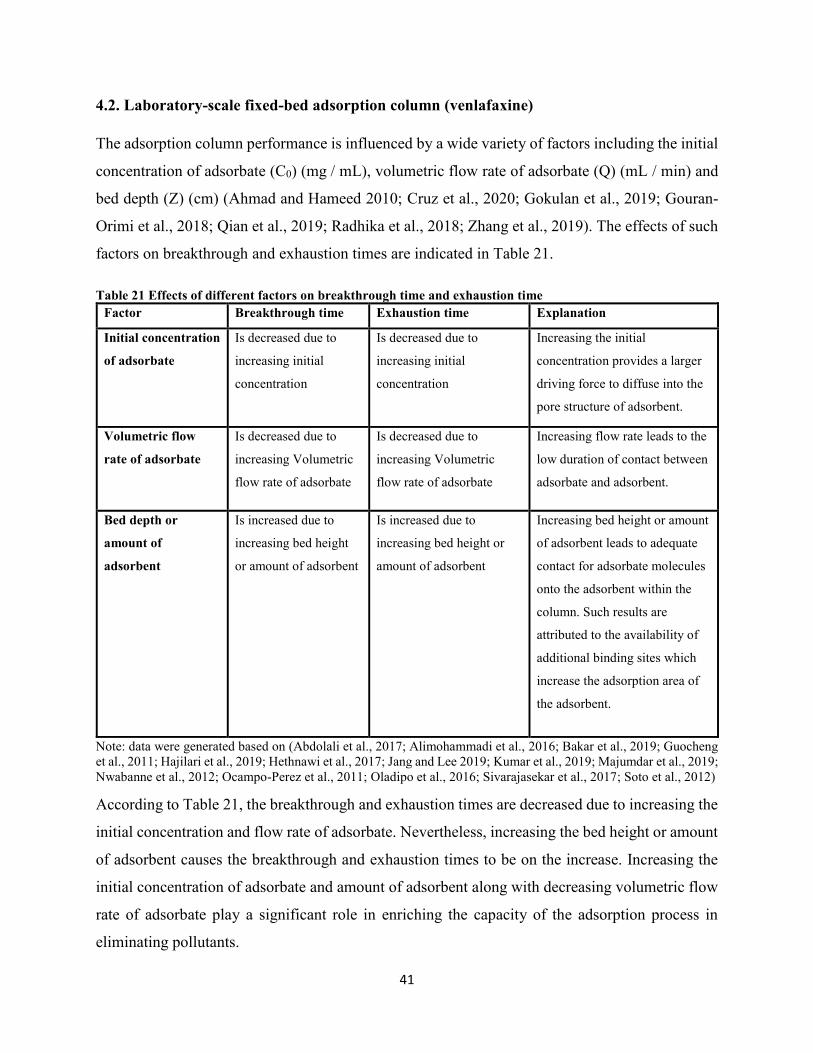
41
4.2. Laboratory-scale fixed-bed adsorption column (venlafaxine)
The adsorption column performance is influenced by a wide variety of factors including the initial
concentration of adsorbate (C0) (mg / mL), volumetric flow rate of adsorbate (Q) (mL / min) and
bed depth (Z) (cm) (Ahmad and Hameed 2010; Cruz et al., 2020; Gokulan et al., 2019; Gouran-
Orimi et al., 2018; Qian et al., 2019; Radhika et al., 2018; Zhang et al., 2019). The effects of such
factors on breakthrough and exhaustion times are indicated in Table 21.
Table 21 Effects of different factors on breakthrough time and exhaustion time
Factor Breakthrough time Exhaustion time Explanation
Initial concentration
of adsorbate
Is decreased due to
increasing initial
concentration
Is decreased due to
increasing initial
concentration
Increasing the initial
concentration provides a larger
driving force to diffuse into the
pore structure of adsorbent.
Volumetric flow
rate of adsorbate
Is decreased due to
increasing Volumetric
flow rate of adsorbate
Is decreased due to
increasing Volumetric
flow rate of adsorbate
Increasing flow rate leads to the
low duration of contact between
adsorbate and adsorbent.
Bed depth or
amount of
adsorbent
Is increased due to
increasing bed height
or amount of adsorbent
Is increased due to
increasing bed height or
amount of adsorbent
Increasing bed height or amount
of adsorbent leads to adequate
contact for adsorbate molecules
onto the adsorbent within the
column. Such results are
attributed to the availability of
additional binding sites which
increase the adsorption area of
the adsorbent.
Note: data were generated based on (Abdolali et al., 2017; Alimohammadi et al., 2016; Bakar et al., 2019; Guocheng
et al., 2011; Hajilari et al., 2019; Hethnawi et al., 2017; Jang and Lee 2019; Kumar et al., 2019; Majumdar et al., 2019;
Nwabanne et al., 2012; Ocampo-Perez et al., 2011; Oladipo et al., 2016; Sivarajasekar et al., 2017; Soto et al., 2012)
According to Table 21, the breakthrough and exhaustion times are decreased due to increasing the
initial concentration and flow rate of adsorbate. Nevertheless, increasing the bed height or amount
of adsorbent causes the breakthrough and exhaustion times to be on the increase. Increasing the
initial concentration of adsorbate and amount of adsorbent along with decreasing volumetric flow
rate of adsorbate play a significant role in enriching the capacity of the adsorption process in
eliminating pollutants.
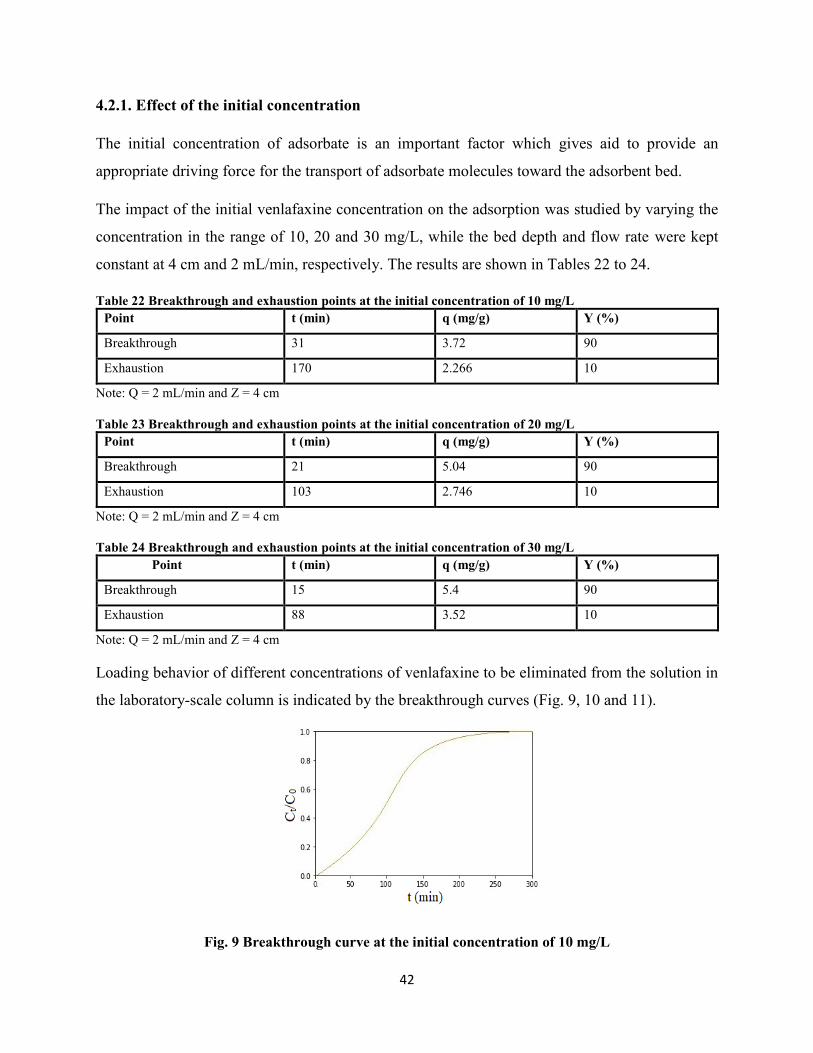
42
4.2.1. Effect of the initial concentration
The initial concentration of adsorbate is an important factor which gives aid to provide an
appropriate driving force for the transport of adsorbate molecules toward the adsorbent bed.
The impact of the initial venlafaxine concentration on the adsorption was studied by varying the
concentration in the range of 10, 20 and 30 mg/L, while the bed depth and flow rate were kept
constant at 4 cm and 2 mL/min, respectively. The results are shown in Tables 22 to 24.
Table 22 Breakthrough and exhaustion points at the initial concentration of 10 mg/L Point t (min) q (mg/g) Y (%)
Breakthrough 31 3.72 90
Exhaustion 170 2.266 10
Note: Q = 2 mL/min and Z = 4 cm
Table 23 Breakthrough and exhaustion points at the initial concentration of 20 mg/L
Point t (min) q (mg/g) Y (%)
Breakthrough 21 5.04 90
Exhaustion 103 2.746 10
Note: Q = 2 mL/min and Z = 4 cm
Table 24 Breakthrough and exhaustion points at the initial concentration of 30 mg/L
Point t (min) q (mg/g) Y (%)
Breakthrough 15 5.4 90
Exhaustion 88 3.52 10
Note: Q = 2 mL/min and Z = 4 cm
Loading behavior of different concentrations of venlafaxine to be eliminated from the solution in
the laboratory-scale column is indicated by the breakthrough curves (Fig. 9, 10 and 11).
Fig. 9 Breakthrough curve at the initial concentration of 10 mg/L
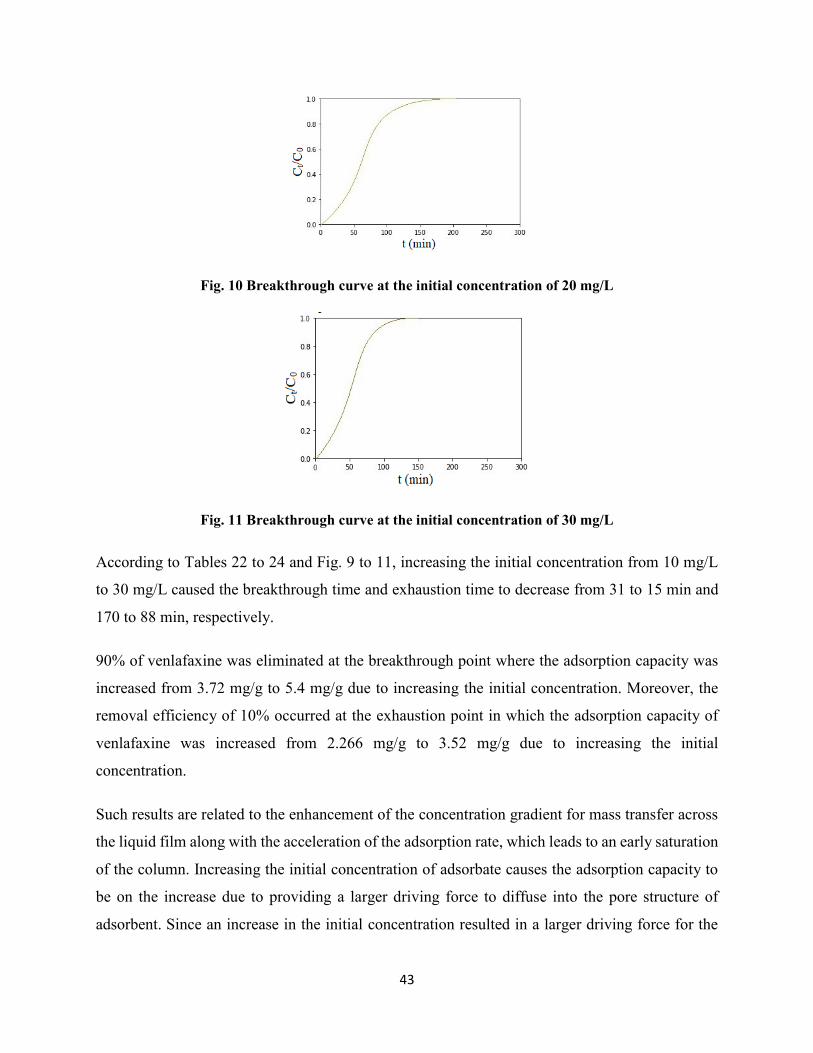
43
Fig. 10 Breakthrough curve at the initial concentration of 20 mg/L
Fig. 11 Breakthrough curve at the initial concentration of 30 mg/L
According to Tables 22 to 24 and Fig. 9 to 11, increasing the initial concentration from 10 mg/L
to 30 mg/L caused the breakthrough time and exhaustion time to decrease from 31 to 15 min and
170 to 88 min, respectively.
90% of venlafaxine was eliminated at the breakthrough point where the adsorption capacity was
increased from 3.72 mg/g to 5.4 mg/g due to increasing the initial concentration. Moreover, the
removal efficiency of 10% occurred at the exhaustion point in which the adsorption capacity of
venlafaxine was increased from 2.266 mg/g to 3.52 mg/g due to increasing the initial
concentration.
Such results are related to the enhancement of the concentration gradient for mass transfer across
the liquid film along with the acceleration of the adsorption rate, which leads to an early saturation
of the column. Increasing the initial concentration of adsorbate causes the adsorption capacity to
be on the increase due to providing a larger driving force to diffuse into the pore structure of
adsorbent. Since an increase in the initial concentration resulted in a larger driving force for the
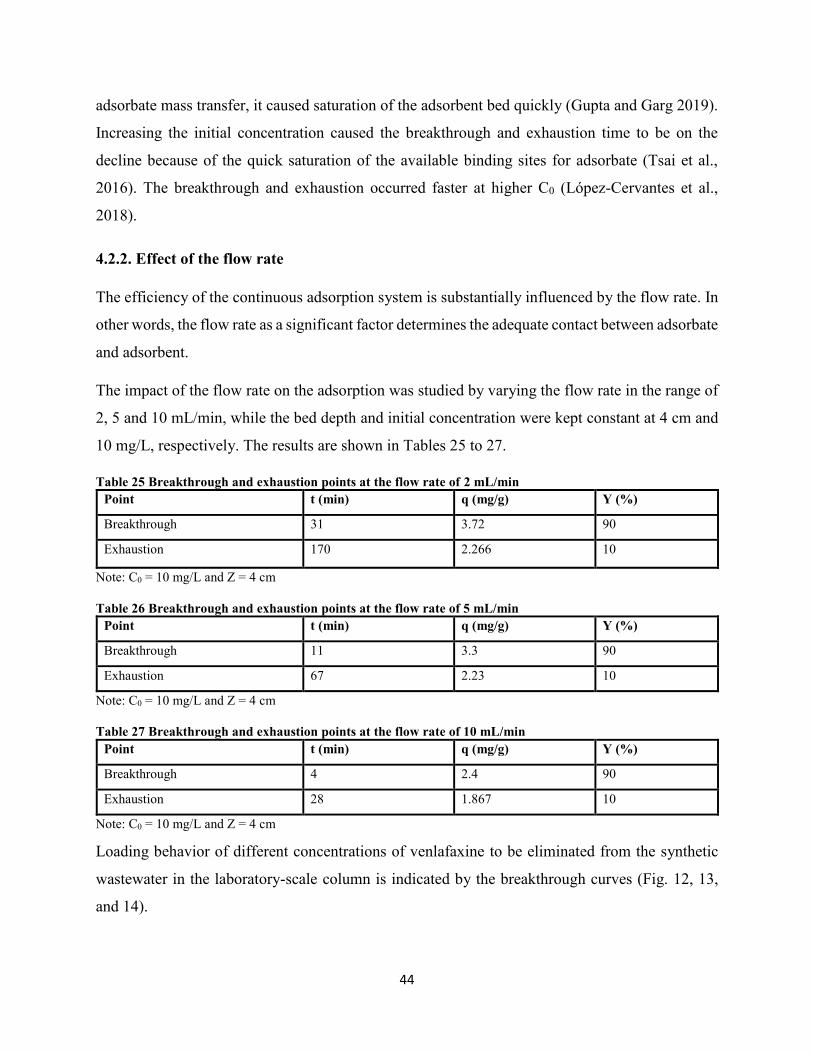
44
adsorbate mass transfer, it caused saturation of the adsorbent bed quickly (Gupta and Garg 2019).
Increasing the initial concentration caused the breakthrough and exhaustion time to be on the
decline because of the quick saturation of the available binding sites for adsorbate (Tsai et al.,
2016). The breakthrough and exhaustion occurred faster at higher C0 (López-Cervantes et al.,
2018).
4.2.2. Effect of the flow rate
The efficiency of the continuous adsorption system is substantially influenced by the flow rate. In
other words, the flow rate as a significant factor determines the adequate contact between adsorbate
and adsorbent.
The impact of the flow rate on the adsorption was studied by varying the flow rate in the range of
2, 5 and 10 mL/min, while the bed depth and initial concentration were kept constant at 4 cm and
10 mg/L, respectively. The results are shown in Tables 25 to 27.
Table 25 Breakthrough and exhaustion points at the flow rate of 2 mL/min Point t (min) q (mg/g) Y (%)
Breakthrough 31 3.72 90
Exhaustion 170 2.266 10
Note: C0 = 10 mg/L and Z = 4 cm
Table 26 Breakthrough and exhaustion points at the flow rate of 5 mL/min
Point t (min) q (mg/g) Y (%)
Breakthrough 11 3.3 90
Exhaustion 67 2.23 10
Note: C0 = 10 mg/L and Z = 4 cm
Table 27 Breakthrough and exhaustion points at the flow rate of 10 mL/min
Point t (min) q (mg/g) Y (%)
Breakthrough 4 2.4 90
Exhaustion 28 1.867 10
Note: C0 = 10 mg/L and Z = 4 cm
Loading behavior of different concentrations of venlafaxine to be eliminated from the synthetic
wastewater in the laboratory-scale column is indicated by the breakthrough curves (Fig. 12, 13,
and 14).
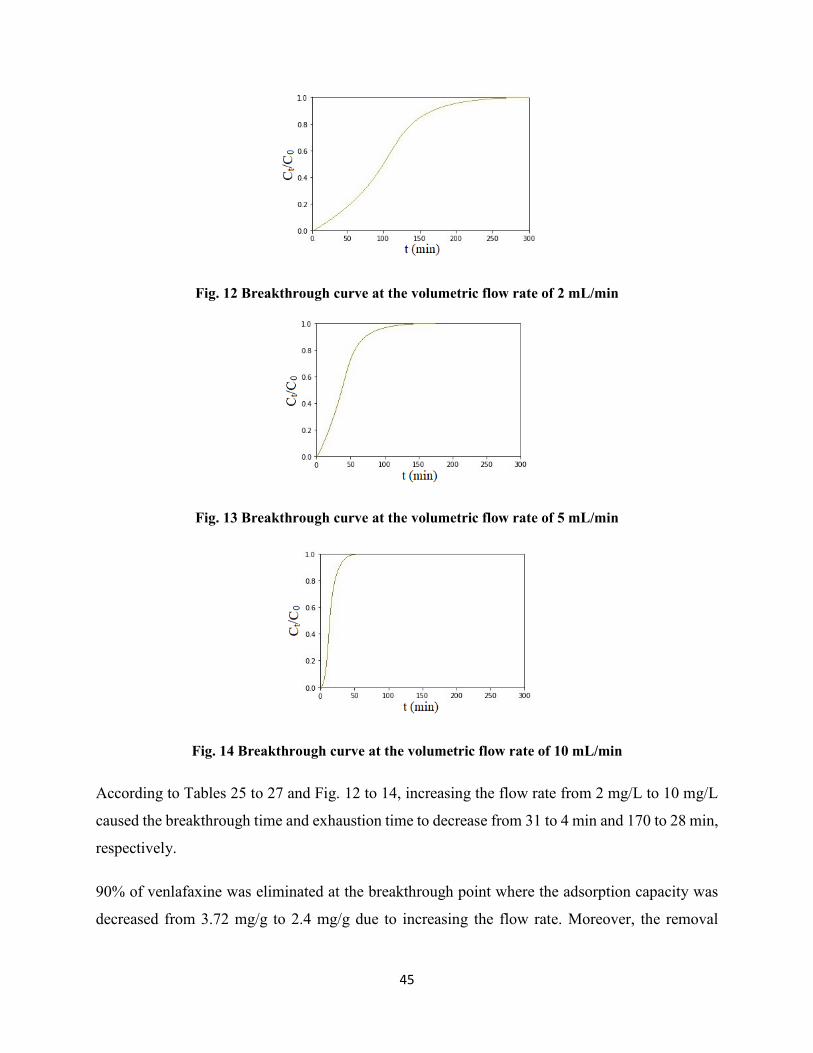
45
Fig. 12 Breakthrough curve at the volumetric flow rate of 2 mL/min
Fig. 13 Breakthrough curve at the volumetric flow rate of 5 mL/min
Fig. 14 Breakthrough curve at the volumetric flow rate of 10 mL/min
According to Tables 25 to 27 and Fig. 12 to 14, increasing the flow rate from 2 mg/L to 10 mg/L
caused the breakthrough time and exhaustion time to decrease from 31 to 4 min and 170 to 28 min,
respectively.
90% of venlafaxine was eliminated at the breakthrough point where the adsorption capacity was
decreased from 3.72 mg/g to 2.4 mg/g due to increasing the flow rate. Moreover, the removal
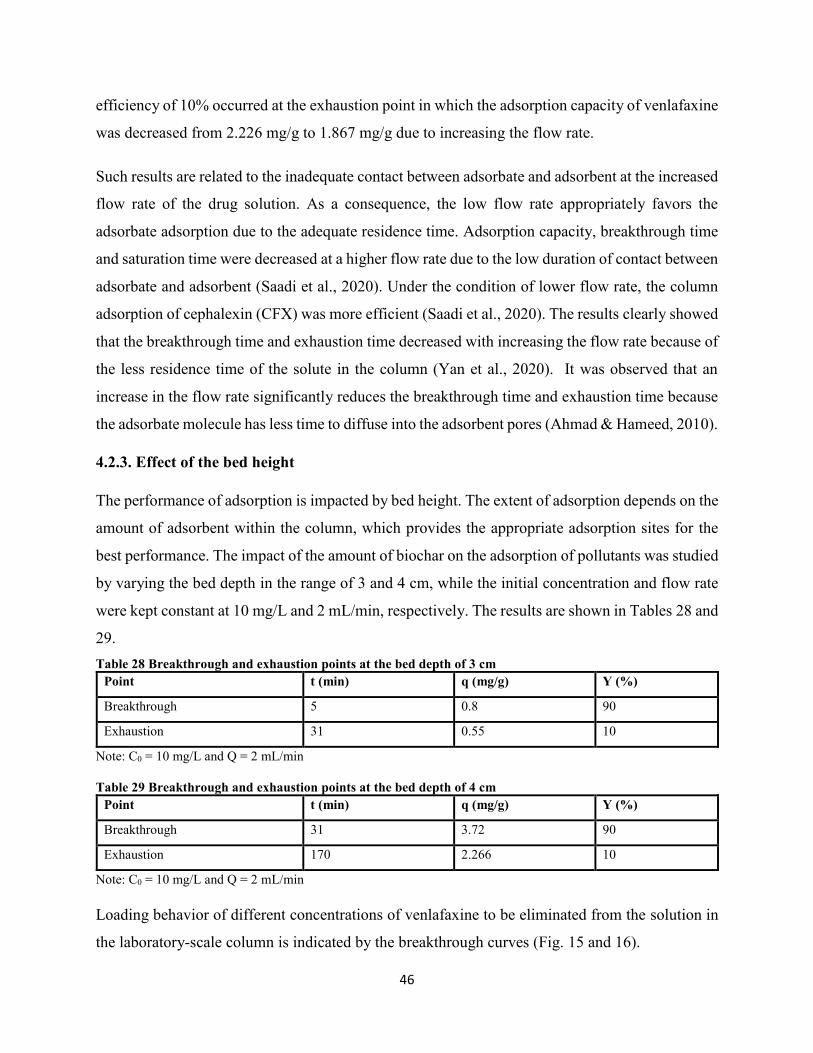
46
efficiency of 10% occurred at the exhaustion point in which the adsorption capacity of venlafaxine
was decreased from 2.226 mg/g to 1.867 mg/g due to increasing the flow rate.
Such results are related to the inadequate contact between adsorbate and adsorbent at the increased
flow rate of the drug solution. As a consequence, the low flow rate appropriately favors the
adsorbate adsorption due to the adequate residence time. Adsorption capacity, breakthrough time
and saturation time were decreased at a higher flow rate due to the low duration of contact between
adsorbate and adsorbent (Saadi et al., 2020). Under the condition of lower flow rate, the column
adsorption of cephalexin (CFX) was more efficient (Saadi et al., 2020). The results clearly showed
that the breakthrough time and exhaustion time decreased with increasing the flow rate because of
the less residence time of the solute in the column (Yan et al., 2020). It was observed that an
increase in the flow rate significantly reduces the breakthrough time and exhaustion time because
the adsorbate molecule has less time to diffuse into the adsorbent pores (Ahmad & Hameed, 2010).
4.2.3. Effect of the bed height
The performance of adsorption is impacted by bed height. The extent of adsorption depends on the
amount of adsorbent within the column, which provides the appropriate adsorption sites for the
best performance. The impact of the amount of biochar on the adsorption of pollutants was studied
by varying the bed depth in the range of 3 and 4 cm, while the initial concentration and flow rate
were kept constant at 10 mg/L and 2 mL/min, respectively. The results are shown in Tables 28 and
29.
Table 28 Breakthrough and exhaustion points at the bed depth of 3 cm Point t (min) q (mg/g) Y (%)
Breakthrough 5 0.8 90
Exhaustion 31 0.55 10
Note: C0 = 10 mg/L and Q = 2 mL/min
Table 29 Breakthrough and exhaustion points at the bed depth of 4 cm
Point t (min) q (mg/g) Y (%)
Breakthrough 31 3.72 90
Exhaustion 170 2.266 10
Note: C0 = 10 mg/L and Q = 2 mL/min
Loading behavior of different concentrations of venlafaxine to be eliminated from the solution in
the laboratory-scale column is indicated by the breakthrough curves (Fig. 15 and 16).
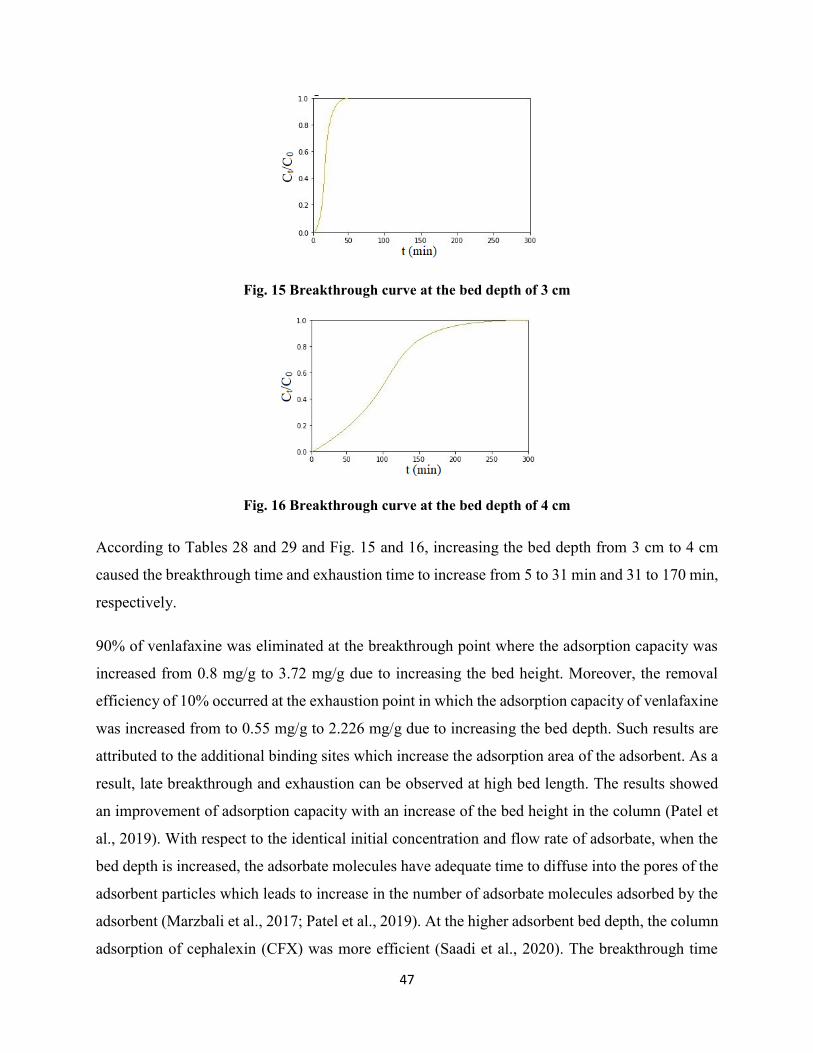
47
Fig. 15 Breakthrough curve at the bed depth of 3 cm
Fig. 16 Breakthrough curve at the bed depth of 4 cm
According to Tables 28 and 29 and Fig. 15 and 16, increasing the bed depth from 3 cm to 4 cm
caused the breakthrough time and exhaustion time to increase from 5 to 31 min and 31 to 170 min,
respectively.
90% of venlafaxine was eliminated at the breakthrough point where the adsorption capacity was
increased from 0.8 mg/g to 3.72 mg/g due to increasing the bed height. Moreover, the removal
efficiency of 10% occurred at the exhaustion point in which the adsorption capacity of venlafaxine
was increased from to 0.55 mg/g to 2.226 mg/g due to increasing the bed depth. Such results are
attributed to the additional binding sites which increase the adsorption area of the adsorbent. As a
result, late breakthrough and exhaustion can be observed at high bed length. The results showed
an improvement of adsorption capacity with an increase of the bed height in the column (Patel et
al., 2019). With respect to the identical initial concentration and flow rate of adsorbate, when the
bed depth is increased, the adsorbate molecules have adequate time to diffuse into the pores of the
adsorbent particles which leads to increase in the number of adsorbate molecules adsorbed by the
adsorbent (Marzbali et al., 2017; Patel et al., 2019). At the higher adsorbent bed depth, the column
adsorption of cephalexin (CFX) was more efficient (Saadi et al., 2020). The breakthrough time
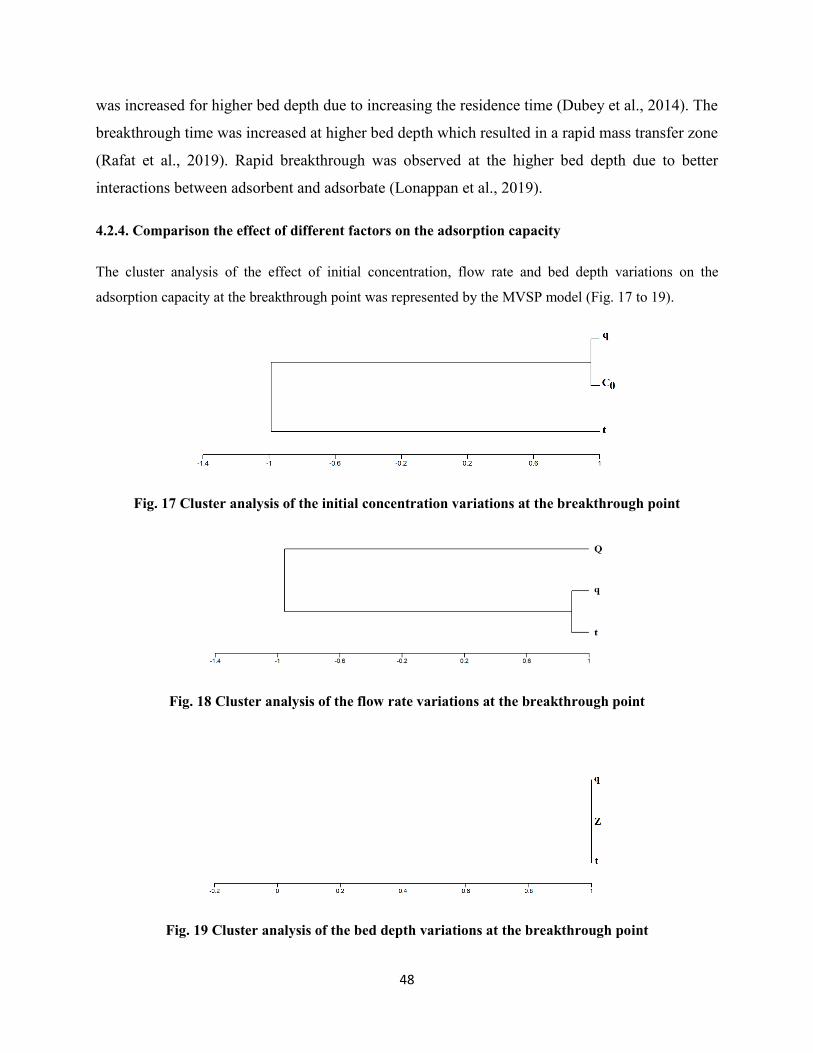
48
was increased for higher bed depth due to increasing the residence time (Dubey et al., 2014). The
breakthrough time was increased at higher bed depth which resulted in a rapid mass transfer zone
(Rafat et al., 2019). Rapid breakthrough was observed at the higher bed depth due to better
interactions between adsorbent and adsorbate (Lonappan et al., 2019).
4.2.4. Comparison the effect of different factors on the adsorption capacity
The cluster analysis of the effect of initial concentration, flow rate and bed depth variations on the
adsorption capacity at the breakthrough point was represented by the MVSP model (Fig. 17 to 19).
Fig. 17 Cluster analysis of the initial concentration variations at the breakthrough point
Fig. 18 Cluster analysis of the flow rate variations at the breakthrough point
Fig. 19 Cluster analysis of the bed depth variations at the breakthrough point
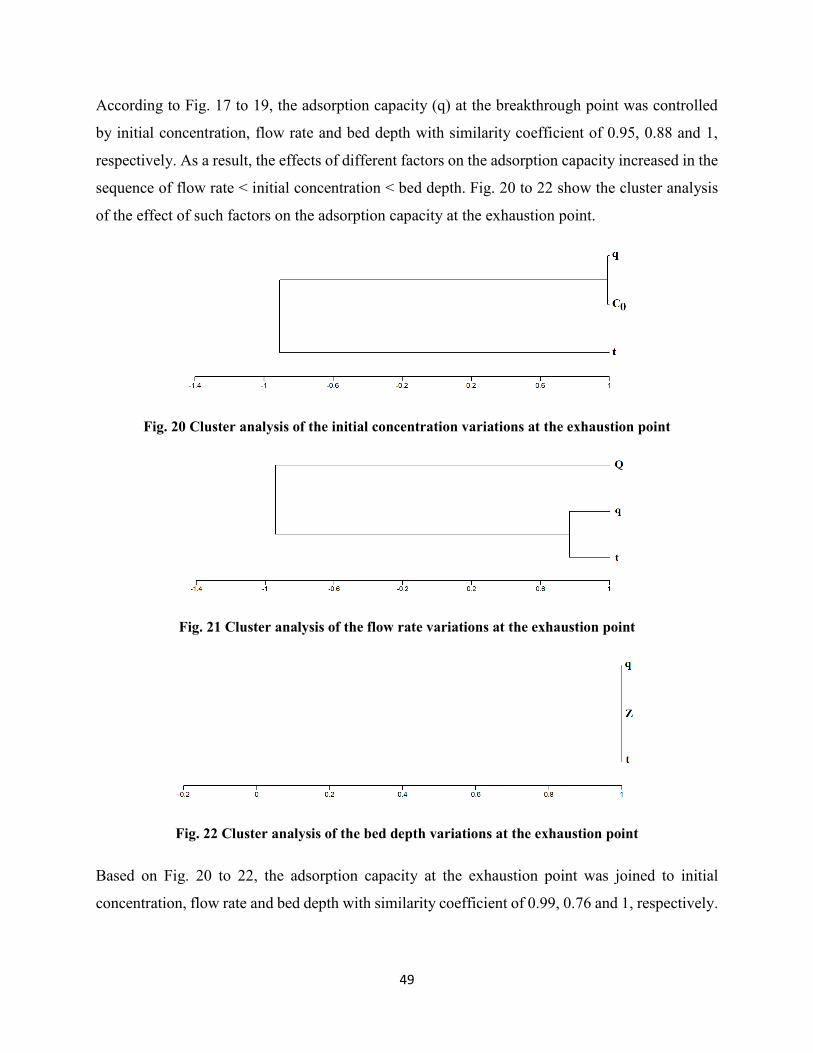
49
According to Fig. 17 to 19, the adsorption capacity (q) at the breakthrough point was controlled
by initial concentration, flow rate and bed depth with similarity coefficient of 0.95, 0.88 and 1,
respectively. As a result, the effects of different factors on the adsorption capacity increased in the
sequence of flow rate < initial concentration < bed depth. Fig. 20 to 22 show the cluster analysis
of the effect of such factors on the adsorption capacity at the exhaustion point.
Fig. 20 Cluster analysis of the initial concentration variations at the exhaustion point
Fig. 21 Cluster analysis of the flow rate variations at the exhaustion point
Fig. 22 Cluster analysis of the bed depth variations at the exhaustion point
Based on Fig. 20 to 22, the adsorption capacity at the exhaustion point was joined to initial
concentration, flow rate and bed depth with similarity coefficient of 0.99, 0.76 and 1, respectively.
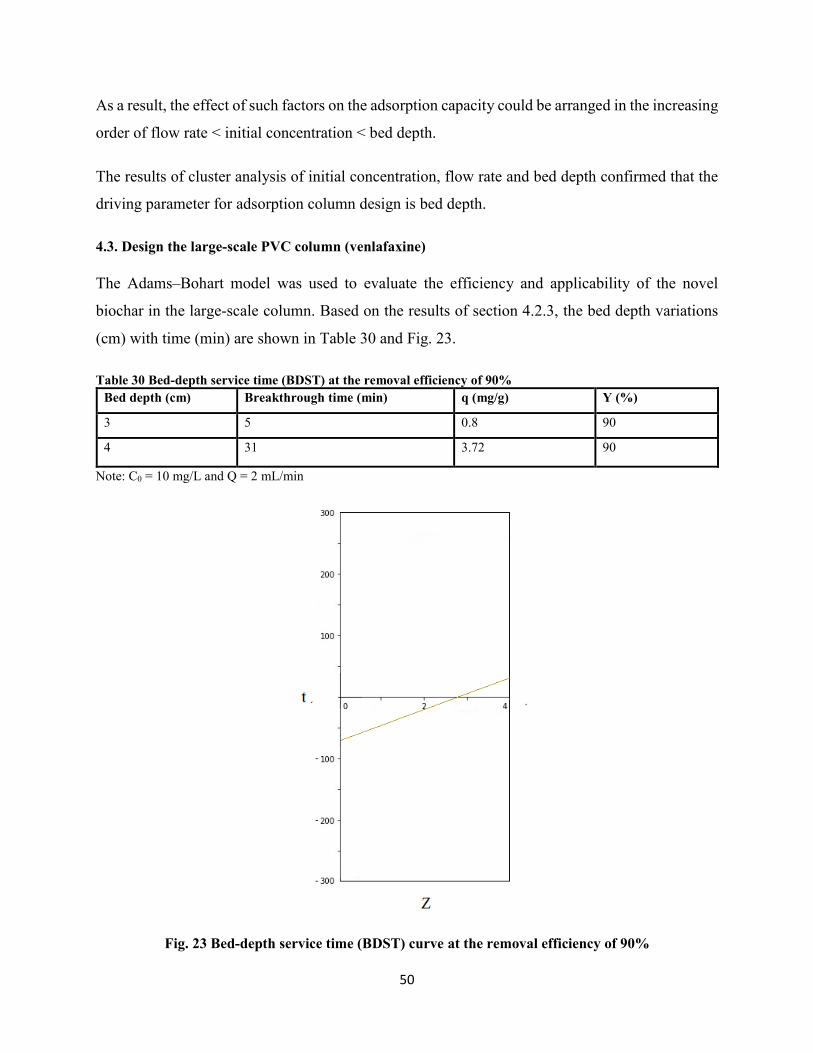
50
As a result, the effect of such factors on the adsorption capacity could be arranged in the increasing
order of flow rate < initial concentration < bed depth.
The results of cluster analysis of initial concentration, flow rate and bed depth confirmed that the
driving parameter for adsorption column design is bed depth.
4.3. Design the large-scale PVC column (venlafaxine)
The Adams–Bohart model was used to evaluate the efficiency and applicability of the novel
biochar in the large-scale column. Based on the results of section 4.2.3, the bed depth variations
(cm) with time (min) are shown in Table 30 and Fig. 23.
Table 30 Bed-depth service time (BDST) at the removal efficiency of 90%
Bed depth (cm) Breakthrough time (min) q (mg/g) Y (%)
3 5 0.8 90
4 31 3.72 90
Note: C0 = 10 mg/L and Q = 2 mL/min
Fig. 23 Bed-depth service time (BDST) curve at the removal efficiency of 90%
51
In Fig. 23, the line can be represented by the Bohart-Adams equation (LaGrega et al., 2010). The
large-scale PVC column can be designed as follows:
Area of the laboratory column = πr2= 0.785 x 1 0-4 m2
Studying the fixed-bed adsorption column under various experimental conditions indicated that
the low flow rate appropriately favors the adsorbate adsorption due to the adequate residence time.
As a result, the flow rate equal to 2 mL/min was used to determine the loading rate in the laboratory
column.
Loading rate in the laboratory column:
V = (0.2 x 1 0-5 m3 / min) / 0.785 x 1 0-4 m2 = 0.03 m3 / (m2.min)
Based on the Adams–Bohart model the same loading rate was used for the full-scale unit yields
(LaGrega et al., 2010):
Area of the large-scale column = Q/V = (0.001 m3 / min) / (0.03 m3 / (m2.min) = 0.03 m2
Diameter of the large-scale column = 0.2 m
BDST equation for 90% removal of venlafaxine can be shown as follows:
Slope a = 3 days / 2.13 m = 1.81 days / m
Intercept b = -0.05 days
Equation of line (formula 3-1): t = 1.81x – 0.05
Velocity of adsorption zone in large-scale column = 1 / a = 0.55 m / day
Adsorbent utilization in large-scale column (formula 3-4) = area x (l /a) x unit weight = 0.03 m2
x 0.55 m/day x 50 kg/m3 = 0.825 kg/day
According to the obtained results, the large-scale PVC column was installed (Fig. 8).
The results of passing wastewater effluent from the large-scale column are shown in Table 31.
Table 31 Removal efficiency of venlafaxine in the large-scale column
Sample Concentration (ng/L) Y (%)
The effluent of column (first day) 117.558073 95
The effluent of column (second day) 1765.8652294 25
The effluent of column (third day) 2116.22931 10
Note: the initial concentration of venlafaxine in wastewater effluent is 2354.48 ng/L
Based on the Table 31, the concentration of venlafaxine in wastewater effluent was decreased from
2354 ng / L to 117.70 ng / L within first day. The obtained results confirmed the feasibility of using
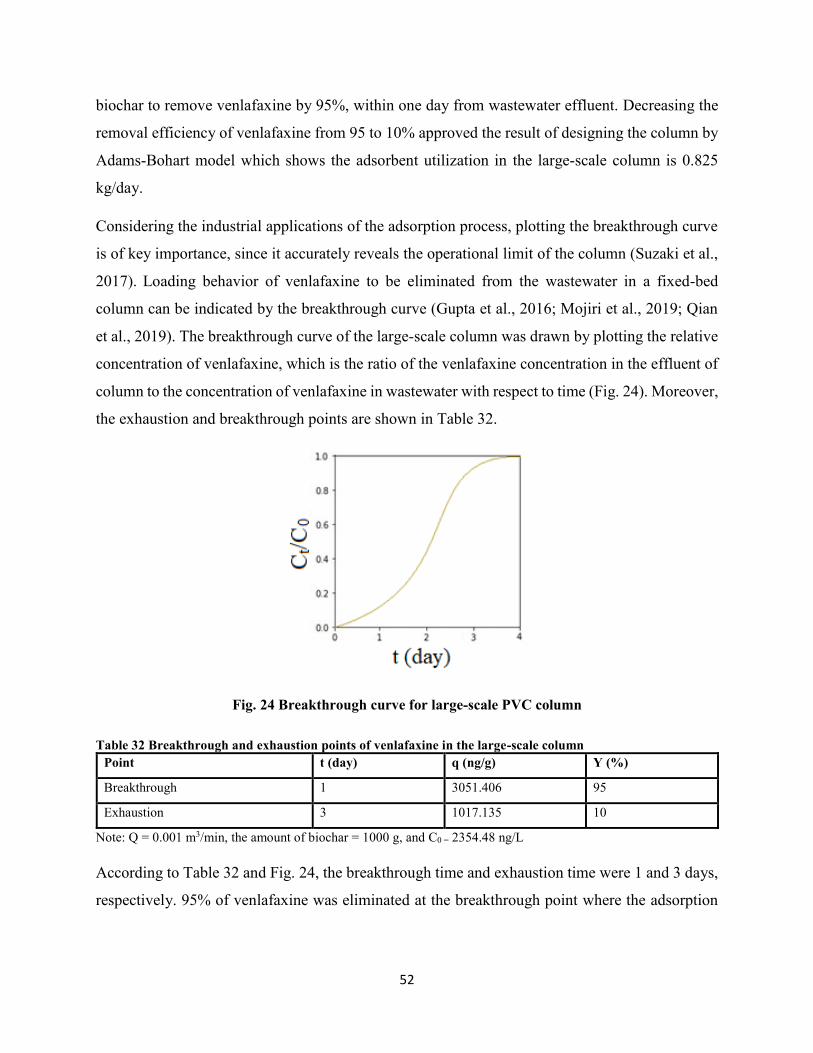
52
biochar to remove venlafaxine by 95%, within one day from wastewater effluent. Decreasing the
removal efficiency of venlafaxine from 95 to 10% approved the result of designing the column by
Adams-Bohart model which shows the adsorbent utilization in the large-scale column is 0.825
kg/day.
Considering the industrial applications of the adsorption process, plotting the breakthrough curve
is of key importance, since it accurately reveals the operational limit of the column (Suzaki et al.,
2017). Loading behavior of venlafaxine to be eliminated from the wastewater in a fixed-bed
column can be indicated by the breakthrough curve (Gupta et al., 2016; Mojiri et al., 2019; Qian
et al., 2019). The breakthrough curve of the large-scale column was drawn by plotting the relative
concentration of venlafaxine, which is the ratio of the venlafaxine concentration in the effluent of
column to the concentration of venlafaxine in wastewater with respect to time (Fig. 24). Moreover,
the exhaustion and breakthrough points are shown in Table 32.
Fig. 24 Breakthrough curve for large-scale PVC column
Table 32 Breakthrough and exhaustion points of venlafaxine in the large-scale column
Point t (day) q (ng/g) Y (%)
Breakthrough 1 3051.406 95
Exhaustion 3 1017.135 10
Note: Q = 0.001 m3/min, the amount of biochar = 1000 g, and C0 = 2354.48 ng/L
According to Table 32 and Fig. 24, the breakthrough time and exhaustion time were 1 and 3 days,
respectively. 95% of venlafaxine was eliminated at the breakthrough point where the adsorption
53
capacity was 3051.406 ng/g. Moreover, the removal efficiency of 10% occurred at the exhaustion
point in which the adsorption capacity of venlafaxine was 1017.135.
The results of other studies revealed that primary treatment and trickling filter/solids contact are
not capable of eliminating antidepressants from sewage (Lajeunesse et al., 2012). Nevertheless,
the capacity of activated sludge, biological aerated filter, and biological nutrient removal processes
in the elimination of antidepressants from sewage is 30% (Lajeunesse et al., 2012). Venlafaxine
was not totally eliminated in the wastewater treatment plants and remained in the effluents entering
river water (Alonso et al., 2010; Rúa-Gómez and Püttmann 2012; Zhou et al., 2010) and even
groundwater (Einsiedl et al., 2010; Rúa-Gómez and Püttmann 2012). 79 % of venlafaxine was
eliminated from wastewater by advanced biological activated carbon filter in a fixed-bed column
(Sbardella et al., 2018). Casas et al. (2015) showed that the removal efficiency of
sulfamethoxazole, venlafaxine, iopromide, tramadol, and diatrizoic is lower than 20 %. Near 60%
of diclofenac was eliminated through using microbiochar in a fixed-bed column (Lonappan et al.,
2019).
Municipal wastewater treatment plants eliminate some of the pharmaceuticals and other complex
substances. Nevertheless, a huge percentage of such pharmaceuticals can still be found in the
treatment plant final effluent, which is released into receiving waterways, especially Saint-
Lowrance River (Blaise et al., 2006; Grill et al., 2016; Marcogliese et al., 2014). Grill et al. (2016)
revealed that pharmaceuticals pose a serious threat to various aquatic organisms due to higher
MEC concentration in comparison with the PNEC concentration. Based on the obtained results
from the utilization of large-scale PVC column, the risk of venlafaxine to the aquatic and marine
organisms can be evaluated as follows:
𝑅𝑄𝑓𝑟𝑒𝑠ℎ𝑤𝑎𝑡𝑒𝑟 =117.558073ng/L
141ng/L= 0.834 < 1
𝑅𝑄𝑚𝑎𝑟𝑖𝑛𝑒𝑤𝑎𝑡𝑒𝑟 =117.558073
ngL
120ngL
= 0.978 < 1
The values of RQ clearly indicated that the risk of presence of venlafaxine for freshwater and
marine water is converted from high risk to low risk to aquatic and marine organisms. The results
54
acknowledged this fact that the novel biochar in the fixed-bed column gave aid to eliminate
venlafaxine from wastewater effluent. Utilization of novel biochar in full-scale facility will provide
a proper position for eliminating pharmaceuticals from the effluent of wastewater treatment plant.
As a consequence, it is expected that such a novel biochar plays a vital role in enriching the
condition of Saint Lawrence River.
4.4. Laboratory-scale fixed-bed adsorption column (Ni, Pb and Cu)
4.4.1 Effect of the initial concentration
The initial concentration of adsorbate is considered as an important factor which influences on the
efficiency of the adsorption system. This parameter adequately determined helps to provide an
appropriate driving force for the transport of adsorbate molecules toward the adsorbent bed. As a
result, the effect of initial concentration on the column performance should be evaluated in an
accurate manner.
The impact of different initial concentrations of Ni, Pb and Cu on the adsorption were studied by
varying the concentration of each metal in the range of 60, 70 and 80 µg/L, while the bed depth
and flow rate were kept constant at 4 cm and 2 mL/min, respectively. The results are shown in
Tables 33 to 41.
Table 33 Breakthrough and exhaustion points of Ni at the initial concentration of 60 µg/L Point t (min) q (µg/g) Y (%)
Breakthrough 24 17.28 90
Exhaustion 150 12 10
Note: Q = 2 mL/min and Z = 4 cm
Table 34 Breakthrough and exhaustion points of Ni at the initial concentration of 70 µg/L
Point t (min) q (µg/g) Y (%)
Breakthrough 21 17.64 90
Exhaustion 130 12.13 10
Note: Q = 2 mL/min and Z = 4 cm
Table 35 Breakthrough and exhaustion points of Ni at the initial concentration of 80 µg/L
Point t (min) q (µg/g) Y (%)
Breakthrough 19 18.24 90
Exhaustion 114 12.16 10
Note: Q = 2 mL/min and Z = 4 cm
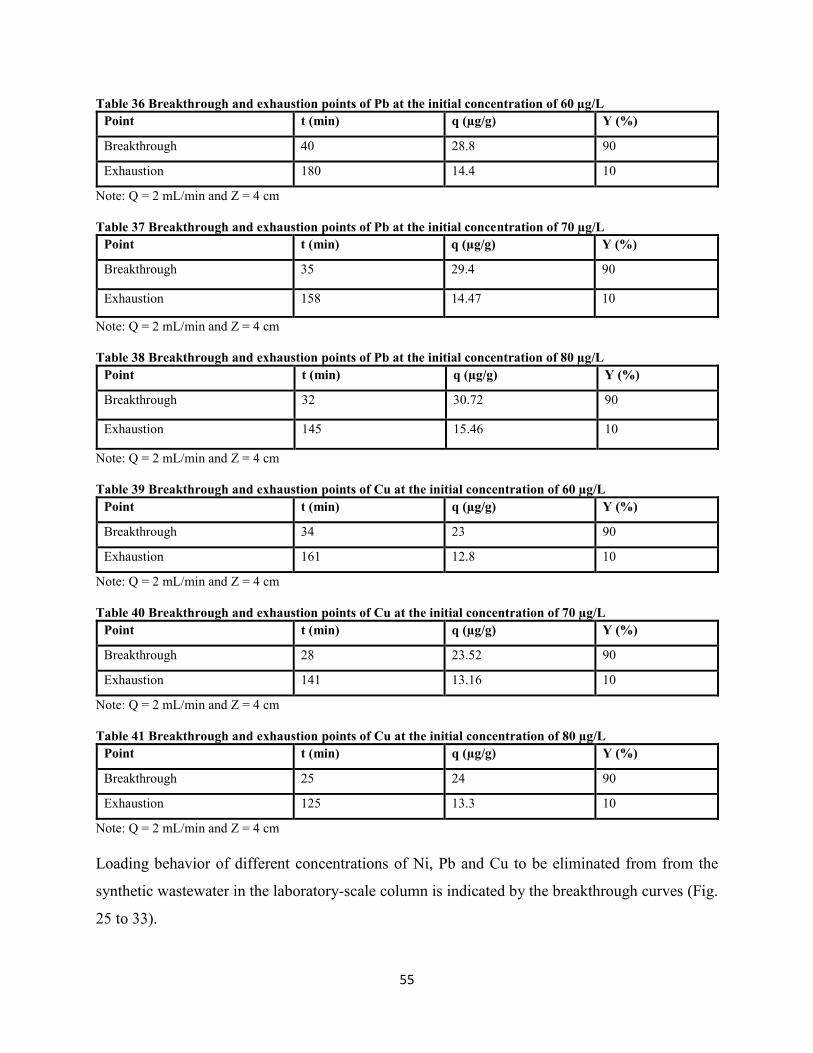
55
Table 36 Breakthrough and exhaustion points of Pb at the initial concentration of 60 µg/L
Point t (min) q (µg/g) Y (%)
Breakthrough 40 28.8 90
Exhaustion 180 14.4 10
Note: Q = 2 mL/min and Z = 4 cm
Table 37 Breakthrough and exhaustion points of Pb at the initial concentration of 70 µg/L
Point t (min) q (µg/g) Y (%)
Breakthrough 35 29.4 90
Exhaustion 158 14.47 10
Note: Q = 2 mL/min and Z = 4 cm
Table 38 Breakthrough and exhaustion points of Pb at the initial concentration of 80 µg/L
Point t (min) q (µg/g) Y (%)
Breakthrough 32 30.72 90
Exhaustion 145 15.46 10
Note: Q = 2 mL/min and Z = 4 cm
Table 39 Breakthrough and exhaustion points of Cu at the initial concentration of 60 µg/L
Point t (min) q (µg/g) Y (%)
Breakthrough 34 23 90
Exhaustion 161 12.8 10
Note: Q = 2 mL/min and Z = 4 cm
Table 40 Breakthrough and exhaustion points of Cu at the initial concentration of 70 µg/L
Point t (min) q (µg/g) Y (%)
Breakthrough 28 23.52 90
Exhaustion 141 13.16 10
Note: Q = 2 mL/min and Z = 4 cm
Table 41 Breakthrough and exhaustion points of Cu at the initial concentration of 80 µg/L
Point t (min) q (µg/g) Y (%)
Breakthrough 25 24 90
Exhaustion 125 13.3 10
Note: Q = 2 mL/min and Z = 4 cm
Loading behavior of different concentrations of Ni, Pb and Cu to be eliminated from from the
synthetic wastewater in the laboratory-scale column is indicated by the breakthrough curves (Fig.
25 to 33).
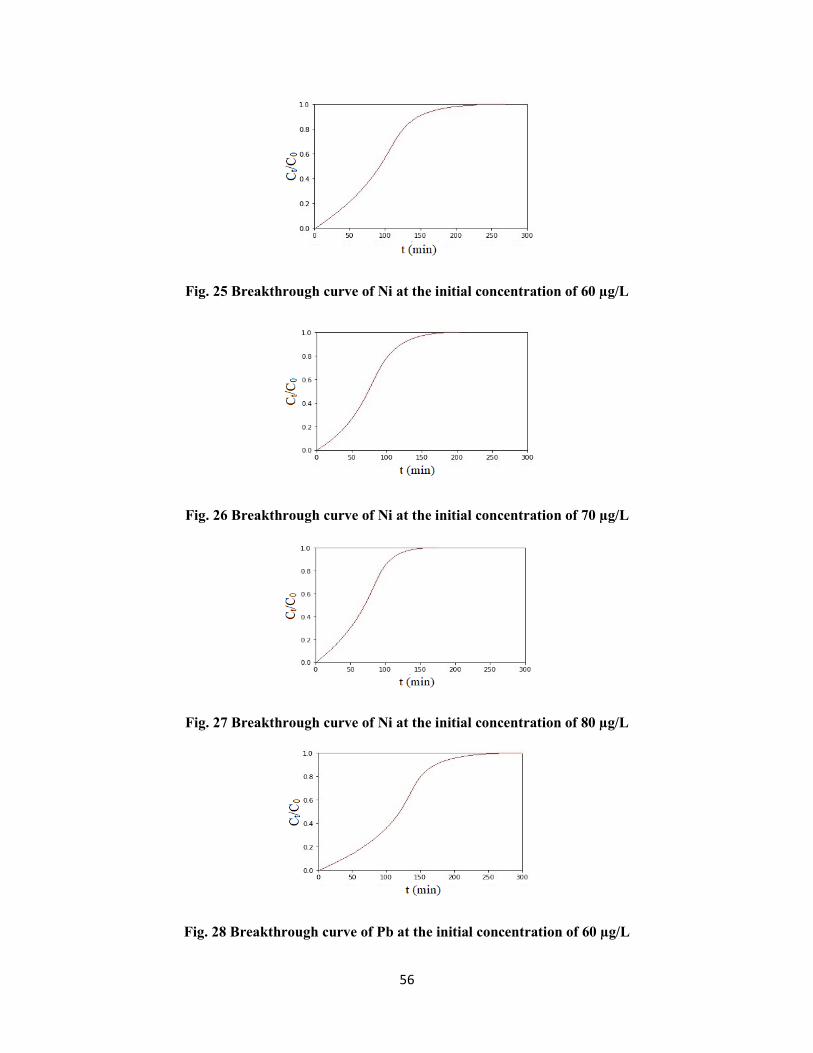
56
Fig. 25 Breakthrough curve of Ni at the initial concentration of 60 µg/L
Fig. 26 Breakthrough curve of Ni at the initial concentration of 70 µg/L
Fig. 27 Breakthrough curve of Ni at the initial concentration of 80 µg/L
Fig. 28 Breakthrough curve of Pb at the initial concentration of 60 µg/L
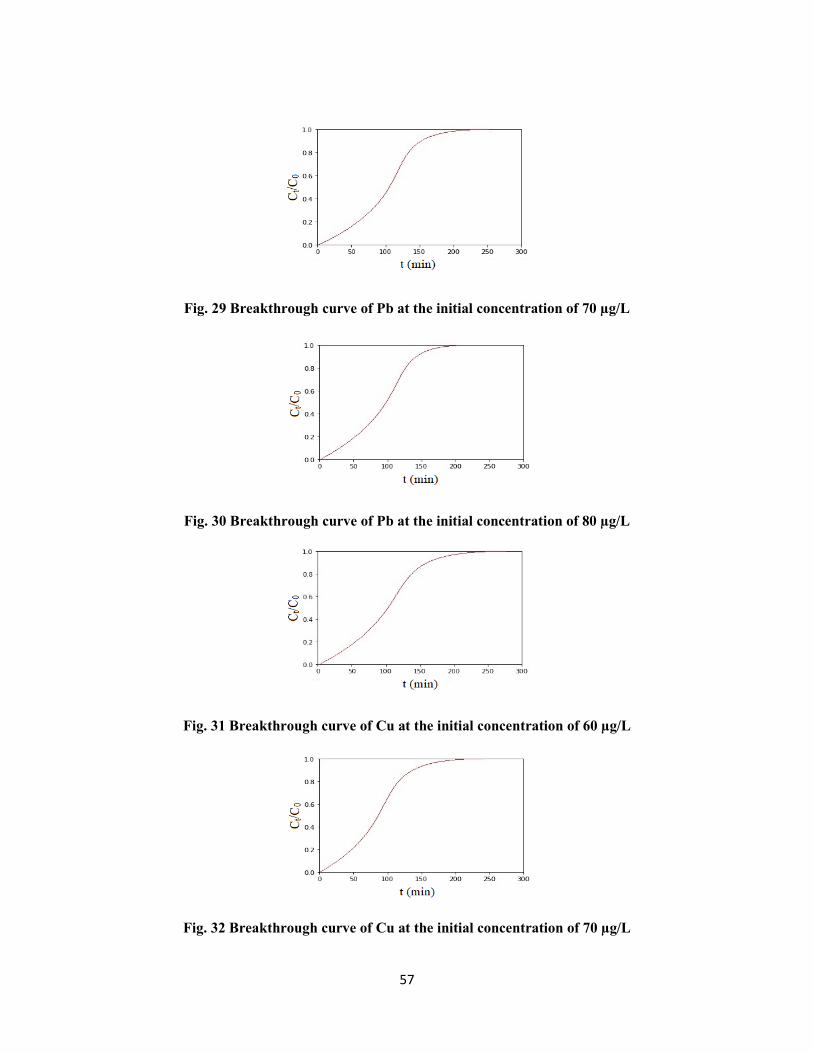
57
Fig. 29 Breakthrough curve of Pb at the initial concentration of 70 µg/L
Fig. 30 Breakthrough curve of Pb at the initial concentration of 80 µg/L
Fig. 31 Breakthrough curve of Cu at the initial concentration of 60 µg/L
Fig. 32 Breakthrough curve of Cu at the initial concentration of 70 µg/L
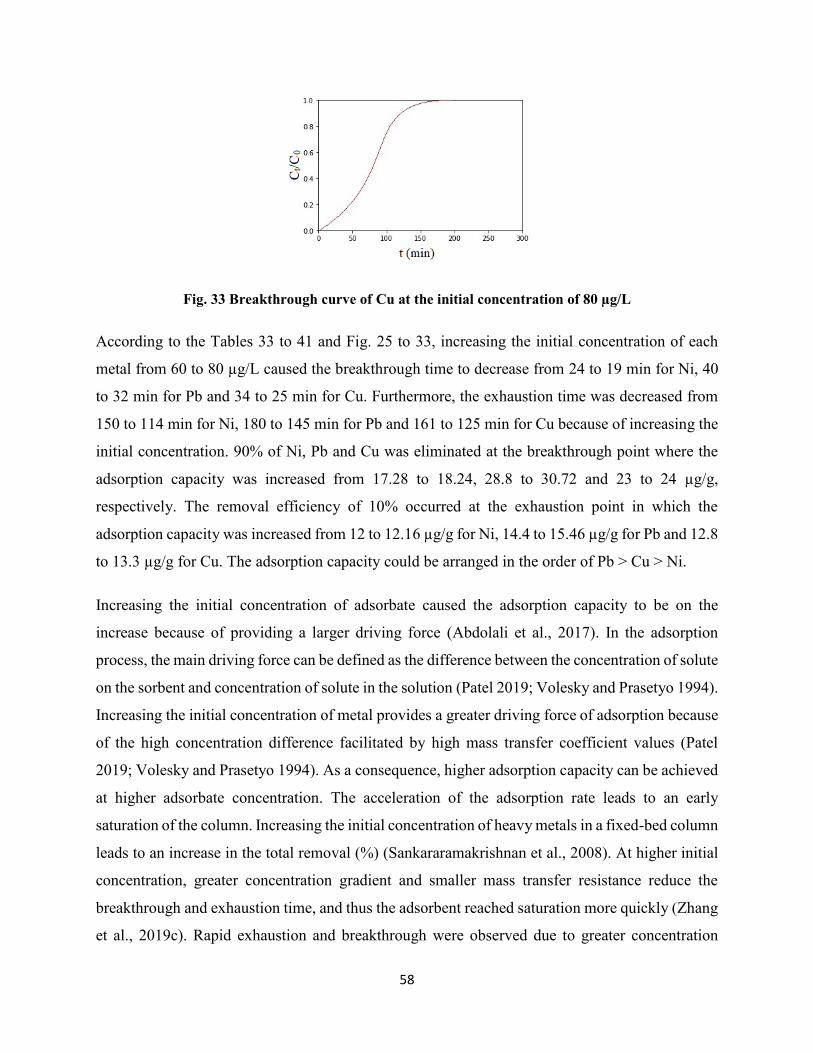
58
Fig. 33 Breakthrough curve of Cu at the initial concentration of 80 µg/L
According to the Tables 33 to 41 and Fig. 25 to 33, increasing the initial concentration of each
metal from 60 to 80 µg/L caused the breakthrough time to decrease from 24 to 19 min for Ni, 40
to 32 min for Pb and 34 to 25 min for Cu. Furthermore, the exhaustion time was decreased from
150 to 114 min for Ni, 180 to 145 min for Pb and 161 to 125 min for Cu because of increasing the
initial concentration. 90% of Ni, Pb and Cu was eliminated at the breakthrough point where the
adsorption capacity was increased from 17.28 to 18.24, 28.8 to 30.72 and 23 to 24 µg/g,
respectively. The removal efficiency of 10% occurred at the exhaustion point in which the
adsorption capacity was increased from 12 to 12.16 µg/g for Ni, 14.4 to 15.46 µg/g for Pb and 12.8
to 13.3 µg/g for Cu. The adsorption capacity could be arranged in the order of Pb > Cu > Ni.
Increasing the initial concentration of adsorbate caused the adsorption capacity to be on the
increase because of providing a larger driving force (Abdolali et al., 2017). In the adsorption
process, the main driving force can be defined as the difference between the concentration of solute
on the sorbent and concentration of solute in the solution (Patel 2019; Volesky and Prasetyo 1994).
Increasing the initial concentration of metal provides a greater driving force of adsorption because
of the high concentration difference facilitated by high mass transfer coefficient values (Patel
2019; Volesky and Prasetyo 1994). As a consequence, higher adsorption capacity can be achieved
at higher adsorbate concentration. The acceleration of the adsorption rate leads to an early
saturation of the column. Increasing the initial concentration of heavy metals in a fixed-bed column
leads to an increase in the total removal (%) (Sankararamakrishnan et al., 2008). At higher initial
concentration, greater concentration gradient and smaller mass transfer resistance reduce the
breakthrough and exhaustion time, and thus the adsorbent reached saturation more quickly (Zhang
et al., 2019c). Rapid exhaustion and breakthrough were observed due to greater concentration
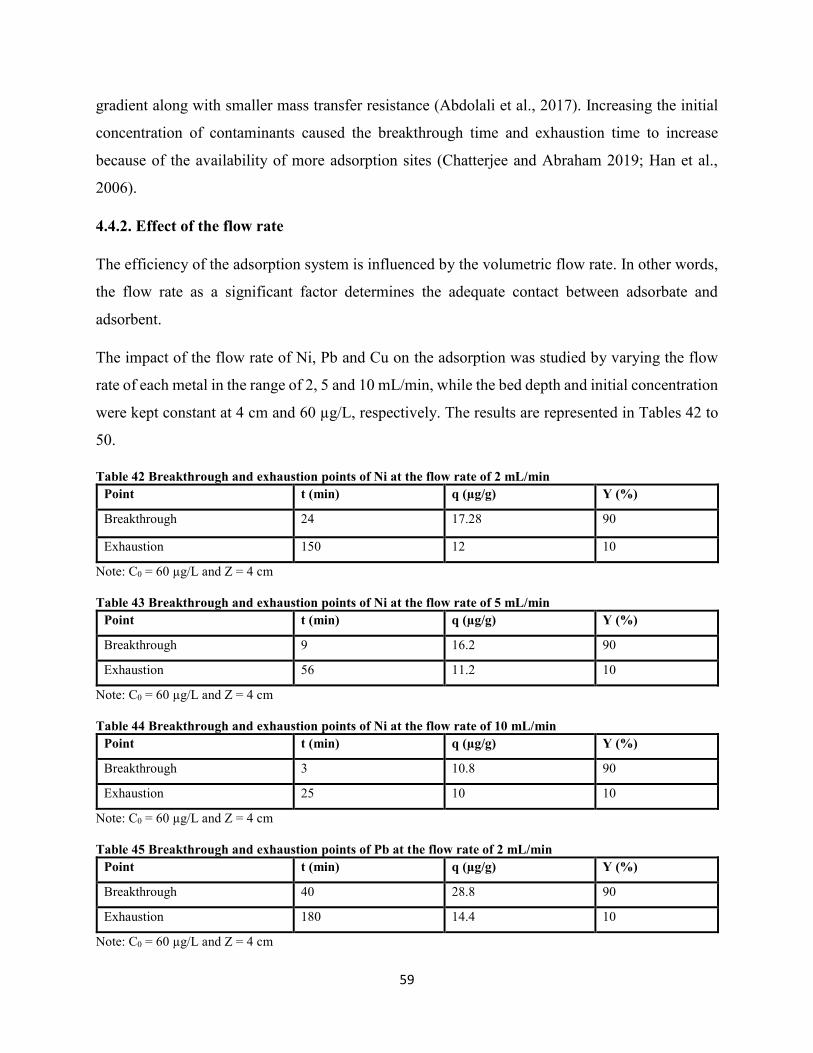
59
gradient along with smaller mass transfer resistance (Abdolali et al., 2017). Increasing the initial
concentration of contaminants caused the breakthrough time and exhaustion time to increase
because of the availability of more adsorption sites (Chatterjee and Abraham 2019; Han et al.,
2006).
4.4.2. Effect of the flow rate
The efficiency of the adsorption system is influenced by the volumetric flow rate. In other words,
the flow rate as a significant factor determines the adequate contact between adsorbate and
adsorbent.
The impact of the flow rate of Ni, Pb and Cu on the adsorption was studied by varying the flow
rate of each metal in the range of 2, 5 and 10 mL/min, while the bed depth and initial concentration
were kept constant at 4 cm and 60 µg/L, respectively. The results are represented in Tables 42 to
50.
Table 42 Breakthrough and exhaustion points of Ni at the flow rate of 2 mL/min Point t (min) q (µg/g) Y (%)
Breakthrough 24 17.28 90
Exhaustion 150 12 10
Note: C0 = 60 µg/L and Z = 4 cm
Table 43 Breakthrough and exhaustion points of Ni at the flow rate of 5 mL/min
Point t (min) q (µg/g) Y (%)
Breakthrough 9 16.2 90
Exhaustion 56 11.2 10
Note: C0 = 60 µg/L and Z = 4 cm
Table 44 Breakthrough and exhaustion points of Ni at the flow rate of 10 mL/min
Point t (min) q (µg/g) Y (%)
Breakthrough 3 10.8 90
Exhaustion 25 10 10
Note: C0 = 60 µg/L and Z = 4 cm
Table 45 Breakthrough and exhaustion points of Pb at the flow rate of 2 mL/min
Point t (min) q (µg/g) Y (%)
Breakthrough 40 28.8 90
Exhaustion 180 14.4 10
Note: C0 = 60 µg/L and Z = 4 cm
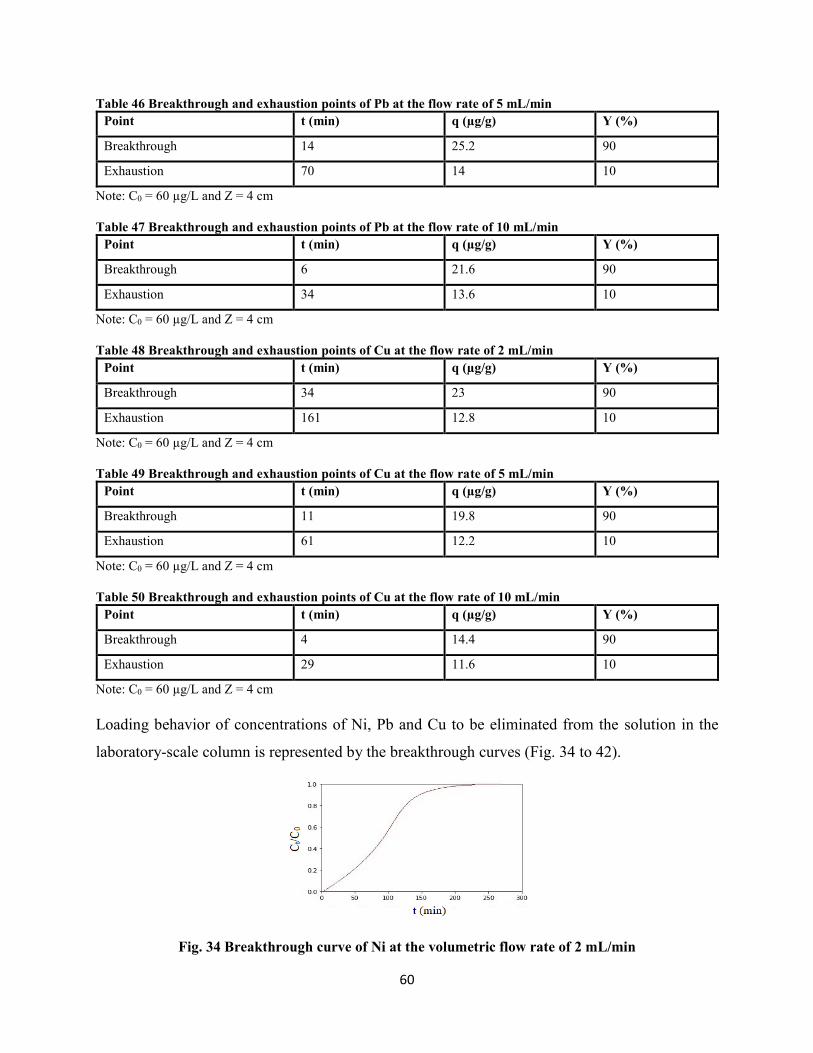
60
Table 46 Breakthrough and exhaustion points of Pb at the flow rate of 5 mL/min
Point t (min) q (µg/g) Y (%)
Breakthrough 14 25.2 90
Exhaustion 70 14 10
Note: C0 = 60 µg/L and Z = 4 cm
Table 47 Breakthrough and exhaustion points of Pb at the flow rate of 10 mL/min
Point t (min) q (µg/g) Y (%)
Breakthrough 6 21.6 90
Exhaustion 34 13.6 10
Note: C0 = 60 µg/L and Z = 4 cm
Table 48 Breakthrough and exhaustion points of Cu at the flow rate of 2 mL/min
Point t (min) q (µg/g) Y (%)
Breakthrough 34 23 90
Exhaustion 161 12.8 10
Note: C0 = 60 µg/L and Z = 4 cm
Table 49 Breakthrough and exhaustion points of Cu at the flow rate of 5 mL/min
Point t (min) q (µg/g) Y (%)
Breakthrough 11 19.8 90
Exhaustion 61 12.2 10
Note: C0 = 60 µg/L and Z = 4 cm
Table 50 Breakthrough and exhaustion points of Cu at the flow rate of 10 mL/min
Point t (min) q (µg/g) Y (%)
Breakthrough 4 14.4 90
Exhaustion 29 11.6 10
Note: C0 = 60 µg/L and Z = 4 cm
Loading behavior of concentrations of Ni, Pb and Cu to be eliminated from the solution in the
laboratory-scale column is represented by the breakthrough curves (Fig. 34 to 42).
Fig. 34 Breakthrough curve of Ni at the volumetric flow rate of 2 mL/min
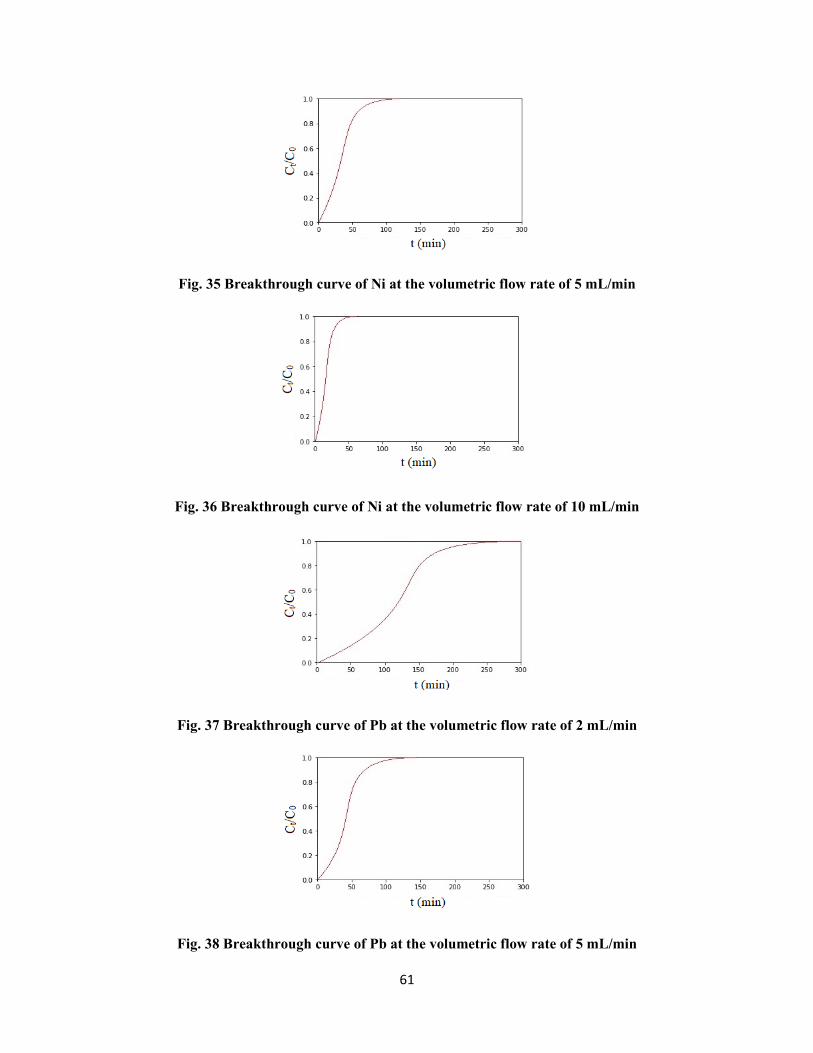
61
Fig. 35 Breakthrough curve of Ni at the volumetric flow rate of 5 mL/min
Fig. 36 Breakthrough curve of Ni at the volumetric flow rate of 10 mL/min
Fig. 37 Breakthrough curve of Pb at the volumetric flow rate of 2 mL/min
Fig. 38 Breakthrough curve of Pb at the volumetric flow rate of 5 mL/min
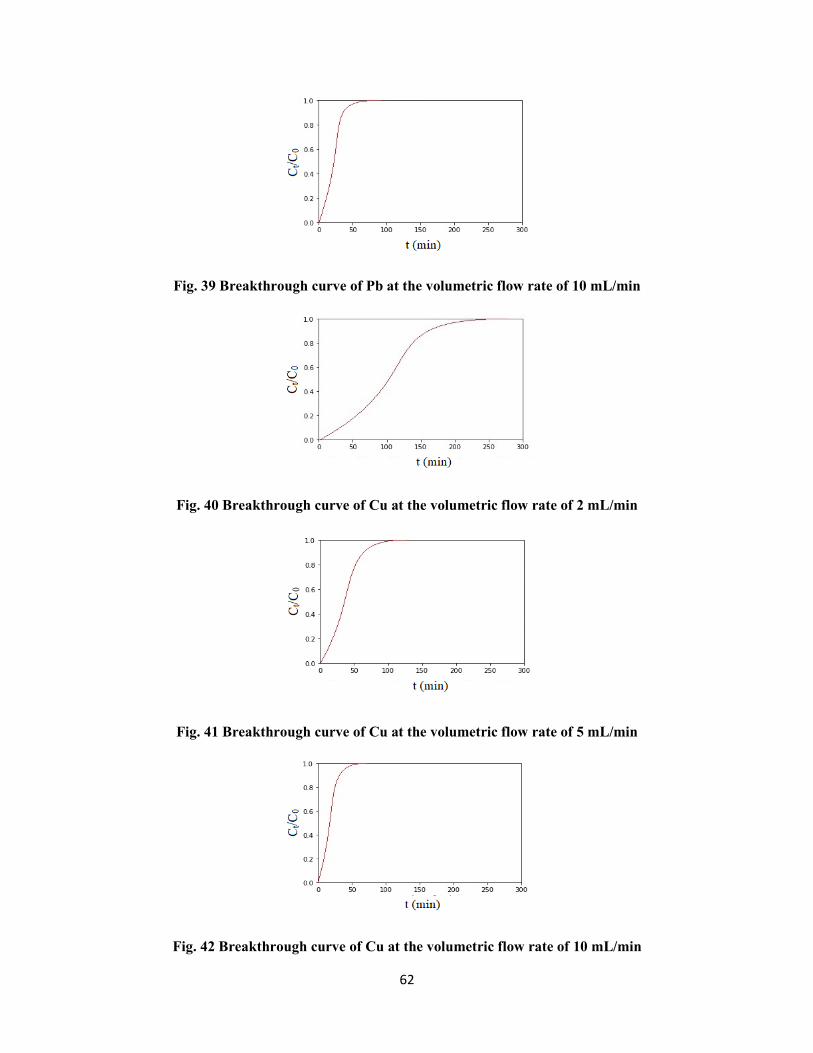
62
Fig. 39 Breakthrough curve of Pb at the volumetric flow rate of 10 mL/min
Fig. 40 Breakthrough curve of Cu at the volumetric flow rate of 2 mL/min
Fig. 41 Breakthrough curve of Cu at the volumetric flow rate of 5 mL/min
Fig. 42 Breakthrough curve of Cu at the volumetric flow rate of 10 mL/min
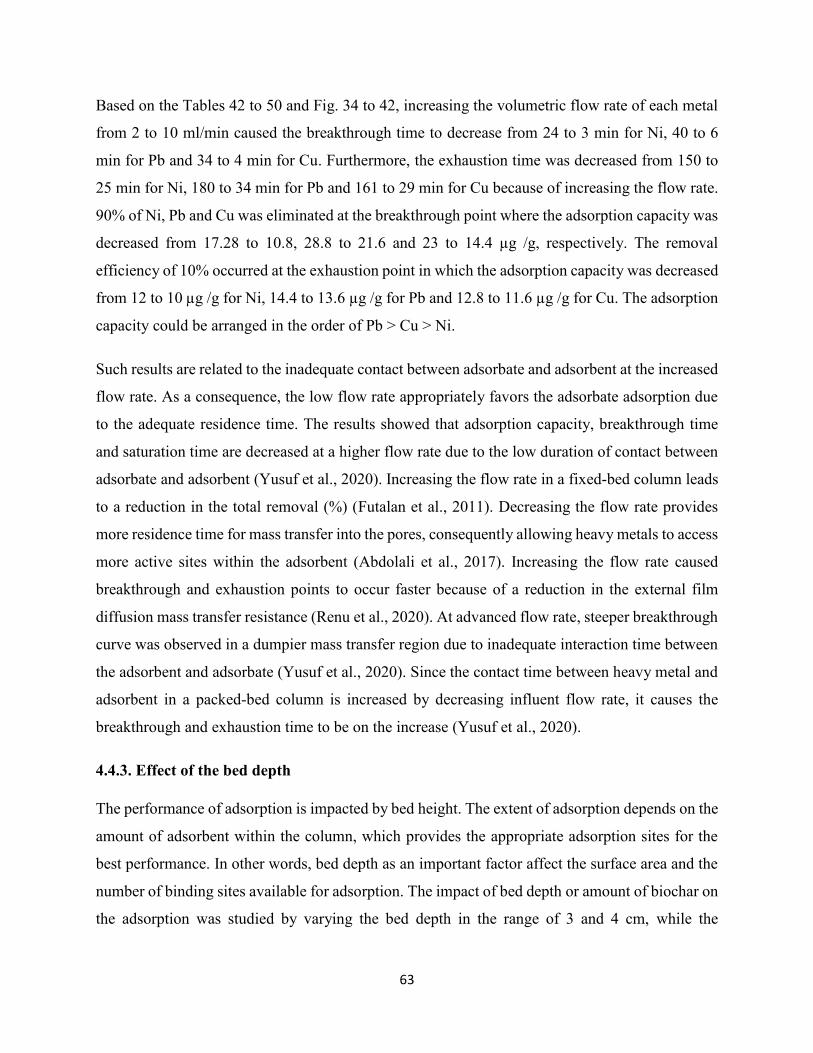
63
Based on the Tables 42 to 50 and Fig. 34 to 42, increasing the volumetric flow rate of each metal
from 2 to 10 ml/min caused the breakthrough time to decrease from 24 to 3 min for Ni, 40 to 6
min for Pb and 34 to 4 min for Cu. Furthermore, the exhaustion time was decreased from 150 to
25 min for Ni, 180 to 34 min for Pb and 161 to 29 min for Cu because of increasing the flow rate.
90% of Ni, Pb and Cu was eliminated at the breakthrough point where the adsorption capacity was
decreased from 17.28 to 10.8, 28.8 to 21.6 and 23 to 14.4 µg /g, respectively. The removal
efficiency of 10% occurred at the exhaustion point in which the adsorption capacity was decreased
from 12 to 10 µg /g for Ni, 14.4 to 13.6 µg /g for Pb and 12.8 to 11.6 µg /g for Cu. The adsorption
capacity could be arranged in the order of Pb > Cu > Ni.
Such results are related to the inadequate contact between adsorbate and adsorbent at the increased
flow rate. As a consequence, the low flow rate appropriately favors the adsorbate adsorption due
to the adequate residence time. The results showed that adsorption capacity, breakthrough time
and saturation time are decreased at a higher flow rate due to the low duration of contact between
adsorbate and adsorbent (Yusuf et al., 2020). Increasing the flow rate in a fixed-bed column leads
to a reduction in the total removal (%) (Futalan et al., 2011). Decreasing the flow rate provides
more residence time for mass transfer into the pores, consequently allowing heavy metals to access
more active sites within the adsorbent (Abdolali et al., 2017). Increasing the flow rate caused
breakthrough and exhaustion points to occur faster because of a reduction in the external film
diffusion mass transfer resistance (Renu et al., 2020). At advanced flow rate, steeper breakthrough
curve was observed in a dumpier mass transfer region due to inadequate interaction time between
the adsorbent and adsorbate (Yusuf et al., 2020). Since the contact time between heavy metal and
adsorbent in a packed-bed column is increased by decreasing influent flow rate, it causes the
breakthrough and exhaustion time to be on the increase (Yusuf et al., 2020).
4.4.3. Effect of the bed depth
The performance of adsorption is impacted by bed height. The extent of adsorption depends on the
amount of adsorbent within the column, which provides the appropriate adsorption sites for the
best performance. In other words, bed depth as an important factor affect the surface area and the
number of binding sites available for adsorption. The impact of bed depth or amount of biochar on
the adsorption was studied by varying the bed depth in the range of 3 and 4 cm, while the
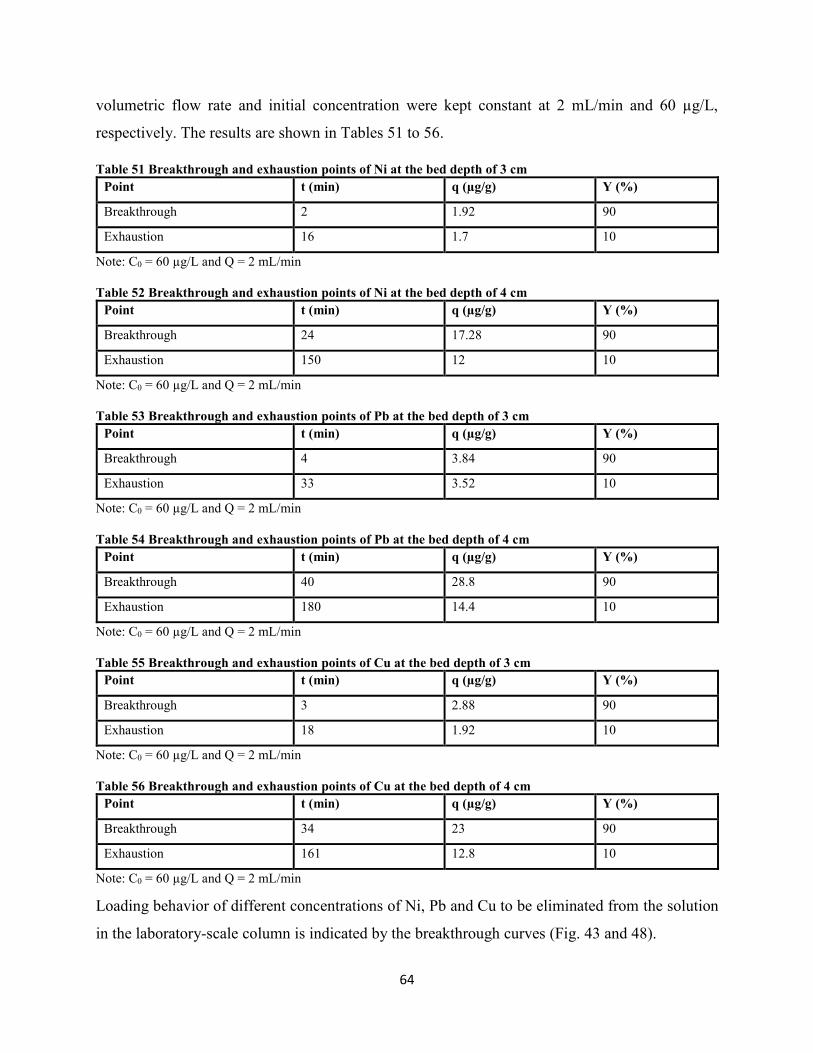
64
volumetric flow rate and initial concentration were kept constant at 2 mL/min and 60 µg/L,
respectively. The results are shown in Tables 51 to 56.
Table 51 Breakthrough and exhaustion points of Ni at the bed depth of 3 cm Point t (min) q (µg/g) Y (%)
Breakthrough 2 1.92 90
Exhaustion 16 1.7 10
Note: C0 = 60 µg/L and Q = 2 mL/min
Table 52 Breakthrough and exhaustion points of Ni at the bed depth of 4 cm
Point t (min) q (µg/g) Y (%)
Breakthrough 24 17.28 90
Exhaustion 150 12 10
Note: C0 = 60 µg/L and Q = 2 mL/min
Table 53 Breakthrough and exhaustion points of Pb at the bed depth of 3 cm
Point t (min) q (µg/g) Y (%)
Breakthrough 4 3.84 90
Exhaustion 33 3.52 10
Note: C0 = 60 µg/L and Q = 2 mL/min
Table 54 Breakthrough and exhaustion points of Pb at the bed depth of 4 cm
Point t (min) q (µg/g) Y (%)
Breakthrough 40 28.8 90
Exhaustion 180 14.4 10
Note: C0 = 60 µg/L and Q = 2 mL/min
Table 55 Breakthrough and exhaustion points of Cu at the bed depth of 3 cm
Point t (min) q (µg/g) Y (%)
Breakthrough 3 2.88 90
Exhaustion 18 1.92 10
Note: C0 = 60 µg/L and Q = 2 mL/min
Table 56 Breakthrough and exhaustion points of Cu at the bed depth of 4 cm
Point t (min) q (µg/g) Y (%)
Breakthrough 34 23 90
Exhaustion 161 12.8 10
Note: C0 = 60 µg/L and Q = 2 mL/min
Loading behavior of different concentrations of Ni, Pb and Cu to be eliminated from the solution
in the laboratory-scale column is indicated by the breakthrough curves (Fig. 43 and 48).
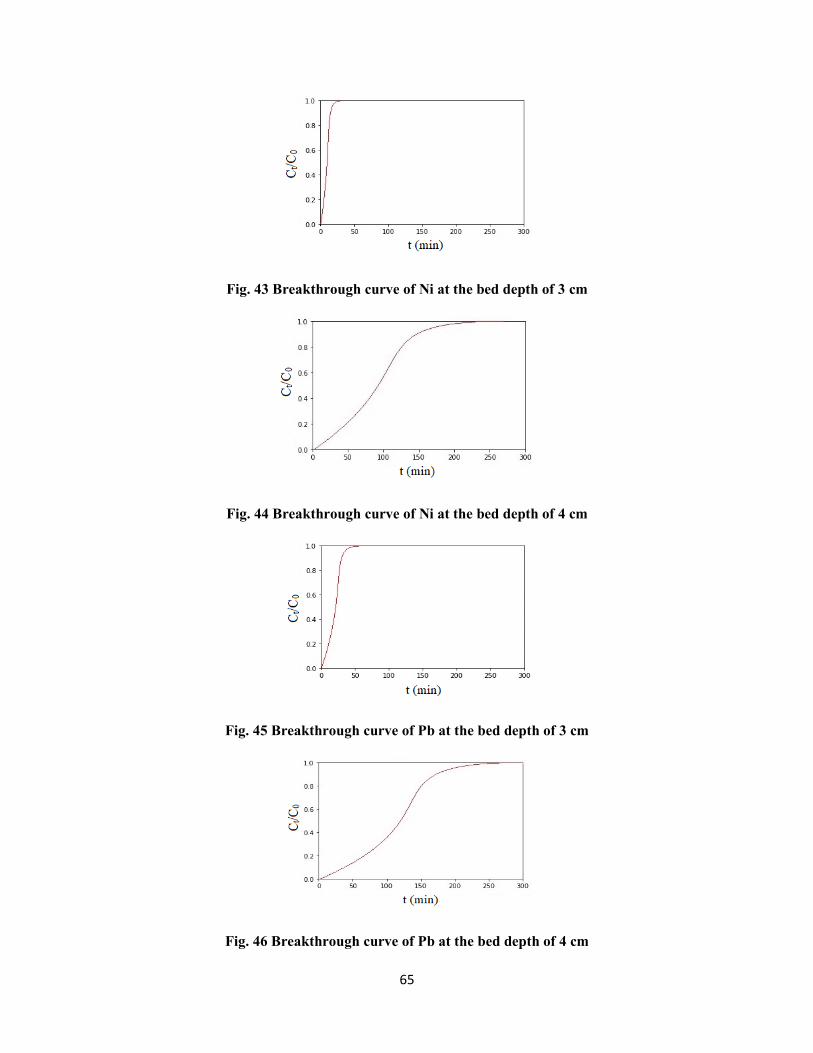
65
Fig. 43 Breakthrough curve of Ni at the bed depth of 3 cm
Fig. 44 Breakthrough curve of Ni at the bed depth of 4 cm
Fig. 45 Breakthrough curve of Pb at the bed depth of 3 cm
Fig. 46 Breakthrough curve of Pb at the bed depth of 4 cm
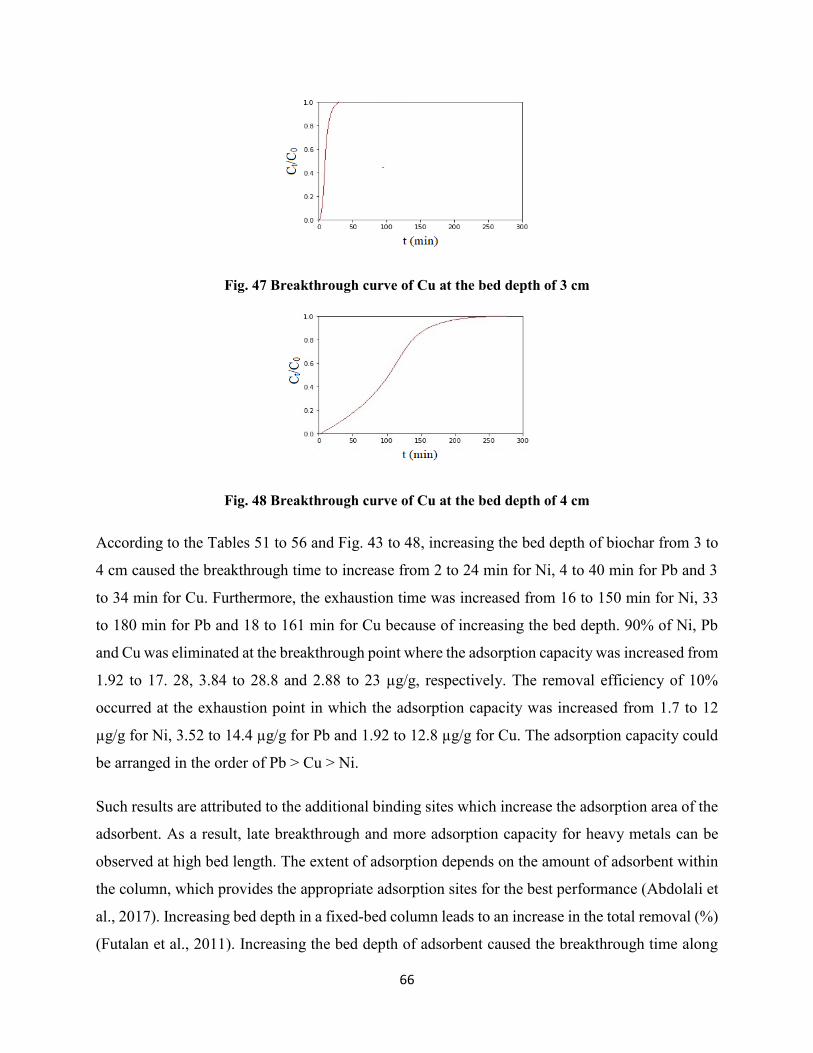
66
Fig. 47 Breakthrough curve of Cu at the bed depth of 3 cm
Fig. 48 Breakthrough curve of Cu at the bed depth of 4 cm
According to the Tables 51 to 56 and Fig. 43 to 48, increasing the bed depth of biochar from 3 to
4 cm caused the breakthrough time to increase from 2 to 24 min for Ni, 4 to 40 min for Pb and 3
to 34 min for Cu. Furthermore, the exhaustion time was increased from 16 to 150 min for Ni, 33
to 180 min for Pb and 18 to 161 min for Cu because of increasing the bed depth. 90% of Ni, Pb
and Cu was eliminated at the breakthrough point where the adsorption capacity was increased from
1.92 to 17. 28, 3.84 to 28.8 and 2.88 to 23 µg/g, respectively. The removal efficiency of 10%
occurred at the exhaustion point in which the adsorption capacity was increased from 1.7 to 12
µg/g for Ni, 3.52 to 14.4 µg/g for Pb and 1.92 to 12.8 µg/g for Cu. The adsorption capacity could
be arranged in the order of Pb > Cu > Ni.
Such results are attributed to the additional binding sites which increase the adsorption area of the
adsorbent. As a result, late breakthrough and more adsorption capacity for heavy metals can be
observed at high bed length. The extent of adsorption depends on the amount of adsorbent within
the column, which provides the appropriate adsorption sites for the best performance (Abdolali et
al., 2017). Increasing bed depth in a fixed-bed column leads to an increase in the total removal (%)
(Futalan et al., 2011). Increasing the bed depth of adsorbent caused the breakthrough time along
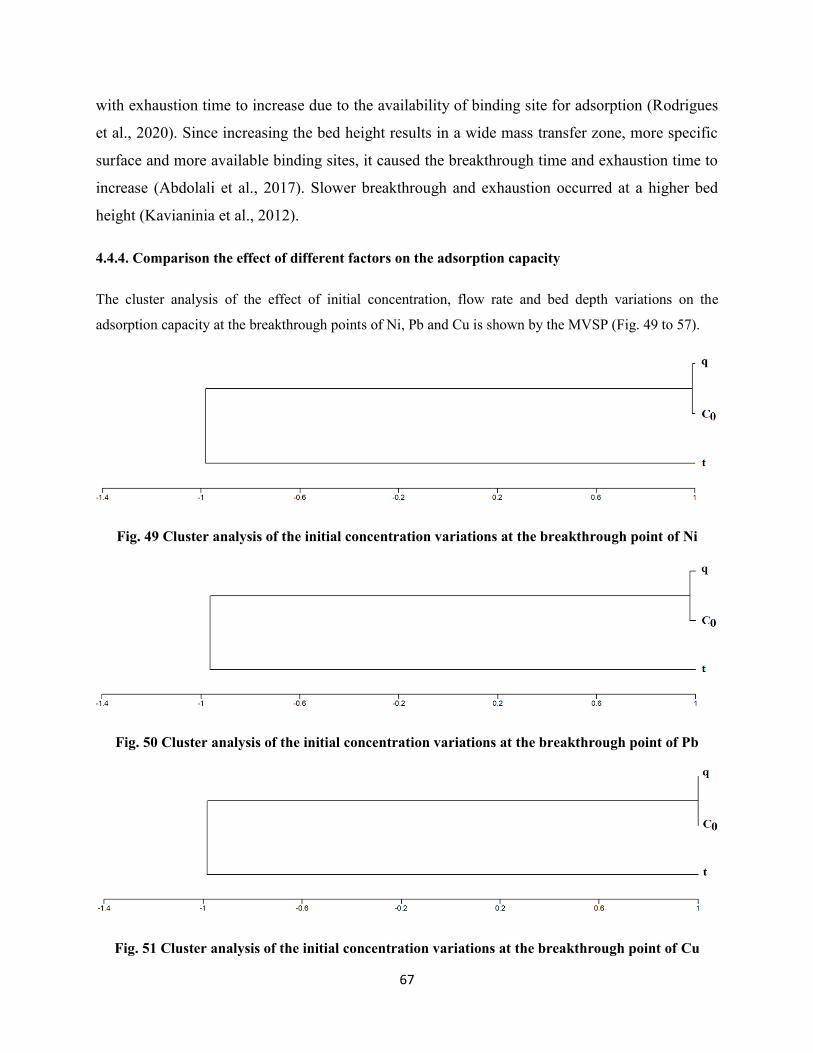
67
with exhaustion time to increase due to the availability of binding site for adsorption (Rodrigues
et al., 2020). Since increasing the bed height results in a wide mass transfer zone, more specific
surface and more available binding sites, it caused the breakthrough time and exhaustion time to
increase (Abdolali et al., 2017). Slower breakthrough and exhaustion occurred at a higher bed
height (Kavianinia et al., 2012).
4.4.4. Comparison the effect of different factors on the adsorption capacity
The cluster analysis of the effect of initial concentration, flow rate and bed depth variations on the
adsorption capacity at the breakthrough points of Ni, Pb and Cu is shown by the MVSP (Fig. 49 to 57).
Fig. 49 Cluster analysis of the initial concentration variations at the breakthrough point of Ni
Fig. 50 Cluster analysis of the initial concentration variations at the breakthrough point of Pb
Fig. 51 Cluster analysis of the initial concentration variations at the breakthrough point of Cu
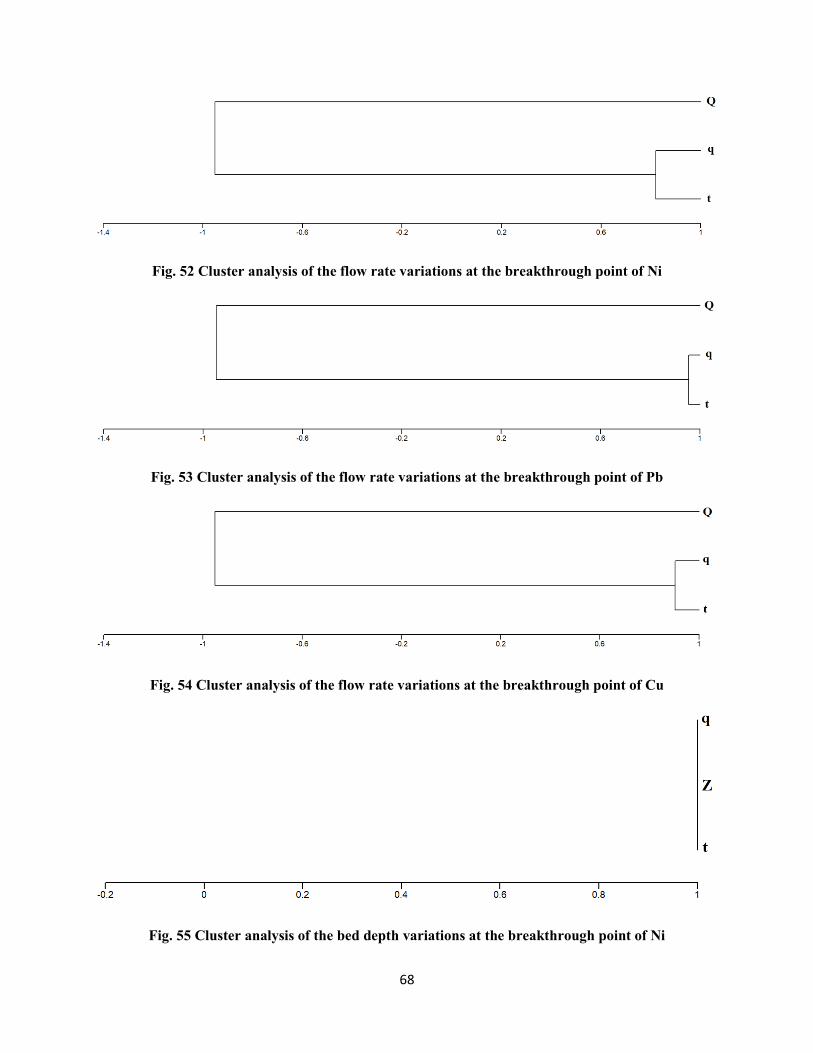
68
Fig. 52 Cluster analysis of the flow rate variations at the breakthrough point of Ni
Fig. 53 Cluster analysis of the flow rate variations at the breakthrough point of Pb
Fig. 54 Cluster analysis of the flow rate variations at the breakthrough point of Cu
Fig. 55 Cluster analysis of the bed depth variations at the breakthrough point of Ni
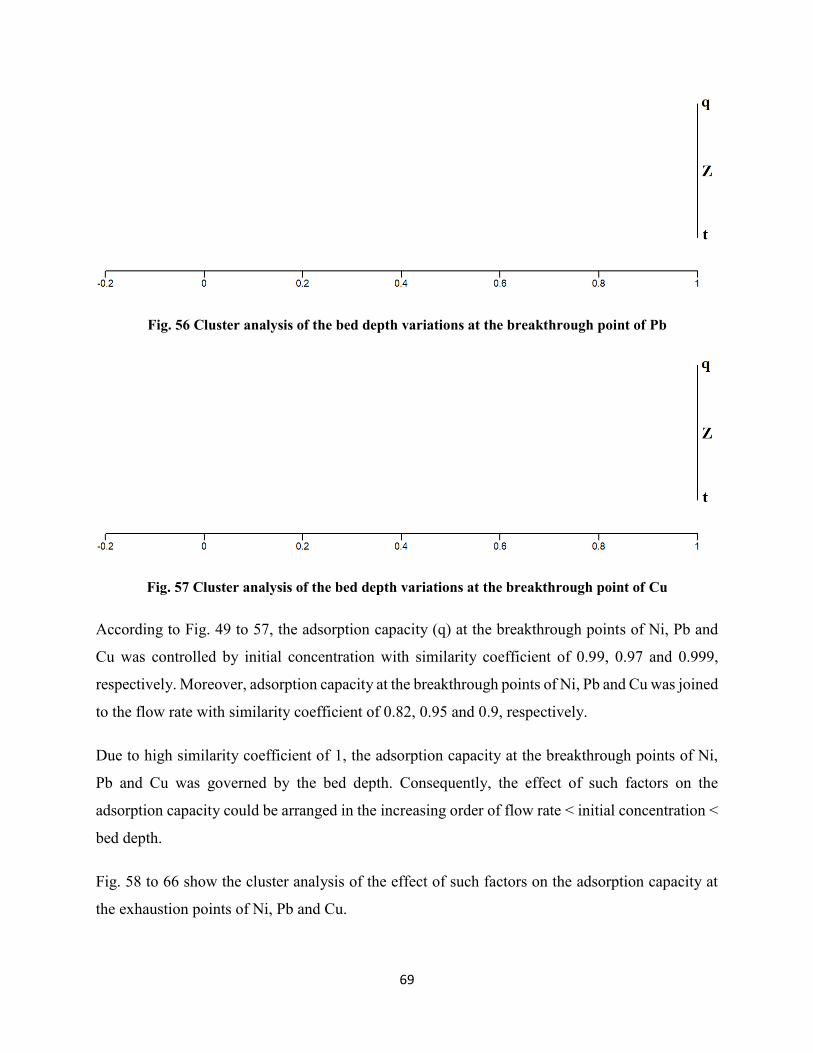
69
Fig. 56 Cluster analysis of the bed depth variations at the breakthrough point of Pb
Fig. 57 Cluster analysis of the bed depth variations at the breakthrough point of Cu
According to Fig. 49 to 57, the adsorption capacity (q) at the breakthrough points of Ni, Pb and
Cu was controlled by initial concentration with similarity coefficient of 0.99, 0.97 and 0.999,
respectively. Moreover, adsorption capacity at the breakthrough points of Ni, Pb and Cu was joined
to the flow rate with similarity coefficient of 0.82, 0.95 and 0.9, respectively.
Due to high similarity coefficient of 1, the adsorption capacity at the breakthrough points of Ni,
Pb and Cu was governed by the bed depth. Consequently, the effect of such factors on the
adsorption capacity could be arranged in the increasing order of flow rate < initial concentration <
bed depth.
Fig. 58 to 66 show the cluster analysis of the effect of such factors on the adsorption capacity at
the exhaustion points of Ni, Pb and Cu.
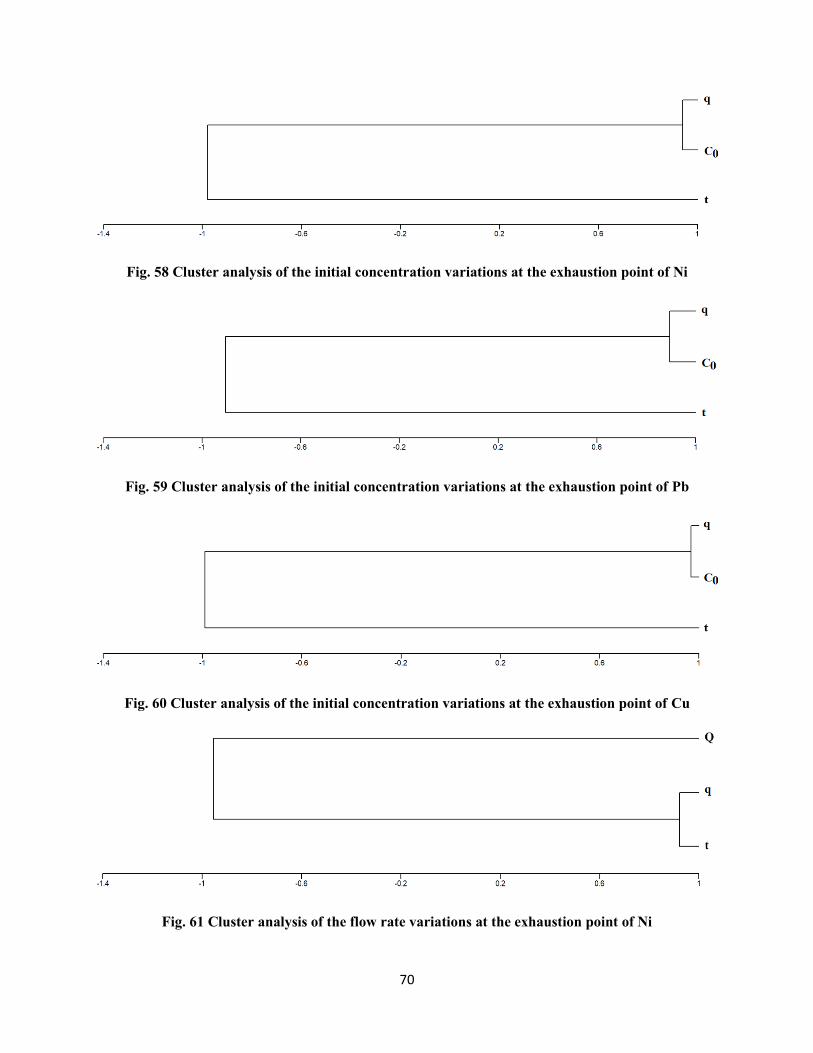
70
Fig. 58 Cluster analysis of the initial concentration variations at the exhaustion point of Ni
Fig. 59 Cluster analysis of the initial concentration variations at the exhaustion point of Pb
Fig. 60 Cluster analysis of the initial concentration variations at the exhaustion point of Cu
Fig. 61 Cluster analysis of the flow rate variations at the exhaustion point of Ni
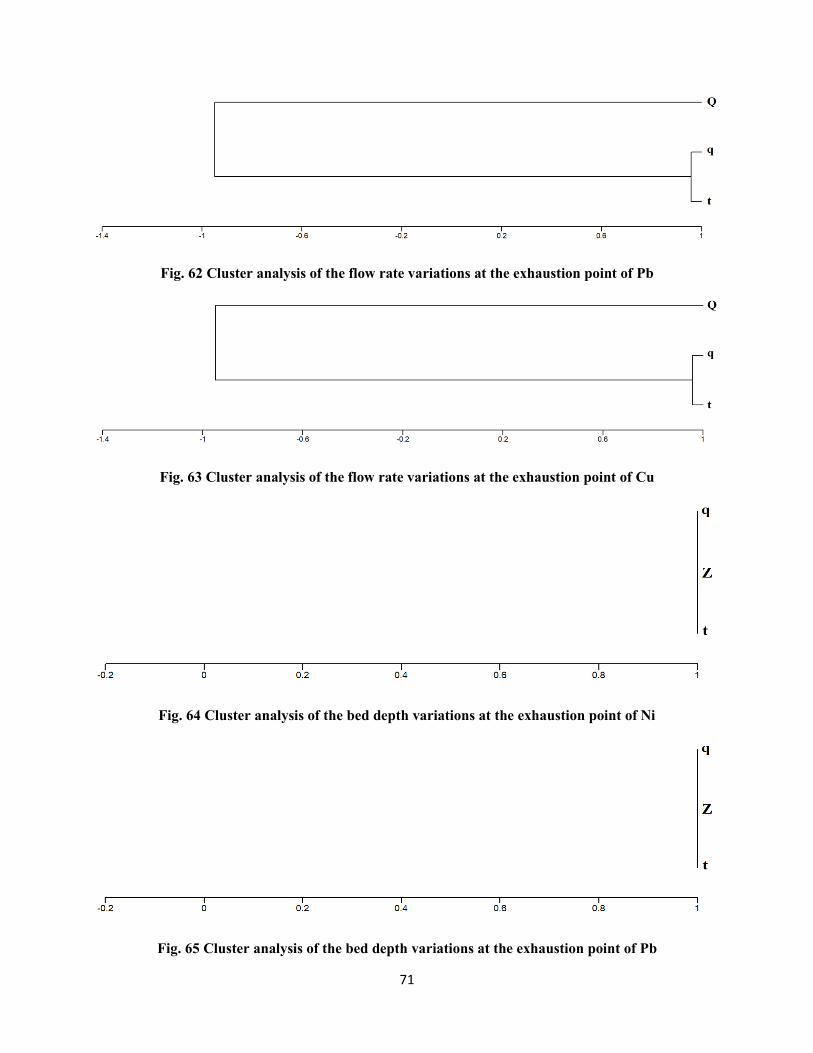
71
Fig. 62 Cluster analysis of the flow rate variations at the exhaustion point of Pb
Fig. 63 Cluster analysis of the flow rate variations at the exhaustion point of Cu
Fig. 64 Cluster analysis of the bed depth variations at the exhaustion point of Ni
Fig. 65 Cluster analysis of the bed depth variations at the exhaustion point of Pb
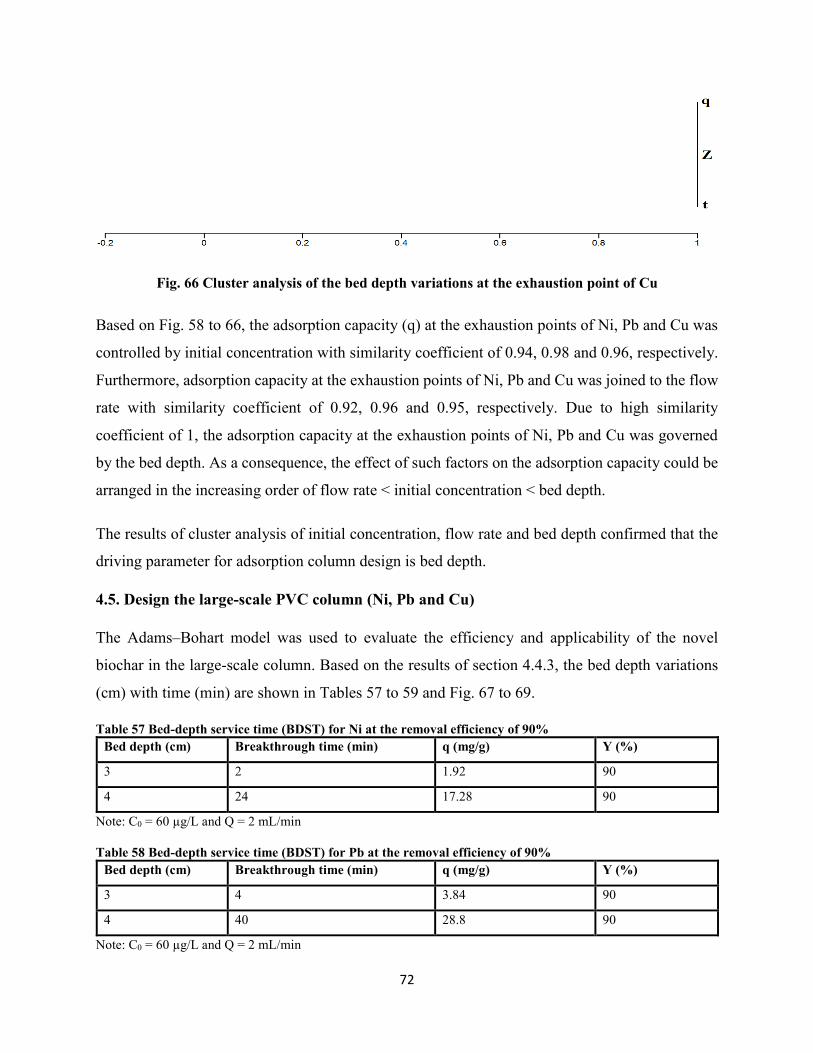
72
Fig. 66 Cluster analysis of the bed depth variations at the exhaustion point of Cu
Based on Fig. 58 to 66, the adsorption capacity (q) at the exhaustion points of Ni, Pb and Cu was
controlled by initial concentration with similarity coefficient of 0.94, 0.98 and 0.96, respectively.
Furthermore, adsorption capacity at the exhaustion points of Ni, Pb and Cu was joined to the flow
rate with similarity coefficient of 0.92, 0.96 and 0.95, respectively. Due to high similarity
coefficient of 1, the adsorption capacity at the exhaustion points of Ni, Pb and Cu was governed
by the bed depth. As a consequence, the effect of such factors on the adsorption capacity could be
arranged in the increasing order of flow rate < initial concentration < bed depth.
The results of cluster analysis of initial concentration, flow rate and bed depth confirmed that the
driving parameter for adsorption column design is bed depth.
4.5. Design the large-scale PVC column (Ni, Pb and Cu)
The Adams–Bohart model was used to evaluate the efficiency and applicability of the novel
biochar in the large-scale column. Based on the results of section 4.4.3, the bed depth variations
(cm) with time (min) are shown in Tables 57 to 59 and Fig. 67 to 69.
Table 57 Bed-depth service time (BDST) for Ni at the removal efficiency of 90% Bed depth (cm) Breakthrough time (min) q (mg/g) Y (%)
3 2 1.92 90
4 24 17.28 90
Note: C0 = 60 µg/L and Q = 2 mL/min
Table 58 Bed-depth service time (BDST) for Pb at the removal efficiency of 90%
Bed depth (cm) Breakthrough time (min) q (mg/g) Y (%)
3 4 3.84 90
4 40 28.8 90
Note: C0 = 60 µg/L and Q = 2 mL/min
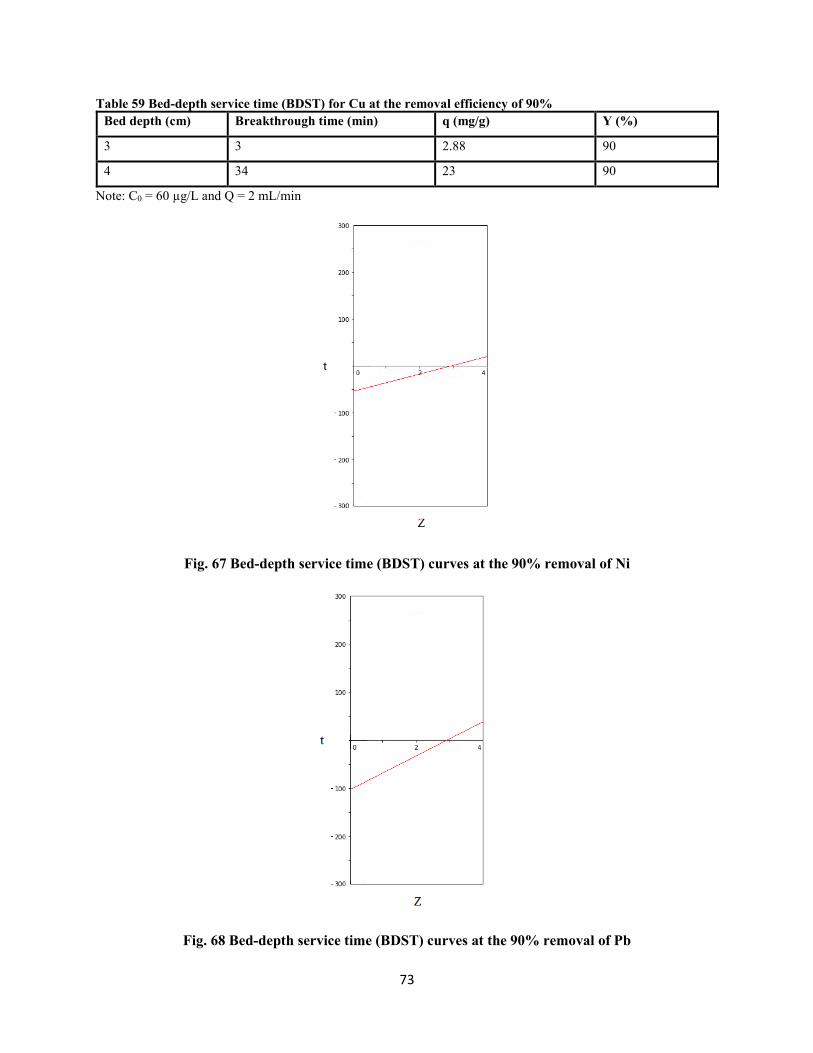
73
Table 59 Bed-depth service time (BDST) for Cu at the removal efficiency of 90%
Bed depth (cm) Breakthrough time (min) q (mg/g) Y (%)
3 3 2.88 90
4 34 23 90
Note: C0 = 60 µg/L and Q = 2 mL/min
Fig. 67 Bed-depth service time (BDST) curves at the 90% removal of Ni
Fig. 68 Bed-depth service time (BDST) curves at the 90% removal of Pb
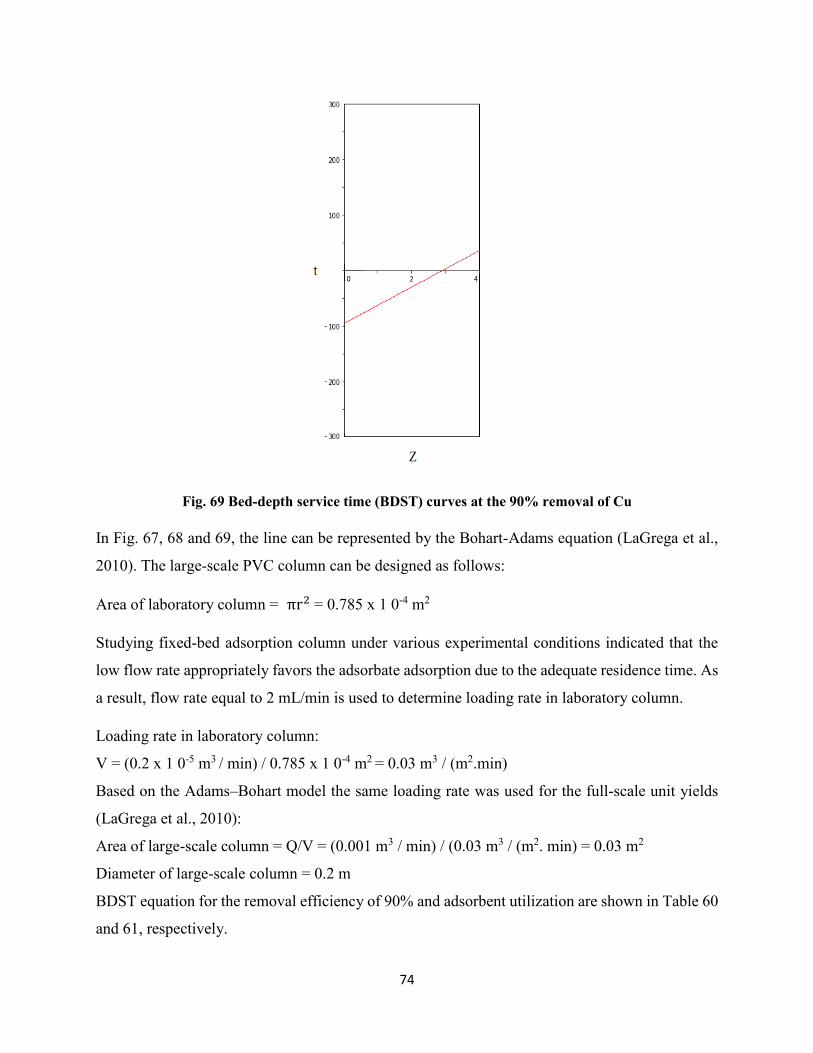
74
Fig. 69 Bed-depth service time (BDST) curves at the 90% removal of Cu
In Fig. 67, 68 and 69, the line can be represented by the Bohart-Adams equation (LaGrega et al.,
2010). The large-scale PVC column can be designed as follows:
Area of laboratory column = πr2= 0.785 x 1 0-4 m2
Studying fixed-bed adsorption column under various experimental conditions indicated that the
low flow rate appropriately favors the adsorbate adsorption due to the adequate residence time. As
a result, flow rate equal to 2 mL/min is used to determine loading rate in laboratory column.
Loading rate in laboratory column:
V = (0.2 x 1 0-5 m3 / min) / 0.785 x 1 0-4 m2 = 0.03 m3 / (m2.min)
Based on the Adams–Bohart model the same loading rate was used for the full-scale unit yields
(LaGrega et al., 2010):
Area of large-scale column = Q/V = (0.001 m3 / min) / (0.03 m3 / (m2. min) = 0.03 m2
Diameter of large-scale column = 0.2 m
BDST equation for the removal efficiency of 90% and adsorbent utilization are shown in Table 60
and 61, respectively.
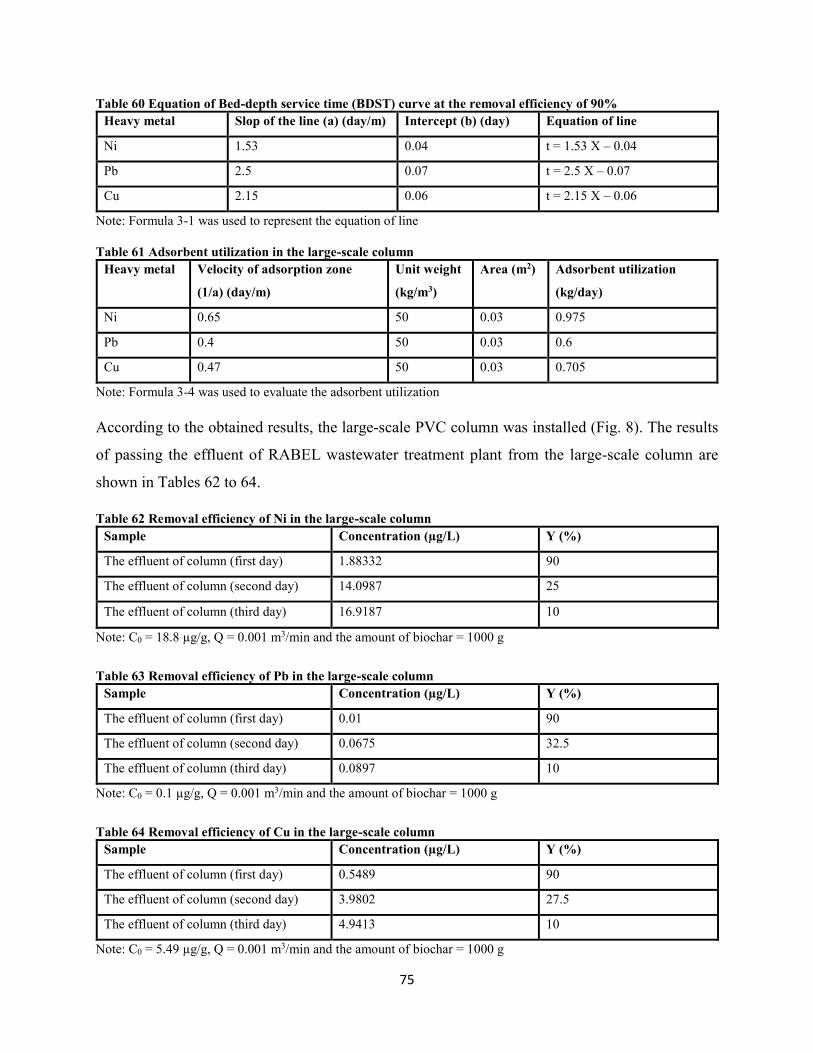
75
Table 60 Equation of Bed-depth service time (BDST) curve at the removal efficiency of 90%
Heavy metal Slop of the line (a) (day/m) Intercept (b) (day) Equation of line
Ni 1.53 0.04 t = 1.53 X – 0.04
Pb 2.5 0.07 t = 2.5 X – 0.07
Cu 2.15 0.06 t = 2.15 X – 0.06
Note: Formula 3-1 was used to represent the equation of line
Table 61 Adsorbent utilization in the large-scale column
Heavy metal Velocity of adsorption zone
(1/a) (day/m)
Unit weight
(kg/m3)
Area (m2) Adsorbent utilization
(kg/day)
Ni 0.65 50 0.03 0.975
Pb 0.4 50 0.03 0.6
Cu 0.47 50 0.03 0.705
Note: Formula 3-4 was used to evaluate the adsorbent utilization
According to the obtained results, the large-scale PVC column was installed (Fig. 8). The results
of passing the effluent of RABEL wastewater treatment plant from the large-scale column are
shown in Tables 62 to 64.
Table 62 Removal efficiency of Ni in the large-scale column Sample Concentration (µg/L) Y (%)
The effluent of column (first day) 1.88332 90
The effluent of column (second day) 14.0987 25
The effluent of column (third day) 16.9187 10
Note: C0 = 18.8 µg/g, Q = 0.001 m3/min and the amount of biochar = 1000 g
Table 63 Removal efficiency of Pb in the large-scale column
Sample Concentration (µg/L) Y (%)
The effluent of column (first day) 0.01 90
The effluent of column (second day) 0.0675 32.5
The effluent of column (third day) 0.0897 10
Note: C0 = 0.1 µg/g, Q = 0.001 m3/min and the amount of biochar = 1000 g
Table 64 Removal efficiency of Cu in the large-scale column
Sample Concentration (µg/L) Y (%)
The effluent of column (first day) 0.5489 90
The effluent of column (second day) 3.9802 27.5
The effluent of column (third day) 4.9413 10
Note: C0 = 5.49 µg/g, Q = 0.001 m3/min and the amount of biochar = 1000 g
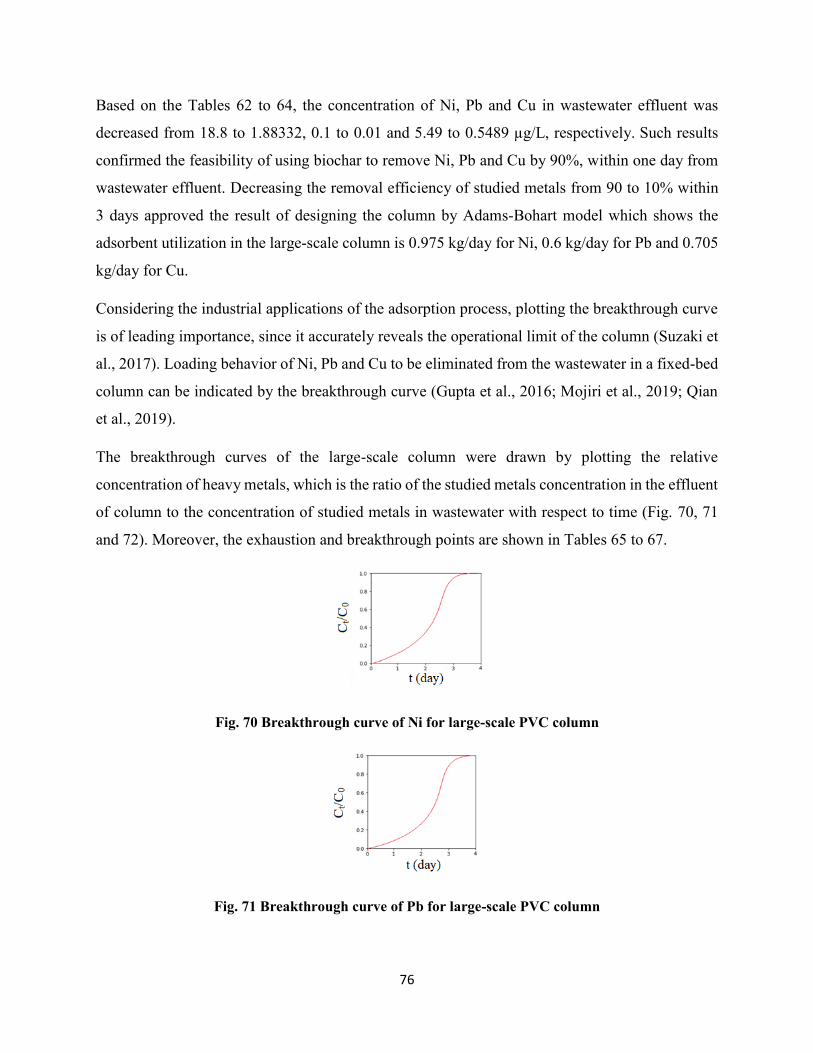
76
Based on the Tables 62 to 64, the concentration of Ni, Pb and Cu in wastewater effluent was
decreased from 18.8 to 1.88332, 0.1 to 0.01 and 5.49 to 0.5489 µg/L, respectively. Such results
confirmed the feasibility of using biochar to remove Ni, Pb and Cu by 90%, within one day from
wastewater effluent. Decreasing the removal efficiency of studied metals from 90 to 10% within
3 days approved the result of designing the column by Adams-Bohart model which shows the
adsorbent utilization in the large-scale column is 0.975 kg/day for Ni, 0.6 kg/day for Pb and 0.705
kg/day for Cu.
Considering the industrial applications of the adsorption process, plotting the breakthrough curve
is of leading importance, since it accurately reveals the operational limit of the column (Suzaki et
al., 2017). Loading behavior of Ni, Pb and Cu to be eliminated from the wastewater in a fixed-bed
column can be indicated by the breakthrough curve (Gupta et al., 2016; Mojiri et al., 2019; Qian
et al., 2019).
The breakthrough curves of the large-scale column were drawn by plotting the relative
concentration of heavy metals, which is the ratio of the studied metals concentration in the effluent
of column to the concentration of studied metals in wastewater with respect to time (Fig. 70, 71
and 72). Moreover, the exhaustion and breakthrough points are shown in Tables 65 to 67.
Fig. 70 Breakthrough curve of Ni for large-scale PVC column
Fig. 71 Breakthrough curve of Pb for large-scale PVC column
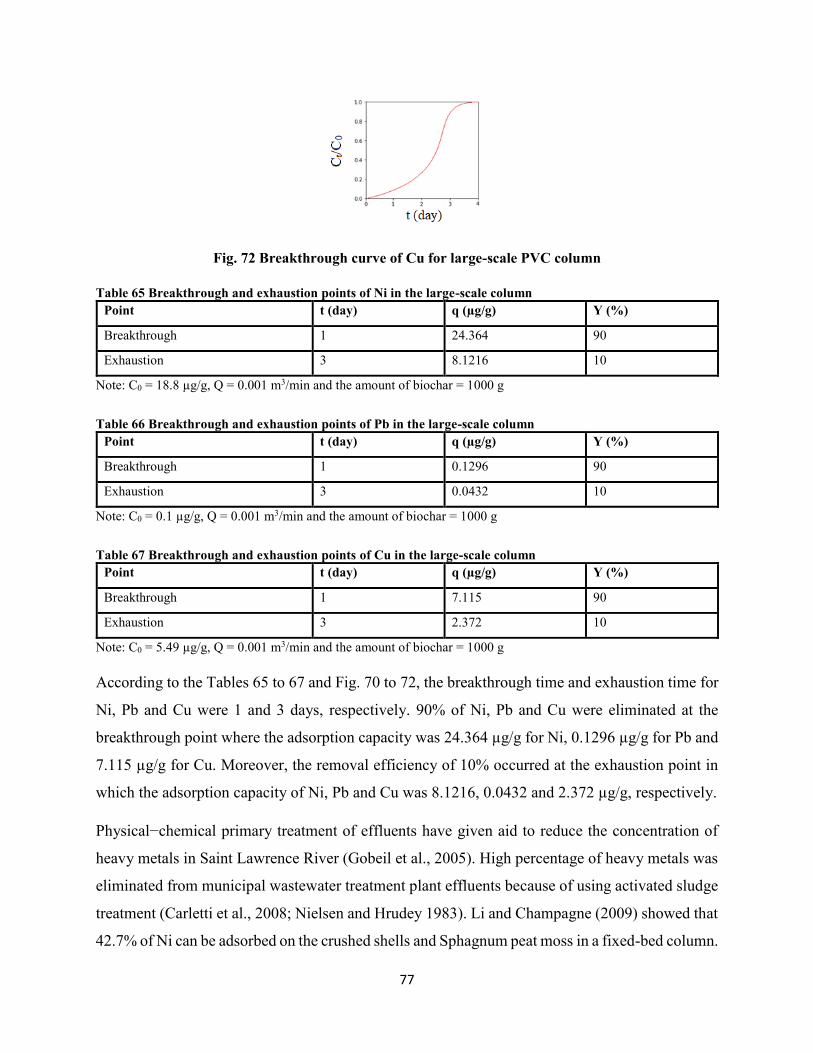
77
Fig. 72 Breakthrough curve of Cu for large-scale PVC column
Table 65 Breakthrough and exhaustion points of Ni in the large-scale column
Point t (day) q (µg/g) Y (%)
Breakthrough 1 24.364 90
Exhaustion 3 8.1216 10
Note: C0 = 18.8 µg/g, Q = 0.001 m3/min and the amount of biochar = 1000 g
Table 66 Breakthrough and exhaustion points of Pb in the large-scale column
Point t (day) q (µg/g) Y (%)
Breakthrough 1 0.1296 90
Exhaustion 3 0.0432 10
Note: C0 = 0.1 µg/g, Q = 0.001 m3/min and the amount of biochar = 1000 g
Table 67 Breakthrough and exhaustion points of Cu in the large-scale column
Point t (day) q (µg/g) Y (%)
Breakthrough 1 7.115 90
Exhaustion 3 2.372 10
Note: C0 = 5.49 µg/g, Q = 0.001 m3/min and the amount of biochar = 1000 g
According to the Tables 65 to 67 and Fig. 70 to 72, the breakthrough time and exhaustion time for
Ni, Pb and Cu were 1 and 3 days, respectively. 90% of Ni, Pb and Cu were eliminated at the
breakthrough point where the adsorption capacity was 24.364 µg/g for Ni, 0.1296 µg/g for Pb and
7.115 µg/g for Cu. Moreover, the removal efficiency of 10% occurred at the exhaustion point in
which the adsorption capacity of Ni, Pb and Cu was 8.1216, 0.0432 and 2.372 µg/g, respectively.
Physical−chemical primary treatment of effluents have given aid to reduce the concentration of
heavy metals in Saint Lawrence River (Gobeil et al., 2005). High percentage of heavy metals was
eliminated from municipal wastewater treatment plant effluents because of using activated sludge
treatment (Carletti et al., 2008; Nielsen and Hrudey 1983). Li and Champagne (2009) showed that
42.7% of Ni can be adsorbed on the crushed shells and Sphagnum peat moss in a fixed-bed column.
78
65 % of nickel was eliminated from wastewater using untreated and treated rice straw (Spurthi et
al., 2015). Maximum nickel adsorption onto boiled sunflower head (BSH) and formaldehyde
sunflower head (FSH) was 65.5 and 75.9%, respectively (Jain et al., 2014).
Pandey and Sharma (2017) showed that the adsoption capacity and removal efficiency of Pb is
8.896 mg/g and 89%, respectively due to utilization of zeoliteNaX in the fixed-bed column. The
removal efficiency of Cu by chicken bone-derived biochar in a fixed-bed column was 17% (Park
et al., 2015).
In Montreal, where chemically enhanced primary treatment is utilized, municipal wastewater plays
an important role in loading a huge percentage of heavy metals into the Saint Lawrence River
(Marcogliese et al., 2015). The significant contribution of urban effluents to the total metal fluxes
carried into the sea by the Saint Lawrence River was demonstrated by measuring heavy metals at
the Montreal wastewater treatment plant (Gobeil et al., 2005). The high risk of heavy metals in
wild freshwater mussels of Grand River (Ontario) was observed due to high concentration of
metals in effluents from municipal wastewater treatment plants (Gillis 2012). Based on the
obtained results from utilization of the large-scale PVC column, the risk of heavy metals to the
aquatic and marine organisms are summarized in Table 68.
Table 68 Risk assessment of heavy metals
Metals Ct (µg/L) Si (µg/L) Wi Qi Wi x Qi HPI Class of risk
Cu 0.5489 1000 0.001 0.05489 0.00005489
3.185 Low Ni 1.88332 20 0.05 9.42 0.471
Pb 0.01 10 0.1 0.1 0.01
Σ Wi = 0.151 Σ Wi x Qi = 0.481
Note: the concentration of Ni, Pb and Cu in wastewater effluent was 1.88332, 0.01 and 0.5489 µg/L, respectively
According to the Table 68, the value of HPI index was decreased from 31.669 to 3.185. In other
words, the pollution intensity of Ni, Pb and Cu was decreased from high risk to low risk to aquatic
and marine organisms. The results acknowledged this fact that the novel biochar in the fixed-bed
column gave aid to eliminate heavy metals from wastewater effluent. Utilization of novel biochar
in full-scale facility will provide a proper position for eliminating heavy metals. As a consequence,
it is expected that such a novel biochar plays a vital role in enriching the condition of Saint
Lawrence River.

Chapter 5: Conclusion and future work
80
5.1. Conclusion
This work demonstrated the feasibility of applying newly produced biochar to adsorption columns
in the wastewater treatment plants. The results showed that biochar which was produced in a
sustainable way from a combination of municipal sludge, wood waste and KOH was able to adsorb
pharmaceuticals (venlafaxine) and inorganic (lead, nickel, and copper) compounds from effluent
of wastewater. Utilization of the waste materials as the primary materials along with the
availability of materials onsite led to the preparation of novel biochar at lower costs. The efficiency
of the novel biochar was confirmed in 3 steps including using biochar in laboratory-scale column
and large-scale column along with risk assessment.
1- The application of biochar in the laboratory-scale column (inner diameter of 1cm and height of
10 cm) was influenced by a wide variety factors including initial concentration of pollutants,
volumetric flow rate of pollutants and the amount of biochar. Thus, increasing the initial
concentration from 10 to 30 mg/L for venlafaxine and 60 to 80 µg/L for heavy metals caused the
adsorption of pollutants on biochar in the column to be on the increase due to providing a greater
driving force. Moreover, increasing the effective bed depth from 3 to 4 cm and decreasing flow
rate from 10 to 2 mL/min led to higher adsorption capacity due to providing additional binding
sites and adequate contact between adsorbate and adsorbent, respectively. The effect of different
factors on the adsorption capacity at the breakthrough and exhaustion points could be arranged in
the increasing order of flow rate < initial concentration < bed depth. As a result, bed depth should
be considered as the most appropriate factor in designing the full-scale facility. 90% of
venlafaxine, Ni, Pb and Cu was eliminated at the breakthrough point where the adsorption capacity
was increased from 0.8 to 5.4 mg/g for venlafaxine, from 1.92 to 18.24 µg/g for Ni, from 3.84 to
30.72 µg/g for Pb, and from 2.88 to 24 µg/g for Cu. The adsorption capacity of heavy metals could
be arranged in the order of Pb > Cu > Ni.
2- Based on the very low concentration and high flow rate of studied pollutants in the effluent of
wastewater treatment, the results of variation of biochar amount were used in the Adams-Bohart
model to design the large-scale column. Applying the large-scale column with area of 0.03 m2 and
biochar utilization of 1 kg/day clearly showed that the effects of lower concentration and higher
flow rate on the adsorption capacity can be compensated by appropriate amount of adsorbent.
Elimination of 95% of venlafaxine and 90% of Ni, Pb and Cu at the breakthrough point within one
81
day from wastewater effluent confirmed the feasibility of using biochar in the large-scale column.
The adsorption capacity at the breakthrough point was 3051.406 ng/g for venlafaxine, 24.364 µg/g
for Ni, 0.1296 µg/g for Pb, and 7.115 µg/g for Cu.
3- RQ and HPI as the proper indexes were used to risk assessment of studied pollutants. RQ > 1
and HPI > 30 showed that the low concentration of venlafaxine and heavy metals in the effluent
of wastewater treatment might pose a serious threat to aquatic and marine organisms and thus
human health. The pollution intensity of venlafaxine, Ni, Pb and Cu to aquatic and marine
organisms was decreased from high risk to low risk due to application of the novel biochar in the
fixed-bed column.
According to the obtained results, utilization of the novel biochar in full-scale facility might be
cost-effective in eliminating organic and inorganic trace pollutants from effluent of wastewater
treatment plant. Thus, it is expected that such a novel biochar plays a vital role in enriching the
condition of water bodies, especially Saint Lawrence River properly.
5.2. Contribution
The contribution of conducting such a project is as follows:
• Risk assessment permitted to be identified that organic and inorganic compounds in the
RABL wastewater treatment plant effluent might be responsible for some irreversible
damages to biota, even at low concentrations. However, application of fixed-bed
adsorption column with novel biochar decreased the pollution intensity of such trace
pollutants from a high risk to low risk.
• This study showed that the most appropriate factor in designing the fixed-bed adsorption
column is bed depth of biochar which influences on the adsorption capacity. Consequently,
bed depth should be considered as the most appropriate factor in designing the full-scale
facility.
• Exposing the large-scale adsorption column to the natural fluctuation of effluent
components contributed to confirm the feasibility of the novel biochar in high removal
efficiency. It was found that the capability of the novel biochar in high removal efficiency
is persistent even at high flow rates and low concentrations.
82
• The study demonstrated that biochar, which was not always produced in optimal operation
conditions at a large scale, preserved its high performance properties. The effluent treated
at large-scale showed as high quality as effluent from small lab treatment of synthetic
wastewater. As a consequence, the sustainable combination of municipal sludge, hardwood
and KOH as the novel biochar can be used in the full-scale facility. Since both types of
waste (municipal sludge and hardwood) are generated in large amounts in Canada, the
elimination of pollutants by using the novel biochar in the full-scale facility will be
remarkably cost effective.
• It is expected that the utilization of the novel biochar in the full-scale facility plays a vital
role in enriching the condition of water bodies, especially Saint Lawrence River
appropriately.
5.3. Future work
The future work might concentrate on the following tasks:
Making use of optimizing methods such as genetic algorithm (GA) in identifying the most
appropriate dimensions for column.
Applying life cycle assessment for assessing environmental impacts associated with all the stages
of utilizing such a column in industrial applications.
Verifying a capacity of the novel biochar at full-scale facility to reduce pharmaceuticals and heavy
metals risks to aquatic and marine organisms
83
References
Abbas, S., & Javed, M. (2016). Growth performance of Labeo rohita under chronic dual exposure of water-borne and
dietary cobalt. Pakistan Journal of Zoology, 48(1), 257-264.
Abdel‐Tawwab, M., Sharafeldin, K. M., & Ismaiel, N. E. M. (2018). Interactive effects of coffee bean supplementation
and waterborne zinc toxicity on growth performance, biochemical variables, antioxidant activity and zinc
bioaccumulation in whole body of common carp, Cyprinus carpio L. Aquaculture Nutrition, 24(1), 123-130.
Abadi, M., Zamani, A., Parizanganeh, A., Khosravi, Y., & Badiee, H. (2018). Heavy metals and arsenic content in
water along the southern Caspian coasts in Iran. Environmental Science and Pollution Research, 25(24), 23725-23735.
Abdolali, A., Ngo, H.H., Guo, W., Zhou, J.L., Zhang, J., Liang, S., Chang, S.W., Nguyen, D.D. and Liu, Y. (2017).
Application of a breakthrough biosorbent for removing heavy metals from synthetic and real wastewaters in a lab-
scale continuous fixed-bed column. Bioresource Technology, 229, 78-87.
Abazari, R., Mahjoub, A. R., & Shariati, J. (2019). Synthesis of a nanostructured pillar MOF with high adsorption
capacity towards antibiotics pollutants from aqueous solution. Journal of Hazardous Materials, 366, 439-451.
Abdullah, E. J. (2013). Quality assessment for Shatt Al-Arab river using heavy metal pollution index and metal index.
Journal of Environment and Earth Science, 3(5), 114-120.
adel Abdel-Khalek, A., Kadry, M., Hamed, A., & Marie, M. A. (2015). Ecotoxicological impacts of zinc metal in
comparison to its nanoparticles in Nile tilapia; Oreochromis niloticus. The Journal of Basic & Applied Zoology, 72,
113-125.
Adeyemi, J. A., da Cunha Martins-Junior, A., & Barbosa Jr, F. (2015). Teratogenicity, genotoxicity and oxidative
stress in zebrafish embryos (Danio rerio) co-exposed to arsenic and atrazine. Comparative Biochemistry and
Physiology Part C: Toxicology & Pharmacology, 172, 7-12.
Afzal, M. Z., Sun, X. F., Liu, J., Song, C., Wang, S. G., & Javed, A. (2018). Enhancement of ciprofloxacin sorption
on chitosan/biochar hydrogel beads. Science of the Total Environment, 639, 560-569.
Agrafioti, E., Bouras, G., Kalderis, D., & Diamadopoulos, E. (2013). Biochar production by sewage sludge pyrolysis.
Journal of Analytical and Applied Pyrolysis, 101, 72-78.
Ahmed, M. J., & Theydan, S. K. (2012). Adsorption of cephalexin onto activated carbons from Albizia lebbeck seed
pods by microwave-induced KOH and K2CO3 activations. Chemical Engineering Journal, 211, 200-207.
Ahmed, S., Pan, J., Ashiq, M. N., Li, D., Tang, P., & Feng, Y. (2019). Ethylene glycol-assisted fabrication and superb
adsorption capacity of hierarchical porous flower-like magnesium oxide microspheres for phosphate. Inorganic
Chemistry Frontiers, 6(8), 1952-1961.
Ahmed, M. J., & Hameed, B. H. (2018a). Removal of emerging pharmaceutical contaminants by adsorption in a fixed-
bed column: a review. Ecotoxicology and Environmental Safety, 149, 257-266.
Ahmad, A. A., & Hameed, B. H. (2010). Fixed-bed adsorption of reactive azo dye onto granular activated carbon
prepared from waste. Journal of Hazardous Materials, 175(1-3), 298-303.
Ahmed, M. B., Zhou, J. L., Ngo, H. H., Guo, W., Thomaidis, N. S., & Xu, J. (2017a) Progress in the biological and
chemical treatment technologies for emerging contaminant removal from wastewater: a critical review. Journal of
Hazardous Materials, 323, 274-298.
84
Ahmed, M. B., Zhou, J. L., Ngo, H. H., Guo, W., Johir, M. A. H., & Sornalingam, K. (2017b). Single and competitive
sorption properties and mechanism of functionalized biochar for removing sulfonamide antibiotics from water.
Chemical Engineering Journal, 311, 348-358.
Ahmed, M. B., Zhou, J. L., Ngo, H. H., Guo, W., Johir, M. A. H., & Belhaj, D. (2017c). Competitive sorption affinity
of sulfonamides and chloramphenicol antibiotics toward functionalized biochar for water and wastewater treatment.
Bioresource Technology, 238, 306-312.
Alalwan, H. A., Abbas, M. N., & Alminshid, A. H. (2020). Uptake of cyanide compounds from aqueous solutions by
lemon peel with utilising the residue absorbent as rodenticide. Indian Chemical Engineer, 62(1), 40-51.
Al-Ghanim, K. A. (2011). Impact of nickel (Ni) on hematological parameters and behavioral changes in Cyprinus
carpio (common carp). African Journal of Biotechnology, 10(63), 13860-13866.
Alimohammadi, Z., Younesi, H., & Bahramifar, N. (2016). Batch and column adsorption of reactive red 198 from
textile industry effluent by microporous activated carbon developed from walnut shells. Waste and Biomass
Valorization, 7(5), 1255-1270.
Alinovi, R., Goldoni, M., Pinelli, S., Campanini, M., Aliatis, I., Bersani, D., Lottici, P.P., Iavicoli, S., Petyx, M.,
Mozzoni, P. and Mutti, A. (2015). Oxidative and pro-inflammatory effects of cobalt and titanium oxide nanoparticles
on aortic and venous endothelial cells. Toxicology in Vitro, 29(3), 426-437.
Alonso, S. G., Catalá, M., Maroto, R. R., Gil, J. L. R., de Miguel, Á. G., & Valcárcel, Y. (2010). Pollution by
psychoactive pharmaceuticals in the Rivers of Madrid metropolitan area (Spain). Environment International, 36(2),
195-201.
AnvariFar, H., Amirkolaie, A.K., Jalali, A.M., Miandare, H.K., Sayed, A.H., Üçüncü, S.İ., Ouraji, H., Ceci, M. and
Romano, N. (2018). Environmental pollution and toxic substances: Cellular apoptosis as a key parameter in a sensible
model like fish. Aquatic Toxicology, 204, 144-159.
Appavu, B., Thiripuranthagan, S., Ranganathan, S., Erusappan, E., & Kannan, K. (2018). BiVO4/N-rGO nano
composites as highly efficient visible active photocatalyst for the degradation of dyes and antibiotics in eco system.
Ecotoxicology and Environmental Safety, 151, 118-126.
Apul, O. G., & Karanfil, T. (2015). Adsorption of synthetic organic contaminants by carbon nanotubes: a critical
review. Water Research, 68, 34-55.
Aslam, S., & Yousafzai, A. M. (2017). Chromium toxicity in fish: A review article. Journal of Entomology and
Zoology Studies, 5(3), 1483-1488.
Ashfaq, M., Khan, K.N., Rehman, M.S.U., Mustafa, G., Nazar, M.F., Sun, Q., Iqbal, J., Mulla, S.I. and Yu, C.P.
(2017). Ecological risk assessment of pharmaceuticals in the receiving environment of pharmaceutical wastewater in
Pakistan. Ecotoxicology and Environmental Safety, 136, 31-39.
Assadian, E., Zarei, M. H., Gilani, A. G., Farshin, M., Degampanah, H., & Pourahmad, J. (2018). Toxicity of copper
oxide (CuO) nanoparticles on human blood lymphocytes. Biological Trace Element Research, 184(2), 350-357.
Assi, M. A., Hezmee, M. N. M., Haron, A. W., Sabri, M. Y. M., & Rajion, M. A. (2016). The detrimental effects of
lead on human and animal health. Veterinary World, 9(6), 660.
Authman, M. M., Zaki, M. S., Khallaf, E. A., & Abbas, H. H. (2015). Use of fish as bio-indicator of the effects of
heavy metals pollution. Journal of Aquaculture Research & Development, 6(4), 1-13.
Azmat, H., Javed, M., Abdullah, S., Javid, A., & Hussain, S. M. (2018). Growth responses of major carps reared under
chronic stress of chromium. Journal of Animal and Plant Sciences, 28(2), 604-609.
85
Backhaus, T., & Faust, M. (2012). Predictive environmental risk assessment of chemical mixtures: a conceptual
framework. Environmental Science & Technology, 46(5), 2564-2573.
Bakar, A., Haslija, A., Abdullah, L. C., Zahri, M., Amirah, N., & Alkhatib, M. A. (2019). Column Efficiency of
Fluoride Removal Using Quaternized Palm Kernel Shell (QPKS). International Journal of Chemical Engineering,
2019, 1-13.
Bakshi, A., & Panigrahi, A. K. (2018). A comprehensive review on chromium induced alterations in fresh water fishes.
Toxicology Reports, 5, 440-447.
Baker, C. O., Huang, X., Nelson, W., & Kaner, R. B. (2017). Polyaniline nanofibers: broadening applications for
conducting polymers. Chemical Society Reviews, 46(5), 1510-1525.
Banerjee, M., Basu, R. K., & Das, S. K. (2019). Cu (II) removal using green adsorbents: kinetic modeling and plant
scale-up design. Environmental Science and Pollution Research, 26(12), 11542-11557.
Basu, M., Guha, A. K., & Ray, L. (2019). Adsorption of Lead on Lentil Husk in Fixed Bed Column Bioreactor.
Bioresource Technology, 283, 86-95.
Bebianno, M. J., & da Fonseca, T. G. (2020). Fate and Effects of Cytostatic Pharmaceuticals in the Marine
Environment. In Fate and Effects of Anticancer Drugs in the Environment (pp. 295-330). Springer, Cham, Switzerland
AG.
Beckers, F., & Rinklebe, J. (2017). Cycling of mercury in the environment: Sources, fate, and human health
implications: A review. Critical Reviews in Environmental Science and Technology, 47(9), 693-794.
Beesley, L., Moreno-Jiménez, E., Gomez-Eyles, J. L., Harris, E., Robinson, B., & Sizmur, T. (2011). A review of
biochars’ potential role in the remediation, revegetation and restoration of contaminated soils. Environmental
Pollution, 159(12), 3269-3282.
Beji, R., Hamdi, W., Kesraoui, A., & Seffen, M. (2018). Adsorption of phosphorus by alkaline Tunisian soil in a fixed
bed column. Water Science and Technology, 78(4), 751-763.
Benaduce, A. P. S., Kochhann, D., Flores, E. M., Dressler, V. L., & Baldisserotto, B. (2008). Toxicity of cadmium for
silver catfish Rhamdia quelen (Heptapteridae) embryos and larvae at different alkalinities. Archives of Environmental
Contamination and Toxicology, 54(2), 274-282.
Bhowmick, S., Pramanik, S., Singh, P., Mondal, P., Chatterjee, D., & Nriagu, J. (2018). Arsenic in groundwater of
West Bengal, India: a review of human health risks and assessment of possible intervention options. Science of the
Total Environment, 612, 148-169.
Billah, M. M., Kamal, A. H. M., Idris, M. H., & Ismail, J. (2017). Mangrove macroalgae as biomonitors of heavy
metal contamination in a tropical estuary, Malaysia. Water, Air, & Soil Pollution, 228(9), 347.
Bikkini, A., & Nanda, P. (2016). Vanadium toxicity to fish Heteropneustes fossilis (Bloch). International Journal of
Fisheries and Aquatic Studies, 4(5), 316-317.
Biswas, J. K., Rai, M., Mondal, M., & Ingle, A. P. (2018). The flop side of using heavy metal (oids) s in the traditional
medicine: toxic insults and injury to human health. In Biomedical Applications of Metals (pp. 257-276). Springer,
Cham, Switzerland AG.
Blair Crawford, C., Quinn, B. (2017). The interactions of microplastics and chemical pollutants. Microplastic
Pollutants, 131-157.
Blaise, C., Gagné, F., Eullaffroy, P., & Férard, J. F. (2006). Ecotoxicity of selected pharmaceuticals of urban origin
discharged to the Saint-Lawrence river (Québec, Canada): a review. Ecotoxicity of selected pharmaceuticals of urban
86
origin discharged to the Saint-Lawrence river (Québec, Canada): a review. Brazilian Journal of Aquatic Science and
Technology, 10, 29-51.
Blewett, T. A., & Leonard, E. M. (2017). Mechanisms of nickel toxicity to fish and invertebrates in marine and
estuarine waters. Environmental Pollution, 223, 311-322.
Blewett, T. A., Ransberry, V. E., McClelland, G. B., & Wood, C. M. (2016). Investigating the mechanisms of Ni
uptake and sub-lethal toxicity in the Atlantic killifish Fundulus heteroclitus in relation to salinity. Environmental
Pollution, 211, 370-381.
Boni, M. R., Chiavola, A., & Marzeddu, S. (2020). Remediation of Lead-Contaminated Water by Virgin Coniferous
Wood Biochar Adsorbent: Batch and Column Application. Water, Air, & Soil Pollution, 231, 1-16.
Bonnefille, B., Gomez, E., Courant, F., Escande, A., & Fenet, H. (2018). Diclofenac in the marine environment: a
review of its occurrence and effects. Marine Pollution Bulletin, 131, 496-506.
Boran, H., & Şaffak, S. (2018). Comparison of Dissolved Nickel and Nickel Nanoparticles Toxicity in Larval
Zebrafish in Terms of Gene Expression and DNA Damage. Archives of Environmental Contamination and
Toxicology, 74(1), 193-202.
Borgia, V. F., Thatheyus, A. J., Murugesan, A. G., Alexander, S. C. P., & Geetha, I. (2018). Effects of effluent from
electoplating industry on the immune response in the freshwater fish, Cyprinus carpio. Fish & Shellfish Immunology,
79, 86-92.
Bosch, A. C., O'Neill, B., Sigge, G. O., Kerwath, S. E., & Hoffman, L. C. (2016). Heavy metals in marine fish meat
and consumer health: a review. Journal of the Science of Food and Agriculture, 96(1), 32-48.
Bozich, J., Hang, M., Hamers, R., & Klaper, R. (2017). Core chemistry influences the toxicity of multicomponent
metal oxide nanomaterials, lithium nickel manganese cobalt oxide, and lithium cobalt oxide to Daphnia magna.
Environmental Toxicology and Chemistry, 36(9), 2493-2502.
Brassesco, M. E., Valetti, N. W., & Picó, G. (2019). Prediction of breakthrough curves in packed-bed column as tool
for lysozyme isolation using a green bed. Polymer Bulletin, 76(11), 5831-5847.
Buekers, J., De Brouwere, K., Lefebvre, W., Willems, H., Vandenbroele, M., Van Sprang, P., Eliat-Eliat, M., Hicks,
K., Schlekat, C.E. and Oller, A.R. (2015). Assessment of human exposure to environmental sources of nickel in
Europe: Inhalation exposure. Science of the Total Environment, 521, 359-371.
Bueno, M. M., Boillot, C., Munaron, D., Fenet, H., Casellas, C., & Gomez, E. (2014). Occurrence of venlafaxine
residues and its metabolites in marine mussels at trace levels: development of analytical method and a monitoring
program. Analytical and Bioanalytical Chemistry, 406(2), 601-610.
Byeon, E., Park, J. C., Hagiwara, A., Han, J., & Lee, J. S. (2020). Two antidepressants fluoxetine and sertraline cause
growth retardation and oxidative stress in the marine rotifer Brachionus koreanus. Aquatic Toxicology, 218, 105337.
Çanlı, M. (2018). A new perspective to aberrations caused by barium and vanadium ions on Lens culinaris Medik.
Ecotoxicology and Environmental Safety, 160, 19-23.
Carletti, G., Fatone, F., Bolzonella, D., & Cecchi, F. (2008). Occurrence and fate of heavy metals in large wastewater
treatment plants treating municipal and industrial wastewaters. Water Science and Technology, 57(9), 1329-1336.
Carson, B. L. (2018). Toxicology biological monitoring of metals in humans. Chapman & Hall, Productivity Press,
Auerbach Publications. Boca Raton, Florida, United States of America.
87
Casas, M. E., Chhetri, R. K., Ooi, G., Hansen, K. M., Litty, K., Christensson, M., Kragelund, C., Andersen, H.R &
Bester, K. (2015). Biodegradation of pharmaceuticals in hospital wastewater by a hybrid biofilm and activated sludge
system (Hybas). Science of the Total Environment, 530, 383-392.
Castro, D., Mieiro, C.L., Coelho, J.P., Guilherme, S., Marques, A., Santos, M.A., Duarte, A.C., Pereira, E. and
Pacheco, M. (2018). Addressing the impact of mercury estuarine contamination in the European eel (Anguilla anguilla
L., 1758)–An early diagnosis in glass eel stage based on erythrocytic nuclear morphology. Marine Pollution Bulletin,
127, 733-742.
Cazan, A. M., & Klerks, P. L. (2015). Effects from a short-term exposure to copper or cadmium in gravid females of
the livebearer fish (Gambusia affinis). Ecotoxicology and Environmental Safety, 118, 199-203.
Cengiz, M. F., Kilic, S., Yalcin, F., Kilic, M., & Yalcin, M. G. (2017). Evaluation of heavy metal risk potential in
Bogacayi River water (Antalya, Turkey). Environmental Monitoring and Assessment, 189(6), 248.
Chatterjee, A., & Abraham, J. (2019). Desorption of heavy metals from metal loaded sorbents and e-wastes: A review.
Biotechnology Letters, 41(3), 319-333.
Chen, H., Guo, Z., Zhou, Y., Li, D., Mu, L., Klerks, P. L., Luo, Y. and Xie, L. (2018). Accumulation, depuration
dynamics and effects of dissolved hexavalent chromium in juvenile Japanese medaka (Oryzias latipes). Ecotoxicology
and Environmental Safety, 148, 254-260.
Chen, T., Luo, L., Deng, S., Shi, G., Zhang, S., Zhang, Y., eng, O., Wang, L., Zhang, J. and Wei, L. (2018a). Sorption
of tetracycline on H3PO4 modified biochar derived from rice straw and swine manure. Bioresource Technology, 267,
431-437.
Chen, S., Yue, Q., Gao, B., Li, Q., Xu, X., & Fu, K. (2012). Adsorption of hexavalent chromium from aqueous solution
by modified corn stalk: a fixed-bed column study. Bioresource Technology, 113, 114-120.
Chin, J. H., & Vora, N. (2014). The global burden of neurologic diseases. Neurology, 83(4), 349-351.
Chiou, Y. H., Wong, R. H., Chao, M. R., Chen, C. Y., Liou, S. H., & Lee, H. (2014). Nickel accumulation in lung
tissues is associated with increased risk of p53 mutation in lung cancer patients. Environmental and Molecular
Mutagenesis, 55(8), 624-632.
Cipro, C. V., Cherel, Y., Bocher, P., Caurant, F., Miramand, P., & Bustamante, P. (2018). Trace elements in
invertebrates and fish from Kerguelen waters, southern Indian Ocean. Polar Biology, 41(1), 175-191.
Corcoll, N., Yang, J., Backhaus, T., Zhang, X., & Eriksson, K. M. (2019). Copper affects composition and functioning
of microbial communities in marine biofilms at environmentally relevant concentrations. Frontiers in Microbiology,
9, 3248.
Coppola, F., Almeida, Â., Henriques, B., Soares, A. M., Figueira, E., Pereira, E., & Freitas, R. (2018). Biochemical
responses and accumulation patterns of Mytilus galloprovincialis exposed to thermal stress and Arsenic
contamination. Ecotoxicology and Environmental Safety, 147, 954-962.
Costigan, M., Cary, R., Dobson, S., & World Health Organization. (2001). Vanadium pentoxide and other inorganic
vanadium compounds. World Health Organization, Geneva, Switzerland.
Cruz, M. A. P., Guimarães, L. C. M., da Costa Júnior, E. F., Rocha, S. D. F., & Mesquita, P. D. L. (2020). Adsorption
of crystal violet from aqueous solution in continuous flow system using bone char. Chemical Engineering
Communications, 207(3), 372-381.
Dabbagh, R., Mirkamali, M. S., & Vafajoo, L. (2019). Removal of Antimony Metalloid From Synthetic Effluent Using
Seaweed as a Low-Cost Natural Sorbent: Adsorption on a Fixed-Bed Column. Journal of Water Chemistry and
Technology, 41(1), 21-28.
88
Dai, L., Wang, Y., Liu, Y., Ruan, R., Duan, D., Zhao, Y., Yu, Z. and Jiang, L. (2019). Catalytic fast pyrolysis of
torrefied corn cob to aromatic hydrocarbons over Ni-modified hierarchical ZSM-5 catalyst. Bioresource Technology,
272, 407-414.
Das R., Das Tuhi S., Zaidi S.M.J. (2018) Adsorption. In: Das R. (eds) Carbon Nanotubes for Clean Water. Carbon
Nanostructures. Springer, Cham, Switzerland AG.
da Silva Aires, M., Paganini, C. L., & Bianchini, A. (2018). Biochemical and physiological effects of nickel in the
euryhaline crab Neohelice granulata (Dana, 1851) acclimated to different salinities. Comparative Biochemistry and
Physiology Part C: Toxicology & Pharmacology, 204, 51-62.
de Angelis, C., Galdiero, M., Pivonello, C., Salzano, C., Gianfrilli, D., Piscitelli, P., Lenzi, A., Colao, A. and Pivonello,
R. (2017). The environment and male reproduction: The effect of cadmium exposure on reproductive function and its
implication in fertility. Reproductive Toxicology, 73, 105-127.
de Franco, M. A. E., de Carvalho, C. B., Bonetto, M. M., de Pelegrini Soares, R., & Féris, L. A. (2017). Removal of
amoxicillin from water by adsorption onto activated carbon in batch process and fixed bed column: Kinetics,
isotherms, experimental design and breakthrough curves modelling. Journal of Cleaner Production, 161, 947-956.
de Namor, A. F. D., El Gamouz, A., Frangie, S., Martinez, V., Valiente, L., & Webb, O. A. (2012). Turning the volume
down on heavy metals using tuned diatomite. A review of diatomite and modified diatomite for the extraction of heavy
metals from water. Journal of Hazardous Materials, 241, 14-31.
Deng, Y., Zhang, T., & Wang, Q. (2017). Biochar adsorption treatment for typical pollutants removal in livestock
wastewater: a review. Engineering Applications of Biochar, 71.
de Water, E., Proal, E., Wang, V., Medina, S.M., Schnaas, L., Téllez-Rojo, M.M., Wright, R.O., Tang, C.Y. and
Horton, M.K. (2018). Prenatal manganese exposure and intrinsic functional connectivity of emotional brain areas in
children. Neurotoxicology, 64, 85-93.
Deokar, S. K., & Mandavgane, S. A. (2015). Estimation of packed-bed parameters and prediction of breakthrough
curves for adsorptive removal of 2, 4-dichlorophenoxyacetic acid using rice husk ash. Journal of Environmental
Chemical Engineering, 3(3), 1827-1836.
Dew, W. A., Azizishirazi, A., & Pyle, G. G. (2014). Contaminant-specific targeting of olfactory sensory neuron
classes: Connecting neuron class impairment with behavioural deficits. Chemosphere, 112, 519-525.
Ding, X., Ye, S., Yuan, H., & Krauss, K. W. (2018). Spatial distribution and ecological risk assessment of heavy
metals in coastal surface sediments in the Hebei Province offshore area, Bohai Sea, China. Marine Pollution Bulletin,
131, 655-661.
Dong, W. Q., Sun, H. J., Zhang, Y., Lin, H. J., Chen, J. R., & Hong, H. C. (2018). Impact on growth, oxidative stress,
and apoptosis-related gene transcription of zebrafish after exposure to low concentration of arsenite. Chemosphere,
211, 648-652.
Doufene, N., Berrama, T., Nekaa, C., & Dadou, S. (2019). Determination of adsorption operating conditions in
dynamic mode on basis of batch study: Application for Dimethylphthalate elimination on activated carbon prepared
from Arundo donax. Chemical Engineering Communications, 206(8), 1015-1034.
Du, L., Yang, J., & Xu, X. (2019). Highly enhanced adsorption of dimethyl disulfide from model oil on MOF-
199/attapulgite composites. Industrial & Engineering Chemistry Research, 58(5), 2009-2016.
Dubey, S. P., Dwivedi, A. D., Lee, C., Kwon, Y. N., Sillanpaa, M., & Ma, L. Q. (2014). Raspberry derived mesoporous
carbon-tubules and fixed-bed adsorption of pharmaceutical drugs. Journal of Industrial and Engineering Chemistry,
20(3), 1126-1132.
89
Duan, Y., Han, D. S., Batchelor, B., & Abdel-Wahab, A. (2016). Application of a reactive adsorbent-coated support
system for removal of mercury (II). Colloids and Surfaces A: Physicochemical and Engineering Aspects, 509, 623-
630.
Duarte, I.A., Reis-Santos, P., Novais, S.C., Rato, L.D., Lemos, M.F., Freitas, A., Pouca, A.S.V., Barbosa, J., Cabral,
H.N. and Fonseca, V.F. (2020). Depressed, hypertense and sore: Long-term effects of fluoxetine, propranolol and
diclofenac exposure in a top predator fish. Science of The Total Environment, 712, 136564.
Edosa, O., Captain, V. E., Festus, N., Brian, M. S., Gadaffi, L., & Kaspar, S. (2019). Assessment of copper levels
along the Namibian marine coastline. GSC Biological and Pharmaceutical Sciences, 7(3), 048-055.
Elbeshti, R. T. A., Elderwish, N. M., Abdelali, K. M. K., & Tastan, Y. (2018). Effects of Heavy Metals on Fish. Menba
Journal of Fisheries Faculty, 2147-2254.
Elia, A.C., Magara, G., Caruso, C., Masoero, L., Prearo, M., Arsieni, P., Caldaroni, B., Dörr, A.J.M., Scoparo, M.,
Salvati, S. and Brizio, P. (2018). A comparative study on subacute toxicity of arsenic trioxide and dimethylarsinic
acid on antioxidant status in Crandell Rees feline kidney (CRFK), human hepatocellular carcinoma (PLC/PRF/5), and
epithelioma papulosum cyprini (EPC) cell lines. Journal of Toxicology and Environmental Health, Part A, 81(10),
333-348.
Einsiedl, F., Radke, M., & Maloszewski, P. (2010). Occurrence and transport of pharmaceuticals in a karst
groundwater system affected by domestic wastewater treatment plants. Journal of Contaminant Hydrology, 117(1-4),
26-36.
Ermolli, M., Menné, C., Pozzi, G., Serra, M. Á., & Clerici, L. A. (2001). Nickel, cobalt and chromium-induced
cytotoxicity and intracellular accumulation in human hacat keratinocytes. Toxicology, 159(1-2), 23-31.
Erşan, M., Bağda, E., & Bağda, E. (2013). Investigation of kinetic and thermodynamic characteristics of removal of
tetracycline with sponge like, tannin based cryogels. Colloids and surfaces B: Biointerfaces, 104, 75-82.
Espejo, W., Padilha, J.D.A., Gonçalves, R.A., Dorneles, P.R., Barra, R., Oliveira, D., Malm, O., Chiang, G. and Celis,
J.E. (2019). Accumulation and potential sources of lead in marine organisms from coastal ecosystems of the Chilean
Patagonia and Antarctic Peninsula area. Marine Pollution Bulletin, 140, 60-64.
Estévez-Calvar, N., Canesi, L., Montagna, M., Faimali, M., Piazza, V., & Garaventa, F. (2017). Adverse effects of the
SSRI antidepressant sertraline on early life stages of marine invertebrates. Marine Environmental Research, 128, 88-
97.
Fabbri, E., & Franzellitti, S. (2016). Human pharmaceuticals in the marine environment: focus on exposure and
biological effects in animal species. Environmental Toxicology and Chemistry, 35(4), 799-812.
Fadzil, F., Ibrahim, S., & Hanafiah, M. A. K. M. (2016). Adsorption of lead (II) onto organic acid modified rubber
leaf powder: batch and column studies. Process Safety and Environmental Protection, 100, 1-8.
Karbassi, A., Fakhraee, M., Vaezi, A., Bashiri, A., & Heidari, M. (2015). An investigation on flocculation, adsorption
and desorption process during mixing of saline water with fresh water (Caspian Sea). Journal of Environmental
Studies, 41(2), 11.
Fakhri, A., & Behrouz, S. (2015). Comparison studies of adsorption properties of MgO nanoparticles and ZnO–MgO
nanocomposites for linezolid antibiotic removal from aqueous solution using response surface methodology. Process
Safety and Environmental Protection, 94, 37-43.
Fang, L., Li, L., Qu, Z., Xu, H., Xu, J., & Yan, N. (2018). A novel method for the sequential removal and separation
of multiple heavy metals from wastewater. Journal of Hazardous Materials, 342, 617-624.
Farajnejad H, Karbassi A, Heidari M (2017) Fate of toxic metals during estuarine mixing of fresh water with saline
water. Environmental Science and Pollution Research 24(35):27430-27435.
90
Faucher, K., Fichet, D., Miramand, P., & Lagardere, J. P. (2008). Impact of chronic cadmium exposure at
environmental dose on escape behaviour in sea bass (Dicentrarchus labrax L.; Teleostei, Moronidae). Environmental
Pollution, 151(1), 148-157.
Fernandes, J., Chandler, J. D., Liu, K. H., Uppal, K., Go, Y. M., & Jones, D. P. (2018). Putrescine as indicator of
manganese neurotoxicity: Dose-response study in human SH-SY5Y cells. Food and Chemical Toxicology, 116, 272-
280.
Fernandes, J., Hao, L., Bijli, K.M., Chandler, J.D., Orr, M., Hu, X., Jones, D.P. and Go, Y.M. (2016). From the cover:
manganese stimulates mitochondrial H2O2 production in SH-SY5Y human neuroblastoma cells over physiologic as
well as toxicologic range. Toxicological Sciences, 155(1), 213-223.
Filler, G., Kobrzynski, M., Sidhu, H. K., Belostotsky, V., Huang, S. H. S., McIntyre, C., & Yang, L. (2017). A cross-
sectional study measuring vanadium and chromium levels in paediatric patients with CKD. BMJ open, 7(5), 1-10.
Fox, K. A., Phillips, T. M., Yanta, J. H., & Abesamis, M. G. (2016). Fatal cobalt toxicity after total hip arthroplasty
revision for fractured ceramic components. Clinical Toxicology, 54(9), 874-877.
Fuentes-Gandara, F., Pinedo-Hernández, J., Marrugo-Negrete, J., & Díez, S. (2018). Human health impacts of
exposure to metals through extreme consumption of fish from the Colombian Caribbean Sea. Environmental
Geochemistry and Health, 40(1), 229-242.
Ferreira, C. I., Calisto, V., Otero, M., Nadais, H., & Esteves, V. I. (2017). Fixed-bed adsorption of Tricaine
Methanesulfonate onto pyrolysed paper mill sludge. Aquacultural Engineering, 77, 53-60.
Fong, J. J., Sreedhara, K., Deng, L., Varki, N. M., Angata, T., Liu, Q., Nizet, V. & Varki, A. (2015).
Immunomodulatory activity of extracellular Hsp70 mediated via paired receptors Siglec‐5 and Siglec‐14. The EMBO
Journal, 34(22), 2775-2788.
Fong, P. P., & Hoy, C. M. (2012). Antidepressants (venlafaxine and citalopram) cause foot detachment from the
substrate in freshwater snails at environmentally relevant concentrations. Marine and Freshwater Behaviour and
Physiology, 45(2), 145-153.
Frontalini, F., Greco, M., Di Bella, L., Lejzerowicz, F., Reo, E., Caruso, A., Cosentino, C., Maccotta, A., Scopelliti,
G., Nardelli, M.P. and Losada, M.T. (2018). Assessing the effect of mercury pollution on cultured benthic foraminifera
community using morphological and eDNA metabarcoding approaches. Marine Pollution Bulletin, 129(2), 512-524.
Fu, Z., Guo, W., Dang, Z., Hu, Q., Wu, F., Feng, C., Zhao, X., Meng, W., Xing, B. and Giesy, J.P. (2017). Refocusing
on nonpriority toxic metals in the aquatic environment in China. Environmental Science and Technology, 51,
3117−3118.
Fu, Z., & Xi, S. (2020). The effects of heavy metals on human metabolism. Toxicology Mechanisms and Methods,
30(3), 167-176.
Futalan, C. M., Kan, C. C., Dalida, M. L., Pascua, C., & Wan, M. W. (2011). Fixed-bed column studies on the removal
of copper using chitosan immobilized on bentonite. Carbohydrate Polymers, 83(2), 697-704.
Gautam, G. J., & Chaube, R. (2018). Differential Effects of Heavy Metals (Cadmium, Cobalt, Lead and Mercury) On
Oocyte Maturation and Ovulation of the Catfish Heteropneustes fossilis: an In Vitro Study. Turkish Journal of
Fisheries and Aquatic Sciences, 18(10), 1205-1214.
Georgin, J., Franco, D. S., Grassi, P., Tonato, D., Piccilli, D. G., Meili, L., & Dotto, G. L. (2019). Potential of Cedrella
fissilis bark as an adsorbent for the removal of red 97 dye from aqueous effluents. Environmental Science and Pollution
Research, 1-13.
91
Ghosh, A., Kaviraj, A., & Saha, S. (2018). Deposition, acute toxicity, and bioaccumulation of nickel in some
freshwater organisms with best-fit functions modeling. Environmental Science and Pollution Research, 25(4), 3588-
3595.
Gobeil, C., Rondeau, B., & Beaudin, L. (2005). Contribution of municipal effluents to metal fluxes in the St. Lawrence
River. Environmental Science & Technology, 39(2), 456-464.
Gokulan, R., Ganesh Prabhu, G., & Jegan, J. (2019). A novel sorbent Ulva lactuca‐derived biochar for remediation of
Remazol Brilliant Orange 3R in packed column. Water Environment Research, 91(7), 642-649.
Gong, J.L., Zhang, Y.L., Jiang, Y., Zeng, G.M., Cui, Z.H., Liu, K., Deng, C.H., Niu, Q.Y., Deng, J.H. and Huan, S.Y.
(2015). Continuous adsorption of Pb (II) and methylene blue by engineered graphite oxide coated sand in fixed-bed
column. Applied Surface Science, 330, 148-157.
Goodnough, L. H., Bala, A., Huddleston III, J. I., Goodman, S. B., Maloney, W. J., & Amanatullah, D. F. (2018).
Metal-on-metal total hip arthroplasty is not associated with cardiac disease. The Bone & Joint Journal, 100(1), 28-32.
Gouran-Orimi, R., Mirzayi, B., Nematollahzadeh, A., & Tardast, A. (2018). Competitive adsorption of nitrate in fixed-
bed column packed with bio-inspired polydopamine coated zeolite. Journal of Environmental Chemical Engineering,
6(2), 2232-2240.
Green, A. J., & Planchart, A. (2018). The neurological toxicity of heavy metals: A fish perspective. Comparative
Biochemistry and Physiology Part C: Toxicology & Pharmacology, 208, 12-19.
Grill, G., Khan, U., Lehner, B., Nicell, J., & Ariwi, J. (2016). Risk assessment of down-the-drain chemicals at large
spatial scales: Model development and application to contaminants originating from urban areas in the Saint Lawrence
River Basin. Science of the Total Environment, 541, 825-838.
Gillis, P. L. (2012). Cumulative impacts of urban runoff and municipal wastewater effluents on wild freshwater
mussels (Lasmigona costata). Science of the Total Environment, 431, 348-356.
Gros, M., Rodríguez-Mozaz, S., & Barceló, D. (2012). Fast and comprehensive multi-residue analysis of a broad range
of human and veterinary pharmaceuticals and some of their metabolites in surface and treated waters by ultra-high-
performance liquid chromatography coupled to quadrupole-linear ion trap tandem mass spectrometry. Journal of
Chromatography A, 1248, 104-121.
Guocheng, L.Ü., Jiao, H., Liu, L., Hongwen, M.A., Qinfang, F.A.N.G., Limei, W.U., Mingquan, W.E.I. and Zhang,
Y. (2011). The adsorption of phenol by lignite activated carbon. Chinese Journal of Chemical Engineering, 19(3),
380-385.
Gupta, A., & Garg, A. (2019). Adsorption and oxidation of ciprofloxacin in a fixed bed column using activated sludge
derived activated carbon. Journal of Environmental Management, 250, 109474.
Gupta, V. K., Tyagi, I., Agarwal, S., Singh, R., Chaudhary, M., Harit, A., & Kushwaha, S. (2016). Column operation
studies for the removal of dyes and phenols using a low-cost adsorbent. Global Journal of Environmental Science and
Management, 2(1), 1-10.
Hadavifar, M., Bahramifar, N., Younesi, H., & Li, Q. (2014). Adsorption of mercury ions from synthetic and real
wastewater aqueous solution by functionalized multi-walled carbon nanotube with both amino and thiolated groups.
Chemical Engineering Journal, 237, 217-228.
Hajilari, M., Shariati, A., & Khosravi-Nikou, M. (2019). Equilibrium and Dynamic Adsorption of Bioethanol on
Activated Carbon in the Liquid Phase. Chemical Engineering & Technology, 42(2), 343-354.
Halm-Lemeille, M. P., & Gomez, E. (2016). Pharmaceuticals in the environment. Environmental Science and
Pollution Research, 23, 4961-4963.
92
Hamilton, P. B., Rolshausen, G., Uren Webster, T. M., & Tyler, C. R. (2017). Adaptive capabilities and fitness
consequences associated with pollution exposure in fish. Philosophical Transactions of the Royal Society B:
Biological Sciences, 372(1712), 20160042.
Han, R., Zhang, J., Zou, W., Xiao, H., Shi, J., & Liu, H. (2006). Biosorption of copper (II) and lead (II) from aqueous
solution by chaff in a fixed-bed column. Journal of Hazardous Materials, 133(1-3), 262-268.
Hanbali, M., Holail, H., & Hammud, H. (2014). Remediation of lead by pretreated red algae: adsorption isotherm,
kinetic, column modeling and simulation studies. Green Chemistry Letters and Reviews, 7(4), 342-358.
Has-Schön, E., Bogut, I., Vuković, R., Galović, D., Bogut, A., & Horvatić, J. (2015). Distribution and age-related
bioaccumulation of lead (Pb), mercury (Hg), cadmium (Cd), and arsenic (As) in tissues of common carp (Cyprinus
carpio) and European catfish (Sylurus glanis) from the Buško Blato reservoir (Bosnia and Herzegovina).
Chemosphere, 135, 289-296.
Hayati, A., Giarti, K., Winarsih, Y., & Amin, M. H. F. (2017). The Effect of Cadmium on Sperm Quality and
Fertilization Of Cyprinus carpio L. Journal of Tropical Biodiversity and Biotechnology, 2(2), 45-50.
Heidari, M. (2019). Role of Natural Flocculation in Eliminating Toxic Metals. Archives of Environmental
Contamination and Toxicology, 76: 366.
Heidari F, Heidari M (2015) Effectiveness of Management of Environmental Education on Improving Knowledge for
Environmental protection (case study: teachers at Tehran’s Elementary School), International Journal of
Environmental Research 9: 1225-1232.
Heidari F, Dabiri F, Heidari M (2017) Legal System Governing on Water Pollution in Iran. Journal of Geoscience and
Environment Protection 5: 36-59.
Hernando, M. D., Mezcua, M., Fernández-Alba, A. R., & Barceló, D. (2006). Environmental risk assessment of
pharmaceutical residues in wastewater effluents, surface waters and sediments. Talanta, 69(2), 334-342.
Hethnawi, A., Nassar, N. N., Manasrah, A. D., & Vitale, G. (2017). Polyethylenimine-functionalized pyroxene
nanoparticles embedded on Diatomite for adsorptive removal of dye from textile wastewater in a fixed-bed column.
Chemical Engineering Journal, 320, 389-404.
Hodkovicova, N., Sehonova, P., Blahova, J., Faldyna, M., Marsalek, P., Mikula, P., Chloupek, P., Dobsikova, R.,
Vecerek, V., Vicenova, M. and Vosmerova, P. (2020). The effect of the antidepressant venlafaxine on gene expression
of biotransformation enzymes in zebrafish (Danio rerio) embryos. Environmental Science and Pollution Research,
27(2), 1686-1696.
Hu, J., Peng, Y., Zheng, T., Zhang, B., Liu, W., Wu, C., Jiang, M., Braun, J.M., Liu, S., Buka, S.L. and Zhou, A.
(2018). Effects of trimester specific exposure to vanadium on ultrasound measures of fetal growth and birth size: a
longitudinal prospective prenatal cohort study. The Lancet Planetary Health, 2(10), e427-e437.
Huggins, T. M., Haeger, A., Biffinger, J. C., & Ren, Z. J. (2016). Granular biochar compared with activated carbon
for wastewater treatment and resource recovery. Water Research, 94, 225-232.
Igberase, E., & Osifo, P. O. (2019). Mathematical modelling and simulation of packed bed column for the efficient
adsorption of Cu (II) ions using modified bio-polymeric material. Journal of Environmental Chemical Engineering,
7(3), 103129.
Ikert, H., & Craig, P. M. (2020). Chronic exposure to venlafaxine and increased water temperature reversibly alters
microRNA in zebrafish gonads (Danio rerio). Comparative Biochemistry and Physiology Part D: Genomics and
Proteomics, 33, 100634.
Ingle, A. P., Paralikar, P., Shende, S., Gupta, I., Biswas, J. K., da Silva Martins, L. H., & Rai, M. (2018). Copper in
Medicine: Perspectives and Toxicity. In Biomedical Applications of Metals (pp. 95-112). Springer, Cham, Switzerland
AG.
93
Inyang, M.I., Gao, B., Yao, Y., Xue, Y., Zimmerman, A., Mosa, A., Pullammanappallil, P., Ok, Y.S. and Cao, X.
(2016). A review of biochar as a low-cost adsorbent for aqueous heavy metal removal. Critical Reviews in
Environmental Science and Technology, 46(4), 406-433.
Izah, S. C., Chakrabarty, N., & Srivastav, A. L. (2016). A review on heavy metal concentration in potable water
sources in Nigeria: Human health effects and mitigating measures. Exposure and Health, 8(2), 285-304.
Jain, M., Garg, V. K., & Kadirvelu, K. (2014). Removal of Ni (II) from aqueous system by chemically modified
sunflower biomass. Desalination and Water Treatment, 52(28-30), 5681-5695.
Jain, M., Garg, V. K., & Kadirvelu, K. (2013). Cadmium (II) sorption and desorption in a fixed bed column using
sunflower waste carbon calcium–alginate beads. Bioresource Technology, 129, 242-248.
Jaishankar, M., Tseten, T., Anbalagan, N., Mathew, B. B., & Beeregowda, K. N. (2014). Toxicity, mechanism and
health effects of some heavy metals. Interdisciplinary Toxicology, 7(2), 60-72.
Jang, J., & Lee, D. S. (2019). Effective phosphorus removal using chitosan/Ca-organically modified montmorillonite
beads in batch and fixed-bed column studies. Journal of Hazardous Materials, 375, 9-18.
Jang, J., Miran, W., Divine, S. D., Nawaz, M., Shahzad, A., Woo, S. H., & Lee, D. S. (2018). Rice straw-based biochar
beads for the removal of radioactive strontium from aqueous solution. Science of the Total Environment, 615, 698-
707.
Jaria, G., Calisto, V., Silva, C. P., Gil, M. V., Otero, M., & Esteves, V. I. (2019). Fixed-bed performance of a waste-
derived granular activated carbon for the removal of micropollutants from municipal wastewater. Science of The Total
Environment, 683, 699-708.
Jin, M., Ji, X., Zhang, B., Sheng, W., Wang, R., & Liu, K. (2019). Synergistic effects of Pb and repeated heat pulse
on developmental neurotoxicity in zebrafish. Ecotoxicology and Environmental Safety, 172, 460-470.
Jing, X. R., Wang, Y. Y., Liu, W. J., Wang, Y. K., & Jiang, H. (2014). Enhanced adsorption performance of
tetracycline in aqueous solutions by methanol-modified biochar. Chemical Engineering Journal, 248, 168-174.
Jose, C. C., Jagannathan, L., Tanwar, V. S., Zhang, X., Zang, C., & Cuddapah, S. (2018). Nickel exposure induces
persistent mesenchymal phenotype in human lung epithelial cells through epigenetic activation of ZEB1. Molecular
Carcinogenesis, 57(6), 794-806.
Karbassi, A. R., Fakhraee, M., Heidari, M., Vaezi, A. R., & Samani, A. V. (2015). Dissolved and particulate trace
metal geochemistry during mixing of Karganrud River with Caspian Sea water. Arabian Journal of Geosciences, 8(4),
2143-2151.
Karbassi AR, Heidari M (2015) An investigation on role of salinity, pH and DO on heavy metals elimination
throughout estuarial mixture. Global Journal of Environmental Science and Management, 1(1), 41-46.
Karbassi, A. R., Heidari, M., Vaezi, A. R., Samani, A. V., Fakhraee, M., & Heidari, F. (2014). Effect of pH and salinity
on flocculation process of heavy metals during mixing of Aras River water with Caspian Sea water. Environmental
Earth Sciences, 72(2), 457-465.
Karbassi AR, Heidari M, Afsari F, Heidari F, Behzadian B (2016) The Individual Effects of Salinity, Voltage and
NaClO on Elimination Efficiency of Metals in Estuary. Academia Journal of Environmental Science 4(11), 201-2012.
Kavianinia, I., Plieger, P. G., Kandile, N. G., & Harding, D. R. (2012). Fixed-bed column studies on a modified
chitosan hydrogel for detoxification of aqueous solutions from copper (II). Carbohydrate Polymers, 90(2), 875-886.
Kaya, H., Aydın, F., Gürkan, M., Yılmaz, S., Ates, M., Demir, V., & Arslan, Z. (2015). Effects of zinc oxide
nanoparticles on bioaccumulation and oxidative stress in different organs of tilapia (Oreochromis niloticus).
Environmental Toxicology and Pharmacology, 40(3), 936-947.
94
Khan, R. K., & Strand, M. A. (2018). Road dust and its effect on human health: a literature review. Epidemiology and
Health, 40, e2018013.
Khairul, I., Wang, Q. Q., Jiang, Y. H., Wang, C., & Naranmandura, H. (2017). Metabolism, toxicity and anticancer
activities of arsenic compounds. Oncotarget, 8(14), 23905.
Khobragade, M. U., & Pal, A. (2016). Fixed-bed column study on removal of Mn (II), Ni (II) and Cu (II) from aqueous
solution by surfactant bilayer supported alumina. Separation Science and Technology, 51(8), 1287-1298.
Khoshdel, Z., Naghibalhossaini, F., Abdollahi, K., Shojaei, S., Moradi, M., & Malekzadeh, M. (2016). Serum copper
and zinc levels among Iranian colorectal cancer patients. Biological Trace Element Research, 170(2), 294-299.
Kim, T. H., Choi, J. Y., Jung, M. M., Oh, S. Y., & Choi, C. Y. (2018). Effects of waterborne copper on toxicity stress
and apoptosis responses in red seabream, Pagrus major. Molecular & Cellular Toxicology, 14(2), 201-210.
Kim, K. H., Kim, J. Y., Cho, T. S., & Choi, J. W. (2012). Influence of pyrolysis temperature on physicochemical
properties of biochar obtained from the fast pyrolysis of pitch pine (Pinus rigida). Bioresource Technology, 118, 158-
162.
Kim, H. S., Kim, Y. J., & Seo, Y. R. (2015). An overview of carcinogenic heavy metal: molecular toxicity mechanism
and prevention. Journal of Cancer Prevention, 20(4), 232.
Klatte, S., Schaefer, H. C., & Hempel, M. (2017). Pharmaceuticals in the environment–a short review on options to
minimize the exposure of humans, animals and ecosystems. Sustainable Chemistry and Pharmacy, 5, 61-66.
Kohzadi, S., Shahmoradi, B., Ghaderi, E., Loqmani, H., & Maleki, A. (2018). Concentration, Source, and Potential
Human Health Risk of Heavy Metals in the Commonly Consumed Medicinal Plants. Biological Trace Element
Research, 187(1), 41-50.
Komjarova, I., & Bury, N. R. (2014). Evidence of common cadmium and copper uptake routes in zebrafish Danio
rerio. Environmental Science & Technology, 48(21), 12946-12951.
Kosma, C. I., Lambropoulou, D. A., & Albanis, T. A. (2014). Investigation of PPCPs in wastewater treatment plants
in Greece: occurrence, removal and environmental risk assessment. Science of the Total Environment, 466, 421-438.
Kovach, W. L. (1999). MVSP-A multivariate statistical Package for Windows, ver. 3.1. Kovach Computing Services,
Pentraeth, Wales, UK, 137.
Kumar, J.A., Amarnath, D.J., Sathish, S., Jabasingh, S.A., Saravanan, A., Hemavathy, R.V., Anand, K.V. and
Yaashikaa, P.R. (2019). Enhanced PAHs removal using pyrolysis-assisted potassium hydroxide induced palm shell
activated carbon: Batch and column investigation. Journal of Molecular Liquids, 279, 77-87.
Kumar, N., Krishnani, K. K., Brahmane, M. P., Gupta, S. K., Kumar, P., & Singh, N. P. (2018). Temperature induces
lead toxicity in Pangasius hypophthalmus: an acute test, antioxidative status and cellular metabolic stress. International
Journal of Environmental Science and Technology, 15(1), 57-68.
Kumar, P., & Singh, A. (2010). Cadmium toxicity in fish: An overview. GERF Bulletin of Biosciences, 1(1), 41-47.
Kumpanenko, I. V., Ivanova, N. A., Dyubanov, M. V., Shapovalova, O. V., Solov’yanov, A. A., & Roshchin, A. V.
(2019). Analysis of Breakthrough Curves of Dynamic Adsorptive Removal of Pollutants from Water. Russian Journal
of Physical Chemistry B, 13(2), 328-338.
La, H., Hettiaratchi, J. P. A., & Achari, G. (2019). The influence of biochar and compost mixtures, water content, and
gas flow rate, on the continuous adsorption of methane in a fixed bed column. Journal of Environmental
Management, 233, 175-183.
95
LaGrega, M. D., Buckingham, P. L., & Evans, J. C. (2010). Hazardous waste management. Waveland Press, Long
Grove, Illinois, United States of America.
Lajeunesse, A., Smyth, S. A., Barclay, K., Sauvé, S., & Gagnon, C. (2012). Distribution of antidepressant residues in
wastewater and biosolids following different treatment processes by municipal wastewater treatment plants in Canada.
Water Research, 46(17), 5600-5612.
Lari, E., Bogart, S. J., & Pyle, G. G. (2018). Fish can smell trace metals at environmentally relevant concentrations in
freshwater. Chemosphere, 203, 104-108.
Lau, L. C., Mohamad Nor, N., Lee, K. T., & Mohamed, A. (2016). Adsorption isotherm, kinetic, thermodynamic and
breakthrough curve models of H2S removal using CeO2/NaOH/PSAC. Petrochemical Science & Engineering, 1(2),
1-10.
Lawal, I. A., & Moodley, B. (2018). Fixed‐Bed and Batch Adsorption of Pharmaceuticals from Aqueous Solutions on
Ionic Liquid‐Modified Montmorillonite. Chemical Engineering & Technology, 41(5), 983-993.
Lee, J.J., Valeri, L., Kapur, K., Ibne Hasan, M.O.S., Quamruzzaman, Q., Wright, R.O., Bellinger, D.C., Christiani,
D.C. and Mazumdar, M. (2018). Growth parameters at birth mediate the relationship between prenatal manganese
exposure and cognitive test scores among a cohort of 2-to 3-year-old Bangladeshi children. International journal of
epidemiology, 47(4), 1169-1179.
Leyssens, L., Vinck, B., Van Der Straeten, C., Wuyts, F., & Maes, L. (2017). Cobalt toxicity in humans—A review
of the potential sources and systemic health effects. Toxicology, 387, 43-56.
Li, C., & Champagne, P. (2009). Fixed-bed column study for the removal of cadmium (II) and nickel (II) ions from
aqueous solutions using peat and mollusk shells. Journal of Hazardous Materials, 171(1-3), 872-878.
Li, Y., Qu, X., Zhang, M., Peng, W., Yu, Y., & Gao, B. (2018). Anthropogenic Impact and Ecological Risk Assessment
of Thallium and Cobalt in Poyang Lake Using the Geochemical Baseline. Water, 10(11), 1703.
Li, G., Liu, Q., Liu, Z., Zhang, Z. C., Li, C., & Wu, W. (2010). Production of calcium carbide from fine biochars.
Angewandte Chemie International Edition, 49(45), 8480-8483.
Liao, P., Zhan, Z., Dai, J., Wu, X., Zhang, W., Wang, K., & Yuan, S. (2013). Adsorption of tetracycline and
chloramphenicol in aqueous solutions by bamboo charcoal: a batch and fixed-bed column study. Chemical
Engineering Journal, 228, 496-505.
Lima, L. F., de Andrade, J. R., da Silva, M. G., & Vieira, M. G. (2017). Fixed bed adsorption of benzene, toluene, and
xylene (BTX) contaminants from monocomponent and multicomponent solutions using a commercial organoclay.
Industrial & Engineering Chemistry Research, 56(21), 6326-6336.
Liu, M., Li, X., Du, Y., & Han, R. (2019). Adsorption of methyl blue from solution using walnut shell and reuse in a
secondary adsorption for Congo red. Bioresource Technology Reports, 5, 238-242.
Liu, A., Wang, C.C., Wang, C.Z., Fu, H.F., Peng, W., Cao, Y.L., Chu, H.Y. and Du, A.F. (2018a). Selective adsorption
activities toward organic dyes and antibacterial performance of silver-based coordination polymers. Journal of Colloid
and Interface Science, 512, 730-739.
Liu, Y., Liu, G., Yuan, Z., Liu, H., & Lam, P. K. (2018). Heavy metals (As, Hg and V) and stable isotope ratios (δ 13
C and δ 15 N) in fish from Yellow River Estuary, China. Science of the Total Environment, 613, 462-471.
Lonappan, L., Rouissi, T., Liu, Y., Brar, S. K., & Surampalli, R. Y. (2019). Removal of diclofenac using microbiochar
fixed-bed column bioreactor. Journal of Environmental Chemical Engineering, 7(1), 102894.
López-Cervantes, J., Sánchez-Machado, D. I., Sánchez-Duarte, R. G., & Correa-Murrieta, M. A. (2018). Study of a
fixed-bed column in the adsorption of an azo dye from an aqueous medium using a chitosan–glutaraldehyde
biosorbent. Adsorption Science & Technology, 36(1-2), 215-232.
96
Ma, R., Wang, B., Lu, S., Zhang, Y., Yin, L., Huang, J., Deng, S., Wang, Y. and Yu, G. (2016). Characterization of
pharmaceutically active compounds in Dongting Lake, China: Occurrence, chiral profiling and environmental risk.
Science of the Total Environment, 557, 268-275.
Machoń-Grecka, A., Dobrakowski, M., Kasperczyk, A., Birkner, E., & Kasperczyk, S. (2020). Angiogenesis and lead
(Pb): is there a connection?. Drug and Chemical Toxicology, 1-5.
Mahato, M. K., Singh, G., Singh, P. K., Singh, A. K., & Tiwari, A. K. (2017). Assessment of mine water quality using
heavy metal pollution index in a coal mining area of Damodar River Basin, India. Bulletin of Environmental
Contamination and Toxicology, 99(1), 54-61.
Majumdar, S., Baishya, A., & Mahanta, D. (2019). Kinetic and Equilibrium Modeling of Anionic Dye Adsorption on
Polyaniline Emeraldine Salt: Batch and Fixed Bed Column Studies. Fibers and Polymers, 20(6), 1226-1235.
Malandrino, P., Russo, M., Ronchi, A., Minoia, C., Cataldo, D., Regalbuto, C., Giordano, C., Attard, M., Squatrito,
S., Trimarchi, F. and Vigneri, R. (2016). Increased thyroid cancer incidence in a basaltic volcanic area is associated
with non-anthropogenic pollution and biocontamination. Endocrine, 53(2), 471-479.
Malve, H. (2016). Exploring the ocean for new drug developments: Marine pharmacology. Journal of Pharmacy &
Bioallied Sciences, 8(2), 83.
Mandal, M. K., Sharma, M., Pandey, S., & Dubey, K. K. (2019). Membrane Technologies for the Treatment of
Pharmaceutical Industry Wastewater. In Water and Wastewater Treatment Technologies (pp. 103-116). Springer,
Singapore.
Manyà, J. J., Azuara, M., & Manso, J. A. (2018). Biochar production through slow pyrolysis of different biomass
materials: Seeking the best operating conditions. Biomass and Bioenergy, 117, 115-123.
Marcogliese, D.J., Blaise, C., Cyr, D., de Lafontaine, Y., Fournier, M., Gagné, F., Gagnon, C. and Hudon, C. (2015).
Effects of a major municipal effluent on the St. Lawrence River: A case study. Ambio, 44(4), 257-274.
Marzbali, M. H., & Esmaieli, M. (2017). Fixed bed adsorption of tetracycline on a mesoporous activated carbon:
Experimental study and neuro-fuzzy modeling. Journal of Applied Research and Technology, 15(5), 454-463.
Maulvault, A.L., Camacho, C., Barbosa, V., Alves, R., Anacleto, P., Pousão-Ferreira, P., Rosa, R., Marques, A. and
Diniz, M.S. (2019). Living in a multi-stressors environment: An integrated biomarker approach to assess the
ecotoxicological response of meagre (Argyrosomus regius) to venlafaxine, warming and acidification. Environmental
Research, 169, 7-25.
Maulvault, A.L., Santos, L.H., Paula, J.R., Camacho, C., Pissarra, V., Fogaça, F., Barbosa, V., Alves, R., Ferreira,
P.P., Barceló, D. and Rodriguez-Mozaz, S. (2018). Differential behavioural responses to venlafaxine exposure route,
warming and acidification in juvenile fish (Argyrosomus regius). Science of The Total Environment, 634, 1136-1147.
McGeer, J. C., Szebedinszky, C., McDonald, D. G., & Wood, C. M. (2000). Effects of chronic sublethal exposure to
waterborne Cu, Cd or Zn in rainbow trout. 1: Iono-regulatory disturbance and metabolic costs. Aquatic Toxicology,
50(3), 231-243.
Melby, E.S., Cui, Y., Borgatta, J., Mensch, A.C., Hang, M.N., Chrisler, W.B., Dohnalkova, A., Van Gilder, J.M.,
Alvarez, C.M., Smith, J.N. and Hamers, R.J. (2018). Impact of lithiated cobalt oxide and phosphate nanoparticles on
rainbow trout gill epithelial cells. Nanotoxicology, 12(10), 1166-1181.
Meng, J., Wang, W. X., Li, L., & Zhang, G. (2018). Tissue-specific molecular and cellular toxicity of Pb in the oyster
(Crassostrea gigas): mRNA expression and physiological studies. Aquatic Toxicology, 198, 257-268.
Menon, N. G., Mohapatra, S., Padhye, L. P., Tatiparti, S. S. V., & Mukherji, S. (2020). Review on Occurrence and
Toxicity of Pharmaceutical Contamination in Southeast Asia. In Emerging Issues in the Water Environment during
Anthropocene (pp. 63-91). Springer, Singapore.
97
Metwally, S. S., El-Sherief, E. A., & Mekhamer, H. S. (2019). Fixed-bed column for the removal of cesium, strontium,
and lead ions from aqueous solutions using brick kiln waste. Separation Science and Technology, 55(4), 635-647.
Meyer, S., Glaser, B., & Quicker, P. (2011). Technical, economical, and climate-related aspects of biochar production
technologies: a literature review. Environmental Science & Technology, 45(22), 9473-9483.
Milivojević, J., Krstić, D., Šmit, B., & Djekić, V. (2016). Assessment of heavy metal contamination and calculation
of its pollution index for Uglješnica River, Serbia. Bulletin of Environmental Contamination and Toxicology, 97(5),
737-742.
Minguez, L., Pedelucq, J., Farcy, E., Ballandonne, C., Budzinski, H., & Halm-Lemeille, M. P. (2016). Toxicities of
48 pharmaceuticals and their freshwater and marine environmental assessment in northwestern France. Environmental
Science and Pollution Research, 23(6), 4992-5001.
Minguez, L., Ballandonne, C., Rakotomalala, C., Dubreule, C., Kientz-Bouchart, V., & Halm-Lemeille, M. P. (2015).
Transgenerational effects of two antidepressants (sertraline and venlafaxine) on Daphnia magna life history traits.
Environmental Science & Technology, 49(2), 1148-1155.
Misson, B., Garnier, C., Lauga, B., Dang, D.H., Ghiglione, J.F., Mullot, J.U., Duran, R. and Pringault, O. (2016).
Chemical multi-contamination drives benthic prokaryotic diversity in the anthropized Toulon Bay. Science of the
Total Environment, 556, 319-329.
Mitra, T., Bar, N., & Das, S. K. (2019). Rice husk: green adsorbent for Pb (II) and Cr (VI) removal from aqueous
solution—column study and GA–NN modeling. SN Applied Sciences, 1(5), 486.
Mizutani, T., & Mizutani, A. (1978). Estimation of adsorption of drugs and proteins on glass surfaces with controlled
pore glass as a reference. Journal of Pharmaceutical Sciences, 67(8), 1102-1105.
Mohan, M. D., & Kasprowicz, M. D. (2016). Identification and Management of Cobalt Toxicity: A Case Report of
Rapidly Progressing Toxicity after Hip Arthroplasty Revision. In The Medicine Forum (Vol. 17, No. 1, p. 18).
Mojiri, A., Vakili, M., Farraji, H., & Aziz, S. Q. (2019). Combined ozone oxidation process and adsorption methods
for the removal of acetaminophen and amoxicillin from aqueous solution; kinetic and optimisation. Environmental
Technology & Innovation, 15, 100404.
Monastero, R., Vacchi-Suzzi, C., Marsit, C., Demple, B., & Meliker, J. (2018). Expression of genes involved in stress,
toxicity, inflammation, and autoimmunity in relation to cadmium, mercury, and lead in human blood: a pilot study.
Toxics, 6(3), 35.
Mondal, S., Aikat, K., & Halder, G. (2016). Ranitidine hydrochloride sorption onto superheated steam activated
biochar derived from mung bean husk in fixed bed column. Journal of Environmental Chemical Engineering, 4(1),
488-497.
Moreira, A., Freitas, R., Figueira, E., Ghirardini, A.V., Soares, A.M., Radaelli, M., Guida, M. and Libralato, G. (2018).
Combined effects of arsenic, salinity and temperature on Crassostrea gigas embryotoxicity. Ecotoxicology and
Environmental Safety, 147, 251-259.
Moreira, A., Figueira, E., Soares, A. M., & Freitas, R. (2016). The effects of arsenic and seawater acidification on
antioxidant and biomineralization responses in two closely related Crassostrea species. Science of the Total
Environment, 545, 569-581.
Moslen, M., & Miebaka, C. A. (2016). Temporal variation of heavy metal concentrations in Periophthalmus sp.
obtained from Azuabie Creek in the upper bonny estuary, Nigeria. Curr Stud Comp Educ Sci Technol, 2, 136-47.
Mukherjee, S. (2017). Histopathological profile of freshwater teleost, channa punctatus exposed to arsenic. Indian
Journal of Scientific Research, 16 (1): 38-42.
98
Nag, S., Bar, N., & Das, S. K. (2019). Sustainable bioremadiation of Cd (II) in fixed bed column using green
adsorbents: Application of Kinetic models and GA-ANN technique. Environmental Technology & Innovation, 13,
130-145.
Naifar, I., Pereira, F., Zmemla, R., Bouaziz, M., Elleuch, B., & Garcia, D. (2018). Spatial distribution and
contamination assessment of heavy metals in marine sediments of the southern coast of Sfax, Gabes Gulf, Tunisia.
Marine Pollution Bulletin, 131, 53-62.
Nair, A., DeGheselle, O., Smeets, K., Van Kerkhove, E., & Cuypers, A. (2013). Cadmium-induced pathologies: where
is the oxidative balance lost (or not)?. International Journal of Molecular Sciences, 14(3), 6116-6143.
Naseri, M., Rahmanikhah, Z., Beiygloo, V., & Ranjbar, S. (2018). Effects of two cooking methods on the
concentrations of some heavy metals (cadmium, lead, chromium, nickel and cobalt) in some rice brands available in
Iranian Market. Journal of Chemical Health Risks, 4(2), 65-72.
Nasseh, N., Barikbin, B., Taghavi, L., & Nasseri, M. A. (2019). Adsorption of metronidazole antibiotic using a new
magnetic nanocomposite from simulated wastewater (isotherm, kinetic and thermodynamic studies). Composites Part
B: Engineering, 159, 146-156.
Nazari, G., Abolghasemi, H., Esmaieli, M., & Pouya, E. S. (2016). Aqueous phase adsorption of cephalexin by walnut
shell-based activated carbon: A fixed-bed column study. Applied Surface Science, 375, 144-153.
Niasar, H. S., Das, S., Xu, C. C., & Ray, M. B. (2019). Continuous column adsorption of naphthenic acids from
synthetic and real oil sands process-affected water (OSPW) using carbon-based adsorbents. Chemosphere, 214, 511-
518.
Nidheesh, P. V., Gandhimathi, R., Ramesh, S. T., & Singh, T. A. (2013). Modeling of crystal violet adsorption by
bottom ash column. Water Environment Research, 85(6), 495-502.
Nielsen, J. S., & Hrudey, S. E. (1983). Metal loadings and removal at a municipal activated sludge plant. Water
Research, 17(9), 1041-1052.
Niu, Y., Ying, D., & Jia, J. (2019). Continuous Adsorption of Copper Ions by Chitosan-Based Fiber in Adsorption
Bed. Journal of Environmental Engineering, 145(8), 04019041.
Noor, N., Zong, G., Seely, E. W., Weisskopf, M., & James-Todd, T. (2018). Urinary cadmium concentrations and
metabolic syndrome in US adults: The National Health and Nutrition Examination Survey 2001–2014. Environment
International, 121, 349-356.
Nordberg, G.F., Bernard, A., Diamond, G.L., Duffus, J.H., Illing, P., Nordberg, M., Bergdahl, I.A., Jin, T. and
Skerfving, S. (2018). Risk assessment of effects of cadmium on human health (IUPAC Technical Report). Pure and
Applied Chemistry, 90(4), 755-808.
Nourouzi, M. M., Chamani, A., Shirani, M., Malekpouri, P., & Chuah, A. L. (2018). Effect of Cd and Pb pollutions
on physiological growth: wavelet neural network (WNN) as a new approach on age determination of Coenobita
scaevola. Bulletin of Environmental Contamination and Toxicology, 101(3), 320-325.
Nunes, B., Daniel, D., Canelas, G. G., Barros, J., & Correia, A. T. (2020). Toxic effects of environmentally realistic
concentrations of diclofenac in organisms from two distinct trophic levels, Hediste diversicolor and Solea
senegalensis. Comparative Biochemistry and Physiology Part C: Toxicology & Pharmacology, 231, 108722.
Nwabanne, J. T., Okoye, A. C., & Lebele-Alawa, B. T. (2012). Packed bed column studies for the removal of lead (ii)
using oil palm empty fruit bunch. European Journal of Scientific Research, 63(2), 296-305.
Ocampo-Perez, R., Leyva-Ramos, R., Mendoza-Barron, J., & Guerrero-Coronado, R. M. (2011). Adsorption rate of
phenol from aqueous solution onto organobentonite: surface diffusion and kinetic models. Journal of Colloid and
Interface Science, 364(1), 195-204.
99
Officioso, A., Panzella, L., Tortora, F., Alfieri, M. L., Napolitano, A., & Manna, C. (2018). Comparative analysis of
the effects of olive oil hydroxytyrosol and its 5-S-lipoyl conjugate in protecting human erythrocytes from mercury
toxicity. Oxidative Medicine and Cellular Longevity, 2018, 1-9.
Ojekunle, O. Z., Ojekunle, O. V., Adeyemi, A. A., Taiwo, A. G., Sangowusi, O. R., Taiwo, A. M., & Adekitan, A. A.
(2016). Evaluation of surface water quality indices and ecological risk assessment for heavy metals in scrap yard
neighbourhood. SpringerPlus, 5(1), 560.
Okoli, C. P., & Ofomaja, A. E. (2019). Development of sustainable magnetic polyurethane polymer nanocomposite
for abatement of tetracycline antibiotics aqueous pollution: Response surface methodology and adsorption dynamics.
Journal of Cleaner Production, 217, 42-55.
Okpala, C. O. R., Sardo, G., Vitale, S., Bono, G., & Arukwe, A. (2018). Hazardous properties and toxicological update
of mercury: From fish food to human health safety perspective. Critical Reviews in Food Science and Nutrition,
58(12), 1986-2001.
Oladipo, A. A., Abureesh, M. A., & Gazi, M. (2016). Bifunctional composite from spent “Cyprus coffee” for
tetracycline removal and phenol degradation: Solar-Fenton process and artificial neural network. International Journal
of Biological Macromolecules, 90, 89-99.
Olivares, C. I., Field, J. A., Simonich, M., Tanguay, R. L., & Sierra-Alvarez, R. (2016). Arsenic (III, V), indium (III),
and gallium (III) toxicity to zebrafish embryos using a high-throughput multi-endpoint in vivo developmental and
behavioral assay. Chemosphere, 148, 361-368.
Ololade, I. A., & Oginni, O. (2010). Toxic stress and hematological effects of nickel on African catfish, Clarias
gariepinus, fingerlings. Journal of Environmental Chemistry and Ecotoxicology, 2(2), 014-019.
Osborne, O.J., Lin, S., Jiang, W., Chow, J., Chang, C.H., Ji, Z., Yu, X., Lin, S., Xia, T. and Nel, A.E. (2017).
Differential effect of micron-versus nanoscale III–V particulates and ionic species on the zebrafish gut. Environmental
Science: Nano, 4(6), 1350-1364.
Olver, J. S., Burrows, G. D., & Norman, T. R. (2004). The treatment of depression with different formulations of
venlafaxine: a comparative analysis. Human Psychopharmacology: Clinical and Experimental, 19(1), 9-16.
Pandey, P. K., & Sharma, S. K. (2017). Removal of Cr (VI) and Pb (II) from Wastewater by ZeoliteNaX in Fixed Bed
Column. Water Conservation Science and Engineering, 2(3), 61-65.
Panneerselvam, K., Marigoudar, S. R., & Dhandapani, M. (2018). Toxicity of Nickel on the Selected Species of
Marine Diatoms and Copepods. Bulletin of Environmental Contamination and Toxicology, 100(3), 331-337.
Palágyi, Š. (2019). Comparison of several models for fitting breakthrough curves of radionuclides transport in crushed
rock: groundwater systems. Journal of Radioanalytical and Nuclear Chemistry, 321(3), 1067-1071.
Park, J.H., Cho, J.S., Ok, Y.S., Kim, S.H., Kang, S.W., Choi, I.W., Heo, J.S., DeLaune, R.D. and Seo, D.C. (2015).
Competitive adsorption and selectivity sequence of heavy metals by chicken bone-derived biochar: batch and column
experiment. Journal of Environmental Science and Health, Part A, 50(11), 1194-1204.
Pastorelli, A.A., Angeletti, R., Binato, G., Mariani, M.B., Cibin, V., Morelli, S., Ciardullo, S. and Stacchini, P. (2018).
Exposure to cadmium through Italian rice (Oryza sativa L.): Consumption and implications for human health. Journal
of Food Composition and Analysis, 69, 115-121.
Patel, H. (2019). Fixed-bed column adsorption study: a comprehensive review. Applied Water Science, 9(3), 45.
Paul, J. S., & Small, B. C. (2019). Exposure to environmentally relevant cadmium concentrations negatively impacts
early life stages of channel catfish (Ictalurus punctatus). Comparative Biochemistry and Physiology Part C:
Toxicology & Pharmacology, 216, 43-51.
100
Paz, S., Burgos, A., Gutiérrez, A., Hernández, C., Lozano, G., Rubio, C., Hardisson, A. (2017). The Mercury: a marine
and food contaminant, 3 (3), 1-55.
Pereira, P., Puga, S., Cardoso, V., Pinto-Ribeiro, F., Raimundo, J., Barata, M., Pousão-Ferreira, P., Pacheco, M. and
Almeida, A. (2016). Inorganic mercury accumulation in brain following waterborne exposure elicits a deficit on the
number of brain cells and impairs swimming behavior in fish (white seabream—Diplodus sargus). Aquatic
Toxicology, 170, 400-412.
Perrodin, Y., & Orias, F. (2017). Ecotoxicity of Hospital Wastewater. In Hospital Wastewaters (pp. 33-47). Springer,
Cham, Switzerland AG.
Philippe, C., Hautekiet, P., Grégoir, A.F., Thoré, E.S., Pinceel, T., Stoks, R., Brendonck, L. and De Boeck, G. (2018).
Combined effects of cadmium exposure and temperature on the annual killifish (Nothobranchius furzeri).
Environmental toxicology and chemistry, 37(9), 2361-2371.
Prichard, E., & Granek, E. F. (2016). Effects of pharmaceuticals and personal care products on marine organisms:
from single-species studies to an ecosystem-based approach. Environmental Science and Pollution Research, 23(22),
22365-22384.
Qi, L., Ma, J., Song, J., Li, S., Cui, X., Peng, X., Wang, W., Ren, Z., Han, M. and Zhang, Y. (2017). The physiological
characteristics of zebra fish (Danio rerio) based on metabolism and behavior: a new method for the online assessment
of cadmium stress. Chemosphere, 184, 1150-1156.
Qian, W., Song, Q., Ding, H., & Xie, W. (2019). Computational simulations of the mass transfer zone in GS adsorption
column packed with Fe3+ type ion exchanger. Chemosphere, 215, 507-514.
Qu, L., Huang, H., Xia, F., Liu, Y., Dahlgren, R. A., Zhang, M., & Mei, K. (2018). Risk analysis of heavy metal
concentration in surface waters across the rural-urban interface of the Wen-Rui Tang River, China. Environmental
Pollution, 237, 639-649.
Radhika, R., Jayalatha, T., Jacob, S., Rajeev, R., & George, B. K. (2018). Adsorption performance of packed bed
column for the removal of perchlorate using modified activated carbon. Process Safety and Environmental Protection,
117, 350-362.
Rafati, L., Ehrampoush, M. H., Rafati, A. A., Mokhtari, M., & Mahvi, A. H. (2019). Fixed bed adsorption column
studies and models for removal of ibuprofen from aqueous solution by strong adsorbent nano-clay composite. Journal
of Environmental Health Science and Engineering, 17(2), 753-765.
Rajeshkumar, S., Liu, Y., Zhang, X., Ravikumar, B., Bai, G., & Li, X. (2018). Studies on seasonal pollution of heavy
metals in water, sediment, fish and oyster from the Meiliang Bay of Taihu Lake in China. Chemosphere, 191, 626-
638.
Rashed, M. N. (2013). Adsorption technique for the removal of organic pollutants from water and wastewater. Organic
pollutants-monitoring, risk and treatment, 167-194.
Rasinger, J. D., Lundebye, A. K., Penglase, S. J., Ellingsen, S., & Amlund, H. (2017). Methylmercury induced
neurotoxicity and the influence of selenium in the brains of adult zebrafish (danio rerio). International Journal of
Molecular Sciences, 18(4), 725.
Ratn, A., Prasad, R., Awasthi, Y., Kumar, M., Misra, A., & Trivedi, S. P. (2018). Zn 2+ induced molecular responses
associated with oxidative stress, DNA damage and histopathological lesions in liver and kidney of the fish, Channa
punctatus (Bloch, 1793). Ecotoxicology and Environmental Safety, 151, 10-20.
Rehrah, D., Bansode, R. R., Hassan, O., & Ahmedna, M. (2016). Physico-chemical characterization of biochars from
solid municipal waste for use in soil amendment. Journal of Analytical and Applied Pyrolysis, 118, 42-53.
Renault, T. (2015). Immunotoxicological effects of environmental contaminants on marine bivalves. Fish & Shellfish
Immunology, 46(1), 88-93.
101
Renu, Agarwal, M., Singh, K., Gupta, R., & Dohare, R. K. (2020). Continuous Fixed-Bed Adsorption of Heavy Metals
Using Biodegradable Adsorbent: Modeling and Experimental Study. Journal of Environmental Engineering, 146(2),
04019110.
Reynel-Avila, H. E., Mendoza-Castillo, D. I., Bonilla-Petriciolet, A., & Silvestre-Albero, J. (2015). Assessment of
naproxen adsorption on bone char in aqueous solutions using batch and fixed-bed processes. Journal of Molecular
Liquids, 209, 187-195.
Rodrigues, J.A.V., Martins, L.R., Furtado, L.M., Xavier, A.L.P., Almeida, F.T.R.D., Moreira, A.L.D.S.L., Melo,
T.M.S., Gil, L.F. and Gurgel, L.V.A. (2020). Oxidized Renewable Materials for the Removal of Cobalt (II) and Copper
(II) from Aqueous Solution Using in Batch and Fixed-Bed Column Adsorption. Advances in Polymer Technology,
2020, 1-17.
Rodríguez‐Moro, G., García‐Barrera, T., Trombini, C., Blasco, J., & Gómez‐Ariza, J. L. (2018). Combination of
HPLC with organic and inorganic mass spectrometry to study the metabolic response of the clam Scrobicularia plana
to arsenic exposure. Electrophoresis, 39(4), 635-644.
Romero‐Cano, L. A., García‐Rosero, H., del Olmo‐Iruela, M., Carrasco‐Marín, F., & González‐Gutiérrez, L. V.
(2019). Amino‐functionalized material from a bio‐template for silver adsorption: process evaluation in batch and fixed
bed. Journal of Chemical Technology & Biotechnology, 94(2), 590-599.
Rosales, E., Meijide, J., Pazos, M., & Sanromán, M. A. (2017). Challenges and recent advances in biochar as low-
cost biosorbent: from batch assays to continuous-flow systems. Bioresource Technology, 246, 176-192.
Rúa-Gómez, P. C., & Püttmann, W. (2012). Occurrence and removal of lidocaine, tramadol, venlafaxine, and their
metabolites in German wastewater treatment plants. Environmental Science and Pollution Research, 19(3), 689-699.
Saadi, Z., Fazaeli, R., Vafajoo, L., Naser, I., & Mohammadi, G. (2020). Promotion of clinoptilolite adsorption for
azithromycin antibiotic by Tween 80 and Triton X-100 surface modifiers under batch and fixed-bed processes.
Chemical Engineering Communications, 6, 1-21.
Saadi, Z., Fazaeli, R., Vafajoo, L., & Naser, I. (2019). Adsorptive removal of apramycin antibiotic from aqueous
solutions using Tween 80-and Triton X-100 modified clinoptilolite: experimental and fixed-bed modeling
investigations. International Journal of Environmental Health Research, 41, 1-26.
Sancho, J. L. S., Rodríguez, A. R., Torrellas, S. Á., & Rodríguez, J. G. (2012). Removal of an emerging pharmaceutical
compound by adsorption in fixed bed column. Desalination and Water Treatment, 45(1-3), 305-314.
Sankararamakrishnan, N., Kumar, P., & Chauhan, V. S. (2008). Modeling fixed bed column for cadmium removal
from electroplating wastewater. Separation and Purification Technology, 63(1), 213-219.
Sangion, A., & Gramatica, P. (2016). Hazard of pharmaceuticals for aquatic environment: prioritization by structural
approaches and prediction of ecotoxicity. Environment International, 95, 131-143.
Saquib, Q., Siddiqui, M.A., Ahmad, J., Ansari, S.M., Faisal, M., Wahab, R., Alatar, A.A., Al-Khedhairy, A.A. and
Musarrat, J. (2018). Nickel Oxide Nanoparticles Induced Transcriptomic Alterations in HEPG2 Cells. In Cellular and
Molecular Toxicology of Nanoparticles (pp. 163-174). Springer, Cham, Switzerland AG.
Sarkar, S., Mukherjee, S., Chattopadhyay, A., & Bhattacharya, S. (2017). Differential modulation of cellular
antioxidant status in zebrafish liver and kidney exposed to low dose arsenic trioxide. Ecotoxicology and
Environmental safety, 135, 173-182.
Sbardella, L., Comas, J., Fenu, A., Rodriguez-Roda, I., & Weemaes, M. (2018). Advanced biological activated carbon
filter for removing pharmaceutically active compounds from treated wastewater. Science of the Total Environment,
636, 519-529.
102
Schiffer, S., & Liber, K. (2017). Estimation of vanadium water quality benchmarks for the protection of aquatic life
with relevance to the Athabasca Oil Sands region using species sensitivity distributions. Environmental toxicology
and chemistry, 36(11), 3034-3044.
Schlesinger, W. H., Klein, E. M., & Vengosh, A. (2017). Global biogeochemical cycle of vanadium. Proceedings of
the National Academy of Sciences, 114(52), E11092-E11100.
Hasan, S. (2011). Design and performance of a pilot submerged membrane electro-bioreactor (SMEBR) for
wastewater treatment (Doctoral dissertation, Concordia University).
Shaheen, S.M., Niazi, N.K., Hassan, N.E., Bibi, I., Wang, H., Tsang, D.C., Ok, Y.S., Bolan, N. and Rinklebe, J. (2019).
Wood-based biochar for the removal of potentially toxic elements in water and wastewater: a critical review.
International Materials Reviews, 64(4), 216-247.
Shahid, M. K., Kim, Y., & Choi, Y. G. (2019). Magnetite synthesis using iron oxide waste and its application for
phosphate adsorption with column and batch reactors. Chemical Engineering Research and Design, 148, 169-179.
Shahzad, K., Khan, M. N., Jabeen, F., Kosour, N., Chaudhry, A. S., Sohail, M., & Ahmad, N. (2018). Toxicity of zinc
oxide nanoparticles (ZnO-NPs) in tilapia (Oreochromis mossambicus): tissue accumulation, oxidative stress,
histopathology and genotoxicity. International Journal of Environmental Science and Technology, 16(4), 1973-1984.
Shanmugam, D., Alagappan, M., & Rajan, R. K. (2016). Bench-scale packed bed sorption of Cibacron blue F3GA
using lucrative algal biomass. Alexandria Engineering Journal, 55(3), 2995-3003.
Singh, C. B., & Ansari, B. A. (2017). Biochemical markers of oxidative stress in brain of zebra fish Danio rerio
exposed to different heavy metals lead and Cobalt. International Journal of Life-Sciences Scientific Research, 3(6),
1484-1494.
Singh, S. K., Katoria, D., Mehta, D., & Sehgal, D. (2015). Fixed bed column study and adsorption modelling on the
adsorption of malachite green dye from wastewater using acid activated sawdust. International Journal of Advanced
Research, 3(7), 521-529.
Sivarajasekar, N., Balasubramani, K., Mohanraj, N., Maran, J. P., Sivamani, S., Koya, P. A., & Karthik, V. (2017).
Fixed-bed adsorption of atrazine onto microwave irradiated Aegle marmelos Correa fruit shell: statistical optimization,
process design and breakthrough modeling. Journal of Molecular Liquids, 241, 823-830.
Sonnack, L., Klawonn, T., Kriehuber, R., Hollert, H., Schäfers, C., & Fenske, M. (2018). Comparative analysis of the
transcriptome responses of zebrafish embryos after exposure to low concentrations of cadmium, cobalt and copper.
Comparative Biochemistry and Physiology Part D: Genomics and Proteomics, 25, 99-108.
Song, Q., & Li, J. (2015). A review on human health consequences of metals exposure to e-waste in China.
Environmental Pollution, 196, 450-461.
Souza, N. L. N., Carneiro, M. T. W. D., Pimentel, E. F., Frossard, A., Freire, J. B., Endringer, D. C., & Júnior, P. D.
F. (2018). Trace elements influence the hatching success and emergence of Caretta caretta and Chelonia mydas.
Journal of Trace Elements in Medicine and Biology, 50, 117-122.
Stankovic, S., Kalaba, P., & Stankovic, A. R. (2014). Biota as toxic metal indicators. Environmental Chemistry
Letters, 12(1), 63-84.
Soto, M. L., Moure, A., Domínguez, H., & Parajó, J. C. (2017). Batch and fixed bed column studies on phenolic
adsorption from wine vinasses by polymeric resins. Journal of Food Engineering, 209, 52-60.
Spurthi L., Brahmaiah T., Sai Prasad K. S., Chandrika K., Kausalya Chandra L., Yashas S. (2015). Removal of nickel
from wastewater using low cost. European Journal of Biomedical and Pharmaceutical Sciences, 2(6), 188-192.
103
Stewart, W. J., Johansen, J. L., & Liao, J. C. (2017). A non-toxic dose of cobalt chloride blocks hair cells of the
zebrafish lateral line. Hearing Research, 350, 17-21.
Su, Y., Zhao, B., Xiao, W., & Han, R. (2013). Adsorption behavior of light green anionic dye using cationic surfactant-
modified wheat straw in batch and column mode. Environmental Science and Pollution Research, 20(8), 5558-5568.
Suzaki, P. Y. R., Munaro, M. T., Triques, C. C., Kleinübing, S. J., Klen, M. R. F., Bergamasco, R., & de Matos Jorge,
L. M. (2017). Phenomenological mathematical modeling of heavy metal biosorption in fixed-bed columns. Chemical
Engineering Journal, 326, 389-400.
Swiatkowska, I., Mosselmans, J.F.W., Geraki, T., Wyles, C.C., Maleszewski, J.J., Henckel, J., Sampson, B., Potter,
D.B., Osman, I., Trousdale, R.T. and Hart, A.J. (2018). Synchrotron analysis of human organ tissue exposed to implant
material. Journal of Trace Elements in Medicine and Biology, 46, 128-137.
Swapna Priya, S., & Radha, K. V. (2016). Fixed-bed column dynamics of tetracycline hydrochloride using commercial
grade activated carbon: comparison of linear and nonlinear mathematical modeling studies. Desalination and Water
Treatment, 57(40), 18964-18980.
Tareq, R., Akter, N., & Azam, M. S. (2019). Biochars and biochar composites: low-cost adsorbents for environmental
remediation. In Biochar from Biomass and Waste (pp. 169-209). Elsevier.
Tsai, W. C., De Luna, M. D. G., Bermillo-Arriesgado, H. L. P., Futalan, C. M., Colades, J. I., & Wan, M. W. (2016).
Competitive fixed-bed adsorption of Pb (II), Cu (II), and Ni (II) from aqueous solution using chitosan-coated
bentonite. International Journal of Polymer Science, 2016, 1-11.
Tien, C. (2018). Introduction to Adsorption: Basics, Analysis, and Applications. Elsevier.
Tiwari, A. K., Singh, P. K., & Mahato, M. K. (2017). Assessment of metal contamination in the mine water of the
West Bokaro Coalfield, India. Mine Water and the Environment, 36(4), 532-541.
ur Rehman, I., Ishaq, M., Ali, L., Khan, S., Ahmad, I., Din, I. U., & Ullah, H. (2018). Enrichment, spatial distribution
of potential ecological and human health risk assessment via toxic metals in soil and surface water ingestion in the
vicinity of Sewakht mines, district Chitral, Northern Pakistan. Ecotoxicology and Environmental Safety, 154, 127-
136.
Vaezi AR, Karbassi AR, Habibzadeh SK, Heidari M, ValikhaniSamani AR (2016) Heavy metal contamination and
risk assessment in riverine sediments. Indian Journal of Geo-Marine Sciences 45(8):1017-1023.
Vaezi AR, Karbassi AR, Fakhraee M, ValikhaniSamani AR, Heidari M (2014) Assessment of Sources and
Concentration of Metal Contaminants in Marine Sediments of Musa Estuary, Persian Gulf. Journal of Environmental
Study, 40 (2), 345-360.
Valcárcel, Y., Alonso, S. G., Rodríguez-Gil, J. L., Gil, A., & Catalá, M. (2011). Detection of pharmaceutically active
compounds in the rivers and tap water of the Madrid Region (Spain) and potential ecotoxicological risk. Chemosphere,
84(10), 1336-1348.
Valikhani Samani A, Karbassi AR, Fakhraeea M, Heidaria M, Vaezia AR, Valikhani Z (2014) Effect of dissolved
organic carbon and salinity on flocculation process of heavy metals during mixing of the Navrud River water with
Caspian Seawater. Desalination and Water Treatment 55(4), 926-934.
Vijaya Bharathi, B., Jaya Prakash, G., Krishna, K. M., Ravi Krishna, C. H., Sivanarayana, T., Madan, K., &
Annapurna, A. (2015). Protective effect of alpha glucosyl hesperidin (G‐hesperidin) on chronic vanadium induced
testicular toxicity and sperm nuclear DNA damage in male Sprague Dawley rats. Andrologia, 47(5), 568-578.
Volesky, B., & Prasetyo, I. (1994). Cadmium removal in a biosorption column. Biotechnology and Bioengineering,
43(11), 1010-1015.
Wahlberg, K., Love, T.M., Pineda, D., Engström, K., Watson, G.E., Thurston, S.W., Yeates, A.J., Mulhern, M.S.,
McSorley, E.M., Strain, J.J. and Smith, T.H. (2018). Maternal polymorphisms in glutathione-related genes are
104
associated with maternal mercury concentrations and early child neurodevelopment in a population with a fish-rich
diet. Environment International, 115, 142-149.
Wanda, E. M., Gulula, L. C., & Phiri, G. (2012). Determination of characteristics and drinking water quality index in
Mzuzu City, Northern Malawi. Physics and Chemistry of the Earth, Parts A/B/C, 50, 92-97.
Wang, T., Shen, C., Wang, N., Dai, J., Liu, Z., & Fei, Z. (2019). Adsorption of 3-Aminoacetanilide from aqueous
solution by chemically modified hyper-crosslinked resins: Adsorption equilibrium, thermodynamics and selectivity.
Colloids and Surfaces A: Physicochemical and Engineering Aspects, 575, 346-351.
Wang, J., Yi, H., Tang, X., Zhao, S., & Gao, F. (2019b). Exceptional Adsorptive Capacity and Kinetic of γ-Al2O3 for
Selective Adsorption of NO assisted by Nonthermal Plasma. Chemical Engineering Journal, 378, 122095.
Wang, M., Tong, Y., Chen, C., Liu, X., Lu, Y., Zhang, W., He, W., Wang, X., Zhao, S. and Lin, Y. (2018). Ecological
risk assessment to marine organisms induced by heavy metals in China's coastal waters. Marine Pollution Bulletin,
126, 349-356.
Wang, W., Li, M., & Zeng, Q. (2015). Adsorption of chromium (VI) by strong alkaline anion exchange fiber in a
fixed-bed column: experiments and models fitting and evaluating. Separation and Purification Technology, 149, 16-
23.
Wang, R. F., Zhu, L. M., Zhang, J., An, X. P., Yang, Y. P., Song, M., & Zhang, L. (2020). Developmental toxicity of
copper in marine medaka (Oryzias melastigma) embryos and larvae. Chemosphere, 125923.
Wazir, S. M., & Ghobrial, I. (2017). Copper deficiency, a new triad: anemia, leucopenia, and myeloneuropathy.
Journal of Community Hospital Internal Medicine Perspectives, 7(4), 265-268.
Wilk, A., Szypulska-Koziarska, D., & Wiszniewska, B. (2017). The toxicity of vanadium on gastrointestinal, urinary
and reproductive system, and its influence on fertility and fetuses malformations. Advances in Hygiene &
Experimental Medicine/Postepy Higieny i Medycyny Doswiadczalnej, 71: 850-859.
Witeska, M., Jezierska, B., & Chaber, J. (1995). The influence of cadmium on common carp embryos and larvae.
Aquaculture, 129(1-4), 129-132.
Wold, M., Beckmann, M., Poitra, S., Espinoza, A., Longie, R., Mersereau, E., Darland, D.C. and Darland, T. (2017).
The longitudinal effects of early developmental cadmium exposure on conditioned place preference and
cardiovascular physiology in zebrafish. Aquatic Toxicology, 191, 73-84.
Wu, X., Wang, Y., Liu, J., Ma, J., & Han, R. (2010). Study of malachite green adsorption onto natural zeolite in a
fixed-bed column. Desalination and Water Treatment, 20(1-3), 228-233.
Wu, Y., & Kong, L. (2020). Advance on toxicity of metal nickel nanoparticles. Environmental Geochemistry and
Health, 25, 1-10.
Wu, X., Liu, C., Qi, H., Zhang, X., Dai, J., Zhang, Q., Zhang, L., Wu, Y. and Peng, X. (2016). Synthesis and adsorption
properties of halloysite/carbon nanocomposites and halloysite-derived carbon nanotubes. Applied Clay Science, 119,
284-293.
Xia, W., Hu, J., Zhang, B., Li, Y., Wise Sr, J.P., Bassig, B.A., Zhou, A., Savitz, D.A., Xiong, C., Zhao, J. and Zhou,
Y. (2016). A case-control study of maternal exposure to chromium and infant low birth weight in China. Chemosphere,
144, 1484-1489.
Xiang, Y., Xu, Z., Wei, Y., Zhou, Y., Yang, X., Yang, Y., Yang, J., Zhang, J., Luo, L. and Zhou, Z. (2019). Carbon-
based materials as adsorbent for antibiotics removal: mechanisms and influencing factors. Journal of Environmental
Management, 237, 128-138.
105
Xing, M., Xu, L., & Wang, J. (2016). Mechanism of Co (II) adsorption by zero valent iron/graphene nanocomposite.
Journal of Hazardous Materials, 301, 286-296.
Xu, J., Church, S.J., Patassini, S., Begley, P., Waldvogel, H.J., Curtis, M.A., Faull, R.L., Unwin, R.D. and Cooper,
G.J. (2017). Evidence for widespread, severe brain copper deficiency in Alzheimer's dementia. Metallomics, 9(8),
1106-1119.
Xu, Q., Zhao, L., Wang, Y., Xie, Q., Yin, D., Feng, X., & Wang, D. (2018). Bioaccumulation characteristics of
mercury in fish in the Three Gorges Reservoir, China. Environmental Pollution, 243, 115-126.
Xu, X. Y., Chu, C., Fu, H., Du, X. D., Wang, P., Zheng, W., & Wang, C. C. (2018a). Light-responsive UiO-66-
NH2/Ag3PO4 MOF-nanoparticle composites for the capture and release of sulfamethoxazole. Chemical Engineering
Journal, 350, 436-444.
Xu, Z., Cai, J. G., & Pan, B. C. (2013). Mathematically modeling fixed-bed adsorption in aqueous systems. Journal
of Zhejiang University Science A, 14(3), 155-176.
Yan, Y. Z., Zheng, W., Huang, D. Z., Xiao, Z. Y., Park, S. S., Ha, C. S., & Zhai, S. R. (2020). Hierarchical multi-
porous carbonaceous beads prepared with nano-CaCO3 in-situ encapsulated hydrogels for efficient batch and column
removal of antibiotics from water. Microporous and Mesoporous Materials, 293, 109830.
Yan, G., Viraraghavan, T., & Chen, M. (2001). A new model for heavy metal removal in a biosorption column.
Adsorption Science & Technology, 19(1), 25-43.
Yang, X., Duan, J., Wang, L., Li, W., Guan, J., Beecham, S., & Mulcahy, D. (2015). Heavy metal pollution and health
risk assessment in the Wei River in China. Environmental Monitoring and Assessment, 187(3), 111.
Yargicoglu, E. N., Sadasivam, B. Y., Reddy, K. R., & Spokas, K. (2015). Physical and chemical characterization of
waste wood derived biochars. Waste Management, 36, 256-268.
Ye, Y., Jiao, J., Kang, D., Jiang, W., Kang, J., Ngo, H.H., Guo, W. and Liu, Y. (2019). The adsorption of phosphate
using a magnesia–pullulan composite: kinetics, equilibrium, and column tests. Environmental Science and Pollution
Research, 26(13), 13299-13310.
Yin, Y., Zhang, P., Yue, X., Du, X., Li, W., Yin, Y., Yi, C. and Li, Y. (2018). Effect of sub-chronic exposure to lead
(Pb) and Bacillus subtilis on Carassius auratus gibelio: bioaccumulation, antioxidant responses and immune responses.
Ecotoxicology and Environmental Safety, 161, 755-762.
Yu, H. Y., Liu, C., Zhu, J., Li, F., Deng, D. M., Wang, Q., & Liu, C. (2016). Cadmium availability in rice paddy fields
from a mining area: the effects of soil properties highlighting iron fractions and pH value. Environmental Pollution,
209, 38-45.
Yu, M., Li, X. J., Ma, Y. X., Liu, R. L., Liu, J. H., & Li, S. M. (2016a). Progress in research on graphene-based
composite supercapacitor materials. Journal of Materials Engineering, 44, 101-111.
Yusuf, M., Song, K., & Li, L. (2020). Fixed bed column and artificial neural network model to predict heavy metals
adsorption dynamic on surfactant decorated graphene. Colloids and Surfaces A: Physicochemical and Engineering
Aspects, 585, 124076.
Zama, E. F., Zhu, Y. G., Reid, B. J., & Sun, G. X. (2017). The role of biochar properties in influencing the sorption
and desorption of Pb (II), Cd (II) and As (III) in aqueous solution. Journal of Cleaner Production, 148, 127-136.
Zhang, Y., Jin, F., Shen, Z., Wang, F., Lynch, R., & Al-Tabbaa, A. (2019). Adsorption of methyl tert-butyl ether
(MTBE) onto ZSM-5 zeolite: Fixed-bed column tests, breakthrough curve modelling and
regeneration. Chemosphere, 220, 422-431.
106
Zhang, J., Khan, M. A., Xia, M., Abdo, A. M., Lei, W., Liao, C., & Wang, F. (2019b). Facile hydrothermal synthesis
of magnetic adsorbent CoFe 2 O 4/MMT to eliminate antibiotics in aqueous phase: tetracycline and ciprofloxacin.
Environmental Science and Pollution Research, 26(1), 215-226.
Zhang, H., Chang, Q., Han, J., Gao, S., Wu, Z., Hu, J., Yang, Y., Wei, Z., Zhang, D. and Peng, Z. (2019c). A facile
synthesis of two engineered poly (vinyl alcohol) macroporous hydrogel beads for the application of Cu (II) and Pb
(II) removal: batch and fixed bed column. Materials Research Express, 6(9), 095315.
Zhang, X., Bai, B., Puma, G. L., Wang, H., & Suo, Y. (2016). Novel sea buckthorn biocarbon SBC@ β-FeOOH
composites: efficient removal of doxycycline in aqueous solution in a fixed-bed through synergistic adsorption and
heterogeneous Fenton-like reaction. Chemical Engineering Journal, 284, 698-707.
Zhang, Y., Geißen, S. U., & Gal, C. (2008). Carbamazepine and diclofenac: removal in wastewater treatment plants
and occurrence in water bodies. Chemosphere, 73(8), 1151-1161.
Zhao, Y., Li, R., & Lin, Y. (2015). Allograft inflammatory factor-1 in grass carp (Ctenopharynogodon idella):
Expression and response to cadmium exposure. Fish & Shellfish Immunology, 47(1), 444-449.
Zheng, J. L., Yuan, S. S., Wu, C. W., & Lv, Z. M. (2016). Acute exposure to waterborne cadmium induced oxidative
stress and immunotoxicity in the brain, ovary and liver of zebrafish (Danio rerio). Aquatic Toxicology, 180, 36-44.
Zhong, W., Zhang, Y., Wu, Z., Yang, R., Chen, X., Yang, J., & Zhu, L. (2018). Health risk assessment of heavy metals
in freshwater fish in the central and eastern North China. Ecotoxicology and Environmental Safety, 157, 343-349.
Zhou, H., Wu, C., Huang, X., Gao, M., Wen, X., Tsuno, H., & Tanaka, H. (2010). Occurrence of selected
pharmaceuticals and caffeine in sewage treatment plants and receiving rivers in Beijing, China. Water Environment
Research, 82(11), 2239-2248.
Zhu, Z., Wu, P., Liu, G., He, X., Qi, B., Zeng, G., Wang, W., Sun, Y. and Cui, F. (2017). Ultrahigh adsorption capacity
of anionic dyes with sharp selectivity through the cationic charged hybrid nanofibrous membranes. Chemical
Engineering Journal, 313, 957-966.
Zhu, Z., Li, G., Zeng, G., Chen, X., Hu, D., Zhang, Y., & Sun, Y. (2015). Fast capture of methyl-dyes over hierarchical
amino-Co 0.3 Ni 0.7 Fe 2 O 4@ SiO 2 nanofibrous membranes. Journal of Materials Chemistry A, 3(44), 22000-
22004.
Zimmer, A. M., Barcarolli, I. F., Wood, C. M., & Bianchini, A. (2012). Waterborne copper exposure inhibits ammonia
excretion and branchial carbonic anhydrase activity in euryhaline guppies acclimated to both fresh water and sea
water. Aquatic Toxicology, 122, 172-180.
Zojajy Pourya. 2020. Production of micro-mesoporous alternative carbonaceous adsorbents for high-efficiency
sorption of the emerging organic micropollutants from wastewater effluent. MASc thesis, Concordia University
Zojaji, P., Alhachami, H, Kariminezhad, E., Jauffur, S, Bakhshi, Z., Vaudri, MA., Sauvé, S., and Elektorowicz, M.
(2019). Occurrence of organic micropollutants in the Saint Lawrence River. CSCE Conference Proceedings. Laval,
QC.
Zojaji, P., Alhachami, H, Kariminezhad, E., Jauffur, S, Bakhshi, Z., Vaudri, MA., Sauvé, S., and Elektorowicz, M.
(2019a ). Presence of venlafaxine, a psychiatric drug, in the vicinity of a wastewater treatment plant outfall’ 54th
Central Canadian Symposium on Water Quality Research, Toronto, Ontario, Canada.
Zojaji, P., Alhachami, H, Kariminezhad, E., Jauffur, S, Bakhshi, Z., Vaudri, MA., Sauvé, S., and Elektorowicz, M.
(2019b). Occurrence of psychiatric drugs in the spring flooding of the Saint Lawrence River, 33th Eastern Canadian
Symposium on Water Quality Research, Montreal, Quebec, Canada.
Zulfadhly, Z., Mashitah, M. D., & Bhatia, S. (2001). Heavy metals removal in fixed-bed column by the macro fungus
Pycnoporus sanguineus. Environmental Pollution, 112(3), 463-470.
107
Zuo, T. T., Li, Y. L., Jin, H. Y., Gao, F., Wang, Q., Wang, Y. D., & Ma, S. C. (2018). HPLC–ICP-MS speciation
analysis and risk assessment of arsenic in Cordyceps sinensis. Chinese Medicine, 13(1), 19.
Zwolak, I., & Gołębiowska, D. (2018). Protective activity of pyruvate against vanadium-dependent cytotoxicity in
Chinese hamster ovary (CHO-K1) cells. Toxicology and Industrial Health, 34(5), 283-292.


