Embed Size (px)
Citation preview

Regional Adiposity and Risk for Coronary Artery Disease inType 1 Diabetes: Does Having Greater Amounts of Lower BodyAdiposity Lower the Risk?
Christina M. Shay, PhD1,3, Aaron M. Secrest, MPH1, Bret H. Goodpaster, PhD2, Sheryl F.Kelsey, PhD1, Elsa S. Strotmeyer, PhD1, and Trevor J. Orchard, MD11Department of Epidemiology, Graduate School of Public Health, University of Pittsburgh,Pittsburgh, Pennsylvania, USA2Department of Medicine, University of Pittsburgh School of Medicine, University of Pittsburgh,Pittsburgh, Pennsylvania, USA3Department of Preventative Medicine, Fienberg School of Medicine, Northwestern University,Chicago, Illinois, USA
AbstractAIMS—Evidence suggests that gluteal-femoral adiposity may be inversely associated withcoronary artery disease (CAD) risk; however, this association has not been evaluated in type 1diabetes (T1D).
METHODS—The relationship between regional adiposity, cardiovascular risk factors, andpresence of CAD was examined in participants from the Pittsburgh Epidemiology of DiabetesComplications (EDC) study using data collected from the 18-year exam (n=163). Total andregional adiposity was assessed by dual x-ray absorptiometry (DEXA).
RESULTS—Participants with CAD exhibited lower % leg fat mass (FM) (33.42 vs. 36.96,p=0.006) and higher % trunk FM (48.33 vs. 45.18, p=0.02), respectively, after adjusting for age,sex, height, and total adiposity compared to those without CAD. Multivariate logistic regressionanalyses revealed that in females, every 1 SD increase in % leg FM was associated with anapproximate 60% reduction in CAD risk (OR=0.40, 95% CI 0.16–0.99). Higher % trunk FM wasalso associated with greater risk of CAD prevalence in females (OR=2.79, 95% CI 1.08–7.20 perSD change). These associations were not observed in males.
CONCLUSIONS—This is novel evidence that DEXA-assessed lower body adiposity is inverselyassociated with CAD in T1D, however, this association seems to only exist in females.
Keywordsadiposity; type 1 diabetes; coronary artery disease; EDC Study; dual x-ray absorptiometry;gluteal-femoral adiposity
© 2010 Elsevier Ireland Ltd. All rights reservedCorresponding Author: Christina M. Shay 680 N. Lake Shore Drive Suite #1102 Chicago, Illinois 60611 Office: 312-506-4777 Fax:312-908-9588 [email protected]'s Disclaimer: This is a PDF file of an unedited manuscript that has been accepted for publication. As a service to ourcustomers we are providing this early version of the manuscript. The manuscript will undergo copyediting, typesetting, and review ofthe resulting proof before it is published in its final citable form. Please note that during the production process errors may bediscovered which could affect the content, and all legal disclaimers that apply to the journal pertain.DISCLOSURE All authors have no conflicts of interest to disclose.
NIH Public AccessAuthor ManuscriptDiabetes Res Clin Pract. Author manuscript; available in PMC 2011 September 1.
Published in final edited form as:Diabetes Res Clin Pract. 2010 September ; 89(3): 288–295. doi:10.1016/j.diabres.2010.03.028.
NIH
-PA Author Manuscript
NIH
-PA Author Manuscript
NIH
-PA Author Manuscript

INTRODUCTIONCoronary artery disease (CAD) is a major cause of morbidity and mortality in type 1diabetes (T1D). The development of CAD occurs decades earlier and at a 10-fold magnitudein T1D compared to non-diabetic individuals [1]. While the factors associated with greaterCAD risk in this population have been well documented, the pathogenesis is still unclear [2].
Although general obesity is a significant CAD risk factor, recent studies have shown thatdifferences in fat distribution throughout the body have varying effects on CAD risk [3].Prospective evidence indicates that simple measures of central adiposity (e.g. waistcircumference) remain significant predictors of CAD after controlling for other pertinentrisk factors [4,5], and measures of abdominal adiposity by various imaging techniques (e.g.CT, MRI, DEXA) have confirmed these results [6,7]. Lower extremity adiposity, on theother hand, has recently been shown to have a protective cardiovascular effect throughfavorable associations with CAD risk factors, such as insulin sensitivity and lipid profiles[8–10]. Additional evidence suggests that this metabolic protection of lower body fat mayintensify at higher levels of obesity [11,12]; therefore, overall level of total adiposity mustbe accounted for when evaluating associations between cardiovascular risk and regionaladiposity.
Using data from a 20-yr prospective study of childhood-onset T1D, the two purposes of thisstudy were: 1) to determine if regional adiposity assessments assist in the characterization ofthose with both CAD and T1D, and 2) to examine the associations between CAD riskfactors and both total adiposity and regional adiposity in individuals with T1D.
METHODSAll participants came from the Pittsburgh Epidemiology of Diabetes Complications Study(EDC), a 20-year prospective follow-up study of childhood-onset (age < 17 at diagnosis)type 1 diabetes mellitus that began in 1986. EDC participants were diagnosed (or seenwithin 1 year of diagnosis) between 1950–1980 at the Children's Hospital of Pittsburgh, aspreviously described [13]. During the 18-year exam cycle (2004–2007), 439 participantswere eligible for examination, 72% of whom (n=318) took part. A subset of theseparticipants (n=185) agreed to also undergo a dual x-ray absorptiometry (DEXA) scan and,of these, 163 had sufficient information on CAD status and body composition for this cross-sectional analysis.
Clinical Evaluation and ProceduresAt the EDC exam, height was measured using a stadiometer and weight was measured on acalibrated balance beam scale. Standardized sitting blood pressures and heart rate weremeasured after a 5-min rest period. Hypertension was defined as systolic blood pressure(SBP) ≥ 140 mmHg or diastolic blood pressure (DBP) ≥ 90 mmHg or the reported use ofmedications for blood pressure control. Total cholesterol was measured enzymatically [14].High-density lipoprotein cholesterol (HDLc) levels were determined by a precipitationtechnique (heparin and manganese chloride) with modification of Lipid Research Clinicsmethod [15]. Non-HDLc levels were calculated by subtracting HDLc from total cholesterol.Blood samples were analyzed for hemoglobin A1c (HbA1c) using the DCA 2000 analyzer(Bayer Diagnostics, Tarrytown, NY). Coronary artery calcification (CAC) was assessed byelectron beam computed tomography (Imatron, San Francisco, CA). Insulin sensitivity wasassessed using the estimated glucose disposal rate (eGDR) formula, which was derived fromhyperinsulinemic-euglycemic clamp studies in T1D (involving HbA1, waist-hip ratio, andhypertension status) [16]. The median of three timed urine collections (or, if necessary, the
Shay et al. Page 2
Diabetes Res Clin Pract. Author manuscript; available in PMC 2011 September 1.
NIH
-PA Author Manuscript
NIH
-PA Author Manuscript
NIH
-PA Author Manuscript

mean of two urine collections) were used to determine albumin excretion rates (AER). Overtnephropathy (ON) was defined as an AER >200 μg/min or, in the absence of urine, a serumcreatinine level >2 mg/dl, renal failure or renal transplantation. Medication history includedcurrent medication use, dosage, and reason for taking medications.
Coronary Artery Disease ClassificationA standardized medical history and clinical examination were performed by a trainedinternist to determine CAD status. CAD cases included a positive clinical history(myocardial infarction (either confirmed with hospital records or pathological Q waves(Minnesota codes 1.1, 1.2)), hospital record or validated angiographic evidence of ≥50%stenosis with or without revascularization, EDC physician-diagnosed angina and/or ischemicECG (Minnesota codes 1.3, 4.1–4.3, 5.1–5.3, 7.1) on exam with CAC ≥ 100), or CAC ≥ 400without presence of clinical disease.
Adiposity AssessmentHip and waist circumference (WC) were assessed as a measure of visceral adiposity, andwaist-hip ratio (WHR) was calculated. Adiposity distribution was measured by dual x-rayabsorptiometry (DEXA) using a Hologic QDR4500A scanner and Hologic QDR systemsoftware version 12.3 (Hologic, Bedford, MA). Total body fat mass (FM) (kg), bone-freelean body mass (LBM) (kg), and percent body FM (% FM) was calculated along withregional measures of arm FM (kg), leg FM (kg), and trunk FM (kg). FM in arms and legswas calculated as the sum of both corresponding appendages. The separation between trunkand leg regions was made by two oblique lines passing through the femoral necks, and theseparation between trunk and arm regions was made by two oblique lines passing throughthe humeral heads. Measures of regional adiposity (legs, arms, and trunk) relative to totalbody FM were calculated as percentages of total FM (% leg FM, % arm FM, and % trunkFM). Participants were excluded from analysis if any region of the body was amputated(n=3), if any plastic artifacts were scanned that may influence the computation of adiposetissue (n=14), or if any area of the body was excluded from the DEXA scan (n=5). Theprotocol was approved by the University of Pittsburgh Institutional Review Board.
Statistical AnalysesVariables lacking a normal distribution were transformed by natural log prior to testing.Non-parametric variables that were not normalized after transformation were analyzed withnon-parametric techniques. Group differences were examined using Student's t-test andMann-Whitney-U test, as appropriate. P < 0.05 was considered statistically significant.General linear models were used to determine group differences after adjusting for factorsknown to influence adiposity (e.g. age, sex, and/or height). Multivariate logistic regressionmodels using a forward conditional approach were fit by gender to examine variables moststrongly associated with presence of CAD. All variables with a univariate association (p <0.25) with presence of CAD were made available for modeling. A significance of p < 0.10was applied for entry and p > 0.05 for exclusion from the models. Variables known toinfluence risk for CAD or adiposity distribution were also included in models. Becausemany adiposity measures were inter-correlated, separate models were fit for each individualregional adiposity measure. Also, since WC was a component of eGDR and was highlycorrelated with all adiposity variables, WC was removed from multivariate analyses.Variance inflation factor (VIF) was calculated as a collinearity diagnostic for the finalmodels and variables were considered to be collinear if VIF ≥ 2.0 Akaike's InformationCriteria (AIC), a measure of goodness of fit and a tool for model selection, was computedfor the final models, and the model with the lowest AIC was considered to have the best fit.SPSS for Windows version 16.0 was used for all analyses (SPSS, Chicago, IL).
Shay et al. Page 3
Diabetes Res Clin Pract. Author manuscript; available in PMC 2011 September 1.
NIH
-PA Author Manuscript
NIH
-PA Author Manuscript
NIH
-PA Author Manuscript

RESULTSParticipant Characteristics
Comparisons between the DEXA study population (n=163, 52.8%) and the remaining EDCpopulation examined at the 18-year follow-up (n=146, 47.2%) are reported in Table 1. Themean (±SD) age and diabetes duration for the DEXA population at the 18-year exam were45.7 (±7.3) and 36.9 (±6.8) years, respectively, which did not significantly differ from thestudy participants who refused a DEXA scan. The only significantly different factors werelower BMI (p<0.01), lower total cholesterol (p=0.02), and lower non-HDL cholesterol(p=0.01) in the DEXA participants compared to EDC participants who did not have a DEXAscan. All other key variables did not significantly differ between groups.
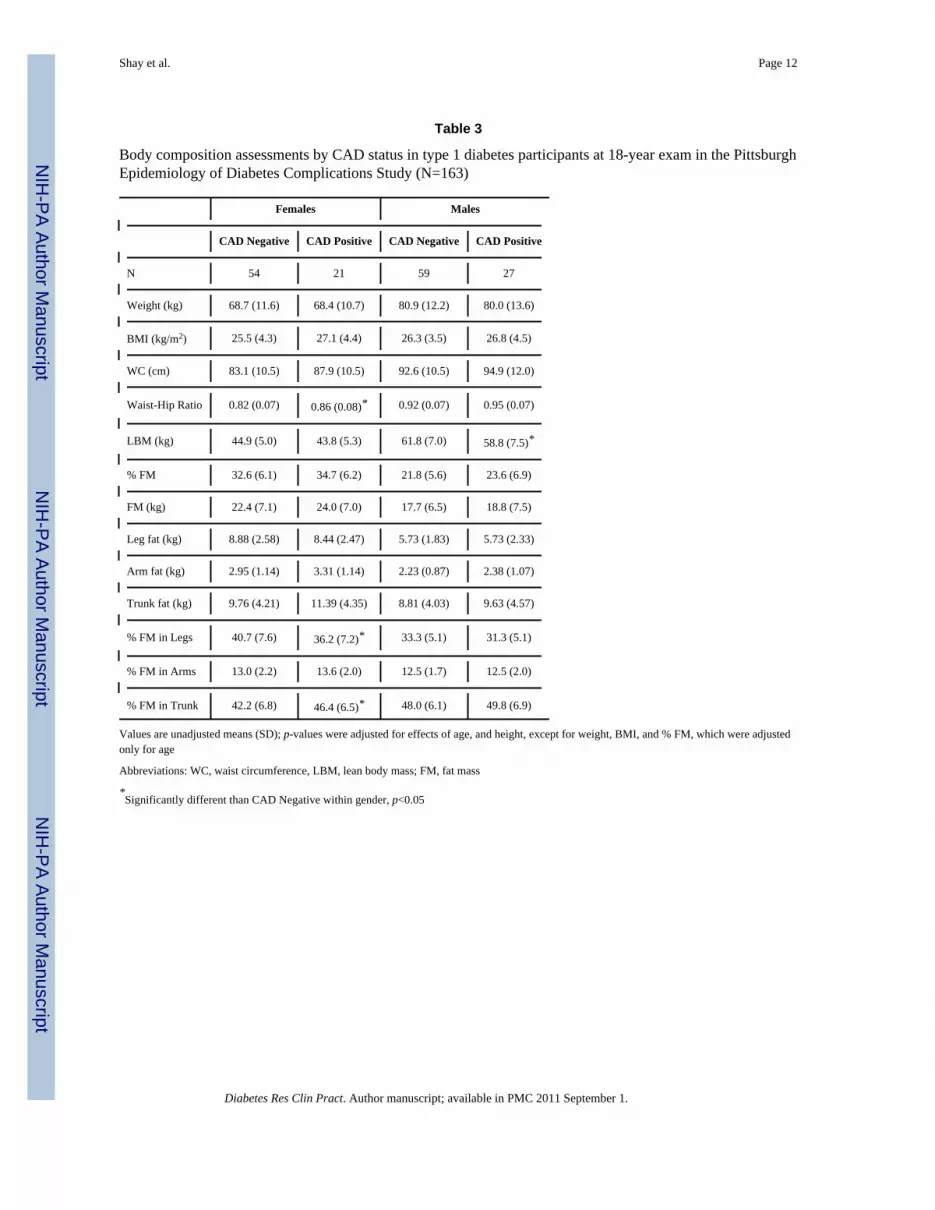
Characteristics of the 163 participants with T1D are presented by CAD status in Table 2.Forty-eight (29.4%) of the participants had a history of CAD: 8 had a myocardial infarction(16.7%), 12 had revascularization (25.0%), 6 had confirmed angina (12.5%), 8 had anischemic ECG (16.7%), 2 had ≥50% stenosis (4.1%), and 12 had CAC > 400 (25.0%). Themean duration between CAD onset and the DEXA scan was 14.7 yrs (range 1.8–19.7 yrs).Participants with CAD were older, had longer diabetes duration, were more frequently on anLDLc medication, and showed a trend toward lower HDLc. AER was lower in CAD cases;however, smoking status, HbA1c, total cholesterol, LDLc, non-HDLc, triglycerides, SBP,and eGDR were similar between groups. Body composition characteristics by both CADstatus and gender are presented in Table 3. Regardless of CAD status, men exhibited higherweight, WC, WHR, and LBM and lower leg, arm, trunk, and total FM (kg and %) comparedto women. Examining adiposity measures by CAD status showed that women with CADexhibited higher % FM in the trunk and lower % FM in the legs as compared with womenwithout CAD, a finding not seen in men. All other adiposity measures were similar betweengroups.
Coronary Artery Disease Risk Factors and Regional AdiposityWhen examining CAD risk factors and regional adiposity (Table 4), a striking inversecorrelation is readily apparent between % leg FM and % trunk FM (r=.94, p<.001), whichwas also reflected in inverse associations between these measures and other CAD riskfactors. Moderately positive correlations existed between % leg FM and both HDLc andeGDR. Conversely, significant inverse correlations between % trunk FM and both HDLcand eGDR were observed, and moderately negative correlations existed between % leg FMand CAC, AER, serum creatinine, SBP, DBP, LDLc, non-HDLc, triglycerides, and BMI.Stronger negative correlations were observed between % leg FM and both WC and WHR.Similar, yet opposite, associations were observed between CAD risk factors and % trunk FMcompared to the associations observed with % Leg FM. Positive correlations were observedbetween % arm FM and diabetes duration, BMI, and WC, while negative correlationsexisted between % arm FM and both eGDR and DBP. Gender differences in correlates werelargely absent, except for significant correlations between serum creatinine and both % trunkFM and % leg FM seen in males but not in females. Also, strong correlations were observedbetween % arm FM and both % leg FM and % trunk FM in females but not in males.
Presence of Coronary Artery Disease and Regional AdiposityUnivariate logistic regression revealed that, in females, age and HDLc were the CAD riskfactors most strongly associated with presence of CAD, while age and serum creatinine weremost strongly associated with presence of CAD in males. Even though not selected in thefinal models, additional variables were added due to their established associations with CADand/or regional adiposity (i.e., smoking status, height, eGDR, and FM) (Table 5). Aftercontrolling for these risk factors, % leg FM and % trunk FM exhibited independent
Shay et al. Page 4
Diabetes Res Clin Pract. Author manuscript; available in PMC 2011 September 1.
NIH
-PA Author Manuscript
NIH
-PA Author Manuscript
NIH
-PA Author Manuscript

associations with presence of CAD in females, while no regional adiposity measure wasassociated with presence of CAD in males (Table 5, Models 2–4 by gender). In females,every 1% higher leg FM was associated with approximately 12% lower CAD risk(OR=0.89, 95% CI 0.79–0.99), while every 1% higher trunk FM was associatedapproximately 16% higher CAD risk (OR=1.16, 95% CI 1.01–1.33).
DISCUSSIONThe novel finding from this investigation is that a preference to store body fat in the lowerlimbs appears to be associated with a lower prevalence of CAD in women but not men withT1D, even after controlling for general obesity and other CAD risk factors. This findingconfirms previous observations that leg and trunk adiposity have independent and oppositeassociations with CAD risk factors [17,18], but this is the first report of these associationsusing DEXA-assessed adiposity measures in T1D.
There has been great interest in identifying regions of the body that are metabolically“optimal” to store adipose tissue. Recent examinations of gluteal-femoral adiposity usingDEXA have shown protective associations between gluteal-femoral adiposity and a varietyof CAD risk factors [19–21]. The potential for lower-body adiposity to serve as a marker ofanti-atherogenicity has propelled the theory that greater leg fat may reflect ability to“spillover” excess adiposity away from the abdomen, into regions where it is lessmetabolically active and less detrimental to cardio-metabolic health. Although we report thatthis association only exists in females with T1D, to our knowledge, this is the firstinvestigation to explore these specific associations in T1D, and further investigation isneeded to confirm these sex-specific findings.
The sex-specific protective association between lower body fat storage and CAD deservesfurther discussion. It is well established that women store more adiposity in the lower limbsthan men [22]; thus, gender differences in the association between regional adiposity andCAD risk are plausible. Reports from Aasen et al. suggest that a preference toward legadiposity attenuates CVD risk in obese individuals, particularly in women, but theassociations lessened in overweight individuals [11,23]. Women in the current investigationwere found to have a greater proportion of fat stored in the legs compared to men aftercontrolling for total adiposity. Therefore, we hypothesize that the enhanced cardio-protective effect of gluteal-femoral adiposity in women with T1D may be due to both agreater preference to store adiposity in legs as well as higher overall adiposity as comparedto males. Also, since individuals with T1D have lower levels of overall adiposity comparedto non-diabetic controls [24], it is reasonable to conclude that the cardio-protective effect oflower body adiposity in T1D may actually be present in men but is more robustly expressedin women who have greater levels of adiposity. Although such speculations are plausible,the strength of these hypotheses is limited without the benefit of direct comparison to a non-diabetic control group.
The nearly identical, but inverse, associations with CAD risk factors observed between %leg FM and % trunk FM are quite intriguing (Table 4). Similar associations exist in non-diabetic populations [8]; thus, it is possible that fat storage in the legs is simply an inverseindication of fat storage in the trunk region. However, since DEXA assessments of % legFM and % trunk FM were strongly and inversely correlated with each other, the independenteffect of each measure on CAD risk could not be examined. Additionally, the use of DEXAto examine regional adiposity is limited in that distinction between visceral, subcutaneous,and intramuscular fat depots cannot be made. To properly explore the biological plausibilityof the current findings, future investigations should focus on examining the independentmetabolic influences of specific leg and trunk fat depots on cardiovascular outcomes.
Shay et al. Page 5
Diabetes Res Clin Pract. Author manuscript; available in PMC 2011 September 1.
NIH
-PA Author Manuscript
NIH
-PA Author Manuscript
NIH
-PA Author Manuscript

It is also interesting to note that the proportional DEXA measures of leg and trunk adipositydid not strongly correlate with traditional CAD risk factors, such as age, HbA1c, and CAC inthis investigation. This finding may be explained by the fact that the regional adipositymeasures in this study were proportional, rather than absolute measures. Leg fat (kg) wasstrongly correlated with overall body fat (kg) (r=0.68, p<0.001) in this T1D population.Since overall adiposity is traditionally considered an independent CVD risk factor, thiswould explain the previous associations reported between leg fat and CVD risk [8,25–27].However, absolute leg fat (kg) showed a very weak association with proportional legadiposity (r=0.08, p=.31) in this sample, potentially contributing to the lack of associationbetween proportional adiposity and the traditional CVD risk factors. Although measures ofproportional adiposity were not strongly associated with traditional CVD risk, % FM in thelegs and trunk were independently associated with presence of CAC in women with T1D,suggesting these adiposity measures may influence CAD risk through a mechanism differentthan that of overall adiposity. Examining whether the proportion of leg adiposity isassociated with CAD risk attempts to answer a different question than whether amount ofleg fat, per se, is associated with CAD risk. If the propensity to store more adipose tissue ina given region is cardio-protective, regardless of overall adiposity, classifying individualsbased on this phenotype may better characterize CAD risk, particularly in high-riskpopulations (e.g., T1D). As DEXA assessment of body composition provides usefulinformation regarding various adiposity regions associated with CAD risk [28,29], applyingthe comprehensive DEXA assessments to a T1D population is appealing.
Although the current findings are intriguing, it is important to note the significantdifferences between study participants who declined the DEXA scan compared to those whoagreed to participate. Participants who had a DEXA scan as part of the 18-year study examexhibited lower BMI, lower total cholesterol, and higher non-HDL cholesterol compared tothe EDC participants who did not have a DEXA scan. Since individuals who participatedwere less likely to be obese and potentially have better blood lipid profiles, it is possible thatsampling bias influenced the current findings. Therefore, the possibility that greater % FMin the legs may play a different role in CAD risk in lower weight, healthier T1D individualsthan it does among individuals with more adverse CAD risk factors cannot be dismissed.
The cross-sectional design of this study limits causal inference of the observed associations.It is conceivable that greater amounts of leg fat may be associated with a lower risk ofdeveloping CAD; however, the duration between CAD onset and the time of the DEXA scanranged from approximately 2 to 20 years, indicating that CAD diagnosis could haveoccurred many years prior to the measurement of regional adiposity. It is therefore possiblethat individuals with T1D and CAD have similar levels of leg fat at the time of CADdiagnosis, but begin to lose lower body fat mass or store more adiposity in the trunk regionas the disease progresses. Further investigation of the temporal nature of these associationsis warranted to more clearly understand the metabolic implications.
Despite our definition of CAD including a wide variety of `soft' endpoints, (i.e., ECGchanges, angina, a high burden of CAC), this study is limited by the small number of CADcases. Therefore, a sensitivity analysis was performed to examine whether the observedassociations would vary if CAD was defined only by “hard” endpoints (i.e., myocardialinfarction or revascularization). Although the number of CAD cases was further reduced bythis definition (8 women and 12 men), greater % FM in the legs was associated with aborderline lower odds of CAD in women (p=0.07) but not in men (p=0.69) (data not shown).We thus conclude that including “soft” endpoints in the CAD definition did not stronglyinfluence the overall findings.
Shay et al. Page 6
Diabetes Res Clin Pract. Author manuscript; available in PMC 2011 September 1.
NIH
-PA Author Manuscript
NIH
-PA Author Manuscript
NIH
-PA Author Manuscript

Since this cohort consists mainly of middle aged adults (age range = 37–64 years), only 17women were post-menopausal. Although there was insufficient power to detect anydifferences by menopausal status, an additional sensitivity analysis of the multivariablelinear regression models (Table 5) was performed excluding all post-menopausal womenand revealed similar results (data not shown). Despite this limitation, this investigation is thelargest study to date using DEXA to explore the associations between regional adiposity andCAD in a T1D population.
In summary, a propensity to store adipose tissue in the lower body was favorably associatedwith CAD risk factors and negatively associated with presence of CAD in women with T1D,but not in men. This lack of association in men with T1D may be due to lower levels ofoverall adiposity and proportionally less adipose tissue stored in the legs in men comparedto women. Our findings that leg and trunk adipose tissue storage may have independent andopposing effects on CAD risk may reflect the metabolically “protective” ability to storebody fat away from the abdomen; however, further investigation into the biologicalplausibility influencing these anthropomorphic trends is needed.
AcknowledgmentsThis work was primarily funded by the National Institutes of Health (DK34818 to TJO) with additional fundsprovided by the American Diabetes Association (1-04-JF-46 to ESS). AMS was supported by a training grant fromthe National Institute of Diabetes and Digestive and Kidney Diseases (F30-DK082137). We thank all EDC studyparticipants for their invaluable contributions as well as the EDC study staff. Preliminary data were presented at theAmerican Diabetes Association 69th annual meeting in New Orleans, LA on June 5–9, 2009.
Grant Support: R01-DK34818, 1-04-JF-46, F30-DK82137 (see acknowledgements)
ABBREVIATIONS
AIC Akaike's information criterion
AER albumin excretion rate
CAC coronary artery calcification
CAD coronary artery disease
DBP diastolic blood pressure
DEXA dual x-ray absorptiometry
EDC Epidemiology of Diabetes Complications
eGDR estimated glucose disposal rate
FM fat mass
LBM lean body mass
MI myocardial infarction
SBP systolic blood pressure
WC waist circumference
REFERENCES1. Warram JH, Laffel LM, Ganda OP, Christlieb AR. Coronary artery disease is the major determinant
of excess mortality in patients with insulin-dependent diabetes mellitus and persistent proteinuria. JAm Soc Nephrol 1992;3:S104–110. [PubMed: 1457752]
Shay et al. Page 7
Diabetes Res Clin Pract. Author manuscript; available in PMC 2011 September 1.
NIH
-PA Author Manuscript
NIH
-PA Author Manuscript
NIH
-PA Author Manuscript

2. Orchard TJ, Costacou T, Kretowski A, Nesto RW. Type 1 diabetes and coronary artery disease.Diabetes Care 2006;29:2528–2538. [PubMed: 17065698]
3. Canoy D. Distribution of body fat and risk of coronary heart disease in men and women. Curr OpinCardiol 2008;23:591–598. [PubMed: 18830075]
4. Buchholz AC, Bugaresti JM. A review of body mass index and waist circumference as markers ofobesity and coronary heart disease risk in persons with chronic spinal cord injury. Spinal Cord2005;43:513–518. [PubMed: 15824757]
5. Soedamah-Muthu SS, Chaturvedi N, Witte DR, Stevens LK, Porta M, Fuller JH. Relationshipbetween risk factors and mortality in type 1 diabetic patients in Europe: the EURODIABProspective Complications Study (PCS). Diabetes Care 2008;31:1360–1366. [PubMed: 18375412]
6. Ding J, Visser M, Kritchevsky SB, Nevitt M, Newman A, Sutton-Tyrrell K, et al. The association ofregional fat depots with hypertension in older persons of white and African American ethnicity. AmJ Hypertens 2004;17:971–976. [PubMed: 15485762]
7. Nicklas BJ, Penninx BW, Ryan AS, Berman DM, Lynch NA, Dennis KE. Visceral adipose tissuecutoffs associated with metabolic risk factors for coronary heart disease in women. Diabetes Care2003;26:1413–1420. [PubMed: 12716798]
8. Van Pelt RE, Evans EM, Schechtman KB, Ehsani AA, Kohrt WM. Contributions of total andregional fat mass to risk for cardiovascular disease in older women. American journal of physiology2002;282:E1023–1028. [PubMed: 11934666]
9. Goodpaster BH, Thaete FL, Kelley DE. Thigh adipose tissue distribution is associated with insulinresistance in obesity and in type 2 diabetes mellitus. The American journal of clinical nutrition2000;71:885–892. [PubMed: 10731493]
10. Goodpaster BH, Thaete FL, Simoneau JA, Kelley DE. Subcutaneous abdominal fat and thighmuscle composition predict insulin sensitivity independently of visceral fat. Diabetes1997;46:1579–1585. [PubMed: 9313753]
11. Aasen G, Fagertun H, Halse J. Regional fat mass by DXA: high leg fat mass attenuates the relativerisk of insulin resistance and dyslipidaemia in obese but not in overweight postmenopausalwomen. Scand J Clin Lab Invest 2008;68:204–211. [PubMed: 18446527]
12. Snijder MB, Visser M, Dekker JM, Goodpaster BH, Harris TB, Kritchevsky SB, et al. Lowsubcutaneous thigh fat is a risk factor for unfavourable glucose and lipid levels, independently ofhigh abdominal fat. The Health ABC Study. Diabetologia 2005;48:301–308. [PubMed: 15660262]
13. Orchard TJ, Dorman JS, Maser RE, Becker DJ, Drash AL, Ellis D, et al. Prevalence ofcomplications in IDDM by sex and duration. Pittsburgh Epidemiology of Diabetes ComplicationsStudy II. Diabetes 1990;39:1116–1124. [PubMed: 2384191]
14. Bucolo G, David H. Quantitative determination of serum triglycerides by the use of enzymes. ClinChem 1973;19:476–482. [PubMed: 4703655]
15. Warnick GR, Albers JJ. Heparin--Mn2+ quantitation of high-density-lipoprotein cholesterol: anultrafiltration procedure for lipemic samples. Clin Chem 1978;24:900–904. [PubMed: 207462]
16. Williams KV, Erbey JR, Becker D, Arslanian S, Orchard TJ. Can clinical factors estimate insulinresistance in type 1 diabetes? Diabetes 2000;49:626–632. [PubMed: 10871201]
17. Bos G, Snijder MB, Nijpels G, Dekker JM, Stehouwer CD, Bouter LM, et al. Oppositecontributions of trunk and leg fat mass with plasma lipase activities: the Hoorn study. Obesityresearch 2005;13:1817–1823. [PubMed: 16286530]
18. Snijder MB, Dekker JM, Visser M, Bouter LM, Stehouwer CD, Yudkin JS, et al. Trunk fat and legfat have independent and opposite associations with fasting and postload glucose levels: the Hoornstudy. Diabetes care 2004;27:372–377. [PubMed: 14747216]
19. Snijder MB, Flyvbjerg A, Stehouwer CD, Frystyk J, Henry RM, Seidell JC, et al. Relationship ofadiposity with arterial stiffness as mediated by adiponectin in older men and women: the HoornStudy. Eur J Endocrinol 2009;160:387–395. [PubMed: 19095778]
20. Van Pelt RE, Jankowski CM, Gozansky WS, Schwartz RS, Kohrt WM. Lower-body adiposity andmetabolic protection in postmenopausal women. J Clin Endocrinol Metab 2005;90:4573–4578.[PubMed: 15886255]
21. Sakai Y, Ito H, Egami Y, Ohoto N, Hijii C, Yanagawa M, et al. Favourable association of leg fatwith cardiovascular risk factors. J Intern Med 2005;257:194–200. [PubMed: 15656878]
Shay et al. Page 8
Diabetes Res Clin Pract. Author manuscript; available in PMC 2011 September 1.
NIH
-PA Author Manuscript
NIH
-PA Author Manuscript
NIH
-PA Author Manuscript

22. Lovejoy JC, Sainsbury A. Sex differences in obesity and the regulation of energy homeostasis.Obes Rev 2009;10:154–167. [PubMed: 19021872]
23. Aasen G, Fagertun H, Tonstad S, Halse J. Leg fat mass as measured by dual X-ray absorptiometry(DXA) impacts insulin resistance differently in obese women versus men. Scand J Clin Lab Invest2009;69:181–189. [PubMed: 18937100]
24. Strotmeyer ES, Cauley JA, Orchard TJ, Steenkiste AR, Dorman JS. Middle-aged premenopausalwomen with type 1 diabetes have lower bone mineral density and calcaneal quantitative ultrasoundthan nondiabetic women. Diabetes Care 2006;29:306–311. [PubMed: 16443878]
25. Smith SR, Lovejoy JC, Greenway F, Ryan D, deJonge L, de la Bretonne J, et al. Contributions oftotal body fat, abdominal subcutaneous adipose tissue compartments, and visceral adipose tissue tothe metabolic complications of obesity. Metabolism 2001;50:425–435. [PubMed: 11288037]
26. Tanko LB, Bagger YZ, Alexandersen P, Larsen PJ, Christiansen C. Peripheral adiposity exhibits anindependent dominant antiatherogenic effect in elderly women. Circulation 2003;107:1626–1631.[PubMed: 12668497]
27. Tatsukawa M, Kurokawa M, Tamari Y, Yoshimatsu H, Sakata T. Regional fat deposition in thelegs is useful as a presumptive marker of antiatherogenesity in Japanese. Proc Soc Exp Biol Med2000;223:156–162. [PubMed: 10654618]
28. Hara M, Saikawa T, Kurokawa M, Sakata T, Yoshimatsu H. Leg fat percentage correlatesnegatively with coronary atherosclerosis. Circ J 2004;68:1173–1178. [PubMed: 15564702]
29. Bestetti A, Castini D, Bigi R, Maioli C, Lombardi F, Gregori D, et al. Truncal fat determined bydual-energy X-ray absorptiometry is an independent predictor of coronary artery diseaseextension. Eur J Cardiovasc Prev Rehabil 2008;15:428–433. [PubMed: 18677167]
Shay et al. Page 9
Diabetes Res Clin Pract. Author manuscript; available in PMC 2011 September 1.
NIH
-PA Author Manuscript
NIH
-PA Author Manuscript
NIH
-PA Author Manuscript

NIH
-PA Author Manuscript
NIH
-PA Author Manuscript
NIH
-PA Author Manuscript
Shay et al. Page 10
Table 1
Characteristics of DEXA study population compared to remaining study population at 18-year exam in thePittsburgh Epidemiology of Diabetes Complications Study
Characteristics No DEXA DEXA p-value
N (% male) 146 (43.7) 163 (53.2) .11
Age (years) 44.3 (7.72) 45.7 (7.28) .12
Diabetes duration (years) 36.8 (7.46) 36.9 (6.81) .86
Ever smoked, n (%) 50 (33.8) 58 (37.2) .55
Serum creatinine (mg/dL)a,b 1.00 (.80–1.18) 1.00 (.83–1.18) .47
AER (μg/min)a,b 12.9 (4.87–77.4) 6.91 (4.34–39.0) .06
HbA1c (%) 7.61 (1.37) 7.42 (1.44) .25
Resting heart rate (bpm)b 75.2 (12.6) 73.7 (10.9) .26
eGDR (mg/kg/min) 7.24 (2.47) 7.49 (2.23) .36
Hypertension, n (%) 62 (41.6) 57 (36.1) .35
Systolic blood pressure (mmHg) 114.1 (15.3) 118.0 (15.9) .07
Diastolic blood pressure (mmHg) 66.4 (11.0) 62.8 (10.8) .08
Body Mass Index (kg/m2) 28.1 (4.82) 26.3 (4.09) <.01
Waist-Hip Ratio 0.88 (0.09) 0.88 (0.09) .78
Total cholesterol (mg/dL) 181.1 (43.5) 170.5 (31.0) .02
HDLc (mg/dL) 58.2 (15.9) 59.2 (16.8) .61
Non-HDLc (mg/dL) 122.8 (42.0) 111.4 (29.0) .01
All values are means (SD) unless otherwise noted.
Abbreviation: AER, albumin excretion rate; eGDR, estimated glucose disposal rate
aData presented as median (interquartile range)
bLog-transformed before statistical testing
Diabetes Res Clin Pract. Author manuscript; available in PMC 2011 September 1.

NIH
-PA Author Manuscript
NIH
-PA Author Manuscript
NIH
-PA Author Manuscript
Shay et al. Page 11
Table 2
Characteristics by coronary artery disease (CAD) status in type 1 diabetes at 18-year exam in the PittsburghEpidemiology of Diabetes Complications Study
Characteristics CAD Negative CAD Positive p-value
N (% male) 115 (51.3) 48 (56.3) .56
Age (years) 44.0 (6.78) 49.4 (6.79) < .01
Diabetes duration (years) 35.4 (6.03) 40.3 (7.13) < .01
Ever smoked, n (%) 39 (34.5) 20 (41.7) .58
Serum creatinine (mg/dL)a,b 1.00 (.80–1.10) 1.00 (.90–1.28) .13
AER (μg/min)a,b 5.98 (4.02–26.1) 5.27 (5.27–59.3) .03
Overt nephropathy, n (%) 26 (22.6) 15 (31.9) .24
HbA1c (%) 7.52 (1.45) 7.15 (1.40) .14
Daily insulin dose (U/kg) 0.59 (0.22) 0.63 (0.25) .36
Resting heart rate (bpm)b 74.0 (10.8) 73.2 (11.3) .69
eGDR (mg/kg/min) 7.66 (2.29) 7.05 (2.04) .12
Hypertension, n (%) 30 (27.0) 18 (37.5) .19
Systolic blood pressure (mmHg) 114.1 (15.3) 118.0 (15.9) .16
Diastolic blood pressure (mmHg) 66.4 (11.0) 62.8 (10.8) .06
Taking ACE/ARB inhibitors, n (%) 61 (53.0) 27 (56.3) .71
Total cholesterol (mg/dL) 172.4 (30.6) 165.6 (31.6) .21
LDLc (mg/dL) 97.9 (27.7) 94.5 (27.7) .51
HDLc (mg/dL) 60.8 (17.2) 55.1 (15.4) .05
Non-HDLc (mg/dL) 111.6 (28.6) 110.6 (29.9) .84
Triglycerides (mg/dL)b 78.5 (36.5) 91.4 (50.3) .09
Taking LDL medications, n (%) 41 (36.3) 26 (54.2) .04
All values are means (SD) unless otherwise noted.
Abbreviation: AER, albumin excretion rate; eGDR, estimated glucose disposal rate
aData presented as median (interquartile range)
bLog-transformed before statistical testing
Diabetes Res Clin Pract. Author manuscript; available in PMC 2011 September 1.
NIH
-PA Author Manuscript
NIH
-PA Author Manuscript
NIH
-PA Author Manuscript
Shay et al. Page 12
Table 3
Body composition assessments by CAD status in type 1 diabetes participants at 18-year exam in the PittsburghEpidemiology of Diabetes Complications Study (N=163)
Females Males
CAD Negative CAD Positive CAD Negative CAD Positive
N 54 21 59 27
Weight (kg) 68.7 (11.6) 68.4 (10.7) 80.9 (12.2) 80.0 (13.6)
BMI (kg/m2) 25.5 (4.3) 27.1 (4.4) 26.3 (3.5) 26.8 (4.5)
WC (cm) 83.1 (10.5) 87.9 (10.5) 92.6 (10.5) 94.9 (12.0)
Waist-Hip Ratio 0.82 (0.07) 0.86 (0.08)* 0.92 (0.07) 0.95 (0.07)
LBM (kg) 44.9 (5.0) 43.8 (5.3) 61.8 (7.0) 58.8 (7.5)*
% FM 32.6 (6.1) 34.7 (6.2) 21.8 (5.6) 23.6 (6.9)
FM (kg) 22.4 (7.1) 24.0 (7.0) 17.7 (6.5) 18.8 (7.5)
Leg fat (kg) 8.88 (2.58) 8.44 (2.47) 5.73 (1.83) 5.73 (2.33)
Arm fat (kg) 2.95 (1.14) 3.31 (1.14) 2.23 (0.87) 2.38 (1.07)
Trunk fat (kg) 9.76 (4.21) 11.39 (4.35) 8.81 (4.03) 9.63 (4.57)
% FM in Legs 40.7 (7.6) 36.2 (7.2)* 33.3 (5.1) 31.3 (5.1)
% FM in Arms 13.0 (2.2) 13.6 (2.0) 12.5 (1.7) 12.5 (2.0)
% FM in Trunk 42.2 (6.8) 46.4 (6.5)* 48.0 (6.1) 49.8 (6.9)
Values are unadjusted means (SD); p-values were adjusted for effects of age, and height, except for weight, BMI, and % FM, which were adjustedonly for age
Abbreviations: WC, waist circumference, LBM, lean body mass; FM, fat mass
*Significantly different than CAD Negative within gender, p<0.05
Diabetes Res Clin Pract. Author manuscript; available in PMC 2011 September 1.

NIH
-PA Author Manuscript
NIH
-PA Author Manuscript
NIH
-PA Author Manuscript
Shay et al. Page 13
Table 4
Pearson correlations between CAD risk factors and regional adiposity in type 1 diabetes in the PittsburghEpidemiology of Diabetes Complications Study (N=163)
% FM in Legs % FM in Trunk
Females (n=77) Males (n=86) Females (n=77) Males (n=86)
Clinical Characteristics
Age (years) .03 −.18 −.06 .15
Diabetes duration (yrs) .03 −.09 −.08 −.01
Agatston CAC scorea −.24 −.22 .24 .12
AER (μg/min)b −.28c −.31c .30c .23
Serum creatinine (mg/dL)b −.06 −.30c .10 .33c
HbA1c (%) −.01 −.26 −.03 −.13
eGDR (mg/kg/min) .41c .49d −.39c −.42d
Resting heart rate (bpm) −.10 −.23c .10 .23
Systolic BP (mmHg) −.26c −.28c .32c .22c
Diastolic BP (mmHg) −.16 −.14 .24c .13
Total cholesterol (mg/dL) −.14 −.14 .18 .12
DLc (mg/dL) −.19 −.23 .25 .20
HDLc (mg/dL) .15 .17 −.11 −.22
Non-HDLc (mg/dL) −.25c −.22c .28c .22c
Triglycerides (mg/dL)b −.31c −.28c .29c .34c
Anthropometry
BMI (kg/m2) −.46d −.43d .57d .55d
Waist circumference (cm) −.66d −.50d .74d .62d
Waist-Hip Ratio −.57d −.59d .56d .60d
Total FM (kg) −.48d −.43d .61d .62d
%FM −.48d −.46d .59d .66d
Arm FM (kg) −.67d −.38c .69d .48d
Leg FM (kg) .19 −.01 −.02 −.24c
Trunk FM (kg) −.72d −.60d .82d .77d
% FM in Arms −.67d −.12 .48d -.07
% FM in Legs -- -- −.96d −.92d
% FM in Trunk −.96d −.92d -- --
Data presented as correlation coefficients
Abbreviations: CAC, coronary artery calcification; AER, albumin excretion rate; eGDR, estimated glucose disposal rate; FM, fat mass.
aLog-transformed +1 before statistical testing
Diabetes Res Clin Pract. Author manuscript; available in PMC 2011 September 1.

NIH
-PA Author Manuscript
NIH
-PA Author Manuscript
NIH
-PA Author Manuscript
Shay et al. Page 14
bLog-transformed before statistical testing
cp<0.05
dp<0.01
Diabetes Res Clin Pract. Author manuscript; available in PMC 2011 September 1.

NIH
-PA Author Manuscript
NIH
-PA Author Manuscript
NIH
-PA Author Manuscript
Shay et al. Page 15
Tabl
e 5
Ass
ocia
tion
of C
AD
risk
fact
ors a
nd re
gion
al a
dipo
sity
mea
sure
s with
CA
D st
atus
in m
en a
nd w
omen
with
type
1 d
iabe
tes -
The
Pitt
sbur
gh E
pide
mio
logy
of D
iabe
tes C
ompl
icat
ions
Stu
dy (N
=163
)
FEM
AL
ES
Mod
el 1
aM
odel
2M
odel
3M
odel
4
Var
iabl
eO
R95
% C
Ip
OR
95%
CI
pO
R95
% C
Ip
OR
95%
CI
p
Age
(yea
rs)
1.14
1.03
–1.2
5.0
11.
151.
03–1
.27
.01
1.13
1.03
–1.2
5.0
11.
151.
04–1
.29
.01
HD
Lc0.
620.
32–1
.20
.16
0.69
0.36
–1.3
5.2
80.
620.
32–1
.20
.16
0.70
0.36
–1.3
5.2
8
His
tory
of S
mok
ing
1.64
0.46
–5.9
3.4
51.
990.
51–7
.74
.32
1.65
0.46
–5.9
2.4
41.
980.
50–7
.85
.33
Hei
ght
0.46
0.23
–0.9
0.0
20.
450.
22–0
.92
.03
0.45
0.23
–0.9
0.0
20.
460.
22–0
.94
.03
eGD
R1.
080.
55–2
.12
.83
1.38
0.65
–2.9
5.4
01.
100.
56–2
.20
.78
1.42
0.66
–3.0
6.3
7
Tota
l FM
1.56
0.80
–3.0
1.1
91.
160.
55–2
.45
.69
1.50
0.77
–2.9
2.2
30.
960.
41–2
.21
.91
% F
M in
Leg
s0.
400.
16–0
.99
.05
% F
M in
Arm
s1.
260.
63–2
.50
.51
% F
M in
Tru
nk2.
791.
08–7
.20
.03
AIC
80.5
77.8
82.0
77.2
MA
LE
S
Mod
el 1
Mod
el 2
Mod
el 3
Mod
el 4
Var
iabl
eO
R95
% C
Ip
OR
95%
CI
pO
R95
% C
Ip
OR
95%
CI
p
Age
(yea
rs)
1.15
1.04
–1.2
8.0
11.
151.
04–1
.28
.01
1.16
1.05
–1.2
8.0
11.
151.
04–1
.28
<.01
Seru
m C
reat
inin
e1.
530.
88–2
.65
.13
1.52
0.87
–2.6
4.1
41.
530.
88–2
.65
.13
1.52
0.88
–2.6
4.1
4
His
tory
of S
mok
ing
1.18
0.38
–3.6
2.7
71.
200.
39–3
.71
.75
1.22
0.40
–3.7
7.7
31.
190.
38–3
.70
.76
Hei
ght
0.67
0.38
–1.1
6.1
50.
670.
39–1
.17
.16
0.65
0.37
–1.1
5.1
40.
670.
39–1
.17
.16
eGD
R0.
830.
43–1
.57
.56
0.86
0.43
–1.7
5.6
80.
830.
44–1
.58
.57
0.84
0.42
–1.6
8.6
2
Tota
l FM
1.14
0.64
–2.0
5.6
51.
110.
61–2
.04
.73
1.17
0.65
–2.1
0.6
01.
120.
57–2
.18
.75
% F
M in
Leg
s0.
900.
46–1
.78
.76
% F
M in
Arm
s0.
840.
47–1
.51
.56
% F
M in
Tru
nk1.
060.
49–2
.26
.89
AIC
95.2
97.1
96.9
97.2
Mod
el 2
: Inc
lude
s Mod
el 1
var
iabl
es a
nd %
FM
in L
egs
Diabetes Res Clin Pract. Author manuscript; available in PMC 2011 September 1.

NIH
-PA Author Manuscript
NIH
-PA Author Manuscript
NIH
-PA Author Manuscript
Shay et al. Page 16M
odel
3: I
nclu
des M
odel
1 v
aria
bles
and
% F
M in
Arm
s
Mod
el 4
: Inc
lude
s Mod
el 1
var
iabl
es a
nd %
FM
in T
runk
Odd
s rat
ios a
re p
er 1
SD
incr
ease
, exc
ept f
or a
ge (p
er 1
yr i
ncre
ase)
and
his
tory
of s
mok
ing
(yes
)
Abb
revi
atio
ns: C
AD
, cor
onar
y ar
tery
dis
ease
; OR
, odd
s rat
io; C
I, co
nfid
ence
inte
rval
; eG
DR
, est
imat
ed g
luco
se d
ispo
sal r
ate;
FM
, fat
mas
s; A
IC, A
kaik
e's In
form
atio
n C
riter
ia
a Mod
el 1
: Inc
lude
s sig
nific
ant u
niva
riate
var
iabl
es (a
ge a
nd H
DLc
in w
omen
, age
and
seru
m c
reat
inin
e in
men
) and
pot
entia
l con
foun
ders
(his
tory
of s
mok
ing,
hei
ght,
eGD
R a
nd T
otal
FM
)
Diabetes Res Clin Pract. Author manuscript; available in PMC 2011 September 1.


