Embed Size (px)
Citation preview
www.tjprc.org [email protected]
RELATIVE ABUNDANCE AND LENGTH-WEIGHT RELATIONSHIP O F CLARIAS
BUTHUPOGON AND HETEROBRANCHUS LONGIFILIS IN ASA RIVER, ILORIN, KWARA
STATE, NIGERIA
OGUNDIRAN, MATHEW AKINLOYE & FAWOLE, OLATUNDE OLUBA NJO
Environmental Biology Unit, Department of Pure and Applied Biology, Ladoke Akintola University of Technology,
Ogbomoso, Nigeria
ABSTRACT
The relative abundance and length-weight relationship of Clarias buthupogon and Heterobranchus longifilis were
studied in Asa River, Ilorin, Nigeria, between April, 2011 and March, 2013, using standard laboratory procedures.
Generally, C. buthupogon and H. longifilis were fairly distributed in Asa River with percentage compositions of
50.29% and 49.71% respectively. There were more fishes at downstream B compared to downstream A and more catch
was experienced during the rainy season compared to dry season. The correlation coefficient (r2) between length and
weight relationship was significantly high (P<0.05) and ranged between 0.644 and 0.908 for C. buthupogon and, between
0.235 and 0.908 for H. longifilis, with their regression coefficient (b) values ranged between 1.19 and 3.59 for
C. buthupogon and, between 2.19 and 4.81 for H. longifilis, a deviation from the standard value of 3, revealing positive and
negative allometric growth. Generally, weight increases faster than the length.
KEYWORDS: Clarrids, Length, Weight, Relationship, Asa River, Ilorin, Kwara State, Nigeria
INTRODUCTION
The global demand for animal protein has increased because of geometrical growth in human population along
with decline agricultural productivity. Fisheries are an important contributor to animal protein needs. The rational and
scientific management of fisheries depend on a fundamental understanding of fish biology and ecology. Among the various
biological aspects of fish, the length-weight relationship is of importance in the management of
both culture and captive fisheries. The yield of fish is usually studied using weight as a measure of size. Fish grows both in
length as well as in bulk, and length is easier to measure and so often used along with weight in growth studies. Length and
weight are related by a power relationship and the equation relating length to weight gives some
indication of the growth pattern of fish in a population. The length-weight relationship has both applied and pure
applications in the fisheries industry. Market sampling of fish of commercial importance often measures the length, as fish
are usually gutted and life weight cannot be measured with certainty. An estimate of it can be obtained using
predetermined length-weight regression.
Nigeria as the largest consumer of fish in Africa needs to increase its domestic fish population. Nigeria’s fresh
water surface area is estimated at 14,991,800 hectres (Ita, 1993), which is about 12.4% of its surface area
(94,185,000 hectres) (Olaosebikan and Raji, 1998). These water bodies constitutes source of fish supply from inland
fisheries; including the lakes, rivers, streams etc. Since most of the Nigeria water bodies are still traditionally farmed and
International Journal of Zoology and Research (IJZR) ISSN(P): 2278-8816; ISSN(E): 2278-8824 Vol. 4, Issue 5, Oct 2014, 35-46 © TJPRC Pvt. Ltd.
36 Ogundiran, Mathew Akinloye & Fawole, Olatunde Olubanjo
Impact Factor (JCC): 1.6864 Index Copernicus Value (ICV): 3.0
ponds are unmanaged, this gives rise to the shortage of fish production, therefore it becomes important to expand and
develop fresh water fish as a renewable natural resource before most of the fishes goes into extinction. Out of about
268 species of fish in the inland waters of Nigeria only the length-weight relationships (LWR) of 43 (16.04%) species have
been reported (Anibeze, 2000). As LWR varies geographically, it is important to obtain and use local LWR values
(Merella et al., 1997). LWR have many uses particularly in estimating the mean weight of a given length class, in
comparing species and populations in different geographic areas and in estimating the condition or “well being” of the fish
(Petrakis and Stergiou, 1995; Garcia et al., 1998). This contribution from the Asa River adds to the existing LWR data on
Nigerian freshwater fishes.
Length- weight data are useful standard results of fish sampling programs (Morato et al., 2001;
Mendes et al., 2004). In fisheries, size is generally more biologically relevant than age, mainly because several ecological
and physiological factors are more size-dependent. Consequently, variation in size has greater important implications for
species diversity and population dynamics (Eizini, 1994). Length – weight regressions have been frequently used to
estimate weight from length because direct weight measurements can be time-consuming in the field
(Sinovnic et al., 2004). Clarias is a fish genus belonging to the family Clariidae and it comprises of ten species in Nigeria
waters, namely, C. gariepinus, C. anguillaris, C. jaensis, C. Macromystax, C. albopunctatus, C. agboyiensis,
C. buthupogon, C. ebriensis, C pachynema, and C. camerunensis (Olaosebikan and Raji, 1998). Clarias buthupogon and
Heterobrachuslongifilis are the predominant species of the genus found in Asa River. The present work compares the
relative abundance and length-weight relationship of Clarias buthupogon and Heterobrachus longifilis in the polluted Asa
River.
MATERIALS AND METHOD
The Study Area
Asa River has a surface area of 302 hectares with a maximum depth of 14 m and is located approximately 4 km
south of Ilorin Township (Adekeye, 2004). The river lies between latitude 80281 and 80521N and longitude 40351 and
40451East. The river is very significant to the socio-economic growth of Ilorin and supplies the basic water needs of Ilorin
city and its environs after treatment. It also serves as their major source of water for agricultural activities such as irrigation
of farmland and most importantly fishing. The river provides fresh fish to the town and serves as water source for both
industrial and domestic uses (Adekeye, 2004). More than three quarter (¾) of domestic and industrial water requirements
of Ilorin and its environs are supplied from Asa River. Major industries in the town are sited along its bank. The river is
also being used for recreational purposes, serving as a tourist attraction centre particularly, and the Asa area.
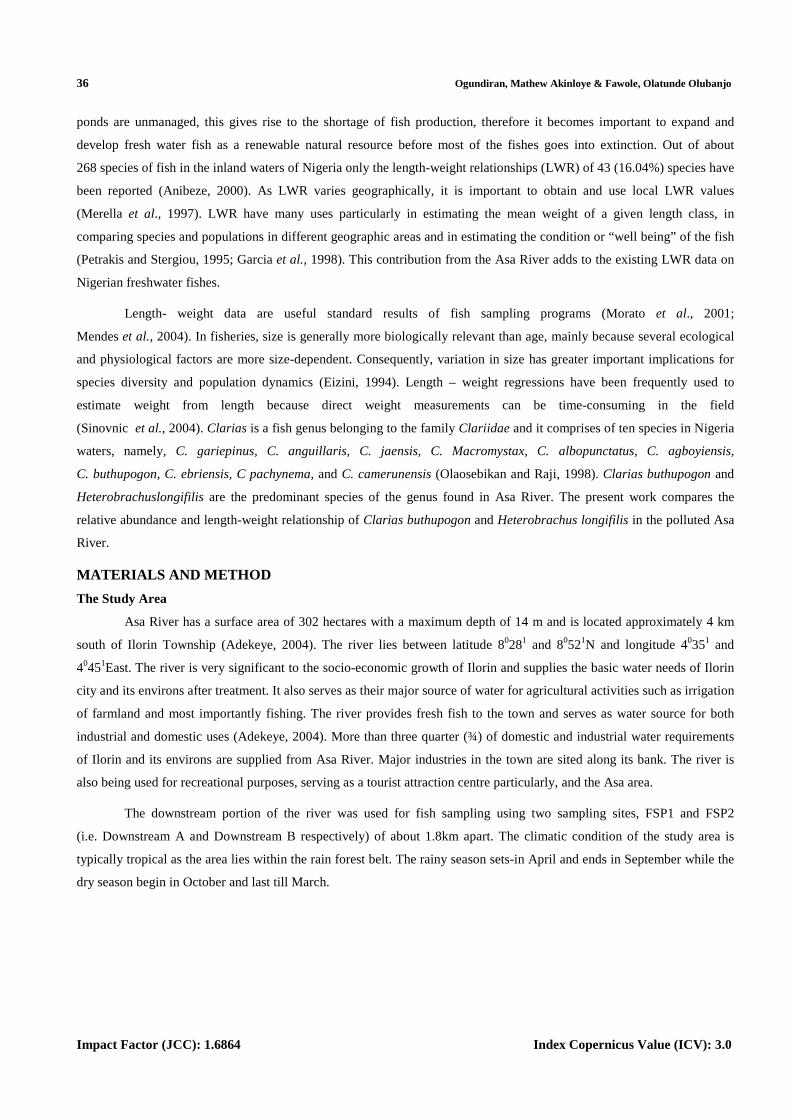
The downstream portion of the river was used for fish sampling using two sampling sites, FSP1 and FSP2
(i.e. Downstream A and Downstream B respectively) of about 1.8km apart. The climatic condition of the study area is
typically tropical as the area lies within the rain forest belt. The rainy season sets-in April and ends in September while the
dry season begin in October and last till March.
Relative Abundance and Length-Weight Relationship of Clarias Buthupogon 37 and Heterobranchus Longifilis in Asa River, Ilorin, Kwara State, Nigeria
www.tjprc.org [email protected]
G A M B A R I
B . A L U K O
A D E W O L E
U N I V E R S I T Y( M I N I C A M P U S )
O L O Y E
R . A B A T A
RO
AD
FR
OM
IBA
DAN
G R A
U B AP O L I C E S T A T I O N
R . O D O T A
O D O T A
A S AD A M
T A T E A N D L Y L E
M A T C H O
R . A G B A
A G B AD A M
G A A A K A N B I
R . A T I K E K E
C O C AC O L A
P E P S I -
M A P O F N I G E R I AS H O W I N G I L O R I N
I L O R I N
8 ° 3 0 ' N
8 ° 2 6 ' N
4 ° 3 5 ' N
RO
AD
TO
KA
DU
NA
N I G E R I A R I V E R B A S I NH E A D Q U A T E R S
8 ° 3 0 ' N
8 ° 2 6 ' N
4 ° 3 5 'N
1 0 1 2 K mS C A L E
S P 2
S P 1
F S P 1
F S P 2
S P 3
C O C A - C O L A
P E P S I - C O L AD E P O T
O K U N R I V E R
R O A D S R I V E R S D A M S
N
OS
ER
E R
IVE
R
AA
SA
RIV
ER
A A B A DA M
R OA D
T U Y I LP H A R M A C E U T I C A L S
D A N G O T EF L O U R
I N D U S T R Y
V I T A F O A MI N D U S T R Y
D O Y I N S O A PA N D
D E T E R G E N T
S P 1 S P 2 S P 3 F S P 1S a m p l e P o in t A S a m p l e P o in t B S a m p l e P o in t C F i s h S a m p l in gP o i n t A ( u p s t r e a m )
F S P 2 F i s h S a m p lin gP o i n t B
( d o w n s t r e a m )
L O C A T I O N S
B R I D G E
U N I T Y A R E A
Figure 1: Map Showing Asa River and all the Sampling Sites
The two fish species used in this work were Clarias buthupogon and Heterobranchus longifilis, both of which are
the predominant species in the water body. Fishing was usually done using different gill nets consisting of 25 mm, 38 mm,
51 mm, 64 mm, 102 mm, 114 mm and 127 mm. Fish samples were also collected using hooks of various sizes, traps and
cast nets. Fishing was done twice monthly starting from April, 2011 to March, 2013. The collected fish samples were
identified immediately after collection using the methods of FAO (1992) and Olaosebikan and Raji (1998).
Monthly catches of C. buthupogon and H. longifilis were mopped and cleaned with filter papers and weighed to
the nearest 0.1g Loadind Mettler Model PM 2000 for small fishes and Salter Model 180 for larger species. The total length
was measured from the tip of the Snout to the tip of the caudal fin while the standard length was taken from the tip of the
snout to the base of the caudal fin using a standard measuring board. Length frequency distribution was also determined by
plotting the frequency of occurrence throughout the sampling months against standard length, and represented with bar
charts. Length – weight relationship was also determined by plotting Log of body weight against Log of standard length
and it is expressed by the equation.
W =aLb (1)
Where, W is weight in grammes, L is Length in centimetres, a is regression constant and b is an exponent lying
between 2 and 4. This relationship can be transformed into a straight line relationship in the form.
Log W = Log a + b Log l (2)
Where: b is the regression coefficient (slope of the graph) and, a is the regression constant
(intercept of the regression line on the Y axis).
38 Ogundiran, Mathew Akinloye & Fawole, Olatunde Olubanjo
Impact Factor (JCC): 1.6864 Index Copernicus Value (ICV): 3.0
RESULTS
Relative Abundance
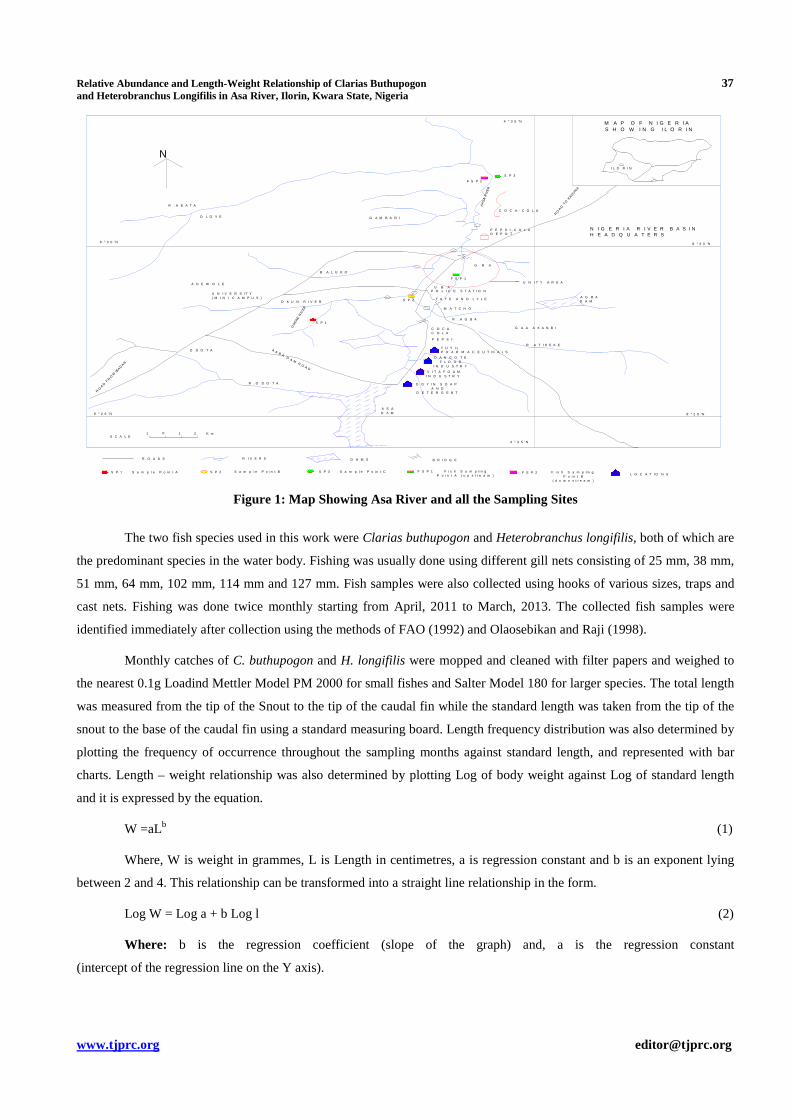
The percentage occurrence of Clarias buthupogon and Heterobranchus longifilis in the cast net/cage catches is
known as the relative abundance of the two species, as shown in Figure 2. H. longifilis was the least abundant having the
percentage composition of 49.71% while C. buthupogon had 50.29% catch between the period of April, 2011 to March,
2013. Although the difference in percentage catch was not statistically significant.
Figure 2: Relative Abundance of C. buthupogon and H. longifilis Sampled from Asa River
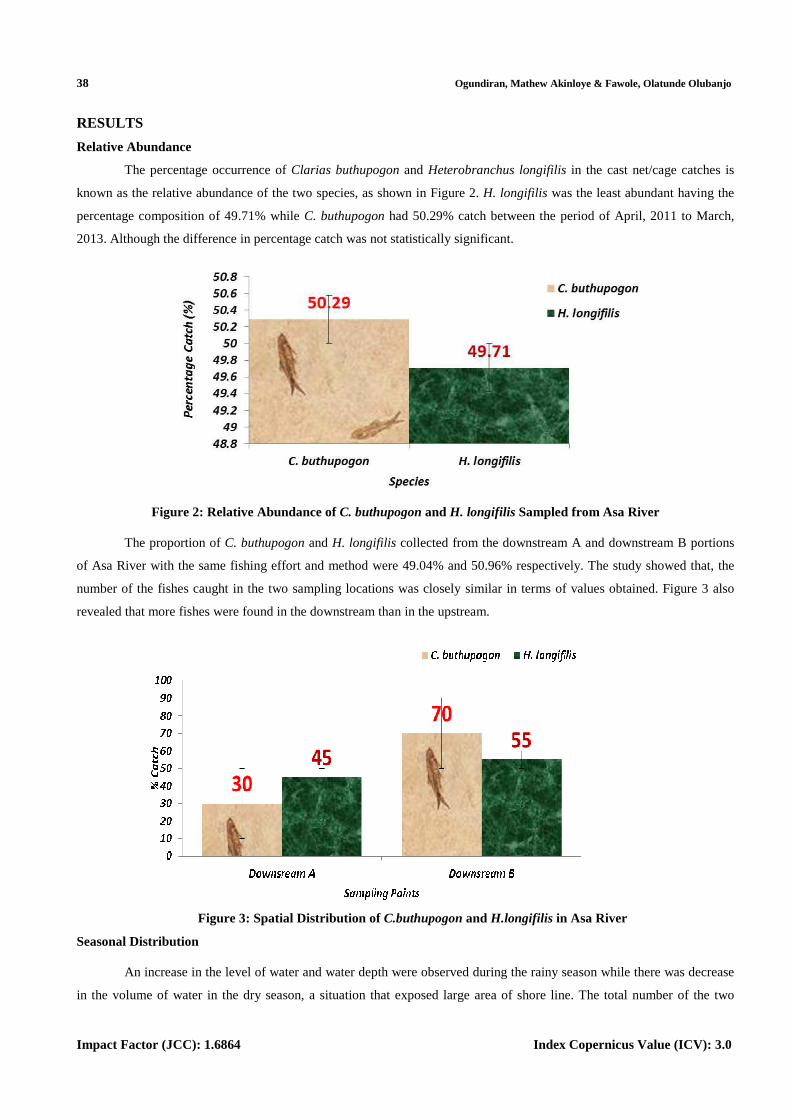
The proportion of C. buthupogon and H. longifilis collected from the downstream A and downstream B portions
of Asa River with the same fishing effort and method were 49.04% and 50.96% respectively. The study showed that, the
number of the fishes caught in the two sampling locations was closely similar in terms of values obtained. Figure 3 also
revealed that more fishes were found in the downstream than in the upstream.
Figure 3: Spatial Distribution of C.buthupogon and H.longifilis in Asa River
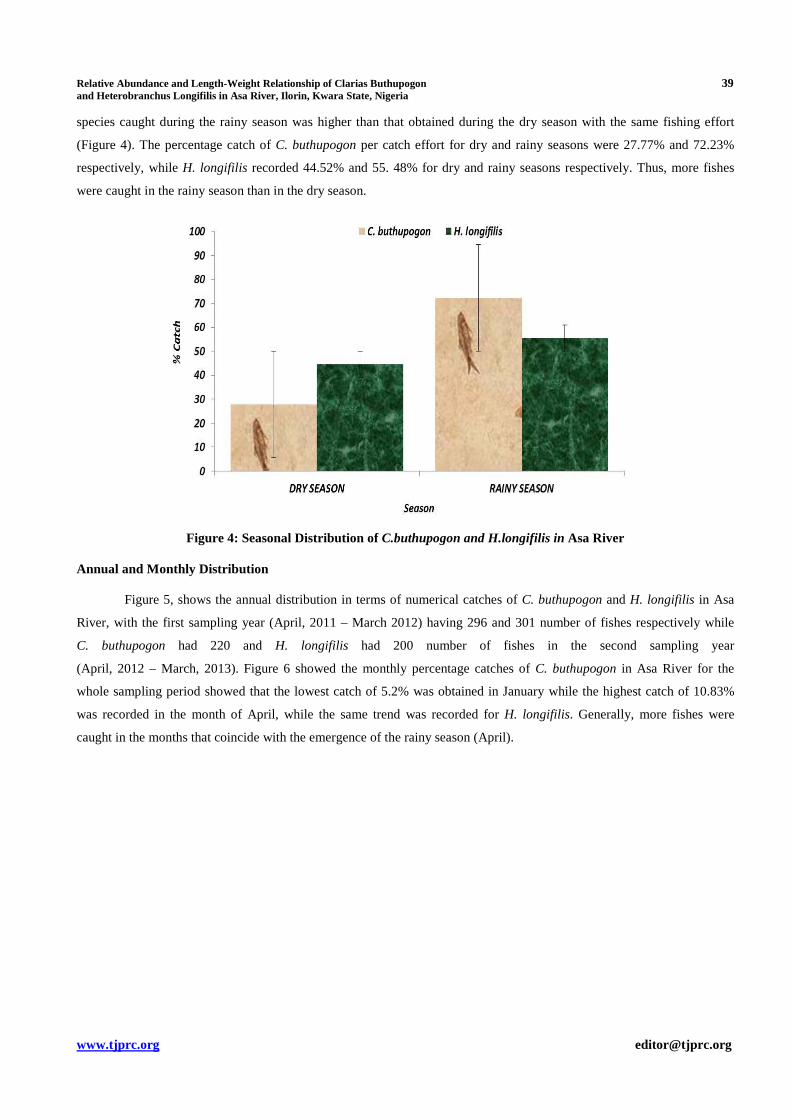
Seasonal Distribution
An increase in the level of water and water depth were observed during the rainy season while there was decrease
in the volume of water in the dry season, a situation that exposed large area of shore line. The total number of the two
Relative Abundance and Length-Weight Relationship of Clarias Buthupogon 39 and Heterobranchus Longifilis in Asa River, Ilorin, Kwara State, Nigeria
www.tjprc.org [email protected]
species caught during the rainy season was higher than that obtained during the dry season with the same fishing effort
(Figure 4). The percentage catch of C. buthupogon per catch effort for dry and rainy seasons were 27.77% and 72.23%
respectively, while H. longifilis recorded 44.52% and 55. 48% for dry and rainy seasons respectively. Thus, more fishes
were caught in the rainy season than in the dry season.
Figure 4: Seasonal Distribution of C.buthupogon and H.longifilis in Asa River
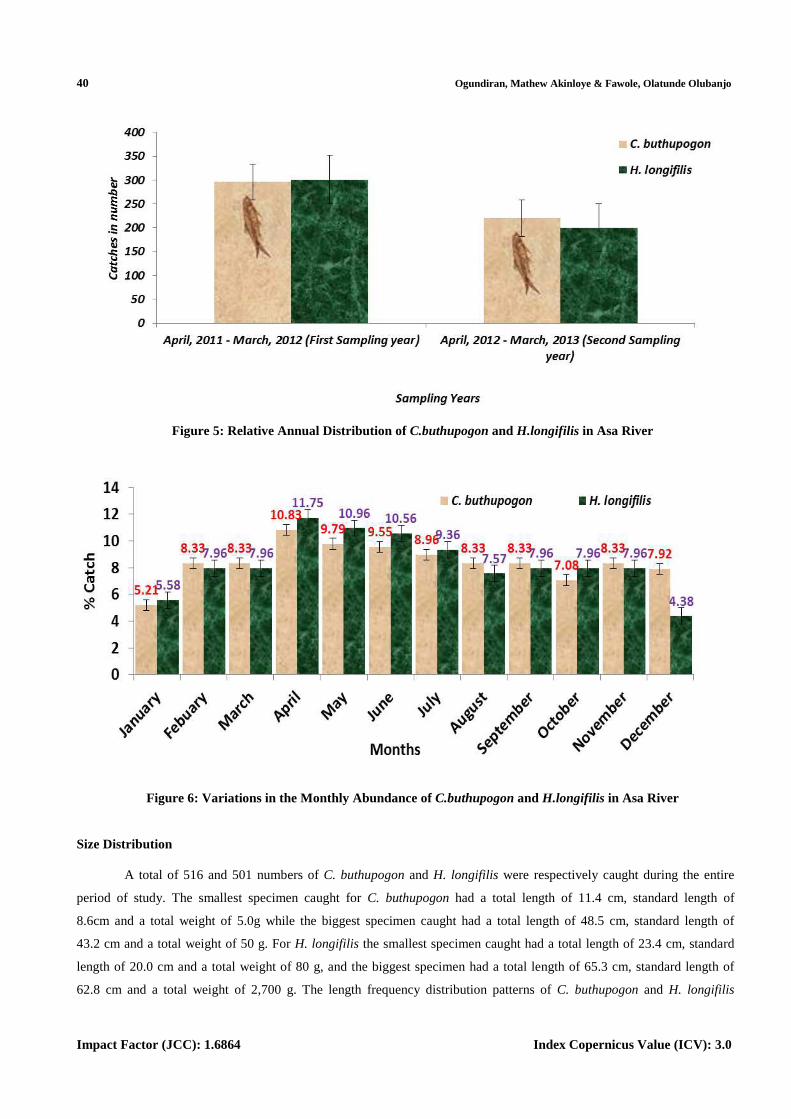
Annual and Monthly Distribution
Figure 5, shows the annual distribution in terms of numerical catches of C. buthupogon and H. longifilis in Asa
River, with the first sampling year (April, 2011 – March 2012) having 296 and 301 number of fishes respectively while
C. buthupogon had 220 and H. longifilis had 200 number of fishes in the second sampling year
(April, 2012 – March, 2013). Figure 6 showed the monthly percentage catches of C. buthupogon in Asa River for the
whole sampling period showed that the lowest catch of 5.2% was obtained in January while the highest catch of 10.83%
was recorded in the month of April, while the same trend was recorded for H. longifilis. Generally, more fishes were
caught in the months that coincide with the emergence of the rainy season (April).
40 Ogundiran, Mathew Akinloye & Fawole, Olatunde Olubanjo
Impact Factor (JCC): 1.6864 Index Copernicus Value (ICV): 3.0
Figure 5: Relative Annual Distribution of C.buthupogon and H.longifilis in Asa River
Figure 6: Variations in the Monthly Abundance of C.buthupogon and H.longifilis in Asa River
Size Distribution
A total of 516 and 501 numbers of C. buthupogon and H. longifilis were respectively caught during the entire
period of study. The smallest specimen caught for C. buthupogon had a total length of 11.4 cm, standard length of
8.6cm and a total weight of 5.0g while the biggest specimen caught had a total length of 48.5 cm, standard length of
43.2 cm and a total weight of 50 g. For H. longifilis the smallest specimen caught had a total length of 23.4 cm, standard
length of 20.0 cm and a total weight of 80 g, and the biggest specimen had a total length of 65.3 cm, standard length of
62.8 cm and a total weight of 2,700 g. The length frequency distribution patterns of C. buthupogon and H. longifilis
Relative Abundance and Length-Weight Relationship of Clarias Buthupogon 41 and Heterobranchus Longifilis in Asa River, Ilorin, Kwara State, Nigeria
www.tjprc.org [email protected]
recorded in this work indicates that a wide range of sizes of these fishes were caught during the sampling period. However,
C. buthupogon with the standard length of between 15.0 cm and 19.9 cm and 20.0 cm and 24.9 cm were more abundant
than other groups, while in H. longifilis, the specimen with mean standard length of between 30.0 cm and 34.9 cm and
35.0 cm and 39.9cm were found to be more abundant than other groups.
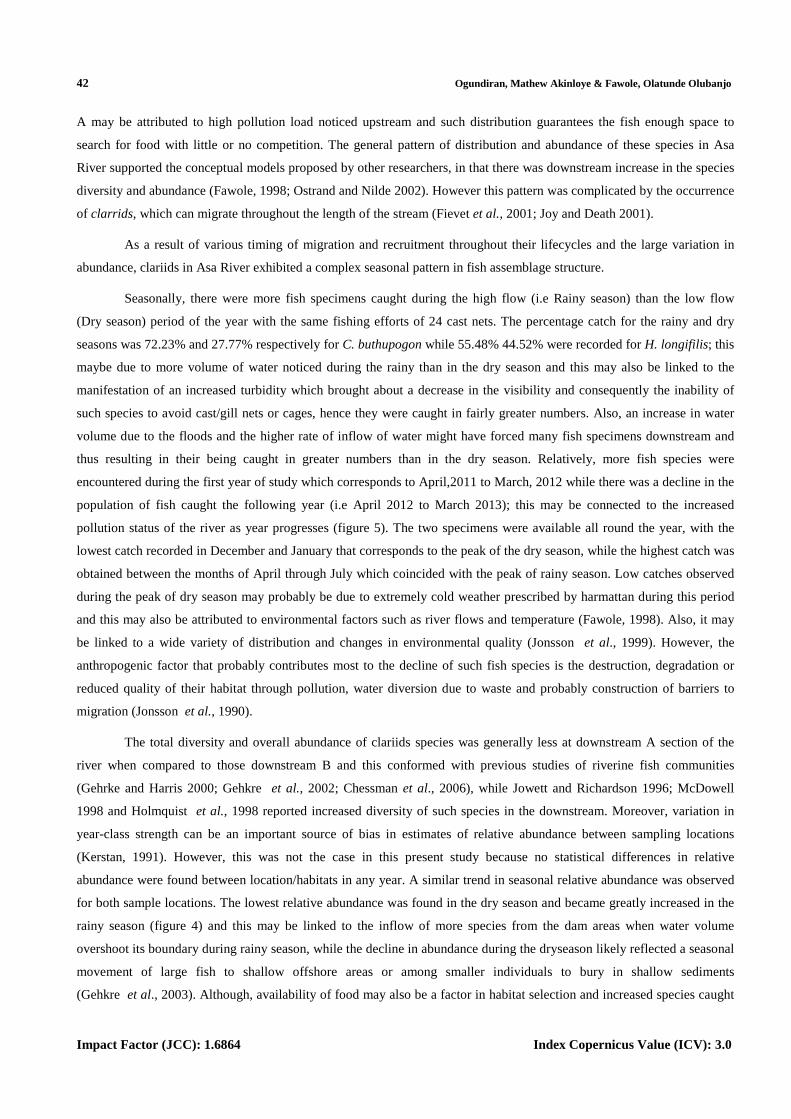
Length-Weight Relationship
The length-weight relationships were significant for all categories of sampled species (Table 1).
The determination coefficient r2 for C. buthupogon ranged from 0.644 to 0.908 for downstream A and in the dry season of
the first and second sampling years (2011/2012 and 2012/2013). In terms of growth type, the results showed that
C. buthupogon exhibits negative allomeric except in the downstream A of the first sampling year where the test organism
reflects a positive allometric type of growth. The coefficient of determination (r2) for H. longifilis ranged from
0.234 to 0.985 with the value of b ranged between 2.19 to 4. 81, but in terms of growth type, the results showed that,
negative allometric growth was the order of the day except for few that exhibit positive allometric, while an isometric
growth was noticed in the dry season with H. longifilis.
Table 1: Length-Weight Relationship of C. buthupogon and H. longifilis Collected from Asa River
DISCUSSIONS
In this study, the results showed that C. buthupogon and H. longifilis were well distributed in Asa River.
In numerical terms, the most abundant species was C. buthupogon with a total catch of 516 while 501 of H. longifilis
(figure 2) which translated to 50.29% and 49.71% respectively. However, it was discovered that the species were more
concentrated in the downstream B part of the river than in the upstream (figure 3). The decline observed in downstream
42 Ogundiran, Mathew Akinloye & Fawole, Olatunde Olubanjo
Impact Factor (JCC): 1.6864 Index Copernicus Value (ICV): 3.0
A may be attributed to high pollution load noticed upstream and such distribution guarantees the fish enough space to
search for food with little or no competition. The general pattern of distribution and abundance of these species in Asa
River supported the conceptual models proposed by other researchers, in that there was downstream increase in the species
diversity and abundance (Fawole, 1998; Ostrand and Nilde 2002). However this pattern was complicated by the occurrence
of clarrids, which can migrate throughout the length of the stream (Fievet et al., 2001; Joy and Death 2001).
As a result of various timing of migration and recruitment throughout their lifecycles and the large variation in
abundance, clariids in Asa River exhibited a complex seasonal pattern in fish assemblage structure.
Seasonally, there were more fish specimens caught during the high flow (i.e Rainy season) than the low flow
(Dry season) period of the year with the same fishing efforts of 24 cast nets. The percentage catch for the rainy and dry
seasons was 72.23% and 27.77% respectively for C. buthupogon while 55.48% 44.52% were recorded for H. longifilis; this
maybe due to more volume of water noticed during the rainy than in the dry season and this may also be linked to the
manifestation of an increased turbidity which brought about a decrease in the visibility and consequently the inability of
such species to avoid cast/gill nets or cages, hence they were caught in fairly greater numbers. Also, an increase in water
volume due to the floods and the higher rate of inflow of water might have forced many fish specimens downstream and
thus resulting in their being caught in greater numbers than in the dry season. Relatively, more fish species were
encountered during the first year of study which corresponds to April,2011 to March, 2012 while there was a decline in the
population of fish caught the following year (i.e April 2012 to March 2013); this may be connected to the increased
pollution status of the river as year progresses (figure 5). The two specimens were available all round the year, with the
lowest catch recorded in December and January that corresponds to the peak of the dry season, while the highest catch was
obtained between the months of April through July which coincided with the peak of rainy season. Low catches observed
during the peak of dry season may probably be due to extremely cold weather prescribed by harmattan during this period
and this may also be attributed to environmental factors such as river flows and temperature (Fawole, 1998). Also, it may
be linked to a wide variety of distribution and changes in environmental quality (Jonsson et al., 1999). However, the
anthropogenic factor that probably contributes most to the decline of such fish species is the destruction, degradation or
reduced quality of their habitat through pollution, water diversion due to waste and probably construction of barriers to
migration (Jonsson et al., 1990).
The total diversity and overall abundance of clariids species was generally less at downstream A section of the
river when compared to those downstream B and this conformed with previous studies of riverine fish communities
(Gehrke and Harris 2000; Gehkre et al., 2002; Chessman et al., 2006), while Jowett and Richardson 1996; McDowell
1998 and Holmquist et al., 1998 reported increased diversity of such species in the downstream. Moreover, variation in
year-class strength can be an important source of bias in estimates of relative abundance between sampling locations
(Kerstan, 1991). However, this was not the case in this present study because no statistical differences in relative
abundance were found between location/habitats in any year. A similar trend in seasonal relative abundance was observed
for both sample locations. The lowest relative abundance was found in the dry season and became greatly increased in the
rainy season (figure 4) and this may be linked to the inflow of more species from the dam areas when water volume
overshoot its boundary during rainy season, while the decline in abundance during the dryseason likely reflected a seasonal
movement of large fish to shallow offshore areas or among smaller individuals to bury in shallow sediments
(Gehkre et al., 2003). Although, availability of food may also be a factor in habitat selection and increased species caught
Relative Abundance and Length-Weight Relationship of Clarias Buthupogon 43 and Heterobranchus Longifilis in Asa River, Ilorin, Kwara State, Nigeria
www.tjprc.org [email protected]
at downstream site of Asa River, and this may be linked to availability of wide varieties of food and this is in consonance
with the submissions of Gehkre et al.,(2003) and Fawole and Adewoye, (2004).
C. buthupogon in the range of 15.0 cm – 19.9 cm for male and 20.0 cm – 24.9 cm for female were found to be
more abundant; while in H. longifilis, the specimens with the mean length of between 30.0 cm–34.9 cm for male and
35.0 cm–39.9 cm for female were noted to be more abundant than other groups, this is an indication that a wide range of
these species can be found in Asa river. The logarithmic plots of log of weight against log of total length showed a linear
relationship which suggest that an increase in length may lead to an increase in body weight. The correlation coefficient
(r2) between weight and length were fairly high for the two studied species and this is an indication that there is a high
degree of correlation between weight and length in the sampled fishes, its positive values reflects that the slope s are
positive. It has been proved that, the closer the r2 value to a unity (i.e. 1) the better the relationship. However, the values of
the regression coefficient (b) for the two Clariid species and for the entire period of study were significantly different
(p>0.05) from 3.0 which is an indication that the Clariids fish species in Asa river exhibits different growth pattern,
ranging from isometric, positive allometric and negative allometric, but the most common growth pattern observed in this
work is negative allometric which is predominant two sample locations and this is irrespective of sex which implies that
the fish species may be longer than its weight or weight increases faster than its length. This observation may be attributed
to over-fishing by the natives owing to easy accessibility to the sampling stations, hence making it difficult for the species
to grow to a sizeable population; this may be unconnected to effluents discharges from industries within the vicinity which
also impacted negatively on the size of the species harvested. This could also be linked to high pollution index experienced
at the downstream A portion of the river due to direct gross discharge of industrial effluents, domestic wastewaters within
the vicinity which also impacted negatively on the size of species harvested or may be due to the feeding activities of these
species, since they are benthic feeders. This result is in conformity to the submission of Fawole and Adewoye, (1998);
Fawole and Arawomo, (1998); Fawole and Arawomo, (1999) who reported allometric growth in Sarotherodon galilaeus in
Opa reservoir with a regression coefficient of 2.43. The result obtained in this work also supported the observation of
Odedeyi, et al., (2007), who also reported allometric growth pattern in Johniusbel angerii due to high chemical pollutants
like fluoride in the Arabian Sea with a regression coefficient of 0.47.
According to Adeyemi et al., (2009), negative allometric growth pattern in fish implied that the weight increases
at a lesser rate than the cube of the body length. King (1996) reported similar growth pattern in many fishes in Nigeria
freshwater. Negative allometric growth have also been reported for H. longifilis from Idodo River, Nigeria
(Anibeze, 2000), Mormyrusrume from River Osse, South Western Nigeria (Odedeyi, et al., 2007) and Parachana obscura
from Igwu and Itu Rivers wetlands, Nigeria (Bolaji, et al., 2011). However, unlike the results in this present work,
isometric growth were reported for Malapterurus electricus from the lower Borno River, Nigeria (Garba and Arome, 2006)
and for Ethmalo safrimbriata and Ilisha Africana from Nkaro River, Nigeria (Abowei et al., 2009) and positive allometric
growth pattern was reported for Hemichromis niloticus from Kainji lake (Yem et al., 2007). The differences recorded
between the results of this work and other previous and afore-mentioned could be attributed to differences in fish species,
age, and sex, fecundity of the fishes, sampling method, sample size and most importantly the prevailing environmental
conditions in different water bodies.
The values of the regression coefficient calculated for both species as shown in table 1 revealed that, b value for
H. longifilis for the two sampling years were better than what was recorded for C. buthupogon. H. longifilis has 4.06 and
44 Ogundiran, Mathew Akinloye & Fawole, Olatunde Olubanjo
Impact Factor (JCC): 1.6864 Index Copernicus Value (ICV): 3.0
4.71 for 2011/2012 and 2012/2013 respectively, both of which translated to positive allometric growth, while
C. buthupogon had 1.19 and 3.59 for 2011/2012 and 2012/2013 respectively which translate to negative and positive
allometry growths. This is an indication that, H. longifilis became heavier with an increase in length and this may be
attributed to the fact that, H. longifilis is a hybrid species of the Clariidae family. Generally, seasonal changes seem not to
have any noticeable effect on the growth pattern of the two species. The two sampling locations recorded negative
allometric growth and this may be linked to the high pollution index noticed in the two locations (Eizini, 1994). For all the
two studied species, the b values were generally in agreement with previous work. It is known that the functional
regression ‘’ b ‘’ value represents the body form, and it is directly related to the weight affected by ecological factors such
as, temperature, food supply, spawning conditions and other factors like sex, age, fishing time and area, and fishing vessels
(Ricker, 1973).
Generally, fishing activities was not observed at sampling site B but relatively low at site C where fish samples
were taken for analyses in this study. This is an indication that it is highly probable that the streams are polluted. The body
size and weight of the two species sampled is adversely affected in these polluted waters. The predominant growth pattern
exhibited by the sampled fish species was negative allometry which indicated that the increase in length of these fishes are
not proportional to increase in weight and this could be due to the effects of the pollution status of the river. Hence, there is
need for further studies on the reproductive potential, food and feeding habits and as well as the condition factor of such
edible fisheries in Asa River.
CONCLUSIONS
The body size and weight of the two species sampled is adversely affected in these polluted waters.
The predominant growth pattern exhibited by the sampled fish species was negative allometry which indicated that the
increase in length of these fish is not proportional to increase in weight and this could be due to the effects of the pollution
status of the river. There were significant variations in the mean values of the two sampled fish species for the two years in
terms of percentage compositions. Also, significant seasonal variations occurred between the mean values of dry and rainy
seasons. The rainy season had higher value than the dry season.
ACKNOWLEDGEMENTS
We are grateful to the entire work force of the central research laboratory of Ladoke Akintola University of
Technology, Ogbomoso for the opportunity given to us to carry out this research work. We also grateful to the technical
staff of Pure and Applied Biology Department, Ladoke Akintola University of Technology, Ogbomoso for their assistance
and regular supply of necessary laboratory equipments.
REFERENCES
1. Abowei, J. F. N., Davis, O. A. and Eli, A. A. (2009): Study of the Length-Weight Relationship and Condition
Factor of Five Fish Species from Nkoro River, Niger Delta, Nigeria. J. of Bio Sci 1(3):94-98.
2. Adekeye, A. O. (2004): Feasibility report for ECOWAS fund loan for accelerated fish production project. A paper
presented at ministry of Agricultural and natural resources (M.A.N.R), Kwara State Nigeria.
3. Adeyemi, S.O., Adikwu, I.A., Akombu, P.M. and Iyela, J.T. (2009): Survey of Zooplanktons and
Macroinvertebrates of Gbedikere Lake, Bassa, Kogi State, Nigeria. Int. J. Lakes and Rivers, 1: 55- 62.
Relative Abundance and Length-Weight Relationship of Clarias Buthupogon 45 and Heterobranchus Longifilis in Asa River, Ilorin, Kwara State, Nigeria
www.tjprc.org [email protected]
4. Anibeze, C. I. P. (2000): Oocyte structure, fecundity and sex ratio of Heterobranchus longifilis
(Valenciennes 1940) in Idodo river basin (Nigeria) with comments on the breeding biology. Journal of Aquatic
Sciences, 15: 59 – 61.
5. Bolaji, B. B., Mfon, T.U. and Utibe, D.I. (2011): Preliminary study on the aspect of the biology of snakehead
parachama obscura, in a Nigeria Wetland. Afr. J. Food, Agric. Nut. Develop., 11: 4708-4717
6. Chessman, B. C., Fryirus, K. and Brierley, G. J. (2006): Linking geomorphic character, behavior and condition to
fluvial biodiversity: Implications for river management. Aquatic Concervation: Marine and Freshwater
Ecosystem 16, 267-288.
7. Eizini, K. (1994): An empirical study of variability in length- at age of marine fishes. Journal of Applied
Ichthyology, 10: 17-41.
8. Eizini, K. (1994): An empirical study of variability in length- at age of marine fishes. Journal of Applied
Ichthyology, 10: 17-41.
9. FAO. (1992): CROPWAT: A computer program for irrigation planning and management. M. Smith. Irrigation
and Drainage Paper 46. Rome.
10. Fawole, O. O and Arawomo, G. A. O. (1999): Fecundity of Sarotherodon galilaeus (Pisces: Cichlidae) in the Opa
reservoir, Ile- Ife, NigeriaRev. biol. trop vol. 48 no.1 San José mar.
11. Fawole, O. O. (1998): Studies on Relative Abundance and mode of Distribution of Fish Species in Opa
Reserviour, Ile Ife, Nigeria. Journal ofApplied Sciences, Vol. 1, pp 45- 56
12. Fawole, O. O. and Adewoye, S. O. (2004):Aspects of the Biology of Clarias gariepinus (BURCHELL, 1822)
in Oba reservoir, Ogbomoso, Nigeria. Science Focus 8: 105 – 109.
13. Fawole, O. O. and Arawomo, G. A. O. (1998): Some Aspect of the Reproductive Biology of Sarotherodon
galilaeus (Artedi) in the Opa Reservoir. Journal of Science Research. Vol. 4(1) pp 107 - 111.
14. Fievet, E., Doledec, S. and Lim, P. (2001): Distribution of migratory of fishes and shrimps along multivariate
gradients in tropical island stream. Journal of Fish Biology 59, 390-402.
15. Garcia-Cubas, A. (1998). Ecologia y distribucion delos micromoluscos de treslagunas litorales delGolfo de
México. Doctoral thesis. Dpto de Biología. Fac. Ciencias. UNAM, 256 p.
16. Gehrke, P. C. Astles, K. L. and Harris, H. J. (2000): Large-scale patterns in species richness and composition of
temperature riverine fish communities, south-eastern Australia. Marine and Freshwater Research 51, 165-182.
17. Gehrke, P. C., Gilligan, D. M. and Barwick, M. (2002): Changes in fish communities of the Shoalhaven River 20
years after construction of Tallow Dam, Australia. River Research and Applications 18, 291-300.
18. Holmquist, J. F., Schmidt-Gendenbach, J. M. and Yoshioka, B. B. (1998): High dams and marine-freshwater
linkages: effects on native and introduced fauna in the Caribbean. Conservation Biology 12, 621-630.
46 Ogundiran, Mathew Akinloye & Fawole, Olatunde Olubanjo
Impact Factor (JCC): 1.6864 Index Copernicus Value (ICV): 3.0
19. Jonsson B., Jonsson N., and Hansen L. P. (1990): Does juvenile experience affect migration and spawning of
adult Atlantic salmon? Behavioral Ecology and Sociobiology; 26:225-230.
20. Jönsson, E. G., Nöthen, M. M. and Hansen L. P. (1999): Polymorphisms in the dopamine D2 receptor gene
and their relationships to striatal dopamine receptor density of healthy volunteers. Mol. Psychiatry.; 4: 290–296.
21. Jowett, I. G. and Richardson, J. (1996): Distribution and abundance of freshwater fish in New Zealand rivers. New
Zealand Journal of Marine and Freshwater Research 30, 239-255.
22. Joy, M. K. and Death, R. G. (2001): Control of freshwater fish and crayfish community structure in Taranaki,
New Zealand: dams, diadromy or habitat structure? Freshwater biology 46, 417-429.
23. Kerstan, M. (1991): The importance of rivers as nursery grounds for 0- and 1-group flounder
(Pleuronectesflesus L.) in comparison to the Wadden Sea. Neth. J. Sea Res. 27, 353–366.
24. King, R. P. (1996): Length-Weight relationship of Nigerian Coastal water fishes. Fishbyte, 19(4): 53-58.
25. Odedeyi, D. O., Fagbenro, O., Bello, O. and Adebayo, O. (2007): “Length-weight and condition factorof the
elephant fish, Mormyrus rumein River Ose, Southwestern Nigeria”, Animal Research International 4, 617-620.
26. Olaosebikan, B. D. and Raji, A. (1998): Field guide to Nigeria freshwater fishes. Federal College of Freshwater
fisheries Techn., New Bussa, Nigeria. 104pp
27. Olayemi A. O., Eniola K. I. T., Awe, S. and Kayode- Ishola, T. M. (2003): Distribution of bacteria in three
detergent effluent polluted water bodies in Ilorin Nigeria NISEB Journal 3 (3): 79- 6.
28. Ostrand, K. G. and Nilde, G. R. (2002); Seasonal and spatial variation in a prairie stream-fish assemblage.
Ecology of Freshwater Fish 11, 137-149.
29. Yem, I. Y., Sani, A. O., Bankole, N. O., Onimisi, H. U. and Musa, Y. M. (2007): Overfishing as a factor
responsible for declined in fish species diversity of Kainji, Nigeria. FISON Proceedings edited by U.I. Enin, E.I.
Chukwu, P.O. Ajah, D.A. Ama-Abasi and F.M. Nwosu 79-84p.


