Embed Size (px)
Citation preview

Cerebral Cortex
doi:10.1093/cercor/bhr387
Reorganization of Oscillatory Activity in Human Parietal Cortex during Spatial Updating
J. Van Der Werf1,2, V. N. Buchholz1, O. Jensen1 and W. P. Medendorp1
1Donders Institute for Brain, Cognition and Behaviour, Radboud University Nijmegen, 6525 EN Nijmegen, the Netherlands and2Department of Cognitive Neuroscience, Radboud University Nijmegen Medical Center, NL-6500 HB Nijmegen, the Netherlands
J. Van Der Werf and V. N. Buchholz have contributed equally to this work
Address correspondence to J. Van Der Werf, Department of Cognitive Neuroscience, Radboud University Medical Center, PO Box 9101, NL-6500 HB
Nijmegen, the Netherlands. Email: [email protected].
Single-neuron recordings have shown that the posterior parietalcortex (PPC) processes spatial information in many frames ofreference, including gaze-centered, head-centered, body-centered,and intermediate coding frames. At the population level, rhythmicneuronal synchronization may provide a mechanism by which PPCcould selectively emphasize the task-relevant reference frame inspatial processing. Using magnetoencephalography, we tested thishypothesis by studying the modulations in oscillatory activity ina spatial updating task. Human subjects had to remember thelocation of a target, briefly flashed left or right of central fixation.Next, they refixated and then, after a further memory delay, madea saccade to the memorized target location. We observed gamma-band (>40 Hz) synchronization and alpha-band (8--12 Hz) desychro-nization in contralateral occipital and parietal areas, both showingupdating in a gaze-centered reference frame but with fast and slowtime courses, respectively. Furthermore, after updating, ipsilateralareas showed less alpha desynchronization when they had beencontralateral to the target before updating. Taken together, ourresults suggest that power in the gamma band is instantlyreorganized to encode task-relevant visuomotor space in a gaze-centered reference frame, while power in the alpha band reflectsa regulatory mechanism actively facilitating the gating of thesaccade target and inhibiting the original stimulus representation.
Keywords: alpha band, gamma band, magnetoencephalography, saccade,reference frame
Introduction
The posterior parietal cortex (PPC) plays an important role in
the transformation of spatial representations from perception
to action. In particular, activity in the lateral intraparietal area
(LIP) of monkey PPC and homologous areas in the human PPC
has been associated with specialized spatial functions, in-
cluding the control of spatial attention (Silver and Kastner
2009; Bisley and Goldberg 2010; Liu et al. 2010), working
memory (Pesaran et al. 2002; Curtis et al. 2004), and saccade
planning (Sereno et al. 2001; Andersen and Buneo 2002; Zhang
and Barash 2004; Liu et al. 2010).
The neural architecture of LIP is characterized by primarily
eye-based gaze-centered response fields (Andersen and Buneo
2002; Patel et al. 2010). Furthermore, within the gaze-centered
neuronal population of LIP, activity has been demonstrated to
remap in order to compensate for intervening saccades
(Duhamel et al. 1992; Colby et al. 1995; Medendorp et al.
2003; Merriam et al. 2003). Gain field modulations, the scaling
of neuronal firing rates by eye and head position, have been
suggested to implicitly transform these spatial representations
into other gaze-independent (e.g., head/body-centered) refer-
ence frames (Andersen et al. 1985; Chang et al. 2009).
At the population level, rhythmic neuronal synchronization
may provide a mechanism to selectively amplify and gate
behaviorally relevant representations in parietal processing
(Buzsaki 2006). In general, gamma-band oscillations ( >40 Hz)
have been implicated in active local processing, maintaining
and emphasizing a neural representation (Fries 2009), while
alpha-band oscillations (8--12 Hz) reflect functional inhibition
and gating (Klimesch et al. 2007; Jensen and Mazaheri 2010).
With regard to monkey area LIP, intracranial local field
potential recordings have shown that neurons synchronize their
activity in a spatially tuned manner during the coding of
a working memory for a saccade (Pesaran et al. 2002). Using
magnetoencephalography (MEG), corresponding observations
have been made in human PPC, indicating a bias of spectral
power to contralateral target locations (Medendorp et al. 2007;
Van Der Werf et al. 2008, 2009, 2010; Hinkley et al. 2011). But
without varying eye position, the question remains unanswered
whether these oscillations are related to the construction of
a gaze-independent spatial representation or are a manifestation
of the saccade goal encoded in gaze-centered coordinates.
To discriminate between these 2 possibilities, we applied MEG
to record oscillatory brain activity from human subjects while
they produced intervening saccades between viewing a goal
target and generating an eye movement toward its remembered
location. While the target remained stable in gaze-independent
coordinates (i.e., relative to head/body), its remembered location
must be updated to compensate for the intervening saccade in
gaze-centered coordinates. By exploiting the hemispheric later-
alization of the power in the various frequency bands, we
compared conditions in which the remembered location of the
target reverses sides relative to the gaze-fixation point versus
conditions in which the target remains at the same side after the
intervening eye movement.
Our results show that parietal gamma-band synchronization
is immediately biased toward the new goal direction, consistent
with spatial updating of the goal direction in a gaze-centered
reference frame. Power modulations in the alpha band are in
line with a regulatory mechanism for spatial updating, slowly
inhibiting the retrospective target representation, and facilitat-
ing the updated target representation for the saccade. Taken
together, our findings suggest a reorganization of oscillatory
activity during spatial updating.
Materials and Methods
ParticipantsTwenty-two naıve participants (7 females/15 males; mean age 26.5
years), free of any neurological or psychiatric disorders, volunteered to
� The Author 2012. Published by Oxford University Press. All rights reserved.
For permissions, please e-mail: [email protected]
Cerebral Cortex Advance Access published March 13, 2012 at R
adboud University on M
arch 14, 2012http://cercor.oxfordjournals.org/
Dow
nloaded from

participate in the study. All participants provided written consent
according to guidelines of the local ethics committee (CMO
Committee on Research Involving Humans subjects, region Arnhem--
Nijmegen, the Netherlands).
MEG RecordingsParticipants sat upright in the MEG system, viewing a stimulus screen
that was positioned 40 cm in front of them. Stimuli were generated
with Presentation 9.10 software (Neurobehavioral Systems Inc. Albany,
NY). Using an LCD video projector (SANYO PLC-XP41, 60 Hz refresh
rate), these stimuli were projected onto the screen via 2 front-silvered
mirrors. MEG data were recorded continuously using a whole-head
system with 275 axial gradiometers (CTF Systems Inc., Port Coquitlam,
Canada). Head position with respect to the sensor array was
continuously measured using localization coils fixed at anatomical
landmarks (the nasion and at the left and right ear canal). Horizontal
and vertical electrooculograms (EOGs) were recorded using electrodes
placed below and above the left eye and at the bilateral outer canthi.
Impedance of all electrodes was kept below 5 kX. During the
experiment, the EOG recordings were continuously inspected to
ensure that participants were vigilant and correctly performing the
task. Furthermore, the electrocardiogram (ECG) was recorded with
electrodes (impedance < 50 kX) attached above the right clavicula and
under the last false rib on the left side. All signals were low-pass filtered
at 300 Hz, sampled at 1200 Hz, and then saved to disk.
For each participant, a full-brain anatomical magnetic resonance
image (MRI) was acquired using a standard inversion prepared 3D T1-
weighted scan sequence (flip angle = 15�; voxel size: 1.0 mm in-plane,
256 3 256, 164 slices; time repetition = 0.76 s; time echo = 5.3 ms).
A 1.5-T whole-body scanner (Siemens, Erlangen, Germany) was used to
record the anatomical MRIs, with reference markers at the same
locations as during the MEG recording, to allow alignment of the
individual MEG and MRI data in later analyses.
Experimental ParadigmSubjects performed an intervening-saccade task, shown in Figure 1. Each
trial began with the subject fixating centrally at a small white cross
presented on the screen. After a baseline period of 1.5 s, a target
stimulus was flashed for 100 ms in the left or right visual hemifield,
horizontally at a mean eccentricity of 3� or 9�, and positioned vertically
at a polar angle < 45� relative to the horizontal meridian. Targets were
jittered slightly in eccentricity (2� visual angle) to make them less
predictable. After a 2-s delay period (the first delay period), the fixation
cross jumped to a new position, at a horizontal eccentricity of 3�, 9�, or15� (jitter 2�), in either the left or the right visual field, unpredictable to
the subject. Subjects were instructed to immediately saccade to the new
fixation position (i.e., the intervening saccade), which was presented for
a duration of 2 s (second delay period). The offset of the fixation cross
signaled the subjects to look at the remembered location of target. The
refixation positions were chosen such that the desired amplitude of this
saccade was on average 6� (jittered in the interval 4--8�). Subsequently,0.7 s later, the central fixation cross reappeared, indicating the start of
a new trial. Trials were presented in 20 blocks of 30 trials each, with the
different blocks separated by a brief self-paced resting period.
Essentially, the paradigm had 4 different conditions regarding the
remembered location of the target relative to gaze before and after the
intervening saccade. It either remained to the right (RR condition) or
remained to the left (LL) or it shifted from right to left (RL) or moved
from left to right (LR). In contrast, during the intervening-saccade task,
the location of the target is invariant in a gaze-independent coding
frame, such as a head-, body-, or world-fixed frame.
Behavioral AnalysisEOG data from each subject were inspected online to ensure high
vigilance levels and correct performance of the task. Figure 1B shows
the EOG traces (horizontal component) of a typical subject during 20
trials of each of the 4 conditions. A schematic representation of the
respective target (o) and fixation position (+) is flanked on the right-
hand side. For each condition, the subject keeps stable fixation during
the first delay period. The subsequent intervening saccade brings the
eyes’ fixation point either to the left or to the right of the remembered
target location, which is subsequently well maintained till the end of
the second delay period. The saccade to the remembered target
location is made after the fixation spot was turned off. Note that, for
every remembered target position, there are opposing eye movement
vectors with about equal amplitudes. Trials with eye movements larger
than the noise level of the EOG recordings (2 3 standard deviation
[SD] = 1.0�) during fixation period were discarded. Also trials in which
subjects blinked or performed incorrectly otherwise were excluded
from further analysis. The EOG recordings in all 22 subjects confirmed
that they followed the instructions correctly in most trials. There was
no significant difference in the number of rejected trials among the 4
task conditions, specified above (one-way ANOVA, F3,63 = 2.4, P > 0.05).
On average 398 ± 89 (SD) trials per participant were accepted for
further analysis (LL 97 ± 24 (SD) trials; LR 101 ± 23 trials; RR 98 ± 23
trials; RL 101 ± 21 trials). Begin and end times of the intervening
refixation saccades were based upon visual inspection, accounting for
noise level of the EOG system (Van Der Werf et al. 2008). Based on the
same criteria, reaction times for the memory-guided target-directed
saccades (LL: 181 ms; RR: 185 ms; LR: 187 ms; RL: 182 ms) did not differ
between the 4 conditions (one-way ANOVA, F3,63 = 2.0, P > 0.05).
MEG Data AnalysisData were analyzed using Fieldtrip software (http://www.ru.nl/neuro-
imaging/fieldtrip), an open source Matlab toolbox for neurophysiological
Figure 1. Experimental design. (A) Trial timing. Each trial started with a baselineperiod of 1 s, during which subjects were instructed to fixate a centrally presentedfixation cross. Next, a stimulus was presented for 0.1 s, randomly right or left ofcentral fixation, followed by a 2-s delay period (first delay). The second delay startedwith the relocation of the fixation cross unpredictably to the left or right of theremembered target location, shortly followed by the subject’s gaze. Due to theintervening saccade, the remembered stimulus location remained either in the sameor shifted to the opposite visual hemifield. After another 2 s delay, the new fixationcross disappeared, signaling the subject to make an eye movement to theremembered target location. Reappearance of the central fixation cross signaled thestart of a new trial. (B) Four different trial types could be distinguished, depending onthe remembered location of the target relative to gaze before and after theintervening saccade. Corresponding EOG traces for each trial type are presented atthe bottom, grouped together based on the position of the flashed stimulus.Schematic representations of the 2 possible refixation positions (colored), thestimulus position (circle), and the central fixation cross (white cross) are presented inthe right-hand panels, with the colors of the refixation crosses matching the color ofthe associated EOG trace.
Page 2 of 12 Oscillatory Activity during Spatial Updating d Van Der Werf et al.
at Radboud U
niversity on March 14, 2012
http://cercor.oxfordjournals.org/D
ownloaded from

data analysis developed at the Donders Institute for Brain, Cognition and
Behaviour. From the trials that survived the exclusion criteria described
above, data segments that contained muscle activity or jump artifacts in
the SQUIDS were excluded using semiautomatic artifact rejection
routines.
For the sensor-level analysis, an estimate of the planar gradient was
calculated for each sensor (Bastiaansen and Knosche 2000). The
horizontal and vertical components of the planar gradients estimated
using the signals from the neighboring sensors approximate the signal
measured by MEG systems with planar gradiometers. The planar field
gradient simplifies the interpretation of the sensor-level data since the
maximal signal is located above the source (Hamalainen et al. 1993).
Power spectra were computed separately for the horizontal and
vertical planar gradients of the MEG field at each sensor location, and
the sum of both was computed to obtain the power at each sensor
location irrespective of the orientation of the gradient.
With these data, we also took several measures to protect our results
against oculomuscular distortions, including microsaccades, which have
been shown to produce high-frequency artifacts (Yuval-Greenberg et al.
2008; Jerbi et al. 2009). First, we refrained from analyzing data during
which the intervening or final saccade was made. Second, we used
independent component analysis (ICA) to clean the sensor-level data of
cardiomagnetic artifacts as well as any remaining eye-muscle artifacts
due to the eccentric fixation during the second delay period in our
paradigm. More specifically, we excluded the components that
correlated the highest (r > 0.15) with either the EOG or the ECG
signal and had a spatial topography associated with ocular or cardiac
magnetic effects (Barbati et al. 2004). Also components whose effects
were topographically located around the eyes were excluded from the
data. Finally, we balanced our contrasts (see below) to rule out effects of
eccentric gaze fixation during the second delay.
Time--frequency representations (TFRs), estimating the time course
in power, were computed using a Fourier approach, applying a tapered
window. Because the gamma band is typically much wider and
therefore better characterized with more spectral concentration
(Hoogenboom et al. 2006), we analyzed 2 frequency ranges separately.
For the lower frequency band (5--40 Hz), we used a Hanning taper, and
a time window of 0.5 s, sliding through the trials in steps of 0.05 s. This
resulted in a spectral smoothing of roughly 3 Hz. For the higher
frequency band (40--130 Hz), we applied a multitaper approach
(Percival and Walden 1993) using 11 orthogonal Slepian tapers and
an analysis window of 0.4 s, also sliding through the trials in steps of
0.05 s. This resulted in a spectral smoothing of approximately 14 Hz.
To localize the neural sources of the various spectral components,
we applied an adaptive spatial filtering (or beamforming) technique
(Dynamic Imaging of Coherent Sources) (Gross et al. 2001; Liljestrom
et al. 2005). First, we divided a template brain volume (International
Consortium for Brain Mapping template; Montreal Neurological In-
stitute (MNI), Montreal, Canada) into a regular 1 cm 3D grid. We then
warped each subject’s MRI to fit this template MRI and the template’s
grid, after which we warped the grid back to fit the subject’s original
MRI to obtain a grid in MNI coordinates for each subject. This
procedure allowed us to directly compare grid points across subjects in
MNI space without the need to normalize. For each subject and for
each grid point, a spatial filter was constructed that passes activity from
this location with unit gain, while attenuating activity from other
locations (Gross et al. 2001). This filter was computed from forward
models with respect to dipolar sources at each grid point (the lead field
matrix) and the cross spectral density between all combinations of
sensors at the frequency of interest. We used realistic single-sphere
head models from each subject’s individual MRI to calculate the lead
field matrix (Nolte et al. 2003). For every single subject, the source
power was estimated to the same baseline interval that was used for the
sensor-level analysis.
Statistical InferencesWe computed the task-related changes in power in various frequency
bands relative to average power in the baseline period (see Fig. 1). The
high-frequency baseline power was computed over the period from
–0.4 to –0.2 prior to the presentation of the stimulus, using a 0.4 s wide
sliding window. The low-frequency baseline was determined across the
interval –0.35 to –0.25 s, using a 0.5 s sliding time window. Thus, in
effect, the baseline period was equal for both frequency ranges: –0.6 to
0 s prior to stimulus onset. We expressed the difference in log power
between the respective delay periods and the baseline as a t-score for
each subject and for each condition. The resulting t-scores were
transformed into z-scores (Bauer et al. 2006; Medendorp et al. 2007) to
obtain normalized estimates of power differences. The resulting z-
scores, which are well normalized for intrasubject variance, were
pooled across subjects (zgroup = 1/ON +zi with zi being the z-score of
the ith subject).
In the first delay, statistical significance of the power modulations
was tested at the sensor level by using a nonparametric clustering
procedure (Nichols and Holmes 2002; Maris and Oostenveld 2007). We
chose our frequency ranges of interest to be 8--12 Hz for the alpha band
and 40--60 Hz for the gamma band. These frequency ranges are
compatible with previous reports (Medendorp et al. 2007; Van Der
Werf et al. 2010). In this procedure, cluster-level test statistic is defined
by pooling the z-scores of neighboring sensors showing the same effect
in a given time--frequency window of interest. In a nonparametric
statistical test, the type I error rate is controlled by evaluating the
cluster-level test statistic under the randomization null distribution of
the maximum cluster-level test statistic. In our analysis, this was
obtained by randomly permuting the data between 2 conditions within
every participant. By creating a reference distribution from 1000
random sets of permutations, the P value was estimated as the
proportion of the elements in the randomization null distribution
exceeding the observed maximum cluster-level test statistic. The
significant channels were used for further analysis of the power
changes during the second delay, that is, after the intervening saccade,
using the randomization approach in the time--frequency domain rather
than on the sensor level. A nonparametric approach was also applied to
test for statistical significance at the source level, clustering together
neighboring voxels exhibiting a similar effect in a predefined volume of
interest, comprising of the occipital and parietal cortices. More
specifically, we predefined the region of interest (ROI) using the
WFU pickatlas (http://fmri.wfubmc.edu/), including the angular gyrus,
superior parietal cortex, inferior parietal cortex, postcentral sulcus,
cuneus, precuneus, superior occipital cortex, middle occipital cortex,
inferior occipital cortex, calcarine sulcus, supramarginal sulcus, and the
lingual sulcus.
Isolating Task-Dependent Spectral PowerThe paradigm was designed with 8 different types of trials. Table 1
provides an overview of the screen positions (horizontal components)
of the target position (T) and the gaze refixation location (G), with the
initial central fixation at 0�. Recall that in the actual task, the respective
positions were jittered slightly. The 8 different trial types can be
divided into RR, RL, LL, and LR conditions, as described above. In our
analyses, we exploited the hemifield-specific lateralization of power to
compare conditions in which the target shifts sides relative to gaze (RL,
Table 1Schematic representation of the 8 conditions
Trial type Screen positions: target (T), gazerefixation (G)
Side: left (L)/right (R)
Target relative to gaze Gaze
�15� �9� �3� 3� 9� 15� Firstdelay
Seconddelay
1 G T R R R2 T G R L R3 G T R R L4 T G R L R5 G T L R L6 T G L L R7 G T L R L8 T G L L L
Note: Three components were manipulated: stimulus location (left or right, at ~3� or ~9�), finalsaccade direction (left or right of gaze, amplitude always ~6�), and gaze direction (left or right ofcentral fixation, at 3�, 9�, or 15�).
Cerebral Cortex Page 3 of 12
at Radboud U
niversity on March 14, 2012
http://cercor.oxfordjournals.org/D
ownloaded from

LR) versus conditions in which the target remains at the same side from
gaze (RR, LL).
To assess the hemifield-specific lateralization of power during the
first delay, we organized our trials into 2 groups, irrespective of target
eccentricity. We compared trials with the target stimulus presented in
the right visual field (RR and RL trials) to those with a target presented
in the left visual field (LL and LR trials). To evaluate these data in
a pooled comparison across hemispheres, we combined the hemifield-
specific changes in power in terms of contralateral versus ipsilateral
target locations.
Lateralized power during the second delay interval may reflect the
contributions of a number of factors: the updated target location in
gaze-centered coordinates (i.e., the direction of the planned saccade),
the target memory in gaze-independent (head/body) coordinates, the
direction of gaze fixation (i.e., eye position), or a combination hereof.
We isolated either of these factors by analyzing separately subsets of
trials in which the other 2 factors remained invariant in hemifield.
In other words, to analyze the hemispheric laterality of power in
relation to gaze-dependent target updating (Gd), we compared trials in
which the head-centered hemifield of the target and the hemifield of
fixation remained the same for both delays, but the gaze-centered
hemifield of the remembered target changed. In terms of contralateral
and ipsilateral locations, we computed for sensors overlying the right
hemisphere: Gd = (P4 – P1) + (P8 – P5), in which Pi represents the
power during the second delay in trial type I in Table 1. Because P1 and
P4 represent trials in which the stimulus was presented to the right and
P5 and P8 trials with the stimulus to the left, this comparison effectively
subtracts out potential effects of a head-centered target encoding.
Similarly, during the second delay, P1 and P4 reflect power of trials with
a rightward gaze direction and P5 and P8 trials with a leftward gaze
direction, resulting in a subtraction of potential effects due to gaze
direction. Because in this comparison, P1 and P4 and P5 and P8 have
opposing gaze-centered (or updated) target directions, these gaze-
dependent target representations are enhanced. For the corresponding
calculations for the sensors covering the left hemisphere, we only
flipped the sign in the above equations. The isolated contributions were
pooled across hemispheres, resulting in the combined hemisphere-
specific changes in power during the second delay period of our
paradigm. We computed the direction selectivity of power for both the
gaze-independent target representation (Gi) and the direction of eye
fixation (Ge) in a similar manner, using the following formulas for the
sensors covering the right hemisphere: Gi = (P6 -- P4) + (P5 -- P3) and
Ge = (P8 – P6) + (P3 – P1). Again, for the corresponding calculations of
the sensors covering the left hemisphere, we flipped the signs in the
equations. We pooled the power effects across hemispheres.
Results
We examined the role of neuronal synchronization in the
representation of memorized visual targets across intervening
eye movements. In our test, subjects fixated at a central point,
while a target was briefly cued into the retinal periphery.
After a delay, subjects switched fixation points (the intervening
saccade) and then after another delay looked to the remem-
bered location of the target. On half of the trials, the in-
tervening saccade made the remembered location of target
change sides relative to the gaze line, while on the other half of
the trials, the remembered target stayed on the same side
relative to gaze. We assessed the laterality of spectral power
during the second delay interval to characterize the oscillatory
activity in terms of gaze-dependent target updating (Gd), gaze-
independent target coding (Gi), and gaze direction (Ge).
Contralateral Gamma-Band Activity after TargetPresentation
We start the description of our results with a focus on the high-
frequency power modulations ( >40 Hz) during the first delay
interval. During this interval subjects have to memorize
a location of a target that served as a goal only after an
intervening eye movement, which could be directed either
leftward or rightward. Because the z-scores are calculated
against an arbitrary task-irrelevant baseline, we show and
interpret the data by contrasting different experimental
conditions within hemispheres. Figure 2A shows the scalp
topography of 40--60 Hz gamma-band activity, averaged across
subjects, during 4 consecutive nonoverlapping time intervals,
each covering 0.5 s of the first delay interval. Regions with
warmer (red) colors (positive z-scores) show a preference for
contralateral targets; regions with cooler (blue) color (negative
z-scores) have a bias for ipsilateral targets. The stimulus
response, observed in the time interval 0--0.5 s, is reflected by
a clear contralateral bias in power in both posterior hemi-
spheres (40--60 Hz; 0--0.5 s; P < 0.05; significant sensors are
marked). This preference vanishes almost completely during
the next 0.5 s but then builds up again to significant values
during the last second of the delay interval (40--60 Hz; 1.0--2.0 s;
P < 0.05; significant sensors are marked).
Figure 2B, middle panel, shows the scalp topography of the
mean power changes over time 1.0--2.0 s and frequency 40--60
Hz. The 2 symmetric subsets of posterior sensors (marked by
dots) were subjected to a time--frequency analysis, shown by
the left- and right-hand panels in Figure 2B, in the same color
format. Based on the symmetry of these panels, the spectro-
grams were pooled across hemispheres, resulting in the
combined hemisphere-specific changes in power for contra-
lateral versus ipsilateral targets (Fig. 2B, bottom panel).
As shown, in response to the target cue, the posterior
sensors show a clear directional bias, across a 40--120 Hz
frequency range, peaking in the 40--60 Hz range with a stronger
synchronization at sensors contralateral than ipsilateral to
targets. Source localization methods (ROI-restricted beamform-
ing, see Materials and Methods) of the most responsive periods
revealed the direction-selective activity in the gamma band to
originate mainly from occipital areas, with some spread to
parietal areas (40--60 Hz; 0--0.5 s; P < 0.05) (see Fig. 2B, bottom-
left panel). During the delay interval, this power selectivity was
sustained exclusively in the 40--60 Hz band, gradually in-
creasing in strength toward the end of this period. The source
of this narrow gamma-band activation was localized exclusively
to extrastriate occipital areas (40--60 Hz; 1.0--2.0 s; P < 0.05)
(see Fig. 2B, bottom-right panel). In absence of any visual
stimulation during the first delay, and without the incentive to
plan a targeting saccade, this effect can be interpreted as
a direction-selective working memory for contralateral targets.
Gamma-Band Synchronization Reorganizes duringSpatial Updating
The crucial manipulation in this experiment was the in-
tervening eye movement, which subjects produced between
viewing the target and executing the eye movement toward its
remembered location. If the target location is coded relative to
gaze, its memory trace must be remapped to maintain the
integrity of the information in this frame across the eye
movement. The outcome of this process should manifest itself
as a retuning of the directional selectivity of spectral power
during the second delay for conditions changing the direction
of the target relative to gaze. More specifically, this re-
organization of spectral power should operate across hemi-
spheres when the intervening saccade changes the side of the
Page 4 of 12 Oscillatory Activity during Spatial Updating d Van Der Werf et al.
at Radboud U
niversity on March 14, 2012
http://cercor.oxfordjournals.org/D
ownloaded from

target relative to gaze and within a hemisphere when the target
remains on the same side. On the other hand, the location of
the target would remain in the same hemifield relative to the
head and body, that is, in gaze-independent coordinates. Thus,
if the directional selectivity of the spectral power, as observed
during the first delay period, reflects the side of the target
relative to the head or body, there is no need for a hemispheric
reorganization of neuronal synchronization after the interven-
ing saccade. Despite these clear predictions, however, it is also
important to realize that subjects adopted a new eye position
during the second delay period, which may also put its
signature on the observed spectral power.
A bias in spectral power during the second delay period,
therefore, could reflect the outcome of gaze-dependent target
remapping (Gd), the persistence of a gaze-independent target
representation (Gi), or the result of maintaining eccentric eye
fixation (Ge). We determined each of these 3 components on
the basis of selecting different subsets of trials, which were
selected such that contributions of the other 2 factors are
neutralized in terms of hemifield (for details, see Materials and
Methods). Furthermore, the power modulations during the
second delay period were analyzed in alignment with the end
time of the intervening saccade (when the refixation was
stable). Figure 3 shows the results of these analyses, plotting
scalp topography (left column), time-resolved power changes
in relation to each component (right column), and the source
reconstruction of the task-modulated oscillatory source (Fig.
3D). Contralateral and ipsilateral biases in spectral power are
color coded in red and blue, respectively.
Figure 3A (left) shows the selective power modulations due
to gaze-dependent target updating (Gd), in the form of more
spectral power in the gamma band for contralateral than
ipsilateral targets (0.25--1.25 s after refixation was completed)
at posterior sensors, at the 60--80 Hz frequency range. The TFR
of the marked sensor groups, which were determined based on
the activity during the first delay, is shown in the right panel,
pooled across hemispheres. The spectrograms clearly demon-
strate that the contralateral selectivity of power in the 60--80 Hz
gamma band is a sustained and significant effect (P < 0.05;
nonsignificant time--frequency tiles are masked at an opacity of
0.5), coding the gaze-centered direction of the target, which is
equivalent to the direction of the pending saccade. It is further
noteworthy that the updated gaze-centered representation
during the second delay is found at a higher frequency range
than the gamma-band frequency that reflected the memorized
target location before the intervening eye movement. The
source of the 60--80 Hz gamma-band activity was exclusively
found in the PPC (P < 0.05; 0.5--1.0 s; 60--80 Hz; ROI-restricted
beamforming, see Materials and Methods) (Fig. 3D).
Recall that in our task the location of the target is spatially
constant in a gaze-independent coding frame, such as a head-,
body-, or world-fixed frame. Figure 3B demonstrates the lack of
evidence for the alternative hypothesis, showing the absence of
a persisting gaze-independent target representation (Gi) in
Figure 2. A 40--60 Hz gamma band encodes the working memory for the location of the flashed target during the first delay. (A) Topographical representation of the direction-selective 40--60 Hz gamma band over time, in consecutive 0.5 s time windows. Warmer (red) color coding represents a bias toward contralateral presented stimuli; cooler (blue)color coding represent a bias toward ipsilateral presented stimuli. Marked sensors show a significant effect (P\ 0.05, see Materials and Methods). (B) Direction-selective time--frequency resolved power changes during the first delay, for the sensors marked in the top-middle panel. The top-middle panel shows the topographical representation of the 40--60 Hz gamma band pooled across subjects during the 1.0- to 2.0-s period after stimulus presentation. Top-left and -right panels show the TFRs of the selected sensors coveringthe left and right hemisphere, respectively. The bottom-middle panel shows the TFR in the gamma band (40--130 Hz) range pooled across hemispheres. Time t 5 0 and verticalline, stimulus presentation; at t 5 2.0 s the fixation cross jumps to a new position. The bottom-left and -right panels show ROI-restricted source reconstructions of the 40--80 Hzand 40--60 Hz gamma band during the first 0.5 s, and the 1.0- to 2.0-s period after stimulus presentation, respectively. Color format as in A. Only significant voxels are shown(P\ 0.05, see Materials and Methods). CS, central sulcus; PO, Parietooccipital sulcus; IPS, intraparietal sulcus. The solid line demarcates the visible part of the ROI.
Cerebral Cortex Page 5 of 12
at Radboud U
niversity on March 14, 2012
http://cercor.oxfordjournals.org/D
ownloaded from
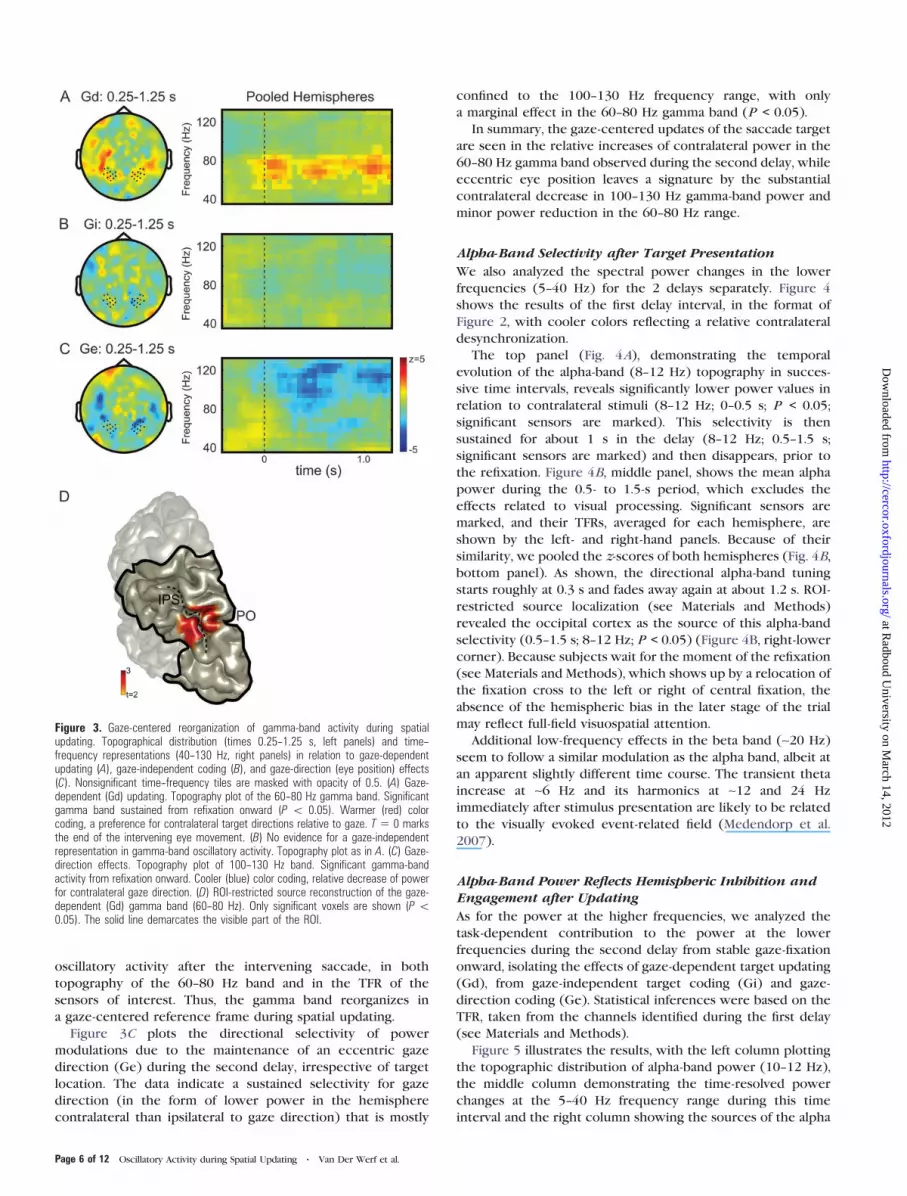
oscillatory activity after the intervening saccade, in both
topography of the 60--80 Hz band and in the TFR of the
sensors of interest. Thus, the gamma band reorganizes in
a gaze-centered reference frame during spatial updating.
Figure 3C plots the directional selectivity of power
modulations due to the maintenance of an eccentric gaze
direction (Ge) during the second delay, irrespective of target
location. The data indicate a sustained selectivity for gaze
direction (in the form of lower power in the hemisphere
contralateral than ipsilateral to gaze direction) that is mostly
confined to the 100--130 Hz frequency range, with only
a marginal effect in the 60--80 Hz gamma band (P < 0.05).
In summary, the gaze-centered updates of the saccade target
are seen in the relative increases of contralateral power in the
60--80 Hz gamma band observed during the second delay, while
eccentric eye position leaves a signature by the substantial
contralateral decrease in 100--130 Hz gamma-band power and
minor power reduction in the 60--80 Hz range.
Alpha-Band Selectivity after Target Presentation
We also analyzed the spectral power changes in the lower
frequencies (5--40 Hz) for the 2 delays separately. Figure 4
shows the results of the first delay interval, in the format of
Figure 2, with cooler colors reflecting a relative contralateral
desynchronization.
The top panel (Fig. 4A), demonstrating the temporal
evolution of the alpha-band (8--12 Hz) topography in succes-
sive time intervals, reveals significantly lower power values in
relation to contralateral stimuli (8--12 Hz; 0--0.5 s; P < 0.05;
significant sensors are marked). This selectivity is then
sustained for about 1 s in the delay (8--12 Hz; 0.5--1.5 s;
significant sensors are marked) and then disappears, prior to
the refixation. Figure 4B, middle panel, shows the mean alpha
power during the 0.5- to 1.5-s period, which excludes the
effects related to visual processing. Significant sensors are
marked, and their TFRs, averaged for each hemisphere, are
shown by the left- and right-hand panels. Because of their
similarity, we pooled the z-scores of both hemispheres (Fig. 4B,
bottom panel). As shown, the directional alpha-band tuning
starts roughly at 0.3 s and fades away again at about 1.2 s. ROI-
restricted source localization (see Materials and Methods)
revealed the occipital cortex as the source of this alpha-band
selectivity (0.5--1.5 s; 8--12 Hz; P < 0.05) (Figure 4B, right-lower
corner). Because subjects wait for the moment of the refixation
(see Materials and Methods), which shows up by a relocation of
the fixation cross to the left or right of central fixation, the
absence of the hemispheric bias in the later stage of the trial
may reflect full-field visuospatial attention.
Additional low-frequency effects in the beta band (~20 Hz)
seem to follow a similar modulation as the alpha band, albeit at
an apparent slightly different time course. The transient theta
increase at ~6 Hz and its harmonics at ~12 and 24 Hz
immediately after stimulus presentation are likely to be related
to the visually evoked event-related field (Medendorp et al.
2007).
Alpha-Band Power Reflects Hemispheric Inhibition andEngagement after Updating
As for the power at the higher frequencies, we analyzed the
task-dependent contribution to the power at the lower
frequencies during the second delay from stable gaze-fixation
onward, isolating the effects of gaze-dependent target updating
(Gd), from gaze-independent target coding (Gi) and gaze-
direction coding (Ge). Statistical inferences were based on the
TFR, taken from the channels identified during the first delay
(see Materials and Methods).
Figure 5 illustrates the results, with the left column plotting
the topographic distribution of alpha-band power (10--12 Hz),
the middle column demonstrating the time-resolved power
changes at the 5--40 Hz frequency range during this time
interval and the right column showing the sources of the alpha
Figure 3. Gaze-centered reorganization of gamma-band activity during spatialupdating. Topographical distribution (times 0.25--1.25 s, left panels) and time--frequency representations (40--130 Hz, right panels) in relation to gaze-dependentupdating (A), gaze-independent coding (B), and gaze-direction (eye position) effects(C). Nonsignificant time--frequency tiles are masked with opacity of 0.5. (A) Gaze-dependent (Gd) updating. Topography plot of the 60--80 Hz gamma band. Significantgamma band sustained from refixation onward (P \ 0.05). Warmer (red) colorcoding, a preference for contralateral target directions relative to gaze. T 5 0 marksthe end of the intervening eye movement. (B) No evidence for a gaze-independentrepresentation in gamma-band oscillatory activity. Topography plot as in A. (C) Gaze-direction effects. Topography plot of 100--130 Hz band. Significant gamma-bandactivity from refixation onward. Cooler (blue) color coding, relative decrease of powerfor contralateral gaze direction. (D) ROI-restricted source reconstruction of the gaze-dependent (Gd) gamma band (60--80 Hz). Only significant voxels are shown (P \0.05). The solid line demarcates the visible part of the ROI.
Page 6 of 12 Oscillatory Activity during Spatial Updating d Van Der Werf et al.
at Radboud U
niversity on March 14, 2012
http://cercor.oxfordjournals.org/D
ownloaded from

Figure 4. Alpha-band modulations during the first delay interval. Format as in Figure 2; blue color coding indicating lower power for contralateral than ipsilateral targets. (A)Temporal evolution of the alpha-band topography (8--12 Hz). Significant sensors are marked (P\ 0.05). (B) Time--frequency resolved power modulations for the sensors markedin the top-middle panel (8--12 Hz, 0.5--1.5 s). Right bottom panel shows the ROI-restricted source reconstruction of the alpha band during the 0.5- to 1.5-s time period. Onlysignificant voxels are shown (P\ 0.05). The solid line demarcates the visible part of the ROI.
Figure 5. The alpha band (8--12 Hz) facilitates the gaze-dependent representation while inhibiting the gaze-independent target representation. Format as in Figure 3.Nonsignificant time--frequency tiles are masked with opacity of 0.5. (A) Reorganization of alpha-band desynchronization during spatial updating in a gaze-dependent referenceframe. Cooler (blue) color coding represents a decrease of alpha-band power for targets contralateral relative to gaze. (B) Alpha-band synchronization in a gaze-independentreference frame. Warmer (red) color coding represents an increase of power for contralateral presented stimuli, independent of the current gaze position. (C) Gaze position doesnot modulate alpha-band power. Cooler (blue) color coding, a relative alpha decrease for contralateral gaze direction.
Cerebral Cortex Page 7 of 12
at Radboud U
niversity on March 14, 2012
http://cercor.oxfordjournals.org/D
ownloaded from

modulations (ROI-restricted beamforming, see Materials and
Methods). Figure 5A, left panel, shows lower alpha-band
synchronization for targets being contralateral than ipsilateral
to the new gaze fixation. Across hemispheres (middle panel),
this bias at the selected sensors (based on the first delay) arises
at about 0.25 s after refixation and persists throughout the
delay. The right-hand panel shows the location of the alpha
source in occipital cortex.
Figure 5B, left panel, demonstrates the topographic power
distribution of the same alpha-band frequency as in A, but now
in terms of gaze-independent (i.e., head- or body-centric) target
coding. This analysis revealed a relative alpha power increase to
targets that were initially presented in the contralateral field, at
the start of the trial, of which both the temporal dynamics
(middle panel) and the source localization (right panel)
resemble that of the gaze-centered suppression effect in A.
Therefore, under the assumption that a relative increase in
alpha-band power reflects cortical inhibition, we could explain
the Gi effects as the inhibition of the hemisphere contralateral
to the location of the target before the intervening eye
movement. Before we further proceed with this explanation,
Figure 5C demonstrates the isolated gaze-direction effect,
which only shows a broadband transient effect around and after
gaze stabilization, most likely evoked by the visual presentation
of the refixation cross.
How do the suppression effects due to gaze-dependent
updating in Figure 5A relate to the gaze-independent power
enhancements in Figure 5B? The bar plots in Figure 6 show the
average response of the marked sensor groups during the
second delay for conditions of within and across hemifield
updating, relative to the direction of gaze. In both conditions
and in both the contralateral and the ipsilateral hemispheres,
there is a strong alpha power reduction relative to baseline.
Because baseline levels are arbitrary and difficult to interpret,
we prefer to compare the alpha levels across experimental
conditions and within hemispheres. For within hemifield
updating, the bars confirm a stronger desynchronization at
contralateral sensors compared with ipsilateral sensors (paired
t-test, t = –2.1, P < 0.05), consistent with a stronger engagement
of the hemisphere that is contralateral to the target after the
updating. Likewise, for updating across hemifields, there is
stronger desynchronization at contralateral than ipsilateral
sensors after the target updating (paired t-test, t = 4.6, P <
0.01). However, whereas the contralateral sensors show no
significant power differences between the 2 updating con-
ditions (paired t-test, t = 0.2, P = 0.8), the ipsilateral sensors are
significantly less desynchronized (paired t-test, t = 2.1, P < 0.05)
when comparing across versus within hemifield updating. The
ipsilateral sensors after across hemifield updating in fact
covered the hemisphere contralateral to the target before
updating. Therefore, we can interpret their relative enhance-
ment compared with the within updating condition as an
active suppression of the hemisphere that coded the target
before it was remapped to the other hemisphere. Alternatively,
we could regard this result as a stronger disinhibition over
ipsilateral sensors during within hemifield updating compared
with between hemifield updating.
Discussion
We investigated the reference frames of oscillatory activity in
parietal cortex during visual processing, spatial updating, and
saccade planning. By introducing a change of fixation between
stimulus presentation and the final memory-guided saccade, we
could relate the direction selectivity of various frequency bands
to spatial updating in a gaze-centered reference frame, spatial
coding in a gaze-independent reference frame, or as an eye
position (i.e., eccentric gaze) effect.
In the higher frequencies, strong biases in spectral power
were observed in both the first (before refixation) and the
second (after refixation) delay periods. Since the first delay was
free of any explicit directional saccade planning, the observed
direction-selective 40--60 Hz gamma band can be interpreted as
a working memory of the target (Howard et al. 2003; Jokisch
and Jensen 2007), being reverberated strongest when closest to
the point of refixation (Fig. 2). The source of this activity was
localized to extrastriate occipital areas and not to the saccade-
related areas of the PPC, adding evidence to the sensory nature
of this working memory trace (Nakamura and Colby 2000,
2002). This observation seems at odds with previous human
neuroimaging work (Medendorp et al. 2003; Merriam et al.
2003) and nonhuman primate electrophysiology (Duhamel
et al. 1992; Mazzoni et al. 1996), showing PPC activation when
Figure 6. After spatial updating, the alpha band reflects inhibition of the gaze-independent stimulus position. The bar plots (with standard error of the mean acrosssubjects) represent the alpha power relative to baseline, for contralateral andipsilateral sensors relative to the upcoming saccade direction, in relation to within andacross hemifield updating. Asterisks indicate significant differences (P\ 0.05; pairedt-test).
Page 8 of 12 Oscillatory Activity during Spatial Updating d Van Der Werf et al.
at Radboud U
niversity on March 14, 2012
http://cercor.oxfordjournals.org/D
ownloaded from
visual targets have to be kept in memory. Methodologically, if
both regions would oscillate in a coherent fashion, the source
reconstruction would be drawn toward the stronger source,
here the occipital source (Van Veen et al. 1997). On the other
hand, the present paradigm also differs from these earlier
studies not only in timing but also in stimulus material. For
example, most previous studies did not impose a first memory
delay and thus required no sustained stimulus maintenance
prior to the intervening eye movement (Duhamel et al. 1992;
Merriam et al. 2003). Other studies using delays have used
visual distracters (Medendorp et al. 2003), adding more
attentional demands and thus more parietal involvement to
the task (Silver and Kastner 2009). In other words, as long as
the retinotopic coordinates of a visual memory trace remain
stable, PPC may be less involved in representing it than
extrastriate occipital areas.
After refixation, when the target is the goal of the next
saccade, the target representation was updated in a gaze-
centered reference frame, as expressed by a bias in 60--80 Hz
power (see Fig. 3A), originating from contralateral PPC. No
evidence was found for a gaze-independent reference frame in
parietal gamma-band tuning (Fig. 3B). This finding shows that
gamma-band activity reorganizes to account for intervening eye
movements, maintaining the constancy of the internal repre-
sentation of visuomotor space (Medendorp 2010). The
posterior parietal location of this gamma-band source is in line
with previous blood oxygen level--dependent and TMS studies
showing that the PPC encodes and updates targets of eye
movements in a gaze-centered reference frame (Colby et al.
1995; Medendorp et al. 2003, 2005; Merriam et al. 2003; Morris
et al. 2007; Patel et al. 2010).
Another cortical structure that is widely accepted to play
a role in (memory-guided) saccades and spatial updating are
the frontal eye fields (FEFs), in both humans and nonhuman
primates (Bruce and Goldberg 1985; Dias and Segraves 1999;
Curtis and D’Esposito 2006; Sommer and Wurtz 2008; Prime
et al. 2010; Medendorp et al. 2011). Using intracranial EEG,
Lachaux et al. (2006) also observed frontal gamma-band activity
during oculomotor planning (Jerbi et al. 2010). Our topograph-
ical representations of the second delay also hint at frontal
activity in a gaze-dependent reference frame (Fig. 3A). Because
our source analysis only included parietofrontal areas (see
Materials and Methods), and thus excluded the FEF, we cannot
make any further claim about the involvement of the FEF in this
study. Generally speaking, however, it has been argued that the
power of the oscillatory activity in the FEF is smaller than in
parietal areas; also the orientation and size of the FEFs may
prevent a reliable demonstration of their involvement in
particular tasks (Jerbi et al. 2008).
Our results indicate that the high-frequency oscillatory
activity may be an instrumental mechanism in implementing
spatial updating, which is here dictated by the metrics of the
saccade. Due to the short moments of inhibition and excitation
in a cycle of a high-frequency rhythm, neurons can rapidly
change their functional connectivity—and herewith informa-
tion transfer—on a millisecond time scale. During the short
time windows of excitation, effective communication can exist
if a receiving group is oscillating in synchrony (Fries 2005). The
shift in frequency and the reallocation of the oscillatory activity
in the gamma band after the intervening saccade could be
initiated by a synchronizing event, most likely by the efference
copy of the saccadic motor command (Rajkai et al. 2008;
Sommer and Wurtz 2008; Melloni et al. 2009). Together, the
presaccadic oscillatory activity from extrastriate areas and
the synchronizing event of the intervening saccade could have
caused a spatially updated oscillatory activity of higher
frequency in the PPC. The frequency of the updated oscillatory
activity may also depend on the size of the network involved
(Buschman and Miller 2007). Prior to updating, the sensory
trace must be reactivated to feed from occipital into higher
order areas like PPC, where efference copies for updating
arrive. In contrast, after the updating, the target representation
can be maintained locally in PPC because it has become the
goal of the next saccade, in a frequency range consistent with
previous reports (Pesaran et al. 2002; Medendorp et al. 2007;
Van Der Werf et al. 2008, 2010).
One further important aspect that may not be left out in our
discussion is related to changes in eye position. Although we
found clear evidence for a gaze-dependent reference frame, we
also contrasted leftward and rightward gaze fixations to assess
the spectral signature of eye position. We found the eye-
position effects in primarily a 100--130 Hz gamma band,
indicating a decrease of power for contralateral gaze directions
(Fig. 3C). This gamma band is different from the gamma band
coding the spatial representation (Fig. 3A), confirming that the
latter is not an eye-position effect (cortical or ocular). From
single-unit literature it is known that parietal neurons modulate
their activity as a function of eye, head, and hand position
(Andersen et al. 1985; Brotchie et al. 1995; Chang et al. 2009).
These modulations express themselves as a gain change; that is,
an increase or decrease of the firing rate of individual neurons,
without distorting the spatial tuning of the recorded neurons.
As such, gain fields have a weighting effect, controlling the
influence of individual neurons on the population output
(Blohm and Crawford 2009). Because gamma-band synchroni-
zation is thought to provide the brain with a mechanism for
gain control (Tiesinga et al. 2004; Fries et al. 2007; Womelsdorf
and Fries 2007; Gregoriou et al. 2009), one could speculate that
the observed gamma-band modulation is functionally related to
the gain fields observed in monkey electrophysiology. In-
dividual neurons could then be spiking in a favorable or an
unfavorable phase of a local gamma cycle, allowing for a proper
weighting of the input signals. This mechanism of phase coding
also allows for a quick read out of spiking information without
the need for the integration of spike trains (Fries et al. 2007).
The finding that gain fields are topographically organized in at
least 2 parietal areas (Siegel et al. 2003) also fit the present
observation. Unfortunately, we were not able to reconstruct
the source of this activity.
In the lower frequencies, stimulus presentation induced an
alpha-band lateralization that persisted for a longer time period
than the initial broadband gamma response (Fig. 4B). Nonethe-
less, the alpha-band bias was not sustained throughout the first
delay, indicating that these oscillations are involved in
processing the stimulus without actually encoding a represen-
tation of it (Van Der Werf et al. 2008). For example, if the alpha-
band desynchronization reflects the focus of attention, these
findings fit the notion that attention drawn by the stimulus
persists for a while (Okada and Salenius 1998; Worden et al.
2000; Golomb et al. 2008; Van Der Werf et al. 2008; van Gerven
and Jensen 2009; Van Der Werf et al. 2010). However, toward
the end of the first delay, spatial attention must be directed
toward the whole visual field because the location of the new
fixation cross cannot be anticipated by the subject. As spatial
Cerebral Cortex Page 9 of 12
at Radboud U
niversity on March 14, 2012
http://cercor.oxfordjournals.org/D
ownloaded from

attention is no longer on the remembered stimulus position, it
would be important to maintain the coordinates of the target in
working memory. Indeed, during this period, the 40--60 Hz
gamma band originating from extrastriate occipital areas showed
an increase in power. Interestingly, Wyart and Tallon-Baudry
(2009) observed gamma-band activity in similar cortical regions
during a visual decision task, in which subjects had to indicate
the presence or absence of a stimulus. The authors observed
functionally dissociable alpha- and gamma-band activities, with
the alpha band reflecting the spotlight of visual attention and the
gamma band reflecting the perceptual bias in extrastriate
occipital areas. Here, we add evidence for their reasoning that
the functional mechanisms implemented by gamma and alpha
can operate independently from each other, with one increasing
the general excitability of an area (alpha) and the other
reflecting a sensory memory trace or prediction (gamma).
After the intervening eye movement, the alpha Gd and Gi
showed slowly developing biases (Fig. 5A,B), which one could
interpret as coding neuronal target representations in both
gaze- and nongaze-centered reference frames. However, when
trying to unify this with observations in the first delay, we do
not consider this interpretation very likely. As a more simple
interpretation, the slowly developing sustained decrease in the
hemisphere contralateral to the direction of the saccade target
(Gd effect) is due to the direction of spatial attention, which is
now aligned with the direction of saccade planning. Note that
this happened at a slower time scale than the updated gamma-
band activity, which could be related to recent findings
showing that attentional facilitation lingers for a while in old
retinotopic coordinates after the saccade (Golomb et al. 2008,
2010). Concurrently, in the hemisphere that was (during the
first delay) engaged in maintaining the spatial location of the
target, a relative increase of alpha power slowly builds up,
yielding the Gi effect (see Figs 5B and 6). Along this line, the Gi
effect therefore supports the notion that alpha-band synchro-
nization reflects the inhibition of task-interfering areas
(Pfurtscheller et al. 1996; Klimesch et al. 2007; Tuladhar et al.
2007; Meeuwissen et al. 2010). Yet, as we already pointed out
in the Results, the Gi effect can also be interpreted in terms of
a stronger disinhibition of ipsilateral regions (Fig. 6), consistent
with the recruitment of the hemisphere that codes the target.
Finally, several previous studies have referred to the topo-
graphic modulations in the alpha band as retinotopic modulations
(Worden et al. 2000; Kelly et al. 2006). However, because these
studies did not vary eye position, any inference as to whether
these topographic modulations are related to a gaze-centered
(retinotopic) frame of reference is unwarranted. Compared with
these studies, the present study is novel in that it has truly
decoded the spatial reference frame in which the alpha band
(and gamma band) operates during cortical processing.
We conclude that alpha- and gamma-band oscillations play
distinct roles in the maintenance and updating of spatial goals
during an intervening eye movement. Power in the gamma
band is instantaneously reorganized to encode task-relevant
space in a gaze-centered reference frame, while power in the
alpha may reflect slower attentional processes that might act
independently when necessary.
Funding
The Netherlands Organization for Scientific Research (grants
864.03.007 to O.J. and 400-04-186 to P.M.).
Notes
Conflict of Interest : None declared.
References
Andersen RA, Buneo CA. 2002. Intentional maps in posterior parietal
cortex. Annu Rev Neurosci. 25:189--220.
Andersen RA, Essick GK, Siegel RM. 1985. Encoding of spatial location
by posterior parietal neurons. Science. 230:456--458.
Barbati G, Porcaro C, Zappasodi F, Rossini PM, Tecchio F. 2004.
Optimization of an independent component analysis approach for
artifact identification and removal in magnetoencephalographic
signals. Clin Neurophysiol. 115:1220--1232.
Bastiaansen MC, Knosche TR. 2000. Tangential derivative mapping of
axial MEG applied to event-related desynchronization research. Clin
Neurophysiol. 111:1300--1305.
Bauer M, Oostenveld R, Peeters M, Fries P. 2006. Tactile spatial
attention enhances gamma-band activity in somatosensory cortex
and reduces low-frequency activity in parieto-occipital areas.
J Neurosci. 26:490--501.
Bisley JW, Goldberg ME. 2010. Attention, intention, and priority in the
parietal lobe. Annu Rev Neurosci. 33:1–21.
Blohm G, Crawford JD. 2009. Fields of gain in the brain. Neuron.
64:598--600.
Brotchie PR, Andersen RA, Snyder LH, Goodman SJ. 1995. Head position
signals used by parietal neurons to encode locations of visual
stimuli. Nature. 375:232--235.
Bruce CJ, Goldberg ME. 1985. Primate frontal eye fields. I. Single neurons
discharging before saccades. J Neurophysiol. 53:603--635.
Buschman TJ, Miller EK. 2007. Top-down versus bottom-up control of
attention in the prefrontal and posterior parietal cortices. Science.
315:1860--1862.
Buzsaki G. 2006. Rhythms of the brain. Oxford: Oxford University Press.
Chang SW, Papadimitriou C, Snyder LH. 2009. Using a compound gain
field to compute a reach plan. Neuron. 64:744--755.
Colby CL, Duhamel JR, Goldberg ME. 1995. Oculocentric spatial
representation in parietal cortex. Cereb Cortex. 5:470--481.
Curtis CE, D’Esposito M. 2006. Selection and maintenance of saccade
goals in the human frontal eye fields. J Neurophysiol. 95:3923--3927.
Curtis CE, Rao VY, D’Esposito M. 2004. Maintenance of spatial and
motor codes during oculomotor delayed response tasks. J Neurosci.
24:3944--3952.
Dias EC, Segraves MA. 1999. Muscimol-induced inactivation of monkey
frontal eye field: effects on visually and memory-guided saccades.
J Neurophysiol. 81:2191--2214.
Duhamel JR, Colby CL, Goldberg ME. 1992. The updating of the
representation of visual space in parietal cortex by intended eye
movements. Science. 255:90--92.
Fries P. 2005. A mechanism for cognitive dynamics: neuronal commu-
nication through neuronal coherence. Trends Cogn Sci. 9:474--480.
Fries P. 2009. Neuronal gamma-band synchronization as a fundamental
process in cortical computation. Annu Rev Neurosci. 32:209--224.
Fries P, Nikolic D, Singer W. 2007. The gamma cycle. Trends Neurosci.
30:309--316.
Golomb JD, Chun MM, Mazer JA. 2008. The native coordinate system of
spatial attention is retinotopic. J Neurosci. 28:10654--10662.
Golomb JD, Nguyen-Phuc AY, Mazer JA, McCarthy G, Chun MM. 2010.
Attentional facilitation throughout human visual cortex lingers in
retinotopic coordinates after eye movements. J Neurosci. 30:
10493--10506.
Gregoriou GG, Gotts SJ, Zhou H, Desimone R. 2009. High-frequency,
long-range coupling between prefrontal and visual cortex during
attention. Science. 324:1207--1210.
Gross J, Kujala J, Hamalainen M, Timmermann L, Schnitzler A, Salmelin R.
2001. Dynamic imaging of coherent sources: studying neural
interactions in the human brain. Proc Natl Acad Sci U S A. 98:694--699.
Hamalainen M, Hari R, Ilmoniemi RJ, Knuutila J, Lounasmaa OV. 1993.
Magnetoencephalography: theory, instrumentation, and applica-
tions to noninvasive studies of the working human brain. Rev Mod
Phys. 65:413--497.
Page 10 of 12 Oscillatory Activity during Spatial Updating d Van Der Werf et al.
at Radboud U
niversity on March 14, 2012
http://cercor.oxfordjournals.org/D
ownloaded from

Hinkley LB, Nagarajan SS, Dalal SS, Guggisberg AG, Disbrow EA. 2011.
Cortical temporal dynamics of visually guided behavior. Cereb
Cortex. 21:519--529.
Hoogenboom N, Schoffelen JM, Oostenveld R, Parkes LM, Fries P. 2006.
Localizing human visual gamma-band activity in frequency, time and
space. Neuroimage. 29:764--773.
Howard MW, Rizzuto DS, Caplan JB, Madsen JR, Lisman J, Aschen-
brenner-Scheibe R, Schulze-Bonhage A, Kahana MJ. 2003. Gamma
oscillations correlate with working memory load in humans. Cereb
Cortex. 13:1369--1374.
Jensen O, Mazaheri A. 2010. Shaping functional architecture by oscillatory
alpha activity: gating by inhibition. Front Hum Neurosci. 4:4.
Jerbi K, Freyermuth S, Dalal SS, Kahane P, Bertrand O, Berthoz A,
Lachaux JP. 2009. Saccade related gamma-band activity in in-
tracerebral EEG: dissociating neural from ocular muscle activity.
Brain Topogr. 22:18--23.
Jerbi K, Freyermuth S, Vidal JR, Bastin J, Bertrand O, Kahane P,
Berthoz A, Lachaux JP. 2010. High frequency power and low
frequency coupling in frontoparietal networks mediate oculomotor
behavior. FENS Abstr. 5, 051.10.
Jerbi K, Hamame CM, Ossandon T, Dalal SS. 2008. Role of posterior
parietal gamma activity in planning prosaccades and antisaccades.
J Neurosci. 28:13713--13715.
Jokisch D, Jensen O. 2007. Modulation of gamma and alpha activity
during a working memory task engaging the dorsal or ventral
stream. J Neurosci. 27:3244--3251.
Kelly SP, Lalor EC, Reilly RB, Foxe JJ. 2006. Increases in alpha oscillatory
power reflect an active retinotopic mechanism for distracter
suppression during sustained visuospatial attention. J Neurophysiol.
95:3844--3851.
Klimesch W, Sauseng P, Hanslmayr S. 2007. EEG alpha oscillations: the
inhibition-timing hypothesis. Brain Res Rev. 53:63--88.
Lachaux JP, Hoffmann D, Minotti L, Berthoz A, Kahane P. 2006.
Intracerebral dynamics of saccade generation in the human frontal
eye field and supplementary eye field. Neuroimage. 30:1302--1312.
Liljestrom M, Kujala J, Jensen O, Salmelin R. 2005. Neuromagnetic
localization of rhythmic activity in the human brain: a comparison of
three methods. Neuroimage. 25:734--745.
Liu Y, Yttri EA, Snyder LH. 2010. Intention and attention: different
functional roles for LIPd and LIPv. Nat Neurosci. 13:495--500.
Maris E, Oostenveld R. 2007. Nonparametric statistical testing of EEG-
and MEG-data. J Neurosci Methods. 164:177--190.
Mazzoni P, Bracewell RM, Barash S, Andersen RA. 1996. Spatially tuned
auditory responses in area LIP of macaques performing delayed
memory saccades to acoustic targets. J Neurophysiol. 75:1233--1241.
Medendorp WP. 2010. Spatial constancy mechanisms in motor control.
Philos Trans R Soc Lond B Biol Sci. 27:476--491.
Medendorp WP, Buchholz VN, Van Der Werf J, Leone FTH. 2011.
Parietofrontal circuits in goal-oriented behavior. Eur J Neurosci.
33:2017–2027.
Medendorp WP, Goltz HC, Vilis T. 2005. Remapping the remembered
target location for anti-saccades in human posterior parietal cortex.
J Neurophysiol. 94:734--740.
Medendorp WP, Goltz HC, Vilis T, Crawford JD. 2003. Gaze-centered
updating of visual space in human parietal cortex. J Neurosci.
23:6209--6214.
Medendorp WP, Kramer GF, Jensen O, Oostenveld R, Schoffelen JM,
Fries P. 2007. Oscillatory activity in human parietal and occipital
cortex shows hemispheric lateralization and memory effects
in a delayed double-step saccade task. Cereb Cortex. 17:2364--2374.
Meeuwissen EB, Takashima A, Fernandez G, Jensen O. Forthcoming
2010. Increase in posterior alpha activity during rehearsal predicts
successful long-term memory formation of word sequences. Hum
Brain Mapp. 32:2045–2053.
Melloni L, Schwiedrzik CM, Rodriguez E, Singer W. 2009. (Micro)-
Saccades, corollary activity and cortical oscillations. Trends Cogn
Sci. 13:239--245.
Merriam EP, Genovese CR, Colby CL. 2003. Spatial updating in human
parietal cortex. Neuron. 39:361--373.
Morris AP, Chambers CD, Mattingley JB. 2007. Parietal stimulation
destabilizes spatial updating across saccadic eye movements. Proc
Natl Acad Sci U S A. 104:9069--9074.
Nakamura K, Colby CL. 2000. Visual, saccade-related, and cognitive
activation of single neurons in monkey extrastriate area V3A.
J Neurophysiol. 84:677--692.
Nakamura K, Colby CL. 2002. Updating of the visual representation in
monkey striate and extrastriate cortex during saccades. Proc Natl
Acad Sci U S A. 99:4026--4031.
Nichols TE, Holmes AP. 2002. Nonparametric permutation tests for
functional neuroimaging: a primer with examples. Hum Brain Mapp.
15:1--25.
Nolte K, Muller B, Dibbets J. 2003. Comparison of linear measurements
in cephalometric studies. J Orofac Orthop. 64:265--274.
Okada YC, Salenius S. 1998. Roles of attention, memory, and motor
preparation in modulating human brain activity in a spatial working
memory task. Cereb Cortex. 8:80--96.
Patel GH, Shulman GL, Baker JT, Akbudak E, Snyder AZ, Snyder LH,
Corbetta M. 2010. Topographic organization of macaque area LIP.
Proc Natl Acad Sci U S A. 107:4728--4733.
Percival D, Walden A. 1993. Spectral analysis for physical applications:
multitaper and conventional univariate techniques. Cambridge
(UK): Cambridge University Press.
Pesaran B, Pezaris JS, Sahani M, Mitra PP, Andersen RA. 2002. Temporal
structure in neuronal activity during working memory in macaque
parietal cortex. Nat Neurosci. 5:805--811.
Pfurtscheller G, Stancak A Jr, Neuper C. 1996. Event-related synchro-
nization (ERS) in the alpha band—an electrophysiological correlate
of cortical idling: a review. Int J Psychophysiol. 24:39--46.
Prime SL, Vesia M, Crawford JD. 2010. TMS over human frontal eye
fields disrupts trans-saccadic memory of multiple objects. Cereb
Cortex. 20:759--772.
Rajkai C, Lakatos P, Chen CM, Pincze Z, Karmos G, Schroeder CE. 2008.
Transient cortical excitation at the onset of visual fixation. Cereb
Cortex. 18:200--209.
Sereno MI, Pitzalis S, Martinez A. 2001. Mapping of contralateral space
in retinotopic coordinates by a parietal cortical area in humans.
Science. 294:1350--1354.
Siegel RM, Raffi M, Phinney RE, Turner JA, Jando G. 2003. Functional
architecture of eye position gain fields in visual association cortex of
behaving monkey. J Neurophysiol. 90:1279--1294.
Silver MA, Kastner S. 2009. Topographic maps in human frontal and
parietal cortex. Trends Cogn Sci. 13:488--495.
Sommer MA, Wurtz RH. 2008. Brain circuits for the internal monitoring
of movements. Annu Rev Neurosci. 31:317--338.
Tiesinga PH, Fellous JM, Salinas E, Jose JV, Sejnowski TJ. 2004. Inhibitory
synchrony as a mechanism for attentional gain modulation. J Physiol
Paris. 98:296--314.
Tuladhar AM, ter Huurne N, Schoffelen JM, Maris E, Oostenveld R,
Jensen O. 2007. Parieto-occipital sources account for the increase in
alpha activity with working memory load. Hum Brain Mapp.
28:785--792.
Van Der Werf J, Buchholz VN, Jensen O, Medendorp WP. 2009.
Neuronal synchronization in human parietal cortex during saccade
planning. Behav Brain Res. 205:329--335.
Van Der Werf J, Jensen O, Fries P, Medendorp WP. 2008. Gamma-band
activity in human posterior parietal cortex encodes the motor goal
during delayed prosaccades and antisaccades. J Neurosci.
28:8397--8405.
Van Der Werf J, Jensen O, Fries P, Medendorp WP. 2010. Neuronal
synchronization in human posterior parietal cortex during reach
planning. J Neurosci. 30:1402--1412.
van Gerven M, Jensen O. 2009. Attention modulations of posterior alpha
as a control signal for two-dimensional brain-computer interfaces.
J Neurosci Methods. 179:78--84.
Van Veen BD, Van DrongelenW, Yuchtman M, Suzuki A. 1997. Localization
of brain electrical activity via linearly constrained minimum variance
spatial filtering. IEEE Trans Biomed Eng. 44:867--880.
Womelsdorf T, Fries P. 2007. The role of neuronal synchronization in
selective attention. Curr Opin Neurobiol. 17:154--160.
Cerebral Cortex Page 11 of 12
at Radboud U
niversity on March 14, 2012
http://cercor.oxfordjournals.org/D
ownloaded from

Worden MS, Foxe JJ, Wang N, Simpson GV. 2000. Anticipatory biasing of
visuospatial attention indexed by retinotopically specific alpha-band
electroencephalography increases over occipital cortex. J Neurosci.
20:RC63.
Wyart V, Tallon-Baudry C. 2009. How ongoing fluctuations in human
visual cortex predict perceptual awareness: baseline shift versus
decision bias. J Neurosci. 29:8715--8725.
Yuval-Greenberg S, Tomer O, Keren AS, Nelken I, Deouell LY. 2008.
Transient induced gamma-band response in EEG as a manifestation
of miniature saccades. Neuron. 58:429--441.
Zhang M, Barash S. 2004. Persistent LIP activity in memory antisaccades:
working memory for a sensorimotor transformation. J Neurophysiol.
91:1424--1441.
Page 12 of 12 Oscillatory Activity during Spatial Updating d Van Der Werf et al.
at Radboud U
niversity on March 14, 2012
http://cercor.oxfordjournals.org/D
ownloaded from


