Embed Size (px)
Citation preview

¢
Updating a Panel Survey Questionnaire
Konstadinos G. GouliasRam M. PendyalaRyuichi Kitamura
September 1991Working Paper, No. 61
The University of California
Transportation Center
University of California
Berkeley, CA 94720

The University of California
’lYansportation Center
The University of California
Transportation Center (UCTC)
is one of ten regional units
mandated by Congress and
established in Fall 1988 to
support research, education,
and training in surface trans-
portation. The UC Center
serves federal Region IX and
is supported by matching
grants from tile U.S. Depart-
ment of Transportation. the
California State Department
of Transportation (Caltrans),
and tile University.
Based on the Berkeley
Campus, UCTC draws upon
existing capabilities and
resources of the Institutes of
Transportation Studies at
Berkeley, Davis, and Irvine;
the Institute of Urban and
Regional Development at
Berkeley: the Graduate
School of Architecture and
Urban Planning at Los
Angeles: and several aca-
demic departments at tile
Berkeley, Davis, Irvine, and
Los Angeles campuses.
Faculty and students on other
Universily of California
campuses may participate in
Center activities. Researchers
at other universities within
the region also have opportu-
nities to collaborate on selec-
ted studies. Currently faculty
at California State University,
Long Beach, and at Arizona
State University, Tempe, are
active participants.
UCTC’s educational and
research programs are focused
on strategic planning for
improving metropolitan
accessibility, with emphasis
on the special conditions in
Region IX. Particular attention
is directed to strategies for
using transportation as an
instrument of economic
development, while also ac-
commodating to the re-
gion’s persistent expansion
and while maintaining and
enhancing the quality of
life there,
The Center distributes reports
on its research in working
papers, monographs, and in
reprints of published arti-
cles. For a list of publications
in print, write to the address
below.
University of California"l~’anspor talion Center
108 Naval Architecture BuildingBerkeley, California 94720Tel: 4151643-7378FAX: 4151643-5456
Authors of papers reporting on UCTC-sponsored research are solelyresponsible for their content. This research ’,,.’as supported by the U.S.Department of Transportation and the California Stale Deparhnent ofTransportation, neither of which assumes liabilily for its content or use.

Updating a Panel Survey Questionnaire
Konstadinos G. GouliasRam M. PendyalaRyuichi Kitamura
Department of Civil EngineeringTransportation Research GroupUniversity of California at Davis
Working Paper, No. 61
September 1991
The University of California Transportation CenterUniversity of California at Berkeley

Keywords: Attrition, Diary fatigue, Panel fatigue, Panel survey,Questionnaire redesign, Trip reporting
Abstract
In a panel survey where the same set of questions is asked repeatedlyover time, the need to update the survey questionnaire may arise.Knowledge of the quality of earlier responses can be used to improve thequestionnaires for subsequent waves. Response rate and item non-response can be improved through information obtained in earlier waves.Changes in layout, appearance, number of questions and wording,influence the quality of the responses. However, the need forcontinuity of the questionnaire’s content and appearance across waves,substantially limits the choices for redesign. Therefore, the redesignof a questionnaire is a constrained problem with an ultimate objectiveof increasing the response rate, item response, and accuracy of theresponses, within the limits imposed by the need to maintain continuity.
A travel impact analysis conducted in connection with the State ofCalifornia Telecommuting Pilot Project offers an opportunity to studypanel questionnaire updating. The process of updating a three-daytravel diary is documented, and its effects on trip reporting andreporting accuracy are discussed in this paper. The results indicatethat improved wording and layout contribute to improved data quality,but do not help to prevent under-reporting of trips due to panelfatigue.
i. Introduction.
A promising approach to travel behavior analysis, which has drawn a
considerable amount of attention in recent years is panel analysis.
Panel analysis is based on longitudinal observations of the same set of
behavioral units. Its strength is that repeated observations of the
same individuals or households provide the history of their behavioral
changes. This makes the identification of causal factors and
relationships a much more practicable task. The confounding effects of
individual-specific factors that do not change over time, can be
accounted for with panel data. Moreover, panel data allows the
construction of dynamic models that forecast future demand based on
systematic tendencies in longitudinal changes, rather than on cross-
sectional variations across behavioral units. Panel analysis also
addresses the dynamic aspects of travel behavior significant in many
planning contexts; including behavioral turnover (e.g., mode switching),
learning and experimentation (e.g., about a new bus line), and long term
vs. short term elasticities (of car ownership to household income).
Panel analysis is being applied to an ever-increasing number of
studies in transportation planning (e.g., Hensher, 1986; Kitamura, 1989;
and Golob & Golob, 1989) and several large-scale panel surveys are
being planned (e.g., Murakami & Watterson, 1989; and Purvis, 1989). The
development of panel survey instruments, however, involves added
complexities arising from unique problems such as attrition, panel
conditioning and decreasing response rates. The effort also involves a
new element; that of updating panel questionnaires between waves of the
survey.
In a panel survey the researcher often has the opportunity of
examining responses to the questionnaire from an earlier survey wave.
Deficiencies, which the researcher may wish to rectify for the
subsequent waves, may become apparent. However, the objective of a
panel survey is often to examine changes in responses to the same set of
questions. Therefore, it is necessary that correction, or updating, of
the questionnaire does not impair the comparability of responses.Obvious design improvements may not help if they interfere with the
continuity. Updating a panel survey questionnaire is thus constrained
by the need to maintain continuity across survey waves.
This paper presents a discussion on panel survey questionnaire
updating, using the ongoing State of California Telecommuting Pilot
Project (Goulias, et al., 1989) as a case study. Telecommuting refers
to the use of telecommunications technology, such as the telephone, to
perform work tasks at home without commuting to the workplace (Kitamura,
et al., 1990a). The project involves a special purpose panel surveythat aims at identifying the impact of telecommuting on individual and
household travel patterns. The questionnaire used in the first survey
wave was modified and used in the second wave, which took place
approximately one year later.
This paper discusses the updating process, in detail, and examines
the quality of the responses of the two survey waves. The study sample
consists of two groups: telecommuters (the portion of the sample working
at home at least one day a week) and the control group (the portion
the sample not telecommuting). This not only allows the isolation of
the impact of telecommuting on travel, but also allows the evaluation of

the changes made in the survey questionnaire. However, it is notpossible to separate the effects of the updating procedure from theeffects of possible changes in factors affecting travel behavior (fuelprices, new bus lines, etc.) between the two waves.
The objective of this paper is to assess the impact of updatingthe questionnaire on trip reporting, to present the stages followed inthat updating and to illustrate how a panel survey questionnaire can beimproved without introducing a loss of continuity. The success of theupdating procedure is evaluated through the use of trip reporting rates.
The following section is a literature review on questionnairedesign and other components of travel surveys. Section 3 describes thepanel travel survey procedure and the instrument of the State ofCalifornia Telecommuting Pilot project. The focus of discussion is theupdating process followed to prepare the questionnaire for the secondwave. Conclusions are outlined in the last section.
2. An overview of surveys
While questionnaire design for panel surveys has much in common withthat of cross-sectional surveys, it involves some unique aspects, (e.g.issues related to the use of travel diaries in repeated interviews; seeGolob, et al., 1986). Unfortunately the literature on panel surveyquestionnaire design is limited. Madow, et al (1983a, p13) note"Theoretical and empirical research should be undertaken on methodsdealing with nonresponse in longitudinal and panel surveys."
2.1 Survey Instrument, Procedure and Data Quality
The quality of survey results may be impaired by problems arising from avariety of sources. These include sampling errors, errors due toincomplete data, response errors, and processing errors (Madow, et al.,1983b). Sources of sampling bias include low response rates, lowcompletion rates, item nonresponse, difficulty in locating respondentsin a longitudinal survey when following up the initial sample, andinadequate sample coverage. These would not be a problem if non-response is proven to be random; otherwise, the sample statistics maynot be representative of the population. It is important to understandthe reasons for non-response or erroneous responses and to devisemethods to overcome their negative consequences. Although there isapparently no definitive agreement on what is most effective (Yu andCooper, 1983), a variety of countermeasures have been suggested. Thesecan be grouped into a priori and a posteriori measures.
A Priori Methods co Reduce Non-Response
A priori methods are those implemented before a survey is conducted.They include improvements in questionnaire design, pretesting, andimprovements in survey administration procedures. Possiblerelationships between these elements and survey responses have beendiscussed extensively in the literature. A brief discussion of thesemethods follows.

Method of contact: Personal interviews have the highest response rate
(Wermuth, 1979) and present the added advantage of collecting more
detailed information about the respondent (Brog, et al., 1983).
Questionnaire Length: Possible biases due to item non-response and
response inaccuracy may be attributable to excessive length (Yu and
Cooper, 1983).
Question Length: Provided they are not embarrassing, short and clearquestions are preferable (Blair, et al., 1977) and vice versa.
Response facilitators: A significant positive effect can be triggered
by preliminary notification, ’foot-in-the-door’ techniques (Reingen and
Kernan, 1977), personalization, follow-up letters and instruction sheets
(Cannell, et al., 1977). Appeal, a quality that arouses interest
sympathy, is a subliminal influence and has been studied by Houston
(1981). He reports that appeal is very important and can significantlyincrease the number of completed questionnaires. The effect of appeal
is not only beneficial on the response rate, but also on the speed and
completeness of the responses.
Forsythe (1977) presents an example of possible detrimental
effects caused by personalization in a survey of business executives. A
cover letter, assurances of anonymity, stating a deadline, and provision
of postage, on the other hand, do not appear to show significant
effects. The influence of survey sponsorship and call-backs is unknown.
Questions and Their Sequence: Also important are the clarity of
questions, uniqueness of the answer, wording, sequence of questions and
their format (Brog and Ampt, 1983; Sheskin and Stopher, 1982).
Layout: Enhancing the questionnaire layout can improve the response
(Sheskin and Stopher, 1982; Heathcote, 1983). Pressley and Tullar
(1977) found that the color of the survey questionnaire and the presence
of cartoons have no significant effect on the response rate. According
to Brog, et al. (1983), a column layout seems to improve response
accuracy. They report that a column layout yielded 3% of unusable or
partly unusable questionnaires compared to 8% for a row layout. The
importance of questionnaire layout is demonstrated by Mayer and Piper
(1982) in their surveys, conducted in two different years, which
indicated completely reversed tendencies of purchasing a product. The
replacement of a line for a box was later verified, by phone, to have
confused the respondents. In another study, lack of adequate space to
report answers is claimed to be a reason for item non-response. In
contrast, when the question asked is about subjects the respondents are
familiar with (e.g., income) even substantial changes in the
questionnaire do not result in any inaccuracies. An example of this can
be found in an experiment by Herriot (1977) who used a panel to assess
the effect of different questionnaire formats on the accuracy of the
answer.
Interaction between Interviewer and Interviewee: An excellent analysis
is presented by McKenzie (1977) on the influence of the interviewer
response quality. The personality of the interviewer seems to influence
the way interviewees answer the questions. Extensive training of the

interviewers seems to be a solution to this problem. This is
particularly important when complex questions are involved (Bailar, et
al., 1977). The effect of interviewers on quality of information
collected in a panel survey is reported by Hensher (1985).
Instructions: A large portion of guidance for completing a questionnaire
is often provided by an instruction sheet. The instructions, according
to Cannell, et al., (1977), have to clarify to the respondent what
expected of him, guide him in such a way that he will be more efficientand motivate him to answer all the questions.
If the above guidelines are adhered to in developing an
instruction sheet, then the absence of an interviewer is partially
overcome and his contributions in reducing respondent errors and
improving item-response rates can partially be replaced.
Administration and Coding: This is another important component of a
satisfactory survey design. Administration includes delivery, follow-up
and collection of the survey instrument (Clark and Goldstucker, 1986;
Brog, et al.,1985b). Coding is a very sensitive part of data
processing. Specific procedures should be defined in order to avoid
biases due to erroneous data entry (Payne, 1977).
Incentives: Monetary incentives, prepaid or promised, have a very strongpositive effect on the quality of responses (Yu and Cooper, 1983;
Wiseman, et al., 1983). The amount of the incentive is highly
correlated with the response rate. Pressley and Tullar (1977) claim
that a dime (i0 cents) increased the response rate by a surprisingly
high 10%. The same tendency is reported by Walsh (1977), although the
effect was not of the same magnitude. Offering other incentives appears
to have some influence, although there are not many studies where non-
monetary incentives are examined.
A Posteriori Methods co Reduce Non Response
Even after every effort is made to improve the survey instrument and
procedure, it is likely that the resulting data will contain
deficiencies that require attention (O’Muircheartaigh, 1978). The
methods that can be used a posteriori can be classified into several
categories.
The first is simply to disregard the respondent if required
information is missing. The second is to replace the respondent with a
"matched" new respondent using a selected set of observable variables
(Kalton, 1983a, 1983b). The assumption in this method is that the
"matched" new respondent will have the same behavioral characteristics
as the dropped one. Usually the verity of this assumption cannot be
tested. Both methods lead to sampling bias if item non-response is not
purely random, and in the case of the matching method, the variables
used for matching do not entirely account for systematic tendency in
non-response. The third alternative is to infer values of the missing
variables from the context (i.e. from other responses of the same
respondents).
A fourth method is a posteriori editing and correction of
suspected erroneous responses (Heathcote, 1983). Durand, et ai.,(1983)
suggest "fixing the data" case by case after reviewing each respondent’s

record in detail. With regard to this method, a Panel on IncompleteData was established in 1977 by the Committee on National Statistics(U.S.A.). The discussions of this Panel have been s,,mmarized in Madowet al (1983a). A brief review of their recommendations follows:
-It is preferable to recover non-response using apriori methods than using a posteriori methods.
-Non-response should be reported in detail and itscauses identified in order to enable researchers torecover the missing information.
-Statistical methods to recover from the detrimentaleffects of non-response do exist; however, bias willalways persist even after a posteriori methods are used.
-Imputation and weighting are two of the methods which can beapplied successfully when needed (in addition see Rubin, 1987).
-Expected biases given by models based on statisticalmethods are not better than observed ones. Of course, inmany studies observed biases cannot be measured.
An a posteriori method of a different nature has been suggested byStopher and Meyburg (1979). This is called the "blanket approach" andinvolves sending letters of gratitude and reminders to all therespondents at a later stage of the survey when a possible problem ofnon-response has been identified. Whoever did not respond wouldprobably feel obliged to respond at this point and those who did respondearlier would be motivated to answer future contacts. Pretesting isfound to be useful to both the respondents (in identifying potentialproblems) and the administration (Hunt, et al., 1982; Ampt and West,1985). Increasing the sample size is a last resort which is appliedonly in cases of extreme need. It is questionable if this last approachsolves the problem when systematic tendencies exist in non-response.
2.2. Panel surveys and questionnaires.
Designing an instrument for a panel survey is more complex than that fora cross-sectional survey because it involves additional problems.Potential problems associated with panel surveys are identified anddiscussed in this section.
AC~rition: Selective attrition and panel conditioning are unique topanel surveys (Golob and Golob, 1989). Self-selection always occurswhen a survey sample consists of volunteer respondents, for whom nomechanism exists to enforce participation. If self-selection issystematic with respect to measures of interest (i.e., the probabilityof participation varies from individual to individual as a function ofthis interest) then the resulting sample will produce biased inferences.This is the case for both cross-sectional surveys and panel surveys.Specific to panel surveys is self-selective attrition, (i.e., self-selective dropout of respondents).

Fortunately, the problem of panel attrition is easier to correct
than the non-response problem. The presence of respondents in earlier
wave(s) implies the availability of measures of their attributes,
including behavioral measures on which attrition is based (Wissen and
Meurs, 1989). This allows the analyst to construct a probabilistic
model of attrition, which in turn can be used to develop weights to
correct for attrition biases (Hensher, 1987). Kitamura and Bovy (1987)
have shown that such weights can be constructed for trip generation
analysis, based on a system of trip generation models at multiple time
points and a probabilistic model of attrition behavior.
Panel condirioninE: Since the same respondents are contacted repeatedly
and answer similar (or identical) questions over time, they are subject
to a phenomenon known as panel conditioning. The effect may be due to
the respondent’s attempt to appear consistent across waves of the
survey.
Consider the case where a panel survey is conducted to evaluate
the interplay of attitudes and behavior before and after a change in the
travel environment. An example can be found in Supernak and Kitamura
(1989) where the change in commuters’ attitudes toward car-pool lanes
before and after their opening is studied in connection with their car-
pool behavior. In such cases the respondents may recall their earlier
responses and so adjust their responses in a later wave in order to be
consistent across the waves, or to exaggerate their reaction to a
change. Hence, panel conditioning is especially suspect when
attitudinal questions are involved. Another cause of panel conditioning
is a change in perception, attitude, and possibly behavior itself, that
may take place because of the increased awareness of the survey subject,
as a result of participating in the survey.
Panel Fatigue: Another problem specific to panel surveys is panel
fatigue which yields a decrease in reporting accuracy. There are many
conceivable sources (e.g., loss of motivation after answering similar
questionnaires over time). Meurs, et al. (1989) illustrate this problem
using the case of the Dutch National Mobility Panel. In addition to the
declining reported trip rate in a weekly diary (which may be viewed as
case of short term fatigue), Meurs, et al. noted that the trip rate
reported by the same respondents for the first day of the weekly diary
tended to decline in later waves of participation. Such a fatigue
effect seems to exist in our panel survey on telecommuting.
"RecruiCment" of Initial Respondents: Because a panel survey in general
demands a long-term commitment on the part of respondents, it appears to
be a common practice to "recruit" them, rather than to randomly sample
them. In the case of the Dutch National Mobility Panel, households
sampled in a pre-survey were asked whether they were willing to
participate in a panel survey which was to continue for several years.
To the author’s knowledge, no effort was made to include in the panel,
those households that declined to participate in this initial survey.
Sample Refreshment: Because of self-selective attrition and other
reasons (residential relocation, household dissolution, death, etc.),
the number of respondents in a panel gradually declines over time. At
the same time, new members enter the study population through birth,

marriage, and migration. This necessitates constant updating of the
panel composition, or sample refreshment, if it is desired that it
reflect the study area population composition. This may require the
continuous collection of information on immigrants (van de Pol, 1987).
The effort spent in sample refreshment can be reduced
significantly if the panel is refreshed by replacing drop-outs with new
respondents, selected according to pre-specified, observable attributes.This method was used in the Dutch National Mobility Panel survey in
which refreshment households were sampled according to household income
and life-cycle stage. The distribution of new households in these two
dimensions was matched to that of the households that had dropped out.
The method, however, may not have been adequate because such measured
attributes in general do not adequately account for selective attrition.
Prelocation: Locating the same set of respondents in subsequent waves is
not a trivial task. Prelocation is the process of locating each
respondent and verifying his address before the distribution of the
questionnaire in a longitudinal survey. The problem of prelocation was
addressed during the 1972-73 consumer survey conducted by the Bureau of
Census for the Bureau of Labor Statistics (Walsh, 1977). A considerable
part of "loss of information" was attributed to difficulties in locating
the respondents. The application of prelocation was found to be
successful, even if there was no way to isolate its effect from those of
other improvements that were introduced simultaneously in the second
year.
These problems as well as the question of Conditioning must be
considered when updating a questionnaire for subsequent waves. Although
it is not possible to eliminate self-selection through an update of the
questionnaire, attrition may be minimized by improving the cover letter
and instruction sheet, tightening survey administration and possibly by
revising the questionnaire itself. While the effect of these measures
on attrition is not well known, it is the authors’ belief that the
administration of the survey is the most critical element in decreasing
attrition. However, since administration is the most expensive part of
the survey procedure, consideration should be given to the other three
remedies as well.
Rizvi (1983) points out that any effort to reduce non-response and
attrition demands time and monetary resources. His description of the
National Longitudinal Study of the High School Class of 1972 indicates
that the following measures were taken to maximize participation and
response:
A series of reminder letters
Telephone tracing
Mailgrams
Monetary incentives ($3 in 1977)
Additional questionnaires
The response rate in this panel survey was 73.84%. Mailgrams are
said to have been most effective, but extremely expensive. It is
reported that each subsequent attempt at contact costs more per person
than the initial questionnaire mailing. The cost of a contact was found
to be as much as 7 times higher than that of the initial mailing (per
returned questionnaire).

In addition, the design of a panel survey must take into accountthe duration of the survey, the frequency of interviews (van de Pol,1987), and the sampling schemes that are effective in measuring changes.It is likely that optimum values differ from study to study depending onthe objectives. Well-practised methods for cross-sectional surveys maynot be applicable or adequate in longitudinal surveys. For example, ifmeasuring the rate of change is the objective, then sample sizerequirements must be determined while considering the population’s rateof change. On the other hand, panels (especially rotating panels) maybe an economical sampling scheme in some cases.
2.3 Data Processing.
General guidelines to be followed during the data processing stage canbe found in the literature (Payne, 1977) and apply to panel surveys well as cross-sectional studies.
The sequence of steps can be summarized as follows:
i. Analysis of the original data files.
2. Development of a set of computer programs to detectdiscrepancies and inconsistencies in the datafiles.
3. Correction of recoverable information using logicalchecks, and
4. Completion of the rectification procedure byrepeating the analysis of the previous steps.
In transportation studies, the resulting data file may beorganized into trip-based, person-based and household-based data filesfor subsequent analysis. The above four-step procedure is applied forthe preparation of all three data files.
In panel surveys, a fifth step can be added;
5. Rectify the remaining recoverable information usingsurvey results from subsequent waves.
In addition, information extracted from the first wave data filesprovides guidelines that are to be followed in updating thequestionnaire. The results of this exercise for the telecommutingproject are reported in Section 3.3.
3. State of California Telecommuting Pilot Project
The main purpose of the State of California Telecommuting Pilot Projectis to assess the utility of telecommuting to the State Government (JALAAssociates, 1989). As part of this effort, a panel travel diary wasconducted with the intent of evaluating the impacts of telecommuting onhousehold travel. A three-day travel diary was distributed at twodifferent times (1988 to 1989) requesting the participants and driving-

age members of their households to report detailed information on thetrips they made on the three survey days. In the first round, theemployees who were selected to telecommute had started telecommuting atleast once a week. Thus the survey can be considered as a "before andafter" study.
The questionnaire used in the first wave was designed by theTransportation, Energy and Air Quality Work Group. The surveyquestionnaire was distributed and collected by the coordinators of theparticipating State agencies. The data coding and entry was performed byJALA Associates. This wave of the survey, conducted prior to theintroduction of telecommuting, was administered over the period ofJanuary to June 1988. The resulting data was analyzed earlier andreported elsewhere (Pendyala, et al., 1989).
The second wave questionnaire was designed by the authors of thispaper. Its distribution commenced in April 1989 and ended in July 1989.The survey was again administered entirely by the State agencies. Inthis wave, the telecommuters were requested to fill out the travel diaryon three consecutive weekdays, at least one of which was a telecommutingday (when work was performed at home). The control group did not changetheir usual work schedule between waves.
3.1 The Survey Sample
The pilot project has involved 222 state employees from 14 agencies.Approximately half of these employees telecommute on an experimentalbasis. The rest constitute a control group and commute to workconventionally. The latter group is expected to reflect changes in thegeneral travel environment (e.g., changes in gasoline prices) and comparison between the two groups should allow the isolation of theimpact of telecommuting on travel.
Of the original sample of 452 respondents in the wave-i survey,364 appeared in the data file containing trip information provided byJALA Associates. Another data file provided by JALA Associatescontained personal characteristics on 411 persons in wave-l. Of the 222employees in this data file, 106 (47.7%) were telecommuters, 88 (39.6%)were control group employees, and 28 (12.6%) were not assigned definite status. Telecommuter household members numbered 76 whilecontrol group household members numbered 93. There were 20 householdmembers unclassified.
In wave-2, a total of 254 individuals responded, of which 149 wereemployees. There were 77 (52%) telecommuter employees and 55 of theirhousehold members. The control group employees who responded numbered72 (48%), with 50 household members. Information on personalcharacteristics such as the identity code of the person, agency, andage, was missing or unknown for a few participants in the wave-I datafile. This information was effectively retrieved in wave-2 for the 194persons who were present in both waves.
Attrition is evident in this panel survey. Of the 222 employeesand 189 household members present in wave-l, only 123 employees and 71household members reported their trips in both waves. These respondentsshall be referred to as ’stayers’ in this paper. The stayers are madeup of 66 telecommuter employees, 39 telecommuter household members, 57control group employees and 32 control group household members. Thosewho did not participate in wave-2 include those who did not wish to

return their questionnaire or who returned unusable questionnaires,
retirees, and those who left the pilot project because of promotion and
other reasons. This group of respondents will be referred to as
’dropouts’ in this paper. The additional respondents in wave-2 (60
persons) include new participants, participants who returned unusable
questionnaires in wave-I and those who returned questionnaires only in
wave-2 even though they participated in wave-l.
3.2. The Questionnaire and its Evolution
The survey instrument designed for the State of California Telecommuting
Pilot Project has undergone changes since it was first distributed in
January 1988. The three versions of the first wave questionnaire were
distributed in January, March/April and June of 1988. It was updated
finally in 1989 to a single unified version which was distributed during
the entire second wave.
Updating the first wave questionnaires was an iterative procedure
that involved three steps:
i. Identification of the questionnaire items that may have caused
inaccurate responses, including questions that are redundant,
confusing or not needed at all.
2. With information from step i, changes to the layout,
presentation, wording and contents are made, and the sequence
of the questions reordered. In addition to the guidelines
identified in the literature review, extreme care was exercised
to maintain continuity.
3. The changes made in step 2 are evaluated, and the process is
iterated by going back to either step i or step 2. The
iterative process ended when the desired expected data quality
was achieved.
A summary of the changes made to earlier versions of the survey
instrument follows:
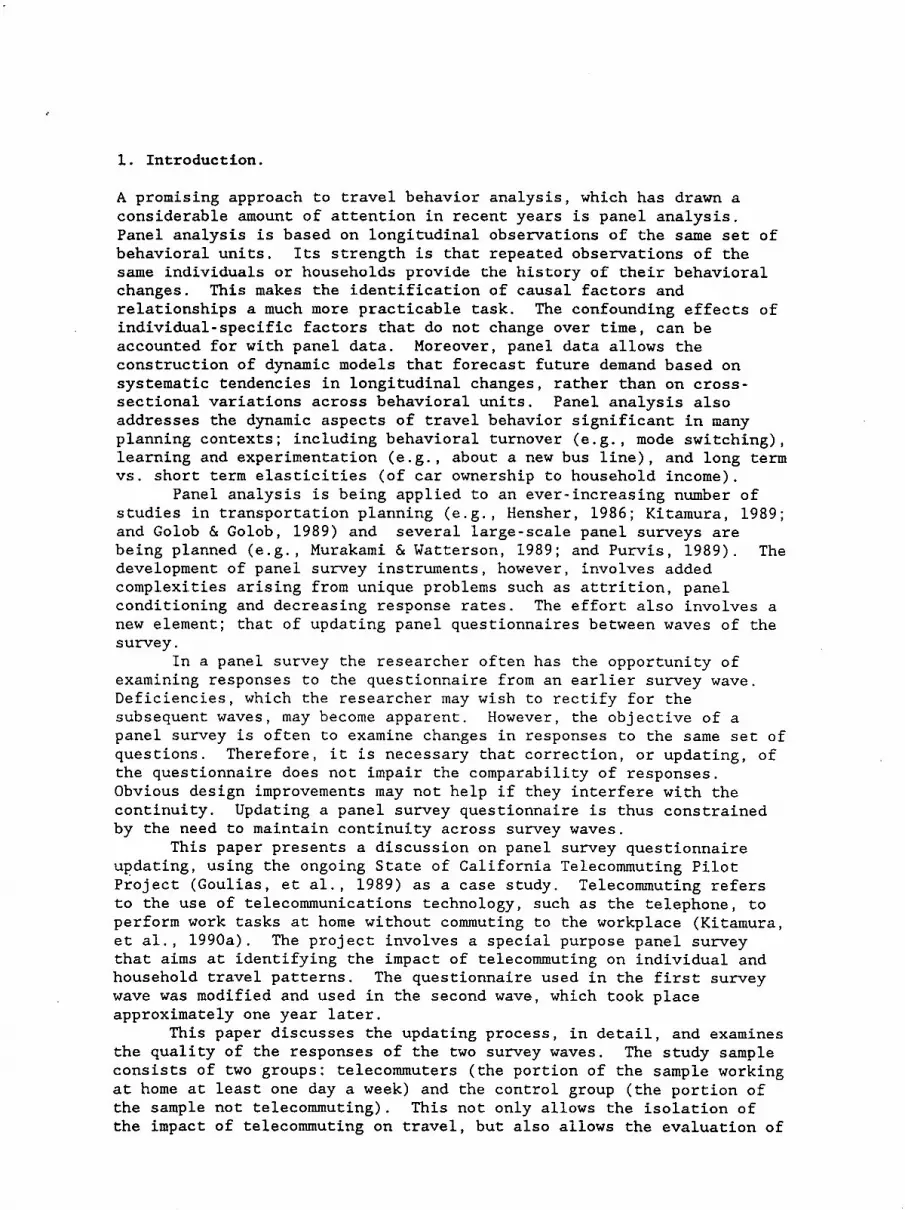
1. Changes to the Cover: Figure la shows the cover page of the travel
diary used in the first wave while figure Ib shows that of the second
wave. The cover was altered in two ways. First, the diary starting
date was entered by the respondent in the wave-2 diary. Second, the
color of the cover sheet was unified from a variety of colors to a
single color for each group (i.e. white for the telecommuter logs and
yellow for the control group). This was done to avoid confusion during
distribution of the logs and during data entry.
2. Changes to the First (Yellow) Page: A comparison of figures 2a and
2b indicates the changes made to the first page. This page requests
socio-demographic information, household car availability and addresses
of frequently visited locations. Changes were made to the layout,
wording and order of questions. In addition, two new questions were
asked in the wave-2 questionnaire. Participants were asked the gender
and employment status of their household members. A retrospective
question regarding past employment was introduced.

3. Changes co the (White) Diary Pages: The layout of the diary
questions was reorganized into a column-like format and the questions
ordered in a manner consistent with the way trip information would be
perceived by the respondent.
A question concerning the working status of the respondent on each
day of the survey was included. Notice that respondents did nottelecommute on every working day even though they were designated as
telecommuters. The options for mode choice were augmented with
walking, bicycling and car/vanpooling. Boxes were substituted for the
line segment previously used to record odometer readings.
In the trip purpose question, the categories were reorganized and
changed to achieve completeness and exclusiveness. Some trip purposes
were combined to reduce the number of categories (e.g. visit
friend/relation and recreation trip purposes were consolidated into one
trip purpose labeled social/recreation). Since the question which asked
whether the present trip was a continuation of a previous trip was not
well understood by the respondents, it was replaced by a trip purpose
category called "change mode".
4. General Ghanges to the Physical Characteristics of the Travel log;
The wave-2 diary was bound at the top using a spiral wire, instead of
being stapled at the side. This was expected to improve the ease of
handling for both the users and the data processors, hence, improving
the accuracy of response and the quality of data. In addition, a thick
front cover and a chip cardboard back cover were used for durability.
The length of the new diary was approximately 1.7 times that of the
wave-i diary, while the thickness and width remained basically the same.
5. Instruction Sheets: In a self-administered survey, respondents needinstructions to aid them in filling out the questionnaire properly.
Moreover, it is important for the respondents to know the purpose of the
survey, the degree of confidentiality of their responses, and the
importance of their participation for the success of the survey.
Properly formulated instructions enhance response accuracy as well as
response rate, since the respondent is more likely to sympathize with
the survey when he can appreciate its importance and feel more
comfortable with it. A properly formulated instruction sheet or booklet
should be clear, brief, and have logically sequenced instructions
(according to the order in which the questionnaire is to be filled out).
The formulation and presentation of the instructions for the
second wave differ substantially from that of the first wave because of
the changes discussed above and the attempt to motivate the respondents
to complete their task. The salient characteristics of the second wave
instruction sheets were:
¯ The cover was introduced in order to capture the respondent’s
attention and to enhance the appearance of the instructions. In this
page, a title ("State of California Telecommuting Pilot Project"), the
survey starting date, and short introductory instructions for
telecommuters were given. Acknowledgement of the respondent’s
anticipated cooperation was also included at this point.
¯ The body of the instruction booklet describes the procedural details
that respondents should follow in order to ease their task. The

instructions were given in the same order in which the questions appearin the travel diary. Figures were also added with proper guiding labels
to avoid any misinterpretation of the questions and the options
available. Emphasis was placed on the definition of a trip and the
newly introduced trip purpose "change mode".
¯ At the end of the instruction sheet, directions were written for
returning the diary. In addition, a short explanation of the purpose of
the survey was included in an attempt to trigger social appeal in the
respondents. Finally, and most importantly, examples of completed
questionnaires were presented to aid the respondents.
3.3 Data Analysis and Evaluation
The assessment of the effect of the changes in the questionnaire on
responses is divided into three segments: attrition, response quality,
and trip reporting.
ACCricion
A comparison of wave 1 travel characteristics between the participants
who responded in both waves (194 interviewees) and those who dropped out
in the second wave (170 interviewees) is considered important
evaluating the effect of attrition in our analysis.
It is well known that respondents who remain in both waves of a
panel survey are those that are better motivated. Their motivation
ranges from the significance to them, of the problem under study, to
their lifestyle and values. For example, people commute long distances
in heavy traffic would find this survey on telecommuting very
interesting and hence would tend to remain in both waves of the survey
and report their trips with greater accuracy. On the other hand,
persons for whom the commute trip is short may not be so interested in
this project. These participants tend to drop-out of the survey after
answering in the first wave. It is critical, then, that the travel
characteristics of these two groups be examined in order to assess
whether the stayers reflect the characteristics of the original sample
of 364 respondents in wave-l.
In Table i, the number of participants who stayed or dropped out
in each group is provided. It is seen that 66.7% of the telecommuters
remained in both waves while 55.8% of the control group employees
remained in both waves. This seems to indicate that telecommuters are
more motivated by this study as they are directly affected by the change
in work patterns. Similarly, among the household members, it is seenthat 55.7% of the telecommuter household members remained in the study,
while only 34.4% of the control group household members remained in the
study. Attrition is, then, heavily dependent upon group membership.
Table 1 Eoes here
In Table 2, the average number of trips reported by each group is
compared. The telecommuter employees present the smallest difference
between stayers and drop-outs. On the other hand, on average, the
control employees with fewer trips dropped out of the survey. The same
observation can be made of the household members.

Table 2 goes here.
A comparison of the number of trips by purpose is presented inTable 3. Here again we see that the characteristics of the stayers anddrop-outs among the telecommuter employees are very similar. Thestayers are found to report a marginally higher number of other purposetrips. With regard to the control employees and the telecommuterhousehold members, the stayers are consistently reporting a greaternumber of trips than the drop-outs. This is indicative of a possibleupward bias in the computation of trip rates of the control employeesand telecommuter household members of the two groups when the 194stayers alone are considered. However, the control household membersexhibit similar characteristics between their stayers and drop-outs.
Table 3 goes here
A comparison of total distance travelled per day has shown thatthe drop-outs among the telecommuter employees do not seem to be asmobile as the stayers, travelling 16% less (Kitamura, et al., 1990b).The drop-outs among the other groups also have slightly lower traveldistances compared to the stayers. This again, is an indication of thefact that the stayers tend to be persons who feel the impact oftravelling long distances.
In addition, an examination of average trip lengths has indicatedthat the drop-outs tend to have longer trips. Also, the telecommutersshow similar work trip lengths between their stayers and drop-outs.However, the stayers among the control group employees and telecommuterhousehold members show shorter work trip lengths.
Overall, the problem of attrition is not pronounced for thetelecommuter employees. They have shown quite similar characteristicsbetween their stayers and drop-outs. Hence the characteristics of the66 stayers could be considered as representative of the characteristicsof the 99 original telecommuters who responded in wave i. However,among the control group employees and telecommuter household members, itis found that the stayers are those who report higher trip rates, butslightly shorter trip lengths.
We cannot evaluate the effect of the enhancements of thequestionnaire on the attrition rate. Presumably, the group ofrespondents common to both waves is the motivated group. Hence, theeffect of updating the questionnaire can be evaluated by comparing thequality of the data obtained from this sample. This comparison ispresented in the next section.
Data QualityThe data obtained from the first wave (original non-augmented file)presented two major problems to be overcome. First, coding and keypunching errors lead to the presence of incorrect data. Second, due tothe unclear definition of a trip in the instruction sheets and in thetravel diary, respondents tended to enter round trips (consisting of atleast two trips) as a single trip.
The results in this section indicate that the second waveresponses are of a higher quality than the responses in the first wave.A comparison of the quality of data obtained in the two waves issummarized in Table 4. In wave-l, the 194 stayers reported a total of

2,350 trips in 3 days. In wave-2, these respondents reported a total of1,953 trips in 3 days (note that the reduction in the total number oftrips is in part due to telecommuting). The amount of missing andinconsistent information is compared between the two waves.Inconsistent information refers to data which are not logical (e.g., theending time of a trip is reported to be before the beginning time of thetrip, or the ending odometer reading is reported to be smaller than thebeginning odometer reading, etc).
Table ~ goes here.
It was also noticed that non-mechanized trips were often notreported in wave i. This is due to the lack of mode categories providedspecifically for non-mechanized modes of in the wave-i diary. It istherefore likely that non-mechanized trips were under-reported in wave-
i.While there was a small decrease in response quality in the
percentage of freeway travel and the number of passengers, the resultsindicate an improvement in the quality of the data. It is important tonote that this improvement occurred even though a drop in item responseacross waves due to panel fatigue was expected.
Trip ReportingEarlier experiences with multi-day travel diaries indicate that thenumber of trips reported tend to decline toward the end of the diaryperiod (Golob and Meurs, 1986; Meurs, et al., 1989). This is in partdue to the increase of days when respondents report no trips at all.
The average number of trips reported in wave i decreases towardthe end of the diary period (Table 5), suggesting the increasingtendency of trip under-reporting as the survey progresses. The sameresult can be observed in wave 2, but the tendency is much lesspronounced. This may be due to the enhancement of the diary used inthis wave. The results suggest that well-formulated questions andneatly designed diaries aid in reducing under-reporting of trips.
Table 5 goes here.
Such improvement, however, cannot be found for the number of non-reporting days, i.e., days on which no trips are reported at all. Inthe results presented in Table 6 no improvement is evident in non-reporting days. Moreover, telecommuter household members present asomewhat larger number of non-reporting days. In wave-l, onetelecommuter household member reported trips only on one day (two non-reporting days) and 6 reported trips on two days. The correspondingnumbers for wave-2 are 4 and 6. On the other hand, the control groupmembers do not exhibit any tendencies between the waves (comparison fortelecommuters is meaningless because they have started to telecommute inwave 2).
Table 6 goes here
It is possible that the decrease in the number of persons fillingout the questionnaires is due to diary fatigue. Diaries requirerespondents to fill out large amounts of information daily, and when

this is required over more than one day, the effects of fatigue appear
to be more pronounced. In this sense, the duration of a diary should be
kept to a minimum. A duration of two days may be required in many
impact assessment studies. Two day diaries may be more appropriate for
these studies because significant decreases in trip reporting were
observed on the third day in this study (this, however, may be due to
the fact that the third day was the last diary day; also see Pas, 1986).
Even though the use of trip diaries has been recommended (Brog, et
al., 1985a; Clarke, et al., 1981) for obtaining accurate information
from the respondents, the findings of this study suggest the contrary.
The average number of trips reported across the waves has reduced
substantially as shown in Table 5. This indicates that the revision of
the diary did not aid in reducing panel fatigue in trip reporting. This
confirms previous results where a decrease in trip reporting across
panel waves was observed (Meurs, et al., 1989).
Overall, it can be seen that trip reporting and item-response can
be improved by enhancing the design of the questionnaire and increasing
the ease of filling it out. Another aspect deserving emphasis is the
importance of effective administration procedures when conducting a
panel survey. The respondents should be followed-up at regular
intervals during the survey period. Moreover, it would be preferable to
have the researchers directly in contact with the respondents, rather
than working through intermediaries. Some intermediaries, especially
employers and supervisors, may be viewed as having control over
employees and this perception may influence their responses. In
contrast, researchers, who analyze survey data from neutral viewpoints,
would be seen as having no influence on their lives.
4. Conclusions
In this paper, the procedure followed to update a panel survey
questionnaire has been presented in detail. The outcome of this
exercise has been encouraging as indicated by the reduction in erroneous
and missing information. The process of updating a panel survey
questionnaire presented in this study is constrained by the need to
maintain continuity across waves. Despite limitations thus imposed, it
has been shown that improvements made to a panel questionnaire may
enhance the quality of information collected. The results, at the same
time, indicated that the revision of the diary did not aid in reducing
panel fatigue in trip reporting. This remains a challenge. Finally, it
is conceivable that the use of a diary may lead to more non-response and
attrition because of the time it demands of the respondents. Although
experiences reported in the literature support the idea that a diary
leads to better trip reporting, its impact on non-response and attrition
need to be carefully examined, especially for multi-day diaries.

AcknowledgmentsThe authors are grateful to David Fleming of the California Departmentof General Services, Jack Nilles of JAIA Associates and Patrick Conroyof the California Department of Transportation who offered many insightsand valuable information. The assistance provided by Huichun Zhao whocontributed in the preparation of the data files and Gabriela Meyer whoparticipated in the design of the questionnaire is gratefullyacknowledged. The editorial help offered by Elizabeth Morrison deservesspecial mention and insights on the earlier draft offered by KennethKurani are appreciated.Funding for this study was provided the California Department ofTransportation and U.S. Department of Transportation through Region NineTransportation Center at University of California, Berkeley.The contents of this paper reflect the views of the authors who areresponsible for the facts and the accuracy of the data presented herein.The contents do not necessarily reflect the official views or policiesof the State of California. This paper does not constitute a standard,specification or regulation.

References
Ampt, E. and West, L. (1985) "The Role of the Pilot Survey in TravelStudies". In: E. Ampt, A. Richardson and W. Brog (Ed.) New SurveyMethods in Transport. VNU Science Press, Utrecht, The Netherlands.
Bailar B., Bailey, L. and Stevens, J. (1977) "Measures of InterviewerBias and Variance". Journal of Marketing Research, 14, pp 337-343.
Blair, E., Sudman, S., Bradburn, N.M. and Stockling, C. (1977) "How ask questions about drinking and sex: Response effects in measuringconsumer behavior". Journal of Marketing Research, 14, pp 316-321.
Brog, W. and Ampt, E. (1983) "State of the Art in the Collection Travel Behavior Data". In Travel Analysis Methods for the 1980s. SpecialReport 201. Transportation Research Board, Washington, D.C., pp 48-62.
Brog, W., Meybourg, A.H. and Wermouth, M.J. (1983), "Development Survey Instruments Suitable for Determining Non-home Activity Patterns".Transportation Research Record 944, Washington, D.C., pp 1-12.
Brog W., Kurt, F., Katteler, H., Ssmmer, G., and Schwerter, B. (1985),"Selected Results of a Standardized Survey Instrument for Large-ScaleTravel Surveys in Several European Countries" In: E. Ampt, A.Richardson and W. Brog (Ed.) New Survey Methods in Transport. VNUScience Press, Utrecht, The Netherlands.
Brog, W., Meybourg, A.H., Stopher, P.R., and Wermouth, M.J. (1985),"Collection of Household Travel and Activity Data: Development of aSurvey Instrument". In: E. Ampt, A. Richardson and W. Brog (Ed.) NewSurvey Methods in Transport. VNU Science Press, Utrecht, TheNetherlands.
Cannell C.F.,Oksenberg, L., and Converse, J.M. (1977) Striving forResponse Accuracy: Experiments in New Interviewing Techniques. Journalof Marketing Research, 14, pp 306-315.
Clarke, M., Dix, M., and Jones, P. (1981) "Error and Uncertainty Travel Surveys" Transportation, i0, pp 105-126.
Clark, A. C. and Goldstucker, C. (1986) "Mail-Out/Mail-Back TravelSurvey in Houston, Texas". Transportation Research Record, 1097, pp 13-19.
Durand R.M., Guffey, H.J., and Planchon, J.M. (1983)the Random versus Non-Random Nature of Item Omissions"Marketing Research, 20, pp 305-313.
"An Examination ofJournal of
Forsyth J.B. (1977) "Obtaining Cooperation in a Survey of BusinessExecut&ves". Journal of Marketing Research, 14, pp 370-373.
Golob, T.F. and Golob, J.M. (1989) "Practical Consideration in theDevelopment of a Transit Users Panel". Paper presented at the

International Conference on Dynamic Travel behavior Analysis, KyotoUniversity, Kyoto, Japan, July 18-19, 1989.
Golob, T.F., and Meurs, H. (1986) "Biases in Response Over Time Seven-Day Travel Diaries". Transportation, 13, pp 163-181.
Golob, J.M., Screurs, L.J.M. and Smit, J.G. (1986) "The Design andPolicy Applications of a Panel for Studying Changes in Mobility overTime". In Behavioral Research for Transport Policy. VNU Science Press,Utrecht, The Netherlands, pp 97-116.
Goulias, K.G., Pendyala, R., Zhao, H. and Kitamura, R. (1989)"Telecommuting and Travel Demand: An Activity-Based Impact Assessment.Panel Survey Questionnaire Updating". Interim Report No. 2. ResearchReport, Transportation Research Group, University of California, Davis,CA. May 1989 (Prepared for the California State Department ofTransportation)
Hensher, D.A. (1985) "Longitudinal Surveys in Transport: An Assessment".In: E. Ampt, A. Richardson and W. Brog (Ed.) New Survey Methods Transport. VNU Science Press, Utrecht, The Netherlands.
Hensher, D.A. (1986) "Statistical Modeling of Discrete Choices Discrete Time with Panel Data". In Behavioral Research for TransportPolicy. VNU Science Press, Utrecht, The Netherlands. pp 97-116.
Hensher, D.A. (1987) "Issues in the Pre-Analysis of Panel Data".Transportation Research A, 21, pp 265-285.
Heathcote, E. (1983) "Survey Data Correction and Expansion: A CaseStudy". Paper Presented at the 2nd International Conference on NewSurvey Methods in Transport, Australia.
Herriot R.A.(1977) "Collecting Income Data on Sample Surveys: Evidencefrom Split-Panel Studies". Journal of Marketing Research, 14, pp 322-329.
Houston, J.P. (1981) Fundamentals of Learning and Memory. AcademicPress, New York.
Hunt S.D., Sparkman, R.D. and Wilcox, J.B (1982) "The Pretest in SurveyResearch: Issues and Preliminary Findings". Journal of MarketingResearch, 19, pp 269-273.
JALA Associates, Inc. (1989) "The State of California TelecommutingPilot Project: Midterm Report". Los Angeles, California.
Kalton, G. (1983a) "Compensating for missing survey data. SurveyResearch Center". Institute of Social Research. The University ofMichigan. Ann Arbor. Michigan.
Kalton, G. (1983b) Introduction to Survey Sampling. Sage Publications.Beverly Hills, CA.

Kitamura, R. and Box-y, P.H.L. (1987) "Analysis of attrition biases andtrip reporting errors for panel data". Transportation Research A, 21, pp287-302.
Kitamura, R. (1989) "Panel Analysis in Transportation Planning: Overview". Presented at the International Conference on Dynamic TravelBehavior Analysis, Kyoto University, Kyoto, Japan, July 18-19, 1989.
Kitamura, R., Nilles, J.M., Conroy, P., and Fleming, D.M. (1990a)"Telecommuting as a Transportation Planning Measure: Initial Results ofState of California Pilot Project". Paper presented at the 69th AnnualMeeting of the Transportation Research Board, January 7-11, 1990,Washington D.C.
Kitamura, R., Goulias, K.G., and Pendyala, R. (1990b) "Telecommuting andTravel Demand: An Impact Assessment for State of California TelecommutePilot Project Participants". Transportation Research Group, ResearchReport, UCD-TRG-RR-90-8. University of California, Davis, CA. (Preparedfor the California State Department of Transportation)
Madow W.G., Nisselson, H., and Olkin, I. (Ed.) (1983a) Incomplete in Sample Surveys, Vol. I. Academic Press. New York.
Madow W.G., Olkin, I., and Rubin, D.B. (Ed.) (1983b) Incomplete Data Sample Surveys, Vol. II. Academic Press. New York.
Mayer C.S. and Piper, C. (1982) "A Note on the Importance of Layout Self-Administered Questionnaires". Journal of Marketing Research, 19,pp 390-391.
McKenzie, J.R. (1977) "An Investigation into Interviewer Effects Market Research". Journal of Marketing Research, 14, pp 330-336.
Meurs, H.J., Visser, J., and van Wissen, L. (1989) "Measurement Error Panel Data". Transportation (forthcoming).
Murakami, E. and Watterson, T. (1989) "A Metropolitan Household PanelSurvey for Dynamic Travel Data". In Second Conference on Application ofTransportation Planning Methods, University of North Carolina atCharlotte, Charlotte NC.
O’Muircheartaigh, C.A. (1978) "Statistical Analysis in the Context Survey Research". In: Payne, C. and O’Muircheartaigh, C.A. (Ed.)Exploring Data Structures. John Wiley and Sons, New York.
Pas, E.I. (1986) "Multiday Samples, Parameter Estimation Precision, andData Collection Costs for Least Squares Regression Trip GenerationModels" Environment and Planning A, 16, pp 571-581.
Payne, C (1977) "The Preparation and Processing of Survey Data". Exploring Data Structures" In: O’Muircheartaigh, C.A. and Payne, C.),John Wiley and Sons, New York.

Pendyala, R., Zhao, H. and Kitamura, R. (1989) "Telecommuting and TravelDemand: An Activity-Based Impact Assessment. Baseline TravelCharacteristics". Interim Report No. i, Research Report UCD-TRG-RR-89-2,Transportation Research Group, University of California, Davis, CA. May1989 (Prepared for the California State Department of Transportation)
Pol van de, F. (1987) "Panel Sampling Designs" In Analysis of PanelData, Proceedings of the Round Table Conference on the LongitudinalTravel Study, Projectbureau Integrale Verkeers- en Vervoersstudies ,Ministrie van Verkeer en Waterstaat, The Hague, The Netherlands. pp 51-81.
Pressley, M.M. and Tullar, W.L. (1977) "A Factor InteractiveInvestigation of Mail Survey Response Rates From Commercial Population".Journal of Marketing Research, 14, pp 108-111.
Purvis, C. (1989) "Survey of Travel Surveys" In Second Conference Application of Transportation Planning Methods, University of NorthCarolina at Charlotte, Charlotte, NC.
Reingen P.H. and Kernan, J.B. (1977) "Compliance with an InterviewRequest: A foot-in-the-Door, Self-Perception Interpretation". Journalof Marketing Research, 14, pp 365-369.
Rizvi, M.H. (1983) "Hot-Deck Procedures: Introduction". In: W.G. Madowand I. Olkin (Ed.) Incomplete Data in Sample Surveys, Vol. III.Academic Press, New York.
Rubin, D.B. (1987) "Multiple Imputation for Nonresponse in Surveys".John Wiley and Sons, New York.
Sheskin, M. F. and Stopher, P.R. (1982) "Pilot Testing of AlternativeAdministrative Procedures and Survey Instruments" TransportationResearch Record 887, Washington D.C.
Stopher P.R. and Meybourg, A.H. (1979) Survey Sampling and MultivariateAnalysis for Social Scientists and Engineers. D.C. Heath, Lexington, MA.
Supernak, J. and Kitamura, R. (1989) "The reversible Car Pool Lanes San Diego: Perception and Reality". Paper presented at the 5th WorldConference on Transport Research. Yokohama, Japan.
Walsh T.C. (1977) "Selected Results from the 1972-73 Diary Surveys"Journal of Marketing Research, 14, pp 344-352.
Wermuth, M.J. (1979) "Effects of Survey Methods and MeasurementTechniques on the Accuracy of Household Travel-Behavior Studies". In:Stopher, P.R. and Meybourg, A.H.(Ed.) New Horizons in Travel-BehaviorResearch. D.C. Heath, Lexington. MA. pp 523-541.
Wiseman F, Schaffer, M. and Schafer, R. (1983) "An Experimental Test the Effects of a Monetary Incentive on Cooperation Rates and DataCollection Costs in Central Location Interviewing". Journal ofMarketing Research, 20, pp 112-123.

Wissen, L.J.G. van, and Meurs, H.J. (1989) "The Dutch Mobility Panel:Experiences and Evaluation". Transportation (forthcoming).
Yu J. and Cooper, H. (1983) "A Quantitative Review of Research DesignEffects on Response Rates to Questionnaires". Journal of MarketingResearch, 20, pp 36-44.

Table i
Number of Wave-i Participants by Group
StayersDropouts
Employees
Telecom. Control
Household Members
66 5733 45
Atr.Rate (%) 44
Atr. Rate - Attrition rate in percentage
Telecom. Control Total
39 32 19431 61 170
44 66 47

Table 2
Number of Wave-i Total Trips per Day by Group
EmployeesF
Telecom. Control
Stayers 3.90 4.39Dropouts 3.88 3.32
Difference -0.02 -i.07
Household MembersWeighted
Telecom. Control Average
4.27 3.42 4.042.96 3.06 3.27
-1.31 -0.36 -0.77

Table 3
Number of Wave-i Trips per Day by Purpose
Employees Household MembersWeighted
Telecom. Control Telecom. Control Average
Work Stayers i.ii 1.14 0.88 0.72 1.01Dropouts 1.22 0.97 0.57 0.69 0.84
Difference 0.Ii -0.17 -0.31 -0.03 -0.17
Home Stayers 1.23 1.32 1.13 1.05 1.21Dropouts 1.38 1.06 1.16 1.06 1.14
Difference 0.15 -0.26 0.03 0.01 -0.07
Other Stayers 1.57 1.91 2.25 1.65 1.82Dropouts 1.28 1.28 1.22 1.31 1.28
Difference -0.29 -0.63 -1.03 -0.34 -0.54

Table 4
Comparison of Missing and Inconsistent Information Between Waves forSelected Trip Characteristics
Wave I Wave 2
Number of Trips 2350Origin Base 24 (1.0%)Destination Base 41 (1.7%)Reported Trip Length 127 (5.4%)Trip Duration 91 (3.9%)Trip Purpose 56 (2.4%)Odometer Readings 457 (19.4%)
195316 (0.8%)25 (1.3%)25 (1.3%)64 (3.2%)3O (1.5%)
294 (15.0%)

Table 5
Trips Reported by Day
Day i Day 2 Day 3a b c
EmployeesT/C Wave i (63) 4.00 4.14 3.59
Wave 2 (60) 3.23 3.25 2.62
a-b a-c b-c
-0.14 0.41 0.56-0.02 0.62 0.63a
Control Wave i (50) 4.56 4.34 4.10Wave 2 (47) 3.96 4.11 3.85
0.22 0,46 0.24-0.15 0.ii 0.26
Household MembersT/C Wave i (39) 4.59 3.64 4.54
Wave 2 (34) 3.35 3.24 2.680.95 a 0.05 -0.900.12 0.68 0.56
Control Wave i (32) 4.63 3.06Wave 2 (26) 3.50 3.54
Average Wave i (184) 4.39 3.90Wave 2 (167) 3.50 3.53
2.56 1.56 a 2.06 a 0.503.42 -0.04 0.08 0.12
3.75 0.48 a 0.64 a 0.153.10 -0.03 0.40 0.43a
_. --.. ------4"" - ....
T/C = TelecommutersControl = Control Group Membersasignificant at the 5% level

Table 6
Number of Respondents by Trip Non-Reporting Days
Employees T/C Wave iWave 2
Control Wave iWave 2
Household T/C Wave iMembers Wave 2
Control Wave iWave 2
T/C = TelecommutersControl = Control Group Members
No. of Non-Reporting Days
0 I 2 Total
59 2 2 6342 12 6 60
47 3 0 5046 i 0 47
32 6 i 3924 6 4 34
26 4 2 3220 3 3 26
.......... ~,, , |

¯ ,’i
" III|1
t
RECEIVED FEB 8 1!83
State TelecommutePilot Project
Baseline ¯ January 27/28/29, 1988
I.D. Code: h ¯
Fig. la
Cover
State TelecommutePilot Project
Tellecommu~er
Personal Travel Log
I.D. Code:
Diary Starting Date ,1989
Fig.lb
Cover

- o~"
P rs n OBaseline: January, 1988
Name: ;,~-~ ¯ ’ ~,,~,.~ ~.~r
AgI:.E’~ I.D. Code:..," .~_. -.., .....
Home Location:,.: ~ ;,=r~’~,-".;;
Work Location: /./ o,v~-. L34",~’/
School Location: .,~d"’F"MA./Om C,110¢’~ ~ CITf
Other Frequent Locations:
M~lO,t C,tOJ~ .t’13ty2~ C[T7
MAJO/* CIt.O.~ .,¢’r,u_.KT$ CITY
Vehicle 4:yL4~. MPG. /4001"I
Mass Transit Co. "1":,vAj, t ~
Mass Transit Co. "2":.’(,U4
Fig. 2a
First Page

1989 Pcrsonn! Travel LogName:
F/r~ M~d_le Last
Age:
Gender:. [] Male [] Female
Are you currently employed?
[] Full Time [] P~ Tune [] Not Employed
If employed (and not a pilot projectparticipant), what is your occupation?
Were you employed at the time of thefirst survey in 1988?
[] FuLl time [] Pan Time [] Not Employed[] Not Surveyed
Home Location:
Work Location:Major Cross Streets City
Major Cross Streets CitySchool Location:
Major Cross Streets CityOther Frequent Locations:
"A"
Major Cross Streets City
"a"
Major Cross Streets CityRelation to State Employee:
Spouse. Son, Daughter, etcEmployee’s agency:
Vehicle 1:
Vehicle 2:..
Vehicle 3:
Year, Make, Model
Year, Make, Model
Year, Make. ModelVehicle 4:
Year, Make, ModelMass Transit Co. "1":
Name
Mass Transit Co. "2":Name
Fig. 2b
First Page

I--I’*w:ONmm3AYI--1T.tmS)AY ~ mO.,,.Y
, ~ ,t.- ~ . ,
COK~UAllON OF ~ TI~P~ [] YES (~e ~ Tri:
ONo
[] OTHER LOCATIOH:
Uo0E OF TRk’,LS~RTA’nON: ["/}PFJ~SONXL VE].,CL£ # ~ .p [~ MASTS TRN~ISlT CO. # __ , BEGIN ODOMETER: ".~ .
UNE I - , ENDING ODOMETER:
¯ NUMBER OF PASSENGERS:
[-’]OTHER
APPROX. LENGTH OF T/~P:. ~" MILES:’o’, ~,
,APPROX. % (by disumct) OF THE TRIP TRAVELED ON THE FREEWAY:
TRIP PURPOSE:
~] COMMUTE TO / FROM WORK [] VISIT FRIEND / RELATION |J
[] o’mER WORK.RE~TEO[] EAT ~EAL {/
[] COMMUTE TO,’ FROM SCHOOL[] ME01CAL / OENTAL it
[] SHOPPING [] RECREATION i[] PERSONAL BUSINESS [] OTHER
[] TRANSPORT CHILD dsa.,,:o.. ~r c~. t-rcj
Fig. 3a
Travel Log

TODAY I AM:
[] Home T©lecommudng [] Sa~ellim Telecommudng
[] Woddng ~ Main Offi~ [] Not Working [] N/A
DAY: [] Monday [] Tuesday
[] Wednesday [] Thursday [] F’rida~
’BEGINNING TIME OF TRIP:
O,m []ORIGIN OF TRIP: [] Home [] Work
[] School [] Other location:(LeJter ID or Major Cross S~ee~s, City,
BEGh~qING ODOMETER:D( Personal velu’cle use only .
MODE OF TRANSPORTATION:[] Personal Vehicle #
[] Mass Transit Co. # __ Line #__
[] Walk [] Bike [] Car/Vanpool Passengers[] Other
(specify)
NUMBER OF PASSENGERS:(Do not Include driver)
TRIP PURPOSE:
[] Change Mode ["]Transport Child[] Going Back Home (school, day care, etc
[] Commute to Work/Satellite [] Serve/Pick Up Psgrs.[] Other Work-Related [] Social/Recreation[] Commute to School [] Eat Meal[] Shopping [] Medical/Dental[] Personal Business [] Other
ENDING TLME OF TRIP:__.Hr. Min. [] am [] pm
DESTINATION OF TRIP: [] Home [] Work[] School [] Other Loca~on:
(Letter 1£) or Major Cross Streets, City)
ENDING ODOMETER: ~-]( Personal vehicle use only ¯
Please Indicate AFproximate Length of Trip:__ (miles)And, Freeway%
Fig. 3b
Travel Log


