Embed Size (px)
Citation preview
Repeatedly Evolved Host-Specific Ectosymbiosesbetween Sulfur-Oxidizing Bacteria and AmphipodsLiving in a Cave EcosystemJan Bauermeister1, Alban Ramette2, Sharmishtha Dattagupta1*
1 Geomicrobiology and Symbiosis Group, Courant Research Center Geobiology, University of Gottingen, Gottingen, Germany, 2 HGF-MPG Group for Deep-Sea Ecology
and Technology, Max Planck Institute for Marine Microbiology, Bremen, Germany
Abstract
Ectosymbioses between invertebrates and sulfur-oxidizing bacteria are widespread in sulfidic marine environments andhave evolved independently in several invertebrate phyla. The first example from a freshwater habitat, involving Niphargusictus amphipods and filamentous Thiothrix ectosymbionts, was recently reported from the sulfide-rich Frasassi caves in Italy.Subsequently, two new Niphargus species, N. frasassianus and N. montanarius, were discovered within Frasassi and found toco-occur with N. ictus. Using a variety of microscopic and molecular techniques, we found that all three Frasassi-dwellingNiphargus species harbor Thiothrix ectosymbionts, which belong to three distinct phylogenetic clades (named T1, T2, andT3). T1 and T3 Thiothrix dominate the N. frasassianus ectosymbiont community, whereas T2 and T3 are prevalent on N. ictusand N. montanarius. Relative distribution patterns of the three ectosymbionts are host species-specific and consistent overdifferent sampling locations and collection years. Free-living counterparts of T1–T3 are rare or absent in Frasassi cavemicrobial mats, suggesting that ectosymbiont transmission among Niphargus occurs primarily through inter- or intraspecificinoculations. Phylogenetic analyses indicate that the Niphargus-Thiothrix association has evolved independently at least twotimes. While ectosymbioses with T1 and T2 may have been established within Frasassi, T3 ectosymbionts seem to have beenintroduced to the cave system by Niphargus.
Citation: Bauermeister J, Ramette A, Dattagupta S (2012) Repeatedly Evolved Host-Specific Ectosymbioses between Sulfur-Oxidizing Bacteria and AmphipodsLiving in a Cave Ecosystem. PLoS ONE 7(11): e50254. doi:10.1371/journal.pone.0050254
Editor: Matthias Horn, University of Vienna, Austria
Received July 23, 2012; Accepted October 17, 2012; Published November 29, 2012
Copyright: � 2012 Bauermeister et al. This is an open-access article distributed under the terms of the Creative Commons Attribution License, which permitsunrestricted use, distribution, and reproduction in any medium, provided the original author and source are credited.
Funding: This study was funded by the German Initiative of Excellence and by the Max Planck Society. Fieldwork was financially supported by the NationalGeographic Committee for Research & Exploration (grant 8387-08 to SD). The funders had no role in study design, data collection and analysis, decision topublish, or preparation of the manuscript. This is contribution number 103 from the Courant Research Centre Geobiology of the University of Gottingen.
Competing Interests: The authors have declared that no competing interests exist.
* E-mail: [email protected]
Introduction
Symbioses are vital for virtually all living organisms. They were
critical for the origin and diversification of Eukaryotes and remain
a major driving force in evolution, as they induce diverse
physiological, morphological, and developmental modifications
in the species involved [1]. Symbioses between invertebrates and
chemosynthetic (e.g. sulfur- or methane-oxidizing) bacteria are of
particular ecological importance in the marine environment,
where they have evolved independently in at least seven metazoan
phyla [2]. Many invertebrates living in sulfide-rich marine
habitats, such as close to deep-sea hydrothermal vents, cold seeps,
and in organic-rich coastal sediments, harbor sulfur-oxidizing
bacteria on their body surfaces [2–3]. Although the animals are
exposed to diverse free-living microbial communities and therefore
susceptible to colonization by many opportunistic, non-specific
surface-dwellers [4], many of them have established long-term and
specific relationships with only few selected sulfur-oxidizing
bacteria [5–10]. Most of these ectosymbionts belong to distinct
groups within the epsilon- and gammaproteobacterial subdivi-
sions. In particular, bacteria within the families Thiovulgaceae and
Thiotrichaceae seem to have evolved an enhanced ability to
establish ectosymbioses [3].
Thiothrix bacteria (family Thiotrichaceae) have been found as
ectosymbionts on the marine amphipod Urothoe poseidonis [11] and
on the freshwater amphipod Niphargus ictus [12]. The latter lives in
sulfide-rich waters of the Frasassi caves (central Italy), which have
been formed by sulfuric acid-driven limestone dissolution and
contain an underground ecosystem sustained by chemoautotrophy
[13]. Thick mats of filamentous sulfur-oxidizing epsilon- and
gammaproteobacteria cover many of the cave water bodies [14–
15]. Thiothrix are abundant in these microbial mats, but the
ectosymbionts of N. ictus are distinct from most of the Thiothrix
bacteria found in the free-living communities [12].
At the time this symbiosis was discovered, N. ictus was reported
to be the only amphipod species inhabiting the Frasassi cave
ecosystem [13,16]. However, subsequent molecular and morpho-
logical investigations revealed the presence of two additional
species [17], which were named Niphargus frasassianus and Niphargus
montanarius [18]. Phylogenetic analyses suggested that the three
Niphargus species most likely invaded the cave system indepen-
dently [17]. N. frasassianus and N. montanarius have so far never been
observed to co-occur, but each of them has been found in
sympatry with N. ictus at some locations within the Frasassi caves.
Host-related factors are considered to play a decisive role in
ectosymbiont selection and maintenance [19–20]. It has recently
been shown that stilbonematid nematodes of two different genera
PLOS ONE | www.plosone.org 1 November 2012 | Volume 7 | Issue 11 | e50254
living together in the same coastal marine sediments harbor
distinct bacterial ectosymbiont phylotopes [10]. The Niphargus
assemblage in Frasassi provided an opportunity to examine
ectosymbiont specificity within partially sympatric, heterospecific
members of the same invertebrate genus. In this study, all three
Frasassi-dwelling Niphargus species were examined for Thiothrix
ectosymbionts using a combination of Scanning Electron Micros-
copy (SEM), 16S rDNA sequencing, Fluorescence In Situ
Hybridization (FISH), Automated Ribosomal Intergenic Spacer
Analysis (ARISA), and nested-PCR. FISH was further used to
inspect Frasassi microbial mats for free-living counterparts of the
symbionts, and nested-PCR assays served for detecting symbiont
dispersal cells. We report on three distinct Thiothrix ectosymbionts
that are partially shared but yet distributed in a host species-
specific manner among the Niphargus.
Materials and Methods
Sample collection & Niphargus species identificationNiphargus specimens were collected in January and May–June
2008, May–June 2009, July and October 2010, and March 2011
from within the Frasassi Grotta Grande del Vento-Grotta del
Fiume complex at eight different cave locations (Il Bugianardo
(BG), Grotta Sulfurea (GS), Sorgente del Tunnel (ST), Grotta
Bella (GB), Lago Verde (LV), Pozzo dei Cristalli (PC), Ramo
Sulfureo (RS), and Lago Claudia (LC); Figure 1). All sites were
accessed via technical spelunking routes.
Niphargus species were determined in the field based on
morphological characters described in [17] and [18]. Individuals
were caught using small fishing nets and forceps as appropriate.
Specimens for SEM were collected into falcon tubes filled with
cave water. They were later transferred to individual eppendorf
tubes filled with a 2.5% glutaraldehyde solution made either in
phosphate buffered saline (PBS) or in filter-sterilized cave water,
and stored at 4uC until analysis. Samples for clone library
construction, FISH, ARISA, and nested-PCR assays were
collected into individual eppendorf tubes filled with RNAlaterH(Ambion/Applied Biosystems, Foster City, CA, USA) and stored
at 220uC until further analysis.
Microbial mat samples were obtained from Frasassi cave
locations GS, ST, GB, PC, and RS in May–June 2009, and from
locations Cave Spring (CS), GB, and RS in October 2011. They
were collected into falcon tubes using sterile pipettes, preserved in
4:1 parts of RNAlaterH within 4 h of collection, and stored at
220uC until analysis.
Scanning Electron Microscopy (SEM)Two N. frasassianus individuals (locations GB and PC, June
2009), nine N. ictus individuals (location BG, June 2009 (16),
October 2010 (56); location LC, May 2009 (16); location LV, July
2010 (26)), and one N. montanarius individual (location BG, June
2009) were investigated for Thiothrix epibionts using SEM. Whole
specimens were sequentially dehydrated in ethanol concentrations
from 30% to 90%, with a final dehydration in hexamethyldisila-
zane (SIGMA-ALDRICH, Munich, Germany) for 5–10 min.
They were mounted on carbon-coated aluminum sample holders,
sputtered with gold-palladium (11 nm thickness), and examined
with a LEO 1530 GEMINI field emission SEM (Zeiss, Gottingen,
Germany).
DNA extractionNiphargus appendages (legs and antennae) were dissected under a
stereomicroscope. DNA extracts of Niphargus specimens collected
in 2008 had previously been obtained from only two legs per
individual (one gnathopod and one pereopod; cf. [17]). In order to
increase the chance of gathering DNA from Thiothrix bacteria
associated with Niphargus, DNA extractions for specimens collected
from 2009 to 2011 were conducted with all appendages on one
side of the Niphargus body. All extractions were performed using
the DNeasy Blood & Tissue Kit (QIAGEN, Hilden, Germany),
following the manufacturer’s instructions (starting with an
overnight treatment with Proteinase K, followed by DNA
precipitation and purification). Microbial mat DNA was extracted
using the PowerSoil DNA Isolation Kit (MO BIO Laboratories,
Carlsbad, CA, USA) according to the manufacturer’s instructions.
16S rDNA sequencing16S rDNA clone libraries were obtained from five N. frasassianus
samples (location GB, June 2008; location PC, May 2008; location
RS, June 2008, May 2009; location ST, May 2009), two N. ictus
samples (location BG, January 2008; location LC, May 2009), two
N. montanarius samples (location BG, January 2008, June 2008),
and one Frasassi microbial mat sample (location ST, May 2009).
DNA was PCR-amplified using the bacterial domain-specific
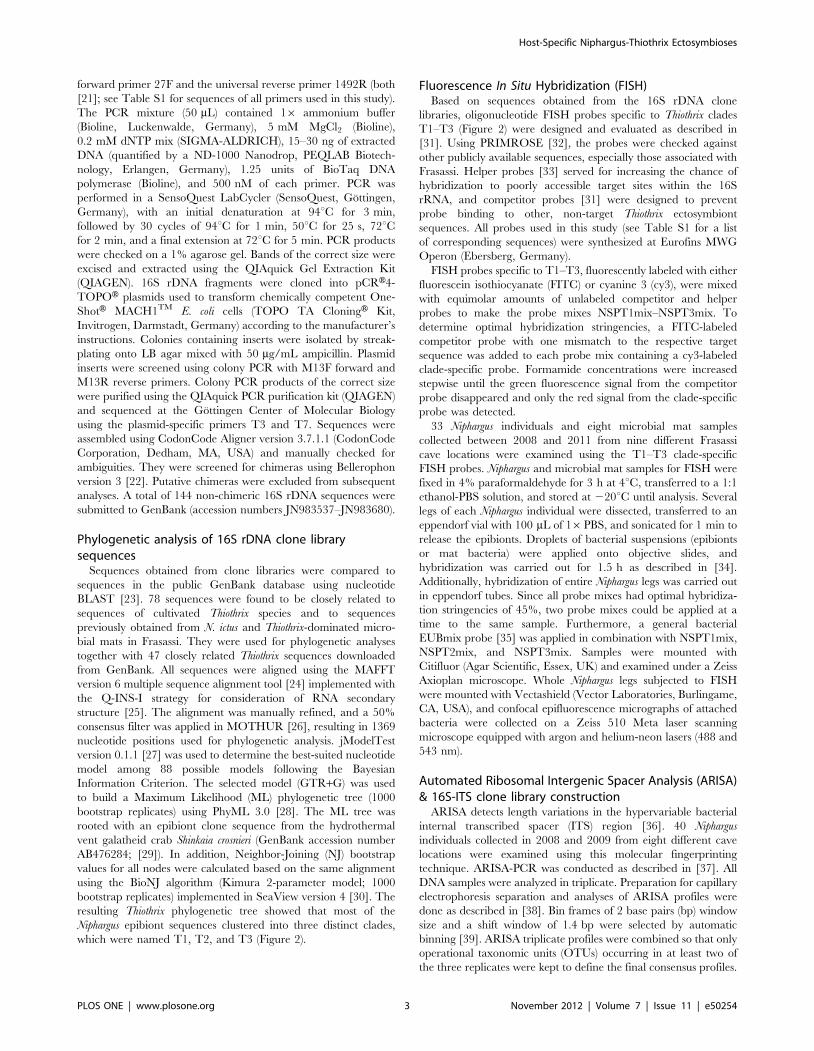
Figure 1. Map of the Grotta Grande del Vento-Grotta del Fiumecomplex of the Frasassi caves. Black circles in main map marksample collection sites. Geochemistry data have been reported earlierby [17]. Predominant biofilm clade determinations are based on FISHresults [15], except for those marked with *, which were identifiedbased on morphology [14]. bdl = below detection limit. Base mapcourtesy of the Gruppo Speleologico CAI di Fabriano.doi:10.1371/journal.pone.0050254.g001
Host-Specific Niphargus-Thiothrix Ectosymbioses
PLOS ONE | www.plosone.org 2 November 2012 | Volume 7 | Issue 11 | e50254
forward primer 27F and the universal reverse primer 1492R (both
[21]; see Table S1 for sequences of all primers used in this study).
The PCR mixture (50 mL) contained 16 ammonium buffer
(Bioline, Luckenwalde, Germany), 5 mM MgCl2 (Bioline),
0.2 mM dNTP mix (SIGMA-ALDRICH), 15–30 ng of extracted
DNA (quantified by a ND-1000 Nanodrop, PEQLAB Biotech-
nology, Erlangen, Germany), 1.25 units of BioTaq DNA
polymerase (Bioline), and 500 nM of each primer. PCR was
performed in a SensoQuest LabCycler (SensoQuest, Gottingen,
Germany), with an initial denaturation at 94uC for 3 min,
followed by 30 cycles of 94uC for 1 min, 50uC for 25 s, 72uCfor 2 min, and a final extension at 72uC for 5 min. PCR products
were checked on a 1% agarose gel. Bands of the correct size were
excised and extracted using the QIAquick Gel Extraction Kit
(QIAGEN). 16S rDNA fragments were cloned into pCRH4-
TOPOH plasmids used to transform chemically competent One-
ShotH MACH1TM E. coli cells (TOPO TA CloningH Kit,
Invitrogen, Darmstadt, Germany) according to the manufacturer’s
instructions. Colonies containing inserts were isolated by streak-
plating onto LB agar mixed with 50 mg/mL ampicillin. Plasmid
inserts were screened using colony PCR with M13F forward and
M13R reverse primers. Colony PCR products of the correct size
were purified using the QIAquick PCR purification kit (QIAGEN)
and sequenced at the Gottingen Center of Molecular Biology
using the plasmid-specific primers T3 and T7. Sequences were
assembled using CodonCode Aligner version 3.7.1.1 (CodonCode
Corporation, Dedham, MA, USA) and manually checked for
ambiguities. They were screened for chimeras using Bellerophon
version 3 [22]. Putative chimeras were excluded from subsequent
analyses. A total of 144 non-chimeric 16S rDNA sequences were
submitted to GenBank (accession numbers JN983537–JN983680).
Phylogenetic analysis of 16S rDNA clone librarysequences
Sequences obtained from clone libraries were compared to
sequences in the public GenBank database using nucleotide
BLAST [23]. 78 sequences were found to be closely related to
sequences of cultivated Thiothrix species and to sequences
previously obtained from N. ictus and Thiothrix-dominated micro-
bial mats in Frasassi. They were used for phylogenetic analyses
together with 47 closely related Thiothrix sequences downloaded
from GenBank. All sequences were aligned using the MAFFT
version 6 multiple sequence alignment tool [24] implemented with
the Q-INS-I strategy for consideration of RNA secondary
structure [25]. The alignment was manually refined, and a 50%
consensus filter was applied in MOTHUR [26], resulting in 1369
nucleotide positions used for phylogenetic analysis. jModelTest
version 0.1.1 [27] was used to determine the best-suited nucleotide
model among 88 possible models following the Bayesian
Information Criterion. The selected model (GTR+G) was used
to build a Maximum Likelihood (ML) phylogenetic tree (1000
bootstrap replicates) using PhyML 3.0 [28]. The ML tree was
rooted with an epibiont clone sequence from the hydrothermal
vent galatheid crab Shinkaia crosnieri (GenBank accession number
AB476284; [29]). In addition, Neighbor-Joining (NJ) bootstrap
values for all nodes were calculated based on the same alignment
using the BioNJ algorithm (Kimura 2-parameter model; 1000
bootstrap replicates) implemented in SeaView version 4 [30]. The
resulting Thiothrix phylogenetic tree showed that most of the
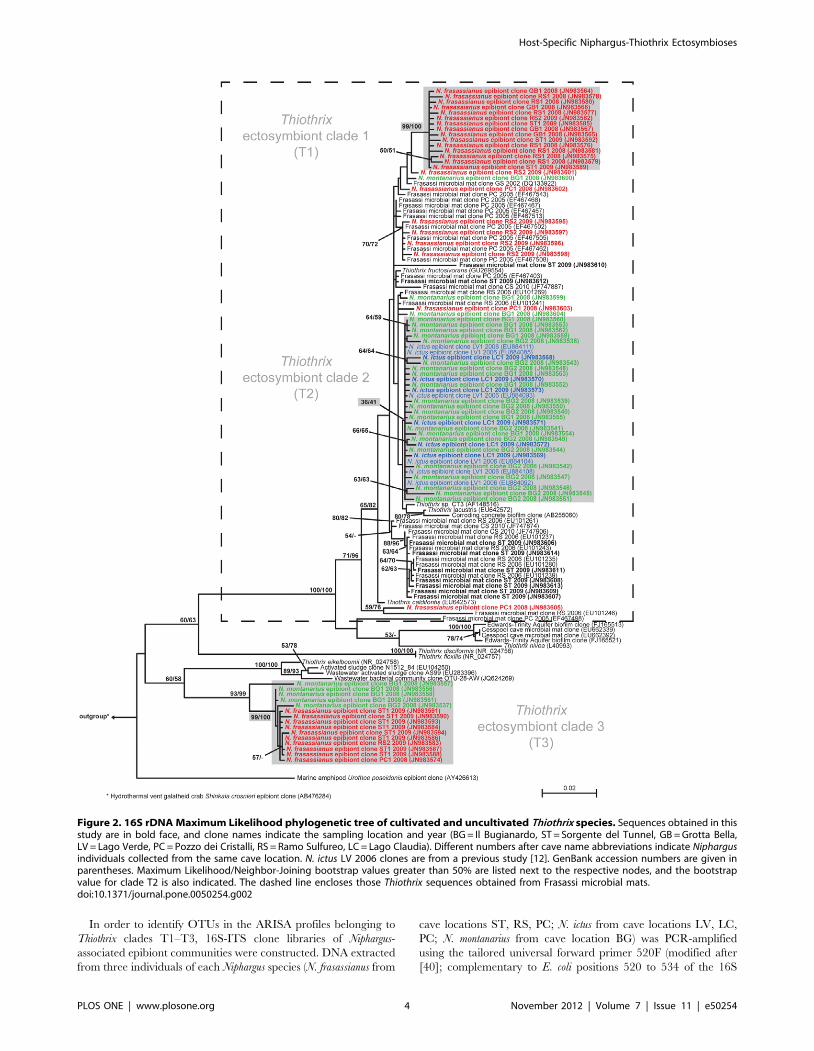
Niphargus epibiont sequences clustered into three distinct clades,
which were named T1, T2, and T3 (Figure 2).
Fluorescence In Situ Hybridization (FISH)Based on sequences obtained from the 16S rDNA clone
libraries, oligonucleotide FISH probes specific to Thiothrix clades
T1–T3 (Figure 2) were designed and evaluated as described in
[31]. Using PRIMROSE [32], the probes were checked against
other publicly available sequences, especially those associated with
Frasassi. Helper probes [33] served for increasing the chance of
hybridization to poorly accessible target sites within the 16S
rRNA, and competitor probes [31] were designed to prevent
probe binding to other, non-target Thiothrix ectosymbiont
sequences. All probes used in this study (see Table S1 for a list
of corresponding sequences) were synthesized at Eurofins MWG
Operon (Ebersberg, Germany).
FISH probes specific to T1–T3, fluorescently labeled with either
fluorescein isothiocyanate (FITC) or cyanine 3 (cy3), were mixed
with equimolar amounts of unlabeled competitor and helper
probes to make the probe mixes NSPT1mix–NSPT3mix. To
determine optimal hybridization stringencies, a FITC-labeled
competitor probe with one mismatch to the respective target
sequence was added to each probe mix containing a cy3-labeled
clade-specific probe. Formamide concentrations were increased
stepwise until the green fluorescence signal from the competitor
probe disappeared and only the red signal from the clade-specific
probe was detected.
33 Niphargus individuals and eight microbial mat samples
collected between 2008 and 2011 from nine different Frasassi
cave locations were examined using the T1–T3 clade-specific
FISH probes. Niphargus and microbial mat samples for FISH were
fixed in 4% paraformaldehyde for 3 h at 4uC, transferred to a 1:1
ethanol-PBS solution, and stored at 220uC until analysis. Several
legs of each Niphargus individual were dissected, transferred to an
eppendorf vial with 100 mL of 16PBS, and sonicated for 1 min to
release the epibionts. Droplets of bacterial suspensions (epibionts
or mat bacteria) were applied onto objective slides, and
hybridization was carried out for 1.5 h as described in [34].
Additionally, hybridization of entire Niphargus legs was carried out
in eppendorf tubes. Since all probe mixes had optimal hybridiza-
tion stringencies of 45%, two probe mixes could be applied at a
time to the same sample. Furthermore, a general bacterial
EUBmix probe [35] was applied in combination with NSPT1mix,
NSPT2mix, and NSPT3mix. Samples were mounted with
Citifluor (Agar Scientific, Essex, UK) and examined under a Zeiss
Axioplan microscope. Whole Niphargus legs subjected to FISH
were mounted with Vectashield (Vector Laboratories, Burlingame,
CA, USA), and confocal epifluorescence micrographs of attached
bacteria were collected on a Zeiss 510 Meta laser scanning
microscope equipped with argon and helium-neon lasers (488 and
543 nm).
Automated Ribosomal Intergenic Spacer Analysis (ARISA)& 16S-ITS clone library construction
ARISA detects length variations in the hypervariable bacterial
internal transcribed spacer (ITS) region [36]. 40 Niphargus
individuals collected in 2008 and 2009 from eight different cave
locations were examined using this molecular fingerprinting
technique. ARISA-PCR was conducted as described in [37]. All
DNA samples were analyzed in triplicate. Preparation for capillary
electrophoresis separation and analyses of ARISA profiles were
done as described in [38]. Bin frames of 2 base pairs (bp) window
size and a shift window of 1.4 bp were selected by automatic
binning [39]. ARISA triplicate profiles were combined so that only
operational taxonomic units (OTUs) occurring in at least two of
the three replicates were kept to define the final consensus profiles.
Host-Specific Niphargus-Thiothrix Ectosymbioses
PLOS ONE | www.plosone.org 3 November 2012 | Volume 7 | Issue 11 | e50254
In order to identify OTUs in the ARISA profiles belonging to
Thiothrix clades T1–T3, 16S-ITS clone libraries of Niphargus-
associated epibiont communities were constructed. DNA extracted
from three individuals of each Niphargus species (N. frasassianus from
cave locations ST, RS, PC; N. ictus from cave locations LV, LC,
PC; N. montanarius from cave location BG) was PCR-amplified
using the tailored universal forward primer 520F (modified after
[40]; complementary to E. coli positions 520 to 534 of the 16S
Figure 2. 16S rDNA Maximum Likelihood phylogenetic tree of cultivated and uncultivated Thiothrix species. Sequences obtained in thisstudy are in bold face, and clone names indicate the sampling location and year (BG = Il Bugianardo, ST = Sorgente del Tunnel, GB = Grotta Bella,LV = Lago Verde, PC = Pozzo dei Cristalli, RS = Ramo Sulfureo, LC = Lago Claudia). Different numbers after cave name abbreviations indicate Niphargusindividuals collected from the same cave location. N. ictus LV 2006 clones are from a previous study [12]. GenBank accession numbers are given inparentheses. Maximum Likelihood/Neighbor-Joining bootstrap values greater than 50% are listed next to the respective nodes, and the bootstrapvalue for clade T2 is also indicated. The dashed line encloses those Thiothrix sequences obtained from Frasassi microbial mats.doi:10.1371/journal.pone.0050254.g002
Host-Specific Niphargus-Thiothrix Ectosymbioses
PLOS ONE | www.plosone.org 4 November 2012 | Volume 7 | Issue 11 | e50254
rRNA) and the bacterial domain-specific reverse primer ITSReub
([41]; complementary to E. coli positions 23 to 37 of the 23S
rRNA). The PCR mixture (50 mL) contained 16 PCR buffer
(Promega, Madison, WI, USA), 1.5 mM MgCl2 (Promega),
0.25 mM dNTP mix (Promega), 1.5 mL bovine serum albumine
(3 mg/mL), 20–25 ng of extracted DNA (quantified by a ND-1000
Nanodrop, PEQLAB), 2.5 units of GoTaq DNA polymerase
(Promega), and 400 nM of each primer. PCR conditions were as
follows: initial denaturation at 94uC for 3 min, followed by 30
cycles of 94uC for 45 s, 57uC for 45 s, 72uC for 90 s, and a final
extension at 72uC for 5 min.
For each PCR, we used a set of three-nucleotide tags conjugated
with the 59 ends of forward and reverse primers in order to use the
mark–recapture cloning method [42]. PCR products from
individuals of the same Niphargus species were pooled before
cloning, and the 59 tags enabled identification of the Niphargus
individual from which the respective sequence was obtained.
Partial 16S-ITS sequences were assembled and manually checked
for ambiguities with CodonCode Aligner version 3.7.1.1, and were
submitted to Genbank (accession numbers JQ217431–JQ217456).
ITS sequences belonging to Thiothrix clades T1–T3 were identified
based on the adjoining 16S rDNA partial sequences, and their
lengths were determined as distances between the target sites of the
ARISA-PCR forward and reverse primers.
Statistical analysesTaking only the ARISA OTUs corresponding to T1–T3
Thiothrix into consideration, pairwise similarities among Niphargus
samples were calculated based on the Bray-Curtis index of
dissimilarity [43]. The resulting matrix was used to examine
patterns in Thiothrix distribution among the three Niphargus hosts
via Non-Metric Multidimensional Scaling (NMDS). NMDS places
all samples in a two-dimensional coordinate system so that the
ranked dissimilarities between the samples are preserved, and a
stress function measures how well the original ranked distances fit
into the reduced ordination space [44]. Analyses of similarities
(ANOSIM) were performed to test for significant differences
between predefined groups of samples (here N. frasassianus, N. ictus,
and N. montanarius) using 1000 Monte-Carlo permutation tests.
The resulting test statistic R indicates the degree of separation,
ranging from 0 (no separation) to 1 (complete separation). As
multiple comparisons were performed, significant ANOSIM R
values were identified at the Bonferroni-corrected level (p,0.05/k,
with k = n(n21)/2, k representing the number of pair-wise
comparisons between n samples). All analyses were implemented
within the statistical R environment [45] using the vegan package
[46] and custom R scripts [39].
Nested-PCR assaysPCR primers specific to Thiothrix clades T1–T3 (Table S1) were
designed based on the corresponding 16S-ITS sequences and used
to screen 40 Niphargus individuals collected in 2008 and 2009 from
eight different cave locations and all eight microbial mat samples
previously investigated with FISH. A nested-PCR approach was
used to increase the sensitivity of the screenings (Figure S1). In a
first PCR round, bacterial 16S rDNA and ITS sequences were
amplified by using the bacterial domain-specific primers 27F and
ITSReub. Using the products of the first PCR as templates, a
second PCR round was performed using either the Thiothrix-
specific forward primer THIO714F or the clade-specific forward
primers T2_1246F and T3_841F, as appropriate, in combination
with clade-specific ITS reverse primers.
Nested-PCR was also applied to obtain partial 16S sequences of
those free-living Thiothrix bacteria previously marked by the T2-
specific FISH probe NSPT2 and to compare them with T2
sequences in 16S clone libraries of N. ictus and N. montanarius.
Again using products of the first PCR round as templates, a third
PCR was performed with Frasassi microbial mat samples collected
in 2011 using the bacterial domain-specific forward primer 27F in
combination with the clade T2-specific 16S reverse primer
T2_1244R (whose sequence was congruent with that of FISH
probe NSPT2).
PCR mixtures (20 mL) contained 16 ammonium buffer (Bio-
line), 2 mM MgCl2 (Bioline), 0.2 mM dNTP mix (Bioline), 2 mL of
DNA extract (5–15 ng/mL; for the first PCR) or 2 mL of first PCR
products (for the second and third PCR), 0.5 units of BioTaq DNA
polymerase (Bioline), and 500 nM of each primer. PCR cycling
conditions were identical with those used for 16S rDNA clone
library construction, except for a primer annealing temperature of
56uC for the second and third PCR rounds. PCR products were
checked on a 1% agarose gel, and bands of the expected size were
excised and purified using the QIAquick Gel Extraction Kit
(QIAGEN). Purified products were sequenced as described above.
PCR sequences were compared with T1, T2, and T3 sequences
previously obtained from 16S rDNA and 16S-ITS clone libraries
and submitted to GenBank (accession numbers JX435482–
JX435601).
16S rDNA clone libraries of N. ictus did not contain any
sequences that clustered within Thiothrix clade T3 (Figure 2).
However, T3 Thiothrix were detected on N. ictus individuals using
FISH, ARISA, as well as PCR screenings followed by sequencing.
In order to compare T3 sequences between the three Niphargus
species, a second phylogenetic tree was constructed using the
portion of the 16S rDNA sequences amplified by the T3-clade
specific primers (Figure S2).
Results and Discussion
Diversity of Thiothrix ectosymbionts of Frasassi-dwellingNiphargus species
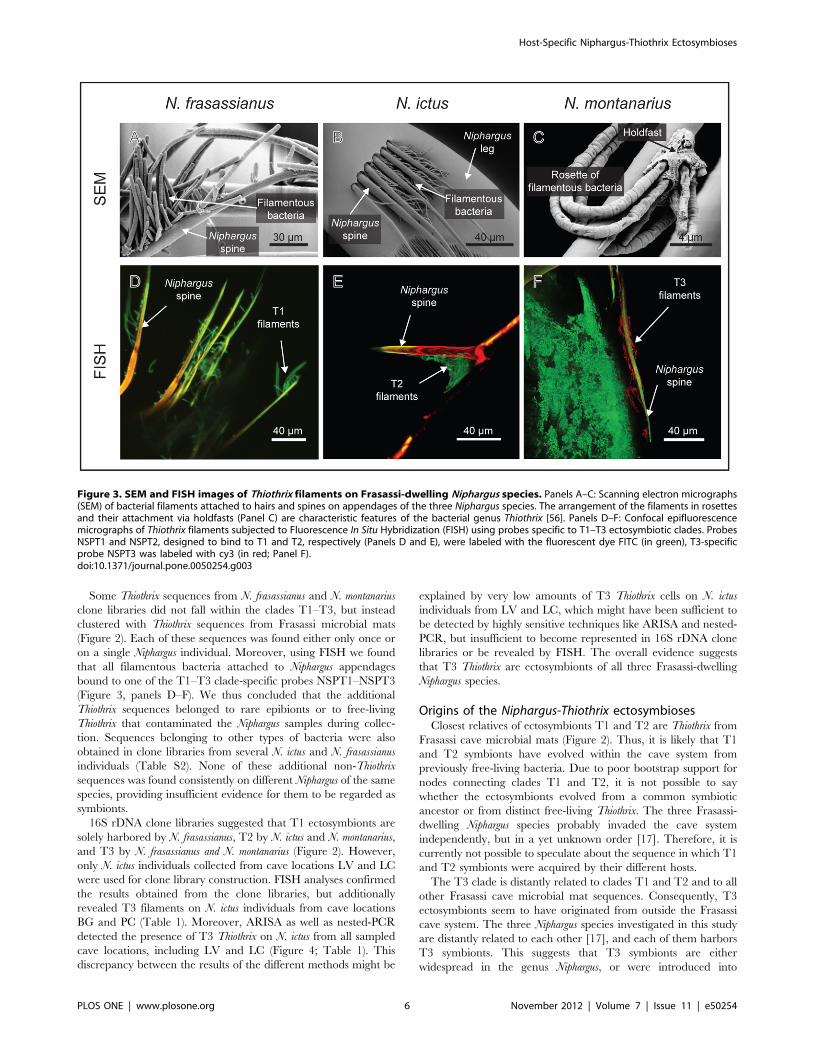
The Frasassi-dwelling Niphargus were found to be associated with
a bacterial epibiont community dominated by Thiothrix. SEM
examination revealed that individuals of all three Niphargus species
harbored filamentous bacteria which were attached via holdfasts
to hairs and spines on the hosts’ legs and antennae (Figure 3). The
quantity of filaments varied between individual hosts. While both
examined N. frasassianus specimens and the only inspected N.
montanarius individual harbored abundant, long bacterial filaments
often arranged in rosettes (Figure 3, panels A and C), three out of
nine investigated N. ictus individuals carried only very few, solitary
filaments.
Eight out of the nine 16S rDNA clone libraries constructed from
Niphargus individuals contained Thiothrix sequences in different
percentages (N. frasassianus from GB 27%, from PC 24%, from RS
70% and 54%, from ST 92%; N. ictus from BG 0%, from LC 60%;
N. montanarius from BG 100% and 100%). A majority of these
Thiothrix sequences (84%) clustered into three different phyloge-
netic clades, referred to as T1, T2, and T3 (Figure 2). Clade T1,
supported by a 99% ML bootstrap value, contained only Thiothrix
sequences obtained from N. frasassianus. Clade T2 (bootstrap value
36) was formed by Thiothrix sequences from N. ictus individuals
analyzed in the present as well as in a previous study [12] and by
sequences obtained from N. montanarius. Clade T3 (99% ML
bootstrap support) was comprised of Thiothrix sequences from N.
montanarius and N. frasassianus. T1–T3 were considered to be
Niphargus symbiont clades, as sequences in these groups were found
consistently in clone libraries from several Niphargus individuals
collected in 2006, 2008, and 2009 from seven different cave sites.
Host-Specific Niphargus-Thiothrix Ectosymbioses
PLOS ONE | www.plosone.org 5 November 2012 | Volume 7 | Issue 11 | e50254
Some Thiothrix sequences from N. frasassianus and N. montanarius
clone libraries did not fall within the clades T1–T3, but instead
clustered with Thiothrix sequences from Frasassi microbial mats
(Figure 2). Each of these sequences was found either only once or
on a single Niphargus individual. Moreover, using FISH we found
that all filamentous bacteria attached to Niphargus appendages
bound to one of the T1–T3 clade-specific probes NSPT1–NSPT3
(Figure 3, panels D–F). We thus concluded that the additional
Thiothrix sequences belonged to rare epibionts or to free-living
Thiothrix that contaminated the Niphargus samples during collec-
tion. Sequences belonging to other types of bacteria were also
obtained in clone libraries from several N. ictus and N. frasassianus
individuals (Table S2). None of these additional non-Thiothrix
sequences was found consistently on different Niphargus of the same
species, providing insufficient evidence for them to be regarded as
symbionts.
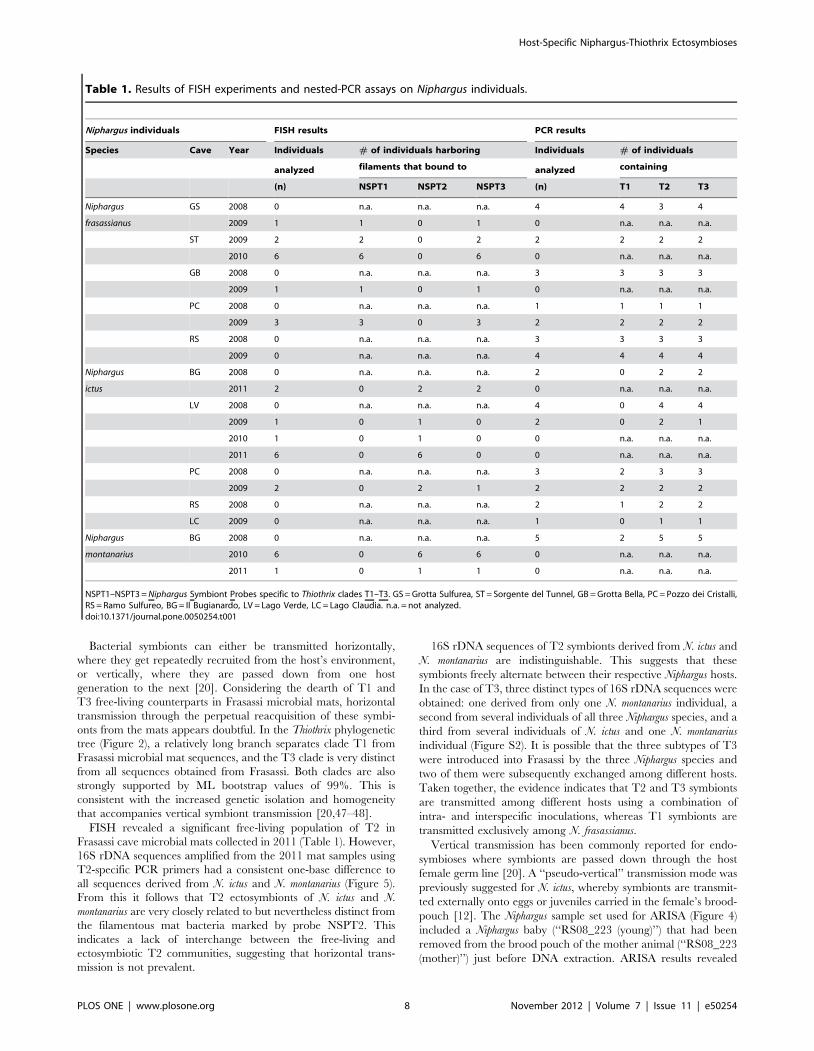
16S rDNA clone libraries suggested that T1 ectosymbionts are
solely harbored by N. frasassianus, T2 by N. ictus and N. montanarius,
and T3 by N. frasassianus and N. montanarius (Figure 2). However,
only N. ictus individuals collected from cave locations LV and LC
were used for clone library construction. FISH analyses confirmed
the results obtained from the clone libraries, but additionally
revealed T3 filaments on N. ictus individuals from cave locations
BG and PC (Table 1). Moreover, ARISA as well as nested-PCR
detected the presence of T3 Thiothrix on N. ictus from all sampled
cave locations, including LV and LC (Figure 4; Table 1). This
discrepancy between the results of the different methods might be
explained by very low amounts of T3 Thiothrix cells on N. ictus
individuals from LV and LC, which might have been sufficient to
be detected by highly sensitive techniques like ARISA and nested-
PCR, but insufficient to become represented in 16S rDNA clone
libraries or be revealed by FISH. The overall evidence suggests
that T3 Thiothrix are ectosymbionts of all three Frasassi-dwelling
Niphargus species.
Origins of the Niphargus-Thiothrix ectosymbiosesClosest relatives of ectosymbionts T1 and T2 are Thiothrix from
Frasassi cave microbial mats (Figure 2). Thus, it is likely that T1
and T2 symbionts have evolved within the cave system from
previously free-living bacteria. Due to poor bootstrap support for
nodes connecting clades T1 and T2, it is not possible to say
whether the ectosymbionts evolved from a common symbiotic
ancestor or from distinct free-living Thiothrix. The three Frasassi-
dwelling Niphargus species probably invaded the cave system
independently, but in a yet unknown order [17]. Therefore, it is
currently not possible to speculate about the sequence in which T1
and T2 symbionts were acquired by their different hosts.
The T3 clade is distantly related to clades T1 and T2 and to all
other Frasassi cave microbial mat sequences. Consequently, T3
ectosymbionts seem to have originated from outside the Frasassi
cave system. The three Niphargus species investigated in this study
are distantly related to each other [17], and each of them harbors
T3 symbionts. This suggests that T3 symbionts are either
widespread in the genus Niphargus, or were introduced into
Figure 3. SEM and FISH images of Thiothrix filaments on Frasassi-dwelling Niphargus species. Panels A–C: Scanning electron micrographs(SEM) of bacterial filaments attached to hairs and spines on appendages of the three Niphargus species. The arrangement of the filaments in rosettesand their attachment via holdfasts (Panel C) are characteristic features of the bacterial genus Thiothrix [56]. Panels D–F: Confocal epifluorescencemicrographs of Thiothrix filaments subjected to Fluorescence In Situ Hybridization (FISH) using probes specific to T1–T3 ectosymbiotic clades. ProbesNSPT1 and NSPT2, designed to bind to T1 and T2, respectively (Panels D and E), were labeled with the fluorescent dye FITC (in green), T3-specificprobe NSPT3 was labeled with cy3 (in red; Panel F).doi:10.1371/journal.pone.0050254.g003
Host-Specific Niphargus-Thiothrix Ectosymbioses
PLOS ONE | www.plosone.org 6 November 2012 | Volume 7 | Issue 11 | e50254
Frasassi by one Niphargus host and subsequently dispersed over the
remaining species inside the caves. Investigations of non-Frasassi
Niphargus species for Thiothrix ectosymbionts are currently under-
way to evaluate these alternatives.
Our analyses suggest that the Niphargus-Thiothrix symbiosis has
evolved independently at least two times. Symbioses with T1 and
T2 may have been initiated within the last one million years,
during which sulfidic conditions within the Frasassi caves have
been established [12], whereas the association with T3 is likely
more ancient.
Thiothrix ectosymbiont transmission modeFISH with oligonucleotide probes specific to T1–T3 was used to
examine whether significant free-living populations of the
ectosymbionts were present in Frasassi cave microbial mats.
These analyses revealed that T1 filaments were nearly absent from
the mats (Table 1), except for two short filaments (both ,10 mm)
observed in two samples. Free-living Thiothrix filaments tend to be
several 100 micrometers in lengths, while ectosymbiont filaments
on Niphargus appear to be ‘‘groomed’’ to lengths between 30 and
100 mm (Figure 3). It is thus likely that the short T1 filaments
detected within the mat samples were shed ectosymbionts rather
than steady members of the microbial mat community. T2-specific
probe NSPT2 bound to few filaments in mats collected before or
in the year 2009 ([12]; Figure 5), but to considerably more
filaments in mats collected in 2011. T3 filaments were not detected
in any of the eight Frasassi microbial mat samples analyzed by
FISH (Figure 5).
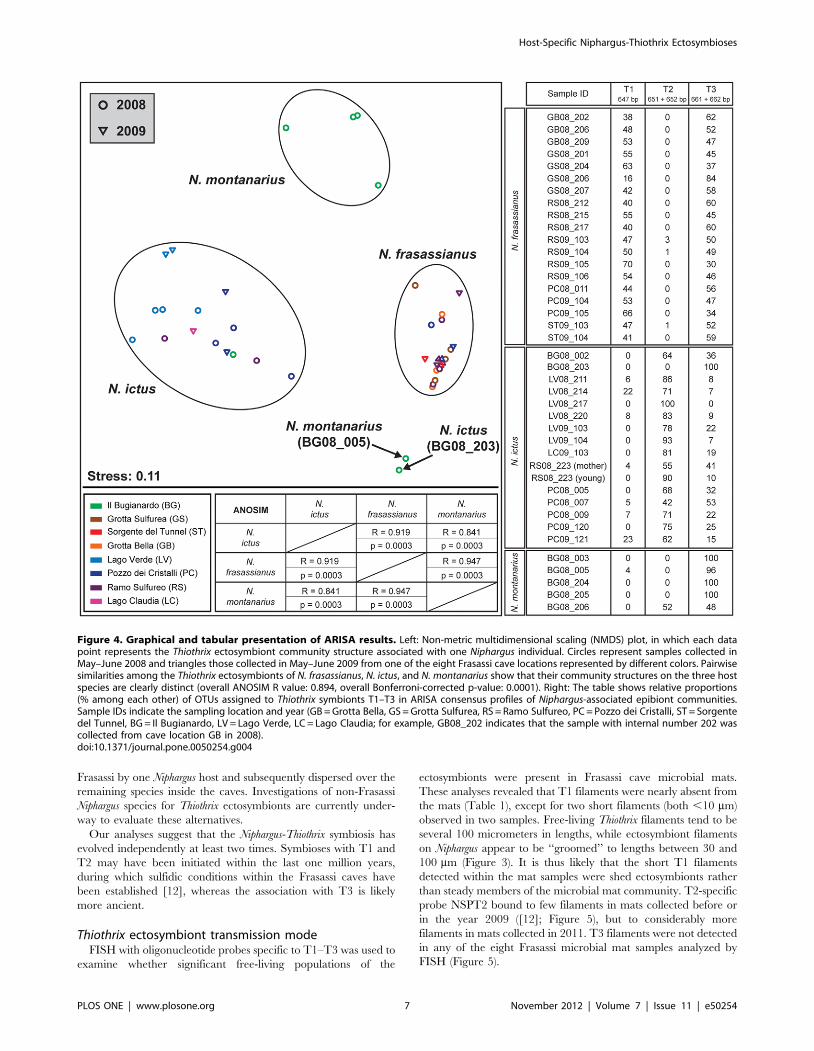
Figure 4. Graphical and tabular presentation of ARISA results. Left: Non-metric multidimensional scaling (NMDS) plot, in which each datapoint represents the Thiothrix ectosymbiont community structure associated with one Niphargus individual. Circles represent samples collected inMay–June 2008 and triangles those collected in May–June 2009 from one of the eight Frasassi cave locations represented by different colors. Pairwisesimilarities among the Thiothrix ectosymbionts of N. frasassianus, N. ictus, and N. montanarius show that their community structures on the three hostspecies are clearly distinct (overall ANOSIM R value: 0.894, overall Bonferroni-corrected p-value: 0.0001). Right: The table shows relative proportions(% among each other) of OTUs assigned to Thiothrix symbionts T1–T3 in ARISA consensus profiles of Niphargus-associated epibiont communities.Sample IDs indicate the sampling location and year (GB = Grotta Bella, GS = Grotta Sulfurea, RS = Ramo Sulfureo, PC = Pozzo dei Cristalli, ST = Sorgentedel Tunnel, BG = Il Bugianardo, LV = Lago Verde, LC = Lago Claudia; for example, GB08_202 indicates that the sample with internal number 202 wascollected from cave location GB in 2008).doi:10.1371/journal.pone.0050254.g004
Host-Specific Niphargus-Thiothrix Ectosymbioses
PLOS ONE | www.plosone.org 7 November 2012 | Volume 7 | Issue 11 | e50254
Bacterial symbionts can either be transmitted horizontally,
where they get repeatedly recruited from the host’s environment,
or vertically, where they are passed down from one host
generation to the next [20]. Considering the dearth of T1 and
T3 free-living counterparts in Frasassi microbial mats, horizontal
transmission through the perpetual reacquisition of these symbi-
onts from the mats appears doubtful. In the Thiothrix phylogenetic
tree (Figure 2), a relatively long branch separates clade T1 from
Frasassi microbial mat sequences, and the T3 clade is very distinct
from all sequences obtained from Frasassi. Both clades are also
strongly supported by ML bootstrap values of 99%. This is
consistent with the increased genetic isolation and homogeneity
that accompanies vertical symbiont transmission [20,47–48].
FISH revealed a significant free-living population of T2 in
Frasassi cave microbial mats collected in 2011 (Table 1). However,
16S rDNA sequences amplified from the 2011 mat samples using
T2-specific PCR primers had a consistent one-base difference to
all sequences derived from N. ictus and N. montanarius (Figure 5).
From this it follows that T2 ectosymbionts of N. ictus and N.
montanarius are very closely related to but nevertheless distinct from
the filamentous mat bacteria marked by probe NSPT2. This
indicates a lack of interchange between the free-living and
ectosymbiotic T2 communities, suggesting that horizontal trans-
mission is not prevalent.
16S rDNA sequences of T2 symbionts derived from N. ictus and
N. montanarius are indistinguishable. This suggests that these
symbionts freely alternate between their respective Niphargus hosts.
In the case of T3, three distinct types of 16S rDNA sequences were
obtained: one derived from only one N. montanarius individual, a
second from several individuals of all three Niphargus species, and a
third from several individuals of N. ictus and one N. montanarius
individual (Figure S2). It is possible that the three subtypes of T3
were introduced into Frasassi by the three Niphargus species and
two of them were subsequently exchanged among different hosts.
Taken together, the evidence indicates that T2 and T3 symbionts
are transmitted among different hosts using a combination of
intra- and interspecific inoculations, whereas T1 symbionts are
transmitted exclusively among N. frasassianus.
Vertical transmission has been commonly reported for endo-
symbioses where symbionts are passed down through the host
female germ line [20]. A ‘‘pseudo-vertical’’ transmission mode was
previously suggested for N. ictus, whereby symbionts are transmit-
ted externally onto eggs or juveniles carried in the female’s brood-
pouch [12]. The Niphargus sample set used for ARISA (Figure 4)
included a Niphargus baby (‘‘RS08_223 (young)’’) that had been
removed from the brood pouch of the mother animal (‘‘RS08_223
(mother)’’) just before DNA extraction. ARISA results revealed
Table 1. Results of FISH experiments and nested-PCR assays on Niphargus individuals.
Niphargus individuals FISH results PCR results
Species Cave Year Individuals # of individuals harboring Individuals # of individuals
analyzed filaments that bound to analyzed containing
(n) NSPT1 NSPT2 NSPT3 (n) T1 T2 T3
Niphargus GS 2008 0 n.a. n.a. n.a. 4 4 3 4
frasassianus 2009 1 1 0 1 0 n.a. n.a. n.a.
ST 2009 2 2 0 2 2 2 2 2
2010 6 6 0 6 0 n.a. n.a. n.a.
GB 2008 0 n.a. n.a. n.a. 3 3 3 3
2009 1 1 0 1 0 n.a. n.a. n.a.
PC 2008 0 n.a. n.a. n.a. 1 1 1 1
2009 3 3 0 3 2 2 2 2
RS 2008 0 n.a. n.a. n.a. 3 3 3 3
2009 0 n.a. n.a. n.a. 4 4 4 4
Niphargus BG 2008 0 n.a. n.a. n.a. 2 0 2 2
ictus 2011 2 0 2 2 0 n.a. n.a. n.a.
LV 2008 0 n.a. n.a. n.a. 4 0 4 4
2009 1 0 1 0 2 0 2 1
2010 1 0 1 0 0 n.a. n.a. n.a.
2011 6 0 6 0 0 n.a. n.a. n.a.
PC 2008 0 n.a. n.a. n.a. 3 2 3 3
2009 2 0 2 1 2 2 2 2
RS 2008 0 n.a. n.a. n.a. 2 1 2 2
LC 2009 0 n.a. n.a. n.a. 1 0 1 1
Niphargus BG 2008 0 n.a. n.a. n.a. 5 2 5 5
montanarius 2010 6 0 6 6 0 n.a. n.a. n.a.
2011 1 0 1 1 0 n.a. n.a. n.a.
NSPT1–NSPT3 = Niphargus Symbiont Probes specific to Thiothrix clades T1–T3. GS = Grotta Sulfurea, ST = Sorgente del Tunnel, GB = Grotta Bella, PC = Pozzo dei Cristalli,RS = Ramo Sulfureo, BG = Il Bugianardo, LV = Lago Verde, LC = Lago Claudia. n.a. = not analyzed.doi:10.1371/journal.pone.0050254.t001
Host-Specific Niphargus-Thiothrix Ectosymbioses
PLOS ONE | www.plosone.org 8 November 2012 | Volume 7 | Issue 11 | e50254

that the juvenile individual, like its mother, harbored T2 and T3
ectosymbionts on its appendages.
Thiothrix bacteria can relocate themselves through gonidia,
which are motile dispersal cells produced from the apex of the
filaments [49–50]. Nested-PCR assays detected T1, T2 and T3 in
many Frasassi microbial mats, including samples where FISH had
indicated an absence of full-grown filaments (Figure 5). The highly
sensitive PCR analyses presumably detected Thiothrix gonidia that
are present in Frasassi cave waters. These gonidia may be the
means by which T1–T3 ectosymbionts are exchanged among
Niphargus hosts living in various cave locations throughout Frasassi.
Host-specific Thiothrix distribution patternsARISA served to identify compositional differences in the
Thiothrix communities associated with the three Niphargus species.
Determining the ITS lengths of the Thiothrix symbionts from 16S-
ITS clone libraries allowed us to assign individual OTUs in the
ARISA consensus profiles to T1, T2, and T3. Symbiont ITS
lengths were as follows: 647 bp (T1), 651, 652 bp (T2), and 661,
662 bp (T3). Taking only the ARISA OTUs corresponding to
these five ITS sequence lengths into account for NMDS analysis,
calculated pairwise similarities confirmed that the relative distri-
bution patterns of Thiothrix symbionts on the three Niphargus species
were host species-specific (Figure 4). Except for two outliers (N.
ictus BG08_203 and N. montanarius BG08_005, which were both
dominated by the 662bp T3 OTU), all analyzed Niphargus samples
clustered into three different groups according to their respective
host species. This was the case even for Niphargus individuals of two
different species that co-occurred and were collected simulta-
neously at the same cave locations (BG, PC, RS). N. ictus and N.
frasassianus inhabit several different cave sites where the dominant
microbial mat type varies based on the cave water geochemistry
and flow regime (Figure 1). However, neither sampling location
nor collection year had a major influence on the relative Thiothrix
ectosymbiont distribution patterns on these hosts. Despite the two
outliers, ANOSIM statistics (R and p values) confirmed clear
separation with high significance between the three Niphargus
species. It is however important to note that the sample size of N.
montanarius (n = 5) was much smaller than that of N. ictus (n = 16)
and N. frasassianus (n = 19). Unequal sample sizes lower the
meaningfulness of ANOSIM, but were unavoidable in our study
due to the low availability of N. montanarius individuals.
T1 and T3 OTUs were abundant on N. frasassianus, whereas N.
ictus and N. montanarius were mainly associated with T2 and T3.
This is in close agreement with our FISH results (Table 1). The
clear separation between the three Niphargus species in the NMDS
plot generated from ARISA (Figure 4) was obtained using a Bray-
Curtis index of dissimilarity for the calculations, which considers
both presence/absence and relative abundance of Thiothrix OTUs.
Using a Jaccard index instead, which takes only OTU presence/
absence into account, resulted in non-significant ANOSIM values
and poor separation between the three groups in the NMDS plot.
Close examination showed that T2 ARISA OTUs were also
occasionally detected on N. frasassianus, and T1 OTUs on N. ictus
and N. montanarius. Thus, the ARISA results indicate that T1–T3
Thiothrix ectosymbionts can colonize all three Niphargus hosts, but
their abundances are strongly influenced by the identity of the host
species they are associated with. This is consistent with the
comparison between FISH and PCR results, where FISH shows a
host-species specific distribution pattern, whereas nested-PCR
assays detected T1–T3 sequences on all three Niphargus species
(Table 1). While the highly sensitive nested-PCR approach might
trace gonidia attached to Niphargus exoskeletons, FISH would only
reveal full-grown Thiothrix filaments. Taken together, our analyses
suggest that T1–T3 ectosymbiont gonidia can attach to exoskel-
etons of all three Niphargus species. However, only T1 and T3
filaments develop successfully on N. frasassianus, whereas T2 and
T3 flourish on N. ictus and N. montanarius, with T3 dominating N.
montanarius ectosymbiont communities.
Chitin, the major component of Niphargus exoskeletons, is a
common binding motif for many invertebrate-microbe associa-
tions [19]. Thiothrix belonging to the clades T1, T2, and T3 all
appear to have the ability and the preference to colonize the
chitinous surfaces of Niphargus amphipods, but their host-species
specific distribution pattern is likely caused by factors controlled by
each Niphargus species.
Selection of particular ectosymbiont clades may be mediated by
lectins secreted on the Niphargus cuticle. Such a mechanism has
previously been shown to enable differential ectosymbiont
acquisition by nematodes dwelling in sulfidic marine sediments
[10,51]. Another possibility is that the three Thiothrix ectosym-
bionts have different tolerances and requirements for sulfide and
oxygen. Thus, their respective prevalences on different Niphargus
species may result from their adaptation to the distinct locomotion
behaviors and microhabitat preferences of their hosts. N. ictus is a
swimming species that prefers stagnant, stratified water bodies. It
travels between oxygenated top layers and sulfidic bottom zones
and thereby exposes its ectosymbionts to alternating redox
conditions [12,17]. N. frasassianus is a poor swimmer and favors
shallow, turbulent streams, where it crawls among sulfide-rich
sediments and microbial mats [17]. Thus, its ectosymbionts are
continuously and simultaneously provided with sulfide and
oxygen. N. montanarius is found exclusively in cave location BG
[17], which is a non-sulfidic pool (Figure 1). We are currently
examining the metabolic capabilities of the three Thiothrix
ectosymbionts to infer the benefits that each of them may derive
from its particular ‘hitch-hiking’ lifestyle.
Figure 5. Results of FISH and PCR analyses of Frasassimicrobial mats. (A) NSPT1–NSPT3 = Niphargus Symbiont Probesspecific to T1–T3. ! = PCR product of expected size verified bysequencing to belong to clades T1, T2, or T3. (B) Consistent one-basedifference between T2 16S rDNA sequences derived from microbialmats and Niphargus samples. n = number of clones. Numbers below thesequences refer to 16S rRNA nucleotide positions according toEscherichia coli numbering [57]. Microbial mat T2 sequences wereobtained by sequencing PCR products using T2-specific primers,whereas T2 epibiont sequences were obtained from 16S rDNA clonelibraries of Niphargus.doi:10.1371/journal.pone.0050254.g005
Host-Specific Niphargus-Thiothrix Ectosymbioses
PLOS ONE | www.plosone.org 9 November 2012 | Volume 7 | Issue 11 | e50254
ConclusionWhile symbioses between invertebrates and sulfur-oxidizing
bacteria have been extensively studied in the marine environment
[2,52], the first example from a freshwater ecosystem involving
Niphargus amphipods was discovered only recently [12]. In this
study, we found that three Niphargus species living in the sulfide-
rich cave system of Frasassi are ectosymbiotic with filamentous
Thiothrix ectosymbionts of three different clades. The genus
Niphargus contains over 300 species distributed throughout Europe
[53–54], some of which are found in other sulfidic locations, such
as Movile cave in Romania [55]. Niphargus-Thiothrix ectosymbioses
are thus potentially widespread in the subterranean realm and
warrant further investigation.
Supporting Information
Figure S1 16S rDNA and ITS binding sites of Thiothrix clade-
specific PCR primers.
(PDF)
Figure S2 16S Maximum Likelihood phylogenetic tree of
Thiothrix clade T3, including all sequences obtained from 16S
clone libraries and nested-PCR assays. Colors mark the different
sources from which the sequences were obtained (red = N.
frasassianus, blue = N. ictus, green = N. montanarius, brown = Frasassi
microbial mats). Clone and sequence names indicate the sampling
location and year (BG = Il Bugianardo, GS = Grotta Sulfurea,
CS = Cave Spring, ST = Sorgente del Tunnel, GB = Grotta Bella,
LV = Lago Verde, PC = Pozzo dei Cristalli, RS = Ramo Sulfureo,
LC = Lago Claudia). Different numbers after cave name abbre-
viations indicate different Niphargus individuals collected from the
same cave location (cf. Figure 2). GenBank accession numbers are
given in parentheses. Maximum Likelihood/Neighbor-Joining
bootstrap values greater than 50% are listed next to the respective
nodes.
(PDF)
Table S1 List of all FISH probes and PCR primers used in this
study.
(XLS)
Table S2 List of non-Thiothrix sequences obtained from 16S
rDNA clone libraries of Niphargus-associated epibionts.
(PDF)
Acknowledgments
The authors thank Simone Cerioni, Sandro Mariani, Jennifer L Macalady,
and Daniel S Jones for helping with sample collection and providing expert
assistance in the field. Many thanks go to Alessandro Montanari for
logistical support during fieldwork. We are very grateful to Dorothea
Hause-Reitner for assistance with scanning electron microscopy, to
Melanie Heinemann for technical assistance with clone library construc-
tion, and to Martina Alisch for help with ARISA preparations. Sincere
thanks are also given to Mahesh S Desai and Jean-Francois Flot for useful
discussions.
Author Contributions
Conceived and designed the experiments: JB SD. Performed the
experiments: JB. Analyzed the data: JB AR. Contributed reagents/
materials/analysis tools: AR SD. Wrote the paper: JB SD. Study design:
SD JB. Sample collection: JB SD. Primer and probe design: JB.
Introduction to ARISA, statistics: AR.
References
1. Sapp J (2004) The dynamics of symbiosis: an historical overview. Botany 82:
1046–1056.
2. Dubilier N, Bergin C, Lott C (2008) Symbiotic diversity in marine animals: the
art of harnessing chemosynthesis. Nature Rev Microbiol 6: 725–740.
3. Goffredi S (2010) Indigenous ectosymbiotic bacteria associated with diverse
hydrothermal vent invertebrates. Environ Microbiol Rep 2: 479–488.
4. Wahl M, Mark O (1999) The predominantly facultative nature of epibiosis:
experimental and observational evidence. Mar Ecol Prog Ser 187: 59–66.
5. Polz MF, Distel DL, Zarda B, Amann R, Felbeck H, et al. (1994) Phylogenetic
analysis of a highly specific association between ectosymbiotic, sulfur-oxidizing
bacteria and a marine nematode. Appl Environ Microbiol 60: 4461–4467.
6. Goffredi SK, Waren A, Orphan VJ, Van Dover CL, Vrijenhoek RC (2004)
Novel forms of structural integration between microbes and a hydrothermal vent
gastropod from the Indian ocean. App Env Microbiol 70: 3082–3090.
7. Bayer C, Heindl NR, Rinke C, Lucker S, Ott JA, et al. (2009) Molecular
characterization of the symbionts associated with marine nematodes of the genus
Robbea. Environ Microbiol Rep 1: 136–144.
8. Petersen JM, Ramette A, Lott C, Cambon-Bonavita M-A, Zbinden M, et al.
(2010) Dual symbiosis of the vent shrimp Rimicaris exoculata with filamentous
gamma-and epsilonproteobacteria at four Mid-Atlantic Ridge hydrothermal
vent fields. Environ Microbiol 12: 2204–2218.
9. Ruehland C, Dubilier N (2010) Gamma- and epsilonproteobacterial ectosym-
bionts of a shallow-water marine worm are related to deep-sea hydrothermal
vent ectosymbionts. Environ Microbiol 12: 2312–2326.
10. Bulgheresi S, Gruber-Vodicka HR, Heindl NR, Dirks U, Kostadinova M, et al.
(2011) Sequence variability of the pattern recognition receptor Mermaid
mediates specificity of marine nematode symbioses. ISME J 5: 986–998.
11. Gillan DC, Dubilier N (2004) Novel epibiotic Thiothrix bacterium on a marine
amphipod. Appl Environ Microbiol 70: 3772–3775.
12. Dattagupta S, Schaperdoth I, Montanari A, Mariani S, Kita N, et al. (2009) A
novel symbiosis between chemoautotrophic bacteria and a freshwater cave
amphipod. ISME J 3: 935–943.
13. Sarbu SM, Galdenzi S, Menichetti M, Gentile G (2000) Geology and biology of
the Frasassi caves in central Italy: an ecological multi-disciplinary study of a
hypogenic underground karst system. In: Wilkens H, Culver DC, Humphreys
WF, editors. Subterranean Ecosystems. Ecosystems of the World. Elsevier
Science: Amsterdam. pp 359–378.
14. Macalady JL, Lyon EH, Koffman B, Albertson LK, Meyer K, et al. (2006)
Dominant microbial populations in limestone-corroding stream biofilms,
Frasassi cave system, Italy. Appl Environ Microbiol 72: 5596–5609.
15. Macalady JL, Dattagupta S, Schaperdoth I, Jones DS, Druschel G, et al. (2008)
Niche differentiation among sulfur-oxidizing bacterial populations in cave
waters. ISME J 2: 590–601.
16. Bertolani R, Manicardi GC, Rebecchi L (1994) Faunistic study in the karst
complex of Frasassi (Genga, Italy). Int J Speleol 23: 61–77.
17. Flot J-F, Worheide G, Dattagupta S (2010) Unsuspected diversity of Niphargus
amphipods in the chemoautotrophic cave ecosystem of Frasassi, central Italy.
BMC Evol Biol 10: 171.
18. Karaman GS, Borowsky B, Dattagupta S (2010) Two new species of the genus
Niphargus Schiodte, 1849 (Amphipoda, fam. Niphargidae) from the Frasassi cave
system in Central Italy. Zootaxa 2439: 35–52.
19. Chaston J, Goodrich-Blair H (2010) Common trends in mutualism revealed by
model associations between invertebrates and bacteria. FEMS Microbiol Rev
34: 41–58.
20. Bright M, Bulgheresi S (2010) A complex journey: transmission of microbial
symbionts. Nat Rev Microbiol 8: 218–230.
21. Weisburg WG, Barns SM, Pelletier DA, Lane DJ (1991) 16S ribosomal DNA
amplification for phylogenetic study. J Bacteriol 173: 697–703.
22. Huber T, Faulkner G, Hugenholtz P (2004) Bellerophon: a program to detect
chimeric sequences in multiple sequence alignments. Bioinformatics 20: 2317–
2319.
23. Altschul SF, Gish W, Miller W, Myers EW, Lipman DJ (1990) Basic local
alignment search tool. J Mol Biol 215: 403–410.
24. Katoh K, Toh H (2010) Parallelization of the MAFFT multiple sequence
alignment program. Bioinformatics 26: 1899–1900.
25. Katoh K, Toh H (2008) Improved accuracy of multiple ncRNA alignment by
incorporating structural information into a MAFFT-based framework. BMC
Bioinformatics 9: 212.
26. Schloss PD, Westcott SL, Ryabin T, Hall JR, Hartmann M, et al. (2009)
Introducing mothur: open-source, platform-independent, community-supported
software for describing and comparing microbial communities. Appl Environ
Microbiol 75: 7537–7541.
27. Posada D (2008) JModelTest: Phylogenetic Model Averaging. Mol Biol Evol 25:
1253–1256.
28. Guindon S, Gascuel O (2003) A simple, fast, and accurate algorithm to estimate
large phylogenies by maximum likelihood. Syst Biol 52: 696–704.
29. Watsuji T, Nakagawa S, Tsuchida S, Toki T, Hirota A, et al. (2010) Diversity
and function of epibiotic microbial communities on the galatheid crab, Shinkaia
crosnieri. Microbes Environ 25: 288–294.
Host-Specific Niphargus-Thiothrix Ectosymbioses
PLOS ONE | www.plosone.org 10 November 2012 | Volume 7 | Issue 11 | e50254
30. Gouy M, Guindon S, Gascuel O (2010) SeaView version 4: a multiplatform
graphical user interface for sequence alignment and phylogenetic tree building.
Mol Biol Evol 27: 221–224.
31. Hugenholtz P, Tyson GW, Blackall LL (2002) Design and evaluation of 16S
rRNA-targeted oligonucleotide probes for fluorescence in situ hybridization. In:
Aquino de Muro M, Rapley R, editors. Gene Probes: Principles and Protocols.
Humana Press: London. pp 29–42.
32. Ashelford KE, Weightman AJ, Fry JC (2002) PRIMROSE: a computer program
for generating and estimating the phylogenetic range of 16S rRNA
oligonucleotide probes and primers in conjunction with the RDP-II database.
Nucleic Acids Res 30: 3481–3489.
33. Fuchs BM, Glockner FO, Wulf J, Amann R (2000) Unlabeled helper
oligonucleotides increase the in situ accessibility to 16S rRNA of fluorescently
labeled oligonucleotide probes. Appl Environ Microbiol 66: 3603–3607.
34. Amann RI (1995) In situ identification of microorganisms by whole cell
hybridization with rRNA-targeted nucleic acid probes. In: Akkerman ADL, van
Elsas DJ, de Bruijn FJ, editors. Molecular Microbial Ecology Manual. Kluwer
Academic Publishers: Dordrecht. pp 1–15.
35. Daims H, Bruhl A, Amann R, Schleifer KH, Wagner M (1999) The domain-
specific probe EUB338 is insufficient for the detection of all bacteria: development
and evaluation of a more comprehensive probe set. Syst Appl Microbiol 22:
434–444.
36. Fisher MM, Triplett EW (1999) Automated approach for ribosomal intergenic
spacer analysis of microbial diversity and its application to freshwater bacterial
communities. Appl Environ Microbiol 65: 4630–4636.
37. Meziti A, Ramette A, Mente E, Kormas KA (2010) Temporal shifts of the
Norway lobster (Nephrops norvegicus) gut bacterial communities. FEMS
Microbiol Ecol 74: 472–484.
38. Boer SI, Hedtkamp SIC, Van Beusekom JEE, Fuhrman JA, Boetius A, et al.
(2009) Time- and sediment depth-related variations in bacterial diversity and
community structure in subtidal sands. ISME J 3: 780–791.
39. Ramette A (2009) Quantitative community fingerprinting methods for
estimating the abundance of operational taxonomic units in natural microbial
communities. Appl Environ Microbiol 75: 2495–2505.
40. Muyzer G, Hottentrager S, Teske A, Wawer C (1996) Denaturing gradient gel
electrophoresis of PCR-amplified 16S rDNA – a new molecular approach to
analyze the genetic diversity of mixed microbial communities. In: Akkermans
ADL, van Elsas JD, de Bruijn FJ, editors. Molecular microbial ecology manual.
Kluwer Academic Publishing: Dordrecht. pp 3.4.4.1–3.4.4.22.
41. Cardinale M, Brusetti L, Quatrini P, Borin S, Puglia AM, et al. (2004)
Comparison of different primer sets for use in Automated Ribosomal Intergenic
Spacer Analysis of complex bacterial communities. Appl Environ Microbiol 70:
6147–6156.
42. Bierne N, Tanguy A, Faure M, Faure B, David E, et al. (2007) Mark-recapture
cloning: a straightforward and cost-effective cloning method for populationgenetics of single-copy nuclear DNA sequences in diploids. Mol Ecol Notes 7:
562–566.
43. Legendre P, Legendre L (1998) Numerical Ecology. Elsevier science:Amsterdam. 853 p.
44. Ramette A (2007) Multivariate analyses in microbial ecology. FEMS MicrobiolEcol 62: 142–160.
45. R Development Core Team (2011) R: A Language and Environment for
Statistical Computing. R Foundation for Statistical Computing: Vienna. ISBN3-900051-07-0. R Project website. Available: http://www.R-project.org.
Accessed 2012 Jan 9.46. Oksanen J, Blanchet FG, Kindt R, Legendre P, Minchin PR, et al. (2011) vegan:
Community Ecology Package. R Project website. Available: http://CRAN.R-project.org/package = vegan. Accessed 2012 Jan 9.
47. Moran NA (1996) Accelerated evolution and Muller’s rachet in endosymbiotic
bacteria. Proc Natl Acad Sci USA 93: 2873–2878.48. Moran NA, Plague GR (2004) Genetic changes following host restriction in
bacteria. Curr Opin Genet Dev 14: 627–633.49. Larkin JM, Shinabarger DL (1983) Characterization of Thiothrix nivea. Int J Syst
Bacteriol 33: 841–846.
50. Chernousova E, Gridneva E, Grabovich M, Dubinina G, Akimov V, et al.(2009) Thiothrix caldifontis sp. nov. and Thiothrix lacustris sp. nov., gammaproteo-
bacteria isolated from sulfide springs. Int J Syst Evol Microbiol 59: 3128–3135.51. Bulgheresi S, Schabussova I, Chen T, Mullin NP, Maizels RM, et al. (2006) A
new C-type lectin similar to the human immunoreceptor DC-SIGN mediatessymbiont acquisition by a marine nematode. Appl Environ Microbiol 72: 2950–
2956.
52. Ott J, Bright M, Bulgheresi S (2004) Marine microbial thiotrophic ectosym-bioses. Oceanogr Mar Biol 42: 95–118.
53. Fiser C, Sket B, Trontelj P (2008) A phylogenetic perspective on 160 years oftroubled taxonomy of Niphargus (Crustacea: Amphipoda). Zool Scripta 37: 665–
680.
54. Vainola R, Witt J, Grabowski M, Bradbury J, Jazdzewski K, et al. (2008) Globaldiversity of amphipods (Amphipoda; Crustacea) in freshwater. Hydrobiologia
595: 241–255.55. Sarbu SM, Kane TC, Kinkle BK (1996) A chemoautotrophically based cave
ecosystem. Science 272: 1953–1955.56. Unz RF, Head IM (2005) Genus I. Thiothrix Winogradsky 1888. In: Garrity GM,
Brenner DJ, Krieg NR, Staley JR., editors. Bergey’s Manual of Systematic
Bacteriology, Volume Two: The Proteobacteria, Parts A–C. Springer Verlag.1392 p.
57. Brosius J, Dull TJ, Sleeter DD, Noller HF (1981) Gene organization and primarystructure of a ribosomal operon from Escherichia coli. J Mol Biol 148: 107–127.
Host-Specific Niphargus-Thiothrix Ectosymbioses
PLOS ONE | www.plosone.org 11 November 2012 | Volume 7 | Issue 11 | e50254


