Embed Size (px)
Citation preview

____________________________________________________________________________________________ *Corresponding author: Email: [email protected];
American Journal of Experimental Agriculture 2(1): 111-132, 2012
SCIENCEDOMAIN international www.sciencedomain.org
Response of Local Cassava Varieties in Uganda to Cassava Mosaic Virus Disease
J. Adriko1*, W. S. Sserubombwe2, E. Adipala1, A. Bua2 and R. Edema1
1Department of Crop Science, P. O. Box 7062, Kampala, Uganda
2National Agricultural Crop Resources Research Institute, P. O. Box 7084, Kampala,
Uganda.
Received 8th
August 2011 Accepted 1
st September 2011
Online Ready 10th
February 2012
ABSTRACT
Cassava mosaic disease (CMD) resistant varieties have been used to manage CMD in Uganda. In spite the availability of a number of CMD resistant cultivars, several local landraces are continually grown in Uganda because they possess certain desirable traits, which may not have been fully met by the resistant varieties. Field based trials were setup to evaluate the response to CMD of some landraces that became prominent after the 1990s CMD pandemic. Experiments were located in areas where CMD is reported to have subsided namely, Mukono (Central Uganda) and Bulindi (Western Uganda). Three landraces were evaluated per site along with resistant (Nase 4) and susceptible (Bao) standards. Plots were planted with materials obtained from either diseased or healthy fields. The results showed differences in sensitivity to CMD among varieties tested, with landraces consistently having higher CMD incidences than Nase 4. The landraces tested in Mukono were more susceptible to CMD than even the Bao, while at Bulindi on the other hand, only Sibampale proved to be more resistant than Bao. There were differences in the whitefly populations among the cassava varieties and locations. High whitefly populations characterized all landraces and Nase 4. In most tested varieties, there was a higher infestation of whiteflies on healthy than diseased plants. Low spread of CMD among local landraces was observed in Bulindi as would be expected in areas where CMD has almost subsided (low pressure areas). However, in Mukono, disease spread among landraces was very rapid and high CMD incidences reaching 100% were recorded regardless of whether plots were planted with healthy or diseased cuttings suggesting it to be a CMD hot-spot. Thus, the use of clean planting materials as an effective phytosanitary method can only be employed under low disease pressure while high disease pressure areas need use of resistant varieties.
Research Article

American Journal of Experimental Agriculture, 2(1): 111-132, 2012
112
Keywords: Cassava mosaic disease; local landraces; CMD incidence; resistant varieties; susceptibility, phytosanitation.
1. INTRODUCTION During the 1990s, a pandemic of an unusually severe form of cassava mosaic disease (CMD) spread throughout Uganda (Otim-Nape et al., 1994). Virus characterization studies revealed that a novel virus known as the Uganda Variant (UgV), a recombinant derived from two previously recognized cassava mosaic geminiviruses (CMGs), African Cassava Mosaic Virus (ACMV) and East African Cassava Mosaic Virus (EACMV) was responsible for this (Harrison et al., 1997). During the expansion of the pandemic, plants infected with UgV typically expressed moderate to severe symptoms, although since 1998, mild strains of UgV appear to have become more frequent in some areas of Uganda (Otim-Nape et al., 2001; Otim-Nape et al., 2000). In these areas, many new farmer-selected local varieties have emerged and been adopted. Some of these varieties were prevalent before the onset of the epidemic but were abandoned during the pandemic. These varieties are now being widely grown by farmers. In addition, some of the resistant genotypes that were deployed during the pandemic were gradually abandoned in favor of these or previously unknown local varieties (Bua et al., 1999). Sound biological information, especially on the response of these local varieties to CMD is very crucial. Research on local cassava varieties is vital since these local landraces are more acceptable to the farmers for various reasons. For example, these varieties produce tuberous roots that are known to store better belowground, have better taste and are compatible with other crops in different cropping systems. In the present study, the performances of some Ugandan landraces that have become prominent since the 1990s pandemic were studied in two post-epidemic areas.
2. MATERIALS AND METHODS 2.1 Experimental Site Experimental plots were set up in Mukono district (Central Uganda) at the Mukono Agricultural Research and Development Center (ARDC) and Hoima (Western Uganda) at Bulindi ARDC. Mukono was chosen because it was considered to be a low CMD-spread site and accordingly minimum contamination by whiteflies was expected (Sserubombwe 1998). Similarly, Bulindi ARDC was reported to be experiencing little spread of CMD by whiteflies and the prevalent viruses were thought to be generally of mild or intermediate virulence. Bulindi was known as an epidemic area between 1989 and 1990. Since then the disease pressure has declined (Otim-Nape et al., 1998; Otim-Nape et al., 2001).
2.2 Cassava Varieties At each site, Nase 4 (CMD-resistant standard) and Bao (CMD-susceptible standard) were planted together with three prominent cassava varieties namely, Njule, Kabwa and Matooke (in Mukono), and Nyaraboke, Tongolo and Sibampale (in Hoima). Selection of stem cuttings for use as planting material was based on the visual assessment of the standing plants. The first experiment at Mukono was planted during the second rainy season of 2002 (hereafter referred to as 2002B) and the second during the first rainy season of 2003 (referred to as 2003A). At Bulindi, the experiments were planted during the first rainy season of 2002

American Journal of Experimental Agriculture, 2(1): 111-132, 2012
113
(2002A) and the second rainy season of 2002 (2002B).
2.3 Experimental Treatments and Design Treatments consisted of healthy and diseased plots of each variety. Hardwood stem cuttings 15 cm long (each having at least 4 nodes) were selected from plants with typical symptoms of CMD and also from symptom-less plants. Selection for “healthy” plants was done as previously described. The 10 treatments (5 varieties x 2 health status) were arranged in a Randomized Complete Block Design with four replications. Each plot measured 18m x 18m, and contained 81 plants spaced 1m by 1m. There were no inter-plot or inter-replicate spaces to avoid edge effects. Routine cultural management practices were observed and no pesticides were used. The central core (5 x 5) of the ‘diseased’ plot comprised ‘diseased’ plants and surrounding these were “guard rows” of initially healthy cuttings while in the ‘healthy’ plots all the 81 plants were healthy. This arrangement provided for additional healthy plants from which to choose whitefly-infected plants. Where necessary, plants which sprouted with incorrect health status 1 month after planting (MAP) were replaced from a “Bulk” of healthy or diseased plants raised nearby.
2.4 Experimental Measurements CMD incidence (%) and severity were determined monthly from 1 up to 6 MAP. CMD incidence was expressed as a percentage based on the proportion of diseased plants compared to the total number of plants present in the plot, and was also calculated separately for ‘Core’ and ‘Guard’ plants. Infection was also categorized as ‘early’ (2 – 4 MAP), ‘late’ (> 4 MAP) - by whitefly, and ‘cutting’ (infected from outset). In contrast, CMD severity was scored for each plant in the plot based on the scale of 1 – 5 (Terry and Hahn, 1980), where; 1 = No symptoms; 2 = mild chlorosis, little leaf distortion; 3 = moderate chlorosis, moderate leaf distortion, minor stunting; 4 = severe chlorosis, moderate leaf distortion, minor stunting, and; 5 = Severe chlorosis, leaf distortion and stunting. Average CMD severity was calculated as the total severity score per plot (excluding category 1)/ number of plants showing disease symptoms. As before, severity values were calculated separately for core and guard plants. The populations of adult whiteflies were monitored on each of the central 49 plants for six months (i.e., 1 MAP to 6 MAP). To do this, a representative shoot of each plant was chosen and counts were taken from the top-most four expanded leaves of the selected plant.
2.5 Data Analysis The raw data were summarized and then subjected to analysis of variance (ANOVA) using Genstat computer package 5 Release 3.2 (Lawes Agricultural Trust, 2005). Where significant differences were obtained between treatments, means were separated using the Least Significant Difference (L.S.D). Actual disease progress (incidence %) curves (based on obviously diseased plants at each time of assessment) were plotted to determine disease progress of CMD for each variety. CMD incidences were used for comparing the effect of inoculum source on the spread of CMD to healthy neighbours in the different varieties. Symptom severity curves were also fitted for different varieties as whole plot severity curves as well as separate central core and guard row severities. The areas under disease progress curves (AUDPCs) were calculated using % incidence as described by Campbell & Madden (1990) as follows:

American Journal of Experimental Agriculture, 2(1): 111-132, 2012
114
AUDPC ∑1n-1
= (i1 + i2)/2 (t2 – t1) Where ∑ = summation; i1 = disease incidence at time t1 and i2 = disease incidence at time t2
Disease index (DI) was also determined to show an overall response of varieties to CMD combining both CMD incidence and severity. It also indicates the amount of plant tissue affected by CMD. This was calculated according to formula of Fargette and Vié (1994) as: DI = Incidence (%) x Severity/ 100 To illustrate the adult whitefly population dynamics in the different varieties, population curves were made.
3. RESULTS AND DISCUSSIONS 3.1 Results 3.1.1 Incidence and disease progress curves of the whole plots Analysis of variance tables (ANOVA) showed significant differences (p<0.001) in the incidence of CMD among varieties recorded at both Bulindi and Mukono. This was consistent in all the seasons. At 6 MAP, higher CMD incidences were seen in each of the local landraces compared to either standard variety. The lowest incidences of CMD occurred in plots of Nase 4 (Figure 1) while in 2002B; plots of Matooke had the highest incidences of CMD (100 and 99.7 % in the “healthy” and “diseased” plots, respectively). This was followed by plots of Njule (98.4 and 98.5), Kabwa (85.1 and 90.9), Bao (79.6 and 89.3) and Nase 4 (5.5 and 14.0) in that order (Figure 1). In general, higher disease incidences at 6 MAP were recorded in plots planted in part with diseased cuttings compared to those planted exclusively with healthy ones. However, in 2002B higher CMD incidences were recorded in initially “healthy plots” planted with Matooke (100%) compared to its “diseased plots” (99.7%). Similarly, the incidence in “healthy plots” of Kabwa in 2003A was 77.9 % and that in “diseased plots” was 77.6% (Figure 1). Disease usually developed more rapidly in the local varieties compared to either standard. For example, in 2002B, the highest spread of CMD was recorded on variety Matooke, which had 0.0% infection with CMD 1 MAP in plots derived from “healthy” cuttings. However, by 6 MAP, CMD incidence had risen to 100% (Figure 1). Similarly, plots derived from “diseased” cuttings had a CMD incidence of 32.5% and this rose quickly to 99.7% by 6 MAP. The lowest spread was recorded in plots of Nase 4 (Figure 1). The highest rate of spread occurred between 4 MAP and 5 MAP, except in Nase 4 (Figure 1a and 1c). All the varieties exhibited similar trends in the progress of CMD in both “healthy” and “diseased” plots with exception of Nase 4 derived from “diseased” cuttings (Figure 1c). In trial 2003A, the disease progress recorded was similar to that observed previously in 2002B. Again greater spread of disease occurred on the local landraces compared to the standards, with the variety Matooke having the highest CMD spread from 0.0 and 27.4% in the ‘healthy’ and ‘diseased’ plots, respectively at 1 MAP to 91.4 and 95.5 at 6 MAP, while Nase 4 had the lowest CMD spread from 0.0 and 20.3 % to 2.1 and 21.9 in the healthy and diseased plots, respectively (Figures 1b and 1d). In 2003A, the highest spread occurred much earlier (between 1 MAP and 2 MAP) compared to that observed in 2002B. However, rates of spread declined continuously with time (Figures 1b and 1d). The Bao and Nase 4 standards showed some recovery after 5 MAP and 3 MAP, respectively (Figure 1b and 1d).

American Journal of Experimental Agriculture, 2(1): 111-132, 2012
115
Figure 1. Monthly incidence (%) of CMD observed in whole plots of each of five
cassava varieties at Mukono containing either healthy (a & b) or diseased (c & d) cuttings during the season 2002B (a & c) and 2003A (b & d)
In contrast at Bulindi, higher CMD incidences were recorded in each of the landraces including the susceptible standard (Bao) compared to the resistant Nase 4. In 2002A initially “healthy” plots planted with the variety Nyaraboke had the highest incidence 6 MAP (76.2%) followed by Bao (45.9%), Sibampale (24%) and Tongolo (17.7%). Nase 4 had the lowest CMD incidence of only 2.4% at 6 MAP. Trends in the diseased plots were similar (Figure 2). In 2002B, there was no spread to Nase 4 in either both “healthy” or “diseased” plots. Cassava mosaic disease spread to other varieties was generally low with incidence of less than 40 % at 6 MAP (Figure 2c). Plots planted with Nyaraboke had the highest incidence at 6 MAP in both “healthy” and “diseased” plots (Fig 2c and 2d). At Bulindi in 2002A the highest spread occurred between 1MAP and 2MAP (Figure 2a and 2b). Some of the infected plants in initially “healthy plots” of Bao and Nase 4 showed recovery after 4 MAP (Figure 2a), while spread was continuous in the plots of Sibampale (Figure 2a and 2b). In 2002B the highest rate of disease spread occurred between 5 and 6 MAP. Disease spread continued to occur in all plots planted with the landraces with exception of the healthy Bao (fig 2c and 2d). In plots planted with “diseased” Nase 4, there was recovery after 2 MAP (fig 2d). 3.1.2 Incidence (%) of CMD in the guard rows The results showed that amount of CMD inoculum in the plots had no significant effect on CMD spread to the healthy guards (p=0.118) in 2002B. In contrast 2003A, cassava variety and the initial “health status” of the plots significantly influenced spread of CMD to the healthy guards (p<0.001).
0
20
40
60
80
100
0 1 2 3 4 5 6 7
CM
D in
cid
en
ce (
%)
MAP
NjuleNase 4MatookeKabwaBao 0
20
40
60
80
100
0 1 2 3 4 5 6 7CM
D In
cid
en
ce (
%)
MAP
Njule
Nase 4
Matooke
Kabwa
Bao
0
20
40
60
80
100
0 1 2 3 4 5 6 7
CM
D in
cid
en
ce (
%)
MAP
NjuleNase 4MatookeKabwaBao 0
20
40
60
80
100
0 1 2 3 4 5 6 7
CM
D In
cid
en
ce (
%)
MAP
Njule
Nase 4
Matooke
Kabwa
Bao
a b
c d

American Journal of Experimental Agriculture, 2(1): 111-132, 2012
116
Figure 2. Monthly incidence (%) of CMD observed in whole plots of each of five cassava varieties at Bulindi when grown from either healthy (a & b) or diseased (c & d) cuttings during the seasons 2002B (a & c) and 2003A (b & d)
0
20
40
60
80
100
0 1 2 3 4 5 6 7
CM
D In
cid
en
ce (
%)
MAP
0
10
20
30
40
0 1 2 3 4 5 6 7
CM
D In
cid
en
ce (
%)
MAP
Tongolo
Nase 4
Sibampale
Nyaraboke
Bao
0
20
40
60
80
100
0 1 2 3 4 5 6 7
CM
D In
cid
en
ce (
%)
MAP
0
20
40
60
80
100
0 1 2 3 4 5 6 7
CM
D In
cid
en
ce (
%)
MAP
d c
b a

American Journal of Experimental Agriculture, 2(1): 111-132, 2012
117
Significant interactive effects of variety and health status on guard CMD incidence occurred in 2003A (p<0.001) but not in 2002B may be because of the higher disease associated with larger adult whitefly numbers in 2002B. In 2002B, Matooke and Njule had the highest guard row incidences (100 and 99.5, and 97.6 and 98.3, respectively) in the healthy and diseased plots. Where the ‘core’ plants were derived from diseased cuttings, significantly higher CMD spread was recorded in the guard rows of the varieties Kabwa and Bao than the equivalent healthy plots. In contrast, disease inoculum in the core had no significant effect on the varieties Matooke, Njule or Nase 4 (Figure 3). However, in 2003A, higher spread of disease was observed in the guard rows of Bao, Matooke and Njule that surrounded diseased cores. An exception was observed for the variety Kabwa where higher disease incidences were recorded in guard rows that surround healthy cores (79.7%) compared to those surrounding diseased cores (71.3%). No significant differences were observed in guard rows of the variety Nase 4 regardless of the initial health status of the core plants (Figure 3b). However, higher CMD incidence occurred in 2002B compared to 2003A in all the varieties. At Bulindi in trial 2002B, there was a significant influence of variety (p<0.001) and health status (p=0.048) on incidence CMD in the guard rows, whereas the variety x health status interaction did not have a significant effect on guard row incidence. The resistant Nase 4 had no CMD in the guards throughout the experiment. However, Nyaraboke recorded the highest CMD incidence at 6 MAP in the guard rows in both “healthy” (37.7%) and diseased (43.9%) plots. Nyaraboke was followed by variety Tongolo (31.2%), Bao (14.2%) and Sibampale (12.7%) in the ‘healthy’ plots; and Tongolo (33.8%), Sibampale (28.2) and Bao (18.1%) in the ‘diseased’ plots (Figure 3c). The presence of CMD inoculum nearly significantly increased CMD spread in varieties Sibampale, Nyaraboke and Bao but not in Tongolo (Figure 3c). 3.1.3 Incidence of whitefly-transmitted CMD There was considerable latent infection observed on the landraces in Bulindi in 2002A. As a consequence, CMD spread to the healthy plants after 1 MAP by adult whiteflies was used to determine the influence of amount of inoculum on CMD spread. Significant differences were observed among varieties. Variety x health status also significantly influenced the amount of whitefly-transmitted CMD (p<0.001), but the amount of CMD inoculum had no significant effect (p = 0.208). The ‘healthy’ (1.0%) and ‘diseased’ (2.9%) plots of Nase 4 had the lowest ‘whitefly-transmitted’ CMD incidence, while Nyaraboke (‘healthy’ plots) and Bao (‘diseased’ plots) had the highest whitefly-transmitted CMD incidences (Figure 4). The CMD inoculum significantly influenced amount of whitefly-transmitted CMD in the varieties Tongolo, Sibampale and Bao (Figure 4). However, in the variety Nyaraboke, there was higher whitefly-transmitted CMD in the “healthy” than “diseased” plots. In contrast, for Nase 4, there was low whitefly transmission of CMD regardless of the initially health status of the cuttings (Figure 4). 3.1.4 Severity of cassava mosaic disease (CMD) The overall severity of CMD was calculated for the “healthy” and “diseased” plots and separately for ‘core plants’ and ‘guard rows’ surrounding them. The plot severities allowed the comparison of disease severities in the different varieties tested. Severity of core plants allowed the comparison of disease intensity in the initially ‘healthy’ and ‘diseased plants of different varieties while that of the guard rows allowed for the assessment of the influence of inoculum pressure on the development of CMD. Whitefly- transmitted CMD severity was similarly used to assess influence of CMD inoculum pressure on disease intensity in 2002A.

American Journal of Experimental Agriculture, 2(1): 111-132, 2012
118
Figure 3. Incidence (%) of CMD recorded in the initially healthy “guard rows” of
‘healthy’ and ‘diseased’ plots of five cassava varieties at 6 months after planting in Mukono during 2002B (a); 2003A (b) and at Bulindi in 2002B (c)
0
20
40
60
80
100
Njule Nase 4 Matooke Kabwa Bao
Gu
ard
CM
D in
cid
en
ce (
%)
Variety
L.s.d var (0.05) = 4.292 L.s.d health status (0.05) = 2.714
0
20
40
60
80
100
Njule Nase 4 Matooke Kabwa Bao
Gu
ard
CM
D In
cid
en
ce (
%)
Variety
Healthy Diseased
L.s.d var (0.05) = 2.598 L.s.d health status (0.05) = 1.643
0
10
20
30
40
50
Tongolo Nase 4 Sibampale Nyaraboke Bao
Gu
ard
ro
w C
MD
in
cid
en
ce (
%)
Variety
L.s.d (0.05) = 3.96
a
c
b

American Journal of Experimental Agriculture, 2(1): 111-132, 2012
119
Figure 4. Whitefly-transmitted incidence (%) of CMD recorded in the initially healthy guard rows of five cassava varieties 6 MAP in Bulindi during the first season of 2002
(2002A) 3.1.5 Severity of CMD in ‘Healthy’ and ‘Diseased’ plots Generally, high CMD severities (mean severity >3) were recorded at Mukono in all the landraces plus the susceptible check, Bao (Figure 5). For all varieties except Nase 4, significant increases in disease severity occurred between 5 MAP and 6 MAP (Figure 5). Disease severity on Nase 4 did not show any significant increases in the ‘healthy’ plots (mean severity was 2) but fluctuated in the ‘diseased’ plots (Figures 5a and 5b).
Figure 5. Mean severity of CMD recorded on plots containing originally healthy (a) or diseased (b) plants of five cassava varieties in Mukono during the first season of 2003 At Bulindi in both seasons, more severe symptoms (2.9 and 3.5, and 2.4 and 3.1) were recorded in the ‘healthy’ and ‘diseased’ plots of the local varieties compared to the resistant check, Nase 4 (2.0 and 3.2) (Figure 6). The highest severities occurred on the varieties, Sibampale (3.4 and 3.4) and Nyaraboke (3.1 and 3.5) in their ‘healthy’ and ‘diseased’ plots. In general, disease symptoms were less severe in 2002B compared to 2002A (Figure 6).
0
10
20
30
40
50
Tongolo Nase 4 Sibampale Nyaraboke Bao
Wh
itefl
y-t
ran
sm
itte
d C
MD
in
cid
en
ce (
%)
Variety
Healthy Diseased
L.s.d (0.05) = 3.41
0.0
1.0
2.0
3.0
4.0
0 1 2 3 4 5 6
CM
D S
everi
ty
MAP
0.0
1.0
2.0
3.0
4.0
0 1 2 3 4 5 6
CM
D S
everi
ty
MAP
Njule Nase 4
Matooke Kabwa
Bao
a b

American Journal of Experimental Agriculture, 2(1): 111-132, 2012
120
Figure 6. Mean symptom severity of CMD recorded on plots of originally containing “healthy” (a & b) or “diseased” (c & d) cuttings of five cassava varieties in Bulindi during the first (a & c) and second (b & d) seasons of 2002
0.0
1.0
2.0
3.0
4.0
0 1 2 3 4 5 6 7
CM
D s
everi
ty
MAP
Tongolo Nase 4
Sibampale Nyaraboke
Bao
0.0
1.0
2.0
3.0
4.0
0 1 2 3 4 5 6 7
CM
D S
everi
ty
MAP
0.0
1.0
2.0
3.0
4.0
0 1 2 3 4 5 6 7
CM
D S
everi
ty
MAP
0.0
1.0
2.0
3.0
4.0
0 1 2 3 4 5 6 7
CM
D s
everi
ty
MAP
d
b
c
a

American Journal of Experimental Agriculture, 2(1): 111-132, 2012
121
3.1.6 Disease severity in the “core” plots At Mukono as to be expected, higher disease severities were recorded on plants originally grown from diseased cuttings compared to those grown from healthy cuttings (Figure 7). However, the disease severity in the susceptible check, Bao, was much lower than expected between 4 MAP and 5 MAP (Figure 7a). For plots planted with the resistant check Nase 4, the highest severity recorded in the initially ‘healthy’ core plants was 2.0 with no further increases in disease severity occurring after 2 MAP (Figure 7a). In contrast, plants from initially ‘diseased’ cuttings had a mean severity of 2.0 but thereafter there were little changes in disease intensity (Figure 7b).
Figure 7. Mean severity of CMD recorded on plants in the “Core plots” originally
derived from “healthy” (a) or “diseased” status (b) in each of cuttings of five cassava varieties at Mukono during 2003A
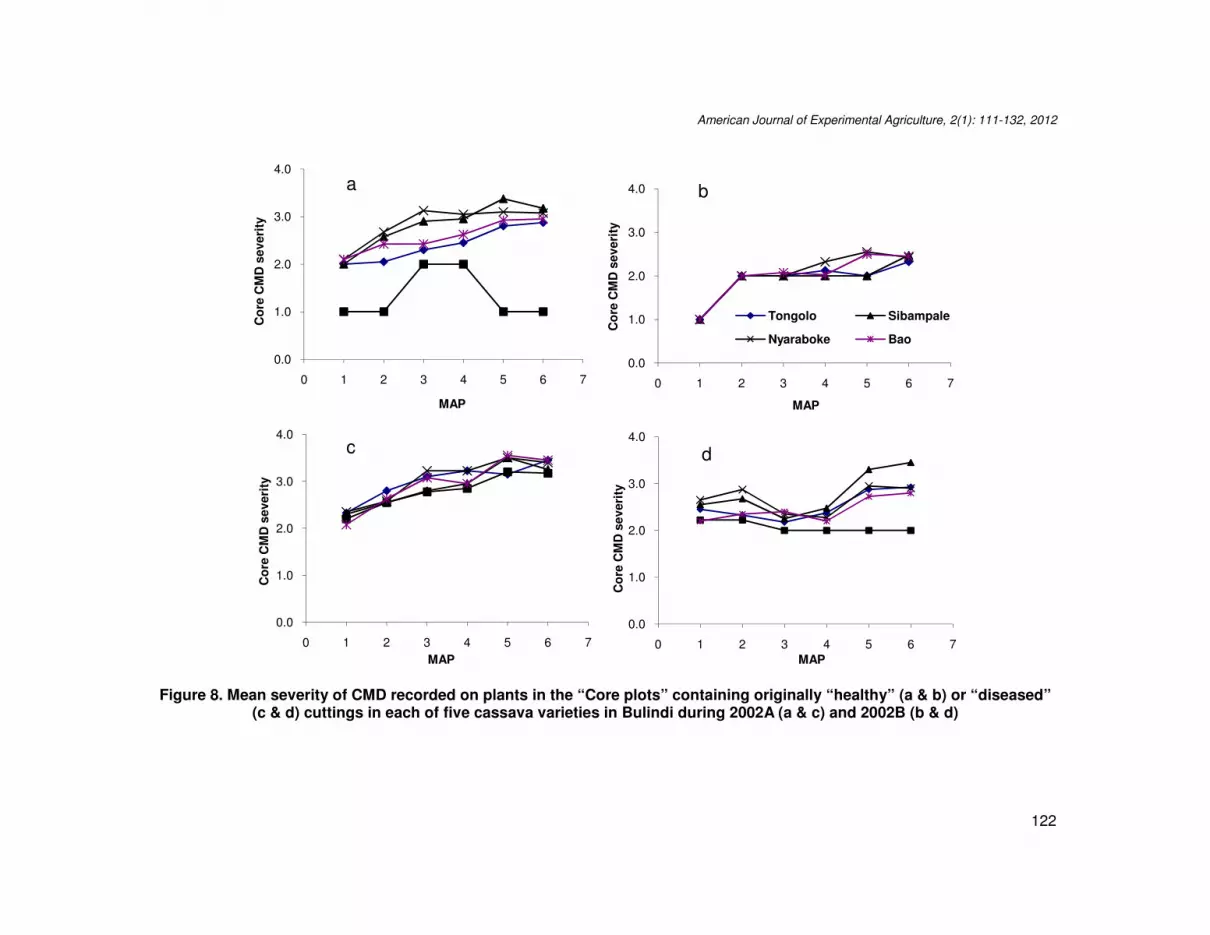
Similarly, at Bulindi plants grown from “diseased” cuttings had higher disease severities compared to those grown from “healthy” cuttings with disease intensities of 2.9 to 3.2 and 2.3 to 2.5 in landraces raised from “healthy” cuttings and 3.3 to 3.5 and 2.9 to 3.5 in those raised from “diseased” cuttings in 2002A and 2002B, respectively. In 2002A, the Nase 4 “core plants” that became infected after 2 MAP recovered after 4 MAP (Figure 8a), while Nase 4 obtained from diseased cuttings in 2002B had an average core severity of 2 (Figure 8d).
3.1.7 Whitefly-transmitted CMD severity Disease severity in plants infected by whitefly varied significantly with variety (p<0.001) and initial health status (p=0.05). Sibampale and Nyaraboke had the highest disease intensities while Nase 4 had the lowest (Figure 9). There was generally a steady increase in symptom severity. However in Nase 4 and Nyaraboke; symptoms tended to decline with time (Figure 9a). 3.1.8 Disease index (DI) The DI depended on the initial health status of plots and variety used (p<0.001). At Mukono, higher DIs were recorded for the local landraces compared to the standard checks (Figure 10). The highest DIs were recorded in plots of Matooke regardless of the initial health status of the cuttings used (DI was 3.4 and 3.6 in healthy and diseased plots, respectively), whereas the lowest DIs were recorded in plots with Nase 4 (Figure 10).
0.0
1.0
2.0
3.0
4.0
0 1 2 3 4 5 6 7
Co
re C
MD
severi
ty
MAP
0.0
1.0
2.0
3.0
4.0
0 1 2 3 4 5 6 7
Co
re C
MD
severi
ty
MAP
Njule Nase 4
Matooke Kabwa
Bao
a b
American Journal of Experimental Agriculture, 2(1): 111-132, 2012
122
Figure 8. Mean severity of CMD recorded on plants in the “Core plots” containing originally “healthy” (a & b) or “diseased” (c & d) cuttings in each of five cassava varieties in Bulindi during 2002A (a & c) and 2002B (b & d)
0.0
1.0
2.0
3.0
4.0
0 1 2 3 4 5 6 7
Co
re C
MD
severi
ty
MAP
0.0
1.0
2.0
3.0
4.0
0 1 2 3 4 5 6 7
Co
re C
MD
severi
ty
MAP
Tongolo Sibampale
Nyaraboke Bao
0.0
1.0
2.0
3.0
4.0
0 1 2 3 4 5 6 7
Co
re C
MD
severi
ty
MAP
0.0
1.0
2.0
3.0
4.0
0 1 2 3 4 5 6 7
Co
re C
MD
severi
ty
MAP
a b
c d

American Journal of Experimental Agriculture, 2(1): 111-132, 2012
123
Figure 9. Mean severity of whitefly-transmitted CMD recorded on plants in plots originally containing “healthy” (a) or
“diseased” (b) cuttings of five cassava varieties in Bulindi during the first season of 2002
Figure 10. Disease index curves recorded on plots originally containing healthy (a) or diseased (b) cuttings of five cassava
varieties in Mukono during the first rains of 2003 (2003A)
0.0
1.0
2.0
3.0
4.0
0 1 2 3 4 5 6 7
W/f
tra
nsm
itte
d C
MD
Severi
ty
MAP
0.0
1.0
2.0
3.0
4.0
0 1 2 3 4 5 6 7
W/f
tra
msm
itte
d C
MD
Severi
ty
MAP
Tongolo Nase 4
Sibampale Nyaraboke
Bao
0.0
1.0
2.0
3.0
4.0
0 1 2 3 4 5 6 7
Dis
ease in
dex
MAP
0.0
1.0
2.0
3.0
4.0
0 1 2 3 4 5 6 7
Dis
ease in
dex
MAP
Njule
Nase 4
Matooke
Kabwa
Bao
a b
a b

American Journal of Experimental Agriculture, 2(1): 111-132, 2012
124
Similarly, at Bulindi, the DI was influenced by variety and original health status of the plots (p<0.001). Higher DIs were recorded in the local landraces compared to the resistant Nase 4 (Figure 11). In 2002A, the DIs indicated no further disease development after 5 MAP (Figure 11a and 11c). In 2002B, Nase 4 had falls in the DIs (Figure 11d).
0.0
0.5
1.0
1.5
2.0
0 1 2 3 4 5 6 7
MAP
Dis
eas
e i
nd
ex
Figure 11. Disease index curves recorded on plots originally containing healthy (a & b) or diseased (c & d) cuttings of five cassava varieties in Bulindi during the first (a &
c) and second (b & d) seasons of 2002 3.1.9 Adult whitefly infestation The whitefly Bemisia tabaci is the main vector of CMD (Dubern 1994; Harrison et al., 1997). It was, therefore, of importance to follow levels of infestation among the varieties under investigation. In Mukono, the mean number of adult whiteflies in plots over the experiment period differed among varieties (p<0.001) and not according to the original health status of the cuttings in either 2002B (p=0.206) or 2003A (p=0.485). Also the mean adult whitefly numbers were not affected by the interaction between variety and initial health status of the plots (p=0.58 and 0.46 in 2002B and 2003A, respectively). In both seasons, Matooke had the largest number of adult whiteflies, followed by Bao, Nase 4, Njule and Kabwa in that order (Figure 12). Significantly more whiteflies were recorded in season 2002B compared to 2003A (Figure 12). At Mukono all the varieties tested had peak whitefly populations at 4 MAP (Figure 13a and 13c) in 2002B and 3 MAP (Figure 13b and 13d) in 2003A regardless of the health status. In all varieties except Kabwa, significant vector population increases were recorded after 5 MAP in 2002B (Figure 13a and 13c). For susceptible check, Bao, whitefly numbers continued to increase even up to the 6 MAP during the 2003A season (Figure 13d).
0.0
0.5
1.0
1.5
2.0
2.5
3.0
3.5
0 1 2 3 4 5 6 7
Dis
ease i
nd
ex
MAP
0.0
0.2
0.4
0.6
0.8
1.0
0 1 2 3 4 5 6 7
Dis
ease i
nd
ex
MAP
Bao
Nase 4
Nyaraboke
Sibampale
Tongolo
0.0
0.5
1.0
1.5
2.0
2.5
3.0
3.5
0 1 2 3 4 5 6 7
Dis
ease i
nd
ex
MAP
a
d c
b

American Journal of Experimental Agriculture, 2(1): 111-132, 2012
125
Figure 12. Mean adult whitefly infestation on top four expanded leaves of plants in
‘healthy’ and ‘diseased’ plots of five cassava varieties at Mukono taken during season 2002B (a) and 2003A (b)
Results of 2002A at Bulindi also showed that adult whitefly populations differed with variety (p<0.001). However, the original health status of the cuttings did not affect whitefly populations (p=0.737). However, in 2002B, neither variety (p=0.150), nor health status (p=0.695) influenced whitefly numbers. In 2002A, Nase 4 and Bao had the highest whitefly numbers while Tongolo had the lowest (Figure 14a). In 2002B, Sibampale, Nyaraboke and Bao had the highest whitefly populations while Tongolo had the lowest (Figure 14b). The age of crop (p<0.001) significantly influenced whitefly populations at Bulindi in both seasons and there was also a significant crop age x variety interaction effect (p=0.005). In 2001A, whitefly populations rose to a peak at 4MAP followed by a decline (Figure 15a and 15c). In 2002B the adult whitefly numbers kept rising reaching a maximum at 6 MAP (Figure 15b & 15d).
0
10
20
30
40
50
60
70
Njule Nase 4 Matooke Kabwa Bao
Mean
ad
ult
wh
itefl
y p
op
ula
tio
n
Variety
Healthy
Diseased
L.s.d (0.05) = 12.24
0
1
2
3
4
5
6
7
8
9
10
Njule Nase 4 Matooke Kabwa Bao
Mean
ad
ult
wh
itefl
y p
op
ula
tio
n
Variety
L.s.d (0.05) = 2.03
a
b

American Journal of Experimental Agriculture, 2(1): 111-132, 2012
126
Figure 13. Monthly population means of adult whiteflies taken on top four expanded leaves of plants in either ‘healthy’ (a &
b) or ‘diseased’ (c & d) plots of varieties Njule, Nase 4, Matooke, Kabwa and Bao grown at Mukono during the second season of 2002 (a & c) and first season of 2003 (b & d)
0
20
40
60
80
100
120
140
0 1 2 3 4 5 6 7
Ad
ult
wh
itefl
y p
op
ula
tio
n
MAP
Njule
Nase 4
Matooke
Kabwa
Bao
0
5
10
15
20
25
0 1 2 3 4 5 6 7
Ad
ult
wh
itefl
y p
op
ula
tio
n
MAP
0
20
40
60
80
100
120
0 1 2 3 4 5 6 7
Ad
ult
wh
itefl
y p
op
ula
tio
n
MAP
0
2
4
6
8
10
12
14
16
18
20
0 1 2 3 4 5 6 7A
du
lt w
hit
efl
y p
op
ula
tio
n
MAP
c d
a b

American Journal of Experimental Agriculture, 2(1): 111-132, 2012
127
Figure 14. Mean adult whitefly populations on top four expanded leaves of plants in
‘healthy’ and ‘diseased’ plots of varieties Tongolo, Nase 4, Sibampale, Nyaraboke and Bao at Bulindi taken during the first (a) and second (b) seasons of 2002
3.1.10 Area under disease progress curves (AUDPC) The total amount of disease that occurred in the experiments was calculated and presented as the area under disease progress curve (AUDPC). The AUDPC of the different varieties was compared and results presented below. AUDPC values differed with variety (p<0.001). In Mukono, Matooke had the highest values in both the “healthy” and “diseased” plots, while the resistant Nase 4 had the lowest. The susceptible check also had lower AUDPC values compared to any of the landraces (Figure 16). As expected AUDPCs were larger for plots originally containing “diseased” cuttings compared to the “healthy” (Figure 16). However, this was not so for variety Kabwa during the 2003A season (Figure 16b). In both seasons at Bulindi, the amount of disease (AUDPC) differed with both variety and the original health status of the core plants (p<0.001). Nyaraboke had the highest and Nase 4 the lowest AUDPC values in both the “healthy” and “diseased” plots (Figure 17). AUDPCs in 2002A were higher than those in 2002B (Figure 17).
0
2
4
6
8
10
12
Tongolo Nase 4 Sibampale Nyaraboke Bao
Ad
ult
wh
itefl
y p
op
ula
tio
n
Variety
Healthy Diseased
L.s.d (0.05) = 2.515
0
2
4
6
8
10
12
Tongolo Nase 4 Sibampale Nyaraboke Bao
Ad
ult
wh
ite
fly p
op
ula
tio
n
Variety
Healthy Diseased
L.s.d (0.05) =3.971
a
b
a
b

American Journal of Experimental Agriculture, 2(1): 111-132, 2012
128
Figure 15. Population of adult whiteflies in plots of varieties Tongolo, Nase 4, Sibampale, Nyaraboke and Bao originally containing either healthy (a & b) or diseased (c & d) cuttings at Bulindi during the first (a & c) and second (b & d) seasons of
2002
0
5
10
15
20
25
30
35
40
0 1 2 3 4 5 6 7
Ad
ult
wh
itefl
y p
op
ula
tio
n
MAP
Tongolo
Nase 4
Sibampale
Nyaraboke
Bao
0
5
10
15
20
25
30
35
40
0 1 2 3 4 5 6 7
Ad
ult
wh
itefl
y p
op
ula
tio
n
MAP
0
5
10
15
20
25
30
35
40
0 1 2 3 4 5 6 7
Ad
ult
wh
itefl
y p
op
ula
tio
n
MAP
0
5
10
15
20
25
30
35
40
0 1 2 3 4 5 6 7
Ad
ult
wh
itefl
y p
op
ula
tio
nMAP
b
d
a
c

American Journal of Experimental Agriculture, 2(1): 111-132, 2012
129
Figure 16. Total amount of disease expressed as the area under disease progress curve (AUDPC) recorded on five varieties grown in Mukono during the second season of 2002 (a) and first season of 2003 (b)
Figure 17. Total amount of disease expressed as the area under disease progress curve (AUDPC) recorded on five varieties grown in Bulindi during the first (a) and second (b) seasons of 2002
0
50
100
150
200
250
Njule Nase 4 Matooke Kabwa Bao
AU
DP
C
Variety
Healthy Diseased
L.s.d var (0.05)=10.43 L.s.d health status(0.05)= 6.60
0
50
100
150
200
250
Njule Nase 4 Matooke Kabwa Bao
AU
DP
C
Variety
L.s.d var (0.05)=3.84 L.s.d Health status (0.05)=2.43
0
50
100
150
200
250
Tongolo Nase 4 SibampaleNyaraboke Bao
AU
DP
C
Variety
Healthy Diseased
L.s.d Var (0.05) = 7.44 L.s.d health status (0.05) = 4.70
0
20
40
60
80
100
120
140
Tongolo Nase 4 SibampaleNyaraboke Bao
AU
DP
C
Variety
L.s.d var (0.05) = 5.940 L.s.d health status (0.05) = 3.76
a b
a
b

American Journal of Experimental Agriculture, 2(1): 111-132, 2012
130
3.2 Discussion The results showed differences in susceptibility (response to infection) to CMD among varieties tested, with landraces consistently having higher CMD incidences than the resistant Nase 4. There was considerable variation in the incidence and severity of CMD. The results also showed differences in the whitefly populations among the different cassava varieties and locations. For example, at Mukono there were high whitefly populations accompanied by high spread of disease and over 75% of plants in the initially healthy plots of the landraces were infected by 6 MAP, these having even higher CMD incidences than the susceptible check, Bao. At Bulindi, the landraces and Bao were also more susceptible to CMD than the resistant Nase 4. These results imply that landraces tested in both Mukono and Bulindi are quite susceptible to CMD. Varietal differences in whitefly infestation and sensitivity to CMD confirm previous findings (Otim-Nape et al., 1998; 2001; Omongo, 2003; Thresh et al., 1994a, b; Byabakama et al., 1999), which emphasize the importance of susceptibility to CMD of cassava genotypes grown in influencing spread of CMD by whiteflies and disease development. According to Legg and Ogwal, 1998, the amount of infected material in the locality also has an influence on CMD spread by whiteflies, which could explain differences in disease spread in the different areas. The initially healthy guard rows of diseased and healthy plants at Mukono had equally high CMD incidences, while at Bulindi healthy plants grown alongside diseased cores had higher CMD incidences than those bordering “healthy” materials used, which could be due to high level of inoculum in the neighborhood of the Mukono experimental site, with less in the Bulindi site neighborhood. The varieties grown in Bulindi exhibited moderate disease severities ranging between 2.5 to 3.5 while those at Mukono exhibited very severe symptoms up to 4.0. In fact, for Mukono the local landraces exhibited higher severity levels than the susceptible check, Bao whereas those in Bulindi exhibited lower or similar severities than Bao. In most of the varieties, diseased plants had lower whitefly infestation than healthy plants. Fewer whiteflies on diseased plants should have been as a result of their emigration to the healthy leaves as less surface area is available for colonization, which occurs as a result of infection by virulent CMB strains (Ayanru and Sharma, 1982; Maruthi 2001; Omongo 2003). This migration thus leads to high spread of CMD in the susceptible cassava varieties.
4. CONCLUSION At Bulindi and other areas where there is low CMD disease pressure, it is likely that use of clean planting material could reduce disease spread and thus it is possible to use disease-free materials of local landraces under such conditions. On the other hand in areas like Mukono where the CMD pressure is high, it’s unlikely to deploy landraces but only improved resistant varieties can be grown and offer the only CMD management tool.
COMPETING INTERESTS Authors have declared that no competing interests exist.

American Journal of Experimental Agriculture, 2(1): 111-132, 2012
131
REFERENCES Ayanru, D.K.G., Sharma, V.C. (1982). Effects of cassava mosaic disease on certain
parameters of field grown cassava clones. Phytopathology, 72, 1057 – 1059. Bua, A., Baguma, Y.K., Otim- Nape, G.W., Ssemakula, G.N., Acola, G., Ogwal, S. (1999).
Approaches to multiplication and distribution of cassava mosaic disease-resistant cassava varieties: the NARO/ Gatsby experience. Proceedings of the workshop on Cassava Mosaic Disease Management in Smallholder Cropping Systems, Jinja Uganda, 7- 9 December 1998, pp. 101- 110 (eds. R.J. Cooter, G.W. Otim-Nape, A. Bua, J. M. Thresh).
Byabakama, B. A., Adipala, E., Ogenga-Latigo, M.W., Otim-Nape, G.W. (1999). The effect of amount and disposition of inoculum on cassava mosaic virus disease development and tuberous root yield of cassava. African Journal of Plant Protection, 7, 45 – 57.
Campbell, C.L., Madden, L.V. (1990). Introduction to Plant Disease Epidemiology. John Wiley and Sons Inc. 532 pp. USA.
Dubern, J. (1994). Transmission of African cassava mosaic Geminivirus by the whitefly (Bemisia tabaci). Tropical Science, 34, 82–91.
Fargette, D., Vie, K. (1994). Modeling the temporal primary spread of African cassava mosaic virus into plantings. Phytopathology, 84, 378–382.
Harrison, B.D., X. Zhou, G.W, Otim-Nape, Y, Liu, D., Robinson, J. (1997). Role of a novel type of double infection in the Geminivirus-induced epidemic of severe cassava mosaic in Uganda. Annals of Applied Biology, 131, 437–448.
Lawes Agricultural Trust, Rothamsted Experimental Station (2005). Genstat 5 Second Edition (for Windows).
Legg, J.P., Ogwal, S. (1998). Changes in the incidence of African cassava mosaic Geminivirus and the abundance of its whitefly vector along south–north transects in Uganda. Journal of Applied Entomology, 122, 169–178.
Maruthi, M.N. (2001). Bemicia tabaci and geminivirus variability in relation to cassava mosaic disease. Ph.D. Thesis. University of Greenwich, UK.
Omongo, C.A. (2003). Cassava whitefly Bemicia tabaci, behaviour and ecology in relation to the spread of the cassava mosaic epidemic in Uganda. Ph.D. Thesis. Natural Resources Institute, University of Greenwich, UK.
Otim-Nape, G.W., Alicai, T., Thresh, J.M. (2001). Changes in the incidence and severity of cassava mosaic virus disease, varietal diversity and cassava production in Uganda. Annals of Applied Biology, 138, 313 – 327.
Otim-Nape, G.W., Bua, A., Thresh, J.M., Baguma Y., Ogwal, S., Ssemakula, G.N., Acola, G., Byabakama, B., Colvin, J., Cooter, R.J., Martin, A. (2000). The current pandemic of cassava mosaic virus disease in East Africa and its control. NARO, NRI, DFID. Natural Resources Institute, Chatham, UK. 100 pp.
Otim-Nape, G.W, Shaw, M.W., Thresh, J.M. (1994). The effects of African cassava mosaic virus on the growth and yield of cassava in Uganda. Tropical Science, 34, 43- 54.
Otim-Nape, G.W., Thresh, J.M., Bua, A., Baguma, Y., Shaw, M.W. (1998). Temporal spread of cassava mosaic disease in a range of cassava cultivars in different agro-ecological regions of Uganda. Annals of Applied Biology, 133, 415 - 430.
Sserubombwe, W.S. (1998). Progress of cassava mosaic disease (CMD) and its effects on growth and yield in different cassava varieties under epidemic conditions in Uganda. M.Sc. Thesis, Makerere University, Kampala, Uganda.
Terry, E.R., Hahn, S.K. (1980). The effect of cassava mosaic disease on growth and yield of a local and an improved variety of cassava. Tropical Pest Management, 26, 34 – 37.

American Journal of Experimental Agriculture, 2(1): 111-132, 2012
132
Thresh, J.M., Fargette, D., Otim-Nape, G.W. (1994a). The viruses and virus diseases of
cassava in Africa. Africa Crop Science, 2, 459-478. Thresh, J.M., Fishpool, L.D., Otim-Nape, G.W., Fargette, D. (1994b). African cassava mosaic
virus disease: an under-estimated and unsolved problem. Tropical Science, 34, 3-14. _________________________________________________________________________ © 2012 Adriko et al; This is an Open Access article distributed under the terms of the Creative Commons Attribution License (http://creativecommons.org/licenses/by/3.0), which permits unrestricted use, distribution, and reproduction in any medium, provided the original work is properly cited.