Embed Size (px)
Citation preview
www.elsevier.com/locate/biocon
Biological Conservation 122 (2005) 465–478
BIOLOGICAL
CONSERVATION
Responses of butterfly and moth species to restored cattlegrazing in semi-natural grasslands
Juha Poyry *, Sami Lindgren, Jere Salminen, Mikko Kuussaari
Finnish Environment Institute, Research Programme for Biodiversity, Mechelininkatu 34 A, P.O. Box 140, FIN-00251 Helsinki, Finland
Received 2 March 2004; received in revised form 18 August 2004; accepted 3 September 2004
Abstract
The effects of restorative grazing on the abundance of butterfly and moth species were studied in mesic semi-natural grasslands of
SW Finland differing in management history: (1) old continuously grazed, (2) restored (with ca 5 years of reinitiated grazing), and
(3) abandoned former pastures.
Generalized linear modelling of species abundances and indicator species analysis produced qualitatively similar results. Only
three species (Polyommatus icarus, Lycaena hippothoe and Camptogramma bilineatum) were most abundant in old pastures, whereas
12 species (Polyommatus semiargus, Polyommatus amandus, Brenthis ino, Aphantopus hyperantus, Scopula immorata, Idaea serpen-
tata, Scotopteryx chenopodiata, Epirrhoe alternata, Cybosia mesomella, Polypogon tentacularius, Hypena proboscidalis and Crypto-
cala chardinyi) were most abundant in abandoned pastures. None of the old-pasture species had become more abundant in restored
pastures. Three species, Epirrhoe hastulata, Xanthorhoe montanata and Chiasmia clathrata, occurred equally abundantly in aban-
doned and in restored pastures indicating a slow progress of restoration.
Species associated with old pastures differed from species associated with abandoned pastures in their recent distributional
changes in Finland. The species of old pastures showed decreasing trends, whereas those of abandoned pastures showed mainly
increasing trends in their distribution. In five out of 11 species, the preferred successional stage differed markedly between this study
and previous studies conducted in Central Europe.
We conclude that (1) ca 5 years of restorative grazing in mesic grasslands has been insufficient for the colonisation of old-pasture
species in the restored sites, (2) different management intensities are needed regionally for the maintenance of grassland insect diver-
sity and (3) application of the knowledge on successional preferences of different species in conservation management, even in cli-
matically similar regions, should be made with caution.
� 2004 Elsevier Ltd. All rights reserved.
Keywords: Butterflies and moths; Cattle grazing; Restoration management; Semi-natural grasslands; Species responses
1. Introduction
Agricultural modernization has caused a widespread
decline of organisms in European agricultural land-
scapes (Krebs et al., 1999; Benton et al., 2003). Pres-
ently, national agri-environment support schemes are
0006-3207/$ - see front matter � 2004 Elsevier Ltd. All rights reserved.
doi:10.1016/j.biocon.2004.09.007
* Corresponding author. Tel.: +358 9 40300 206; fax: +358 9 40300
290.
E-mail address: [email protected] (J. Poyry).
the main tool in attempts to halt and eventually reverse
this negative development (Sutherland, 2002; Kleijn and
Sutherland, 2003). Existing schemes have indeed pro-
duced positive effects on some organisms (Ovenden
et al., 1998; Kleijn et al., 2001). However, it is becoming
evident that their impact is not sufficient and new meth-
ods for the management of agricultural biodiversity are
urgently needed (Sutherland, 2002). Initiatives for new,more comprehensive means such as large-scale habitat
restoration have also been proposed (Bignal, 1998; Suth-
erland, 2002). One of the potentially very important
466 J. Poyry et al. / Biological Conservation 122 (2005) 465–478
means is the use of grazing animals to restore semi-nat-
ural grasslands from abandoned and overgrown former
semi-natural pastures or from improved grassland pas-
tures and cultivated fields (WallisDeVries, 1995).
Grazing management is commonly used in the resto-
ration of semi-natural habitats (WallisDeVries et al.,1998). The prevailing management regimes that are ap-
plied in many European countries are targeted at inten-
sive grazing, which has been demonstrated to be most
suitable in maintaining and restoring high vascular spe-
cies diversity (e.g., Bakker, 1998). Our knowledge on
the effects of restorative grazing on other organisms such
as insects is largely based on studies focusing on an indi-
vidual declining or threatened species, often a butterfly,with a high conservation status (Thomas, 1991; Pullin,
1996). Among the few available studies, both positive
and negative responses to restarted grazing management
have been reported (Thomas, 1990, 1991; Dolek and
Geyer, 2002). Failed attempts at restoration due to
unsuitable grazing intensity have also been documented
(Oates, 1995). A clear gap in our knowledge is that the
effects of restoration with grazing on insect communitiesin semi-natural habitats have been only rudimentarily
studied, as is also the case with overall species-specific re-
sponses (but see WallisDeVries and Raemakers, 2001). It
is thus imperative to gather further knowledge concern-
ing what proportion of insect species, and more specifi-
cally which species, are expected to react positively and
which negatively to the effects of restored grazing.
Many studies have explored the abundance of insects(often butterflies, seldom moths) over a continuum of
successional stages in grasslands. The insect communi-
ties of grasslands with low vegetation caused by high
grazing intensity have typically been compared with
areas where extensive grazing (i.e., grazing with lower
intensity) and/or increasing periods of abandonment
have resulted in higher vegetation. These reports include
both qualitative (Erhardt, 1985; BUTT, 1986; Erhardtand Thomas, 1991; Oates, 1995) and quantitative (Bal-
mer and Erhardt, 2000) approaches in comparing spe-
cific responses to successional development of
vegetation. However, it is not known whether this
knowledge can directly be applied to predict possible
specific responses to restarted grazing.
In this paper we present results from a large-scale field
study in which we examined the responses of butterflyand day-active moth species to restorative grazing. We
compared the abundances of different species among
old, restored and abandoned former pastures. We also
investigated whether the observed distributional changes
differed among the groups of species assigned to the stud-
ied pasture types. The analysis was based on the records
published in the Atlas of FinnishMacrolepidoptera (Hul-
den et al., 2000). We chose butterflies and macromoths asthe study group due to the existing standard tools (e.g.,
Pollard�s transect method), their well known ecology,
and because they have generally been widely used as
model taxa in various ecological and environmental stud-
ies (Pollard and Yates, 1993; Boggs et al., 2003).
The effects of restorative grazing on species composi-
tion, richness, diversity and general abundance have
been dealt with in a separate paper (Poyry et al.,2004). The corresponding results for vascular plant com-
munity structure within the same study areas have been
presented by Pykala (2003).
2. Material and methods
2.1. Study sites
Three kinds of mesic semi-natural grasslands, in total
33 sites, differing in their management history were stud-
ied in SW Finland: (1) old pastures, which have been
grazed annually for at least several decades or longer
(n = 6 for 1999 and n = 5 for 2000), (2) abandoned pas-
tures, where grazing ceased >10 years ago (n = 6 for
1999 and n = 6 for 2000) and (3) restored pastures, wheregrazing was reinitiated ca 5 (min = 3, max = 8) years ago
after >10 years of abandonment (n = 6 for 1999 and n = 4
for 2000) (Fig. 1). A list of the sites and their main char-
acteristics has been presented in Poyry et al. (2004).
In 1999, all the study sites were located in Somero,
along the Hantala valley region, within an area of 20
km2 comprising the largest occurrence of semi-natural
grasslands in the country (Kontula et al., 2000), but in2000 they were located in a larger area of 30 · 100 km2
in SW Finland (Fig. 1). In 1999, areas of the study sites
varied from 0.29 to 1.31 ha, whereas in 2000 all sampled
areas were 0.25 ha in size. All sites were located along
small river valleys and brooks. The average nearest-
neighbour distance among the sites was 600 m in 1999
and 7300 m in 2000. A typical slope orientation at the
sites was SE, S or SW, with a slope angle from 5� to20�. The predominant soil type in the study sites was clay.
Old pastures were selected from the sites which had
been located and evaluated as botanically valuable in
the National inventory of semi-natural grasslands
(Vainio et al., 2001). These were supplemented with
comparable restored pastures included in the Finnish
agri-environmental scheme and partly overgrown yet
still unforested abandoned pastures located in the sameregion. All restored pastures and most old pastures were
included in the Finnish agri-environmental support
scheme for the management of semi-natural grasslands
(Salminen and Kekalainen, 2000). The grazing animal
in all pastures was cattle, usually dairy heifers but in
four cases beef cattle. All except two sites were owned
by local farmers and other private land-owners. None
of the sites were located in a nature conservation area,but about 2/3 of the sites were included in the Finnish
proposal for the EU Natura 2000-network.
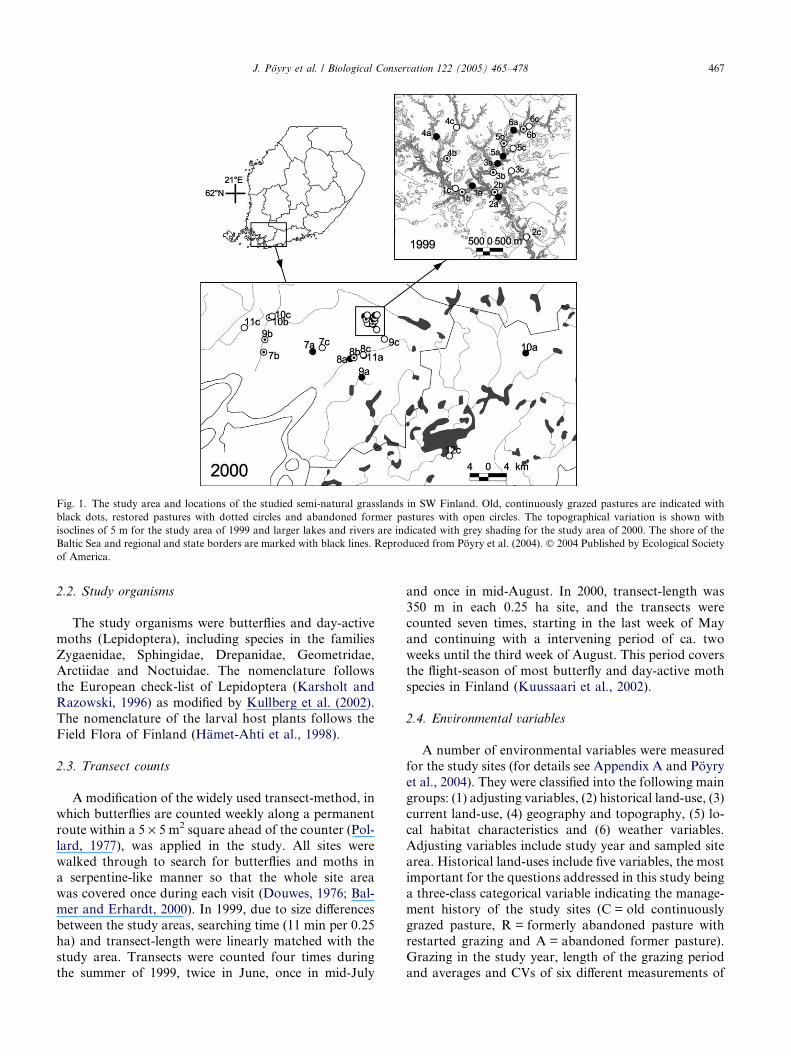
Fig. 1. The study area and locations of the studied semi-natural grasslands in SW Finland. Old, continuously grazed pastures are indicated with
black dots, restored pastures with dotted circles and abandoned former pastures with open circles. The topographical variation is shown with
isoclines of 5 m for the study area of 1999 and larger lakes and rivers are indicated with grey shading for the study area of 2000. The shore of the
Baltic Sea and regional and state borders are marked with black lines. Reproduced from Poyry et al. (2004). � 2004 Published by Ecological Society
of America.
J. Poyry et al. / Biological Conservation 122 (2005) 465–478 467
2.2. Study organisms
The study organisms were butterflies and day-active
moths (Lepidoptera), including species in the families
Zygaenidae, Sphingidae, Drepanidae, Geometridae,
Arctiidae and Noctuidae. The nomenclature follows
the European check-list of Lepidoptera (Karsholt and
Razowski, 1996) as modified by Kullberg et al. (2002).
The nomenclature of the larval host plants follows the
Field Flora of Finland (Hamet-Ahti et al., 1998).
2.3. Transect counts
Amodification of the widely used transect-method, in
which butterflies are counted weekly along a permanent
route within a 5 · 5 m2 square ahead of the counter (Pol-
lard, 1977), was applied in the study. All sites were
walked through to search for butterflies and moths ina serpentine-like manner so that the whole site area
was covered once during each visit (Douwes, 1976; Bal-
mer and Erhardt, 2000). In 1999, due to size differences
between the study areas, searching time (11 min per 0.25
ha) and transect-length were linearly matched with the
study area. Transects were counted four times during
the summer of 1999, twice in June, once in mid-July
and once in mid-August. In 2000, transect-length was
350 m in each 0.25 ha site, and the transects werecounted seven times, starting in the last week of May
and continuing with a intervening period of ca. two
weeks until the third week of August. This period covers
the flight-season of most butterfly and day-active moth
species in Finland (Kuussaari et al., 2002).
2.4. Environmental variables
A number of environmental variables were measured
for the study sites (for details see Appendix A and Poyry
et al., 2004). They were classified into the following main
groups: (1) adjusting variables, (2) historical land-use, (3)
current land-use, (4) geography and topography, (5) lo-
cal habitat characteristics and (6) weather variables.
Adjusting variables include study year and sampled site
area. Historical land-uses include five variables, the mostimportant for the questions addressed in this study being
a three-class categorical variable indicating the manage-
ment history of the study sites (C = old continuously
grazed pasture, R = formerly abandoned pasture with
restarted grazing and A = abandoned former pasture).
Grazing in the study year, length of the grazing period
and averages and CVs of six different measurements of
468 J. Poyry et al. / Biological Conservation 122 (2005) 465–478
grazing intensity were included as measures of current
land-use. Geography and topography variables include
latitude, longitude and a solar radiation index calculated
from slope direction and steepness (Griffiths, 1985; Luo-
to et al., 2001). Local habitat characteristics include 11
variables, comprising measures of vascular plant speciesrichness and density and nectar plant density indices.
Weather variables included the annual averages and
CVs of temperature, wind speed, cloudiness, proportion
of direct sun-shine during a count and proportion of
counts made under inappropriate weather conditions
(there were only a few such cases).
2.5. Data analysis
Two main methods were used to compare abun-
dances of individual species between the three pasture
types: generalized linear modelling (GLM) and indicator
species analysis (ISA).
Generalized linear modelling (McCullagh and Nelder,
1989) as implemented in the software GLIM, version
3.77 (Payne, 1986; Nicholls, 1991; Crawley, 1993) wasused to construct multiple regression models. The re-
sponse variables were abundances of individual species
with a minimum of 15 observed individuals. The analy-
sis of Parnassius mnemosyne was restricted to the study
area of 1999 due to the isolated nature of its occurrence
(Luoto et al., 2001).
The variables adjusting for the effects of study-year
(1 = 1999, 2 = 2000) and area were forced first into theexplanatory models. As the main question of this study
was to compare species abundance among three groups
of grasslands, grazing history was next added to the
models as a categorical explanatory variable. An F-ratio
test of the deviance reduction was applied to test for the
statistical significance of inclusion of the explanatory
variable into the model (McCullagh and Nelder, 1989;
Crawley, 1993).As multiple statistical tests from the same data set can
potentially increase the probability of making Type I er-
rors (i.e., rejecting true H0 of no difference between the
pasture types), more stringent significance levels with
sequential Bonferroni correction were calculated for
the tested species (Rice, 1989). Because different species
can be considered as independent entities, arguments
may be presented both for and against the necessity ofusing corrections for multiple testing to eliminate Type
I errors (Cabin and Mitchell, 2000; Quinn and Keough,
2002). It is also clear that attempts to eliminate Type I
errors inflate Type II errors (i.e., accepting false H0 of
no difference between the pasture types), and cause loss
of power in the statistical tests used and inability to de-
tect existing real differences (Cabin and Mitchell, 2000;
Quinn and Keough, 2002). In our case, 32 parallelGLM tests with p < 0.05 would create a family-wise er-
ror rate of 81% of making one Type I error (Quinn and
Keough, 2002). Simultaneously, application of sequen-
tial Bonferroni correction caused a drop from 19 to 12
of the species with strong evidence against H0. This
means that by eliminating 1 Type I error we may intro-
duce 6 Type II errors of not detecting real abundance
difference among the pasture types. Hence, we showoriginal uncorrected p-values but also indicate which
species showed strong evidence against H0 with Bonfer-
roni corrected significance levels.
Finally, a posteriori pair-wise F-ratio tests with
GLMs were applied to the species with significant differ-
ences in abundance among the three pasture types so
that abundances in two pasture types were compared
at the same time.Indicator species analysis (ISA) (Dufrene and Legen-
dre, 1997) as implemented in the software PC-ORD ver-
sion 4.22 (McCune and Mefford, 1999) was applied to
study whether an individual butterfly or moth species
would show indicator value for any of the three pasture
types. An indicator value for each species i in each group
j of sites was calculated according to Dufrene and Leg-
endre (1997):
INDVALij ¼ Aij � Bij � 100; ð1Þ
where INDVALij = indicator value for species i in group
j, Aij = relative abundance of species i in group j and
Bij = relative frequency of species i in group j. In this
method the highest indicator value max[INDVALij] is
saved as a summary of the overall indicator value IND-
VALi of the species i. Statistical significance of IND-
VALi was evaluated using a Monte Carlo method, i.e.,by randomly rearranging the data for a large number
of times, with the default in the software being 1000
times. After the rearrangement procedure, a probability
distribution of possible indicator values in the data is
gained, and the observed indicator value of species i is
compared to the distribution to receive estimate of sta-
tistical significance. The probability of a type I error is
then the proportion of randomized indicator values thatexceeds the observed indicator value (Dufrene and Leg-
endre, 1997; McCune and Mefford, 1999).
Multivariate ordination methods with non-metric mul-
tidimensional scaling (NMDS) (Clarke, 1993; McCune
and Grace, 2002) were applied to explore the main dis-
tributional patterns of butterfly and moth species and
their relationships to environmental variables as imple-
mented the software PC-ORD, version 4.22 (McCuneand Mefford, 1999). Sørensen (Bray-Curtis) distance
measure was used in the NMDS analysis (Clarke,
1993; McCune and Grace, 2002). Ordination axes were
rotated (Varimax rotation) to maximise the correlation
between the main component of variation and the first
ordination axis. The NMDS scree plots were inspected
to select for the final number of dimensions in the
NMDS run (McCune and Mefford, 1999). The ordina-tion results are presented as species plots. Species scores
J. Poyry et al. / Biological Conservation 122 (2005) 465–478 469
were calculated by weighted averaging from the site
scores. Species occurring most abundantly (with strong
statistical significance, p < 0.05) in any of the three pas-
ture types according to GLM and ISA (i.e., indicator
species) are shown highlighted in ordination plots. Vec-
tors of the environmental variables having the strongestcorrelations (p < 0.01) with ordination axes were added
to ordination plots in order to assign the indicator spe-
cies to the main environmental gradients.
2.6. Pasture type preference and distributional trends
The absolute distributional trend in Finland was cal-
culated for each butterfly and moth species as the num-ber of positive 10 · 10 km2 atlas square records during
1988–1997 divided by the corresponding number in the
period before 1988 (Hulden et al., 2000). As a corrected
measure, the relative distributional trend for each spe-
cies was then calculated by taking into account the over-
all numbers of records from the two time periods. The
number of positive squares for all species in 1988–1997
was divided by the number of positive squares for allspecies before 1988. Relative distributional trend was
then calculated by dividing the uncorrected distribu-
tional trend by this correction value. Relative trends
were separately calculated for butterflies, geometrid
moths, tiger moths and noctuid moths, since data
sources and observational intensity differed between
these groups (Hulden et al., 2000). Only resident butter-
fly species of agricultural environments (Pitkanen et al.,2001) and resident day-active species of other families
(Kuussaari et al., 2002, M. Kuussaari and J. Poyry,
unpublished data) were included in the calculations, in
order to minimize bias within each taxonomic group.
After calculating the relative population trends, we com-
pared the trends in the two groups with largest numbers
of associated species, old pastures and abandoned pas-
tures, as indicated by GLM analyses. We also testedwhether there was a relationship between distributional
change and the GLM coefficient for the effect of aban-
donment on species abundance. The statistical tests ap-
plied here included the Mann–Whitney U test and
Pearson�s correlation as implemented in the software
Statistix, version 7.0 (Anonymous, 2000).
3. Results
3.1. Abundance differences among pasture types
Aminimum of 15 individuals was observed for a total
of 32 species of butterflies and moths. Results of general-
ized linearmodelling with pasture type as the explanatory
variable showed that the abundances of 19 out of the 32tested species differed with strong statistical significance
(p < 0.05) among the pasture types (Table 1). Using a
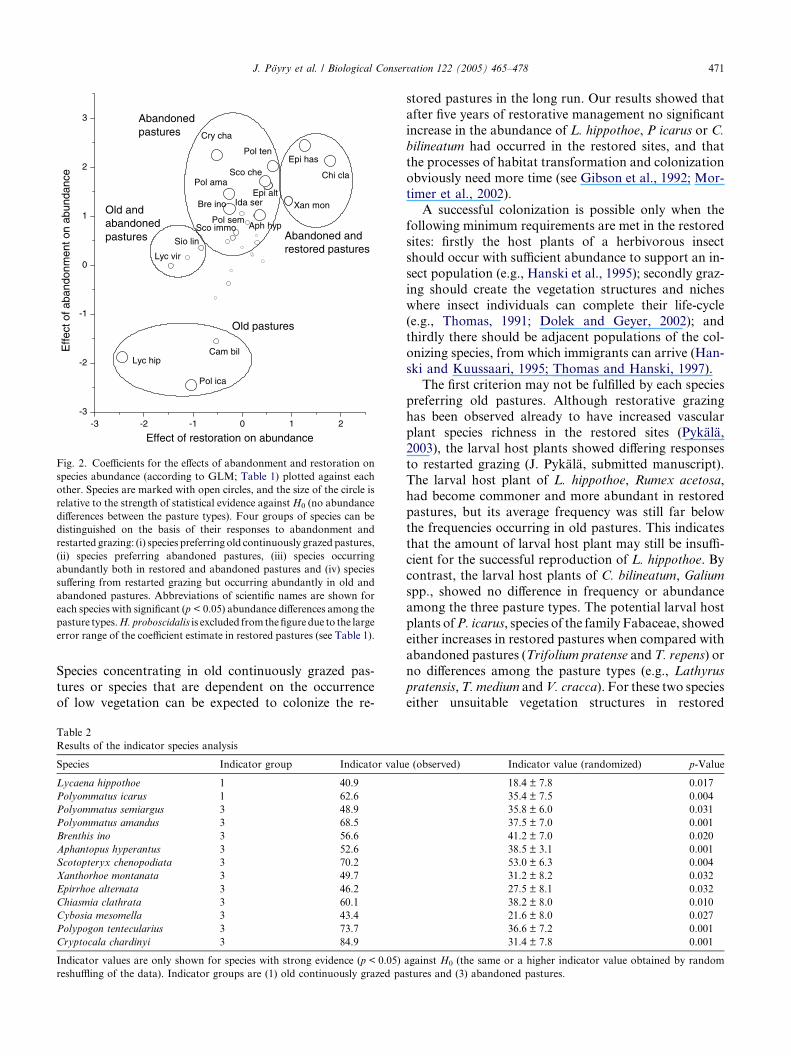
posteriori pair-wise tests, species may be assigned to
groups according to their preferred pasture types (Table
1, Fig. 2). Thus, three species, Lycaena hippothoe, Poly-
ommatus icarus and Camptogramma bilineatum, oc-
curred most abundantly in old pastures, but none of
these showed significant recovery in restored pastures.Nine species (Polyommatus semiargus, Polyommatus
amandus, Brenthis ino, Aphantopus hyperantus, Scotop-
teryx chenopodiata, Epirrhoe alternata, Polypogon tenta-
cularius, Hypena proboscidalis and Cryptocala chardinyi)
occurred most abundantly in abandoned pastures (Ta-
ble 1, Fig. 2). In addition, for two species, Scopula
immorata and Idaea serpentata, abundances increased
in abandoned pastures, but no pair-wise differencescould be detected. Three species, E. hastulata, Xanthor-
hoe montanata and Chiasmia clathrata, occurred equally
abundantly in abandoned and restored pastures but in
lower numbers in old pastures. Finally, two species, Lyc-
aena virgaureae and Siona lineata, appeared to have suf-
fered from restoration, and they occurred most
abundantly in both old and abandoned pastures (Table
1, Fig. 2).After sequential Bonferroni correction the number of
species with strong evidence for differences among the
pasture types decreased to 12 (Table 1). Now a posteri-
ori pair-wise tests showed that two species, L. hippothoe
and P. icarus, occurred most abundantly in old pastures.
Eight species (all the nine listed above except P. semiar-
gus) occurred most abundantly in abandoned pastures,
but only one species, C. clathrata, was observed mostabundantly in both restored and abandoned pastures.
3.2. Indicator species of pasture types
According to indicator species analysis eleven species
(P. semiargus, P. amandus, B. ino, A. hyperantus, S.
chenopodiata, X. montanata, E. alternata, C. clathrata,
Cybosia mesomella, P. tentacularius and C. chardinyi)were shown to be indicators of abandoned pastures
and two species, L. hippothoe and P. icarus, were indica-
tors of old pastures (Table 2). By contrast, no species
showed indicator value for restored pastures. C. meso-
mella was the only species for which association with a
pasture type that had not been detected with GLM anal-
yses (due to the low number of observed individuals)
was detected with ISA.
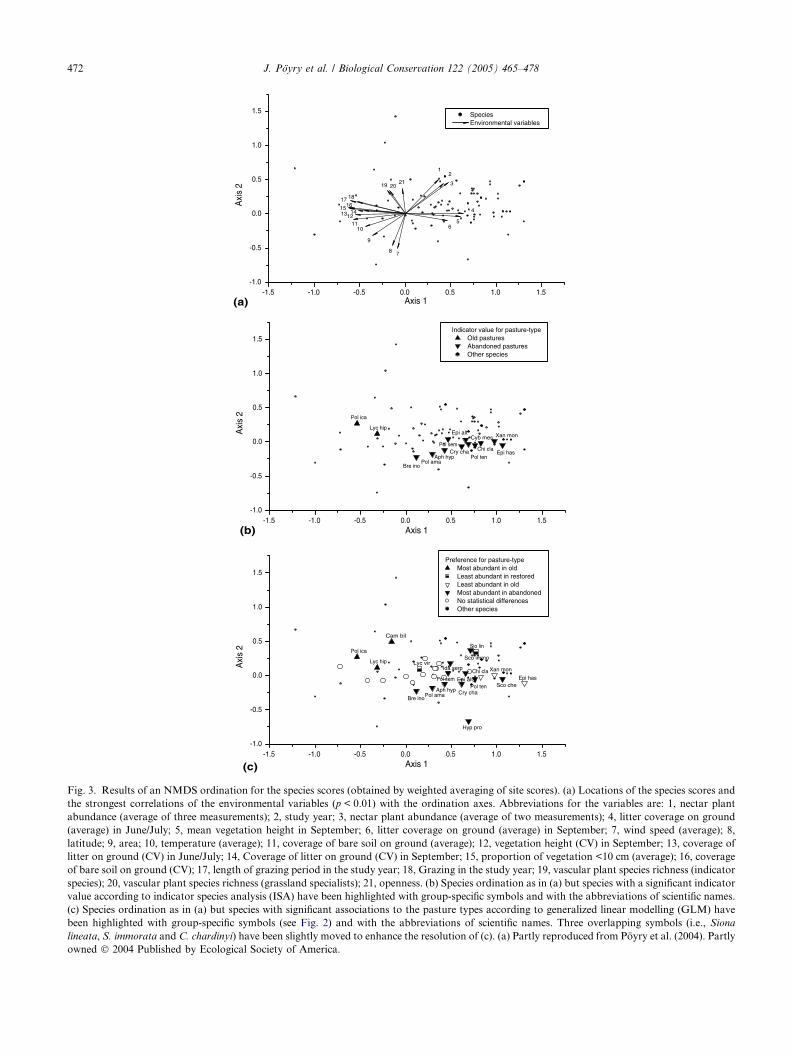
3.3. Species distribution along environmental gradients
NMDS ordination for species scores showed that spe-
cies concentrating in (Fig. 3(c)) or indicating (Fig. 3(b))
old pastures were located at low values (<0) along Axis
1, whereas species occurring most abundantly in aban-
doned pastures were located at high values (>0). Speciesassociated with different pasture types were not separated
along Axis 2. Environmental variables describing effects
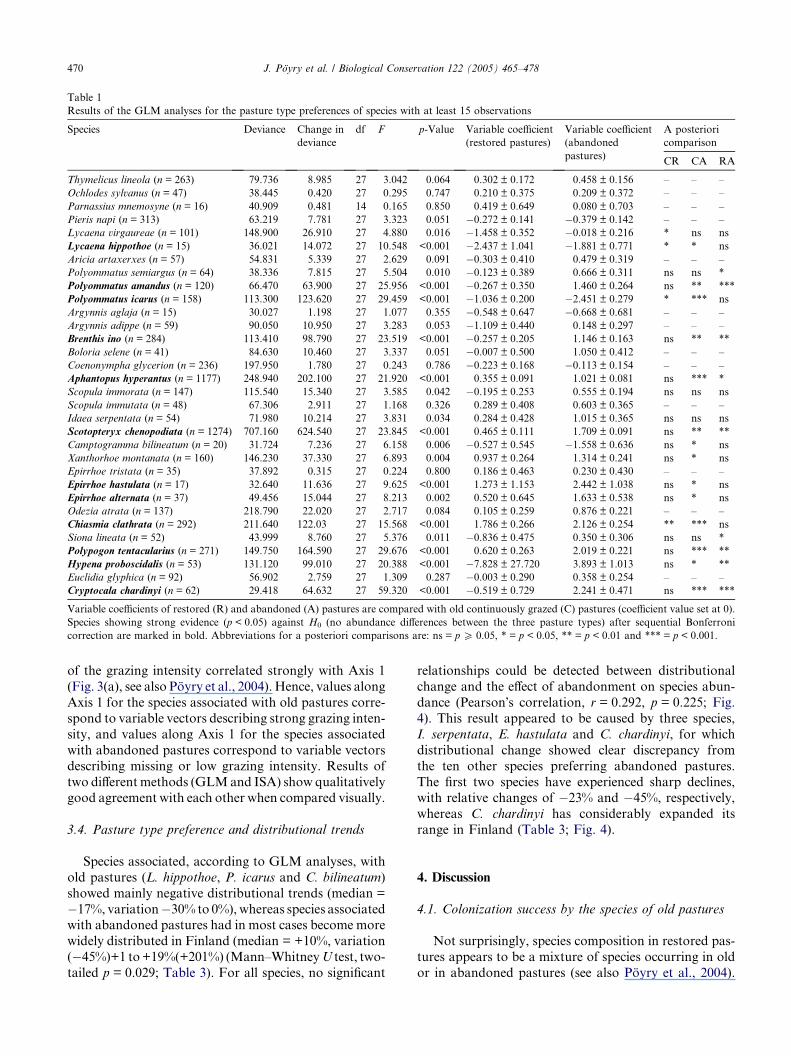
Table 1
Results of the GLM analyses for the pasture type preferences of species with at least 15 observations
Species Deviance Change in
deviance
df F p-Value Variable coefficient
(restored pastures)
Variable coefficient
(abandoned
pastures)
A posteriori
comparison
CR CA RA
Thymelicus lineola (n = 263) 79.736 8.985 27 3.042 0.064 0.302 ± 0.172 0.458 ± 0.156 – – –
Ochlodes sylvanus (n = 47) 38.445 0.420 27 0.295 0.747 0.210 ± 0.375 0.209 ± 0.372 – – –
Parnassius mnemosyne (n = 16) 40.909 0.481 14 0.165 0.850 0.419 ± 0.649 0.080 ± 0.703 – – –
Pieris napi (n = 313) 63.219 7.781 27 3.323 0.051 �0.272 ± 0.141 �0.379 ± 0.142 – – –
Lycaena virgaureae (n = 101) 148.900 26.910 27 4.880 0.016 �1.458 ± 0.352 �0.018 ± 0.216 * ns ns
Lycaena hippothoe (n = 15) 36.021 14.072 27 10.548 <0.001 �2.437 ± 1.041 �1.881 ± 0.771 * * ns
Aricia artaxerxes (n = 57) 54.831 5.339 27 2.629 0.091 �0.303 ± 0.410 0.479 ± 0.319 – – –
Polyommatus semiargus (n = 64) 38.336 7.815 27 5.504 0.010 �0.123 ± 0.389 0.666 ± 0.311 ns ns *
Polyommatus amandus (n = 120) 66.470 63.900 27 25.956 <0.001 �0.267 ± 0.350 1.460 ± 0.264 ns ** ***
Polyommatus icarus (n = 158) 113.300 123.620 27 29.459 <0.001 �1.036 ± 0.200 �2.451 ± 0.279 * *** ns
Argynnis aglaja (n = 15) 30.027 1.198 27 1.077 0.355 �0.548 ± 0.647 �0.668 ± 0.681 – – –
Argynnis adippe (n = 59) 90.050 10.950 27 3.283 0.053 �1.109 ± 0.440 0.148 ± 0.297 – – –
Brenthis ino (n = 284) 113.410 98.790 27 23.519 <0.001 �0.257 ± 0.205 1.146 ± 0.163 ns ** **
Boloria selene (n = 41) 84.630 10.460 27 3.337 0.051 �0.007 ± 0.500 1.050 ± 0.412 – – –
Coenonympha glycerion (n = 236) 197.950 1.780 27 0.243 0.786 �0.223 ± 0.168 �0.113 ± 0.154 – – –
Aphantopus hyperantus (n = 1177) 248.940 202.100 27 21.920 <0.001 0.355 ± 0.091 1.021 ± 0.081 ns *** *
Scopula immorata (n = 147) 115.540 15.340 27 3.585 0.042 �0.195 ± 0.253 0.555 ± 0.194 ns ns ns
Scopula immutata (n = 48) 67.306 2.911 27 1.168 0.326 0.289 ± 0.408 0.603 ± 0.365 – – –
Idaea serpentata (n = 54) 71.980 10.214 27 3.831 0.034 0.284 ± 0.428 1.015 ± 0.365 ns ns ns
Scotopteryx chenopodiata (n = 1274) 707.160 624.540 27 23.845 <0.001 0.465 ± 0.111 1.709 ± 0.091 ns ** **
Camptogramma bilineatum (n = 20) 31.724 7.236 27 6.158 0.006 �0.527 ± 0.545 �1.558 ± 0.636 ns * ns
Xanthorhoe montanata (n = 160) 146.230 37.330 27 6.893 0.004 0.937 ± 0.264 1.314 ± 0.241 ns * ns
Epirrhoe tristata (n = 35) 37.892 0.315 27 0.224 0.800 0.186 ± 0.463 0.230 ± 0.430 – – –
Epirrhoe hastulata (n = 17) 32.640 11.636 27 9.625 <0.001 1.273 ± 1.153 2.442 ± 1.038 ns * ns
Epirrhoe alternata (n = 37) 49.456 15.044 27 8.213 0.002 0.520 ± 0.645 1.633 ± 0.538 ns * ns
Odezia atrata (n = 137) 218.790 22.020 27 2.717 0.084 0.105 ± 0.259 0.876 ± 0.221 – – –
Chiasmia clathrata (n = 292) 211.640 122.03 27 15.568 <0.001 1.786 ± 0.266 2.126 ± 0.254 ** *** ns
Siona lineata (n = 52) 43.999 8.760 27 5.376 0.011 �0.836 ± 0.475 0.350 ± 0.306 ns ns *
Polypogon tentacularius (n = 271) 149.750 164.590 27 29.676 <0.001 0.620 ± 0.263 2.019 ± 0.221 ns *** **
Hypena proboscidalis (n = 53) 131.120 99.010 27 20.388 <0.001 �7.828 ± 27.720 3.893 ± 1.013 ns * **
Euclidia glyphica (n = 92) 56.902 2.759 27 1.309 0.287 �0.003 ± 0.290 0.358 ± 0.254 – – –
Cryptocala chardinyi (n = 62) 29.418 64.632 27 59.320 <0.001 �0.519 ± 0.729 2.241 ± 0.471 ns *** ***
Variable coefficients of restored (R) and abandoned (A) pastures are compared with old continuously grazed (C) pastures (coefficient value set at 0).
Species showing strong evidence (p < 0.05) against H0 (no abundance differences between the three pasture types) after sequential Bonferroni
correction are marked in bold. Abbreviations for a posteriori comparisons are: ns = p P 0.05, * = p < 0.05, ** = p < 0.01 and *** = p < 0.001.
470 J. Poyry et al. / Biological Conservation 122 (2005) 465–478
of the grazing intensity correlated strongly with Axis 1
(Fig. 3(a), see also Poyry et al., 2004). Hence, values along
Axis 1 for the species associated with old pastures corre-
spond to variable vectors describing strong grazing inten-
sity, and values along Axis 1 for the species associated
with abandoned pastures correspond to variable vectors
describing missing or low grazing intensity. Results of
two different methods (GLMand ISA) show qualitativelygood agreement with each other when compared visually.
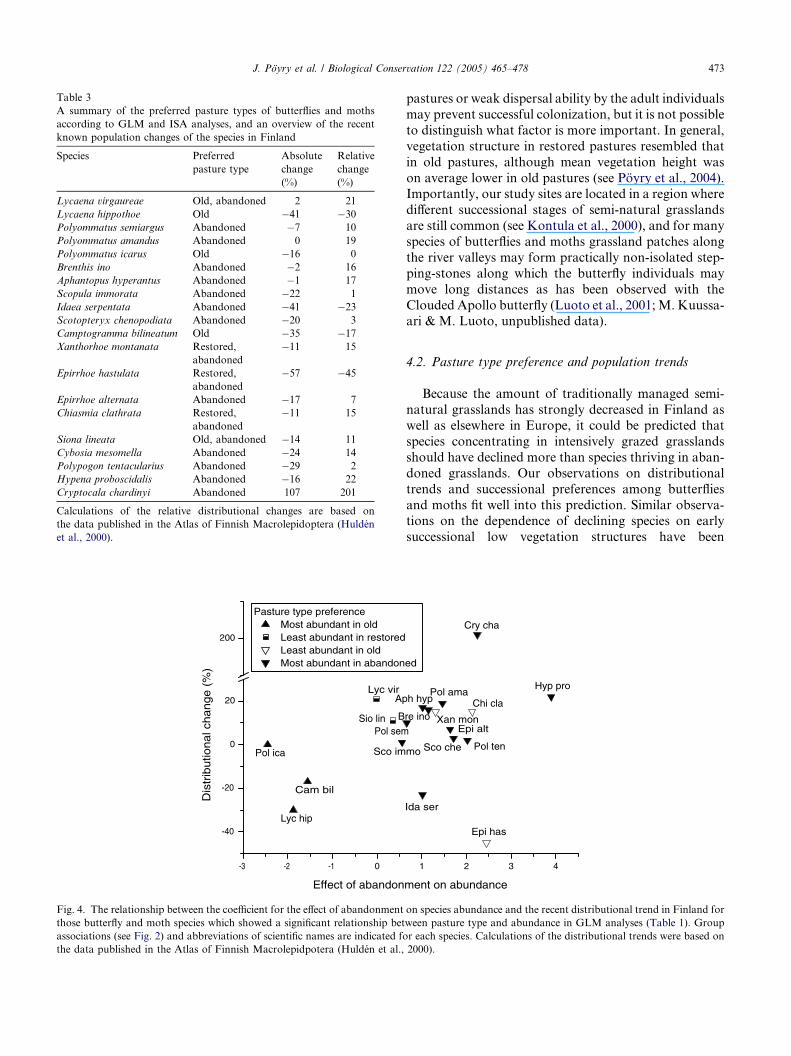
3.4. Pasture type preference and distributional trends
Species associated, according to GLM analyses, with
old pastures (L. hippothoe, P. icarus and C. bilineatum)
showed mainly negative distributional trends (median =
�17%, variation�30% to 0%), whereas species associatedwith abandoned pastures had in most cases become more
widely distributed in Finland (median = +10%, variation
(�45%)+1 to+19%(+201%) (Mann–WhitneyU test, two-
tailed p = 0.029; Table 3). For all species, no significant
relationships could be detected between distributional
change and the effect of abandonment on species abun-
dance (Pearson�s correlation, r = 0.292, p = 0.225; Fig.
4). This result appeared to be caused by three species,
I. serpentata, E. hastulata and C. chardinyi, for which
distributional change showed clear discrepancy from
the ten other species preferring abandoned pastures.
The first two species have experienced sharp declines,with relative changes of �23% and �45%, respectively,
whereas C. chardinyi has considerably expanded its
range in Finland (Table 3; Fig. 4).
4. Discussion
4.1. Colonization success by the species of old pastures
Not surprisingly, species composition in restored pas-
tures appears to be a mixture of species occurring in old
or in abandoned pastures (see also Poyry et al., 2004).
-3 -2 -1 0 1 2-3
-2
-1
0
1
2
3 Abandonedpastures
Old and abandonedpastures
Old pastures
Abandoned andrestored pastures
Ida ser
Sco immoPol sem
Pol ten
Aph hyp
Sco che
Epi altBre ino
Pol ama
Cry cha
Xan mon
Chi cla
Epi has
Sio lin
Lyc vir
Cam bilLyc hip
Pol ica
Effe
ct o
f aba
ndon
men
t on
abun
danc
e
Effect of restoration on abundance
Fig. 2. Coefficients for the effects of abandonment and restoration on
species abundance (according to GLM; Table 1) plotted against each
other. Species are marked with open circles, and the size of the circle is
relative to the strength of statistical evidence againstH0 (no abundance
differences between the pasture types). Four groups of species can be
distinguished on the basis of their responses to abandonment and
restarted grazing: (i) species preferring old continuously grazed pastures,
(ii) species preferring abandoned pastures, (iii) species occurring
abundantly both in restored and abandoned pastures and (iv) species
suffering from restarted grazing but occurring abundantly in old and
abandoned pastures. Abbreviations of scientific names are shown for
each species with significant (p < 0.05) abundance differences among the
pasture types.H. proboscidalis is excluded from thefigure due to the large
error range of the coefficient estimate in restored pastures (see Table 1).
J. Poyry et al. / Biological Conservation 122 (2005) 465–478 471
Species concentrating in old continuously grazed pas-
tures or species that are dependent on the occurrence
of low vegetation can be expected to colonize the re-
Table 2
Results of the indicator species analysis
Species Indicator group Indicator valu
Lycaena hippothoe 1 40.9
Polyommatus icarus 1 62.6
Polyommatus semiargus 3 48.9
Polyommatus amandus 3 68.5
Brenthis ino 3 56.6
Aphantopus hyperantus 3 52.6
Scotopteryx chenopodiata 3 70.2
Xanthorhoe montanata 3 49.7
Epirrhoe alternata 3 46.2
Chiasmia clathrata 3 60.1
Cybosia mesomella 3 43.4
Polypogon tentecularius 3 73.7
Cryptocala chardinyi 3 84.9
Indicator values are only shown for species with strong evidence (p < 0.05)
reshuffling of the data). Indicator groups are (1) old continuously grazed pa
stored pastures in the long run. Our results showed that
after five years of restorative management no significant
increase in the abundance of L. hippothoe, P icarus or C.
bilineatum had occurred in the restored sites, and that
the processes of habitat transformation and colonization
obviously need more time (see Gibson et al., 1992; Mor-timer et al., 2002).
A successful colonization is possible only when the
following minimum requirements are met in the restored
sites: firstly the host plants of a herbivorous insect
should occur with sufficient abundance to support an in-
sect population (e.g., Hanski et al., 1995); secondly graz-
ing should create the vegetation structures and niches
where insect individuals can complete their life-cycle(e.g., Thomas, 1991; Dolek and Geyer, 2002); and
thirdly there should be adjacent populations of the col-
onizing species, from which immigrants can arrive (Han-
ski and Kuussaari, 1995; Thomas and Hanski, 1997).
The first criterion may not be fulfilled by each species
preferring old pastures. Although restorative grazing
has been observed already to have increased vascular
plant species richness in the restored sites (Pykala,2003), the larval host plants showed differing responses
to restarted grazing (J. Pykala, submitted manuscript).
The larval host plant of L. hippothoe, Rumex acetosa,
had become commoner and more abundant in restored
pastures, but its average frequency was still far below
the frequencies occurring in old pastures. This indicates
that the amount of larval host plant may still be insuffi-
cient for the successful reproduction of L. hippothoe. Bycontrast, the larval host plants of C. bilineatum, Galium
spp., showed no difference in frequency or abundance
among the three pasture types. The potential larval host
plants ofP. icarus, species of the family Fabaceae, showed
either increases in restored pastures when compared with
abandoned pastures (Trifolium pratense and T. repens) or
no differences among the pasture types (e.g., Lathyrus
pratensis,T.medium andV. cracca). For these two specieseither unsuitable vegetation structures in restored
e (observed) Indicator value (randomized) p-Value
18.4 ± 7.8 0.017
35.4 ± 7.5 0.004
35.8 ± 6.0 0.031
37.5 ± 7.0 0.001
41.2 ± 7.0 0.020
38.5 ± 3.1 0.001
53.0 ± 6.3 0.004
31.2 ± 8.2 0.032
27.5 ± 8.1 0.032
38.2 ± 8.0 0.010
21.6 ± 8.0 0.027
36.6 ± 7.2 0.001
31.4 ± 7.8 0.001
against H0 (the same or a higher indicator value obtained by random
stures and (3) abandoned pastures.
-1.5 -1.0 -0.5 0.0 0.5 1.0 1.5-1.0
-0.5
0.0
0.5
1.0
1.5
-1.5 -1.0 -0.5 0.0 0.5 1.0 1.5-1.0
-0.5
0.0
0.5
1.0
1.5
Lyc hip
Pol ica
Pol sem
Pol amaBre ino
Aph hyp
Sco immo
Ida serp
Sco cheEpi alt
Pol ten
Hyp pro
Cry cha
Xan monChi claEpi has
Lyc vir
Sio lin
Lyc hip
Pol ica
Cam bil
Cyb mes
Pol ten
Chi cla
Xan mon
Epi hasCry cha
Epi alt
Pol sem
Aph hypPol ama
Bre ino
Indicator value for pasture-type Old pastures Abandoned pastures Other species
Axi
s 2
Axis 1
-1.5 -1.0 -0.5 0.0 0.5 1.0 1.5-1.0
-0.5
0.0
0.5
1.0
1.5
9
1011
12
16151413
8 7
65
4
3
21
17 18
19 2021
Axi
s 2
Axis 1
Species Environmental variables
(c)
(b)
(a)
Axi
s 2
Axis 1
Preference for pasture-type Most abundant in old Least abundant in restored Least abundant in old Most abundant in abandoned No statistical differences Other species
Fig. 3. Results of an NMDS ordination for the species scores (obtained by weighted averaging of site scores). (a) Locations of the species scores and
the strongest correlations of the environmental variables (p < 0.01) with the ordination axes. Abbreviations for the variables are: 1, nectar plant
abundance (average of three measurements); 2, study year; 3, nectar plant abundance (average of two measurements); 4, litter coverage on ground
(average) in June/July; 5, mean vegetation height in September; 6, litter coverage on ground (average) in September; 7, wind speed (average); 8,
latitude; 9, area; 10, temperature (average); 11, coverage of bare soil on ground (average); 12, vegetation height (CV) in September; 13, coverage of
litter on ground (CV) in June/July; 14, Coverage of litter on ground (CV) in September; 15, proportion of vegetation <10 cm (average); 16, coverage
of bare soil on ground (CV); 17, length of grazing period in the study year; 18, Grazing in the study year; 19, vascular plant species richness (indicator
species); 20, vascular plant species richness (grassland specialists); 21, openness. (b) Species ordination as in (a) but species with a significant indicator
value according to indicator species analysis (ISA) have been highlighted with group-specific symbols and with the abbreviations of scientific names.
(c) Species ordination as in (a) but species with significant associations to the pasture types according to generalized linear modelling (GLM) have
been highlighted with group-specific symbols (see Fig. 2) and with the abbreviations of scientific names. Three overlapping symbols (i.e., Siona
lineata, S. immorata and C. chardinyi) have been slightly moved to enhance the resolution of (c). (a) Partly reproduced from Poyry et al. (2004). Partly
owned � 2004 Published by Ecological Society of America.
472 J. Poyry et al. / Biological Conservation 122 (2005) 465–478
-3 -2 -1 0
-40
-20
0
20
200
Pol ica
Lyc hip
Cam bil
Lyc vir
B
Ap
Sio linPol sem
Sco im
Dis
trib
utio
na
l ch
an
ge
(%
)
Effect of abandon
Pasture type preference Most abundant in old Least abundant in restored Least abundant in old Most abundant in abandon
Fig. 4. The relationship between the coefficient for the effect of abandonment
those butterfly and moth species which showed a significant relationship bet
associations (see Fig. 2) and abbreviations of scientific names are indicated fo
the data published in the Atlas of Finnish Macrolepidpotera (Hulden et al.,
Table 3
A summary of the preferred pasture types of butterflies and moths
according to GLM and ISA analyses, and an overview of the recent
known population changes of the species in Finland
Species Preferred
pasture type
Absolute
change
(%)
Relative
change
(%)
Lycaena virgaureae Old, abandoned 2 21
Lycaena hippothoe Old �41 �30
Polyommatus semiargus Abandoned �7 10
Polyommatus amandus Abandoned 0 19
Polyommatus icarus Old �16 0
Brenthis ino Abandoned �2 16
Aphantopus hyperantus Abandoned �1 17
Scopula immorata Abandoned �22 1
Idaea serpentata Abandoned �41 �23
Scotopteryx chenopodiata Abandoned �20 3
Camptogramma bilineatum Old �35 �17
Xanthorhoe montanata Restored,
abandoned
�11 15
Epirrhoe hastulata Restored,
abandoned
�57 �45
Epirrhoe alternata Abandoned �17 7
Chiasmia clathrata Restored,
abandoned
�11 15
Siona lineata Old, abandoned �14 11
Cybosia mesomella Abandoned �24 14
Polypogon tentacularius Abandoned �29 2
Hypena proboscidalis Abandoned �16 22
Cryptocala chardinyi Abandoned 107 201
Calculations of the relative distributional changes are based on
the data published in the Atlas of Finnish Macrolepidoptera (Hulden
et al., 2000).
J. Poyry et al. / Biological Conservation 122 (2005) 465–478 473
pastures or weak dispersal ability by the adult individuals
may prevent successful colonization, but it is not possible
to distinguish what factor is more important. In general,
vegetation structure in restored pastures resembled that
in old pastures, although mean vegetation height was
on average lower in old pastures (see Poyry et al., 2004).Importantly, our study sites are located in a region where
different successional stages of semi-natural grasslands
are still common (see Kontula et al., 2000), and for many
species of butterflies and moths grassland patches along
the river valleys may form practically non-isolated step-
ping-stones along which the butterfly individuals may
move long distances as has been observed with the
Clouded Apollo butterfly (Luoto et al., 2001;M. Kuussa-ari & M. Luoto, unpublished data).
4.2. Pasture type preference and population trends
Because the amount of traditionally managed semi-
natural grasslands has strongly decreased in Finland as
well as elsewhere in Europe, it could be predicted that
species concentrating in intensively grazed grasslands
should have declined more than species thriving in aban-
doned grasslands. Our observations on distributional
trends and successional preferences among butterflies
and moths fit well into this prediction. Similar observa-tions on the dependence of declining species on early
successional low vegetation structures have been
1 2 3 4
Xan mon
Chi clare ino
h hypPol ama
Hyp pro
Cry cha
Sco che
Epi alt
Pol ten
Epi has
Ida ser
mo
ment on abundance
ed
on species abundance and the recent distributional trend in Finland for
ween pasture type and abundance in GLM analyses (Table 1). Group
r each species. Calculations of the distributional trends were based on
2000).
474 J. Poyry et al. / Biological Conservation 122 (2005) 465–478
reported in numerous studies of butterflies in NW
Europe (e.g., Thomas, 1991, 1993).
4.3. Successional preferences on a European scale
Comparisons of successional preferences of speciesassociated with one pasture type, either old or aban-
doned, with studies conducted elsewhere in Europe can
reveal interesting differences between regions. Appropri-
ate material for such comparisons is provided by studies
of butterfly and moth communities inhabiting different
vegetation heights of semi-natural grassland in Switzer-
land (Erhardt, 1985; Balmer and Erhardt, 2000). It was
possible to compare successional associations among ele-ven species of butterflies and moths occurring in grass-
lands in southern Finland and in mountainous regions
of Switzerland. The preferences were markedly different
in several species. One species (C. bilineatum) of the three
that were associated with old continuous pastures in Fin-
land did not prefer low early successional vegetation in
Switzerland and four (P. semiargus, S. immorata, I. ser-
pentata and P. tentacularius) of the seven species associ-ated with abandoned pastures in Finland preferred a
different successional stage in Switzerland (Erhardt,
1985; Balmer and Erhardt, 2000).
Associations of butterflies with different stages of
grassland vegetation are particularly well known inGreat
Britain (for reviews see BUTT, 1986; Oates, 1995), but
only two species that showed clear associations in our
study also occur there, namely P. icarus and A. hyperan-
tus. Successional preferences of these two species are
qualitatively similar in Finland and Great Britain.
It is well known that butterflies may occupy very differ-
ent vegetation heights and stages of succession in different
climatic zones (e.g., Thomas, 1991, 1993). Species depend-
ent on warm microclimates created by the early succes-
sional low vegetation in the northern part of their
ranges gradually shift their preference towards higher veg-etation further south. However, southern Finland and
mountainous areas of Switzerland are located in rather
similar (boreomontane) climatic zones. Hence, one might
expect that in these countries species would favour similar
successional stages of semi-natural grassland. In contrast
to this expectation, nearly half (5 from 11) of the com-
pared species showed clear differences in their succes-
sional preferences between Finland and Switzerland.This observation holds an important message for conser-
vation managers: knowledge of habitat preference of but-
terflies and moths gained in one region should only be
applied with caution in practical management planning
elsewhere, even in areas with similar climatic conditions.
4.4. Conclusions for management
In our study, clearly more species (15) were associ-
ated with abandoned (three of which also with restored)
pastures than with old continuous pastures (three spe-
cies). Although the species associated with old pastures
had not yet returned to the restored sites, the overall
species composition as indicated by an ordination anal-
ysis was already similar between old and restored pas-
tures (Poyry et al., 2004). We have also observed thatspecies richness and total abundance of butterflies and
moths were highest in abandoned pastures among the
three management history types (Poyry et al., 2004).
Studies conducted in Central Europe have similarly con-
cluded that a larger proportion of butterfly and moth
species are associated with mid-late successional grass-
land vegetation (Balmer and Erhardt, 2000). These
observations challenge the existing management instruc-tions applied in Finland and in many other Western
European countries (see WallisDeVries et al., 1998).
The results of the present study showed that even
though the majority of butterflies and moths in grass-
lands prefer abandoned pastures, there may be more
declining and conservationally important species asso-
ciated with old continuously grazed areas. Hence it
could be argued that the existing management instruc-tions of intensive grazing have been adequate, but
that the time for restoration has not been sufficient
for the species of old pastures to have colonised the
restored sites. This should not be understood as
meaning that only the species dependent on low veg-
etation need attention when constructing management
plans for grassland insects (Dolek and Geyer, 2002).
Obviously, the requirements of all members of the in-sect community in semi-natural grasslands are never
met in one particular site at a time. Thus, more var-
iation in grazing intensity between pastures and possi-
bly yearly varying grazing regimes should be allowed
on the regional level compared with the present man-
agement instructions (see Brown et al., 1990; Morris,
1990; Dolek and Geyer, 2002). This recommendation
is also in agreement with proposals for enhancing het-erogeneity in the management of biodiversity in agri-
cultural areas (Benton et al., 2003) and with the
predictions of theoretical models of highest local
diversity in regional habitat mosaics (e.g., Levin and
Paine, 1974).
We conclude by suggesting that, with the above
specifications, the use of restorative cattle grazing of
previously abandoned semi-natural grasslands to con-struct grassland patch networks, is an important addi-
tion to the proposed tools to halt the decline of
biodiversity in European agricultural landscapes (Wal-
lisDeVries, 1995; Bignal, 1998; Sutherland, 2002). But-
terflies and moths appear to be, along with vascular
plants, useful indicator taxa for monitoring the effects
of restoration in semi-natural grasslands, because they
include certain species with positive and other specieswith negative responses to the onset of restarted
grazing.
J. Poyry et al. / Biological Conservation 122 (2005) 465–478 475
Acknowledgements
This work was funded by the Finnish Ministry of
Environment (for the project ‘‘Maintaining biodiver-
sity in traditional rural landscapes – optimal manage-
ment and area networks’’ through the FinnishBiodiversity Research Programme FIBRE coordinated
Appendix A
A list of the environmental variables measured during the study, their assign
analyses
Variable group and variable Details of measurement a
Adjusting variables
Year 1 = 1999, 2 = 2000
Site area Measured from digitized m
Land use history
Grazing history type Classified as a three-class
study sites (C = old contin
restarted grazing and A =
�redundant� type to which
Use of fertilizers and supplement forages Use of fertilizers and supp
Enrichment Soil nutrient enrichment d
plant composition (see Pyk
as a three-class variable (0
Use as arable field Cultivation was coded as
Spreading of hayseeds Spreading of hay seeds w
Current grazing management
Grazing in the study year Grazing during the study
Length of grazing period in the study year Length of the grazing seas
were present and ending i
Lepidopteran larvae are s
Mean vegetation height Average of direct measure
each study site during mid
Vegetation height (CV) Coefficient of variation of
sample squares in each stu
Proportion of vegetation <10 cm (average) Mean of proportion of lo
each study site during mid
Proportion of vegetation <10 cm (CV) Coefficient of variation of
sample squares in each stu
Coverage of bare soil on ground (average) Mean of coverage of bare
during mid-September
Coverage of bare soil on ground (CV) Coefficient of variation of
in each study site during m
Coverage of litter on ground (average) Mean of coverage of litter
site during plant surveys i
Coverage of litter on ground (CV) Coefficient of variation of
squares in each study site
Coverage of litter on ground (average) Mean of coverage of litter
site during mid-Septembe
Coverage of litter on ground (CV) Coefficient of variation of
squares in each study site
Coverage of mosses on ground (average) Mean of coverage of moss
site during plant surveys i
Coverage of mosses on ground (CV) Coefficient of variation of
squares in each study site
Geography and topography
Longitude Longitudinal midpoint of
coordinate system, was m
by the Academy of Finland), the Finnish Environment
Institute (SYKE), and the Maj and Tor Nessling
Foundation (Grant No. 2003008). Ilkka Hanski, Risto
Heikkinen, Marko Nieminen and Juha Pykala are
thanked for constructive criticism on the manuscript.
Michael J. Bailey improved the language of themanuscript.
ation to main groups and details of their measurement and usage in
nd usage
aps with the accuracy of 0.01 hectares
categorical variable indicating the management history of the
uously grazed pasture, R = formerly abandoned pasture with
abandoned former pasture). Old pastures were selected as the
other types were compared in GLM analysis
lement forages was coded as binary variables (0 = no, 1 = yes)
ue to fertilizers or supplementary forages as indicated by vascular
ala, 2003, Biodiversity & Conservation 12, 2211–2226) was coded
= no, 1 = low to moderate and 2 = severe enrichment)
a binary variable (0 = no, 1 = yes)
as coded as a binary variable (0 = no, 1 = yes)
year was coded as a binary variable (0 = ungrazed, 1 = grazed)
on was measured as weeks, starting from the first date when cattle
n the first week of September, representing the period when
ensitive to the effects of grazing
ments of vegetation height made from 15 1-m2 sample squares in
-September
direct measurements of vegetation height made from 15 1-m2
dy site during mid-September
w vegetation (<10 cm) measured from 15 1-m2 sample squares in
-September
proportion of low vegetation (<10 cm) measured from 15 1-m2
dy site during mid-September
ground measured from 15 1-m2 sample squares in each study site
coverage of bare ground measured from 15 1-m2 sample squares
id-September
on ground measured from 15 1-m2 sample squares in each study
n June or July (see Pykala, 2003)
coverage of litter on ground measured from 15 1-m2 sample
during plant surveys in June or July (see Pykala, 2003)
on ground measured from 15 1-m2 sample squares in each study
r
coverage of litter on ground measured from 15 1-m2 sample
during mid-September
es on ground measured from 15 1-m2 sample squares in each study
n June or July (see Pykala, 2003)
coverage of mosses on ground measured from 15 1-m2 sample
during plant surveys in June or July (see Pykala, 2003)
a site, derived from digitized maps in the Finnish uniform map
easured with the accuracy of 1 m
(continued on next page)
Appendix A (continued)
Variable group and variable Details of measurement and usage
Latitude Latitudinal midpoint of a site, derived from the Finnish uniform map
coordinate system, was measured from digitized maps with the accuracy of
1 m
Solar radiation The direction and the angle (steepness) of slope was measured from digital
maps with a resolution of 1:20,000. The slope measurements were
combined to calculate a general index of solar radiation with the following
equation (Griffiths, 1985):
Solar radiation = [cos(altitude)*sin(slope angle)*cos(ground
direction � sun direction) + sin(altitude)*cos(slope angle)]
where altitude is the angle of the sun above the horizon, sun direction
is the deviation of direction of the sun from south (south = 0,
east = �90, west = +90), and ground direction is the downgrade
direction of the ground from south (south = 0, east = �90, west = +90).
The solar radiation index was calculated for three times of day, 9 am,
12 am and 3 pm, and the average of these values was used in the
analysis
Local habitat characteristics
Openness Habitat types surrounding the focal grassland patch were measured as
percentages (%) of the bordering habitat. The percentages of open habitat
types (e.g., grasslands, cultivated fields, road banks) were summed to
describe the openness of a patch
Proportion of moist grassland vegetation The percentage (%) of moist grassland was estimated for each site to
describe the internal variation in habitat quality
Vascular plant species richness (total) The total number of vascular plant species observed within the study site
(see Pykala, 2003)
Vascular plant species richness (grassland specialists) The number of grassland-specialized vascular plant species observed within
the study site (see Pykala, 2003)
Vascular plant species richness (positive indicator species) The number of vascular plant species indicating well managed and low-
nutrient semi-natural grassland (see Pykala, 2003)
Vascular plant species density (average) The mean of vascular plant species observed within 1-m2 sample squares
(15 squares per site)
Vascular plant species density (CV) The coefficient of variation of vascular plant species observed within 1-m2
sample squares (15 squares per site)
Nectar plants (measurement II, average of measurements II
and III, and average of measurements I, II and III)
Amounts of nectar plants were measured in the field twice in 1999, in late
June and mid-August, and three times in 2000, in the first half of June, the
first half of July and the first half of August. On each occasion, the cover
classes (1 = <2%, 2 = 2–4%, 3 = 4–8%, 4 = 8–16%, 5 = 16–32%, 6 = 32–
64% and 7 = >64%) of 12 most abundant nectar plants were estimated and
summed to an index describing overall nectar abundance. Simultaneously a
simpler index of nectar abundance ranging from 0 (no nectar plants) to 10
(several abundant nectar plant species) was visually estimated. As the
correlation between the two indices was relatively high (r = 0.81), we
decided to use the simpler index in the analyses
Since the early summer of 1999 was very warm and dry, but that of 2000
was cool and partly rainy, the first measurement of 1999 and the second
measurement of 2000 were made at approximately the same phase of the
season. This measurement (referred to as Measurement II) and the yearly
averages of the individual nectar plant measurements were used in the
analyses
Weather variables
Temperature (average) The annual average of temperature observations made during butterfly and
moth counts
Temperature (CV) The annual coefficient of variation of temperature observations made
during butterfly and moth counts
Proportion of direct sunshine (average) The annual average of the proportion of direct sunshine observed during
butterfly and moth counts
Proportion of direct sunshine (CV) The annual coefficient of variation of the proportion of direct sunshine
observed during butterfly and moth counts
Wind speed (average) The annual average of wind speed during butterfly and moth counts
measured in the Beaufort scale
Wind speed (CV) The annual coefficient of variation of wind speed during butterfly and moth
counts measured in the Beaufort scale
476 J. Poyry et al. / Biological Conservation 122 (2005) 465–478
Appendix A (continued)
Variable group and variable Details of measurement and usage
Proportion of counts with <50% direct sun shine The proportion of counts with <50% direct sunshine during the count was
used to describe the weather differences between different sites
Proportion of counts with inappropriate weather The proportion of counts that did not fulfill the basic weather assumptions
of the transect method (Pollard, 1977, Biological Conservation 12, 115–
134) was used to describe the weather differences between different sites
J. Poyry et al. / Biological Conservation 122 (2005) 465–478 477
References
Anonymous, 2000. Statistix 7. User�s manual. Analytical Software,
Tallahassee.
Bakker, J.P., 1998. The impact of grazing on plant communities. In:
WallisDeVries, M.F., Bakker, J.P., Van Wieren, S.E. (Eds.),
Grazing and Conservation Management. Kluwer Academic Pub-
lishers, Dordrecht, pp. 137–184.
Balmer, O., Erhardt, A., 2000. Consequences of succession on
extensively grazed grasslands for central European butterfly
communities: Rethinking conservation practices. Conservation
Biology 14, 746–757.
Benton, T.G., Vickery, J.A., Wilson, J.D., 2003. Farmland biodiver-
sity: is habitat heterogeneity the key?. Trends in Ecology and
Evolution 18, 182–188.
Bignal, E.M., 1998. Using an ecological understanding of farmland to
reconcile nature conservation requirements, EU agriculture policy
and world trade agreements. Journal of Applied Ecology 35, 949–
954.
Boggs, C.L., Watt, W.B., Ehrlich, P.R. (Eds.), 2003. Butterflies:
Ecology and Evolution Taking Flight. The University of Chicago
Press, Chicago.
Brown, V.K., Gibson, C.W.D., Sterling, P.H., 1990. The mechanisms
controlling insect diversity in calcareous grasslands. In: Hillier, S.H.,
Walton, D.W.H., Wells, D.A. (Eds.), Calcareous Grasslands –
Ecology andManagement. Proceedings of a joint British Ecological
Society/ Nature Conservancy Council symposium, 14–16 September
1987 at the University of Sheffield. Bluntisham Books, Huntingdon,
pp. 79–87.
BUTT (Butterflies Under Threat Team) 1986. The management of
chalk grassland for butterflies. Nature conservancy council,
Peterborough.
Cabin, R.J., Mitchell, R.J., 2000. To Bonferroni or not to Bonferroni:
When and how are the questions. Bulletin of the Ecological Society
of America 81, 246–248.
Clarke, K.R., 1993. Non-parametric multivariate analyses of changes in
community structure. Australian Journal of Ecology 18, 117–143.
Crawley, M.J., 1993. GLIM for Ecologists. Blackwell Scientific
Publications, Oxford.
Dolek, M., Geyer, A., 2002. Conserving biodiversity on calcareous
grasslands in the Franconian Jura by grazing: a comprehensive
approach. Biological Conservation 104, 351–360.
Douwes, P., 1976. An area census method for estimating butterfly
population numbers. Journal of Research on the Lepidoptera 15,
146–152.
Dufrene, M., Legendre, P., 1997. Species assemblages and indicator
species: the need for a flexible asymmetrical approach. Ecological
Monographs 67, 345–366.
Erhardt, A., 1985. Diurnal Lepidoptera: sensitive indicators of
cultivated and abandoned grassland. Journal of Applied Ecology
22, 849–861.
Erhardt, A., Thomas, J.A., 1991. Lepidoptera as a indicator of change
in the semi-natural grasslands of lowland and upland Europe. In:
Collins, N.M., Thomas, J.A. (Eds.), The Conservation of Insects
and Their Habitats. Academic Press, London, pp. 213–236.
Gibson, C.W.D., Brown, V.K., Losito, L., McGavin, G.C., 1992. The
response of invertebrate assemblies to grazing. Ecography 15, 166–
176.
Griffiths, J.F., 1985. Climatology. In: Houghton, D.D. (Ed.), Hand-
book of Applied Meteorology. John Wiley & Sons, New York, pp.
62–132.
Hamet-Ahti, L., Suominen, J., Ulvinen, T., Uotila, P. (Eds.), 1998.
Field Flora of Finland. Finnish Museum of Natural History,
Botanical Museum, Helsinki (in Finnish).
Hanski, I.,Kuussaari,M., 1995. Butterflymetapopulation dynamics. In:
Cappucino, N., Price, P.W. (Eds.), Population dynamics: New
Approaches andSynthesis.Academic Press, SanDiego, pp. 149–171.
Hanski, I., Poyry, J., Pakkala, T., Kuussaari, M., 1995. Multiple
equilibria in metapopulation dynamics. Nature 377, 618–621.
Hulden, L. (Ed.), Albrecht, A., Itamies, J., Malinen, P., Wettenhovi, J.,
2000. Suomen suurperhosatlas – Finlands storfjarilsatlas. Lepido-
pterological Society of Finland, Finnish Museum of Natural
History, Helsinki. (In Finnish and Swedish with English summary).
Karsholt, O., Razowski, J. (Eds.), 1996. The Lepidoptera of Europe. A
Distributional Checklist. Apollo Books, Stenstrup.
Kleijn, D., Berendse, F., Smit, R., Gilissen, N., 2001. Agri-environ-
ment schemes do not effectively protect biodiversity in Dutch
agricultural landscapes. Nature 413, 723–725.
Kleijn, D., Sutherland, W.J., 2003. How effective are European agri-
environment schemes in conserving and promoting biodiversity?.
Journal of Applied Ecology 40, 947–969.
Kontula, T., Lehtomaa, L., Pykala, J., 2000. Land-use history,
vegetation and flora in Rekijoki valley, Somero SW Finland.
Suomen ymparisto 306, 1–96 (in Finnish with English summary).
Krebs, J.R., Wilson, J.D., Bradbury, R.B., Siriwardena, G.M., 1999.
The second silent spring?. Nature 400, 611–612.
Kullberg, J.,Albrecht,A.,Kaila,L., Varis,V., 2002.Checklist ofFinnish
Lepidoptera - Suomen perhosten luettelo. Sahlbergia 6, 45–190.
Kuussaari, M., Heliola, J., Niininen, I., 2002. Results of the butterfly
monitoring scheme in Finnish agricultural landscapes for the year
2001. Baptria 27, 38–47 (in Finnish with English summary).
Levin, S.A., Paine, R.T., 1974. Disturbance, patch formation, and
community structure. Proceedings of the National Academy of
Sciences of the USA 71, 2744–2747.
Luoto, M., Kuussaari, M., Rita, H., Salminen, J., von Bonsdorff, T.,
2001. Determinants of distribution and abundance in the clouded
apollo butterfly: a landscape ecological approach. Ecography 24,
601–617.
McCullagh, P., Nelder, J.A., 1989. Generalized Linear Models.
Chapman & Hall, London.
McCune, B., Grace, J.B., 2002. Analysis of Ecological Communities.
MjM Software Design, Gleneden Beach, Oregon.
McCune, B., Mefford, M.J., 1999. PC-ORD. Multivariate analysis of
ecological data, Version 4. MjM Software Design, Gleneden Beach,
Oregon.
Morris, M.G., 1990. The effects of management on the invertebrate
community of calcareous grassland. In: Hillier, S.H., Walton,
D.W.H., Wells, D.A. (Eds.), Calcareous Grasslands – Ecology and
Management. Proceedings of a joint British Ecological Society/
Nature Conservancy Council symposium, 14–16 September 1987 at
478 J. Poyry et al. / Biological Conservation 122 (2005) 465–478
the University of Sheffield. Bluntisham Books, Huntingdon, pp.
128–133.
Mortimer, S.R., Booth, R.G., Harris, S.J., Brown, V.K., 2002. Effects
of initial site management on the Coleoptera assemblages colonis-
ing newly established chalk grassland on ex-arable land. Biological
Conservation 104, 301–313.
Nicholls, A.O., 1991. An introduction to statistical modelling using
GLIM. In: Margules, C.R., Austin, M.P. (Eds.), Nature Conser-
vation: Cost Effective Biological Surveys and Data Analysis.
CSIRO, Australia, pp. 191–201.
Oates, M.R., 1995. Butterfly conservation within the management of
grassland habitats. In: Pullin, A.S. (Ed.), Ecology and Conserva-
tion of Butterflies. Chapman & Hall, London, pp. 98–112.
Ovenden, G.N., Swash, A.R.H., Smallshire, D., 1998. Agri-environ-
ment schemes and their contribution to the conservation of
biodiversity in England. Journal of Applied Ecology 35, 955–960.
Payne, C.D. (Ed.), 1986. The GLIM system release 3.77 manual.
Numeric Algorithms Group. Royal Statistical Society, Oxford.
Pitkanen, M., Kuussaari, M., Poyry, J., 2001. Butterflies. In: Pitkanen,
M., Tiainen, J. (Eds.), Biodiversity of Agricultural Landscapes in
Finland. BirdLife Finland, Helsinki, pp. 51–68.
Pollard, E., 1977. A method for assessing changes in the abundance of
butterflies. Biological Conservation 12, 115–134.
Pollard, E., Yates, T.J., 1993. Monitoring Butterflies for Ecology and
Conservation. Chapman & Hall, London.
Poyry, J., Lindgren, S., Salminen, J., Kuussaari, M., 2004. Restoration
of butterfly and moth communities in semi-natural grasslands by
cattle grazing. Ecological Applications 14(6), in press.
Pullin, A.S., 1996. Restoration of butterfly populations in Britain.
Restoration Ecology 4, 71–80.
Pykala, J., 2003. Effects of restoration with cattle grazing on plant
species composition and richness of semi-natural grasslands.
Biodiversity and Conservation 12, 2211–2226.
Quinn, G.P., Keough, M.J., 2002. Experimental design and data
analysis for biologists. Cambridge University Press, Cambridge.
Rice, W.R., 1989. Analysing tables of statistical tests. Evolution 43,
223–225.
Salminen, P., Kekalainen, H. (Eds.), 2000. The management of
agricultural heritage habitats in Finland. Report by the Heritage
Landscapes Working Group. Suomen ymparisto 443, pp. 1–162 (in
Finnish with English summary).
Sutherland, W.J., 2002. Restoring a sustainable countryside. Trends in
Ecology and Evolution 17, 148–150.
Thomas, C.D., Hanski, I., 1997. Butterfly metapopulations. In:
Hanski, I., Gilpin, M.E. (Eds.), Metapopulation Biology: Ecology,
Genetics and Evolution. Academic Press, San Diego, pp. 359–386.
Thomas, J.A., 1990. The conservation of Adonis blue and Lulworth
skipper butterflies – two sides of the same coin. In: Hillier, S.H.,
Walton, D.W.H., Wells, D.A. (Eds.), Calcareous Grasslands –
Ecology and Management. Proceedings of a joint British Ecolog-
ical Society/ Nature Conservancy Council symposium, 14–16
September 1987 at the University of Sheffield. Bluntisham Books,
Huntingdon, pp. 112–117.
Thomas, J.A., 1991. Rare species conservation: case studies of
European butterflies. In: Spellerberg, I.F., Goldsmith, F.B., Mor-
ris, M.G. (Eds.), The Scientific Management of Temperate Com-
munities for Conservation: the 31st Symposium of the British
Ecological Society, Southampton, 1989. Blackwell Science, Cam-
bridge, pp. 149–197.
Thomas, J.A., 1993. Holocene climate changes and warm man-made
refugia may explain why a sixth of British butterflies possess
unnatural early-successional habitats. Ecography 16, 278–284.
Vainio, M., Kekalainen, H., Alanen, A., Pykala, J., 2001. Traditional
rural biotopes in Finland. Final report of the nationwide inventory.
Suomen ymparisto 527, 1–163 (in Finnish with English summary).
WallisDeVries, M.F., 1995. Large herbivores and the design of large-
scale nature reserves in Western Europe. Conservation Biology 9,
25–33.
WallisDeVries, M.F., Bakker, J.P., Van Wieren, S.E. (Eds.), 1998.
Grazing and Conservation Management. Kluwer Academic Pub-
lishers, Dordrecht.
WallisDeVries, M.F., Raemakers, I., 2001. Does extensive grazing
benefit butterflies in coastal dunes. Restoration Ecology 9, 179–
188.


