Embed Size (px)
Citation preview
Velocity and runout simulation ofdestructive debris flows and debrisavalanches in pyroclastic deposits,Campania region, ItalyPaola Revellino Æ Oldrich Hungr Æ Francesco M. Guadagno Æ Stephen G. Evans
Abstract The Campanian Apennines arecharacterized by the presence of monocline ridges,mainly formed by limestone. During the periods ofvolcanic activity of the Somma-Vesuvius andPhlegrean Fields, the ridges were mantled withpyroclastic materials in varying thickness. Thepyroclastics have been involved in destructivelandslides both in historical time and in the recentpast (1997, 1998, 1999). The landslides occurfollowing intense and prolonged rainfalls. In somecases, landslides extended up to 4 km into thesurrounding lowlands and reached towns, causingsevere destruction and over 200 deaths. Generally,the landslides begin as small debris slides thatdevelop into large, shallow debris avalanches ordebris flows involving pyroclastic horizons andcolluvial soils (0.5–2 m thick) on steep andvegetated slopes, often at the heads of gullies. Duringmotion, the landslide materials eroded vegetationand soils from the slope, so that the moving materialvolume tended to increase. Then, proceedingtowards and beyond the base of the slopes, thephenomena evolved into hyperconcentratedstreamflow due to dilution by incorporating water.The results of motion analyses are described. Anempirical rheological relationship was used
including two principal terms that depend on thetotal normal stress and on the flow velocity. On thisbasis, the model has simulated the velocity andduration of debris avalanches and the distribution ofthe deposits. The selected areas were those of Sarno/Quindici and Cervinara, where a large amount ofdata is available both on the material properties andgeomorphological setting. It was found that themajority of the cases at the two sites can be simu-lated successfully with only one specific pair ofrheologic parameters. This provides the possibilityfor first-order predictions to be made of the motionof future landslides. Such predictions will be avaluable tool for outlining potential hazard areasand designing remedial measures.
Keywords Landslides Æ Debris flows Æ Pyroclasticsoil Æ Dynamic analysis Æ Southern Italy
Introduction
The Campania region of southern Italy has recentlyexperienced disastrous debris avalanches and debris flows(1997–2001) originating on steep slopes mantled bypyroclastic deposits (Calcaterra and others 1997; Celicoand Guadagno 1998; Del Prete and others 1998; Fiorilloand others 2001). The most recent events took place in twoclusters: the Sarno/Quindici events of 5–6 May 1998, whichkilled 161 persons and the Cervinara landslides of 15–16December 1999 with six dead (Fiorillo and others 2001).Altogether, over 180 major individual landslides took placein these two areas.The landslides were remarkably similar to each other interms of style, scale, mode of triggering, material and thegeological and topographic setting (Revellino and others2002). The authors formed a hypothesis that it would bepossible to simulate the dynamic behaviour of theselandslides using a single model, with a limited range ofinput parameters. Such a model, if successfully calibrated,could become a useful tool for predicting the behaviour offuture landslides of the same type and in similar settings.A systematic program of back-analysis using the program‘‘DAN’’ (‘‘dynamic analysis’’) developed by Hungr (1995)
Received: 18 December 2002 / Accepted: 30 July 2003Published online: 9 September 2003ª Springer-Verlag 2003
P. Revellino Æ F.M. Guadagno (&)Department of Geological and Environmental Studies,Faculty of Science, University of Sannio, via Port’Arsa,11 82100 Benevento, ItalyE-mail: [email protected]: +39-0824-23013
O. HungrDepartment of Earth and Ocean Sciences,University of British Columbia,6339 Stores Road, Vancouver, BC, V6T 1Z4, Canada
S.G. EvansGeological Survey of Canada, 601 Booth Street,Ottawa, Ontario, K1A 0E8, Canada
DOI 10.1007/s00254-003-0885-z Environmental Geology (2004) 45:295–311 295
Original article
was undertaken with the aim of calibrating the model for anumber of landslide cases from the Campania Region.Prediction of landslide runout and extent of the deposi-tional areas constitute fundamental factors in the evalua-tion of landslide intensity for risk assessment. Predictionsof landslide velocity, volume and discharge are also neededfor design of mitigation measures. Dynamic characteristicsincluding total runout distance, velocity of the flowingmass, thickness and distribution of debris are consideredin this paper.
Recent events in the Campaniaregion
Geological and geomorphological settingThe geology of the Campanian Apennines (Fig. 1) ischaracterized by the presence of calcareous and dolomiticmonocline ridges, generally oriented NW-SE and NE-SW,which derive from Plio-Pleistocene tectonic activity (Ip-polito and others 1975). The limestone blocks are karsti-fied to some degree. Fossil talus deposits, cemented bytravertine, mantle the toes of the limestone slopes in somelocations. Apart from these deposits, native regolith isgenerally absent on the steep calcareous bedrock slopes.During periods of volcanic activity of the Somma-Vesu-vius and the Phlegrean Fields, about 20–30 km to the west,air fall deposits mantled this rugged relief. The pyroclastic
materials deposited a thin but almost continuous mantleover the steep slopes of calcareous bedrock.The pyroclastic mantle is of varying thickness up to severalmetres, but is locally absent. It generally becomes thinnerwith increasing height above the base of the slopes. The airfall deposits date from volcanic eruptions of the last 22,000years, the youngest being A.D. 1631 (Rolandi and others2000). Some of the older layers contain weathered paleo-soil horizons, covered by younger pyroclastic material.The basal soil level in the region could be attributed to the35,000 years B.P. Campanian Ignimbrite (Rosi and Sbarna1987).The thickness of the pyroclastic mantle, formed fromairfall deposits and soil horizons, was controlled by theexposure of the slope in relation to the prevailing winddirections and by the surface morphology and slopeangles. The mantle covered surface irregularities creating asmooth topography, although steps are visible wherelimestone beds form vertical faces with typical subverticalcliffs (Guadagno 2000).The cyclic deposition of volcanic air fall, separated byperiods of weathering, creates a complex sequence of soils,as shown in Fig. 2. The individual layers have contrastingcharacteristics in terms of lithology, grain size and thick-ness. It must be stressed that all the layers dip approxi-mately parallel to the underlying calcareous bedrocksurface.The layered structure is fundamental to the developmentof landslide phenomena, as it controls the mechanical andhydrological behaviour of the slopes The pyroclasticmantle contains layers of varying density, grain sizes
296 Environmental Geology (2004) 45:295–311
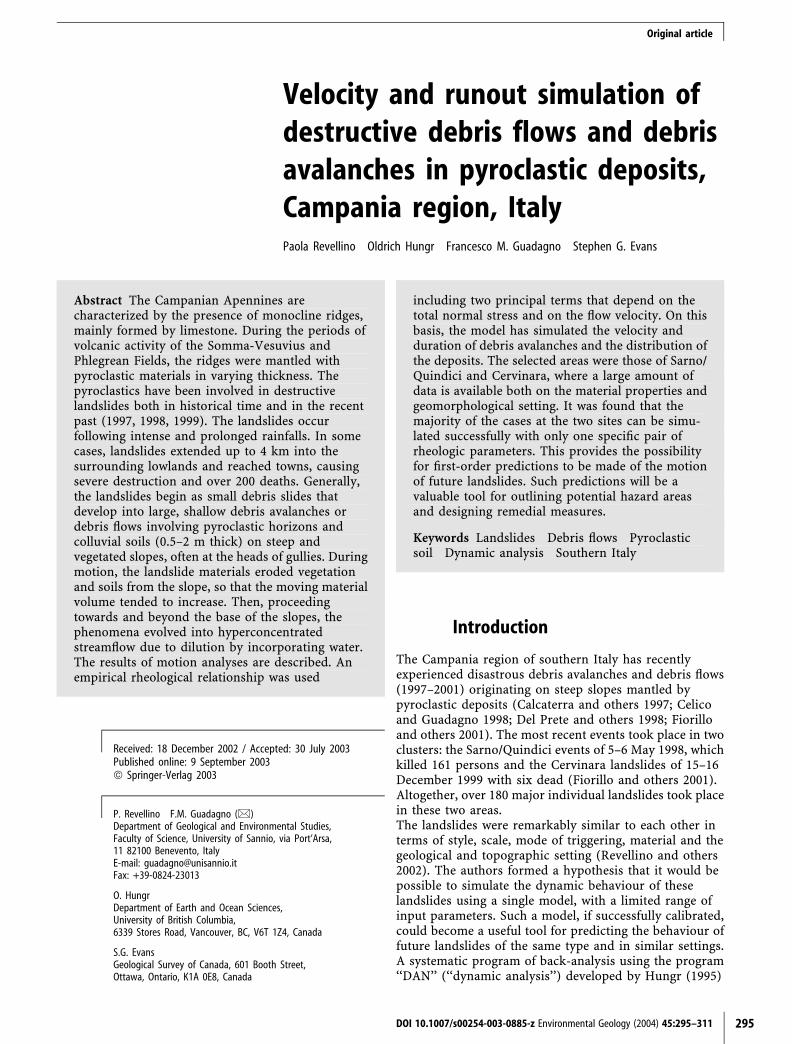
Fig. 1Generalized geology and location map. 1 Plio-Pleistocene deposits;2 Altavilla units (Tortonian Middle Pleistocene); 3 Irpinia units(Langhian–Tortonian); 4 Carbonate Matese unit (Trias-Paleocene);5 Carbonate unit of the Alburno-Cervate unit (Trias–Paleocene);6 Sicilide units (Cretaceous–Eocene); and 7 Principal faults. Locationsof Sarno/Quindici and Cervinara areas are also shown
Fig. 2Typical sequence of Pizzo d’Alvano soils exposed in an excavated pit.The light coloured layers are pumice; the dark-coloured layers areweathered soil horizons
Original article
ranging from clay to gravel-sized lapilli, uniform andgraded layers, soil horizons altered by chemical weath-ering, leaching and accumulation, and layers characterizedby macro-pores left by the decay of roots.The presence of pyroclastic deposits on slopes with anglesas steep as 40–50� points to a rather high friction angle forthe material, although incomplete saturation and thepresence of dense vegetation also play a role.The fertility of the pyroclastic soil has allowed the growthof dense vegetation on the slopes. The land has been used,since Romans times, for the cultivation of chestnut andfilbert nut trees. During the last few decades, many hori-zontal trackways have been created for access to theseplantations, which have interrupted the continuity of thepyroclastic cover of the steep slopes through fairly deepside cuts.
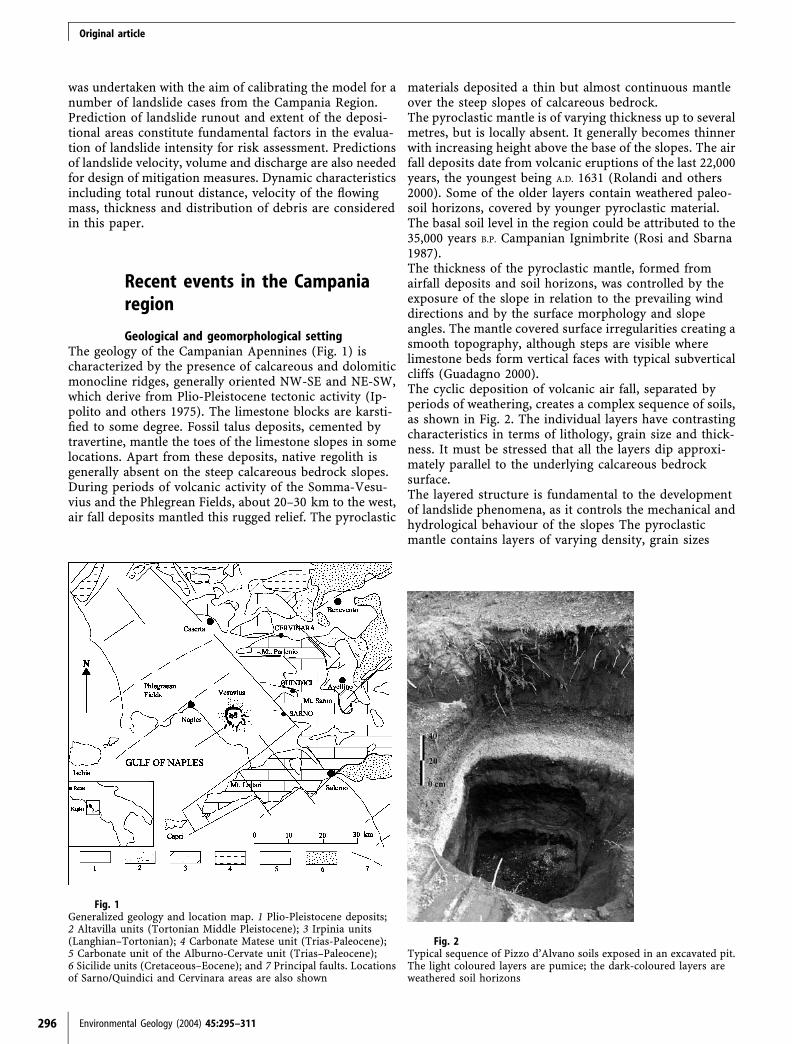
Geotechnical properties of the pyroclastic soilThe pyroclastic layers and soil horizons forming the coverof the carbonate ridges possess particular geological andgeotechnical properties that play an important role in thedevelopment of landslides. Table 1 shows a schematicprofile of soils and their geotechnical parameters, respec-tively, in the Sarno and Cervinara areas resulting fromanalysis carried out on representative samples (Guadagnoand Magaldi 2000; Fiorillo and others 2001). Failuresurfaces are usually located within the pyroclastic layers,generally at the bottom of a pumiceous horizon or at thetop to the particular silty and clayey yellowish basal soil
with pumiceous clasts, probably attributable to theCampanian Ignimbrite.As inferred in Table 1, the tephritic-fonolitic pumiceforming much of the air fall deposits can be considered asa well-graded granular material (friction angle between 38and 45�), but with an unusual character. Esposito andGuadagno (1998) showed that the presence of intercon-nected voids within the grains strongly influence waterflow, causing suction and complex water diffusion effects.As a result, greater volumes of water, and therefore longerperiods of rainfall, are needed to obtain fully saturatedconditions than would be necessary for soils made of solidclasts.In contrast, the fossil soil horizons can be considered ascohesive materials and their behaviour is influenced aboveall by their mineralogy. Terribile and others (1999) andGuadagno and Magaldi (2000) recognize the presence ofallophane soils (Maeda and others 1977) with some or-ganic content. As a result of this, the Campanian volcanicsoils exhibit high values of liquid limit at relatively lowclay content. The clays appear over-consolidated (OCR>5), but without significant true cohesion. The residualfriction angle, more than 25�, is quite high and similar tothe peak angle, probably contributing to the stability ofthis pyroclastic soil on steep slopes (Guadagno 2000).In Fig. 3a, results of grain size analyses on representativesamples of pyroclastic layers are reported. Pyroclasticmaterial can be classified as sand with gravel and silt witha small clay fraction. Similar granulometric characteristics
Environmental Geology (2004) 45:295–311 297
Table 1Typical schematic soil profile and geotechnical parameters of thepyroclastic mantle in the Sarno/Quindici and Cervinara area. Loca-tions of failure surfaces are also indicated at the base of C2 and Bwb2horizons. Soils are named following the soil taxonomy(Soil SurveyStaff 1975, 1992) as follows: surficial horizon (A); weathering deep
horizon (Bw1, Bw2); deep horizon less weathered (C1, C2); buriedsurficial horizon (Ab); buried weathering deep horizon (Bwb1, Bwb2);weathering illuvial deep horizon (Bt); suffixes (1) and (2) in soildescription mark similar horizons belonging to different eruptions
Original article
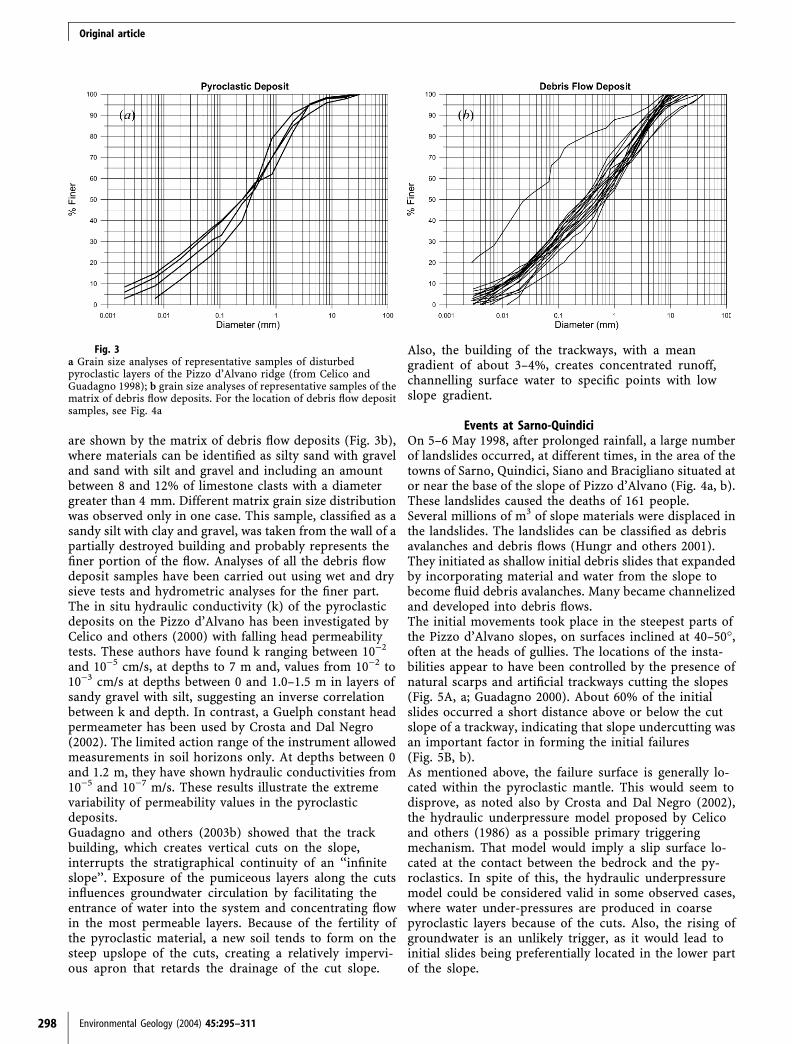
are shown by the matrix of debris flow deposits (Fig. 3b),where materials can be identified as silty sand with graveland sand with silt and gravel and including an amountbetween 8 and 12% of limestone clasts with a diametergreater than 4 mm. Different matrix grain size distributionwas observed only in one case. This sample, classified as asandy silt with clay and gravel, was taken from the wall of apartially destroyed building and probably represents thefiner portion of the flow. Analyses of all the debris flowdeposit samples have been carried out using wet and drysieve tests and hydrometric analyses for the finer part.The in situ hydraulic conductivity (k) of the pyroclasticdeposits on the Pizzo d’Alvano has been investigated byCelico and others (2000) with falling head permeabilitytests. These authors have found k ranging between 10)2
and 10)5 cm/s, at depths to 7 m and, values from 10)2 to10)3 cm/s at depths between 0 and 1.0–1.5 m in layers ofsandy gravel with silt, suggesting an inverse correlationbetween k and depth. In contrast, a Guelph constant headpermeameter has been used by Crosta and Dal Negro(2002). The limited action range of the instrument allowedmeasurements in soil horizons only. At depths between 0and 1.2 m, they have shown hydraulic conductivities from10)5 and 10)7 m/s. These results illustrate the extremevariability of permeability values in the pyroclasticdeposits.Guadagno and others (2003b) showed that the trackbuilding, which creates vertical cuts on the slope,interrupts the stratigraphical continuity of an ‘‘infiniteslope’’. Exposure of the pumiceous layers along the cutsinfluences groundwater circulation by facilitating theentrance of water into the system and concentrating flowin the most permeable layers. Because of the fertility ofthe pyroclastic material, a new soil tends to form on thesteep upslope of the cuts, creating a relatively impervi-ous apron that retards the drainage of the cut slope.
Also, the building of the trackways, with a meangradient of about 3–4%, creates concentrated runoff,channelling surface water to specific points with lowslope gradient.
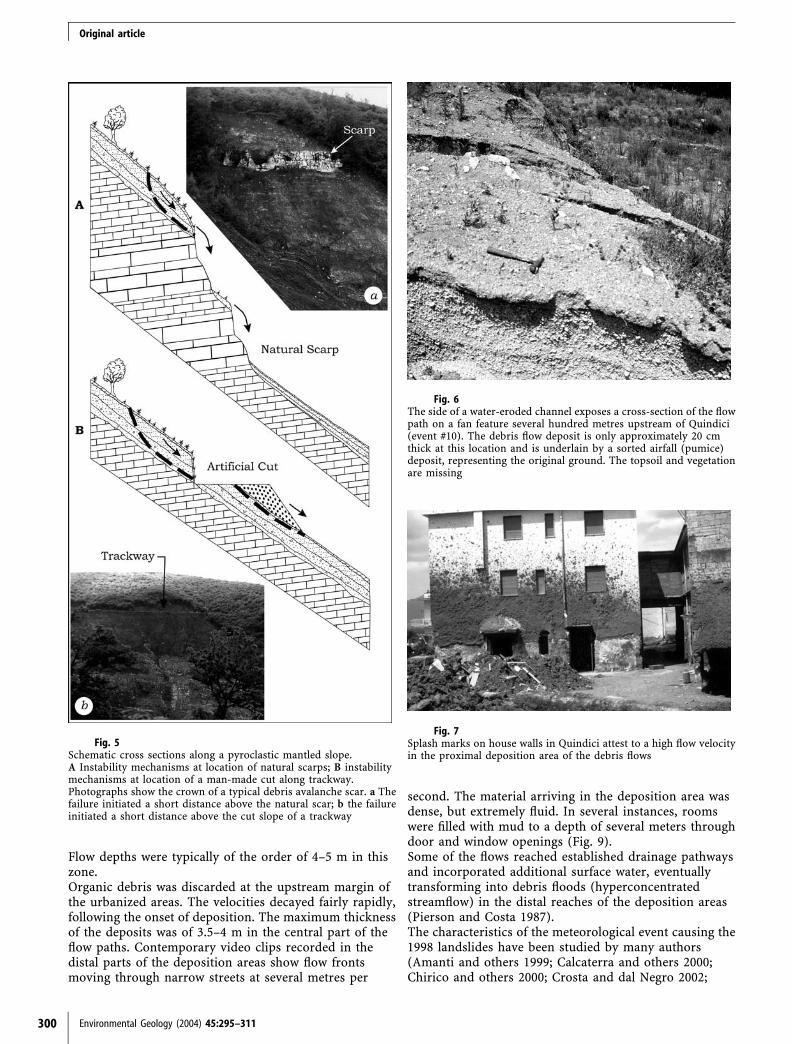
Events at Sarno-QuindiciOn 5–6 May 1998, after prolonged rainfall, a large numberof landslides occurred, at different times, in the area of thetowns of Sarno, Quindici, Siano and Bracigliano situated ator near the base of the slope of Pizzo d’Alvano (Fig. 4a, b).These landslides caused the deaths of 161 people.Several millions of m3 of slope materials were displaced inthe landslides. The landslides can be classified as debrisavalanches and debris flows (Hungr and others 2001).They initiated as shallow initial debris slides that expandedby incorporating material and water from the slope tobecome fluid debris avalanches. Many became channelizedand developed into debris flows.The initial movements took place in the steepest parts ofthe Pizzo d’Alvano slopes, on surfaces inclined at 40–50�,often at the heads of gullies. The locations of the insta-bilities appear to have been controlled by the presence ofnatural scarps and artificial trackways cutting the slopes(Fig. 5A, a; Guadagno 2000). About 60% of the initialslides occurred a short distance above or below the cutslope of a trackway, indicating that slope undercutting wasan important factor in forming the initial failures(Fig. 5B, b).As mentioned above, the failure surface is generally lo-cated within the pyroclastic mantle. This would seem todisprove, as noted also by Crosta and Dal Negro (2002),the hydraulic underpressure model proposed by Celicoand others (1986) as a possible primary triggeringmechanism. That model would imply a slip surface lo-cated at the contact between the bedrock and the py-roclastics. In spite of this, the hydraulic underpressuremodel could be considered valid in some observed cases,where water under-pressures are produced in coarsepyroclastic layers because of the cuts. Also, the rising ofgroundwater is an unlikely trigger, as it would lead toinitial slides being preferentially located in the lower partof the slope.
298 Environmental Geology (2004) 45:295–311
Fig. 3a Grain size analyses of representative samples of disturbedpyroclastic layers of the Pizzo d’Alvano ridge (from Celico andGuadagno 1998); b grain size analyses of representative samples of thematrix of debris flow deposits. For the location of debris flow depositsamples, see Fig. 4a
Original article
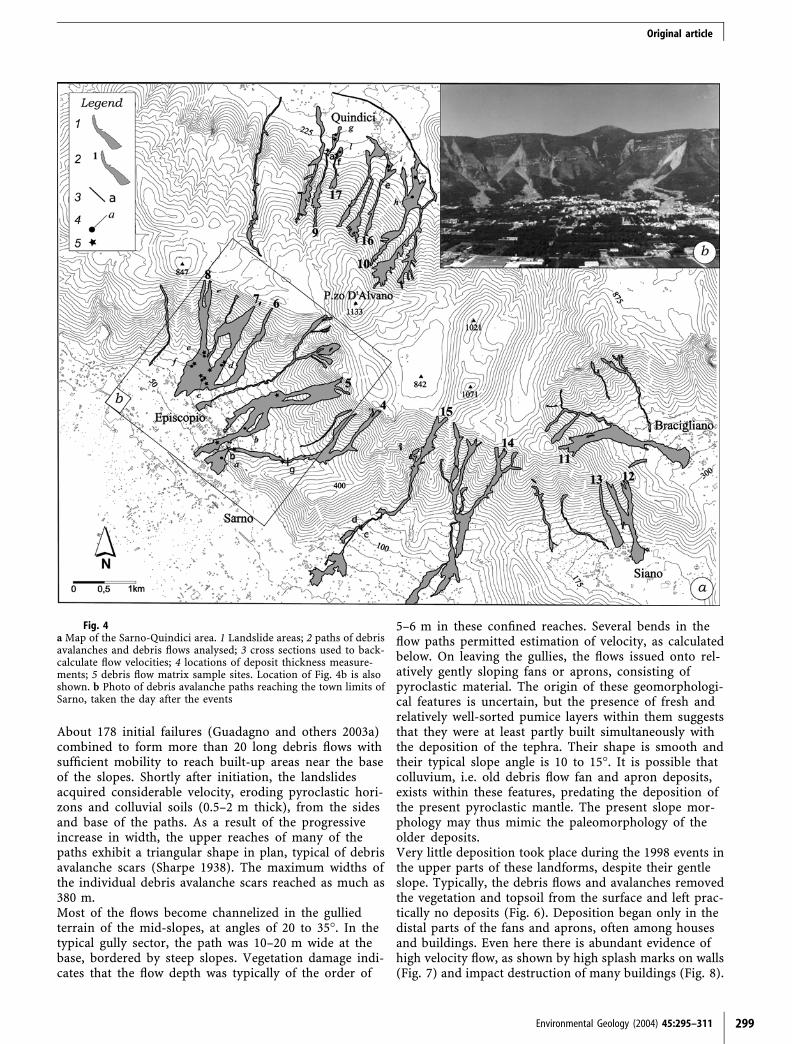
About 178 initial failures (Guadagno and others 2003a)combined to form more than 20 long debris flows withsufficient mobility to reach built-up areas near the baseof the slopes. Shortly after initiation, the landslidesacquired considerable velocity, eroding pyroclastic hori-zons and colluvial soils (0.5–2 m thick), from the sidesand base of the paths. As a result of the progressiveincrease in width, the upper reaches of many of thepaths exhibit a triangular shape in plan, typical of debrisavalanche scars (Sharpe 1938). The maximum widths ofthe individual debris avalanche scars reached as much as380 m.Most of the flows become channelized in the gulliedterrain of the mid-slopes, at angles of 20 to 35�. In thetypical gully sector, the path was 10–20 m wide at thebase, bordered by steep slopes. Vegetation damage indi-cates that the flow depth was typically of the order of
5–6 m in these confined reaches. Several bends in theflow paths permitted estimation of velocity, as calculatedbelow. On leaving the gullies, the flows issued onto rel-atively gently sloping fans or aprons, consisting ofpyroclastic material. The origin of these geomorphologi-cal features is uncertain, but the presence of fresh andrelatively well-sorted pumice layers within them suggeststhat they were at least partly built simultaneously withthe deposition of the tephra. Their shape is smooth andtheir typical slope angle is 10 to 15�. It is possible thatcolluvium, i.e. old debris flow fan and apron deposits,exists within these features, predating the deposition ofthe present pyroclastic mantle. The present slope mor-phology may thus mimic the paleomorphology of theolder deposits.Very little deposition took place during the 1998 events inthe upper parts of these landforms, despite their gentleslope. Typically, the debris flows and avalanches removedthe vegetation and topsoil from the surface and left prac-tically no deposits (Fig. 6). Deposition began only in thedistal parts of the fans and aprons, often among housesand buildings. Even here there is abundant evidence ofhigh velocity flow, as shown by high splash marks on walls(Fig. 7) and impact destruction of many buildings (Fig. 8).
Environmental Geology (2004) 45:295–311 299
Fig. 4a Map of the Sarno-Quindici area. 1 Landslide areas; 2 paths of debrisavalanches and debris flows analysed; 3 cross sections used to back-calculate flow velocities; 4 locations of deposit thickness measure-ments; 5 debris flow matrix sample sites. Location of Fig. 4b is alsoshown. b Photo of debris avalanche paths reaching the town limits ofSarno, taken the day after the events
Original article
Flow depths were typically of the order of 4–5 m in thiszone.Organic debris was discarded at the upstream margin ofthe urbanized areas. The velocities decayed fairly rapidly,following the onset of deposition. The maximum thicknessof the deposits was of 3.5–4 m in the central part of theflow paths. Contemporary video clips recorded in thedistal parts of the deposition areas show flow frontsmoving through narrow streets at several metres per
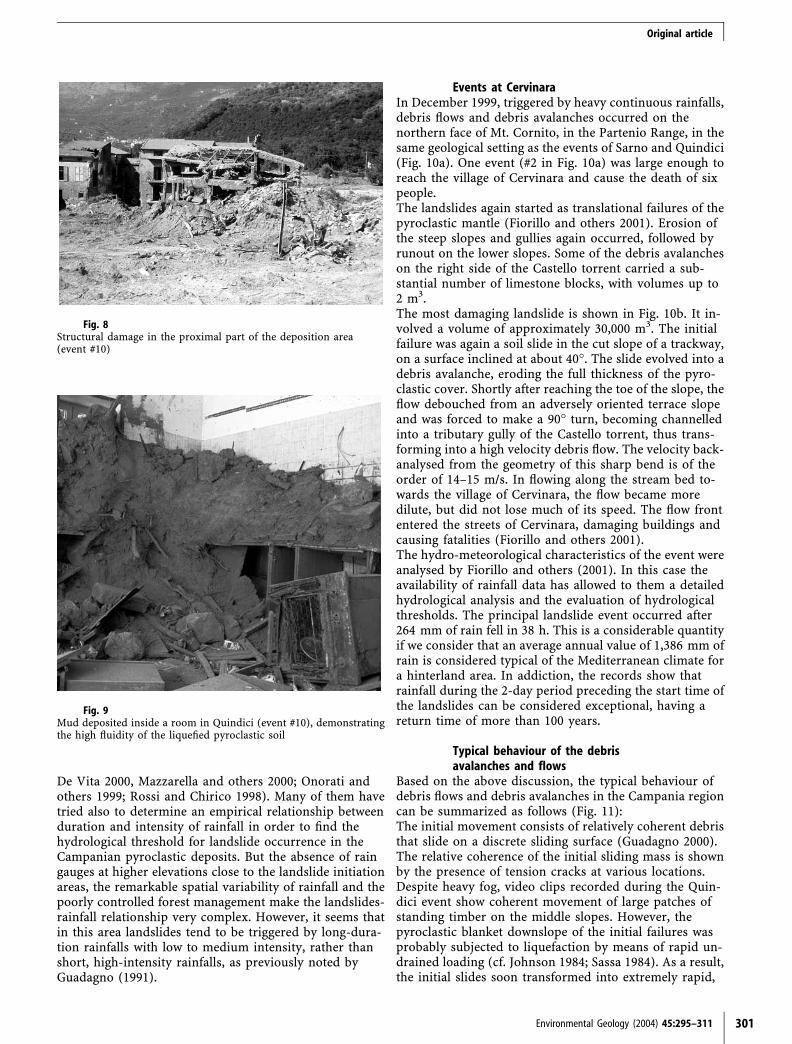
second. The material arriving in the deposition area wasdense, but extremely fluid. In several instances, roomswere filled with mud to a depth of several meters throughdoor and window openings (Fig. 9).Some of the flows reached established drainage pathwaysand incorporated additional surface water, eventuallytransforming into debris floods (hyperconcentratedstreamflow) in the distal reaches of the deposition areas(Pierson and Costa 1987).The characteristics of the meteorological event causing the1998 landslides have been studied by many authors(Amanti and others 1999; Calcaterra and others 2000;Chirico and others 2000; Crosta and dal Negro 2002;
300 Environmental Geology (2004) 45:295–311
Fig. 5Schematic cross sections along a pyroclastic mantled slope.A Instability mechanisms at location of natural scarps; B instabilitymechanisms at location of a man-made cut along trackway.Photographs show the crown of a typical debris avalanche scar. a Thefailure initiated a short distance above the natural scar; b the failureinitiated a short distance above the cut slope of a trackway
Fig. 6The side of a water-eroded channel exposes a cross-section of the flowpath on a fan feature several hundred metres upstream of Quindici(event #10). The debris flow deposit is only approximately 20 cmthick at this location and is underlain by a sorted airfall (pumice)deposit, representing the original ground. The topsoil and vegetationare missing
Fig. 7Splash marks on house walls in Quindici attest to a high flow velocityin the proximal deposition area of the debris flows
Original article
De Vita 2000, Mazzarella and others 2000; Onorati andothers 1999; Rossi and Chirico 1998). Many of them havetried also to determine an empirical relationship betweenduration and intensity of rainfall in order to find thehydrological threshold for landslide occurrence in theCampanian pyroclastic deposits. But the absence of raingauges at higher elevations close to the landslide initiationareas, the remarkable spatial variability of rainfall and thepoorly controlled forest management make the landslides-rainfall relationship very complex. However, it seems thatin this area landslides tend to be triggered by long-dura-tion rainfalls with low to medium intensity, rather thanshort, high-intensity rainfalls, as previously noted byGuadagno (1991).
Events at CervinaraIn December 1999, triggered by heavy continuous rainfalls,debris flows and debris avalanches occurred on thenorthern face of Mt. Cornito, in the Partenio Range, in thesame geological setting as the events of Sarno and Quindici(Fig. 10a). One event (#2 in Fig. 10a) was large enough toreach the village of Cervinara and cause the death of sixpeople.The landslides again started as translational failures of thepyroclastic mantle (Fiorillo and others 2001). Erosion ofthe steep slopes and gullies again occurred, followed byrunout on the lower slopes. Some of the debris avalancheson the right side of the Castello torrent carried a sub-stantial number of limestone blocks, with volumes up to2 m3.The most damaging landslide is shown in Fig. 10b. It in-volved a volume of approximately 30,000 m3. The initialfailure was again a soil slide in the cut slope of a trackway,on a surface inclined at about 40�. The slide evolved into adebris avalanche, eroding the full thickness of the pyro-clastic cover. Shortly after reaching the toe of the slope, theflow debouched from an adversely oriented terrace slopeand was forced to make a 90� turn, becoming channelledinto a tributary gully of the Castello torrent, thus trans-forming into a high velocity debris flow. The velocity back-analysed from the geometry of this sharp bend is of theorder of 14–15 m/s. In flowing along the stream bed to-wards the village of Cervinara, the flow became moredilute, but did not lose much of its speed. The flow frontentered the streets of Cervinara, damaging buildings andcausing fatalities (Fiorillo and others 2001).The hydro-meteorological characteristics of the event wereanalysed by Fiorillo and others (2001). In this case theavailability of rainfall data has allowed to them a detailedhydrological analysis and the evaluation of hydrologicalthresholds. The principal landslide event occurred after264 mm of rain fell in 38 h. This is a considerable quantityif we consider that an average annual value of 1,386 mm ofrain is considered typical of the Mediterranean climate fora hinterland area. In addiction, the records show thatrainfall during the 2-day period preceding the start time ofthe landslides can be considered exceptional, having areturn time of more than 100 years.
Typical behaviour of the debrisavalanches and flows
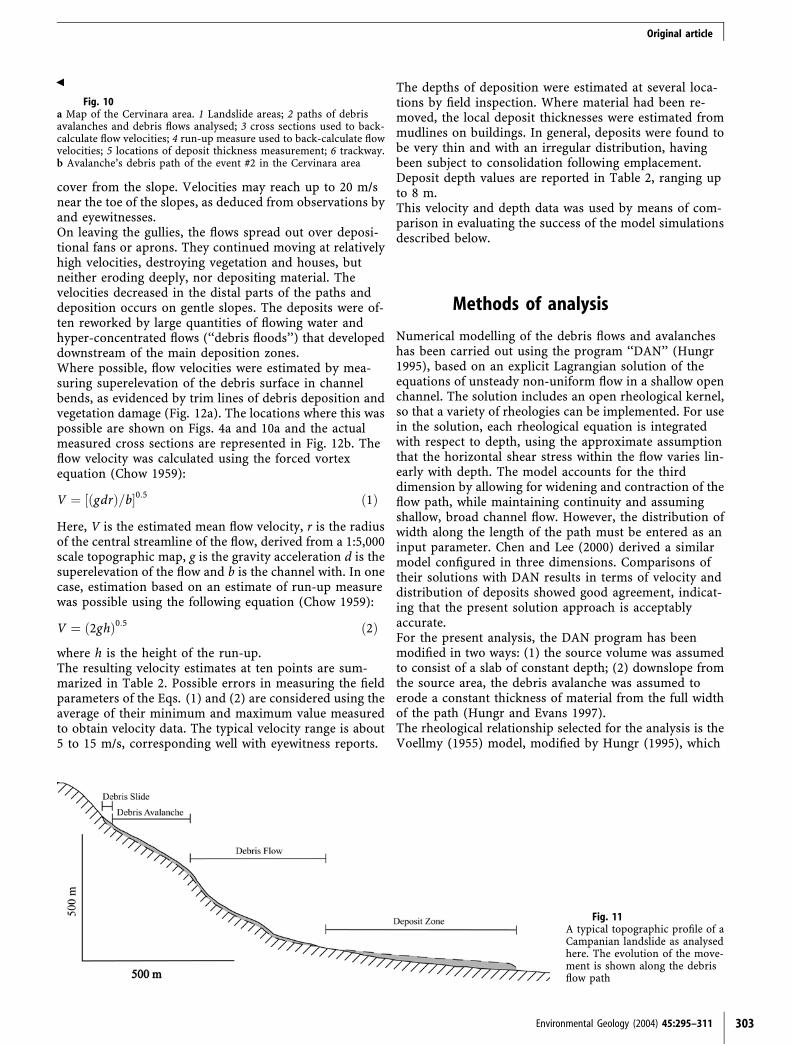
Based on the above discussion, the typical behaviour ofdebris flows and debris avalanches in the Campania regioncan be summarized as follows (Fig. 11):The initial movement consists of relatively coherent debristhat slide on a discrete sliding surface (Guadagno 2000).The relative coherence of the initial sliding mass is shownby the presence of tension cracks at various locations.Despite heavy fog, video clips recorded during the Quin-dici event show coherent movement of large patches ofstanding timber on the middle slopes. However, thepyroclastic blanket downslope of the initial failures wasprobably subjected to liquefaction by means of rapid un-drained loading (cf. Johnson 1984; Sassa 1984). As a result,the initial slides soon transformed into extremely rapid,
Environmental Geology (2004) 45:295–311 301
Fig. 8Structural damage in the proximal part of the deposition area(event #10)
Fig. 9Mud deposited inside a room in Quindici (event #10), demonstratingthe high fluidity of the liquefied pyroclastic soil
Original article
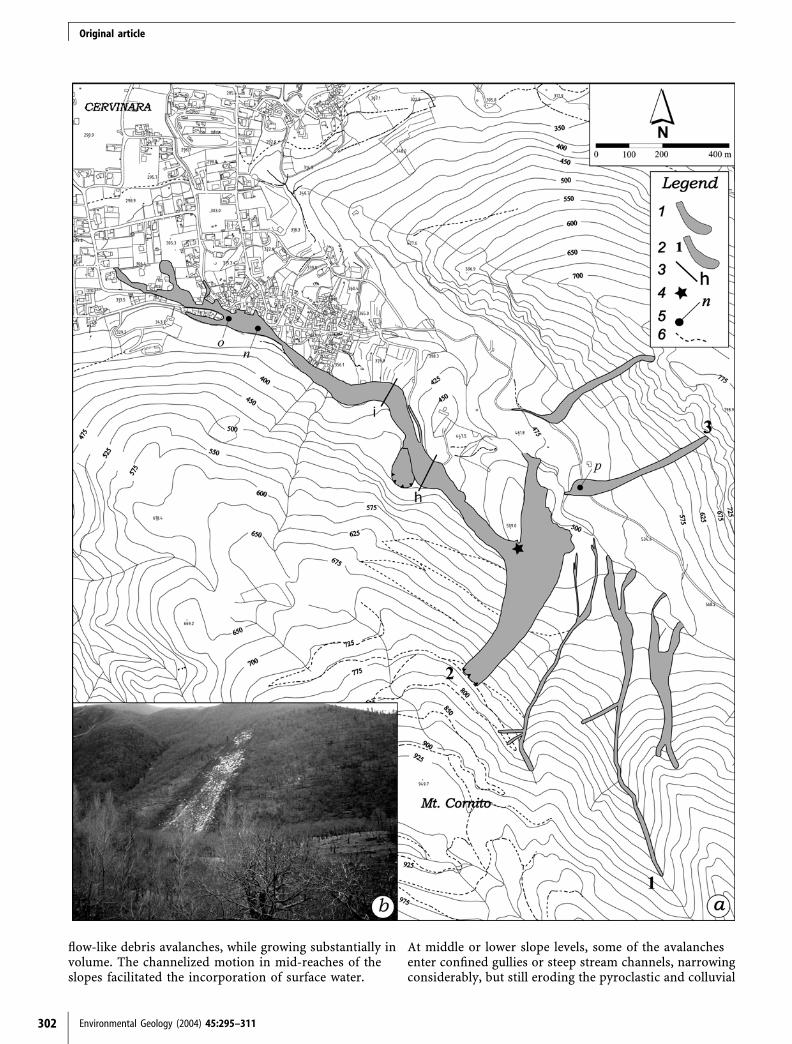
flow-like debris avalanches, while growing substantially involume. The channelized motion in mid-reaches of theslopes facilitated the incorporation of surface water.
At middle or lower slope levels, some of the avalanchesenter confined gullies or steep stream channels, narrowingconsiderably, but still eroding the pyroclastic and colluvial
302 Environmental Geology (2004) 45:295–311
Original article
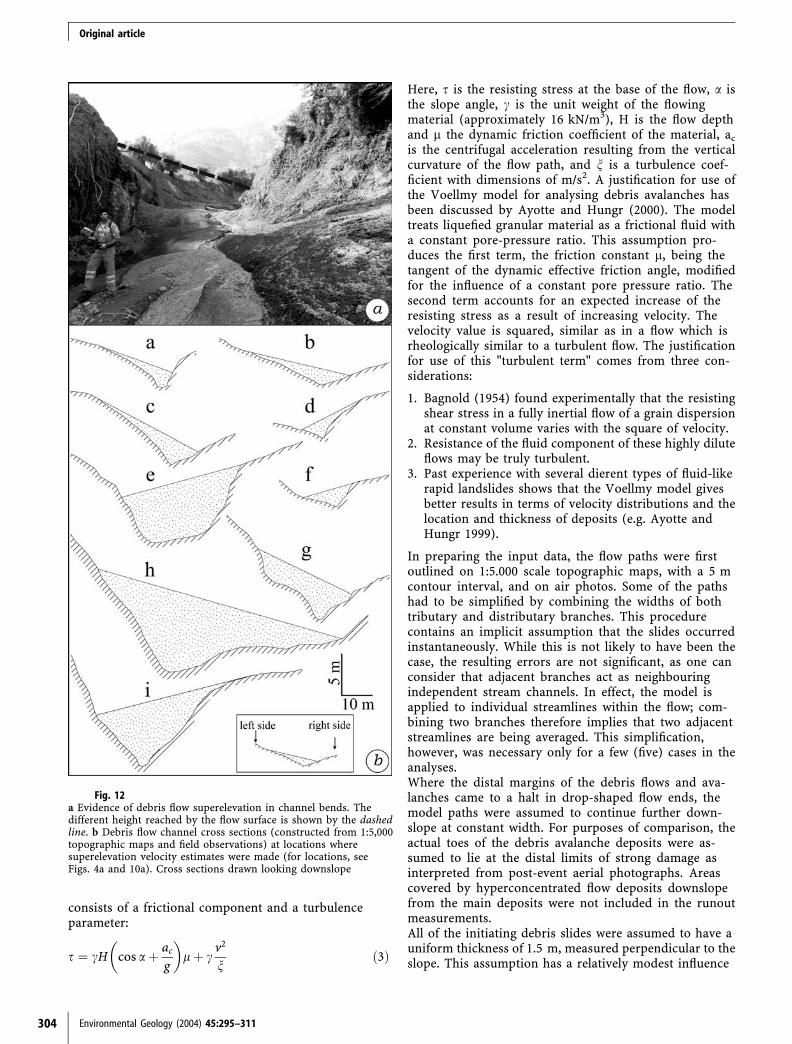
cover from the slope. Velocities may reach up to 20 m/snear the toe of the slopes, as deduced from observations byand eyewitnesses.On leaving the gullies, the flows spread out over deposi-tional fans or aprons. They continued moving at relativelyhigh velocities, destroying vegetation and houses, butneither eroding deeply, nor depositing material. Thevelocities decreased in the distal parts of the paths anddeposition occurs on gentle slopes. The deposits were of-ten reworked by large quantities of flowing water andhyper-concentrated flows (‘‘debris floods’’) that developeddownstream of the main deposition zones.Where possible, flow velocities were estimated by mea-suring superelevation of the debris surface in channelbends, as evidenced by trim lines of debris deposition andvegetation damage (Fig. 12a). The locations where this waspossible are shown on Figs. 4a and 10a and the actualmeasured cross sections are represented in Fig. 12b. Theflow velocity was calculated using the forced vortexequation (Chow 1959):
V ¼ gdrð Þ=b½ �0:5 ð1Þ
Here, V is the estimated mean flow velocity, r is the radiusof the central streamline of the flow, derived from a 1:5,000scale topographic map, g is the gravity acceleration d is thesuperelevation of the flow and b is the channel with. In onecase, estimation based on an estimate of run-up measurewas possible using the following equation (Chow 1959):
V ¼ 2ghð Þ0:5 ð2Þ
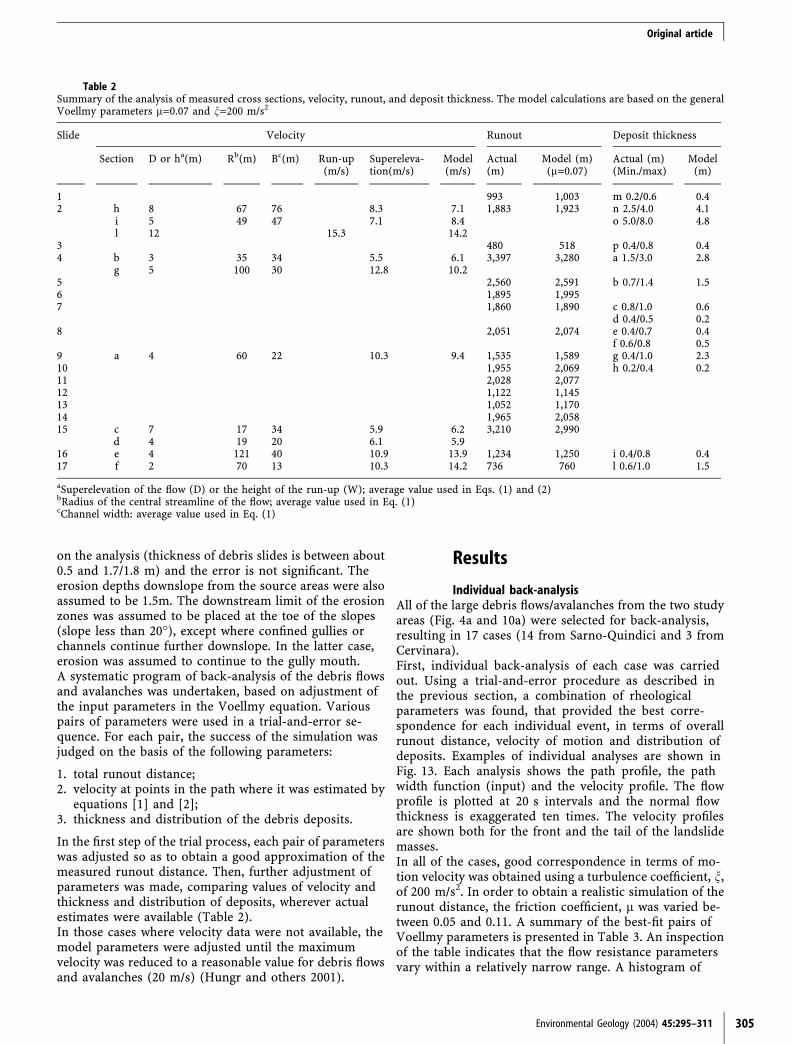
where h is the height of the run-up.The resulting velocity estimates at ten points are sum-marized in Table 2. Possible errors in measuring the fieldparameters of the Eqs. (1) and (2) are considered using theaverage of their minimum and maximum value measuredto obtain velocity data. The typical velocity range is about5 to 15 m/s, corresponding well with eyewitness reports.
The depths of deposition were estimated at several loca-tions by field inspection. Where material had been re-moved, the local deposit thicknesses were estimated frommudlines on buildings. In general, deposits were found tobe very thin and with an irregular distribution, havingbeen subject to consolidation following emplacement.Deposit depth values are reported in Table 2, ranging upto 8 m.This velocity and depth data was used by means of com-parison in evaluating the success of the model simulationsdescribed below.
Methods of analysis
Numerical modelling of the debris flows and avalancheshas been carried out using the program ‘‘DAN’’ (Hungr1995), based on an explicit Lagrangian solution of theequations of unsteady non-uniform flow in a shallow openchannel. The solution includes an open rheological kernel,so that a variety of rheologies can be implemented. For usein the solution, each rheological equation is integratedwith respect to depth, using the approximate assumptionthat the horizontal shear stress within the flow varies lin-early with depth. The model accounts for the thirddimension by allowing for widening and contraction of theflow path, while maintaining continuity and assumingshallow, broad channel flow. However, the distribution ofwidth along the length of the path must be entered as aninput parameter. Chen and Lee (2000) derived a similarmodel configured in three dimensions. Comparisons oftheir solutions with DAN results in terms of velocity anddistribution of deposits showed good agreement, indicat-ing that the present solution approach is acceptablyaccurate.For the present analysis, the DAN program has beenmodified in two ways: (1) the source volume was assumedto consist of a slab of constant depth; (2) downslope fromthe source area, the debris avalanche was assumed toerode a constant thickness of material from the full widthof the path (Hungr and Evans 1997).The rheological relationship selected for the analysis is theVoellmy (1955) model, modified by Hungr (1995), which
Environmental Geology (2004) 45:295–311 303
Fig. 10a Map of the Cervinara area. 1 Landslide areas; 2 paths of debrisavalanches and debris flows analysed; 3 cross sections used to back-calculate flow velocities; 4 run-up measure used to back-calculate flowvelocities; 5 locations of deposit thickness measurement; 6 trackway.b Avalanche’s debris path of the event #2 in the Cervinara area
Fig. 11A typical topographic profile of aCampanian landslide as analysedhere. The evolution of the move-ment is shown along the debrisflow path
b
Original article
consists of a frictional component and a turbulenceparameter:
s ¼ cH cos aþ ac
g
� �lþ c
v2
nð3Þ
Here, s is the resisting stress at the base of the flow, a isthe slope angle, c is the unit weight of the flowingmaterial (approximately 16 kN/m3), H is the flow depthand l the dynamic friction coefficient of the material, ac
is the centrifugal acceleration resulting from the verticalcurvature of the flow path, and n is a turbulence coef-ficient with dimensions of m/s2. A justification for use ofthe Voellmy model for analysing debris avalanches hasbeen discussed by Ayotte and Hungr (2000). The modeltreats liquefied granular material as a frictional fluid witha constant pore-pressure ratio. This assumption pro-duces the first term, the friction constant l, being thetangent of the dynamic effective friction angle, modifiedfor the influence of a constant pore pressure ratio. Thesecond term accounts for an expected increase of theresisting stress as a result of increasing velocity. Thevelocity value is squared, similar as in a flow which isrheologically similar to a turbulent flow. The justificationfor use of this "turbulent term" comes from three con-siderations:
1. Bagnold (1954) found experimentally that the resistingshear stress in a fully inertial flow of a grain dispersionat constant volume varies with the square of velocity.
2. Resistance of the fluid component of these highly diluteflows may be truly turbulent.
3. Past experience with several dierent types of fluid-likerapid landslides shows that the Voellmy model givesbetter results in terms of velocity distributions and thelocation and thickness of deposits (e.g. Ayotte andHungr 1999).
In preparing the input data, the flow paths were firstoutlined on 1:5.000 scale topographic maps, with a 5 mcontour interval, and on air photos. Some of the pathshad to be simplified by combining the widths of bothtributary and distributary branches. This procedurecontains an implicit assumption that the slides occurredinstantaneously. While this is not likely to have been thecase, the resulting errors are not significant, as one canconsider that adjacent branches act as neighbouringindependent stream channels. In effect, the model isapplied to individual streamlines within the flow; com-bining two branches therefore implies that two adjacentstreamlines are being averaged. This simplification,however, was necessary only for a few (five) cases in theanalyses.Where the distal margins of the debris flows and ava-lanches came to a halt in drop-shaped flow ends, themodel paths were assumed to continue further down-slope at constant width. For purposes of comparison, theactual toes of the debris avalanche deposits were as-sumed to lie at the distal limits of strong damage asinterpreted from post-event aerial photographs. Areascovered by hyperconcentrated flow deposits downslopefrom the main deposits were not included in the runoutmeasurements.All of the initiating debris slides were assumed to have auniform thickness of 1.5 m, measured perpendicular to theslope. This assumption has a relatively modest influence
304 Environmental Geology (2004) 45:295–311
Fig. 12a Evidence of debris flow superelevation in channel bends. Thedifferent height reached by the flow surface is shown by the dashedline. b Debris flow channel cross sections (constructed from 1:5,000topographic maps and field observations) at locations wheresuperelevation velocity estimates were made (for locations, seeFigs. 4a and 10a). Cross sections drawn looking downslope
Original article
on the analysis (thickness of debris slides is between about0.5 and 1.7/1.8 m) and the error is not significant. Theerosion depths downslope from the source areas were alsoassumed to be 1.5m. The downstream limit of the erosionzones was assumed to be placed at the toe of the slopes(slope less than 20�), except where confined gullies orchannels continue further downslope. In the latter case,erosion was assumed to continue to the gully mouth.A systematic program of back-analysis of the debris flowsand avalanches was undertaken, based on adjustment ofthe input parameters in the Voellmy equation. Variouspairs of parameters were used in a trial-and-error se-quence. For each pair, the success of the simulation wasjudged on the basis of the following parameters:
1. total runout distance;2. velocity at points in the path where it was estimated by
equations [1] and [2];3. thickness and distribution of the debris deposits.
In the first step of the trial process, each pair of parameterswas adjusted so as to obtain a good approximation of themeasured runout distance. Then, further adjustment ofparameters was made, comparing values of velocity andthickness and distribution of deposits, wherever actualestimates were available (Table 2).In those cases where velocity data were not available, themodel parameters were adjusted until the maximumvelocity was reduced to a reasonable value for debris flowsand avalanches (20 m/s) (Hungr and others 2001).
Results
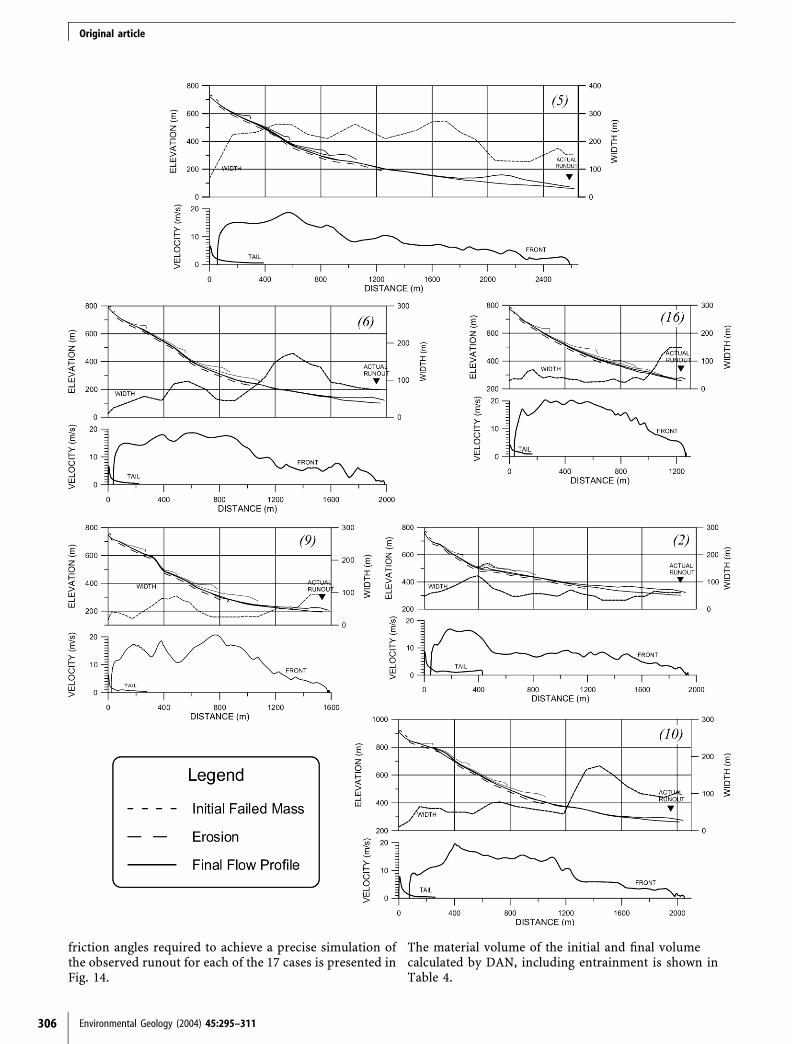
Individual back-analysisAll of the large debris flows/avalanches from the two studyareas (Fig. 4a and 10a) were selected for back-analysis,resulting in 17 cases (14 from Sarno-Quindici and 3 fromCervinara).First, individual back-analysis of each case was carriedout. Using a trial-and-error procedure as described inthe previous section, a combination of rheologicalparameters was found, that provided the best corre-spondence for each individual event, in terms of overallrunout distance, velocity of motion and distribution ofdeposits. Examples of individual analyses are shown inFig. 13. Each analysis shows the path profile, the pathwidth function (input) and the velocity profile. The flowprofile is plotted at 20 s intervals and the normal flowthickness is exaggerated ten times. The velocity profilesare shown both for the front and the tail of the landslidemasses.In all of the cases, good correspondence in terms of mo-tion velocity was obtained using a turbulence coefficient, n,of 200 m/s2. In order to obtain a realistic simulation of therunout distance, the friction coefficient, l was varied be-tween 0.05 and 0.11. A summary of the best-fit pairs ofVoellmy parameters is presented in Table 3. An inspectionof the table indicates that the flow resistance parametersvary within a relatively narrow range. A histogram of
Environmental Geology (2004) 45:295–311 305
Table 2Summary of the analysis of measured cross sections, velocity, runout, and deposit thickness. The model calculations are based on the generalVoellmy parameters l=0.07 and n=200 m/s2
Slide Velocity Runout Deposit thickness
Section D or ha(m) Rb(m) Bc(m) Run-up(m/s)
Supereleva-tion(m/s)
Model(m/s)
Actual(m)
Model (m)(l=0.07)
Actual (m)(Min./max)
Model(m)
1 993 1,003 m 0.2/0.6 0.42 h 8 67 76 8.3 7.1 1,883 1,923 n 2.5/4.0 4.1
i 5 49 47 7.1 8.4 o 5.0/8.0 4.8l 12 15.3 14.2
3 480 518 p 0.4/0.8 0.44 b 3 35 34 5.5 6.1 3,397 3,280 a 1.5/3.0 2.8
g 5 100 30 12.8 10.25 2,560 2,591 b 0.7/1.4 1.56 1,895 1,9957 1,860 1,890 c 0.8/1.0 0.6
d 0.4/0.5 0.28 2,051 2,074 e 0.4/0.7 0.4
f 0.6/0.8 0.59 a 4 60 22 10.3 9.4 1,535 1,589 g 0.4/1.0 2.310 1,955 2,069 h 0.2/0.4 0.211 2,028 2,07712 1,122 1,14513 1,052 1,17014 1,965 2,05815 c 7 17 34 5.9 6.2 3,210 2,990
d 4 19 20 6.1 5.916 e 4 121 40 10.9 13.9 1,234 1,250 i 0.4/0.8 0.417 f 2 70 13 10.3 14.2 736 760 l 0.6/1.0 1.5
aSuperelevation of the flow (D) or the height of the run-up (W); average value used in Eqs. (1) and (2)bRadius of the central streamline of the flow; average value used in Eq. (1)cChannel width: average value used in Eq. (1)
Original article
friction angles required to achieve a precise simulation ofthe observed runout for each of the 17 cases is presented inFig. 14.
The material volume of the initial and final volumecalculated by DAN, including entrainment is shown inTable 4.
306 Environmental Geology (2004) 45:295–311
Original article
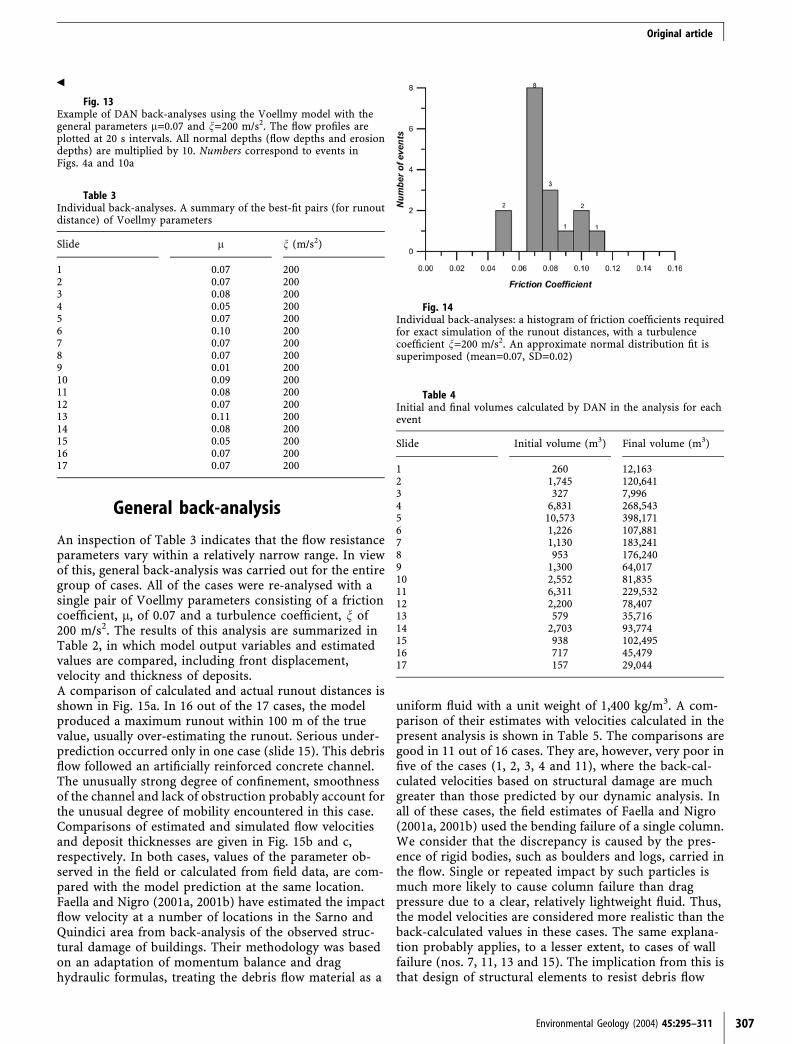
General back-analysis
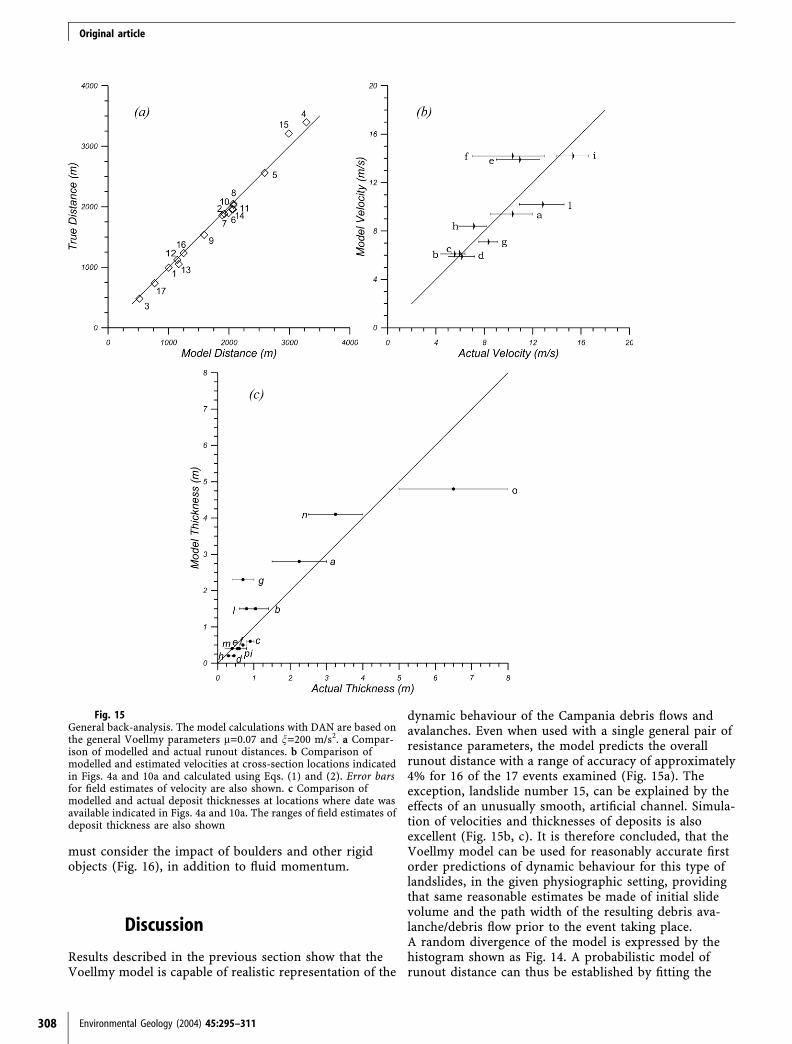
An inspection of Table 3 indicates that the flow resistanceparameters vary within a relatively narrow range. In viewof this, general back-analysis was carried out for the entiregroup of cases. All of the cases were re-analysed with asingle pair of Voellmy parameters consisting of a frictioncoefficient, l, of 0.07 and a turbulence coefficient, n of200 m/s2. The results of this analysis are summarized inTable 2, in which model output variables and estimatedvalues are compared, including front displacement,velocity and thickness of deposits.A comparison of calculated and actual runout distances isshown in Fig. 15a. In 16 out of the 17 cases, the modelproduced a maximum runout within 100 m of the truevalue, usually over-estimating the runout. Serious under-prediction occurred only in one case (slide 15). This debrisflow followed an artificially reinforced concrete channel.The unusually strong degree of confinement, smoothnessof the channel and lack of obstruction probably account forthe unusual degree of mobility encountered in this case.Comparisons of estimated and simulated flow velocitiesand deposit thicknesses are given in Fig. 15b and c,respectively. In both cases, values of the parameter ob-served in the field or calculated from field data, are com-pared with the model prediction at the same location.Faella and Nigro (2001a, 2001b) have estimated the impactflow velocity at a number of locations in the Sarno andQuindici area from back-analysis of the observed struc-tural damage of buildings. Their methodology was basedon an adaptation of momentum balance and draghydraulic formulas, treating the debris flow material as a
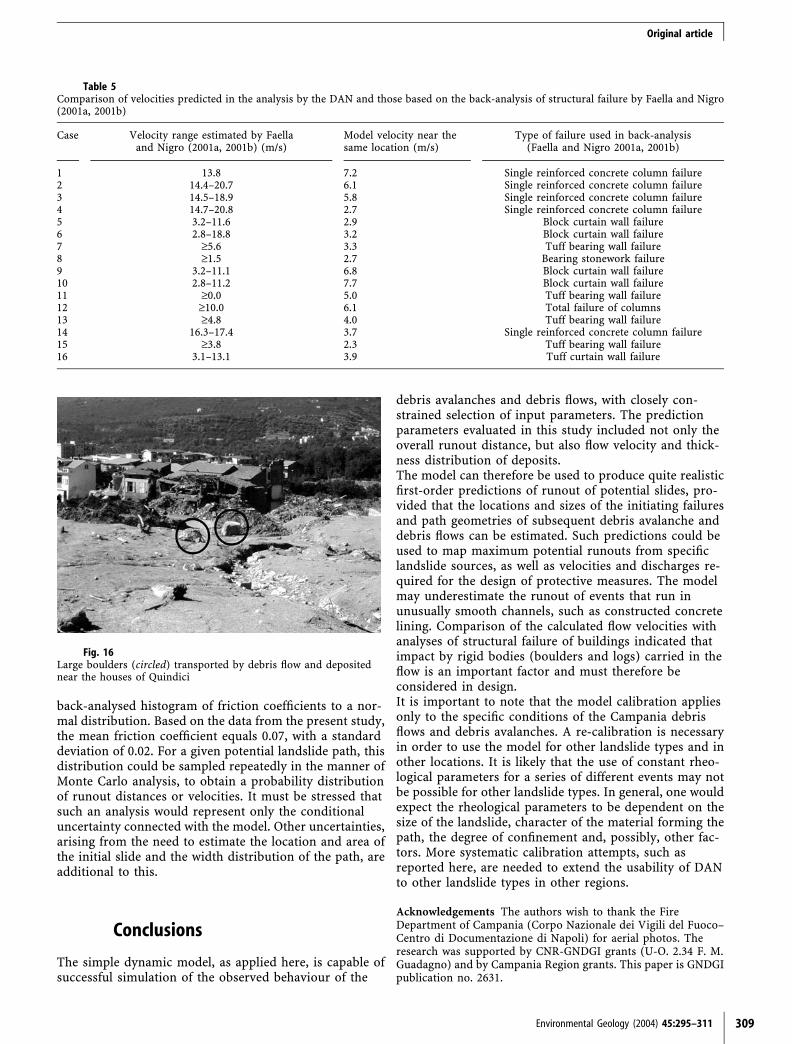
uniform fluid with a unit weight of 1,400 kg/m3. A com-parison of their estimates with velocities calculated in thepresent analysis is shown in Table 5. The comparisons aregood in 11 out of 16 cases. They are, however, very poor infive of the cases (1, 2, 3, 4 and 11), where the back-cal-culated velocities based on structural damage are muchgreater than those predicted by our dynamic analysis. Inall of these cases, the field estimates of Faella and Nigro(2001a, 2001b) used the bending failure of a single column.We consider that the discrepancy is caused by the pres-ence of rigid bodies, such as boulders and logs, carried inthe flow. Single or repeated impact by such particles ismuch more likely to cause column failure than dragpressure due to a clear, relatively lightweight fluid. Thus,the model velocities are considered more realistic than theback-calculated values in these cases. The same explana-tion probably applies, to a lesser extent, to cases of wallfailure (nos. 7, 11, 13 and 15). The implication from this isthat design of structural elements to resist debris flow
Environmental Geology (2004) 45:295–311 307
Fig. 13Example of DAN back-analyses using the Voellmy model with thegeneral parameters l=0.07 and n=200 m/s2. The flow profiles areplotted at 20 s intervals. All normal depths (flow depths and erosiondepths) are multiplied by 10. Numbers correspond to events inFigs. 4a and 10a
Table 3Individual back-analyses. A summary of the best-fit pairs (for runoutdistance) of Voellmy parameters
Slide l n (m/s2)
1 0.07 2002 0.07 2003 0.08 2004 0.05 2005 0.07 2006 0.10 2007 0.07 2008 0.07 2009 0.01 20010 0.09 20011 0.08 20012 0.07 20013 0.11 20014 0.08 20015 0.05 20016 0.07 20017 0.07 200
Fig. 14Individual back-analyses: a histogram of friction coefficients requiredfor exact simulation of the runout distances, with a turbulencecoefficient n=200 m/s2. An approximate normal distribution fit issuperimposed (mean=0.07, SD=0.02)
Table 4Initial and final volumes calculated by DAN in the analysis for eachevent
Slide Initial volume (m3) Final volume (m3)
1 260 12,1632 1,745 120,6413 327 7,9964 6,831 268,5435 10,573 398,1716 1,226 107,8817 1,130 183,2418 953 176,2409 1,300 64,01710 2,552 81,83511 6,311 229,53212 2,200 78,40713 579 35,71614 2,703 93,77415 938 102,49516 717 45,47917 157 29,044
b
Original article
must consider the impact of boulders and other rigidobjects (Fig. 16), in addition to fluid momentum.
Discussion
Results described in the previous section show that theVoellmy model is capable of realistic representation of the
dynamic behaviour of the Campania debris flows andavalanches. Even when used with a single general pair ofresistance parameters, the model predicts the overallrunout distance with a range of accuracy of approximately4% for 16 of the 17 events examined (Fig. 15a). Theexception, landslide number 15, can be explained by theeffects of an unusually smooth, artificial channel. Simula-tion of velocities and thicknesses of deposits is alsoexcellent (Fig. 15b, c). It is therefore concluded, that theVoellmy model can be used for reasonably accurate firstorder predictions of dynamic behaviour for this type oflandslides, in the given physiographic setting, providingthat same reasonable estimates be made of initial slidevolume and the path width of the resulting debris ava-lanche/debris flow prior to the event taking place.A random divergence of the model is expressed by thehistogram shown as Fig. 14. A probabilistic model ofrunout distance can thus be established by fitting the
308 Environmental Geology (2004) 45:295–311
Fig. 15General back-analysis. The model calculations with DAN are based onthe general Voellmy parameters l=0.07 and n=200 m/s2. a Compar-ison of modelled and actual runout distances. b Comparison ofmodelled and estimated velocities at cross-section locations indicatedin Figs. 4a and 10a and calculated using Eqs. (1) and (2). Error barsfor field estimates of velocity are also shown. c Comparison ofmodelled and actual deposit thicknesses at locations where date wasavailable indicated in Figs. 4a and 10a. The ranges of field estimates ofdeposit thickness are also shown
Original article
back-analysed histogram of friction coefficients to a nor-mal distribution. Based on the data from the present study,the mean friction coefficient equals 0.07, with a standarddeviation of 0.02. For a given potential landslide path, thisdistribution could be sampled repeatedly in the manner ofMonte Carlo analysis, to obtain a probability distributionof runout distances or velocities. It must be stressed thatsuch an analysis would represent only the conditionaluncertainty connected with the model. Other uncertainties,arising from the need to estimate the location and area ofthe initial slide and the width distribution of the path, areadditional to this.
Conclusions
The simple dynamic model, as applied here, is capable ofsuccessful simulation of the observed behaviour of the
debris avalanches and debris flows, with closely con-strained selection of input parameters. The predictionparameters evaluated in this study included not only theoverall runout distance, but also flow velocity and thick-ness distribution of deposits.The model can therefore be used to produce quite realisticfirst-order predictions of runout of potential slides, pro-vided that the locations and sizes of the initiating failuresand path geometries of subsequent debris avalanche anddebris flows can be estimated. Such predictions could beused to map maximum potential runouts from specificlandslide sources, as well as velocities and discharges re-quired for the design of protective measures. The modelmay underestimate the runout of events that run inunusually smooth channels, such as constructed concretelining. Comparison of the calculated flow velocities withanalyses of structural failure of buildings indicated thatimpact by rigid bodies (boulders and logs) carried in theflow is an important factor and must therefore beconsidered in design.It is important to note that the model calibration appliesonly to the specific conditions of the Campania debrisflows and debris avalanches. A re-calibration is necessaryin order to use the model for other landslide types and inother locations. It is likely that the use of constant rheo-logical parameters for a series of different events may notbe possible for other landslide types. In general, one wouldexpect the rheological parameters to be dependent on thesize of the landslide, character of the material forming thepath, the degree of confinement and, possibly, other fac-tors. More systematic calibration attempts, such asreported here, are needed to extend the usability of DANto other landslide types in other regions.
Acknowledgements The authors wish to thank the FireDepartment of Campania (Corpo Nazionale dei Vigili del Fuoco–Centro di Documentazione di Napoli) for aerial photos. Theresearch was supported by CNR-GNDGI grants (U-O. 2.34 F. M.Guadagno) and by Campania Region grants. This paper is GNDGIpublication no. 2631.
Environmental Geology (2004) 45:295–311 309
Table 5Comparison of velocities predicted in the analysis by the DAN and those based on the back-analysis of structural failure by Faella and Nigro(2001a, 2001b)
Case Velocity range estimated by Faellaand Nigro (2001a, 2001b) (m/s)
Model velocity near thesame location (m/s)
Type of failure used in back-analysis(Faella and Nigro 2001a, 2001b)
1 13.8 7.2 Single reinforced concrete column failure2 14.4–20.7 6.1 Single reinforced concrete column failure3 14.5–18.9 5.8 Single reinforced concrete column failure4 14.7–20.8 2.7 Single reinforced concrete column failure5 3.2–11.6 2.9 Block curtain wall failure6 2.8–18.8 3.2 Block curtain wall failure7 ‡5.6 3.3 Tuff bearing wall failure8 ‡1.5 2.7 Bearing stonework failure9 3.2–11.1 6.8 Block curtain wall failure10 2.8–11.2 7.7 Block curtain wall failure11 ‡0.0 5.0 Tuff bearing wall failure12 ‡10.0 6.1 Total failure of columns13 ‡4.8 4.0 Tuff bearing wall failure14 16.3–17.4 3.7 Single reinforced concrete column failure15 ‡3.8 2.3 Tuff bearing wall failure16 3.1–13.1 3.9 Tuff curtain wall failure
Fig. 16Large boulders (circled) transported by debris flow and depositednear the houses of Quindici
Original article
References
Amanti M, Ducci D, Onorati G, Ventura R (1999) Relazione tra glieventi franosi del maggio 1998 e la piovosita dell’area di Sarno.Atti dei convegni dei Lincei 154: Il rischio idrogeologico e ladifesa del suolo. Roma 1–2 Ottobre, 1998, pp 73–80
Ayotte D, Evans N, Hungr O (1999) Runout analysis of debrisflows and avalanches in Hong Kong. Slope stability and land-slides. Proceedings of the Vancouver Geotechnical SocietySymposium May, 1999, pp 39–46
Ayotte D, Hungr O (2000) Calibration of a runout predictionmodel for debris-flows and avalanches. In: Wieczorek G, Naeser(eds) Debris-flows hazards mitigation: mechanics, prediction,and assessment. Proc 2nd Int Conf on Debris Flows, Taipei.Balkema, Rotterdam, pp 505–514
Bagnold RA (1954). Experiments on a gravity-free dispersion oflarge solid spheres in a Newtonian fluid under shear. Proc R SocLond Ser A 255:49–63
Calcaterra D, Santo A, De Riso R, Budetta P, Di Crescenzo G,Franco I, Galietta G, Iovinelli R, Napolitano P, Palma B (1997)Fenomeni franosi connessi all’evento pluviometrico del gennaio1997 in Penisola Sorrentina. Atti del IX Congresso NazionaleGeologi, Roma, 17–20 Aprile 1997, pp 223–231
Calcaterra D, Parise M, Palma B, Palella L (2000) The influence ofmeteoric events in triggering shallow landslides in pyroclasticdeposits of Campania, Italy. Proc 8th Int Symp Landslides,Cardiff, 1, pp 209–214
Celico P, Aquino S, Esposito L, Piscopo V (2000) Problematicheidrogeologiche connesse con i fenomeni di instabilita delle coltripiroclastiche della dorsale di Pizzo d’Alvano. Quad Geol Appl7(2):167–187
Celico P, Guadagno FM (1998) L’instabilita delle coltri piroclas-tiche delle dorsali carbonatiche in Campania: attualiconoscenze. Quad Geol Appl 5(1):129–188
Celico P, Guadagno FM, Vallario A (1986) Proposta di un modellointerpretativo per lo studio delle frane nei terreni piroclastici.Geol Appl ed Idrogeologia 21:173–193
Chen H, Lee CF (2000) Numerical simulation of debris flows. CanGeotech J 37:146–160
Chirico GB, Claps P, Rossi F, Villani P (2000) Hydrologic con-dition leading to debris-flow initiation in the Campanian vol-canoclastic soil. Proc EGS Plinius Conf, Maratea, October 1999,pp 473–484
Chow VT (1959) Open-channel hydraulics. McGraw-Hill, NewYork, 680 pp
Crosta GB, Dal Negro P (2003) Observations and modelling of soilslip-debris flow initiation processes in pyroclastic deposits: theSarno 1998 event. Nat Hazards Earth Syst Sci 3:53–69
De Vita P (2000) Fenomeni di instabilita delle coperture piro-clastiche dei Monti Lattari, di Sarno e di Salerno (Campania) edanalisi degli eventi pluviometrici determinanti. Quad Geol Appl7(2):213–235
Del Prete M, Guadagno FM, Hawkins B (1998) Preliminary reporton the landslides of 5 May 1998, Campania, southern Italy. BullEng Geol Environ 57:113–129
Esposito L, Guadagno FM (1998) Some special geotechnicalproperties of pumice deposits. Bull Eng Geol Environ 57:41–50
Faella C, Nigro E (2001a) Effetti delle colate rapide sulle cost-ruzioni. Parte Prima: Descrizione del danno. Forum per il Ris-chio Idrogeologico ‘‘Fenomeni di colata rapida di fango nelMaggio ’98’’, Napoli, 22 giugno 2001:105–112
Faella C, Nigro E (2001b) Effetti delle colate rapide sulle cost-ruzioni. Parte Seconda: Valutazione della velocita di impatto.Forum per il Rischio Idrogeologico ‘‘Fenomeni di colata rapidadi fango nel Maggio ’98’’, Napoli, 22 giugno 2001, pp 113–125
Fiorillo F, Guadagno FM, Aquino S, De Blasio A, (2001). TheDecember 1999 Cervinara landslides: further debris flows in the
pyroclastic deposits of Campania (southern Italy). Bull Eng GeolEnviron 60(3):171–184
Guadagno FM (1991) Debris flows in the Campanian volcani-clastic soil. Slope stability engineering. Thomas Telford (ed),London, pp 109–114
Guadagno FM (2000) The landslides of 5th May 1998 in Camp-ania, Southern Italy: natural disasters or also man-inducedphenomena? J Nepal Geol Soc 22:463–470
Guadagno FM, Magaldi S (2000) Considerazioni sulle proprietageotecniche dei suoli allofanici di copertura delle dorsali car-bonatiche Campane. Quad Geol Appl 7(2):143–155
Guadagno FM, Forte R, Revellino P, Fiorillo F, Focareta M (2003a)Some aspects of the initiation of debris avalanches in theCampania Region: the role of morphological slope discontinu-ities and the development of failure. Geomorphology (in press)
Guadagno FM, Martino S, Scarascia Mugnozza G (2003b) Influ-ence of man-made cuts on the stability of pyroclastic covers(Campania—southern Italy): a numerical modelling approach.Environ Geol 43:371–384
Hungr O (1995) A model for the runout analysis of rapid flowslides, debris flows, and avalanches. Can Geotech J 32:610–623
Hungr O, Evans SG (1997) A dynamic model for landslides withchanging mass. Proceedings of the International Association ofEngineering Geology Symposium on engineering geology andthe environment. Athens, Greece, 1, pp 719–724
Hungr O, Evans SG, Bovis M, Hutchinson JN (2001) Review of theclassification of landslides of the flow type. Environ Eng Geosci7(3):1–18
Ippolito F, D’Argenio B, Pescatore TS, Scandone P (1975) Struc-tural-stratigraphic units and tectonic framework of SouthernApennines. In: Squyres C (ed) Geology of Italy. Earth Sci SocLybian Arab Republ, Tripoli, pp 317–328
Johnson AM (1984) Debris flows. In: Brudsen D, Prior DE (eds)Slope instability. Wiley, London, pp 257–361
Maeda T, Takenake H, Warkentin BP (1977) Physical propertiesof allophane soils. Adv Agron 29:229–264
Mazzarella A, Martone M, Tranfaglia G (2000) Il recente eventoalluvionale del 4–5 maggio 1998 nel sarnese e il deficit risolutivodella rete pluviometrica. Quad Geol Appl 7(2):203–211
Onorati G, Braca G, Iritano G (1999) Evento idrologico del 4, 5 e 6Maggio 1998 in Campania. Monitoraggio ed analisi idrologica.Atti dei convegni dei Lincei 154: Il rischio idrogeologico e ladifesa del suolo. Roma 1–2 Ottobre 1998, pp 103–108
Pierson TC, Costa JE (1987) A rheological classification of sub-aerial sediment-water flows. Geol Soc Am Rev Eng Geol 7:1–12
Revellino P, Hungr O, Guadagno FM, Evans SG (2002) Dynamicanalysis of recent destructive debris flows and debris avalanchesin pyroclastic deposits, Campania region, Italy. InternationalConference on instability—planning and management. Vent-nor, May 2002, pp 363–371
Rolandi G, Bartollini F, Cozzolino G, Esposito N, Sannino D(2000) Sull’origine delle coltri piroclastiche presenti sul versanteoccidentale del Pizzo d’Alvano (Sarno-Campania). Quad GeolAppl 7(1):37–47
Rosi M, Sbrana A (1987) The Campanian ignimbrite. In: Rosi M,Sbrana A (eds) Phleagrean fields. Quad Ric Sci CNR 9 (114):13–14
Rossi F, Chirico GB (1998) Definizione delle soglie pluviometrichedi allarme. Rapporto Unita Operativa 2.38, C.N.R.- G.N.D.C.I.,Salerno
Sassa K (1984) The mechanism starting liquefied landslides anddebris flows. Proc 4th Int Symp on Landslides, Toronto, 2, pp349–354
Sharpe CFS (1938) Landslide and related phenomena. ColumbiaUniv Press, New York, 137 pp
Soil Survey Staff (1975) Soil taxonomy: a basic system of soilclassification for making and interpreting soil surveys.
310 Environmental Geology (2004) 45:295–311
Original article

Agricultural handbook no 436. US Department of Agriculture,Soil Conservation Service, Washington, DC
Soil Survey Staff (1992) Keys to soil taxonomy, 5th edn. USDepartment of Agriculture, Pocahontas Press, Blacksburg, VA
Terribile A, Basile A, di Gennaro A, Aronne A, Buonanno M, DeMascellis R, Vingiani S, Mulacelli F (1999) The soil of the
landslide of Sarno and Quindici. In: Proc Symp on degradationprocesses in volcanic soils. University of Napoli, pp 48–64
Voellmy A (1955) Uber die Zerstorungskraft von LawinenSchweiz Bauzeitung 73:212–285
Environmental Geology (2004) 45:295–311 311
Original article