Embed Size (px)
Citation preview
NAVAL FACILITIES ENGINEERING SERVICE CENTER Port Hueneme, California 93043-4370
Technical Report TR-2067-ENV
SURFACE QUALITY IMPACT OF REPLACING
VAPOR DEGREASERS WITH AQUEOUS
IMMERSION SYSTEMS
by
C.A. Kodres D.R. Polly T.A. Hoffard G.D. Anguiano
March 1997
Sponsored by U.S. Environmental Protection Agency Cincinnati, OH 45268
19970411 029 Approved for public release; distribution is unlimited.
£\ Printed on recycled paper
DISCLAIM NOTICE
THIS DOCUMENT IS BEST
QUALITY AVAILABLE. THE COPY
FURNISHED TO DTIC CONTAINED
A SIGNIFICANT NUMBER OF
COLOR PAGES WHICH DO NOT
REPRODUCE LEGIBLY ON BLACK
AND WHITE MICROFICHE.
REPORT DOCUMENTATION PAGE FormApproved
OMBNo.0704-018
Public reporting burden for this collection of information is estimated to average 1 hour per response, including the time for reviewing instructions, searching existing data sources, gathering and maintaining the data needed, and completing and reviewing the collection of information. Send comments regarding this burden estimate or any other aspect of this collection information, including suggestions for reducing this burden, to Washington Headquarters Services, Directorate for Information and Reports, 1215 Jefferson Davis Highway, Suite 1204, Arlington, VA 22202- 4302, and to the Office of Management and Budget, Paperwork Reduction Project (0704-0188), Washington, DC 20503.
1. AGENCY USE ONLY (Leave blank) 2. REPORT DATE March 1997
4. TITLE AND SUBTITLE
SURFACE QUALITY IMPACT OF REPLACING VAPOR DEGREASERS WITH AQUEOUS IMMERSION SYSTEMS
6. AUTHOR(S)
C.A. Kodres, D.R. Polly, T.A. Hoffard, G.D. Anguiano
7. PERFORMING ORGANIZATION NAME(S) AND ADDRESSE(S)
Naval Facilities Engineering Service Center 1100 23rd Ave. Port Hueneme, CA 93043-4370
9. SPONSORING/MONITORING AGENCY NAME(S) AND ADDRESSES
U.S. Environmental Protection Agency Cincinnati, OH 45268
3. REPORT TYPE AND DATES COVERED Final; Oct 1994 through Mar 1996
5. FUNDING NUMBERS
8. PERFORMING ORGANIZATION REPORT NUMBER
TR-2067-ENV
10. SPONSORING/MONITORINGAGENCYREPORT NUMBER
11. SUPPLEMENTARY NOTES
12a. DISTRIBUTION/AVAILABILITY STATEMENT
Approved for public release; distribution is unlimited.
12b. DISTRIBUTION CODE
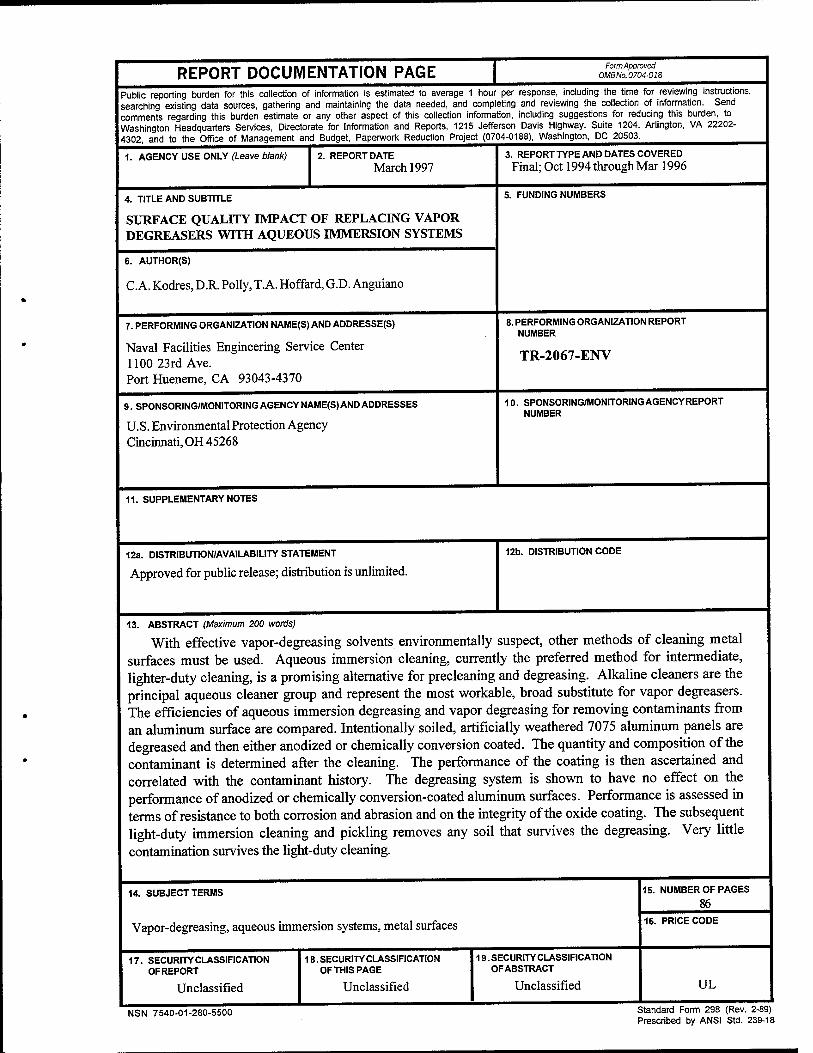
13. ABSTRACT (Maximum 200 words)
With effective vapor-degreasing solvents environmentally suspect, other methods of cleaning metal surfaces must be used. Aqueous immersion cleaning, currently the preferred method for intermediate, lighter-duty cleaning, is a promising alternative for precleaning and degreasing. Alkaline cleaners are the principal aqueous cleaner group and represent the most workable, broad substitute for vapor degreasers. The efficiencies of aqueous immersion degreasing and vapor degreasing for removing contaminants from an aluminum surface are compared. Intentionally soiled, artificially weathered 7075 aluminum panels are degreased and then either anodized or chemically conversion coated. The quantity and composition of the contaminant is determined after the cleaning. The performance of the coating is then ascertained and correlated with the contaminant history. The degreasing system is shown to have no effect on the performance of anodized or chemically conversion-coated aluminum surfaces. Performance is assessed in terms of resistance to both corrosion and abrasion and on the integrity of the oxide coating. The subsequent light-duty immersion cleaning and pickling removes any soil that survives the degreasing. Very little
contamination survives the light-duty cleaning.
14. SUBJECT TERMS
Vapor-degreasing, aqueous immersion systems, metal surfaces
17. SECURITY CLASSIFICATION OFREPORT
Unclassified
18. SECURITY CLASSIFICATION OF THIS PAGE
Unclassified
19. SECURITY CLASSIFICATION OFABSTRACT
Unclassified
15. NUMBER OF PAGES
86 16. PRICE CODE
UL
NSN 7540-01-280-5500 Standard Form 298 (Rev. 2-89) Prescribed by ANSI Std. 239-18
CONTENTS
Page
INTRODUCTION 1
Aqueous Cleaning Systems 2 Finishing a Metal Surface 2
PREVIOUS TESTS FOR CLEANER EFFICIENCY 3
TEST PROCEDURE 5
RESULTS 7
ICP Analyses of Contaminants 7 FTIR Cleanliness Analyses 7 Water Break Cleanliness Analyses 9 Resistance of Surface to Abrasion 9 Resistance of Surface to Corrosion 9 Integrity of Coating 9
STATISTICAL VALIDITY OF SAMPLE SIZE 10
CONCLUSIONS 11
REFERENCES 11
APPENDIXES
A - Procedures for Cleaning, Anodizing, and Chemical Conversion Coating of Aluminum Panels A-l
B - Analysis of Panel Surface Cleanliness B-l C - Analyses of Panel Surface Performance C-l D - Material Safety Data Sheets of Cleaners and Chemicals
Used in This Study D-l
INTRODUCTION
A variety of coatings are applied to metals to increase corrosion resistance, hardness, wear resistance, and the aesthetic qualities of the surface. Prior to the application of the coating, the metal undergoes a series of preparation treatments which may include grinding, brightening, degreasing, cleaning, pickling, etching, and de-smutting. With the residual microsoils having the most significant effect on the condition of the subsequent coatings (Cohen, 1987), the degreasing is one of the more important preparation treatments (EPA, 1994b).
Vapor degreasing has been one of the preferred processes used to clean metals prior to coating. In this process, a solvent is heated to its boiling point, generating substantial vapor which contacts soiled parts suspended above the liquid surface as shown in Figure 1. Solvent condensing on the parts dissolves the soil, and the liquid/soil mixture falls back down into the boiling solvent. The contaminants usually have higher boiling points than the solvent so the vapor itself remains relatively pure. Figure 2 shows a second major advantage of vapor degreasing: the part dries rapidly when removed from the solvent-saturated atmosphere. There were approximately 24,500 vapor degreasers operating in the United States in 1992 (EPA, 1995).
Traditionally, chlorinated hydrocarbon solvents have been used in vapor degreasers because they are very effective and nonflammable cleaners (EPA, 1994a). The solvents most commonly used were CFC-113, trichloroethylene (TCE), perchloroethylene (PERC), methylene chloride (METH), and 1,1,1-trichloroethane (TCA). However, TCE, PERC, and METH are toxic and are suspected carcinogens. In addition, TCE is photochemically reactive; its vapor contributes to the formation of smog. In the early 1970s, these solvents began to be replaced by, primarily, CFC-113 and TCA. Cleaning efficiencies are comparable, and both have a lower toxicity and a much lower photochemical reactivity (Bird and Donahue, 1993).
Then in the late 1970s, some chlorofluorocarbons were found to undergo chemical changes in the upper atmosphere that result in the destruction of stratospheric ozone. This discovery led to the Montreal Protocol on "Substances that Deplete the Ozone Layer," signed in 1987 by 45 nations including the United States. Agreements were made to restrict the production and use of ozone-depleting chemicals (EPA, 1994a). The Montreal Protocol and its subsequent amendments provided the catalyst to amend the U.S. Clean Air Act, setting deadlines for phasing out ozone-depleting chemicals in the United States. The production of Class I ozone- layer-depleting substances, which includes both CFC-113 and TCA, was banned in the U.S. beginning January 1,1996.
With all five effective vapor-degreasing solvents now environmentally suspect, other methods of cleaning metal surfaces must be used. The selection promises to be abundant. Some tested alternatives have been commercially available for a number of years, for example, aqueous, semiaqueous, and hydrocarbon immersion processes (Wang and Merchant, 1993). The development of other technologies, such as supercritical C02 processes (Rancourt, 1994; Rancourt and Messer, 1994) is being accelerated.
Aqueous Cleaning Systems
Aqueous immersion cleaning is currently the preferred method for intermediate, lighter- duty cleaning and is a promising alternative for precleaning and degreasing (Weltman and Evanoff, 1991). Aqueous cleaners may be broadly defined as cleaning solutions made of water plus chemical additives such as surfactants, builders, corrosion inhibitors, and antioxidants (Bernett and Krebs, 1990). They are non-ozone depleting and usually nontoxic. Most aqueous cleaners have very low volatility, and most are biodegradable. The soiled part is immersed in the cleaner as shown in Figure 3. Thus, these cleaners have the disadvantage of losing their effectiveness as the bath becomes contaminated. Drying problems are inherent with certain parts (Woodrow, et al., 1995). Regardless, a recent survey suggests that aqueous cleaning is technologically feasible in 80 to 90 percent of all metal cleaning applications (D'Ruiz, 1991).
Aqueous cleaners are commercially available in many compositions and may also be custom formulated for particular applications. These cleaners can be grouped into three categories: emulsion, acidic, and alkaline (ASM, 1982). Each has its specific applications. Emulsion cleaners have problems with disposal of spent emulsions and the strict VOC emission regulations imposed on them (D'Ruiz, 1991). Emulsion cleaners are less thorough than alkaline cleaners (ASM, 1982). In general, broad application of acidic cleaners is unlikely due to limitations on the use of acid on metal substrates. Acid cleaners will etch aluminum and other nonferrous metals. Alkaline cleaners are the principal aqueous cleaner group and represent the most workable, broad substitute for vapor degreasers (Evanoff, 1990).
Finishing a Metal Surface
Preparation of a metal surface for plating is a critical operation because maximum adhesion of the coating to the substrate is the major requirement for quality work (ASM, 1982), and adhesion depends on both the elimination of surface contamination to better induce a metallurgical bond and the generation of a completely active surface to initiate plating. Adequate preparation requires a long series of steps, such as:
1. Degreasing with a solvent or aqueous cleaner
2. Intermediate cleaning with an alkaline cleaner
3. Electrocleaning to remove the last traces of contaminants
4. Acid treatment to remove light oxide films formed during previous cleaning stages and to microetch the surface
5. Anodic de-smutting to remove any carbon smut formed during acid treatment
6. Aluminum is normally anodized prior to plating
The preparation stages vary, depending on the substrate and the type of plating, but in all plating operations, the final product is far removed from the degreasing. Figure 4 is a
photograph of a typical industrial metal finishing shop showing the various processing tanks lined up side by side.
Preparation of an aluminum surface for anodic or chemical conversion coatings is less stringent than the preparation of a surface for plating, and therefore, the degreasing step is more critical to the quality of the final product. The solvent/aqueous degreasing of aluminum is normally followed only by immersion in a dilute alkaline cleaner and one or more stages of pickling to remove surface oxides, although pickling removes up to 0.0003 inch of surface metal.
Anodizing is the electrochemical conversion of the aluminum surface to its oxide while the metal is the anode in an electrolytic cell. The primary purpose of the process is to increase corrosion resistance by providing a barrier to corrodents. The anodic coating also enhances subsequent electroplating (ASM, 1982). Type II sulfuric acid anodizing produces a coating with a thickness of 0.00015 to 0.00025 inch. Pores in a Type II coating are sealed by immersion in a dichromate solution.
Chemical conversion coatings are adherent surface layers of low solubility oxide, phosphate, or chromate compounds produced by the reaction of suitable reagents with the aluminum surface (ASM, 1982). Conversion coatings are formed by a chemical oxidation- reduction reaction at the surface of the metal. This reaction involves the removal of 0.00001 to 0.0001 inch of surface metal. Conversion-coated surfaces are thinner and weaker than anodized surfaces, and would be more affected by surviving surface contamination.
PREVIOUS TESTS FOR CLEANER EFFICIENCY
Since the Montreal Protocol was signed, numerous tests have been conducted to evaluate the cleaning efficiency of different alkaline aqueous degreasers. These tests ranged in comprehensiveness from the efforts at several small shops, in which a single cleaner was evaluated, to the work contracted by the Air Force to EG&G Idaho, Inc. (Wikoff, et al., 1989), which included testing the efficiency of 163 different cleaners. A few cleaners were tested by several investigators. For example, the cleaning efficiency of Brulin 815 GD was appraised by most aerospace companies. The cleaning efficiencies of the Turco products were included in tests conducted by many of the military facilities. Many tests of metal cleaners were never published in the open literature. Hundreds of commercially available aqueous cleaners have never been independently tested.
A key to any such test is the ability to determine metal surface cleanliness. There have been a number of methods used, ranging from a simple wiping test, where the metal surface was wiped to see if any contaminant remained, to the measurement and analysis of the electrons emitted from a soiled metal surface illuminated with an ultraviolet (UV) light. The water break (ASM, 1982; Spring, 1974; Cohen, 1987) and weight change methods (Tarn, et al., 1993) are probably the most widely used. Other methods include:
1. Visual inspection (ASTM, 1994a) 2. Wiping (ASM, 1982; Spring, 1974; Cohen, 1987) 3. Black (UV) light inspection (ASTM, 1994a) 4. Adhesive bonding strength (Woodrow, et al., 1995) 5. Fluorescent particles (Hill, et al., 1994; ASM, 1982)
6. Mist test (Spring, 1974) 7. Nielsen method/copper sulfate (ASM, 1982) 8. Surface energy (Jones, 1985) 9. Nonvolatile residue/rinse method (Allen, et al, 1993) 10. Nonvolatile residue/impingement method (Caimi, et al., 1994) 11. Ultrasonic extraction (Monroe, 1994) 12. Contact angle (ASTM, 1994b; Spring, 1974) 13. Scanning electron microscope (Paciej, et al., 1993) 14. Optically stimulated electron emissions (Chawla, 1990) 15. Infrared specular reflectance (Williams and Jones, 1993) 16. Electron spectroscopy (Greene, et al., 1992) 17. Evaporative rate (Anderson, et al., 1968) 18. Radioisotope tracers (ASM, 1982) 19. Particulate level (Pedley, et al., 1993; Welch, 1993; Koch and Kmetko, 1993) 20. Laser profilometry (Paciej, et al., 1993)
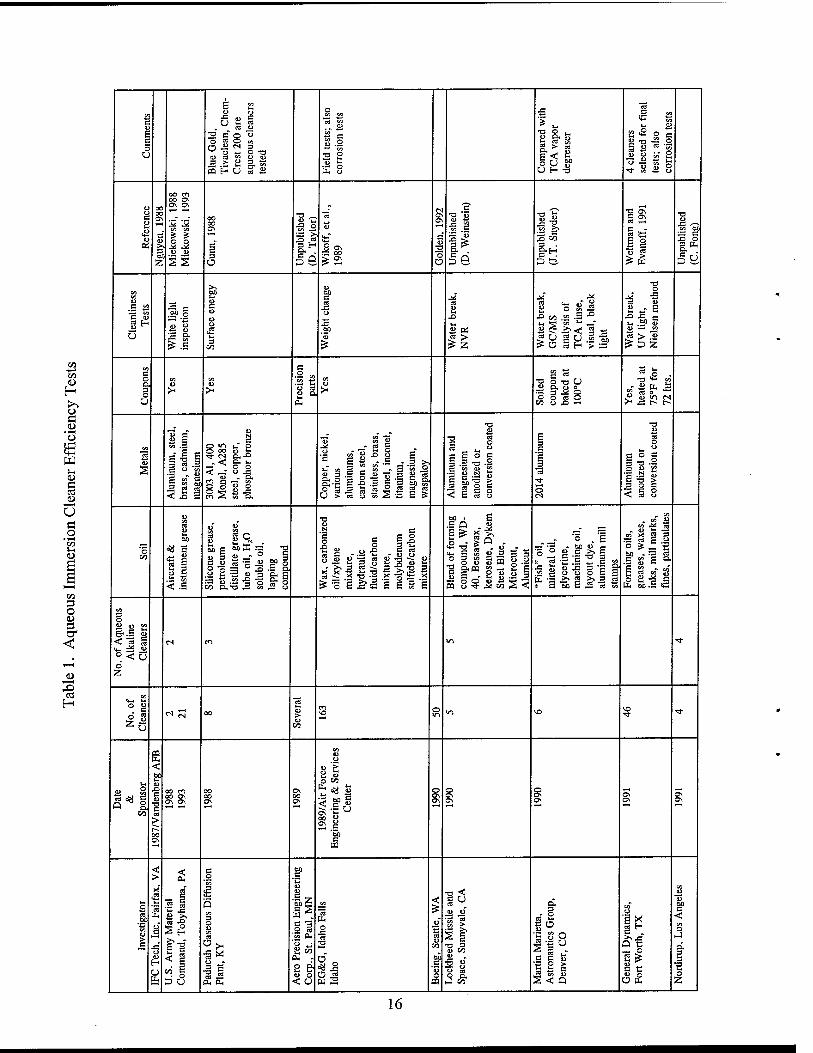
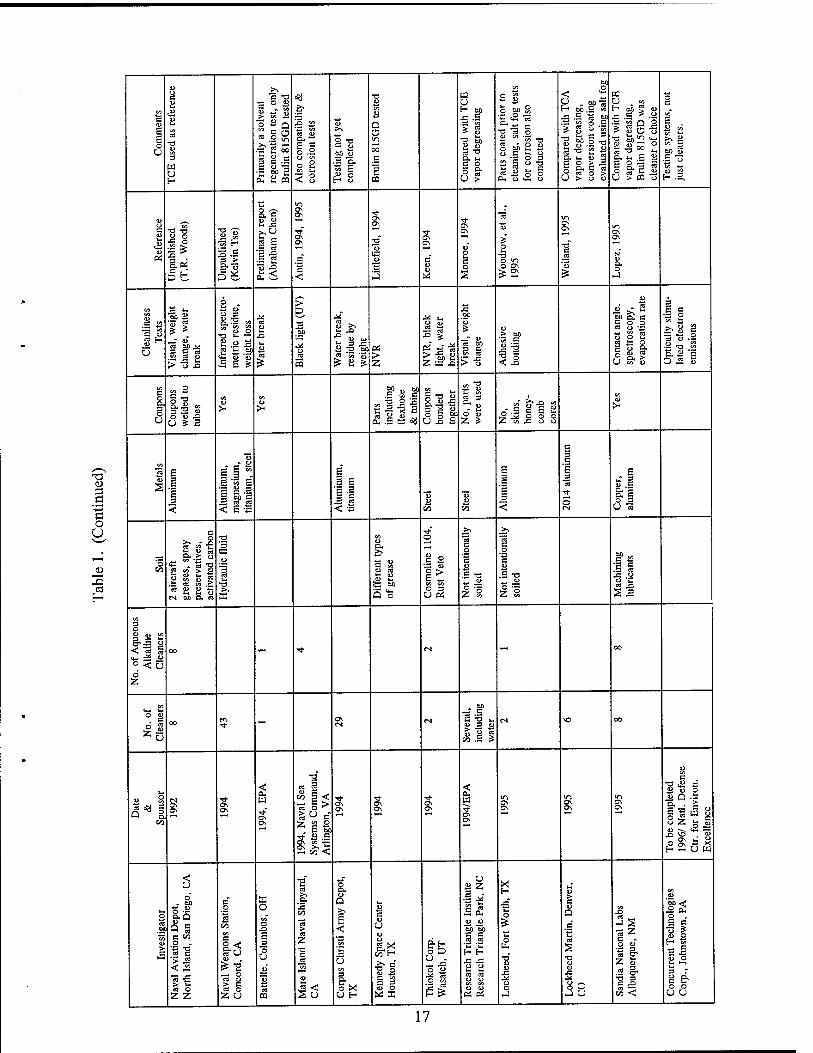
Table 1 is a partial but representative summary of cleaner efficiency tests that have been conducted. Several of these tests are of particular interest. Among the earliest were the cleaner evaluations conducted at the Gaseous Diffusion Plant in Paducah, Kentucky (Gunn, 1988) on intentionally soiled, unweathered Monel, copper, steel, aluminum and bronze panels. These tests are noteworthy because the cleaning efficiencies of eight different aqueous cleaners were directly compared to efficiencies obtained using both TCE and TCA vapor degreasers. Laboratory scale vapor degreasers were employed. Cleanliness was determined by estimating the surface energy of the metal (Jones, 1985). The ten cleaners were compared statistically; one of the aqueous cleaners was found to be the best multipurpose degreaser.
The EG&G tests (Wikoff, et al, 1989) are notable because of their comprehensiveness. A matrix involving 163 different cleaners, 5 different soils, and 16 different metal panels was employed. The panels were weathered by heating them to 100°C for 1 hour. Both aqueous and nonaqueous cleaners were tested. Cleanliness obtained by immersion in TCA was used as a baseline. Cleanliness was evaluated by measuring weight loss (Tarn, et al., 1993). Approximately forty solvents passed the cleaning test with wax the most difficult soil to remove. The mechanisms for stirring the cleaner were another parameter of interest although the results were inconclusive.
Simply measuring the mass of the soils removed from an unfinished surface by a particular cleaner or cleaning system, however, ignores the usual purpose of the cleaning. Only a few of the cleaner efficiency tests previously conducted used the performance of the surface finish as the criterion for evaluating degreasing efficiency, and the evaluation was often limited to adhesion properties or the ability to survive in a salt fog chamber (ASTM, 1994c).
The cleaning tests at General Dynamics/Fort Worth (Weltman and Evanoff, 1991) included a study of the effects of aqueous degreasers on unweathered 2024 aluminum surfaces that had been anodized or chemically conversion coated. The coated panels were immersed in four different cleaners and compared with results when TCE vapor degreasing was employed. Corrosion resistance to salt spray was the criterion, 336 hours for the anodized panels and 168
hours for the conversion-coated panels. The aluminum was cleaned after the coating was applied. The quality of the coating was then evaluated. One of the immersion cleaners failed.
If the performance of the surface coating is the primary variable in determining the efficiency of a degreasing system, all steps between the degreasing and the coating must also be retained for the study to have validity. For example, if the coating is only applied after a deoxidation step, then the test specimens must also be deoxidized.
Lockheed Missile and Space Center conducted a series of tests in which the corrosion resistance of unweathered 7075 and 2024 aluminum panels cleaned in a TCA vapor degreaser were compared with surfaces immersed in different alkaline aqueous degreasers. The contaminant was a mixture of kerosene, Tap Magic, Microcut, Alumicut, and Dykem Steel Blue. Following the degreasing step, the TCA-cleaned surfaces were visually clean while the panels immersed in the aqueous cleaners showed some residue. However, based on nonvolatile residue measurements (Allen, et al., 1993), the aqueous degreased panels were cleaner. The panels were then anodized or chromate conversion coated following normal procedures. Corrosion resistance was tested by placing the aluminum panels in a salt spray chamber for a minimum of 336 hours. There were no failures in any of the anodized panels. Several of the conversion-coated 2024 panels failed, including one vapor degreased panel.
Most metal cleaning tests used panels rather than actual parts. The reason is economics; the use of enough actual parts to make the tests statistically valid would be too expensive. The use of panels is tantamount to stipulating that surface cleanliness is judged on how well an accessible surface is cleaned. Success with hard-to-clean areas such as odd-shaped tubing, sandwich welds, and honeycombs is not included, although these areas are successfully cleaned using vapor degreasers.
One exception was the tests conducted at Lockheed Fort Worth (Woodrow, et al., 1995) comparing an aqueous alkaline cleaner with TCE vapor degreasing. Five sections of chemically conversion-coated aluminum honeycomb core and composite skins used in the F-16 aircraft were cut out and used as test specimens. Following normal procedure, after the degreasing, these sections were subjected to two stages of deoxidation. Adhesive bonding was the criterion for evaluating surface cleanliness; shear and tension loads were applied to skins bonded to the honeycomb. The performance of the coating was then evaluated by placing the parts in a salt fog chamber for 30 days. Results of the tests indicated that the method of degreasing had no adverse effect on the cleanliness or corrosion resistance of the parts.
To date, no attempt has been made to link the performance of the surface finish with the composition of the contaminant not removed by a particular degreaser.
TEST PROCEDURE
The work presented in this report is a comparison of the effects (if any) of different degreasing systems on the performance of an anodized or chemically conversion-coated aluminum surface. Intentionally soiled, artificially weathered aluminum panels were degreased and then coated. The quantity and composition of the contaminant was determined after the cleaning. The performance of the coating was then ascertained and correlated with the contaminant history.
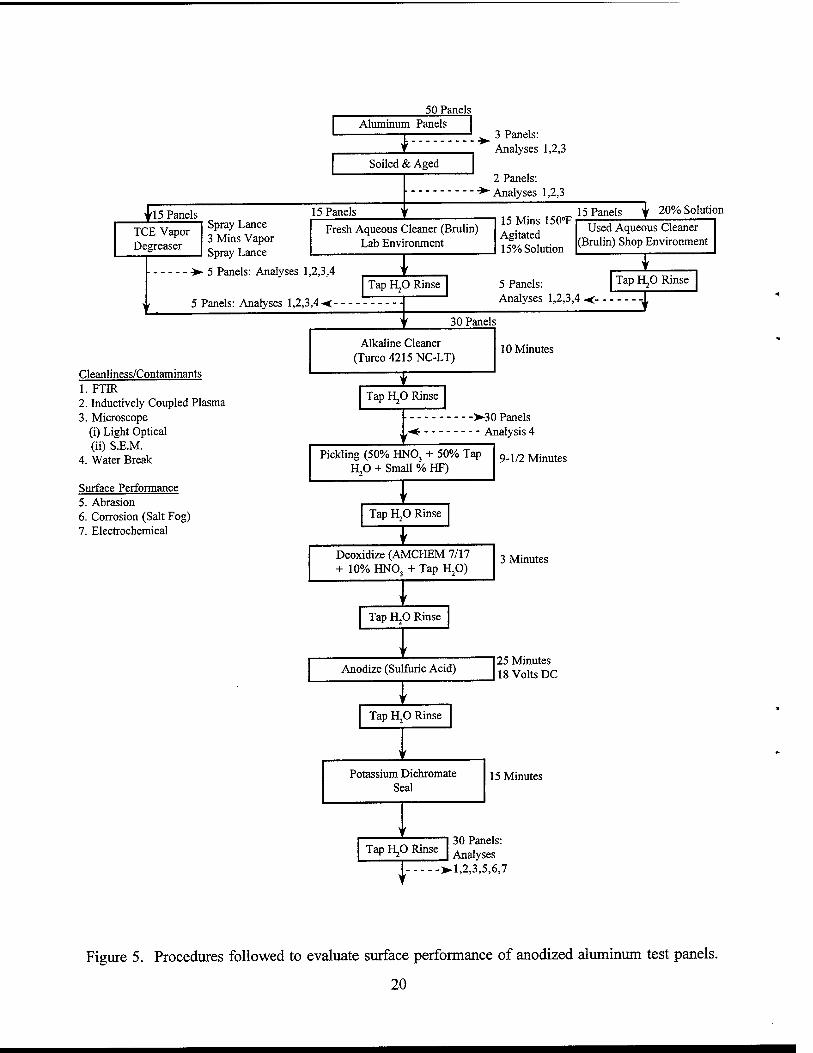
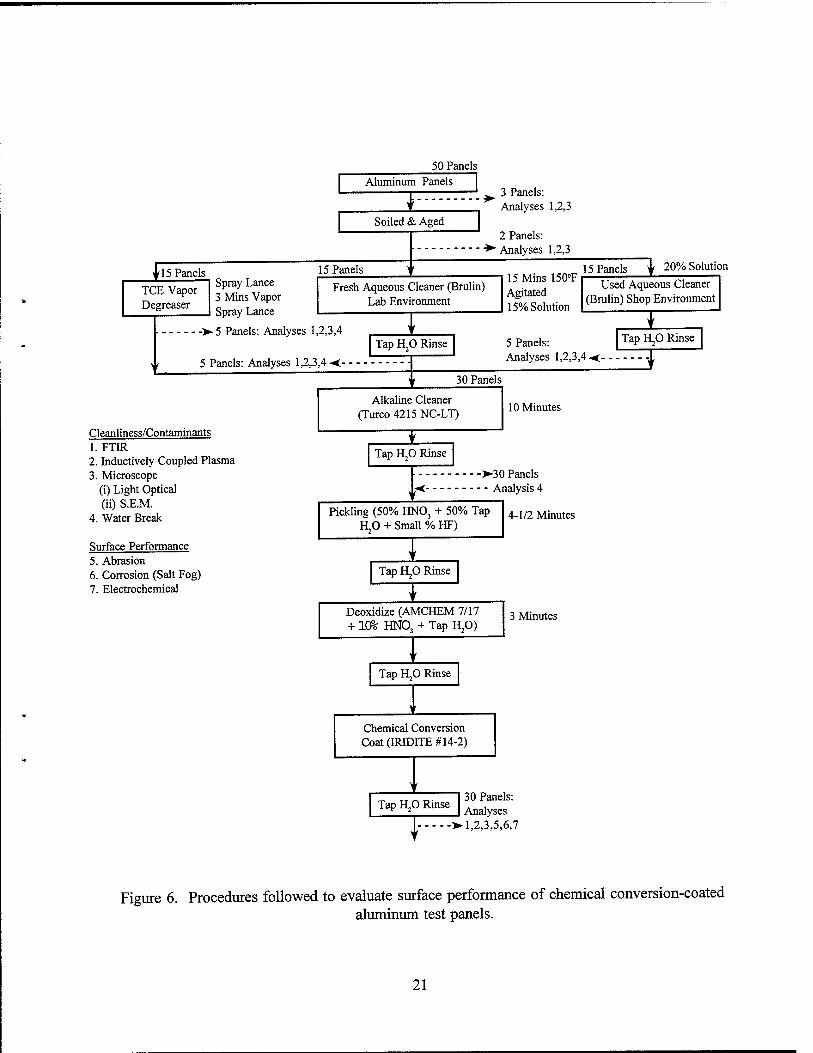
Figures 5 and 6 are schematics showing the cleaning/coating processes. The different cleanliness and surface performance analyses and the steps after which they were conducted are also included in these figures. Appendix A describes the tests in detail. The composition of the soils was analyzed using plasma spectroscopy. The quantity and composition of the soils remaining on the panels after each step of the cleaning and coating were determined using infrared spectroscopy. The panel surfaces were also examined with optical microscopes. In addition to corrosion and abrasion tests, the integrity of the coated panels was evaluated using electrochemical examination. Appendixes B and C discuss in detail the cleanliness tests and the tests used for evaluating surface performance, respectively. Simple water break free tests were applied after the degreasing stages.
One hundred 7075 aluminum test panels were cut, soiled, weathered, cleaned, and anodized or chemically conversion coated using the facilities and personnel of McDonnell- Douglas Aerospace, St. Louis, Missouri. Metal cleaning and surface finishing procedures and specifications adhered to at McDonnell-Douglas were retained.
An early major decision was whether the contaminants should be applied individually or mixed together. Several standard metal-cleaning efficiency tests consider a mixture of contaminants to be the most difficult to remove (FST, 1994). Previous tests were about equally divided.
The panels used for these tests were intentionally soiled with a mixture of equal volumes of four common lubricants considered by McDonnell-Douglas to be the most difficult to remove: Safety Draw 700, Cimflo #20, CRC Soft Seal, and Titan Lube #1129. Safety Draw 700 and Cimfio #20 are aluminum stretch-forming lubricants. CRC Soft Seal is a door release agent and Titan Lube #1129 is a titanium tube-bending lubricant. CRC Soft Seal and Titan Lube #1129, although not used for aluminum parts fabrication, are very plentiful in aerospace shops and often show up on these parts. Material Safety Data Sheets of all four lubricants are provided in Appendix D.
Actual parts are often not cleaned immediately after they are soiled. A soil applied to a metal and immediately dunked in a cleaner is many times easier to remove than that same soil applied to a metal that was subsequently subjected to fabricating operations such as forming, drawing, stamping, cutting, welding, or rolling (Scislowski, 1990).
Forming of an aluminum part was simulated by applying 2,000 psi to the panels in a laboratory press and then heating them in a circulating air oven at 150°F for 2 hours. The panels were stored uncovered on shelves in the cleaning shop for 3 weeks, allowing the contaminant to dry, before degreasing and finishing.
Three different degreasing processes were compared: cleaning with fresh Brulin 815 GD (an alkaline aqueous cleaner in common use in the aerospace industry), cleaning with used Brulin 815 GD, and TCE vapor degreasing, which was used as the baseline. Cleaning with fresh Brulin was conducted in a small tank in a laboratory environment. Degreasing with the used Brulin and with TCE vapor was accomplished using currently active industrial-sized systems at McDonnell-Douglas. The Brulin in the McDonnell-Douglas shop was 3 weeks old when the test panels were cleaned.
Often, as there was for this study, there is a delay between the degreasing and the application of the finish. Therefore, the first step in the finishing sequence was a light-duty cleaning by immersing the parts in a dilute solution of the alkaline cleaner Turco 4215 NC-LT to
remove dust, inks, and light oils that have recontaminated the aluminum parts. A Material Safety Data Sheet of this cleaner is provided in Appendix D. Surface oxides and some surface metal were then removed by two stages of pickling in a dilute nitric acid solution. The panels were rinsed in tap water after each step.
Finally, an anodized coating was applied to half of the panels, applying 18 volts DC for 25 minutes, meeting the requirements specified in MIL-A-8625 for Type II, Class 1 sulfuric acid anodizing. The surfaces were dichromate sealed by immersion in a potassium-dichromate solution. The other half of the panels were chemically conversion coated, immersing the panels in a solution of the reagent Iridite 14-2 for 3 minutes, meeting the requirements specified in MIL- C-5541.
RESULTS
It was immediately apparent through visual examination that the vapor degreaser was not removing all of the contamination. A light, but easily visible, film remained on the aluminum surfaces. The Brulin cleaned panels, by comparison, were visually clean. Figures 7 and 8 are 1.75X and 4X photographs, respectively, comparing the vapor-degreased and Brulin cleaned panel surfaces with a soiled surface. Note in Figure 7(b), the vapor-degreased panel, that the section on which the 2,000-psi "forming" pressure was applied is more soiled than the surrounding metal, evidence that working a soiled surface exacerbates the cleaning problem.
ICP Analyses of Contaminants
The Supersoil, the individual components of the Supersoil, and the fresh and used Brulin cleaner solutions were analyzed by inductively coupled plasma emission spectroscopy (ICP). The only elements detected in significant concentrations in the Supersoil were boron at approximately 650 ppm from the Safety Draw 700, and sodium at 100 ppm, also from the Safety Draw.
In the fresh Brulin solution, sodium, potassium, and phosphorous were detected in concentrations greater than 20,000 mg/L. Silicon was also found at approximately 1,500 mg/L, with a smaller amount of nickel at 130 mg/L. Analysis of the used Brulin revealed similar concentrations of the above, plus lower concentrations of calcium, magnesium, and zinc. These latter metals could be coming from the tap water used to dilute the Brulin solutions and/or the cleaning tanks. A discussion of ICP theory and analysis techniques is included in Appendix B.
FTIR Cleanliness Analyses
Fifty-six circular (0.5-inch-diameter) samples were cut from the aluminum test panels. The locations of the cuts were selected so that a number of the samples came from panel sections where pressure was applied. All samples were analyzed by Fourier transform infrared spectroscopy (FTIR) using a Biorad FTS-60 instrument and a diffuse-reflectance sampling device. A cleaned 0.5-inch circular disc from an unsoiled panel was used as the background to subtract out any peaks intrinsic to the panels themselves. A detailed description of FTIR theory, the analysis procedures followed, and the results are included in Appendix B.
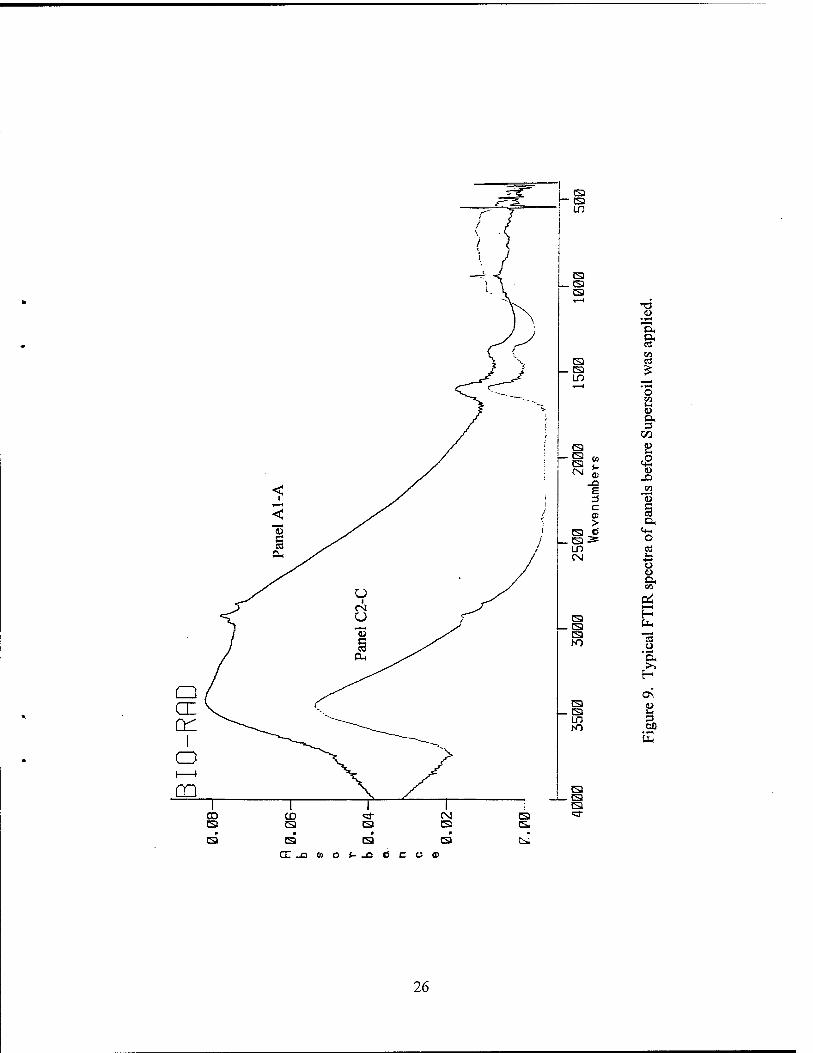
Eight samples were cut from the "as-received" panels (not soiled, cleaned, or finished). The peaks (areas of increased energy absorbency by the material) in the FTIR spectra are weak but consistently located at approximately 2,920 and 2,850 cm"1 (wave numbers) and at 1,592, 1,378 and 948 cm"1, as shown in Figure 9. This indicates that there is some kind of hydrocarbon contaminant on the "as-received" panels. However, the spectra peaks are too weak to allow the contaminant to be classified or identified. (Hydrocarbon peaks appear consistently at 3,000 to 2,800 cm"1 in the FTIR spectra of thousands of organic materials containing CH3 and CH2
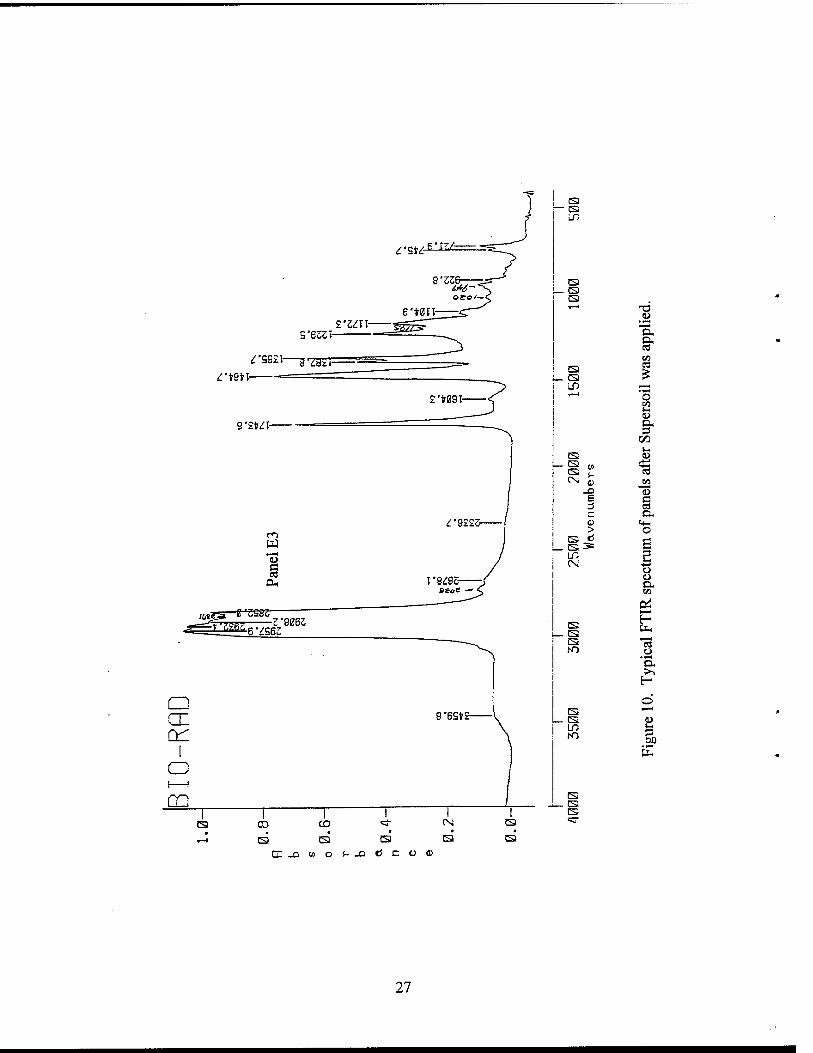
chemical groups.) Twelve samples were cut from panels purposely soiled with Supersoil, the blend of four
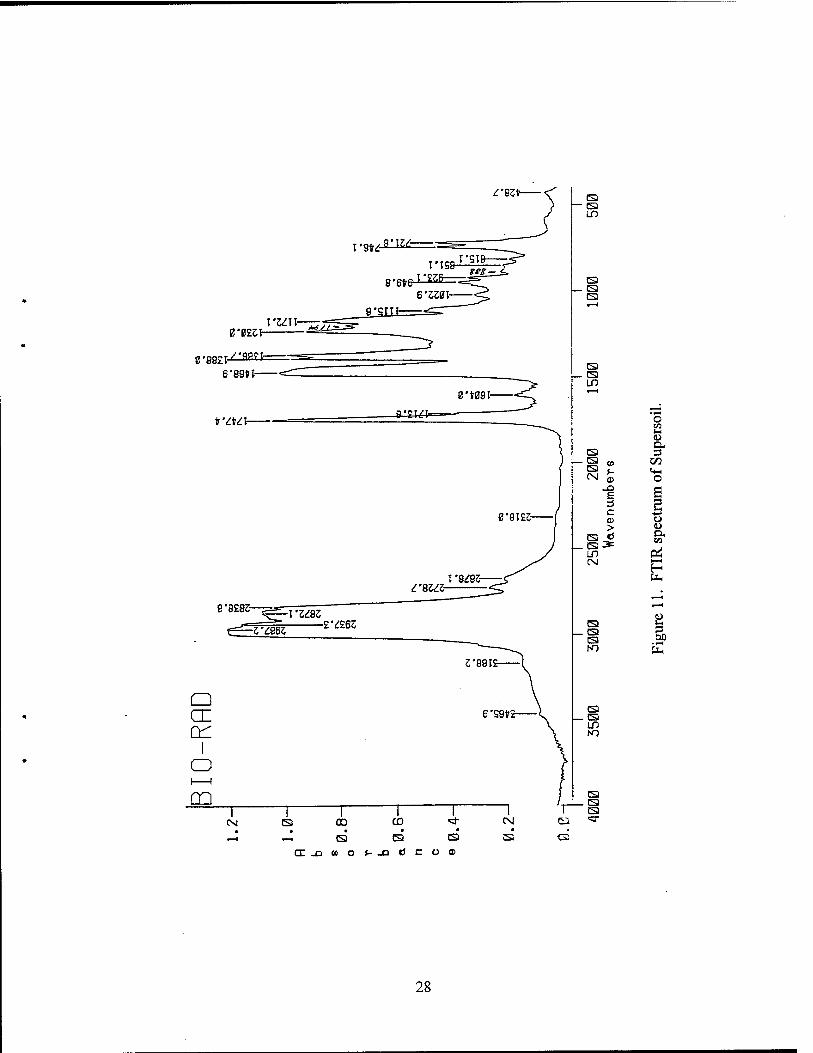
metal lubrication compounds (panels not cleaned or finished). All spectra for these panels match the spectrum of the Supersoil blend itself. Compare Figures 10 and 11. No data trend is evident between the samples with the soil pressed into the panels and the samples with the impressed soil.
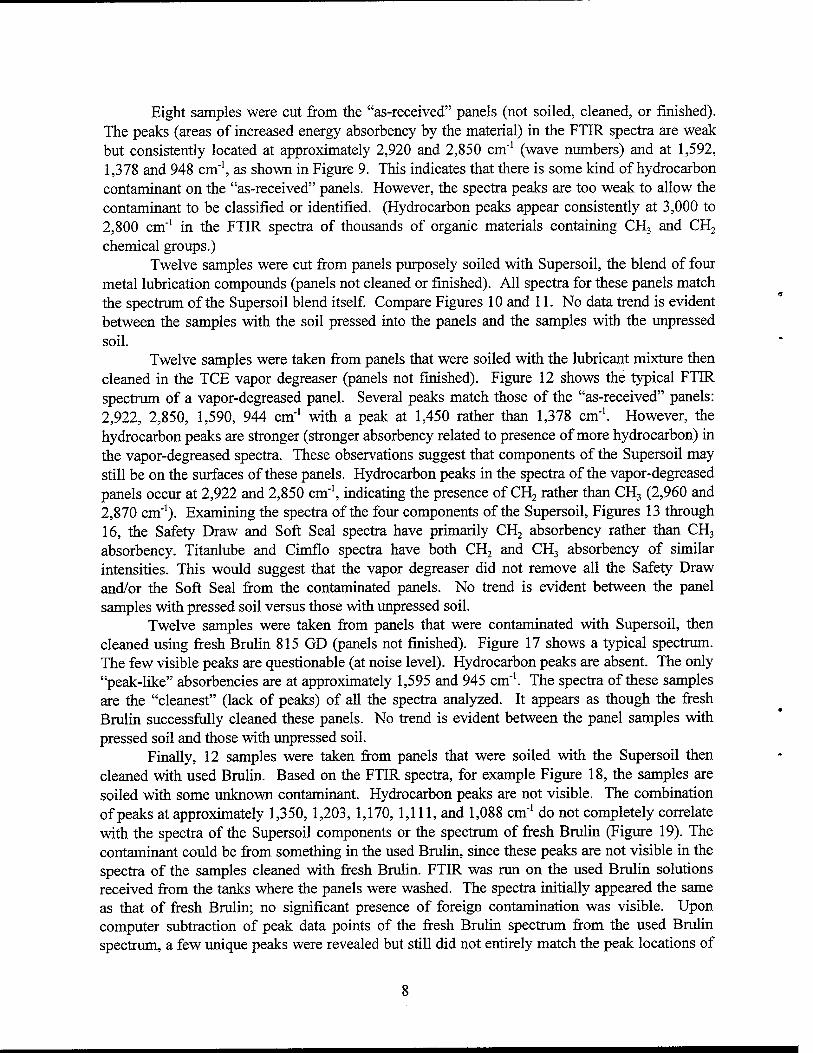
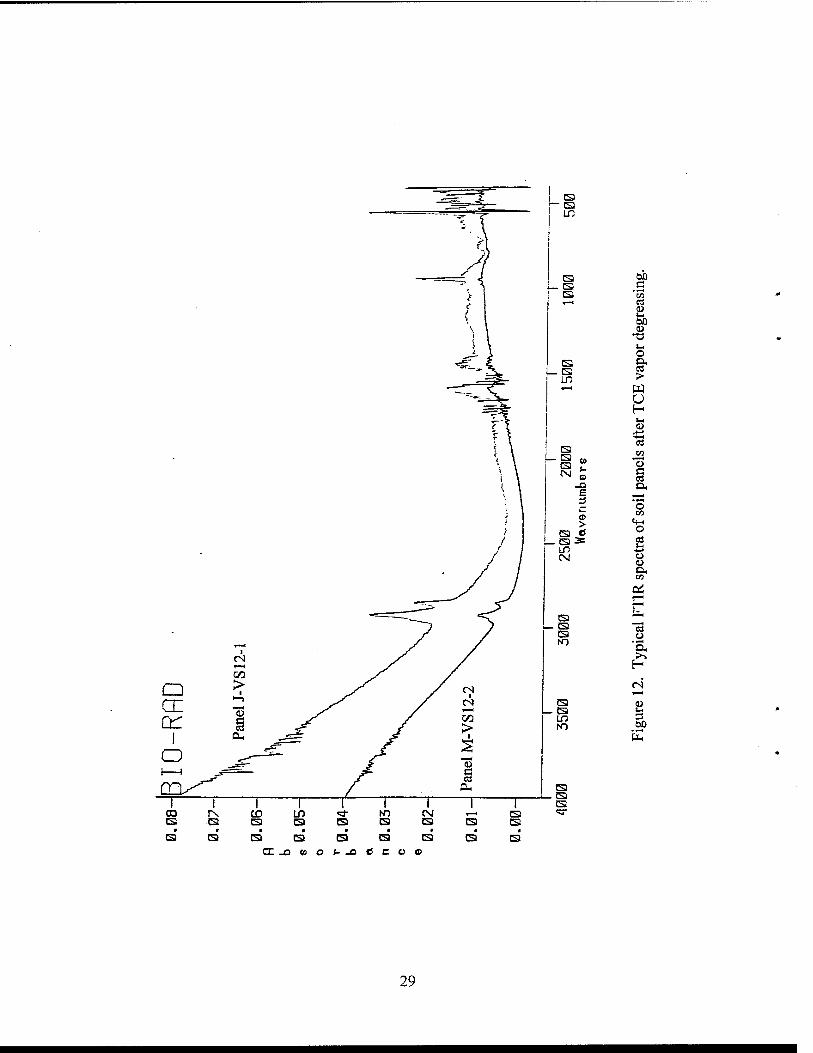
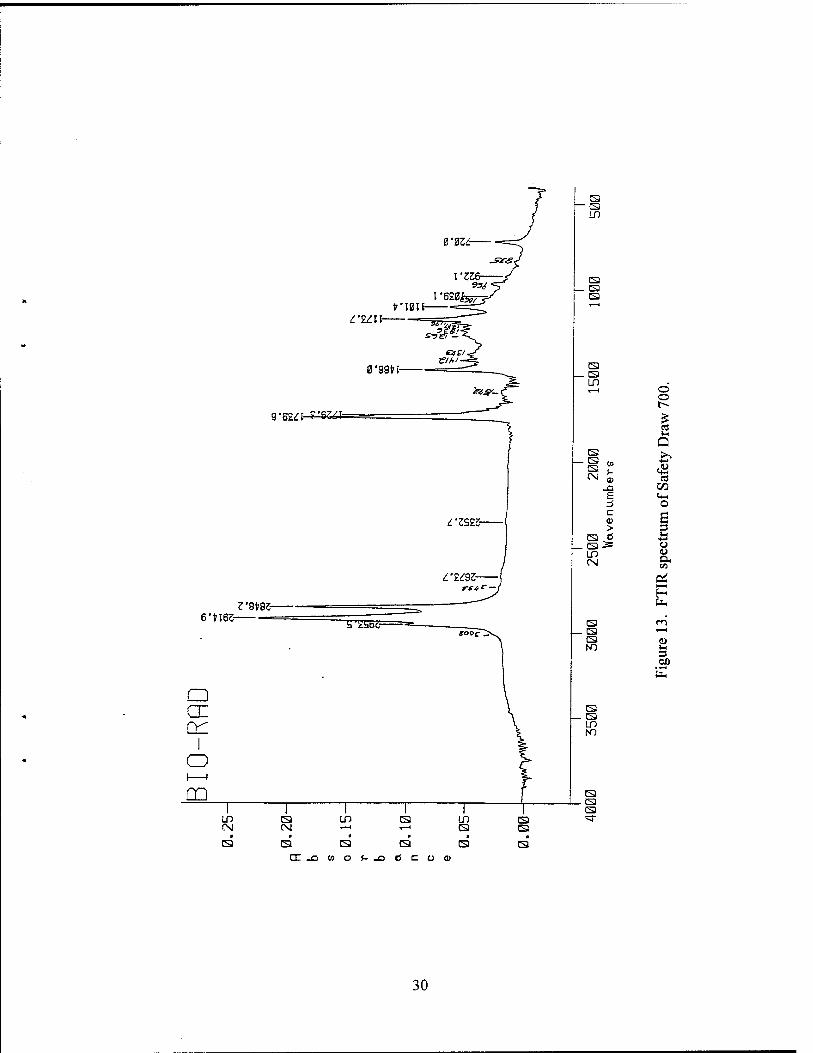
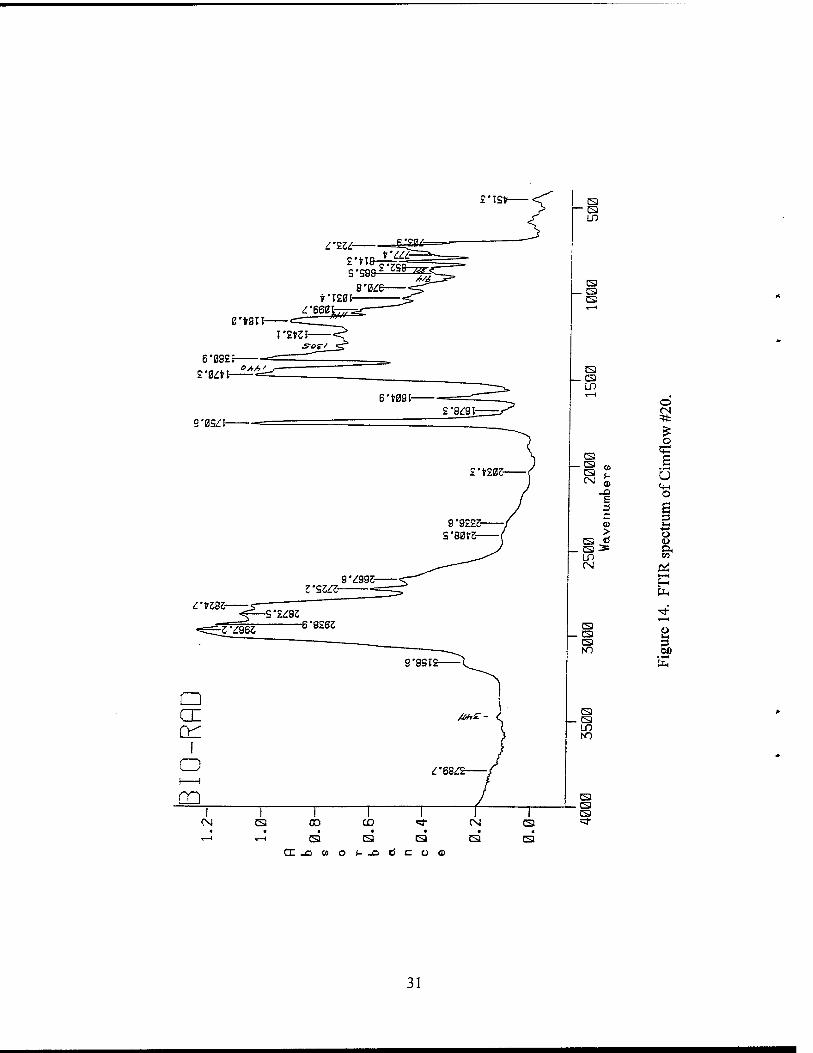
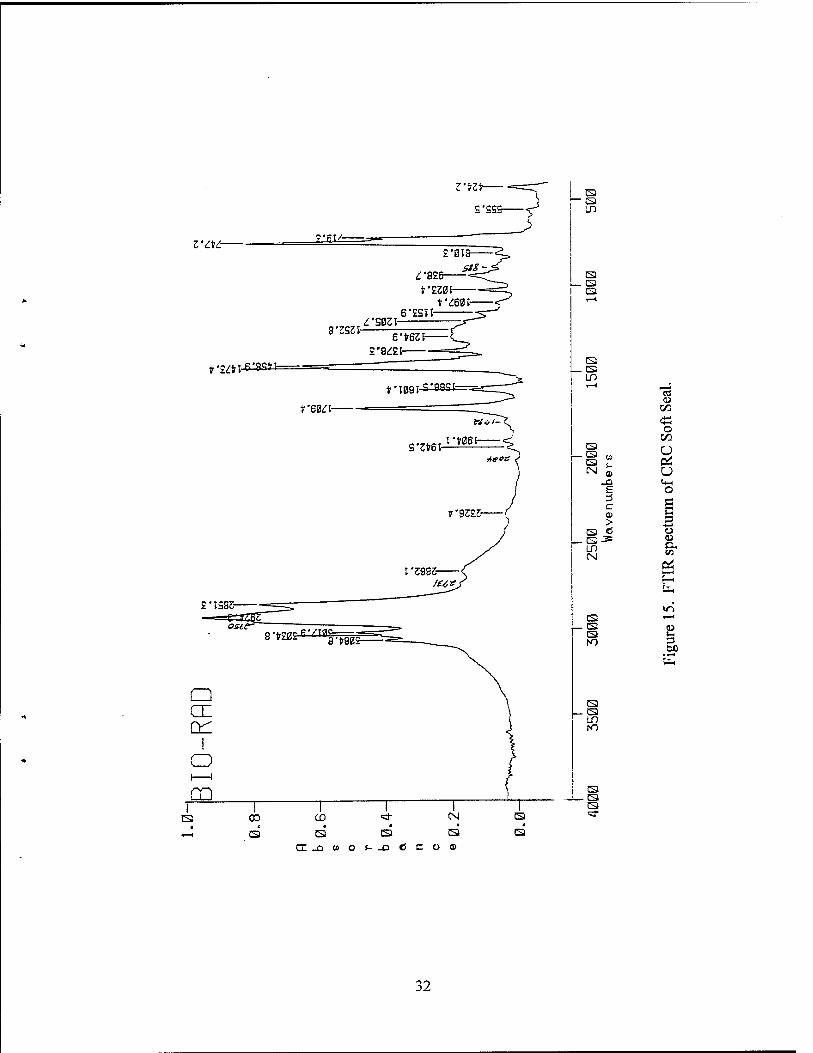
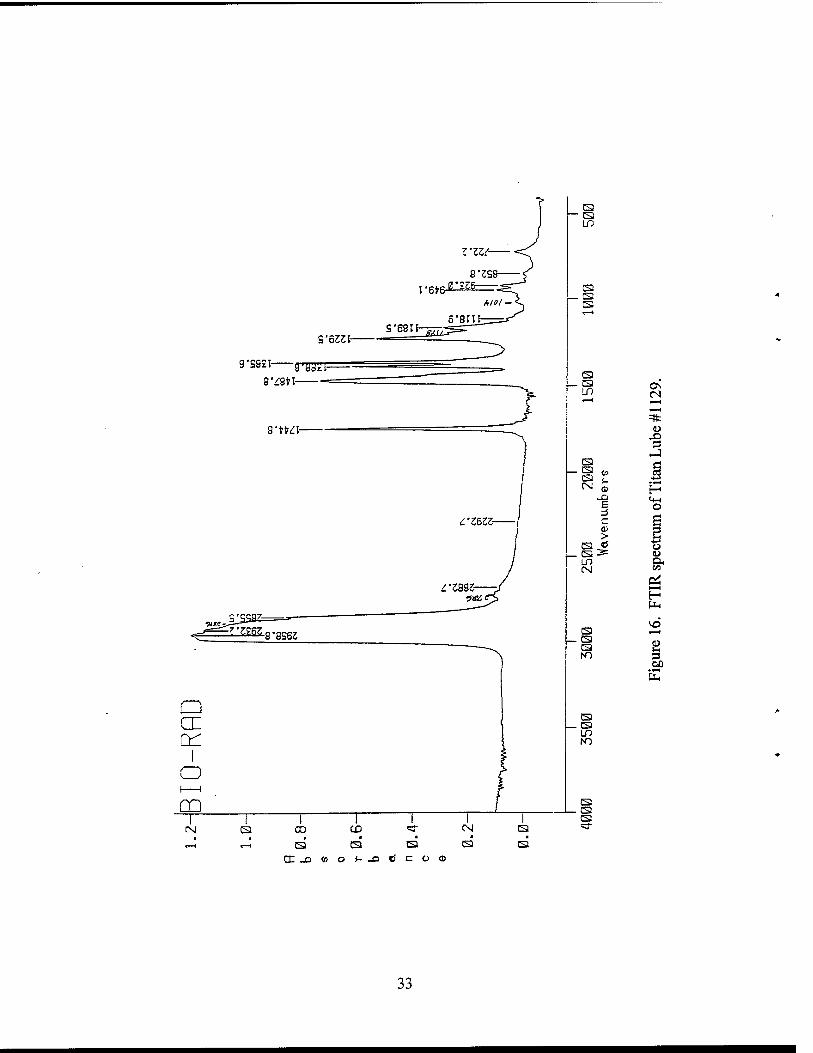
Twelve samples were taken from panels that were soiled with the lubricant mixture then cleaned in the TCE vapor degreaser (panels not finished). Figure 12 shows the typical FTIR spectrum of a vapor-degreased panel. Several peaks match those of the "as-received" panels: 2,922, 2,850, 1,590, 944 cm"1 with a peak at 1,450 rather than 1,378 cm"1. However, the hydrocarbon peaks are stronger (stronger absorbency related to presence of more hydrocarbon) in the vapor-degreased spectra. These observations suggest that components of the Supersoil may still be on the surfaces of these panels. Hydrocarbon peaks in the spectra of the vapor-degreased panels occur at 2,922 and 2,850 cm"1, indicating the presence of CH2 rather than CH3 (2,960 and 2,870 cm"1). Examining the spectra of the four components of the Supersoil, Figures 13 through 16, the Safety Draw and Soft Seal spectra have primarily CH2 absorbency rather than CH3
absorbency. Titanlube and Cimflo spectra have both CH2 and CH3 absorbency of similar intensities. This would suggest that the vapor degreaser did not remove all the Safety Draw and/or the Soft Seal from the contaminated panels. No trend is evident between the panel samples with pressed soil versus those with impressed soil.
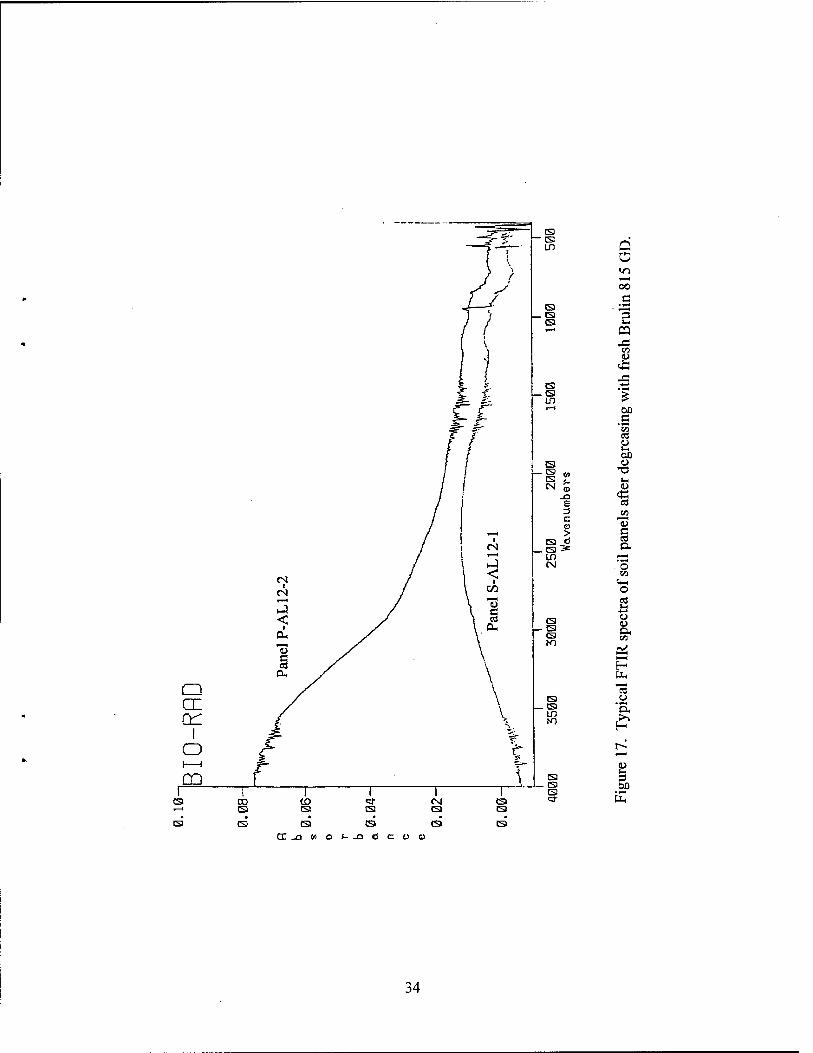
Twelve samples were taken from panels that were contaminated with Supersoil, then cleaned using fresh Brulin 815 GD (panels not finished). Figure 17 shows a typical spectrum. The few visible peaks are questionable (at noise level). Hydrocarbon peaks are absent. The only "peak-like" absorbencies are at approximately 1,595 and 945 cm"1. The spectra of these samples are the "cleanest" (lack of peaks) of all the spectra analyzed. It appears as though the fresh Brulin successfully cleaned these panels. No trend is evident between the panel samples with pressed soil and those with impressed soil.
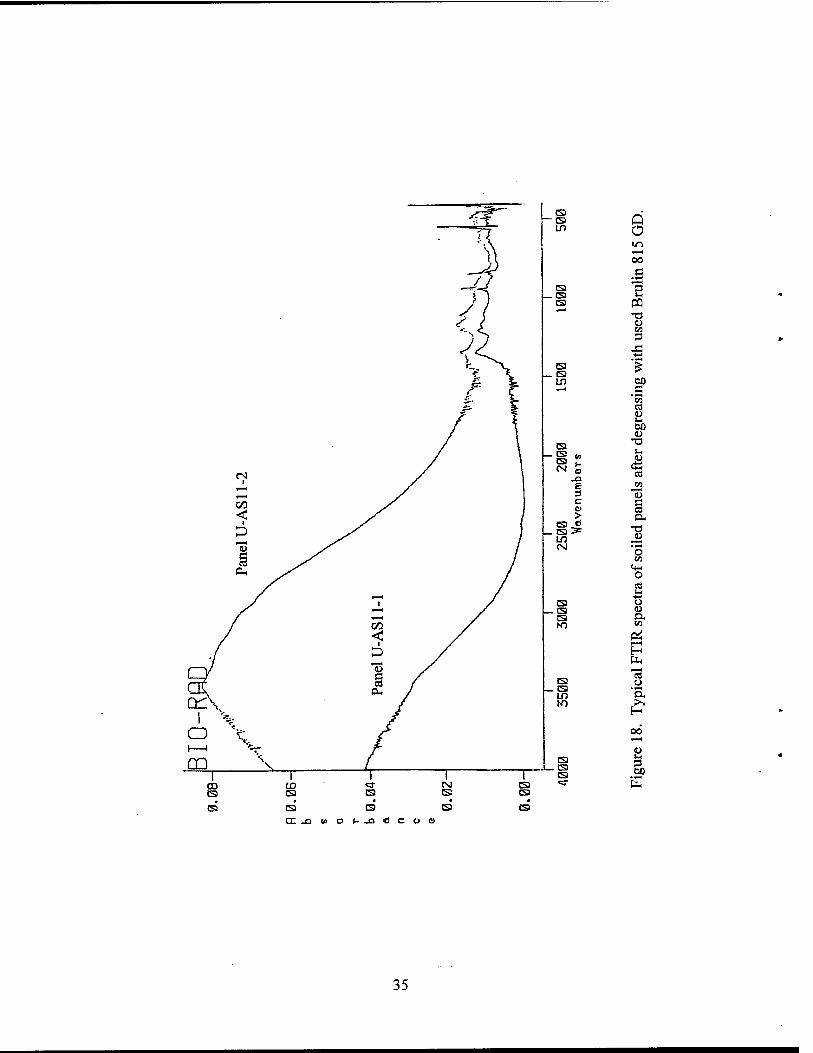
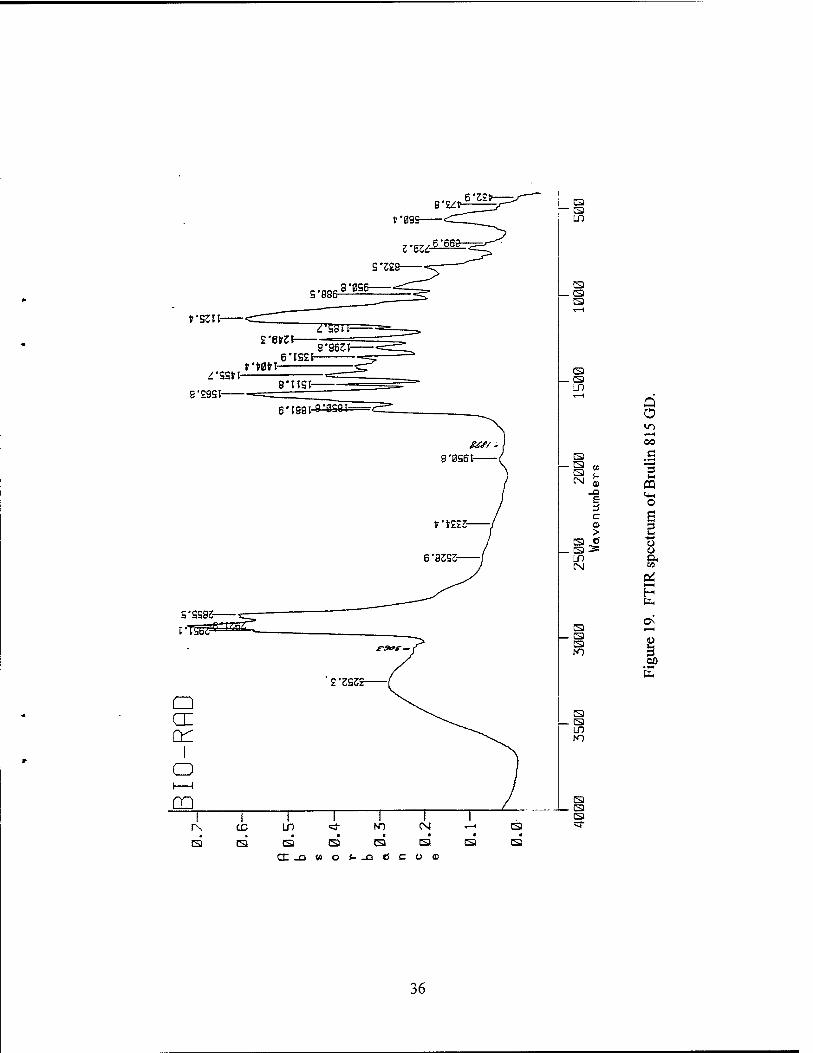
Finally, 12 samples were taken from panels that were soiled with the Supersoil then cleaned with used Brulin. Based on the FTIR spectra, for example Figure 18, the samples are soiled with some unknown contaminant. Hydrocarbon peaks are not visible. The combination of peaks at approximately 1,350,1,203,1,170,1,111, and 1,088 cm"1 do not completely correlate with the spectra of the Supersoil components or the spectrum of fresh Brulin (Figure 19). The contaminant could be from something in the used Brulin, since these peaks are not visible in the spectra of the samples cleaned with fresh Brulin. FTIR was run on the used Brulin solutions received from the tanks where the panels were washed. The spectra initially appeared the same as that of fresh Brulin; no significant presence of foreign contamination was visible. Upon computer subtraction of peak data points of the fresh Brulin spectrum from the used Brulin spectrum, a few unique peaks were revealed but still did not entirely match the peak locations of
8
the panel spectra. The panel peaks are too weak to classify or identify. Again, no trend is evident between the panel samples with pressed soil and those with impressed soil.
Water Break Cleanliness Analyses
All of the degreased panels were tested for water break. The tests were conducted following the light-duty immersion cleaning in Turco 4215 NC-LT as illustrated in Figures 5 and 6. All of the panels passed this test.
Resistance of Surface to Abrasion
Three soiled, anodized panels that had been degreased in TCE vapor, three panels degreased in clean Brulin 815 GD, and three degreased in used Brulin were selected for testing resistance to abrasion. The test panels were sheared off 4 inches from their bottom edge and a 1/4-inch hole punched in the center for attachment to the abrader. A Model 503 Taber Abraser was employed. Rubbing wear is produced by rotating the sample on a vertical axis while in contact with two weighted abrasive wheels. A detailed description of the procedures followed and the complete tabulated results are included in Appendix C.
The surface wear index was defined as the weight loss in milligrams per 1,000 cycles of abrasion while applying a 500-gram load. Weight loss and wear index differences within each panel-type set were as great or greater than differences between panel types. Furthermore, the percentage of difference between all test panels, regardless of type, was within the specified precision for testing panels of the same type within a single laboratory per ASTM D 4060. Therefore, no discernible difference was found in the abrasion resistance of the coating developed subsequent to the different cleaning methods.
Resistance of Surface to Corrosion
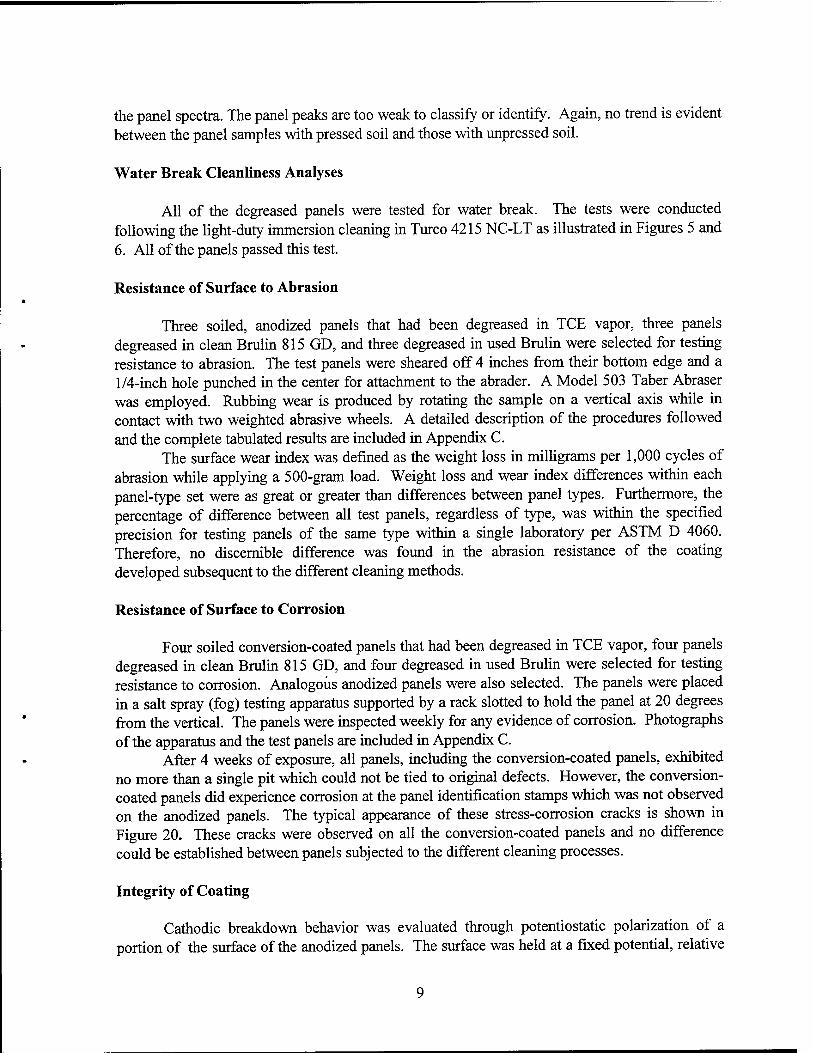
Four soiled conversion-coated panels that had been degreased in TCE vapor, four panels degreased in clean Brulin 815 GD, and four degreased in used Brulin were selected for testing resistance to corrosion. Analogous anodized panels were also selected. The panels were placed in a salt spray (fog) testing apparatus supported by a rack slotted to hold the panel at 20 degrees from the vertical. The panels were inspected weekly for any evidence of corrosion. Photographs of the apparatus and the test panels are included in Appendix C.
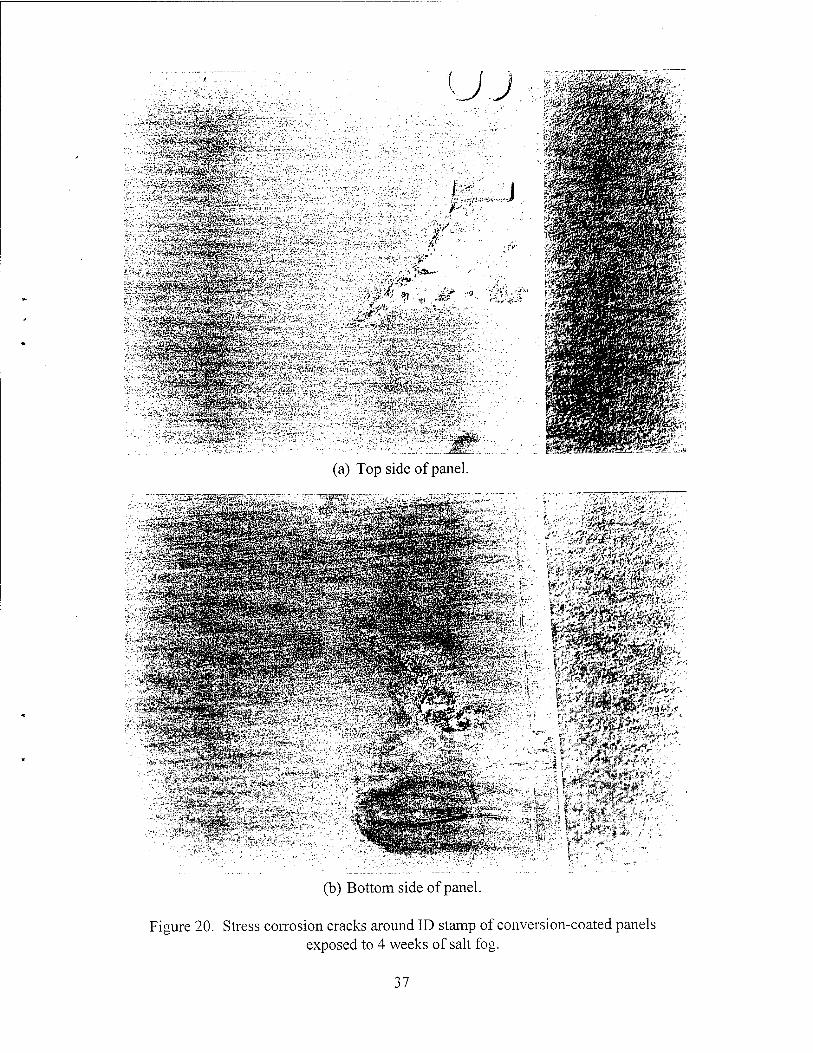
After 4 weeks of exposure, all panels, including the conversion-coated panels, exhibited no more than a single pit which could not be tied to original defects. However, the conversion- coated panels did experience corrosion at the panel identification stamps which was not observed on the anodized panels. The typical appearance of these stress-corrosion cracks is shown in Figure 20. These cracks were observed on all the conversion-coated panels and no difference could be established between panels subjected to the different cleaning processes.
Integrity of Coating
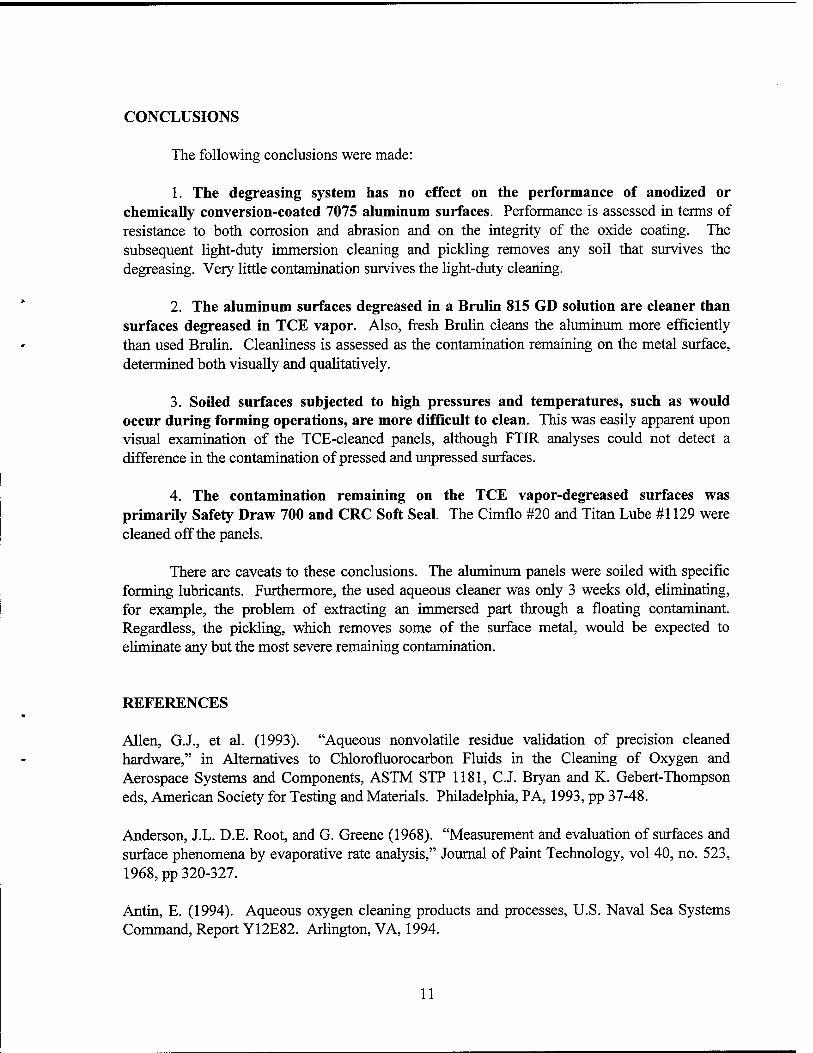
Cathodic breakdown behavior was evaluated through potentiostatic polarization of a portion of the surface of the anodized panels. The surface was held at a fixed potential, relative
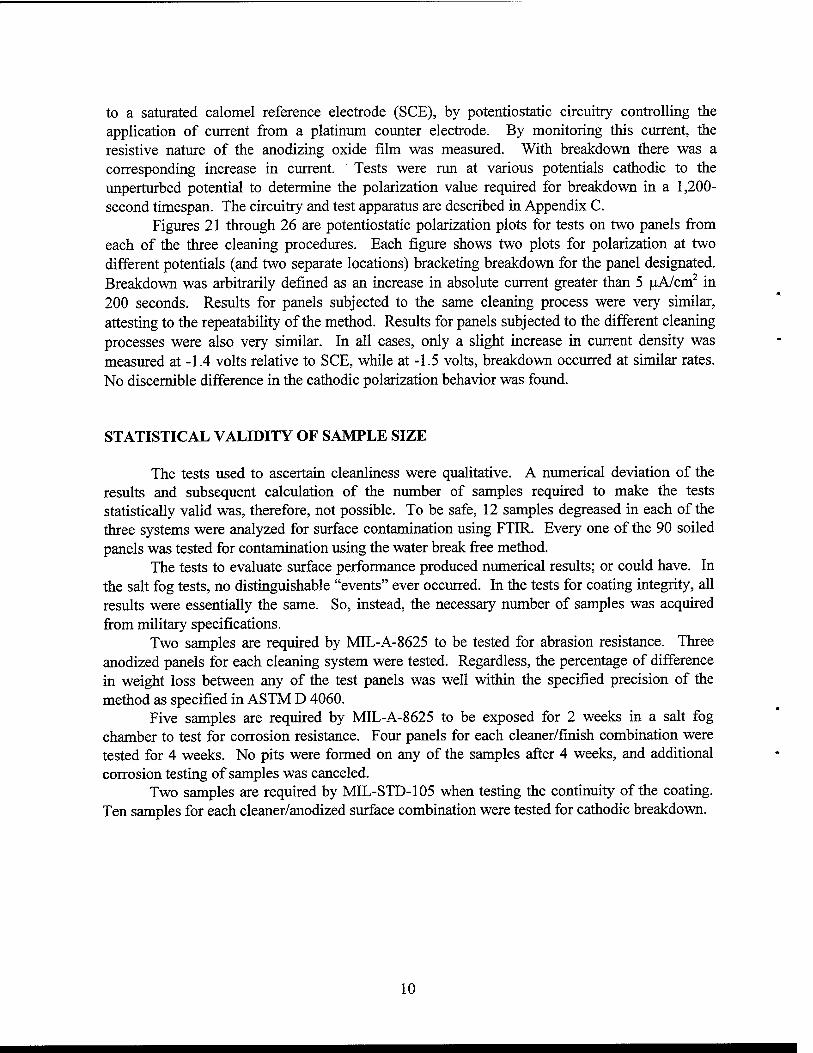
to a saturated calomel reference electrode (SCE), by potentiostatic circuitry controlling the application of current from a platinum counter electrode. By monitoring this current, the resistive nature of the anodizing oxide film was measured. With breakdown there was a corresponding increase in current. Tests were run at various potentials cathodic to the unperturbed potential to determine the polarization value required for breakdown in a 1,200- second timespan. The circuitry and test apparatus are described in Appendix C.
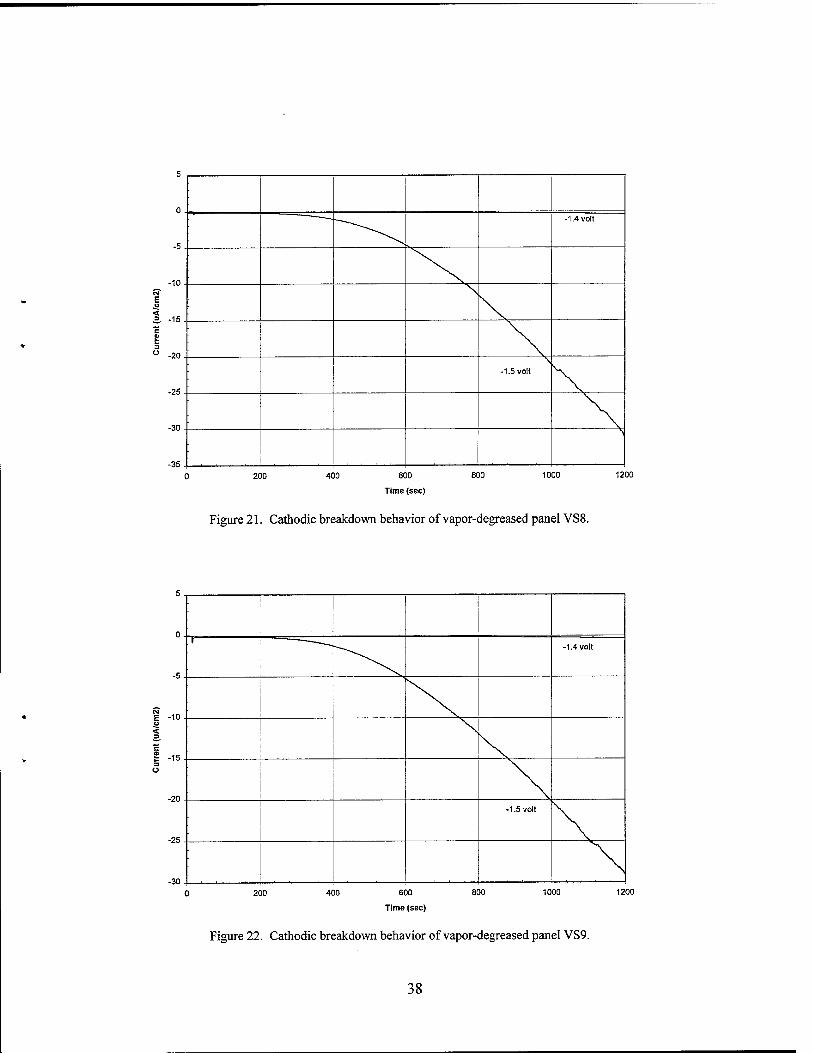
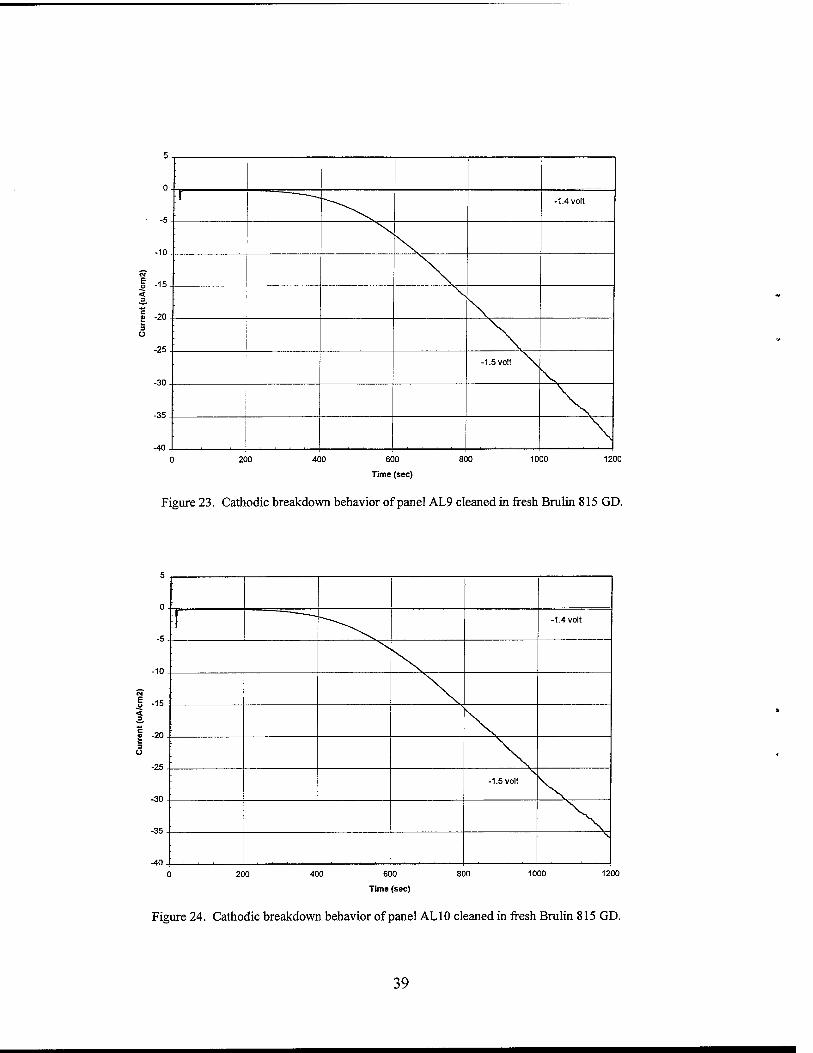
Figures 21 through 26 are potentiostatic polarization plots for tests on two panels from each of the three cleaning procedures. Each figure shows two plots for polarization at two different potentials (and two separate locations) bracketing breakdown for the panel designated. Breakdown was arbitrarily defined as an increase in absolute current greater than 5 jiA/cm2 in 200 seconds. Results for panels subjected to the same cleaning process were very similar, attesting to the repeatability of the method. Results for panels subjected to the different cleaning processes were also very similar. In all cases, only a slight increase in current density was measured at -1.4 volts relative to SCE, while at -1.5 volts, breakdown occurred at similar rates. No discernible difference in the cathodic polarization behavior was found.
STATISTICAL VALIDITY OF SAMPLE SIZE
The tests used to ascertain cleanliness were qualitative. A numerical deviation of the results and subsequent calculation of the number of samples required to make the tests statistically valid was, therefore, not possible. To be safe, 12 samples degreased in each of the three systems were analyzed for surface contamination using FTIR. Every one of the 90 soiled panels was tested for contamination using the water break free method.
The tests to evaluate surface performance produced numerical results; or could have. In the salt fog tests, no distinguishable "events" ever occurred. In the tests for coating integrity, all results were essentially the same. So, instead, the necessary number of samples was acquired from military specifications.
Two samples are required by MIL-A-8625 to be tested for abrasion resistance. Three anodized panels for each cleaning system were tested. Regardless, the percentage of difference in weight loss between any of the test panels was well within the specified precision of the method as specified in ASTM D 4060.
Five samples are required by MIL-A-8625 to be exposed for 2 weeks in a salt fog chamber to test for corrosion resistance. Four panels for each cleaner/finish combination were tested for 4 weeks. No pits were formed on any of the samples after 4 weeks, and additional corrosion testing of samples was canceled.
Two samples are required by MIL-STD-105 when testing the continuity of the coating. Ten samples for each cleaner/anodized surface combination were tested for cathodic breakdown.
10
CONCLUSIONS
The following conclusions were made:
1. The degreasing system has no effect on the performance of anodized or chemically conversion-coated 7075 aluminum surfaces. Performance is assessed in terms of resistance to both corrosion and abrasion and on the integrity of the oxide coating. The subsequent light-duty immersion cleaning and pickling removes any soil that survives the degreasing. Very little contamination survives the light-duty cleaning.
2. The aluminum surfaces degreased in a Brulin 815 GD solution are cleaner than surfaces degreased in TCE vapor. Also, fresh Brulin cleans the aluminum more efficiently than used Brulin. Cleanliness is assessed as the contamination remaining on the metal surface, determined both visually and qualitatively.
3. Soiled surfaces subjected to high pressures and temperatures, such as would occur during forming operations, are more difficult to clean. This was easily apparent upon visual examination of the TCE-cleaned panels, although FTIR analyses could not detect a difference in the contamination of pressed and impressed surfaces.
4. The contamination remaining on the TCE vapor-degreased surfaces was primarily Safety Draw 700 and CRC Soft Seal. The Cimflo #20 and Titan Lube #1129 were cleaned off the panels.
There are caveats to these conclusions. The aluminum panels were soiled with specific forming lubricants. Furthermore, the used aqueous cleaner was only 3 weeks old, eliminating, for example, the problem of extracting an immersed part through a floating contaminant. Regardless, the pickling, which removes some of the surface metal, would be expected to eliminate any but the most severe remaining contamination.
REFERENCES
Allen, G.J., et al. (1993). "Aqueous nonvolatile residue validation of precision cleaned hardware," in Alternatives to Chlorofluorocarbon Fluids in the Cleaning of Oxygen and Aerospace Systems and Components, ASTM STP 1181, CJ. Bryan and K. Gebert-Thompson eds, American Society for Testing and Materials. Philadelphia, PA, 1993, pp 37-48.
Anderson, J.L. D.E. Root, and G. Greene (1968). "Measurement and evaluation of surfaces and surface phenomena by evaporative rate analysis," Journal of Paint Technology, vol 40, no. 523, 1968, pp 320-327.
Antin, E. (1994). Aqueous oxygen cleaning products and processes, U.S. Naval Sea Systems Command, Report Y12E82. Arlington, VA, 1994.
11
Antin, E. (1995). NOC aqueous oxygen cleaning process, U.S. Naval Sea Systems Command, Report Y2A124. Arlington, VA, 1995.
American Society for Metals (ASM) (1982). Metals handbook, Volume 5, Surface cleaning, finishing, and coating, 9th ed. Metals Park, OH, 1982.
American Society for Testing and Materials (ASTM) (1994a). "Standard practice for cleaning methods for material and equipment used in oxygen-enriched environments," Annual Book of ASTM Standards, Designation: G93-88, 1994, pp 1134-1143.
American Society for Testing and Materials (ASTM) (1994b). "Standard test method for hydrophobic contamination on glass by contact angle measurement," 1994 Annual Book of ASTM Standards, vol 15.02, section C813-90,1994.
American Society for Testing and Materials (ASTM) (1994c). "Standard practice for operating salt spray (fog) testing apparatus," 1994 Annual Book of ASTM Standards, vol 03.02, designation: Bl 17-94,1994, pp 17-24.
Bernett, T.W. and H.W. Krebs (1990). "Theories of alkaline cleaners," in Ceramic Engineering and Science Proceedings, vol 11, no. 5-6,1990, pp 443-448.
Bird, R.W. and B.A. Donahue (1993). Aqueous alkaline cleaners: An alternative to organic solvents, U.S. Army Corps of Engineers Construction Engineering Research Laboratories, Technical Report EP-93/05. Champaign, IL, 1993.
Caimi, R.E.B., M.D. Littlefield, G.S. Melton, and E.A. Thaxton (1994). "Cleaning verification by air/water impingement," in Precision Cleaning '94 Proceedings, Rosemont, IL, May 16-18, 1994, pp 97-107.
Chawla, M.K. (1990). "How clean is clean? A quantitative answer," Plating and Surface Finishing, vol 77, no. 8,1990, pp 40-42.
Cohen, L.E. (1987). "How clean is your 'clean' metal surface?" Plating and Surface Finishing, vol 74, no. 11,1987, pp 58-61.
D'Ruiz, CD. (1991). Aqueous cleaning as an alternative to CFC and chlorinated solvent-based cleaning. 1 st ed., Noyes Publications, Park Ridge, NJ, 1991.
U.S. Environmental Protection Agency (EPA) (1994a). Alternatives to chlorinated solvents for cleaning and degreasing, Office of Research and Development, USEPA, Technical Report EPA/625/R-93/016. Cincinnati, OH, 1994.
U.S. Environmental Protection Agency (EPA) (1994b). Guide to cleaner technologies: Cleaning and degreasing process changes, Office of Research and Development, USEPA, Technical Report EPA/625/R-93/017. Cincinnati, OH, 1994.
12
U.S. Environmental Protection Agency (EPA) (1995). Demonstration of alternative cleaning systems, Office of Research and Development, USEPA, Technical Report EPA/600/R-95/120. Cincinnati, OH, 1995.
Evanoff, S.P. (1990). "Hazardous waste reduction in the aerospace industry," Chemical Engineering Progress, Apr 1990, pp 51-61.
Federal Standard Test (FST) (1994). Method 536/6701.1: Cleaning efficiency, 1994.
Golden, J.L. (1992). "Vapor degreasing alternatives in metal cleaning applications: Evaluation of aqueous degreasers," Plating and Surface Finishing, vol 79, no. 7,1992, pp 16-18.
Greene, A.C., R.D. Cormia, and Q.T. Phillips (1992). "Evaluating cleaning efficiencies of CFC replacement systems in the disk-drive industry using surface analytical techniques," Microcontamination, vol 10, no. 3,1992, pp 37-40, 63-65.
Gunn, D. (1988). "Evaluation of aqueous degreasers versus chlorinated solvents at the Paducah diffusion plant," Paducah Gaseous Diffusion Plant, Technical Report KY/L-1507-R1. Paducah, KY, 1988.
Hill, E.A., K.R. Monroe, and K.D. Carter (1994). "A quantitative method for cleaning process development," in Precision Cleaning '94 Proceedings, Rosemont, IL, May 16-18, 1994, pp 108- 121.
Jones, W.C. (1985). "Testing surfaces for cleanliness," Metal Finishing, vol 83, no. 10,1985, pp 13-15.
Keen, J.M., et al. (1994). "Screening, down selection, and implementation of environmentally compliant cleaning and insulation bonding for MNASA," in Proceedings of the Workshop on Environmentally Benign Cleaning and Degreasing Technology, Naval Surface Warfare Center, Indian Head, MD, 1994, pp 225-233.
Koch, U.H. and CJ. Kmetko (1993). "Aqueous cleaning of industrial and high-purity valves and fittings: Process development, control, and validation," in Alternatives to Chlorofluorocarbon Fluids in the Cleaning of Oxygen and Aerospace Systems and Components, ASTM STP 1181, CJ. Bryan and K. Gebert-Thompson eds, American Society for Testing and Materials. Philadelphia, PA, 1993, pp 49-65.
Littlefield, M.D., et al. (1994). "Aqueous degreasing, precision cleaning, and cleanliness verification processes," in Proceedings of the Workshop on Environmentally Benign Cleaning and Degreasing Technology, Naval Surface Warfare Center, Indian Head, MD, 1994, pp 205- 210.
Lopez, E.P. (1995). "Identifying a suitable alternative cleaner for mechanical piece part applications," Precision Cleaning, vol 3, no. 10,1995, pp 23-31.
13
Miekowski, A. and J. Domin (1988). Evaluation of commercial cleaning compounds, U.S. Army Material Command Logistics Support Activity, Project Report TE-LS-16-88. Tobyhanna, PA, 1988.
Miekowski, A. and K. Pillar (1993). Biodegradable cleaner/degreaser testing, U.S. Army Material Command Logistics Support Activity, Project Report TE-LS-31-92. Tobyhanna, PA, 1993.
Monroe, K.R. (1994). Replacing solvent cleaning with aqueous cleaning, Environmental Protection Agency, Report EPA-600/R-94-131. Research Triangle Institute, Research Triangle Park, NC, 1994.
Nguyen, V.T., N.A. Zirps, and D.K. Shaver (1988). "Solvent substitution and equipment modifications for vapor degreasing," Publications in Process Technology '88: The Key to Hazardous Waste Management, vol 2, Environmental Protection Agency, Washington, DC, 1988.
Paciej, R., F. Jansen, and S. Krommenhoek (1993). "Evaluation of plasma cleaning, an environmentally friendly process, for removing lubricants from metallic surfaces," in Alternatives to Chlorofluorocarbon Fluids in the Cleaning of Oxygen and Aerospace Systems and Components, ASTM STP 1181, C.J. Bryan and K. Gebert-Thompson eds, American Society for Testing and Materials. Philadelphia, PA, 1993, pp 124-140.
Pedley, M.D., D. Janoff, and H. Johnson (1993). "A comparison of nonCFC and CFC methods for removal of organic and particulate contaminant on stainless steel components," in Alternatives to Chlorofluorocarbon Fluids in the Cleaning of Oxygen and Aerospace Systems and Components, ASTM STP 1181, C.J. Bryan and K. Gebert-Thompson eds, American Society for Testing and Materials. Philadelphia, PA, 1993, pp 11-21.
Rancourt, J.D. (1994). Supercritical fluid extraction equipment and technical references, Naval Surface Weapons Center, Indian Head Division, Contract Report NSWC-IHCR-94-46. Polymer Solutions, Inc., Blacksburg, VA, 1994.
Rancourt, J.D. and D.C. Messer (1994). Supercritical water oxidation, Naval Surface Weapons Center, Indian Head Division, Contract Report NSWC-IHCR-94-47. Polymer Solutions, Inc., Blacksburg, VA, 1994.
Scislowski, S. (1990). "Cleaning basics (Part II) - Soils," Metal Finishing, vol 88, no. 2, 1990, pp 43-46.
Spring, S. (1974). Industrial cleaning. 1st ed., Melbourne, Australia, Prism Press, 1974.
Tarn, T.M., R. Wyngarden, and A.F. Naylor (1993). "Evaluation of performance test methods for an aqueous cleaner," Plating and Surface Finishing, vol 80, no. 12,1993, pp 58-62.
14
Wang, V. and A.N. Merchant (1993). "Metal-cleaning alternatives for the 1990s," Metal Finishing, vol 91, no. 4,1993, pp 13-16.
Weiland, J.D. (1995). "Surpassing the challenge," Inside: Environmental Champions, Chemical Engineering (supplement), 1995, pp 44-46.
Welch, P.J. (1993). "Evaluation of the differences in performing particle analysis with water instead of CFC fluids," in Alternatives to Chlorofluorocarbon Fluids in the Cleaning of Oxygen and Aerospace Systems and Components, ASTM STP 1181, C.J. Bryan and K. Gebert- Thompson eds, American Society for Testing and Materials. Philadelphia, PA, 1993, pp 27-36.
Weltman, H.J. and S.P. Evanoff (1991). "Replacement of halogenated solvent degreasing with regenerable aqueous cleaners," in Proceedings of the 46th Annual Industrial Waste Conference, Purdue University, IN, 1991.
Wikoff, P.M., et al. (1989). Substitution of wax and grease cleaners with biodegradable solvents: Phase I. EG&G Idaho, Inc., Technical Report ESL-TR-89-04. Idaho Falls, ID, 1989.
Williams, M.K. and J.F. Jones (1993). "Witness coupon testing as a possible method for validating precision cleaned hardware in oxygen systems," in Alternatives to Chlorofluorocarbon Fluids in the Cleaning of Oxygen and Aerospace Systems and Components, ASTM STP 1181, C.J. Bryan and K. Gebert-Thompson eds, American Society for Testing and Materials. Philadelphia, PA, 1993, pp 116-123.
Woodrow, T.A., E. Barnes, and S.P. Evanoff (1995). "Aqueous degreasing of skins and honeycomb core," Metal Finishing, vol 93, no. 2,1995, pp 40-43.
15
CO •4-» co o H >> o c u
'o «B W
>-< u c CO <D
O Ö o
s co
o
C
c U
Blu
e G
old,
T
ivac
lean
, C
hem
- C
rest
200
are
aq
ueou
s cl
eane
rs
test
ed
o CO CO
« B if c S.l *"* CO
2 £ E S C
ompa
red
with
T
CA
vap
or
degr
ease
r
4 cl
eane
rs
sele
cted
for
fin
al
test
s; a
lso
corr
osio
n te
sts
Ü
M
u öS
00 oo 0\
Ö tu >1
s z
oo <n OO C\ ON 0\
M 'Sä CO CO
& £ O O
s is
oo oo o\
3 Ü
43 O CO J* ;=, >-
*ed
«
Is &2
o\
c" CU
■a
O
"2 's CO .5
f ^ 5°
■a *<~
co £•
3 co 3
D &
■a 5\ 3 Oj
o «
■a eu
co OO S 3 .O O
c r i
en
<D
.S 2 •a CO
co H
u
.op o
*= eu
00 CM
0> 3 CD
CU o
UM c-<
3 CO
eu 00 3 CO
J3
.op *S
ed ■ u
X)
S OS
>z Wat
er b
reak
, G
C/M
S an
alys
is o
f T
CA
rin
se,
visu
al,
blac
k lig
ht
Wat
er b
reak
, U
V l
ight
, N
iels
en m
etho
d
co a o o.
g
CO D
CO eu
e .2 „ ü ed
p-<
CO CU
>-
Soile
d co
upon
s ba
ked
at
100-
C
Yes
, he
ated
at
75°F
for
72
hrs
.
CO
1 CD
5-
Alu
min
um,
stee
l, br
ass, c
adm
ium
, m
agne
sium
30
03 A
l, 40
0 M
onel
, A
285
stee
l, co
pper
, ph
osph
or b
ronz
e
Cop
per, n
icke
l, va
riou
s al
umin
ums,
ca
rbon
ste
el,
stai
nles
s, b
rass
, M
onel
, in
cone
l, tit
aniu
m,
mag
nesi
um,
was
palo
y
Alu
min
um a
nd
mag
nesi
um
anod
ized
or
conv
ersi
on c
oate
d
E 3
cd
O tN A
lum
inum
an
odiz
ed o
r co
nver
sion
coa
ted
3 CO
CO cd tu
DO
*_, tU
a 2 .S3 to <.S Si
licon
e gr
ease
, pe
trol
eum
di
still
ate
grea
se,
lube
oil,
H20
so
lubl
e oi
l, la
ppin
g co
mpo
und
Wax
, ca
rbon
ized
oi
l/xyl
ene
mix
ture
, hy
drau
lic
flui
d/ca
rbon
m
ixtu
re,
mol
ybde
num
su
lfid
e/ca
rbon
m
ixtu
re
Ble
nd o
f fo
rmin
g co
mpo
und, W
D-
40,
Bes
saw
ax,
kero
sene
, D
ykem
St
eel
Blu
e,
Mic
rocu
t, A
lum
icut
"F
ish"
oil,
m
iner
al o
il,
glyc
erin
e,
mac
hini
ng o
il,
layo
ut d
ye,
alum
inum
mill
st
amps
F
orm
ing
oils
, gr
ease
s, w
axes
, in
ks,
mill
mar
ks,
fine
s, p
artic
ulat
es
No. o
f A
queo
us
Alk
alin
e C
lean
ers
tN en v\ ■*
CO
a g
Z - « <N 00
3 i-i CU > CO
CO
en o V~l \o ■cj-
•*
IM
w o.
e < oo 1>
■§
■a > oo 0\
oo en 00 o\ ON C\
oo OO ON
OO o\
1989
/Air F
orce
E
ngin
eeri
ng &
Ser
vice
s C
ente
r s 8 ON
ON o\
« .SP
CO
|
< > x"
3 EC
xT o
2 ed"
.2 i
h" i
3
1 5
CO
O U CO cd
1i
oo B 'C
CU CU
«. c 3 .2 a CO PH
3 ^ 2 w a. - S & CU o
< U
CO
I* PL,
O JS
2
o § ca S
1 CO
c cd tu
CO
i CU o
03
■a <
cu eu •a §
s | •a 3 S co a> S 8 s « o a. >-) co M
artin
Mar
ietta
, A
stro
naut
ics
Gro
up,
Den
ver, C
O
CO O
« H
1« _ o 2£ 3 tJ eu o o fi
CO eu
3 OO B <
CO O -1
& s
■s o Z
16
T3
g 'f. O U
CO
5 a s o
<U o c a> t->
,u
u t_.
CO CO
*o CD CO
w
Pri
mar
ily
a so
lven
t re
gene
rati
on te
st,
only
B
rulin
815
GD t
este
d
.§■
"H CO "*2 co ea a> a. w
S c
5 .2 O co
o a CO l_i
< 8
>> 2 -a c 2 00 0)
■i ö.
H ü
■o
Q Ü
00
1 CO
U U H oo
S co ft a
2 u a -O Cl. i-i E °
U 5 Par
ts c
oate
d pr
ior
to
clea
ning
, sa
lt fo
g te
sts
for
corr
osio
n al
so
cond
ucte
d
Com
pare
d w
ith T
CA
va
por
degr
easi
ng,
conv
ersi
on c
oatin
g ev
alua
ted
usin
g sa
lt fo
g C
ompa
red
with
TC
E
vapo
r de
grea
sing
, B
rulin
815
GD
was
cl
eane
r of
cho
ice
O C
CO
E CO ^
1/3 el to a> S "ü
1.1
o 4)
<4-i u
ft<
a o •ö o
EL« 5b
1? co tr*
S.S 3 >
5*
if J§ &u c« g s « £ •*= C CO
ft* S
o\ o\
•* ON ON
c <
ON ON
3
ON
c CJ
it
■*
ON ON
O o s o
CO
Ü
o ■a O v-l O ON
^2
in ON ON
"5
in ON ON
CD a, o
»1
en
c «3 ^ c«
« E-H
Is •5 S * .
to rt a>
o . Ö a O 3 <*> "O ,„ CL •— co CO CO CO
cl> O •O i- —
S.ä£ CO h* 00
SE5
ctf
es
>
op
CO
s «Ö CO "S > z
■g s
■° > a _« co
Z = £
JS -SP *s
—" ID CO tiO 3 C CO CO
4> > W)
"co C
1 § < .o
£ „C - co
gP Q, C 5 o o - S co o p *-i ate
Ü » 1)
id ■S o
i» 6 a 'S .2
.Ü 13 co
as! O ^2 5
c o a 3 o U
111 U 5 S
CO co
>- lüg *o o 'S
SI'S s o § op U S 2
a "8 W CO
s = & U
O tU o.l|f S £. ^ o o o
CO
><
CO
e i s s <
'«3
S 1 "
1 g,-i i E
<3| "CO
55
73
55
E i E 3
<
E g E
o CNI
E U S3 a,'S O 3 u «
'o 00
e
Hg 3 fit > o j_, CO •—
*£ - « ^ « to > <U
g a s | .2 ffl M .s cj u O w
1-. fcH U (N 00 Q, CO
■g '3 B3
1 •a >,
CO
a.
c S ü eö
Sj- BO
rf O
8 s
1> CO CO O 3
"« Ö .2 c CD
jS-5 Ä co
_>, C O
S3 a>
.S -a
Ä CO
§?a :§ s
S 3
No. o
f A
queo
us
Alk
alin
e C
lean
ers
00 - -* (N - CO
in
o g ri co z -
OO en - ON fNl
tN
. 00 — C co ;3
USD
5 11 tN NO 00
1-1
U g
CO
tN ON ON
ON ON
2 W
■*
ON ON
•a c
CO co
" s — tz> g < "3 o ^ SO a •7 co O
•* fi g ON >> 's —t !« <
ON ON
ON ON
ON ON
<
ON ON
ON ON
en ON ON
»n ON ON
u CO C
•ö cS e S o o «> Q .is
Esi§3 o .2 e o Z g §
•^ ^ *"• S H 2 o w
o
.£P CO
|
< U
o" . 50
g-Q Q S B CO O .
"S"S > -S < S "3 r£ > fc-
CO O
Z Z
e
CO c a?! CO CJ a> -
£2 — o
CO ej > C CO o Z CJ
ffi O co 3
x> E
3 o £ "öS
•2 CO ><
.9- CO
*ca > eo z •a B CO
« <
O a. u Q >. E
< CO
*c U
CO
K o X U H
u C
U u o §-><
^ S C 2 c 5 i) o
o D U .
o H O co
'•3 5
CJ a z 1- £ ft.
*äb "Sb c c eö eo
H H
2 u
CO CO CJ OJ CO CO cu o
■s t-l O
t* IM o u-
•a u CU
o o
t-i ID > s <u Q
_c hfl CO
s •o
QJ
J u
CO -O
CO ^^
JS "co 2 s - .2 a
CO C7*
Z eu .S3 §" •O 3 C XI
CO <
CO tU
la O „
cu O H to
s| tU o 1-1 t—1
P r g & o o U U
17
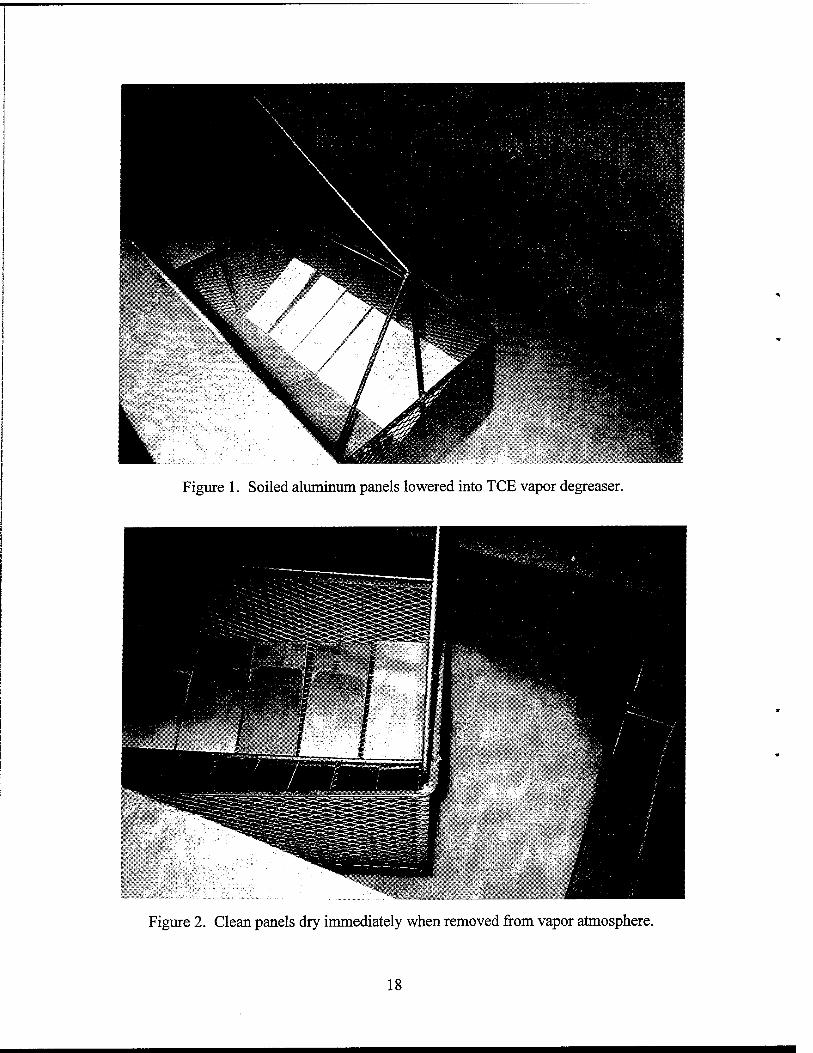
Figure 1. Soiled aluminum panels lowered into TCE vapor degreaser.
Figure 2. Clean panels dry immediately when removed from vapor atmosphere.
18
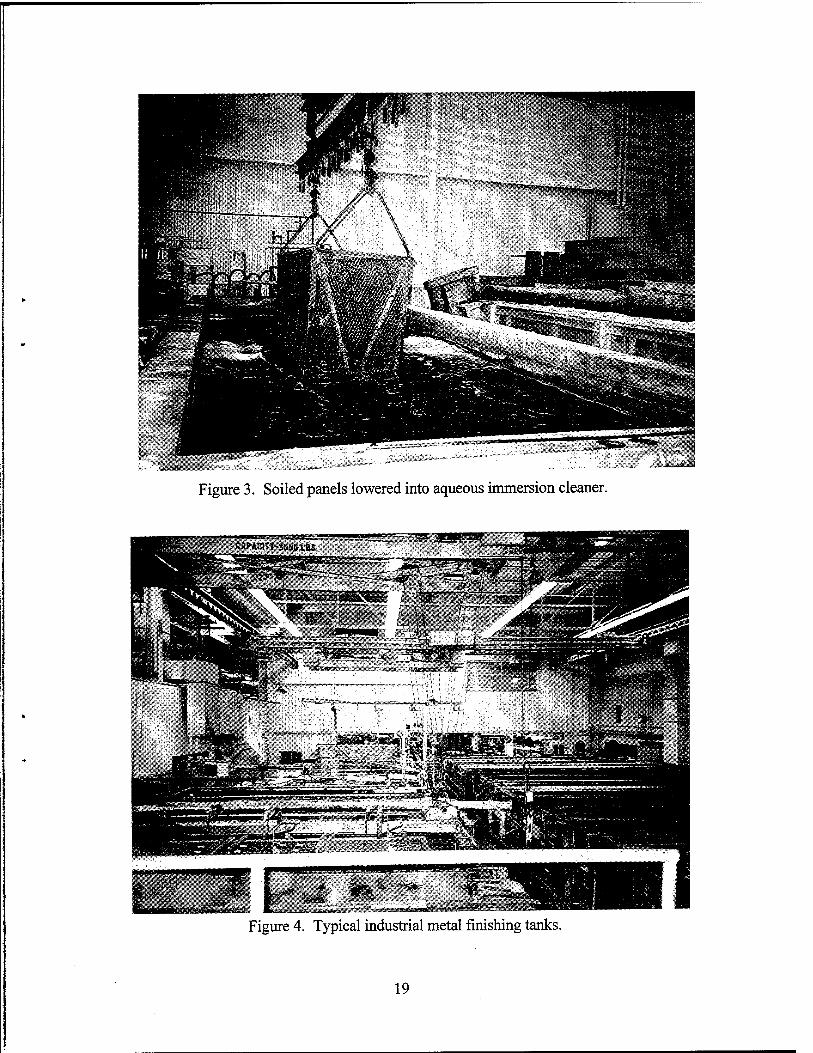
Figure 3. Soiled panels lowered into aqueous immersion cleaner.
Figure 4. Typical industrial metal finishing tanks.
19
50 Panels Aluminum Panels
* Soiled & Aged
H5 Panels 15 Panels
3 Panels: Analyses 1,2,3
2 Panels: Analyses 1,2,3
TCE Vapor Degreaser
Spray Lance 3 Mins Vapor Spray Lance
Fresh Aqueous Cleaner (Brulin) Lab Environment
• >- 5 Panels: Analyses 1,2,3,4
5 Panels: Analyses 1,2,3,4 <-
15 Mins 150°F Agitated 15% Solution
15 Panels t 20% Solution Used Aqueous Cleaner
(Brulin) Shop Environment
Tap HjO Rinse
Cleanliness/Contaminants 1. FTIR 2. Inductively Coupled Plasma 3. Microscope
(i) Light Optical (ii) S.E.M.
4. Water Break
Surface Performance 5. Abrasion 6. Corrosion (Salt Fog) 7. Electrochemical
5 Panels: Analyses 1,2,3,4 -
Tap HO Rinse
30 Panels
Alkaline Cleaner (Turco 4215 NC-LT)
10 Minutes
Tap HjO Rinse
►30 Panels Analysis 4
Pickling (50% HN03 + 50% Tap H20 + Small % HF)
9-1/2 Minutes
Tap H20 Rinse
Deoxidize (AMCHEM 7/17 + 10% HN03 + Tap H20)
3 Minutes
Tap HO Rinse
Anodize (Sulfuric Acid) 25 Minutes 18 Volts DC
Tap HO Rinse
Potassium Dichromate Seal
15 Minutes
Tap ILO Rinse 30 Panels: Analyses
->-l,2,3,5,6,7
Figure 5. Procedures followed to evaluate surface performance of anodized aluminum test panels.
20
50 Panels Aluminum Panels
T Soiled & Aged
4fl5 Panels
TCE Vapor Degreaser
Spray Lance 3 Mins Vapor Spray Lance
15 Panels
3 Panels: Analyses 1,2,3
2 Panels: "Analyses 1,2,3
Fresh Aqueous Cleaner (Brulin) Lab Environment
>5 Panels: Analyses 1,2,3,4
5 Panels: Analyses 1,2,3,4-<-
15 Mins 150°F Agitated 15% Solution
15 Panels \ 20% Solution Used Aqueous Cleaner
(Brulin) Shop Environment
Tap HO Rinse
Cleanliness/Contaminants 1. FTIR 2. Inductively Coupled Plasma 3. Microscope
(i) Light Optical (ii) S.E.M.
4. Water Break
Surface Performance 5. Abrasion 6. Corrosion (Salt Fog) 7. Electrochemical
5 Panels: Analyses 1,2,3,4-
T Tap Up Rinse
30 Panels
Alkaline Cleaner (Turco 4215 NC-LT)
10 Minutes
Tap H20 Rinse
»-30 Panels Analysis 4
Pickling (50% HNO3 + 50% Tap H20 + Small % HF)
4-1/2 Minutes
Tap H,0 Rinse
I Deoxidize (AMCHEM 7/17 + 10% HNO3 + Tap H20)
3 Minutes
Tap H20 Rinse
Chemical Conversion Coat (IRIDITE #14-2)
Tap HjO Rinse 30 Panels: Analyses 1,2,3,5,6,7
Figure 6. Procedures followed to evaluate surface performance of chemical conversion-coated aluminum test panels.
21
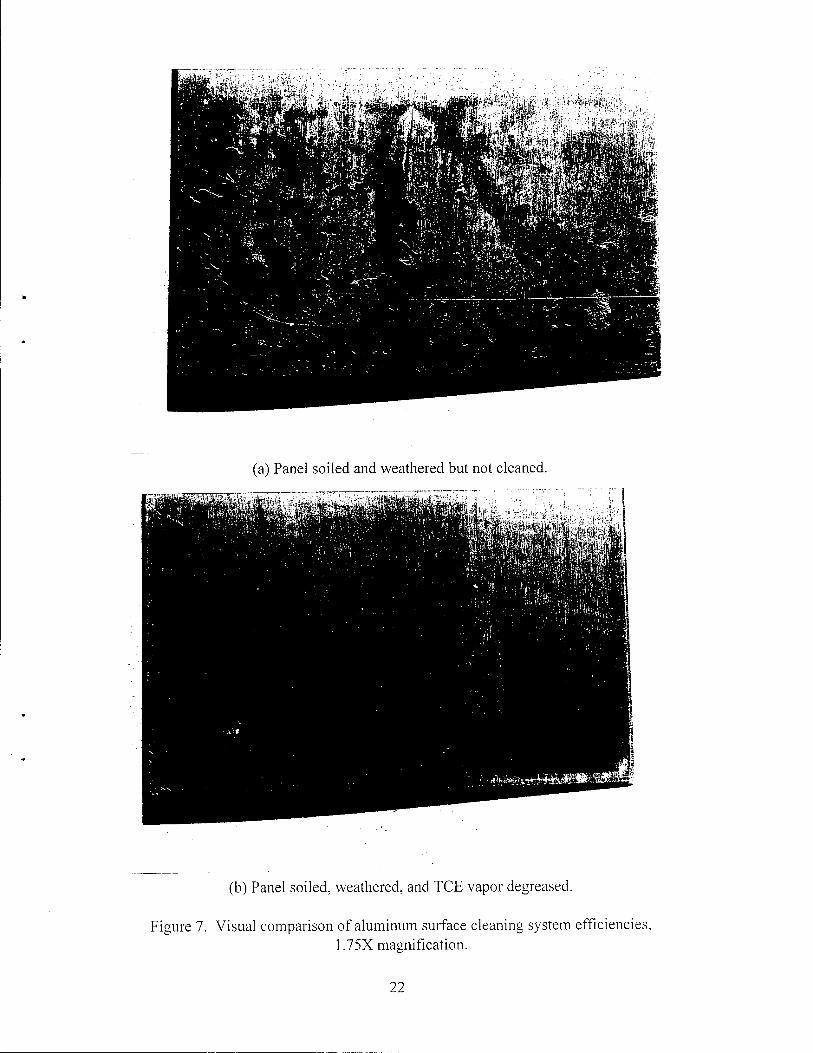
(a) Panel soiled and weathered but not cleaned.
(b) Panel soiled, weathered, and TCE vapor degreased.
Figure 7. Visual comparison of aluminum surface cleaning system efficiencies, 1.75X magnification.
22
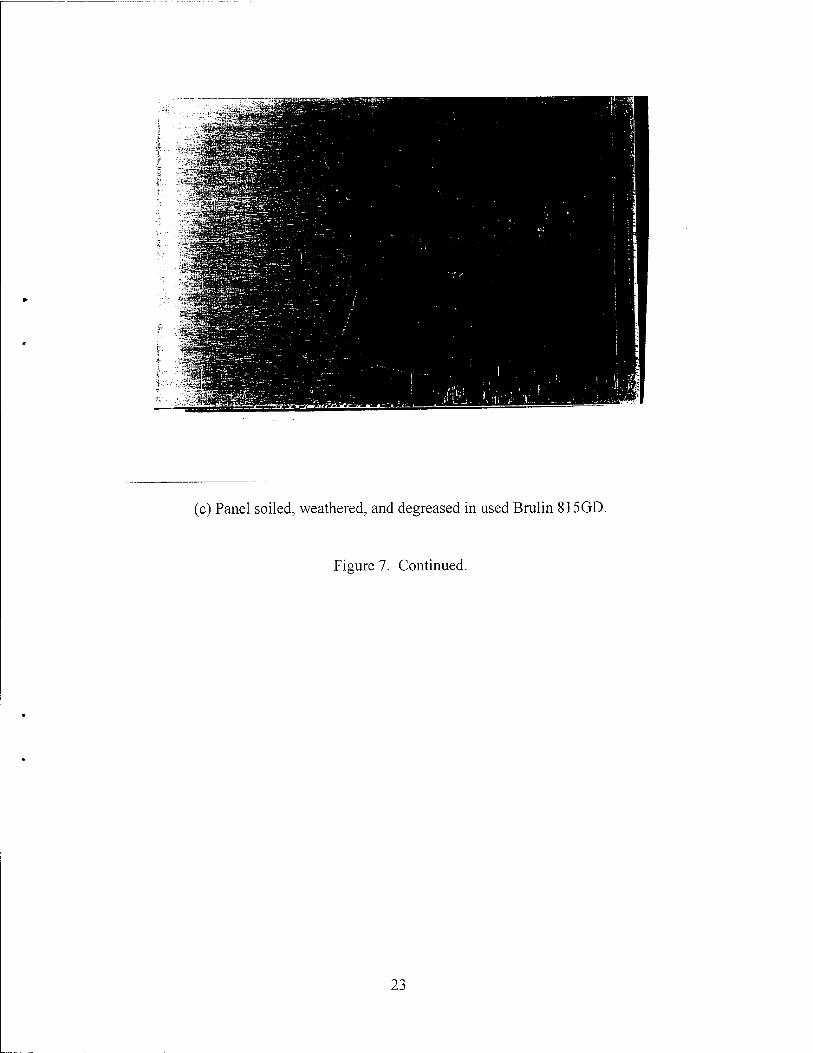
(c) Panel soiled, weathered, and degreased in used Brulin 815GD.
Figure 7. Continued.
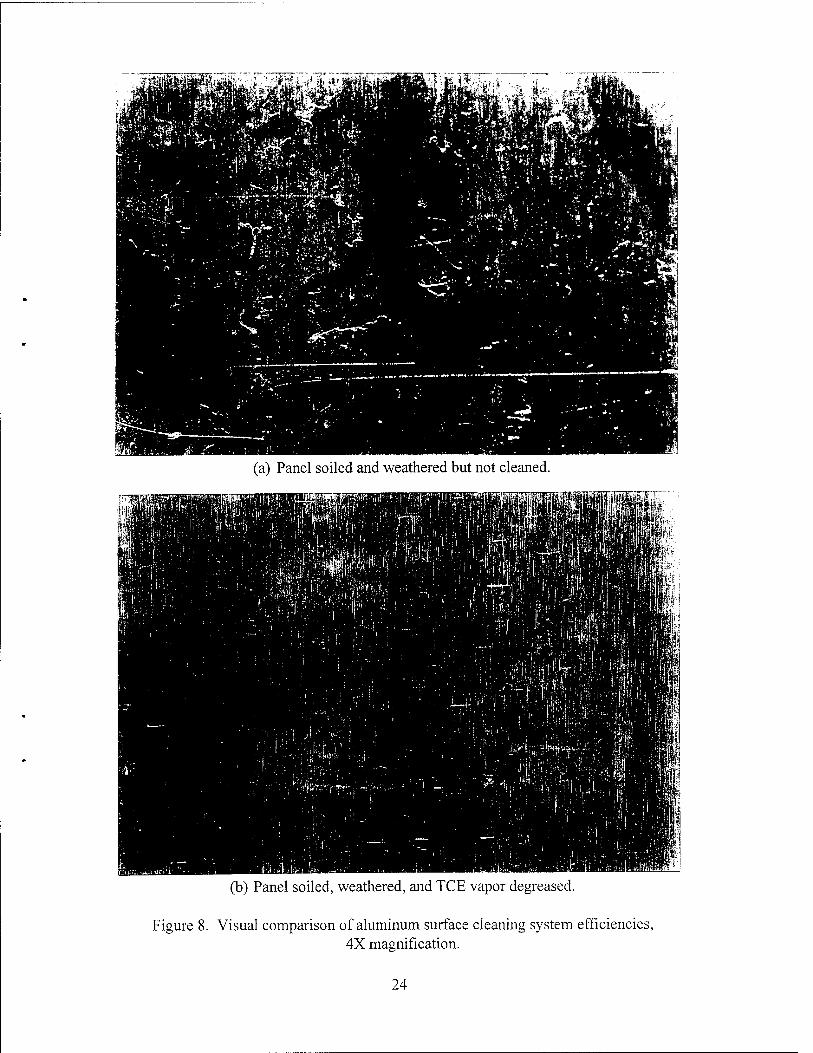
(a) Panel soiled and weathered but not cleaned.
(b) Panel soiled, weathered, and TCE vapor degreased.
Figure 8. Visual comparison of aluminum surface cleaning system efficiencies, 4X magnification.
24
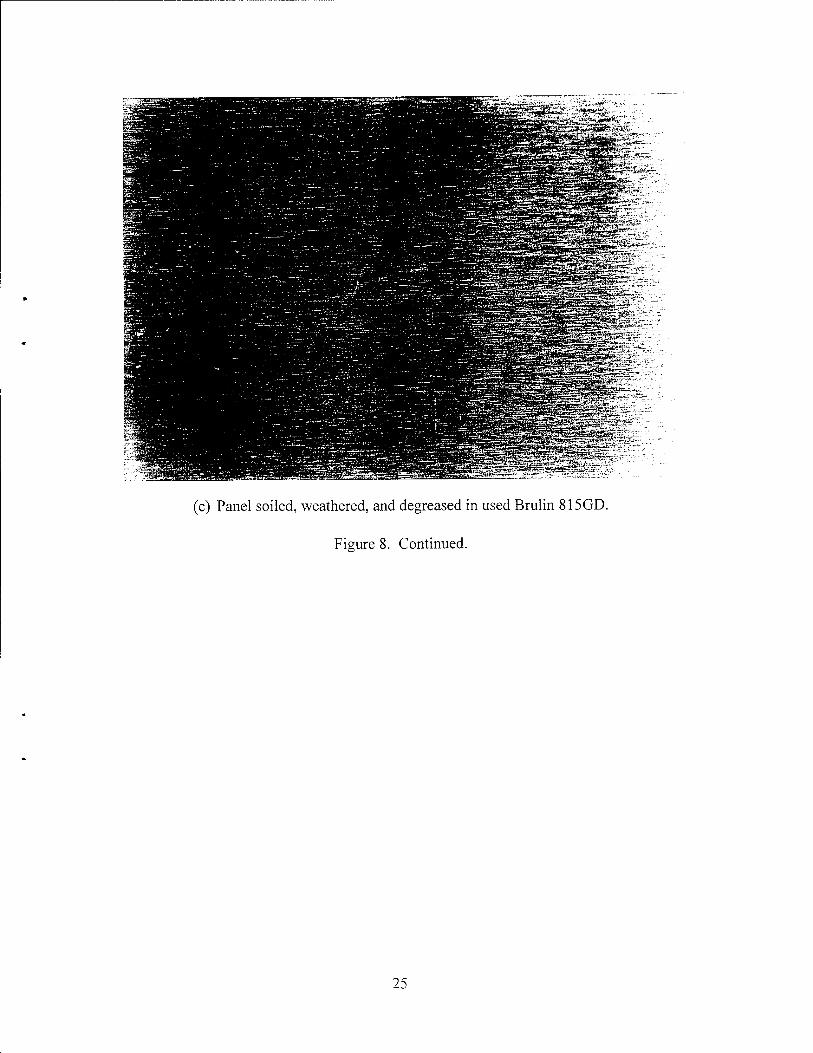
(c) Panel soiled, weathered, and degreased in used Brulin 815GD.
Figure 8. Continued.
25
t—es m
es _es
es *-H
.8 "E,
es es -es £
LD t—t
O
VI es !-H _ es es CM J3 n
B w Zi <U c s CD C8 > O,
es cS CM
_C3 :* O LD es CM >->
O u OH W
es — es
H PL,
es es 0 •** & >> H
ON es a> — es & m 3 to DO
es .es es ca-
fe
26
rst£EXZ£z
mn
! s p-cs
m
i tS !_ IS
is
IS i— (S
IS
CM %
> IS *■
— IS 3= i ^
IS . IS IS
IS . IS m
is . ts IS
T3
TEL
co
o co S-l
« CO
CO
13 c a a, «4-1 o
o u a, CO
H b "eS O
"S. >>
s DO
IS CO CD
IS IS d _o w o
«3- ■
IS CS
tS c O CD
IS
27
I '9t£
e'ezzv
B'832t-
o m
o- 00
o
o 1)
H
u u
Oil
28
Q CE
i o m^
cs
r=3 00 - CS c
Cal CO es o Si 00 cu
IM O
r=3 & . cs m >
u H
CO ca CS (2 CM
CO
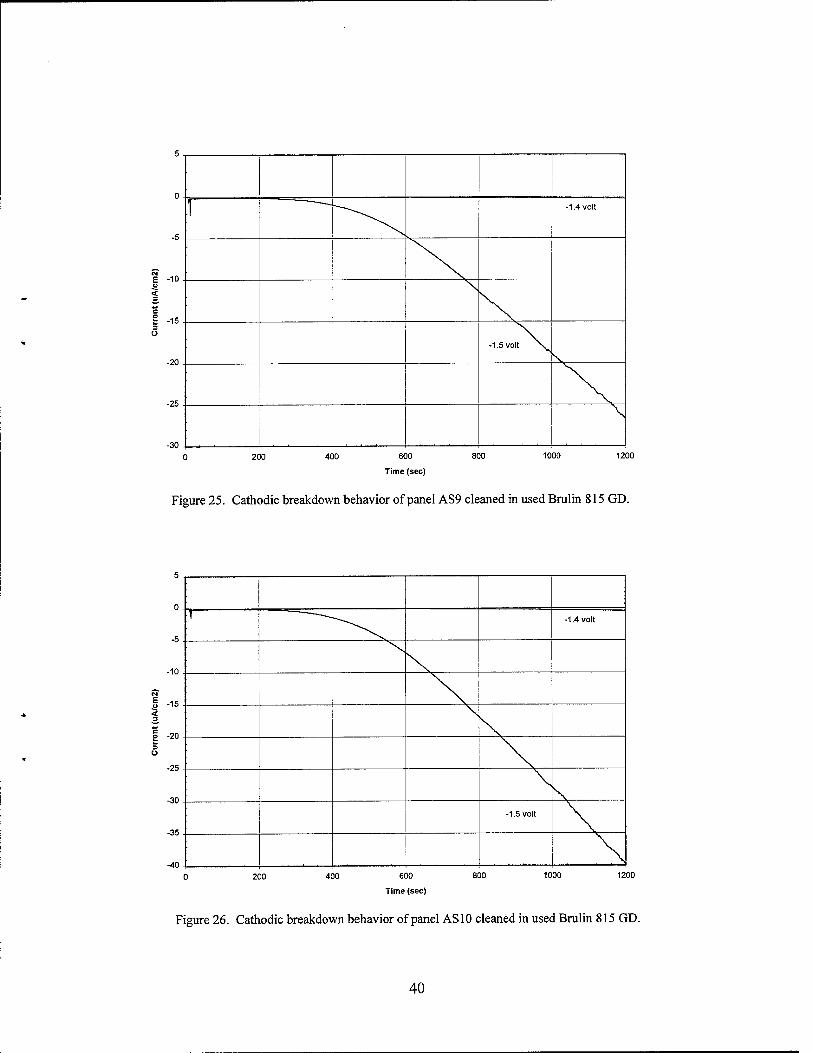
c CCS
-0 DH B 3 c o
CM
re c O r=3 Ä CS
in CM o o a,
CO
ES fc CS C3 fcj o N) • I—I a,
H CN 1-H
CS a> r<s 1-H
in D IO 00
1 CD
1 1 CD
1 1 1 1 CM
1 1 CS
CS cs CS cs cs CS CS CS CS m » * * * • ■ ■ a
CS CS CS CS CS CS CS CS CS
cr -O «9 O *- -o CS c o a>
IS CS CS
HH
29
VVU-
tr'ten- ruu-
9'62^1 *'SZ^T—
6'H6&
O o
CO CZ)
O
£ 3 t->
O <D OH CO
0« h—4
<u 3 op E
s o er .o
(3 C3 C
S ta
30
riZi:
B'tsn-
6'082
9WI-
O CN =tfc
O
CO .£3 s- u <s> <4-C
O 3 g c 3 a> lH > o «5 u
3= a, Xf)
H
CD CD «d- CM
C3 S CS1 C3
CT _a » o (—Q c5 c ü CD
31
VC1L- .'Slfc £'013-
i'1L%\ 6*8Sftfr
IS CD CD ■=*" CM t ■ • ■
C3 S S CS Ü_OCOOS--OC5COCD
IS
IS IS m
is
s
IS . IS LD
is
IS <_ CM 5
E c CD >
■ S^ LO CM
IS .IS IS
is . IS m to
■ IS IS
»a « o CO
U U «4-1 o
O P. CO
I—H
H
3 DO
• PH
32
13 IS LD
IS S3 IS
s is ON LD CM ■«—t
^H
* O
x> 3 •J
IS a s f_ CM Sj
-O ct—c E
c o S
a> 3 > i-c
S Ö O (S^ u LD a, CSJ CO
c* »—H
H fe
\© S IS S 2 fO 3
bo
CO CD =3" CM ■ « • •
S CSt S C3
33
IS
Q O m 00 C
(S - ^H IS 3 ra hd «—i CQ
en
C<-(
J3 CJ -*-^ IS) £ 1—1
CO
fS 4) cs X) Csl I-i es <D
.a <G E c3 3 co
0 > IS
7E CO
IT) ^3 IM o
CO
O
CO Ü
IS 0
IS a. N)
H tu
r=3 0
to >• •
p cs 3 IS 00 s **■*
cr fe
34
si es Q LD Ü
in 1—H 00
e CS 3 IS VJ
IS CQ T3
<D en 3
J3 +J
IS IS is IX) (50 v-H c
en C3 (U S-c Qfl <U
IS T3
IS c. CM a
0)
CS .0 £ en 3 U c C 0 CS > D,
T3 U5 CD CM
O m
tM O «J i->
■*-»
IS O IS <U ts O, trt en
0* *—H H tu i—1
S3 IS O IS in a, to >>
H od *—<
<L> IS IS 3
öD
fa
35
a-^ V09&-
fSZlV
cs
. cs
Q O in »>—H
oo CS C
3 CN £ ffl
e 3
4M O
c £ o 3 > s-
CS Ö 13 3= 1> m o« CN w
OS *—< H tL,
Os cs T-H
(3 IS) M to 3
00
r\ CD m «a- NO CM
H CS CS CS CS (SI d_QWO»-_OCSCÜ(D
CS
es cs
m fO
IS cs cs <3"
b
36
■ ^t-,.-Ä'.T3Sip».A:;.-ü
(a) Top side of panel.
J i^Sävr>Si.'i
J
i'i'';:
4«.
J-, rrfti^rfteSgiiZAT*' ''■
(b) Bottom side of panel.
Figure 20. Stress corrosion cracks around ID stamp of conversion-coated panels exposed to 4 weeks of salt fog.
37
b
0 . -1.4 volt
-10
-15 .
E Ü < c £ 3 Ü
-1.5 volt
-35.
200 400 600
Time (sec)
800 1000 1200
Figure 21. Cathodic breakdown behavior of vapor-degreased panel VS8.
e -io
E -15 3 Ü
-20
-25
-30
■
'i -1.4 volt
■
-1.5 volt
■
200 400 600
Time (sec)
800 1000
Figure 22. Cathodic breakdown behavior of vapor-degreased panel VS9.
38
S -20
-25
-30
-40
f -1.4 volt
-1.5 volt \
200 400 600
Time (sec)
800 1000 1200
Figure 23. Cathodic breakdown behavior of panel AL9 cleaned in fresh Brulin 815 GD.
-15
S -20
-25
-30
-35
I -1.4 volt
■
:
-1.5 volt
400 600
Time (sec)
800
Figure 24. Cathodic breakdown behavior of panel AL10 cleaned in fresh Brulin 815 GD.
39
£ -10
E -15 3 o
-20
-25
I -1.4 volt
-1.5 volt Nv
■
200 600
Time (sec)
1000 1200
Figure 25. Cathodic breakdown behavior of panel AS9 cleaned in used Brulin 815 GD.
5 -20
-25
-30
:
T -1.4 volt
-1.5 volt
200 400 600
Time (sec)
800 1000
Figure 26. Cathodic breakdown behavior of panel AS10 cleaned in used Brulin 815 GD.
40
Appendix A
PROCEDURES FOR CLEANING, ANODIZING, AND CHEMICAL CONVERSION COATING OF ALUMINUM PANELS
by
G.D. Anguiano
The steps followed to prepare, clean, and finish the surfaces of the aluminum test panels are listed below. Material Safety Data Sheets of the chemicals used in this study are provided as Appendix D. Both the cleaning and surface finishing were done at McDonnell-Douglas Aerospace, St. Louis, Missouri.
1. Fifty test panels each at 4.5 by 10 by 0.032 inches and another fifty test panels at 3 by 10 by 0.032 inches were cut from a 30 tf section of 7075-T6, 0.032-inch-thick aluminum sheet.
2. The fifty 4.5- by 10-inch test panels were marked for identification as follows: fifteen with ALI through AL15, fifteen with AS1 through AS15, fifteen with VS1 through VS15, and five with no ID markings. The ID mark was stamped on the top edge (4.5-inch dimension) with steel dies. Figure A-l is a closeup of the panels showing the ID marking.
3. The fifty 3- by 10-inch test panels were marked in the same manner: fifteen with ALI through AL15, fifteen with AS1 through AS15, fifteen with VS1 through VS15, and five with no ID markings. The ID mark was also located on the top edge (3-inch dimension).
4. One hundred nylon clean room bags were acquired, each bag just large enough to hold a single test panel.
5. Three 3- by 10-inch and three 4.5- by 10-inch test panels, with no ID markings, were put in clean bags, one test panel per bag, and saved for future analyses.
6. Four lubricants were acquired to use as contaminants:
(a) 1 quart of Safety Draw 700, an aluminum stretch-forming lubricant
(b) 1 quart of Cimflo #20, also an aluminum stretch-forming lubricant
(c) 1 quart of Titanlube No. 1129, a titanium tube-bending lubricant but a common contaminant of aluminum parts
(d) 1 quart of CRC Soft Seal, a mold-release agent
A-l
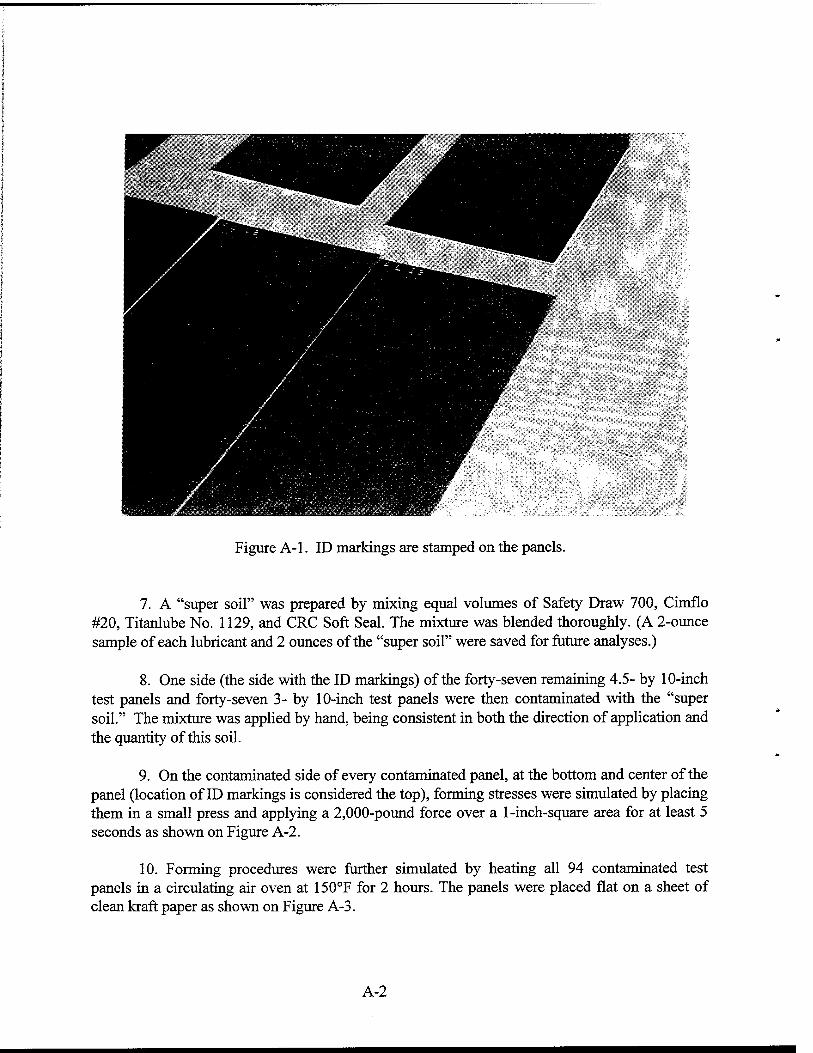
Figure A-l. ID markings are stamped on the panels.
7. A "super soil" was prepared by mixing equal volumes of Safety Draw 700, Cimflo #20, Titanlube No. 1129, and CRC Soft Seal. The mixture was blended thoroughly. (A 2-ounce sample of each lubricant and 2 ounces of the "super soil" were saved for future analyses.)
8. One side (the side with the ID markings) of the forty-seven remaining 4.5- by 10-inch test panels and forty-seven 3- by 10-inch test panels were then contaminated with the "super soil." The mixture was applied by hand, being consistent in both the direction of application and the quantity of this soil.
9. On the contaminated side of every contaminated panel, at the bottom and center of the panel (location of ID markings is considered the top), forming stresses were simulated by placing them in a small press and applying a 2,000-pound force over a 1-inch-square area for at least 5 seconds as shown on Figure A-2.
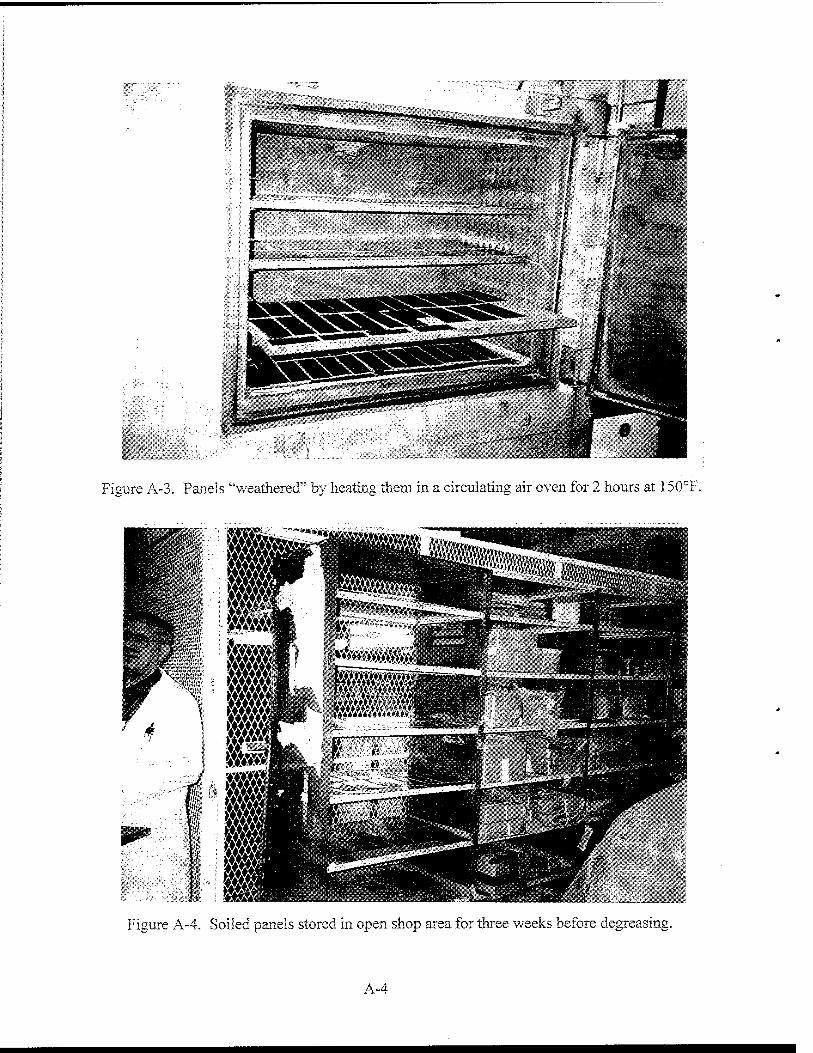
10. Forming procedures were further simulated by heating all 94 contaminated test panels in a circulating air oven at 150°F for 2 hours. The panels were placed flat on a sheet of clean kraft paper as shown on Figure A-3.
A-2
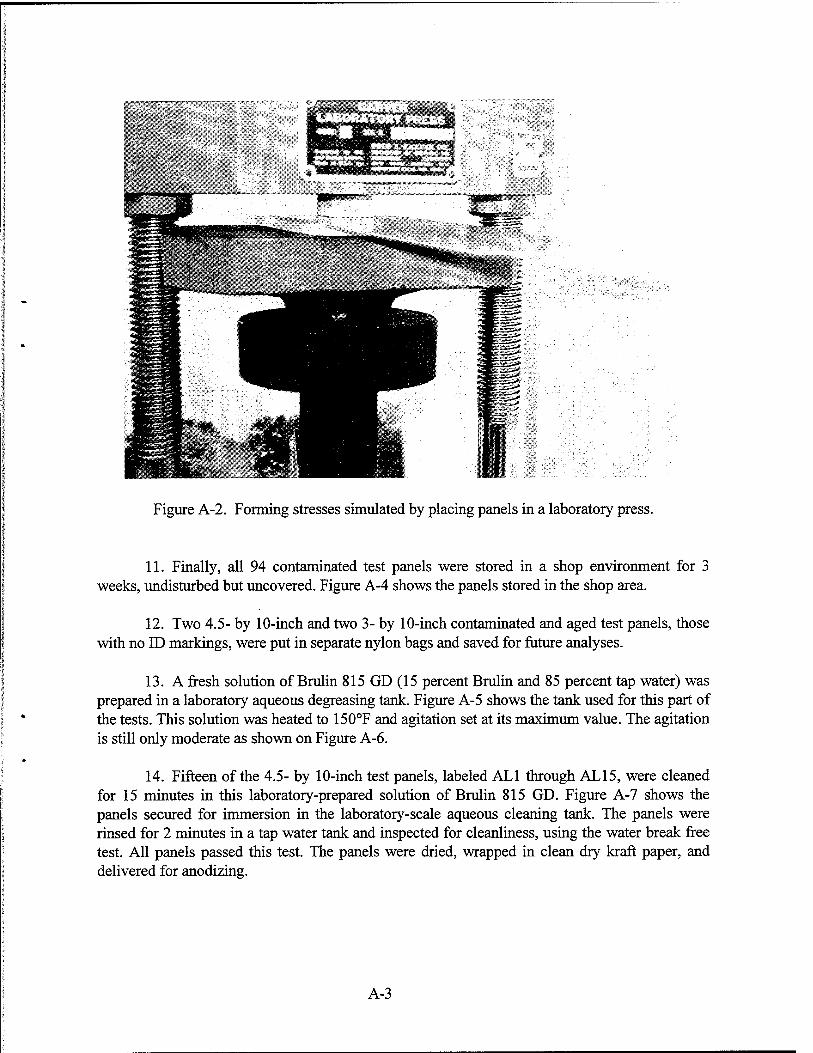
Figure A-2. Forming stresses simulated by placing panels in a laboratory press.
11. Finally, all 94 contaminated test panels were stored in a shop environment for 3 weeks, undisturbed but uncovered. Figure A-4 shows the panels stored in the shop area.
12. Two 4.5- by 10-inch and two 3- by 10-inch contaminated and aged test panels, those with no ID markings, were put in separate nylon bags and saved for future analyses.
13. A fresh solution of Brulin 815 GD (15 percent Brulin and 85 percent tap water) was prepared in a laboratory aqueous degreasing tank. Figure A-5 shows the tank used for this part of the tests. This solution was heated to 150°F and agitation set at its maximum value. The agitation is still only moderate as shown on Figure A-6.
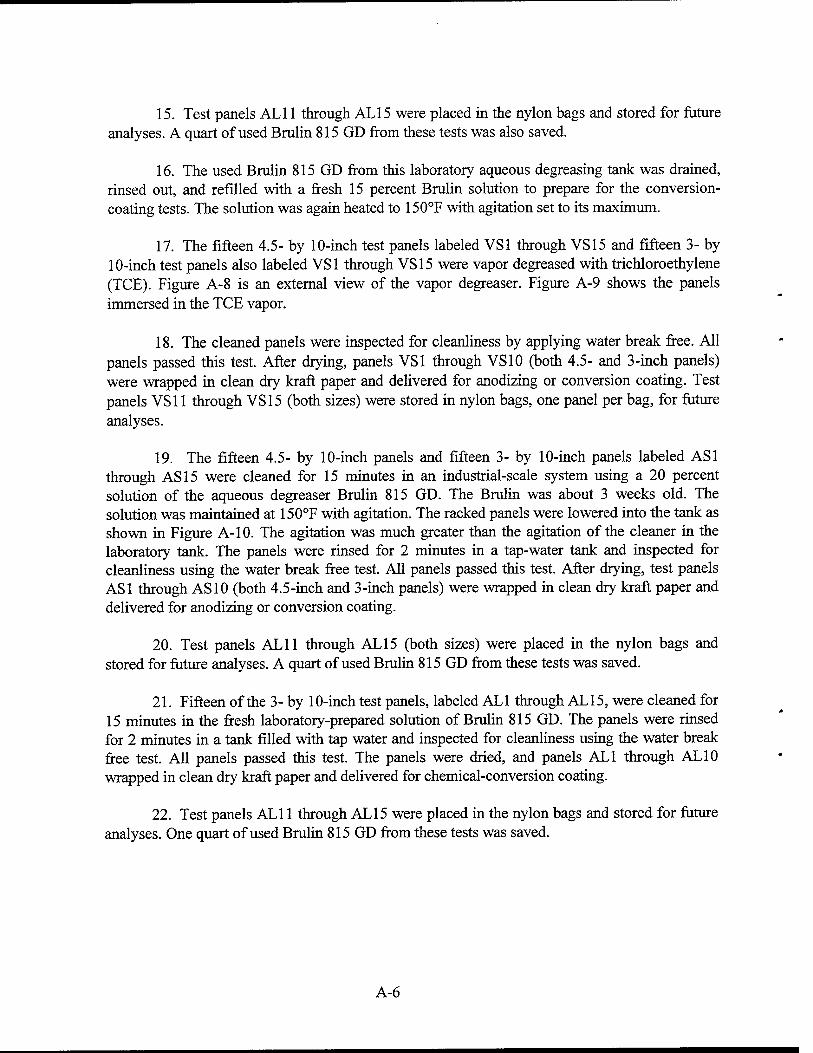
14. Fifteen of the 4.5- by 10-inch test panels, labeled ALI through AL15, were cleaned for 15 minutes in this laboratory-prepared solution of Brulin 815 GD. Figure A-7 shows the panels secured for immersion in the laboratory-scale aqueous cleaning tank. The panels were rinsed for 2 minutes in a tap water tank and inspected for cleanliness, using the water break free test. All panels passed this test. The panels were dried, wrapped in clean dry kraft paper, and delivered for anodizing.
A-3
Fieure A-3. Panels "weathered" by heating them In a circulating air oven for 2 hours at 150°F.
IP MM wM ♦VAVr WWW www Jwwf
Figure A-4. Soiled panels stored in open shop area for three weeks before degreasing.
A-4
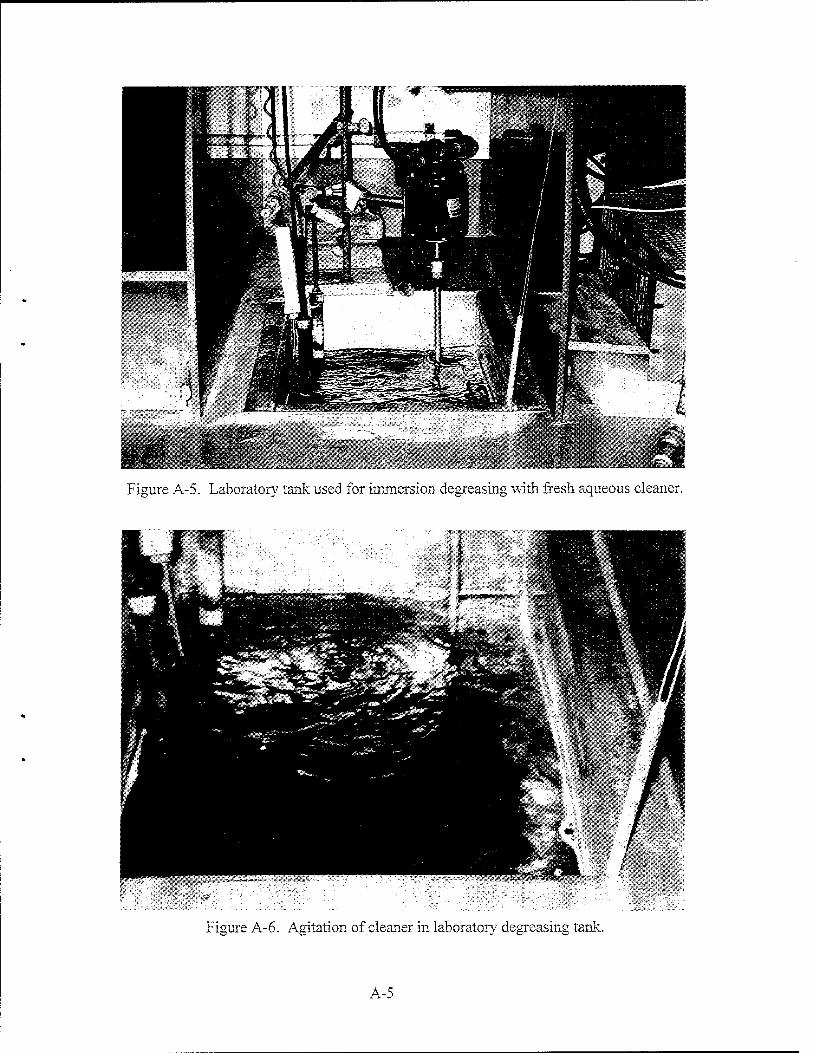
Figure A-5. Laboratory tank used for immersion degreasing with fresh aqueous cleaner.
Figure A-6. Agitation of cleaner in laboratory degreasing tank.
A-5
15. Test panels ALI 1 through AL15 were placed in the nylon bags and stored for future analyses. A quart of used Brulin 815 GD from these tests was also saved.
16. The used Brulin 815 GD from this laboratory aqueous degreasing tank was drained, rinsed out, and refilled with a fresh 15 percent Brulin solution to prepare for the conversion- coating tests. The solution was again heated to 150°F with agitation set to its maximum.
17. The fifteen 4.5- by 10-inch test panels labeled VS1 through VS15 and fifteen 3- by 10-inch test panels also labeled VS1 through VS15 were vapor degreased with trichloroethylene (TCE). Figure A-8 is an external view of the vapor degreaser. Figure A-9 shows the panels immersed in the TCE vapor.
18. The cleaned panels were inspected for cleanliness by applying water break free. All panels passed this test. After drying, panels VS1 through VS10 (both 4.5- and 3-inch panels) were wrapped in clean dry kraft paper and delivered for anodizing or conversion coating. Test panels VS11 through VS15 (both sizes) were stored in nylon bags, one panel per bag, for future analyses.
19. The fifteen 4.5- by 10-inch panels and fifteen 3- by 10-inch panels labeled AS1 through AS 15 were cleaned for 15 minutes in an industrial-scale system using a 20 percent solution of the aqueous degreaser Brulin 815 GD. The Brulin was about 3 weeks old. The solution was maintained at 150°F with agitation. The racked panels were lowered into the tank as shown in Figure A-10. The agitation was much greater than the agitation of the cleaner in the laboratory tank. The panels were rinsed for 2 minutes in a tap-water tank and inspected for cleanliness using the water break free test. All panels passed this test. After drying, test panels AS1 through AS 10 (both 4.5-inch and 3-inch panels) were wrapped in clean dry kraft paper and delivered for anodizing or conversion coating.
20. Test panels ALU through AL15 (both sizes) were placed in the nylon bags and stored for future analyses. A quart of used Brulin 815 GD from these tests was saved.
21. Fifteen of the 3- by 10-inch test panels, labeled ALI through AL 15, were cleaned for 15 minutes in the fresh laboratory-prepared solution of Brulin 815 GD. The panels were rinsed for 2 minutes in a tank filled with tap water and inspected for cleanliness using the water break free test. All panels passed this test. The panels were dried, and panels ALI through AL 10 wrapped in clean dry kraft paper and delivered for chemical-conversion coating.
22. Test panels ALI 1 through AL15 were placed in the nylon bags and stored for future analyses. One quart of used Brulin 815 GD from these tests was saved.
A-6
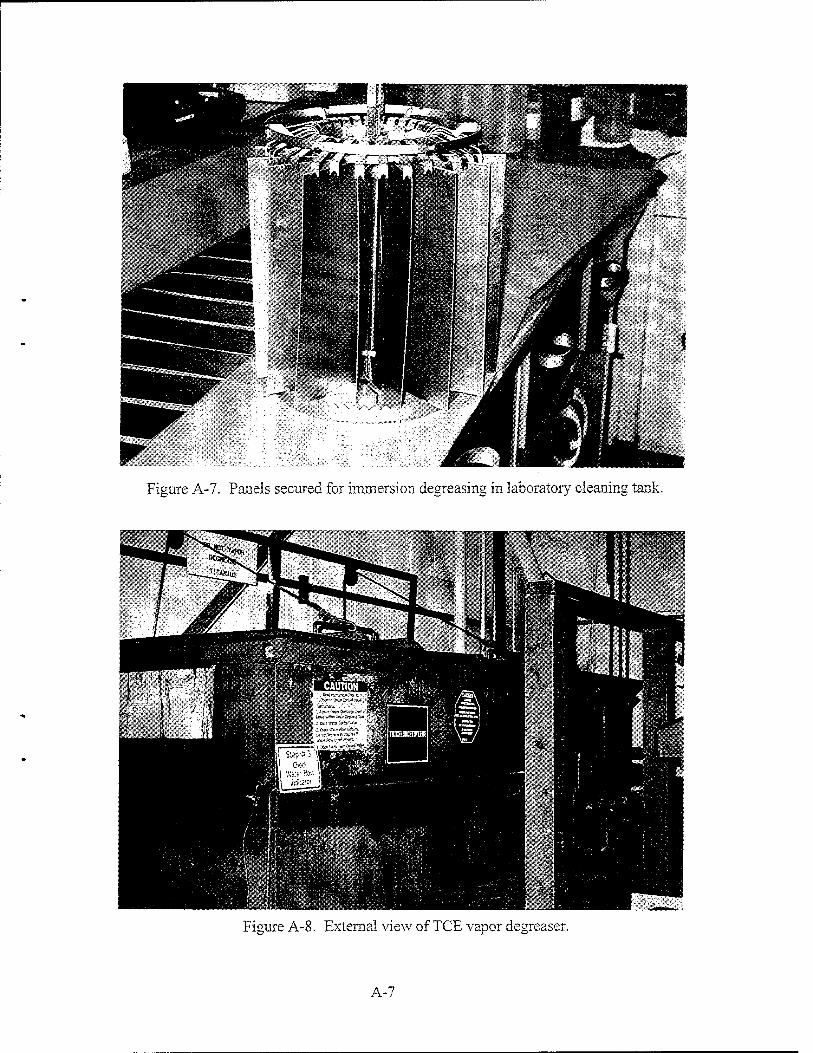
Figure A-7. Panels secured for immersion degreasing in laboratory cleaning tank.
Figure A-8. External view of TCE vapor degreaser.
A-7
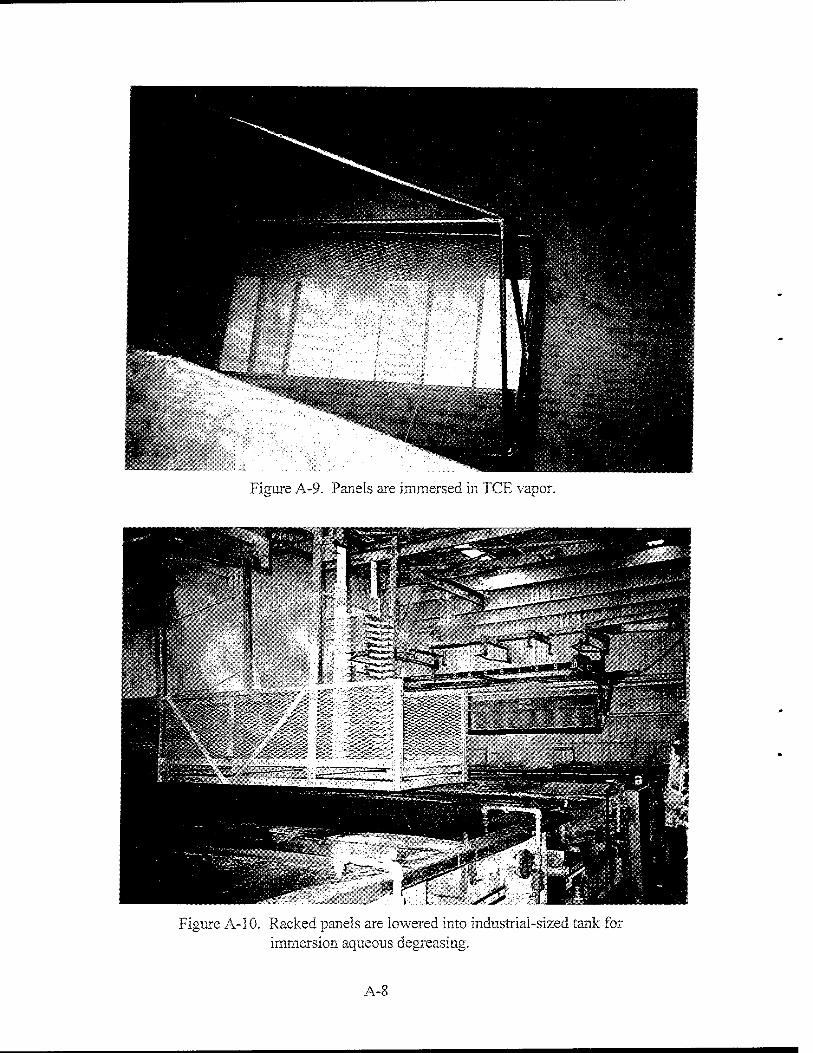
Figure A-9. Panels are immersed in TCE vapor.
Figure A-10. Racked panels are lowered into industrial-sized tank for immersion aqueous degreasing.
A-
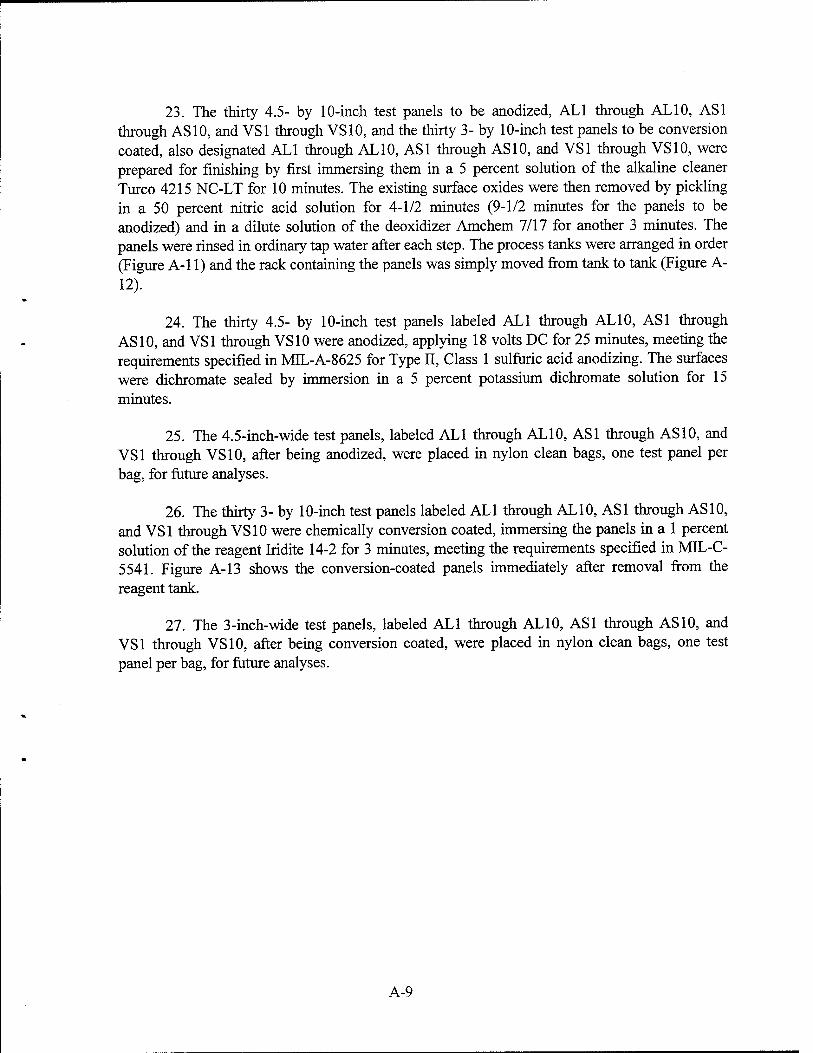
23. The thirty 4.5- by 10-inch test panels to be anodized, ALI through AL 10, AS1 through AS 10, and VS1 through VS10, and the thirty 3- by 10-inch test panels to be conversion coated, also designated ALI through AL10, AS1 through AS10, and VS1 through VS10, were prepared for finishing by first immersing them in a 5 percent solution of the alkaline cleaner Turco 4215 NC-LT for 10 minutes. The existing surface oxides were then removed by pickling in a 50 percent nitric acid solution for 4-1/2 minutes (9-1/2 minutes for the panels to be anodized) and in a dilute solution of the deoxidizer Amchem 7/17 for another 3 minutes. The panels were rinsed in ordinary tap water after each step. The process tanks were arranged in order (Figure A-l 1) and the rack containing the panels was simply moved from tank to tank (Figure A- 12).
24. The thirty 4.5- by 10-inch test panels labeled ALI through AL10, AS1 through AS 10, and VS1 through VS10 were anodized, applying 18 volts DC for 25 minutes, meeting the requirements specified in MIL-A-8625 for Type II, Class 1 sulfuric acid anodizing. The surfaces were dichromate sealed by immersion in a 5 percent potassium dichromate solution for 15 minutes.
25. The 4.5-inch-wide test panels, labeled ALI through AL10, AS1 through AS10, and VS1 through VS10, after being anodized, were placed in nylon clean bags, one test panel per bag, for future analyses.
26. The thirty 3- by 10-inch test panels labeled ALI through AL10, AS1 through AS10, and VS1 through VS10 were chemically conversion coated, immersing the panels in a 1 percent solution of the reagent Indite 14-2 for 3 minutes, meeting the requirements specified in MIL-C- 5541. Figure A-13 shows the conversion-coated panels immediately after removal from the reagent tank.
27. The 3-inch-wide test panels, labeled ALI through AL10, AS1 through AS10, and VS1 through VS10, after being conversion coated, were placed in nylon clean bags, one test panel per bag, for future analyses.
A-9
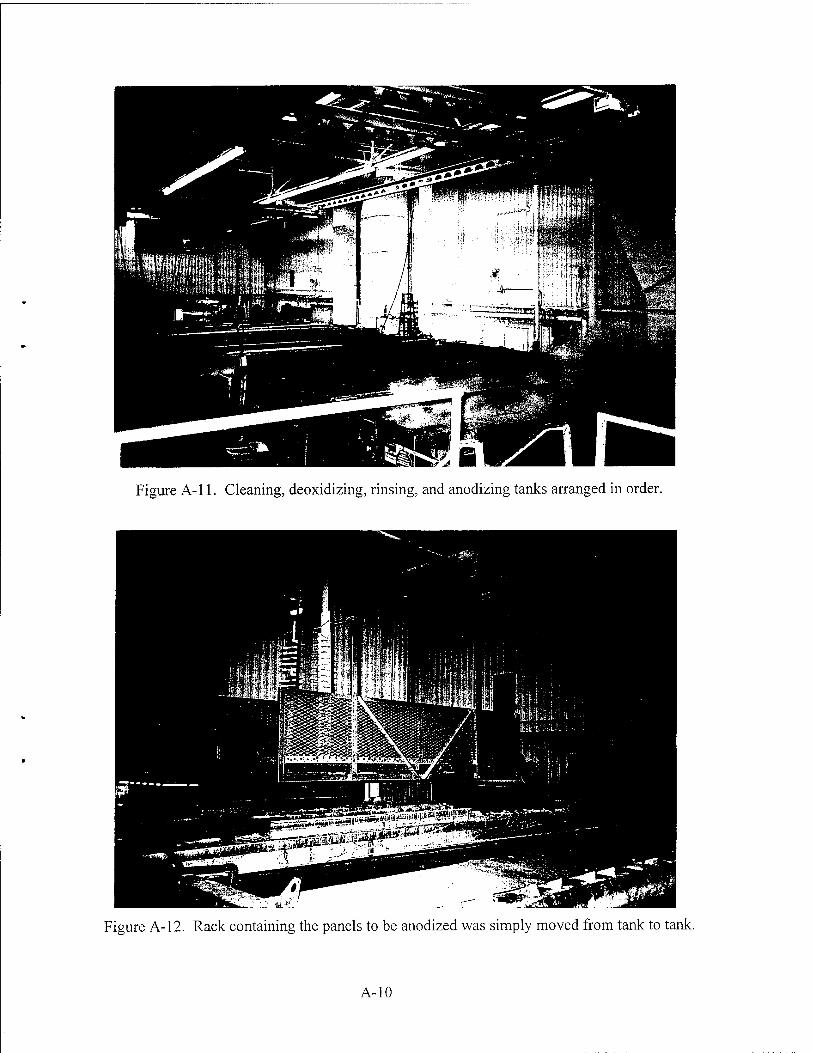
Figure A-l 1. Cleaning, deoxidizing, rinsing, and anodizing tanks arranged in order.
Figure A-12. Rack containing the panels to be anodized was simply moved from tank to tank.
A-10
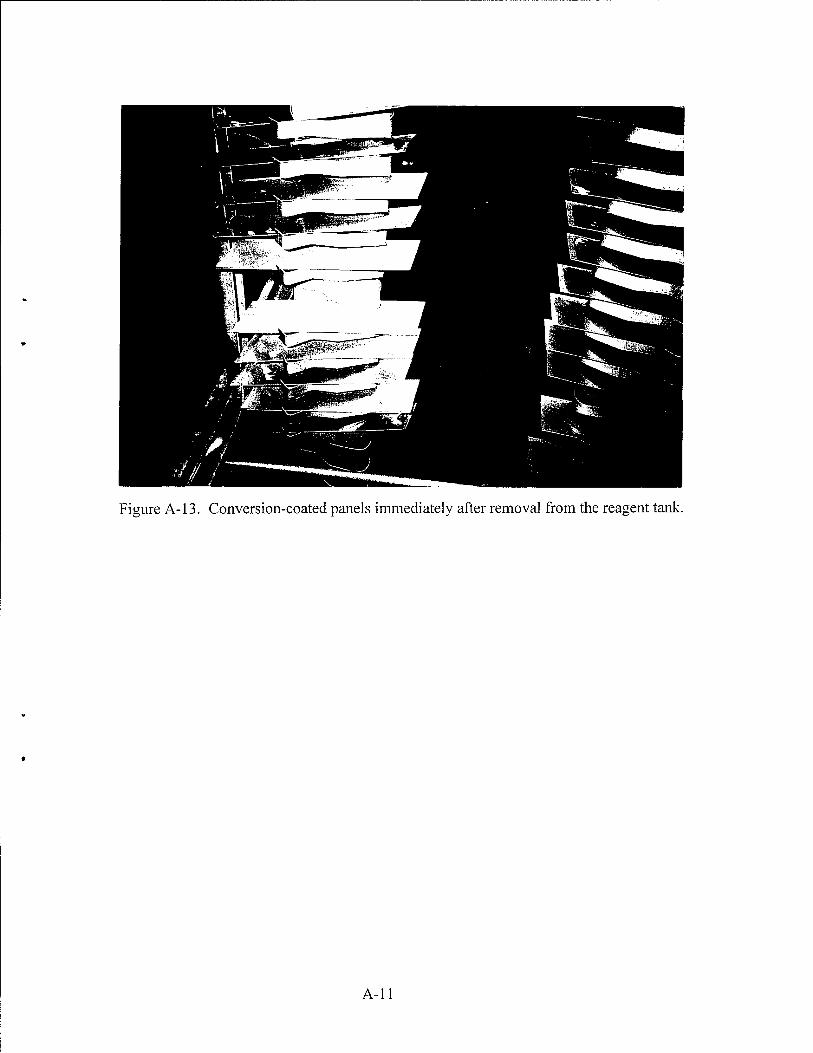
Figure A-13. Conversion-coated panels immediately after removal from the reagent tank.
A-ll
Appendix B
ANALYSIS OF PANEL SURFACE CLEANLINESS
by
Theresa A. Hoffard
FTIR ANALYSIS
FTIR Theory
Fourier transform infrared spectroscopy (FTIR) is an analytical method that uses infrared radiation to characterize and quantify organic (and some inorganic) materials. The infrared portion of the electromagnetic spectrum covers a wavelength range of 0.75 to 1,000 micrometers. The mid-infrared region of 2.5 to 25 micrometers, or wave numbers of 4,000 to 400 cm"1, is the most useful region for IR analytical spectroscopy. Wave numbers (cm"1) are proportional to frequency and are calculated as inverse wavelengths.
At the molecular level, an organic substance absorbs infrared energy and undergoes vibrations at discrete frequencies according to its unique chemical makeup. A graph of the energy absorbed (absorbency) versus the infrared frequency (wave numbers) is the absorption "spectrum" of that material. Different chemical functional groups produce unique absorption patterns so that, for a pure compound, the spectrum becomes a "fingerprint" for identification. For unknown materials or mixtures such as paints, a spectrum may classify the material as being from a particular chemical family, e.g., urethane versus epoxy for a paint material. However, it might not provide enough information to identify the pure components.
In the FTIR spectrophotometer, a material is placed in a sample compartment of the instrument. It is hit with a beam of infrared energy, usually covering the mid-infrared frequency range. For gases and transparent or translucent liquids and solids, the beam passes through the sample, is attenuated by sample absorption, then travels to the detector. For opaque solids, the beam is reflected off the sample and guided to the detector with a series of mirrors (and sometimes with special refractive crystals). Diffuse reflectance is an FTIR sampling method for solid or semisolid materials that uses mirrors.
A device inside the instrument called a Michelson interferometer uses a "beamsplitter" and both a fixed and a moving mirror to "modulate" the infrared beam. The infrared beam is "split" by the beamsplitter into two beams, one to the fixed mirror, and one to the moving mirror. The two beams are reflected back from the mirrors to the beamsplitter where they recombine constructively or destructively, depending on the position of the moving mirror. The optical path difference between the beam coming from the fixed mirror and the beam coming from the moving mirror is called "retardation." The modulated beam then travels to the sample compartment and on to the detector. At the detector, the raw electrical signal is called an interferogram.
FTIR employs a Class II He Ne (helium neon) laser. The laser is not the source of the infrared radiation. Rather, it generates a reference signal for the computer: measuring the
B-l
retardation of the recombined infrared beam and acting as an internal clock. This clock allows the FTIR computer to convert the interferogram signal at the detector into an absorption spectrum. The computer uses a set of mathematical operations for this, primarily the Fourier transform.
FTIR Analysis Techniques
The following FTIR analysis techniques were considered during the project:
1. EPA Method 413.2 for analysis of the Brulin cleaning solutions -
Several solutions of Brulin 815 GD used to clean the panels were received for analysis. They were to be analyzed according to EPA method 413.2, a method using Freon-113 (1,1,2- trichloro-l,2,2-trifluoroethane) to extract oil and grease from aqueous solutions for analysis by FTIR. The FTIR instrument scans for hydrocarbons (indicating presence of grease or related materials) in the extract. The method was attempted but abandoned due to the following:
(a) Supersoil is not completely soluble in Freon-113, and so the extraction efficiency is questionable. (Solubility of Supersoil was tested in several solvents including Freon-113.)
(b) The Brulin is a detergent and its components are designed to be compatible both with water and organic materials. The Brulin itself appeared to be partially extracting into the Freon. (An extract from fresh Brulin was found to contain hydrocarbons even in the absence of Supersoil contaminant.)
(c) The manufacturer has designed Brulin in such a way that many oils and greases will not dissolve in the Brulin, but instead rise to the top of the solution where they can be skimmed. Visible small lumps of Supersoil material were clinging to the upper walls of the plastic sampling containers of used Brulin, meaning the soil is not miscible with the Brulin.
2. FTIR solvent analysis of test panel contaminants by Soxhlet extraction or solvent- wipe -
Contaminants on the test panels were to be extracted into solvent and analyzed by FTIR, utilizing portions of EPA Methods 413.2, and 3540B Soxhlet Extraction. This procedure was not attempted due to the following:
(a) Solubility tests on Supersoil show it is not soluble in the solvents used to extract the material from test panel samples.
(b) The amount of contaminant left on the cleaned test panels was so small that a prohibitively large sample of the panel would be needed to extract a sufficient quantity of contaminant for analysis.
B-2
3. Diffuse reflectance FTIR on the test panels -
Panel analysis was successfully accomplished by direct analysis of the metal panels using FTIR reflectance spectroscopy. Metal discs cut from panels were analyzed in a diffuse reflectance sampling device (nondestructive test). The results, although not strictly quantitative, do show an overall trend in the degree of panel soiling.
Reference Supersoil components were placed on metal discs (volatiles allowed to evaporate) and analyzed in the same manner as the test panels. The Brulin solutions were run by gently drying samples in an oven to remove water, placing the remaining residue on metal discs, and analyzing as above.
Results of FTIR Analyses
Table B-l presents the tabular data for each panel tested plus comments on the data. Circular (0.5-inch-diameter) samples numbered 1 to 56 were cut from the aluminum test
panels. The samples were analyzed by FTIR (Fourier transform infrared spectroscopy) using a Biorad FTS-60 and a diffuse-reflectance sampling device. A cleaned 0.5-inch circular disc (from an unsoiled panel) was used as the background to subtract any peaks intrinsic to the panels themselves. The origin of the samples (i.e., which samples were from which panels) was not revealed to the analyst until after the samples had been run and the spectra (output data) analyzed. The results are as follows (see the accompanying chart):
1. Samples 1 through 8 were taken from the as-received panels (not soiled, cleaned, anodized, or coated). What peaks did show up in the FTIR spectra are very weak but are consistently located at approximately 2,920 and 2,850 cm"1 (CH2 hydrocarbon peaks) and at 1,592, 1,378, and 948 cm"1. Samples 2, 7, and 8 did not have visible hydrocarbon peaks. This indicates that there is some kind of hydrocarbon contaminant on most of the as-received panels. However, the spectral peaks are too weak to allow the contaminant to be classified or identified. Hydrocarbon peaks appear from 3,000 to 2,800 cm'1 in the spectra of many thousands of different organic materials.
2. Samples 9 through 20 were taken from the soiled panels (not cleaned, anodized, or coated). These samples were purposely soiled with Supersoil, a blend of four metal- lubricating compounds. All of the FTIR spectra for samples 9 through 20 match the spectrum of the Supersoil blend itself. No trend is evident between the samples with the soil pressed onto the panels and those samples with impressed soil.
3. Samples 21 through 32 were taken from panels that were soiled with Supersoil, then cleaned using a vapor degreasing method. The FTIR spectra peaks are very weak. However, several peaks match those of the as-received panels - 2,920, 2,850, 1,590, and 944, indicating that the original contamination present on the panels was not successfully removed. The hydrocarbon peaks are stronger (related to the presence of more hydrocarbon) in the spectra of samples 21 through 32, and a peak at
B-3
approximately 1,450 appears for most of the samples. These observations indicate that components of Supersoil may be left on the surfaces of these panels. No trend is evident between the panel samples with pressed soil versus those with impressed soil.
4. Samples 33 through 44 were taken from panels that were soiled with Supersoil, then cleaned using fresh Brulin 815 GD, an aqueous cleaner. What peaks can be seen are extremely weak and are questionable (at noise level). Hydrocarbon peaks at the typical locations are not visible and the only other peak-like absorbencies are at approximately 1,595 and 945. The spectra of samples 33 through 44 are the cleanest (least number of peaks) of all the spectra analyzed. No trend is evident between the panel samples with pressed soil versus those with impressed soil.
5. Samples 45 through 56 were taken from panels that were soiled with Supersoil then cleaned with used Brulin. According to the samples' FTIR spectra, the samples are soiled with some unknown contaminant (although hydrocarbon peaks are not visible). The combination of peaks at approximately 1,350, 1,203, 1,170, 1,111, and 1,088 do not completely correlate with the spectra of Supersoil components or the spectrum of fresh Brulin. Samples 47, 48, and 49 do not show 1,203 to 1,088 peaks. The peaks are too weak to definitively classify or identify. No trend is evident between the panel samples with pressed soil versus those with impressed soil.
6. FTIR was run on fresh Brulin, as well as used Brulin solutions received from the tanks where the panels were washed. The individual spectra of the used versus fresh Brulin appear the same. A computer subtraction of the fresh Brulin spectrum from the used Brulin spectrum was performed. Several small unique peaks in the subtracted Brulin spectrum are visible, but do not completely correlate to the spectra peaks of panel samples 45 through 56.
Conclusions
As expected, the panels soiled with Supersoil, but not cleaned or finished, all produced strong FTIR spectra matching the spectrum of the reference sample of Supersoil.
The as-received panels represent the test panels before any intentional soiling, cleaning, or finishing was performed. The FTIR data indicate that there is a small amount of contamination on the surfaces of these panels. The as-received panels were stored in individual plastic bags upon arrival at NFESC and were not handled with bare hands or exposed to other atmospheric contaminants. Thus, the contamination occurred before arrival at NFESC. The contaminants could be a number of things: fingerprints, dust from the atmosphere, residue from the cutting process, etc.
The FTIR data for the vapor-degreased panels showed the most contamination of any of the panels tested. There is clearly and visibly contamination on the surfaces of these panels beyond the as-received contaminants. The trichloroethylene (TCE) vapor degreaser appears NOT to have performed as well as the aqueous Brulin cleaner to remove the Supersoil. Although not definitive, the location of the hydrocarbon peaks in the FTIR data suggests that of the four
B-4
components making up the Supersoil, the Safety Draw and/or Soft Seal components are the most likely to be left behind on the panel surfaces.
The FTIR data for the panels cleaned with fresh Brulin show very little or no contamination. The fresh Brulin appears to have cleaned the panels more thoroughly than either the TCE degreaser or the used Brulin.
The FTIR data for the panels cleaned with used Brulin show some slight contamination which appears to be different than as-received contamination. The used Brulin may have carried contamination from its previous use and imparted it to the test panel surfaces, or an unidentified remnant of Supersoil may be left on these panels. The subtraction spectrum of the used Brulin minus the clean Brulin revealed only a few unique peaks which do not completely match the spectra of panel samples 45 through 56. The weakness of the panel spectra peaks makes it impossible to tell whether the subtracted peaks are being produced from the same contaminant that is on the surfaces of panel samples 45 through 56.
Positive identification of contaminants on the cleaned and as-received panels is not feasible due to the extremely small amounts present, resulting in very weak FTIR spectra.
ICP-EI ANALYSIS
ICP Theory
Inductively coupled plasma emission spectroscopy (ICP) is an analytical method which uses argon "plasma" to quantitatively detect metals and other elements in aqueous (and some non-aqueous) solutions. Some types of solid samples may be analyzed using acid digestion and extraction of the metals into solution.
Emission spectroscopy is based upon the phenomenon that atoms and ions of elements, when energetically excited, emit electromagnetic radiation at discrete wavelengths. When these atoms or ions are excited, the outermost electrons undergo energy transitions back to the ground state and emit photons of ultraviolet, visible, and near-infrared radiation.
An ICP instrument contains a quartz torch tube through which argon gas flows. Plasma formation, the ionization of the argon, is initiated by a spark. Surrounding the torch is an argon- cooled coil powered by a radio-frequency generator. The coil produces a fluctuating magnetic field which inductively causes ions and electrons of the argon plasma to flow in a specific path.
Sample solutions are aspirated, converted to aerosols, and injected into the plasma. The elements in the solution atomize and ionize in the plasma. The extreme heat of the plasma serves to excite the elements. Each excited element emits radiation at a series of discrete wavelengths unique for that element. A photomultiplier tube is used to detect the emissions and produce a signal which is converted by the ICP computer into an emission "spectrum." The emission counts are mathematically converted to the element's concentration in solution. Generally, one wavelength per element (usually in the visible or near UV range) is chosen by the ICP operator to determine concentration for that element.
B-5
ICP Analysis Techniques
The components of Supersoil were analyzed by ICP. They were treated as "soils" and digested by EPA Method 3050A. Method 3040 was not used since the components are not completely soluble in the required organic solvents. The digested soils were analyzed according to Method 6010A in aqueous solution. Over twenty metals were checked, some of which are not listed in these methods.
The fresh Brulin cleaner solution was also analyzed by ICP. The samples were diluted, acidified, and run according to Method 6010A. Used Brulin solution was likewise analyzed.
It was originally planned that the contaminants on the metal panels would be analyzed by ICP. The panels were to be solvent wiped or Soxhlet extracted and the residue in solvent analyzed. However, the Supersoil was found to be insoluble in the solvents used to perform these methods (insoluble in water as well). Also, the very low concentrations of contaminants on the panels would have dictated that a large sample of each panel be required for the analyses. There was not enough of each panel to go around between the ICP test and the other tests (FTIR, salt- fog, X-ray, etc.). Digestion of metal samples into aqueous solution for ICP would have caused the aluminum itself to digest, interfering with the accuracy of an ICP analysis.
Results of ICP Analysis
The only elements present in significant concentrations in the Supersoil were boron from the Safety Draw component at approximately 650 ppm and sodium at 100 ppm (also from the Safety Draw).
In the fresh Brulin, sodium, potassium, and phosphorous were present in concentrations greater than 20,000 mg/L. Compounds containing sodium, potassium, or phosphorous are common ingredients in detergents. Silicon was also found at approximately 1,500 mg/L, with a smaller amount of nickel at 130 mg/L. Analysis of the used Brulin revealed similar concentrations of the above, plus lower concentrations of calcium, magnesium, and zinc. These latter metals could be coming from the tap water used to dilute the Brulin solutions and/or the tanks.
Conclusions
Since ICP was not feasible for the analysis of the panel samples, no conclusions can be drawn comparing the panel contaminants to the materials applied to the panels (Brulin and Supersoil).
Future X-ray fluorescence analysis may be used to reveal the presence of elements on the panel surfaces corresponding to Supersoil and Brulin elements. No contaminant extraction or digestion is required for this method.
B-6
BIBLIOGRAPHY
American Society for Testing and Materials (1996). Standard practice for general techniques for qualitative infrared analysis. ASTM E 1252-94, Annual Book of ASTM Standards. Philadelphia, PA, 1996.
Bio-Rad Laboratories, Inc. (1982). FTIR FTS 3200 data station user's manual 091-0325A. Bio- Rad Digilab Division, Cambridge MA, 1982.
Environmental Protection Agency (1994). Soxhlet extraction, method 3540B. SW-846 Test Methods for Evaluating Solid Waste, Ch. 4.2.1, Rev 2,1994.
Environmental Protection Agency (1992). Acid digestion of sediments, sludges, and soils, method 3050A. SW-846 Test Methods for Evaluating Solid Waste, Ch. 3.2, Rev. 1,1992.
Environmental Protection Agency (1992). Inductively coupled plasma-atomic emission spectroscopy, method 6010A. SW-846 Test Methods for Evaluating Solid Waste, Ch. 3.3, Rev 1,1992.
Environmental Protection Agency (1986). Dissolution procedure for oils, greases, or waxes, method 3040. SW-846 Test Methods for Evaluating Solid Waste, Ch. 3.2, Rev 0,1986.
Environmental Protection Agency (1978). Oil and grease, total recoverable, method 413.2 (spectrophotometric, infrared). EPA STÖRET No. 00560, Rev 0,1978.
Skoog, D.A. (1985). Principles of instrumental analysis. 3rd ed., Saunders College Publishing, Philadelphia PA, 1985, pp 254,292-296.
B-7
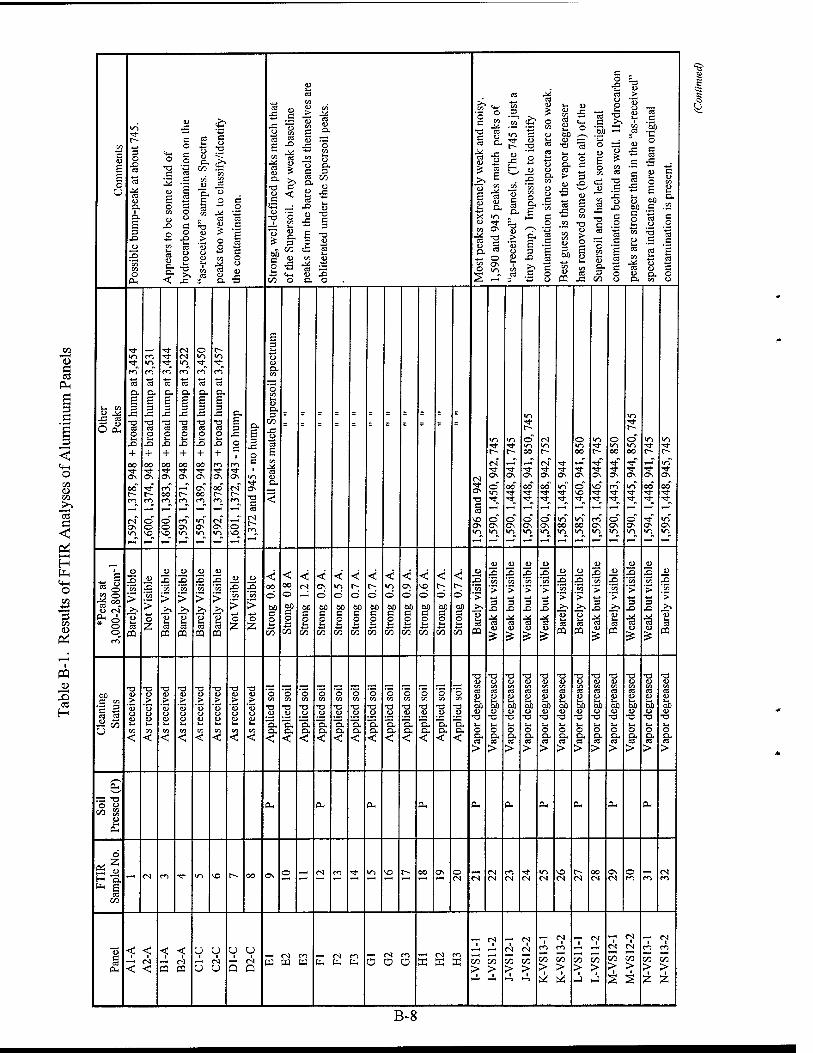
CO
PH
§ 3 < CM o oo <o CO
"öS e <
H
O
3 co to
to
CO
c CU
a s o U
Poss
ible
bum
p-pe
ak a
t abo
ut 7
45.
App
ears
to b
e so
me
kind
of
hydr
ocar
bon
cont
amin
atio
n on
the
"as-
rece
ived
" sa
mpl
es.
Spec
tra
peak
s to
o w
eak
to c
lass
ify/
iden
tify
the
cont
amin
atio
n.
Stro
ng,
wel
l-de
fine
d pe
aks
mat
ch th
at
of th
e Su
pers
oil.
Any
wea
k ba
selin
e
peak
s fr
om t
he b
are
pane
ls th
emse
lves
are
oblit
erat
ed u
nder
the
Supe
rsoi
l pe
aks.
Mos
t pea
ks e
xtre
mel
y w
eak
and
nois
y.
1,59
0 an
d 94
5 pe
aks
mat
ch p
eaks
of
"as-
rece
ived
" pa
nels
. (T
he 7
45 i
s jus
t a
tiny
bum
p.)
Impo
ssib
le to
ide
ntif
y
cont
amin
atio
n si
nce
spec
tra
are
so w
eak.
Bes
t gu
ess
is th
at th
e va
por
degr
ease
r
has
rem
oved
som
e (b
ut n
ot a
ll) o
f the
Supe
rsoi
l an
d ha
s le
ft s
ome
orig
inal
cont
amin
atio
n be
hind
as
wel
l. H
ydro
carb
on
peak
s ar
e st
rong
er th
an i
n th
e "a
s-re
ceiv
ed"
spec
tra
indi
catin
g m
ore
than
ori
gina
l
cont
amin
atio
n is
pre
sent
.
J-. en
8<e
•* m ■*
■*-» ca a. £ 3
J3
T3 ca o i-
x> + oo -3- as
so r-
(N OS m
in ro
la Cu £ 3
X!
TJ ca O 1H
X>
+ OO -a- os
-a- r- ro
O © SO
■**
to
03
Cu
£
T3 ca o
x> + 00 u- o
m 00
o o SO
tN tN m ro *J ca
Cu
£ 3 x: T3 ca o tn
XI
+ 00
os
p~ co
co ON m
o <n rr to" •fcH ca n. £ 3 ja
■a CB o IH
XI
+ 00 -3- o
ON oo to
in ON m
to o. £ 3
Xi
•o ca o i~i
XI
+ •* 00 t-
rN OS >n
£ 3
X!
O c
tN f- rn
o VD
£ 3
XJ
o c ■
vs
OS
T3 C CB
tN P~
£ 3 lH
t3 u Cu CO
"3 CO »H u Cu 3
tZ)
x: o ta B CO
CB
Cu
<
- = = = = = = = = = =
CN Tf OS
T3 C CB
SO OS in
VI -a- t-
tN
O in "*
o OS in
in
■■a- Os
00
•<*
o OS in
m •* p»
o" in 00
HM
Os
oo
o ON in
tN m p~
CN
Os
00 -a-
o OS in
ON
in ■a-
in oo in
O in oo
ON
O SO
in 00 in
m
p-
rj-
ON
SO -a-
ro OS m
o in oo
OS
m
o OS in
in
P~
o" in 00
Os
in
o OS in
in ■a- p~
Os
00
•<*
OS in
in •«* p~
m
ON
00
■*
m ON in
i „ E
•is CO ~ CD tN
cu ■ * o
©
u
"co
> "3 lH ca
oa
J3 IS "co
> O
z
3 "co
> _>N
"53 S3
CO
JÜ1
3 "co
i> _>>
ä
_o 3 "cO
> 73 IH CB
3 "co
> 13
CB
Ü2 3 'co
> O
z
3 "co
> o z
< 00
o 00 c o w
t^
00
Ö
00 c o
55
< «N
00 c o
■*-• en
< OS
Ö
00 c o
55
vs Ö
00 c o
55
< Ö
00 c o tH
55
< ö 00 c o UH
55
< o 00 c o UH
55
< OS
Ö
00 c o
55
Ö
OO c o ü 00
<
Ö
00 c
s 55
< Ö
00 c o tH
55
3 CO
"> "ju ca
CQ
cu
'co
»• 3
XI
■% CU
o 3 'co
> 3
X>
CB CU
is
JU 3 "co
> 3
X)
±i CB CU
_cu 3 "co
> 3
XI
Jsc! ca cu
XI CO
'> "53 (H CB
m
3 CO
'> x> "53 in CB
CD
ü
"co
> 3
X>
£t, CB CU
_cu 3
CO
"> >N
1 05
J2£ 3 'co
> 3
X>
M CB cu
u5
3 'co
> 3
XI
CB CU
3 CO
"> _>, "53
Lu CB
03
00 G en
13 cu >
'53 CU cu in CO
<
T3 CD >
"53 o cu U*
CO
<
-a cu .> '5
CJ u In CO
<
•o cu >
"53 cu cu Uu
CO
<
T3 Ü
"J3 cu CJ tH
CO
<
T3 CL> >
"53
t-,
CO
<
T3
> '53 o CL>
CO
<
•o u
"53 o bH
CO
<
o CO
T3 U
o.
o CO
•a
a, <
o CO
X! CU
Cu Cu
<
o CO
T3 CU
Cu a <
o CO
T3 U
C C
<
o CO
■a o
o. Cu
<
o CO
•a cu
a, Cu
<
O CO
-a CU
Cu Cu
<
o CO
•a u
Cu Cu
<
o CO
•a cu
Cu Cu
<
o CO
•a CU
Cu Cu
<
o CO
•a CU
Cu Cu
<
T3 <u CO CB CU tH 00 cu
X)
o
8- >
-a CU CO CB CU lH 00 CU
•o lH o Cu ca
>
-a CU CO CB CU UH
oo cu
•o |H o Cu CB
>
■zs cu CO C3 CU lH 00 cu
13
o Cu ca
>
•u cu CO ca cu |H oo cu
•a u O Cu ca
>
cu CO ca cu 1-1 00 cu -o u* o Cu CB
>
T3 CU CO ca cu lH 00 cu -a
Uu
o Cu CB
>
•o cu CO CB CU |H OO cu
13 tH O
tt
T3 CU CO CB CU tH 00 cu
-T3 lH O Cu CB
>
-o cu CO CB CU
00 CU
■a tH O
s- >
T3 CU CO CB CU
OO u
T3
o c ca >
T3 CU CO CB
00 CU
T3 Uu o
ca >
ST ^^ O CD
u lH
PH
OH Cu, OH ft. ft. ft. ft. OH ft. ft.
tN rr,
d
h a- ft. S3
oo
- CN m Tj- m ^o p~ 00 Os o - (N m ■* in SO r~ 00 OS o CN <N
CN tN CN tN
m tN
NO tN
P~ CN
OO CN
OS tN
o ro m
Pane
l <: < ■ i
—' tN
< <
<c < ■ i
— CN 03 CD
■ i -< tN u u
U U ■ i
— CN
Q Q — <N ro WWW
— <N n b b OH
—• <N m a o o - CN m
HU S X
— CN ■ i
CO oo > >
1 1
"7 ^ CN tN
00 00
> > 1 1
— tN ■ ■ es m
oo 00 > >
— tN i i
00 00
> > ►J W
—. tN i i
tN IN
00 00
> >
-H tN
OO 00
> > z z
B-8
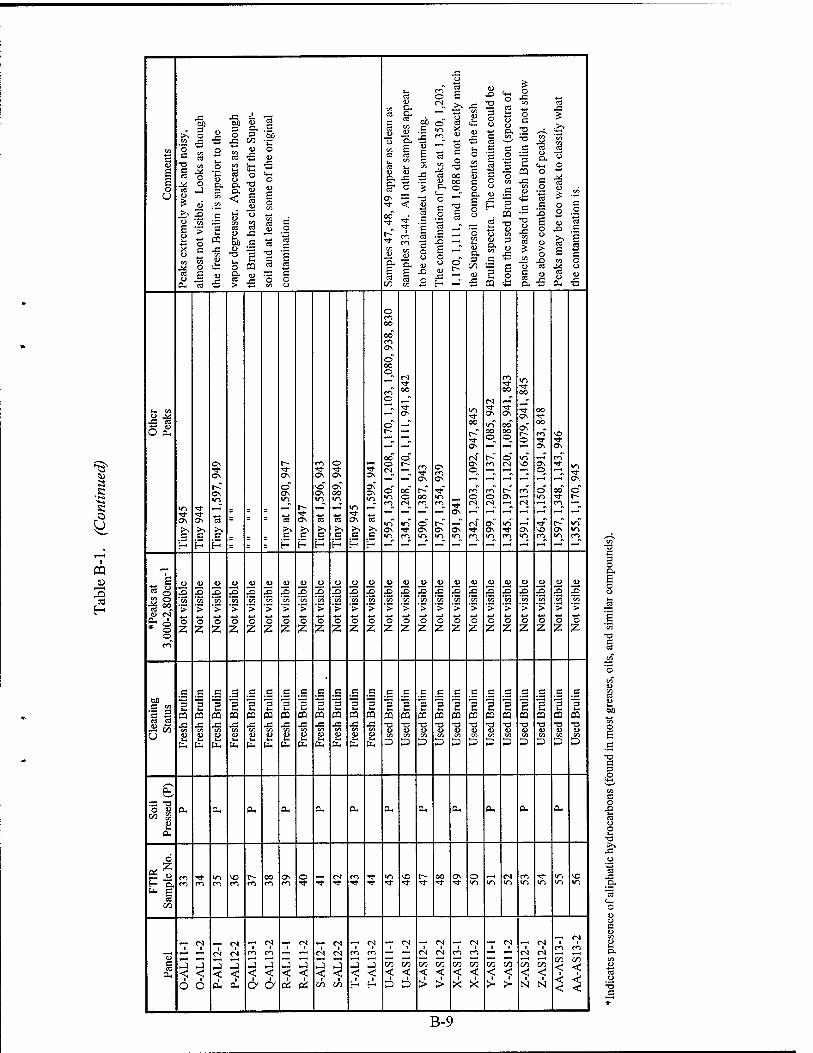
s •S et K
a
V3
C Ü
E E o U
Peak
s ex
trem
ely
wea
k an
d no
isy,
al
mos
t no
t vis
ible
. L
ooks
as
thou
gh
the
fres
h B
rulin
is s
uper
ior
to t
he
vapo
r de
grea
ser.
App
ears
as
thou
gh
the
Bru
lin h
as c
lean
ed o
ff th
e Su
per-
soil
and
at l
east
som
e of
the
orig
inal
cont
amin
atio
n.
Sam
ples
47,
48,
49
appe
ar a
s cl
ean
as
sam
ples
33-
44.
All
othe
r sa
mpl
es a
ppea
r
to b
e co
ntam
inat
ed w
ith s
omet
hing
.
The
com
bina
tion
of p
eaks
at
1,35
0, 1
,203
,
1,17
0, 1
,111
, an
d 1,
088
do n
ot e
xact
ly m
atch
the
Supe
rsoi
l co
mpo
nent
s or
the
fres
h
Bru
lin s
pect
ra.
The
con
tam
inan
t co
uld
be
from
the
use
d B
rulin
sol
utio
n (s
pect
ra o
f
pane
ls w
ashe
d in
fre
sh B
rulin
did
not
sho
w
the
abov
e co
mbi
natio
n of
pea
ks).
Peak
s m
ay b
e to
o w
eak
to c
lass
ify
wha
t
the
cont
amin
atio
n is
.
U. CO
Ja-a 8Ä
m •* os
P
OS
c P
OS
OS
r~ OS in
cs
P
rf OS
o" OS in
'S e p
OS
c P
co "3- OS
VO OS en
s >s c P
O ■<± Os
as 00 in
ts c P
Os
c p
OS
Os" OS en
s >> C
P
o rn oo
ot> rn Os
O 00 o
ro o
o r-
oo" o tN
o »ri ro
m OS in
tN
00
■3- Os
o"
00 o tN
>n ■a- m
m Os
r~ oo
O Os tn
Os m OS
<n
r~ Os in
Os in
in
00
Os
tN Os O
m o tN
tN -3- m
tN
OS
in 00 o_
t- m
m o tN
OS Os m
00
Os
oo" oo C3
o ts
OS
m
in Tt 00
Os
Os"
o
m so
tN
OS in
oo
00
OS
OS o
o m
so
so
Os
m
00
m
Os m
OS
o r~
>n >n m
„ E «<S t» o
* o q
JO
en
> O z
JO
en
> O
Z
u
en
> O
Z
J3 3 en
> O z
jo
3 en
> O
Z
X> en
O
Z
u 3 en
> O z
to
3 en
> O
Z
JU 3 en
> O
Z
jo
XI
O z
JO 3
en
> O z
JO 3 en
> O z
JO 3 en
> •faj o z
JO
3 en
> o z
JO 3 en
> O
Z
JO
X en
> O
Z
JO 3 en
> O z
JO
3 en
> O z
JO
3 en
> O z
JO
3 en
> o z
JO 3 en
O z
JO 3 en
> O
Z
JO 3 en
> O z
JO 3 > O z
60 C en
C 3 5 Cd
0*
c 3 fa-
CQ XI en <0
b
3 fa- 03
en <U fa- b
c 3 fa-
CQ X en U fa- b
c 3
u fa- b
e 3 fa-
CQ X en U fa- b
e 3 fa- m en to IM
b
c 3 fa-
CQ x en to fa- b
c 3 fa-
ea X! en to fa- b
C
3 fa- CQ X! en
b
c 3 fa- m JS en to fa- b
c 3
CQ X en to fa- b
c 3 fa-
CQ X en U fa- b
C
3 fa- CQ XI a en
e 3 fa-
CO •a a>
►3
c
e CQ •a to en
c 3 fa-
CQ T3 <U en
c
5 CQ •a en
B
3 fa- CQ ■a to en
3
c 3
CQ •o to en
3
s 3
CQ T3 to en
3
c 3 fa- ffl
s 3 fa«
CQ *o co
e 3
CQ -a
CO en
3
c 3 fa-
CQ •o to
W
o o to 1-1
OH
a, b b b b b b b b b b b
d
H 3. fc 1 00
Ti- ro
m co
so r- m
00 co
OS en
o ■*
tN -et
m SO 00 Os O in m
tN m m in
in en m
"co c b
— tN i i
o o
— tN
tN tN
< < ■ i
b P-
• i co CO
ä a
■ i
< < t I
0- 0.
— tN i ■
tN tN
< < ■ ■
CO CO
—■ tN ■ i
m en
►J -I
< < I 1
— tN ■ i
CO CO
< <
—i tN
tN tN
CO CO
<: < 1 ■
> >
—c tN ■ I
m m
CO CO
< <
— tN ■ i
CO CO
< <
tN tN
CO CO
< < t 1
N N
— IN ■ 1
m en
CO CO
< <
ii
3 O Pu
•a c
o E
c o X
•a x
B-9
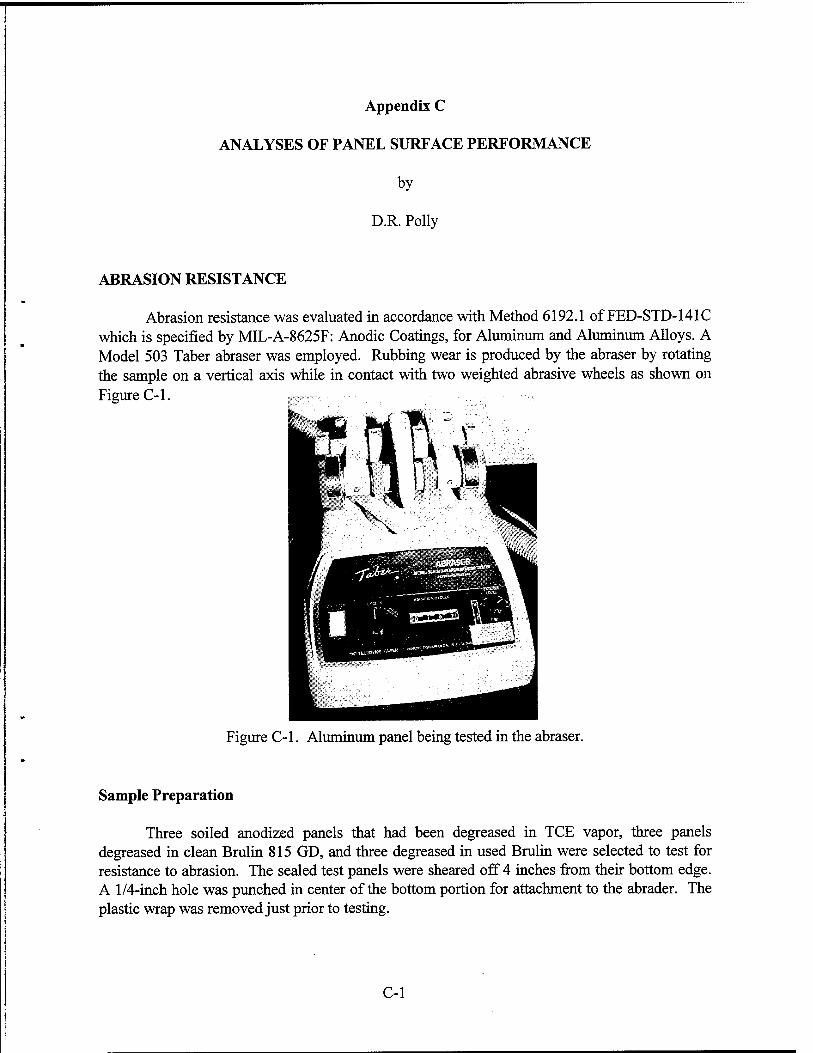
Appendix C
ANALYSES OF PANEL SURFACE PERFORMANCE
by
D.R. Polly
ABRASION RESISTANCE
Abrasion resistance was evaluated in accordance with Method 6192.1 of FED-STD-141C which is specified by MIL-A-8625F: Anodic Coatings, for Aluminum and Aluminum Alloys. A Model 503 Taber abraser was employed. Rubbing wear is produced by the abraser by rotating the sample on a vertical axis while in contact with two weighted abrasive wheels as shown on Figure C-l.
Figure C-l. Aluminum panel being tested in the abraser.
Sample Preparation
Three soiled anodized panels that had been degreased in TCE vapor, three panels degreased in clean Brulin 815 GD, and three degreased in used Brulin were selected to test for resistance to abrasion. The sealed test panels were sheared off 4 inches from their bottom edge. A 1/4-inch hole was punched in center of the bottom portion for attachment to the abrader. The plastic wrap was removed just prior to testing.
C-l
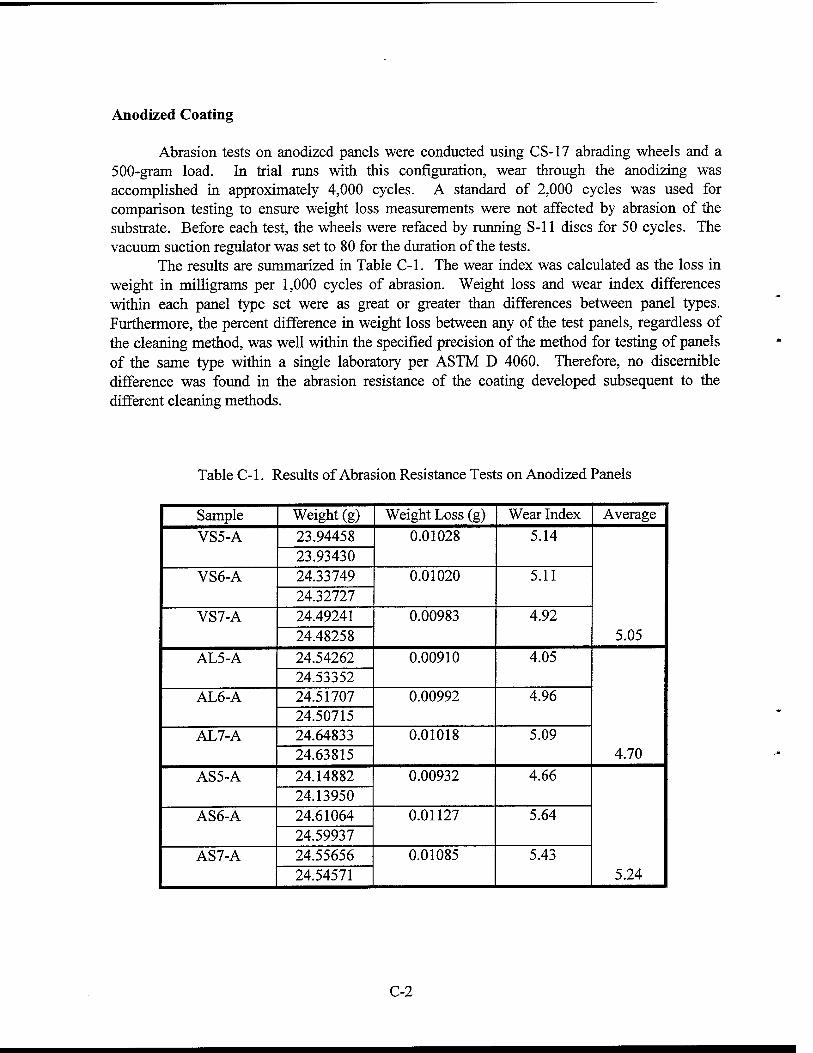
Anodized Coating
Abrasion tests on anodized panels were conducted using CS-17 abrading wheels and a 500-gram load. In trial runs with this configuration, wear through the anodizing was accomplished in approximately 4,000 cycles. A standard of 2,000 cycles was used for comparison testing to ensure weight loss measurements were not affected by abrasion of the substrate. Before each test, the wheels were refaced by running S-ll discs for 50 cycles. The vacuum suction regulator was set to 80 for the duration of the tests.
The results are summarized in Table C-l. The wear index was calculated as the loss in weight in milligrams per 1,000 cycles of abrasion. Weight loss and wear index differences within each panel type set were as great or greater than differences between panel types. Furthermore, the percent difference in weight loss between any of the test panels, regardless of the cleaning method, was well within the specified precision of the method for testing of panels of the same type within a single laboratory per ASTM D 4060. Therefore, no discernible difference was found in the abrasion resistance of the coating developed subsequent to the different cleaning methods.
Table C-l. Results of Abrasion Resistance Tests on Anodized Panels
Sample Weight (g) Weight Loss (g) Wear Index Average
VS5-A 23.94458 0.01028 5.14
5.05
23.93430 VS6-A 24.33749 0.01020 5.11
24.32727 VS7-A 24.49241 0.00983 4.92
24.48258 AL5-A 24.54262 0.00910 4.05
4.70
24.53352 AL6-A 24.51707 0.00992 4.96
24.50715 AL7-A 24.64833 0.01018 5.09
24.63815 AS5-A 24.14882 0.00932 4.66
5.24
24.13950 AS6-A 24.61064 0.01127 5.64
24.59937 AS7-A 24.55656 0.01085 5.43
24.54571
C-2
Conversion Coating
Although conversion coatings are not intended to impart any abrasion or wear resistance, an attempt was made to get some information concerning surface "adhesion" of the conversion coating. However, even with a very mild abrasive wheel (CS-10F) and very small load (50 gram), wear through the coating was accomplished in less than 10 cycles. There was no measurable weight loss to 0.01 mg. Therefore, no useful performance comparisons could be made.
CATHODIC BREAKDOWN TEST
Numerous accelerated electrochemical tests have been employed for testing surface coatings with various degrees of success. Reportedly (Ref 1), good correlation between cathodic breakdown and longer term performance of anodized coatings has been found. A modified version of an aircraft industry breakdown test (Ref 2) was employed for investigating possible differences in the anodized coating due to the different cleaning processes.
Test Procedure
Cathodic breakdown behavior was evaluated through potentiostatic polarization of a portion of the surface of test panels from each cleaning process. The surface was held at a fixed potential relative to a saturated calomel reference electrode (SCE) by potentiostatic circuitry (Figure C-2) controlling the application of current from a platinum counter electrode. By monitoring this current, the resistive nature of the anodizing oxide film was measured. With breakdown there was a corresponding increase in current. Tests were run at various potentials cathodic to the unperturbed potential to determine the polarization value required for breakdown in a 1,200-second timespan.
Test Fixture
The test apparatus shown in Figure C-3 was employed for containment of the electrolyte. A Plexiglas cylinder with an "0"-ring seal on the lower rim was clamped to the surface. The sealed area was then submerged in electrolyte consisting of 10 mL of a 5 percent solution of sodium chloride. The area of the submerged surface was 11.40 cm2.
C-3
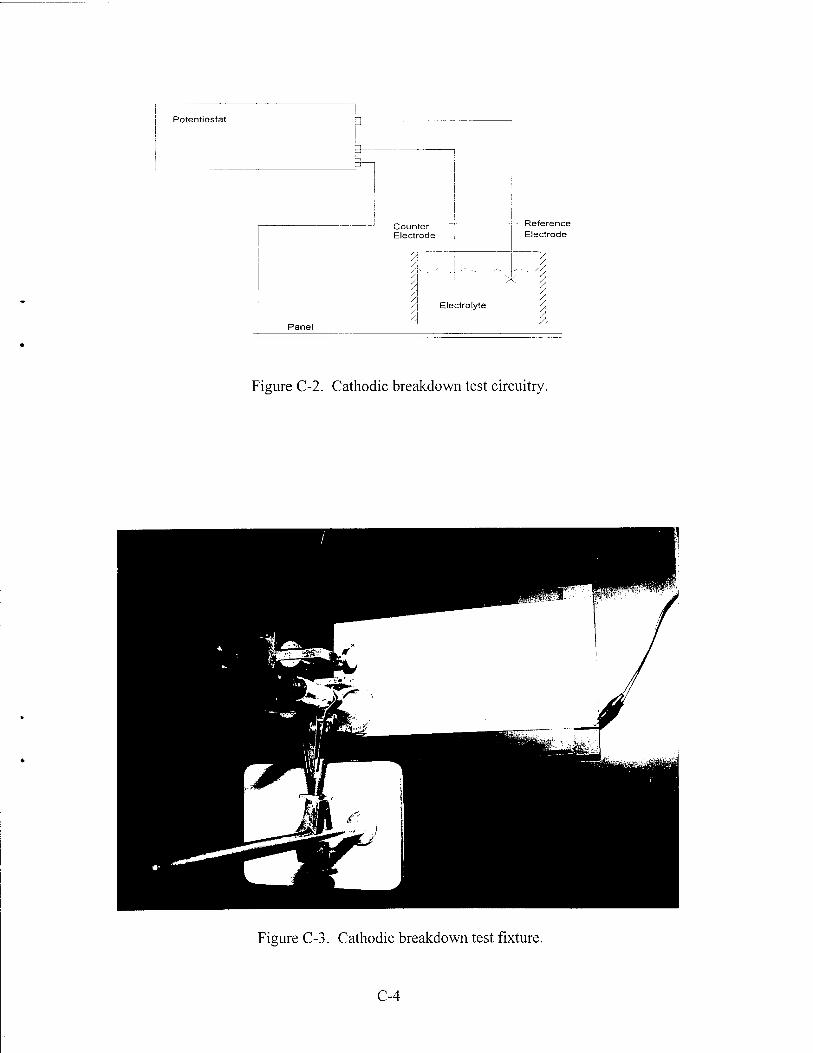
Potentiostat
Panel
Counter Electrode
Reference Electrode
1 X
/ /
I /
Electrolyte {,
Figure C-2. Cathodic breakdown test circuitry.
»
/
I
Figure C-3. Cathodic breakdown test fixture.
C-4
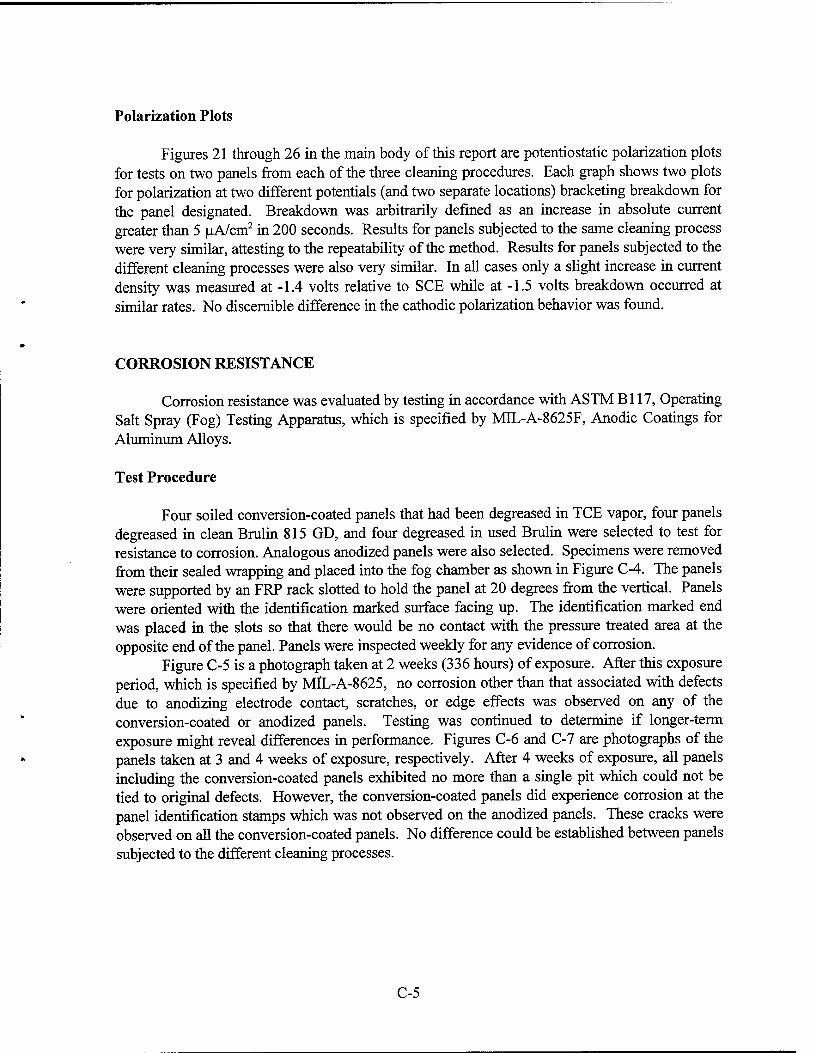
Polarization Plots
Figures 21 through 26 in the main body of this report are potentiostatic polarization plots for tests on two panels from each of the three cleaning procedures. Each graph shows two plots for polarization at two different potentials (and two separate locations) bracketing breakdown for the panel designated. Breakdown was arbitrarily defined as an increase in absolute current greater than 5 uA/cm2 in 200 seconds. Results for panels subjected to the same cleaning process were very similar, attesting to the repeatability of the method. Results for panels subjected to the different cleaning processes were also very similar. In all cases only a slight increase in current density was measured at -1.4 volts relative to SCE while at -1.5 volts breakdown occurred at similar rates. No discernible difference in the cathodic polarization behavior was found.
CORROSION RESISTANCE
Corrosion resistance was evaluated by testing in accordance with ASTM Bl 17, Operating Salt Spray (Fog) Testing Apparatus, which is specified by MIL-A-8625F, Anodic Coatings for Aluminum Alloys.
Test Procedure
Four soiled conversion-coated panels that had been degreased in TCE vapor, four panels degreased in clean Brulin 815 GD, and four degreased in used Brulin were selected to test for resistance to corrosion. Analogous anodized panels were also selected. Specimens were removed from their sealed wrapping and placed into the fog chamber as shown in Figure C-4. The panels were supported by an FRP rack slotted to hold the panel at 20 degrees from the vertical. Panels were oriented with the identification marked surface facing up. The identification marked end was placed in the slots so that there would be no contact with the pressure treated area at the opposite end of the panel. Panels were inspected weekly for any evidence of corrosion.
Figure C-5 is a photograph taken at 2 weeks (336 hours) of exposure. After this exposure period, which is specified by MTL-A-8625, no corrosion other than that associated with defects due to anodizing electrode contact, scratches, or edge effects was observed on any of the conversion-coated or anodized panels. Testing was continued to determine if longer-term exposure might reveal differences in performance. Figures C-6 and C-7 are photographs of the panels taken at 3 and 4 weeks of exposure, respectively. After 4 weeks of exposure, all panels including the conversion-coated panels exhibited no more than a single pit which could not be tied to original defects. However, the conversion-coated panels did experience corrosion at the panel identification stamps which was not observed on the anodized panels. These cracks were observed on all the conversion-coated panels. No difference could be established between panels subjected to the different cleaning processes.
C-5
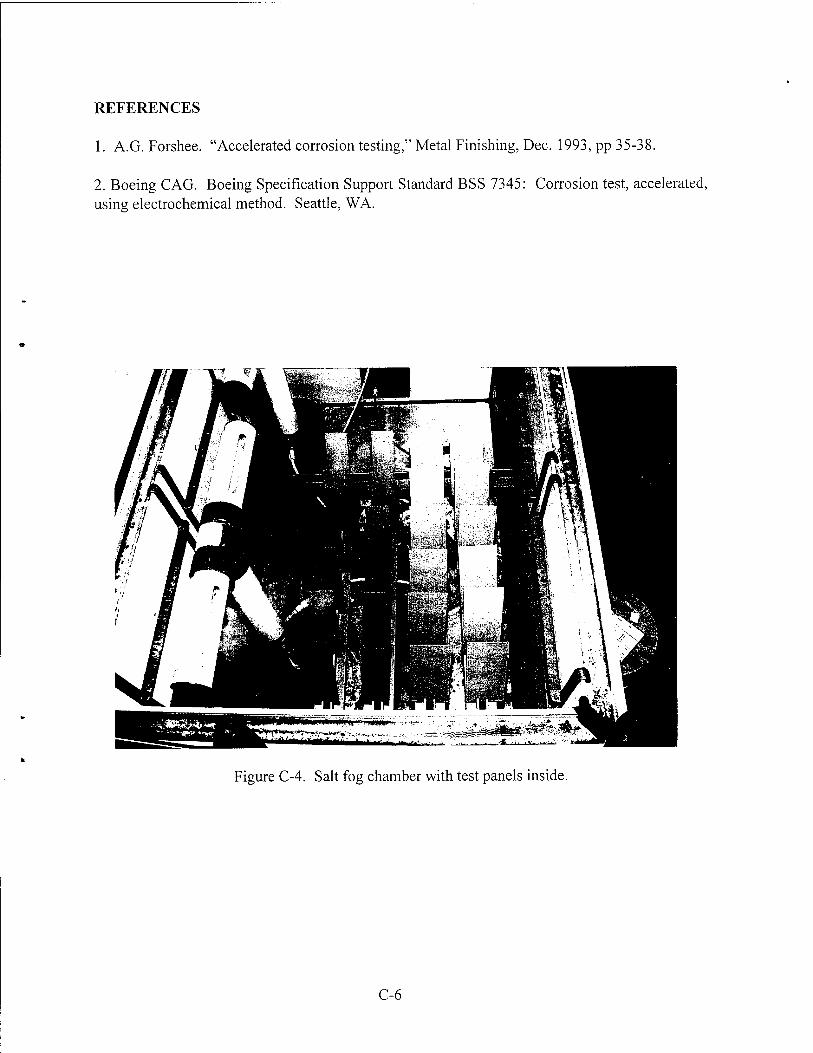
REFERENCES
1. A.G. Forshee. "Accelerated corrosion testing," Metal Finishing, Dec. 1993, pp 35-38.
2. Boeing CAG. Boeing Specification Support Standard BSS 7345: Corrosion test, accelerated, using electrochemical method. Seattle, WA.
Figure C-4. Salt fog chamber with test panels inside.
C-6
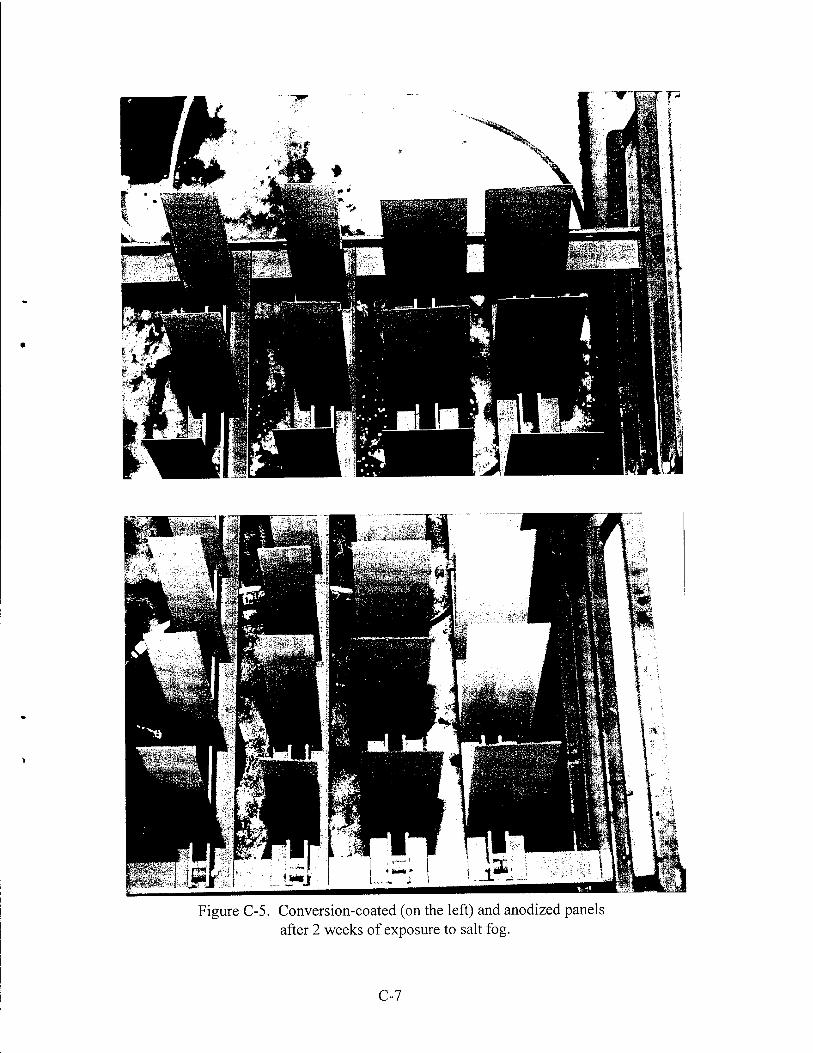
Figure C-5. Conversion-coated (on the left) and anodized panels after 2 weeks of exposure to salt fog.
C-7
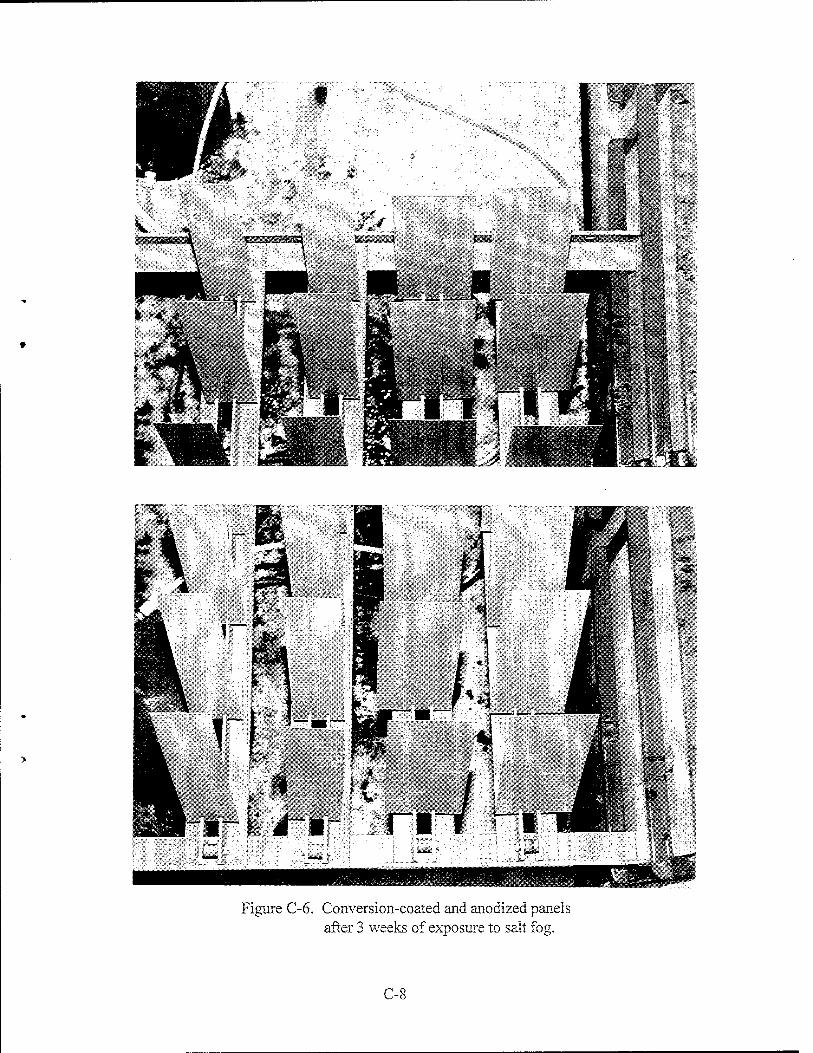
Figure C-6. Conversion-coated and anodized panels after 3 weeks of exposure to salt fog.
C-8
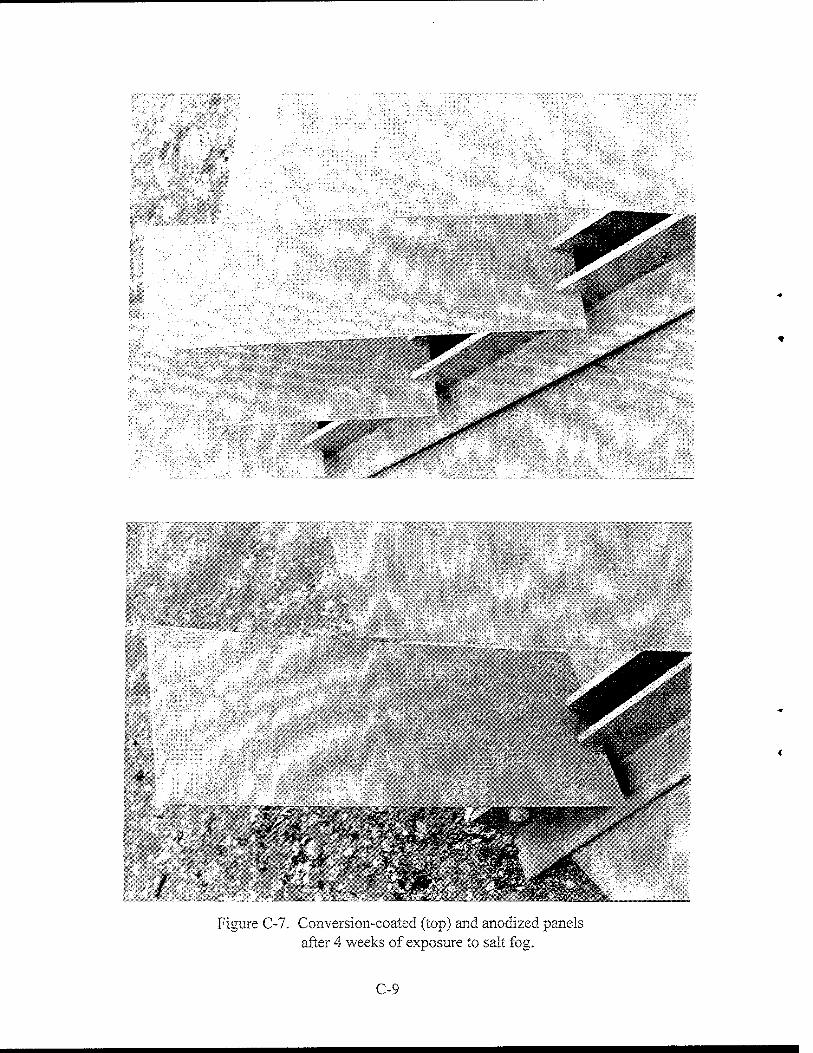
Wmmß
;^%&mM'!M&¥MwMMMi
-**' i^-ijgi. & '■
Figure C-7. Conversion-coated (top) and anodized panels after 4 weeks of exposure to salt fog.
C-9
Appendix D
MATERIAL SAFETY DATA SHEETS OF CLEANERS AND CHEMICALS USED IN THIS STUDY
Enclosed in this appendix are excerpts of Material Safety Data Sheets summarizing the ingredients and physical and chemical properties of the aqueous degreaser used in these analyses,
Brulin815GD
the four soils,
Safety Draw 700 Cimflo 20 TitanLubeNo. 1129 CRC Soft Seal
the alkaline light-duty cleaner,
Turco4215NC-LT
the deoxidizers,
Parker Amchem Deoxidizer 7 Parker Amchem Deoxidizer 17
and the chemical conversion coating reagent,
Indite 14-2.
D-l
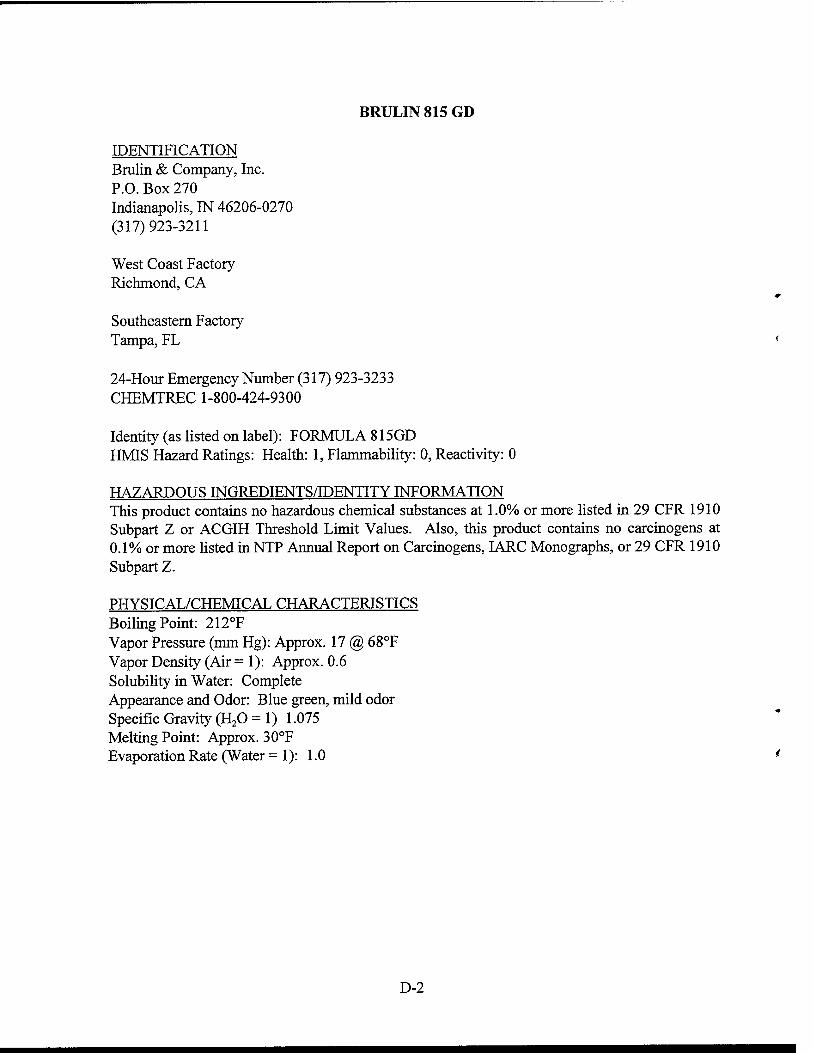
BRULIN 815 GD
IDENTIFICATION Brulin & Company, Inc. P.O. Box 270 Indianapolis, IN 46206-0270 (317)923-3211
West Coast Factory Richmond, CA
Southeastern Factory Tampa, FL
24-Hour Emergency Number (317) 923-3233 CHEMTREC 1-800-424-9300
Identity (as listed on label): FORMULA 815GD HMIS Hazard Ratings: Health: 1, Flammability: 0, Reactivity: 0
HAZARDOUS INGREDIENTS/IDENTITY INFORMATION This product contains no hazardous chemical substances at 1.0% or more listed in 29 CFR 1910 Subpart Z or ACGIH Threshold Limit Values. Also, this product contains no carcinogens at 0.1% or more listed in NTP Annual Report on Carcinogens, IARC Monographs, or 29 CFR 1910 Subpart Z.
PHYSICAL/CHEMICAL CHARACTERISTICS Boiling Point: 212°F Vapor Pressure (mm Hg): Approx. 17 @ 68°F Vapor Density (Air = 1): Approx. 0.6 Solubility in Water: Complete Appearance and Odor: Blue green, mild odor Specific Gravity (H20 = 1) 1.075 Melting Point: Approx. 30°F Evaporation Rate (Water =1): 1.0
D-2
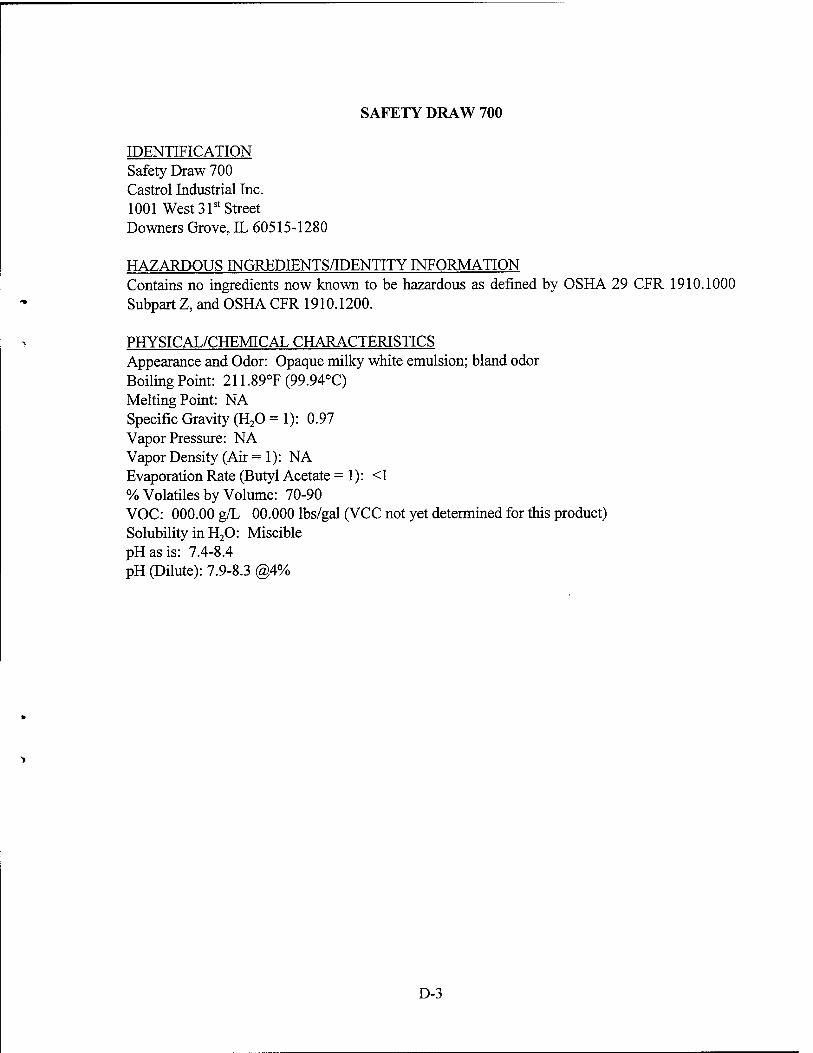
SAFETY DRAW 700
IDENTIFICATION Safety Draw 700 Castrol Industrial Inc. 1001 West 31st Street Downers Grove, IL 60515-1280
HAZARDOUS INGREDIENTS/IDENTITY INFORMATION Contains no ingredients now known to be hazardous as defined by OSHA 29 CFR 1910.1000 Subpart Z, and OSHA CFR 1910.1200.
PHYSICAL/CHEMICAL CHARACTERISTICS Appearance and Odor: Opaque milky white emulsion; bland odor Boiling Point: 211.89°F (99.94°C) Melting Point: NA Specific Gravity (H20 = 1): 0.97 Vapor Pressure: NA Vapor Density (Air =1): NA Evaporation Rate (Butyl Acetate =1): <1 % Volatiles by Volume: 70-90 VOC: 000.00 g/L 00.000 lbs/gal (VCC not yet determined for this product) Solubility in H20: Miscible pHasis: 7.4-8.4 pH (Dilute): 7.9-8.3 @4%
D-3
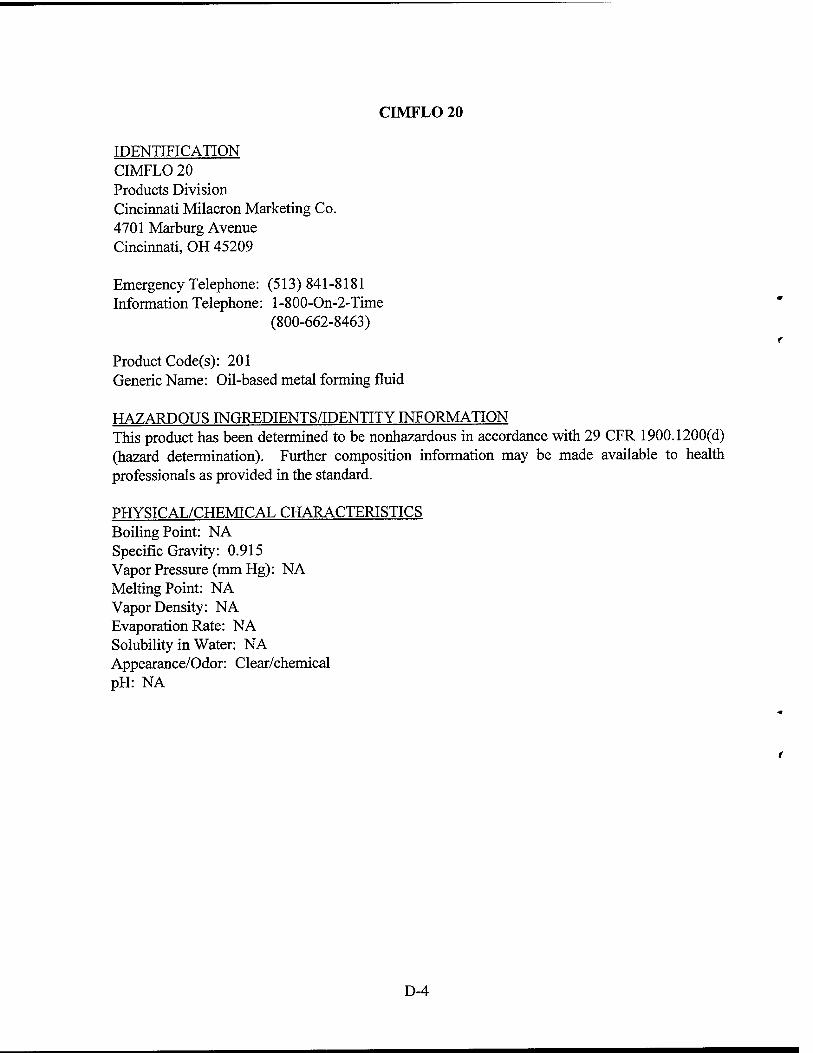
CIMFLO 20
IDENTIFICATION CIMFLO 20 Products Division Cincinnati Milacron Marketing Co. 4701 Marburg Avenue Cincinnati, OH 45209
Emergency Telephone: (513) 841 -8181 Information Telephone: l-800-On-2-Time
(800-662-8463)
Product Code(s): 201 Generic Name: Oil-based metal forming fluid
HAZARDOUS INGREDIENTS/IDENTITY INFORMATION This product has been determined to be nonhazardous in accordance with 29 CFR 1900.1200(d) (hazard determination). Further composition information may be made available to health professionals as provided in the standard.
PHYSICAL/CHEMICAL CHARACTERISTICS Boiling Point: NA Specific Gravity: 0.915 Vapor Pressure (mm Hg): NA Melting Point: NA Vapor Density: NA Evaporation Rate: NA Solubility in Water: NA Appearance/Odor: Clear/chemical pH: NA
D-4
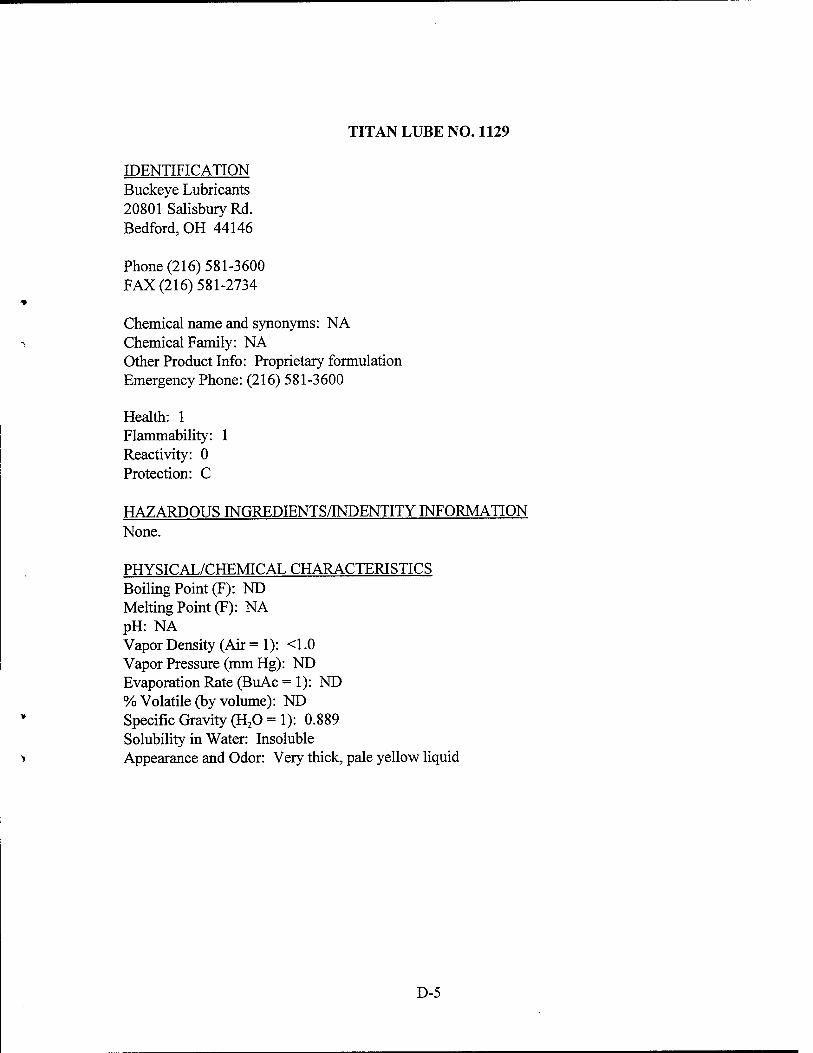
TITAN LUBE NO. 1129
IDENTIFICATION Buckeye Lubricants 20801 Salisbury Rd. Bedford, OH 44146
Phone (216) 581-3600 FAX (216) 581-2734
Chemical name and synonyms: NA Chemical Family: NA Other Product Info: Proprietary formulation Emergency Phone: (216) 581-3600
Health: 1 Flammability: 1 Reactivity: 0 Protection: C
HAZARDOUS INGREDIENTS/INDENTITY INFORMATION None.
PHYSICAL/CHEMICAL CHARACTERISTICS Boiling Point (F): ND Melting Point (F): NA pH: NA Vapor Density (Air =1): <1.0 Vapor Pressure (mm Hg): ND Evaporation Rate (BuAc =1): ND % Volatile (by volume): ND Specific Gravity (H20 = 1): 0.889 Solubility in Water: Insoluble Appearance and Odor: Very thick, pale yellow liquid
D-5
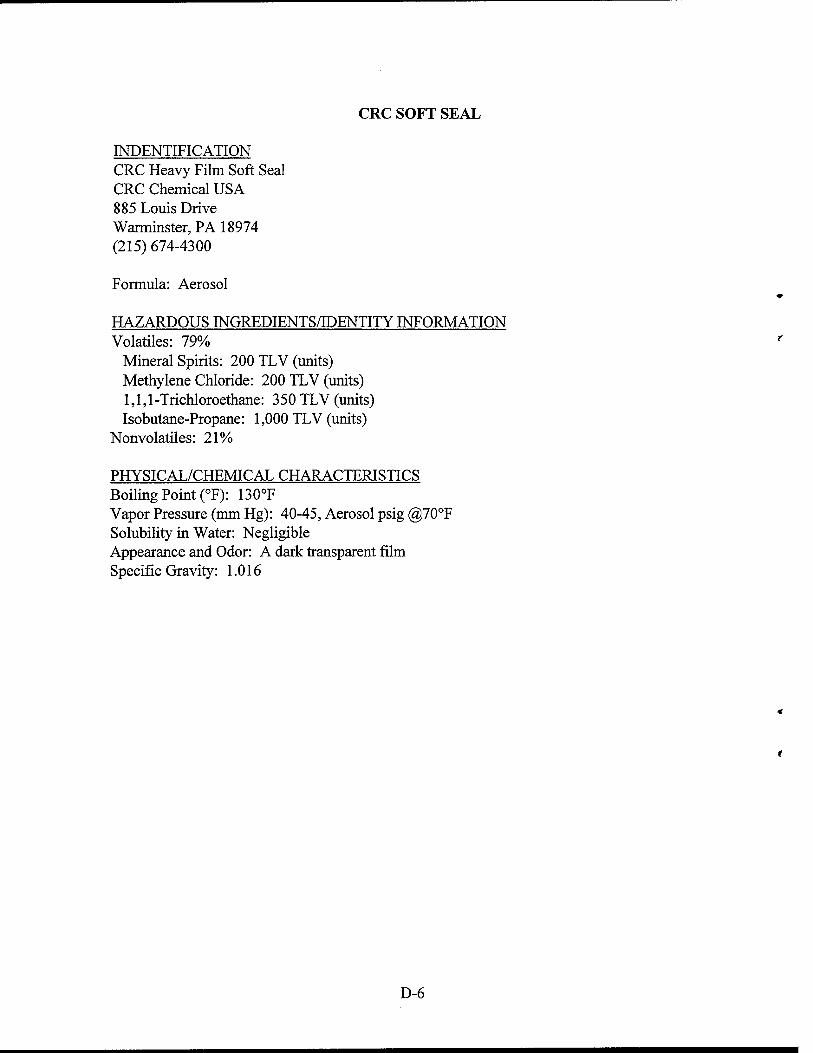
CRC SOFT SEAL
INDENTIFICATION CRC Heavy Film Soft Seal CRC Chemical USA 885 Louis Drive Warminster, PA 18974 (215) 674-4300
Formula: Aerosol
HAZARDOUS INGREDIENTS/IDENTITY INFORMATION Volatiles: 79%
Mineral Spirits: 200 TLV (units) Methylene Chloride: 200 TLV (units) 1,1,1-Trichloroethane: 350 TLV (units) Isobutane-Propane: 1,000 TLV (units)
Nonvolatiles: 21%
PHYSICAL/CHEMICAL CHARACTERISTICS Boiling Point (°F): 130°F Vapor Pressure (mm Hg): 40-45, Aerosol psig @70°F Solubility in Water: Negligible Appearance and Odor: A dark transparent film Specific Gravity: 1.016
D-6
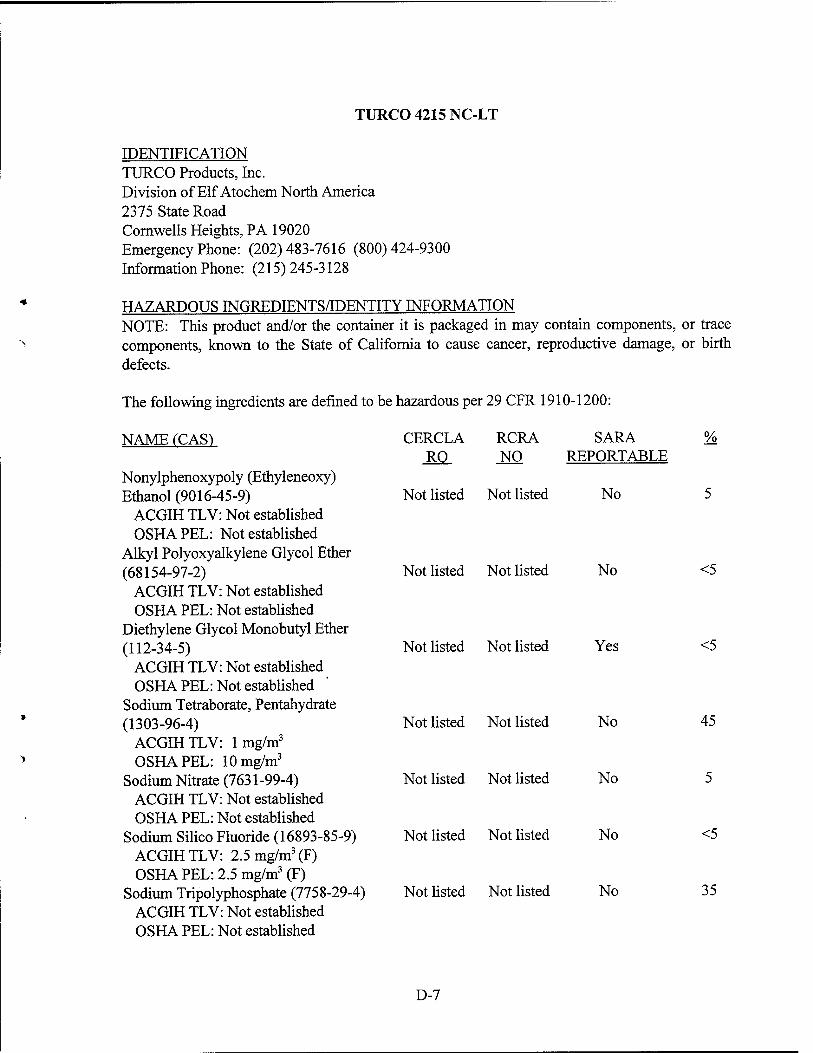
TURCO 4215 NC-LT
IDENTIFICATION TURCO Products, Inc. Division of Elf Atochem North America 2375 State Road Cornwells Heights, PA 19020 Emergency Phone: (202)483-7616 (800) 424-9300 Information Phone: (215)245-3128
* HAZARDOUS INGREDIENTS/IDENTITY INFORMATION ntain components, NOTE: This product and/or the container it is packaged in may co or trace
> components, known to the State of California to cause cancer, reproductive damage, or birth defects.
The following ingredients are defined to be hazardous pei - 29 CFR 1910-1200:
NAME fCAS) CERCLA RCRA SARA %
RO NO REPORTABLE Nonylphenoxypoly (Ethyleneoxy) Ethanol (9016-45-9) Not listed Not listed No 5
ACGIH TLV: Not established OSHA PEL: Not established
Alkyl Polyoxyalkylene Glycol Ether (68154-97-2) Not listed Not listed No <5
ACGIH TLV: Not established OSHA PEL: Not established
Diethylene Glycol Monobutyl Ether (112-34-5) Not listed Not listed Yes <5
ACGIH TLV: Not established OSHA PEL: Not established
Sodium Tetraborate, Pentahydrate >
(1303-96-4) ACGIH TLV: 1 mg/m3
Not listed Not listed No 45
> OSHA PEL: 10 mg/m3
Sodium Nitrate (7631-99-4) Not listed Not listed No 5 ACGIH TLV: Not established OSHA PEL: Not established
Sodium Silico Fluoride (16893-85-9) Not listed Not listed No <5 ACGIH TLV: 2.5 mg/m3(F) OSHA PEL: 2.5 mg/m3 (F)
Sodium Tripolyphosphate (7758-29-4) Not listed Not listed No 35 ACGIH TLV: Not established OSHA PEL: Not established
D-7
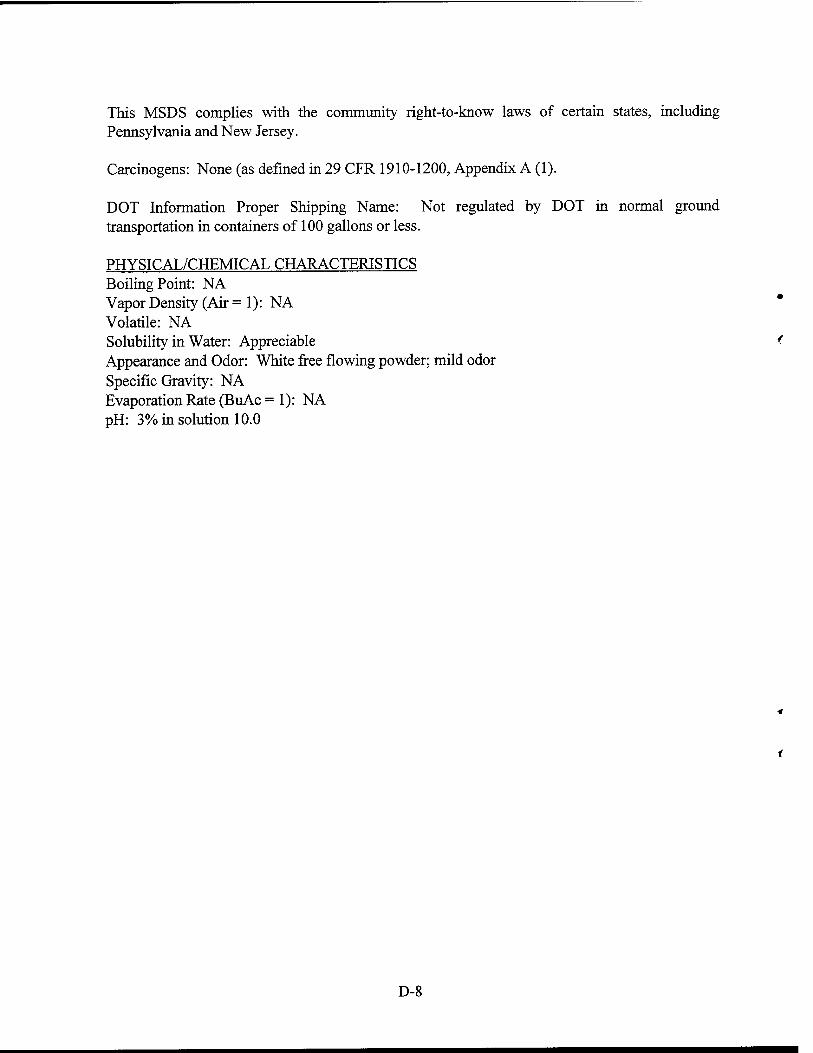
This MSDS complies with the community right-to-know laws of certain states, including Pennsylvania and New Jersey.
Carcinogens: None (as defined in 29 CFR 1910-1200, Appendix A (1).
DOT Information Proper Shipping Name: Not regulated by DOT in normal ground transportation in containers of 100 gallons or less.
PHYSICAL/CHEMICAL CHARACTERISTICS Boiling Point: NA Vapor Density (Air =1): NA Volatile: NA Solubility in Water: Appreciable Appearance and Odor: White free flowing powder; mild odor Specific Gravity: NA Evaporation Rate (BuAc =1): NA pH: 3% in solution 10.0
D-8
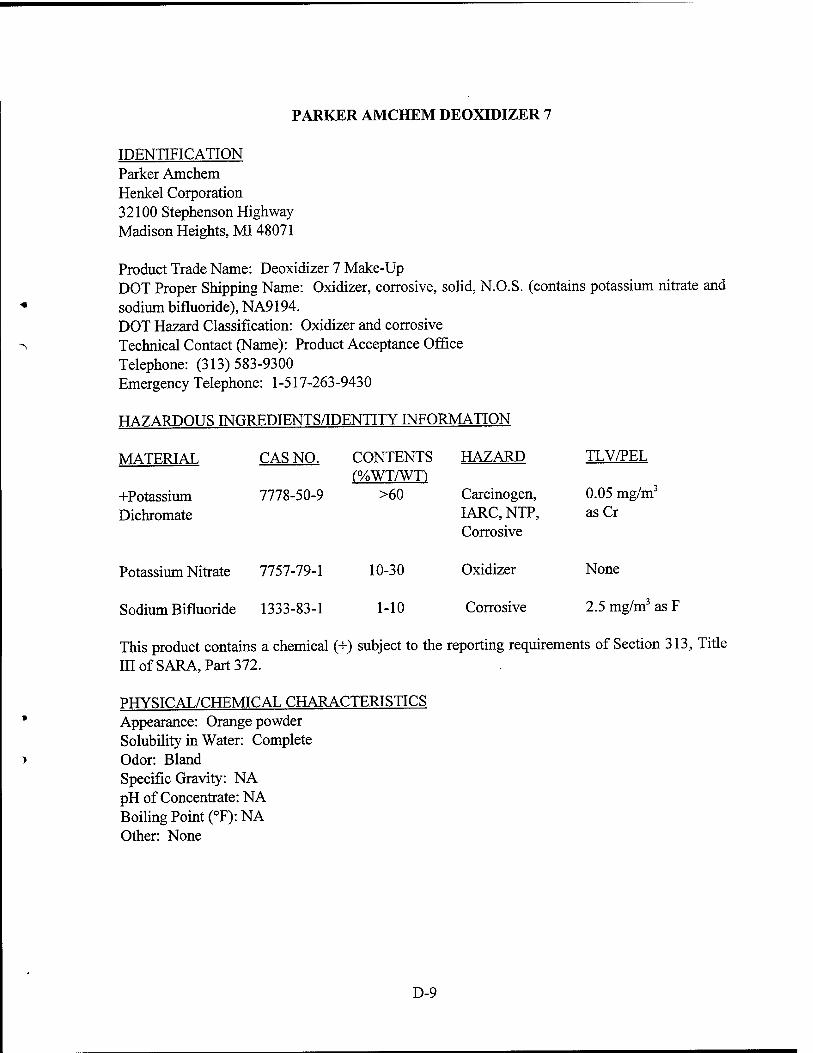
PARKER AMCHEM DEOXIDIZER 7
IDENTIFICATION Parker Amchem Henkel Corporation 32100 Stephenson Highway Madison Heights, MI 48071
Product Trade Name: Deoxidizer 7 Make-Up DOT Proper Shipping Name: Oxidizer, corrosive, solid, N.O.S. (contains potassium nitrate and sodium bifluoride), NA9194. DOT Hazard Classification: Oxidizer and corrosive Technical Contact (Name): Product Acceptance Office Telephone: (313)583-9300 Emergency Telephone: 1-517-263-9430
HAZARDOUS INGREDIENTS/IDENTITY INFORMATION
MATERIAL CAS NO. CONTENTS f%WT/Wn
HAZARD TLV/PEL
+Potassium 7778-50-9 >60 Carcinogen, 0.05 mg/m3
Dichromate IARQNTP, Corrosive
asCr
Potassium Nitrate 7757-79-1 10-30 Oxidizer None
Sodium Bifluoride 1333-83-1 1-10 Corrosive 2.5 mg/m3 as F
This product contains a chemical (+) subject to the reporting requirements of Section 313, Title III of SARA, Part 372.
PHYSICAL/CHEMICAL CHARACTERISTICS Appearance: Orange powder Solubility in Water: Complete Odor: Bland Specific Gravity: NA pH of Concentrate: NA Boiling Point (°F): NA Other: None
D-9
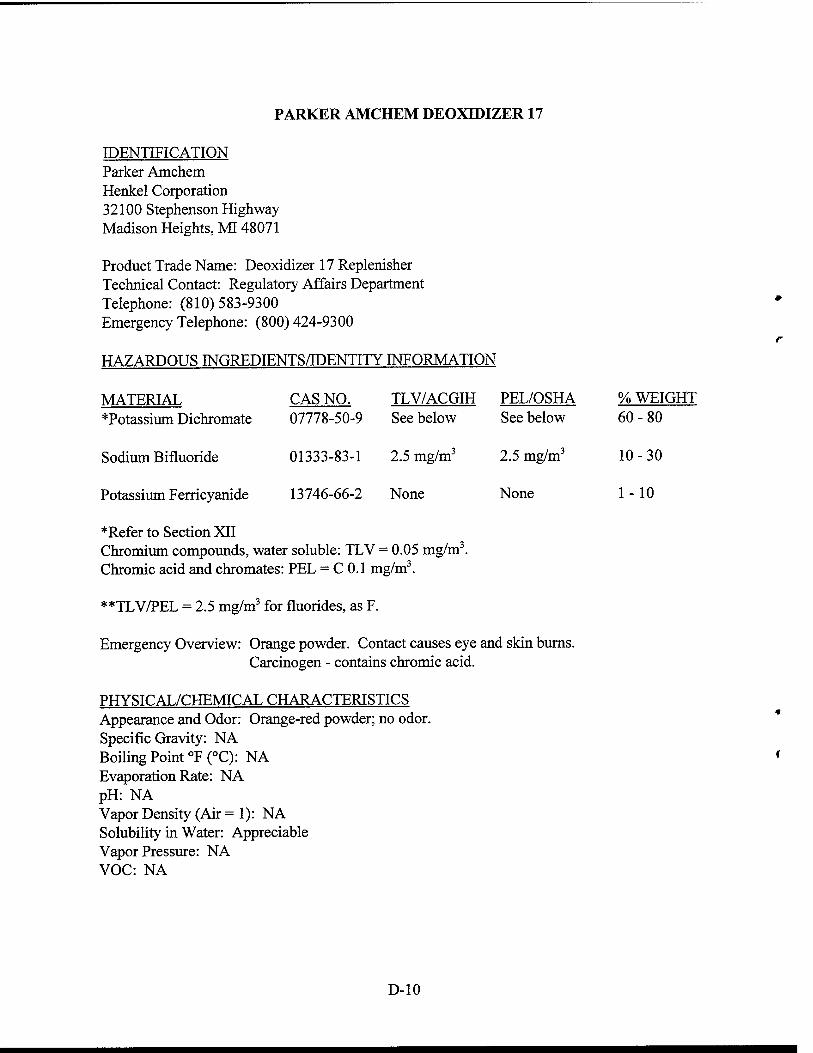
PARKER AMCHEM DEOXIDIZER 17
CAS NO. TLV/ACGIH PEL/OSHA % WEIGHT 07778-50-9 See below See below 60-80
01333-83-1 2.5 mg/m3 2.5 mg/m3 10-30
13746-66-2 None None 1-10
IDENTIFICATION Parker Amchem Henkel Corporation 32100 Stephenson Highway Madison Heights, MI 48071
Product Trade Name: Deoxidizer 17 Replenisher Technical Contact: Regulatory Affairs Department Telephone: (810)583-9300 Emergency Telephone: (800) 424-9300
HAZARDOUS INGREDIENTS/IDENTITY INFORMATION
MATERIAL *Potassium Dichromate
Sodium Bifluoride
Potassium Ferricyanide
*Refer to Section XII Chromium compounds, water soluble: TLV = 0.05 mg/m3. Chromic acid and chromates: PEL = C 0.1 mg/m3.
**TLV/PEL = 2.5 mg/m3 for fluorides, as F.
Emergency Overview: Orange powder. Contact causes eye and skin burns. Carcinogen - contains chromic acid.
PHYSICAL/CHEMICAL CHARACTERISTICS Appearance and Odor: Orange-red powder; no odor. Specific Gravity: NA Boiling Point °F (°C): NA Evaporation Rate: NA pH: NA Vapor Density (Air =1): NA Solubility in Water: Appreciable Vapor Pressure: NA VOC: NA
D-10
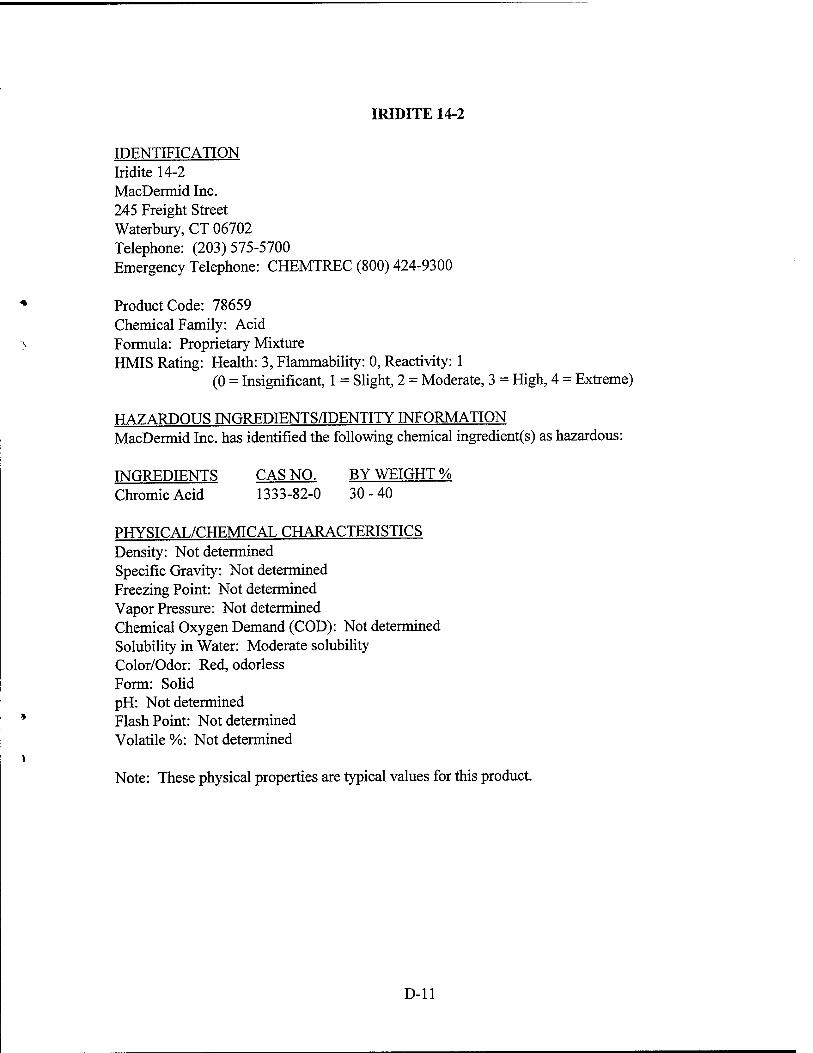
IRIDITE 14-2
IDENTIFICATION Iridite 14-2 MacDermid Inc. 245 Freight Street Waterbury, CT 06702 Telephone: (203) 575-5700 Emergency Telephone: CHEMTREC (800) 424-9300
Product Code: 78659 Chemical Family: Acid Formula: Proprietary Mixture HMIS Rating: Health: 3, Flammability: 0, Reactivity: 1
(0 = Insignificant, 1 = Slight, 2 = Moderate, 3 = High, 4 = Extreme)
HAZARDOUS INGREDIENTS/IDENTITY INFORMATION MacDermid Inc. has identified the following chemical ingredient(s) as hazardous:
INGREDIENTS CAS NO. BY WEIGHT % Chromic Acid 1333-82-0 30-40
PHYSICAL/CHEMICAL CHARACTERISTICS Density: Not determined Specific Gravity: Not determined Freezing Point: Not determined Vapor Pressure: Not determined Chemical Oxygen Demand (COD): Not determined Solubility in Water: Moderate solubility Color/Odor: Red, odorless Form: Solid pH: Not determined Flash Point: Not determined Volatile %: Not determined
Note: These physical properties are typical values for this product.
D-ll
DISTRIBUTION LIST
"\
AFCEE / MAXWELL, BROOKS AFB TX; AFCEE / PPD, BROOKS AFB TX AFIT / DEV, WRIGHT-PATTERSON AFB OH AGMC/EM / COLSON, NEWARK AFB OH AMARC/LABC / WILSON, DAVIS MONTHAN AFB AZ ANNISTON ARMY DEPOT / SDSAN-DEL-EMD, ANNISTON AL APCD / FRESNO CA; GOLETA CA; SAN DIEGO CA AQMD / SACRAMENTO CA; DIAMOND BAR CA ARMY ARDEC / PIRROTTA, PICATINNY NJ ARMY CRREL / ISKANDAR, HANOVER NH ARMY ENGRG DIV / ED-SY, HUNTSVILLE AL BAAQMD / CONTROL OFFICER, SAN FRANCISCO CA BARRON / LAFAYETTE CA BOEING DEFENSE AND SPACE GROUP / GROSHART, SEATTLE WA; OSBORNE,
SEATTLE WA BROOKS AFB / CODE HSC-YAQ, SAN ANTONIO TX BRULIN AND CO INC / ZUPAN, INDIANAPOLIS IN CAL AIR RESOURCE BOARD / SACRAMENTO CA CALEPA / GARZA, SACRAMENTO CA; LODER, SACRAMENTO CA; LUAN,
SACRAMENTO CA; CHEMICAL SOLUTIONS INC / MILLE, LIVERMORE CA CNO / CODE N451H, ARLINGTON VA COMSUBPAC / CODE 44A1, PEARL HARBOR HI CONCURRENT TECH CORP / JOHNSTOWN PA CORPUS CHRISTI ARMY DEPOT / GAWENIS, CORPUS CHRISTI TX; SDSCC-M
(MS-58), CORPUS CHRISTI TX DEFENSE DEPOT OGDEN / FACILITY ENGINEER, OGDEN UT DLA / BEDDOES, ALEXANDRIA VA; COFFIE, ALEXANDRIA VA FLT AIR CARIBBEAN / N09003, FPO AA HQ AFMC/ENX / BLACK, WRIGHT PATTERSON AFB OH; HERRING, WRIGHT
PATTERSON AFB OH; MONROE, WRIGHT PATTERSON AFB OH HQAMC / NAPOLITANO, ALEXANDRIA VA; VERDONIK, ALEXANDRIA VA INLAND TECH CORP / HALAR, TACOMA WA JACOBS ENGR GROUP / CALLAHAN, PASADENA CA JOINT DEPOT / SMITH, DAYTON OH LETTERKENNY ARMY DEPOT / SDSLE-EN, CHAMBERSBURG PA
LLNL / MELTZER, LIVERMORE CA LOCKHEED FORT WORTH CO / BARNES, FORT WORTH TX; PHILLIPS, FORT
WORTH TX; WOODROW, FORT WORTH TX LOCKHEED/MARTIN MISSILES AND SPACE / CAMAHORT, SUNNYVALE CA MCAS / ENVIRONMENTAL AFFAIRS, CHERRY POINT NC MCAS CHERRY POINT / CODE 35450, CHERRY POINT NC MCLB / CODE 88-4, ALBANY GA; CODE 883 (RIVERS), ALBANY GA; CODE 883
(WOODWARD), ALBANY GA MONTEREY BAY UNIFIED APCD / MONTEREY CA
NAB NORFOLK / N61463, NORFOLK VA NAS JACKSONVILLE / CODE 0015, JACKSONVILLE FL; CODE 340,
JACKSONVILLE FL; CODE 343, JACKSONVILLE FL; N09607, JACKSONVILLE FL
NAS NORTH ISLAND / CODE 344, SAN DIEGO CA NAVAIRSYSCOM / AIR-09Y, ARLINGTON VA NAVAVN DEPOT / LINN, JACKSONVILLE FL; CODE 640, MCAS CHERRY
POINT NC NAVAVN DEPOT JACKSONVILLE / CODE 0015, NAS JACKSONVILLE FL; NAVAVN DEPOT NORTH ISLAND / CODE 670, SAN DIEGO CA NAVAVNDEP / CODE 342, NAS JACKSONVILLE FL NAVBAS PEARL HARBOR / N61449, PEARL HARBOR HI NAVBAS SD / N00242, SAN DIEGO CA NAVDEP / CODE 647, CHERRY POINT NC; ROBERTS, CHERRY POINT NC NAVFAC / LING, ALEXANDRIA VA NAVMAG / CODE 09, LUALUALEI HI NAVSEASYSCOM / SEA-071&E, ARLINGTON VA NAVSHIP / CODE 900H, PORTSMOUTH NH; ATTN TAYLOR, PORTSMOUTH VA;
CODE 106, PEARL HARBOR HI NAVSUBASE BANGOR / N68742, SILVERDALE WA NAVSUBBASE / N55429, GROTON CT NAVWPNCEN / CODE C833, CHINA LAKE CA NAVY CFC / ARLINGTON VA NAWC / CODE 6062, WARMINSTER PA; CODE 832, WARMINSTER PA NOARL / CODE 440, NSTL MS NORDA / CODE 1121SP, NSTL MS NORFOLK NAVAL SHIPYARD / CODE 106, PORTSMOUTH VA NSWC / ANDREWS, CRANE IN; CODE 095, CRANE IN; CODE 095, INDIAN
HEAD MD; CODE 7067, CRANE IN; CODE OE, INDIAN HEAD MD; CODE SF, CRANE IN
NUWC / CODE 041, KEYPORT WA; CODE 043, KEYPORT WA; CODE EDX4, KEYPORT WA
NWS / CODE 09203, CONCORD CA; CODE 0923, SEAL BEACH CA; CODE 096, COLTS NECK NJ; CODE Hl, YORKTOWN VA
OC-ALC/EMV / RANKIN, TINKER AFB OK PUGET SOUND NAVSHIP / CODE 106.33, BREMERTON WA; CODE 134.6,
BREMERTON WA; CODE 248, BREMERTON WA; CODE 248.313, BREMERTON WA; SHOP 71, BREMERTON WA
PWC / CODE 400, WASHINGTON DC RED RIVER ARMY DEPOT / WRIGHT, TEXARKANA TX SA-ALC/EMP / CHABOT, KELLY AFB TX SM-ALC/EMPM / ROCKSWOLD, MCCLELLAN AFB CA SWAP / SILVER SPRING MD THE BRUCE CO / WASHINGTON DC
TOBYHANNA ARMY DEPOT / PARRENT, TOBYHANNA PA; SDSTO-ME, TOBYHANNA PA
TOOELE ARMY DEPOT / SDSTE-IRE, TOOELE UT UNIV OF MASS / BULKO, LOWELL MA US ARMY MATERIAL COMMAND / AMCEN-A, ALEXANDRIA VA; AMCLG-MJ,
ALEXANDRIA VA US EPA / HAZWAST, WASHINGTON DC; NATICH, RESEARCH TRIANGLE
PARK NC; PPIC, WASHINGTON DC US GEOLOGICAL SURVEY / BALES, RALEIGH NC USAEC / CETHA-EC, ABERDEEN PROVING GROUND MD; SFIM-AEC-ECS,
ABERDEEN PROVING GROUND MD; SFIM-AEC-ETD, ABERDEEN ABERDEEN PROVING GROUND MD
USCG / G-EAE-39A, BELTSVILLE MD USCG HQ / G-ECV-4B, WASHINGTON DC
USNF JAPAN / N57006, FPO AP USNF KOREA / N62894, APO AP USNF MARIANAS / N57043, FPO AP VCAPCD / VENTURA CA WATER POLLUTION PLANT / MUKHAR, SAN JOSE CA WR-ALC/TJ.EAC / (GIBBS), ROBINS AFB GA


![Clasificarea tr[1]](https://img.pdfslide.net/doc/110x75/6316a0500f5bd76c2f028dd9/clasificarea-tr1.jpg)