Embed Size (px)
Citation preview

Deep-Sea Research I 79 (2013) 20–39
Contents lists available at SciVerse ScienceDirect
Deep-Sea Research I
0967-06http://d
n CorrE-m
journal homepage: www.elsevier.com/locate/dsri
Revised circulation scheme north of the Denmark Strait
Kjetil Våge a,n, Robert S. Pickart b, Michael A. Spall b, G.W.K. Moore c, Héðinn Valdimarsson d,Daniel J. Torres b, Svetlana Y. Erofeeva e, Jan Even Ø. Nilsen f
a Geophysical Institute and Bjerknes Centre for Climate Research, University of Bergen, Bergen, Norwayb Woods Hole Oceanographic Institution, Woods Hole, USAc University of Toronto, Toronto, Canadad Marine Research Institute, Reykjavik, Icelande College of Oceanic and Atmospheric Sciences, Oregon State University, Corvallis, USAf Nansen Environmental and Remote Sensing Center and Bjerknes Centre for Climate Research, Bergen, Norway
a r t i c l e i n f o
Article history:Received 31 January 2013Received in revised form26 April 2013Accepted 16 May 2013Available online 24 May 2013
Keywords:Denmark StraitEast Greenland CurrentNorth Icelandic JetBlosseville BasinDenmark Strait Overflow WaterArctic freshwater export
37/$ - see front matter & 2013 Elsevier Ltd. Ax.doi.org/10.1016/j.dsr.2013.05.007
esponding author. Tel.: +47 55582605.ail address: [email protected] (K. Våge).
a b s t r a c t
The circulation and water mass transports north of the Denmark Strait are investigated using recentlycollected and historical in situ data along with an idealized numerical model and atmospheric reanalysisfields. Emphasis is placed on the pathways of dense water feeding the Denmark Strait Overflow Waterplume as well as the upper-layer circulation of freshwater. It is found that the East Greenland Current(EGC) bifurcates at the northern end of the Blosseville Basin, some 450 km upstream of the DenmarkStrait, advecting overflow water and surface freshwater away from the boundary. This “separated EGC”flows southward adjacent to the previously identified North Icelandic Jet, indicating that approximately70% of the Denmark Strait Overflow Water approaches the sill along the Iceland continental slope.Roughly a quarter of the freshwater transport of the EGC is diverted offshore via the bifurcation. Twohypotheses are examined to explain the existence of the separated EGC. The atmospheric fieldsdemonstrate that flow distortion due to the orography of Greenland imparts significant vorticity intothe ocean in this region. The negative wind stress curl, together with the closed bathymetric contours ofthe Blosseville Basin, is conducive for spinning up an anti-cyclonic gyre whose offshore branch couldrepresent the separated EGC. An idealized numerical simulation suggests instead that the current isprimarily eddy-forced. In particular, baroclinic instability of the model EGC spawns large anti-cyclonesthat migrate offshore and coalesce upon reaching the Iceland continental slope, resulting in theseparated EGC. Regardless of the formation mechanism, the recently obtained shipboard data andhistorical hydrography both indicate that the separated EGC is a permanent feature of the circulationnorth of the Denmark Strait.
& 2013 Elsevier Ltd. All rights reserved.
1. Introduction
The meridional exchange across the Greenland–Scotland Ridge isof key importance for the North Atlantic climate system. Warm,saline Gulf Stream-origin waters flow northward across the ridgeinto the Nordic seas, release heat to the atmosphere, and aretransformed into dense overflow waters. These waters return south-ward by flowing through gaps in the ridge as overflow plumes,which form the lower limb of the Atlantic Meridional OverturningCirculation (AMOC). As part of the horizontal circulation, freshsurface waters from the Arctic Ocean are fluxed southward alongthe western boundary of the Nordic seas and across the ridge. Mostof this freshwater, as well as the densest portion of the AMOC – the
ll rights reserved.
Denmark Strait Overflow Water (DSOW) – pass between Greenlandand Iceland. As such, the Denmark Strait is a critical and complexchoke point in the subpolar circulation, and the pathways and watermass transports north of the strait help dictate the magnitude of theexchange between the Nordic seas and the North Atlantic Ocean.
The climatic importance of the deep overflows across theGreenland–Scotland Ridge was first hypothesized by Cooper(1955), and about a decade later remarkably accurate estimatesof the overflow transports had been made (see Dickson et al.,2008, for an overview of the early measurements). The mostrecent observations of the DSOW near the sill indicate a meantransport of 3.4 Sv (1 Sv¼106 m3/s, Jochumsen et al., in press). Thefirst definitive scenario for the source of the DSOW was put forthby Swift et al. (1980) who suggested that the water comprisingthe plume originated from open-ocean convection in the centralIceland Sea (Swift and Aagaard, 1981). A later study then steered thecommunity towards the idea that the transformation of Atlantic inflow

K. Våge et al. / Deep-Sea Research I 79 (2013) 20–39 21
into DSOW occurs primarily within the boundary current system ofthe Nordic seas (Mauritzen,1996). This notion has persisted, supportedby a recent study using over 50 years of historical hydrographic data(Eldevik et al., 2009).
Consistent with this, it was noted that Atlantic-origin water,modified by some exchange with the Greenland and Iceland seas,comprised the bulk of the overflow (Rudels et al., 2002, 2005).Geochemical tracer data suggest that the DSOW is a complexmixture of a large set of water masses originating from differentregions. However, it is generally believed that Atlantic-originwater forms the major part of the overflow (Tanhua et al., 2005,2008; Jeansson et al., 2008), with some contribution from theIceland Sea (Olsson et al., 2005). One common link in all of thesestudies is that the primary pathway by which the source waters ofthe DSOW enter the strait is the East Greenland Current (EGC,Fig. 1). There is increasing evidence, however, that this may not bethe case.
A previously unknown current flowing along the continentalslope north of Iceland in the direction of the Denmark Straitwas identified by Jónsson (1999) and Jónsson and Valdimarsson(2004), which is now referred to as the North Icelandic Jet (NIJ,Fig. 1). These studies found that the NIJ was potentially of sufficientstrength to account for most of the transport of DSOWacross the sillif some entrainment of ambient water was included. However, itwas subsequently suggested that the NIJ is not an independentcurrent, but rather a branch of the EGC. For example, hydraulictheory predicts that as the deep-reaching EGC approaches theDenmark Strait and encounters shoaling bathymetry, the Icelandcontinental slope becomes a dynamical western boundary due tothe topographic beta effect arising from the sloping bottom, forcingthe EGC to cross from the Greenland side to the Iceland side (e.g.Pratt, 2004). Another possibility, present in the model simulations
Fig. 1. Two overturning circulation schemes in the Nordic seas in which warm, light scolors). The first scheme is the boundary current loop around the perimeter of thehypothesized interior loop north of Iceland (Våge et al., 2011b). (For interpretation of thethis article.)
of Köhl et al. (2007), is that the NIJ is a branch of the EGC thatbifurcates upstream of the strait as part of a time dependentprocess. According to their model, the total volume transport ofthe two branches is constant and the DSOW may be supplied byeither branch.
By contrast, other model studies suggest that, at times, the NIJmay not be directly related to the EGC. Köhl (2010) argued that themagnitude of the cyclonic wind stress curl in the region dictatesthe source of the NIJ. In particular, when the curl is strong the NIJoriginates from the EGC, but during periods of weak curl the NIJemanates from the northern Iceland Sea. In the latter case thecurrent stems from an offshoot of the weakening cyclonic circula-tion in the Iceland Sea. In some of the idealized configurations of asimilar model, Käse et al. (2009) found that the NIJ can originatefrom a southward flow of dense water along the Jan Mayen Ridgenortheast of Iceland. Such temporal switching between sources ofthe overflow water has also been noted in observational studies(Rudels et al., 2003; Olsson et al., 2005; Holfort and Albrecht,2007).
A recent investigation has shed further light on the nature andsource of the NIJ, which suggests that the dense current is neither abranch of the EGC nor does it originate from the northern IcelandSea or the Jan Mayen Ridge. Data from two extensive hydrographic/velocity surveys along the Iceland slope in 2008 and 2009 implythat the NIJ advects both the densest overflow water into theDenmark Strait as well as roughly half of the total overflowtransport (1.570.2 Sv, Våge et al., 2011b). Våge et al. (2011b) tracedthe current upstream as far as the northeast corner of Iceland,where it weakened considerably (recently collected unpublisheddata support this view as well). Its distinct hydrographic propertiesprovide additional evidence that the NIJ is independent from theEGC. Using an idealized numerical simulation, Våge et al. (2011b)
urface waters (red colors) are transformed into cold, dense overflow waters (blueNordic seas identified by Mauritzen (1996). The second scheme is the recentlyreferences to color in this figure caption, the reader is referred to the web version of
K. Våge et al. / Deep-Sea Research I 79 (2013) 20–3922
argued that the NIJ mainly originates along the north slope ofIceland as a deep limb of a local overturning cell whose upperbranch is the North Icelandic Irminger Current (NIIC, Fig. 1), whichflows northward on the eastern side of the Denmark Strait. Specifi-cally, the warm, salty inflow is exchanged laterally with dense watertransformed via air–sea interaction in the interior Iceland Sea. Thedense water subsequently sinks near the boundary to form the NIJ.These results place a renewed emphasis on the Iceland Sea as apotential contributor to the AMOC.
While the transport of dense overflow water through theDenmark Strait is reasonably well quantified (Jochumsen et al.,2012), the flow of buoyant freshwater through the strait remainslargely unknown. Only recently have estimates of the EGC fresh-water volume transport been made (Holfort et al., 2008). The abilityto measure this transport using moored instruments is hamperedby the presence of ice. However, Holfort and Meincke (2005)successfully deployed moorings at 741N east of Greenland, approxi-mately halfway between the Fram Strait and the Denmark Strait,resulting in the first EGC total (liquid and solid) freshwater fluxestimate of 40–55 mSv (referenced to a salinity of 34.9). In the FramStrait an extensive mooring array has been maintained since 1997,and a decade-long time series of liquid freshwater flux was recentlypresented by de Steur et al. (2009). Some synoptic measurementsof liquid freshwater flux along the east coast of Greenland also exist(e.g. Nilsson et al., 2008; Sutherland and Pickart, 2008) as well asestimates of the solid freshwater export from the Arctic Oceanthrough the Fram Strait (e.g. Kwok et al., 2004).
One of the important aspects of freshwater in the high-latitudeclimate system is its ability to influence deep convection. However,in order to impact the convective activity in the Nordic seas andsubpolar North Atlantic, there must be a flux of freshwater fromthe boundary current into the interior convective regions. Thereare two known direct export pathways of freshwater from theEGC into the Nordic seas: the Jan Mayen Current north of the JanMayen Fracture Zone and the East Icelandic Current north ofIceland. However, these pathways together account for only asmall fraction of the freshwater flux through the Fram Strait(15 mSv or about 13%, Jónsson, 2007; Dickson et al., 2007). Addi-tional exchange between the EGC and the interior is thought to beminor (Aagaard and Carmack, 1989; Nilsson et al., 2008), leaving thebulk of the liquid freshwater to remain within the EGC (this is notnecessarily the case for the solid freshwater, see Jones et al., 2008;Dodd et al., 2009, 2012). Freshwater volume transports of the EGCthrough the Denmark Strait have also been obtained by construct-ing budgets for the Nordic seas (Dickson et al., 2007; Segtnan et al.,2011), but these values represent residuals in the basin-widebalances.
While the importance of the Denmark Strait for the NorthAtlantic climate system is well established, the complex circulationin and upstream of the strait is not fully understood. Oceanogra-phers have been aware of the northern overflows for a century(Nansen, 1912), yet a consensus has not been reached regardingthe origin of their source waters. Closed heat and freshwaterbudgets for the Nordic seas will not be attainable until reliabletransport measurements throughout the water column have beenmade in the vicinity of the strait. The motivation for the presentstudy is to advance our understanding of the shallow and deepcirculation in this critically important area. Using a collectionof oceanic and atmospheric data sets, together with a numericalmodel, we present new aspects of the water mass pathways anddynamics in this region, with emphasis on the EGC system. Weprovide evidence of a heretofore unknown interior branch of theEGC north of the Denmark Strait that impacts the supply of bothbuoyant freshwater and dense overflow water to the strait. Werefer to this current as the “separated EGC”. Our primary objectivesare to establish the existence of the separated EGC, quantify its
structure and transport, and elucidate the dynamics by which it isformed, including the role of atmospheric forcing.
The structure of the paper is as follows. The various data setsand methods are presented in Section 2. We use a collection ofhigh-resolution synoptic realizations of a hydrographic/velocitytransect from Greenland to Iceland in Section 3, along with historicalhydrographic data in Section 4, to investigate the circulation north ofthe Denmark Strait. The wind forcing is described using atmosphericreanalysis fields in Section 5. Finally, a numerical model is used inSection 6 to explore the internal and external forcing mechanismsresponsible for the separated branch of the EGC and the associatedinterior flux of overflow water and freshwater.
2. Data and methods
2.1. Synoptic sections
Four synoptic hydrographic/velocity realizations of a transectfrom Greenland to Iceland across the Blosseville Basin (Fig. 2) areconsidered in the study. The transect, known as the Kögur section,was occupied in August 2004, October 2008, August 2011, andAugust 2012. Some aspects of two of the occupations have beenpreviously presented (Sutherland and Pickart, 2008; Våge et al.,2011b). The hydrographic measurements were obtained using aSea-Bird conductivity–temperature–depth (CTD) instrument, andvelocities were measured using acoustic Doppler current profilers(ADCPs): an upward- and downward-facing lowered ADCP systemin August 2012, and vessel-mounted ADCPs on the remainingcruises. The vessel-mounted ADCP instrument malfunctioned atthe western end of the August 2004 occupation, and hence novelocity data were obtained on the Greenland shelf during thatcruise. Vertical sections of potential temperature, salinity, poten-tial density, and ADCP velocity for each cruise were constructedusing Laplacian-spline interpolation with a grid spacing of 2 kmby 10 m. From the temperature and salinity fields, the relativegeostrophic flow normal to each section was calculated, which wasthen referenced by matching this to the vertically averaged ADCPvelocities over the common depth interval at each horizontalgrid point (Pickart et al., 2005). The accuracies of the pressure,temperature, salinity, and absolutely referenced velocity fields areestimated to be 0.3 dbar, 0.001 1C, 0.002, and 3.6 cm s−1, respec-tively. See Våge et al. (2011b) for further details of the dataprocessing and Appendix A for a description of the de-tidingprocedure and the methodology for calculating transports, includ-ing errors.
2.2. Historical hydrography
The historical hydrographic data employed in this study coverthe period from 1980 to the present and were acquired from thearchives of the Marine Research Institute of Iceland, the Interna-tional Council for the Exploration of the Seas (ICES), the WorldOcean Database, the Norwegian Iceland Seas Experiment (NISE)database (Nilsen et al., 2008), and the Argo global program ofprofiling floats (using only delayed-mode data, which have beencorrected for drift in the conductivity and pressure sensors, Wonget al., 2003). The profiles from these different sources were com-bined into a single product, hereafter referred to as the historicalhydrographic data set. Only observations obtained during thesummer half-year period of May through October (66% of the totalnumber of measurements) are considered here due to a dearth ofwintertime data on the Greenland continental shelf and slope. SeeAppendix B for details of the quality control and gridding of thehistorical hydrography.

Fig. 2. Bathymetry of the Iceland Sea and the Denmark Strait from the ETOPO2 2-min elevation data base. The closed white contour is the 1400 m isobath roughlydelineating the Blosseville Basin, and the black line identifies the Kögur transect (named after the Kögur mountain on the northwest coast of Iceland). Depth is contouredwith 200 m increments starting at 200 m.
K. Våge et al. / Deep-Sea Research I 79 (2013) 20–39 23
2.3. Meteorological fields
We employ two different reanalysis products in this work. TheInterim Reanalysis (ERA-I) from the European Center for MediumRange Weather Forecasts is a global product (Dee et al., 2011).We use the 0.751 interpolated 6-hourly fields for the period fromJanuary 1979 to December 2011. Comparison with aircraft andship observations in the southeast Greenland region shows goodagreement with ERA-I (Renfrew et al., 2009; Harden et al., 2011).
For a higher resolution view of the surface wind field in theregion of interest, we also make use of the North AmericanRegional Reanalysis (NARR) from the US National MeteorologicalCenter (Mesinger et al., 2006). The NARR is a regional data set thatcovers the North American continent as well as adjoining oceanicregions including southeast Greenland and the Irminger Sea, withlateral boundary conditions provided by the NCEP-2 global reana-lysis. The NARR has a horizontal resolution of approximately32 km. For this paper we use the full 3-hourly resolution dataset for the period from January 1979 to December 2011. Recentstudies of the flow distortion around the topography of southernGreenland indicate that the NARR surface fields are in good overallagreement with both aircraft and buoy observations (Moore et al.,2008; Renfrew et al., 2009).
2.4. Idealized simulations
A high-resolution regional general circulation model is imple-mented to aid in the interpretation of the observational resultsand to provide insights on the dynamics of the circulation. Themodel is the MITgcm (Marshall et al., 1997), which solves thehydrostatic primitive equations of motion on a fixed Cartesian,staggered C-grid in the horizontal and at constant depths inthe vertical. Bottom topography is treated with a partial cell,
which provides a high-resolution representation of the bottomtopography while retaining accuracy in the calculation of thehorizontal pressure gradient (Adcroft et al., 1997). The model usesa linear equation of state ρ¼ ρ0 þ βðS−S0Þ, where β¼ 0:8 kg=m3,ρ0 ¼ 1026:5 kg=m3 is a reference density, and S0¼32.5 a referencesalinity. For simplicity, only salinity is considered (temperatureis constant).
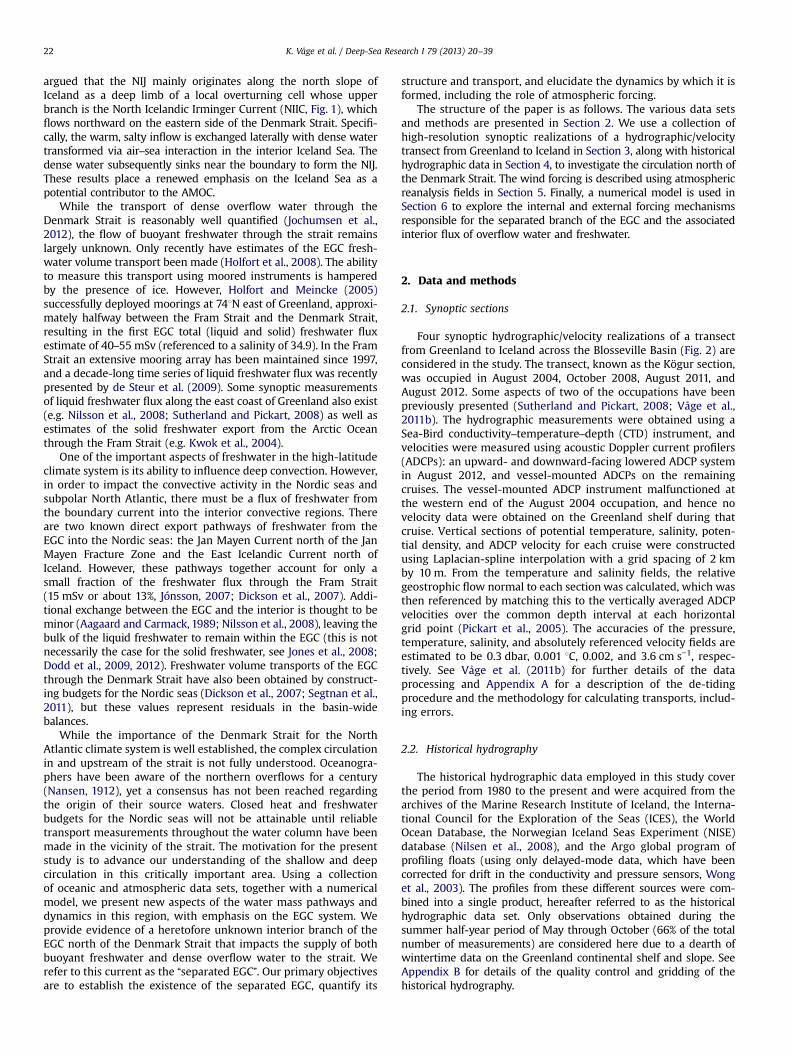
The model domain is a channel oriented along the east coast ofGreenland, extending 864 km in the along-boundary direction, y,and 480 km in the offshore direction, x (Fig. 3, rotated counter-clockwise by 331). The Coriolis parameter is f ¼ 1:3� 10�4 1=s,taken to be constant. The bottom topography has been linearlyinterpolated to the model grid from the ETOPO2 2-min elevationdata base and then smoothed with a 5-point filter. The model isinitialized with fresh, stratified water on the shelf (bottom depthsshallower than 400 m) with a minimum salinity of 32 at thesurface, which varies exponentially with vertical scale of 250 mtowards a deep salinity of 35. The basin interior (bottom depthsgreater than 575 m) is filled with unstratified water with a salinityof 35. The salinity at each depth in the transition region between400 and 575 m bottom depth is linearly interpolated between theshelf and interior values at each depth. The stratification in theregion between 740 and 840 km in y and the region offshore of350 km in x are restored towards this initial state with a time scaleof 5 days. This provides a source of freshwater on the shelf andsaline water in the basin interior. The long-time evolution is notqualitatively sensitive to the details of the initial profile, providedthat freshwater is initialized over the shelf. The bottom topogra-phy in the region between 804 and 864 km is linearly interpolatedfrom the value at y¼0 to that at y¼804 km. In this way, the flowout of the southern end of the channel provides the inflow fromthe north and mass is conserved, while the restoring of salinitymaintains freshwater on the shelf. The region offshore of this
x (km)
y (k
m)
0 200 4000
100
200
300
400
500
600
700
800
0
200
400
600
800
1000
1200
1400
1600
Fig. 3. Model domain and bottom topography. The white regions are land.
K. Våge et al. / Deep-Sea Research I 79 (2013) 20–3924
northern restoring region is a solid boundary, provided to preventlarge-scale recirculations in the interior. The offshore boundary ofthe model is placed far from the region of interest, and salinityrestoring for x4350 km is used to minimize influences of Ekmantransport interacting with the solid eastern boundary.
The horizontal resolution of the model is 1 km in both the x andy directions. There are 30 levels in the vertical, with grid spacingincreasing from 5 m over the upper 20 m to 250 m near thebottom. The maximum bottom depth is approximately 1500 m.The model incorporates second order vertical viscosity anddiffusivity with coefficients of 10−5 m2=s. Horizontal viscosity isparameterized as a second order operator with the coefficient Ah
determined by a Smagorinsky closure as
Ah ¼ ðν=πÞ2Δ2D; ð1Þ
where Δ is the grid spacing, and D is the deformation rate definedas D¼ ½ðux−vyÞ2 þ ðuy þ vxÞ2�1=2, u and v are the horizontal velo-cities, subscripts indicate partial differentiation, and ν¼ 1. There isno explicit diffusion of salinity.
1 From here on we use the term shelf break EGC to distinguish the EGC fromthe separated EGC in the Blosseville Basin.
3. Synoptic transects north of the Denmark Strait
The Kögur transect (Fig. 2) extends from Greenland to Icelandacross the Blosseville Basin, hence capturing all of the advectivepathways into the Denmark Strait. The transect is sufficiently farupstream that distinct deep pathways can be distinguished priorto forming the merged DSOW plume that subsequently overflowsthe sill. To investigate the conditions north of the strait, wefirst examine the mean flow patterns and hydrography, and theninspect the individual realizations in more detail. Finally, transportestimates for each pathway are presented.
3.1. Mean velocity structure
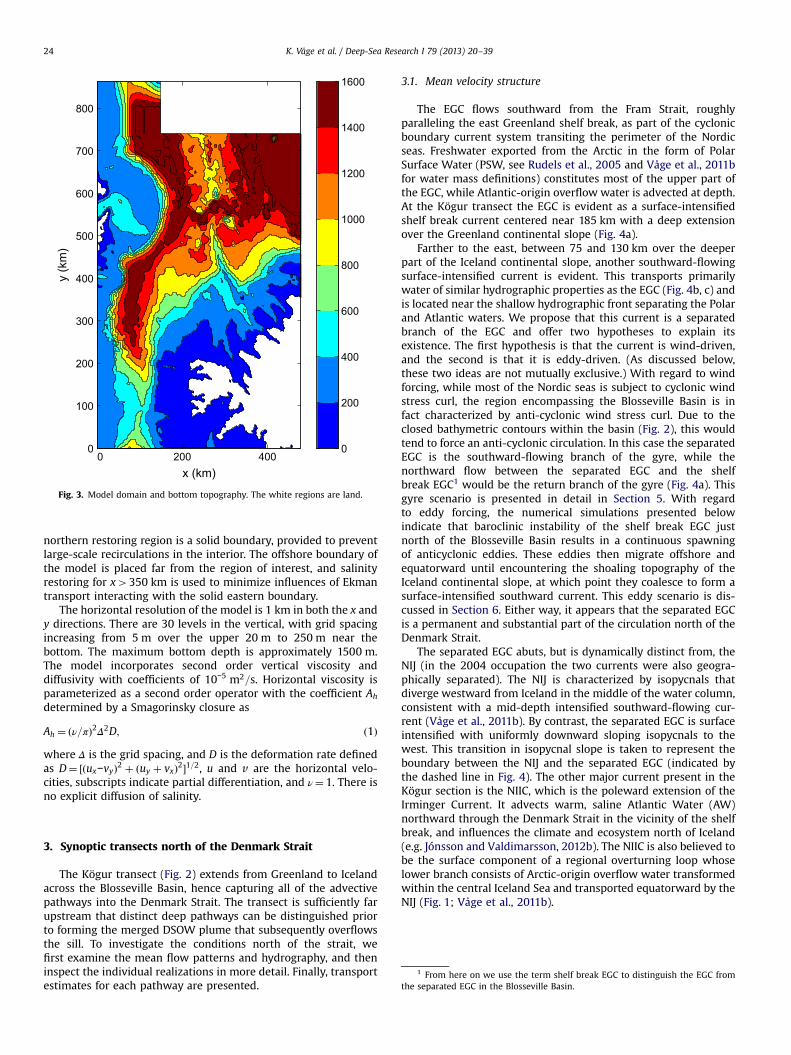
The EGC flows southward from the Fram Strait, roughlyparalleling the east Greenland shelf break, as part of the cyclonicboundary current system transiting the perimeter of the Nordicseas. Freshwater exported from the Arctic in the form of PolarSurface Water (PSW, see Rudels et al., 2005 and Våge et al., 2011bfor water mass definitions) constitutes most of the upper part ofthe EGC, while Atlantic-origin overflow water is advected at depth.At the Kögur transect the EGC is evident as a surface-intensifiedshelf break current centered near 185 km with a deep extensionover the Greenland continental slope (Fig. 4a).
Farther to the east, between 75 and 130 km over the deeperpart of the Iceland continental slope, another southward-flowingsurface-intensified current is evident. This transports primarilywater of similar hydrographic properties as the EGC (Fig. 4b, c) andis located near the shallow hydrographic front separating the Polarand Atlantic waters. We propose that this current is a separatedbranch of the EGC and offer two hypotheses to explain itsexistence. The first hypothesis is that the current is wind-driven,and the second is that it is eddy-driven. (As discussed below,these two ideas are not mutually exclusive.) With regard to windforcing, while most of the Nordic seas is subject to cyclonic windstress curl, the region encompassing the Blosseville Basin is infact characterized by anti-cyclonic wind stress curl. Due to theclosed bathymetric contours within the basin (Fig. 2), this wouldtend to force an anti-cyclonic circulation. In this case the separatedEGC is the southward-flowing branch of the gyre, while thenorthward flow between the separated EGC and the shelfbreak EGC1 would be the return branch of the gyre (Fig. 4a). Thisgyre scenario is presented in detail in Section 5. With regardto eddy forcing, the numerical simulations presented belowindicate that baroclinic instability of the shelf break EGC justnorth of the Blosseville Basin results in a continuous spawningof anticyclonic eddies. These eddies then migrate offshore andequatorward until encountering the shoaling topography of theIceland continental slope, at which point they coalesce to form asurface-intensified southward current. This eddy scenario is dis-cussed in Section 6. Either way, it appears that the separated EGCis a permanent and substantial part of the circulation north of theDenmark Strait.
The separated EGC abuts, but is dynamically distinct from, theNIJ (in the 2004 occupation the two currents were also geogra-phically separated). The NIJ is characterized by isopycnals thatdiverge westward from Iceland in the middle of the water column,consistent with a mid-depth intensified southward-flowing cur-rent (Våge et al., 2011b). By contrast, the separated EGC is surfaceintensified with uniformly downward sloping isopycnals to thewest. This transition in isopycnal slope is taken to represent theboundary between the NIJ and the separated EGC (indicated bythe dashed line in Fig. 4). The other major current present in theKögur section is the NIIC, which is the poleward extension of theIrminger Current. It advects warm, saline Atlantic Water (AW)northward through the Denmark Strait in the vicinity of the shelfbreak, and influences the climate and ecosystem north of Iceland(e.g. Jónsson and Valdimarsson, 2012b). The NIIC is also believed tobe the surface component of a regional overturning loop whoselower branch consists of Arctic-origin overflow water transformedwithin the central Iceland Sea and transported equatorward by theNIJ (Fig. 1; Våge et al., 2011b).

Fig. 4. Mean vertical sections along the Kögur transect. (a) Absolutely referenced geostrophic velocity (color, cm/s, equatorward flow is negative), overlain by potentialdensity (thin gray contours, kg/m3). The 27.8 kg/m3 isopycnal and the 0 1C isotherm are highlighted in white. The dashed vertical line indicates the boundary between theseparated EGC and the NIJ. The thick black line in (a) is the zero velocity contour. The acronyms are: EGC¼East Greenland Current; NIJ¼North Icelandic Jet; NIIC¼NorthIcelandic Irminger Current; PSW¼Polar Surface Water; AW¼Atlantic Water; Atl¼Atlantic-origin overflow water; Arc¼Arctic-origin overflow water. (b) Potentialtemperature (color, 1C) and (c) Salinity (color). (For interpretation of the references to color in this figure caption, the reader is referred to the web version of this article.)
K. Våge et al. / Deep-Sea Research I 79 (2013) 20–39 25
3.2. Mean hydrographic structure
In the mean Kögur section, cold, fresh PSW dominates theupper water column on the Greenland shelf. This water massextends far offshore into the interior of the Blosseville Basin, morethan halfway across the transect (Fig. 4b, c). Warm, saline AW isfound over the Iceland shelf and slope.
Below the surface layer, water denser than sθ ¼ 27:8 kg=m3
(the upper white contour in Fig. 4) has traditionally been identi-fied as overflow water (e.g. Dickson and Brown, 1994). FollowingVåge et al. (2011b), we distinguish two types of overflow water:Atlantic- and Arctic-origin overflow waters, warmer and colderthan 0 1C, respectively, (the 0 1C contour is highlighted white inFig. 4). These names refer to the geographic domain in whichthe transformation from surface to overflow water takes place(Swift and Aagaard, 1981). The Atlantic-origin overflow water is
identified by an intermediate maximum in temperature andsalinity, and is primarily found between 27.9 and 28.0 kg/m3
isopycnals. In the mean Kögur transect this layer extends fromthe Greenland continental slope and shoals towards the surfacefront of the separated EGC. Two cores of Atlantic-origin overflowwater, near 100 and 170 km, appear to be associated with theseparated EGC and the shelf break EGC, respectively. On theeastern side of the Kögur section the Arctic-origin overflow wateris banked up high on the Iceland continental slope. This formsthe densest component of the DSOW plume (generally denserthan 28.03 kg/m3), and is primarily supplied by the NIJ (Våge et al.,2011b).
The PSW and Atlantic-origin overflow water are generallyassociated with the EGC and hence largely confined to the Greenlandshelf and slope (this is particularly true for the shallow waters,Aagaard and Carmack, 1989; Nilsson et al., 2008). However, our data

Fig. 5. Vertical sections along the Kögur transect of absolute geostrophic velocity (color, cm/s, equatorward flow is negative) overlain by potential density (contours, kg/m3).The panels show the (a) August 2004, (b) October 2008, (c) August 2011, and (d) August 2012 realizations. The 27.8 kg/m3 isopycnal and the 0 1C isotherm are highlighted inwhite. The dashed vertical line indicates the approximate boundary between the separated EGC and the NIJ. The black line is the zero velocity contour. The black trianglesindicate station locations. (For interpretation of the references to color in this figure caption, the reader is referred to the web version of this article.)
K. Våge et al. / Deep-Sea Research I 79 (2013) 20–3926
reveal that, associated with the separated EGC, these water masses areclearly found in the interior of the Blosseville Basin as well (Fig. 4b, c).Regardless of the process by which the separated EGC is formed, thiscurrent provides another means of shelf–basin exchange in addition tothe direct advective pathways represented by the Jan Mayen Currentand the East Icelandic Current.
3.3. Temporal variability
The major flow features present in the mean Kögur transect –the two branches of the EGC, the NIJ and the NIIC – are evident aswell in each of the individual realizations (Fig. 5).2 On the westernside of the transect one sees the shelf break EGC, although it isvariable in magnitude from section to section. This is likely due inpart to the strength of the wind forcing. For example, in October2008 the shelf break EGC was quite strong because it was underthe influence of northerly winds, while in August 2012 the windswere predominantly from the south, which likely resulted in thepoleward flow at depth that “split” the shelf break EGC in two. Thedeep extension of the shelf break EGC, which carries the overflowwater, seems to vary both in strength and in lateral position in theindividual realizations.
On the eastern side of the Kögur section the NIIC was sampledon three occasions (the August 2011 occupation did not extendonto the Iceland continental shelf), evident as a surface-intensifiedpoleward flow. In October 2008 and August 2012 the current waslocated near the shelf break, while in August 2004 it was foundfarther inshore on the shelf. Seaward of this, in all four realiza-tions, the NIJ was situated near the 650 m isobath, which is alsothe depth of the Denmark Strait sill. This is consistent with theresults of Våge et al. (2011b) who demonstrated that the NIJ feedsthe DSOW. At times the NIJ consisted of distinct filaments ofequatorward flow, the reasons for which remain unclear. However,we note that the NIJ's characteristic isopycnal divergence and mid-depth intensification were present in each realization.
2 This provides justification for computing a mean section based only on fourrealizations.
Seaward of the NIJ, in the eastern part of the Blosseville Basinover the deep Iceland continental slope, the separated EGC ispresent in each occupation of the Kögur transect. This currentresides at the hydrographic front where the bulk of the PSW layerends. As is true for the shelf break branch of the EGC, the lateralsalinity gradient dominates the temperature gradient, resultingin a density front that supports a surface-intensified southward-flowing jet. One sees that the penetration depth of the separatedEGC can be quite extensive. Interestingly, the first two realizationsof the Kögur section (2004 and 2008) are more reminiscent of theabove-mentioned gyre scenario. In those two cases there is a well-defined deep-reaching poleward flow to the west that could beconstrued as the northward branch of the gyre. By contrast, thelatter two realizations of the transect (2011 and 2012) suggestthe presence of eddies. In particular, note the lens of cold PSWcentered at 105 km in the 2011 occupation (Figs. 6c and 7c),corresponding to an anti-cyclonic surface-intensified circulation(Fig. 5c). This is indicative of a large eddy that might have beenshed from the shelf break EGC. These two scenarios, eddy-forcedvs. wind-forced, are elaborated on later in the paper.
3.4. Transports
We now document the volume transport, and, where appro-priate, the freshwater transport of each of the equatorwardcurrents present in the Kögur transect. This demonstrates theimportance of the NIJ as well as the separated EGC – both newlyrevealed features – in the circulation system north of the DenmarkStrait. Averaged over all four realizations, the shelf break EGCtransported 108724 mSv and the separated EGC 2977 mSv offreshwater relative to a reference salinity of 34.8 (Fig. 8a). Hence,nearly one quarter of the total freshwater transport within the EGCsystem takes place in the interior of the Blosseville Basin, whichmust be considered in order to obtain accurate estimates of thefreshwater export through the Denmark Strait. Most ð495%Þof this freshwater transport takes place within the upper 200 mof the water column, while a negligible amount is transported bythe NIJ.

Fig. 6. Same as Fig. 5, but for potential temperature (color, 1C). (For interpretation of the references to color in this figure caption, the reader is referred to the web version ofthis article.)
Fig. 7. Same as Fig. 5, but for salinity (color). (For interpretation of the references to color in this figure caption, the reader is referred to the web version of this article.)
K. Våge et al. / Deep-Sea Research I 79 (2013) 20–39 27
There have been no mooring-based estimates of liquid fresh-water transport in the vicinity of the Denmark Strait because ofthe inherent risks due to pack-ice and icebergs. As such, themost relevant numbers for comparison were obtained assumingbalanced Nordic seas freshwater budgets. Relative to referencesalinities of 35.2 and 34.9, Dickson et al. (2007) and Segtnan et al.(2011) computed freshwater fluxes through the Denmark Straitof 151 and 130 mSv, respectively. Our corresponding numbers forthe composite EGC are 223737 mSv and 159728 mSv. While theestimates of Dickson et al. (2007) and Segtnan et al. (2011) aretotal freshwater flux (liquid and solid), only small amounts of seaice were encountered during our realizations, hence it is reason-able to compare our estimates with the earlier studies. The volumetransport of water lighter than sθ ¼ 27:8 kg=m3 across the Kögurtransect is 2.670.3 Sv in the shelfbreak EGC and 1.370.1 Sv in the
separated EGC. The combined transport is substantially largerthan the 1.3 Sv of surface outflow in the EGC reported by Hansenand Østerhus (2000).
The hydrographic analysis of Mauritzen (1996) suggested thatthe main path of overflow water into the Denmark Strait is alongthe continental slope of east Greenland via the EGC. Our resultsimply instead that the majority of the overflow water approachesthe strait from the Iceland continental slope through a combina-tion of the NIJ and the separated EGC. While this is consistent withpredictions from hydraulic theory (e.g. Pratt, 2004), we will showin Sections 5 and 6 that the separated EGC has not simplyswitched to the Iceland side due to shoaling bathymetry of thestrait. Furthermore, Våge et al. (2011b) have previously documen-ted that the NIJ originates along the Iceland continental slope farupstream of the Denmark Strait. Hence the topographic beta effect

−180
−160
−140
−120
−100
−80
−60
−40
−20
02004 2008 2011 2012 Mean 2004 2008 2011 2012 Mean
Fres
hwat
er tr
ansp
ort (
mS
v)
−2.5
−2
−1.5
−1
−0.5
02004 2008 2011 2012 Mean 2004 2008 2011 2012 Mean 2004 2008 2011 2012 Mean
Shelf break EGC Separated EGC NIJ
Ove
rflow
wat
er tr
ansp
ort (
Sv)
Fig. 8. Transport estimates across the Kögur transect (equatorward flow is negative) for the shelf break EGC (left), the separated EGC (middle), and the NIJ (right). Panel(a) shows freshwater transports (relative to a reference salinity of 34.8) and panel (b) shows overflow water transports (sθ ≥27:8 kg=m3 and depth o650 m). The thin barsrepresent the four realizations and the thick bar is the mean value. The black lines are error bars.
K. Våge et al. / Deep-Sea Research I 79 (2013) 20–3928
does not seem to play an important role in the pathways of densewater leading to the sill. Our calculated average overflow watertransports (sθ ≥27:8 kg=m3 and depth o650 m) are 0.870.3 Svin the shelf break EGC, 1.370.4 Sv in the separated EGC, and1.470.3 Sv in the NIJ (Fig. 8b). The combined sum of 3.5 Svcorresponds well with the long-term mean overflow water trans-port through the Denmark Strait of 3.4 Sv estimated by Jochumsenet al. (in press), and our NIJ overflow water transport is in goodagreement with the previous estimate of 1.570.2 Sv from twosynoptic surveys (Våge et al., 2011b).
In the gyre scenario outlined above, some of the equatorwardtransport of freshwater and overflow water in the separatedEGC would recirculate before reaching the Denmark Strait sill.The poleward return flow is weaker, however, resulting in a netequatorward throughput. Based on the present set of sections, thepoleward return flow is approximately half of the equatorwardflow in the separated EGC. Even if no permanent gyre exists in theBlosseville Basin, the synoptic sections indicate that there is sometransient northward flow between the shelf break EGC and theseparated EGC. This would tend to reduce the composite EGCcontribution to the total overflow transport, although this smallertotal transport is still in good agreement with the value calculatedby Jochumsen et al. (in press) when considering measurement errors.The northward flow would similarly tend to reduce the compositeEGC freshwater transport, but the resulting net throughput is stillhigher than the previous calculations that assume a balanced Nordicseas freshwater budget. It is worth noting that sparse measurementson the inner Greenland shelf indicate that the freshest water is foundadjacent to the coast, possibly associated with a southward flow.Such a coastal current could have a significant freshwater transport,but this cannot be properly assessed with the present set of sections.
The poleward flow of AW through the Denmark Strait in theNIIC has been monitored for a number of years using mooringslocated roughly 80 km to the east of the Kögur transect. The long-
term mean transport at that location (known as the Hornbankiline) is 0.88 Sv (Jónsson and Valdimarsson, 2012b). Delineating theAW by a salinity greater than 34.9 and temperature warmer than3 1C (after Swift and Aagaard, 1981), we obtain a three-sectionmean NIIC transport of 1.170.2 Sv. AW is the only warm andsaline water mass along the Kögur transect (Fig. 4), and thetransport estimate is not very sensitive to the precise criteriaused. Our larger value of NIIC transport may be due to synopticvariability, or there may be leakage of AW from the NIIC betweenthe two locations (Jónsson and Valdimarsson, 2005). On the otherhand, the mooring-derived value at the Hornbanki line could be anunderestimate due to inadequate spatial coverage (Jónsson andValdimarsson, 2012b).
The process of aspiration, by which dense water upstream of aridge is raised above sill level to participate in an overflow, isbelieved to occur in the Strait of Gibraltar and in the Faroe BankChannel (Stommel et al., 1973; Kinder and Parrilla, 1987; Hansenand Østerhus, 2007). In our occupations of the Kögur line thegeostrophic velocities are generally weak at depths greater thanthe Denmark Strait sill. In fact, the mean transport below 650 m isnot significantly different from zero. This implies that aspiration isnot important in the Denmark Strait. Therewas, however, considerablevariability in the deep flow from section to section (not shown).
4. Historical hydrography north of the Denmark Strait
The synoptic sections presented above reveal that the EGC hastwo branches north of the Denmark Strait, and, accordingly, PSWoccupies much of the interior Blosseville Basin. Furthermore, asignificant fraction of the Atlantic-origin overflow water is trans-ported by the separated EGC. We now use the historical hydro-graphic data set to demonstrate that our results are consistentwith previous measurements. The dynamic topography of the sea

K. Våge et al. / Deep-Sea Research I 79 (2013) 20–39 29
surface relative to 500 m is shown in Fig. 9, which reveals featuresof the upper ocean circulation in the region. The broad minimumin the central Iceland Sea indicates the presence of a cyclonic gyre,and is consistent with earlier findings using a more sparsehydrographic data set (Swift and Aagaard, 1981) and directvelocity measurements (Voet et al., 2010). In the northwest partof the domain, along the east Greenland shelf break (marked bythe gray contour following the 500 m isobath in Fig. 9), a sharpincrease in dynamic height is evident which implies surface-intensified equatorward flow. This is the shelf break EGC. However,at the northern end of the Blosseville Basin near 691N the highvalues of dynamic topography extend into the interior. Here theseparated EGC splits from the shelf break EGC. Farther south, overthe length of the Blosseville Basin (marked by the closed graycontour following the 1400 m isobath in Fig. 9), the two branchescan be identified by regions of enhanced gradients in dynamictopography: along the Greenland shelf break, and in the interioralong the base of the Iceland continental slope. Interestingly,a consistent northward return flow is not visible in the meanmap of dynamic topography. If it exists, it may not appear in themean due to a weaker baroclinic signature than the surface-intensified separated EGC (see Fig. 4) or due to sparse data inthe western Blosseville Basin. We note that inspection of along-track altimeter sea surface height also does not reveal a northwardflow, but this product is not expected to perform well in partiallyice-covered waters and on such small spatial scales.
The distribution of polar waters north of the Denmark Straitclosely resembles the dynamic topography. Near-surface potentialtemperature and salinity fields (Fig. 10) show that the PSW isclosely confined to the shelf north of 691N, whereas in theBlosseville Basin this water mass spreads far into the interior tothe base of the Iceland slope. (A slightly deeper level is consideredfor temperature than for salinity in order to avoid the summertime
Fig. 9. Dynamic height of the surface relative to 500 db. The gray lines are the 500 mcontour delineating the Blosseville Basin. The gray crosses mark the locations of data pcontoured as black lines.
surface warming due to insolation, evident in Fig. 4.) Presence ofPSW over the deep Iceland slope is regularly observed at the Kögurtransect, and some of this water mass is likely mixed into the AWtransported by the NIIC along the shelf north of Iceland (Jónssonand Valdimarsson, 2012b).
While PSW was confined to the Greenland shelf north of 691N,the Atlantic-origin overflow water transported by the EGC in thisregion extends some distance offshore (Fig. 11). The temperatureand salinity maxima indicate, however, that the core of theoverflow water is found along the continental slope. (The stron-gest signature of the Atlantic-origin overflow water is found in thedensity range 27:9 kg=m3osθo28:0 kg=m3, used to isolate thiswater mass in Fig. 11.) South of 691N, temperature and salinitymaxima along the slope are no longer visible, and Atlantic-originoverflow water is observed throughout the Blosseville Basin. Thehydrographic properties of the overflow water in this regionhave been modified, probably by the same process forming theseparated EGC.
The historical hydrography supports the inference from thesynoptic Kögur sections that the separated EGC is a permanentfeature in the Blosseville Basin and that it provides a means ofshelf-basin exchange impacting the circulation of both surface andoverflow water masses north of the Denmark Strait. However, it isdifficult to discern the details of how these water masses approachand pass through the Denmark Strait from this analysis. In thevicinity of the sill warm, saline AW from the Irminger Currentdominates the surface layer, even extending at times onto theGreenland shelf, and undiluted PSW appears to be found only nearthe coast. In the case of the overflow layer the two-branch EGCsystem and the NIJ, observed as distinct pathways at the Kögurtransect near the southern end of the Blosseville Basin, mergeprior to forming the DSOW plume exiting the Denmark Strait.The relative transports of these overflow pathways likely influence
depth contour along the east Greenland shelf break and the closed 1400 m depthoints. The 200 m, 400 m, 600 m, 800 m, 1000 m, 1400 m, and 2000 m isobaths are

Fig. 11. As in Fig. 10, but for overflow waters (maximum value between 27.9 and 28.0 kg/m3).
Fig. 10. As in Fig. 9, but for near-surface potential temperature (a—vertically averaged between 50 and 100 m) and salinity (b—vertically averaged between 10 and 30 m).
K. Våge et al. / Deep-Sea Research I 79 (2013) 20–3930
the final water mass composition of the plume (e.g. Rudels et al.,2003). In the next two sections we investigate the processes bywhich the separated EGC is formed, which will enable us to betterunderstand the associated impacts on the overflow product and onthe freshwater budget of the region.
5. Atmospheric forcing
The atmospheric circulation over the western subpolar NorthAtlantic is dominated by the Icelandic Low, a semi-permanentregion of low pressure situated southwest of Iceland in the lee ofsouthern Greenland (Serreze et al., 1997). The cyclonic circulationaround the Icelandic Low and the associated positive wind stresscurl can be seen in Fig. 12. The curl attains its maximum value tothe east of Greenland's southernmost point, Cape Farewell, as aresult of the increased surface wind speeds in this region that areassociated with westerly tip jets (Doyle and Shapiro, 1999; Mooreand Renfrew, 2005; Våge et al., 2009). The low Froude number of
the surface circulation, resulting from the high and steep topo-graphy of Greenland (Fig 12), leads to the so-called barrier windsalong its east coast that are characterized by southerly flowdirected parallel to the coast (Moore and Renfrew, 2005; Hardenet al., 2011; Moore et al., 2012).
As can be seen from Fig. 12a, surface wind speeds tend to belowest near the coastline and over sea ice as a result of an increasein surface roughness (Moore, 2003; Petersen and Renfrew, 2009).Due to this reduction in wind speed from the nearshore ice, anarrow band of negative wind stress curl extends along the entireeast coast of Greenland that is embedded in the generally positivewind stress curl of the broader subpolar North Atlantic (Fig. 12b).In the southeast portion of Greenland there are two regions ofparticularly steep coastal topography coupled with strong curva-ture of the coastline: one near 691N and the other near 661N. Theformer is associated with the Watkins Range, that contains Green-land's highest mountain, and is in the vicinity of the BlossevilleBasin. In these regions, there is an acceleration of the barrierwinds because the flow is being forced to move around the

Fig. 12. The annual mean: (a) sea-level pressure (contours, mb), 10 m wind(vectors, m/s) and 10 m wind speed (color, m/s) and (b) curl of the wind stress(color, 10−6 N/m2) and the 10 m wind (vectors, m/s) from the ERA-I for the period1979–2011. In (a) the thick black line represents the annual mean 50% sea iceconcentration contour. In (b) the zero isoline of the curl of the wind stress isindicated by the thick black contour. The red contour delineates the approximateextent of the Blosseville Basin as represented by the 1400 m isobath. The bluecontours represent the height of the topography over Greenland (km). (Forinterpretation of the references to color in this figure caption, the reader is referredto the web version of this article.)
Fig. 13. The curl of the wind stress (color, 10−6 N/m2) and the 10 m wind (vectors,m/s) for: (a) October, (b) June, and (c) the annual mean from the NARR for theperiod 1979–2011. The zero isoline of the curl of the wind stress is indicated bythe thick black contour. The red contour delineates the approximate extent ofthe Blosseville Basin as represented by the 1400 m isobath. The blue contoursrepresent the height of the topography over Greenland (km). (For interpretation ofthe references to color in this figure caption, the reader is referred to the webversion of this article.)
K. Våge et al. / Deep-Sea Research I 79 (2013) 20–39 31
obstacles (Harden and Renfrew, 2012; Moore, 2012). This localizedflow distortion enhances the anti-cyclonic circulation. The combi-nation of the local topographic steering together with the reduc-tion in nearshore wind speed due to ice causes a particularlystrong region of negative wind stress curl over the BlossevilleBasin (Fig. 13).
The sea ice along east Greenland expands southwards during thewinter and retreats northwards during the summer (Wadhams,1981), and so the coastal region of low surface wind speed under-goes a similar cycle. Also, the Icelandic Low is deepest duringthe winter months and so the barrier winds are intensified duringthis period. Consequently, the negative wind stress curl over theBlosseville Basin is strongest in fall/winter (Fig. 13a) and weakest inspring/summer (Fig 13b). Note, however, that the curl remainsnegative even when the circulation is weak, and, as a result, theannual mean wind stress curl is negative in this region (Fig. 13c).
The strong negative wind stress curl over the Blosseville Basin,in conjunction with the closed bathymetric contours of the basin,is conducive for spinning up a local anti-cyclonic ocean gyre. Themodel simulation of Spall and Pickart (2003) demonstrated that
positive wind stress curl east of Cape Farewell (Fig. 12b) wascapable of driving the cyclonic Irminger Gyre (Våge et al., 2011a).This was true even though the wind forcing nearly vanishes duringthe summer months. The weak stratification of the IrmingerSea, in conjunction with the bathymetry of the continental slope,resulted in a “flywheel” effect whereby the seasonal input of

K. Våge et al. / Deep-Sea Research I 79 (2013) 20–3932
vorticity from the atmosphere to the ocean was able to maintain anearly steady gyre. At depth, the Blosseville Basin is characterizedby similarly weak stratification adjacent to the continental slopesof Greenland and Iceland, and the atmospheric circulation impartsstrong negative vorticity to the ocean for nearly half the year. Assuch, there is reason to suspect that an anti-cyclonic gyre shouldbe maintained in the basin, consistent with the mean absolutegeostrophic velocity section of Fig. 4.
As demonstrated in the next section, there is an additionalaspect of the wind forcing that appears to be of importance for theformation of the separated EGC. To first order the barrier windsparallel the shelf break of East Greenland, and, as such, there is anonshore Ekman transport in the surface layer. This shoreward flowhelps maintain the hydrographic front associated with the shelfbreak EGC. As noted above, the sharp bend in the coastline near691N steers the wind towards the southwest (which is part of thereason for the negative wind stress curl over the Blosseville Basin).However, because the orientation of the continental slope changesso abruptly near 691N, the wind cannot adjust quickly enough toremain parallel to the shelf break at this location. This is demon-strated in Fig. 14 which documents the degree to which the windparallels 500 m isobath (roughly the shelf break) at each latitudein the domain of interest. One sees that at the northern end of theBlosseville Basin the winds are more than 401 offset from thedirection of the shelf break. Consequently, the onshore componentof the Ekman transport is reduced in this region. The ramificationsof this are explored below.
3 Note that the model does have anti-cyclonic wind stress curl over theBlosseville Basin (Fig. 13c).
6. Numerical simulation of the East Greenland Current northof the Denmark Strait
We now use the idealized numerical model, described inSection 2.4, to examine the interaction between the East GreenlandCurrent and the basin interior, and to investigate the cause of theseparated EGC. In an effort to understand themost basic aspects of thisinteraction, we force the model with a steady wind stress (no surfaceforcing of heat and freshwater). The wind forcing is derived from theannual mean of the high resolution NARR product (Section 5), and themodel has been run for a period of 2.5 years. The mean sea surfacesalinity over the final 2 years of integration is shown in Fig. 15. There isa sharp gradient in salinity near the shelf break at high latitudes(although there is some spreading of saline waters onto the shelfbetween y ¼ 500 km and 700 km). This gradient corresponds to amaximum in along-shelf velocity, i.e. a shelf break current. However,near y¼500 km the freshwater begins to shift offshore of the shelfbreak such that by y¼300 km waters fresher than 33.5 are foundalmost 100 km offshore of the shelf break. This freshwater remainsoffshore of the shelf edge all the way to the Denmark Strait (neary¼100 km, x¼100 km in the model).
6.1. Salinity and velocity
A representative synoptic section of the along-channel velocityand salinity from the model at y¼320 km is shown in Fig. 16 forday 360. This location roughly corresponds with the Kögur section.There is a maximum southward velocity of just over 1 m/s over theshelf break, which decreases towards the bottom (Fig. 16a). Thereis also southward flow exceeding 50 cm/s centered about 100 kmoffshore of the shelf break, over the eastern side of the BlossevilleBasin. This flow is more surface trapped, with a vertical scale onlyon the order of 200 m. In between these two southward flows is anorthward current of 50 cm/s near x¼80 km. While it is temptingto associate the southward flow above the Iceland continentalslope with the separated EGC, the two oppositely flowing jets inthe interior are in fact the signature of an anti-cyclonic ring of
shelf water that separated from the shelf and carried freshwateracross the Blosseville Basin (Fig. 16b). This structure is reminiscentof some of the synoptic sections along the Kögur line (e.g. Figs. 5cand 6c) and suggests that the features seen in the data may belarge anti-cyclonic rings of shelf water (i.e. larger than thedeformation radius).
The sea surface salinity on day 770 (Fig. 17) demonstrates thatthe shelf break jet south of y¼500 km is very time-dependent,and is dominated by meanders and eddies with horizontal scalesof O(50 km). These freshwater eddies penetrate well off theboundary, giving rise to the offshore shift in the mean positionof the sea surface salinity front. The region between the shelfbreak and the eastern side of the Blosseville Basin is highly timedependent and dominated by eddies and filaments.
The spin-up of the offshore front, and the space and time scalesof the variability, are demonstrated by a plot of along-channelvelocity and salinity at 17.5 m depth as a function of x and time(Fig. 18). The fresh water initially confined to the shelf spreadsrapidly offshore until around day 200, when the offshore frontequilibrates near x¼120 km. Coincident with this salinity gradientis a region of southward flow with strength O(10–20 cm/s). There isalso a region of stronger southward flow shoreward of x¼50 km,which is the meandering shelf break jet. The region betweenthe shelf break jet and the offshore front is dominated by flowreversals of O(20 cm/s). They generally occur in concert withsouthward flow farther offshore, separated by a freshwater anom-aly. This is the signature of freshwater lenses that have been shedfrom the boundary current and have propagated offshore, as seen inFigs. 16 and 17. The dashed line at day 360 in Fig. 18 shows that thefeatures seen in the synoptic section (Fig. 16) are quite common.
The model suggests then that the separated EGC arises fromeddies that coalesce when they encounter the Iceland continentalslope. In this scenario the northward flow between the shelf breakEGC and separated EGC is simply the recirculation associated withfreshwater eddies shed from the shelf break jet. Furthermore, themodel suggests that synoptic sections across the Blosseville Basinshould occasionally reveal isolated anti-cyclonic eddies, which, asnoted above, seems to be the case. The alternate hypothesis of awind-driven anti-cyclonic gyre, where the offshore branch is theseparated EGC, is not supported by the model.3 However, one mustkeep in mind that the data are spatially and temporally sparse,which makes it difficult to distinguish between these two possi-bilities; a definitive conclusion will require more field data.
6.2. Role of the wind
Although the curl of the wind stress seems not to play acentral role in the model, the wind stress itself is important inmaintaining the shelf break jet and in determining where thefreshwater is able to penetrate offshore of the boundary. Acalculation was run with the same initial conditions and restoringbut with no wind stress. Freshwater extends farther offshore thanfor the case with wind (not shown). As noted earlier, for the mostpart the wind is parallel to the coast (Fig. 14), so the Ekmantransport is directed onshore. This advects dense, saline watertowards the shelf break and acts to maintain the baroclinicity ofthe jet. Frontal instability acts to reduce the horizontal densitygradient by advecting freshwater offshore near the surface. Theabsence of wind forcing thus allows the eddy fluxes to carry thefresh water farther offshore.
Analysis of the energy conversion terms indicates that themeanders and eddies are formed primarily by baroclinic

0 200 4000
100
200
300
400
500
600
700
800
x (km)
y (k
m)
sal
inity
32
32.5
33
33.5
34
34.5
35
Fig. 15. Mean sea surface salinity over final 2 years of integration, with bottomtopography (white contours, contour interval (c.i.) 200 m). The dashed white line isthe location of the vertical section in Fig. 16.
Fig. 16. Synoptic zonal sections of meridional velocity (upper panel, c.i.¼0.1 m/s,bold line is the zero velocity contour) and salinity (lower panel, c.i.¼0.25) onday 360.
Fig. 14. Difference in angle between the mean wind direction and orientation of the shelf break (color) as a function of latitude. The shelf break is taken to be the 500 misobath, and the calculation is carried out along a 50 km swath centered around that isobath. The mean 10 m wind vectors from NARR, used in the calculation, are shown.(For interpretation of the references to color in this figure caption, the reader is referred to the web version of this article.)
K. Våge et al. / Deep-Sea Research I 79 (2013) 20–39 33
instability. The conversion rate from potential to eddy kineticenergy was calculated in the region of the Blosseville Basin (20–150 km in x and 200–500 km in y) and averaged between 10 and540 m depth. For the case with wind forcing, the average conver-sion rate is positive at about 1:2� 10−8 m2=s3. This correspondswith eddy formation via baroclinic instability. The case with nowind starts at a level above the case with wind forcing, but rapidly
0 200 4000
100
200
300
400
500
600
700
800
x (km)
y (k
m)
sal
inity
32
32.5
33
33.5
34
34.5
35
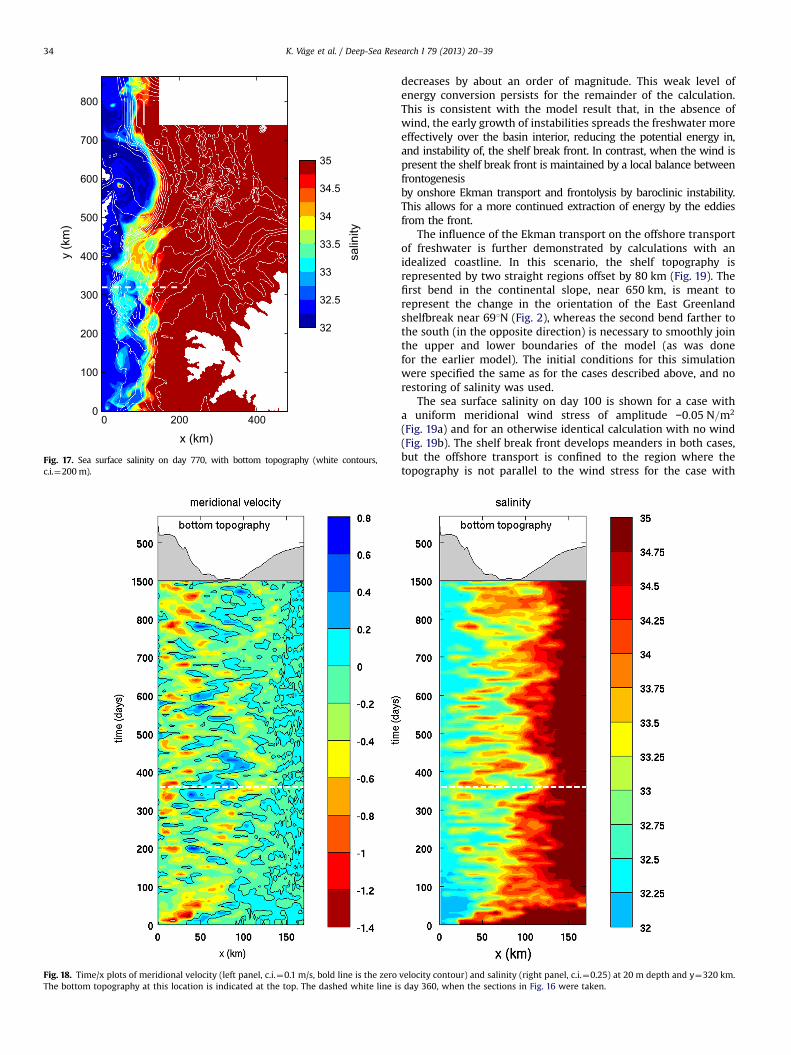
Fig. 17. Sea surface salinity on day 770, with bottom topography (white contours,c.i.¼200 m).
Fig. 18. Time/x plots of meridional velocity (left panel, c.i.¼0.1 m/s, bold line is the zeroThe bottom topography at this location is indicated at the top. The dashed white line is
K. Våge et al. / Deep-Sea Research I 79 (2013) 20–3934
decreases by about an order of magnitude. This weak level ofenergy conversion persists for the remainder of the calculation.This is consistent with the model result that, in the absence ofwind, the early growth of instabilities spreads the freshwater moreeffectively over the basin interior, reducing the potential energy in,and instability of, the shelf break front. In contrast, when the wind ispresent the shelf break front is maintained by a local balance betweenfrontogenesisby onshore Ekman transport and frontolysis by baroclinic instability.This allows for a more continued extraction of energy by the eddiesfrom the front.
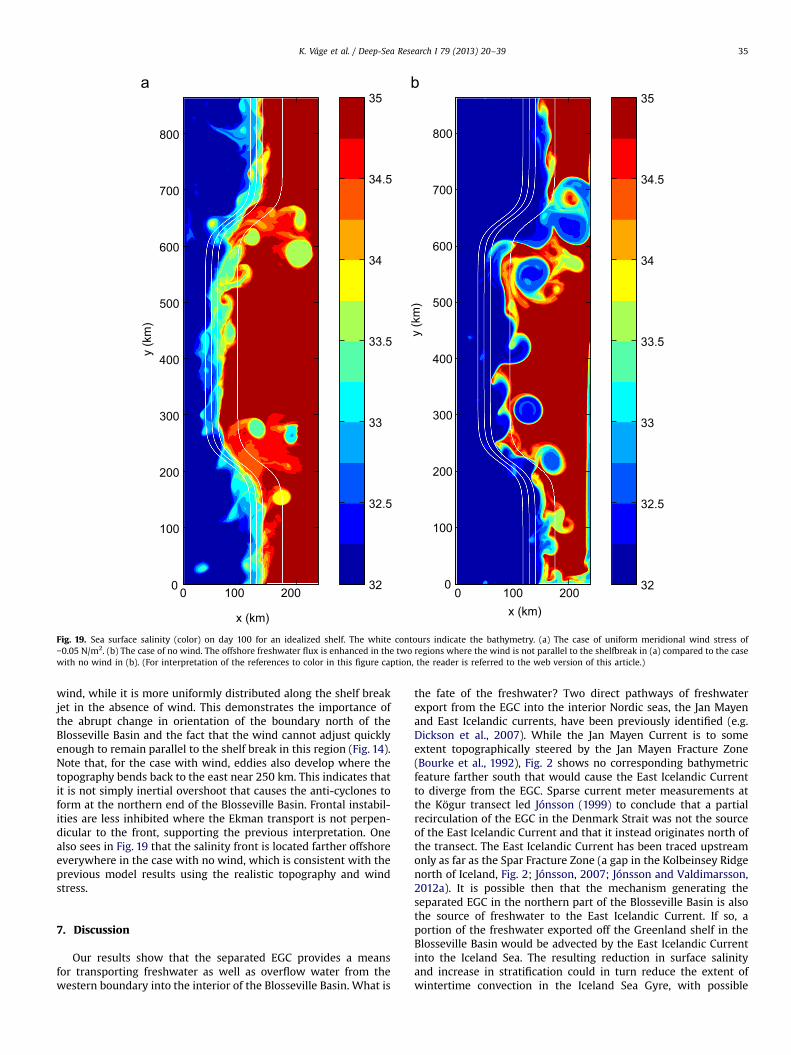
The influence of the Ekman transport on the offshore transportof freshwater is further demonstrated by calculations with anidealized coastline. In this scenario, the shelf topography isrepresented by two straight regions offset by 80 km (Fig. 19). Thefirst bend in the continental slope, near 650 km, is meant torepresent the change in the orientation of the East Greenlandshelfbreak near 691N (Fig. 2), whereas the second bend farther tothe south (in the opposite direction) is necessary to smoothly jointhe upper and lower boundaries of the model (as was donefor the earlier model). The initial conditions for this simulationwere specified the same as for the cases described above, and norestoring of salinity was used.
The sea surface salinity on day 100 is shown for a case witha uniform meridional wind stress of amplitude −0:05 N=m2
(Fig. 19a) and for an otherwise identical calculation with no wind(Fig. 19b). The shelf break front develops meanders in both cases,but the offshore transport is confined to the region where thetopography is not parallel to the wind stress for the case with
velocity contour) and salinity (right panel, c.i.¼0.25) at 20 m depth and y¼320 km.day 360, when the sections in Fig. 16 were taken.
0 100 2000
100
200
300
400
500
600
700
800
x (km)
y (k
m)
32
32.5
33
33.5
34
34.5
35
0 100 2000
100
200
300
400
500
600
700
800
x (km)
y (k
m)
32
32.5
33
33.5
34
34.5
35
Fig. 19. Sea surface salinity (color) on day 100 for an idealized shelf. The white contours indicate the bathymetry. (a) The case of uniform meridional wind stress of−0.05 N/m2. (b) The case of no wind. The offshore freshwater flux is enhanced in the two regions where the wind is not parallel to the shelfbreak in (a) compared to the casewith no wind in (b). (For interpretation of the references to color in this figure caption, the reader is referred to the web version of this article.)
K. Våge et al. / Deep-Sea Research I 79 (2013) 20–39 35
wind, while it is more uniformly distributed along the shelf breakjet in the absence of wind. This demonstrates the importance ofthe abrupt change in orientation of the boundary north of theBlosseville Basin and the fact that the wind cannot adjust quicklyenough to remain parallel to the shelf break in this region (Fig. 14).Note that, for the case with wind, eddies also develop where thetopography bends back to the east near 250 km. This indicates thatit is not simply inertial overshoot that causes the anti-cyclones toform at the northern end of the Blosseville Basin. Frontal instabil-ities are less inhibited where the Ekman transport is not perpen-dicular to the front, supporting the previous interpretation. Onealso sees in Fig. 19 that the salinity front is located farther offshoreeverywhere in the case with no wind, which is consistent with theprevious model results using the realistic topography and windstress.
7. Discussion
Our results show that the separated EGC provides a meansfor transporting freshwater as well as overflow water from thewestern boundary into the interior of the Blosseville Basin. What is
the fate of the freshwater? Two direct pathways of freshwaterexport from the EGC into the interior Nordic seas, the Jan Mayenand East Icelandic currents, have been previously identified (e.g.Dickson et al., 2007). While the Jan Mayen Current is to someextent topographically steered by the Jan Mayen Fracture Zone(Bourke et al., 1992), Fig. 2 shows no corresponding bathymetricfeature farther south that would cause the East Icelandic Currentto diverge from the EGC. Sparse current meter measurements atthe Kögur transect led Jónsson (1999) to conclude that a partialrecirculation of the EGC in the Denmark Strait was not the sourceof the East Icelandic Current and that it instead originates north ofthe transect. The East Icelandic Current has been traced upstreamonly as far as the Spar Fracture Zone (a gap in the Kolbeinsey Ridgenorth of Iceland, Fig. 2; Jónsson, 2007; Jónsson and Valdimarsson,2012a). It is possible then that the mechanism generating theseparated EGC in the northern part of the Blosseville Basin is alsothe source of freshwater to the East Icelandic Current. If so, aportion of the freshwater exported off the Greenland shelf in theBlosseville Basin would be advected by the East Icelandic Currentinto the Iceland Sea. The resulting reduction in surface salinityand increase in stratification could in turn reduce the extent ofwintertime convection in the Iceland Sea Gyre, with possible

Fig. 20. Schematic circulation in the area northeast of the Denmark Strait, presented in the text. The East Greenland Current (EGC) bifurcates north of the Blosseville Basinand the offshore branch joins with the North Icelandic Jet (NIJ) to provide most of the dense water feeding the Denmark Strait Overflow Water plume. The shelf break EGCprovides the other portion. The separated EGC is believed to be formed by anti-cyclonic eddies that coalesce, with perhaps a wind-driven anti-cyclonic recirculation north ofthe sill (dashed line). As discussed in Våge et al. (2011b), the NIJ represents the lower limb of a local overturning loop: the inflowing North Icelandic Irminger Current –advecting warm Atlantic Water – forms eddies that are cooled by the atmosphere and disintegrate in the Iceland Sea Gyre. The dense water so formed progresses backtowards the boundary (represented by the short blue arrows) and sinks to form the NIJ. A possible pathway of the upper-layer East Icelandic Current (EIC) is indicatedas well.
K. Våge et al. / Deep-Sea Research I 79 (2013) 20–3936
consequences for the AMOC. Another ramification of the fresh-water export from the boundary is that less of the undiluted PSWremains within the shelf break EGC equatorward of the DenmarkStrait (Fig. 10) which could potentially impact the convectiveregions in the Irminger and Labrador seas.
Our revised circulation scheme is shown schematically inFig. 20. Included in the figure are findings from the present studyas well as results from the study of Våge et al. (2011b). As seen inthe schematic, and at odds with the Mauritzen (1996) circulationscheme, the source waters of the Denmark Strait Overflow Waterplume primarily approach the sill along the Iceland continentalslope. These waters are advected in roughly equal proportions bythe separated EGC and the North Icelandic Jet (NIJ). By contrast,the shelf break EGC appears to transport a significantly smallerfraction (roughly 30%) of overflow water along the Greenlandslope. This is perhaps to be expected within the framework ofhydraulic theory (e.g. Pratt, 2004). However, the NIJ originates farupstream (northeast of Iceland, Fig. 20) and the separated EGCtransposes to the Iceland slope in the northern end of theBlosseville Basin, not due to shoaling bathymetry in the vicinityof the sill. At this point it remains uncertain how much water (ifany) recirculates anti-cyclonically from the separated EGC north ofthe sill or whether or not there is a permanent gyre within theBlosseville Basin. A recently deployed mooring array along theKögur transect should shed light on this.
We note that the high-resolution numerical simulations of theflow north of the Denmark Strait in Köhl et al. (2007) have aspectsthat are similar to the circulation scheme presented here. Forexample, the EGC bifurcates upstream of the Blosseville Basin.However, the eastern branch of the EGC in their model flowssouthward along the Kolbeinsey Ridge and feeds the NIJ farupstream of the Denmark Strait, which is inconsistent with ourresults. Nonetheless, Köhl et al.'s (2007) simulations indicate thatmost of the overflow water in the East Greenland Current switchesfrom the Greenland to the Iceland slope at the northern end of the
Blosseville Basin and that the overflow water primarily approachesthe Denmark Strait sill along the eastern boundary.
Between the Kögur transect and the Denmark Strait sill the threebranches advecting overflow water (the shelf break EGC, separatedEGC, and the NIJ) presumably merge to form the DSOW plume. Forthe NIJ and separated EGC, which are governed by differentdynamics and transport different water masses (mid-depth inten-sified flow of Arctic-origin overflow water and surface-intensifiedflow advecting Atlantic-origin overflow water, respectively), themerging process may lead to the generation of instabilitiesupstream of the sill (e.g. Fristedt et al., 1999). Such pre-existinginstabilities may subsequently be amplified during the descent ofthe overflow plume (e.g. Spall and Price, 1998).
At present it is unknown which, if any, of these flow branchesfeeding the DSOW plume exerts dominant control on the variabilityof the overflow. Numerical simulations suggest that changes in theEGC north of the strait impact the transport and composition of theoverflow plume (Karcher et al., 2011; Hall et al., 2011). However,comparable studies remain to be undertaken for the recentlydiscovered NIJ. The mooring array across the Kögur line includesinstruments in all three branches, which may provide some insightsalong these lines. More detailed tracer studies will also add to ourunderstanding of the dominant pathways and upstream sources ofoverflow water. We stress that the circulation scheme presentedhere needs further confirmation, particularly to elucidate themerging of the different overflow branches and the fate of thefreshwater exported into the interior.
Acknowledgments
Historical hydrographic data were provided by the MarineResearch Institute, Iceland; Institute of Marine Research, Norway;the Faroese Fisheries Laboratory; and the Geophysical Institute,University of Bergen, Norway, through the NISE project, and

K. Våge et al. / Deep-Sea Research I 79 (2013) 20–39 37
obtained from the World Ocean Database (www.nodc.noaa.gov).Argo data were obtained from the GODAE (www.usgodae.orgdatacenter. We thank Else Juul Green for extracting data from the ICESdata base (www.ices.dk) and Jack Cook for providing Figs. 1 and20. Support for this work was provided by the Norwegian ResearchCouncil (KV), the European Union 7th Framework Programme (FP72007-2013) under Grant agreement no. 308299 NACLIM Project(KV), US National Science Foundation Grants OCE-0959381 (RP,MS, DT) and OCE-0850416 (MS), and the Natural Sciences andEngineering Research Council of Canada (KM). This is publicationA420 from the Bjerknes Centre for Climate Research.
Appendix A. Removal of barotropic tides from the synopticsections using a tidal model
The most recent version of the Oregon State University AtlanticOcean tidal model (Egbert et al., 1994; Egbert and Erofeeva, 2002)was used to remove the barotropic tidal component from theADCP profiles prior to the construction of the absolute geostrophicvelocity sections. The improvements relative to the previousversion used by Våge et al. (2011b) are higher resolution (1/301vs. 1/121) and more accurate bathymetry. Comparison betweenthe two versions at the Kögur transect shows that the greatestdifference is found in the western end of the section, primarily dueto the improved representation of the Greenland continental shelfand slope. For the Iceland slope the difference is less pronounced.The mean absolute difference in the NIJ transport resulting fromde-tiding using the two models was 0.1 Sv, which is well withinthe overall transport error estimates. In particular, the value of NIJtransport for the October 2008 occupation quoted by Våge et al.(2011b) differs by only 0.03 Sv when the new tidal model isapplied. Hence the results presented here using the new modelare consistent with previously published results in terms of NIJtransport. A reduction in the error arising from the de-tiding is,however, not justified from an overall quantitative comparisonbetween the tidal model and actual bottom depths along theKögur transect.
Appendix B. Quality control and gridding of the historicalhydrography
While most of the data have been subject to preliminaryquality control, additional checks were performed following thegeneral procedure of previous studies (e.g. Skagseth and Mork,2012). Temperature and salinity measurements outside the expectedrange of values in the Nordic seas (−2–20 1C and 20–36, respectively)were discarded. Each profile was subsequently inspected for densityinversions, and profiles containing an inversion exceeding 0.05 kg/m3
were excluded (Rossby et al., 2009; Skagseth and Mork, 2012).(Profiles with a single data spike were included after the removal ofthe spike.) Finally, each profile was checked for outliers as follows. Allprofiles within an effective radius of 110 km around the station inquestion (approximately 11 of latitude) were identified. The effectiveradius is increased along isobaths in regions of large topographicgradients and takes into account the greater correlation length scalesalong the bottom topography, which is appropriate given the closealignment between the circulation in the Nordic seas and the bottomcontours (e.g. Nøst and Isachsen, 2003). The radius was calculatedfollowing Davis (1998):
r2 ¼ jxg−xoj2 þ����3λ
Hg−Ho
Hg þ Ho
����
2
: ðB:1Þ
The first term on the right hand side of (B.1) is the geographicaldistance between the profile to be checked (subscript g) and all other
profiles (subscript o), and the second term is the increase in distancedetermined by the difference in bottom depths (H). The topographicparameter λ was set to 100 km (Lavender et al., 2005; Voet et al.,2010; Skagseth and Mork, 2012). A doubling in water depth betweentwo profiles would lead to an increase in r2 by λ2. Bathymetric datawere obtained from the ETOPO2 2-min elevation data base andsmoothed by convolution with a 20-km Gaussian window. All of theprofiles so identified were then vertically interpolated at 5 m inter-vals, and the mean and standard deviation of temperature andsalinity calculated at each depth. If the profile in question containeddata points at any depth that differed from themean bymore than sixstandard deviations, it was discarded.
For the present analysis, observations from the historicalhydrographic data set of a given property at a given depth levelwere anisotropically interpolated onto a regular 0.21 longitude by0.11 latitude grid using (B.1). For each grid point (subscript g) theeffective distance to each data point (subscript o) was calculated.The average value of all data points within an effective distance of50 km or less, weighted by the inverse of the distance (profilescloser to the grid point than 1 km were weighted equally), wasassigned to that grid point. Using an effective distance increasedby the difference in barotropic potential vorticity (PV¼ f/H, wheref is the Coriolis parameter) instead of difference in depth(e.g. Böhme and Send, 2005) yielded qualitatively similar results.Finally, the gridded fields were smoothed by convolution with a30 km Gaussian window.
References
Aagaard, K., Carmack, E.C., 1989. The role of sea ice and other fresh water in theArctic circulation. J. Geophys. Res. 94, 14485–14498.
Adcroft, A., Hill, C., Marshall, J., 1997. Representation of topography by shaved cellsin a height coordinate ocean model. Mon. Weather Rev. 125, 2293–2315.
Böhme, L., Send, U., 2005. Objective analyses of hydrographic data for referencingprofiling float salinities in highly variable environments. Deep Sea Res. II 52,651–664, http://dx.doi.org/10.1016/j.dsr2.2004.12.014.
Bourke, R.H., Paquette, R.G., Blythe, R.F., 1992. The Jan Mayen Current of theGreenland Sea. J. Geophys. Res. 97, 7241–7250.
Cooper, L.H.N., 1955. Deep water movements in the North Atlantic as a linkbetween climate changes around Iceland and the biological productivity ofthe English Channel and the Celtic Sea. J. Mar. Res. 14, 347–362.
Davis, R.E., 1998. Preliminary results from directly measuring middepth circulationin the tropical and South Pacific. J. Geophys. Res. 103, 24619–24639.
de Steur, L., Hansen, E., Gerdes, R., Karcher, M., Fahrbach, E., Holfort, J., 2009.Freshwater fluxes in the East Greenland Current: a decade of observations.Geophys. Res. Lett. 36, L23611, http://dx.doi.org/10.1029/2009GL041278.
Dee, D.P., Uppala, S.M., Simmons, A.J., Berrisford, P., Poli, P., et al., 2011. The ERA-Interim reanalysis: configuration and performance of the data assimilationsystem. Quart. J. R. Meteorol. Soc. 137, 553–597, http://dx.doi.org/10.1002/qj.828.
Dickson, R.R., Brown, J., 1994. The production of North Atlantic Deep Water:sources, rates and pathways. J. Geophys. Res. 99, 12319–12341.
Dickson, R.R., Dye, S., Jónsson, S., Köhl, A., Macrander, A., Marnela, M., Meincke, J.,Olsen, S., Rudels, B., Valdimarsson, H., Voet, G., 2008. The overflow fluxwest of Iceland: variability, origins and forcing. In: Dickson, R.R., Meincke, J.,Rhines, P. (Eds.), Arctic-Subarctic Ocean Fluxes: Defining the role ofthe northern seas in climate. Springer, Dordrecht, The Netherlands,pp. 443–474.
Dickson, R.R., Rudels, B., Dye, S., Karcher, M., Meincke, J., Yashayaev, I., 2007.Current estimates of freshwater flux through Arctic and subarctic seas. Prog.Oceanogr. 73, 210–230.
Dodd, P.A., Heywood, K.J., Meredith, M.P., Naveira-Garabato, A.C., Marca, A.D.,Falkner, K.K., 2009. Sources and fate of freshwater exported in the EastGreenland Current. Geophys. Res. Lett. 36, L19608, http://dx.doi.org/10.1029/2009GL039663.
Dodd, P.A., Rabe, B., Hansen, E., Falck, E., Mackensen, A., Rohling, E., Stedmon, C.,Kristiansen, S., 2012. The freshwater composition of the Fram Strait outflowderived from a decade of tracer measurements. J. Geophys. Res. 117, http://dx.doi.org/10.1029/2012JC008011.
Doyle, J.D., Shapiro, M.A., 1999. Flow response to large-scale topography: theGreenland tip jet. Tellus 51, 728–748.
Egbert, G.D., Bennett, A.F., Foreman, M.G.G., 1994. TOPEX/Poseidon tides estimatedusing a global inverse model. J. Geophys. Res. 99, 24821–24852.
Egbert, G.D., Erofeeva, S.Y., 2002. Efficient inverse modeling of barotropic oceantides. J. Atmos. Oceanic Technol. 19, 183–204.

K. Våge et al. / Deep-Sea Research I 79 (2013) 20–3938
Eldevik, T., Nilsen, J.E.Ø., Iovino, D., Olsson, K.A., Sandø, A.B., Drange, H., 2009.Observed sources and variability of Nordic seas overflow. Nat. Geosci. 2,406–410, http://dx.doi.org/10.1038/NGEO518.
Fristedt, T., Hietala, R., Lundberg, P., 1999. Stability properties of a barotropicsurface-water jet observed in the Denmark Strait. Tellus 51, 979–989.
Hall, S., Dye, S.R., Heywood, K.J., Wadley, M.R., 2011. Wind forcing of salinityanomalies in the Denmark Strait overflow. Ocean Sci. 7, 821–834, http://dx.doi.org/10.5194/os–7–821–2011.
Hansen, B., Østerhus, S., 2000. North Atlantic–Nordic Seas exchanges. Prog.Oceanogr. 45, 109–208.
Hansen, B., Østerhus, S., 2007. Faroe Bank Channel overflow 1995–2001. Prog.Oceanogr. 75, 817–856, http://dx.doi.org/10.1016/j.pocean.2007.09.004.
Harden, B.E., Renfrew, I.A., 2012. On the spatial distribution of high winds offsoutheast Greenland. Geophys. Res. Lett. 39, L14806, http://dx.doi.org/10.1029/2012GL052245.
Harden, B.E., Renfrew, I.A., Petersen, G.N., 2011. A climatology of wintertime barrierwinds off southeast Greenland. J. Climate 24, 4701–4717, http://dx.doi.org/10.1175/2011JCLI4113.1.
Holfort, J., Albrecht, T., 2007. Atmospheric forcing of salinity in the overflow ofDenmark Strait. Ocean Sci. 3, 411–416.
Holfort, J., Hansen, E., Østerhus, S., Dye, S., Jónsson, S., Meincke, J., Mortensen, J.,Meredith, M., 2008. Freshwater fluxes east of Greenland. In: Dickson, R.R.,Meincke, J., Rhines, P. (Eds.), Arctic-Subarctic Ocean Fluxes: Defining the roleof the northern seas in climate. Springer, Dordrecht, The Netherlands,pp. 263–287.
Holfort, J., Meincke, J., 2005. Time series of freshwater-transport on the EastGreenland Shelf at 741N. Meteorol. Z. 14, 703–710, http://dx.doi.org/10.1127/0941–2948/2005/0079.
Jeansson, E., Jutterström, S., Rudels, B., Anderson, L.G., Olsson, K.A., Jones, E.P., SmethieJr., W.M., Swift, J.H., 2008. Sources to the East Greenland Current and itscontribution to the Denmark Strait Overflow. Prog. Oceanogr. 78, 12–28, http://dx.doi.org/10.1016/j.pocean.2007.08.031.
Jochumsen, K., Quadfasel, D., Valdimarsson, H., Jónsson, S. 2012. Variability of theDenmark Strait overflow: Moored time series from 1996–2011. J. Geophys. Res.,117, C12003, http://dx.doi.org/10.1029/2012JC008244.
Jones, E.P., Anderson, L.G., Jutterström, S., Swift, J.H., 2008. Sources and distributionof fresh water in the East Greenland Current. Prog. Oceanogr. 78, 37–44http://dx.doi.org/10.1016/j.pocean.2007.06.003.
Jónsson, S., 1999. The circulation in the northern part of the Denmark Strait and itsvariability. ICES Report CM-1999/L:06, 9 pp.
Jónsson, S., 2007. Volume flux and fresh water transport associated with the EastIcelandic Current. Prog. Oceanogr. 73, 231–241, http://dx.doi.org/10.1016/j.pocean.2006.11.003.
Jónsson, S., Valdimarsson, H., 2004. A new path for the Denmark Strait overflowwater from the Iceland Sea to Denmark Strait. Geophys. Res. Lett. 31, L03305,http://dx.doi.org/10.1029/2003GL019214.
Jónsson, S., Valdimarsson, H., 2005. Recent developments in oceanographicresearch in Icelandic waters. In: Caseldine, C., Russell, A., Harðardóttir, J.,Knudsen, O. (Eds.), Iceland—Modern Processes and Past Environments. Else-vier, pp. 79–92.
Jónsson, S., Valdimarsson, H., 2012a. Hydrography and circulation over the southernpart of the Kolbeinsey Ridge. ICES J. Mar. Sci., http://dx.doi.org/10.1093/icesjms/fss101, ⟨Website: http://icesjms.oxfordjournals.org/content/early/2012/06/08/icesjms.fss101⟩.
Jónsson, S., Valdimarsson, H., 2012b. Water mass transport variability to the northIcelandic shelf, 1994-2010. ICES J. Mar. Sci., http://dx.doi.org/10.1093/icesjms/fss024, ⟨Website: http://icesjms.oxfordjournals.org/content/early/2012/02/24/icesjms.fss024⟩.
Karcher, M., Beszczynska-Möller, A., Kauker, F., Gerdes, R., Heyen, S., Rudels, B.,2011. Arctic Ocean warming and its consequences for the Denmark Straitoverflow. J. Geophys. Res. 116, http://dx.doi.org/10.1029/2010JC006265.
Käse, R.H., Serra, N., Köhl, A., Stammer, D.B., 2009. Mechanisms for the variabilityof dense water pathways in the Nordic Seas. J. Geophys. Res. 114, C01013http://dx.doi.org/10.1029/2008JC004916.
Kinder, T.H., Parrilla, G., 1987. Yes, some of the Mediterranean outflow does comefrom great depth. J. Geophys. Res. 92, 2901–2906.
Köhl, A., 2010. Variable source regions of Denmark Strait and Faroe Bank Channeloverflow waters. Tellus 62A, 551–568, http://dx.doi.org/10.1111/j.1600–0870.2010.00454.x.
Köhl, A., Käse, R.H., Stammer, D.B., 2007. Causes of changes in the Denmark StraitOverflow. J. Phys. Oceanogr. 37, 1678–1696.
Kwok, R., Cunningham, G.F., Pang, S.S., 2004. Fram Strait sea ice outflow. J. Geophys.Res. 109, C01009, http://dx.doi.org/10.1029/2003JC001785.
Lavender, K.L., Owens, W.B., Davis, R.E., 2005. The mid-depth circulation of thesubpolar North Atlantic Ocean as measured by subsurface floats. Deep Sea Res. I52, 767–785.
Marshall, J., Hill, C., Perelman, L., Adcroft, A., 1997. Hydrostatic, quasi-hydrostatic,and nonhydrostatic ocean modeling. J. Geophys. Res. 102, 5733–5752.
Mauritzen, C., 1996. Production of dense overflowwaters feeding the North Atlanticacross the Greenland–Scotland Ridge. Part 1: evidence for a revised circulationscheme. Deep Sea Res. I 43, 769–806.
Mesinger, F., DiMego, G., Kalnay, E., Mitchell, K., Shafran, P.C., et al., 2006. NorthAmerican Regional Reanalysis. Bull. Am. Meteorol. Soc. 87, 343–360.
Moore, G.W.K., 2003. Gale force winds over the Irminger Sea to the east of CapeFarewell, Greenland. Geophys. Res. Lett. 30, 1894, http://dx.doi.org/10.1029/2003GLO18012.
Moore, G.W.K., 2012. A new look at Greenland flow distortion and its impact onbarrier flow, tip jets and coastal oceanography. Geophys. Res. Lett., http://dx.doi.org/10.1029/2012GL054017.
Moore, G.W.K., Pickart, R.S., Renfrew, I.A., 2008. Buoy observations from thewindiest location in the world ocean, Cape Farewell, Greenland. Geophys.Res. Lett. 35, L18802, http://dx.doi.org/10.1029/2008GL034845.
Moore, G.W.K., Renfrew, I.A., 2005. Tip jets and barrier winds: a QuikSCATclimatology of high wind speed events around Greenland. J. Climate 18,3713–3725.
Moore, G.W.K., Renfrew, I.A., Pickart, R.S., 2012. Spatial distribution of air-sea heatfluxes over the sub-polar North Atlantic Ocean. Geophys. Res. Lett. 39, L18806,http://dx.doi.org/10.1029/2012GL053097.
Nansen, F., 1912. Das Bodenwasser und die Abkühlung des Meeres. Int. Revue dergesamten Hydrobiologie Hydrographie Band V, 1–42.
Nilsen, J.E. Ø., Hátún, H., Mork, K.A., Valdimarsson, H., 2008. The NISE data set. TechnicalReport 08-01, Faroese Fisheries Laboratory, Box 3051, Tórshavn, Faroe Islands.
Nilsson, J., Björk, G., Rudels, B., Winsor, P., Torres, D.J., 2008. Liquid freshwatertransport and Polar Surface Water characteristics in the East Greenland Currentduring the AO-02 Oden expedition. Prog. Oceanogr. 78, 45–57, http://dx.doi.org/10.1016/j.pocean.2007.06.002.
Nøst, O.A., Isachsen, P.E., 2003. The large-scale time-mean ocean circulation in theNordic Seas and Arctic Ocean estimated from simplified dynamics. J. Mar. Res.61, 175–210.
Olsson, K.A., Jeansson, E., Tanhua, T., Gascard, J.-C., 2005. The East Greenland Currentstudied with CFCs and released sulphur hexafluoride. J. Marine Syst. 55, 77–95.
Petersen, G.N., Renfrew, I.A., 2009. Aircraft-based observations of air–sea fluxesover Denmark Strait and the Irminger Sea during high wind speed conditions.Quart. J. R. Meteorol. Soc. 135, 2030–2045, http://dx.doi.org/10.1002/qj.355.
Pickart, R.S., Torres, D.J., Fratantoni, P.S., 2005. The East Greenland Spill Jet. J. Phys.Oceanogr. 35, 1037–1053.
Pratt, L.J., 2004. Recent progress on understanding the effects of rotation in modelsof sea straits. Deep Sea Res. II 51, 351–369.
Renfrew, I.A., Petersen, G.N., Sproson, D.A.J., Moore, G.W.K., Adiwidjaja, H., Zhang,S., North, R., 2009. A comparison of aircraft-based surface-layer observationsover Denmark Strait and the Irminger Sea with meteorological analyses andQuikSCAT winds. Quart. J. R. Meteorol. Soc. 135, 2046–2066, http://dx.doi.org/10.1002/qj.444.
Rossby, T., Ozhigin, V., Ivshin, V., Bacon, S., 2009. An isopycnal view of the NordicSeas hydrography with focus on properties of the Lofoten Basin. Deep Sea Res. I56, 1955–1971, http://dx.doi.org/10.1016/j.dsr.2009.07.005.
Rudels, B., Björk, G., Nilsson, J., Winsor, P., Lake, I., Nohr, C., 2005. The interactionbetween waters from the Arctic Ocean and the Nordic Seas north of Fram Straitand along the East Greenland Current: results from the Arctic Ocean-02 Odenexpedition. J. Mar. Syst. 55, 1–30.
Rudels, B., Eriksson, P., Buch, E., Budéus, G., Fahrbach, E., Malmberg, S.-A., Meincke,J., Mälkki, P., 2003. Temporal switching between sources of the Denmark Straitoverflow water. ICES Mar. Sci. Symp. 219, 319–325.
Rudels, B., Fahrbach, E., Meincke, J., Budéus, G., Eriksson, P., 2002. The EastGreenland Current and its contribution to the Denmark Strait overflow. ICESJ. Mar. Sci. 59, 1133–1154.
Segtnan, O.H., Furevik, T., Jenkins, A.D., 2011. Heat and freshwater budgets of theNordic seas computed from atmospheric reanalysis and ocean observations.J. Geophys. Res. 116, C11003, http://dx.doi.org/10.1029/2011JC006939.
Serreze, M.C., Carse, F., Barry, R.G., Rogers, J.C., 1997. Icelandic Low cyclone activity:climatological features, linkages with the NAO, and relationships with recentchanges in the Northern Hemisphere circulation. J. Climate 10, 453–464.
Skagseth, Ø., Mork, K.A., 2012. Heat content in the Norwegian Sea, 1995–2010. ICESJ. Mar. Sci., http://dx.doi.org/10.1093/icesjms/fss026 ⟨Website: http://icesjms.oxfordjournals.org/content/early/2012/02/24/icesjms.fss026⟩.
Spall, M.A., Pickart, R.S., 2003. Wind-driven recirculations and exchange in theLabrador and Irminger Seas. J. Phys. Oceanogr. 33, 1829–1845.
Spall, M.A., Price, J.F., 1998. Mesoscale variability in Denmark Strait: the PV outflowhypothesis. J. Phys. Oceanogr. 28, 1598–1623.
Stommel, H., Bryden, H., Mangelsdorf, P., 1973. Does some of the Mediterraneanoutflow come from great depth? Pure Appl. Geophys. 105, 879–889.
Sutherland, D.A., Pickart, R.S., 2008. The East Greenland Coastal Current: structure,variability and forcing. Prog. Oceanogr. 78, 58–77, http://dx.doi.org/10.1016/j.pocean.2007.09.006.
Swift, J.H., Aagaard, K., 1981. Seasonal transitions and water mass formation in theIceland and Greenland seas. Deep Sea Res. 28A, 1107–1129.
Swift, J.H., Aagaard, K., Malmberg, S.-A., 1980. The contribution of the DenmarkStrait overflow to the deep North Atlantic. Deep Sea Res. 27A, 29–42.
Tanhua, T., Olsson, K.A., Jeansson, E., 2005. Formation of Denmark Strait overflowwater and its hydro-chemical composition. J. Mar. Syst. 57, 264–288.
Tanhua, T., Olsson, K.A., Jeansson, E., 2008. Tracer evidence of the origin andvariability of Denmark Strait Overflow Water. In: Dickson, R.R., Meincke, J.,Rhines, P. (Eds.), Arctic-Subarctic Ocean Fluxes: Defining the Role of theNorthern Seas in Climate. Springer, Dordrecht, The Netherlands, pp. 475–503.
Våge, K., Pickart, R.S., Sarafanov, A., Knutsen, Ø., Mercier, H., Lherminier, P., Bersch,M., van Aken, H.M., Meincke, J., Quadfasel, D., Bacon, S., 2011a. The IrmingerGyre: circulation, convection, and interannual variability. Deep Sea Res. I 58,590–614, http://dx.doi.org/10.1016/j.dsr.2011.03.001.
Våge, K., Pickart, R.S., Spall, M.A., Valdimarsson, H., Jónsson, S., Torres, D.J., Østerhus,S., Eldevik, T., 2011b. Significant role of the North Icelandic Jet in the formationof Denmark Strait Overflow Water. Nat. Geosci. 4, 723–727, http://dx.doi.org/10.1038/NGEO1234.

K. Våge et al. / Deep-Sea Research I 79 (2013) 20–39 39
Våge, K., Spengler, T., Davies, H.C., Pickart, R.S., 2009. Multi-event analysis ofthe westerly Greenland tip jet based upon 45 winters in ERA-40. Quart.J. R. Meteorol. Soc. 135, 1999–2011, http://dx.doi.org/10.1002/qj.488.
Voet, G., Quadfasel, D., Mork, K.A., Søiland, H., 2010. The mid-depth circulation ofthe Nordic Seas derived from profiling float observations. Tellus 62, 516–529,http://dx.doi.org/10.1111/j.1600–0870.2010.00444.x.
Wadhams, P., 1981. The ice cover in the Greenland and Norwegian Seas. Rev.Geophys. Space Phys. 19, 345–393.
Wong, A.P.S., Johnson, G.C., Owens, W.B., 2003. Delayed-mode calibration ofautonomous CTD float profiling salinity data by θ�S climatology. J. Atmos.Oceanic Technol. 20, 308–318.


