Embed Size (px)
Citation preview

14 QUALITY MANAGEMENT IN HEALTH CARE/FALL 2000
14
Quality Management in Health Care, 2000, 9(1), 14–22© 2000 Aspen Publishers, Inc.
Risk-Adjusted Clinical Quality Indicators:Indices for Measuring and Monitoring Rates of
Mortality, Complications, and ReadmissionsSusan I. DesHarnais, M. Thane Forthman, Judith M. Homa-Lowry, L. Dwight Wooster
This article describes a risk-adjusted approach for profilinghospitals and physicians onclinical quality indicators usingreadily available administrativedata. By comparing risk-adjustedrates of mortality, complications,and readmissions to peers,national norms, andbenchmarks, this approachenables purchasers andproviders to identify bothfavorable and adverse outcomesperformance.
Key words: benchmarking,complications, mortality, outcomesassessment, readmissions, riskadjustment
Susan I. DesHarnais, PhD, is a senior research associatewith The Delta Group, Inc., in Greenville, South Carolina.DesHarnais served as principal research investigator forthe Agency for Health Care Policy and Research and theHealth Care Financing Administration.
M. Thane Forthman, MBA, is managing principal of TheDelta Group, Inc., in Greenville, South Carolina.
Judith M. Homa-Lowry, RN, MS, CPHQ, is a senior con-sultant at The Delta Group, Inc., in Greenville, SouthCarolina. Homa-Lowry has served as president of the Na-tional Association for Health Care Quality and as facultyfor the Joint Commission on Accreditation of HealthcareOrganizations.
L. Dwight Wooster, MD, FCCP, is medical director at TheDelta Group, Inc., in Greenville, South Carolina.
LINICAL OUTCOMES assessment is be-coming a vital component of provider se-lection in the rapidly evolving managedcare environment. This is due in part toC
the success that many managed care organizations(MCOs) have experienced in limiting their risk onthe cost side of health care by shifting the responsi-bility of delivering efficient care to providersthrough the implementation of flat-rate per case andcapitated contracts. As a result, MCOs are beginningto incorporate the use of clinical outcomes assess-ment to select providers who perform well in areasof quality that can be measured, such as complica-tion and mortality rates, rather than simply focusingon costs. However, because significant differencesin demographic and clinical risk factors exist amongpatients treated across providers, a medically mean-ingful and statistically reliable risk adjustment toolis needed to make accurate comparisons of clinicaloutcomes.
This need for risk adjustment has been apparent formany years but its necessity became especially pro-nounced when the Health Care Financing Adminis-tration (HCFA) released hospital mortality rates forMedicare patients between 1986 and 1994.1 Becausethe methodologies adopted by HCFA did not account

Risk-Adjusted Clinical Quality Indicators 15
adequately for patient risk factors, there was muchcriticism of both the methodology2 and the decisionto release data that was not risk adjusted properly. Inrecent years, there have been many other attempts torelease or publish data on hospital performance.Some examples include the work done for the GreaterCleveland Health Quality Choice Project,3 the Mary-land Hospital Association’s Quality Indicator Project,4
the New York State Cardiovascular Data Base Project,5
and the Pennsylvania Health Care Cost ContainmentCouncil.6,7 These data releases met with mixed suc-cess. As Hannan and colleagues state:
A majority of cardiologists has not generally changed theirwell-established referral patterns as a result of the New Yorkcoronary artery bypass graft surgery reports. However, therehas been a modest impact on referrals resulting from thedistribution of these reports. The findings also suggest thatincreased dialogue between clinicians and policy makersregarding the format and structure of public releases wouldbe a valuable undertaking.8
While numerous severity measures exist that ac-count for some patient clinical characteristics, mosthave been constructed to measure a patient’s in-creased need for resource consumption in order toassess financial outcomes such as charges or costs.Moreover, severity narrowly implies that each pa-tient has some degree of severity associated with hisor her principal diagnosis and that this degree defineshis or her risk level. Yet in reality, a patient may be ingeneral good health but still be at risk for a particularadverse outcome because of age, sex, race,comorbidity, health behavior, or other characteristicsunrelated to the severity of his or her principaldiagnosis.9 A risk adjustment, on the other hand,accounts for the wide range of patient characteristicsthat may increase the probability for adverse qualityoutcomes for a given patient.
The purpose of this article is twofold: to describe arisk-adjusted approach for making valid compari-sons of clinical outcomes across providers and todemonstrate how this approach can be used for bothscreening adverse events and documenting favorableoutcomes performance. A description of how each ofthe risk-adjustment models was constructed and vali-dated is presented in the next section.
Risk-Adjusted Clinical Quality IndicatorModels
It is not possible, either conceptually or techni-cally, to construct an all-inclusive index to measurethe quality of health care. However, The Delta Grouphas constructed separate risk-adjusted indices thatvalidly measure three important components of thequality care: (1) mortality, (2) complications, and (3)readmissions. The specific indices developed by TheDelta Group are the risk-adjusted mortality index(RAMI), the risk-adjusted complications index (RACI),and the risk-adjusted readmissions index (RARI).These indices are based on the earlier research per-formed at the Commission on Professional and Hos-pital Activities (CPHA) through funding provided byHCFA.10–13 The risk models rely on readily availableadministrative data that can be used to assess riskfactors relating to the patient’s diagnoses (principaland secondary), age, sex, race, and surgical proce-dures. Recent work by Iezzoni and colleagues14 hasshown that risk adjustment methods that rely solelyon this type of administrative data perform quite wellwhen compared with methods that require addi-tional record abstracting.
Risk factors for RAMI, RACI, and RARI were mod-eled independently within clusters of diagnosis-re-lated groups (DRGs) using standard logistic regres-sion. Logistic regression was selected as theappropriate modeling tool because each of the vari-ables that were to be predicted (i.e., death, presenceof a complication, and readmission) could be classi-fied only into one of two categories (either theyoccurred or they did not occur). The clustering ofDRGs was necessary because many of the risk factorsassociated with an increased risk of death or compli-cations for a clinical condition were used as the basisfor DRG patient classification (age, comorbidities/complications, and discharge status). For instance,DRGs 89, 90, and 91 are all simple pneumonia andpleurisy but the DRG assignments differ by the age ofthe patient and presence or absence of comorbiditiesor complications (CCs). Similarly, DRGs 121, 122,and 123 are all circulatory disorders with acute myo-cardial infarction (AMI) but the DRG assignments

16 QUALITY MANAGEMENT IN HEALTH CARE/FALL 2000
vary by discharge status (alive or expired) and pres-ence or absence of cardiovascular complications.Consequently, DRGs were combined into clinicallyrelated clusters to determine how age, comorbidities,and other factors were associated with an increasedrisk of adverse outcomes within each disease cat-egory. The clustering process was applied across allDRGs, which resulted in 316 distinct clinical catego-ries. For ease of analysis, after the models wereapplied to the DRG clusters, most of the results wereunbundled and summarized at the individual DRGlevel. The method used to cluster DRGs was essen-tially the same as the HCFA “adjacent” DRG method-ology developed by the Health Systems ManagementGroup at Yale University to combine DRGs “with andwithout CCs.”15 The actual structure of specific DRGclusters is shown in Figure 1.
Hospital facility characteristics such as ownershiptype, bed size, teaching status, residency trainingprogram status, rural or urban designation, and occu-pancy level were not used in the risk-adjustmentmodels because these characteristics do not adjust fora patient’s legitimate clinical risk.16 Instead, theyrepresent the institutional risk associated with beingadmitted to a particular type of facility. The impor-tance of excluding hospital characteristics cannot beoverstated because the inclusion of these characteris-tics would distort grossly each of the risk models byarbitrarily lowering and raising the standard of careacross hospitals—even when the demographic andclinical characteristics of the patients are identical.
Furthermore, because institutional risk is one of theresidual variables that should be evaluated carefullyby purchasers and providers, the use of hospitalcharacteristics is counterintuitive and as such lacksface validity with employers, payers, and the medicalcommunity at large.12
RAMI
RAMI was developed to measure the risk of deathduring a hospital stay for specific diagnoses andprocedures. The predictive variables used in theRAMI logistic models were the patient’s age, sex,race, DRG cluster (risk associated with the principaldiagnosis/procedure), presence or absence ofcomorbidities (not complications), presence of anysecondary diagnoses of cancer other than skin cancer,and total number of comorbidities. Complications ofcare were excluded as risk factors so the severity of apatient’s illness at the time of admission could bemeasured in order to assess the risk of the patient’sprimary medical problem and related comorbiditiesprior to medical care intervention. Because the HCFAlist of CCs makes no distinction between comorbidities(secondary diagnoses present at the time of admis-sion) and complications (conditions that arose dur-ing the course of treatment), clinicians were retainedto separate the two. The clinicians designated 103post-surgical and 125 post-obstetrical conditions onthe HCFA CC list as most likely to be complicationsof care, or iatrogenic events. This list includes prob-lems such as septicemia, accidental operating lacera-
Figure 1. Structure of Specific DRG Clusters
DRG 89–91 Cluster:Simple Pneumonia & Pleurisy
DRG 121–123 Cluster:Circulatory Disorders with AMI
DRG89
DRG90
DRG91
DRG121
DRG122
DRG123
Age >17 without CC Age 0–17Without C.V. Comp.
& AliveExpired
With C.V. Comp.
& AliveAge >17 with CC

Risk-Adjusted Clinical Quality Indicators 17
tions, and obstetrical shock. This was a conservativeapproach insofar as certain conditions such as pneu-monia and urinary tract infections, which may ormay not be complications, were assumed to becomorbidities.
RACI
RACI was developed to measure the risk of post-surgical and post-obstetrical complications during ahospital stay for associated diagnoses and proce-dures. The predictive variables used in the RACIlogistic models included age, sex, DRG cluster (riskassociated with the principal diagnosis/procedure),presence or absence of comorbidities (not complica-tions), presence of cancer except skin cancer, andtotal number of comorbidities. The RACI modelsexcluded newborns, all cases in which patients died,and all cases in which patients were transferred toother short-term hospitals. A list of the 103 post-surgical and 125 post-obstetrical complicationsscreened by RACI is displayed in Table 1.
RARI
RARI was developed to measure the risk of anunanticipated readmission to the same hospital within30 days of discharge for specific diagnoses and proce-dures. Because the purpose of RARI is to measureadverse outcomes, certain types of readmissions wereexcluded such as readmissions that ordinarily wouldbe either scheduled (bilateral elective surgery, che-motherapy, diagnostic admission followed by surgi-cal admission) or unavoidable [multiple admissionsfor patients with acquired immune deficiency syn-drome (AIDS), cancer, and so forth]. Additionally,cases in which patients were transferred to anothershort-term hospital, cases in which patients diedduring the first admission, and newborns were ex-cluded from RARI. The predictive variables used inthe RARI logistic models were the patient’s age, sex,DRG cluster (risk associated with the principal diag-nosis/procedure), presence or absence ofcomorbidities and complications, presence of anysecondary diagnoses of cancer other than skin cancer,and total number of comorbidities.
Validation of the Risk Models
Significant effort was made to construct medicallymeaningful and statistically reliable models for risk-adjusting comparisons of mortality, complications,and readmissions. A summary of the steps taken toensure the validity of each of the risk models is asfollows:
• Only demographic and clinical characteristicsof patients were used as predictive variables ineach of the risk models.
• Risk factors were modeled for RAMI, RACI, andRARI using a large, representative database thatcovered all payer classifications and case typesexcept neonates.
• Statistical analysis was performed on each of themodels, comparing observed rates to predictedrates across an independent data set that was notused to fit the models. R2 statistics were calcu-lated. The R2 values for the models were 0.85 forRAMI, 0.65 for RACI, and 0.60 for RARI where1.0 would indicate a perfect linear relationshipbetween observed and predicted rates. Modelswith R2 values greater than 0.50 generally areconsidered to have good explanatory power whilemodels with R2 values greater than 0.90 oftensuggest that inappropriate predictive variablesmay have been used to construct the models.
A summary of the predictive variables used in eachrisk model along with each model’s R2 statistic isprovided in Table 2. An overview of the variousoutcome analyses that can be performed using therisk models is detailed in the next section.
Clinical Quality Outcomes Analysis
There are a variety of databases available for con-ducting valid comparisons of provider outcomes.The databases rely on patient discharge abstracts andinclude:
• HCFA Medicare Provider Analysis and Review(MedPAR) files that represent all Medicare dis-charges from short-term, general, non-federalU.S. hospitals
• public domain, all payer, statewide databasesthat include: Arizona, Arkansas, California, Colo-

18 QUALITY MANAGEMENT IN HEALTH CARE/FALL 2000
Table 1
LIST OF POST-SURGICAL AND POST-OBSTETRICAL COMPLICATIONS
Post-Surgical Complications1. Septicemia2. Streptococcal Septicemia3. Staphylococcus Septicemia4. Staphylococcus Septicemia NOS5. Staphylococcus Aureus Septicemia6. Staphylococcus Septicemia NEC7. Pneumococcal Septicemia8. Anaerobic Septicemia9. Gram-Negative Septicemia NEC
10. Gram-Negative Septicemia NOS11. H. Influenzae Septicemia12. E. Coli Septicemia13. Pseudomonas Septicemia14. Serratia Septicemia15. Gram-Negative Septicemia NEC16. Septicemia NEC17. Septicemia NOS18. Bacterial Infection in Other Dis/NOS19. Streptococcus Infection NOS20. Streptococcus Unspecified21. Streptococcus Group A22. Streptococcus Group B23. Streptococcus Group C24. Enterococcus Group D25. Streptococcus Group G26. Other Streptococcus (04109)27. Staphylococcus Infection NOS28. Staphylococcus Unspecified29. Staphylococcus Infection Aureus30. Other Staphylococcus (04119)31. Pneumococcus Infection NOS32. Klebsiella Infection NOS33. E. Coli Infection NOS34. H. Influenzae Infection NOS35. Proteus Infection NOS36. Pseudomonas Infection NOS37. Bacterial Infection NEC38. Mycoplasma39. Bacillus Fragilis40. Clostridium Perfringens41. Other Anaerobes42. Other Gram-Negative Bacteria43. Helicobacter Pylori
44. Other specific Bacteria45. Bacterial Infection NOS46. Acute Post-Hemorrhage Anemia47. Second Thrombocytopenia48. Anoxic Brain Damage49. Iatrogen Pulmonary Embolism/
Infarction50. Intracerebral Hemorrhage51. Intracranial Hemorrhage NEC/NOS52. Non-Traumatic Extradural Hemorrhage53. Subdural Hemorrhage54. Intracranial Hemorrhage NOS55. Cerebrovascular Accident56. Pseudomonal Pneumonia57. Staphylococcus Aureus Pneumonia58. Pneumonia, Other Gram-Negative
Bacteria59. Pneumonia, Organism NOS60. Pleural Effusion NOS61. Spontaneous Pneumothorax NEC62. Pulmonary Collapse63. Acute Respiratory Failure64. Peritonitis NEC65. Rectal & Anal Hemorrhage66. Perforation of Intestine67. Acute Renal Failure NOS68. Urinary Tract Infection, NOS69. Urinary Obstruction NOS70. Fever71. Bacteremia72. Malfunction of Internal Orthopedic
Device/Graft73. Reaction—Other Vascular Device/
Graft74. Complication—Other Cardiac Device75. Complication—Renal Dialysis
Device/Graft76. Complication—Other Vascular
Device/Graft77. Iatrogen Cardiovascular Infarction/
Hemorrhage78. Surgical Complication—Nervous
System NEC
79. Surgical Complication—Heart80. Surgical Complication—Peripheral
Vascular System81. Surgical Complication—Respiratory
System82. Surgical Complication—Digestive
System83. Surgical Complication—Urinary
Tract84. Hemorrhage Complication,
Procedural85. Hematoma Complication, Procedural86. Accidental Operating Laceration87. Postoperative Wound Disruption88. Other Postoperative Infection89. Other Specific Complication,
Procedural NEC90. Vascular Complication of Medical
Care NEC91. Accidental Cut/Hemorrhage in
Medical Care92. Accidental Cut/Hemorrhage in
Surgery93. Accidental Cut/Hemorrhage in
Infusion94. Accidental Cut/Hemorrhage—
Perfusion NEC95. Accidental Cut/Hemorrhage in
Injection96. Accidental Cut/Hemorrhage with
Scope Exam97. Accidental Cut/Hemorrhage with
Catheterization98. Accidental Cut/Hemorrhage with
Heart Catheterization99. Accidental Cut/Hemorrhage with
Enema100. Accidental Cut in Medical Care NEC101. Accidental Cut in Medical Care NOS102. Abnormal Reaction—Artificial
Implant103. Abnormal Reaction—Surgical
Procedure NEC
Post-Obstetrical Complications1. Acute Post-Hemorrhage Anemia2. Second Thrombocytopenia3. Lumbar Puncture Reaction4. Congestive Heart Failure5. Pulmonary Collapse6. Failed Induction NOS—Unspecified
7. Failed Induction NOS—Delivered8. Failed Induction NOS—Antepartum9. Failed Forceps NOS—Delivered
10. Delivered with 3rd DegreeLacerations—Unspecified
11. Delivered with 3rd DegreeLacerations—Delivered
12. Delivered with 3rd DegreeLacerations—Postpartum
13. Delivered with 4th DegreeLacerations—Unspecified
14. Delivered with 4th DegreeLacerations—Delivered
continues

Risk-Adjusted Clinical Quality Indicators 19
Table 1
CONTINUED
15. Delivered with 4th DegreeLacerations—Postpartum
16. Obstetrical Perineal LacerationNOS—Unspecified
17. Obstetrical Perineal LacerationNOS—Delivered
18. Perineal Laceration NOS—Postpartum
19. Obstetrical Perineal Trauma NEC—Unspecified
20. Obstetrical Perineal Trauma NEC—Delivered
21. Perineal Trauma NEC—Postpartum22. Obstetrical Perineal Trauma NOS—
Unspecified23. Obstetrical Perineal Trauma NOS—
Delivered24. Perineal Trauma NOS—Postpartum25. Ruptured Uterus NOS—Delivered26. Inversed Uterus—Postpartum27. Laceration of Cervix—Unspecified28. Laceration of Cervix—Delivered29. Laceration of Cervix—Postpartum30. High Vaginal Laceration—
Unspecified31. High Vaginal Laceration—Delivered32. High Vaginal Laceration—
Postpartum33. Obstetrical Injury, Pelvic Org—
Unspecified34. Obstetrical Injury, Pelvic Org—
Delivered35. Injury, Pelvic Org NEC—Postpartum36. Damage to Pelvic Joint—Unspecified37. Damage to Pelvic Joint—Delivered38. Damage to Pelvic Joint—Postpartum39. Obstetrical Trauma NEC—
Unspecified40. Obstetrical Trauma NEC—Delivered41. Obstetrical Trauma NEC—Delivered
with P/P42. Obstetrical Trauma NEC—
Antepartum43. Obstetrical Trauma NEC—
Postpartum44. Obstetrical Trauma NOS—
Unspecified45. Obstetrical Trauma NOS—Delivered46. Obstetrical Trauma NOS—Delivered
with P/P47. Obstetrical Trauma NOS—
Antepartum
48. Obstetrical Trauma NOS—Postpartum
49. Third-Stage Hemorrhage—Deliveredwith P/P
50. Third-Stage Hemorrhage—Postpartum
51. Postpartum Hemorrhage NEC—Delivered with P/P
52. Postpartum Hemorrhage NEC—Postpartum
53. Delayed Postpartum Hemorrhage—Delivered with P/P
54. Delayed Postpartum Hemorrhage—Postpartum
55. P/P Coagulation Deficiency—Delivered with P/P
56. Postpartum Coagulation Deficit—Postpartum
57. Pulmonary Complication inDelivery—Delivered
58. Pulmonary Complication—Deliveredwith P/P
59. Pulmonary Complication—Postpartum
60. Heart Complication in Delivery—Delivered
61. Heart Complication—Delivered withP/P
62. Heart Complication—Postpartum63. Central Nervous System
Complication Labor/Delivery—Delivered
64. Central Nervous SystemComplication—Delivered with P/P
65. Central Nervous SystemComplication in Delivery—Postpartum
66. Anesthesia Complication NEC—Delivered
67. Anesthesia Complication NEC—Delivered with P/P
68. Anesthesia Complication—Postpartum (66884)
69. Anesthesia Complication NOS—Delivered
70. Anesthesia Complication NOS—Delivered with P/P
71. Anesthesia Complication—Postpartum (66894)
72. Obstetrical Shock—Delivered73. Obstetrical Shock—Delivered with
P/P
74. Obstetrical Shock—Postpartum75. Maternal Hypotension Syndrome—
Delivered76. Maternal Hypotension Syndrome—
Delivered with P/P77. Maternal Hypotension Syndrome—
Postpartum78. Acute Renal Failure—Delivered with
P/P79. Acute Renal Failure—Postpartum80. Other Obstetrical Complications—
Delivered81. Other Obstetrical Complications—
Delivered with P/P82. Other Obstetrical Surgical
Complications—Postpartum83. Complicated Labor/Delivery NEC—
Delivered84. Complicated Delivery NEC—
Delivered with P/P85. Complicated Delivery NEC—
Postpartum86. Complicated Labor/Delivery NOS—
Delivered87. Complicated Delivery NOS—
Delivered with P/P88. Complicated Delivery NOS—
Postpartum89. Major Puerperal Infection—
Unspecified90. Major Puerperal Infection—
Delivered P/P91. Major Puerperal Infection—
Postpartum92. Thrombosis Postpartum—Delivered
with P/P93. Deep Vein Thrombosis—Postpartum94. Thrombosis NEC—Delivered95. Thrombosis NEC—Delivered with P/P96. Thrombosis NEC—Postpartum97. Obstetrical Air Embolism—
Delivered98. Obstetrical Air Embolism—
Delivered with P/P99. Obstetrical Air Embolism—
Postpartum100. Amniotic Embolism—Delivered101. Amniotic Embolism—Delivered
with P/P102. Amniotic Embolism—Postpartum103. Pulmonary Embolism NOS—
Delivered
continues

20 QUALITY MANAGEMENT IN HEALTH CARE/FALL 2000
rado, Connecticut, Florida, Georgia, Illinois, Iowa,Louisiana, Maine, Maryland, Missouri, Massa-chusetts, Nevada, New Hampshire, New Jersey,New York, North Carolina, Ohio, Oregon, Penn-sylvania, Rhode Island, South Carolina, Tennes-see, Texas, Utah, Vermont, Virginia, Washing-ton, West Virginia, Wisconsin, and Wyoming(certain restrictions may apply regarding dataaccess and reporting in each state)
Table 2
PREDICTIVE VARIABLES AND R2 STATISTICS BY RISK MODEL
Predictive variables Risk-adjusted Risk-adjusted Risk-adjustedand R2 statistics mortality index complications index readmissions index
Demographic• Age ✓ ✓ ✓
• Sex ✓ ✓ ✓
• Race ✓
Clinical• DRG cluster ✓ ✓ ✓
• Presence of cancer, except skin ✓ ✓ ✓
• Presence of complications ✓
• Presence of comorbidities ✓ ✓ ✓
• Number of comorbidities ✓ ✓ ✓
R2 Statistic .85 .65 .60
Table 1
CONTINUED
104. Pulmonary Embolism NOS—Delivered with P/P
105. Pulmonary Embolism NOS—Postpartum
106. Obstetrical Pyemic. Embolism—Delivered
107. Obstetrical Pyemic. Embolism—Delivered with P/P
108. Obstetrical Pyemic. Embolism—Postpartum
109. Pulmonary Embolism NEC—Delivered
110. Pulmonary Embolism NEC—Delivered with P/P
111. Pulmonary Embolism NEC—Postpartum
112. Puerperal CerebrovascularDisorder—Delivered
113. Cerebrovascular Disorder—Delivered with P/P
114. Cerebrovascular Disorder—Postpartum
115. Disrupted C-Section Wound—Unspecified
116. Disrupted C-Section Wound—Delivered with P/P
117. Disrupted C-Section Wound—Postpartum
118. Disrupted Perineal Wound119. Disrupted Perineum—Delivered
with P/P120. Disrupted Perineum—Postpartum121. Other Complicated Obstetrical
Surgical Wound122. Obstetrical Surgical Complication—
Delivered with P/P123. Puerperal Complication NEC/NOS124. Puerperal Complication NEC—
Delivered with P/P125. Puerperal Complication NOS
• proprietary UB–92 data from individual hospi-tals and consortia (including networks, alliances,and multihospital systems)
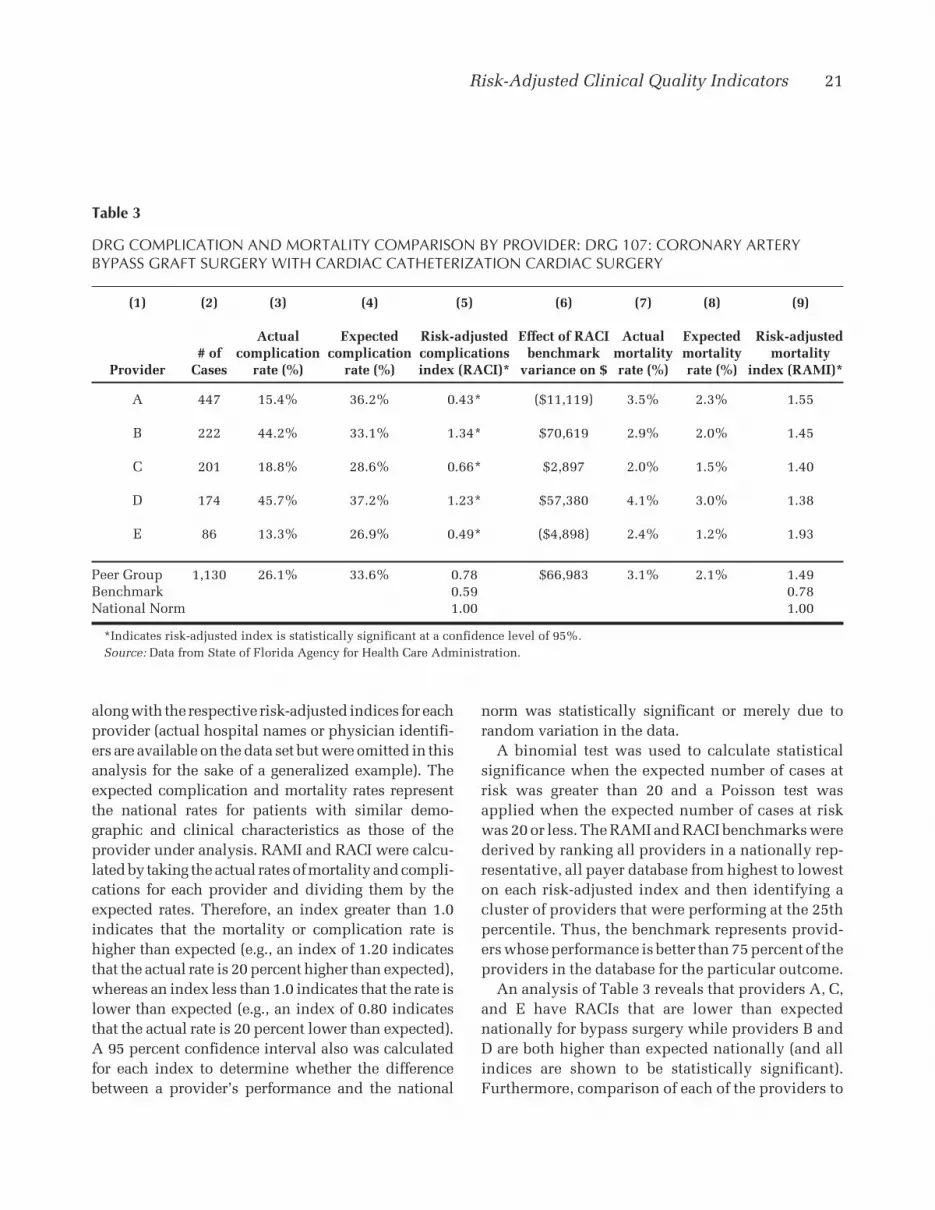
Application of the risk models for clinical outcomesanalysis is displayed in Table 3 using all payer statedata from the Florida Agency for Health Care Admin-istration. Actual and expected rates of complicationsand mortality for coronary artery bypass graft surgerywith cardiac catheterization (DRG 106) are shown
Risk-Adjusted Clinical Quality Indicators 21
along with the respective risk-adjusted indices for eachprovider (actual hospital names or physician identifi-ers are available on the data set but were omitted in thisanalysis for the sake of a generalized example). Theexpected complication and mortality rates representthe national rates for patients with similar demo-graphic and clinical characteristics as those of theprovider under analysis. RAMI and RACI were calcu-lated by taking the actual rates of mortality and compli-cations for each provider and dividing them by theexpected rates. Therefore, an index greater than 1.0indicates that the mortality or complication rate ishigher than expected (e.g., an index of 1.20 indicatesthat the actual rate is 20 percent higher than expected),whereas an index less than 1.0 indicates that the rate islower than expected (e.g., an index of 0.80 indicatesthat the actual rate is 20 percent lower than expected).A 95 percent confidence interval also was calculatedfor each index to determine whether the differencebetween a provider’s performance and the national
Table 3
DRG COMPLICATION AND MORTALITY COMPARISON BY PROVIDER: DRG 107: CORONARY ARTERYBYPASS GRAFT SURGERY WITH CARDIAC CATHETERIZATION CARDIAC SURGERY
(1) (2) (3) (4) (5) (6) (7) (8) (9)
Actual Expected Risk-adjusted Effect of RACI Actual Expected Risk-adjusted# of complication complication complications benchmark mortality mortality mortality
Provider Cases rate (%) rate (%) index (RACI)* variance on $ rate (%) rate (%) index (RAMI)*
A 447 15.4% 36.2% 0.43* ($11,119) 3.5% 2.3% 1.55
B 222 44.2% 33.1% 1.34* $70,619 2.9% 2.0% 1.45
C 201 18.8% 28.6% 0.66* $2,897 2.0% 1.5% 1.40
D 174 45.7% 37.2% 1.23* $57,380 4.1% 3.0% 1.38
E 86 13.3% 26.9% 0.49* ($4,898) 2.4% 1.2% 1.93
Peer Group 1,130 26.1% 33.6% 0.78 $66,983 3.1% 2.1% 1.49Benchmark 0.59 0.78National Norm 1.00 1.00
*Indicates risk-adjusted index is statistically significant at a confidence level of 95%.Source: Data from State of Florida Agency for Health Care Administration.
norm was statistically significant or merely due torandom variation in the data.
A binomial test was used to calculate statisticalsignificance when the expected number of cases atrisk was greater than 20 and a Poisson test wasapplied when the expected number of cases at riskwas 20 or less. The RAMI and RACI benchmarks werederived by ranking all providers in a nationally rep-resentative, all payer database from highest to loweston each risk-adjusted index and then identifying acluster of providers that were performing at the 25thpercentile. Thus, the benchmark represents provid-ers whose performance is better than 75 percent of theproviders in the database for the particular outcome.
An analysis of Table 3 reveals that providers A, C,and E have RACIs that are lower than expectednationally for bypass surgery while providers B andD are both higher than expected nationally (and allindices are shown to be statistically significant).Furthermore, comparison of each of the providers to

22 QUALITY MANAGEMENT IN HEALTH CARE/FALL 2000
the RACI benchmark shows that providers A and Eare performing better than the benchmark, indicatingthat they are among the top performing providers inthe nation. Also note that providers B and D areincurring more than $70,000 and $50,000 respec-tively in additional resource consumption due tomuch higher rates of complications than the bench-mark. The opportunity for providers B and D toreduce their cost of care by improving their rates ofcomplications demonstrates a well-known continu-ous quality improvement (CQI) principle that betterquality actually can cost less. With regard to RAMI,all providers have indices that are higher than ex-pected nationally but because they are not statisti-cally significant, the differences can be attributed torandom variation rather than to poor quality of care.
Conclusion
This type of risk-adjusted approach to clinicaloutcomes analysis allows purchasers to validly as-sess the relative performance of hospitals and physi-cians on important measures of quality. It also en-ables hospitals to identify and statistically validateadverse events, establish improvement priorities andobjectives, develop quality improvement plans, as-sess regulatory compliance, and identify favorableoutcomes for marketing to MCOs. Additionally, itoffers an effective process for monitoring new treat-ment protocols to ensure that cost containment doesnot compromise the quality of care.
2. H.W. Rosen and B.A. Green, “Mortality Lists: A MethodologyCritique,” Hospital and Health Services Administration 32(1987): 119.
3. M. Pine, “Designing and Using Case Mix Indices,” ManagedCare Quarterly 2, no. 3 (Spring 1994): 1–11.
4. “National Project Offers Hospitals Internal, External Compari-sons,” Hospital Outcomes Management 2, no. 1 (January1995): 5–7.
5. E.L. Hannan, H. Kilbun, Jr., J.F. O’Connell, G. Lukacik, and E.F.Shields, “Adult Open Heart Surgery in New York State: AnAnalysis of Risk Factors and Hospital Mortality Rates,” Journalof the American Medical Association 264 (1990): 2768–2774.
6. A Consumer Guide to Coronary Artery Bypass Graft Surgery(Harrisburg, PA: Pennsylvania Health Care Cost ContainmentCouncil, 1992).
7. Pennsylvania Health Care Cost Containment Council HospitalEffectiveness Report (Harrisburg, PA: Pennsylvania HealthCare Cost Containment Council, 1993).
8. E.L. Hannan, C.C. Stone, T.L. Biddle, and B.A. DeBuona,“Public Release of Cardiac Surgery Outcomes Data in NewYork: What Do New York State Cardiologists Think of It?”American Heart Journal 134, no. 6 (1997): 1120.
9. M. Pine and J. Pine, “Standardization of Terms and AnalyticalMethods for Performance Evaluation: Achievable Goal orImpossible Dream?” Managed Care Quarterly 3, no. 3 (Sum-mer 1995): 11.
10. S.I. DesHarnais, L.F. McMahon, Jr., and R.T. Wroblewski,“Measuring Outcomes of Hospital Care Using Multiple Risk-Adjusted Indexes,” Health Services Research 26, no. 4 (Octo-ber 1991): 425–445.
11. S.I. DesHarnais, “Current Uses of Large Data Sets to Assess theQuality of Providers: Construction of Risk-Adjusted Indexes ofHospital Performance,” International Journal of TechnologyAssessment in Health Care 6 (1990): 229–238.
12. S.I. DesHarnais, L.F. McMahon, Jr., R.T. Wroblewski, and A.J.Hogan, “Measuring Hospital Performance: The Developmentand Validation of Risk-Adjusted Indexes of Mortality, Read-missions, and Complications,” Medical Care 28, no. 12 (De-cember 1990): 1127–1141.
13. S.I. DesHarnais, J.D. Chesney, R.T. Wroblewski, S.T. Fleming,and L.F. McMaohn, Jr., “The Risk-Adjusted Mortality Index: ANew Measure of Hospital Performance,” Medical Care 26, no.12 (December 1988): 1129–1148.
14. L.I. Iezzoni, A.S. Ash, M. Shwartz, J. Daley, J.S. Hughes, andY.D. Mackieman, “Predicting Who Dies Depends on HowSeverity Is Measured: Implications for Evaluating Patient Out-comes,” Annals of Internal Medicine 123 (1995): 763–770.
15. N. Edwards, D. Honeman, D. Burley, and M. Navarro, “Refine-ment of the Medicare Diagnosis-Related Groups to Incorpo-rate a Measure of Severity,” Health Care Financing Review 16,no. 2 (1994): 48.
16. L.I. Iezzoni, ed., Risk Adjustment for Measuring Health CareOutcomes (Ann Arbor, MI: Health Administration Press, 1994).
REFERENCES
1. “HCFA Mortality Rates,” New York Times, 12 March 1986, 1.Report on the methodology originally published in the FederalRegister (August 17, 1987): 30741–30745. The actual reportswere published as Medicare Hospital Mortality Data (7 vol-umes), Superintendent of Documents, Government PrintingOffice (December 1987).


