Embed Size (px)
Citation preview
ROI of Manag€m€nt Training and D€v€lopm€nt
An innovative approach to measurement
With cases from
the Bank of Ireland
Banco Santander Central Hispano
DHL
DSM
IBM
Repsol
ACKNOWLEDGEMENT
“Information and texts for this report were supplied by Nigel Habershon (ProjectLeader), Donna Neumann (Consultant, PDI Inc), Dr. Gerrit Knodt (Senior Partner,
InterContext) and Dr. Sheila Tyler of the Open University Business School on behalf ofIBM. The report was complied and edited by Sheila Tyler.”

The ROI of Management Training and Development
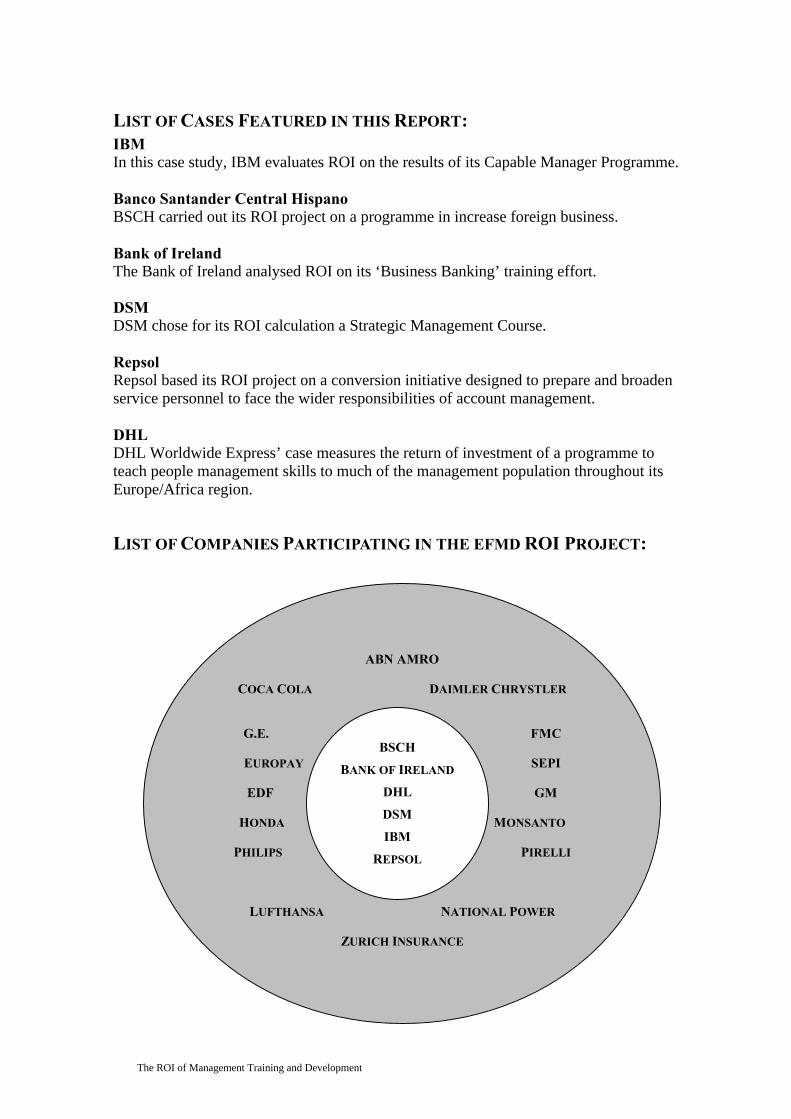
ABN AMRO
COCA COLA DAIMLER CHRYSTLER
G.E. FMC
EUROPAY SEPI
EDF GM
HONDA MONSANTO
PHILIPS PIRELLI
LUFTHANSA NATIONAL POWER
ZURICH INSURANCE
LIST OF CASES FEATURED IN THIS REPORT:IBMIn this case study, IBM evaluates ROI on the results of its Capable Manager Programme.
Banco Santander Central HispanoBSCH carried out its ROI project on a programme in increase foreign business.
Bank of IrelandThe Bank of Ireland analysed ROI on its ‘Business Banking’ training effort.
DSMDSM chose for its ROI calculation a Strategic Management Course.
RepsolRepsol based its ROI project on a conversion initiative designed to prepare and broadenservice personnel to face the wider responsibilities of account management.
DHLDHL Worldwide Express’ case measures the return of investment of a programme toteach people management skills to much of the management population throughout itsEurope/Africa region.
LIST OF COMPANIES PARTICIPATING IN THE EFMD ROI PROJECT:
BSCH
BANK OF IRELAND
DHL
DSM
IBM
REPSOL

The ROI of Management Training and Development 1
TABLE OF CONTENT
Acknowledgement ............................................................................................................ 1Table of Content ............................................................................................................... 1What is efmd? .................................................................................................................. 5
efmd Corporate Services .............................................................................................. 5Professional Development............................................................................................ 5Organisational Development ........................................................................................ 6Conferences and Practice-based Learning Groups ....................................................... 6
Section I............................................................................................................................ 7The ROI of Management Training and Development ...................................................... 7
1. Background............................................................................................................... 91.1. Project process and dissemination...................................................................... 101.2. The participating companies............................................................................... 10
2. Measuring Return on Investment and its Application to Training and Development11
2.1. The ROI formula................................................................................................. 122.2. The challenges of measuring ROI ...................................................................... 122.3. The need for conservatism.................................................................................. 142.4. Training and development ROI approaches ....................................................... 14
3. The PDI Model ....................................................................................................... 153.1. The benefit formula ............................................................................................ 153.2. The value of return, risk, and liquidity ............................................................... 173.3. Measuring effectiveness ..................................................................................... 183.4. When to measure ................................................................................................ 19
3.4.1. Measuring retrospectively........................................................................... 193.5. Measuring the development process................................................................... 20
3.5.1. Evaluating the development process .......................................................... 213.6. Measuring training expenses .............................................................................. 21
3.6.1. Opportunity costs........................................................................................ 233.7. Getting sensitive data.......................................................................................... 23
4. The case studies ...................................................................................................... 244.1. The companies.................................................................................................... 24
4.1.1. The programmes ......................................................................................... 25IBM............................................................................................................................. 25BSCH.......................................................................................................................... 25Bank of Ireland ........................................................................................................... 25DSM ........................................................................................................................... 25Repsol ......................................................................................................................... 25DHL............................................................................................................................ 25
5. Conclusion.............................................................................................................. 26
The ROI of Management Training and Development2
Section II......................................................................................................................... 29The case Studies ............................................................................................................. 29
CASE STUDY I: IBM.................................................................................................... 311. Background............................................................................................................. 312. The Original Research Project................................................................................ 323. The Scope and Design of the Study........................................................................ 334. The Sample Groups, the 360� Instrument and Responses .................................... 355. The Findings ........................................................................................................... 376. The Suitability of the Instrument and Findings for an ROI Initiative..................... 397. Converting Effectiveness into Impact and Impact into $benefit ............................ 418. The ROI Calculation............................................................................................... 439. Learning from the ROI Project ............................................................................... 4410. Commentary ........................................................................................................... 44
CASE STUDY II: BANCO SANTANDER CENTRAL HISPANO (BSCH) ............... 491. Background............................................................................................................. 492. The Initial Framework ............................................................................................ 50
2.1. The training and development programme......................................................... 502.2. Costs and benefits: hard and soft measurements ................................................ 512.3. The effectiveness challenge ................................................................................ 532.4. The evaluation process ....................................................................................... 562.5. Calculating the training benefit .......................................................................... 572.6. Analysing the results........................................................................................... 582.7. Converting benefit to return on investment ........................................................ 60
CASE STUDY III: DSM ................................................................................................ 621. Background............................................................................................................. 622. The Strategic Management Course......................................................................... 63
2.1. Participant profile ............................................................................................... 632.2. Course objectives................................................................................................ 632.3. Content ............................................................................................................... 642.4. Context ............................................................................................................... 642.5. Programme improvement targets........................................................................ 65
3. Evaluating the Effectiveness of the SMC............................................................... 653.1. The Generic Research Thesis ............................................................................. 653.2. The methodology................................................................................................ 67
3.2.1. The “After-Only” Design............................................................................ 673.2.2. The validity of the design ........................................................................... 683.2.3. The “target population” for analysis........................................................... 693.2.4. Measuring the Kirkpatrick 5 levels............................................................. 693.2.5. The measurement process........................................................................... 70
4. The Results of the Study......................................................................................... 714.1. Compatibility...................................................................................................... 714.2. Response rates .................................................................................................... 714.3. Participation pre-SMC perceptions (SMC ’97 and SMC ’99) ........................... 71
4.3.1. The selection process.................................................................................. 714.3.2. Initial reactions ........................................................................................... 724.3.3. Learning expectations................................................................................. 724.3.4. The application of what they have learned ................................................. 724.3.5. The participant/manager dialogue .............................................................. 72
The ROI of Management Training and Development 3
4.3.6. The Kirkpatrick Model ............................................................................... 735. Conclusions and Recommendations....................................................................... 79
5.1. The Kirkpatrick Theory ...................................................................................... 795.2. The methodology................................................................................................ 795.3. The results........................................................................................................... 79
CASE STUDY IV: REPSOL.......................................................................................... 821. Background............................................................................................................. 822. The Target Programme (11/97 – 11/98) ................................................................. 83
2.1. Programme design .............................................................................................. 842.1.1. Overview .................................................................................................... 842.1.2. Format of the individual action plans (Step 1) ........................................... 852.1.3. Diagnostic summary ................................................................................... 862.1.4. The selection of measurement criteria........................................................ 862.1.5. Statistical indicators.................................................................................... 87
3. The Impact of the Training Initiative...................................................................... 883.1. Time/cost savings ............................................................................................... 883.2. Other significant results...................................................................................... 89
3.2.1. Call system ................................................................................................. 893.2.2. Customer survey ......................................................................................... 89
4. Comments............................................................................................................... 91
CASE STUDY V: THE BANK OF IRELAND ............................................................. 931. Background............................................................................................................. 932. “Business Banking 1” ............................................................................................. 95
2.1. The programme................................................................................................... 952.2. Programme costs................................................................................................. 962.3. Participant profile ............................................................................................... 97
2.3.1. Enrolment criteria ....................................................................................... 972.3.2. Major job responsibilities ........................................................................... 972.3.3. Interaction ................................................................................................... 972.3.4. Scope of the job .......................................................................................... 972.3.5. Education level ........................................................................................... 972.3.6. Average tenure in position.......................................................................... 972.3.7. Average salary ............................................................................................ 97
3. Measuring the Results ............................................................................................ 983.1. Programme objective.......................................................................................... 983.2. Survey results...................................................................................................... 983.3. Effectiveness measures....................................................................................... 993.4. Impact measures ............................................................................................... 100
4. Conclusions .......................................................................................................... 101
CASE STUDY VI: DHL WORLDWIDE EXPRESS .................................................. 1021. Objectives of the ROI study.................................................................................. 102
1.1. Profile of the study’s company: ........................................................................ 1021.2. Study Assumptions, Goals and Methodology................................................... 1031.3. EXCELLENCE IN PEOPLE MANAGEMENT: The course .......................... 1051.4. The Final Results .............................................................................................. 1061.5. Cost of Training & Development ..................................................................... 1071.6. PARTICIPANT SURVEY RESULTS ............................................................. 1091.7. Participant Manager’s Survey Results.............................................................. 119
The ROI of Management Training and Development4
Section Three............................................................................................................... 123Appendixes .................................................................................................................. 123
1. Appendix One ..................................................................................................... 1251.1. ROI Model ........................................................................................................ 1251.2. Evaluation Process (Jack J. Phillips) ................................................................ 1251.3. Participant Business Locations ......................................................................... 1261.4. Participant ROI Follow-Up Memo #1 .............................................................. 1271.5. Participant ROI Follow-Up Memo #2 .............................................................. 1281.6. Manager of Participant ROI Follow-Up Memo................................................ 1291.7. Program Needs Analysis Costs Template......................................................... 130
1.7.1. Program Needs Analysis Costs................................................................. 1301.7.2. Program Development Costs .................................................................... 1311.7.3. Program Delivery Costs............................................................................ 1321.7.4. Program Evaluation Costs ........................................................................ 133
1.8. “Excellence In People Management” Course Description ............................... 1341.9. Books On Measurement & Evaluation ............................................................. 135
2. Appendix Two..................................................................................................... 137Measuring Performance and the Impact of Management Development ...................... 137
3. Appendix Three .................................................................................................. 139The ROI of Training and Development Efforts............................................................ 139
4. Appendix four ..................................................................................................... 141The roi of training and development - Review of an innovative approach tomeasurement................................................................................................................. 141
The ROI of Management Training and Development 5
WHAT IS EFMD?
The European Foundation for Management Development (efmd) is the premierprofessional network of management education and development across Europe andbeyond. Our mission is to promote excellence in the management developmentprofession.We believe:• That management within the context of an organisation is the ability to get the best
out of people for the optimal – and shared – benefit of all stakeholders.• That development is realised through academic preparation, practical formation and
the provision of adequate experience and incentives to managers• That excellence is achieved through identification, constructive debate and
permanent improvement of standards• That to promote is to seek consensus, awareness and wide recognition of such
standards and values, both within and beyond our membership network
Most of the leading business schools across Europe and beyond are members, as areover 100 major international corporations which want to learn from others and bysharing their own issues. In addition, efmd is the custodian of standards in good practicefor its profession and industry, for the schools via EQUIS, the worldwide accreditationstandard for business schools and increasingly for corporate practice too.Generally, efmd’s goal is to support corporate performance directly by helping tosustain a dialogue between theory and practice.
EFMD CORPORATE SERVICES
Is for practitioners in corporations wanting to learn from the experience of their peers bysharing their own experience. We offer a variety of tailor-made services to ourmembers, supporting their management development processes. The efmd corporatemembers’ network, which currently connects more than 100 international and Europeancorporations, and represents 1200 professionals, is an excellent forum for networkingand information exchange on leading edge management development.
PROFESSIONAL DEVELOPMENT
efmd delivers LINK (Learning, Innovation, Networking, Knowledge), a uniqueEuropean programme for fast track new management professionals. Focused onpractical needs, faculty is composed of management development practitioners fromleading companies and consultants. efmd also helps its corporate members to design,manage, deliver and evaluate in-company training for their employees. Utilising theextensive efmd network allows the use of the best professors and trainers throughoutEurope for a truly pan-European view of business education.
The ROI of Management Training and Development6
ORGANISATIONAL DEVELOPMENT
We have launched the “CLIP - Corporate Learning Improvement Process”, sincecorporate learning and knowledge management are key issues for the sustainabledevelopment of companies.
The purpose of CLIP is to design a quality assessment and development tool forcompany training centres and corporate universities. The working party consists of chieflearning officers as well as heads of corporate universities from leading Europeancompanies and financial services.
CONFERENCES AND PRACTICE-BASED LEARNING GROUPS
We run an annual Corporate Members Meeting that focuses on current concerns,allows sharing of best practices and new approaches. The “efmd Corporate Members’Day” is a review session of outputs generated from the past year activities and theagenda for the coming year.
We run a number of learning groups and special interest groups. Goal is to exchangereal practice based experience with experts, discuss pitfalls, and analyse success storieswithin an open and confidential environment. The groups work with leadingpractitioners, consultants and academics. We regularly publish reports based on theresults of those working groups. Lead by the members, we have an active process forselecting new topics in response to our members’ needs.
More info: Mrs. Shanshan GE, Manager, Corporate ServicesTel: + 32-2-629 08 27, Email: [email protected]
The ROI of Management Training and Development 7
SECTION I
THE ROI OF MANAGEMENT TRAINING AND DEVELOPMENT

The ROI of Management Training and Development8
The ROI of Management Training and Development 9
1. BACKGROUND
In 1998, the EU agreed to sponsor an efmd proposal designed to measure the Return onInvestment of some large European corporate training programmes. Two dozencompanies had expressed an interested in measuring of improvement the measurementof returns on their training and development efforts; eventually five completed theproject with the remainder forming a ‘shadow group’ following the projects and itsresults.
The project, run under the aegis of the EC Leonardo da Vinci fund, had been conceivedtwo years earlier following the efmd’s 25th annual conference, Measuring Performanceand the Impact of Management Development. A poll of the conference audienceshowed that 80% measured participant reactions to training efforts (‘happiness sheets’).Far fewer, just 33%, measured application of learning following training anddevelopment, and just 10% were attempting somewhat unsuccessfully, to equate theimpact of learning to improved business performance. Most of efmd’s corporatemembers felt they should be doing better. The faculty members of the various EuropeanBusiness Schools, who made up half of those attending the session, expressed the viewthat measuring the ROI of training and development efforts was the exclusiveresponsibility of their clients. Thus, the message was clear: companies must meet theirown needs with regard to evaluating programmes and calculating ROI.
There was consensus that ROI measurement was probably too cumbersome a tool tomeasure every training effort systematically. However, it should be considered in thedesign phase of any significant or particularly important training and developmentinvestment, and the appropriate measurement system built in to evaluate the results, at areasonable cost.
The ROI project was planned over the following year. Its main objectives were:
• to establish a clearer link between what it costs to educate and develop peopleand the returns on such investments.
• to ensure training and development receives an improved strategic focus inorganisations
• to encourage better targeted and increased investment in Human Resourcesacross Europe
• to develop tangible and better ‘bottom-line’ measures of the impact of generalmanagement training.
Each of the five participating companies identified a training and development effort forwhich it wanted to establish a realistic estimate of the ROI achieved. Companies werefree to chose the training/development programmes they wished to evaluation and nopressure was exerted on them to select ‘hard’ topics (those more conducive to producingmeasurement data.
The ROI of Management Training and Development10
Projects ranged from training to produce increases in foreign investment at a bank to theimpact of management education on workplace performance in a multi-nationalcompany.
The work was organised on an action-learning basis. Personnel Decisions International(PDI), a U.S. management consultancy specialising in the field, provided a model forcalculating ROI. This was not imposed on companies, but was taken up by participatingcompanies with various modifications. Donna Neumann of PDI was retained as atechnical adviser to give advice and guidance to the participating member companiesthroughout the project.
1.1. PROJECT PROCESS AND DISSEMINATION
To facilitate learning between the participating companies, regular meetings everyquarter so that members could present work-in-progress and share problems andexperience. IBM, PDI, The Bank of Ireland, BSCH and efmd hosted the events. Thesegroup meetings were useful additions to the numerous direct meetings between the ROIproject team and the individual participating companies.
At the end of the project companies presented their findings at two conferences,including the efmd annual conference in Edinburgh in 2000. To serve the purposes ofwider dissemination efmd together with the authors of the various studies decided toproduce this publication.
1.2. THE PARTICIPATING COMPANIES
The companies came from diverse cultural and business backgrounds-two banks, (oneSpanish and one Irish), a Dutch/international chemical company, a Spanish/internationaloil company, and the Advanced Sales and Marketing Institute (AMI) of IBM (based inBelgium), which was using the expertise of the Open University, UK, to provide anMBA programme through supported distance learning and a global air express companyheadquartered in Brussels, Belgium.
The topics chosen for the projects were varied from increasing the foreign businesselement or customer care in bank branches, optimising the return achieved by a‘flagship’ senior management Strategic Management course, converting petrol pumptechnicians into customer account managers, to professional development for younghigh performing managers and managers-to-be.
The details of these projects are set out later in the report as case studies. The report’sconclusion offers explanation for the successes and the failures, and more particularly tooffer suggestions to others who might be tempted to undertake such a project and toincrease the return on the effort they will be required to put into such a project.
The ROI of Management Training and Development 11
2. MEASURING RETURN ON INVESTMENT AND ITS APPLICATION TOTRAINING AND DEVELOPMENT
The measurement of return on investment (ROI) is, simply stated, the comparison of thecosts of a development programme to the benefits derived from it. As such, the ROIfigure is a measure of whether the development investment created value or lost valuefor the organisation. Much of the current interest in measuring ROI is rooted in a desireon the part of development professionals to establish that they are creating value for theorganisation, or at least neutralise the criticisms of detractors who argue thatdevelopment programmes are an unnecessary expense.
While the pressure for cost-justification can be a significant impetus for evaluatingtraining investments, a good economic analysis can and should do much more thanprove funds were well spent. Training and development professionals give thefollowing reasons for measuring ROI on development programmes:
A desire to ensure that scarce resources are directed at the investments that willcreate the most value.Every training manager must make choices as to how to allocate money, time, andattention. By focusing on value, the training manager can ensure limited resources areused to the organisation’s best advantage.
Inform the design of future training programmesTraining managers who identify this as a primary objective want to apply the insightsgained in the ROI measurement process to future offerings. By doing so, they canensure that every programme adds definable value to the organisation.
Ensure that adequate funds are allocated to training investments.In most organisations, training managers constantly compete for resources. Muchtraining is viewed as “discretionary” spending that can be easily increased or decreasedin the short run, making it an easy target at budget-cutting time. Even organisationswith a strong commitment to development can waver in the face of a downturn inbusiness performance. At those times, training managers must be able to provide aclear, compelling business case for the training investment. Even more important,training managers who have regularly and voluntarily demonstrated their focus on valuewill have an advantage over those who wait for others to demand cost-justification.
Enhance the credibility of the training function.Many training professionals believe their craft is under-appreciated by the organisation.By mastering the language of value, individuals can dramatically change others’perceptions of the training function.
Before undertaking any ROI measurement project, it is important to have a clear set ofobjectives for the analysis. This directive to ‘start with the end in mind’ will be familiarto those who are responsible for designing training and development programmes. It iswidely accepted that the design process should begin by stating the overall objectives forthe development programme, and later, for each module within the programme.Without those guideposts, one runs the risk of incurring unnecessary effort, or in theworst case, designing a brilliant programme that does not accomplish the intendedoutcome. The same lessons hold true for an ROI analysis.
The ROI of Management Training and Development12
An ROI analysis is of value to an organisation only if it helps managers to make orjustify a decision. While evidence of individual or departmental performance may be aby-product of the analysis, it should not be the primary objective. An analogy can bedrawn with post-analysis of capital investments.
Assume a company has made a major investment in a new technology. In most mediumto large organisations, the decision to invest would be based on the analysis presented inthe business case. The analysis is based on known facts and assumptions about the costsand benefits of the proposed investment. If the analysis is credible and the expectedreturn on investment meets or exceeds the organisation’s hurdle rate or investment, theproject is approved. A suitable period of time after making the investment, the analystlooks at the investment’s actual performance and compares it to the business case for theinvestment. Now that the facts are known, the analyst can determine which assumptionswere correct and which were incorrect. The insights gained from the post-analysisenables the analyst to improve his/her ability to predict the return on investment infuture capital investments. In turn, this improves future investment decisions.
2.1. THE ROI FORMULA
The basic ROI formula compares the benefits of the investment to the cost. This formulais used to measure return on any investment, training or otherwise.
Net Program BenefitROI (%) = ------------------------- x 100
Programme CostsThe formula can be illustrated using a simple example. An individual invests $100 in afinancial instrument. One year later, the investor sells the financial instrument, andreceives $108. He received $8 in return for his investment of $100, making his ROI8%:
8 x 100 = 8% 100
2.2. THE CHALLENGES OF MEASURING ROI
The ROI formula is relatively simple, but those who have attempted to measure ROIknow that it can be very difficult to do. Costs are usually obvious and easy to capture,whereas benefits can be difficult to quantify. Most of the cost of training falls into a fewcommon categories that are easy to recognise. The direct costs of the training, such asdesign costs, trainer compensation, facilities and materials, are often captured in thetraining department budget. Participants’ travel expenses, if any, are captured by theirdepartments. The indirect costs, such as the cost of taking trainees off the job and theirmanagers’ time and attention, are not captured in the financial reports, but can usuallybe estimated fairly easily. On the other hand, the very nature of the benefits will varysubstantially from one training programme to the next. Some training programmes arevery closely tied to tangible outputs that are already measured. Examples would includetechnical skills in a manufacturing environment or loss prevention methods at a retailchain. Training in “soft skills”, such as leadership or coaching, can be very valuable yetare usually more difficult to link to job performance.
The ROI of Management Training and Development 13
Improvements in performance can be hard to measure. This is increasingly true in aneconomy where intangible assets create a greater proportion of value and outputs are theproduct of complex systems and processes. Designers of performance managementsystems frequently struggle with this dilemma. Organisations want to provide formalperformance feedback annually, at a minimum. Their reward systems are usually basedon individual performance. The implications are that performance must be measured inthe short run, even for jobs with long cycle times, and must be centred on individuals.The same challenges apply when measuring ROI of training. Many trainingprogrammes seek to improve the skills of individuals, even when those individualsoperate in a team environment. The more interdependencies between roles, the moredifficult it is to measure individual performance.
The more the training function understands the roles of those participating in training,and how those roles fit in to the larger work unit, the easier it is to make the connectionbetween participating in the training. If a particular training programme is customisedto the role or department, that will make the measurement task easier. On the otherhand, training programmes with “open enrolment”, meaning participants represent awide range of roles, complicate the measurement task. Moreover, the value anindividual can create for the organisation is dependent on the job context. For example,a manager who coaches a large number of subordinates has the opportunity to influencethe performance of each. All other things equal, the potential value than can be createdby attending the training would be greater, the more subordinates the manager has. Thisdifference could be described as a variation in the frequency with which the trainee willapply the skills.
There can also be significant differences in the kinds of situations in which trainees canapply the skills, and these can also dramatically affect the potential value of the training.This seems obvious, but is too often overlooked at the conception of an ROI project.
Training function has difficulty gaining access to data, and interpreting the data whenthey do receive it. Most training functions are not in the habit of gathering andinterpreting performance data, so their requests for information are frequently met withscepticism. Those providing the data may legitimately fear the data will be misused ormisinterpreted by an unsophisticated user. Worse, they may fear that training managers’interest in the data may be temporary, and the data will not be used at all. This canmake accounting and other functions reluctant to go out of their way to show Trainingwhat data is available, how it may be relevant to measuring ROI, and how it should beinterpreted. Ironically, although the Finance function is often the most vocal aboutwanting to see the ROI on T & D interventions, assisting Training in the analysis is alow priority. More ROI projects have been frustrated by a lack of assistance fromFinance (or other functions that report measurement data) than any other cause.
When measuring ROI, one needs to consider the time period. For financial investments,returns are typically stated in annual terms. This is not generally true for other kinds ofinvestments, such as property, plant, and equipment. For investments in assets, therelevant time period is the number of years the asset will create value.
The ROI of Management Training and Development14
For example, if a company pays $50,000 for a vehicle that is expected to last 10 years,we calculate the benefits1 derived from the investment and compare it to the $50,000purchase price. For investments whose benefits extend beyond one year, we take intoaccount the “time value of money”, which reflects the fact that the value of the benefitsthat occur in the first year are much greater than those that occur in year ten.2
When measuring the ROI on training, what is the correct time period? The answer is: Itdepends on the project. The overriding principle is to determine the length of time thebenefits can reasonably be expected to continue. Benefit period can be estimated bytaking account of:• how long the programme has been or will be offered• how long trainees are expected to retain the learning• how long trainees will be in a role in which the new skills will be valuable. This can
be influenced by expected tenure in the job, future assignments, and turnover rates.
2.3. THE NEED FOR CONSERVATISM
Conservatism is a principle followed in the practice of public accounting. The rationaleis that, to protect investors, companies must be prevented from overstating their incomeor net worth. From this principle has evolved many rules that accountants must follow.While training managers are not bound by those same rules, there is still a value in beingconservative when estimating ROI. If an ROI analysis is perceived as overstating thebenefits or understating the investment, two things will happen: the conclusions of theanalysis will be called into question, and worse, the credibility of the training managerwill be damaged.
2.4. TRAINING AND DEVELOPMENT ROI APPROACHES
A number of approaches to measuring training and development ROI have beendeveloped over the last 50 years. Donald Kirkpatrick’s four level model is widelyregarded as the classic one. An alternative approach was put forward by Don Mager.Jack Phillips has elaborated the basic Kirkpatrick approach into a five level process.Kaufman also added a fifth level to Kirkpatrick’s basic hierarchy, but his is a societalmeaure as opposed to Phillips’ financial one. The main way in which this report seeksto move the debate forward is by using a training and development ROI modeldeveloped by Peter Ramstad and used by Personnel Decisional International.Kirkpatrick’s approach is also used in part in one case study. The DHL case studyconducted and prepared by Gerrit Knodt “A Study in the Return on Investment andTraining: The Excllence in People Management Programme” used the approach andmodel developed by Jack J. Phillips.
1 The benefits derived from the investment can be measured in many ways, depending on the situation.For example, if the vehicle in question is purchased so the company can minimize the use of costly outsidedelivery services, the benefit is equal to the cost savings.2 For further explanation, look up the topic “discounted cash flows” in any basic Finance text.
The ROI of Management Training and Development 15
3. THE PDI MODEL
The ROI formula compares the costs of a programme to the benefits it provides. Costsare relatively easy to calculate, while benefits are usually more difficult. This section ofthe report focuses on measuring benefits. Costs will be discussed in the next part of thereport
During the EC project, we offered the project partners the opportunity to test a newmodel for conceptualising the value created by training programmes. Partners were freeto use this model or any other model of their choice. This model was created by PeteRamstad of Personnel Decisions International.
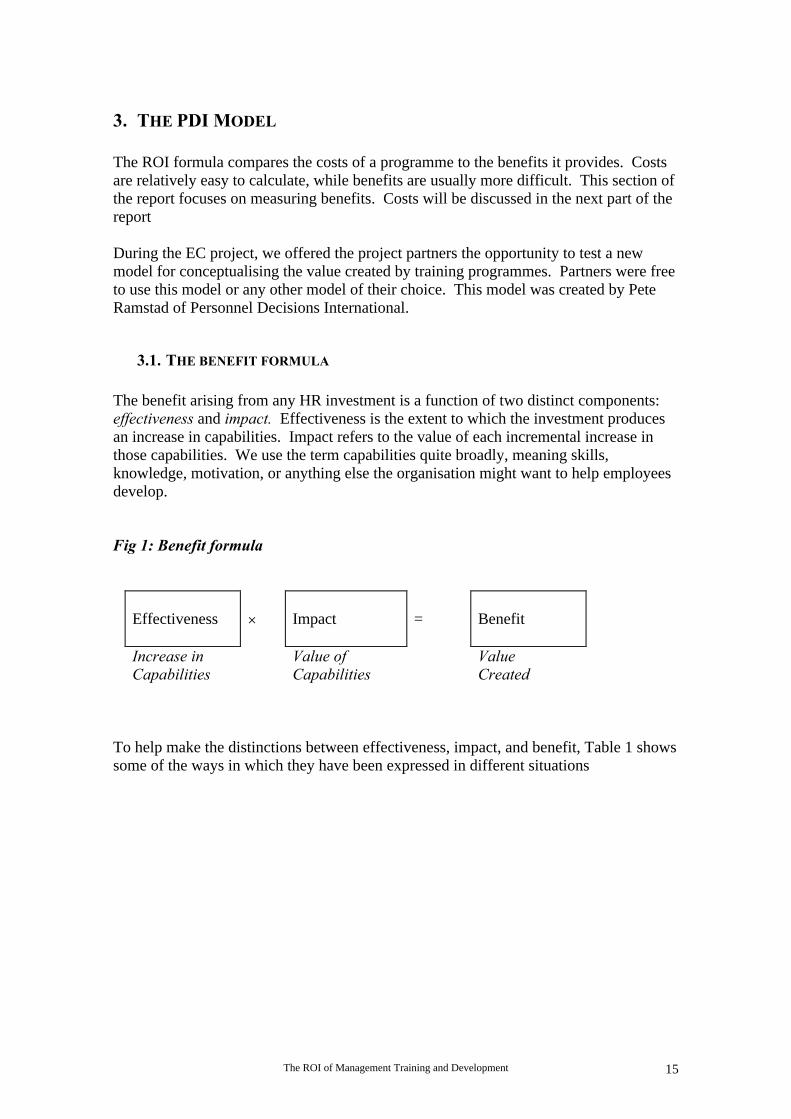
3.1. THE BENEFIT FORMULA
The benefit arising from any HR investment is a function of two distinct components:effectiveness and impact. Effectiveness is the extent to which the investment producesan increase in capabilities. Impact refers to the value of each incremental increase inthose capabilities. We use the term capabilities quite broadly, meaning skills,knowledge, motivation, or anything else the organisation might want to help employeesdevelop.
Fig 1: Benefit formula
Effectiveness × Impact = Benefit
Increase inCapabilities
Value ofCapabilities
ValueCreated
To help make the distinctions between effectiveness, impact, and benefit, Table 1 showssome of the ways in which they have been expressed in different situations
The ROI of Management Training and Development16
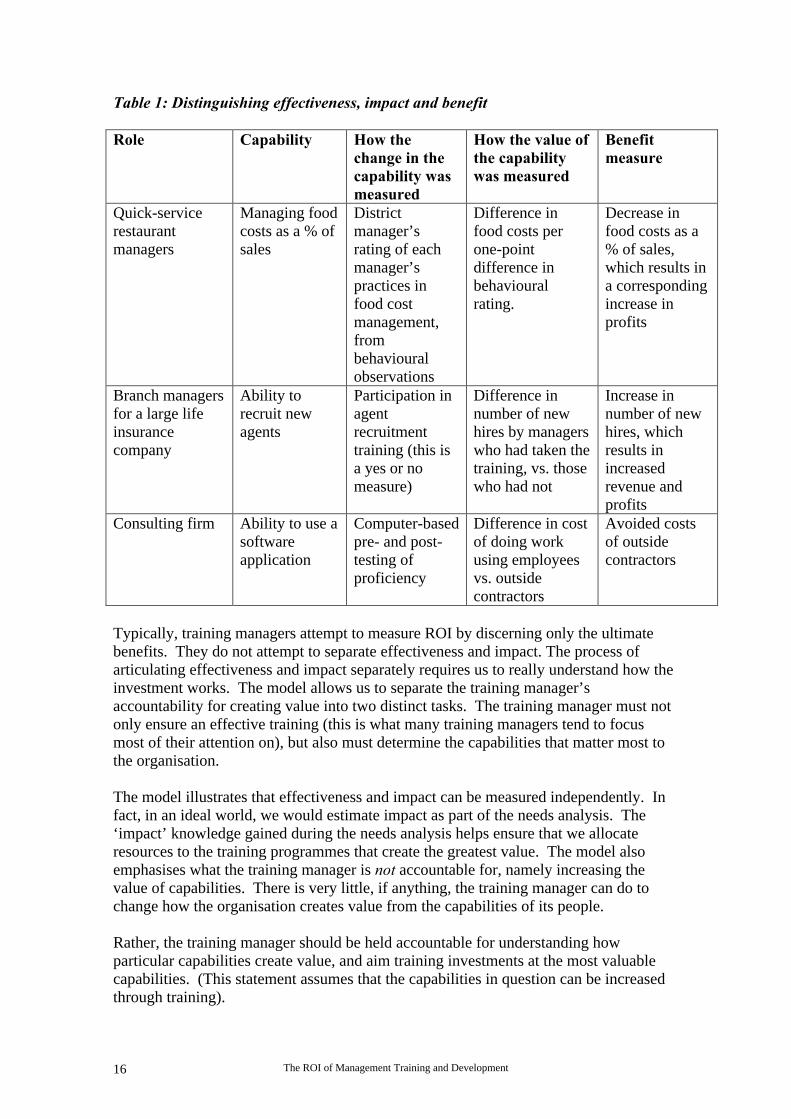
Table 1: Distinguishing effectiveness, impact and benefit
Role Capability How thechange in thecapability wasmeasured
How the value ofthe capabilitywas measured
Benefitmeasure
Quick-servicerestaurantmanagers
Managing foodcosts as a % ofsales
Districtmanager’srating of eachmanager’spractices infood costmanagement,frombehaviouralobservations
Difference infood costs perone-pointdifference inbehaviouralrating.
Decrease infood costs as a% of sales,which results ina correspondingincrease inprofits
Branch managersfor a large lifeinsurancecompany
Ability torecruit newagents
Participation inagentrecruitmenttraining (this isa yes or nomeasure)
Difference innumber of newhires by managerswho had taken thetraining, vs. thosewho had not
Increase innumber of newhires, whichresults inincreasedrevenue andprofits
Consulting firm Ability to use asoftwareapplication
Computer-basedpre- and post-testing ofproficiency
Difference in costof doing workusing employeesvs. outsidecontractors
Avoided costsof outsidecontractors
Typically, training managers attempt to measure ROI by discerning only the ultimatebenefits. They do not attempt to separate effectiveness and impact. The process ofarticulating effectiveness and impact separately requires us to really understand how theinvestment works. The model allows us to separate the training manager’saccountability for creating value into two distinct tasks. The training manager must notonly ensure an effective training (this is what many training managers tend to focusmost of their attention on), but also must determine the capabilities that matter most tothe organisation.
The model illustrates that effectiveness and impact can be measured independently. Infact, in an ideal world, we would estimate impact as part of the needs analysis. The‘impact’ knowledge gained during the needs analysis helps ensure that we allocateresources to the training programmes that create the greatest value. The model alsoemphasises what the training manager is not accountable for, namely increasing thevalue of capabilities. There is very little, if anything, the training manager can do tochange how the organisation creates value from the capabilities of its people.
Rather, the training manager should be held accountable for understanding howparticular capabilities create value, and aim training investments at the most valuablecapabilities. (This statement assumes that the capabilities in question can be increasedthrough training).
The ROI of Management Training and Development 17
Separating training effectiveness from impact can help us a great deal in making acompelling case for a proposed investment. In particular, it enables us to use what wecall the ‘threshold ROI’ method, which will be discussed in Section 4 of the report.
3.2. THE VALUE OF RETURN, RISK, AND LIQUIDITY
Most discussions about the value of training centre on the value of improvingperformance. However, training investments can create value in other ways, too. Theterms ‘return’, ‘risk’, and ‘liquidity’, to be helpful in distinguishing the ways traininginvestments create value. The analogy to financial investments is also particularlyhelpful in explaining the concepts to Finance and line managers.
RETURN
It is probably safe to say that most training investments are designed to create value byimproving performance. This is analogous to the financial investor’s desire to seek outfinancial instruments that will have the greater rewards. Examples of return-focusedtraining investments are programmes designed to improve selling skills or training in theuse of productivity-enhancing software.
RISK
In some cases, training investments are designed not to improve performance, but toprevent adverse events from happening. This is analogous to the financial investor’sdesire to protect his principal. Examples of risk-reducing investment are training hiringmanagers in relevant employment laws or any kind of safety training.
LIQUIDITY
In rare cases, organisations invest in training on a speculative basis. This happens whenthe organisation is facing uncertainty, and must be prepared to move swiftly as any oneof multiple scenarios unfolds. This can be likened to a the flexibility an investor gets bykeeping money in instruments that can be quickly converted to cash without incurring apenalty, should the need arise. In these types of training investments, the organisation isbuying flexibility. An example of a liquidity-producing investment would be foreignlanguage training for employees who may be asked to relocate to a new country on shortnotice, even though the company is not yet certain it will enter the new country.
Why is it important to understand whether a training investment is focusing onimproving return, reducing risk, or increasing liquidity? The main reason is that eachrequires a different approach to measuring the value of a training programme. Trainingmanagers who have studied the literature on ROI measurement will recognise that themost widely-used methods focus almost exclusively on measuring and valuingimprovements in performance. However, if you look at a risk-reducing or liquidity-enhancing investments through the lens of performance improvement, you will see noimprovement in performance, and the investments will appear to create no value. Onemust also recognise the trade-offs between return, risk, and liquidity. Investors clearlyunderstand these trade-offs when comparing financial investments.
The ROI of Management Training and Development18
It is widely understood that low rated bonds (including the very low-rated “junk bonds”)offer a substantially higher return, but also carry a much greater risk of default.
That is a return/risk trade-off. The same trade-offs apply when it comes to traininginvestments. In the case of liquidity-enhancing investments, such as the foreignlanguage training described above, there is a trade-off between liquidity (flexibility) andcurrent performance. The company will incur substantial costs in training employees inthe new language, believing there may be great value in having the ability to enter thenew country quickly, should the company decide to do so.
3.3. MEASURING EFFECTIVENESS
The PDI model asserts that the value created by a training programme is the product ofeffectiveness and impact (se Fig 1). There are a number of different tools one can use tomeasure the effectiveness of a training programme. Examples include tests, behaviouralobservations or performance ratings. Effectiveness measures can be objective (Did theemployee greet you?) or subjective (How friendly was the greeting?).
Tests can be a very effective, low-cost way to measure new knowledge and skills. Testsare generally more helpful when the knowledge and skills being trained are of aconcrete, technical nature, such as company policies, rather than “soft” skills such asemployee. Unfortunately, many competencies targeted in training programmes aredifficult to measure via a test. Behavioural observations have the advantage ofmeasuring capabilities in a real-world setting. In the financial services firm, it isimportant that the TSR’s be courteous and helpful, in addition to giving the rightanswers to questions. Since attitude cannot easily be measured in a test, the firm maydecide to listen in on a sampling of TSR calls, and rate them on qualitative attributessuch as courtesy and helpfulness. The training manager can then use this data tomeasure trainees’ capabilities before and after the training programme. Behaviouralobservations are, of course, subjective although the accuracy and consistency of ratingscan be improved in various ways.
While the annual performance appraisal rating is usually not a good gauge of increasedcapabilities, performance ratings can still be a useful tool, if the rating instrument andprocess is tailored to the training programme. Careful design and execution is critical.A programme-specific performance-rating tool is usually necessary even if theorganisation has a performance appraisal system in place. This is because, typically,performance appraisals do not measure the capabilities that are targeted by the training,and instead contain only broad rating categories such as ‘customer service’ or‘teamwork’.
The ROI of Management Training and Development 19
3.4. WHEN TO MEASURE
Measuring change requires pre- and post-measures. Failure to institute pre-trainingmeasures limits one to using existing measures (e.g., performance appraisal ratings) toestablish pre-training capabilities. In some cases, there may be no valid pre-trainingmeasure of capabilities.Defining the measures before the training enables you to build the best possiblemeasurement mechanisms (such as pre- and post- ratings by supervisor) into the designof the programme. The measurements can be designed to measure improvements in thespecific skills or knowledge provided by the training programme. The process ofdetermining the effectiveness measures clarifies the purpose and objectives of thetraining, thereby informing the design process.However, it is often the case the companies attempt to measure the ROI on adevelopment programme some time after the programme has taken place.
3.4.1. MEASURING RETROSPECTIVELY
As most of the companies participating in the ROI project carried out measurementretrospectively, a short description of how is achieved is given. In situations whereretrospective measurement of ROI is carried out, the pertinent questions for companiesare:
• What led you to invest in thisprogramme?
• What business needs were youtrying to address?
• How did you determine that adevelopment programme wasan appropriate solution?
• What capabilities is theprogramme intended to build?
• How are those capabilitiesconnected to individualperformance?
• How did programme designerstake those needs into account?
• Is there any writtendocumentation of the businesscase?
• Who were the initial sponsorsof this programme?
• Why did they want it?• What would success look like,
in their eyes?• What business performance
indicators get the mostattention at your company?
• In your own mind, why do youthink this was a worthyinvestment?
• Tell me more about theparticipants
• How many?• How were they selected for
the programme?• What expectations were set for
them?• What role(s) are they in?• How is success measured in
those roles?• What evidence do you have
that can be used to establishthe degree to whichparticipants increased theircapabilities (e.g., ratings,promotion rates, existingperformance measures)?
• What do participants,supervisors, peers andcustomers say about theprogramme and its benefits tothe organisation?
The ROI of Management Training and Development20
3.5. MEASURING THE DEVELOPMENT PROCESS
The typical measurement of development programmes focuses only on the end result.While the end result is certainly important, it can also be helpful to measure certainaspects of the development process. This is analogous to measures of “process health”that are advocated by quality improvement efforts. Quality experts discovered long agothat it is not enough to measure the end product. To improve a process, one mustunderstand how the end result was obtained. That can only be done by measuringintermediate stages of the process.Process measures:• can help you understand why the programme achieved the results it did and identify
opportunities for improvement.• underscore that the responsibility for development is shared by the individual, the
manager, and the training department.• when designing a new programme, process thinking helps you identify and correct
potential defects before they occur, increasing the potential effectiveness of thetraining.
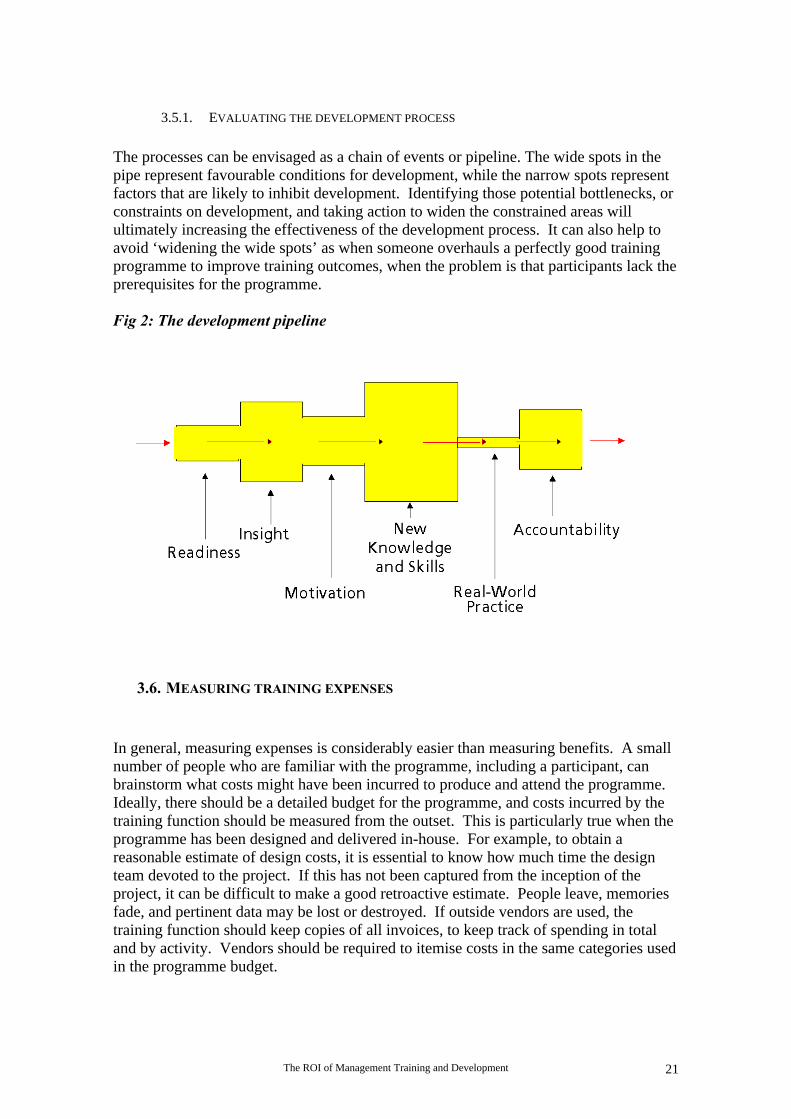
To measure the health of the development process, the ‘necessary and sufficientconditions for success need to be defined. David Peterson and Mary Dee Hicks haveidentified six conditions that are necessary for individuals, teams, and other work groupsto develop in ways that contribute to organisational success3:
1. Readiness: People need to be ready and able to take part in the development process.2. Insight: People need to know what to develop and where they stand.3. Motivation: People need to know why it matters to them.4. New knowledge and skill: People need to know how and where they can acquirenew capabilities.5. Real-world practice: People need opportunities to apply what they’ve learned andreflect on those experiences to guide their ongoing development.6. Accountability: People need to be held responsible for developing themselves, andfor ensuring that their development is having a positive impact on their performance.
Each of these factors can be measured to determine the constrained areas in the process,and to identify opportunities for improvement. The measurements can be as simple ashaving a group of stakeholders develop a consensus rating of a particular developmentinvestment in terms of the six conditions above, giving each a rating of 1 (highlyineffective) to 5 (highly effective). Alternatively, one could construct a more detailedwritten survey. Either way, the exercise will provide insight into how training outcomescan be improved.
3 Adapted from Peterson and Hicks, 1998
The ROI of Management Training and Development 21
3.5.1. EVALUATING THE DEVELOPMENT PROCESS
The processes can be envisaged as a chain of events or pipeline. The wide spots in thepipe represent favourable conditions for development, while the narrow spots representfactors that are likely to inhibit development. Identifying those potential bottlenecks, orconstraints on development, and taking action to widen the constrained areas willultimately increasing the effectiveness of the development process. It can also help toavoid ‘widening the wide spots’ as when someone overhauls a perfectly good trainingprogramme to improve training outcomes, when the problem is that participants lack theprerequisites for the programme.
Fig 2: The development pipeline
3.6. MEASURING TRAINING EXPENSES
In general, measuring expenses is considerably easier than measuring benefits. A smallnumber of people who are familiar with the programme, including a participant, canbrainstorm what costs might have been incurred to produce and attend the programme.Ideally, there should be a detailed budget for the programme, and costs incurred by thetraining function should be measured from the outset. This is particularly true when theprogramme has been designed and delivered in-house. For example, to obtain areasonable estimate of design costs, it is essential to know how much time the designteam devoted to the project. If this has not been captured from the inception of theproject, it can be difficult to make a good retroactive estimate. People leave, memoriesfade, and pertinent data may be lost or destroyed. If outside vendors are used, thetraining function should keep copies of all invoices, to keep track of spending in totaland by activity. Vendors should be required to itemise costs in the same categories usedin the programme budget.
The ROI of Management Training and Development22
The following categories of costs below are common to many programmes:
Costs incurred by the training function§ Curriculum design and development costs§ Programme materials§ Compensation of programme deliverer§ Travel expenses for the deliverer and other staff§ Administrative costs§ Facilities§ Incidental costs
Costs usually incurred by the participants’ function§ Cost of taking participant off the job§ Cost of participants’ time spent on pre- and post-programme activities§ Cost of managers’ time§ Travel costs
Costs incurred by other functionsSubject matter experts’ assistance with design or delivery.
Costs incurred by the training functionTraining managers who make greater use outside vendors will have a considerablyeasier task of calculating the costs. The task can be as simple as gathering up theappropriate invoices and tallying them. When any of the above is handled in-house, thetraining manager will have to do more investigating, typically assisted by the accountingdepartment. If the programme is designed in-house, salaries and benefits of those staffpeople would normally be included for the time period they are working on theprogramme in question. In some cases, the labour costs will reflect more than salariesand benefits. This is particularly true of larger programmes. For example, if a trainer isdedicated full-time to the programme, costs of office space, computers, and other toolswould be included in the cost calculation. The goal is to reflect the full economic costsassociated with having the individual work on the programme. When calculatingadministrative costs, one needs to consider the tasks being done, who is doing them, andhow much time is being spent. These administrative costs should include clerical help aswell as managers and other staff. Facilities costs should include meeting space, audio-visual equipment, meals provided, and incidental costs. operating the facility, and assignthe costs to the training programme based on usage.
Costs incurred by the participants’ functionMeasuring the costs incurred by the participants’ function can be more challenging thanmeasuring the costs incurred by the training function. This is because measuring thevalue of someone’s time requires an understanding of what they do. Pre-programmeactivities would include time spent completing any forms, surveys, or other pre-work,and discussing personal development objectives with others, including the manager,peers, and subordinates. (Most training managers would be happy to include the cost ofmanagers’ time, if only they could get the manager to spend some time with theparticipant before and after the programme!)
Travel costs are relatively easy to capture, but in addition it is necessary to measure thecost of taking the participant off the job. The same principles can be applied tocalculate the cost of pre-and post-programme activities and the manager’s time.
The ROI of Management Training and Development 23
3.6.1. OPPORTUNITY COSTS
When measuring indirect costs, the true economic (‘incremental’) cost should becovered. This is the opportunity cost, so-called because it reflects the value theindividual could have created, had he stayed on the job. Determining the opportunitycost requires an understanding of the participants job situation, and what happens whenhe is absent. For example, if an hourly worker were taken off the job, most trainingmanagers would say the cost is the wages and benefits paid to the worker during thetime in training. However, that may not measure the true economic cost. If otherscovered for the individual and there was no disruption in production, the cost of takingworker off the job is zero. On the other hand, if a temporary worker replaces theindividual, the cost is more accurately reflected by the fees paid to the temporaryagency. Usually, the greatest opportunity costs are incurred when the individual is notreplaced and an essential task goes undone. The value any individual is expected tocreate on the job exceeds his wages and benefits. If that were not the case, the businesswould not be profitable.
What is the cost of taking an executive off the job? Many executives just have to workharder in the subsequent weeks to make up for the absence. In that case, it could beargued that the economic cost is zero. However, this is one area where the practical andthe theoretical often diverge. If the assumption is made that the opportunity cost is zero,users of the analysis may question its accuracy. For that reason, it is usually assumedthat the opportunity cost is equal to the salaries and benefits paid during the time theindividual is in training.
One difficulty of measuring opportunity costs is that accounting departments do notusually capture costs that way. They will know what it costs to hire temporary labour,but usually will not offer much insight into the value lost if the worker is absent and notreplaced. This means that training manager has to know the difference between what isreflected in the accounting records and the true opportunity cost, and find a reasonableway to estimate the opportunity cost. If the organisation has a financial analysisfunction, they will typically have had a lot of practice in estimating opportunity costswhile performing analyses of other kinds of investments.
3.7. GETTING SENSITIVE DATA
When the training manager is asking accounting for data that is not usually provided tothe training function, he sometimes encounters resistance. The question in theaccountant’s mind may be something such as ‘Why are you asking?’ or ‘What are yougoing to do with this data, if I give it to you?’ Obviously, one cannot make an accurateestimate of the ROI without having reasonable estimates of the costs involved.Sometimes, simply explaining the business purpose of the analysis is enough to gainaccess to data.
Salary data can be particularly sensitive, and there may be company rules againstdisclosing it. Again, it pays to remind the accountant that the data will be used tosupport significant investment decisions.
The ROI of Management Training and Development24
Protecting confidentiality may mean you have to find a way to disguise individual salarydata, such as by aggregating the salaries of several individuals together, when reportingyour cost calculations. Another tack is to ask for the salary in a ‘round figure’. Anaccountant may be more comfortable saying “about $50,000” than providing an actualsalary of $48,750. Failing all else, a human resources department may provideinformation about the salary range for the position in question; the middle of the rangecan then be used.
4. THE CASE STUDIES
The ROI of the investment should be estimated before the investment is undertaken. The‘threshold ROI’ method - more aptly called the ‘threshold effectiveness’ method - isused to estimate how effective a particular development investment must be if it is togenerate a satisfactory return. By calculating the threshold effectiveness level, it isintended to establish that there is a high probability that the investment will generate asatisfactory return. This is quite different from trying to show the programme has orwill have a high return on investment.
In practice, however, the return on investment of a development programme is oftencalculated after the investment in a training/development programme has already takenplace. Most of the ROI projects undertaken as part of the project were no exception:training and development programmes had already started and ROI calculation waslargely retrospective.
4.1. THE COMPANIES
Of the participating companies, five had completed their ROI projects in time to presenttheir findings to the efmd annual conference in Edinburgh in 2000. They were IBM,renowned for its high level of investment in training and development; tow banks, theBank of Ireland and the Banco Santander Central Hispano, where financial and trainingobjectives are closely entwined, a Dutch-based chemical company, DSM and a Spanishpetroleum company, Repsol. DSM and Repsol both had important ‘change’requirements and pressing international ambitions.
The ROI of Management Training and Development 25
4.1.1. THE PROGRAMMES
IBMWalter Stepanek, the manager of IBM’s Global Advanced Sales and Marketing Institute(AMI) produced ROI calculations on the results of IBM’s Capable Manager programme,a year-long supported distance learning course provided by the Open University. Thework was carried out for IBM by Dr Sheila Tyler of the Open University BusinessSchool. To assess the impact of the education programme, the workplace performanceof students was compared with that of non-students in the same organisation.
BSCHBSCH carried out its ROI project on a programme in increase foreign business. The ROIproject, managed by Pilar Fernandez Baca, involved a comparison of branch managerswho received training with a matched control group of untrained managers.
Bank of IrelandThe Bank of Ireland analysed by return on its ‘Business Banking’ training effort,measuring the impact of the training and the payback on the investment. This projectwas run by Paul Paterson.
DSMDSM chose for its ROI calculation a Strategic Management Course. Like IBM, DSMbrought in academic help. University student Simone Sluijmans, a final-year universitystudent chose the DSM project to work on for her undergraduate dissertation. Theproject was managed by Christiane Thielens who replaced Joop Joosen fifteen monthsinto efmd initiative.
RepsolRepsol, a company striving to enlarge the commercial activities of its franchised petrolstations, based its ROI project on a major conversion initiative that was designed toprepare and broaden service personnel to face the wider responsibilities of accountmanagement.
DHLThe pioneer and market leader of the global express industry, DHL Worldwide Express,utilised the process and model developed by Jack Philips, to measure the return ofinvestment of a programme to teach people management skills to much of themanagement population throughout its Europe/Africa region.
The following six case studies set out how each of these companies went about theprocess of evaluating the impact and benefits of the programmes, calculating the costsand working out the ROI. The first five companies chose to use adapted and simplifiedversions of the PDI model.
The ROI of Management Training and Development26
5. CONCLUSION
Superficially, ROI is a financial metric which can be used by HR managers and directorsto justify training and development budgets. However, the method employed tocalculate ROI requires mapping training/development objectives to outcomes andoutcomes to desired impact. Through attempting ROI calculations, the need for andhow to bring about strategic alignment becomes clear. The involvement of financialpersonnel, company strategists, line managers, those charged with training anddevelopment, and the recipients of the training/education programme will come to beseen as critical. Moreover, the attempt to achieve strategic alignment also reveals wherethe benefits of training/education may be maximised (for example, increasing theopportunities for application of new knowledge which may require greater involvementby line managers). In this way, training and development may become embedded instrategic thinking at executive level: at this level the use of ROI to ‘justify’ training anddevelopment expenditure to senior management becomes less compelling. Embarkingon ROI exercises, then, can be seen both as a short-term expedients for decision-makingand, in the longer term, as a mechanism of change in organisational thinking.
This thinking was behind the main objectives of the ROI Project, which were:
1. To establish a clearer link between what it costs to educate and developpeople and the returns on such investments.
2. To ensure training and development receives an improved strategic focus inorganisations
3. To encourage better-targeted and increased investment in Human Resourcesacross Europe.
4. To develop tangible and better ‘bottom-line’ measures of the impact ofgeneral management training.
These objectives were largely met, although Objective 3 would require revisiting theparticipating companies to see if this had occurred.

The ROI of Management Training and Development 27

The ROI of Management Training and Development28

The ROI of Management Training and Development 29
SECTION II
THE CASE STUDIES

The ROI of Management Training and Development30
The ROI of Management Training and Development 31
CASE STUDY I: IBM
1. BACKGROUND
IBM enjoys the status of being a household name almost globally. The world’s largestinformation technology company, IBM employs some 305 000 people in 164 countries.The company creates, develops and manufactures advanced ITs including computersystems, software, networking systems, storage devices and microelectronics, and anetwork of professionals translate these into integrated solutions and services forcustomers. The company has turned itself around since the 1980s and early 1990s whenit was thrown into turmoil by the PC and client/server revolutions for which, ironically,the company had laid the foundations. In 1993 the company experienced both recordlosses and the beginning of the ‘new IBM’ with the arrival of Lou Gerstner as CEO whopared costs and the workforce but kept IBM as a single company to maintain IBM’senduring strength: the ability to provide integrated solutions, services, products andtechnologies for customers. This dovetailed with an industry shift in focus to networkcomputing which, by the mid 1990s, became central to IBM’s business strategy.
This was the backdrop to IBM’s bold move to development management capabilities inEurope, the Middle East and Africa (EMEA). An informal partnership was struck withthe Open University Business School in the UK to provide management education tosuccessive cohorts of students. The aim was to have 2000 middle managers with MBAdegrees by 2002, both through the education programme and new-hire. The decisionwas driven by a set of organisational objectives: to create speedy cultural change andnew leadership while creating a ‘learning environment’ capable of sustainingadaptability and flexibility among managers. To achieve this learning environment acritical mass of managers using a common language and shared concepts wasconsidered vital.
In May 1996 240 young managers or managers-to-be, selected for their high potential,began studying with the Open University Business School (OUBS). The delivery of thepart-time, tutor-supported distance learning courses was specially adapted by OUBS toinclude additional face-to-face tuition. In A second large cohort of student began inMay 1997. IBM funded research into the progress of this second group of students.This study began before the ROI project initiative, and there were no policy decisionswithin IBM to assess in financial terms the return on the investment. However, theoriginal study had been set up in a way that met many of the criteria for calculating theROI in the way envisaged by efmd. Thus the ROI project could be ‘piggybacked’ on tothe larger study for very little cost. The perceived benefit to IBM of joining the projectwas the opportunity to gain new knowledge.
The ROI of Management Training and Development32
2. THE ORIGINAL RESEARCH PROJECT
IBM’s broad aim for the original evaluative research project was to discover whetherOUBS courses were producing managers with skills and capabilities which met itsobjective for organisational renewal. An issue was whether managers (as students ofOUBS) were applying their skills to the workplace. For OUBS, the research objectiveswere more educational. The combined objectives were to ascertain:
• the impact of student characteristics (e.g. selection/situation, learning history,aspirations, attitudes, autonomy and approach to learning) on learning outcomesboth academic and in the workplace
• the impact of learning on student characteristics (e.g. approach to learning,development of autonomy, positive attitudes to continuing self-development)
• the impact of course delivery (and learning support) on student learning
• learning outcomes both in terms of formal assessment and application of learning inthe workplace and the relationships between knowledge application and factors suchas opportunities to apply learning, organisational support systems and line managers'knowledge of the course content.
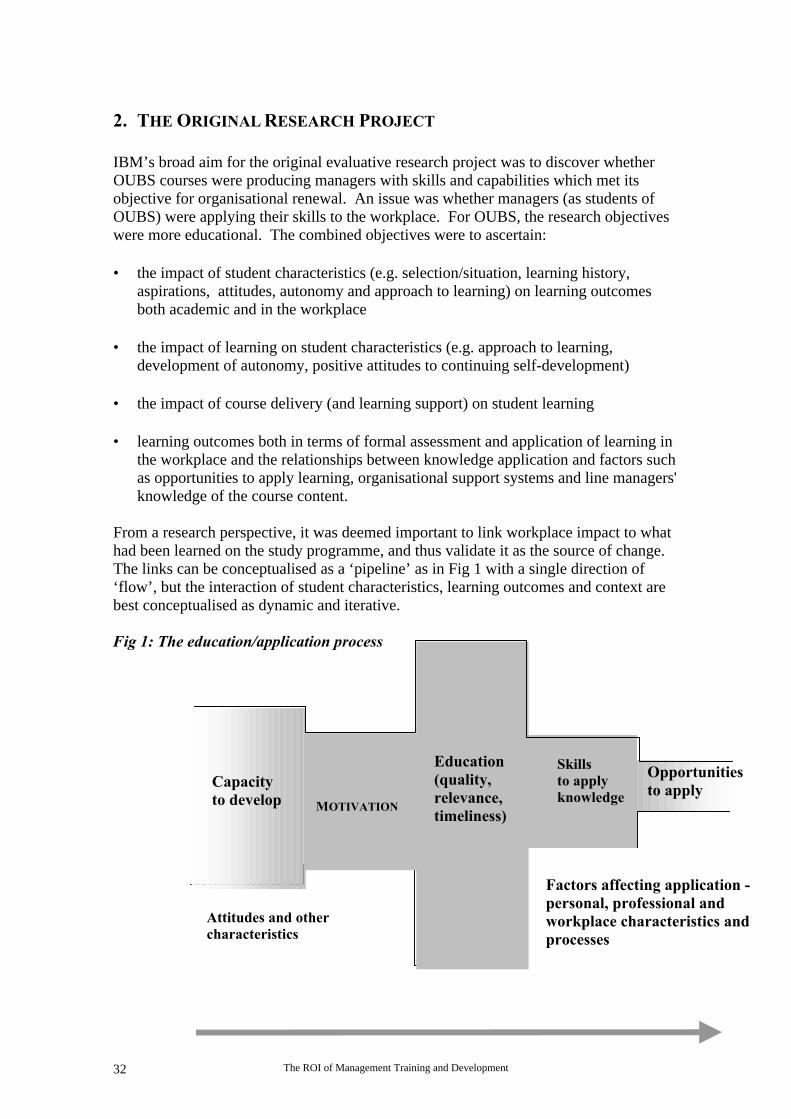
From a research perspective, it was deemed important to link workplace impact to whathad been learned on the study programme, and thus validate it as the source of change.The links can be conceptualised as a ‘pipeline’ as in Fig 1 with a single direction of‘flow’, but the interaction of student characteristics, learning outcomes and context arebest conceptualised as dynamic and iterative.
Fig 1: The education/application process
Factors affecting application -personal, professional andworkplace characteristics andprocesses
Capacityto develop MOTIVATION
Education(quality,relevance,timeliness)
Skillsto applyknowledge
Opportunitiesto apply
Attitudes and othercharacteristics
The ROI of Management Training and Development 33
A highly pragmatic rationale lay behind this way of following IBM students. It wasintended make visible the factors which enable or inhibit learning and applicationknowledge in the workplace so that ‘constraints’ could be remedied and ‘enhancers’build upon. The identification of such factors could be used to ‘unblock’ constrictedsections of the ‘pipeline’ to leverage greater benefits from the programme. Indeed, theobjectives of the research could be translated easily into IBM’s pragmatic concerns andquestions:
1. Did we choose the people with the ‘right’ characteristics for the programme,assuming that it leads to the desired outcomes – academic success, application oflearning; knowledge transfer and thus to organisational renewal?
2. Do our managers change in the ‘right’ ways to meet our organisationalobjectives?
3. Did we ask for the right adaptations to programme delivery?
4. How do our students do compared with other students? Are they applyingtheir learning to the workplace and giving us our return on investment? If not,why not? What and where are the barriers to effective learning and workplaceapplication of learning, so we can remove them?
3. THE SCOPE AND DESIGN OF THE STUDY
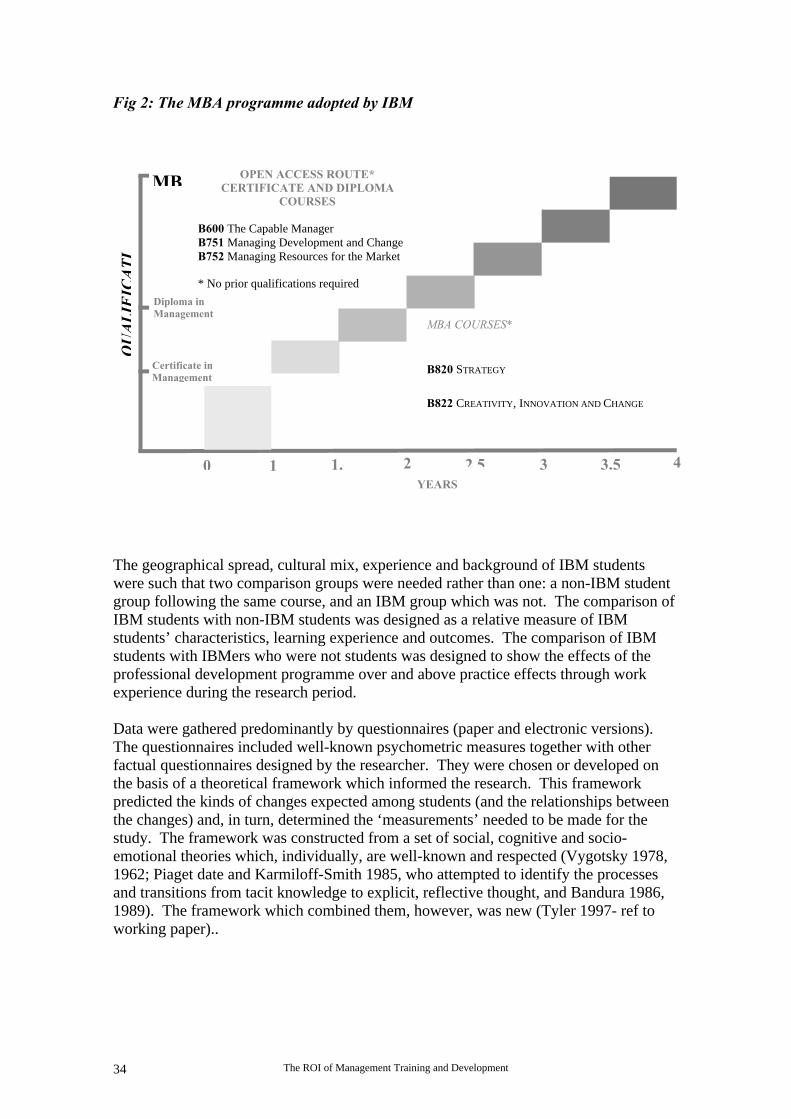
Ideally, an evaluation should begin before students embark on an educationalprogramme, and terminate some time after the learning programme ends. However, inthe case of IBM, students were embarking on a four-year programme with a fixed menuof courses chosen for their particular relevance to IBM, leading to the qualification ofMBA (see Fig 2). A longitudinal study of a single cohort of students from beginning toend would have taken in excess of four years, while a cross longitudinal-latitudinalstudy was not possible because there were insufficient cohorts.
For the two-year research project, the focus was narrowed to the second cohort ofstudents about to begin the first course, The Capable Manager, because they could befollowed through the initial, year-long phase of the programme. The first studentcohort, who had already started, was studied to assess pertinent issues.
The ROI of Management Training and Development34
Fig 2: The MBA programme adopted by IBM
The geographical spread, cultural mix, experience and background of IBM studentswere such that two comparison groups were needed rather than one: a non-IBM studentgroup following the same course, and an IBM group which was not. The comparison ofIBM students with non-IBM students was designed as a relative measure of IBMstudents’ characteristics, learning experience and outcomes. The comparison of IBMstudents with IBMers who were not students was designed to show the effects of theprofessional development programme over and above practice effects through workexperience during the research period.
Data were gathered predominantly by questionnaires (paper and electronic versions).The questionnaires included well-known psychometric measures together with otherfactual questionnaires designed by the researcher. They were chosen or developed onthe basis of a theoretical framework which informed the research. This frameworkpredicted the kinds of changes expected among students (and the relationships betweenthe changes) and, in turn, determined the ‘measurements’ needed to be made for thestudy. The framework was constructed from a set of social, cognitive and socio-emotional theories which, individually, are well-known and respected (Vygotsky 1978,1962; Piaget date and Karmiloff-Smith 1985, who attempted to identify the processesand transitions from tacit knowledge to explicit, reflective thought, and Bandura 1986,1989). The framework which combined them, however, was new (Tyler 1997- ref toworking paper)..
OPEN ACCESS ROUTE*CERTIFICATE AND DIPLOMA
COURSES
B600 The Capable ManagerB751 Managing Development and ChangeB752 Managing Resources for the Market
* No prior qualifications required
MBA COURSES*
B820 STRATEGY
B822 CREATIVITY, INNOVATION AND CHANGE
B890 I E
YEARS
1 1. 2 2.5 3.53 40
QU
AL
IFIC
AT
I
Certificate inManagement
Diploma inManagement
MB
The ROI of Management Training and Development 35
A particular feature of the research was to address the issue of application of knowledgeand skills from the learning context to the workplace. This is assumed in programmesof professional development which are often based on cyclical models of experientiallearning e.g. Kolb date, which have practical experience and concrete knowledge as thestarting point and critical, reflective thinking and behaviour change at the end of alearning cycle. The issue is not a trivial one. Learning can be tightly ‘situated’ – that is,bound to the context in which the learning occurs. ‘On-the-job’ in-company training isan example of this. Here, essentially the individual is being trained to fit a set of idealworkplace norms (shaping the individual to fit the existing organisation) rather than tochallenge and change them. External education programmes are subject to a differentset of problems. While individual development is more likely to occur in the ‘safe’learning environment of external programmes, there remains the problem of applyingthis learning back in the workplace. Application will depend on a number of factors, themost important of which are the relevance of the new knowledge, and opportunities andsupport for its application. A workplace that systematically accommodates learners’new ideas and practices in appropriate ways is a ‘learning organisation.’
The background to the original project has been treated with some brevity because theROI project focussed narrowly on application of learning in the workplace. IBMstudents and the non-student comparison group, together with their line manages,colleagues and direct reports were asked to a complete 360� workplace appraisalquestionnaire at the beginning and end of The Capable Manager course (referred to asTime 1 and Time 2). The questionnaire was developed using the detailed learningobjectives of the course.
4. THE SAMPLE GROUPS, THE 360� INSTRUMENT AND RESPONSES
The IBM student group constituted all 240 students who were enrolled on the relevantpresentation of The Capable Manager Course. The IBM non-student group (sample size75) was originally to be a group of ‘students-in-waiting’ but it was not possible in thetime-frame. Instead the control group participants were chosen by students as being‘like them’ in important ways – young high-potentials likely to be in the next cohort ofstudents in the programme and not currently studying on any other programme. (Theother comparison group, the non-IBM student group made up of all the students enrolledfor the same course at the same time in the London and Cambridge regions andContinental and Western Europe, did not participate in the 360° workplace appraisal.However, a simpler self-report instrument on management techniques used in theworkplace was incorporated into another questionnaire completed by the three groups atTime 2.) No particular problems were envisaged with the degree of ‘match’ betweenthe target group (IBM students) and relevant comparison group (IBM non-students);similarities/differences could be tested a posteriori.
The 360° workplace questionnaire was sent to IBM students and their non-student‘look-alikes’ in IBM, and their respective line managers, colleagues and direct reports.The instrument consisted of 64 key questions covering 16 course topics. An example isshown in Box 1.
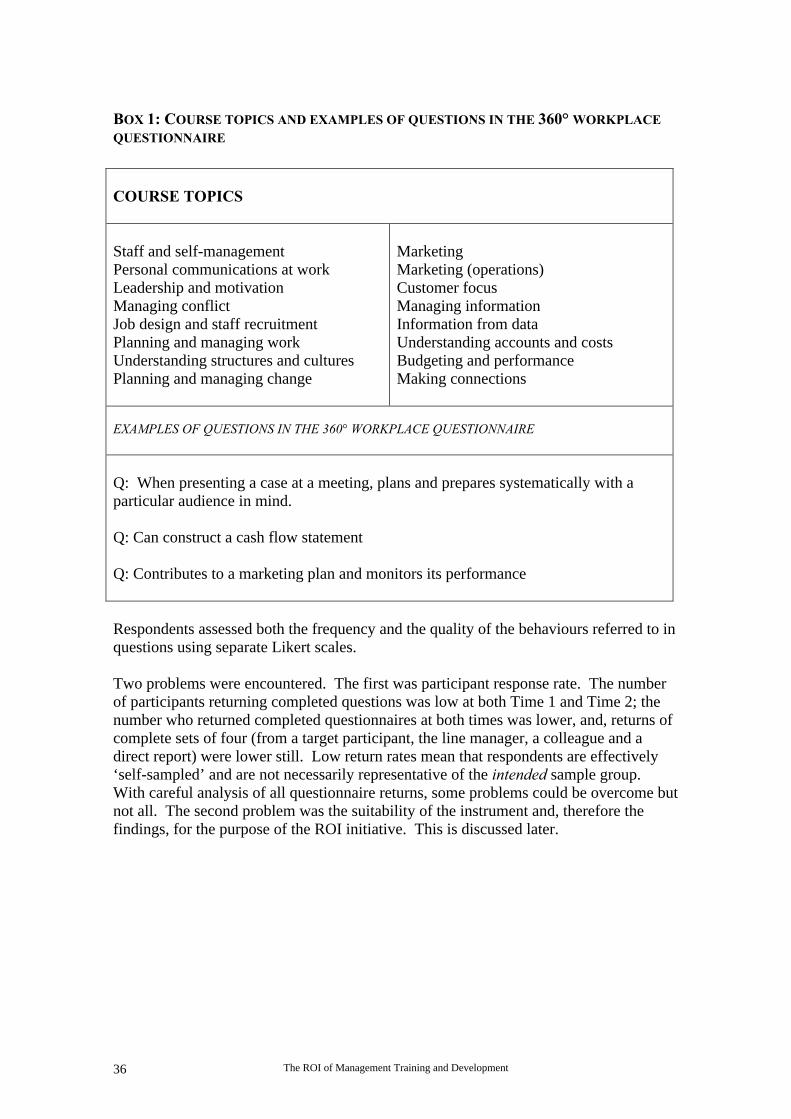
The ROI of Management Training and Development36
BOX 1: COURSE TOPICS AND EXAMPLES OF QUESTIONS IN THE 360° WORKPLACEQUESTIONNAIRE
COURSE TOPICS
Staff and self-managementPersonal communications at workLeadership and motivationManaging conflictJob design and staff recruitmentPlanning and managing workUnderstanding structures and culturesPlanning and managing change
MarketingMarketing (operations)Customer focusManaging informationInformation from dataUnderstanding accounts and costsBudgeting and performanceMaking connections
EXAMPLES OF QUESTIONS IN THE 360° WORKPLACE QUESTIONNAIRE
Q: When presenting a case at a meeting, plans and prepares systematically with aparticular audience in mind.
Q: Can construct a cash flow statement
Q: Contributes to a marketing plan and monitors its performance
Respondents assessed both the frequency and the quality of the behaviours referred to inquestions using separate Likert scales.
Two problems were encountered. The first was participant response rate. The numberof participants returning completed questions was low at both Time 1 and Time 2; thenumber who returned completed questionnaires at both times was lower, and, returns ofcomplete sets of four (from a target participant, the line manager, a colleague and adirect report) were lower still. Low return rates mean that respondents are effectively‘self-sampled’ and are not necessarily representative of the intended sample group.With careful analysis of all questionnaire returns, some problems could be overcome butnot all. The second problem was the suitability of the instrument and, therefore thefindings, for the purpose of the ROI initiative. This is discussed later.
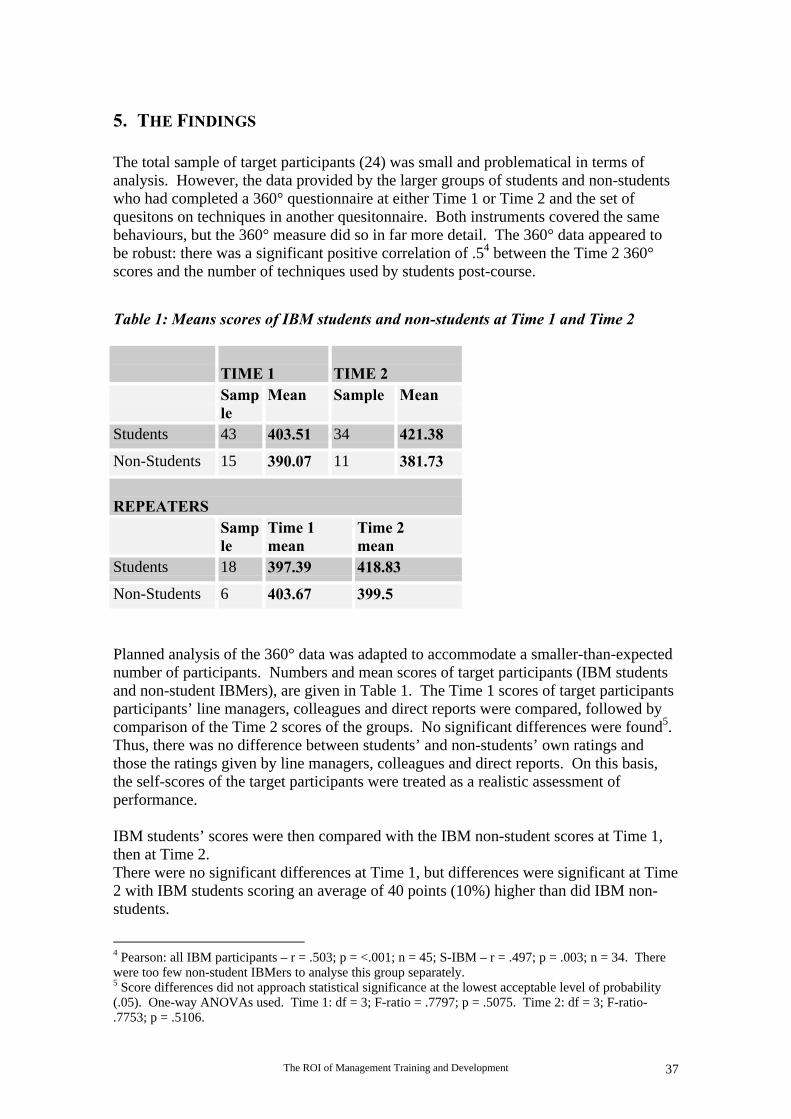
The ROI of Management Training and Development 37
5. THE FINDINGS
The total sample of target participants (24) was small and problematical in terms ofanalysis. However, the data provided by the larger groups of students and non-studentswho had completed a 360° questionnaire at either Time 1 or Time 2 and the set ofquesitons on techniques in another quesitonnaire. Both instruments covered the samebehaviours, but the 360° measure did so in far more detail. The 360° data appeared tobe robust: there was a significant positive correlation of .54 between the Time 2 360°scores and the number of techniques used by students post-course.
Table 1: Means scores of IBM students and non-students at Time 1 and Time 2
TIME 1 TIME 2Sample
Mean Sample Mean
Students 43 403.51 34 421.38
Non-Students 15 390.07 11 381.73
REPEATERSSample
Time 1mean
Time 2mean
Students 18 397.39 418.83
Non-Students 6 403.67 399.5
Planned analysis of the 360° data was adapted to accommodate a smaller-than-expectednumber of participants. Numbers and mean scores of target participants (IBM studentsand non-student IBMers), are given in Table 1. The Time 1 scores of target participantsparticipants’ line managers, colleagues and direct reports were compared, followed bycomparison of the Time 2 scores of the groups. No significant differences were found5.Thus, there was no difference between students’ and non-students’ own ratings andthose the ratings given by line managers, colleagues and direct reports. On this basis,the self-scores of the target participants were treated as a realistic assessment ofperformance.
IBM students’ scores were then compared with the IBM non-student scores at Time 1,then at Time 2.There were no significant differences at Time 1, but differences were significant at Time2 with IBM students scoring an average of 40 points (10%) higher than did IBM non-students.
4 Pearson: all IBM participants – r = .503; p = <.001; n = 45; S-IBM – r = .497; p = .003; n = 34. Therewere too few non-student IBMers to analyse this group separately.5 Score differences did not approach statistical significance at the lowest acceptable level of probability(.05). One-way ANOVAs used. Time 1: df = 3; F-ratio = .7797; p = .5075. Time 2: df = 3; F-ratio-.7753; p = .5106.
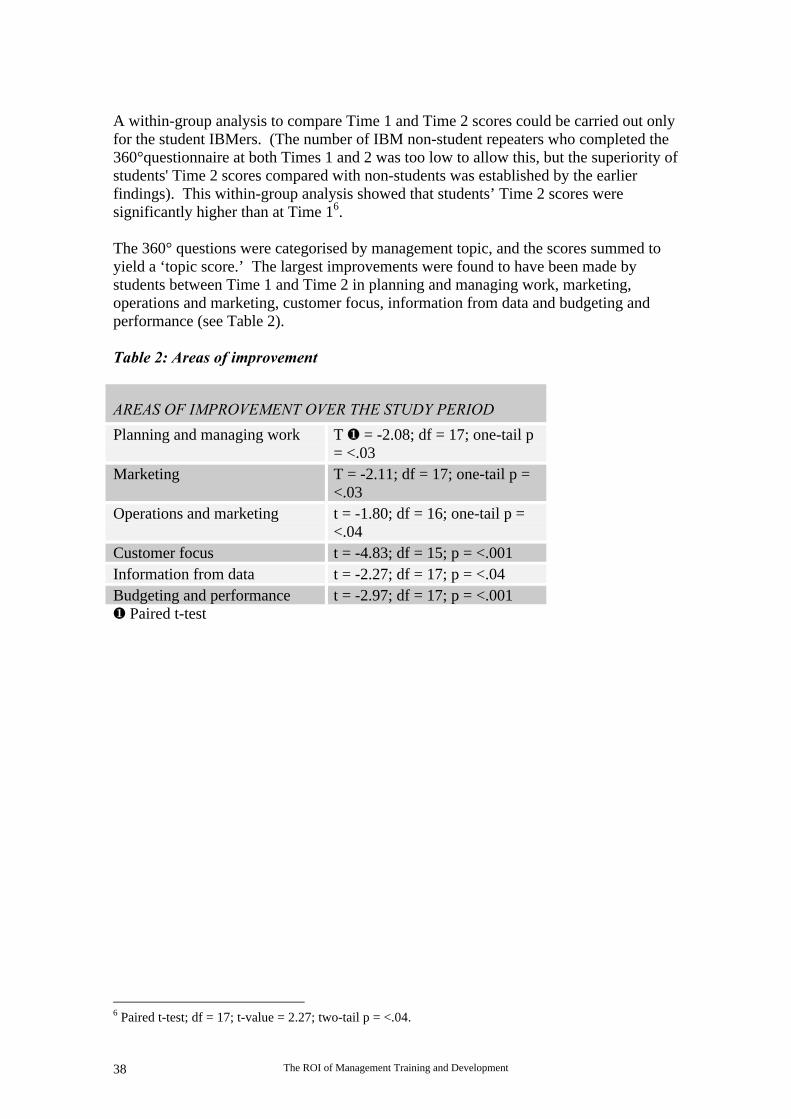
The ROI of Management Training and Development38
A within-group analysis to compare Time 1 and Time 2 scores could be carried out onlyfor the student IBMers. (The number of IBM non-student repeaters who completed the360°questionnaire at both Times 1 and 2 was too low to allow this, but the superiority ofstudents' Time 2 scores compared with non-students was established by the earlierfindings). This within-group analysis showed that students’ Time 2 scores weresignificantly higher than at Time 16.
The 360° questions were categorised by management topic, and the scores summed toyield a ‘topic score.’ The largest improvements were found to have been made bystudents between Time 1 and Time 2 in planning and managing work, marketing,operations and marketing, customer focus, information from data and budgeting andperformance (see Table 2).
Table 2: Areas of improvement
AREAS OF IMPROVEMENT OVER THE STUDY PERIOD
Planning and managing work T ¶ = -2.08; df = 17; one-tail p= <.03
Marketing T = -2.11; df = 17; one-tail p =<.03
Operations and marketing t = -1.80; df = 16; one-tail p =<.04
Customer focus t = -4.83; df = 15; p = <.001Information from data t = -2.27; df = 17; p = <.04Budgeting and performance t = -2.97; df = 17; p = <.001¶ Paired t-test
6 Paired t-test; df = 17; t-value = 2.27; two-tail p = <.04.
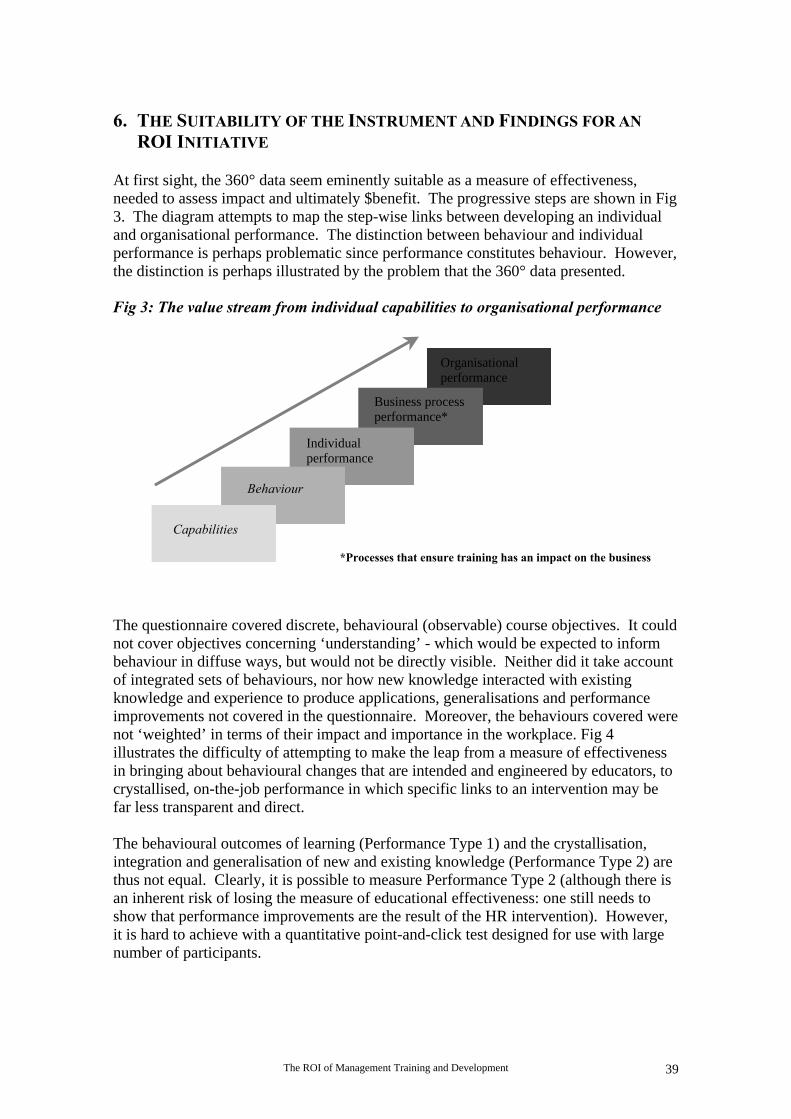
The ROI of Management Training and Development 39
6. THE SUITABILITY OF THE INSTRUMENT AND FINDINGS FOR ANROI INITIATIVE
At first sight, the 360° data seem eminently suitable as a measure of effectiveness,needed to assess impact and ultimately $benefit. The progressive steps are shown in Fig3. The diagram attempts to map the step-wise links between developing an individualand organisational performance. The distinction between behaviour and individualperformance is perhaps problematic since performance constitutes behaviour. However,the distinction is perhaps illustrated by the problem that the 360° data presented.
Fig 3: The value stream from individual capabilities to organisational performance
The questionnaire covered discrete, behavioural (observable) course objectives. It couldnot cover objectives concerning ‘understanding’ - which would be expected to informbehaviour in diffuse ways, but would not be directly visible. Neither did it take accountof integrated sets of behaviours, nor how new knowledge interacted with existingknowledge and experience to produce applications, generalisations and performanceimprovements not covered in the questionnaire. Moreover, the behaviours covered werenot ‘weighted’ in terms of their impact and importance in the workplace. Fig 4illustrates the difficulty of attempting to make the leap from a measure of effectivenessin bringing about behavioural changes that are intended and engineered by educators, tocrystallised, on-the-job performance in which specific links to an intervention may befar less transparent and direct.
The behavioural outcomes of learning (Performance Type 1) and the crystallisation,integration and generalisation of new and existing knowledge (Performance Type 2) arethus not equal. Clearly, it is possible to measure Performance Type 2 (although there isan inherent risk of losing the measure of educational effectiveness: one still needs toshow that performance improvements are the result of the HR intervention). However,it is hard to achieve with a quantitative point-and-click test designed for use with largenumber of participants.
Capabilities
Behaviour
Individualperformance
Business processperformance*
Organisationalperformance
*Processes that ensure training has an impact on the business
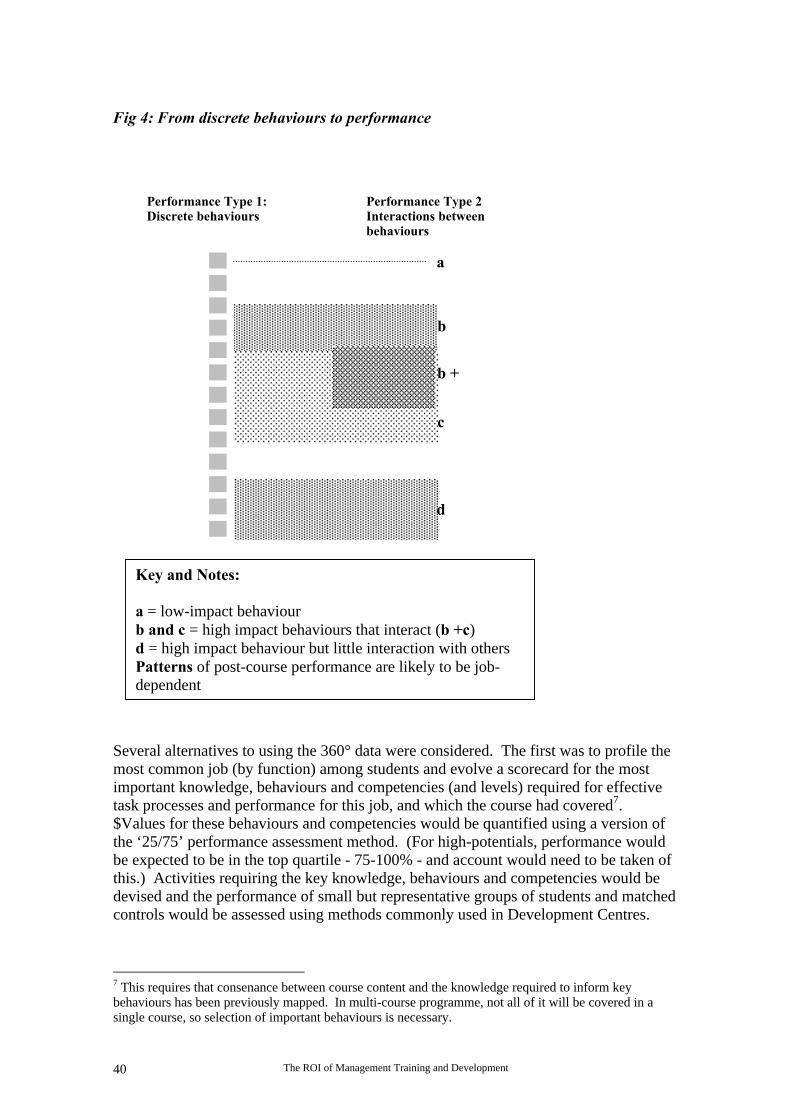
The ROI of Management Training and Development40
Fig 4: From discrete behaviours to performance
Several alternatives to using the 360° data were considered. The first was to profile themost common job (by function) among students and evolve a scorecard for the mostimportant knowledge, behaviours and competencies (and levels) required for effectivetask processes and performance for this job, and which the course had covered7.$Values for these behaviours and competencies would be quantified using a version ofthe ‘25/75’ performance assessment method. (For high-potentials, performance wouldbe expected to be in the top quartile - 75-100% - and account would need to be taken ofthis.) Activities requiring the key knowledge, behaviours and competencies would bedevised and the performance of small but representative groups of students and matchedcontrols would be assessed using methods commonly used in Development Centres.
7 This requires that consenance between course content and the knowledge required to inform keybehaviours has been previously mapped. In multi-course programme, not all of it will be covered in asingle course, so selection of important behaviours is necessary.
Performance Type 1:Discrete behaviours
Performance Type 2Interactions betweenbehaviours
a
b
c
b +c
d
Key and Notes:
a = low-impact behaviourb and c = high impact behaviours that interact (b +c)d = high impact behaviour but little interaction with othersPatterns of post-course performance are likely to be job-dependentNot all learning is visible
The ROI of Management Training and Development 41
Design sophistication could be added by including ‘control tasks’ completely unrelatedto the course content. On these students and non-students would be expected to performequally. The performance difference between students and non-students on ‘targettasks’ could be used to calculated the $benefit to the company. In this way, gains couldbe linked to the intervention (the course) as the source of improvement while measuringPerformance Type 2. However, the introduction of a different measurement systemwhich required a number of phases was deemed too expensive for what had beenplanned as a relatively cheap extension of the original research project.
Another alternative to using the 360° data was to take the annual sales targets ofstudents involving in marketing and base impact of the education programme on howwell the targets were met. However, this was problematical because there was nothingto tie performance to course content. In short, this method broke the direct andpotentially observable link between educational effectiveness and workplace impact. Aplan to link the 360° behaviours to ‘IBM competencies’ - a generic set derived fromsenior executives - was shelved for the same reason. Indirectness introduces room forerror, and the more indirect the links the more the process becomes one of guesswork.With time running out, a method of using the 360° data had to be found. Problems werenot at an end, however. Time constraints meant that the method was pared to barenecessities.
7. CONVERTING EFFECTIVENESS INTO IMPACT AND IMPACT INTO$BENEFIT
Each of the 16 management areas (‘topics’) covered by the course had a set of skills andcompetencies associated with it. It was decided to take the 16 management topics,produce a brief description of them and select one ‘representative’ question from each asan exemplar of the type and scale of behaviour associated with the management area.To select the questions, the average increase in the overall score for each topic wascalculated. The question which yielded the score nearest to the average was chosen.The final 16 questions were reproduced as a questionnaire for distribution to a group ofIBM managers of mixed-seniority in the EMEA region. The questionnaire asked themanagers three questions:
• the value of a 20% improvement in each management area• when the skill/competence would be likely to be evident• how long the skill/competence was likely to be of value.
The average pre-course score for each question was given so that the IBM managers hada realistic idea of skill levels and would be able to assess the value of a 20%improvement at the upper end of the scale. This was important in the sense that forsome skills, a moderate level may be sufficient to have an impact while, for others,increasing levels of expertise continue to have a positive impact. A section of theexercise is shown in Box 2. The decision to ask managers to assess the value of a 20%improvement in skill was based on ‘visibility’: it was thought the value of largerimprovements would be easier to assess than small ones. The ‘real’ improvementsamong students was 5-10% across topics but, to avoid bias, the IBM management groupwas not told this.
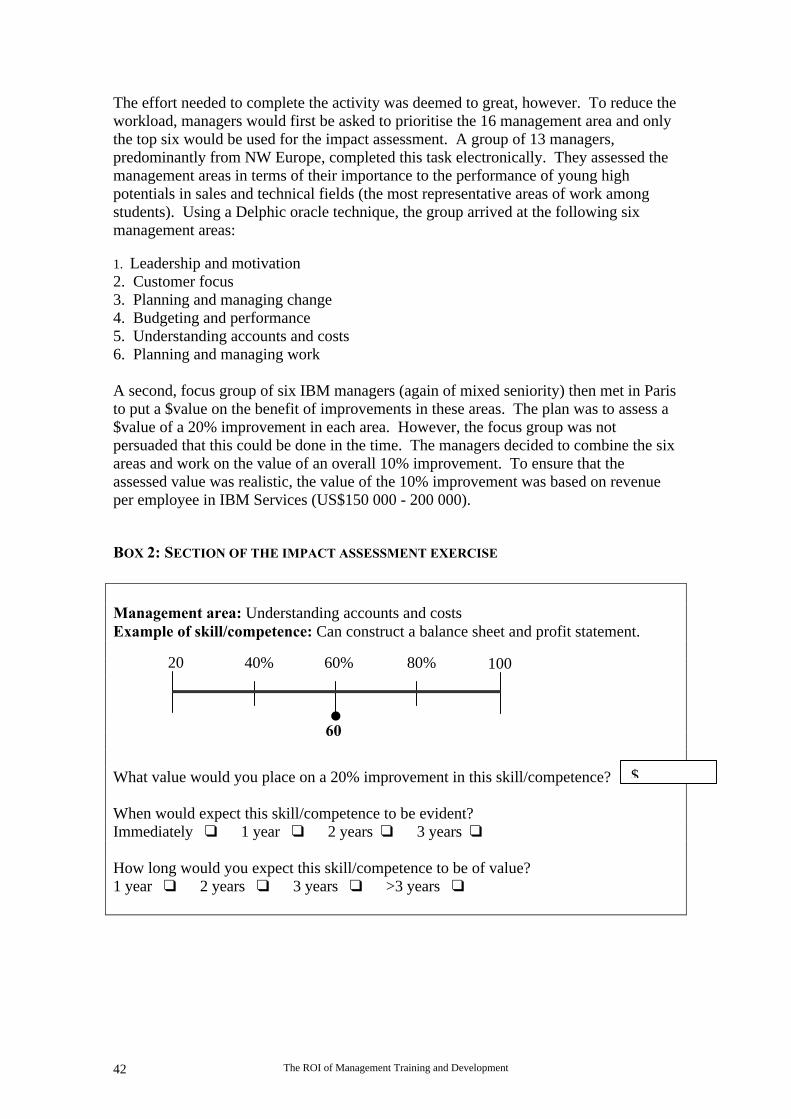
The ROI of Management Training and Development42
The effort needed to complete the activity was deemed to great, however. To reduce theworkload, managers would first be asked to prioritise the 16 management area and onlythe top six would be used for the impact assessment. A group of 13 managers,predominantly from NW Europe, completed this task electronically. They assessed themanagement areas in terms of their importance to the performance of young highpotentials in sales and technical fields (the most representative areas of work amongstudents). Using a Delphic oracle technique, the group arrived at the following sixmanagement areas:
1. Leadership and motivation2. Customer focus3. Planning and managing change4. Budgeting and performance5. Understanding accounts and costs6. Planning and managing work
A second, focus group of six IBM managers (again of mixed seniority) then met in Paristo put a $value on the benefit of improvements in these areas. The plan was to assess a$value of a 20% improvement in each area. However, the focus group was notpersuaded that this could be done in the time. The managers decided to combine the sixareas and work on the value of an overall 10% improvement. To ensure that theassessed value was realistic, the value of the 10% improvement was based on revenueper employee in IBM Services (US$150 000 - 200 000).
BOX 2: SECTION OF THE IMPACT ASSESSMENT EXERCISE
Management area: Understanding accounts and costsExample of skill/competence: Can construct a balance sheet and profit statement.
What value would you place on a 20% improvement in this skill/competence?
When would expect this skill/competence to be evident?Immediately q 1 year q 2 years q 3 years q
How long would you expect this skill/competence to be of value?1 year q 2 years q 3 years q >3 years q
$
60%
20 40% 60% 80% 100%
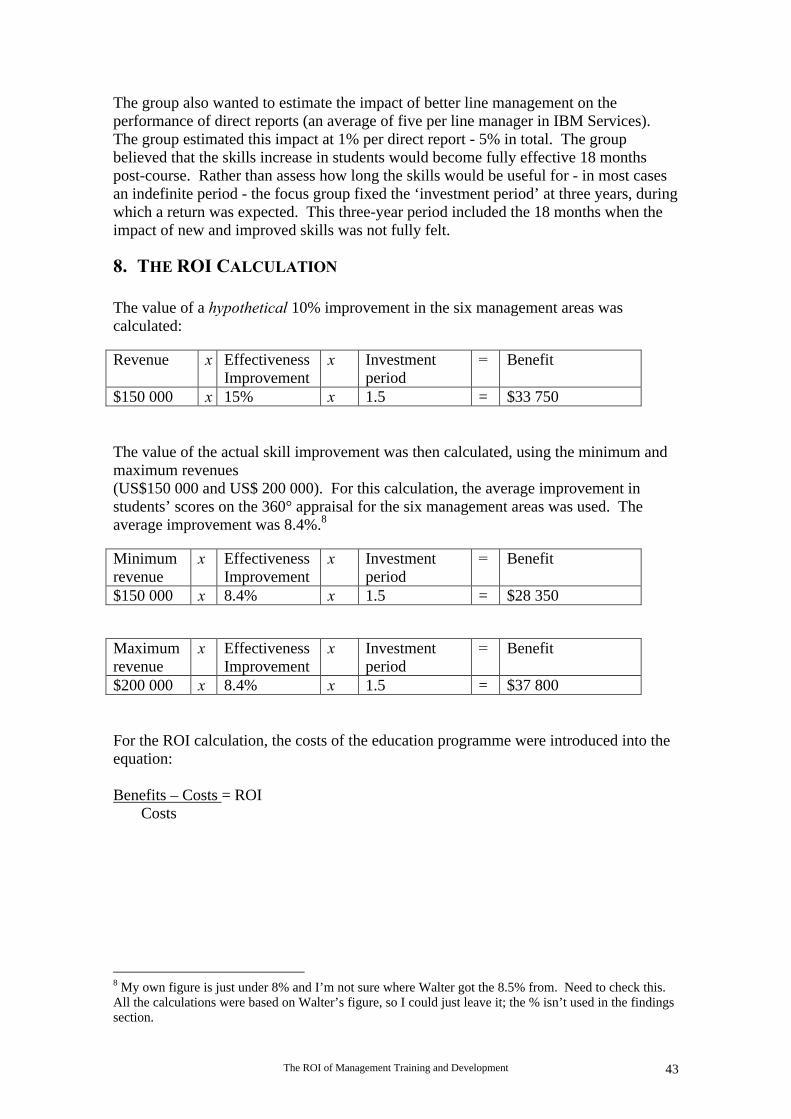
The ROI of Management Training and Development 43
The group also wanted to estimate the impact of better line management on theperformance of direct reports (an average of five per line manager in IBM Services).The group estimated this impact at 1% per direct report - 5% in total. The groupbelieved that the skills increase in students would become fully effective 18 monthspost-course. Rather than assess how long the skills would be useful for - in most casesan indefinite period - the focus group fixed the ‘investment period’ at three years, duringwhich a return was expected. This three-year period included the 18 months when theimpact of new and improved skills was not fully felt.
8. THE ROI CALCULATION
The value of a hypothetical 10% improvement in the six management areas wascalculated:
Revenue x EffectivenessImprovement
x Investmentperiod
= Benefit
$150 000 x 15% x 1.5 = $33 750
The value of the actual skill improvement was then calculated, using the minimum andmaximum revenues(US$150 000 and US$ 200 000). For this calculation, the average improvement instudents’ scores on the 360° appraisal for the six management areas was used. Theaverage improvement was 8.4%.8
Minimumrevenue
x EffectivenessImprovement
x Investmentperiod
= Benefit
$150 000 x 8.4% x 1.5 = $28 350
Maximumrevenue
x EffectivenessImprovement
x Investmentperiod
= Benefit
$200 000 x 8.4% x 1.5 = $37 800
For the ROI calculation, the costs of the education programme were introduced into theequation:
Benefits – Costs = ROI Costs
8 My own figure is just under 8% and I’m not sure where Walter got the 8.5% from. Need to check this.All the calculations were based on Walter’s figure, so I could just leave it; the % isn’t used in the findingssection.
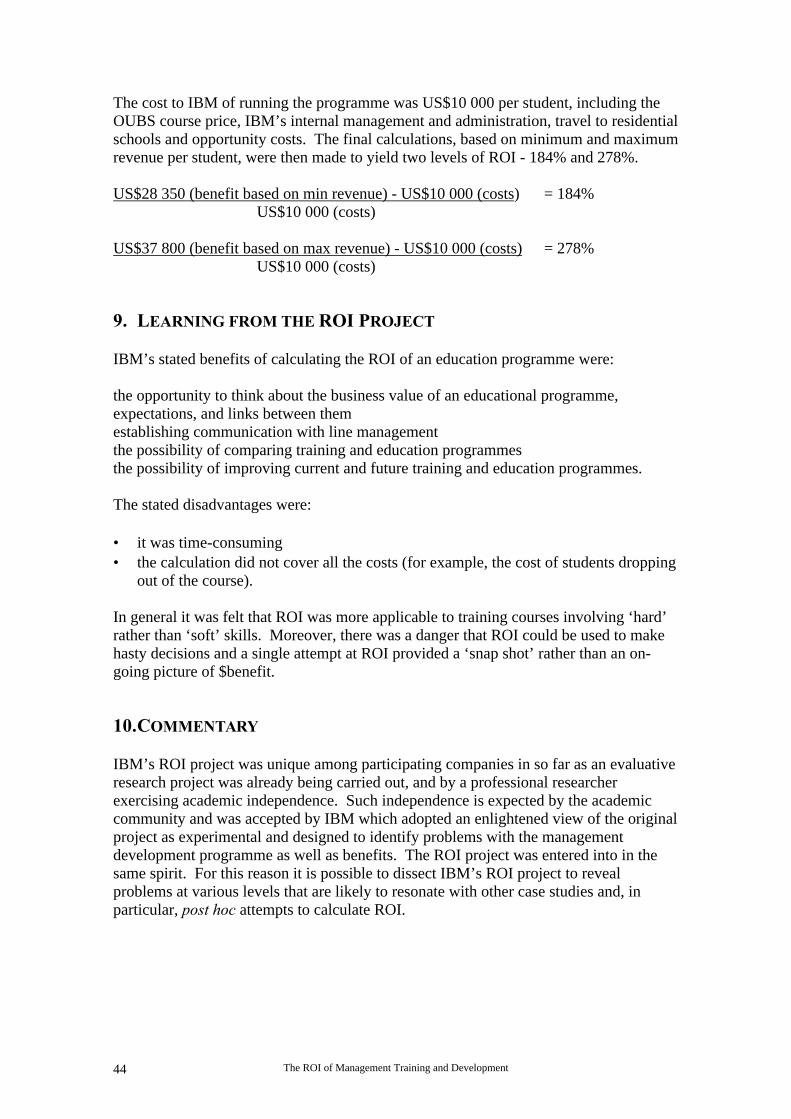
The ROI of Management Training and Development44
The cost to IBM of running the programme was US$10 000 per student, including theOUBS course price, IBM’s internal management and administration, travel to residentialschools and opportunity costs. The final calculations, based on minimum and maximumrevenue per student, were then made to yield two levels of ROI - 184% and 278%.
US$28 350 (benefit based on min revenue) - US$10 000 (costs) = 184%US$10 000 (costs)
US$37 800 (benefit based on max revenue) - US$10 000 (costs) = 278%US$10 000 (costs)
9. LEARNING FROM THE ROI PROJECT
IBM’s stated benefits of calculating the ROI of an education programme were:
the opportunity to think about the business value of an educational programme,expectations, and links between themestablishing communication with line managementthe possibility of comparing training and education programmesthe possibility of improving current and future training and education programmes.
The stated disadvantages were:
• it was time-consuming• the calculation did not cover all the costs (for example, the cost of students dropping
out of the course).
In general it was felt that ROI was more applicable to training courses involving ‘hard’rather than ‘soft’ skills. Moreover, there was a danger that ROI could be used to makehasty decisions and a single attempt at ROI provided a ‘snap shot’ rather than an on-going picture of $benefit.
10. COMMENTARY
IBM’s ROI project was unique among participating companies in so far as an evaluativeresearch project was already being carried out, and by a professional researcherexercising academic independence. Such independence is expected by the academiccommunity and was accepted by IBM which adopted an enlightened view of the originalproject as experimental and designed to identify problems with the managementdevelopment programme as well as benefits. The ROI project was entered into in thesame spirit. For this reason it is possible to dissect IBM’s ROI project to revealproblems at various levels that are likely to resonate with other case studies and, inparticular, post hoc attempts to calculate ROI.
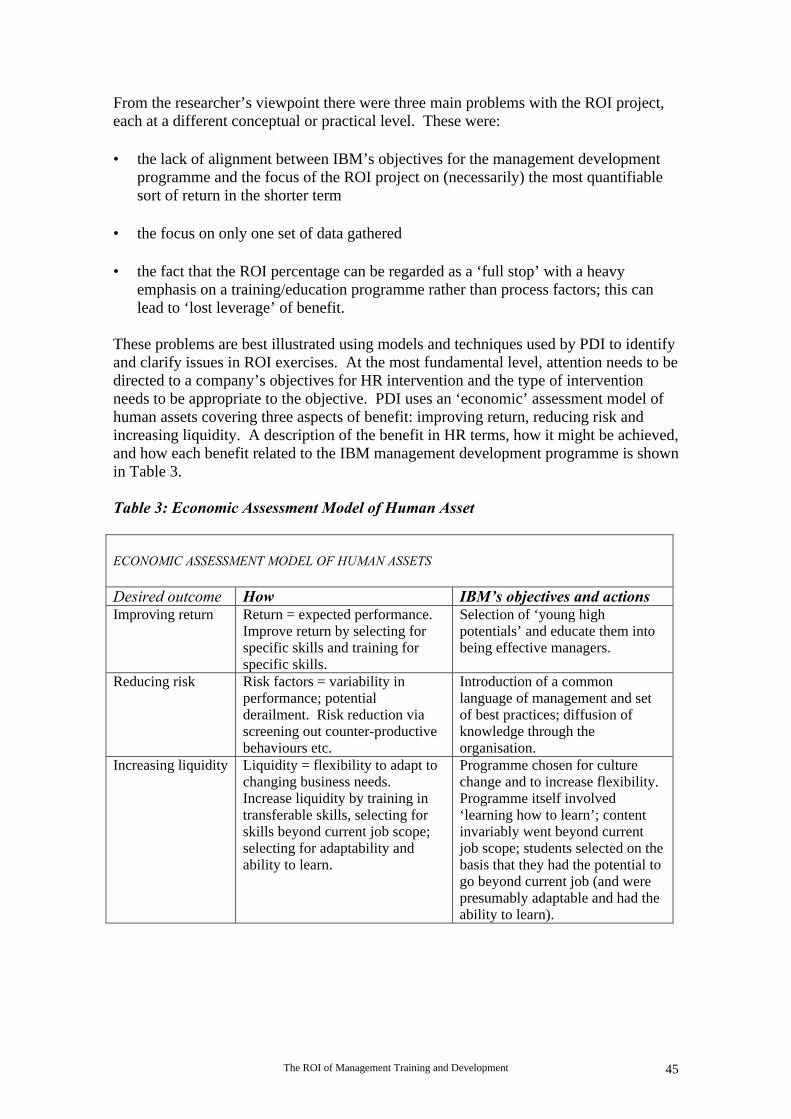
The ROI of Management Training and Development 45
From the researcher’s viewpoint there were three main problems with the ROI project,each at a different conceptual or practical level. These were:
• the lack of alignment between IBM’s objectives for the management developmentprogramme and the focus of the ROI project on (necessarily) the most quantifiablesort of return in the shorter term
• the focus on only one set of data gathered
• the fact that the ROI percentage can be regarded as a ‘full stop’ with a heavyemphasis on a training/education programme rather than process factors; this canlead to ‘lost leverage’ of benefit.
These problems are best illustrated using models and techniques used by PDI to identifyand clarify issues in ROI exercises. At the most fundamental level, attention needs to bedirected to a company’s objectives for HR intervention and the type of interventionneeds to be appropriate to the objective. PDI uses an ‘economic’ assessment model ofhuman assets covering three aspects of benefit: improving return, reducing risk andincreasing liquidity. A description of the benefit in HR terms, how it might be achieved,and how each benefit related to the IBM management development programme is shownin Table 3.
Table 3: Economic Assessment Model of Human Asset
ECONOMIC ASSESSMENT MODEL OF HUMAN ASSETS
Desired outcome How IBM’s objectives and actionsImproving return Return = expected performance.
Improve return by selecting forspecific skills and training forspecific skills.
Selection of ‘young highpotentials’ and educate them intobeing effective managers.
Reducing risk Risk factors = variability inperformance; potentialderailment. Risk reduction viascreening out counter-productivebehaviours etc.
Introduction of a commonlanguage of management and setof best practices; diffusion ofknowledge through theorganisation.
Increasing liquidity Liquidity = flexibility to adapt tochanging business needs.Increase liquidity by training intransferable skills, selecting forskills beyond current job scope;selecting for adaptability andability to learn.
Programme chosen for culturechange and to increase flexibility.Programme itself involved‘learning how to learn’; contentinvariably went beyond currentjob scope; students selected on thebasis that they had the potential togo beyond current job (and werepresumably adaptable and had theability to learn).
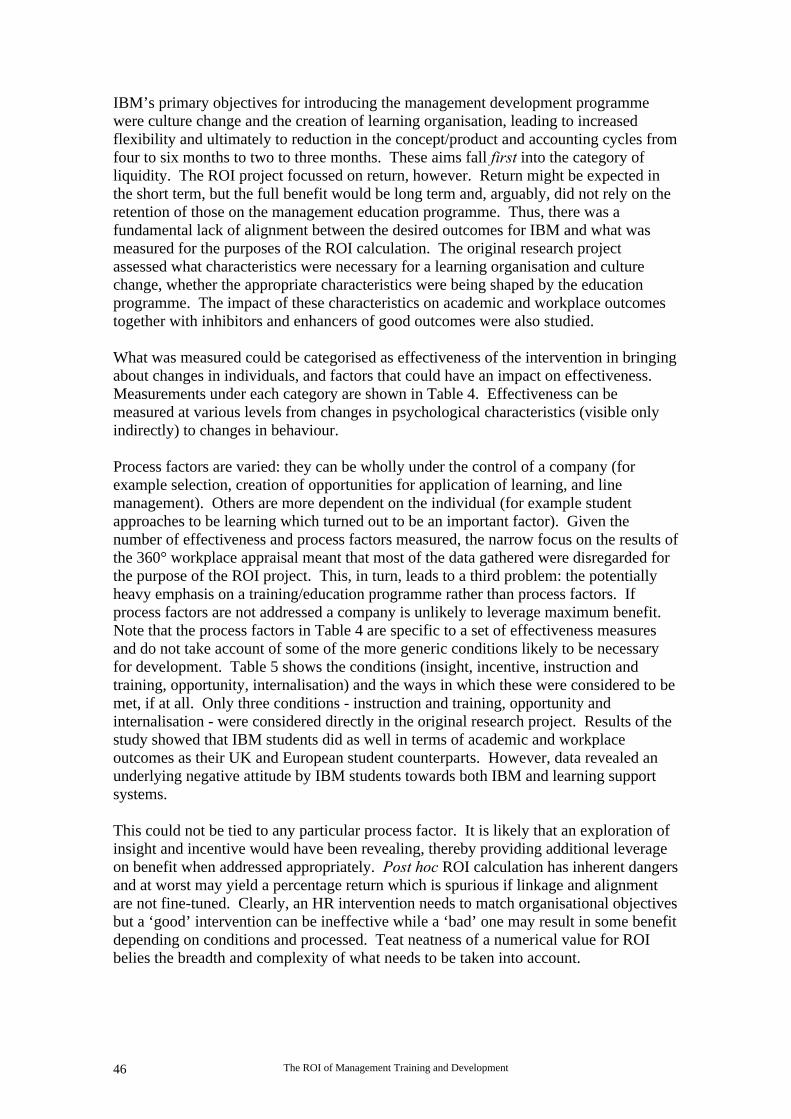
The ROI of Management Training and Development46
IBM’s primary objectives for introducing the management development programmewere culture change and the creation of learning organisation, leading to increasedflexibility and ultimately to reduction in the concept/product and accounting cycles fromfour to six months to two to three months. These aims fall first into the category ofliquidity. The ROI project focussed on return, however. Return might be expected inthe short term, but the full benefit would be long term and, arguably, did not rely on theretention of those on the management education programme. Thus, there was afundamental lack of alignment between the desired outcomes for IBM and what wasmeasured for the purposes of the ROI calculation. The original research projectassessed what characteristics were necessary for a learning organisation and culturechange, whether the appropriate characteristics were being shaped by the educationprogramme. The impact of these characteristics on academic and workplace outcomestogether with inhibitors and enhancers of good outcomes were also studied.
What was measured could be categorised as effectiveness of the intervention in bringingabout changes in individuals, and factors that could have an impact on effectiveness.Measurements under each category are shown in Table 4. Effectiveness can bemeasured at various levels from changes in psychological characteristics (visible onlyindirectly) to changes in behaviour.
Process factors are varied: they can be wholly under the control of a company (forexample selection, creation of opportunities for application of learning, and linemanagement). Others are more dependent on the individual (for example studentapproaches to be learning which turned out to be an important factor). Given thenumber of effectiveness and process factors measured, the narrow focus on the results ofthe 360° workplace appraisal meant that most of the data gathered were disregarded forthe purpose of the ROI project. This, in turn, leads to a third problem: the potentiallyheavy emphasis on a training/education programme rather than process factors. Ifprocess factors are not addressed a company is unlikely to leverage maximum benefit.Note that the process factors in Table 4 are specific to a set of effectiveness measuresand do not take account of some of the more generic conditions likely to be necessaryfor development. Table 5 shows the conditions (insight, incentive, instruction andtraining, opportunity, internalisation) and the ways in which these were considered to bemet, if at all. Only three conditions - instruction and training, opportunity andinternalisation - were considered directly in the original research project. Results of thestudy showed that IBM students did as well in terms of academic and workplaceoutcomes as their UK and European student counterparts. However, data revealed anunderlying negative attitude by IBM students towards both IBM and learning supportsystems.
This could not be tied to any particular process factor. It is likely that an exploration ofinsight and incentive would have been revealing, thereby providing additional leverageon benefit when addressed appropriately. Post hoc ROI calculation has inherent dangersand at worst may yield a percentage return which is spurious if linkage and alignmentare not fine-tuned. Clearly, an HR intervention needs to match organisational objectivesbut a ‘good’ intervention can be ineffective while a ‘bad’ one may result in some benefitdepending on conditions and processed. Teat neatness of a numerical value for ROIbelies the breadth and complexity of what needs to be taken into account.
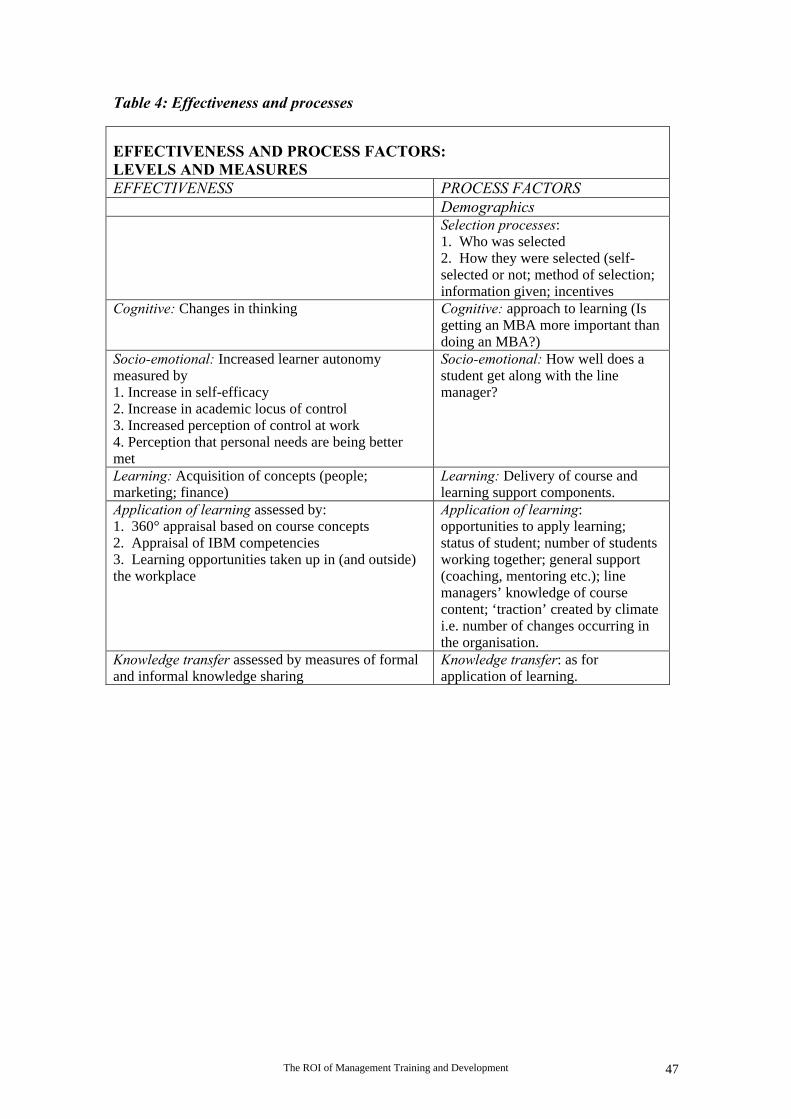
The ROI of Management Training and Development 47
Table 4: Effectiveness and processes
EFFECTIVENESS AND PROCESS FACTORS:LEVELS AND MEASURESEFFECTIVENESS PROCESS FACTORS
DemographicsSelection processes:1. Who was selected2. How they were selected (self-selected or not; method of selection;information given; incentives
Cognitive: Changes in thinking Cognitive: approach to learning (Isgetting an MBA more important thandoing an MBA?)
Socio-emotional: Increased learner autonomymeasured by1. Increase in self-efficacy2. Increase in academic locus of control3. Increased perception of control at work4. Perception that personal needs are being bettermet
Socio-emotional: How well does astudent get along with the linemanager?
Learning: Acquisition of concepts (people;marketing; finance)
Learning: Delivery of course andlearning support components.
Application of learning assessed by:1. 360° appraisal based on course concepts2. Appraisal of IBM competencies3. Learning opportunities taken up in (and outside)the workplace
Application of learning:opportunities to apply learning;status of student; number of studentsworking together; general support(coaching, mentoring etc.); linemanagers’ knowledge of coursecontent; ‘traction’ created by climatei.e. number of changes occurring inthe organisation.
Knowledge transfer assessed by measures of formaland informal knowledge sharing
Knowledge transfer: as forapplication of learning.
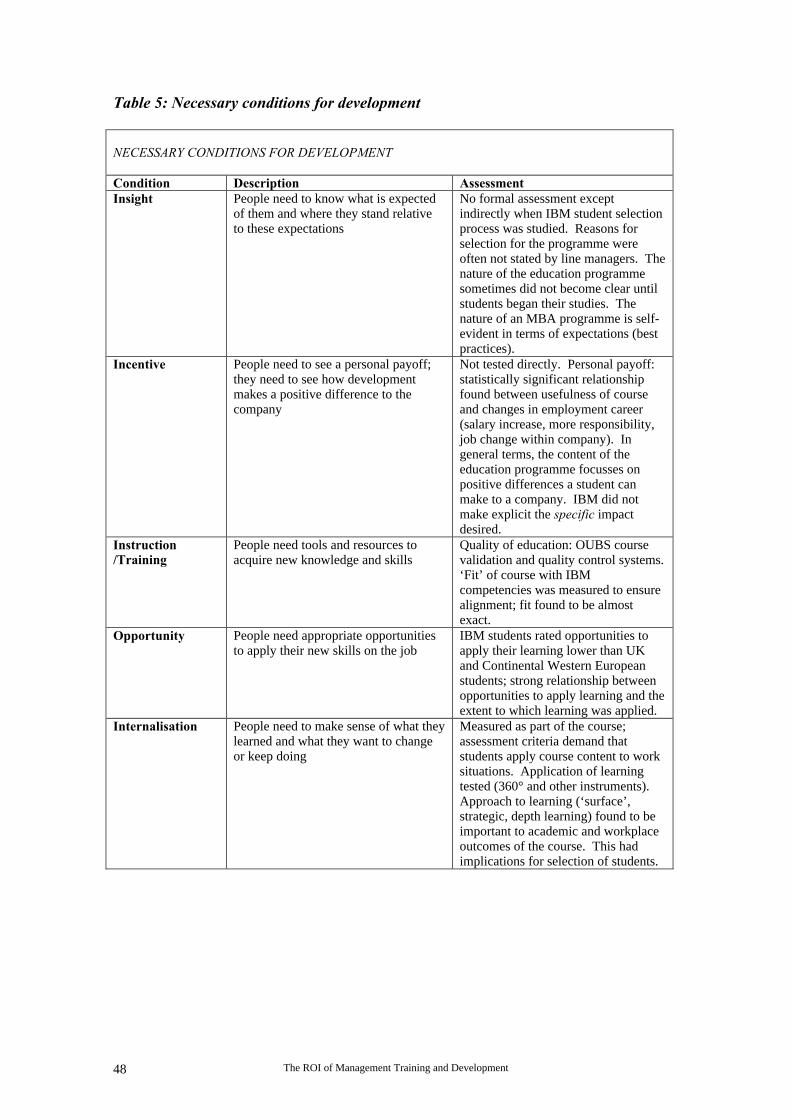
The ROI of Management Training and Development48
Table 5: Necessary conditions for development
NECESSARY CONDITIONS FOR DEVELOPMENT
Condition Description AssessmentInsight People need to know what is expected
of them and where they stand relativeto these expectations
No formal assessment exceptindirectly when IBM student selectionprocess was studied. Reasons forselection for the programme wereoften not stated by line managers. Thenature of the education programmesometimes did not become clear untilstudents began their studies. Thenature of an MBA programme is self-evident in terms of expectations (bestpractices).
Incentive People need to see a personal payoff;they need to see how developmentmakes a positive difference to thecompany
Not tested directly. Personal payoff:statistically significant relationshipfound between usefulness of courseand changes in employment career(salary increase, more responsibility,job change within company). Ingeneral terms, the content of theeducation programme focusses onpositive differences a student canmake to a company. IBM did notmake explicit the specific impactdesired.
Instruction/Training
People need tools and resources toacquire new knowledge and skills
Quality of education: OUBS coursevalidation and quality control systems.‘Fit’ of course with IBMcompetencies was measured to ensurealignment; fit found to be almostexact.
Opportunity People need appropriate opportunitiesto apply their new skills on the job
IBM students rated opportunities toapply their learning lower than UKand Continental Western Europeanstudents; strong relationship betweenopportunities to apply learning and theextent to which learning was applied.
Internalisation People need to make sense of what theylearned and what they want to changeor keep doing
Measured as part of the course;assessment criteria demand thatstudents apply course content to worksituations. Application of learningtested (360° and other instruments).Approach to learning (‘surface’,strategic, depth learning) found to beimportant to academic and workplaceoutcomes of the course. This hadimplications for selection of students.
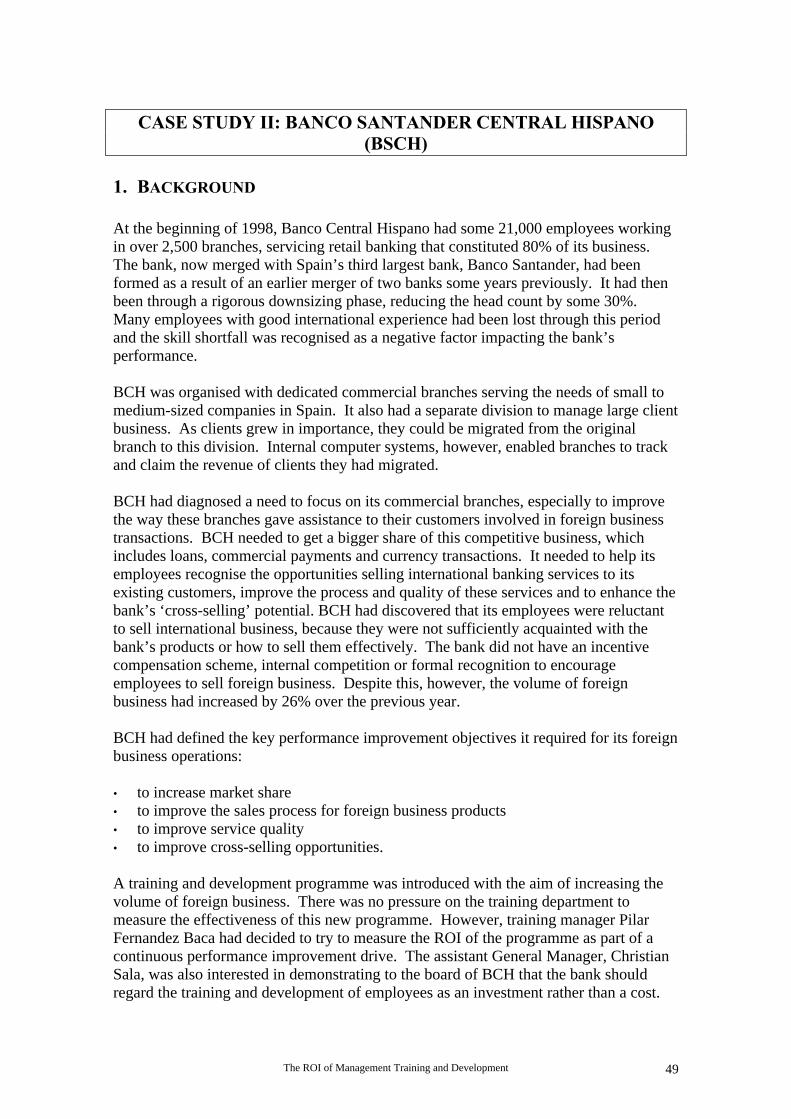
The ROI of Management Training and Development 49
CASE STUDY II: BANCO SANTANDER CENTRAL HISPANO(BSCH)
1. BACKGROUND
At the beginning of 1998, Banco Central Hispano had some 21,000 employees workingin over 2,500 branches, servicing retail banking that constituted 80% of its business.The bank, now merged with Spain’s third largest bank, Banco Santander, had beenformed as a result of an earlier merger of two banks some years previously. It had thenbeen through a rigorous downsizing phase, reducing the head count by some 30%.Many employees with good international experience had been lost through this periodand the skill shortfall was recognised as a negative factor impacting the bank’sperformance.
BCH was organised with dedicated commercial branches serving the needs of small tomedium-sized companies in Spain. It also had a separate division to manage large clientbusiness. As clients grew in importance, they could be migrated from the originalbranch to this division. Internal computer systems, however, enabled branches to trackand claim the revenue of clients they had migrated.
BCH had diagnosed a need to focus on its commercial branches, especially to improvethe way these branches gave assistance to their customers involved in foreign businesstransactions. BCH needed to get a bigger share of this competitive business, whichincludes loans, commercial payments and currency transactions. It needed to help itsemployees recognise the opportunities selling international banking services to itsexisting customers, improve the process and quality of these services and to enhance thebank’s ‘cross-selling’ potential. BCH had discovered that its employees were reluctantto sell international business, because they were not sufficiently acquainted with thebank’s products or how to sell them effectively. The bank did not have an incentivecompensation scheme, internal competition or formal recognition to encourageemployees to sell foreign business. Despite this, however, the volume of foreignbusiness had increased by 26% over the previous year.
BCH had defined the key performance improvement objectives it required for its foreignbusiness operations:
• to increase market share• to improve the sales process for foreign business products• to improve service quality• to improve cross-selling opportunities.
A training and development programme was introduced with the aim of increasing thevolume of foreign business. There was no pressure on the training department tomeasure the effectiveness of this new programme. However, training manager PilarFernandez Baca had decided to try to measure the ROI of the programme as part of acontinuous performance improvement drive. The assistant General Manager, ChristianSala, was also interested in demonstrating to the board of BCH that the bank shouldregard the training and development of employees as an investment rather than a cost.
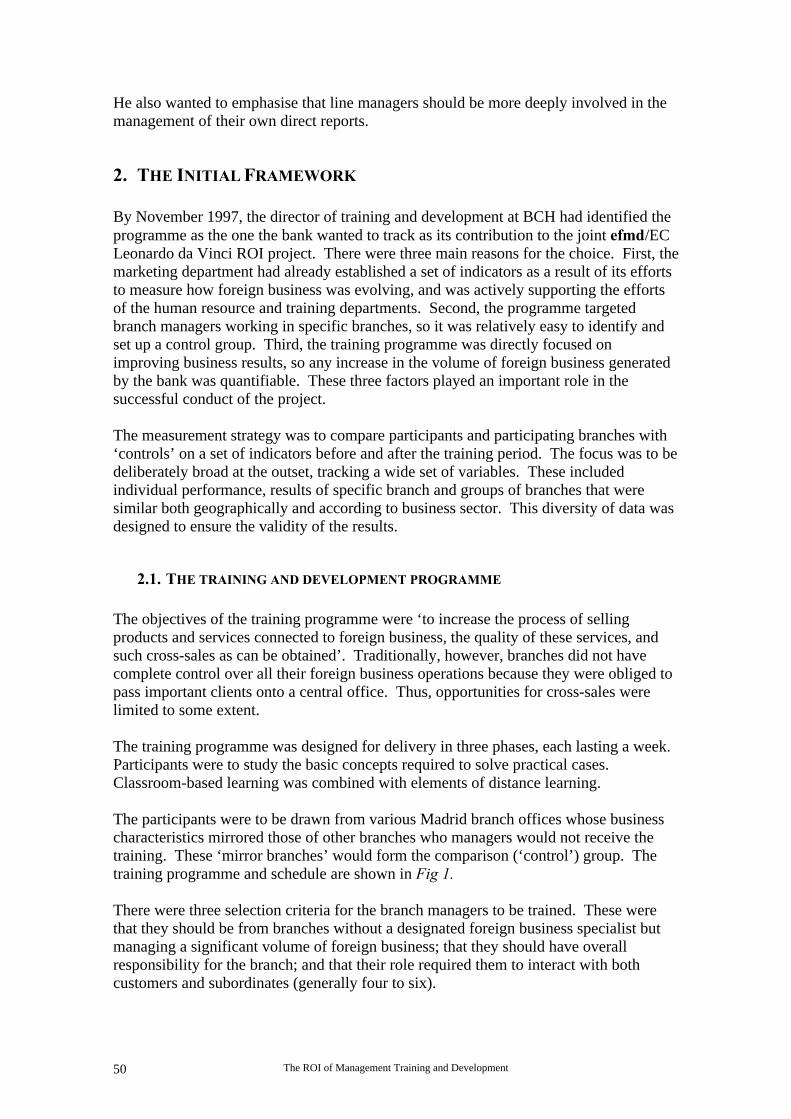
The ROI of Management Training and Development50
He also wanted to emphasise that line managers should be more deeply involved in themanagement of their own direct reports.
2. THE INITIAL FRAMEWORK
By November 1997, the director of training and development at BCH had identified theprogramme as the one the bank wanted to track as its contribution to the joint efmd/ECLeonardo da Vinci ROI project. There were three main reasons for the choice. First, themarketing department had already established a set of indicators as a result of its effortsto measure how foreign business was evolving, and was actively supporting the effortsof the human resource and training departments. Second, the programme targetedbranch managers working in specific branches, so it was relatively easy to identify andset up a control group. Third, the training programme was directly focused onimproving business results, so any increase in the volume of foreign business generatedby the bank was quantifiable. These three factors played an important role in thesuccessful conduct of the project.
The measurement strategy was to compare participants and participating branches with‘controls’ on a set of indicators before and after the training period. The focus was to bedeliberately broad at the outset, tracking a wide set of variables. These includedindividual performance, results of specific branch and groups of branches that weresimilar both geographically and according to business sector. This diversity of data wasdesigned to ensure the validity of the results.
2.1. THE TRAINING AND DEVELOPMENT PROGRAMME
The objectives of the training programme were ‘to increase the process of sellingproducts and services connected to foreign business, the quality of these services, andsuch cross-sales as can be obtained’. Traditionally, however, branches did not havecomplete control over all their foreign business operations because they were obliged topass important clients onto a central office. Thus, opportunities for cross-sales werelimited to some extent.
The training programme was designed for delivery in three phases, each lasting a week.Participants were to study the basic concepts required to solve practical cases.Classroom-based learning was combined with elements of distance learning.
The participants were to be drawn from various Madrid branch offices whose businesscharacteristics mirrored those of other branches who managers would not receive thetraining. These ‘mirror branches’ would form the comparison (‘control’) group. Thetraining programme and schedule are shown in Fig 1.
There were three selection criteria for the branch managers to be trained. These werethat they should be from branches without a designated foreign business specialist butmanaging a significant volume of foreign business; that they should have overallresponsibility for the branch; and that their role required them to interact with bothcustomers and subordinates (generally four to six).
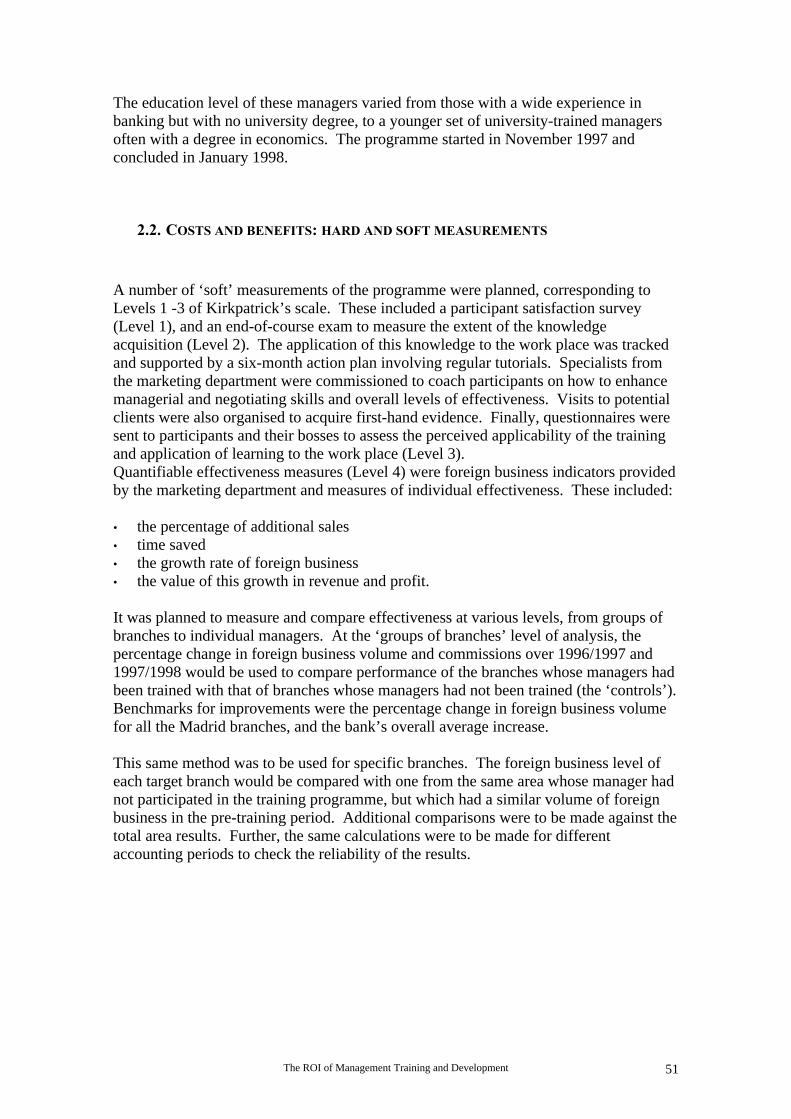
The ROI of Management Training and Development 51
The education level of these managers varied from those with a wide experience inbanking but with no university degree, to a younger set of university-trained managersoften with a degree in economics. The programme started in November 1997 andconcluded in January 1998.
2.2. COSTS AND BENEFITS: HARD AND SOFT MEASUREMENTS
A number of ‘soft’ measurements of the programme were planned, corresponding toLevels 1 -3 of Kirkpatrick’s scale. These included a participant satisfaction survey(Level 1), and an end-of-course exam to measure the extent of the knowledgeacquisition (Level 2). The application of this knowledge to the work place was trackedand supported by a six-month action plan involving regular tutorials. Specialists fromthe marketing department were commissioned to coach participants on how to enhancemanagerial and negotiating skills and overall levels of effectiveness. Visits to potentialclients were also organised to acquire first-hand evidence. Finally, questionnaires weresent to participants and their bosses to assess the perceived applicability of the trainingand application of learning to the work place (Level 3).Quantifiable effectiveness measures (Level 4) were foreign business indicators providedby the marketing department and measures of individual effectiveness. These included:
• the percentage of additional sales• time saved• the growth rate of foreign business• the value of this growth in revenue and profit.
It was planned to measure and compare effectiveness at various levels, from groups ofbranches to individual managers. At the ‘groups of branches’ level of analysis, thepercentage change in foreign business volume and commissions over 1996/1997 and1997/1998 would be used to compare performance of the branches whose managers hadbeen trained with that of branches whose managers had not been trained (the ‘controls’).Benchmarks for improvements were the percentage change in foreign business volumefor all the Madrid branches, and the bank’s overall average increase.
This same method was to be used for specific branches. The foreign business level ofeach target branch would be compared with one from the same area whose manager hadnot participated in the training programme, but which had a similar volume of foreignbusiness in the pre-training period. Additional comparisons were to be made against thetotal area results. Further, the same calculations were to be made for differentaccounting periods to check the reliability of the results.
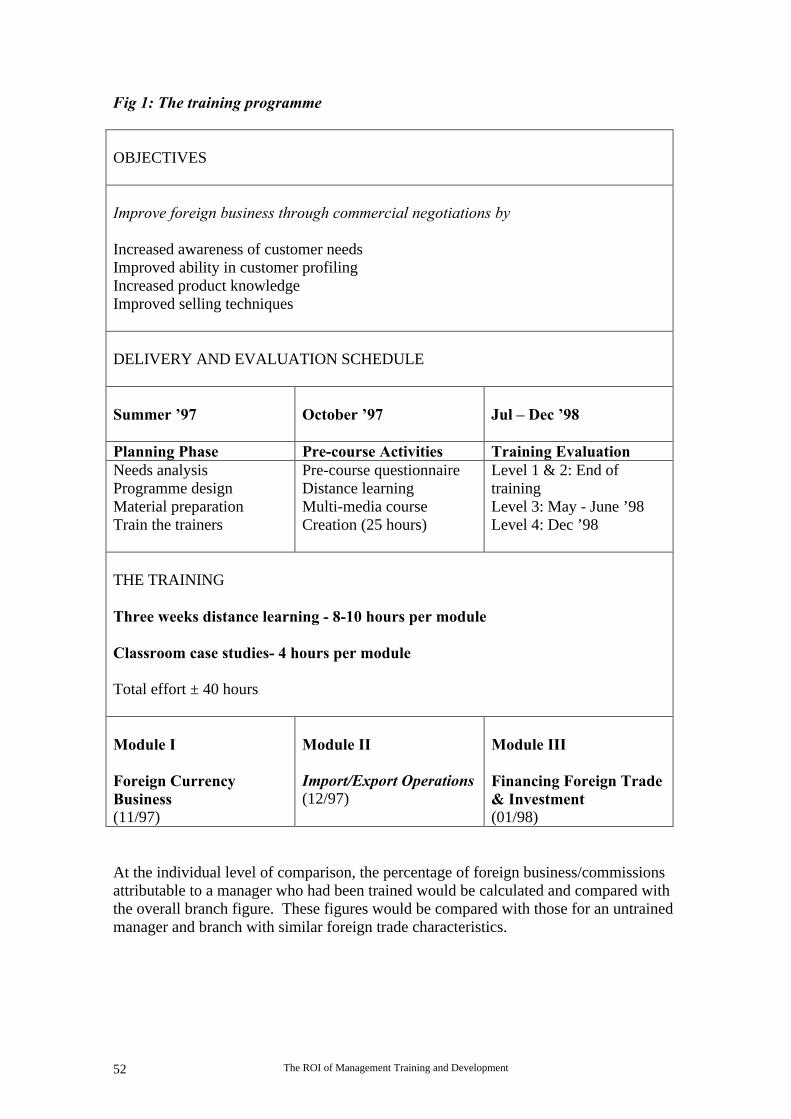
The ROI of Management Training and Development52
Fig 1: The training programme
OBJECTIVES
Improve foreign business through commercial negotiations by
Increased awareness of customer needsImproved ability in customer profilingIncreased product knowledgeImproved selling techniques
DELIVERY AND EVALUATION SCHEDULE
Summer ’97 October ’97 Jul – Dec ’98
Planning Phase Pre-course Activities Training EvaluationNeeds analysisProgramme designMaterial preparationTrain the trainers
Pre-course questionnaireDistance learningMulti-media courseCreation (25 hours)
Level 1 & 2: End oftrainingLevel 3: May - June ’98Level 4: Dec ’98
THE TRAINING
Three weeks distance learning - 8-10 hours per module
Classroom case studies- 4 hours per module
Total effort ± 40 hours
Module I
Foreign CurrencyBusiness(11/97)
Module II
Import/Export Operations(12/97)
Module III
Financing Foreign Trade& Investment(01/98)
At the individual level of comparison, the percentage of foreign business/commissionsattributable to a manager who had been trained would be calculated and compared withthe overall branch figure. These figures would be compared with those for an untrainedmanager and branch with similar foreign trade characteristics.
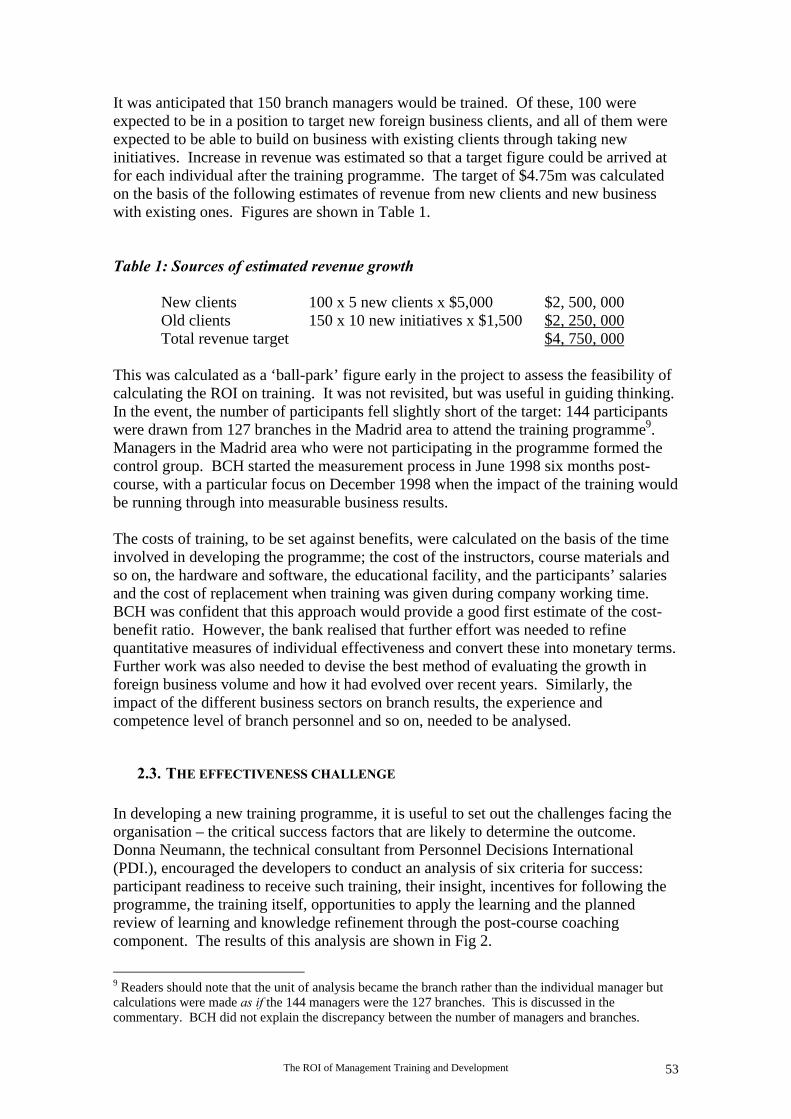
The ROI of Management Training and Development 53
It was anticipated that 150 branch managers would be trained. Of these, 100 wereexpected to be in a position to target new foreign business clients, and all of them wereexpected to be able to build on business with existing clients through taking newinitiatives. Increase in revenue was estimated so that a target figure could be arrived atfor each individual after the training programme. The target of $4.75m was calculatedon the basis of the following estimates of revenue from new clients and new businesswith existing ones. Figures are shown in Table 1.
Table 1: Sources of estimated revenue growth
New clients 100 x 5 new clients x $5,000 $2, 500, 000Old clients 150 x 10 new initiatives x $1,500 $2, 250, 000Total revenue target $4, 750, 000
This was calculated as a ‘ball-park’ figure early in the project to assess the feasibility ofcalculating the ROI on training. It was not revisited, but was useful in guiding thinking.In the event, the number of participants fell slightly short of the target: 144 participantswere drawn from 127 branches in the Madrid area to attend the training programme9.Managers in the Madrid area who were not participating in the programme formed thecontrol group. BCH started the measurement process in June 1998 six months post-course, with a particular focus on December 1998 when the impact of the training wouldbe running through into measurable business results.
The costs of training, to be set against benefits, were calculated on the basis of the timeinvolved in developing the programme; the cost of the instructors, course materials andso on, the hardware and software, the educational facility, and the participants’ salariesand the cost of replacement when training was given during company working time.BCH was confident that this approach would provide a good first estimate of the cost-benefit ratio. However, the bank realised that further effort was needed to refinequantitative measures of individual effectiveness and convert these into monetary terms.Further work was also needed to devise the best method of evaluating the growth inforeign business volume and how it had evolved over recent years. Similarly, theimpact of the different business sectors on branch results, the experience andcompetence level of branch personnel and so on, needed to be analysed.
2.3. THE EFFECTIVENESS CHALLENGE
In developing a new training programme, it is useful to set out the challenges facing theorganisation – the critical success factors that are likely to determine the outcome.Donna Neumann, the technical consultant from Personnel Decisions International(PDI.), encouraged the developers to conduct an analysis of six criteria for success:participant readiness to receive such training, their insight, incentives for following theprogramme, the training itself, opportunities to apply the learning and the plannedreview of learning and knowledge refinement through the post-course coachingcomponent. The results of this analysis are shown in Fig 2.
9 Readers should note that the unit of analysis became the branch rather than the individual manager butcalculations were made as if the 144 managers were the 127 branches. This is discussed in thecommentary. BCH did not explain the discrepancy between the number of managers and branches.
The ROI of Management Training and Development54
The impact of these factors on BCH’s ability to produce an effective trainingprogramme was rated on a five-point scale by the developers. A rating of 5 was given tofactors on which the programme and participants were in good shape, while a rating of 1denoted quite an obstacle in terms of reaching a high level of effectiveness. Theanalysis showed that the factor most threatening to the programme’s effectiveness wasincentive, and the least problematic factor was participant readiness.
Fig 2: Ratings on critical success factors. Solid lines show the pre- training ratings;broken lines show the post-training ratings
A second analysis was made at the end of the training process evaluating how these sixcriteria actually played their part in helping or hindering BCH. The broken line in Fig 2shows the results of this analysis. The lack of incentive for the participants to enrol andsuccessfully complete the programme it turned out much as expected. There was nopromotional or financial incentive, and personal objectives given by the participants’managers do not seem to have had much bite. This criterion was perceived to be the‘bottle neck’ in the process. There was slippage in the ratings of other criteria too.
5
4
3
2
1
1
2
3
4ParticipantReadiness
(5/4.5)
Insight(3.5/3)
Incentive(1/1)
Training(3/3) Opportunity
(3.5/2)Review +
Refine(4/2)
The ROI of Management Training and Development 55
The reasons are set out below.
PARTICIPANTREADINESS
Participants were required to be dealing with asignificant level of foreign business. If they were not,they were supposed to have basic training before theprogramme. Some participants slipped in ‘under thenet’, so the group was not as homogenous as planned interms of foreign business experience.
PARTICIPANT INSIGHT No feedback was given on a pre-test designed to assesswhether managers needed basic training prior toattending the programme, so a learning opportunity wasmissed. Lack of feedback, and lack of follow-throughon basic training, was how some participants slipped‘under the net.’
OPPORTUNITY Participants did not have it spelt out for them clearlyenough what was expected of them back in the workplace.
REVIEW AND REFINE The planned customer visits with a marketing coach didnot proceed exactly as planned due to a majororganisational change in January 1998, cutting Madridinto two separate marketing territories.
BCH found these analyses useful in highlighting likely problem areas and where (andwhy) it had experienced some slippage. The overall ratings before and after theprogramme (20; 15.5) provided an idea of the extent of the anticipated challenge and thereality. As a result, BCH lowered its expectation of post-training growth foreignbusiness operations and fee income. It expected branches with trained managers toachieve a 39% growth in foreign trade operations compared with 34% for controls. Feeincome was expected to increase from 10% to 11% after training. These figures wererevised downward by 75% of the potential gain, yielding 37.7% and 10.7% respectively.These expectations do not figure again in the study, but the exercise showed thetempering effect of analysing the ‘learning and application’ pipeline in the context of theorganisation and the workplace. The analysis was also valuable for the development offuture training programmes.
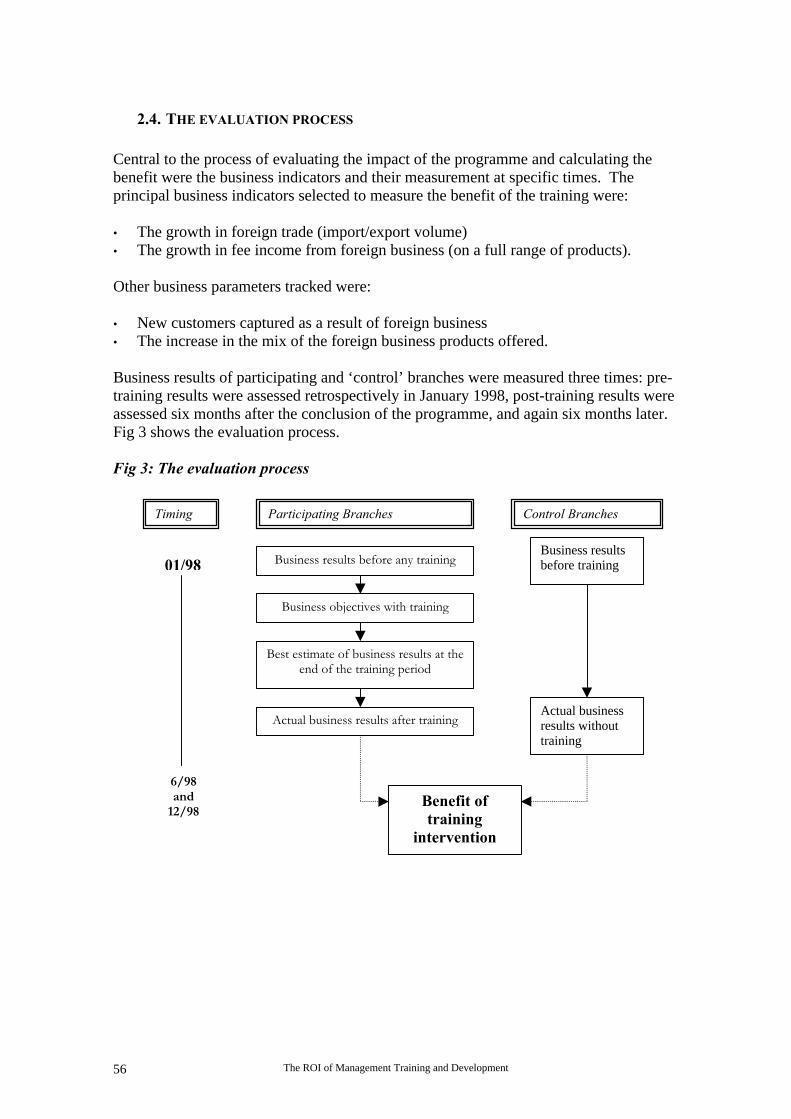
The ROI of Management Training and Development56
2.4. THE EVALUATION PROCESS
Central to the process of evaluating the impact of the programme and calculating thebenefit were the business indicators and their measurement at specific times. Theprincipal business indicators selected to measure the benefit of the training were:
• The growth in foreign trade (import/export volume)• The growth in fee income from foreign business (on a full range of products).
Other business parameters tracked were:
• New customers captured as a result of foreign business• The increase in the mix of the foreign business products offered.
Business results of participating and ‘control’ branches were measured three times: pre-training results were assessed retrospectively in January 1998, post-training results wereassessed six months after the conclusion of the programme, and again six months later.Fig 3 shows the evaluation process.
Fig 3: The evaluation process
Control BranchesTiming Participating Branches
Business results before any training
Business objectives with training
Best estimate of business results at theend of the training period
Actual business results after training
Business resultsbefore training
Actual businessresults withouttraining
Benefit oftraining
intervention
01/98
6/98and
12/98
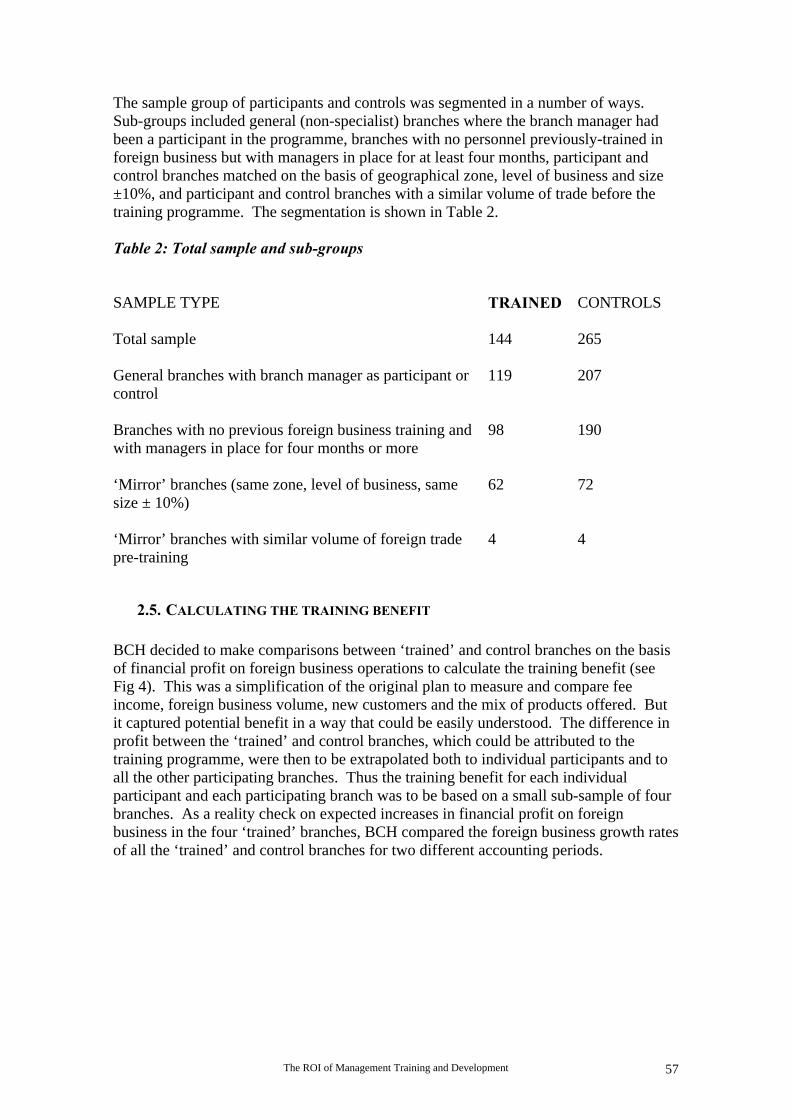
The ROI of Management Training and Development 57
The sample group of participants and controls was segmented in a number of ways.Sub-groups included general (non-specialist) branches where the branch manager hadbeen a participant in the programme, branches with no personnel previously-trained inforeign business but with managers in place for at least four months, participant andcontrol branches matched on the basis of geographical zone, level of business and size±10%, and participant and control branches with a similar volume of trade before thetraining programme. The segmentation is shown in Table 2.
Table 2: Total sample and sub-groups
SAMPLE TYPE TRAINED CONTROLS
Total sample 144 265
General branches with branch manager as participant orcontrol
119 207
Branches with no previous foreign business training andwith managers in place for four months or more
98 190
‘Mirror’ branches (same zone, level of business, samesize ± 10%)
62 72
‘Mirror’ branches with similar volume of foreign tradepre-training
4 4
2.5. CALCULATING THE TRAINING BENEFIT
BCH decided to make comparisons between ‘trained’ and control branches on the basisof financial profit on foreign business operations to calculate the training benefit (seeFig 4). This was a simplification of the original plan to measure and compare feeincome, foreign business volume, new customers and the mix of products offered. Butit captured potential benefit in a way that could be easily understood. The difference inprofit between the ‘trained’ and control branches, which could be attributed to thetraining programme, were then to be extrapolated both to individual participants and toall the other participating branches. Thus the training benefit for each individualparticipant and each participating branch was to be based on a small sub-sample of fourbranches. As a reality check on expected increases in financial profit on foreignbusiness in the four ‘trained’ branches, BCH compared the foreign business growth ratesof all the ‘trained’ and control branches for two different accounting periods.
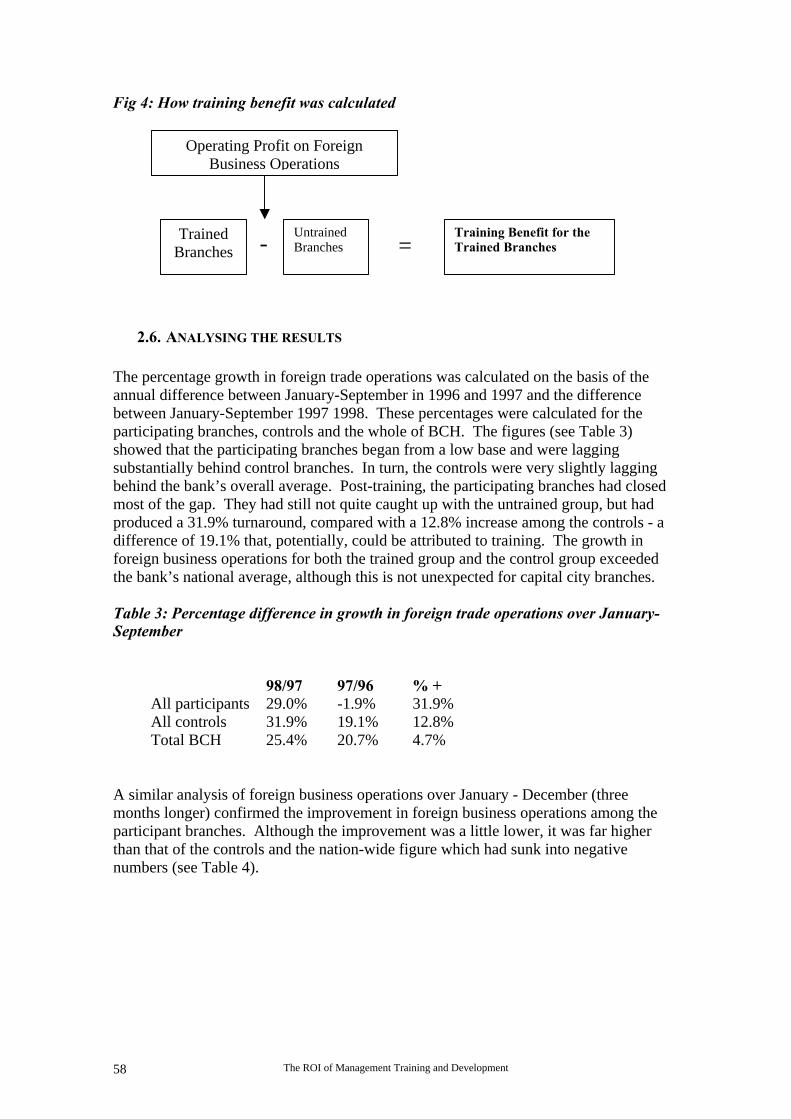
The ROI of Management Training and Development58
Fig 4: How training benefit was calculated
2.6. ANALYSING THE RESULTS
The percentage growth in foreign trade operations was calculated on the basis of theannual difference between January-September in 1996 and 1997 and the differencebetween January-September 1997 1998. These percentages were calculated for theparticipating branches, controls and the whole of BCH. The figures (see Table 3)showed that the participating branches began from a low base and were laggingsubstantially behind control branches. In turn, the controls were very slightly laggingbehind the bank’s overall average. Post-training, the participating branches had closedmost of the gap. They had still not quite caught up with the untrained group, but hadproduced a 31.9% turnaround, compared with a 12.8% increase among the controls - adifference of 19.1% that, potentially, could be attributed to training. The growth inforeign business operations for both the trained group and the control group exceededthe bank’s national average, although this is not unexpected for capital city branches.
Table 3: Percentage difference in growth in foreign trade operations over January-September
98/97 97/96 % +All participants 29.0% -1.9% 31.9%All controls 31.9% 19.1% 12.8%Total BCH 25.4% 20.7% 4.7%
A similar analysis of foreign business operations over January - December (threemonths longer) confirmed the improvement in foreign business operations among theparticipant branches. Although the improvement was a little lower, it was far higherthan that of the controls and the nation-wide figure which had sunk into negativenumbers (see Table 4).
Operating Profit on ForeignBusiness Operations
TrainedBranches
UntrainedBranches
Training Benefit for theTrained Branches- =
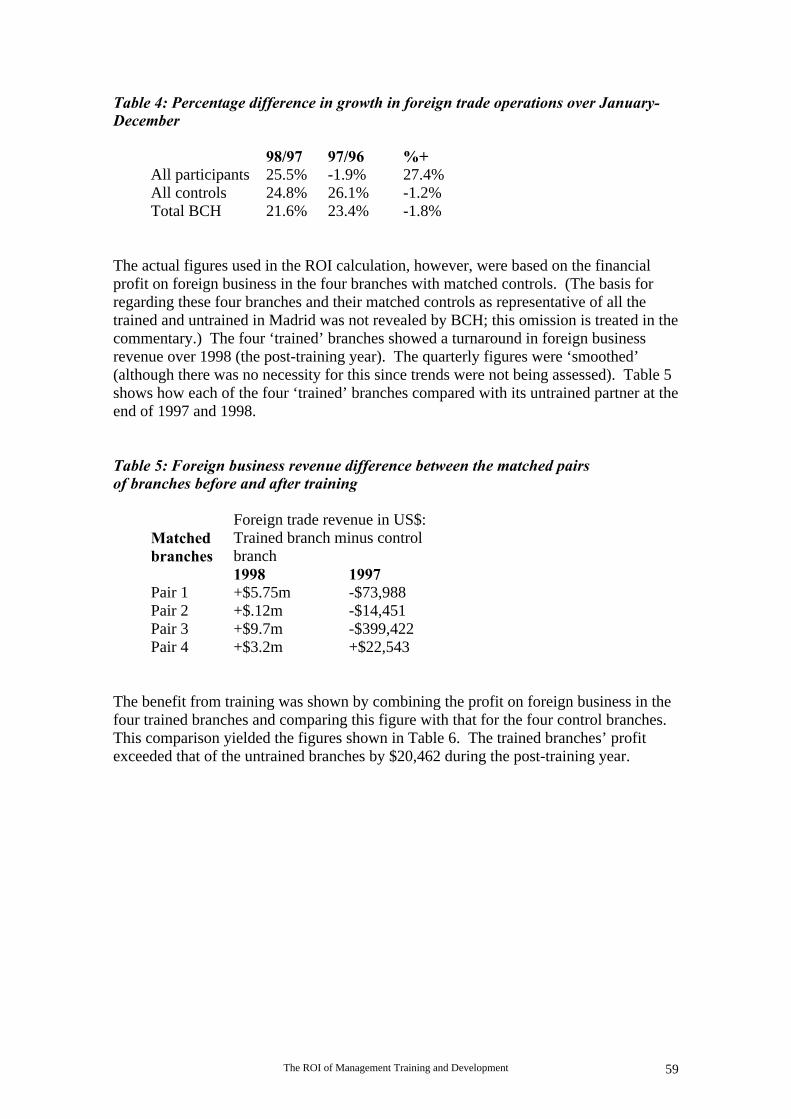
The ROI of Management Training and Development 59
Table 4: Percentage difference in growth in foreign trade operations over January-December
98/97 97/96 %+All participants 25.5% -1.9% 27.4%All controls 24.8% 26.1% -1.2%Total BCH 21.6% 23.4% -1.8%
The actual figures used in the ROI calculation, however, were based on the financialprofit on foreign business in the four branches with matched controls. (The basis forregarding these four branches and their matched controls as representative of all thetrained and untrained in Madrid was not revealed by BCH; this omission is treated in thecommentary.) The four ‘trained’ branches showed a turnaround in foreign businessrevenue over 1998 (the post-training year). The quarterly figures were ‘smoothed’(although there was no necessity for this since trends were not being assessed). Table 5shows how each of the four ‘trained’ branches compared with its untrained partner at theend of 1997 and 1998.
Table 5: Foreign business revenue difference between the matched pairsof branches before and after training
Foreign trade revenue in US$:Trained branch minus controlbranch
Matchedbranches
1998 1997Pair 1 +$5.75m -$73,988Pair 2 +$.12m -$14,451Pair 3 +$9.7m -$399,422Pair 4 +$3.2m +$22,543
The benefit from training was shown by combining the profit on foreign business in thefour trained branches and comparing this figure with that for the four control branches.This comparison yielded the figures shown in Table 6. The trained branches’ profitexceeded that of the untrained branches by $20,462 during the post-training year.
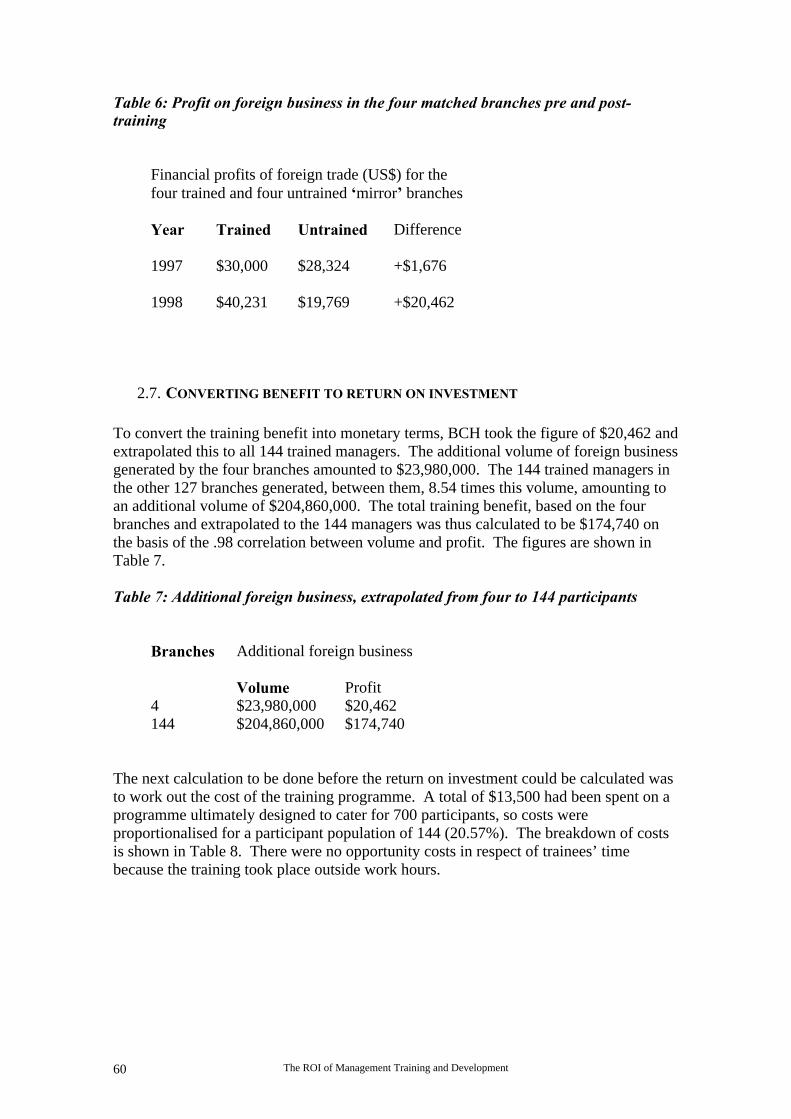
The ROI of Management Training and Development60
Table 6: Profit on foreign business in the four matched branches pre and post-training
Financial profits of foreign trade (US$) for thefour trained and four untrained ‘mirror’ branches
Year Trained Untrained Difference
1997
1998
$30,000
$40,231
$28,324
$19,769
+$1,676
+$20,462
2.7. CONVERTING BENEFIT TO RETURN ON INVESTMENT
To convert the training benefit into monetary terms, BCH took the figure of $20,462 andextrapolated this to all 144 trained managers. The additional volume of foreign businessgenerated by the four branches amounted to $23,980,000. The 144 trained managers inthe other 127 branches generated, between them, 8.54 times this volume, amounting toan additional volume of $204,860,000. The total training benefit, based on the fourbranches and extrapolated to the 144 managers was thus calculated to be $174,740 onthe basis of the .98 correlation between volume and profit. The figures are shown inTable 7.
Table 7: Additional foreign business, extrapolated from four to 144 participants
Additional foreign businessBranches
Volume Profit4 $23,980,000 $20,462144 $204,860,000 $174,740
The next calculation to be done before the return on investment could be calculated wasto work out the cost of the training programme. A total of $13,500 had been spent on aprogramme ultimately designed to cater for 700 participants, so costs wereproportionalised for a participant population of 144 (20.57%). The breakdown of costsis shown in Table 8. There were no opportunity costs in respect of trainees’ timebecause the training took place outside work hours.
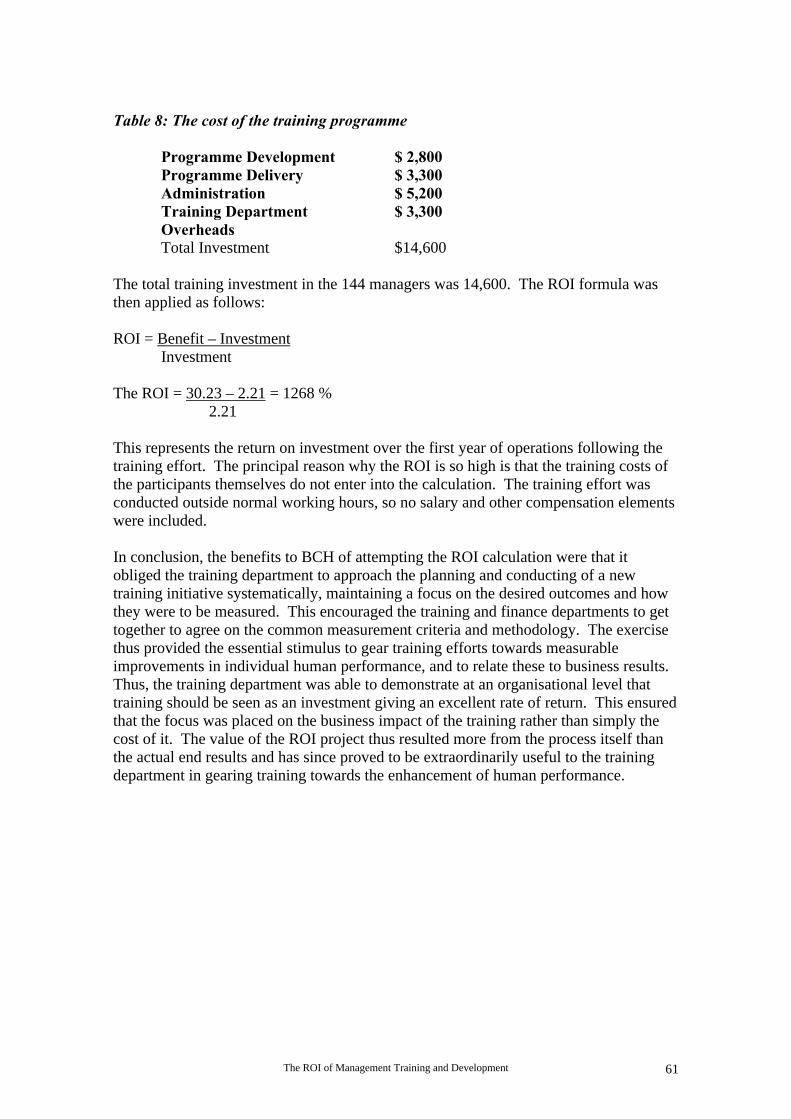
The ROI of Management Training and Development 61
Table 8: The cost of the training programme
Programme Development $ 2,800Programme Delivery $ 3,300Administration $ 5,200Training DepartmentOverheads
$ 3,300
Total Investment $14,600
The total training investment in the 144 managers was 14,600. The ROI formula wasthen applied as follows:
ROI = Benefit – InvestmentInvestment
The ROI = 30.23 – 2.21 = 1268 %2.21
This represents the return on investment over the first year of operations following thetraining effort. The principal reason why the ROI is so high is that the training costs ofthe participants themselves do not enter into the calculation. The training effort wasconducted outside normal working hours, so no salary and other compensation elementswere included.
In conclusion, the benefits to BCH of attempting the ROI calculation were that itobliged the training department to approach the planning and conducting of a newtraining initiative systematically, maintaining a focus on the desired outcomes and howthey were to be measured. This encouraged the training and finance departments to gettogether to agree on the common measurement criteria and methodology. The exercisethus provided the essential stimulus to gear training efforts towards measurableimprovements in individual human performance, and to relate these to business results.Thus, the training department was able to demonstrate at an organisational level thattraining should be seen as an investment giving an excellent rate of return. This ensuredthat the focus was placed on the business impact of the training rather than simply thecost of it. The value of the ROI project thus resulted more from the process itself thanthe actual end results and has since proved to be extraordinarily useful to the trainingdepartment in gearing training towards the enhancement of human performance.
The ROI of Management Training and Development62
CASE STUDY III: DSM
1. BACKGROUND
DSM is a Dutch medium-sized chemical company founded in 1902, employing almost18,000 employees worldwide, 13,000 of whom work in The Netherlands. In 1997, thecompany was divided into 13 major business groups, dealing with its four principalbusiness segments:
• Polymers• Industrial Chemicals• Resin and Plastic Products• Energy and other activities.
Its products compete in the automotive, electronic, packaging, pharmaceutical, plastichousehold goods, agriculture, construction and textile markets. It operates in 40countries.
Joop Joosen, the director responsible for Training and Learning, who had come into thejob after a 25-year career in production, was interested in bringing some of hismeasurement experience into training. He had been an active member of the efmd ROIsteering committee that had met in July 1997 in Paris and in November 1997 in London,and signed up for the project at the start of 1998.
His mission was to focus particularly on the top 200 DSM executives and managersworldwide, and the two flagship programmes:
• The Strategic Management Course (SMC) run once a year for some 36 participants.This was a programme designed to prepare participants and give them the necessaryskills to participate in the company-wide “Business Strategy Dialogue” (BSD).
• The Corporate Management Course (CMC) run twice a year for some 24participants. This was designed to help participants understand and apply thebehavioural processes required for the effective implementation of Strategy.
DSM had a solid traditional measurement and tracking system at Kirkpatrick level 1, butlittle at other levels, and Joop Joosen wanted to invest more effort in re-defining theseprogrammes in both business and behavioural terms, and discover more about the returnDSM were getting for their Training and Development investment.
At the ROI project “kick-off” meeting held at IBM’s International Education Centre atLa Hulpe in Belgium at the beginning of March 1998, DSM decided to focus on theirStrategic Management Course, as their contribution to the efmd/EC ROI project. Eventhough they only held one programme a year, they had abundant stable historical datagoing back to 1994. In all, 300 participants had been through the programme since itsstart in 1990.
The ROI of Management Training and Development 63
There was no question of the Training and Development department having to defendthe SMC programme or provide a justification for it – it underpinned and provided apre-requisite for participation in the annual company-wide Business Strategy Dialogueprocess – but it was felt appropriate to measure the financial impact the Programmeachieved, and place some quantifiable measures on the undoubted learning allacknowledged.
2. THE STRATEGIC MANAGEMENT COURSE
2.1. PARTICIPANT PROFILE
36 executives and senior managers drawn from across the company – Business, Plant,Research, Human Resource Managers, Financial Controllers, etc. The composition ofthe group was designed to reflect the heterogeneity of the disciplines and businessesand the international character of DSM.
These participants would join the reservoir of those already trained and involved in thetop-level strategy discussions. The course was regarded internally very much as a “rightof passage”. The 9th SMC held in April 1998 had 37 participants drawn from ninecountries and all 13 business groups.
2.2. COURSE OBJECTIVES
• To introduce participants to the strategic business concepts, they needed tounderstand and conduct a competitive analysis of their own specific businesses.
• To increase their understanding of the factors influencing the competitiveness oftheir businesses.
• To prepare participants to take part in their specific Business Strategy Dialogue(BSD) process. The BSD is in three phases. The development, implementation, andthen performance measurement of a Strategic Plan.
• To provide a company-wide framework for developing and discussing businessplans (essentially establishing a common language).
• To create an inter-personal network to facilitate the exchange of experience andideas both during the course and in the future.
The ROI of Management Training and Development64
2.3. CONTENT
Participants learn how to determine the competitive dynamics of their industry and thepossible strategic options and key success factors applicable to their businesses. Theythen take part exercises on target-setting and formulating performance indicators. Theyapply the conceptual frameworks introduced in the Programme in various case studies,group assignments and class discussions, and finally relate all of this to some actualDSM cases.
The five-day programme is delivered by an international academic faculty, drawnprincipally from leading European Business Schools.
The direct “outcome” of the SMC is that participants should be able to become activecontributors in the Business Strategy Dialogue process designed to:
• improve the decision-making process;• improve customer focus;• make appropriate acquisitions, divestments;• acquire and maintain a technological edge;• make the appropriate “make or buy” decision;• achieve operational excellence;• define the Key Success Factors (KSF’s);• establish the significant Performance Indicators (PI’s).
2.4. CONTEXT
In behavioural terms, having a core of some 200-300 executives and senior managers all“schooled” via the same SMC process, it was expected that:
• the BSD meetings and discussions would be more effective;• there would be fewer misunderstandings;• organizational flexibility would increase;• it would open up growth opportunities for the individuals involved.
There was also an awareness that any such company-wide “cloning” process carriedwith it the inherent danger that it might block out new ideas hostile to the prevalent“group-think”.
The principal objective of the course was formulated as “Teaching managers thestrategic language spoken at DSM to facilitate the formulation of strategic plans andensure a uniform structure to the development of these plans!” This objective can besplit into two constituent parts.
Cognitive LearningThe knowledge acquired by the managers attending the Programme, centred aroundwhat DSM calls the “5 C’s” – Company, Customers, Competition, Costs and Context.
The ROI of Management Training and Development 65
Social-Behavioural LearningLearning the most effective behaviour for managers working together to create theirstrategic plans.
For the course to be effective, both these parts must be accomplished successfully.
2.5. PROGRAMME IMPROVEMENT TARGETS
Two areas for possible improvement had already been detected:
• There was a need to tighten the participant selection process to ensure managersonly nominated appropriate candidates. Occasionally, some “dead wood” got inthrough the net, in spite of there being a selection process, as the demand for placeshas always outstripped the number of places available.
• There was a need to reinforce the pre and post-course briefings managers wererequired to hold with the participants they had selected for the SMC. Sometimes,there was little or no dialogue.
3. EVALUATING THE EFFECTIVENESS OF THE SMC
DSM’s Corporate Management Training Department decided that they lacked themanpower and expertise internally to pursue and deliver on a timely basis the input theyhad committed to provide to the efmd/EC ROI project. They therefore engaged agraduate research student – Simone Sluijsmans – working under the supervision ofProfessor L.S. Tigchelar at the Catholic University of Brabant, to help them measure theeffectiveness of the SMC. The rest of this chapter is drawn principally from her doctoralthesis and is a synopsis of it
After the decision to engage Simone had been taken, Joop Joosen left the CorporateManagement Department for another manufacturing assignment, and ChristianeThielens took over the management of the ROI project with the same energy andenthusiasm.
3.1. THE GENERIC RESEARCH THESIS
Simone Sluijsmans first looked over the traditional Kirkpatrick level 1 participantratings that DSM had been collecting since the outset in 1991, and the follow-upevaluations made six months after each programme, which had been initiated in 1997.
To measure the effectiveness of the SMC against its stated objectives, she defined thebasic yardstick – “Have the two main objectives – the cognitive learning and thesocio-behavioural learning objectives been reached?”
The ROI of Management Training and Development66
She sub-divided this thesis into five sub-sets:
• Are the participants satisfied with the SMC?
• Have they learned something during the course• seen from a cognitive perspective• seen from a socio-behavioural perspective?
• Do they use the things they have learned as seen from these two perspectives?
• Are the organizati0nal results being effected by the participants’ change inbehaviour?
• Does the ROI meet the pre-set target of 20%?
Simone was faced with the classic problem confronting someone asked to evaluate theeffectiveness of a training initiative. There was no “needs analysis” document definingwhy and for what purpose the training had been initiated in the first place. All theexpert opinion she had studied – Rae (1986), Kirkpatrick (1994) and Phillips (1997)may divide the evaluation process into differing numbers of steps, but are all unanimousthat you decide how and what you are going to measure “up front” rather than attempt to“bolt it on” at the end. In the vast majority of cases, however, this is the onlyalternative!
It was necessary, therefore, to conduct what cynics might call a “retro-fit”. Thisinvolves going back to the earlier steps in the model, talking to people, identifying whatthey perceived the purpose of the training to be – in brief, creating a surrogate latter- day“needs analysis”.
The ROI of Management Training and Development 67
3.2. THE METHODOLOGY
3.2.1. THE “AFTER-ONLY” DESIGN
The evaluation of training programmes has been classified in the literature as either“Formative” or “Summative” (Basarab & Root 1992). The first provides informationand feedback for the purpose of improving the course during its development andimplementation. Summative measures the merits and worth of the training effort.Clearly, Simone’s focus was on the second category. In selecting an evaluation design,she was likewise limited to only one of the three possible alternatives:
• The Experimental Design, which is based on various elements, including anexperimental and control group with pre and post-testing. None of these factorsexisted for the SMC.
• The Quasi-Experimental Design, which through accepting that some externalfactors are not controlled, falls for the same reason.
• The Non-Experimental Design, for which the obvious choice is aptly named the“After-Only” design!
The weakness inherent in this design is the threat that external factors will corrupt theinternal validity of the findings. To attempt to partially mitigate against this, it wasdecided to ask future trainees (SMC ’99) about the pre-training situations and theirexpectations. This input could then be set against the retrospective input gathered frompast participants, which was likely to be tainted by the training and post-trainingexperience they had been subjected to.
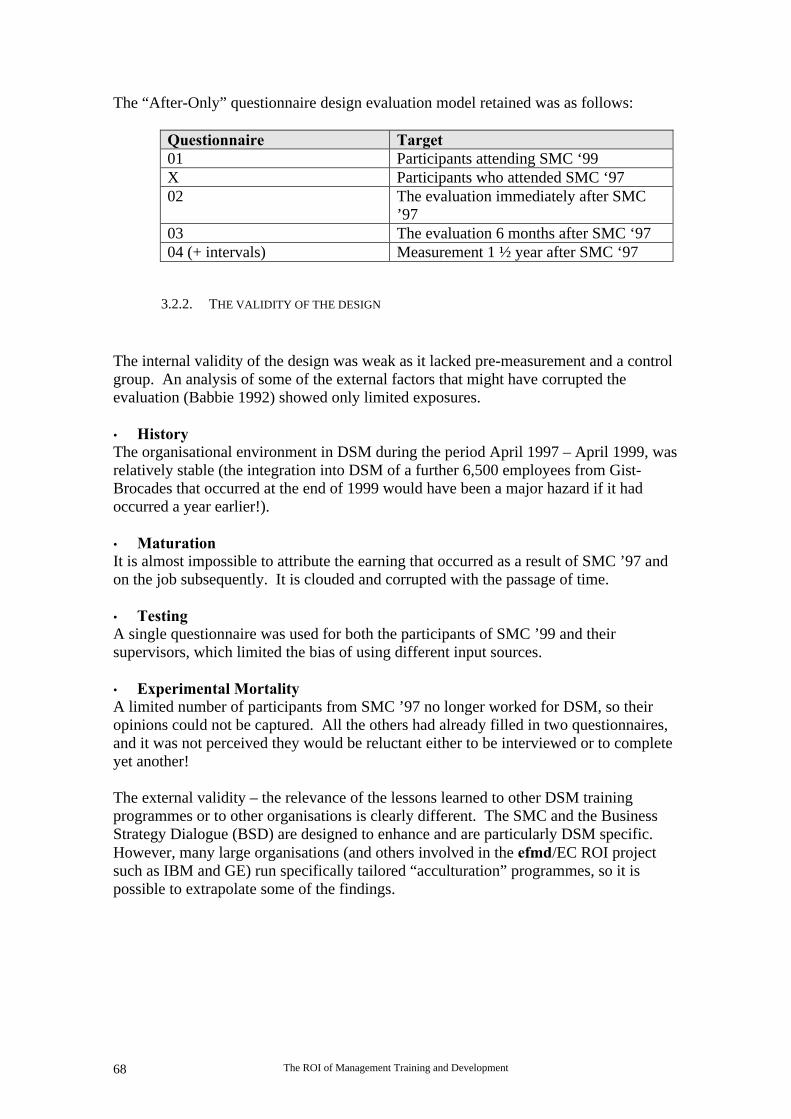
The ROI of Management Training and Development68
The “After-Only” questionnaire design evaluation model retained was as follows:
Questionnaire Target01 Participants attending SMC ‘99X Participants who attended SMC ‘9702 The evaluation immediately after SMC
’9703 The evaluation 6 months after SMC ‘9704 (+ intervals) Measurement 1 ½ year after SMC ‘97
3.2.2. THE VALIDITY OF THE DESIGN
The internal validity of the design was weak as it lacked pre-measurement and a controlgroup. An analysis of some of the external factors that might have corrupted theevaluation (Babbie 1992) showed only limited exposures.
• HistoryThe organisational environment in DSM during the period April 1997 – April 1999, wasrelatively stable (the integration into DSM of a further 6,500 employees from Gist-Brocades that occurred at the end of 1999 would have been a major hazard if it hadoccurred a year earlier!).
• MaturationIt is almost impossible to attribute the earning that occurred as a result of SMC ’97 andon the job subsequently. It is clouded and corrupted with the passage of time.
• TestingA single questionnaire was used for both the participants of SMC ’99 and theirsupervisors, which limited the bias of using different input sources.
• Experimental MortalityA limited number of participants from SMC ’97 no longer worked for DSM, so theiropinions could not be captured. All the others had already filled in two questionnaires,and it was not perceived they would be reluctant either to be interviewed or to completeyet another!
The external validity – the relevance of the lessons learned to other DSM trainingprogrammes or to other organisations is clearly different. The SMC and the BusinessStrategy Dialogue (BSD) are designed to enhance and are particularly DSM specific.However, many large organisations (and others involved in the efmd/EC ROI projectsuch as IBM and GE) run specifically tailored “acculturation” programmes, so it ispossible to extrapolate some of the findings.
The ROI of Management Training and Development 69
3.2.3. THE “TARGET POPULATION” FOR ANALYSIS
37 participants attended SMC ’97 and all but four of them still worked for DSM. Forthe analysis of Kirkpatrick levels 3 and 4, the manager of these participants alsoreceived a questionnaire, and all but one of them still worked for DSM. The futureparticipants who were to attend SMC ’99 and their managers were all to be questionedas part of a pre-measurement process.
It was decided to break down the target population using different variables – thefunction, length of service, time in job, age – factors that it was felt, as a result ofinterviews and a subsequent brainstorming session, might skew the findings one way orthe other. It takes time to “get the feel” for the culture of an organization and peoplenew to a job are usually on a steeper and richer learning curve. It was not thoughtappropriate to include “gender” as a variable given the virtual male mono-culture ofSMC participants!
3.2.4. MEASURING THE KIRKPATRICK 5 LEVELS
Level One – Reactions and Planned Actions
All of the SMC ’97 participants provided their evaluations directly after the course andsix months after, so it was not thought necessary to measure their reactions one moretime. The questionnaires the participants completed contained classic closed items on afive-point Likert scale ranging from “strongly agree” to “strongly disagree” with thepossibility to include “write in” comments. The target was to reach a 4.0 satisfactionlevel.
Level Two – Learning
Feedback was elicited in the same questionnaire format on the same two occasions, so itwas decided to stick with this input.
Level Three – Application to the Job
This was first measured 6 months after SMC ’97 using a similar five-point scale, butalso encouraging more “write-in” comments. It was decided to interview theparticipants eighteen months after the course, using a structured interview format(Phillips 1997) and to send the participants’ managers a questionnaire using a four-pointscale to force either a positive or negative opinion by removing the neutral rating. Asatisfaction level of 3.0 was fixed as the target. Open-ended questions we also included.The questionnaire was designed to probe how both the cognitive and socio-behaviourallearning had been achieved.
The ROI of Management Training and Development70
Level Four – Business Results
SMC participants have not yet provided any input to help establish a Kirkpatrick level 4evaluation. Since no hard data equating pre and post-business results exists, bothparticipants and their managers will be asked to provide estimates of the benefit of SMCfor DSM. The participants are to be asked to provide a written statement of the benefitsaccompanied by an estimated monetary value.
Level Five – the Return on Investment
The estimated SMC benefits obtained in the level four calculations were to be setagainst the costs of the training effort. These costs to include the development,occupation, administration, course materials and equipment costs, and participant salaryand compensation incurred during the training period. Since the ROI calculationinvolves estimates of the business results rather than hard data, the actual results shouldbe regarded prudently!
3.2.5. THE MEASUREMENT PROCESS
Questionnaires
All the questionnaire data collected was to be treated confidentially. As thequestionnaire sent to the participant’s manager is designed so it can be linked to theinterview process, these managers are identified, so those who do not return thequestionnaires can be followed up. The participants, though, are not identifiable. Allconcerned in this data collection exercise were to get a report summarizing the resultsand the conclusions of the study.
Interviews
To obtain information on Kirkpatrick levels 3 and 4, a structured interview process wasdesigned containing both open and closed (4-point scale) items. SPSS was used toconduct a statistical analysis of the data obtained. If the participants consented, theirinterviews were taped to permit the interviewer to concentrate on the interviewee betterand provide authenticated input.
The ROI of Management Training and Development 71
4. THE RESULTS OF THE STUDY
4.1. COMPATIBILITY
To situate SMC ’97 in a wider context, DSM made an analysis on all the SMCprogrammes from ’94 – ’99, using the four variables mentioned earlier – functions,length of service, time in jobs, and age. The conclusion was that no two SMC groupswere statistically comparable, which is not surprising given the strategy of attempting toachieve the widest possible participant mix (nationality, business group, function, etc.).DSM had achieved a “dynamic” changing participant mix, but this does have thedownside that it is therefore dangerous to extrapolate the analysis of one SMC as thoughit has general applications.
4.2. RESPONSE RATES
The principal focus of the analysis was SMC ’97. 28 out of the original 33 participatedin the evaluation (85%) – one person was on sick leave, one refused (“I don’t rememberanything”) and three non-Dutch participants failed to respond. Of the 35 participantmanagers, 30 responded. Those who did not, explained that they were no longer theindividual’s manager, or had only just become so, thus they were unable to completeboth a pre and post-training evaluation.
The participants of SMC ’99 were also questioned, with 30 out of the 37 responding(81%). These response rates were considered to be excellent (Babbie 1992).
4.3. PARTICIPATION PRE-SMC PERCEPTIONS (SMC ’97 AND SMC ’99)
4.3.1. THE SELECTION PROCESS
As might be expected, those asked to attend a “flagship” programme, which is also a“right of passage” for further career development in the organisation, are unlikely to benegative about attending such an event.
The interviews showed that most participants felt their enrolment had been a jointdecision between them and their managers, and 90% of the managers claimed they wereenthusiastic about their subordinates attending the SMC.
The ROI of Management Training and Development72
4.3.2. INITIAL REACTIONS
The participants were asked to describe their feelings about being asked to attend theSMC – responding on a four-point scale (4 = very excited) with a desired target of 3.00.The results for the two programmes were 3.21 and 3.10. They scored even morepositively on their level of expectation, but those from SMC ’97 higher than those ofSMC ’99. We could hypothesise that SMC ’97 participants having completed theprogramme and having positive feelings about it, have somewhat rosy memories of theirlevels of expectations, or conversely that the SMC ’99 participants are marginally morecynical or are less sure of how things are going to work out with the projected inflow ofa further 6,500 new employees at the end of 1999 following their merger with Gist-Brocades.
4.3.3. LEARNING EXPECTATIONS
The responses to the question on how much the participants expected to learn wereequally positively skewed, and the open-ended questions showed most participantsmade a direct linkage with their future participation in the Business Strategy Dialogue(BSD). But many emphasized that the learning goals were far wider than just the BSD.
4.3.4. THE APPLICATION OF WHAT THEY HAVE LEARNED
The results were again positively skewed. Participants from SMC ’97 scored 3.11 andSMC ’97 gave a 3.07 rating for the “short-term” and 3.55 for the longer-term. Whenasked how they applied the learning, it was not surprising that the BSD received themost mention. When asked if they wanted to use the skills they had learned, the SMCscore was a positive 3.11 and SMC ’99 a 3.47. One can likewise hypothesise that themore you have already applied what you have learned, the less charged up you are aboutyour desire to do so!
4.3.5. THE PARTICIPANT/MANAGER DIALOGUE
Managers are supposed to meet with the participants they send to an SMC, both beforeand after the programme – however, only 17.9% of the SMC ’97 participants rememberattending a briefing session, and 32.1% a debriefing session. 80% of the participants atSMC ’99 state that they “intend” to have a discussion with their manager. The problemlies with the managers, but DSM can be comforted that other organisations suffer thesame problem, which conceptually must weaken the potential ROI of the training effort.
The ROI of Management Training and Development 73
4.3.6. THE KIRKPATRICK MODEL
4.3.6.1. LEVEL ONE – REACTION AND PLANNED ACTION
The participants felt well-informed beforehand about the SMC they attended (3.79 on a5-point scale). They felt the programme workload was about on target (3.1), which isthe desired level for managers. When it is lower they fret that they are wasting theirvaluable time!
The “social” parameters (accommodation, food, organisation, etc.) all rated above target– with “relaxation” under target. The “catch-all” overall satisfaction rating scored 4.7immediately after the SMC, and 4.5 after a period of 6 months, which is pleasinglystable. These high ratings are perhaps helped by the high ratings that the participants’managers give on their own earlier SMC experience, and the feelings of those managers,who for one reason or another had not attended an SMC and who felt they had missedout on a significant “aculturation” process.
4.3.6.2. LEVEL TWO – LEARNING
The questionnaires tackled three key indicators:
• “I understand the factors influencing the competitiveness of my business”.• “I am able to evaluate my own business in terms of competitive analysis, strategic
options, key success factors and performance indicators”.• “I am able to participate ‘up-to-par’ in the Business Strategy Dialogue of my
business”.
All of these three items met the level 4.0 target, with the ratings immediately after theevent and six months later being remarkable stable. Open-ended questions containreferences to things learned in addition to factors tracked in the closed items.
The ROI of Management Training and Development74
4.3.6.3. LEVEL THREE – APPLICATION TO THE JOB
The information used for this analysis was obtained from interviews made with theparticipants from SMC ’97 and questionnaires collected from their managers and theSMC ’99 questionnaires. Since some participant/manager pairs are incomplete, theanalysis was made at the group level only.
The Socio-Behavioural AspectsThe SMC was not specifically aimed at influencing participant behaviour. DSM hadother programmes targeting such an objective. It was decided though to ask both theparticipants and their managers to rate a variety of traits on a four-point scale:
1. I/he absolutely do/does not possess the trait.2. I/he hardly possess/possesses the trait.3. I/he possess/possesses the trait to some extent.4. The trait is one of my/his stronger points.
The SMC ’97 participants and their managers were asked to give a pre and post-courserating, and were asked to give a different rating if they felt there was a change inbehaviour, however small it might have been. The logic behind this was that theresearch was looking for the presence of a change not to evaluate the extent of thechange. The choice of a four-point scale meant that the increments from one rating toanother are huge steps. A larger eight or ten-point scale would have been a moresensitive instrument.
When this data was analysed together with a similar pre-course rating made by theparticipants of SMC ’99, it was decided not to pursue it further, as almost all ratings fellinto the 3 and 4 category. Since the traits selected for analysis were essentially thosebehaviours managers were supposed to exhibit -–this is maybe not very surprising! Theexpectations that behavioural change would occur (and this change measured) wereprobably too high. It was reckoned that if both the participants and their managersrecorded a 25% change on a particular trait, then this would indicate that the SMC hadhad a significant change on the trait in question.This assumption that such a huge swing should occur for all the participants on a scalethat was already severely skewed, was obviously wide of the mark. None of the traitsreceived a zero improvement score from all the participants, so some changed in onetrait, and some in another, but never in such numbers that it be concluded a tidal changehad swept through the participants’ behaviour!
The inclusion of a control group and probably a more sensitive measurement tool wouldhave been necessary to chart the impact of the SMC on the socio-behaviouralcharacteristics of the participants. There are some cynics who believe that five daysspent in the corporate chateau are unlikely to achieve a dramatic “conversion on the roaddo Damascus” – life-time managerial behaviour tends to be remarkably stable, and it isdifficult “to teach old dogs new tricks”!
The ROI of Management Training and Development 75
The Cognitive Aspect
The managers were asked to respond to a closed item “my employee has moretheoretical knowledge about strategy (in general) and strategic decisions now that he hasparticipated in the SMC”. The 4-point response scale varied from “completely agree”(4) to “completely disagree” (1). 22 mangers responded positively, three negatively andfour did not answer, and the mean score was 2.92, which failed to meet the 3.0 targetthat was hoped for, but was still a positive rating.
To measure the cognitive learning of the participants attending SMC ’97 and those whowould attend SMC ’99, they were given a business situation and asked to evaluate it –the assumption was that SMC ’97 participants having attended the programme wouldscore higher.
The French Factory Purchase Case
“You are the business director of one of DSM’s business groups. One of your managerscomes with a proposal to buy a competitor’s plant in France that for some reason thecompetitor is eager to dispose of. Before making the decision to buy the plant or not,you need to gather some information. Name five pieces of information that you think isuseful to obtain.”
The pre-cursor to SMC, a programme called “Impact” designed by IMEDE in Lausanne(as was the SMC) had emphasized the importance for DSM managers to focus on thefive “C’s” – Company, Customer, Competition, Costs and Context. The interviewrespondents were given a point each time one of these “C’s” was mentioned, and anadditional 0.5 points for a second reference. The mean scores of the SMC ’97 and ’99populations were then to be compared.
In fact, this data was not included in the study. The interviewer frequently had toexplain the questions to those being interviewed, which meant that the data of thosewhose input was gathered only by questionnaire and not through the interview format,was in all probability suspect! In addition, some respondents were unwilling to provideinformation on themselves, which might have put them in a negative light, though theconfidentiality of the data collection process had been guaranteed to them. It was alsoclear that some respondents had also replied only in a most cursory manner.
The measurement of the cognitive learning on the socio-behavioural aspects of theprogramme was, therefore, abortive and a different approach would have been neededeventually.
What can we conclude about what the participants used from what they learned?Different participants learned different things that modified their behaviour on this orthat specific behavioural trait, but no overall general change on any single trait wasproven.
On some items there were significant differences between the post-SMC ’97 and pre-SMC ’99 participants, showing that the former – especially on the Key Success Factorsand Performance Indicators items – had learned something, and were using thisknowledge to provide their answers.
The ROI of Management Training and Development76
The SMC ’97 population also seemed more “customer” and “competition” focused, butthe data is not conclusive that this difference results from the “training” and not theexperience gained since the training! This is the inevitable handicap of having to “retro-fit” a measurement process! Although hard evidence is lacking, the participants“claimed” they learned and used what they learned, and their reactions especially fromthe open format “write-in” comments sections were overwhelmingly positive. In theScottish courts, there is a verdict of “not proven”, which implies that what was claimedin all probability happened, but not beyond the level of doubt to be a certainty. This isprobably the SMC verdict for Kirkpatrick’s level three measurements!
4.3.6.4. LEVEL FOUR – BUSINESS RESULTS
SMC ’99 participants and their managers were asked a raft of closed and open endedquestions designed to measure the effect of SMC on the business results of DSM onvarious dimensions:
• Have the business results been impacted?• Have the number of poor decisions decreased?• What monetary benefit level would you assign to the SMC training?• What other benefits were achieved?
75% of the participants responded that they thought their training had had a positiveeffect on DSM’s results – 25% noted there had been an impact, but were not willing togo so far as to state a measurable impact had occurred. Their managers though, werenot nearly as positive. Many were not willing to give any response, maybe because theywere asked to give concrete examples to back up their judgements. Several managersresponded that in their opinion the impact of the SMC training on business results couldnot be measured! The jury is “out”.
Although, almost 20% of the participants were unable to evaluate whether the SMCtraining had improved their decision-making process (“fewer poor decisions”), 80% ofthose responding felt it had to varying degrees, largely on account of what theyperceived as their improved “strategic thinking”. Once again, their managers were lesspositive splitting almost equally between those who though a positive impact had beenachieved and those who disagreed.
About 20% of the managers did not respond to the question, and the reasons given bythose that did reply, to justify their answer, were so disparate as to defy any significantanalysis. The jury is still “out” – but the nature of the enquiry itself based on a “whatif…” hypothesis probably determines the difficulty of reaching a solid conclusion.
The differences between the responses of the participants and their managers was alsoequally marked on the question of the monetary benefit of the SMC to DSM. They areasked to respond to a four-point benefit scale:
The ROI of Management Training and Development 77
Monetary Benefit for Participants (2 Dutch Florins is approx. 1 US Dollar)
• Less than 1,000 Dutch Florins per annum• 1,000 – 5,000 Dutch Florins• 5,000 – 25,000 Dutch Florins• More than 25,000 Dutch Florins per annum
75% of the participants responded in the 4th category, with estimates varying from25,000 Dutch Florins to ten times this figure. The next largest vote was for the 3rd
category. Although, a majority of the managers also plumped for the 4th category, theirresponses were spread more evenly over the four categories, but many chose not to offeran answer. For calculating the ROI, a monetary benefit of 25,000 Dutch Florins will betaken as the most realistic estimate. On reflection, the scale was too reduced, and theresults therefore too skewed, as a small pre-test would have shown.
When asked what other benefits had accrued from participating in the SMC, mostcomments cited the importance of “social networking”, and the creation of a commonlyagreed “strategic language”- both key factors in facilitating the decision-making processby minimising personal or procedural roadblocks.
In conclusion, although every effort was made to qualify and even quantify the impactof SMC on the business results of DSM, the response is not entirely satisfactory. All theindicators though are pointing in the same direction, underpinning the positive “gutfeeling” especially of the participants themselves, and to a lesser extent their managers.
4.3.6.5. LEVEL FIVE – RETURN ON INVESTMENT
The Benefits of the SMC
It was decided to take two values – one the average of all the responses on the monetarybenefit scale, which was 19,307 Dutch Florins per head (8,761 Euros) – and the otherthe amount most cited 25,000 Dutch Florins (11,344 Euros).
The Costs of the SMC
It was decided to take two values again – one including the development costs and theother without them.
The overall SMC training costs including participant salaries were calculated at 352,117Dutch Florins (159,784 Euros). Rather than attempt to evaluate the development costsof a nine-year old programme, it was decided to take a surrogate – a similar and recentprogramme, which had cost 200,000 Dutch Florins (90,756 Euros). It was also decidednot to amortise the SMC development costs over nine, a dozen, or whatever number ofprogrammes – but include them as a one-off cost (this is not the usual procedure!). TheSMC costs including these development costs were therefore calculated at 552,117Dutch Florins (250,540 Euros).
The ROI of Management Training and Development78
The ROI Calculations
Since two monetary benefit values and two cost estimates have been taken, there arefour basic calculations. It was also decided to calculate both the:
Cost/Benefit Ratio (Programme Benefits/Programme Costs)ROI % Programme Benefits – costs/costs x 100%
The Director of Corporate management Training had set a 20% ROI target for the SMC.
Costs without DevelopmentCosts352,117 Dutch Florins
Costs with Development Costs552,117 Dutch FlorinsBenefit
(27 Participants)Calculations Calculations
19,307 Dutch Florinsper participant
521,289 Dutch Florins
CBR = 521,289352,117
ROI = 521,289 -352,117
352,117
1.48
48.0%
CBR = 521,289552,117
ROI = 521,289 -552,117
552,117
0.94
-5.6%
25,000 Dutch Florinsper participant
675,000 Dutch Florins
CBR = 675,000352,117
ROI = 675,000 -352,117
352,117
1.92
91.7%
CBR = 675,000552,117
ROI = 675,000 -552,117
552,117
1.22
22.2%
In conclusion, only in the case of taking all the development costs on a one-off basis,and the more conservative monetary benefit figure, is the 20% ROI target not met.Since nine SMC’s have already been completed, it would be more normal to amortisethe development costs over ten or a dozen programmes, and also deflate the “surrogate”current development costs to achieve a more accurate estimate of the original SMCdevelopment costs.
It is safe therefore to conclude that the SMC achieves its ROI target comfortably – forthose purists, who still consider that hard proof is lacking, they should be “satisfied withthe evidence if proof is not possible” (Kirkpatrick 1994). DSM has accumulated andanalysed an impressive body of evidence!
The ROI of Management Training and Development 79
5. CONCLUSIONS AND RECOMMENDATIONS
5.1. THE KIRKPATRICK THEORY
The decision to take Kirkpatrick’s theory as the basis for the efmd/EC ROI study was a“given” for DSM. It would have been interesting to include some work on Kaufman’slevel five, in which he focuses on the societal outcomes of a performance improvementprogramme, such as SMC and the impact it has on the environment surrounding theorganization.
5.2. THE METHODOLOGY
• The literature on ROI is mostly very theoretical, and it would have been helpful tohave had more practical examples, pointers, tips, etc. to facilitate the measurementprocess and avoid (what in retrospect were) some of the problems linked tocollecting and analysing valid data.
• It is difficult to bolt on an evaluation process to an “up and running” programme.SMC ’98 had just finished and SMC ’99 was too late for post-testing to meet theefmd/EC project deadlines. The message is, design the evaluation process alongwith (or even before) the programme itself!
• Whenever it is at all possible, use a “control” group – this avoids all the gymnasticsDSM were forced to engage in, and the weakness inherent in any “after-only”design. With participants drawn from the widest possible intake – nationality,function, etc. – it is also always difficult to extrapolate data from one singleprogramme and claim the findings would be replicated in other programmes.
• Using different data- collection techniques for SMC ’97 and SMC ’99 (interview vs.questionnaire) is obviously not ideal and could have caused some bias in the datacollected. Given the circumstances, however, it was the only viable option.
5.3. THE RESULTS
The results satisfied the general thesis – “Is the SMC effective according to theobjectives of the programme, and are the cognitive and socio-behavioural learningobjectives met?”
• SMC Participant Perceptions and Reactions (level One)
90% of the managers polled were enthusiastic about the SMC, which obviously gave apositive signal to the participants. 80% of the participants would have liked to discussthe SMC both before and after attending the course, and many were disappointed not tohave had this opportunity, which was a requirement stipulated by the CorporateManagement Training department.
The ROI of Management Training and Development80
Both the participants and their managers rated the SMC higher than the pre-setsatisfaction targets on all aspects of the programme (both at the end and six monthsafter) – so satisfaction was not a negative drag on any eventual ROI calculations!
• Learning
The direct desired outcome of the learning – the ability to participate “up to par” in theBusiness Strategy Dialogue (BSD) was positively rated both immediately after the SMCand six months later. However, it is only a post-experience rating, which cannot becompared against a pre-training one or against a “control”.
• Application to the Job
Although the socio-behavioural traits measured show evidence of some change, takingall the participants as a group, no individual participant was judged to have achieved adramatic “conversion” as a result of having participated in the SMC. Part of theproblem is that participants to be nominated for the programme already belong to the“elite” membership, which requires high scores on the traits selected for measurement,so their scores were likely to be already “skewed” on the scale – the other cause is thatthe scale itself was not actually sensitive enough to measure “change”. Some of therespondents – both participants and managers thought it was a nonsense to attempt tomeasure such things, as they thought that training could not impact socio-behaviouralfactors.
The cognitive learning achieved is less in doubt according to the vast majority of themanagers polled, who reckoned their participants had increased their theoreticalknowledge about strategy and strategic decision-taking as a result of having attended theSMC. The participants agreed, but surprisingly the participants from the more recentSMC ’99 scored higher than the earlier SMC ’97. This was probably due to the fact thatone set of data was collected by questionnaire and the other through interviews, so thecomparisons are not “clean” – but there is also the problem of judging the impact of alearning event long after it occurred – was the learning achieved by the training or by thepost-training experience, or as is most likely, both and in what proportion! Again,without a “control” group, we are left guessing.
The attempts to measure learning by putting the participants through a series of cases –what criteria to use in buying a plant in France, organizing a Business StrategyDialogue, developing Key Success Factors for a business group and their correspondingperformance indicators were both an original and successful initiative, with the SMC’97 graduates out-scoring the pre-SMC ’99 participants. Since a lot of the data wasobtained from open-ended questions – the responses were independently rated by two ormore persons to increase the reliability of the scores.
The efforts to get the participants to give examples of good and poor decisions they hadmade, so the role of the SMC could be judged, on improving the quality of decision-making was less successful.
In spite of the promise of confidentiality, participants were not prepared to be frankabout their failings, even in an interview format. It was decided after polling the SMC’97 participants not to proceed with the SMC ’99 group using the questionnaire format.Again, it was realized how important it is to use the same data collection methodology.
The ROI of Management Training and Development 81
• Business Results
The majority of the participants and managers, when asked to evaluate the monetarybenefit of the SMC, selected the response at the top of the scale – a 25,000 DutchFlorins improvement or more. Unfortunately, the scale did not go high enough toprovide a “true” average – so a 25,000 Dutch Florins ceiling was taken, which naturallydepresses the ROI results.
On the positive side though, the large consensus that a monetary benefit accrued, wasbacked by the other indicators.
• The Return on Investment
Two monetary level indicators – the “average” and the 25,000 Dutch Florins limit on thescale were included, together with two cost indicators for the training (with and withoutdevelopment costs), and the corresponding ROI figure calculated. The results showedthat there was every indication that the ROI target of 20% had been reached – only inthe case of assigning all the development costs against a single SMC was this not foundto be the case – but since nine SMC’s have already been held, this is not really a realisticscenario! All the evidence points towards a most healthy Return on Investment for theSMC – only the ultimate and definitive proof is missing”!
The ROI of Management Training and Development82
CASE STUDY IV: REPSOL
1. BACKGROUND
At the beginning of 1998, Federico Galán – the Director of Corporate Training forRepsol – selected a training project that had just started in their logistics subsidiary –CLH – as Repsol’s contribution to the efmd/EC ROI project.
Repsol is a large Spanish petroleum company with about 30% of the petrol stations inSpain. These petrol stations can either be:
• company-owned and company-operated (COCO)• company-owned and dealer-operated (CODO)• dealer-owned and dealer-operated (DODO).
Dealers typically sign up for a ten to fifteen-year franchise agreement to buy Repsolproducts and use the Repsol brand name.
CLH is Repsol’s logistics business that is responsible for:
• the transport by pipeline or other means and storage of petroleum products(5refineries and 30 storage depots);
• the chartering of tankers leased to transport the petroleum to Spain– about half ofthese ships are leased from foreign companies;
• the delivery of petroleum products to Repsol clients via their own road transporttanker fleet (250 vehicles);
• the technical services provided to the service stations - the design, construction,modification, maintenance and sale of pumps and other equipment.
CLH has a price advantage on petroleum products compared to the competition. Onlylimited revenue and profits are generated by the technical service departments. CLH isunique in that it offers a nation-wide service on the complete service station productline. Its prices are competitive and it is the only organisation to offer an emergencyservice and a tamper-proof security control offering. CLH has a market share of over30% and has been able to offer lower retail prices as a result of cost efficiencies drivenby economies of scale.
The technical services department has 52 employees – 40 technicians and 12administrative staff. The technicians, who average over twenty-five years length ofservice with the company, maintain some 5,500 petrol pumps spread over some 1,800petrol stations extended right across the length and breadth of Spain in each one of itsfifty-something provinces.
The conversion of the traditional petrol station into a wider retail point of sale not onlyfor automotive products, but also those in the food, drink, reading and entertainmentmarkets, has obliged CLH to take a hard look at how they have been managing theirtechnical services business.
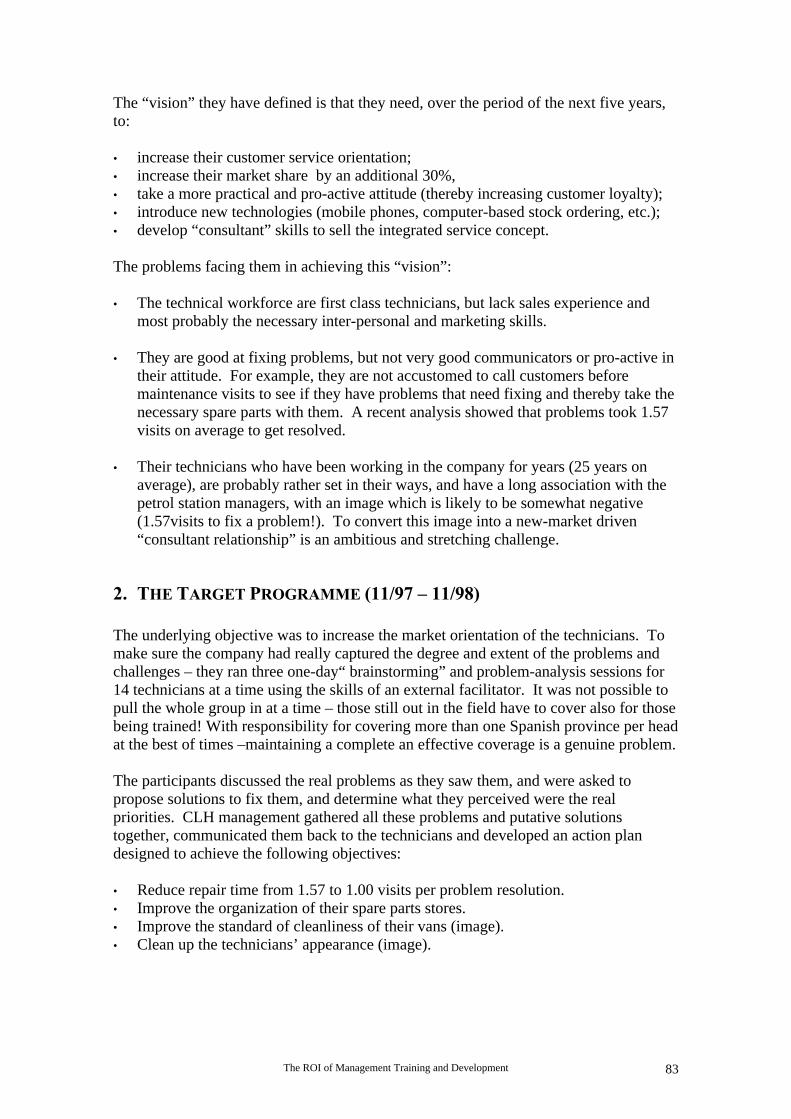
The ROI of Management Training and Development 83
The “vision” they have defined is that they need, over the period of the next five years,to:
• increase their customer service orientation;• increase their market share by an additional 30%,• take a more practical and pro-active attitude (thereby increasing customer loyalty);• introduce new technologies (mobile phones, computer-based stock ordering, etc.);• develop “consultant” skills to sell the integrated service concept.
The problems facing them in achieving this “vision”:
• The technical workforce are first class technicians, but lack sales experience andmost probably the necessary inter-personal and marketing skills.
• They are good at fixing problems, but not very good communicators or pro-active intheir attitude. For example, they are not accustomed to call customers beforemaintenance visits to see if they have problems that need fixing and thereby take thenecessary spare parts with them. A recent analysis showed that problems took 1.57visits on average to get resolved.
• Their technicians who have been working in the company for years (25 years onaverage), are probably rather set in their ways, and have a long association with thepetrol station managers, with an image which is likely to be somewhat negative(1.57visits to fix a problem!). To convert this image into a new-market driven“consultant relationship” is an ambitious and stretching challenge.
2. THE TARGET PROGRAMME (11/97 – 11/98)
The underlying objective was to increase the market orientation of the technicians. Tomake sure the company had really captured the degree and extent of the problems andchallenges – they ran three one-day“ brainstorming” and problem-analysis sessions for14 technicians at a time using the skills of an external facilitator. It was not possible topull the whole group in at a time – those still out in the field have to cover also for thosebeing trained! With responsibility for covering more than one Spanish province per headat the best of times –maintaining a complete an effective coverage is a genuine problem.
The participants discussed the real problems as they saw them, and were asked topropose solutions to fix them, and determine what they perceived were the realpriorities. CLH management gathered all these problems and putative solutionstogether, communicated them back to the technicians and developed an action plandesigned to achieve the following objectives:
• Reduce repair time from 1.57 to 1.00 visits per problem resolution.• Improve the organization of their spare parts stores.• Improve the standard of cleanliness of their vans (image).• Clean up the technicians’ appearance (image).
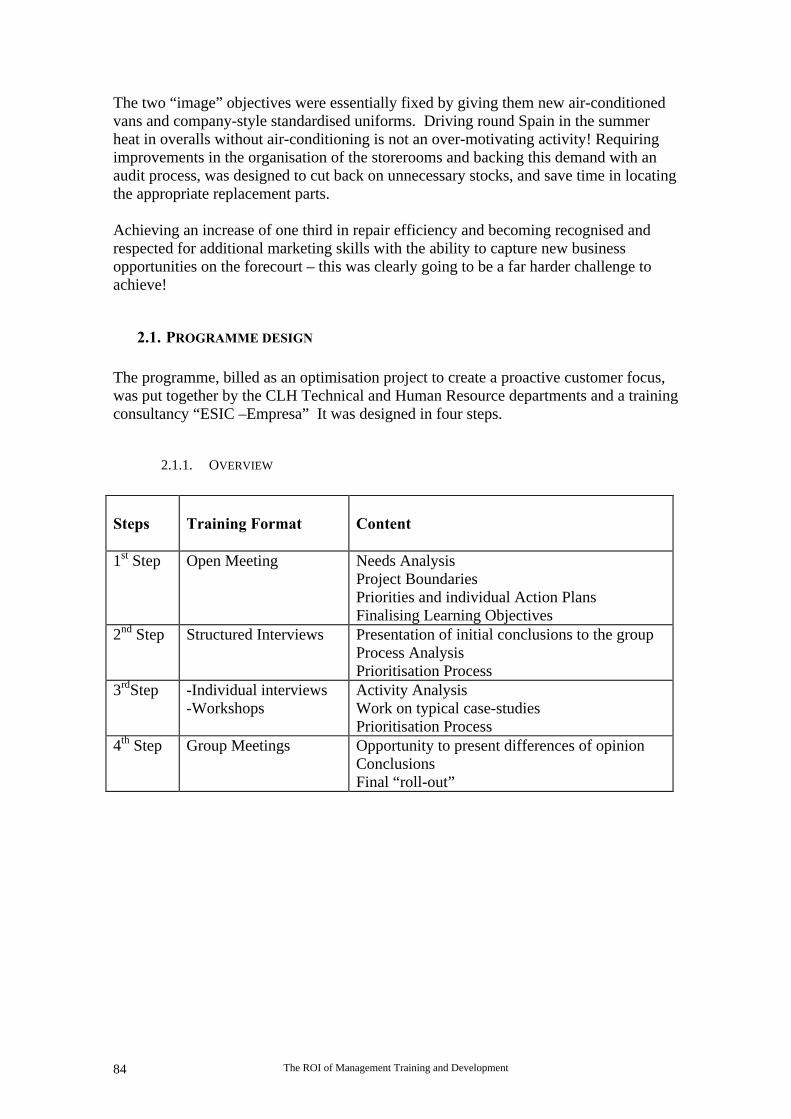
The ROI of Management Training and Development84
The two “image” objectives were essentially fixed by giving them new air-conditionedvans and company-style standardised uniforms. Driving round Spain in the summerheat in overalls without air-conditioning is not an over-motivating activity! Requiringimprovements in the organisation of the storerooms and backing this demand with anaudit process, was designed to cut back on unnecessary stocks, and save time in locatingthe appropriate replacement parts.
Achieving an increase of one third in repair efficiency and becoming recognised andrespected for additional marketing skills with the ability to capture new businessopportunities on the forecourt – this was clearly going to be a far harder challenge toachieve!
2.1. PROGRAMME DESIGN
The programme, billed as an optimisation project to create a proactive customer focus,was put together by the CLH Technical and Human Resource departments and a trainingconsultancy “ESIC –Empresa” It was designed in four steps.
2.1.1. OVERVIEW
Steps Training Format Content
1st Step Open Meeting Needs AnalysisProject BoundariesPriorities and individual Action PlansFinalising Learning Objectives
2nd Step Structured Interviews Presentation of initial conclusions to the groupProcess AnalysisPrioritisation Process
3rdStep -Individual interviews-Workshops
Activity AnalysisWork on typical case-studiesPrioritisation Process
4th Step Group Meetings Opportunity to present differences of opinionConclusionsFinal “roll-out”

The ROI of Management Training and Development 85
In organisational competency terms, the programme was designed to achieve threefundamental goals:
• To improve the service quality and the image perceived by the customers• To change the “technical” mentality of the technicians towards that of a marketeer
able to achieve high levels of added value.• To change what was essentially a reactive to a pro-active attitude to problem-
solving.
2.1.2. FORMAT OF THE INDIVIDUAL ACTION PLANS (STEP 1)
Objective
From an initial auto-evaluation process, individuals were asked to consider thefollowing points:
• What do I need to change or improve?• What benefits will the changes bring me?• What do I have to do?• How am I going to start?• When am I going to do it?• How am I going to measure the results?
Implementation
• Fix quantified plans and milestones• Establish follow-up procedures (if thought necessary)
Timetable
• Kick-off meetings – 11/97 (3 groups)• Presentation of results/conclusions – 2/98 (3 groups)• Pre-evaluation – 3/98• Action plan period – 04/98 to 09/98• Post-evaluation – 10/98• Conclusions/further improvements – 12/98
Programme Costs
- Direct Costs 818,000 Pesetas- Consultant Costs 974,000 Pesetas
1,792,000 Pesetas
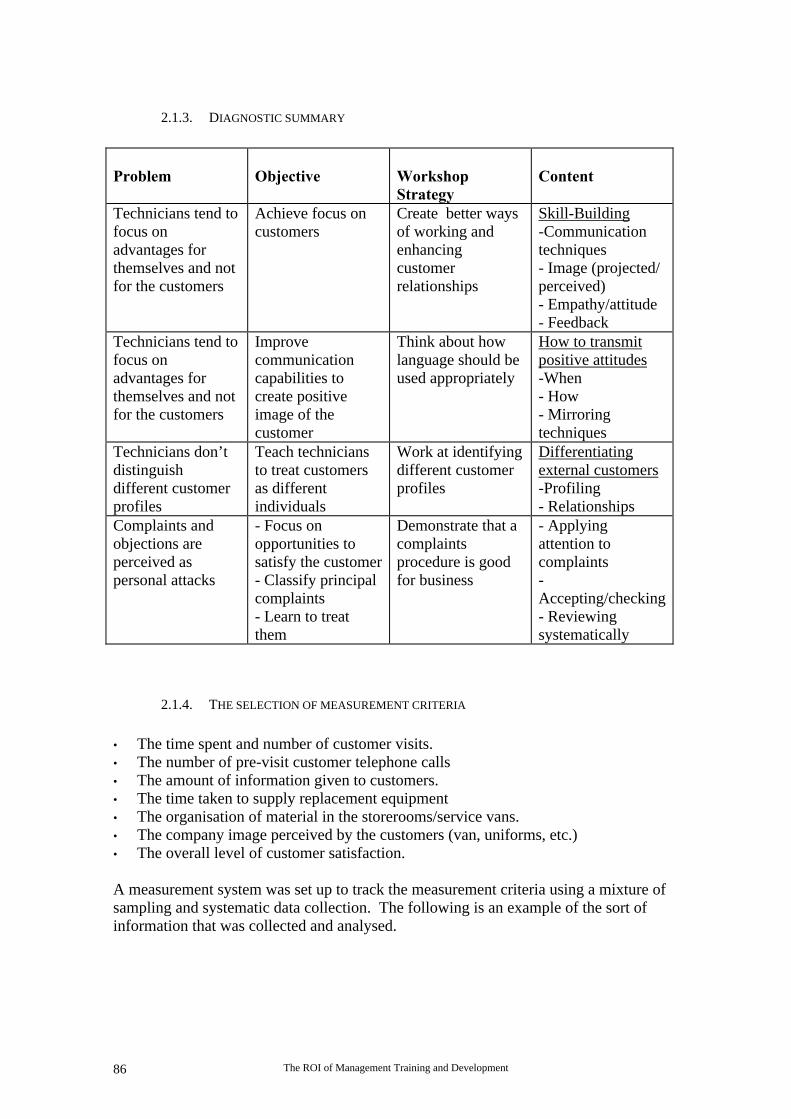
The ROI of Management Training and Development86
2.1.3. DIAGNOSTIC SUMMARY
Problem Objective WorkshopStrategy
Content
Technicians tend tofocus onadvantages forthemselves and notfor the customers
Achieve focus oncustomers
Create better waysof working andenhancingcustomerrelationships
Skill-Building-Communicationtechniques- Image (projected/perceived)- Empathy/attitude- Feedback
Technicians tend tofocus onadvantages forthemselves and notfor the customers
Improvecommunicationcapabilities tocreate positiveimage of thecustomer
Think about howlanguage should beused appropriately
How to transmitpositive attitudes-When- How- Mirroringtechniques
Technicians don’tdistinguishdifferent customerprofiles
Teach techniciansto treat customersas differentindividuals
Work at identifyingdifferent customerprofiles
Differentiatingexternal customers-Profiling- Relationships
Complaints andobjections areperceived aspersonal attacks
- Focus onopportunities tosatisfy the customer- Classify principalcomplaints- Learn to treatthem
Demonstrate that acomplaintsprocedure is goodfor business
- Applyingattention tocomplaints-Accepting/checking- Reviewingsystematically
2.1.4. THE SELECTION OF MEASUREMENT CRITERIA
• The time spent and number of customer visits.• The number of pre-visit customer telephone calls• The amount of information given to customers.• The time taken to supply replacement equipment• The organisation of material in the storerooms/service vans.• The company image perceived by the customers (van, uniforms, etc.)• The overall level of customer satisfaction.
A measurement system was set up to track the measurement criteria using a mixture ofsampling and systematic data collection. The following is an example of the sort ofinformation that was collected and analysed.
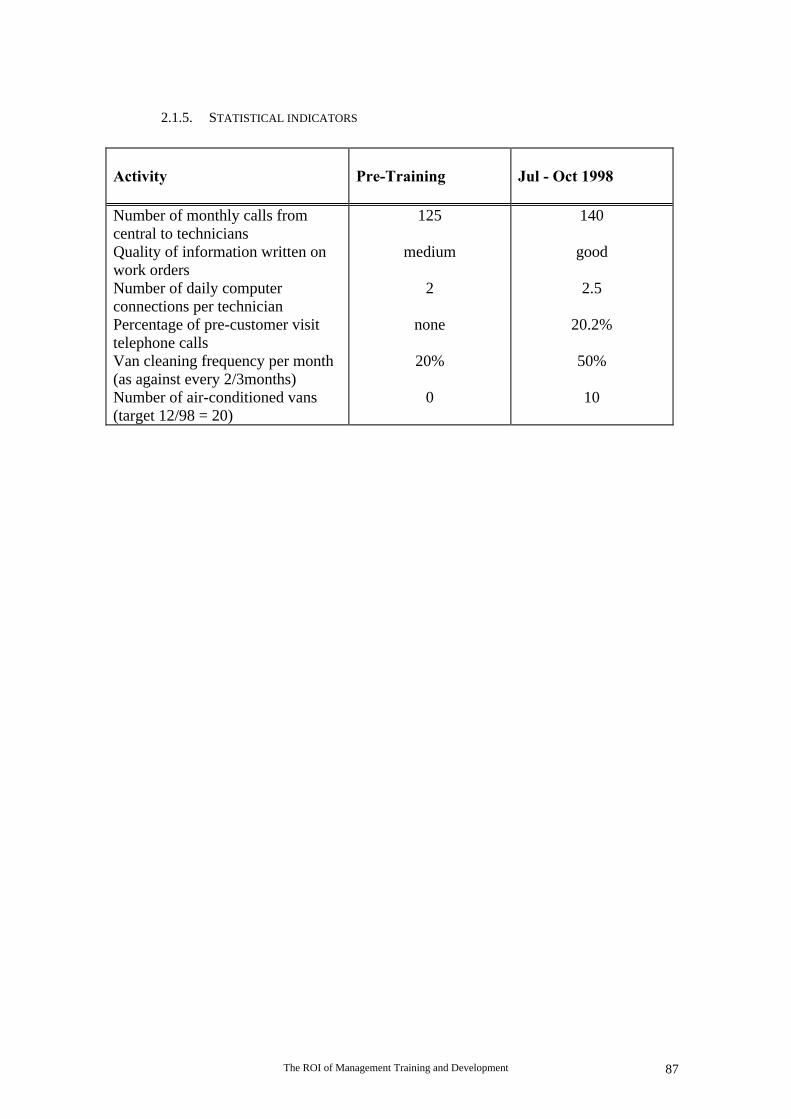
The ROI of Management Training and Development 87
2.1.5. STATISTICAL INDICATORS
Activity Pre-Training Jul - Oct 1998
Number of monthly calls fromcentral to techniciansQuality of information written onwork ordersNumber of daily computerconnections per technicianPercentage of pre-customer visittelephone callsVan cleaning frequency per month(as against every 2/3months)Number of air-conditioned vans(target 12/98 = 20)
125
medium
2
none
20%
0
140
good
2.5
20.2%
50%
10
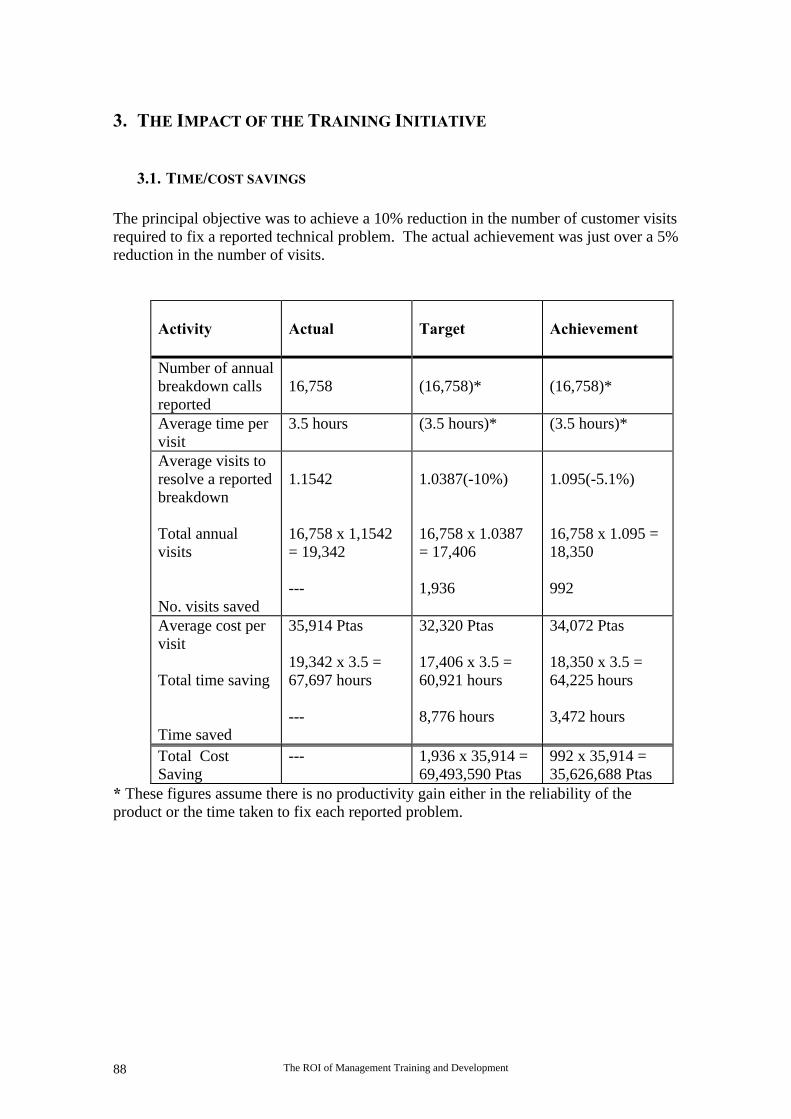
The ROI of Management Training and Development88
3. THE IMPACT OF THE TRAINING INITIATIVE
3.1. TIME/COST SAVINGS
The principal objective was to achieve a 10% reduction in the number of customer visitsrequired to fix a reported technical problem. The actual achievement was just over a 5%reduction in the number of visits.
Activity Actual Target Achievement
Number of annualbreakdown callsreported
16,758 (16,758)* (16,758)*
Average time pervisit
3.5 hours (3.5 hours)* (3.5 hours)*
Average visits toresolve a reportedbreakdown
Total annualvisits
No. visits saved
1.1542
16,758 x 1,1542= 19,342
---
1.0387(-10%)
16,758 x 1.0387= 17,406
1,936
1.095(-5.1%)
16,758 x 1.095 =18,350
992
Average cost pervisit
Total time saving
Time saved
35,914 Ptas
19,342 x 3.5 =67,697 hours
---
32,320 Ptas
17,406 x 3.5 =60,921 hours
8,776 hours
34,072 Ptas
18,350 x 3.5 =64,225 hours
3,472 hours
Total CostSaving
--- 1,936 x 35,914 =69,493,590 Ptas
992 x 35,914 =35,626,688 Ptas
* These figures assume there is no productivity gain either in the reliability of theproduct or the time taken to fix each reported problem.

The ROI of Management Training and Development 89
3.2. OTHER SIGNIFICANT RESULTS
3.2.1. CALL SYSTEM
Apart from the results already tabulated in the previous tables showing the number ofvisits saved and the resulting economies of both time and money, it is also interesting tonote that what probably drove these improvements more than any other factor was thesignificant behavioural change, which convinced the technicians to contact thecustomers they intended to visit prior to the actual visit. This now occurred in almosthalf the occasions (49.7%),whereas previously it had not been done to any level ofsignificance.
3.2.2. CUSTOMER SURVEY
The results of a customer survey on a range of questions in which a rating of 4 denotes“excellence” and a rating of 1“very bad”, also underpin the reasons for theimprovements achieved. The following is a typical example:
Activity Pre-InitiativeRating
Post-InitiativeRating
Relevan t information recorded ontechnician work sheets
2.2 3.3
In addition there were other indicatorswhich showed general productivityimprovements
No. pumps servicedNo. pumps serviced per technician
19989,969277
199912,640 (+26.8%)351
As in any new tracking system, the data collected throws up some interestingdiscoveries that obliged management to reconsider some of their original assumptions.
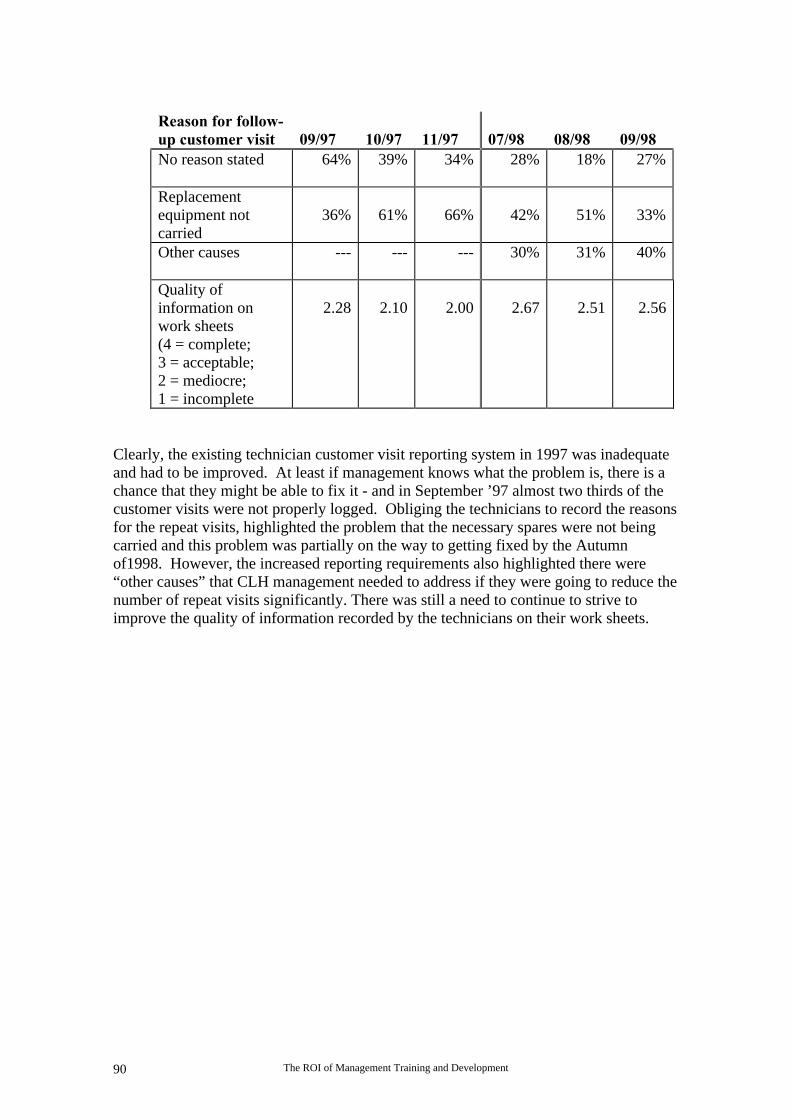
The ROI of Management Training and Development90
Reason for follow-up customer visit 09/97 10/97 11/97 07/98 08/98 09/98No reason stated 64% 39% 34% 28% 18% 27%
Replacementequipment notcarried
36% 61% 66% 42% 51% 33%
Other causes --- --- --- 30% 31% 40%
Quality ofinformation onwork sheets(4 = complete;3 = acceptable;2 = mediocre;1 = incomplete
2.28 2.10 2.00 2.67 2.51 2.56
Clearly, the existing technician customer visit reporting system in 1997 was inadequateand had to be improved. At least if management knows what the problem is, there is achance that they might be able to fix it - and in September ’97 almost two thirds of thecustomer visits were not properly logged. Obliging the technicians to record the reasonsfor the repeat visits, highlighted the problem that the necessary spares were not beingcarried and this problem was partially on the way to getting fixed by the Autumnof1998. However, the increased reporting requirements also highlighted there were“other causes” that CLH management needed to address if they were going to reduce thenumber of repeat visits significantly. There was still a need to continue to strive toimprove the quality of information recorded by the technicians on their work sheets.
The ROI of Management Training and Development 91
4. COMMENTS
At first sight, the Repsol case seemed somewhat marginal to the task of measuring theReturn on Investment of a large corporate Training and Development initiative. Thetraining element was extremely limited - the technicians were to be brought in for aseries of one-day meetings to analyse their problems, decide what course of action wasrequired and to plan and measure the results of these actions. It seemed a classic Kepnerand Tregoe approach.
Problem Analysis →→ Decisions Analysis →→ Action Analysis
It was more akin to a typical organisational development project designed to improveproductivity and hopefully develop a new and more productive role for those involved.Though it was clear that significant organisational improvements could be achieved byimproving management procedures and practices, it was felt that the “desired rolechange” would involve a far more ambitious behavioural training effort than Repsol hadplanned, and there were doubts that long-established client/service providerrelationships could be impacted as dramatically as Repsol intended, especially given theseniority and length of service of the incumbent technicians.
On reflection, however, it was clear that Repsol had decided to involve the techniciansin establishing and working through the agenda for their own “conversion”, rather thanimposing a solution on them. How effective the technicians will become as agents ofchange to deliver their enhanced marketeer/service provider mission - only time willshow.
The CLH initiative met the requirements of the efmd/EC ROI project -it was to be runwithin a tight time frame, for a reduced population with relatively easy measurementparameters. The pay-back achieved in the first year as a result of the initiative was35.63 million pesetas on an investment stated to be only 1.79 million pesetas. For the40+ technicians involved, this works out at a training cost of 44,750 pesetas a head(some£160+), which would seem to imply that not all the costs traditionally counted inthe total training bill are included (participant salaries ,travel costs, etc.)
It could also be argued that a new fleet of upgraded air-conditioned vans, mobilephones, new uniforms, etc. might have helped drive out some of the economiesachieved, even though their cost is not included, but others might claim these “hygiene”factors were more likely to have contributed only to the longer-term marketingobjectives.

The ROI of Management Training and Development92
The difficulty in attributing an ROI for the training element is that most of theimprovements were directly a result of management “getting their act together” andputting in a measurement and tracking system to deliver the required economies. Thetraining was important in that it persuaded the incumbents that they needed to change,incorporated their suggestions and criticisms of the existing management process, andavoided any of the negative “bunker” mentality reactions that “change” initiatives throwup if the psychological implications have not been properly thought through. In“quality” jargon, the training is a “cost of avoidance”, so it is difficult to attribute all thevalue of the return merely to the training element. On the same basis, it could beclaimed that the new air-conditioned vans helped to “sugar the pill” and achieveimproved organisational behaviour on a voluntary and no additional salary cost-basis!
The ROI of Management Training and Development 93
CASE STUDY V: THE BANK OF IRELAND
1. BACKGROUND
The Bank of Ireland was founded in 1783 and until 1942 it also served as the banker tothe Government in addition to its commercial activities.
After giving up its central bank role it grew rapidly in the late 50s and 60s, acquiring theHibernian Bank in 1958 and the Irish offices of the National Bank in 1966. In the 1970sit opened offices abroad, notably in New York, London, Frankfurt and Tokyo.
In the 1980s it embarked on a strategy of becoming a broadly-based Financial Servicesgroup both at home and abroad, acquiring a building society, life assurance companyand stockbroker. It also built up a major presence in the mortgage business. This wasconsolidated by the acquisition of the Bristol & West Building Society in 1997, bywhich time it had assets of IR £19 Billion and employed 10,755 employees world-wide.
The Bank of Ireland is now the largest financial services provider within Ireland andaims to be the market leader across a broad spectrum of activities e.g. Retail Banking,Insurance, Stockbroking, Investment Management etc. The Bank has a large network ofover 300 branches and over 40 business centres, which constitute its primarysales/service channel.
Within each sphere of activity, the Bank faces stiff competition. Whilst there is somedifferentiation on grounds of price and technology, the main emphasis is on service andrelationship building.
An extended period of extremely strong business growth has left the bank withextensive skill shortages, which coupled with a difficult recruitment market, have leftmanagement with no alternative but to develop existing staff by training andexperiential learning.
Vincent Dooley, the Chief Training and Development Manager was interested inincreasing the focus on the return that the Bank was achieving from its investment inTraining and Development. He attended the initial ROI pre-project briefing meeting setup by Alan Mitchell of efmd, and shortly after the project was officially launched set upanother meeting in Dublin on February 17, 1998 to kick off the Bank of Ireland’sparticipation in the efmd/EC ROI Project. This meeting was attended by Paul Paterson,who was shortly to succeed him, and two representatives from the Finance Department.Paul Paterson outlined the current T/D projects the Bank was engaged in.
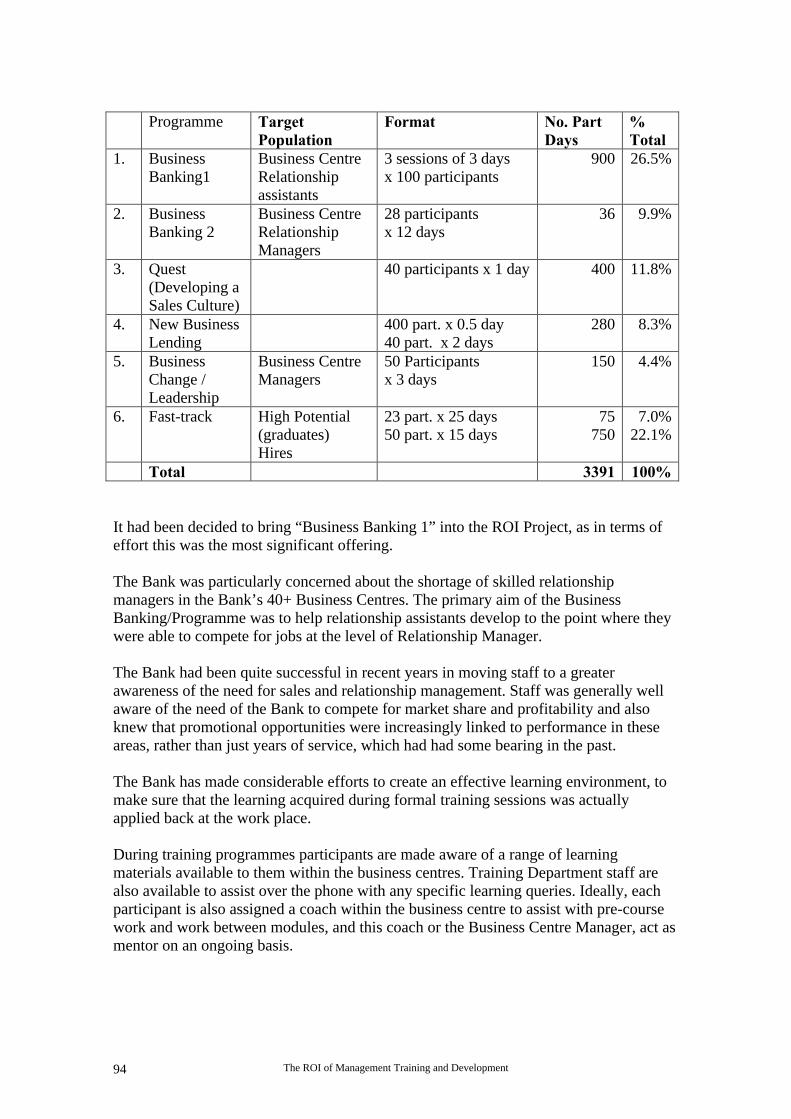
The ROI of Management Training and Development94
Programme TargetPopulation
Format No. PartDays
%Total
1. BusinessBanking1
Business CentreRelationshipassistants
3 sessions of 3 daysx 100 participants
900 26.5%
2. BusinessBanking 2
Business CentreRelationshipManagers
28 participantsx 12 days
36 9.9%
3. Quest(Developing aSales Culture)
40 participants x 1 day 400 11.8%
4. New BusinessLending
400 part. x 0.5 day40 part. x 2 days
280 8.3%
5. BusinessChange /Leadership
Business CentreManagers
50 Participantsx 3 days
150 4.4%
6. Fast-track High Potential(graduates)Hires
23 part. x 25 days50 part. x 15 days
75750
7.0%22.1%
Total 3391 100%
It had been decided to bring “Business Banking 1” into the ROI Project, as in terms ofeffort this was the most significant offering.
The Bank was particularly concerned about the shortage of skilled relationshipmanagers in the Bank’s 40+ Business Centres. The primary aim of the BusinessBanking/Programme was to help relationship assistants develop to the point where theywere able to compete for jobs at the level of Relationship Manager.
The Bank had been quite successful in recent years in moving staff to a greaterawareness of the need for sales and relationship management. Staff was generally wellaware of the need of the Bank to compete for market share and profitability and alsoknew that promotional opportunities were increasingly linked to performance in theseareas, rather than just years of service, which had had some bearing in the past.
The Bank has made considerable efforts to create an effective learning environment, tomake sure that the learning acquired during formal training sessions was actuallyapplied back at the work place.
During training programmes participants are made aware of a range of learningmaterials available to them within the business centres. Training Department staff arealso available to assist over the phone with any specific learning queries. Ideally, eachparticipant is also assigned a coach within the business centre to assist with pre-coursework and work between modules, and this coach or the Business Centre Manager, act asmentor on an ongoing basis.
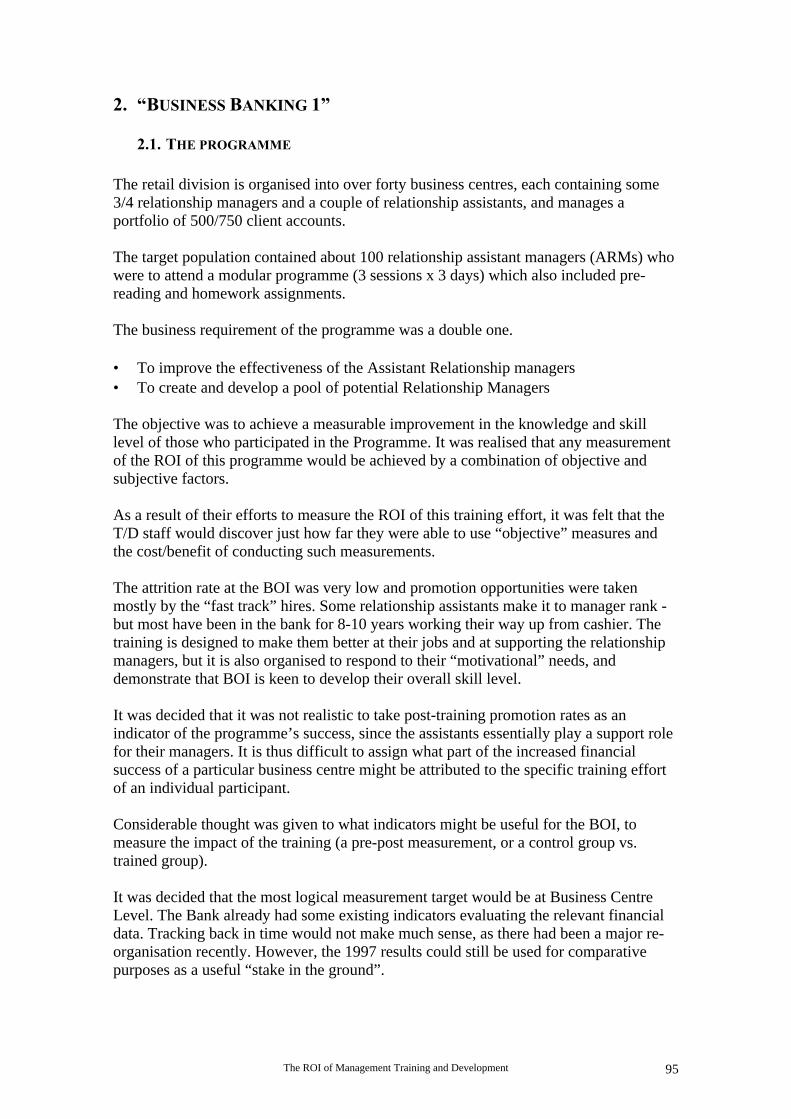
The ROI of Management Training and Development 95
2. “BUSINESS BANKING 1”
2.1. THE PROGRAMME
The retail division is organised into over forty business centres, each containing some3/4 relationship managers and a couple of relationship assistants, and manages aportfolio of 500/750 client accounts.
The target population contained about 100 relationship assistant managers (ARMs) whowere to attend a modular programme (3 sessions x 3 days) which also included pre-reading and homework assignments.
The business requirement of the programme was a double one.
• To improve the effectiveness of the Assistant Relationship managers• To create and develop a pool of potential Relationship Managers
The objective was to achieve a measurable improvement in the knowledge and skilllevel of those who participated in the Programme. It was realised that any measurementof the ROI of this programme would be achieved by a combination of objective andsubjective factors.
As a result of their efforts to measure the ROI of this training effort, it was felt that theT/D staff would discover just how far they were able to use “objective” measures andthe cost/benefit of conducting such measurements.
The attrition rate at the BOI was very low and promotion opportunities were takenmostly by the “fast track” hires. Some relationship assistants make it to manager rank -but most have been in the bank for 8-10 years working their way up from cashier. Thetraining is designed to make them better at their jobs and at supporting the relationshipmanagers, but it is also organised to respond to their “motivational” needs, anddemonstrate that BOI is keen to develop their overall skill level.
It was decided that it was not realistic to take post-training promotion rates as anindicator of the programme’s success, since the assistants essentially play a support rolefor their managers. It is thus difficult to assign what part of the increased financialsuccess of a particular business centre might be attributed to the specific training effortof an individual participant.
Considerable thought was given to what indicators might be useful for the BOI, tomeasure the impact of the training (a pre-post measurement, or a control group vs.trained group).
It was decided that the most logical measurement target would be at Business CentreLevel. The Bank already had some existing indicators evaluating the relevant financialdata. Tracking back in time would not make much sense, as there had been a major re-organisation recently. However, the 1997 results could still be used for comparativepurposes as a useful “stake in the ground”.
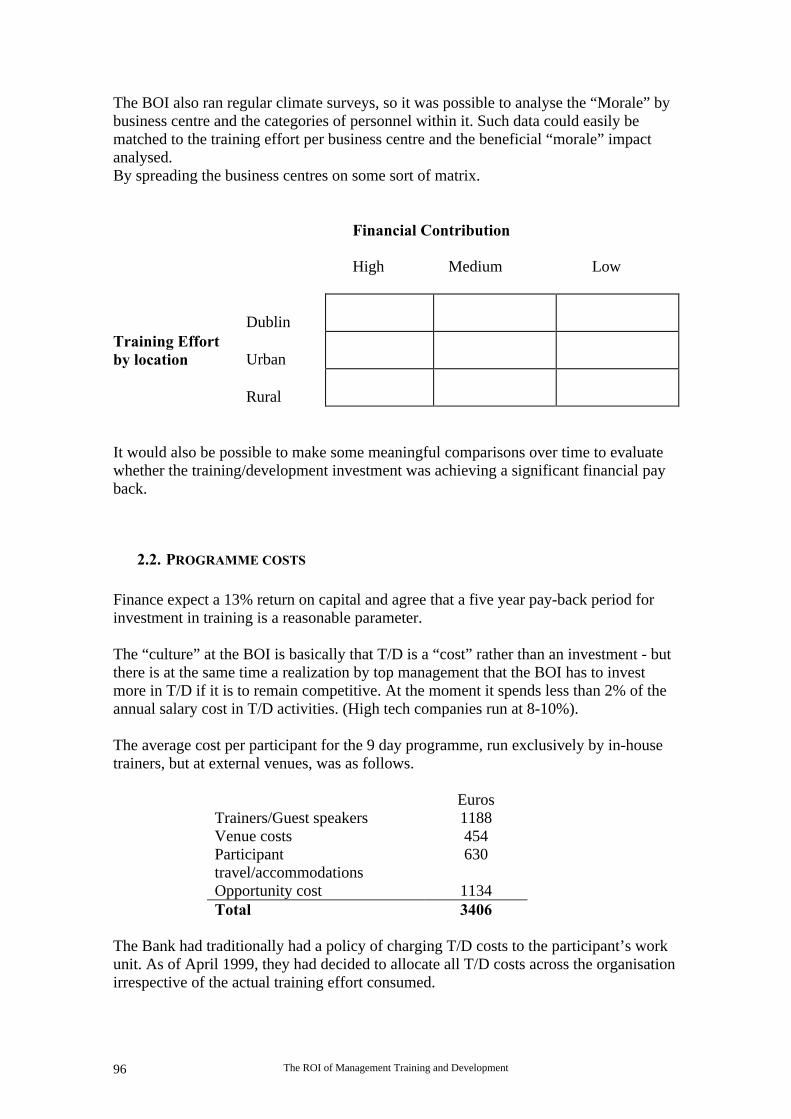
The ROI of Management Training and Development96
The BOI also ran regular climate surveys, so it was possible to analyse the “Morale” bybusiness centre and the categories of personnel within it. Such data could easily bematched to the training effort per business centre and the beneficial “morale” impactanalysed.By spreading the business centres on some sort of matrix.
Financial Contribution
High Medium Low
DublinTraining Effortby location Urban
Rural
It would also be possible to make some meaningful comparisons over time to evaluatewhether the training/development investment was achieving a significant financial payback.
2.2. PROGRAMME COSTS
Finance expect a 13% return on capital and agree that a five year pay-back period forinvestment in training is a reasonable parameter.
The “culture” at the BOI is basically that T/D is a “cost” rather than an investment - butthere is at the same time a realization by top management that the BOI has to investmore in T/D if it is to remain competitive. At the moment it spends less than 2% of theannual salary cost in T/D activities. (High tech companies run at 8-10%).
The average cost per participant for the 9 day programme, run exclusively by in-housetrainers, but at external venues, was as follows.
EurosTrainers/Guest speakers 1188Venue costs 454Participanttravel/accommodations
630
Opportunity cost 1134Total 3406
The Bank had traditionally had a policy of charging T/D costs to the participant’s workunit. As of April 1999, they had decided to allocate all T/D costs across the organisationirrespective of the actual training effort consumed.
The ROI of Management Training and Development 97
2.3. PARTICIPANT PROFILE
2.3.1. ENROLMENT CRITERIA
• Persons currently holding the job of Relationship assistant (or perhaps) juniorRelationship Manager in a Business Centre.
• Persons able to invest some of their own time to work outside the classroom (pre-course reading, case studies between modules etc)
2.3.2. MAJOR JOB RESPONSIBILITIES
• To assist Relationship Manager(s) in servicing the needs of a portfolio of businessclients
• Routine credit control management on a daily basis
• Research /interview preparation and follow-up as directed by the Relationshipmanager
2.3.3. INTERACTION
• Principally with the Relationship Manager, customers and the credit controldepartment.
2.3.4. SCOPE OF THE JOB
• A typical business centre would have 3/4 relationship Managers and 2/3Relationship Assistants managing a portfolio of 500/750 clients
2.3.5. EDUCATION LEVEL
• All participants would have completed second level education before joining theBank. Typically, they would be engaged in part-time study for qualifications (e.g.the Institute of Bankers)
2.3.6. AVERAGE TENURE IN POSITION
• On average participants would have worked for the Bank of Ireland for 8 to 10years, starting with basic branch duties. They would probably have been in theirpresent positions from one to two years.
2.3.7. AVERAGE SALARY
c. IR£18, 000 per annum on a scale progressing to IR£25,000
The ROI of Management Training and Development98
3. MEASURING THE RESULTS
3.1. PROGRAMME OBJECTIVE
To create a pool of potential relationship managers with the necessary skill levels in• Credit analysis techniques• Product knowledge• Actual selling techniques
It was decided to measure the output achieved by surveying both the participants andtheir managers with the focus on:
• The training process itself• The effectiveness of the training• The impact of the training
In addition to these major measurement objectives, specific questions would bedeveloped to verify
• The timeliness of the training effort• Whether or not the rationale for it had been adequately explained• The perceived incentive• Its relevance to the job• The effectiveness of the coaching• The available opportunities to put the learning into practice
The degree to which the Relationship Managers felt they were able to fully delegatetheir activities would also be measured, as would the increase in “cross sales”, and thenumbers of applications for promotion to Relationship Manager (both received andthose with a successful outcome).
3.2. SURVEY RESULTS
The feedback provided by the managers constituted the principal source of informationon the impact achieved and effectiveness of the training. They felt in general they couldfully delegate relationships for which they had previously been directly responsible. Insummary, the findings were that the participants showed evidence that they hadachieved:
• Improved “credit” decision-making• Improved customer retention• Increased “cross sales”• A “competitive distance”• An enhanced business banker profile
The ROI of Management Training and Development 99
The challenge, as ever, in any analysis of the ROI of T/D activities, is how to convertthe improved output into monetary values (that also takes into account the inadequaciesof the measurement process itself!)
The particular difficulties in measuring the benefits achieved by those who had attendedBusiness Banking 1 were:
• The learning was spread over 3 distinct modules over time• The actual opportunities to apply the learning and the effectiveness of the coaching
back in the workplace constitute the key determinants for success. Capturing thesevariables in a measurement process is not obvious.
• The range of benefits derived from the training are quite diverse• Not all the benefits are visible/measurable immediately
The feedback obtained showed that in general participants were enthusiastic about theexperience, even though they had encountered some problems with the content matter.The objective of establishing a coach for all the participants had not worked as well ashad been intended. There had also been some delays in getting participants through thethird and last module.
It was decided to reinforce the overall survey data with some “knowledge testing” at thebeginning and end of the Programme for the 50 participants following the Programme in1998/99. This was coupled with a comprehensive questionnaire completed by both theparticipants and their managers.
Even with this considerable effort and focus, the T/D management still felt that theywere a long way from “cracking the nut” of measuring how much of the learning benefit(and its related financial benefits), resulted from experiential practice and coaching ,rather than the formal training itself. They were also doubtful to what extent the “timelag” in the learning would corrupt the conclusions of their analysis.
3.3. EFFECTIVENESS MEASURES
An expert group was formed to attempt to apply a monetary value to the learningachieved by the participants. The key measurements they had to consider were asfollows:
• Test results showed an average improvement of 15%• 85% of the participants claimed they had achieved a significant improvement in
their competence to cope with the core Credit Analysis Requirements.• 70% of the participants claimed they had achieved a significant improvement in
their ability to outline key product features.
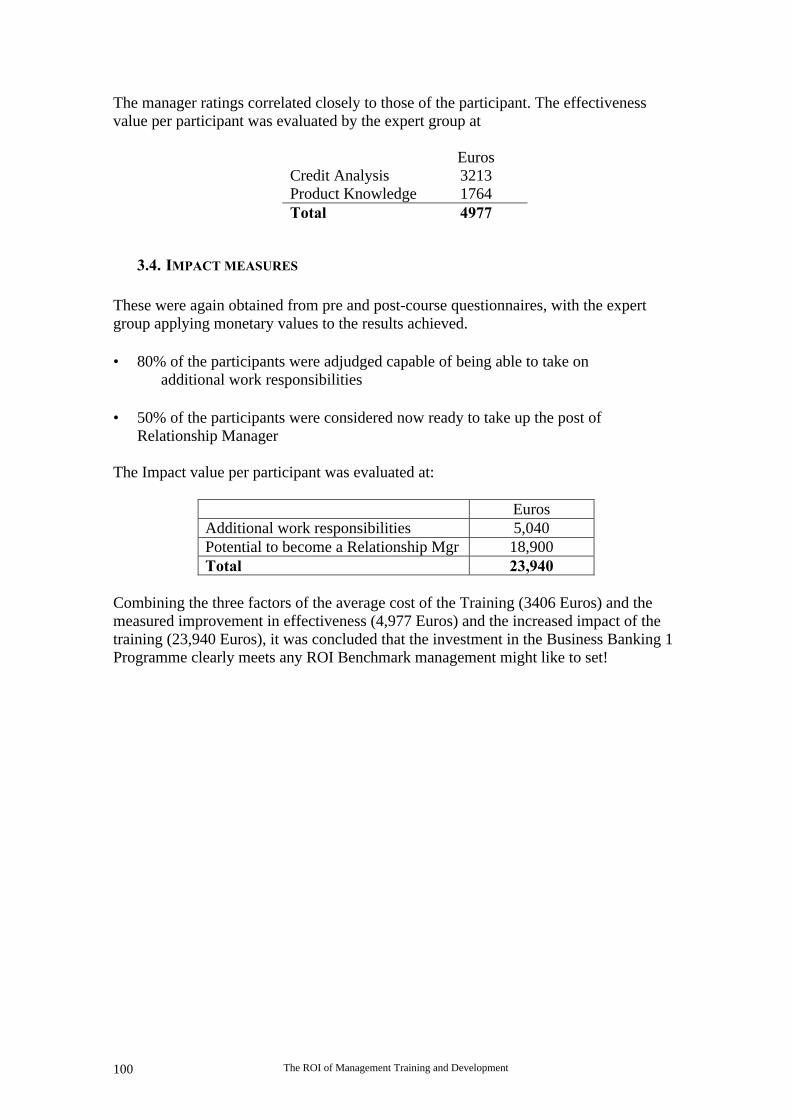
The ROI of Management Training and Development100
The manager ratings correlated closely to those of the participant. The effectivenessvalue per participant was evaluated by the expert group at
EurosCredit Analysis 3213Product Knowledge 1764Total 4977
3.4. IMPACT MEASURES
These were again obtained from pre and post-course questionnaires, with the expertgroup applying monetary values to the results achieved.
• 80% of the participants were adjudged capable of being able to take on additional work responsibilities
• 50% of the participants were considered now ready to take up the post ofRelationship Manager
The Impact value per participant was evaluated at:
EurosAdditional work responsibilities 5,040Potential to become a Relationship Mgr 18,900Total 23,940
Combining the three factors of the average cost of the Training (3406 Euros) and themeasured improvement in effectiveness (4,977 Euros) and the increased impact of thetraining (23,940 Euros), it was concluded that the investment in the Business Banking 1Programme clearly meets any ROI Benchmark management might like to set!
The ROI of Management Training and Development 101
4. CONCLUSIONS
Having been through the project the conclusion of those involved in it at the Bank ofIreland were summarized as follows:
• ROI calculations can be made and defended
• A precise ROI figure is not actually required or necessarily helpful - it’s the processof ensuring that the cost/benefit ratio has been adequately thought through andmeasured (by what is inevitably a combination of objective and subjectivetechniques) that is all important.
• There is a degree of subjectivity in virtually all the measurement criteria-even thoseclaimed to be “objective”!
• It is very difficult (and certainly not cost-effective) to attempt to isolate the impactof the experiential learning. The application of the learning creates its own learningdynamic!
• Likewise the “time-lag” in achieving some of the benefits increases the subjectivityof the measurements used.
The ROI of Management Training and Development102
CASE STUDY VI: DHL WORLDWIDE EXPRESS
1. OBJECTIVES OF THE ROI STUDY
A number of issues are driving both the interest in and the application of the Return onInvestment process in the field of Human Resources Development. Senior managementis increasingly demanding that those delivering the training and developmentinterventions to employees demonstrate the returned value to the business. Total qualitymanagement, re-engineering and continuous improvement process improvement havecreated focus on measurement and evaluation. That includes measuring theeffectiveness of training.
This study was developed at the request of DHL’s senior human resources management.The objective of this Return On Investment (ROI) study was to determine the perceivedmonetary value, as well as intangible benefits, to DHL as a result of sending participantsto the Excellence in People Management Program.
This study was conducted using the methodology developed and copyrighted by JackPhillips, Ph.D., CEO, the Jack Phillips Center for Research, Birmingham, Alabama,USA
1.1. PROFILE OF THE STUDY’S COMPANY:
DHL Worldwide Express is the pioneer and market leader of the global air expressindustry. Its founders, Adrian Dalsey, Larry Hillblom and Robert Lynn, effectivelycreated the industry on the West Coast of America in 1969 by moving shippingmanifests from San Francisco to Hawaii by air to speed ocean cargo. In doing so, theystarted a process that would revolutionise the way the world does business. Today, DHLcarries more than 140 million shipments annually for over a million customersworldwide. DHL's expanding global network currently links 80,000 destinationsservicing 635,000 cities in 228 countries, with more than 64,000 employees and 18,500delivery vehicles. A fleet of over 250 aircraft makes DHL the equivalent of the world'sninth largest airline.DHL was the world's first international air express business, and since then hasconsistently led the industry into new countries and territories. In the 1970s, 1980s and1990s, DHL pioneered air express services in Asia, Europe, the Middle East, LatinAmerica, Africa, Eastern Europe, the People's Republic of China and the CIS - openingup trade and breaking new ground in markets, services and technology.
A company founded on express speed has to be in tune with the latest technology. Forexample, working closely with customs authorities around the world, DHL isintroducing Electronic Data Interchange links to streamline clearances and improve thespeed of shipments. Today, DHL continues to be a pioneer through bringing innovativenew services to the global market using the latest technology including the WEB andInteractive Voice Response.
The ROI of Management Training and Development 103
Most recently, DHL confirmed its position as a technology leader by being the firstexpress carrier to introduce a WAP (Wireless Application Protocol) tracking system,allowing customers to monitor the progress of their shipment from their mobile phoneor any WAP device. DHL, in partnership with many of the world’s leading e-commercetraders, is designing and implementing logistics models that offer the most efficient andcost effective means of global fulfilment of online orders – both in the business tobusiness and business to consumer marketplaces. As DHL customers move into newmarkets, DHL goes with them. The global reach of DHL's network makes possible nextbusiness day delivery between almost any point on the globe. In line with the growth ofits distribution network, DHL has extended its product portfolio. On the ground, DHL'slocal country management and service teams, over 98% of whom are locally employed,ensure DHL is in tune with diverse political and cultural environments. And DHLinvests between 2% and 5% (in newer markets) in training its 64,000 employees. DHLwas named “World’s most global company” by Global Finance Magazine. The DHLWorldwide Express network is composed of DHL International Limited, its subsidiariesand affiliates which serve all locations outside the United States and its territories; andDHL Airways Inc., its subsidiaries and affiliates which serve all locations in the UnitedStates and its territories. DHL's external shareholders are Lufthansa Air Cargo(25.001%), Japan Airlines (6 %), Deutsche Post AG (25.001%) and two investmenttrusts (23%) The remaining stock is held privately.
1.2. STUDY ASSUMPTIONS, GOALS AND METHODOLOGY
In order to conduct the ROI study on Excellence in People Management course thefollowing assumptions were made:
• The course was offered approximately 5 times per year in the regional trainingcentre in Brussels.
• The study comprised participants who had been able to apply their new skills andbehaviours for at least one year, enabling them to interact with their staff during anentire management process performance cycle (Goal Setting, Coaching,Performance Appraisal, Compensation/Rewarding and Teambuilding)
• The workshops were generally attended by a mix of 2/3 local supervisors andmanagers and 1/3 of participants representing other regional businesses.
• In order to get a good sampling of the effectiveness of this program five programsconducted between mid 1995 and mid 1996 were measured.
The total population of these courses was 57, of which 16 had either left or were leavingDHL at the conclusion of the study. The ROI study was therefore conducted with asample of 41 participants. Of these participants, 37 returned their surveys.
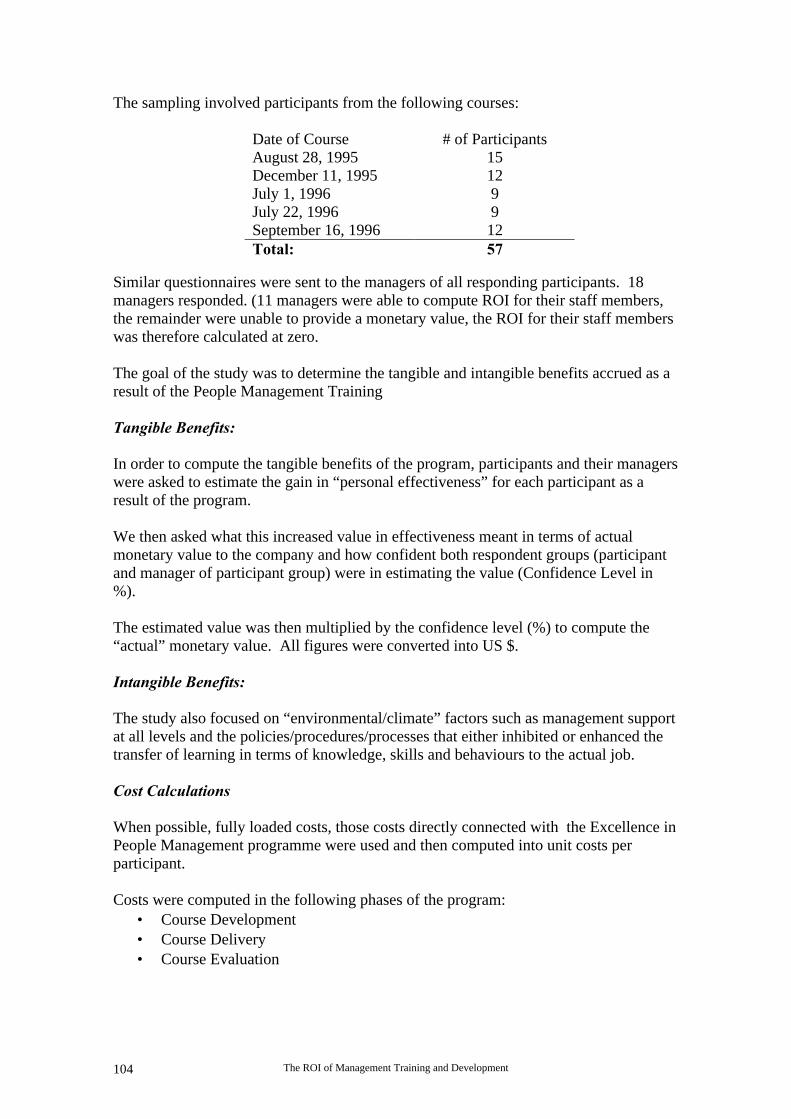
The ROI of Management Training and Development104
The sampling involved participants from the following courses:
Date of Course # of ParticipantsAugust 28, 1995 15December 11, 1995 12July 1, 1996 9July 22, 1996 9September 16, 1996 12Total: 57
Similar questionnaires were sent to the managers of all responding participants. 18managers responded. (11 managers were able to compute ROI for their staff members,the remainder were unable to provide a monetary value, the ROI for their staff memberswas therefore calculated at zero.
The goal of the study was to determine the tangible and intangible benefits accrued as aresult of the People Management Training
Tangible Benefits:
In order to compute the tangible benefits of the program, participants and their managerswere asked to estimate the gain in “personal effectiveness” for each participant as aresult of the program.
We then asked what this increased value in effectiveness meant in terms of actualmonetary value to the company and how confident both respondent groups (participantand manager of participant group) were in estimating the value (Confidence Level in%).
The estimated value was then multiplied by the confidence level (%) to compute the“actual” monetary value. All figures were converted into US $.
Intangible Benefits:
The study also focused on “environmental/climate” factors such as management supportat all levels and the policies/procedures/processes that either inhibited or enhanced thetransfer of learning in terms of knowledge, skills and behaviours to the actual job.
Cost Calculations
When possible, fully loaded costs, those costs directly connected with the Excellence inPeople Management programme were used and then computed into unit costs perparticipant.
Costs were computed in the following phases of the program:• Course Development• Course Delivery• Course Evaluation
The ROI of Management Training and Development 105
A Needs Analysis was not conducted, no costs were incurred in this phase. Managementwas in agreement, that, since no formal, systematic “people management skills”training had been conducted previously, the need for such training was implicit.
1.3. EXCELLENCE IN PEOPLE MANAGEMENT: THE COURSE
EXCELLENCE IN PEOPLE MANAGEMENT, re-designed from a similar program usedin the author’s former company, was first piloted in Brussels in September of 1994. Itwas intended to teach DHL supervisors and managers the fundamental skills, knowledgeand behaviours needed to effectively manage their teams.
The 5-day program supported two strategic company objectives:
• To extend the commitment to the principle that the PEOPLE of DHL are its morevaluable asset.
• To provide training in researched people management skills and behaviours which,when consistently practiced on the job, would significantly enhance work groupclimate and productivity.
The program consisted of a series of modules covering the Role of theSupervisor/Manager, Communications and Personal Effectiveness, Goal Setting,Coaching, Performance Appraisal, Compensation/Rewarding, and Building andEffective Teambuilding involving 39 globally researched behaviours (The ForumCorporation) that set aside excellent “people managers” from average ones.
The program was based on the three essentials of Adult Learning: Instruction, Practiceand Behaviour Modelling.
EXCELLENCE IN PEOPLE MANAGEMENT contains a Level 3 evaluation processcalled the Management Growth Process (MGP), a 90-degree process (pre- and posttraining administered) that compares the participant’s self perceptions regarding thebehaviours and skills taught in Excellence In People Management with the perceptionsof his/her staff.
MGP can also serve as a coaching vehicle to further improve the supervisor/managers’skills, in order for them to meet the minimum standard of People Management.
Note: MGP is a validated and copyrighted process developed by Gerrit J. Knodt aspart of his doctoral research conducted at Citibank Global Payment Productsfrom 1987 to 1990.
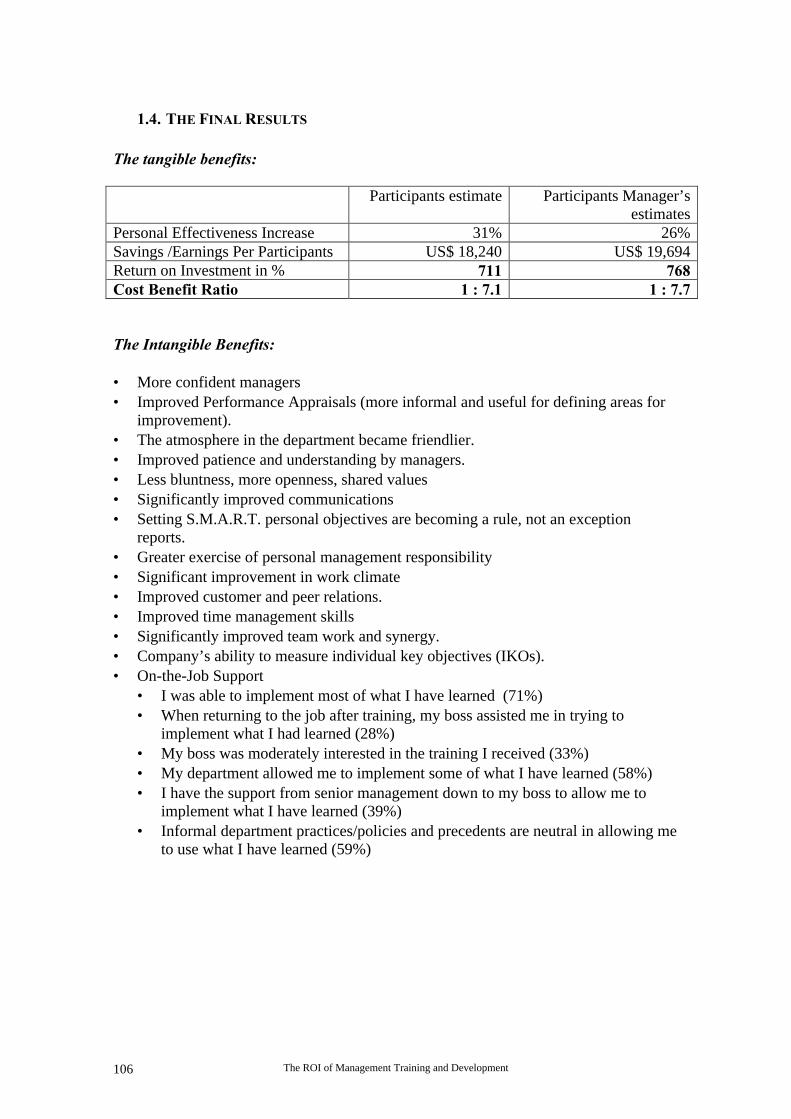
The ROI of Management Training and Development106
1.4. THE FINAL RESULTS
The tangible benefits:
Participants estimate Participants Manager’sestimates
Personal Effectiveness Increase 31% 26%Savings /Earnings Per Participants US$ 18,240 US$ 19,694Return on Investment in % 711 768Cost Benefit Ratio 1 : 7.1 1 : 7.7
The Intangible Benefits:
• More confident managers• Improved Performance Appraisals (more informal and useful for defining areas for
improvement).• The atmosphere in the department became friendlier.• Improved patience and understanding by managers.• Less bluntness, more openness, shared values• Significantly improved communications• Setting S.M.A.R.T. personal objectives are becoming a rule, not an exception
reports.• Greater exercise of personal management responsibility• Significant improvement in work climate• Improved customer and peer relations.• Improved time management skills• Significantly improved team work and synergy.• Company’s ability to measure individual key objectives (IKOs).• On-the-Job Support
• I was able to implement most of what I have learned (71%)• When returning to the job after training, my boss assisted me in trying to
implement what I had learned (28%)• My boss was moderately interested in the training I received (33%)• My department allowed me to implement some of what I have learned (58%)• I have the support from senior management down to my boss to allow me to
implement what I have learned (39%)• Informal department practices/policies and precedents are neutral in allowing me
to use what I have learned (59%)
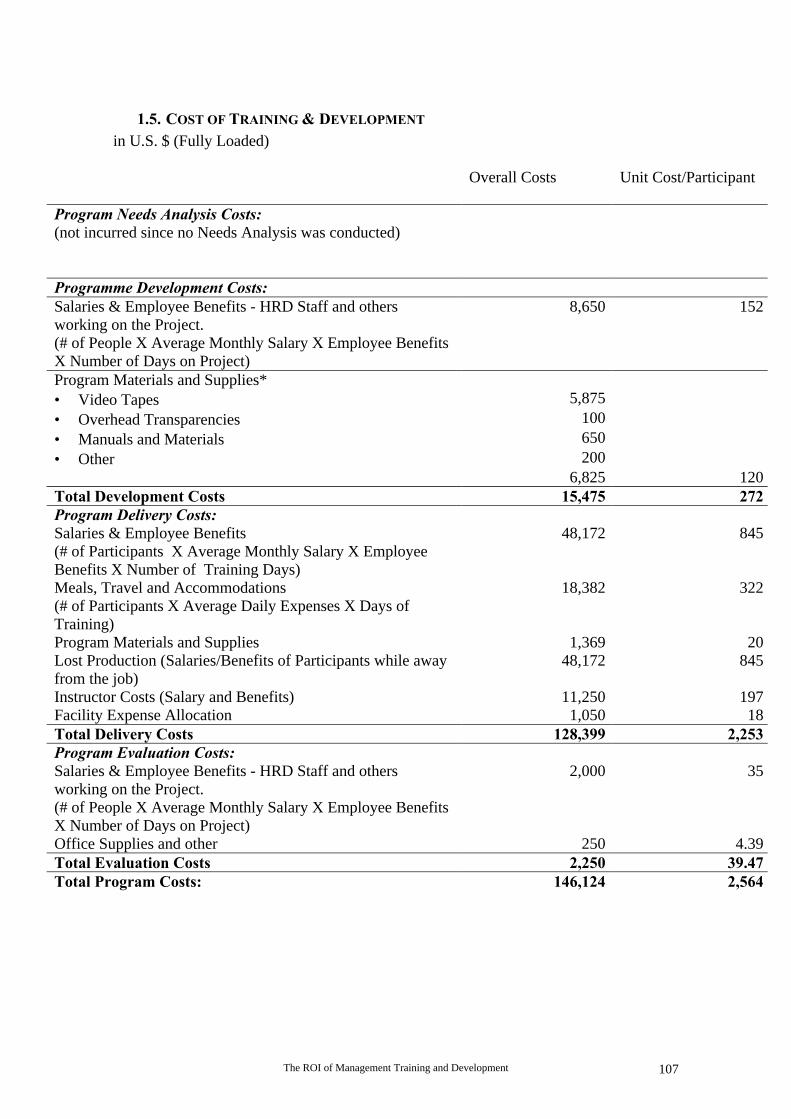
The ROI of Management Training and Development 107
1.5. COST OF TRAINING & DEVELOPMENT
in U.S. $ (Fully Loaded)
Overall Costs Unit Cost/Participant
Program Needs Analysis Costs:(not incurred since no Needs Analysis was conducted)
Programme Development Costs:Salaries & Employee Benefits - HRD Staff and othersworking on the Project.(# of People X Average Monthly Salary X Employee BenefitsX Number of Days on Project)
8,650 152
Program Materials and Supplies*• Video Tapes 5,875• Overhead Transparencies 100• Manuals and Materials 650• Other 200
6,825 120Total Development Costs 15,475 272Program Delivery Costs:Salaries & Employee Benefits(# of Participants X Average Monthly Salary X EmployeeBenefits X Number of Training Days)
48,172 845
Meals, Travel and Accommodations(# of Participants X Average Daily Expenses X Days ofTraining)
18,382 322
Program Materials and Supplies 1,369 20Lost Production (Salaries/Benefits of Participants while awayfrom the job)
48,172 845
Instructor Costs (Salary and Benefits) 11,250 197Facility Expense Allocation 1,050 18Total Delivery Costs 128,399 2,253Program Evaluation Costs:Salaries & Employee Benefits - HRD Staff and othersworking on the Project.(# of People X Average Monthly Salary X Employee BenefitsX Number of Days on Project)
2,000 35
Office Supplies and other 250 4.39Total Evaluation Costs 2,250 39.47Total Program Costs: 146,124 2,564
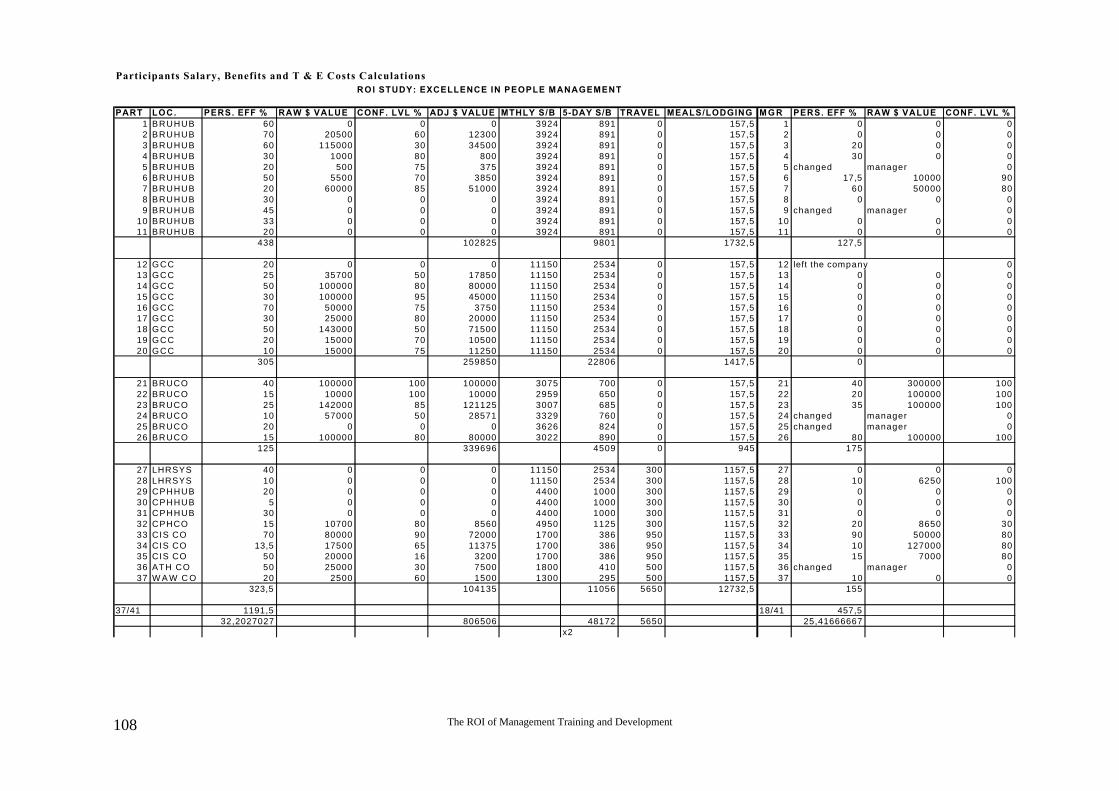
The ROI of Management Training and Development108
Participants Salary, Benefits and T & E Costs CalculationsROI STUDY: EXCELLENCE IN PEOPLE MANAGEMENT
PART LOC. PERS. EFF % RAW $ VALUE CONF. LVL % ADJ $ VALUE MTHLY S/B 5-DAY S/B TRAVEL MEALS/LODGING M G R PERS. EFF % RAW $ VALUE CONF. LVL %1 BRUHUB 60 0 0 0 3924 891 0 157,5 1 0 0 02 BRUHUB 70 20500 60 12300 3924 891 0 157,5 2 0 0 03 BRUHUB 60 115000 30 34500 3924 891 0 157,5 3 20 0 04 BRUHUB 30 1000 80 800 3924 891 0 157,5 4 30 0 05 BRUHUB 20 500 75 375 3924 891 0 157,5 5 changed manager 06 BRUHUB 50 5500 70 3850 3924 891 0 157,5 6 17,5 10000 907 BRUHUB 20 60000 85 51000 3924 891 0 157,5 7 60 50000 808 BRUHUB 30 0 0 0 3924 891 0 157,5 8 0 0 09 BRUHUB 45 0 0 0 3924 891 0 157,5 9 changed manager 0
10 BRUHUB 33 0 0 0 3924 891 0 157,5 10 0 0 011 BRUHUB 20 0 0 0 3924 891 0 157,5 11 0 0 0
438 102825 9801 1732,5 127,5
12 GCC 20 0 0 0 11150 2534 0 157,5 12 left the company 013 GCC 25 35700 50 17850 11150 2534 0 157,5 13 0 0 014 GCC 50 100000 80 80000 11150 2534 0 157,5 14 0 0 015 GCC 30 100000 95 45000 11150 2534 0 157,5 15 0 0 016 GCC 70 50000 75 3750 11150 2534 0 157,5 16 0 0 017 GCC 30 25000 80 20000 11150 2534 0 157,5 17 0 0 018 GCC 50 143000 50 71500 11150 2534 0 157,5 18 0 0 019 GCC 20 15000 70 10500 11150 2534 0 157,5 19 0 0 020 GCC 10 15000 75 11250 11150 2534 0 157,5 20 0 0 0
305 259850 22806 1417,5 0
21 BRUCO 40 100000 100 100000 3075 700 0 157,5 21 40 300000 10022 BRUCO 15 10000 100 10000 2959 650 0 157,5 22 20 100000 10023 BRUCO 25 142000 85 121125 3007 685 0 157,5 23 35 100000 10024 BRUCO 10 57000 50 28571 3329 760 0 157,5 24 changed manager 025 BRUCO 20 0 0 0 3626 824 0 157,5 25 changed manager 026 BRUCO 15 100000 80 80000 3022 890 0 157,5 26 80 100000 100
125 339696 4509 0 945 175
27 LHRSYS 40 0 0 0 11150 2534 300 1157,5 27 0 0 028 LHRSYS 10 0 0 0 11150 2534 300 1157,5 28 10 6250 10029 CPHHUB 20 0 0 0 4400 1000 300 1157,5 29 0 0 030 CPHHUB 5 0 0 0 4400 1000 300 1157,5 30 0 0 031 CPHHUB 30 0 0 0 4400 1000 300 1157,5 31 0 0 032 CPHCO 15 10700 80 8560 4950 1125 300 1157,5 32 20 8650 3033 CIS CO 70 80000 90 72000 1700 386 950 1157,5 33 90 50000 8034 CIS CO 13,5 17500 65 11375 1700 386 950 1157,5 34 10 127000 8035 CIS CO 50 20000 16 3200 1700 386 950 1157,5 35 15 7000 8036 ATH CO 50 25000 30 7500 1800 410 500 1157,5 36 changed manager 037 W A W C O 20 2500 60 1500 1300 295 500 1157,5 37 10 0 0
323,5 104135 11056 5650 12732,5 155
37/41 1191,5 18/41 457,532,2027027 806506 48172 5650 25,41666667
x2

The ROI of Management Training and Development 109
1.6. PARTICIPANT SURVEY RESULTS
Surveys Sent: 41Surveys Received: 37Response Rate: 90%
As a former participant in the Excellence in People Management Program, you canbest evaluate the immediate, long-range and lasting effects of the program. Therehas been a significant period of time since you completed the program to be able tohave used all the behaviours and models taught in the area of Goal Setting,Coaching, Performance Appraisal, Compensation/Rewarding and Teambuilding.We are interested in your opinions about the program’s success and lasting effects.Since this questionnaire is part of a Return on Investment Study to be submitted toSenior Management, we need your frank comments regarding the program
Please be assured that your specific comments will be handled in strict confidence.Only the overall results will be presented.
General Evaluation:
The following objectives were stated for the program. To what extent did theprogram achieve these objectives?
Percent of ResponsesCompletelySuccessful
GenerallySuccessful
LimitedSuccess
Failed
A To improve your understandingabout the nature, requirements andresponsibilities of thesuperv./mgr.’s job.
43 54 3 00
B To be able to use theCommunication Model effectivelywhen communicating with yourstaff members.
24 70 6 00
C To be able to write, communicateand get mutual agreement on thegoals set for your staff membersusing the Goal Setting Model.
43 30 27 00
D To be able to effectively use the 8behaviour associated withsuccessful goal setting.
17 60 23 00
E To be able to effectively use theCoaching Model
35 57 08 00
F To be able to effectively use the 8behaviours associated withexcellent coaching.
29 51 20 00
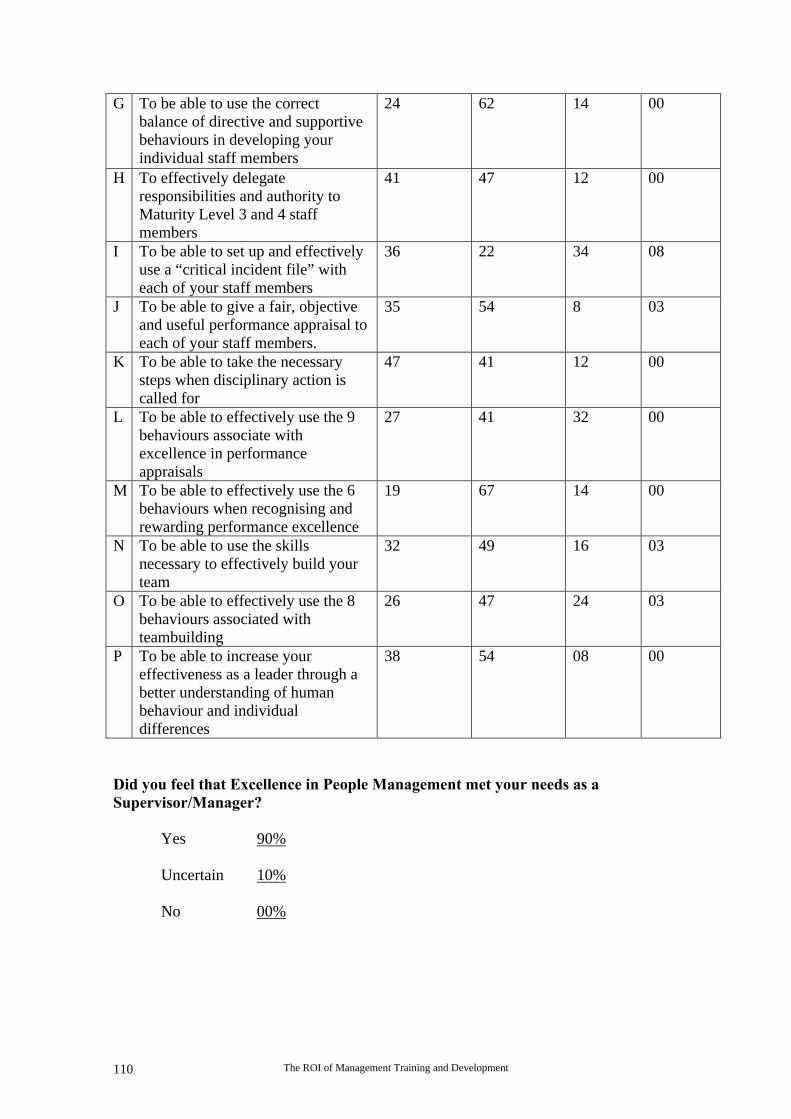
The ROI of Management Training and Development110
G To be able to use the correctbalance of directive and supportivebehaviours in developing yourindividual staff members
24 62 14 00
H To effectively delegateresponsibilities and authority toMaturity Level 3 and 4 staffmembers
41 47 12 00
I To be able to set up and effectivelyuse a “critical incident file” witheach of your staff members
36 22 34 08
J To be able to give a fair, objectiveand useful performance appraisal toeach of your staff members.
35 54 8 03
K To be able to take the necessarysteps when disciplinary action iscalled for
47 41 12 00
L To be able to effectively use the 9behaviours associate withexcellence in performanceappraisals
27 41 32 00
M To be able to effectively use the 6behaviours when recognising andrewarding performance excellence
19 67 14 00
N To be able to use the skillsnecessary to effectively build yourteam
32 49 16 03
O To be able to effectively use the 8behaviours associated withteambuilding
26 47 24 03
P To be able to increase youreffectiveness as a leader through abetter understanding of humanbehaviour and individualdifferences
38 54 08 00
Did you feel that Excellence in People Management met your needs as aSupervisor/Manager?
Yes 90%
Uncertain 10%
No 00%
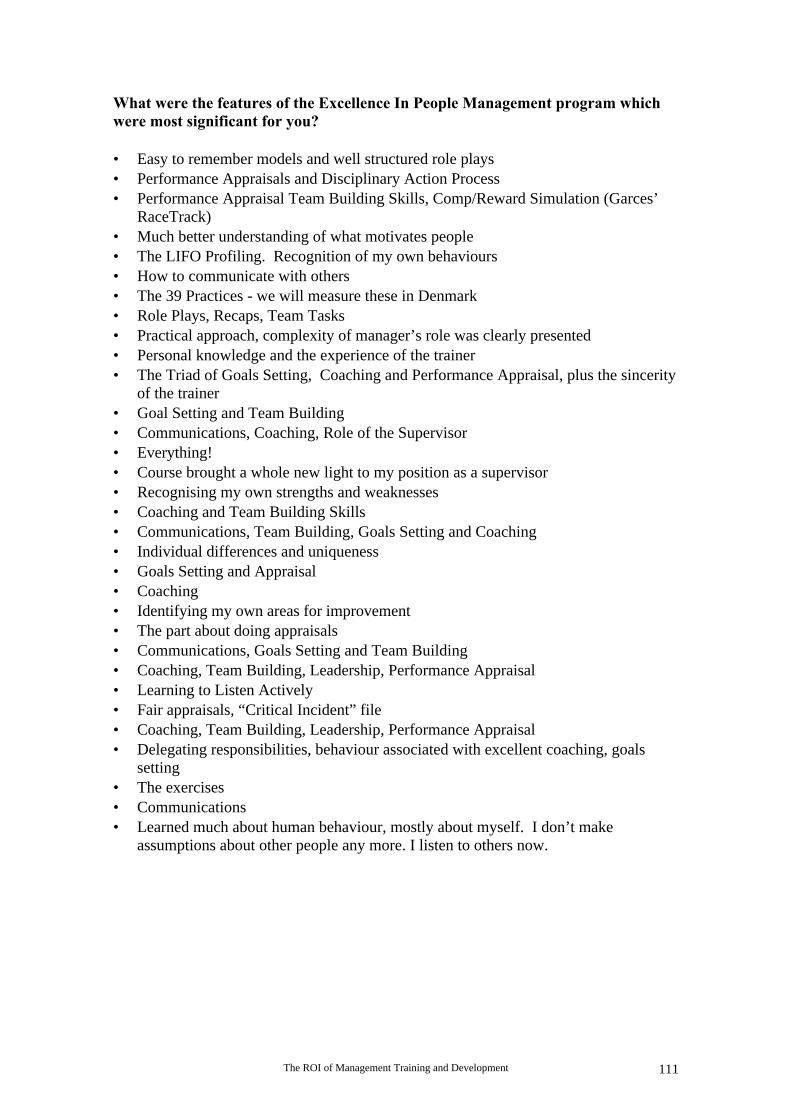
The ROI of Management Training and Development 111
What were the features of the Excellence In People Management program whichwere most significant for you?
• Easy to remember models and well structured role plays• Performance Appraisals and Disciplinary Action Process• Performance Appraisal Team Building Skills, Comp/Reward Simulation (Garces’
RaceTrack)• Much better understanding of what motivates people• The LIFO Profiling. Recognition of my own behaviours• How to communicate with others• The 39 Practices - we will measure these in Denmark• Role Plays, Recaps, Team Tasks• Practical approach, complexity of manager’s role was clearly presented• Personal knowledge and the experience of the trainer• The Triad of Goals Setting, Coaching and Performance Appraisal, plus the sincerity
of the trainer• Goal Setting and Team Building• Communications, Coaching, Role of the Supervisor• Everything!• Course brought a whole new light to my position as a supervisor• Recognising my own strengths and weaknesses• Coaching and Team Building Skills• Communications, Team Building, Goals Setting and Coaching• Individual differences and uniqueness• Goals Setting and Appraisal• Coaching• Identifying my own areas for improvement• The part about doing appraisals• Communications, Goals Setting and Team Building• Coaching, Team Building, Leadership, Performance Appraisal• Learning to Listen Actively• Fair appraisals, “Critical Incident” file• Coaching, Team Building, Leadership, Performance Appraisal• Delegating responsibilities, behaviour associated with excellent coaching, goals
setting• The exercises• Communications• Learned much about human behaviour, mostly about myself. I don’t make
assumptions about other people any more. I listen to others now.

The ROI of Management Training and Development112
Which module (Role of the Supervisor/Manager; Communications; Goal Setting;Coaching; Performance Appraisal; Recognition/Rewarding (Garces’ Race Track),Teambuilding) has been most helpful to you on your job?
• Coaching and appraising helped me to build better relationships with my staff• Goal Setting and Performance Appraisal• Coaching/Appraising helped me to use a better approach with my staff• Communications and Coaching• Communications• Goals Setting- to be able to define, communicate and “sell” your objectives• “Just in time” appraisal training• Communications and Team Building• Coaching, Rewarding, Synergy (Team Building)• Coaching and Recognition as motivators• Communications and Goals Setting are essential• Goal Setting• Goal Setting, Team Building, Performance Appraisal• Coaching - I apply it now on regular basis, instead of ad hoc• Communications, since the model underpins all others• Communicating - receiving and distributing information• Coaching, appraisals - looking at my people differently• Setting up clear goals• The Communication Model significantly improved my skills because it made me
“aware”• Goals Setting• Goals Setting and coaching as these managerial roles are always underestimated• Goal Setting Model and Coaching Skills• Had no idea what goal setting meant - now I do• Everything!• Coaching and Team Building
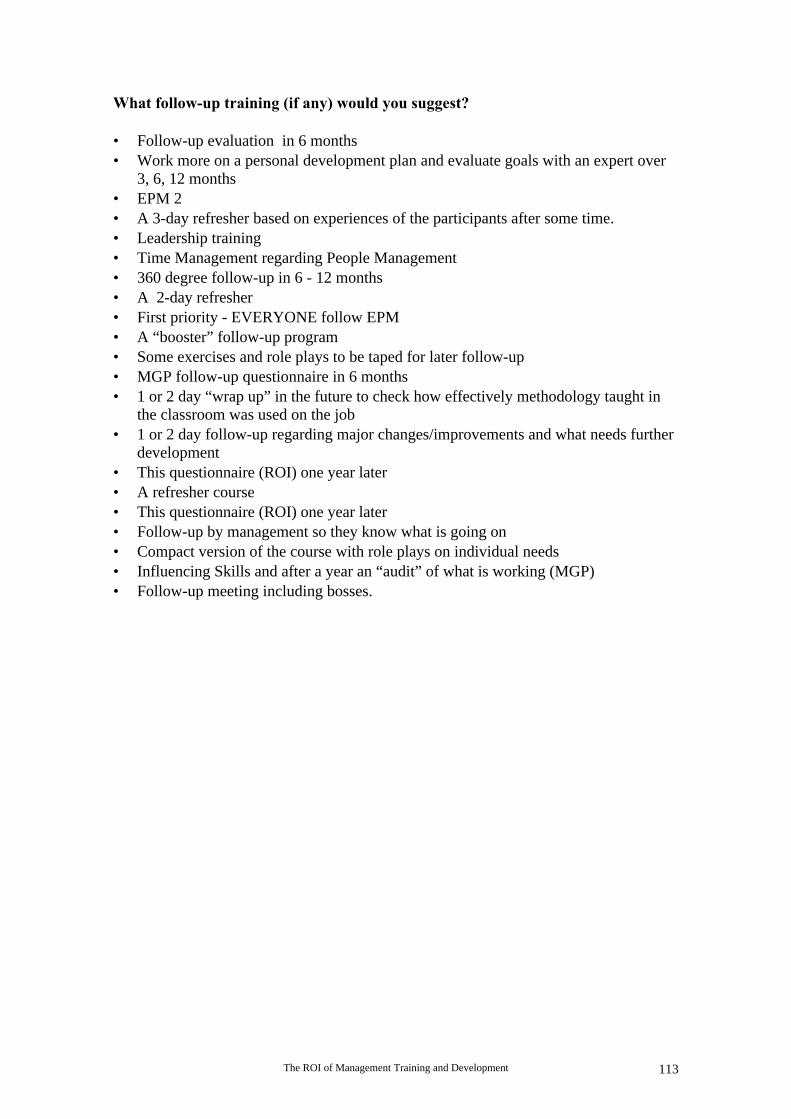
The ROI of Management Training and Development 113
What follow-up training (if any) would you suggest?
• Follow-up evaluation in 6 months• Work more on a personal development plan and evaluate goals with an expert over
3, 6, 12 months• EPM 2• A 3-day refresher based on experiences of the participants after some time.• Leadership training• Time Management regarding People Management• 360 degree follow-up in 6 - 12 months• A 2-day refresher• First priority - EVERYONE follow EPM• A “booster” follow-up program• Some exercises and role plays to be taped for later follow-up• MGP follow-up questionnaire in 6 months• 1 or 2 day “wrap up” in the future to check how effectively methodology taught in
the classroom was used on the job• 1 or 2 day follow-up regarding major changes/improvements and what needs further
development• This questionnaire (ROI) one year later• A refresher course• This questionnaire (ROI) one year later• Follow-up by management so they know what is going on• Compact version of the course with role plays on individual needs• Influencing Skills and after a year an “audit” of what is working (MGP)• Follow-up meeting including bosses.
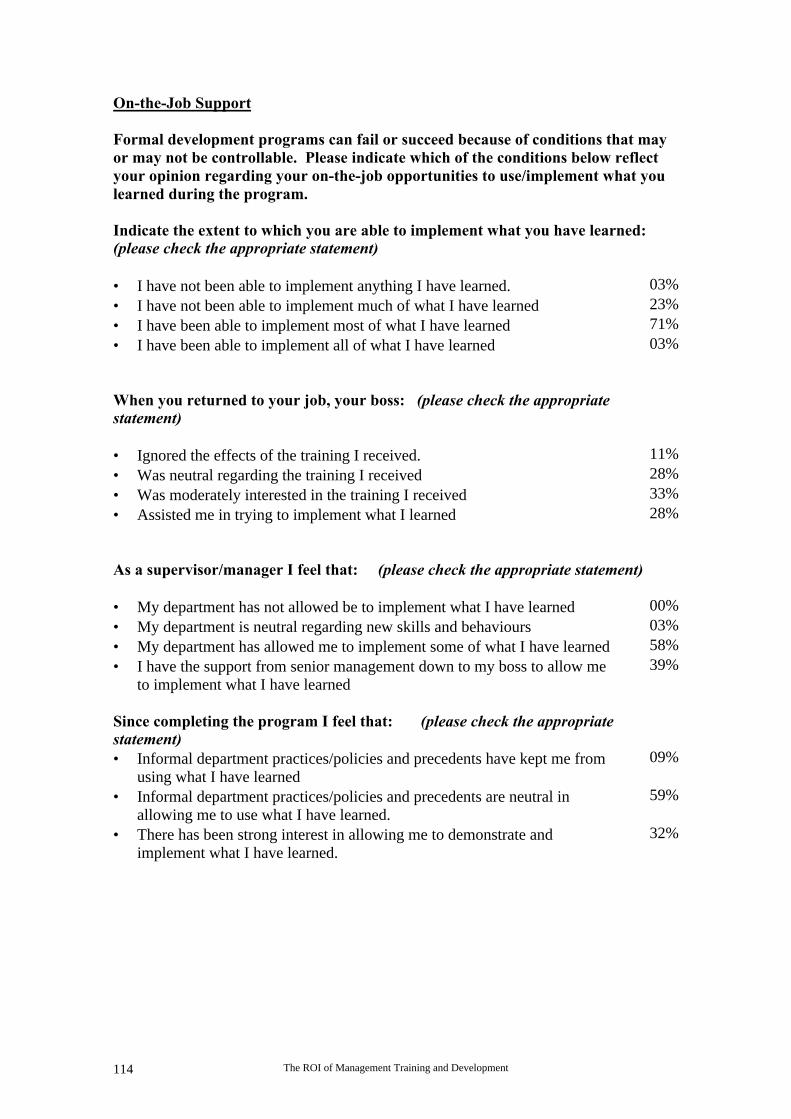
The ROI of Management Training and Development114
On-the-Job Support
Formal development programs can fail or succeed because of conditions that mayor may not be controllable. Please indicate which of the conditions below reflectyour opinion regarding your on-the-job opportunities to use/implement what youlearned during the program.
Indicate the extent to which you are able to implement what you have learned:(please check the appropriate statement)
• I have not been able to implement anything I have learned. 03%• I have not been able to implement much of what I have learned 23%• I have been able to implement most of what I have learned 71%• I have been able to implement all of what I have learned 03%
When you returned to your job, your boss: (please check the appropriatestatement)
• Ignored the effects of the training I received. 11%• Was neutral regarding the training I received 28%• Was moderately interested in the training I received 33%• Assisted me in trying to implement what I learned 28%
As a supervisor/manager I feel that: (please check the appropriate statement)
• My department has not allowed be to implement what I have learned 00%• My department is neutral regarding new skills and behaviours 03%• My department has allowed me to implement some of what I have learned 58%• I have the support from senior management down to my boss to allow me
to implement what I have learned39%
Since completing the program I feel that: (please check the appropriatestatement)• Informal department practices/policies and precedents have kept me from
using what I have learned09%
• Informal department practices/policies and precedents are neutral inallowing me to use what I have learned.
59%
• There has been strong interest in allowing me to demonstrate andimplement what I have learned.
32%
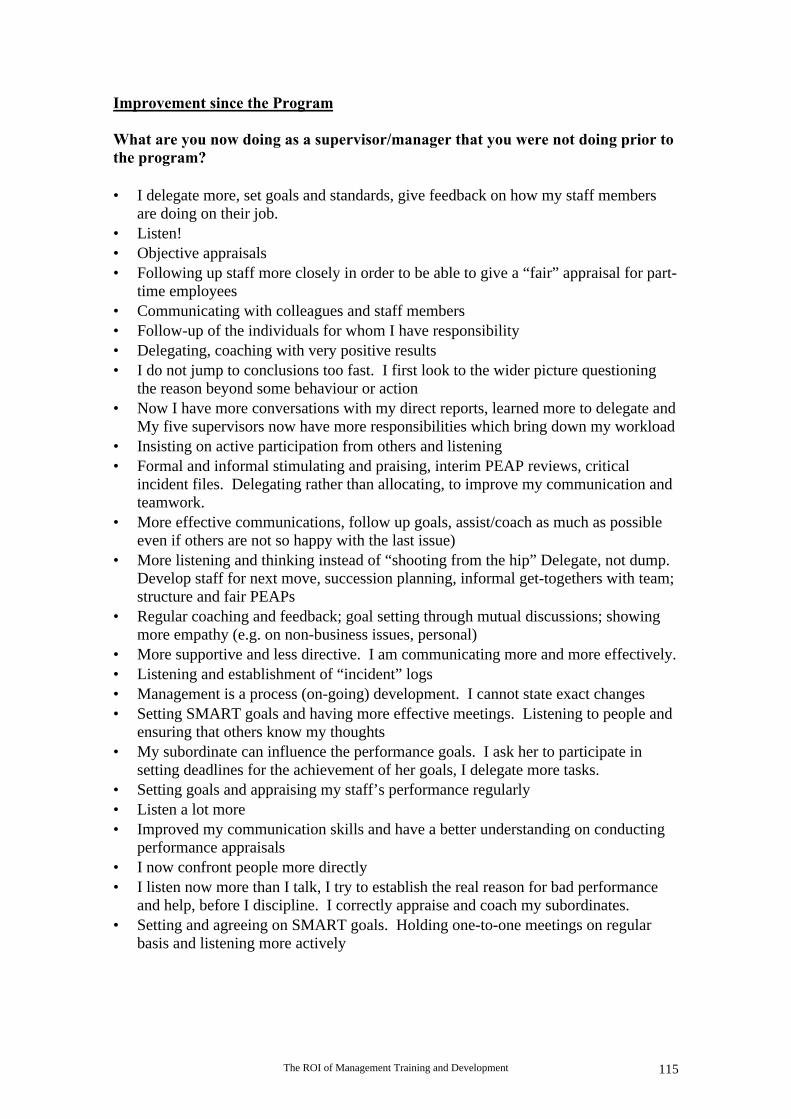
The ROI of Management Training and Development 115
Improvement since the Program
What are you now doing as a supervisor/manager that you were not doing prior tothe program?
• I delegate more, set goals and standards, give feedback on how my staff membersare doing on their job.
• Listen!• Objective appraisals• Following up staff more closely in order to be able to give a “fair” appraisal for part-
time employees• Communicating with colleagues and staff members• Follow-up of the individuals for whom I have responsibility• Delegating, coaching with very positive results• I do not jump to conclusions too fast. I first look to the wider picture questioning
the reason beyond some behaviour or action• Now I have more conversations with my direct reports, learned more to delegate and
My five supervisors now have more responsibilities which bring down my workload• Insisting on active participation from others and listening• Formal and informal stimulating and praising, interim PEAP reviews, critical
incident files. Delegating rather than allocating, to improve my communication andteamwork.
• More effective communications, follow up goals, assist/coach as much as possibleeven if others are not so happy with the last issue)
• More listening and thinking instead of “shooting from the hip” Delegate, not dump.Develop staff for next move, succession planning, informal get-togethers with team;structure and fair PEAPs
• Regular coaching and feedback; goal setting through mutual discussions; showingmore empathy (e.g. on non-business issues, personal)
• More supportive and less directive. I am communicating more and more effectively.• Listening and establishment of “incident” logs• Management is a process (on-going) development. I cannot state exact changes• Setting SMART goals and having more effective meetings. Listening to people and
ensuring that others know my thoughts• My subordinate can influence the performance goals. I ask her to participate in
setting deadlines for the achievement of her goals, I delegate more tasks.• Setting goals and appraising my staff’s performance regularly• Listen a lot more• Improved my communication skills and have a better understanding on conducting
performance appraisals• I now confront people more directly• I listen now more than I talk, I try to establish the real reason for bad performance
and help, before I discipline. I correctly appraise and coach my subordinates.• Setting and agreeing on SMART goals. Holding one-to-one meetings on regular
basis and listening more actively

The ROI of Management Training and Development116
What have you stopped doing as a supervisor/manager since attending Excellencein People Management?
• I stopped doing everything myself, I give responsibilities to my staff members andhold regular team meetings
• Barking! Shouting!• Saying “yes” when thinking” no”• I stopped being busy with myself and put more interest in my staff• Taking all decisions myself• Doing it all myself• My management style has changed from purely results-based to focus on
individuals• Doing things myself!• Doing everything myself and not communicating/delegating to others what is on-
going• I stopped criticising people as much as I did before and began to praise them more.• Focusing on errors, mistakes in the work done by subordinates; pushing my own
views rather then listen/understanding my staff members• Jump to conclusions regarding human behaviour• Stopped setting unrealistic objectives.• Massaging people’s characters to become what I want them to be.• Possibly I am now seen as less “cold” and distant, because of more regular contact
and communications and allowing more inputs to my staff and encouraging them• Talking too fast and not checking for understanding• I have stopped thinking that my people have an obligation to do something for me.• I have stopped discussing and solving employee’s problems some time after they are
noticed, instead I do it immediately now.• Deciding on issues prior to listening to my staff• Stopped writing and agreeing on unclear, vague objectives• I have stopped doing everything myself and instead started to delegate more
responsibility.• Thinking how stupid people are, constantly being dissatisfied with the performance
of my staff

The ROI of Management Training and Development 117
Can you describe any changes in you, your work, or your relationships with yourboss, your staff, your customers, and your peers/colleagues that were caused insome substantial part by your attending EPM?
• I became more confident as a manager• Performance appraisals become more informal and useful for defining areas for
improvement. The atmosphere in the department became friendlier.• I think I show more patience and understanding for the others. I definitely listen
actively to what others are saying. I am more likely to recognise good performancethan to criticise for poor performance. I offer my help and assistance to others.
• Less blunt, more openness, shared values• Communications improved significantly• More able to communicate effectively and to work coherently as a group• I set objectives, I coach, I praise. I spot the mistakes my boss does in managing me.
It would be good if every manager in DHL is trained how to manage people. Helpedmy relationship to my lead couriers. More delegation, less control, more coaching.
• I have become more tolerant. I remember having a really good feeling after thecourse that spread at the heart of my reports.
• Improved communication with my subordinates.• More open to customers and peers. Because I believe in EPM, I sent all my direct
reports to this course.• More respected. Positive feedback from superiors in my own performance
appraisal. Helped me to be more direct and assertive. More openness to dialogueand feedback.
As a result of EPM, what do you estimate to be the increase in your personaleffectiveness, expressed as a percent?
Group: 31 %
As a result of any change in your thinking or new ideas and skills you havelearned, please estimate (in your local currency) the amount of money that youhave saved or earned for the company (i.e., reduced absenteeism and turnover,reduced employee complaints, better team building, increased productivity,increase in personal effectiveness, etc.) since attending the program:
Participant Average:US $ 18,240
Cost/Benefit Ration: 1: 7.1
ROI (%) 711
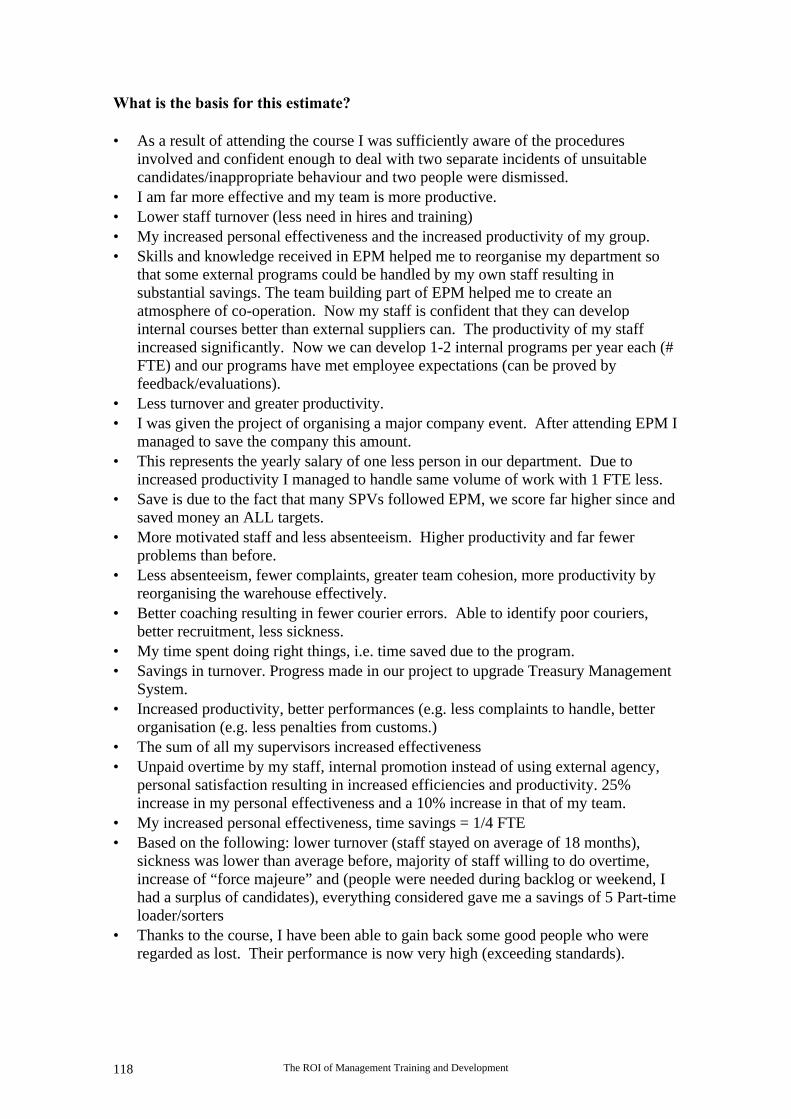
The ROI of Management Training and Development118
What is the basis for this estimate?
• As a result of attending the course I was sufficiently aware of the proceduresinvolved and confident enough to deal with two separate incidents of unsuitablecandidates/inappropriate behaviour and two people were dismissed.
• I am far more effective and my team is more productive.• Lower staff turnover (less need in hires and training)• My increased personal effectiveness and the increased productivity of my group.• Skills and knowledge received in EPM helped me to reorganise my department so
that some external programs could be handled by my own staff resulting insubstantial savings. The team building part of EPM helped me to create anatmosphere of co-operation. Now my staff is confident that they can developinternal courses better than external suppliers can. The productivity of my staffincreased significantly. Now we can develop 1-2 internal programs per year each (#FTE) and our programs have met employee expectations (can be proved byfeedback/evaluations).
• Less turnover and greater productivity.• I was given the project of organising a major company event. After attending EPM I
managed to save the company this amount.• This represents the yearly salary of one less person in our department. Due to
increased productivity I managed to handle same volume of work with 1 FTE less.• Save is due to the fact that many SPVs followed EPM, we score far higher since and
saved money an ALL targets.• More motivated staff and less absenteeism. Higher productivity and far fewer
problems than before.• Less absenteeism, fewer complaints, greater team cohesion, more productivity by
reorganising the warehouse effectively.• Better coaching resulting in fewer courier errors. Able to identify poor couriers,
better recruitment, less sickness.• My time spent doing right things, i.e. time saved due to the program.• Savings in turnover. Progress made in our project to upgrade Treasury Management
System.• Increased productivity, better performances (e.g. less complaints to handle, better
organisation (e.g. less penalties from customs.)• The sum of all my supervisors increased effectiveness• Unpaid overtime by my staff, internal promotion instead of using external agency,
personal satisfaction resulting in increased efficiencies and productivity. 25%increase in my personal effectiveness and a 10% increase in that of my team.
• My increased personal effectiveness, time savings = 1/4 FTE• Based on the following: lower turnover (staff stayed on average of 18 months),
sickness was lower than average before, majority of staff willing to do overtime,increase of “force majeure” and (people were needed during backlog or weekend, Ihad a surplus of candidates), everything considered gave me a savings of 5 Part-timeloader/sorters
• Thanks to the course, I have been able to gain back some good people who wereregarded as lost. Their performance is now very high (exceeding standards).
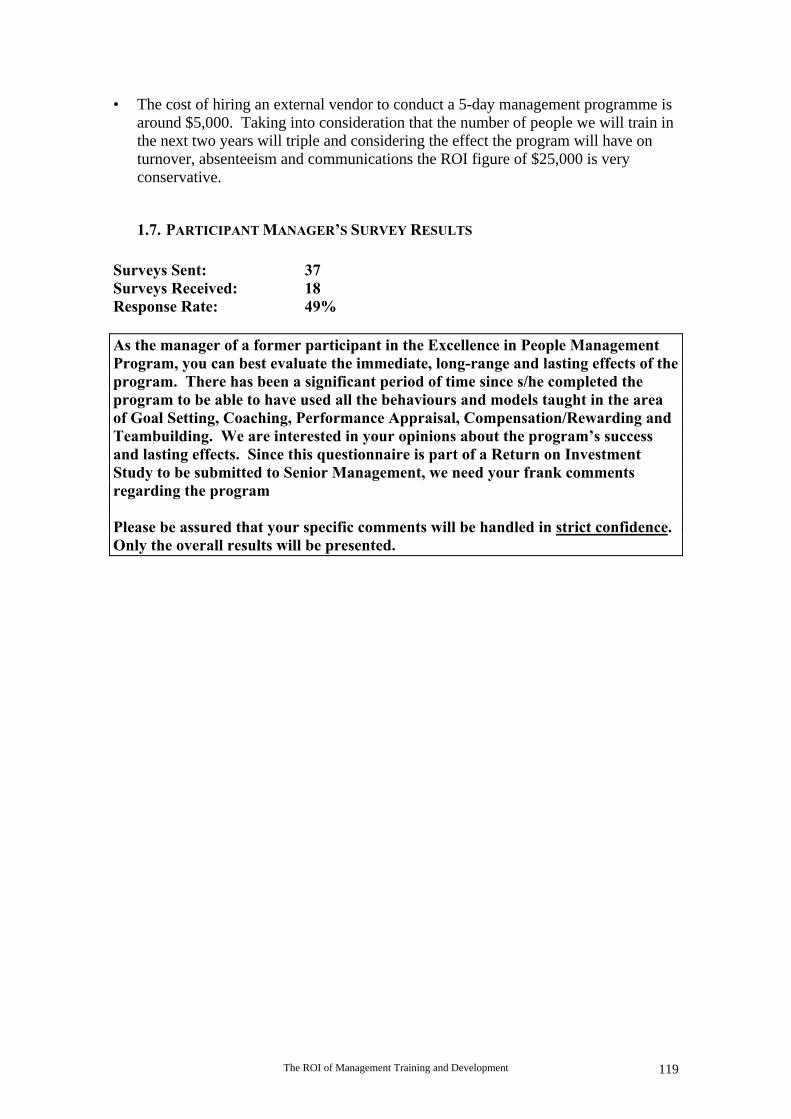
The ROI of Management Training and Development 119
• The cost of hiring an external vendor to conduct a 5-day management programme isaround $5,000. Taking into consideration that the number of people we will train inthe next two years will triple and considering the effect the program will have onturnover, absenteeism and communications the ROI figure of $25,000 is veryconservative.
1.7. PARTICIPANT MANAGER’S SURVEY RESULTS
Surveys Sent: 37Surveys Received: 18Response Rate: 49%
As the manager of a former participant in the Excellence in People ManagementProgram, you can best evaluate the immediate, long-range and lasting effects of theprogram. There has been a significant period of time since s/he completed theprogram to be able to have used all the behaviours and models taught in the areaof Goal Setting, Coaching, Performance Appraisal, Compensation/Rewarding andTeambuilding. We are interested in your opinions about the program’s successand lasting effects. Since this questionnaire is part of a Return on InvestmentStudy to be submitted to Senior Management, we need your frank commentsregarding the program
Please be assured that your specific comments will be handled in strict confidence.Only the overall results will be presented.

The ROI of Management Training and Development120
General Evaluation:
The following objectives were stated for the program. To what extent did theprogram achieve these objectives in terms of your staff member’s effectivenesswith his/her staff?
Percent of ResponsesCompletelySuccessful
GenerallySuccessful
LimitedSuccess
Failed
A To improve his/her understanding about thenature, requirements and responsibilities
40 53 07 00
B To be able to effectively communicate withhis/her staff members.
26 67 07 00
C To be able to write, communicate and getmutual agreement on the goals set for his/herstaff members.
20 67 13 00
D To be able to effectively use the 8behaviours associated with successful goalsetting.
27 53 13 07
E To be able to effectively coaching his/herstaff members
40 47 07 06
F To be able to effectively use the 8behaviours associated with excellentcoaching
20 60 20 00
G To be able to use the correct balance ofdirective and supportive behaviours indeveloping his/her individual staff members
33 47 20 00
H To effectively delegate responsibilities andauthority to the appropriate staff members.
40 47 07 06
I To be able to set up and effectively use a“critical incident file” with each of your staffmembers.
47 33 13 07
J To be able to give a fair, objective anduseful performance appraisal to each ofhis/her staff members.
42 36 24 00
K To be able to take the necessary steps whendisciplinary action is called for.
33 47 13 07
L To be able to effectively use the (9)behaviours associated with excellence inPerformance Appraisal.
40 40 20 00
M To be able to effectively use the (6)behaviours when recognising and rewardingperformance excellence
20 60 13 07
N To be able to use the skills necessary toeffectively build his/her team
33 47 13 07
O To be able to effectively use the (8)behaviours associated with teambuilding
27 47 20 06
P To be able to increase his/her effectivenessas a leader through a better understanding ofhuman behaviour and individual differences.
40 40 13 07

The ROI of Management Training and Development 121
Did you feel that Excellence in People Management positively influenced the on-the-jobs effectiveness of your staff member as a supervisor/manager?
Yes: 81%Uncertain: 19%No: 00%
Improvement since the Program:
What is your staff member now doing as a supervisor/manager that s/he was notdoing prior to attending the program?
• He is setting SMART goals• More humane, open approach to his people• He tends to refer to me less and is more prepared to make decisions• He is less defensive, more confident, now a trustworthy individual• Co-ordinating his time more effectively, his “human” skills regarding his people
have drastically improved.• Great improvement in ability to build and develop his team.• Significant improvement in all her skills• More confidence in coaching others• Listening to staff, not shouting and acting like a dictator
As a result of EPM, what do you estimate to be the increase in your staff member’spersonal effectiveness, expressed as a percent?
Group: 26%
As a result of the training, please estimate (in your local currency) the amount ofmoney that you believe has been saved or earned for your department or thecompany (i.e., reduced absenteeism and turnover, reduced employee complaints,better teambuilding, increased productivity, increase in personal effectiveness, etc.)as a result of your staff member attending the program:
Participant Average: US $19,694
Cost/Benefit Ration: 1: 7.7
ROI (%) 768
The ROI of Management Training and Development122
What is the basis for your estimate?
• Reduced absenteeism and better work climate (teambuilding)• Being able to keep his staff motivated. Less turnover. Greater productivity.• People are willing to now talk to their supervisors.• My estimate is high because as Process Improvement Manager, my staff member is
in a good position to lead cost reduction or service improvement projects. I haveestimated how much it would cost to recruit a person with all those skills already inone person, thanks to a great extent to the course.
• Personal effectiveness. Substantial turnover reductions.• Percentage of turnover, no failure in achieving goals. No need to further use
external program developers and providers (a real save of money).• My staff member’s self-confidence. Group responded to him. Reduced staff
turnover.• The team has worked better together supporting each other and projects. This has
resulted in us not bringing in contractors to do some work.
In my opinion, the overall program was:
• Right on time.• Good!• Very good for my staff member since he needed to experience other ways of doing
things.• Excellent for this individual.• Very Good!• Excellent - also in my new role as business head we use the program.• Good staff meetings, goals/target setting, budgeting, and performance appraisals as a
result of this program.• Useful for all supervisors and managers. It is these fundamental skills that they all
should know and practice.• Excellent, critical for our business.• As a result of EPM, my staff member opened up to new approaches, more reassured
and self-aware.• He is much better at delegating, more professional in his appraisals, very good team
builder and exhibiting greater initiative.• Very useful for my staff member. It confirmed a lot of what she was doing as she
had been in the role for some time before attending EPM.

The ROI of Management Training and Development 123
SECTION THREE
APPENDIXES

The ROI of Management Training and Development124
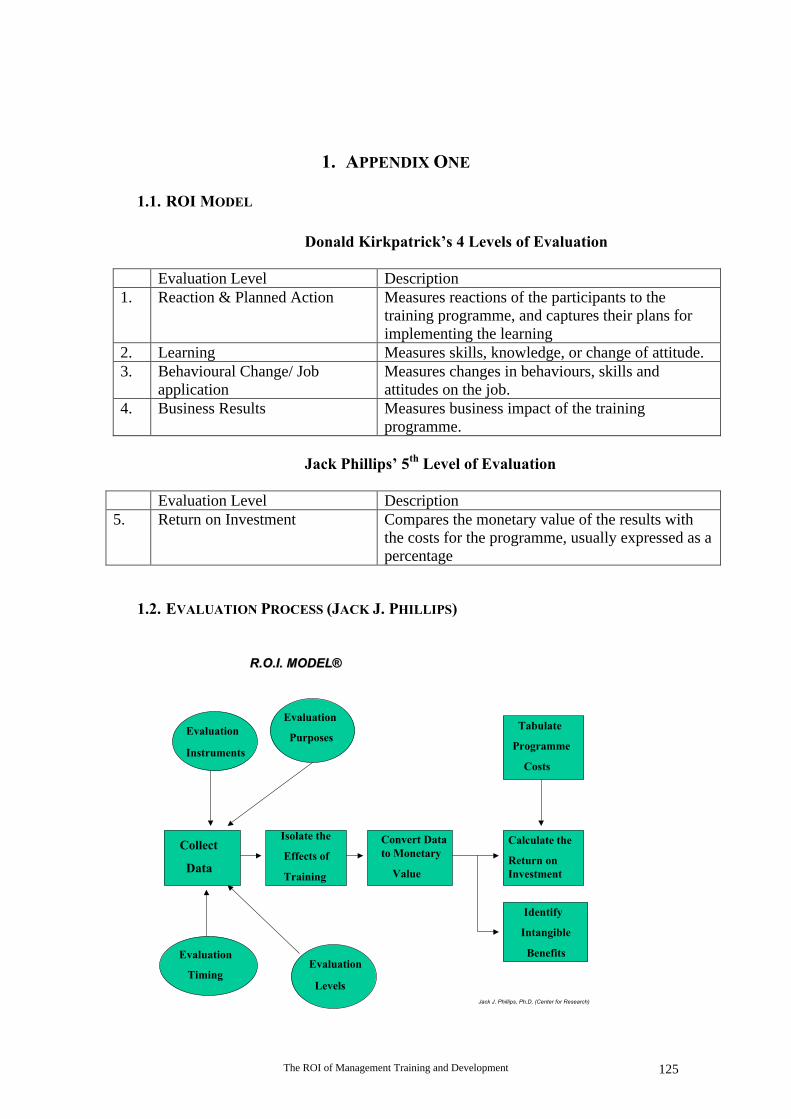
The ROI of Management Training and Development 125
1. APPENDIX ONE
1.1. ROI MODEL
Donald Kirkpatrick’s 4 Levels of Evaluation
Evaluation Level Description1. Reaction & Planned Action Measures reactions of the participants to the
training programme, and captures their plans forimplementing the learning
2. Learning Measures skills, knowledge, or change of attitude.3. Behavioural Change/ Job
applicationMeasures changes in behaviours, skills andattitudes on the job.
4. Business Results Measures business impact of the trainingprogramme.
Jack Phillips’ 5th Level of Evaluation
Evaluation Level Description5. Return on Investment Compares the monetary value of the results with
the costs for the programme, usually expressed as apercentage
1.2. EVALUATION PROCESS (JACK J. PHILLIPS)
R.O.I. MODELR.O.I. MODEL®®
Collect
Data
Isolate the
Effects of
Training
Convert Datato Monetary
Value
Tabulate
Programme
Costs
Calculate the
Return onInvestment
Identify
Intangible
Benefits
Evaluation
Instruments
Evaluation
Purposes
Evaluation
Timing Evaluation
LevelsJack J. Phillips, Ph.D. (Center for Research)

The ROI of Management Training and Development126
1.3. PARTICIPANT BUSINESS LOCATIONS
Brussels Global Coordination Centre: 10 managers
Brussels Hub: 12 managers
Country Offices:
Belgium 8 managersUnited Kingdom 3 managersCzech Republic 3 managersRussian Federation 3 managersGreece 1 managerDenmark 1 manager
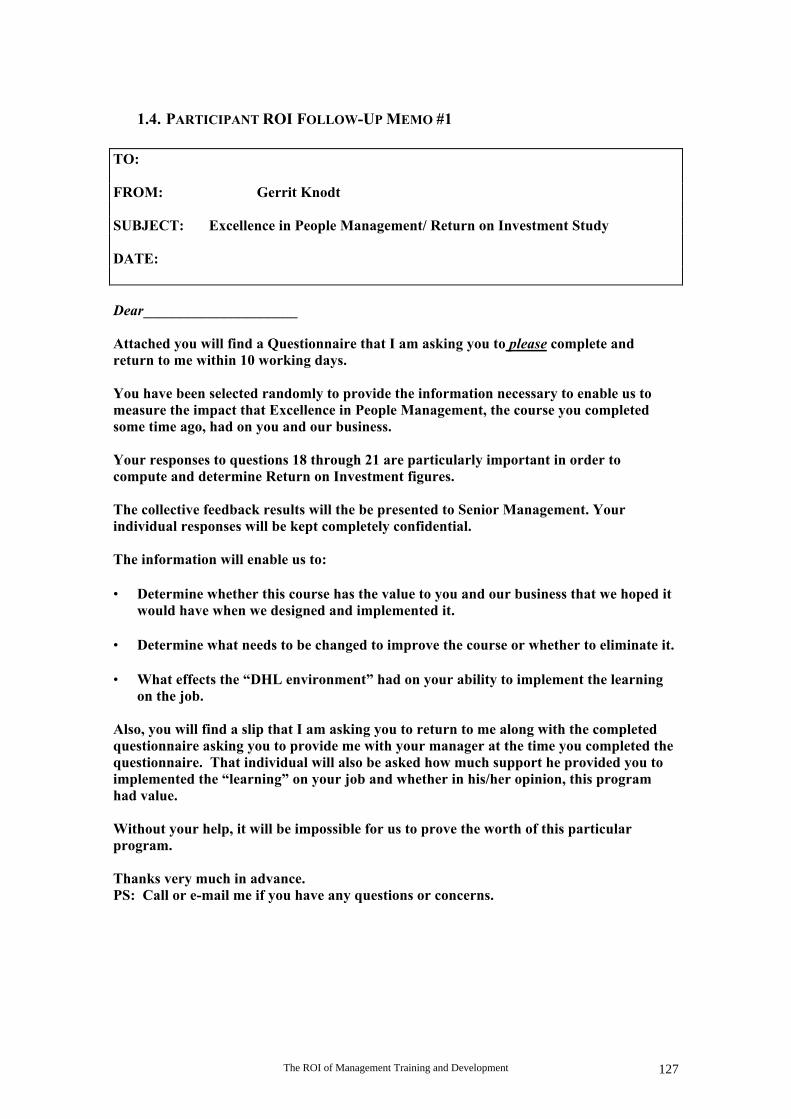
The ROI of Management Training and Development 127
1.4. PARTICIPANT ROI FOLLOW-UP MEMO #1
TO:
FROM: Gerrit Knodt
SUBJECT: Excellence in People Management/ Return on Investment Study
DATE:
Dear_____________________
Attached you will find a Questionnaire that I am asking you to please complete andreturn to me within 10 working days.
You have been selected randomly to provide the information necessary to enable us tomeasure the impact that Excellence in People Management, the course you completedsome time ago, had on you and our business.
Your responses to questions 18 through 21 are particularly important in order tocompute and determine Return on Investment figures.
The collective feedback results will the be presented to Senior Management. Yourindividual responses will be kept completely confidential.
The information will enable us to:
• Determine whether this course has the value to you and our business that we hoped itwould have when we designed and implemented it.
• Determine what needs to be changed to improve the course or whether to eliminate it.
• What effects the “DHL environment” had on your ability to implement the learningon the job.
Also, you will find a slip that I am asking you to return to me along with the completedquestionnaire asking you to provide me with your manager at the time you completed thequestionnaire. That individual will also be asked how much support he provided you toimplemented the “learning” on your job and whether in his/her opinion, this programhad value.
Without your help, it will be impossible for us to prove the worth of this particularprogram.
Thanks very much in advance.PS: Call or e-mail me if you have any questions or concerns.
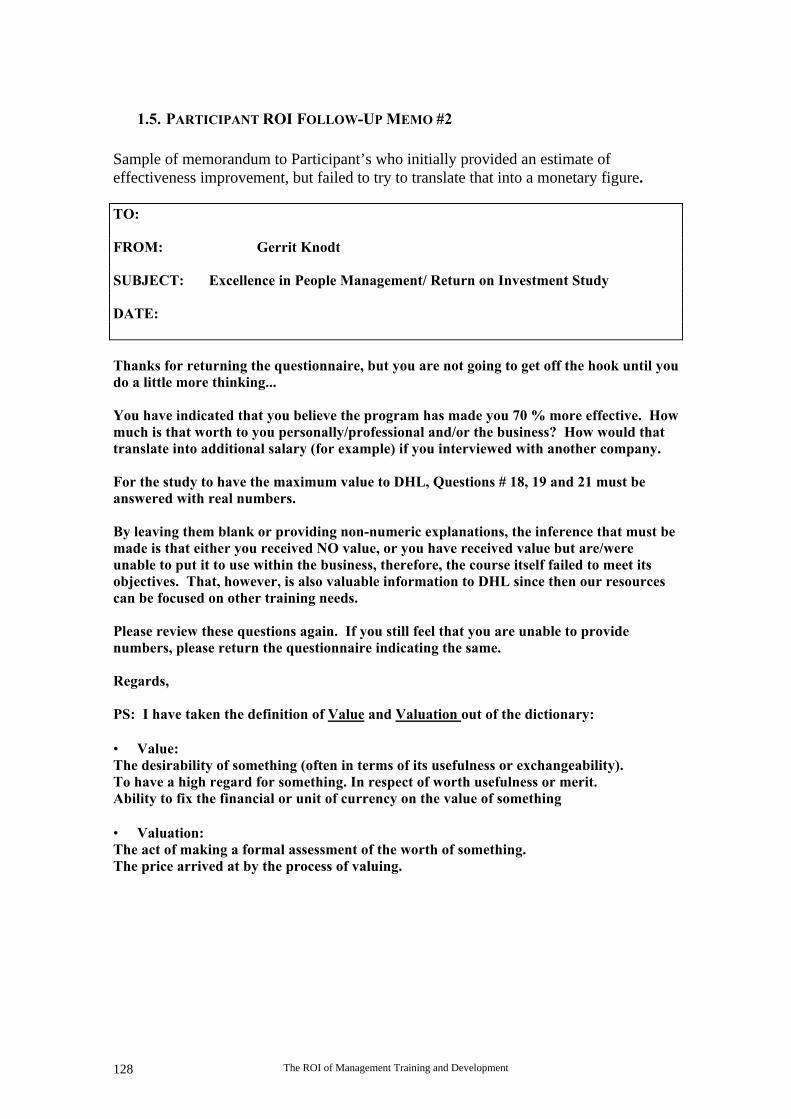
The ROI of Management Training and Development128
1.5. PARTICIPANT ROI FOLLOW-UP MEMO #2
Sample of memorandum to Participant’s who initially provided an estimate ofeffectiveness improvement, but failed to try to translate that into a monetary figure.
TO:
FROM: Gerrit Knodt
SUBJECT: Excellence in People Management/ Return on Investment Study
DATE:
Thanks for returning the questionnaire, but you are not going to get off the hook until youdo a little more thinking...
You have indicated that you believe the program has made you 70 % more effective. Howmuch is that worth to you personally/professional and/or the business? How would thattranslate into additional salary (for example) if you interviewed with another company.
For the study to have the maximum value to DHL, Questions # 18, 19 and 21 must beanswered with real numbers.
By leaving them blank or providing non-numeric explanations, the inference that must bemade is that either you received NO value, or you have received value but are/wereunable to put it to use within the business, therefore, the course itself failed to meet itsobjectives. That, however, is also valuable information to DHL since then our resourcescan be focused on other training needs.
Please review these questions again. If you still feel that you are unable to providenumbers, please return the questionnaire indicating the same.
Regards,
PS: I have taken the definition of Value and Valuation out of the dictionary:
• Value:The desirability of something (often in terms of its usefulness or exchangeability).To have a high regard for something. In respect of worth usefulness or merit.Ability to fix the financial or unit of currency on the value of something
• Valuation:The act of making a formal assessment of the worth of something.The price arrived at by the process of valuing.

The ROI of Management Training and Development 129
1.6. MANAGER OF PARTICIPANT ROI FOLLOW-UP MEMO
TO:
FROM: Gerrit Knodt
SUBJECT: Excellence in People Management/ Return on Investment Study
DATE:
Dear
Attached you will find one questionnaire which I am asking you to please complete andreturn to me within 10 working days.
The questionnaire asks you to reflect on the on-the-job performances of_____________________, who you managed at the time he attended “Excellence in PeopleManagement”.
Your feedback will make it possible for us to measure the impact of Excellence in PeopleManagement on the on-the job performance of those individuals who have attended theprogram. The question we are trying to answer is: Did _________’s attendance of EPMhave an impact on your department at the time and the business. Responses to Questions6,7, and 9 are critical.
The collective feedback of managers like you around the region will be presented toSenior Management. Your responses will be kept confidential.
The information will enable us to:
• Determine whether this course has the value to you and our business that we hoped itwould have when we designed and implemented it. That its value was greater thanits cost to the business.
• Determine what needs to be changed to improve the course or whether to eliminate it.
Without your help, it will be impossible for us to prove the worth of this particularprogram.
Thanks very much in advance.
PS: Call or e-mail me if you have any questions or concerns.

The ROI of Management Training and Development130
1.7. PROGRAM NEEDS ANALYSIS COSTS TEMPLATE
Cost of training and development (fully loaded)
1.7.1. PROGRAM NEEDS ANALYSIS COSTS
Salaries & Employee Benefits - HRD Staff (# of People X Average Salary X Employee Benefits X # of Hours on Project)
Meals, Travel, and Incidental Expenses
Office Supplies and Expenses
Printing and Reproduction of Materials
Outside Services in support of Project
Equipment Expenses
Registration Fees
General Overhead Allocations
Other Miscellaneous Expenses
Total Analysis Costs:
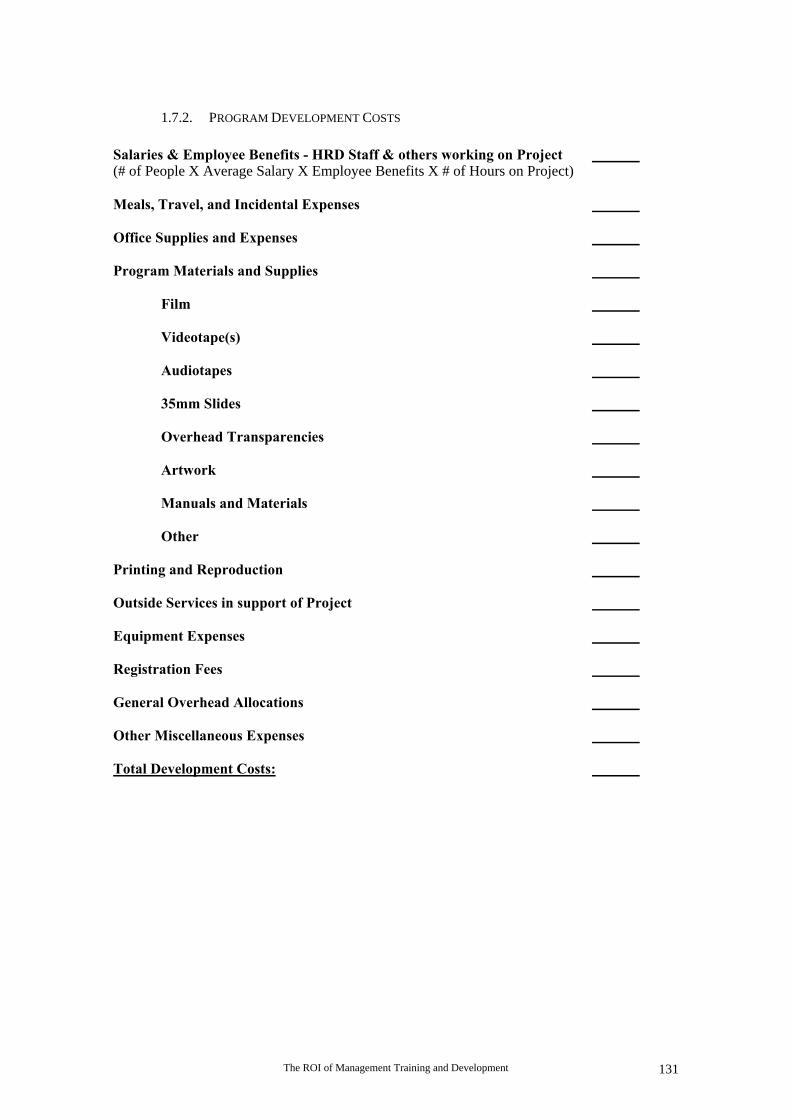
The ROI of Management Training and Development 131
1.7.2. PROGRAM DEVELOPMENT COSTS
Salaries & Employee Benefits - HRD Staff & others working on Project (# of People X Average Salary X Employee Benefits X # of Hours on Project)
Meals, Travel, and Incidental Expenses
Office Supplies and Expenses
Program Materials and Supplies
Film
Videotape(s)
Audiotapes
35mm Slides
Overhead Transparencies
Artwork
Manuals and Materials
Other
Printing and Reproduction
Outside Services in support of Project
Equipment Expenses
Registration Fees
General Overhead Allocations
Other Miscellaneous Expenses
Total Development Costs:

The ROI of Management Training and Development132
1.7.3. PROGRAM DELIVERY COSTS
Participant Costs
Salaries & Employee Benefits (# of Participants X Average Salary X Employee Benefits X Hours. Or Daysof Training Time)
Meals, Travel and Accommodations (# of Participants X Average Daily Expenses X Days of Training
Program Materials and Supplies
Participant Replacement Costs (if applicable)
Lost Production (explain basis of calculation)
Instructor Costs Salaries & Benefits Meals, Travel & Incidental Expenses Outside Services
Facility Costs Facility Rental Facilities Expenses Allocation
Equipment Expense
General Overhead Allocation
Other Miscellaneous Costs
Total Delivery Costs
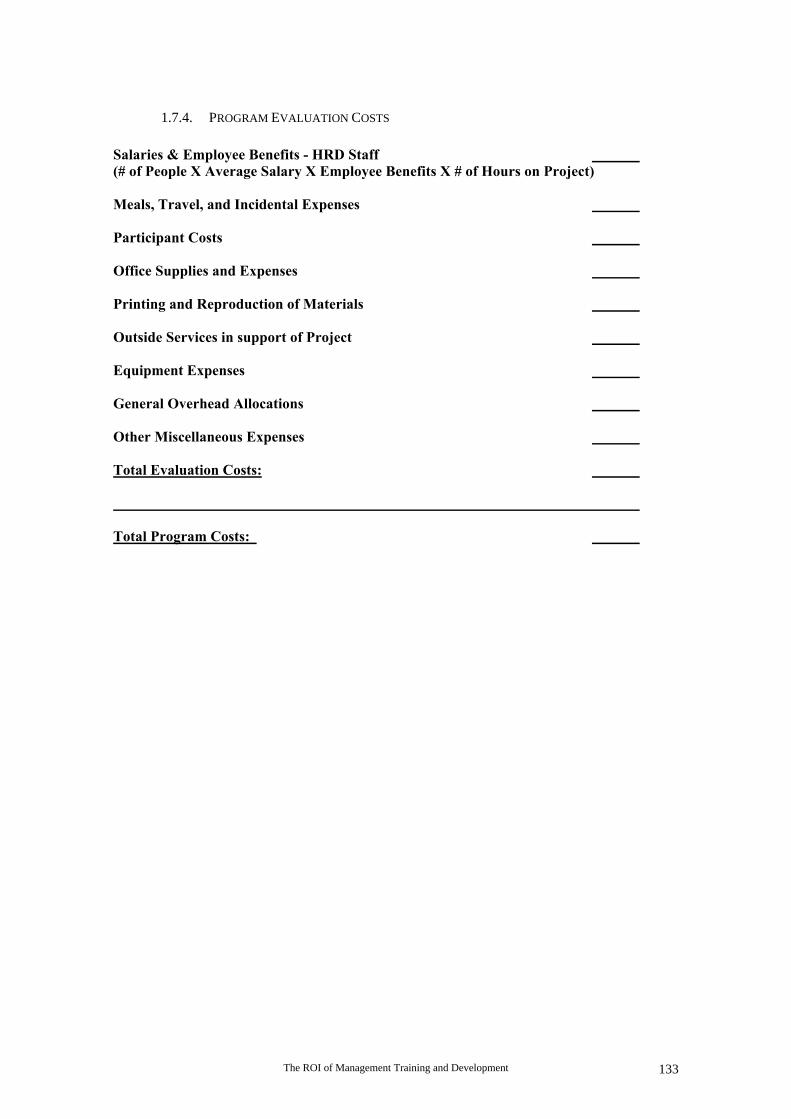
The ROI of Management Training and Development 133
1.7.4. PROGRAM EVALUATION COSTS
Salaries & Employee Benefits - HRD Staff (# of People X Average Salary X Employee Benefits X # of Hours on Project)
Meals, Travel, and Incidental Expenses
Participant Costs
Office Supplies and Expenses
Printing and Reproduction of Materials
Outside Services in support of Project
Equipment Expenses
General Overhead Allocations
Other Miscellaneous Expenses
Total Evaluation Costs:
Total Program Costs:
The ROI of Management Training and Development134
1.8. “EXCELLENCE IN PEOPLE MANAGEMENT” COURSE DESCRIPTION
EXCELLENCE IN PEOPLE MANAGEMENT
Introduction:
This program, through behaviour modelling, role playing, video presentations, casestudies, short lectures and group discussions, enables individuals who have peoplemanagement responsibility to learn or to improve the behaviours, skills and attitudesrequired to create a work climate of respect and productivity.The program is specifically designed to teach the DHL-specific PerformanceManagement Process and identifies the specific behaviours for which each DHLmanager will be held accountable.
Program Overview:
During the first day of the program, using the Management Growth Process (MGP),individuals with at least two direct reports will receive feedback regarding their currentlevel of people management competence. This will provide the personal insightparticipant’s must have to be able to improve their effectiveness as people managers. Atthe conclusion of an entire Performance Management cycle, individuals will againreceive feedback to measure improvement.
Program Content:
• The Role of the People Manager• Effective Interpersonal Communication Skills• Getting Commitment to Goals and Standards *• Coaching for Improved Performance *• Achieving a fair, objective and useful Performance Appraisal *• Rewarding for Excellence• Building an Effective Team
* The three elements of DHL’s Performance Management Process
Program Objectives:
As a result of attending this program, participants will be able to and expected to:• apply the “excellent” behaviours on the job• will be able to effectively set goals and objectives with his/her team members• effectively coach individual team members to maximize their performance• conduct fair, useful and objective performance appraisals• motivate others through recognition, rewards and compensation• build an effective and cohesive team
Who Should Attend:Managers identified through the Management Growth Process (MGP), managers withless than three direct reports and all newly hired or appointed managers.
The ROI of Management Training and Development 135
1.9. BOOKS ON MEASUREMENT & EVALUATION
Return on Investment in Training andPerformance Improvement Programs,Jack J. Phillips, Ph.D., Gulf Publishing,Houston, Texas, 1997.
Handbook of Training and Evaluationand Measurement Methods (3rd Edition),Jack J. Phillips, Ph.D., Gulf Publishing,Houston, Texas, 1997.
Accountability in Human ResourceManagement, Jack J. Phillips, Ph.D.,Gulf Publishing, Houston, Texas, 1996.
Evaluating Training Effectiveness,Second Edition, Peter Bramley,McGraw-Hill Book Company, London,1996.
Evaluating Human Resources, Programs,and Organizations, Byron R. Burnham,Krieger Publishing Company, Malabar,Florida, 1995.
In Action: Measuring Return onInvestment, Volume 1, Jack J. Phillips,Ph.D. (Editor), American Society forTraining and Development, Alexandria,Virginia, 1994.
In Action: Measuring Return onInvestment, Volume 2, Jack J. Phillips,Ph.D. (Editor), American Society forTraining and Development, Alexandria,Virginia, 1997.
Return On Quality, Roland T. Rust,Anthony J. Zahorik, Timothy L.Keiningham, Irwin Publishers, Chicago,Illinois, 1994
Evaluating Training Programs, DonaldL. Kirkpatrick, Berrett-KoehlerPublishers, San Francisco, California,1994.
Make Training Worth Every Penny, JaneHolcomb, Pfeiffer & Company, SanDiego, California, 1994.
Handbook of Training Evaluation andMeasurement Methods (2nd Edition),Jack J. Phillips, Ph.D., Gulf Publishing,Houston, Texas 1991.
The Training Evaluation Process, DavidJ. Basarab, Sr. and Darrell K. Root,Kluwer Academic Publishers, Norwell,Massachusetts, 1992.
Training Evaluation Handbook, A. C.Newby, Pfeiffer & Company, San Diego,California 1992.
Evaluation: A Tool for Improving HRDQuality, Nancy M. Dixon, UniversityAssociates, San Diego, California, 1990.
Improving Human ResourceDevelopment Through Measurement,Third in the Theory-to-PracticeMonograph Series, Catherine M. Sleezer(Editor), American Society for Trainingand Development, Washington, DC,1989.
Training for Impact, Dana GainesRobinson and James C. Robinson,Jossey-Bass, San Francisco, California,1989.
The Balanced Scorecard: TranslatingStrategy into Action. Robert S. Kaplanand David P. Norton,Harvard BusinessSchool Press, 1996.
Evaluation: Relating Training toBusiness Performance, Terence Jackson,University Associates, San Diego,California, 1989.
Forecasting Financial Benefits of HumanResource Development, Richard A.
The ROI of Management Training and Development136
Swanson and Deane B. Gradous, Jossey-Bass, San Francisco, California, 1988.
Achieving Results from Training, RobertO. Brinkerhoff, Jossey-Bass, SanFrancisco, California, 1987.
How to Measure Training Effectiveness,Leslie Rae, Nichols PublishingCompany, New York, NY, 1986.
Evaluating Job-Related Training, BasilS. Deming, American Society forTraining and Development, Washington,DC, 1982.
Costs, Benefits, & Productivity inTraining Systems, Greg Kearsley,Addison-Wesley Publishing, Reading,Massachusetts, 1982.
Evaluating Training Programs, DonaldL. Kirkpatrick, American Society forTraining ad Development, Madison,Wisconsin, 1975.
Evaluation of Management Training,Peter Warr, Michael Bird, and NeilRackham, Gower Press Limited,London, 1970.
The ROI of Management Training and Development 137
2. APPENDIX TWO
MEASURING PERFORMANCE AND THE IMPACT OF MANAGEMENTDEVELOPMENT
By Nigel Habershon
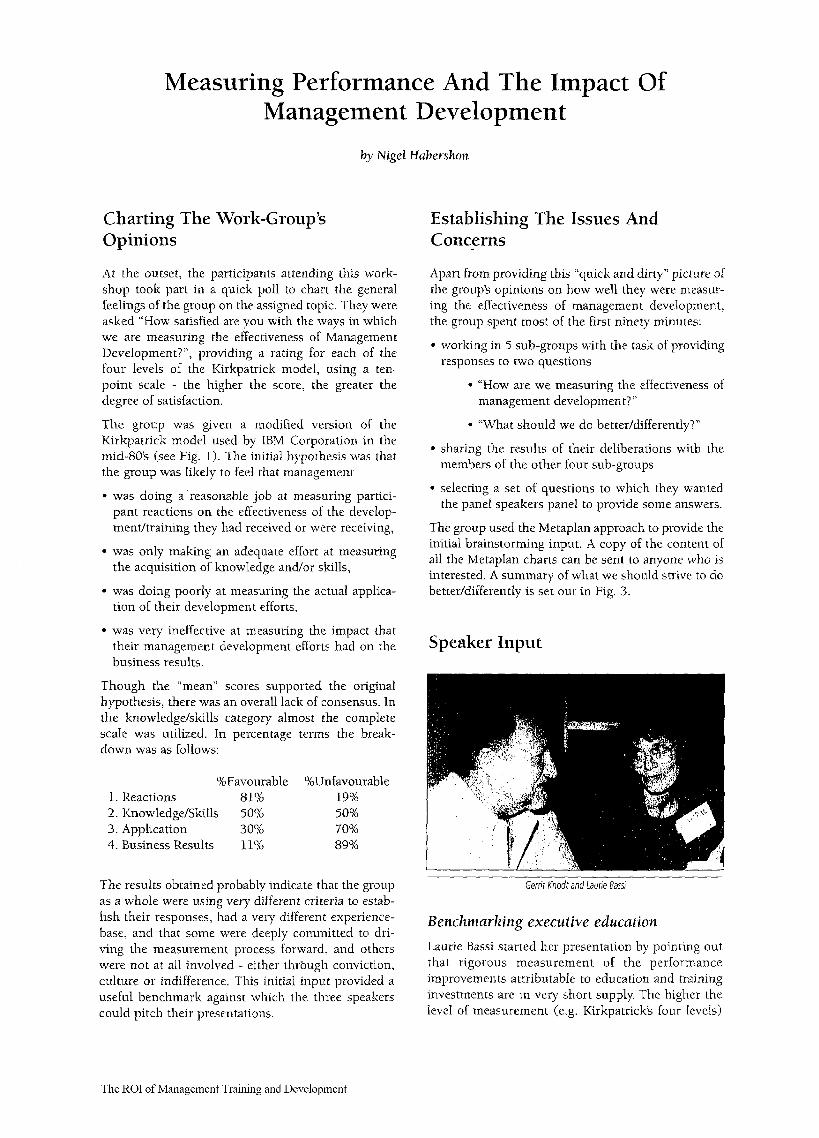
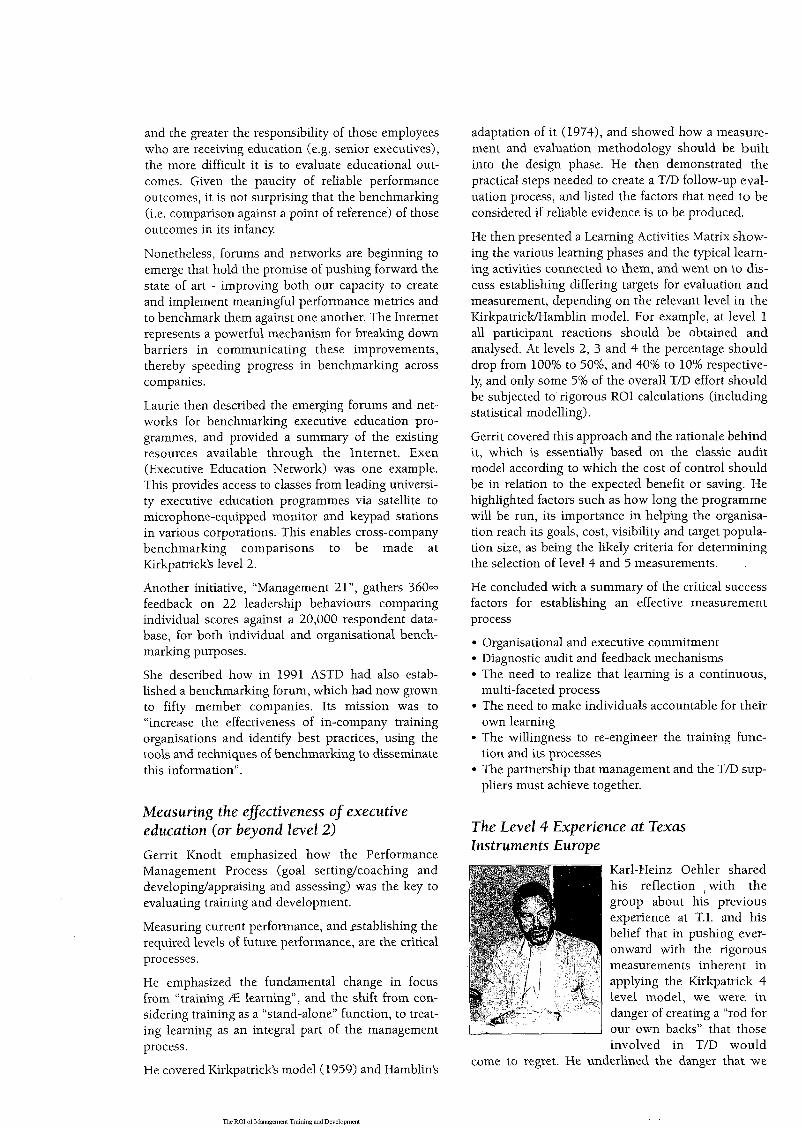
The ROI of Management Training and Development 139
3. APPENDIX THREE
THE ROI OF TRAINING AND DEVELOPMENT EFFORTS
By Nigel Habershon
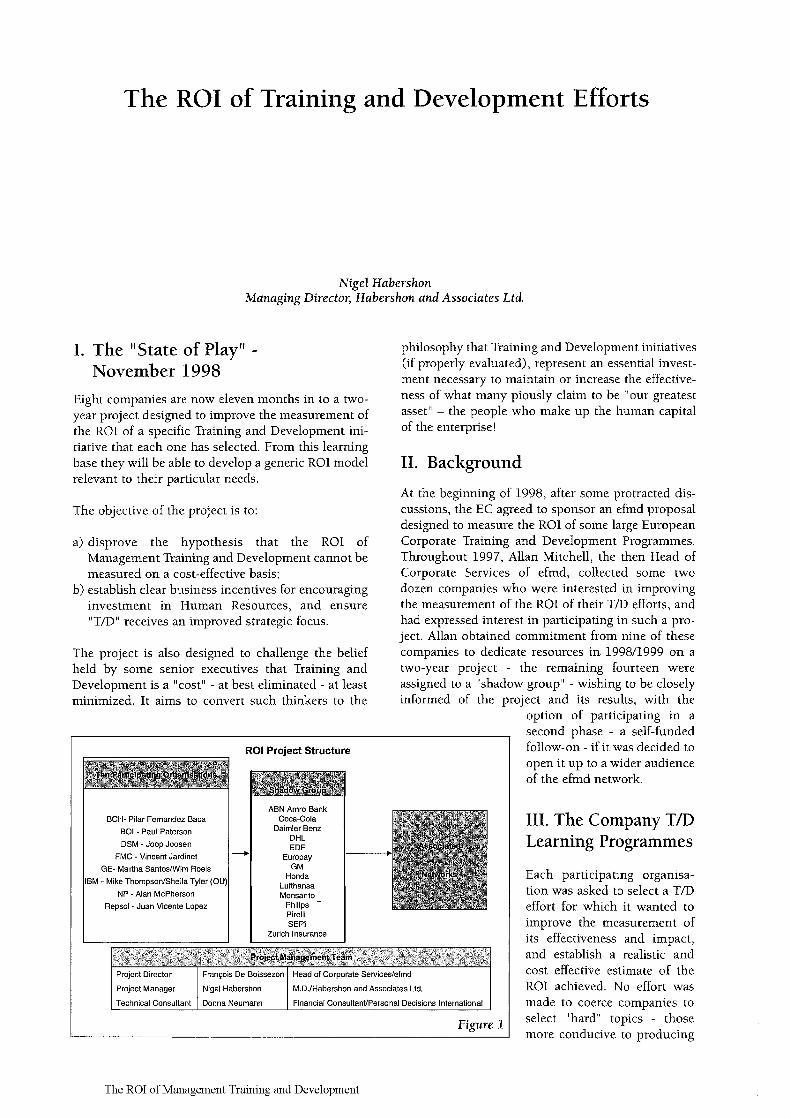
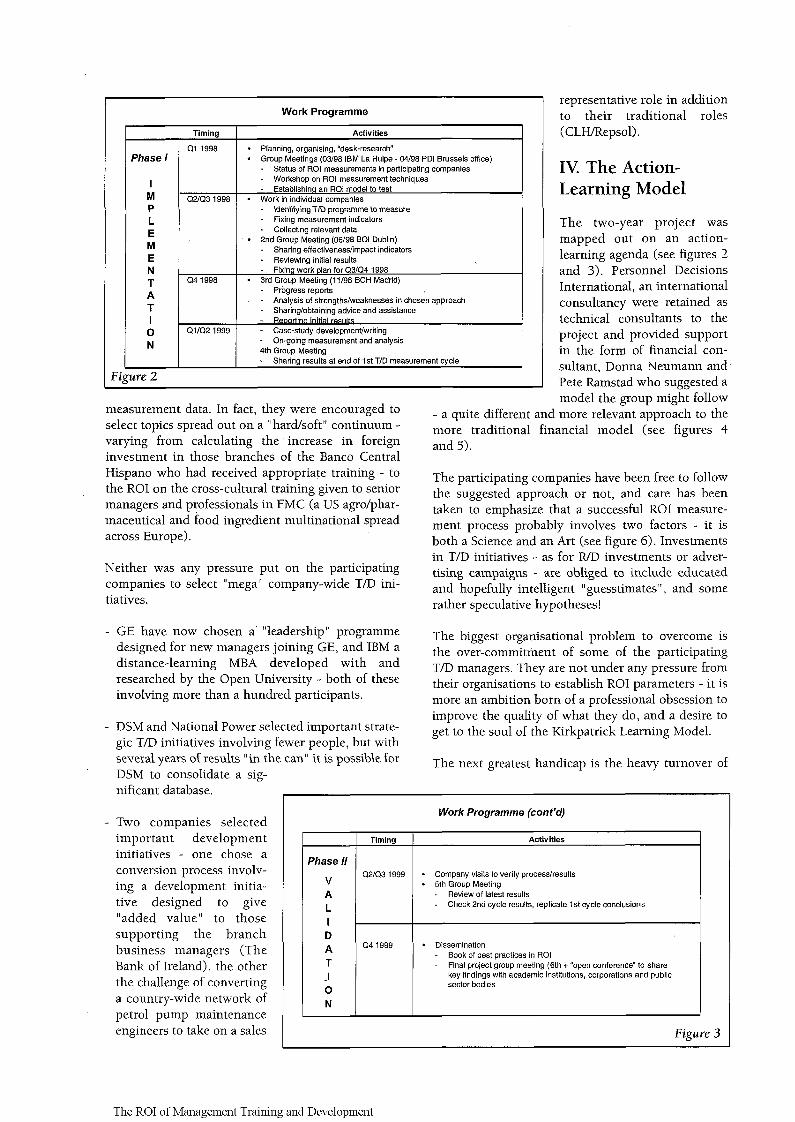
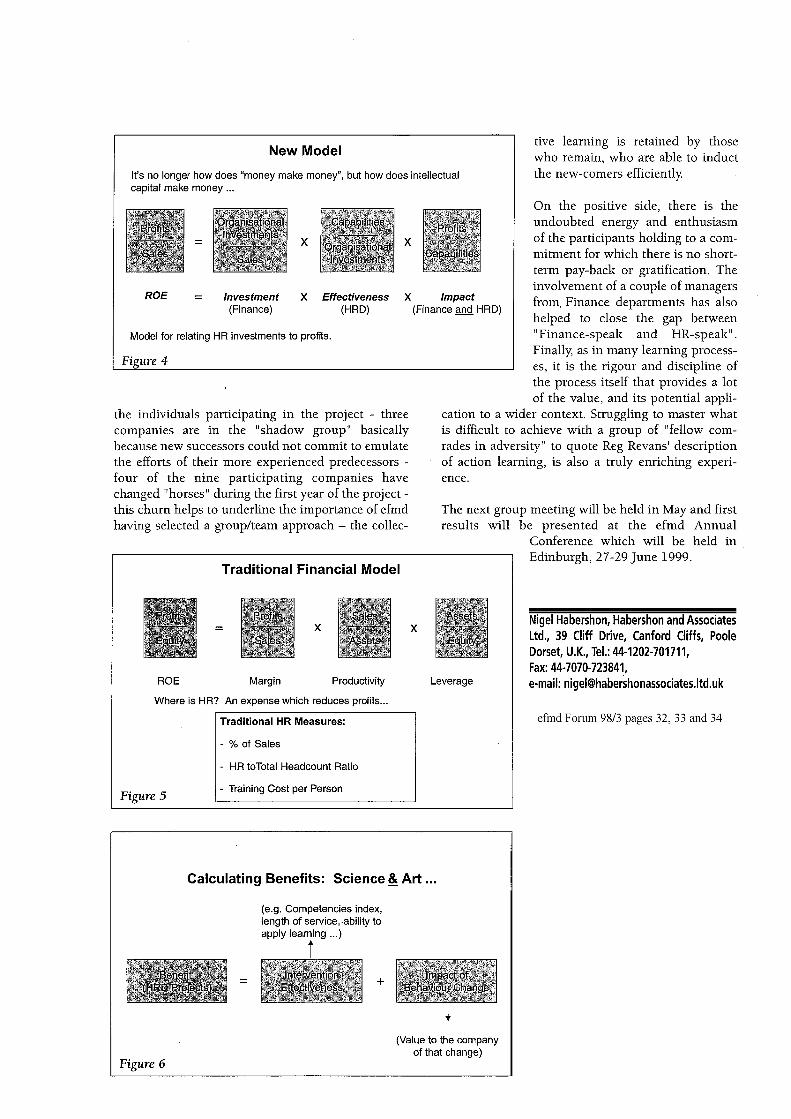
The ROI of Management Training and Development 141
4. APPENDIX FOUR
THE ROI OF TRAINING AND DEVELOPMENT - REVIEW OF ANINNOVATIVE APPROACH TO MEASUREMENT
By Nigel Habershon
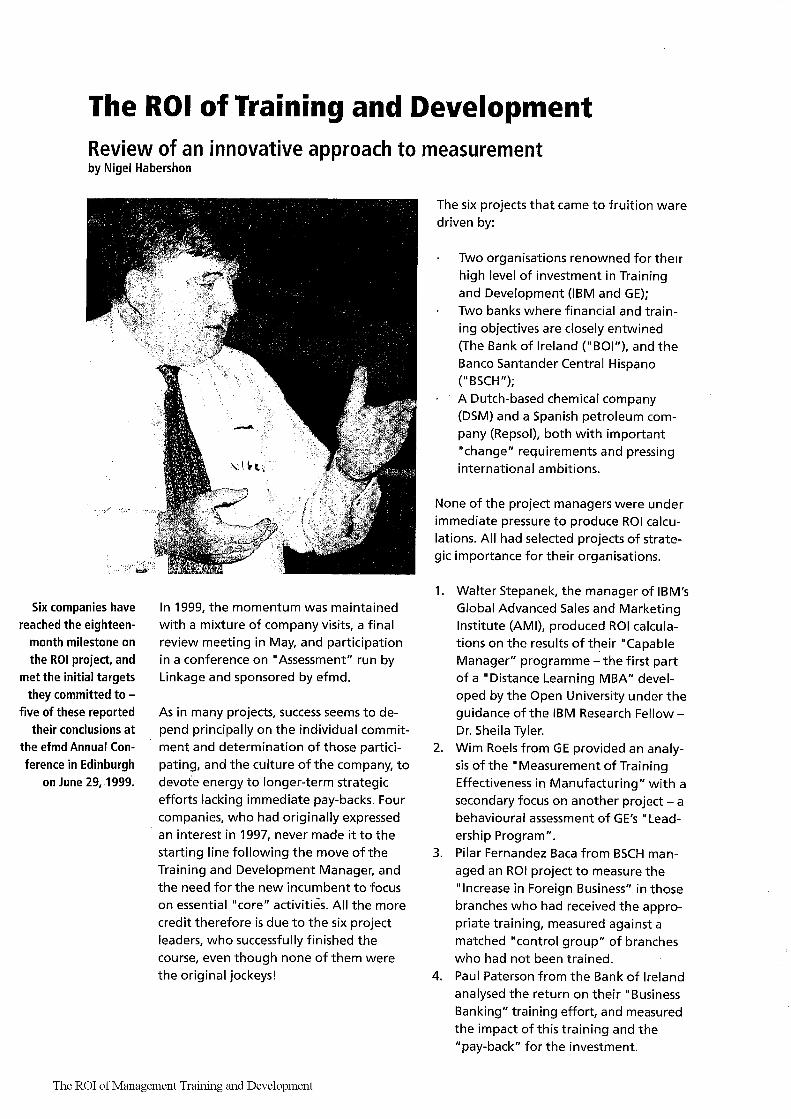
The ROI of Management Training and Development 143
European Foundation For Management DevelopmentRue Gachard 88B-1050 Brussels
Tel.: +32-2-6290810Fax: +32-2-6290811Email: [email protected]
Website: http://www.efmd.be
Copyrights 2002