Embed Size (px)
Citation preview

Hakcipta © tesis ini adalah milik pengarang dan/atau pemilik hakcipta lain. Salinan
boleh dimuat turun untuk kegunaan penyelidikan bukan komersil ataupun
pembelajaran individu tanpa kebenaran terlebih dahulu ataupun caj. Tesis ini tidak
boleh dihasilkan semula ataupun dipetik secara menyeluruh tanpa memperolehi
kebenaran bertulis daripada pemilik hakcipta. Kandungannya tidak boleh diubah
dalam format lain tanpa kebenaran rasmi pemilik hakcipta.
HUBUNGAN ANTARA ADOPSI CT DAN INOVASI DEN GAN PREST ASI PERNIAGAAN PKS DI
MALAYSIA: PENGARUH PENYEDERHANA KELEBIHAN DAYA
SAING
NUR YUHAINIS BINTI AB W AHAB
IJAZAH DOKTOR FA SAFAH UNIVERSITI UT ARA MALAYSIA
2018
HUB UN GAN ANT ARA ADOPSI ICT DAN TN V ASI DEN GAN PREST ASI PERNIAGAAN PKS DJ MALA YSTA:
PENGARUH PENYEDERHANA KELEBIHAN DAY A SAING
Oleh
NUR YUHAINIS BINTI AB AHAB
Tesis diserahkan kepa a Othman Yeop Abdullah, Graduate School of Business,
Universiti Utara Malaysia bagi memenuhi syarat Jjazah Doktor Falsafah
KEBENARAN MEN UNA
Dalam membentangkan tesis ini, bagi memenuhi yarat sepenuhnya untuk ijazah lanjutan Universiti Utara Malaysia, saya bersetuju bahawa Perpustakaan Universiti Utara Malaysia boleh secara bebas membenarkan sesiapa sahaja untuk memeriksa. Saya juga bersetuju bahawa penyelia-penyelia saya atau jika ketiadaan mercka, Dekan Othman Y eop Abdullah Graduate School of Business diberi kebenaran untuk membuat salinan tesis ini dalam sebarang bentuk, samada keseluruhannya atau sebahagiannya bagi tujuan kesarjanaan. Adalah dimaklumkan bahawa sebarang penyalinan atau penerbitan atau kegunaan tesis ini samada sepenuhnya atau sebahagian daripadanya bagi tujuan keuntungan kcwangan tidak dibenarkan kecuali setelah mendapat kebcnaran secara bcrtulis daripada saya. Juga dimaklumkan bahawa pengiktirafan harus diberi kepada saya dan Universiti Utara Malaysia dalam sebarang kegunaan kesarjanaan terhadap sebarang petikan daripada tesis saya.
Sebarang permohonan untuk menyalin atau mengguna mana-mana bahan dalam tesis ini, samada sepenuhnya atau sebahagiannya, hendaklah dialamatkan kepada:
Dekan Othman Yeop Abdullah Graduate School of Business
Universiti Utara Malaysia 060 IO U UM Sintok Kedah Darulaman.
11

PENGAKUAN
"Saya akui penulisan ini adalah hasil saya sendiri kc ali nukilan dan ringkasan yang
tiap-tiap satu saya jelaskan sumbemya"
Nur Yuhainis Bt Ab Wahab (No. Matrik: 95790)
111
2018
ABSTRAK
Pengukuran prestasi pemiagaan adalah penting ke na ianya membantu seseorang pengurus firrna PKS dalam membuat perbandingan kedudukan firmanya dengan pesaing-pesaing di dalam pasaran. Oleh itu, kajian ini bertujuan untuk mencliti hubungan adopsi JCT dan inovasi ke atas prestasi perniagaan firrna PKS dengan kelebihan daya saing berperanan sebagai pembolehubah penyederhana. Rangka kerja pcnyelidikan ini dibentuk adalah berdasarkan kepada literatur sedia ada bagi menguji hubungan di antara pembolehubah-pembolehubah kajian. Resource Based View Theory (RBV) telah digunakan untuk menjelaskan hubungan antara pembolehubahpemboleubah yang dikaji. Untuk menguji secara empirikal rangka penyelidikan kajian ini, data telah dikumpulkan dengan menggunakan kaedah bancian. Sejumlah 1,071 soal selidik telah diedarkan kepada responden di firma-firma PKS dengan menggunakan tcknik persampelan strata scimbang berdasarkan persampelan rawak mudah. Data yang dikumpulkan dianalisis menggunakan pakej statistik untuk sains sosial (SPSS). Kaedah kolerasi Pearson, regresi berganda dan regresi berhierarki telah digunakan untuk menguji hipotesis kajian. Keputusan empirikal kajian menunjukkan bahawa adopsi ICT (faktor teknologi, faktor organisasi, faktor luaran) dan inovasi mempunyai hubungan signiftkan secara positif dengan prestasi perniagaan. Di samping itu, pembolehubah kelebihan daya saing didapati tidak mempunyai kesan penyederhanaan kepada hubungan di antara adopsi ICT dan inovasi dengan prestasi pcrniagaan. Waiau bagaimanapun, hanya satu dimensi dalam kelebihan daya saing (situasi pasaran) memberi kesan penyederhanaan kepada hubungan di antara dimensi-dimensi adopsi ICT (faktor teknologi clan faktor luaran) dengan prestasi perniagaan. Penemuan kajian ini menyarankan agar pihak pengurusan tertinggi firrna PKS menitikberatkan faktor-faktor yang akan meningkatkan prestasi pemiagaan. Selain itu, dapatan kajian ini perlu diberi perhatian oleh pihak kerajaan selaku pembuat dasar serta agensi-agensi kerajaan yang terlibat dalam membangunkan firma-firma PKS. Implikasi kajian, batasan kaj ian, dan cadangan bagi kajian susulan masa hadapan turut dibincangkan.
Kata kunci: adopsi JCT, inovasi, kelebihan daya samg, prestasi permagaan
iv
ABSTRACT
Business perfonnance measurement is important ause it helps SMEs managers compare their finn 's position in relation with its competitors in the market place. Hence, this study aims to examine the relationship between ICT adoption and innovation on SME firms ' business performance with the moderating role of competitive advantage. A research framework was established based on existing literature to test the relationship among these variables. Resource Based View Theory (RBV) was employed to explain the relationship between the studied variables. In order to empirically test the research framework of this study, data were collected by employing a survey instrument. A total of 1,071 questionnaires were distributed to respondents in the SMEs involved using proportionate stratified technique based on simple random sampling. The data collected was analysed using the Statistical Package for Social Science (SPSS). Pearson correlation, multiple regression and hierarchical regression methods were used to test the hypotheses. The empirical results revealed that JCT adoption (technology factor, organizational factor, external factor) and innovation have a significant positive relationship with business performance. In addition, it was found that competitive advantage has no moderating effect on both the relationship between ICT adoption and innovation with business performance. However, only one dimension of competitive advantages (market situation) moderates the relationship between the dimensions of ICT adoption (technology factor, organizational factor) and business performance. The results provide insights for SME's top management for the need to emphasise on factors that will increase business performance. In addition, policy makers in the government as well as SMEs related agencies should consider the findings of this research in enhancing the development of SME's. Research implications, limitations and suggestions for future research were also discussed.
Keywords: ICT adoption, innovation, competitive a antage, business performance
V
PENGHARGAA
Dengan nama Allah, Yang Maha Pemurah lagi Maha Penyayang, serta selawat dan
salam kc atas junjungan besar Nabi Muhammad S.A.W. Alhamdulillah, saya amat
bersyukur kepada Allah S.W.T kerana dengan hidayah dan taufikNya saya dapat
menyempurnakan tesis PhD ini. Penghargaan kbusus dan jutaan terima kasih kepada
penyelia saya, Prof Madya Dr. Shuhymee Ahmad, di atas segala tunjuk ajar,
bimbingan, dorongan, nasihat dan inspirasi yang telah diberikan oleh beliau dalarn
menyiapkan tesis ini. Sesungguhnya pengalaman yang mencabar ini amat bermakna
kepada saya.
Penghargaan dan ucapan terima kasih juga ditujukan kepada pihak Universiti Utara
Malaysia, khususnya pensyarah-pensyarah, staf-staf, rakan-rakan seperjuangan
pelajar PhD di UUM serta semua pihak di atas segala cadangan, maklum balas,
perbincangan, nasihat dan teguran membina dalam memperbaiki mutu kajian ini.
Jutaan tcrima kasih juga ditujukan kepada semua responden (firrna PKS di Malaysia)
yang memberikan kerjasama dan membantu menjayakan kajian ini serta semua pihak
yang terlibat secara langsung mahupun tidak langsung dalam menyiapkan tesis PhD
101.
Penghargaan teristimewa kcpada kedua ibu bapa yang tersayang, Ab Wahab Mat dan
Chek Noorlia Abu Bakar serta seluruh ahli keluarga yang dikasihi, terima kasih di
atas doa yang dipanjatkan, sokongan, kesabaran, nasihat dan kata-kata semangat
yang telah diberikan sehingga kajian ini berjaya disiapkan.
Scmoga Allah S.W.T memberikan keberkatanNya kepada kita semua. Amin.
VI
KANDUNGA
KEBENARAN MENGGUNA 11
PENGAKUAN iii
ABSTRAK lV
ABSTRACT V
PENGHARGAAN Vl
KANDUNGAN Vll
SENARAI JADUAL xii
SENARAI RAJAH xv
SEN ARAI SING KA TAN XVI
BAB 1
PEN GEN ALAN
I.I Pengenalan 1
1.2 Latar Belakang Kajian
1.3 Pernyataan Masalah 5
1.4 Soalan Kajian 12
1.5 ObjektifKajian 12
1.6 Signifikan Kajian 13
1.7 Skop Kajian 14
1.8 Definisi Operasional 15
1.9 Penyusunan Tesis 17
2.0 Penutup 18
BAB 2 19
ULASAN KARYA 19
2.1 Pengcnalan 19
2.2 Prestasi Pemiagaan 19
Vll
2.2.l Faktor yang Mempengaruhi Prestasi Perniagaan 20
2.2.2 Pengukuran Prestasi Perniagaan 23
2.3 Konsep Asas Teknologi Maklumat dan Komunikasi (ICT) 26
2.3.1 Aplikasi Adopsi ICT 27
2.3.2 Konsep E-Dagang 29
2.3.3 Kelebihan Penggunaan E-Dagang 31
2.3.4 Kelemahan dan Halangan Penggunaan E-Dagang 32
2.3.5 Faktor Teknologi, Organisasi dan Persekitaran (TOE Model) 33
2.3.6 Pekembangan ICT di Malaysia 35
2.3.7 Agensi Yang Mengawal Selia Berkaitan Adopsi JCT di Malaysia 39
2.4 Inovasi 43
2.4.1 Klasifikasi Inovasi 44
2.4.2 Inovasi Dalam Kalangan Firma Perusahaan Kecil dan Sederhana 47 (PKS) di Malaysia
2.5 Kelebihan Daya Saing 51
2.5.1 Pembangunan Produk Berbeza 53
2.5.2 Situasi Pasaran 54
2.5.3 Tindak Balas Pasaran (Pelanggan dan Pesaing) 55
2.6 Perusahaan Kecil dan Sederhana (PKS) 55
2.6.1 Definisi PKS 59
2.6.2 PKS di Malaysia 63
2.6.3 Badan Penyelaras PKS di Malaysia 66
2.6.4 PKS dalam Sektor Pembuatan di Malaysia 69
2. 7 Penutup 73
BAB 3 75
PEMBENTUKAN TEORI DAN HIPOTESIS KATTAN 75
3.1 Pengenalan 75
3.2 Teori Dasar Kepada Pembentukan Kajian 75
3.2.1 Teori Pandangan Asas Sumber sebagai Teori Dasar 76
3.3 Hubungan Antara Adopsi ICT dengan Prestasi Perniagaan 77
3.3.1 Hubungan Antara Faktor Teknologi dengan Prestasi Perniagaan 80
3.3.2 Hubungan Antara Faktor Organisasi dengan Prestasi Pemiagaan 81
3.3.3 Hubungan Antara Faktor Luaran dengan Prestasi Perniagaan 82
V111
3.4 Hubungan Antara Inovasi dengan Prcstasi Perniagaan
3.5 Pengaruh Penyederhanaan Kelebihan Daya Saing
3 .5 .1 Pengaruh Penycderhanaan Pembangunan Produk Berbeza
3.5.2 Pengaruh Penyederhanaan Situasi Pasaran
3.5.3 Pengaruh Penyederhanaan Tindak Balas Pasaran Pelanggan
3 .5 .4 Pengaruh Penyederhanaan Tindak Balas Pasaran Pesaing
3.6 Kerangka Konseptual
3.7 Penutup
BAB4
METODOLOGIKAJTAN
4.1 Pengenalan
4.2 Rekabentuk Kajian
4.3 Proses Persampelan
4.3.1 Lokasi Kajian
4.3.2 Populasi Kajian
4.3.3 Unit Analisis dan Pemilihan Responden
4.3.4 Saiz Sampel
4.3.5 Kacdah Persampelan
4.4 Prosedur Mengumpul Data
4.5 lnstrumen Pengukuran
84
88
90
92
93
94
95
97
98
98
98
98
100
100
100
102
103
103
106
108
4.5.1 Instrumen Pembolehubah Prestasi Pcrniagaan (Pembolehubah l 09 Bersandar)
4.5.2 Instrumen Pembolehubah Adopsi JCT (Pembolehubah Tidak 111 Bcrsandar)
4.5.3 Instrumen Pembolehubah Inovasi (Pembolehubah Tidak l 13 Barsandar)
4.5.4 lnstrumen Pembolehubah Kelebihan Daya Saing (Pembolehubah 115 Penyederhana)
4.6 Prosedur Menganalisis Data
4.6.1 Statistik Dcskriptif
4.6.2 Analisis Kolerasi
4.6.3 Analisis Regresi
4.6.4 Ujian Penyederhana
4. 7 Proses Pengujian Soal Selidik (Pra Ujian)
4 .7.1 Kajian Rintis
IX
I I 7
118
119
119
120
120
124
4.8 Analisis Kebolehpercayaan dan Kesahan Instrumen
4.8.1 Analisis Kebolehpercayaan Instrumen
4.9 Kajian Sebenar di Lapangan
4.9.1 Analisis Kebolehpercayaan
4.9.2 Analisis Kesahan
4. IO Penyaringan Data
4.10.1 Bias Maklum Balas
4.10.2 Pengurusan Data Tidak Lengkap
4.10.3 Ujian Pensisih (Outliers)
4.10.4 Ujian Normaliti
4.10.5 Ujian Lineariti
4.10.6 Ujian Multikolineariti
4.11 Penutup
BAB5
DAPATAN KAJIAN
5.1 Pengenalan
5.2 Profit Sampel Kajian
5.2.1 Latar Belakang Responden
5.2.2 Latar Belakang Firrna PKS
5.3 Analisis Deskriptif
5.4 Analisis Kolerasi
5.5 Menjawab Empat Objektif Kajian
125
127
129
130
132
144
144
146
147
149
151
152
153
155
155
155
155
156
158
160
163
166
5.5.1 Objektif Pertama dan Kedua: Hubungan antara Pembolehubah 166 Adopsi ICT dan Inovasi dengan Prestasi Perniagaan
5.6 Pengaruh Pembolehubah Penyederhana Kelebihan Daya Saing: Menentukan Pengujian Hipotesis H3i - H3p
5.6.1 ObjektifKetiga: Pengaruh Pembolehubah Penyederhana Kelebihan Daya Saing Ke atas Hubungan Antara Pembolehubah Adopsi ICT dengan Prestasi Perniagaan
5 .6.2 Objektif Keempat: Pengaruh Pembolehubah Penyederhana Kclebihan Daya Saing Ke atas Hubungan Antara Inovasi dengan Prestasi Perniagaan
5.5 Penutup
X
168
169
204
218
BAB6
PERBINCANGAN DAN KESIMPULAN
6. I Pengenalan
6.2 Gambaran Ringkas Kajian
6.3 Perbincangan Dapatan Kajian
220
220
220
220
222
6.3.1 Objektif Pertama: Hubungan antara Pembolehubah Adopsi ICT 223 dengan Prestasi Perniagaan
6.3.2 Objektif Kedua: Hubungan antara Pembolehubah Inovasi 227 dengan Prestasi Pemiagaan
6.3.3 Objektif Ketiga: Pengaruh Pembolehubah Penycderhana 228 Kelebihan Daya Saing Ke Atas Hubungan antara Pembolehubah Penggunaan ICT dengan Prestasi Pemiagaan
6.3.4 Objektif Keempat: Pengaruh Pembolehubah Penyederhana Kelebihan Daya Saing Ke Atas Hubungan antara Pembolehubah Inovasi dengan Prestasi Perniagaan
6.4 Implikasi Kajian
6.4.1 Implikasi Teoritikal
6.4.2 Implikasi Pengurusan
6.5 Batasan Kajian
6.6 Cadangan Kajian Masa Hadapan
6. 7 Kesimpulan
RUJUKAN
LAMPIRAN A
LAMPIRANB
LAMPIRANC
LAMPIRAND
LAMPIRANE
LAMPIRANF
LAMPIRANG
LAMPIRANH
XI
238
245
245
247
252
253
255
257
306
318
319
328
337
346
349
367
SENARAI JADUAL
Jadual 2.1 Faktor-faktor Yang Mempcngaruhi Prestasi Perniagaan 21 Berdasarkan Kajian-kajian Lepas
Jadual 2.2 Adopsi ICT Dalam Organisasi Pengurusan Terpilih 28
Jadual 2.3 Faktor Penghalang Kepada Aktiviti Inovasi 50
Jadual 2.4 Perbandingan Kriteria Definisi PKS Yang Digunakan 60 Di Pelbagai Negara
Jadual 2.5 Definisi Baharu PKS Berkuatkuasa Pada 1 Januari 2014 63
Jadual 2.6 Pengagihan Bilangan PKS Mengikut Subsektor Dalam 70 Sektor Pembuatan
Jadual 4. I Pengagihan PKS Mengikut Sub-Sektor Dalam Sektor IO I Pembuatan
Jadual 4.2 Rumusan Teknik Persampelan Berstrata Seimbang l 05
Jadual 4.3 Item-Item Adopsi tcknologi maklumat dan komunikasi 11 2 (JCT)
Jadual 4.4 Item-item Inovasi I 14
Jadual 4.5 Item-item Kelebihan Daya Saing 116
Jadual 4.6 Nilai Cronbach Alpha Bagi Ujian Kebolehpercayaan 128 Peringkat Kajian Rintis
Jadual 4. 7 Nilai Cronbach Alpha Bagi Ujian Kebolehpercayaan 13 1 Kajian Sebenar
Jadual 4.8 Analisis Faktor Pembolehubahubah Adopsi ICT 135
Jadual 4 .9 Analisis Faktor Pembolehubah Inovasi 137
Jadual 4.10 Analisis Faktor Pembolehubah Kelebihan Daya Saing
Jadual 4.11 Analisis Faktor Pembolehubah Prestasi
139
140
Jadual 4.12 Ringkasan Keputusan Bagi Analisis Faktor (Principal 143 Component Analysis)
Jadual 4.13 Ujian Bias Maklum Balas (Ujian T Sampel Bebas) 145
Jadual 4.14 Ujian Statistik Skewness dan Kurtosis 151
Jadual 4. I 5 Nilai Tolerance dan VIF Pembolehubah Tidak 153
Xll
Bersandar
Jadual 5. I Latar Belakang Responden
Jadual 5.2 Latar Belakang Firma
Jadual 5.3 Statistik Deskriptif
157
158
160
Jadual 5.4 Ringkasan Keputusan Ujian Kolerasi Antara 165 Pembolehubah
Jadual 5.5 Keputusan Analisis Regresi Berganda Antara 167 Pembolehubah JCT Dan Inovasi Dengan Prestasi
Jadual 5.6
Perniagaan.
Keputusan Analisis Regresi Berganda Pembolehubah JCT (Faktor Teknologi, Organisasi, Faktor Luaran) Dan Inovasi Prestasi Perniagaan.
Antara Faktor
Dengan
168
Jadual 5.7 Kesan Pembolehubah Penyederhana Ke Atas Adopsi 169 ICT
Jadual 5.8 Kesan Pembolehubah Penyederhana (Pembangunan 172 Produk Berbeza) Ke Atas Adopsi ICT (Faktor Teknologi)
Jadual 5.9 Kesan Pembolehubah Penyederhana (Pembangunan 174 Produk Berbeza) Ke atas Adopsi JCT (Faktor Organisasi)
Jadual 5.10 Kesan Pembolehubah Penyederhana (Pembangunan 177 Produk Berbeza) Ke atas Adopsi JCT (Faktor Luaran)
Jadual 5.11 Kesan Pembolehubah Penyederhana (Situasi Pasaran) 179 Ke Atas Adopsi JCT (Faktor Teknologi)
Jadual 5.12 Kesan Pembolehubah Penyederhana (Situasi Pasaran) 184 Kc atas Adopsi ICT (Faktor Organisasi)
Jadual 5 .13 Kesan Pembolehubah Penyederhana (Situasi Pasaran) 186 Ke atas Adopsi ICT (Faktor Luaran)
Jadual 5.14 Kesan Pembolehubah Penyederhana {Tindak Balas 190 Pasaran Pelanggan) Ke Atas Adopsi ICT (Faktor Teknologi)
Jadual 5 .15 Kesan Pembolehubah Penyederhana (Tindak Balas 193 Pasaran Pelanggan) Ke atas Adopsi ICT (Faktor Organisasi)
Jadual 5.16 Kesan Pembolehubah Penyederhana (Tindak Balas 195
Xlll
Pasaran Pelanggan) Ke atas Adopsi JCT (Faktor Luaran)
Jadual 5.17 Kesan Pembolehubah Penyederhana (Tindak Balas 198 Pasaran Pesaing) Ke Atas Adopsi ICT (Faktor Teknologi)
Jadual 5.18 Kesan Pembolehubah Penyederhana (Tindak Balas 200 Pasaran Pesaing) Ke atas Adops-i ICT (Faktor Organisasi)
Jadual 5.19 Kesan Pembolehubah Penyederhana (Tindak Balas 203 Pasaran Pesaing) Ke atas Adopsi ICT (Faktor Luaran)
Jadual 5.20 Kesan Pembolehubah Penyederhana Kelebihan Daya 205 Saing Ke Atas Inovasi
Jadual 5.21 Kesan Pembolehubah Penyederhana (Pcmbangunan 208 Produk Berbeza) Ke atas Inovasi
Jadual 5.22 Kesan Pembolehubah Penyederhana (Situasi Pasaran) 210 Ke atas Inovasi
Jadual 5.23 Kesan Pembolehubah Penyederhana (Tindak Balas 213 Pasaran Pelanggan) Ke atas Inovasi
Jadual 5.24 Kesan Pembolehubah Penyederhana (Tindak Balas 215 Pasaran Pcsaing) Ke atas Inovasi
Jadual 5.25 Ringkasan Keputusan Ujian Hipotesis Kajian 217
XIV
SENARAI RAJ
Rajah 2.1 Taburan PKS mengikut negeri-negeri di Malaysia
Rajah 2.2 Sumbangan Nilai Tambah oleh Subsektor Pembuatan Terpilih 2013
Rajah 3.1 Kerangka Konseptual
Rajah 4.1 Boxplot Sebelum Outlier Dikeluarkan Daripada Analisis
Rajah 4.2 Boxplot Sebelum Outlier Dikeluarkan Daripada Analisis
Rajah 4.3 Histogram Residual Bagi Pembolehubah Inovasi Dengan Prestasi Pemiagaan
Rajah 4.4 Plot Kebarangkalian Normal Bagi Pembolehubah lnovasi
Rajah 4.5 Graf Scatterplot Ujian Lineariti Antara Pembolehubah Inovasi Dengan Prestasi Perniagaan
Rajah 5.1 Garisan Interaksi Kelebihan Daya Saing (Situasi Pasaran) antara Adopsi ICT (Faktor Teknologi) dan Prestasi Perniagaan
Rajah 5.2 Garisan Interaksi Kelebihan Daya Saing (Situasi Pasaran) antara Adopsi ICT (Faktor Luaran) dan Prestasi Pemiagaan
xv
65
73
96
148
148
149
150
152
182
188
SENARAI SINGKA N
TCT Teknologi Maklumat dan Komunikasi
KDNK Keluaran Dalaman Negara Kasar
MCMC Suruhanjaya Komunikasi dan Multimedia Malaysia
MDeC Multimedia Development Corporation
MSC Multimedia Super Coridor
MTDC Perbadanan Pembangunan Teknologi Malaysia
MOSTI Kementerian Sains, Teknologi dan Inovasi
MPKSN Majlis Penyelidikan dan Kemajuan Sains Negara
MPPK Majlis Pembangunan PKS Kebangsaan
MTMOS lnstitut Mikroelektronik Malaysia
NITC Majlis Teknologi Maklumat Negara
NITA National Informational Technology Agenda
PKS Perusahaan Kecil dan Sederbana
XVl
BABl
PEN GEN ALA
1.1 Pengenalan
Dalam Bab l membincangkan tentang latar belakang kajian, pernyataan masalah,
soalan, objektif, signifikan dan skop kajian. Perbincangan bab ini dimulakan dengan
menjelaskan tentang pandangan keseluruhan penyelidikan semasa dan keperluan
untuk mendorong peningkatan prestasi peniagaan Perusahaan Kecil dan Sederhana
(PKS) di Malaysia. Seterusnya, huraian yang menjelaskan soalan mengapa kajian ini
perlu dijalankan dan disusuli dengan objektif kajian. Perbincangan selanjutnya pada
bahagian signifikan kajian, menjelaskan tentang sumbangan basil kajian ini terhadap
teori dan praktis dari pelbagai aspek, skop kajian serta definisi operasional. Bab 1 di
akhiri dengan pcnjelasan tentang susun atur bab dalam tesis ini.
1.2 Latar Belakang Kajian
Usaha untuk memperkasakan sistem ekonomi negara di mata dunia adalah
merupakan salah satu agenda utama Kerajaan Malaysia. Matlamat ini dinyatakan
dengan jclas dalam Wawasan 2020 yang telah diperkenalkan oleh Mantan Perdana
Menteri Malaysia, Mahathir Mohamad bennula pada tahun 1991 . Hasrat untuk
Malaysia mencapai status negara maju menjelang tahun 2020 perlu mensasarkan
pertumbuhan ekonomi pada kadar 7 pcratus setahun (Unit Perancangan Ekonomi,
2013) sud.ah menunjukkan basil yang positif. Hal ini tcrbukti apabila Gabenor Bank
Negara Malaysia mengumumkan prcstasi Keluaran Dalaman Negara Kasar (KDNK)
Malaysia 201 4 meningkat sebanyak 6 peratus dengan nilai RM 835 billion.

The contents of
the thesis is for
internal user
only
RUJUKAN
Abdul Manaf, Bohari. (2006). lsu-isu kontemporari koridor raya multimedia:
Jnovasi teknologi. Selangor, Malaysia: Paerson/ Prentice Hall.
Abdul Rahim, Anuar & Zulaikha, Jamaludin. (2005). Agenda JCT ke arah
pembangunan K-Ekonomi Malaysia. Sintok, Malaysia: Penerbit Universiti
Utara Malaysia.
Abdul Yazid Alias (2016, Disember 16). Inovasi membawa PKS ke peringkat global.
Utusan Malaysia, Retrieved from http://www.utusanmalaysiaonline.com.my
Agresti, A., & Finlay, B. (2009). Statistical Methods for the Social Sciences ( 4th ed.).
Upper Saddle River, NJ: Pearson.
Akkeren, J. and Cavaye, A.L.M. (1999). Factors Affecting Entry-Level Internet
Technology Adoptionby Small Business in Australia: An Empirical Study.
Proceedings of the 10th Australasian Co11ference on information Systems.
Wellington, New Zealand, 1-3 December.
Alipour, F., & Karimi, R. (2011). Mediation role of innovation and knowledge
transfer in the relationship between learning orientation and organizational
performance. International Journal of Business and Social Science, 2(19),
144-147.
AI-Kibsi, G., De Boer, K., Mourshed, M., & Rea, N. P. (2001). Putting citizens on
line, not in line. McKinsey Quarterly, 2, 65-73.
257
Ambastha, A., & Momaya, K. (2004). Competitiveness of firms: Review of theory,
frameworks and models. Singapore Management Review, 26 (1), 45-61.
Armstrong, J. U. S. T., & Overton, T. (1977). Estimating nonresponse bias in mail
surveys. Journal of Marketing Research, 14, 396-402.
Amran Awang. (2006). Orentasi keusahawanan firma dan prestasi Perusahaan Kecil
dan Sederhana (PKS) Bumiputera: Kajian impak penyederhana beberapa
faktor persekitaran yang ditanggap. (Thesis, PHO, Unversiti Sains Malaysia,
2006).
Analoui, F., & Karmi. A. (2002). How chief executives' perception of the
environment impacts on company performance. Journal of Management
Development, 21(4), 290- 305.
Anis Nur Assila Rozrni., Aliimran Nordin., & Mohd Izhar A. Bakar (2018). The
Perception of ICT Adoption in Small Medium Enterprise: A SWOT
Analysis? International Journal of Innovation and Business Strategy, 9( 1 ),
69-79.
Apulu, I., Latham A., & Moreton. R. (2011). Factors affecting the effective
utilization and adoption of sophicticated ICT solutions: Case studies of SMEs
in Lagos, Nigeria. Journal of Systems and Information Technology, 2(13),
125-143. doi: I 0.1108/13287261111135972.
Arendt, L. (2008). Barriers to ICT adoptions in SMEs: how to bridge the digital
divide? Journal of Systems and Information Technology, 10(2), 93-108.
doi: 10.1108/ 13287260810897738.
258
Aragon-Sanchez, A. and Sanchez-Marin, G. (2005), "Strategic orientation,
management characteristics, and performance: a study of Spanish SMEs",
Journal of Small Business Management, 43(3), pp. 287-308.
Arsaythamby, V. & Arumugam, R. (2013). Kaedah analisis & interpretasi data.
Sintok, Malaysia: Penerbit Universiti Utara Malaysia.
Asghar Afshar Jahanshahi., Zhang. S. X., & Brem. A (2013). E-commerce for SMEs:
empirical insights from three countries. Journal of Small Business and
Enterprise Development, 20( 4 ), 849-865. doi: I 0. I 108/JSBED-03-2012-0039.
Azizi Halipah. (2010). Pengaruh kompetensi keusahawanan, struktur organisasi dan
persekitaran terhadap prestasi Perusahaan KeciJ dan Sederhana di Malaysia.
(Thesis, PHD, Unversiti Utara Malaysia, 2010).
Azman Ibrahim (2014, Oktober 28). Bajet: tumpuan ICT wujud pekerjaan untuk
rakyat. Utusan Malaysia, pp 17.
Azman Ibrahim (2015, Februari 13). Malaysia catat KDNK 6 peratus. Utusan
Malaysia, pp l 7.
Azleen Abdul Rahim (20 I 8, Januari 23). Tidak semua kaedah untuk pemasaran
media sosial. Utusan Malaysia, pp 15.
Azrul Hakimie Anuer (2016, November 13). Usahawan desa diperkasa e-Dagang.
Utusan Malaysia. Retrieved from http://www.utusanmalaysiaonline.com.my
Baderisham Jolly. (2013). The extent of management capabilities, relationship
capability and competitive advantage influence on Bumiputera Contractors
259
project performance. Doctor of Business Administration, Universiti Utara
Malaysia.
Babrami, H., & Evans, S. (1987). Stratocracy in high-technology firms. California
Management Review, 30( l ), 51-66.
Baldwin, J. R., & Johnson, J. (1996). Business strategies in more- and less-innovate
firms in Canada. Research Policy, 25(5), 785-804.
Bank Negara Malaysia (2008). Laporan Tahunan PKS 2007. Retrieved from
http://www.bnm.gov.my.
Bank Negara Malaysia (2011, April 8). Mesyuarat Pertama Majlis Pembangunan
PKS Kebangsaan. BNM Siaran Akhbar. Retrieved from
http://www.bnm.gov.my.
Bank Negara Malaysia (2014). Laporan Kestabilan Kewangan dan Sistem
Pembayaran 2013. Retrieved from http://www.bnm.gov.my.
Barney, J.B. (1991). Firm resources and sustained competitive advantage. Journal of
Management 19, 99-120.
Barney, J. B. & Hesterly, W. S. (2006). Strategic management and competitive
advantage. Concepts and cases, Upper Saddle River, New Jersey: Prentice
Hall.
Barney, J.B. & Hesterly, W. S. (2010). VRIO Framework: In Strategic Management
and Competitive Advantage, 68-86.
260
Baron, R. M., & Kenny, D. A. (1986). The moderator-mediator variable distinction
in social psychological research: Conceptual, strategic and statistical
considerations. Journal of Personality and Social Psychology 51(6), 1173-
1 I 82.
Behling, 0., & McFillcn, J.M. (1996). A syncretical model of charismatic/
transformational leadership. Group & Organizational Management 21(2),
163-181.
Bennett, T.M. (2009). A study of the management leadership style preferred by TT
subordinates. Journal of Organizational Culture, Communications and
Conflict. 13(2), 1-26.
Bertschek, I., Kaiser, U. (2004). Productivity effects of organizational change:
microeconometric evidence. Management Science, 50 (3), 394-404.
Bessant, J., & Tidd, J. (2011). Innovation and entrepreneurship: Second Edition:
John Wiley & Son, West Sussex.
Bingi, P., & Khamalah, J. (2000). The challenges facing global e-commerce.
Information Systems Management 17(4), 26-34.
Birley, S. (1985). The role of networks in the entrepreneurial process. Journal of
Business Venturing 1, 107-1 17.
Birman, K. P. (2004). Like it or not, web services and distributed objects.
Communication of the ACM, 47(12), 60-62.
Black, S.E., & Lynch, L.M. (2004). What's driving the new economy?: The benefits
of workplace innovation. The Economic Journal, I J 4.
261
Bloom, N., Sadun, R., & Van Reenen, J. (2010). Americans do I.T. Better: US
Multinationals and the Productivity Miracle. National Bureau of Economic
Research Working Paper Series, (No. 13085).
Blumentritt, T. and Danis, W. (2006), "Business strategy types and innovative
practices", Journal of Management Issues, 18(2), 274-291
Bowen, D. E., & Ostroff, C. (2004). Understanding HRM-Firrn performance
linkages: The role of the "strength" of the HRM system. Academy of
Management Review, 29(2), 203- 221
Bresnahan, T. F., Brynjolfsson, E., & Hitt, L.M. (2002). Information Technology,
Workplace Organization, and the Demand for skilled Labour: Firm Level
Evidence,". Quarterly Journal of Economics, 117(1), 339-376.
Brush, C. G., and R. Chaganti (1998). "Business without Glamour? An Analysis of
Resources of Performance by Size and Age :in Small Service and Retail
Firms," Journal of Business Venturing 14, 233-257.
Brynjolfsson, E., & Hitt, L.M. (1998). Beyond the Productivity Paradox. Computers
are the Catalyst For Bigger Changes. Forthcoming in the Communication of
theACM, 1-19.
Burgelman, R. A. (I 983 ) . A model of the interaction strategic behavior, corporate
context, and the concept. Academy of Management Review, 26, 154-166.
Burgelman, R. A. ( 1984). Design for Corporate Entrepreneurship. California
Management Review, 26, 154-166.
262
Burgelman, R. A., & Sayles, L. R. (1986). Inside corporate innovation: Strategy,
structure and managerial skills. New York: Free Press.
Byrne, B. M. (2010). Structural equation modeling with AMOS: Basic concepts,
applications, and programming. Structural Equation Modeling (2nd ed., Vol.
22). New York: Taylor and Francis Group.
Calantone, R.J., Cavusgil, S.T., & Zhao, Y. (2002). Leaming orientation, firm
innovation capability, and firm performance. Industrial Marketing
Management, 31(6), 515-524.
Cardona, M., Kretschmer, T., & Strobel, T. (2013). ICT and productivity:
conclusions from the empirical literature. Information Economics and Policy
25. 109-125.
Caro1, Y.L., & Mavis, Y.C. (2007). Does innovation lead to performance? An
empirical study of SMEs in Taiwan. Management Research News, 30(2),
115-132.
Castellacci, F. (20 I 0). Structural change and the growth of industrial sectors:
empirical test of a GPT model. Review of Income and Wealth, 56 (3), 449-
482.
Cavana, R. Y., Delahaye, B. L., & Sekaran, U. (2001). Applied business research:
Qualitative and quantitative methods. Milton, Old: John Wiley & Son
Australia.
Chadwick, K. H. (1998). An empirical analysis of the relationships among
entrepreneurial orientation, organizational culture and firm performance.
263
(Doctoral dissertation, Lousiana Tech University, 1998). ProQuest Digital
Dissertations (UMI No. 9840688).
Chandran, D., Kang, K. S., & Leveaux, R. (2001). Internet culture in developing
countries with special reference to e-commerce. Proceedings of the 5th Pacific
Asia Conference on Information Systems (PACIS): Information Technology
for £strategy, Seoul. 656-664.
Chang, C., & Robin, S. (2008). Public policy, innovation and total factor
productivity: an application to Taiwan' s manufacturing industry.
Mathematics and Computers in Simulation, 79(3), 352-367.
Chang-Shuo, L. (2006). Organizational, technological and environmental
determinants of electronic commerce adoption m SMEs in Taiwan.
Unpublished PhD dissertation, Lyn University, US.
Chen, C. Y., Leu, J. D., & Chiou, C. H. (2006). The Impact of E-Supply Chain
Capability on Competitive Advantage and Organizational Performance.
International Journal of Economic and Business Management, 4(5), 419-427.
Chua, Y. P. (2009). Statistik penyelidikan fanjutan: Ujian univariat dan multivariat.
Shah Alam: McGraw-Hill Education.
Churchill, G. A. Jr. ( 1979). A paradigm for developing better measures marketing
constructs. Journal of Marketing Research, 16(1), 64-73.
Churchill, G. A., & Iacobucci, D. (2004). Marketing research: Methodological
foundations. Australia: South Western Thomson Leaming.
264
Chowdhury, S. K., & Wolf, S. (2003). Use of lCTs and the economic performance of
SMEs in East Africa (No. 2003/06). WIDER Discussion Papers//World
Institute for Development Economics (UNU-WIDER).
Christiansen, C. (1997). The innovator's dilemma. MA: Harvard Business School
Press.
Chwelos, P., Benbasat, I., & Dexter, A. S. (2001). Research report: empirical test of
an EDI adoption model. lriformation Systems Research, 12(3), 304-321.
Clayton, T., & Criscuolo, C. (2002). Electronic commerce and business change.
Economic Trends, 583, 62-69.
Coakes, S. J. (2013). SPSS: Analysis Without Anguish; version 20. 0 for Windows.
Queensland: John Wiley&Sons Australia.
Coetzee, M., & Eloff, J. H. P. (2005a). Autonomous trust for web services. Internet
Research. 15(5), 498-507.
Cohen, J. (1988). Set correlation and contingency tables. Applied Psychological
Measurement, 12(4), 425-434.
Conner, K.R. & Prahalad, C.K. (1996). A resource-based theory of the firms
knowledge versus opportunity organization science, 7, 478-496.
Cooper, A. C., & Dunkelberg, W. C. (1986). Entrepreneurship and paths to business
ownership. Strategic Management Journal. 7, 53-68.
Cooper, D. R., & Schindler, P. S. (2006). Business research method: (11th cd).
United States: McGraw-Hill International Edition.
265
Cooper, J. R. ( 1998). A multidimension approach to the adoption of innovation.
Management Decision. 36(8), 493-502.
Cooper, R. G. (l 979). The dimensions of industrial new product success and failure.
Journal of Marketing, 43, 93-103.
Covin, J. G., & Slevin, D. P. (1988). The influence of organization structure on the
utility of an entrepreneurial top management style. Journal of Management
Studies, 25(3), 217-234.
Covin, J. G., & Slevin, D. P. (1989). Strategic management of small firms in hostile
and benign environments. Strategic Management Journal, 10, 75-87.
Covin, J. G ., & Slevin, D. P. (1991 ). A conceptual entrepreneurship as firm behavior.
Entrepreneurship Theory and Practice, 16(1), 7-25.
Covin, J. G., Slevin, D. P., & Heelay, M. B. (2001). Strategic decision making in an
intuitive vs. technocratic mode: Structural and environmental considerations.
Journal of Business Research, 52(1 ), 51-67.
Cragg, P. B., & King, M. (1993). Small-firm computing: Motivators and inhibitors.
Management Information System Quaterly, 17(1), 47-60.
Clayton, T. and Criscuolo, C. (2002), "Electronic commerce and business change",
in Clayton, T. and Criscuolo, C. (Eds), National Statistics, available at:
www .statistics.gov. uk/cci/article.asp?ID= 139
Creswell, J. W. (2012). Educational Research. Planning, Conducting And Evaluating
Quantitative And Qualitative Research: (4th cd). United States: Pearson.
266
Cumming, B. S. ( 1998). Innovation overview and future challenges. European
Journal of Innovation Management, I (1 ), 21-29.
Dai, M., & Yuan, Y. (2013). Product differentiation and efficiencies in the retail
bank industry. Journal of Banking and Finance, 37, 4907-4919.
Damanpour, F. (l 990). Innovation effectiveness, adoption and organizational
pe,:formance. Innovation and Creativity at Work: John Wiley & Sons.
Damanpour, F. (1991). Organizational innovation: a meta-analysis of effects of
determinants and moderators. Academic Management Journal, 34(3), 550-
590.
Damanpour, F., Walker, R., & Avellaneda (2009). Combinitive effects of innovation
types and organizational performance: a longitudinal study of service
organizations. Journal of Management Studies, 38(1 ), 45-65.
Daniel, E., & Grimshaw, D. J. (2002). An exploratory comparison of electronic
commerce adoption in large and small enterprises. Journal of Information
Technology, 17(3), 133-147.
Darroch, J., & McNaughton, R. (2002). Examining the link between knowledge
management practices and types of innovation. Journal of Intellectual
Capital, 3(3), 210-222.
Davis, J. L. (2007). Firm-level entrepreneurship and performance: An examination
and extension of relationships and measurements of the entrepreneurial
orientation construct. (Doctoral dissertation, The University of tcxas at
Arlington, 2007). ProQuest Digital Dissertations (UMI No. 3273959).
267
Dawes, J. (1999). The relationship between subjective and objective company
performance measures in market orientation research: futher empirical
evidence. Marketing Bulletin-Department of Marketing Massey University,
10, 65-75.
Day, G. S. (1991). Learning about markets. Marketing Science Institute. Report June.
91-117
Day, G.S. (1994a). The capabilities of market-driven organizations. Journal of
Marketing, 58(4), 37-52.
DeGeus. A. (1988). Planning As Learning. Harvard Business Review. 66.
(March/April). 70-74.
Deshpande, R., Farley, J.U., Fredick, E., & Webster, J. (1993). Corporate culture,
customer orientation and innovatiness in Japan firms: a quadrad analysis.
Journal of Marketing, 57(1 ), 23-38.
Dess, G. G., Lumpkin, G.T., & Covin, J. (1997). Entrepreneurial strategy making and
firm performance : Test of contingency and cofigurational models. Strategic
Management Journal, 18(9), 677-695.
Dess, G. G., & Richard, B. R. Jr. (1984). Measuring Organizational Performance in
the Absence of Objective Measure. The Case of the Privetely-Held Firm and
Conglomerate Business Unit. Strategic Management Journal, 5(3), 265-273.
Dilek Ozdemir Gungor., & Sitki Gozlu. (2012). Influencing factors of innovation for
Turkish companies. International Journal of Quality Service Sciences, 4(4),
374-386.
268
Dobni C. B. (2008). Measuring innovation culture in organizations. The development
of a generalized innovation culture construct using exploratory factor
analysis. European Journal of Innovation Management, I I ( 4), 539-559.
Dolingger, M. J. (1995). Entrepreneurship: Strategies and Resources: Irwin,
Austine: Australia.
Dolingger, M. J. (2003). Entrepreneurship: Strategies and Resources (3 rd ed.): Upper
Saddle River, New Jersey: Prentice Hall.
Dragnic, D. (2014). Impact of internal and external factors on the performance of
fast-growing small and medium businesses. Journal of Contemporary Issues,
19(1), 119-159.
Drucker, P.F. (2002). The discipline of innovation. Harvard Business Review, 80,
95-102.
Duan, Y., Mullins, R., Hamblin, D., Stanek, S., Sroka, H., Machado, V., & Araujo,
J. (2002). Addressing ICTs skill challenges in SMEs: insights from three
country investigations. Journal of European Industrial Training, 26(9), 430-
441.doi:10.1 108/03090590590210451524.
Edison, H., Nauman, & Torkar, R. (2013). Towards innovation measurement in the
software industry. Journal of Systems and Software, 86, 1390-1407.
Edwards, J. R., & Lambert, L. S. (2007). Methods for integrating moderation and
mediation: A general analytical framework using moderated path analysis.
Psychological Methods, 12(1), 1-22.
269
Eisenhardt, K. M., & Schoonhoven, C. B. (1990). Organizational growth: Linking
founding team, strategy, environment, and growth among U.S. semiconductor
ventures, 1978-1988. Administrative Science Quarterly, 35, 504-529.
Emory, C. W. & Cooper, D. R. (1991). Business research methods. (4th ed.).
Homewood: Irwin.
Esselaar, S., Stork, C., Ndiwalana, A., & Deen-Swarray, M. (2006). ICT usage and
its impact on profitability of SMEs in 13 African countries. Information and
Communication Technologies and Development, 40-47.
European Commision (2005). The new SME definition: User guide and model
declaration. Enterprise and Industry Publication. Retrieved from http:
ec.europa.eu/enterprise/policies/sme/files/sme _ definition/sme _user _guide.pdf
European Commision (2013). A Rocevery on The Horizon. Annual Report on
European SMEs 2012/2013. Retrieved from http:
/www.researchgate.net/profile/Deborah _ Cox/publication/259174 56 7
Fahy, J. (2000). The resource-based view of the firm: Some stumbling-blocks on the
road to understanding sustainable competitive advantage. Journal of
European Industrial Training, 24(2/3/4), 94-104.
Fallah, M. H., & Leecher, T. G. (2008). Global innovation .performance: strategic
challenges for multinational corporations. Journal of Engineering &
Technology Management, 25, Nos 1/2, 58-74.
270
Fatimah Wati Ibrahim, Selamah Maamor & Mukaramah. (2005). Kedah:
Pembangunan dan cabaran / Fatimah Wati Ibrahim, Selamah Maamor &
Mukaramah. UUM Sintok: Penerbit Universiti Utara Malaysia.
Ferreira, J., & Azevedo, S. (2007). Entrepreneurial orientation as a main resource
and capability on small firm's growth, Munich Personal RePEc Archive (Vol.
5682, pp. 1-20).
Fillis, I., Johansson, U. and Wagner, B. (2003). A Conceptualization of the Opportunities
and Barriers to E-business Development in the Smaller Firm. Journal of Small
Businesses and Enterprise Development. Vol. I 0, No.3, pp. 336-344.
Falshaw, J. R., Glaister, K. W., & Ekrem, T. (2006). Evidence on formal strategic
planning and company performance. Management Decision, 44(1 ), 9-30
Freel, M. S. (2000b). Do small innovating firms out perform non-innovatiors? Small
Business Economics, 14(3), 195-210.
Frese, M. , Krauss, S. I., Keith, N., Escher, S., Grabarkiewicicz, R., & Luneng, S. T
(2012). Business owners' action planning and its relationship to business
success in three African countries. Journal of Applied Psychology, 92(6),
1481-1498
Fulford, H., & Doherty, N . F. (2003). The application of information security
policiesin large UK-based organisations: An exploratory analysis.
Information Management and Computer Security, 11(3), 106-114.
Garrett, P. R., Covin, J. G., & Slevin, D. P (2009). Market responsiveness, top
management risk taking and the role of strategic learning as determinants of
271
market ptoneenng. Journal of Business Research, 62, 782-788.
doi: I 0.1016/j.jbusres.2008.06.006.
Geroski, M., & Machin, S. (1992). Do innovating firm outperformed non
innovators? Business Strategy Review, 3(2), 79-90.
Ghobakbloo, M., Arias-Aranda, D., & Benitez-Amado, J. (2011). Adoption of e
commerce applications in SMEs. Industrial Management & Data Systems,
111(8), 1238-1269.
Gibbs, J. L., & Kraemer, K. L. (2004). A cross-country investigation of the
determinants of scope of e-commerce use: an institutional approach.
Electronic Markets, 14(2), 124-137.
Gielnik, M. M., Zacher, H., & Freese, M. (2012). Focus on opportunities as a
mediator of the relationship between business owners' age and venture
growth. Journal of Business Venturing, 2 7, 127-142. doi: 10.1016/j.jbusvent-
2010.05.002.
Gimenez, C., & Ventura, A. (2002). Supply chain management as a competitive
advantage in the Spanish grocery sector. Published Working Paper. No. 2,
04/2002, Universitat Pompeu Fabra' (UPF), Barcelona, Spain
Grandon, E. E., & Pearson, J. M. (2004). Electronic Commerce adoption: An
empirical study of small and medium US businesses, Information and
Management 42(1), 197-216.
272
Gupta, A. K., & Govindarajan, V. (1984). Business unit strategy, managerial
characteristics, and business unit effectiveness. Academy of Management
Journal , 2 7( l ), 25-41.
Haag, S., & Cummings, M. (2013). Management information systems for the
information age. (9th ed). United States: McGraw-Hill International Edition.
Hair Jr., J. F., Anderson, R. E., Tatham, R. L., & Balck, C. W. ( 1995). Multivariate
data analysis with readings. (4th ed). New Jersey: Prentice Hall.
Hair, Jr. J. F., Black, W. C., Babin, B. J., & Anderson, R.E. (2006). Multivariate
Data Analysis: (6th ed.). Upper Saddle River, N.J: Pearson Prentice Hall.
Hair Jr., J. F., Money, A.H., Samouel, P., & Page, M . (2007). Research method for
business. West Susssex: John Wiley & Sons.
Hair, Jr. J. F., Black, W. C., Babin, B. J., & Anderson, R.E. (2010). Multivariate
Data Analysis: A global perspective (7th ed.). New York: Pearson Prentice
Hall.
Haiyang, L. (2001). How does new venture strategy matter in the environment
performance relationship? Journal of High Technology Management
Research, 12(2), 183-204.
Heunks, F. J. (1998). Innovation, creativity and success. Small Business Economics,
10(3), 263-272.
Hellriegel, D., Jackson, S.E. & Slocum, J.W. Jr . (2005). Management: A
competency-based approach (10th ed.). US: South-Western, Thomson
Learning.
273
Hishamuddin Ayub (2014, Mac 4). Galak PKS guna teknologi baharu. Utusan
Malaysia. Retrieved from http://www.utusanmalaysiaonline.com.my
Hong, P.T.T., and Giang, N.B. (2004). Determinants of E-Commerce Adoption in
SMEs. The Fourth International Conference on Electronic Business (ICEB
2004), Beijing.
Hong, W. Y., & Zhu, K. (2006). Migrating to internet-based e-commerce: Factor
affecting e-commerce adoption and migration at the firm level. Informational
& Management, 43(2), 204-221.
Hult, G. T., Hurley, R. F., & Knight, G. A (2004). Innovtiveness: its antecedents and
impact on business performance. Industrial Marketing Management, 33(5),
429-438.
Hurt, T., Joseph, K., & Cook, C. (1997). Scales for the measurement of
innovativeness. Human Communication Research, 4(1), 58-65.
lacovou, C., Benbasat, I., & Dexter, A. S. (1995). Electronic data changeand small
organizations: Adoption and impact of tchnology. Management Information
Systems Quarterly, 19(4), 465-485.
Ionita, D. (2013). Success and Goals: An Exploratory Research in Small Enterprises.
Procedia Economic and Finance, 6(13), 503-511.
Jab a tan Perangkaan Malaysia. (2012), Banci Ekonomi 2011, Retrieved from
http://www.statistics.gov.my.
James, W. M. (2002). Best HR practices fortody's innovation management. Research
Technology Management, 45(1), 57-60.
274
Jennings, D. F., & Lumpkin, J. R. (1989). Function modeling corporate
entrepreneurship: An empirical integrative analysis. Journal of Management,
15(3), 482-492.
Jensen, P. H., & Webster, E. (2009). Another look at the relationship between
innovation proxies. Australian Economic Paper, 48(3), 252-269.
Jimenez-Jimenez, D., & Sanz-Valle, R. (2011). Innovation, organizational learning
and performance . .Journal of Business Research, 64( 4), 408-417.
Johne, A., & Davies, R. (2000). Innovation in medium-sized insurance companies:
how marketing adds value. International .Journal of Bank Marketing, 18(1 ),
6-14.
Jolly, V. K. ( 1997). Innovation in medium-sized insurance compames: how
marketing adds value. International Journal of Bank Marketing, 18(1 ), 6-14.
Jones, M. C., & Beatty, R. C. ( 1998). Commercializing new technologies: Getting
from mind to market. Boston, MA: Havard Business School Press.
Jones, P., Beynon-Davies, P ., & Muir, E. J. (2014). Ebusincss barriers to growth
within the SME sector . .Journal of Systems and Information Technology,
7(1 /2), 1-25.
Joshi, P., Singh, H., & Phippen, A. D. (2004). Web services: Measuring practitioner
attitude. Internet Research, 14(5), 366-371.
Junaidah, H. (2007). Information communications technology (ICT) adoption among
SME owners in Malaysia. International Journal of Business and Information,
2(2), 22 1- 240.
275
Jutla, D., Bodorik, P., & Dhaliwal, F. (2002). Suporting the e-business readiness of
small and medium-sized enterprises: Approaches and metrics. Internet
research, 12(2), 139-164.
Kamukama, N., Ahiauzu, A. and Ntayi, J. (2011) Competitive Advantage: Mediator
of Intellectual Capital and Performance. Journal of Intellectual Capital, 12,
152-164. https://doi.org/10.1108/146919311 I I 097953
Kanter, R. M. (1982). The middle manager as innovator. Havard Business Review,
60(4), 95-106.
Karagozoglu, N ., & Brown, W. B. ( 1998). Adaptive responses by conservative and
entrepreneurial firms. Journal of Product Management, 5(4), 269-281.
Kauffman, R. J., Wang, B., & Miller, T. (2002, January). Strategic 'Morphing' and
the Survivability of E-commerce Firms. In System Sciences, 2002. HICSS.
Proceedings of the 35th Annual Hawaii International Conference. IEEE
Computing Society Press, 8, 2930-2939.
Kementerian Kewangan Malaysia (2014). Laporan Ekonomi 2013/2014. Retrieved
from http://www.treasury.gov.my.
Kementerian Komunikasi dan Multimedia Malaysia Official Website, (2016).
Retrieved from http://nitc.kkmm.gov.my
Kementerian Komunikasi dan Multimedia Malaysia Official Website, (2016).
Retrieved from http://nitc.kkmm.gov.my/index.php/national-ict-
policies/national-it-agenda-nita.
276
Kemcnterian Sains, Teknologi dan Inovasi Official Website, (2014). Mengenai
MOSTJ. Retrieved from http://www.mosti.gov.my.
Keskin, H. (2006). Market orientation, learning orientation and innovation
capabilities in SMEs: an extended model. European Journal of Innovation
Management, 9(4), 396-417.
Khan, M . R., & Motiwalla, L. (2002). The influence of e-commerce initiatives on
corporate performance: An empirical investigation in the United States.
International Journal of Management, 19(3), 503.
Khan, M.J., Dominic, P.D.D., Khan, A., and Naseebullah. (2010). Adoption of E
Commerce in Malaysia and its Affect on the Business Performance: An
Organizational Perspective. Proceeding of Information Technology (JTSim),
20 IO International Symposium 1, 1-I 5.
Khandwala, P. N. ( 1987). Generators of pioneering innovative management: Some
Indian evidence. Organizational Studies, 8( I), 39-59.
Khazanchi, S., Lewis, M. W., & Boyer, K. (2007). Innovation-supportive culture: the
impact of organizational values on process innovation. Journal of Operations
Management, 25(4), 871-884.
King, W. R., & Teo, T. S. H. (1996). Key determinants of facilitatorsand inhibitors
for the strategic use of information technology. Journal of Management
information Systems, 12( 4), 35-53.
277
King, W. R., & Teo, T. S. H. (2000). Assessing the impact oof proactive versus
reactive modes of strategic information systems planning. Omega, 28(6), 667-
679.
Kirby, D. A. (2003). Entrepreneurship. UK. Mc Graw Hill Education.
Klinsontorn, S. (2005). The influence of leadership styles on organizational
commitment and employee performances. (Doctoral dissertation, University
of Nova Southeastern, 2005). ProQuest Digital Dissertation (UMI No.
3255207).
Knox, S. (2002). The broadroom agenda: developing the innovative organization.
Corporate Governance, 2( I), 27-36.
Kreiser, P. M., Marino, L. W., & Weaver, K. M., (2002a). Assessing the relationship
between entrepreneurial orientation, the external environment, and the firm
performance. In Frontiers of Entrepreneurship Research (ms. 199-208) .
Wellesly, MA: Babson College.
Kreiser, P. M., Marino, L. W., & Weaver, K. M., (2002b). Assessing the
psychometric properties of the entrepreneurial orientation scale: A multi
country analysis, Entrepreneurship Theory & Practice, 26(4), 71-94.
Krejcie, R. V., & Morgan, D. W., (1970). Determining sample size for research
activities: Educational and psychology measurement, 30, pp: 607-610.
Kuratko, D. F. & Hodgetts, R. M. (2007). Entrepreneurship: Theory, Process,
Practice, Mason Ohio: (71h ed.). Thomson South Western.
278
Kurnia, S., Alzougool, B., Ali, M., and Alhashmi S.M. (2009). Adoption of
Electronic Commerce Technologies by SMEs in Malaysia. Proceeding of the
42nd Hawaii International Conference on System Sciences, Hawaii.
Lai, V. S., & Guynes, J. L. (1997). An assessment of the influence of organizational
characteristics on information technology adoption: A discriminative
Approach. IEEE Transactions on Engineering Management, 44(2), 146-157.
Lee, T. T., & Koh, A. C. (2002). A managerial perspective on e-commerce
development in Malaysia. Electronic Commerce Research, 2(1/2), 7-29.
Lee, L., Petter, S., Fayard, D., & Robinson, S. (2011 ). On the use of partial least
squares path modeling in accounting research. International Journal of
Accounting Information Systems, 12(4), 305-328.
doi.org/10.10 l 6/j.accinf.2011.05.002
Lewis, B. R., & Byrd, T. A. (2003). Development of a measure for the information
technology infrastructure construct. European Journal of Information
Systems, 12(4), 93-109.
Li, J_ J., & Zhou, K. Z. (2010). How foreign firms achieve competitive advantage in
the Chinese emerging economy: Managerial ties and market orientation.
Journal of Business Research, 63(8), 856-862.
Lily Julienty Abu Bakar. (201 I). Relationship Between Firm Resources And Product
Innovation Performance In Malaysia Small And Medium Enterprises: The
Moderating Role Of Age And Size (Thesis, PHD, Unversiti Utara Malaysia,
2011).
279
Lin, J. H., & Wang, M. Y. (2015). Complementary assets, appropriability and patent
commercialization: Market sensing capability as a moderator. Asia Pacific
Management Review, 20, 141-14 7.
Lippert, S. K. (2001). An exploratory study into the relevance of trust in the context
of information systems technology. Doctoral Dissertation. The George
Washington University, Washington, D.C.
Lopez-Gamero, M. D., Molina-Azorin J. F., & Claver-Cortes, E. (2009). The whole
relationship between environmental variables and firm performance:
Competitive advantage and firm resources as mediator variables. Journal of
Environmental Management, 90(10), 3110-3121.
Lucky, E. 0. I. (2011). Entrepreneurial performance and firm performance. Are they
synonymous: A PhD experience. International Journal of Business and
Management Tomorrow, 1(2), 1-6.
Lumpkin, G. T., & Dess, G. G. (1996). Clarifying the entrepreneurial orientation
construct and linking it to performance. Academic Management review,
21(1), 135-172.
Lumpkin, G. T., & Dess, G. G. (2001). Linking two dimension of entrepreneurial
orientation performance: The moderating role of environment and industry of
life cycle. Journal of Business Venturing, 16, 429-45 I.
Luo, Y. (1999). Environment-strategy-performance relations in small businesses in
China: A case of township and village enterprise in Southern China. Journal
of Small Business Management, 37(1), 37-52.
280
Ma, H. (2000). Competitive advantage and firm performance. Competitiveness
Review, 10(2), 16.
Madrid-Guijarro, A., Auken, H. V., & Garcia, D. (2007). An analysis of factors
impacting performance of Spanish manufacturing firms. Journal of Business
and Entrepreneurship, 20(4), 369-386.
Mahmood Nazar Mohamed. (2005). Cross-cultural limitations in back-translated
tests used in management and social science research. Jurnal Pembangunan
Sosial, 8(Jun & Dis), 45-62.
Majlis Penasihat Ekonomi Malaysia. (2010). Model Baru Ekonomi Untuk Malaysia
Bahagian 1. Kuala Lumpur: Percetakan Nasional Malaysia Berhad.
Malaysian Technology Development Corporation Official Website, (2012). MTDC.
Retrieved from http://www.mtdc.com.my
Martinette, L. A. (2006). The relationship between learning orientation and business
performance: the moderating effect of source of competitive advantage.
Doctor of Business Administration, Nova South Eastern, US.
Martinette, L. A., & Leeson, A. 0. (2012). The relationship between learning
orientation and business performance and the moderating effect of
competitive advantage: A service organization perspective. Journal of Service
Science, 5(1), 43-58.
Maryeni, Y.Y., Govindaraju, R., Prihartono, B., and Sudirman, I. (2012).
Technological and Organizational Factors Influencing the E-Commerce
Adoption by Indonesia SMEs. Proceeding of the 2012 JEEE ICMIT.
281
Mazharul Islam, & Azharul Karim. (2011). Manufacturing practices and
performance. International Journal of Quality and Realibility Management,
28(1), 43-61. Miller, D. (1983). The correlates of entrepreneurship in three
types of firms. Management Science, 29(7), 770-791.
McMillan, I. C., Zemann, L., & Subbanarasimha, P., N. (1987). Criteria
distinguishing successful from unsuccessful ventures in the venture screening
processes. Journal of Business Venturing, 2(2), 123-137.
Meso, P. & Smith, R. (2000). A resource-based view of organizational knowledge
management systems. Journal of Know/ edge Management, 4(3 ), 224-231.
Meyers, L.S., Gamst, G., & Guarino, A.J. (2006). Applied Multivariate Research:
Design and interpretation. London: Sage Publications.
Miller, D. & Camp B. (1985). Exploring determinants of success m corporate
ventures. Journal of Business Venturing, 1 (2), 8 7-105.
Miller, D. & Friesen, P. H. (1978). Archetypes of strategy formulation. Management
Science, 24, 921-933.
Miller, D. & Friesen, P. H. (1982). Innovation in conservative and entrepreneurial
firms: Two models of strategic momentum. Strategic Management Journal,
3, 1-25.
Miller, D. (1987). Strategy making and structure: Analysis and implications for
performance. Academy of Management Journal, 30, 7-32.
282
Miller, D. (1988). Relating Porter's business strategies to environment and structure:
Analysis and performance implications. Academy of Management Journal,
31(2), 280-308.
Mitussis, D. (2010). SME innovation in Zhejiang, China: Potential constraints to
development of widespread innovation. Journal of Knowledge-based
Innovation in China, 2(1), 89-105. doi:10.l 108/17561411011032007.
Mohd Khairuddin, Hashim. (2002). Small and medium-sized enterprises in
Malaysia: Development issues I Mohd Khairuddin Hashim, Syed Azizi Wafa.
Petaling Jaya: Prentice Hall.
Mohd .Khairuddin, Hashim. (2007). SME's in Malaysia: A brief handbook. Pctaling
Jaya. August Publishing Sdn Bhd.
Mohd Majid Konting. (1998). Kaedah penyelidikan pendidikan. Kuala Lumpur:
Dewan Bahasa dan Pustaka.
Mohd Zulkifli Muhammad, Abdul Kamal Char, Mohd Rushdan Yasoa, & Zakiah
Hassan. (2010). Small and Medium Enterprises ( SMEs ) Competing in the
Global Business Environment : A Case of Malaysia, International Business
Research 3(1), 66-75.
Mohd Zaky Zainuddin (2018, Januari 18). Pemula niaga dipelawa guna kemudahan
di MIMOS. Berita Harian.
Morgan, N . A., Slotegraaf, R. J., & Vorhies, D. W. (2009). Linking marketing
capabilities with profit growth. international Journal of Research in
Marketing, 26(4), 284-293.
283
Morgan, N. A., Kaleka, A., & Katsikeas, C. S. (2004). Antecedents of export venture
performance: A theoretical model and empirical assessment. Journal of
Marketing, 68, 90--108.
Mougayar, W. (1998). Opening Digital Markets: Battle Plans and Business
Strategies fir Internet Commerce. New York: McGraw-Hill.
Mpofu, K. C., & Watkins-Mathys, L. (2011). Understanding ICT adoption in the
small firm sector in Southern Afiica. Journal of Systems and lriformation
Technology, 13(2), 179-199. doi:10.1108/13287261 I I l 136007.
Mukharnad Najib & Akira Kiminami. (2011 ). Innovation, cooperation and business
performance: Some evidence from Indonesian small food processing cluster.
Journal of Agribusiness in Developing and Emerging Economies, 1(1), 75-96.
doi: 10.1108/2044083111113 I 523.
Multimedia Development Corporation, (2013). Malaysian Digital Economy Report
2012. Retrieved from http://www.
http://www.digitalmalaysia.my/sites/default/files/dm-report2012.pdf
Murphy, K.R., & Davidshofer, C.O. (1998). Psychological testing: Principles and
applications. (4th ed.). New Jersey: Prentice Hall.
Murphy, G.B., Trailer, J.W., & Hill, R.C. (1996). Measuring performance in
entrepreneurship research. Journal of Business Research, 36(1), 15-23.
doi: 10.10 I 6/0148-2963(95)00159-X.
Nabisan, S., & Wang, Y. M. ( 1999). Technical opm1on: Roadblocks to web
technology adoption? Communications of the ACM, 42(1), 98-IOl.
284
Nabila Yasmin Razib (2015, September 09). PKS disaran manfaat tcknologi JCT.
Utusan Malaysia, Retrieved from http://www.utusanmalaysiaonline.com.my
Naman, J. L., & Slevin, D. P. (1993). Entrepreneurship and the concept of fit. A
model and empirical tests. Strategic Management Journal, 14(2), 137-153.
National Informational Technology Agenda (NIT A). Retrieved from http://
nitc.kkmm.gov.my/index.php/national-ict-policies/national-it-agenda-nita.
Ndubsi, N.O., & Khurram Iftikhar (2012). Relationship between entrepreneurship,
innovation and performance. Journal of Research in Marketing and
Entrepreneurship, 14(2), 214-236. doi: I 0.1108/ 147152012 I I 271429.
Neely, A. (2005). The evolution of performance measurement research:
Developments in the last decade and a research agenda for the next.
International Journal of Operations & Production Management, 25( 12),
1264-1277
Noor Hazlina, A., & Seet, P.S. (2009). Dissecting behaviours associated witth
business failure: A qualitative study of SME owners in Malaysia and
Australia. Asian Social Science, 5(9), 98-104.
Norita Deraman, Armanurah Mohamad, Habshah Bakar, Norashidah Hashim, & Ooi
Yeng Keat. (20 I 0). Keusahawan: Teori dan praktis. Malaysia: McGraw-Hill.
Norshafizah Hanafi. (2012). Business performance of women-owned smes in
Malaysia: learning and entrepreneurial orientations and the mediating roles of
competitive advantage. Doctor of Business Administration, Univcrsiti Utara
Malaysia.
285
Norzaidi Mohd Daud, Chong, S. C., Murali, R., & Intan Salwani Mohamed. (2007).
Intranet usage and manager's perfonnancein the portindustry. Industrial
Management &Data Systems, 107(8), 1227- 1250.
Norzaidi Mohd Daud, Chong, S. C., Murali, R., & Intan Salwani Mohamed. (2009).
E-commerce usage and business performance in the Malaysian tourism
sector: empirical analysis. Information Management & Computer Security,
17(2), 166-185.
Nunally, J.C. (1978). Psychometric theory (2nd ed.). New York: McGraw Hill.
O'Mahony, M., & Vecchi, M. (2005). Quantifying the impact of ICT capital on
output growth: a heterogeneous dynamic panel approach. Economica 72,
615-633
Ojeda-Gomez, J., Simpson, M., Lenny Koh, S. C., & Padmore, J. (2007). Achieving
competitive advantage in the Mexican footwear industry. Benchmarking: An
International Journal, 14(3), 289-305.
Oke, A., Burke, G., & Myres. A. (2007). Innovation types and performance in
growing UK SMEs. International Journal of Operations and Production
Management, 27(7), 735-753.
Ollo-L6pez, A., & Aramendfa-Muneta, M. E. (2012). JCT impact on
competitiveness, innovation and environment. Telematics and lriformatics,
29(2), 204-210.
286
Ongori, H. & Migro, S.O (2010). Information and communication technology
adoption in SMEs: literature review. Journal of Chinese Entrepreneurship,
2(1), 93-104. doi:10.1108/17561391011019041
Online, U. (2017). Bukan mudah menjadi usahawan. Retrieve from
http://www.utusan.com.my/mobile/bisnes/usahawan/8216-bukan-mudah-j adi
usahawan-8217- 1 . 484 3 83
Ostgaard, T. A., & Birley, S. (1994). Personal networks and firm competitive
strategy-A strategy or coincidental match?. Journal of Business Venturing, 9,
281-305.
Otero-Neira, C., Lindman, M., & Fernandez, M. (2009). lnnovation and performance
in SME furniture industries. an international comparative study. Marketing
Intelligence & Planning, 27(2), 216-232. doi 10.1108/EBS-04-2013-0012
Pallant, J. (2011 ). SPSS Survival Manual: A step by step guide to data analysis using
SPSS/or windows (Version 15) (3rd ed.). Corws Nest. Allen & Unwin.
Panuwatwanich, K., Stewart, R. A., & Sherif Mohamed. (2008). The role of climate
for innovation in enhancing business performance: the case of design
firms. Engineering, Construction and Architectural Management, 15(5), 40-
422.
Passemard, D., & Kleiner, B.H. (2000). Competitive advantage in global industries:
Management Research News, 23(7/8), 111-117.doi
10 .1108/01409170010782307
287
Paul, J., Beynon-Davies, P., & Muir, E. (2014). Ebusiness barriers to growth within
the sme sector. Journal of Systems and Information Technology. 7(1/2), 1-25.
Pelham, A M. (1997). Marketing orientation and performance: the moderating
effects of product and customer differentiation. Journal of Business &
Industrial Marketing, 12( 5), 276-296.doi 10.1108/08858629710183257
Penrose, E.T. (1959). The theory of the growth of the firm. New York: Wiley.
Perbadanan Pembangunan Teknologi Malaysia Official Website, (2016). Retrieved
from http://www.mtdc.gov.my
Pcrbadanan Produktiviti Malaysia Official Website, (2012). Technological
Innovation Capabilities of Malaysian-Owned Companies (MyTIC). Retrieved
from http://www.mpc.gov.my
Perbadanan Produktiviti Malaysia Official Website, (2014). Laporan Produktiviti
2013/2014. Retrieved from http://www.mpc.gov.my
Peteraf, M.A. (I 993). The cornerstones of competitive advantage : A resource-based
view. Strategic Management Journal, 14(3), 179-19 I.
Pickernell, D., Paul, J., Packham G., Thomas, B., White, G., & Willis R. (2013). E
commerce trading activity and the SME sector: an FSB perspective. Journal
of Small Business and Enterprise Development, 20( 4), 866-888.
Porter, M. (l 980). Competitive strategy. New York: Free Press.
Porter, M. (1985). Competitive advantage. Creating and sustaining superior
pe,formance. New York: Free Press.
288
Porter, M. (1998). On competition. Boston: Havard Business School Press.
Prajapati, K., & Biswas, S. N. (2011). Effective of entrepreneur network and
entrepreneur self-efficacy on subjective performance: A study of handicraft
and handloom clester. The Journal of Entrepreneurship, 20(2), 227- 247.
Prescott, M. B. and Conger, S. A. (1995) Information technology innovations: a
classification by IT locus of impact and research approach, Data Base for
Advance in Information Systems, 26, 2-3,20-41.
Proudlock, M., Phelps, B., & Gamble, P. (1999). IT adoption strategies: best practice
guidelines for professional SMEs. Journal of Small Business and Enterprise
Development, 6(3), 240- 252.
Pusat Maklumat Sains dan Teknologi Malaysia. Official Website, (2015). Global
Innovation Index (GIi). Retrieved from
http://www.mastic.gov. my/web/guest/ gii.
Quirk, P., & Forder, J. (2003). Electronic commerce and the law. Sydney and
Melbourne, Australia: John Wiley & Sons.
Rahayu, R., & Day, J. (2015). Determinant Factors of E-commerce Adoption by
SMEsin Developing Country: Evidence from Indonesia, Procedia-Social and
Behavorial Sciences, 195, 142-150.
Ramachandran, K., & Ramnarayan, S. ( 1993). Entrepreneurial orientation and
networking: Some Indian evidence. Journal of Business Venturing, 8(6), 513-
525.
289
Ramaswami, S.N., Bhargava, M. & Srivastava, R. (2004). Market-based assets and
capabilities, business processes, and financial performance. Marketing
Science Institute Report (04-102). Issue One, Working Paper Series.
Ramaswami, S.N., Bhargava, M. & Srivastava, R. (2006). Market-based assets and
capabilities, business processes, and financial performance. ZIBS Technical
Report (03-43). Zyman Institute of Brand Science.
Ramdani, B., Chevers, D., & Williams, D. A. (2013). SMEs' adoption of enterprise
applications: A technology-organisation-environment model. Journal of
Small Business and Enterprise Development, 20(4), 735.
Randall, T. R., Morgan, R. M., & Morton, A. R. (2003). Efficient versus responsive
supply chain choice: an empirical examination of influential factors. Journal
of Product Innovation Management, 20(6), 430-443.
Raunch, A., Wiklund, J., Lumpkin, G. T., & Frese, M. (2009). Entrepreneurial
orientation and business performance: An assessment of past research and
suggestions for the future. Entrepreneurship Theory and Practice, Vol. 3(3),
761-787.
Ray, G., Barney, J. B. , & Muhanna, W. A. (2004). Capabilities, business processes,
and competitive advantage: Choosing the dependent variable in empirical
tests of the resource-based view. Strategic Management Journal, 25, 23-37.
Richard, P. J., Devinney, T.M., Yip, G.S., & Gerry, J. (2009). Measuring
organizational performance: Towards methodological best practice. Journal
of Management, 35(3),718-804.
290
Robinson, L. (2009). A summary of Diffusion of Innovations, Changeology: UIT
Cambridge Ltd.
Robson, C. (2000). Real world research: A resources for a social scientists and
practitioner- researchers. Massachusetts: Blackwell Publishers Inc.
Rogers, E. M. (1983) Diffusion of Innovation. Third edition. New York: The Free
Press.
Rogers, E. M. (1995) Diffusion Q/ Innovation. New York: The Free Press.
Roller, L.H., Waverman, L., 2001. Telecommunications infrastructure and economic
development: a simultaneous approach. American Economic Review 91 (4),
909-923.
Romanelli, E. ( 1987). New venture strategies in the microcomputer industry.
California Management Review, 30, l 60-175
Rosli Mohd Saad. (2014). Hubungan antara rancangan perniagaan, sumber
pembiayaan dan persekitaran luaran dengan prestasi perniagaan: Kajian
cmpirikal mengenai PKS di Malaysia (Tcsis PHO, Universiti Utara Malaysia,
2014).
Ruiz- Jimenez, J.M., & Mar Fuentes-Fuentes M. D. (2013). Knowledge combination,
innovation, organizational performance in technology firms. Industrial
Management & Data Systems, 13(4), 523-540.
doi: 10.1 I 08/02635571311322775
Sabhita Marican, (2005). Kaedah penyelidikan sains sosial. Malaysia: Prentice Hall.
291

Sadia, M. (2011). The Impact of Competitive Advantage on Organizational
Performance. European Journal of Business and Management, 3(4), 191-
196.
Safarnia, H., Akbari, Z. & Abbasi, A. (2011) Review of Market Orientation &
Competitive Advantage in the Industrial Estates Companies (Kerman, Iran):
Appraisal of Model by Amos Graphics. World Journal of Social Sciences,
1(5), 132- 150.
Salavou H. (2002). Profitability in market oriented SMEs: does product innovation
matter? European Journal of innovation Management, 5(3), 164-171.
Sandberg, W.R., & Hoffer C. W. (1987). Improving new venture performance: The
role of strategy, industry structure, and the entrepreneur. Journal of Business
Venturing, 2, 5-28.
Santos, A. T. (2004). The influence of entrepreneurial orientation, focus of attention,
and environmental turbulence on the strategy-performance relationship.
(Doctoral dissertation, Alliant International University, 2004 ). ProQuest
Digital Dissertations (UMI No. 3142055).
Sany Sanuri Mohd Mokhtar. (2007). The relationship between market orientation
and quality orientation and its impacts on the performance of Malaysia
manufacturing firms. (Thesis PHD, Universiti Utara Malaysia, 2007).
Sapienza, H.J., Smith, K.G., & Gannon, M.J. (1988). Using subjective evaluation of
organizational performance in small business research. American Journal of
Small Business, 12, 45-53
292
Saunila, M. (2014). Innovation capability for SME success: perspectives of financial
and operational performance. Journal of Advances in Management Research,
11(2), 163-175.
Schafer, D. S., (1990). Level of the entrepreneurship and scanning source usage in
very small business: Entrepreneurship Theory & Practice, 15(2), 19-31.
Schumacker, R. E., & Lomax, R. G. (2004). A Beginner's Guide to Structural
Equation Modeling (2nd ed.). New Jersey: Lawrence Erlbaum Associates.
Schumpeter, J. A. (1947). Creativity response in economic history. The Journal of
Economic History, 7(2), 149-159.
Sharifonnasabia, F., Raj, R. G., & Marsukia, M. Z. (2018). The Effect Of Conception
Of Internet Usage And Smes' Activities On Organizational Performance
Among Tourism Enterprises In Malaysia. Malaysian Journal of Computer
Science, 31(3), 210-227.
Sekaran, U. (2000). Research method for business: A skill-building approach. New
York: John Wiley & Sons.
Sekaran, U. (2000b). Research methods for business. In Research method~ for
business (pp. 89-117).
Sekaran, U. (2003). Research method for business: A skill-building approach. New
York: John Wiley & Sons.
Sekaran, U., & Bougie R. (2013). Research method for business: A skill-building
approach. New York: John Wiley & Sons.
293
Senge, P. (1990). The leader's new work: building learning organizations. Sloan
Management Review, 32(1), 7-23.
Seyal, A. H., & Rahman, M. N. A. (2003). A preliminary investigation of e
commerce adoption in SMEs in Brunei. Journal of Global Information
Technology Management, 6(6), 6-26.
Shah, J. R., & Murtaza, M. B. (2005). Effective customer relationship management
through web services. The Journal of Computer Information Systems, 46(1 ),
98-109.
Shuhymee Ahmad. (2011). Hubungan antara orientasi keusahawanan, gaya
kepimpinan dan persekitaran luaran dengan prestasi pcmiagaan: Satu kajian
empirikal mengenai PKS di Malaysia (Tesis PHD, Universiti Utara Malaysia,
2011).
Simon, H. (2009), Hidden champions of the twenty-first century, The success
strategies of unknown world market leaders, Springer, New York, NY.
Simpson, P. M., Siguaw, J. A., & Enz, C. A. (2006). Innovation orientation
outcomes. The good and the bad. Journal of Business Resources, 59, 1131-
1141.
Slater, S. F. & Narver, J. C. (1994a). Does competitive environment moderate the
market orientation-performance relationship? Journal of Marketing, 58, 46-
55.
294
Slevin, D. P., & Covin J. G. (1990). Juggling entrepreneurial style and organization
structure: How to get yur act together. Sloan Management Review, 31(2), 43-
53.
SME Corporation Malaysia Official Website, (2010). Laporan Tahunan PKS
2009/10. Retrieved from http://www.smecorp.gov.my
SME Corporation Malaysia Official Website, (2011 ). SME Census 2011. Retrieved
from http://www.smecorp.gov.my
SME Corporation Malaysia Official Website, (20 12). Laporan Tahunan SME Corp
Malaysia 2011. Retrieved from http://www.smecorp.gov.my
SME Corporation Malaysia Official Website, (2012). Pelan Induk PKS 2012-2020.
Retrieved from http://www.smecorp.gov.my
SME Corporation Malaysia Official Website, (2013). Laporan Tahunan PKS
2012113. Retrieved from http://www.smecorp.gov.my
SME Corporation Malaysia Official Website, (2014). Laporan Tahunan PKS
2013/14. Retrieved from http://www.smecorp.gov.my
SME Corporation Malaysia Official Website, (2015). Laporan Tahunan PKS
2014/15. Retrieved from http://www.smecorp.gov.my
SME Corporation Malaysia Official Website, (2015). Pelan Tindakan Bersepadu
PKS 2014. Retrieved from http://www.smecorp.gov.my
SME Corporation Malaysia Official Website, (2016). Laporan Tahunan PKS
2015116. Retrieved from http://www.smecorp.gov.my
295
SME Corporation Malaysia Official Website, (2017). Laporan Tahunan PKS
2016/17. Retrieved from http://www.smecorp.gov.my
Smith, T., (1996). Accounting for Growth. Stripping the camouflage from company
accounts. Randoms House, London.
Smith, T.M., & Reece, J. S. (1999). The relationship of strategy, fit, productivity and
business performance in a services setting. Journal of Operation
Management, 17(2), 145-161. doi: 10.1016/S0272-6963(98)0003 7-0.
Soh, C., Mah, Q. Y., Gan, F. J., Chew, D., & Reid, E. (1999). The use of the Internet
for business: The experience of early adopters in Singapore. Internet
Research, 7(3), 217-228.
Song, M. X., & Parry, M. E. (1992). The R&D-marketing interface in Japanese high
technology firms. Journal of Product Innovation Management, 9(2), 91-112.
Srivastava, Rajendra, K., Tasadduq A., Shervani, & Liam Fahey. (1998). Market
based assets and shareholder value: A framework for analysis. Journal of
Marketing, 62, 2-18.
Stansfield, M., & Grant, K. (2003). An investigation into issues influencing the use
of the Internet and electric commerce among small-medium sized enterprises.
Journal of Electronic Commerce Research, 4(1), 15-33.
Stevenson, H., & Gumpert, D. (1985). The heart of entrepreneurship: Havard
Business Review, Apr-May, 85-94.
Stiles, P. & Kulvisaechana, S. (2004). Human capital and performance in puhlic sector,
Cambridge: Judge Institute of Management, University of Cambridge.
296
Stuart, R., & Abetti, P. A. (1987). Start-up ventures: Towards the prediction of initial
success. Journal of Business Venturing, 2, 215-230.
Subramaniam, A., & Nilakanta, S. (1996). Organizational innovativeness: exploring
the relation-ship between organizational deterrminants of innovation, types of
innovations, and measures of organizational performance. International
Journal of Management Science, 24(6), 631-647.
Sulaiman Ainin., Farzana Parveen., Sedigheh Moghavvemi., & Noor Isrnawati Jaafar
(2015). Industrial Management and Data Systems, 115(3), 570-588.
Sundbo, J. (2003). Innovation and strategic reflexivity: an evolutionary approach
applied to service in Shavinina, L.V. (Ed). The International Handbook on
Innovation, 1st ed., Elsevier Science Ltd., Oxford, 97-114.
Suriati Zainal Abidin. (2014). Innovation process, innovation outcome and firm's
performance in the Malaysian electrical and electronics industry (Tesis PHD,
Universiti Utara Malaysia, 2014).
Suruhanjaya Komunikasi dan Multimedia Malaysia Official Website, (2010).
Mengenai SKMM. Retrieved from http://www.skmm.gov.my
Syed Shah Alam. (2009). Adoption of internet in Malaysians. Journal of Business
and Enterprise Development, 16(2), 240-255.
Tabachnick, B. G., & Fidell, L. S. (2001). Using Multivariate Statistics. (4th Edition).
Boston, MA: Allyn & Bacon.
Talke, K., Salomo, S., & Kock, A. (2011 ). Top management diversity and strategic
innovation orientation: the relationship and consequences for innovativeness
297
and performance. Journal of Product Innovation Management, 28( 6), 8 I 9-
832.
Tan, J., & Tan, D. (2005). Environment-strategy co-evaluation and co-allignment: A
staged model of Chinese SOEs under transition. Strategic Management
Journal, 26(2), 141-157.
Tan, K.S., Chong, S.C., & Lin B. (2009). Internet-based ICT adoption among small
and medium enterprises: Malaysia's perspective. Industrial Management &
Data Systems, 109(2), 224-244.
Tan, K.S., Chong, S.C., Lin B., & Eze, U. C. (2010). Internet-based ICT adoption
among SMEs. Journal of Enterprise Information Management, 23(1), 27-55.
doi: 10.1108/ 17410391011008897
Tan, M., & Teo T. S. H. (1998). Factor influencing the adoption of the Internet in
Singapore. International Journal of electronic Commerce, 2(3), 5-18.
Tang, Y., Wang, P., & Zhang, Y. (2007). Marketing and business performance of
construction SMEs in China. Journal of Business and Industrial Marketing,
22(2), 118-125. doi:10.1018/08858620710730230
Teo, H. H., Wei, K. K., & Benbasat, I. (2003). Predicting intention to adapt
interorganizational linkages: an institutional perspective. Management
Information System Quarterly, 27(1), 19-49.
Teo, T. S. H., & Pian, Y. (2003). A contingency perspective on Internet adoption and
competitive advantage. European Journal of Information Systems, I 2(2), 78-
92.
298
Teo, T. S. H., Tan, M., & Buk, W. K. ( 1997). A contingency model of Internet
adoption in Singapore. International Journal of Electronic Commerce, 2(2),
57-69.
Thi, L.S. (2006). Eletronic commerce adoption among manufacturing SMEs in
Malaysia (Tesis PHD, Loughborough University Institutional Repository,
2006).
Tiago, 0 ., & Maria, F. M. (20 I 0). Understanding e-business adoption across
industries in European countries. Industrial Management & Data System,
110(9), 1337-1354. doi: I0.1108/02635571011087428.
Thong, J. Y. L. (1999). An integrated model of information systems adoption in
small businesses. Journal of Management Information System, 15(4), 187-
214.
Thong, J. Y. L. (2001). Resource contraints and information systems implementation
in Singapore small business. Omega, 29(2), 143-156.
Tidd, J., Bessant, J., & Pavitt, K. (2001). Managing innovation: integrating
technological, market and organizational change. (2nd ed.). Chichester: John
Wiley.
Tomatzky, L. G. and Fleischer, M. (I 990). The Process of Technological Innovation.
Massachusetts: Lexington.
Tse, A.C. B., Sin, L. Y. M., Yau, 0. H. M, Lee, J.S.Y., & Chow, R. (2004). A firm's
role in the marketplace and the relative performance of market orientation and
299
relationship marketing orientation. European Jourmal of Marketing, 38(9),
1158-1172.
Turban, E., McLean, E., & Wetherbe, J. (2001). Information technology for
management: Making connection for strategic advantages. (2nd ed.). New
York: John Wiley & Son.
Tushman, M. L., & Anderson, P. (1986). Technological discontinuities and
organizational environments. Administrative Science Quarterly, 31, 439-465.
Unit Perancang Ekonomi, (2013). Wawasan 2020 1991-2020. Retrieved from
http://www.epu.gov.my/wawasan-2020-1991-2020
Unit Perancangan Ekonomi. (2000), Rancangan Malaysia Kelapan. Retrieved from
http://www.epu.gov.my
Unit Perancangan Ekonomi. (2006), Rancangan Malaysia Kesembilan. Retrieved
from http://www.epu.gov.my
Unit Perancangan Ekonomi. (20 I 0), Rancangan Malaysia Kesepu/uh. Retrieved
from http://www.epu.gov.my
Unit Perancangan Ekonomi. (2015), Rancangan Malaysia Kesebelas. Retrieved from
http://www.epu.gov.my
Unit Perancangan Ekonomi. (2015), Rancangan Malaysia Kesebelas: lnovasi
Penjanan Kekayaan (Kertas Strategi 21). Retrieved from
http://www.epu.gov.my
300
Varis, M., & Littunen, H. (2010). Types of innovation, sources of information and
performance in entrepreneurial SMEs: European Journal of Innovation
Management, 13(2), 128-144. doi: 10.1108/14601061011040221.
Venkatraman, N., & Ramunajam, V. (1986). Measurement of business performance
in strategy research: A comparison of approaches. Academy of Management
Review, 11(4), 801-814
Venkatraman, N., (1989). The concept of fit in strategy research: Toward verbal and
statistical correspondence. Academy of Management Review, 14(3), 423-444
Wall, T. D., Michie, J., Patterson M ., Wood., S. J., Sheehan M., Clccg, C. W., &
West, M. (2004). On the validity of subjective measures of company
performance. Personnel Psychology, 57(1), 95-118.
Walsh, W. B. & Betz, N. E. (1991). Tests and assessment. (3rd ed.). New Jersey:
Prentice Hall.
Wang, C. L., & Ahmed, P. K. (2004). The development and validation of the
organizational innovativeness construct using confirmatory factor analysis.
European Journal of Innovation Management, 7 (4 ), 303-313.
Wang, Y., & Lo, H. (2003). Customer-focused performance and the dynamic model
for competence building and leveraging: A resource-based view. Journal of
Management Development, 22(6), 483-526.
Wang, Y. C., & Qualls, W. (2007). Towards a theoretical model of technology
adoption in hospitality organizations. International Journal of Hospitality
Management, 26(3), 560-573.
301
Wang, Y. M., Wang, Y. S., & Yang, Y. F. (2010). Understanding the determinants of
rfrid adoption in the manufacturing industry. Technological Forecasting &
Social Change, 77(5), 803-815.
Warner, R. M. (2008). Applied statistics: from bivariate through multivariate
techniques. Thousands Oaks: Sage.
Weernwardena, J. (2003). The role of marketing capability in innovation-based
competitive strategy: Journal of Strategic Marketing, //(I), 15-35.
doi: 10.1080/0965254032000096766.
Wernerfelt, B. (1984). A resource-based view of the finn. Strategic Management
Journal, 5(2), 171-180.
Wiklund, J. (1999). The sustainability of the entrepreneurial orientation-performance
relationship. Entrepreneurship theory and practice, 24(1), 37-48.
Wiklund, J., & Shepherd, D. (2003). Knowledge-bas,ed resources, entrepreneurial
orientation, and the performance of small and medium-sized businesses.
Strategic Management Journal, 24, 1307- 1314.
Wiklund, J., & Shepherd, D. (2003). Research notes and commentaries: Knowledge
based resources, entrepreneurial orientation, and the performance of small
and medium-sized businesses. Strategic Management Journal, 24(13), 1307-
1314.
Wiklund, J., & Shepherd, D. (2005). Entrepreneurial orientation- small business
performance relationship.A configurtional approach. Journal of Business
Venturing, 20(1 ), 71-91.
302
Wirtz, J., & Wong, P. K. (2001). An empirical study on Internet-based business-to
business e-commerce in Singapore. Singapore Management Review, 23(1),
87-112.
Woo, C. Y., & Cooper, A. C. (1981). Strategies of effective low share business.
Strategic Management Journal, 2, 301-318.
W oraluek Lalitsasivimol. (2014 ). Leaming organization, organizational
innovativeness and the performance of small and medium enterprise in
Bangkok, Thailand (Doctor of Business Administration, Universiti Utara
Malaysia, 2014).
Yague, M. I., Mana, A., & Lopez, J. (2005). A metadata-based access control model
for web services. Internet Reseach, 15( I), 99-1 16.
Yahya Al-Ansari., Pcrvan S., & Xu. J (2013). Innovation and business performance
of SMEs: the case of Dubai. Education, Busine.s and Society: Contemporary
Middle Eastern Issues, 6(3/4), 162-180. doi: I 0.1108/EBS-04-2013-0012.
Yap, C. S., Soh, C. C. P., & Raman, K. S. (1992). Information systems success
factors in small business. Omega, 20(5/6), 597-609.
Yun Lin C. Y., & Chen. M. Y. (2007). Does innovation lead to performance? An
empirical study of SMEs in Taiwan. Management Research News, 30(2),
115-132. doi: 10.1108/01409170710722955.
Zahra S. A. (1993). Environment, corporate entrepreneurship and financial
performance: A taxonomic approach. Journal a/Business Venturing, 8, 319-
340
303
Zahra S. A., & Covin, J. G (1995). Contextual influences on the corporate
entrepreneurship- performance relationship: A longitudinal analysis. Journal
<if Business Venturing, 10, 43-58.
Zairani Zaino], & Zaimah Zainol Ariffin. (2012). Rintangan Perusahaan Kecil dan
Sederhana memperoleh pembiayaan: Cadangan penambahbaikan. Universiti
Utara Malaysia: UUM Press.
Zhao, J. L., & Cheng, H. K. (2005). Web services and process management. A union
of convenience or a new area of research? Decision Support Systems, 40(1 ),
1-8.
Zhu, K., & Kraemer, K. L. (2005). Post-adoption variations in usage and value of e
business by organizations: cross-country evidence from the retail industry.
Information systems research, 16(1), 61-84.
Zhu, K., Kraemer, K. L., & Xu, S. (2003). Electronic business adoption by European
firms: A cross-country assessment of the facilitators and inhibitors. European
Journal of Information Systems, 12, 251-268.
Zhu, K. , Kraemer, K. L., & Xu, S. (2006). The process of innovation assimilation by
firms in different countries: a technology diffusion perspective on e-business.
Management Science, 52(10), 1557-1576.
Zhu, K., Kraemer, K. L., Xu, S. & Dedrick, J. (2004). Information technology payoff
in e-business environments: An international perspective on the value
creation of e-businessin the financial service industry. Journal of
Management Information Systems, 2 1(1), 17-54.
304
Zikmund, W. G. (2000). Business Research Method (6th Ed.): Forth Worth, Texas:
The Dryden.
Zott, C., Amit, R., & Donlevy, J. (2000). Strategies for value creation in e
commerce: Best practice in Europe. European Management Journal, 18(5),
463-475.
Zunaidah Zainon (2015, Januari 21). Penstrukturan semula rangsang bajet PKS.
Utusan Malaysia. Retrieved from http://www.utusanmalaysiaonline.com.my
305
LAMPIRAN A
UUM Unlversltl Utara Malaysia
Nur Yuhainis Binti Ab Wahab No. 9 Jalan Ilmu, Bukit Indab, Bandar Darulaman, 06000 Jitra, Kedah Darul Aman. E-mel: yuhainisl [email protected] Tel. bimbit: 016 - 378 5497.
KAJIAN MENGENAI PREST ASI PERNIAGAAN KE ATAS PERUSAHAAN KECIL DAN SEDERHANA (PKS) DI MALAYSIA
Tuan Pemilik Perniagaan / Pengurus
Tujuan kajian ini adalah untuk mengkaji hubungan antara adopsi teknologi maklumat dan komunikasi (JCT) dan inovasi dengan prestasi pemiagaan serta pengarub pembolehubah penyederhana kelebihan daya saing. Untuk makluman tuan, firma tuan telah dipilih untuk terlibat dalam kajian ini. Diharap dapatan daripada kajian ini akan memberi maklumat berguna yang boleh menyumbang kepada pembangunan PKS di Malaysia, selaras dengan perkembangan persekitaran pemiagaan semasa.
Oleh itu, saya memohon jasa baik pihak tuan untuk meluangkan sedikit masa (lebih kurang 20 minit) untuk menjawab soal selidik yang mempunyai kaitan dengan amalan adopsi tek:nologi maklumat dan komunikasi (ICT), inovasi dan kelebiban daya saing dalam firma tuan. Kerjasama pihak tuan dalam menjawab soal selidik ini sangat penting untuk memastikan kejayaan kajian ini. Untuk makluman tuan, semua maklumat yang diperolchi daripada kajian ini adalah dianggap sulit. Keputusan dan basil kajian ini akan digunakan untuk tujuan akademik semata-mata dan bukannya untuk tujuan komersial.
Jika pihak tuan inginkan satu salinan ringkasan dari kajian tersebut, sila sertakan kad pemiagaan dan e-mel tuan ke dalam sarnpul surat yang disediakan. Sila pulangkan borang soal selidik yang telah siap dijawab dengan memasukkan ke dalam sampul surat yang disertakan. Kerjasama daripada pihak tuan untuk mengembalikan borang soal selidik ini secepat mungkin adalah sangat dihargai. Jika tuan mempunyai sebarang persoalan mengenai kajian, sila hubungi saya rnelalui tclcfon bimbit, e-mel atau menggunakan alamat seperti di atas.
306

Soal selidik ini perlulah dijawab oleh pihak pengurusan tertinggi firma (pemilik, pengerusi, pengarah, CEO, atau pengurus)
Bahagian A dan Bahagian B di bawah mcrupakan latar bclakang responden dan latar bclakang firma anda. Sita jawab scmua soalan berikut dengan tanda ( / ) pada ruangan yang disediakan. Segala maklumat yang dibcrikan adalah SULIT dan hanya digunakan untuk tujuan kajian ini sahaja.
(Part A and Part B below represent the respondent's background and the background of your firm. Please answer the following questions with a sign ( I) in the space provided All information provided is STRICTLY CONFIDENTIAL and used only for academic purposes).
BAHAGIAN A: LAT AR BELAKANG RESPOND EN Respondent Background
l. Jantina ( Gender)
D Lelaki (Male)
2. Umur (Age)
D Wanita (Female)
0Bawah 30 (Below 30) 031 - 40 D 41 - 50
051 - 60 D 61 dan ke atas (61 and above)
3. Bangsa (Race)
0Melayu (Malay) 0Cina (Chinese) Qndia (Indian)
D Lain- lain, sila nyatakan (Others, please specify) ____ _
4. Status perkahwinan (Maritial Status)
D Bujang (Single) OBcrcerai (Divorce)
D Berkahwin (Married)
5. Tahap pendidikan tcrtinggi (Highest Education Level)
D PhD 0Sarjana (Master's degree) D ljazah (Degree)
D Diploma D Sekolah mcnengah (Secondary School) D Sekolah rendah (Primary School)
6. Jawatan anda di firma ini? Sila nyatakan (Your post at this firm? Please 5pecify)
7. Berapa lama anda bekerja di firma ini? (How many years have you worked in thisfirm?)
D 5 tahun dan kurang (5 years and less) 06 - 10 tahun (years)
D 11 - 15 tahun (years) 016 - 20 tahun D Lcbih dari 21 tahun (more than 21 years)
307
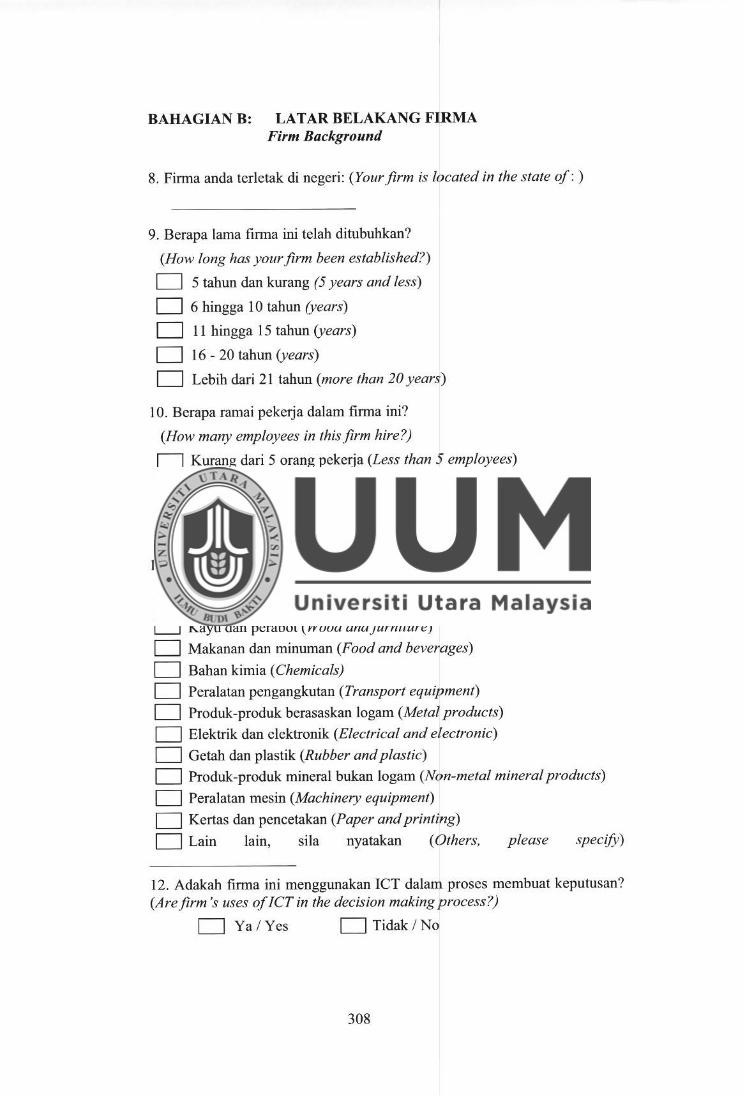
BAHAGIAN B: LATAR BELAKANG FIRMA Firm Background
8. Finna anda tcrletak di negeri: (Your firm is located in the state of:)
9. Berapa lama firma ini telah ditubuhkan?
(How long has your firm been established?)
D 5 tahun dan kurang (5 years and less)
D 6 hingga 10 tahun (years)
D 11 hingga 15 tahun (years)
D 16 - 20 tahun (years)
D Lebih dari 21 tahun (more than 20 years)
I 0. Bcrapa ramai pekerja dalam firma ini?
(How many employees in this.firm hire?)
D Kurang dari 5 orang pekerja (Less than 5 employees)
D 5 - 75 orang pekerja (employees)
D 76 - 200 orang pekerja (employees)
D Lebih dari 201 orang pekerja (employees)
11. Apakah jenis firma anda? Pilih satu sahaja (What is your firm's type? Choose only one statement)
D Tekstil dan pakaian (Textiles and apparel)
D Kayu dan pcrabot (Wood and furniture)
D Makanan dan minuman (Food and beverages)
D Bahan kimia ( Chemicals)
D Peralatan pengangkutan (Transport equipment)
D Produk-produk berasaskan logam (Metal products)
D Elektrik dan clektronik (Electrical and electronic)
D Getah dan plastik (Rubber and plastic)
D Produk-produk mineral bukan logam (Non-metal mineral products)
D Peralatan mesin (Machinery equipment)
D Kertas dan pencetakan (Paper and printing)
D Lain lain, sila nyatakan (Others, please specify)
12. Adakah firma ini menggunakan JCT dalam proses membuat keputusan? (Are firm 's uses of JCT in the decision making process?)
D Ya / Yes D Tidak /No
308
13. Adakab firma ini menerapkan inovasi di dalam rnenjalankan aktivitiaktiviti perniagaan? (Are firm's applies innovation in the business activities?)
D Ya / Yes D Tidak /No
309
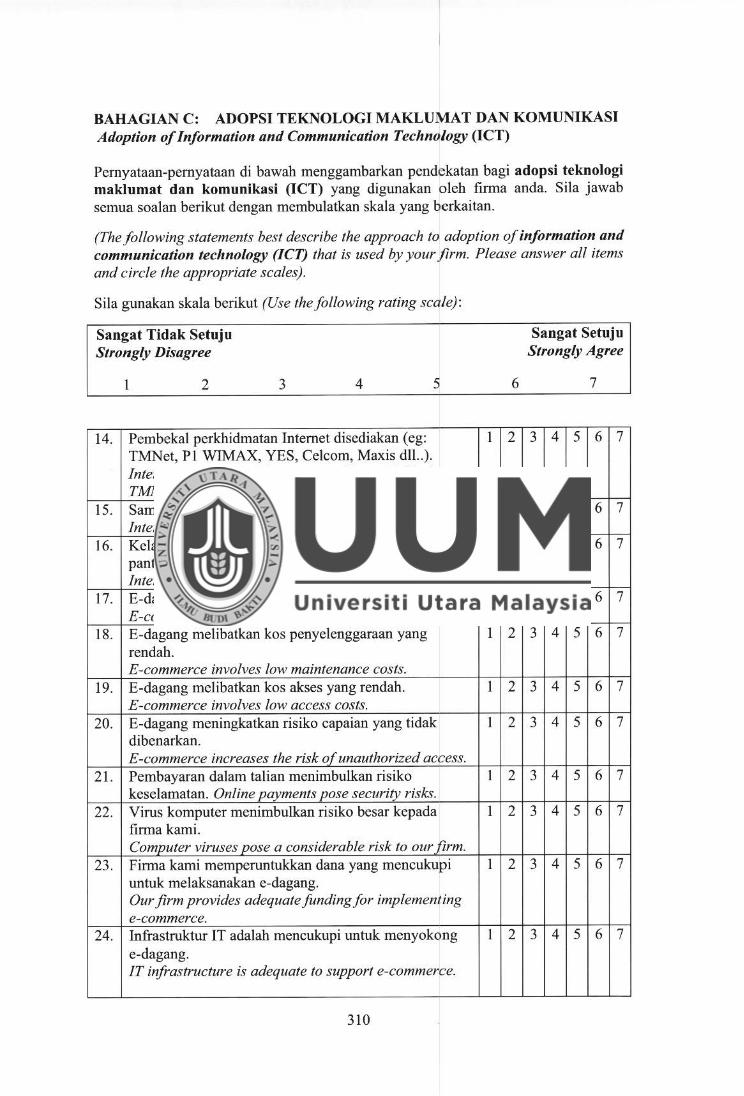
BAHAGIAN C: ADOPSI TEKNOLOGI MAKLUMAT DAN KOMUNIKASI Adoption of Information and Communication Technology (ICT)
Pernyataan-pernyataan di bawah menggambarkan pendekatan bagi adopsi teknologi maklumat dan komunikasi (ICT) yang digunakan oleh firma anda. Sila jawab scmua soalan berikut dengan membulatkan skala yang berkaitan.
(The following statements best describe the approach to adoption of information and communication technology (JCT) that is used by your firm. Please answer all items and circle the appropriate scale:-.).
Sila gunakan skala berikut (Use the following rating scale):
Sangat Tidak Setuju Strongly Disagree
l 2 3 4 5
14. Pembekal perkhidmatan Internet disediakan ( eg: TMNet, Pl WTMAX, YES, Celcom, Maxis dll .. ). Internet service providers are readily available (e.g. TMNet, P 1 WJMAX, YES, Ce/com, Maxis di/ .. ).
15. Sambungan internet bolch dipercayai. Internet connections are reliable.
16. Kelajuan internet untuk memuat turun/akses sangat pantas. Internet downloadinf!/access speed is.fast.
17. E-dagang melibatkan kos permulaan yang rendah. E-commerce involves low initial set-up costs.
18. E-dagang melibatkan kos penyelenggaraan yang rendah. E-commerce involves low maintenance costs.
19. E-dagang melibatkan kos akses yang rendah. E -commerce involves low access costs.
20. E-dagang meningkatkan risiko capaian yang tidak dibenarkan. E-commerce increases the risk of unauthorized access.
21. Pembayaran dalam talian menimbulkan risiko keselamatan. Online payments pose security rish'.
22. Virus komputer mcnimbulkan risiko besar kepada firma kami. Computer viruses pose a considerable risk to our firm.
23. Pinna kami rnemperuntukkan dana yang mencukupi untuk melaksanakan e-dagang. Our firm provides adequatefundingfor implementing e-commerce.
24. Infrastruktur IT adalah mencukupi untuk menyokong e-dagang. IT infrastructure is adequate to support e-commerce.
310
6
I 2
1 2
1 2
1 2
1 2
1 2
1 2
1 2
1 2
1 2
l 2
Sangat Setuju Strongly Agree
7
3 4 5 6 7
3 4 5 6 7
3 4 5 6 7
3 4 5 6 7
3 4 5 6 7
3 4 5 6 7
3 4 5 6 7
3 4 5 6 7
3 4 5 6 7
3 4 5 6 7
3 4 5 6 7
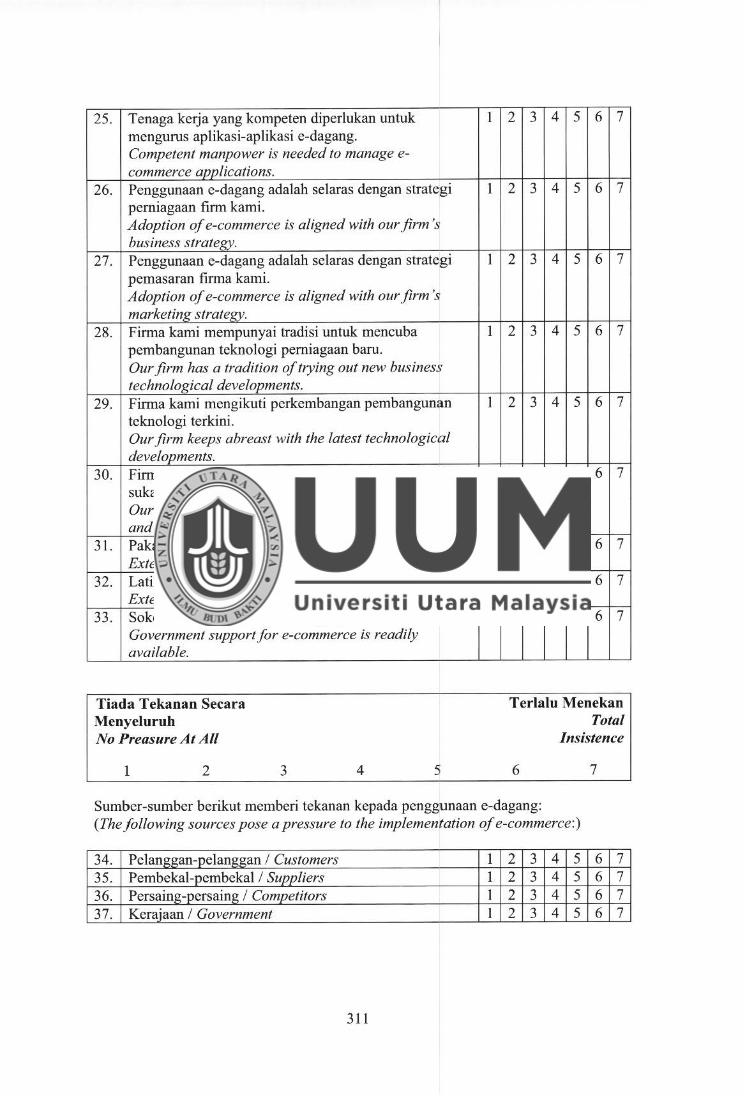
25. Tenaga kerja yang kompeten diperlukan untuk mcngurus aplikasi-aplikasi e-dagang. Competent manpower is needed to manage e-commerce avvlications.
26. Penggunaan e-dagang adalah selaras dengan strategi pemiagaan firm kami. Adoption of e-commerce is aligned with our.firm's business strategy.
27. Penggunaan e-dagang adalah selaras dengan stratcgi pemasaran firma kami. Adoption of e-commerce is aligned with our firm's marketing strate<zv.
28. Firrna kami rnernpunyai tradisi untuk rnencuba pembangunan teknologi perniagaan baru. Our firm has a tradition of trying out new business technological develooments.
29. Firrna kami mengikuti pcrkcrnbangan pembangunan tcknologi terkini. Our firm keeps abreast with the latest technological developments.
30. Firrna kami merasakan penggunaan e-dagang adalah sukarcla dan bukan wajib. Our firm feels that the use of e-commerce is voluntary and not compulsory.
3 I. Pakar luar e-dagang disediakan. External e-commerce expertise is readily available.
32. Latihan luar e-dagang disediakan. External trainin~ in e-commerce is readily available.
33. Sokongan kerajaan untuk e-dagang disediakan. Government support/or e-commerce is readily available.
Tiada Tekanan Secara Menyeluruh No Preasure At All
1 2 3 4 5
I
1
1
1
1
1
I
1
1
2 3 4 5 6 7
2 3 4 5 6 7
2 3 4 5 6 7
2 3 4 5 6 7
2 3 4 5 6 7
2 3 4 5 6 7
2 3 4 5 6 7
2 3 4 5 6 7
2 3 4 5 6 7
Terlalu Menekan Total
Insistence
6 7
Sumbcr-sumber berikut mernberi tekanan kepada penggunaan e-dagang: (The following sources pose a pressure to the implementation of e-commerce:)
34. Pclan2:1mn-oelam!1mn / Customers 1 2 3 4 5 6 7 35. Pembekal-pcmbckal / Suppliers 1 2 3 4 5 6 7
36. Persaing-persaing / Competitors I 2 3 4 5 6 7 37. Keraiaan / Government 1 2 3 4 5 6 7
311
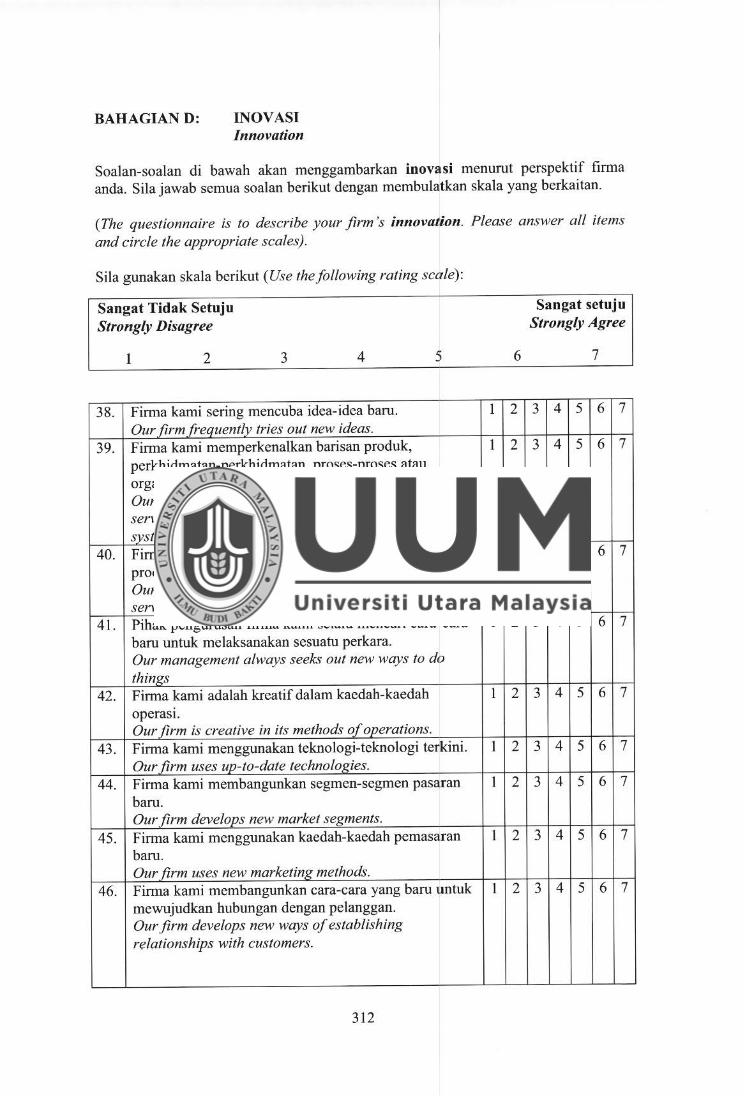
BAHAGIAND: INOVASI Innovation
Soalan-soalan di bawah akan menggambarkan inovasi menurut perspektif firma anda. Sila jawab semua soalan berikut dengan membulatkan skala yang berkaitan.
(The questionnaire is to describe your ./inn 's innovation. Please answer all items and circle the appropriate scale!>).
Sila gunakan skala berikut (Um the following rating scale):
Sangat Tidak Setuju Strongly Disagree
1 2 3 4 5
38. Pinna kami sering mencuba idea-idea baru. Our finnfreauentlv tries out new ideas.
39. Firma kami memperkenalkan barisan produk, perkhidmatan-perkhidmatan, proses-proses atau organisasi/ sistem-sistem pengurusan baru. Our firm introduces a number of new products lines, services, processes or organization/ management systems.
40. Firma kami adalah yang terawal memasarkan produk-produk atau perkhidmatan-perkhidmatan baru. Our firm is first to market with new products or services.
41. Pihak pengurusan firma karni selalu mencari cara-cara baru untuk melaksanakan sesuatu perkara. Our management always seeks out new ways to do thines
42. Firma kami adalah krcatif dalam kaedah-kaedah operas1. Our firm is creative in its methods of operations.
43. Firma kami menggunakan teknologi-teknologi terkini. Our firm uses up-to-date technologies.
44. Firma kami rnembangunkan segmen-segmen pasaran baru. Our firm develops new market segments.
45. Firma kami menggunakan kaedah-kaedah pemasaran baru. Our firm uses new marketine methods.
46. Firma kami mcmbangunkan cara-cara yang baru untuk mewujudkan hubungan dengan pelanggan. Our.firm develops new wcrys of establishing relationships with customers.
312
6
1 2
1 2
1 2
1 2
I 2
1 2
I 2
1 2
1 2
Sangat setuju Strongly Agree
7
3 4 5 6 7
3 4 5 6 7
3 4 5 6 7
3 4 5 6 7
3 4 5 6 7
3 4 5 6 7
3 4 5 6 7
3 4 5 6 7
3 4 5 6 7
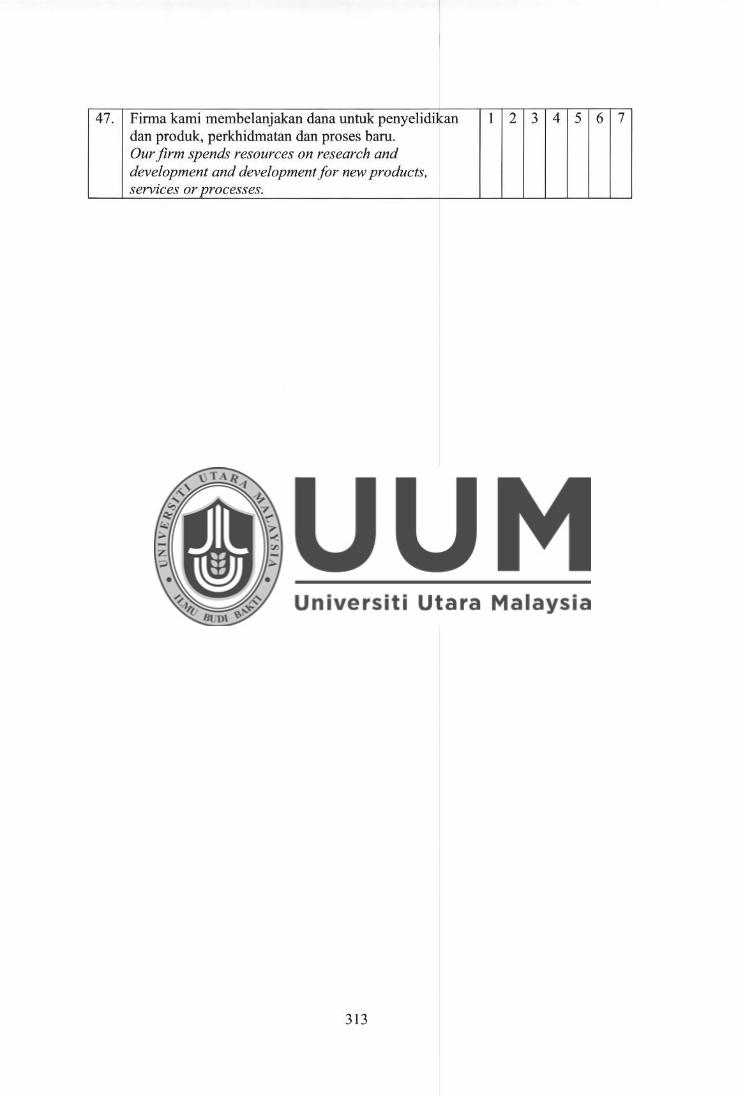
47. Firma kami membelanjakan dana untuk penyelidikan 1 2 3 4 5 6 7 dan produk, perkhidmatan dan proses barn. Our firm spends resources on research and development and development for new products, services or processes.
313
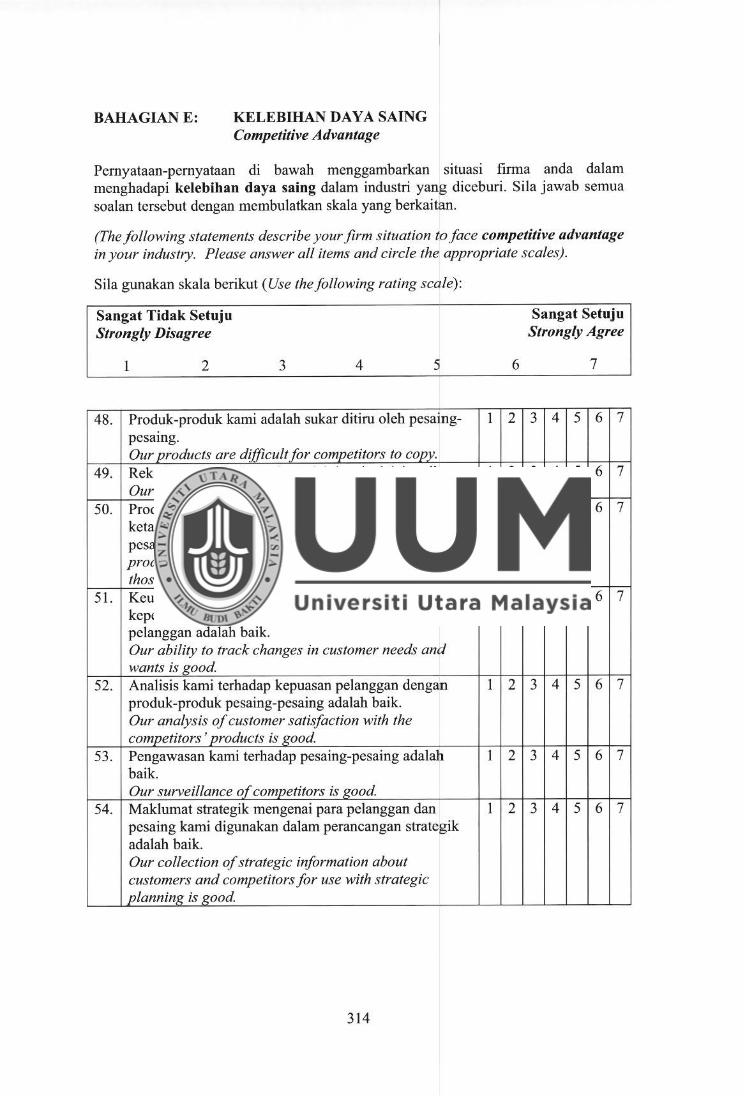
BAHAGIANE: KELEBIHAN DAYA SAING Competitive Advantage
Pernyataan-pernyataan di bawah menggambarkan situasi firma anda dalam menghadapi kelebihan daya saing dalam industri yang diceburi. Sita jawab semua soalan tcrsebut dengan membulatkan skala yang berkaitan.
(The following statements describe your.firm situation to face competitive advantage in your industry. Please answer all items and circle the appropriate scales).
Sila gunakan skala berikut (Use the following rating scale):
Sangat Tidak Setuju Strongly Disagree
1 2 3 4 5
48. Produk-produk kami adalah sukar ditiru oleh pesaing-pesamg. Our products are difj zcult for competitors to coov.
49. Reka bentuk-reka bentuk produk kami adalah unik. Our product designs are unique.
50. Produk-produk kami tidak mempunyai kelebihan yang ketara berbanding dengan produk-produk pesaing-pesaing kami. Our products do not have a signfficant advantage over those of our competitors.
51. Keupayaan kami untuk mengesan perubahan dalam kcpcrluan-keperluan dan kehendak-kehendak pclanggan adalah baik. Our ability to track changes in customer needs and wants is good.
52. Analisis kami terhadap kepuasan pelanggan dengan produk-produk pesaing-pesaing adalah baik. Our analysis of customer satisfaction with the competitors ' products is good.
53. Pengawasan kami terhadap pesaing-pesaing adalah baik. Our surveillance of comoetitors is good.
54. Maklumat strategik mengenai para pelanggan dan pesaing kami digunakan dalam perancangan strategik adalah baik. Our collection of strategic information about customers and competitors for use with strategic planning is good.
314
6
1 2
1 2
1 2
1 2
1 2
1 2
1 2
Sangat Setuju Strongly Agree
7
3 4 5 6 7
3 4 5 6 7
3 4 5 6 7
3 4 5 6 7
3 4 5 6 7
3 4 5 6 7
3 4 5 6 7
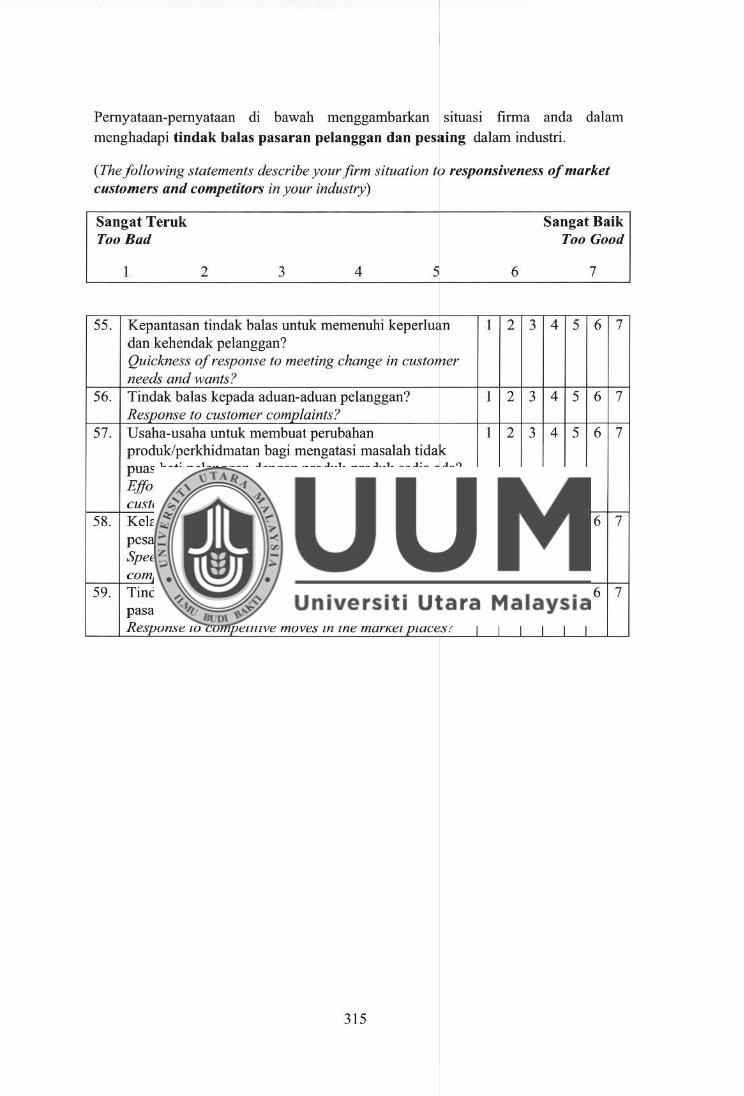
Pernyataan-pernyataan di bawah menggambarkan situasi firma anda dalam
menghadapi tindak balas pasaran pelanggan dan pesaing dalam industri.
(The following statements describe your firm situation to responsiveness of market customers and competitors in your industry)
Sangat Teruk Too Bad
1 2 3 4 5
55. Kepantasan tindak balas untuk memenuhi keperluan dan kehendak pelanggan? Quickness of response to meeting change in customer needs and wants?
56. Tindak balas kepada aduan-aduan pelanggan? Response to customer complaints?
57. Usaha-usaha untuk membuat perubahan produk/perkhidmatan bagi mengatasi masalah tidak puas hati pelanggan dengan produk-produk sedia ada? Efforts to make product/service changes to overcome customer dissatisfaction with existinK products?
58. Kelajuan penyebaran maklumat dalaman mengenai pcsaing-pcsaing? Speed of dissemination of information in-house about competitors?
59. Tindak balas terhadap pergerakan persaingan di dalam pasaran? Response to competitive moves in the market places?
315
6
1 2 3
1 2 3
I 2 3
1 2 3
I 2 3
Sangat Baik Too Good
7
4 5 6 7
4 5 6 7
4 5 6 7
4 5 6 7
4 5 6 7
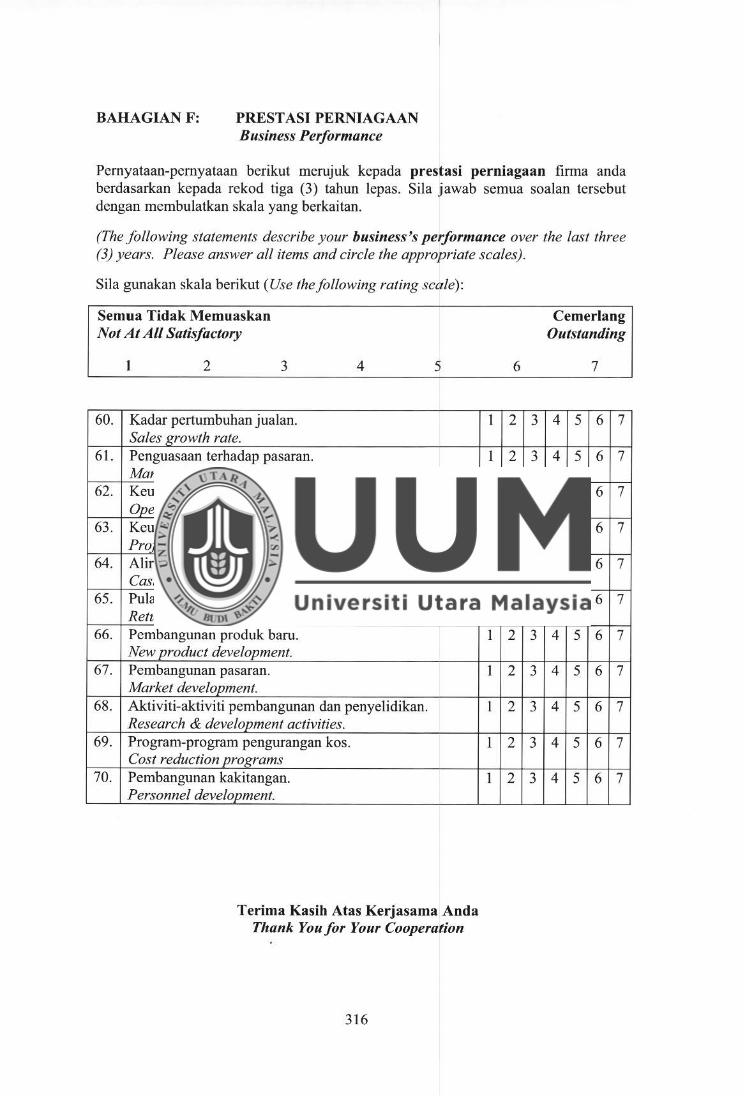
BAHAGIAN F: PREST ASI PERNIAGAAN Business Performance
Pcmyataan-pemyataan berikut merujuk kepada prestasi perniagaan firma anda berdasarkan kepada rekod tiga (3) tahun lepas. Sila jawab semua soalan tersebut dengan membulatkan skala yang berkaitan.
(The .following statements describe your business's performance over the last three (3) years. Please answer all items and circle the appropriate scales).
Sil a gunakan skala berikut ( Use the following rating scale):
Semua Tidak Memuaskan Not At All Satisfactory
60.
61.
62.
63.
64.
65.
66.
67.
68.
69.
70.
2 3 4 5
Kadar pertumbuhan jualan. Sales f(rowth rate. Penguasaan terhadap pasaran. Market share. Keuntungan opcrasi. Operatinf( pro/it. Keuntungan kepada nisbah jualan. Pro/its to sales ratio. Aliran tunai daripada operasi. Cash flow from operations. Pulangan ke atas pelaburan. Return on investment. Pembangunan produk baru. New product development. Pembangunan pasaran. Market development. Aktiviti-aktiviti pembangunan dan penyelidikan. Research & development activities. Program-program pengurangan kos. Cost reduction programs Pembangunan kakitangan. Personnel development.
Terima Kasih Atas Kerjasama Anda Thank You for Your Cooperation
316
6
I 2 3
1 2 3
1 2 3
1 2 3
I 2 3
1 2 3
1 2 3
I 2 3
I 2 3
1 2 3
I 2 3
Cemerlang Outstanding
7
4 5 6 7
4 5 6 7
4 5 6 7
4 5 6 7
4 5 6 7
4 5 6 7
4 5 6 7
4 5 6 7
4 5 6 7
4 5 6 7
4 5 6 7
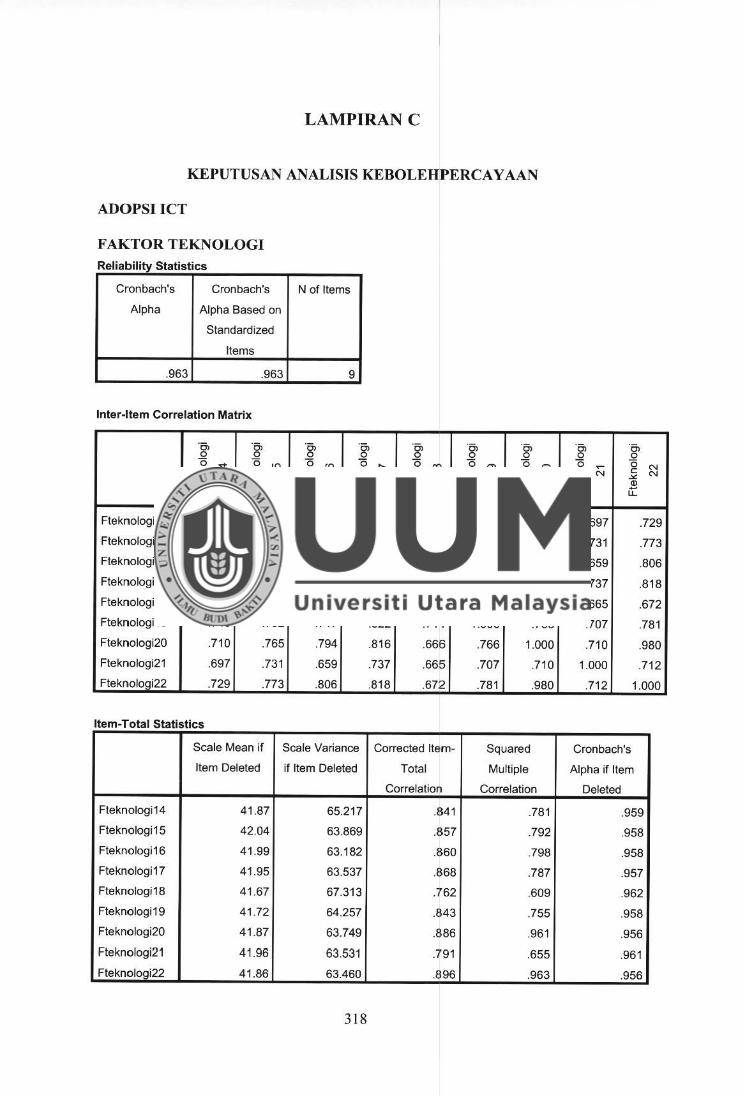
LAMPIRAN C
KEPUTUSAN ANALISIS KEBOLEHPERCA Y AAN
ADOPSIICT
FAKTOR TEKNOLOGI Reliability Statistics
Cronbach's Cronbach's N of Items
Alpha Alpha Based on
Standardized
Items
.963 .963 9
Inter-Item Correlation Matrix
·g, ·5i ·a, ·g, ·5i ·5 ·a, 0 0 0 0 0
0 -st 0 I{) 0 (0 0 r-- 0 co 0 a, 0 0 C .... C .... C .... C .... C .... C .... C N -"" -"" -"" -"" -"" -"" -"" Q) 2 Q) Q) 2 Q) Q) u:: u. u:: u:: u. u:: u::
Fteknologi 14 1.000 .824 .818 .705 .711 .740 .710
Fteknologi 15 .824 1.000 .836 .747 .649 .702 .765
Fteknologi16 .818 .836 1.000 .759 .665 .717 .794
Fteknologi 17 .705 .747 .759 1.000 .689 .822 .816
Fteknologi 18 .711 .649 .665 .689 1.000 .711 .666
Fteknologi19 .740 .702 .717 .822 .71 1 1.000 .766
Fteknologi20 .710 .765 .794 .816 .666 .766 1.000
Fteknologi21 .697 .731 .659 .737 .665 .707 .710
Fteknologi22 .729 .773 .806 .818 .672 .781 .980
Item-Total Statistics
Scale Mean if Scale Variance Corrected Item- Squared
Item Deleted if Item Deleted Total Multiple
Correlation Correlation
Fteknologi 14 41.87 65.217 .841 .781
Fteknologi15 42.04 63.869 .857 .792
Fteknologi16 41.99 63.182 .860 .798
Fteknologi17 41.95 63.537 .868 .787
Fteknologi18 41 .67 67.313 .762 .609
Fteknologi 19 41.72 64.257 .843 .755
Fteknologi20 41 .87 63.749 .886 .961
Fteknologi21 41.96 63.531 .791 .655
Fteknologi22 41 .86 63.460 .896 .963
318
·g, ·a, 0
0 .... 0 N C N C N -"" -"" Q)
u:: 2 u.
.697 .729
.731 .773
.659 .806
.737 .818
.665 .672
.707 .781
.710 .980
1.000 .71 2
.712 1.000
Cronbach's
Alpha if Item
Deleted
.959
.958
.958
.957
.962
.958
.956
.961
.956
3J N1ac 2.01G
Kcpada sesiaµa yang berkenar1n
luan / Puan
LAMPIRAN B
TERJEMAHAN SOAL SELIDIK KAJIAN MENGENAI PRE$:'TASI PEHNIAGAAN
KE ATAS PERUSAHAAN l(ECIL DAN SEDERHANA (PKS) DI MALAYSIA DARI
BAHASA INGGERIS KE BAHASA MELAYU
Silya, Sander lyakannu .idalah seorang jurubahasa ·yvng bertugas di Mahkamah Scsyen, Alo r Setar
Kedah telah memeriksa, mentcrjemah dan mengesahkan soa l selidik bertajuk "Hubungiln anta,a
pengunaan tcknologi maklumat dan komunikasi (ICT) dan inovasi dcngan prestasi perniagaan serla
peneuruh pembolehubah penyederhana kc lebihan d<Jya saing ".
<;n;il «>lir li!, ini tPbh rlic:or:,h!,"" L,.,r,:,rl:, "'" " nlol, M11, V11h,:,inir nt Ah IM,h-,h I !I /0 · Of"lf"\710 n, C11101 _. .... _, ... _ .............. .,_, .... ..... ................. ~., ...... ,.. ..... "" .... .J• • ,u v, ..... ,, 1 , v1 IUIIUIIIIJ ..,, ,,v Y• UIIVIJ \ ,,,. • VVVI ..J,,,.,,,I V4 J'--r ...,,,
yang rnerupakan calon PhD di Kolej Perniagaan, Univcrsiti Utara Malaysit1 .
Saya percaya soaf selidik yang telah diterjcmah ini boleh difahami dan digunakan untuk kajian dalam
bidang penggunaan JCT dan inovasi serta kelebihan daya suing terutt1ma dalum konteks prestasi
perniagaan PKS di Malaysia.
Sekian, tcrimil kasih.
Yang benar,
Bl SANDER IYAK:i\NNU
JURUBAHASA
MAHKAMAH SESYEN (2)
ALOR SETAR, KEDAH
3 17
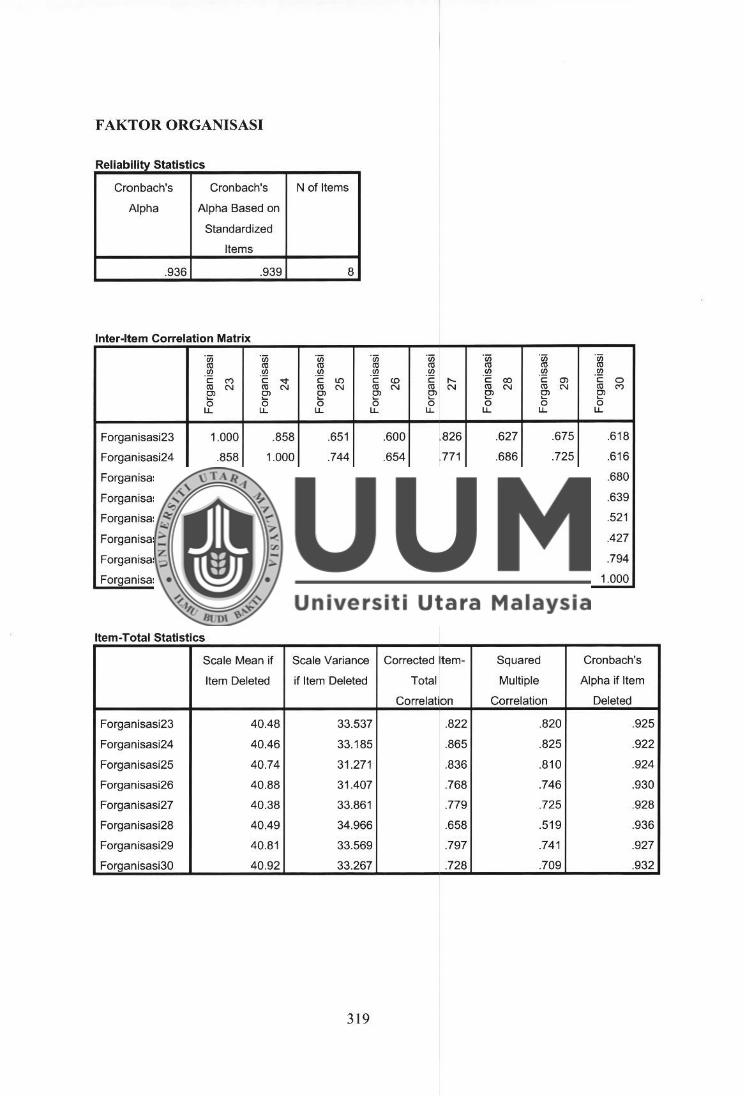
F AKTOR ORGANISASI
Reliability Statistics
Cronbach's Cronbach's N of Items
Alpha Alpha Based on
Standardized
Items
.936 .939 8
Inter-Item Correlation Matrix
'iii 'iii "iii 'iii 'iii 'iii 'iii iii ('O ('O ('O ('O ('O ('O ('O ('O
-~ -~ tJ) ti) ti) -~ -~ ti)
C: (") C: -q- ·c I.() ·c co ·c r-- C: co C: C1) ·c 0 co N co N co N ('O N co N co N co N ('O (")
e C) C) e e e C) e 0 0 0 0 0 0 0 0
LL. LL. u. u. LL. u. u. LL.
Forganisasi23 1.000 .858 .651 .600 .826 .627 .675 .618
Forganisasi24 .858 1.000 .744 .654 .771 .686 .725 .616
Forganisasi25 .651 .744 1.000 .857 .666 .567 .661 .680
Forganisasi26 .600 .654 .857 1.000 .628 .489 .616 .639
Forganisasi27 .826 .771 .666 .628 1.000 .586 .609 .521
Forganisasi28 .627 .686 .567 .489 .586 1.000 .597 .427
Forganisasi29 .675 .725 .661 .616 .609 .597 1.000 .794
Forqanisasi30 .618 .616 .680 .639 .521 .427 .794 1.000
Item-Total Statistics
Scale Mean if Scale Variance Corrected Item- Squared Cronbach's
Item Deleted if Item Deleted Total Multiple Alpha if Item
Correlation Correlation Deleted
Forganisasi23 40.48 33.537 .822 .820 .925
Forganisasi24 40.46 33.185 .865 .825 .922
Forganisasi25 40.74 31.271 .836 .810 .924
Forganisasi26 40.88 31.407 .768 .746 .930
Forganisasi27 40.38 33.861 .779 .725 .928
Forganisasi28 40.49 34.966 .658 .519 .936
Forganisasi29 40.81 33.569 .797 .741 .927
Forganisasi30 40.92 33.267 .728 .709 .932
319
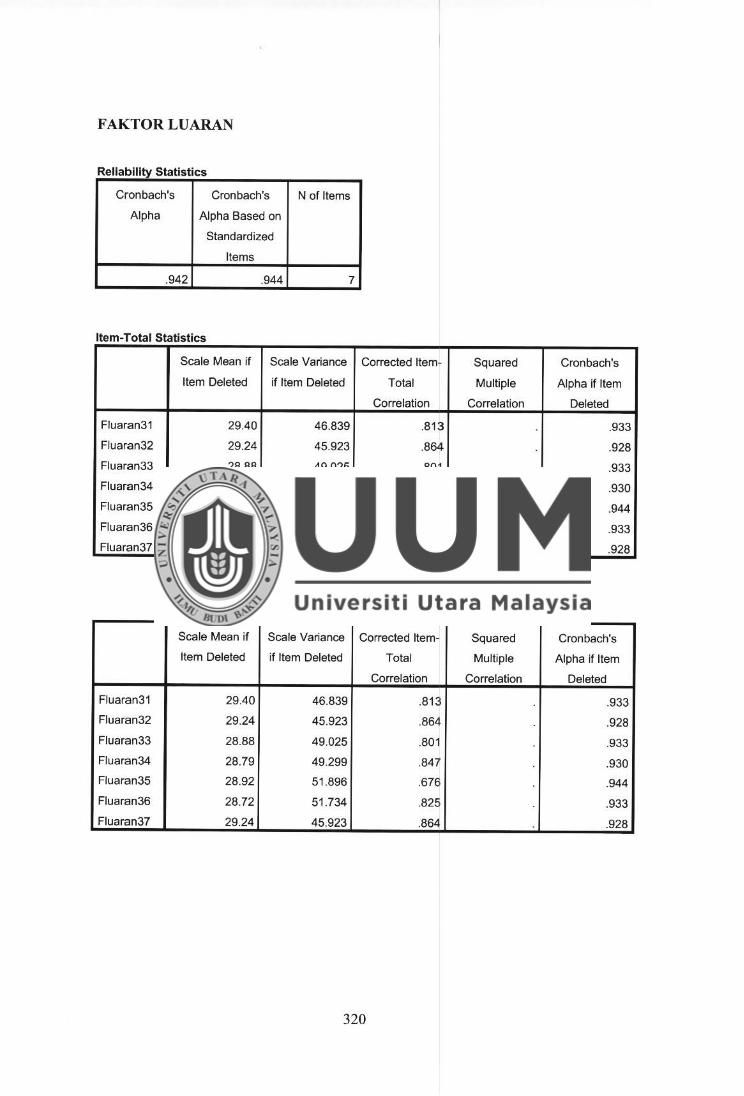
FAKTOR LUARAN
Reliability Statistics
Cronbach's Cronbach's N of Items
Alpha Alpha Based on
Standardized
Items
.942 .944 7
Item-Total Statistics
Scale Mean if Scale Variance Corrected Item- Squared Cronbach's
Item Deleted if Item Deleted Total Multiple Alpha if Item
Correlation Correlation Deleted
Fluaran31 29.40 46.839 .813 .933
Fluaran32 29.24 45.923 .864! .928
Fluaran33 28.88 49.025 .801 .933
Fluaran34 28.79 49.299 .847 .930
Fluaran35 28.92 51.896 .676 .944
Fluaran36 28.72 51.734 .825 .933
Fluaran37 29.24 45.923 .864 .928
Item-Total Statistics
Scale Mean if Scale Variance Corrected Item- Squared Cronbach's
Item Deleted if Item Deleted Total Multiple Alpha if Item
Correlation Correlation Deleted
Fluaran31 29.40 46.839 .813 .933
Fluaran32 29.24 45.923 .864 .928
Fluaran33 28.88 49.025 .801 .933
Fluaran34 28.79 49.299 .847 .930
Fluaran35 28.92 51.896 .676 .944
Fluaran36 28.72 51.734 .825 .933
Fluaran37 29.24 45.923 .864 .928
320
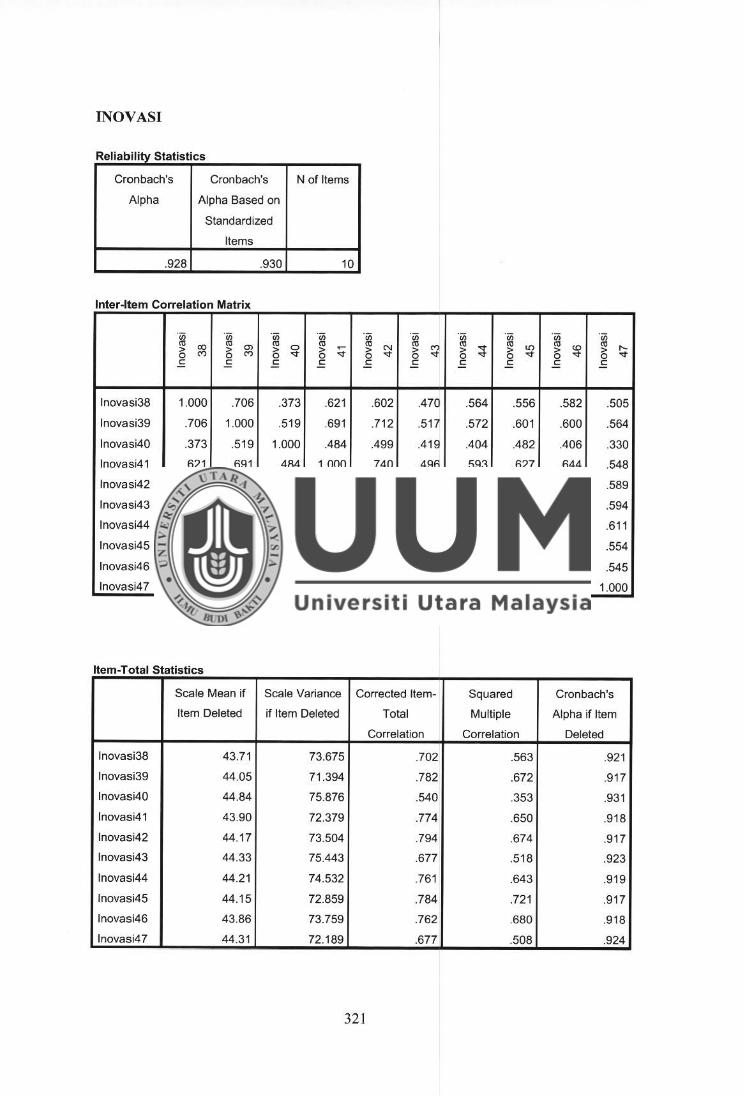
INOVASI
Reliability Statistics
Cronbach's Cronbach's N of Items
Alpha Alpha Based on
Standardized
Items
.928 .930 10
Inter-Item Correlation Matrix
"iii "iii "iii ·w ·en ·w ·w ·w ·w ·w (1) co (1)
Cl) (1)
0 (1) .- (1) N (1) C') <ll -.:I" <ll I.() <ll <O
(1) I'-> > > > > > > > > > 0 C') 0 C') 0 -.:I" 0 -.:I" 0 -.:I" 0 -.:I" 0 -.:I" 0 -.:I" 0 -.:I" 0 -.:I"
E E E C: C C: E E E E - - -
lnovasi38 1.000 .706 .373 .621 .602 .470 .564 .556 .582 .505
lnovasi39 .706 1.000 .519 .691 .712 .517 .572 .601 .600 .564
lnovasi40 .373 .519 1.000 .484 .499 .419 .404 .482 .406 .330
lnovasi41 .621 .691 .484 1.000 .740 .496 .593 .627 .644 .548
lnovasi42 .602 .712 .499 .740 1.000 .596 .593 .606 .620 .589
lnovasi43 .470 .517 .419 .496 .596 1.000 .625 .580 .525 .594
lnovasi44 .564 .572 .404 .593 .593 .625 1.000 .736 .671 .611
lnovasi45 .556 .601 .482 .627 .606 .580 .736 1.000 .789 .554
lnovasi46 .582 .600 .406 .644 .620 .525 .671 .789 1.000 .545
lnovasi47 .505 .564 .330 .548 .589 .594 .611 .554 .545 1.000
Item-Total Statistics
Scale Mean if Scale Variance Corrected Item- Squared Cronbach's
Item Deleted if Item Deleted Total Multiple Alpha if Item
Correlation Correlation Deleted
lnovasi38 43.71 73.675 .702 .563 .921
lnovasi39 44.05 71.394 .782 .672 .917
lnovasi40 44.84 75.876 .540 .353 .931
lnovasi41 43.90 72.379 .774 .650 .918
lnovasi42 44.17 73.504 .794 .674 .917
lnovasi43 44.33 75.443 .677 .518 .923
lnovasi44 44.21 74.532 .761 .643 .919
lnovasi45 44.15 72.859 .784 .721 .917
lnovasi46 43.86 73.759 .762 .680 .918
lnovasi47 44.31 72.189 .677 .508 .924
321
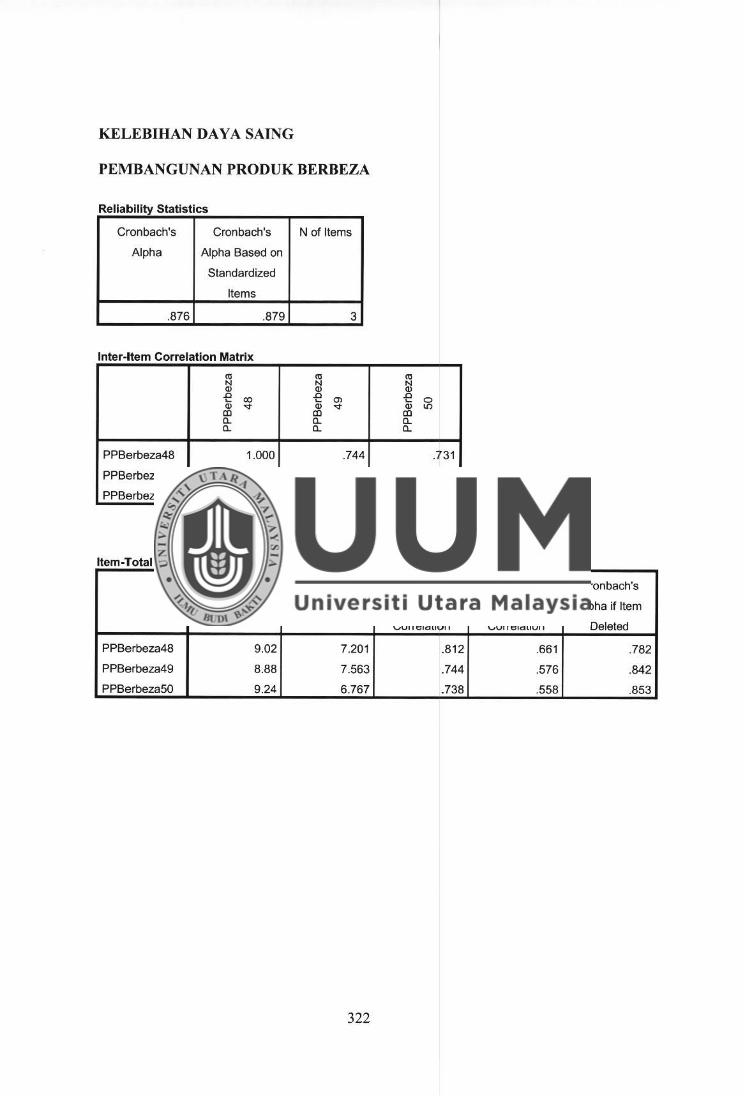
KELEBIHAN DAY A SATNG
PEMBANGUNANPRODUKBERBEZA
Reliability Statistics
Cronbach's Cronbach's N of Items
Alpha Alpha Based on
Standardized
Items
.876 .879 3
Inter-Item Correlation Matrix
(ll (ll N N Q) Q) .a co .a
0) Q) -st" Q) -st" co co Cl. a.. Cl. Cl.
PPBerbeza48 1.000 .744
PPBerbeza49 .744 1.000
PPBerbeza50 .731 .646
Item-Total Statistics
Scale Mean if Scale Variance
Item Deleted if Item Deleted
PPBerbeza48 9.02 7.201
PPBerbeza49 8.88 7.563
PPBerbeza50 9.24 6.767
322
(ll N Q) .a Q) co
0 ll)
a.. a..
.731
.646
1.000
Corrected Item- Squared Cronbach's
Total Multiple Alpha if Item
Correlation Correlation Deleted
.812 .661 .782
.744 .576 .842
.738 .558 .853
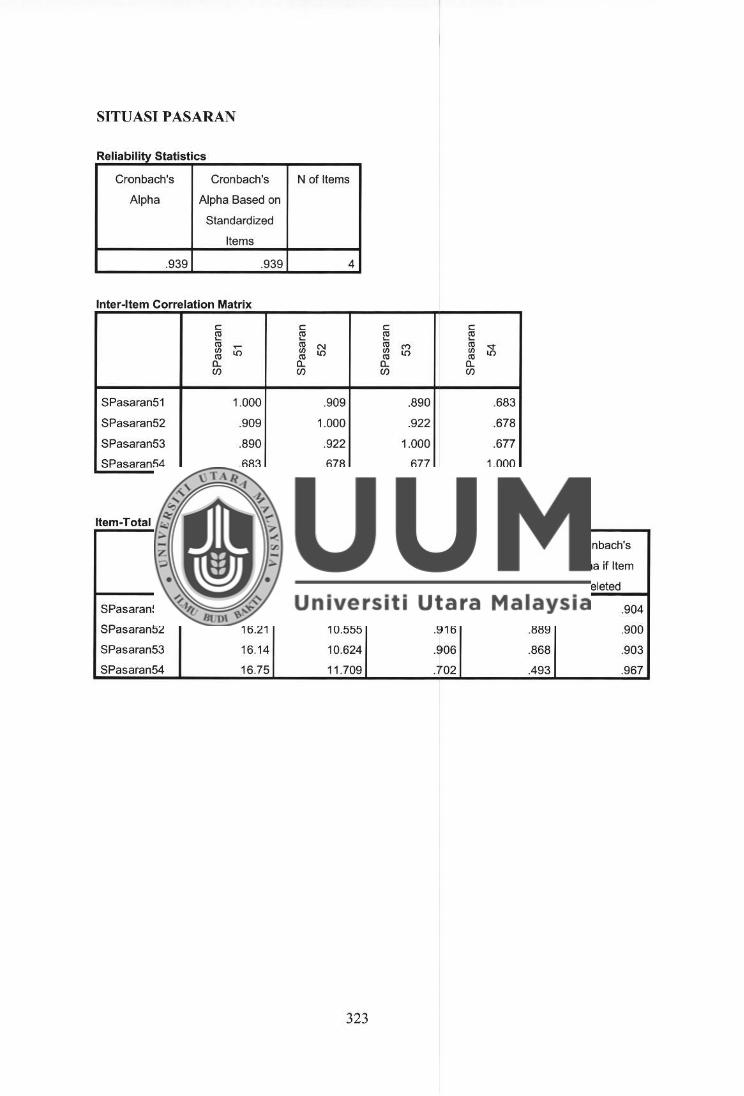
SITUASI PASARAN
Reliability Statistics
Cronbach's Cronbach's N of Items
Alpha Alpha Based on
Standardized
Items
.939 .939 4
lnter-ttem Correlation Matrix
C: C: C: C: Ctl Ctl Ctl Ctl
ro ,.... ro N ro (") ro ';I, Cl) I[)
Cl) I[)
Cl) I[)
Cl)
Ctl Ctl Ctl Ctl a. a. a. a. Cf) Cf) Cf) Cf)
SPasaran51 1.000 .909 .890 .683
SPasaran52 .909 1.000 .922 .678
SPasaran53 .890 .922 1.000 .677
SPasaran54 .683 .678 .677 1.000
Item-Total Statistics
Scale Mean if Scale Variance Corrected Item- Squared Cronbach's
Item Deleted if Item Deleted Total Multiple Alpha if Item
Correlation Correlation Deleted
SPasaran51 16.29 10.311 .902 .848 .904
SPasaran52 16.21 10.555 .916 .889 .900
SPasaran53 16.14 10.624 .906 .868 .903
SPasaran54 16.75 11.709 .702 .493 .967
323
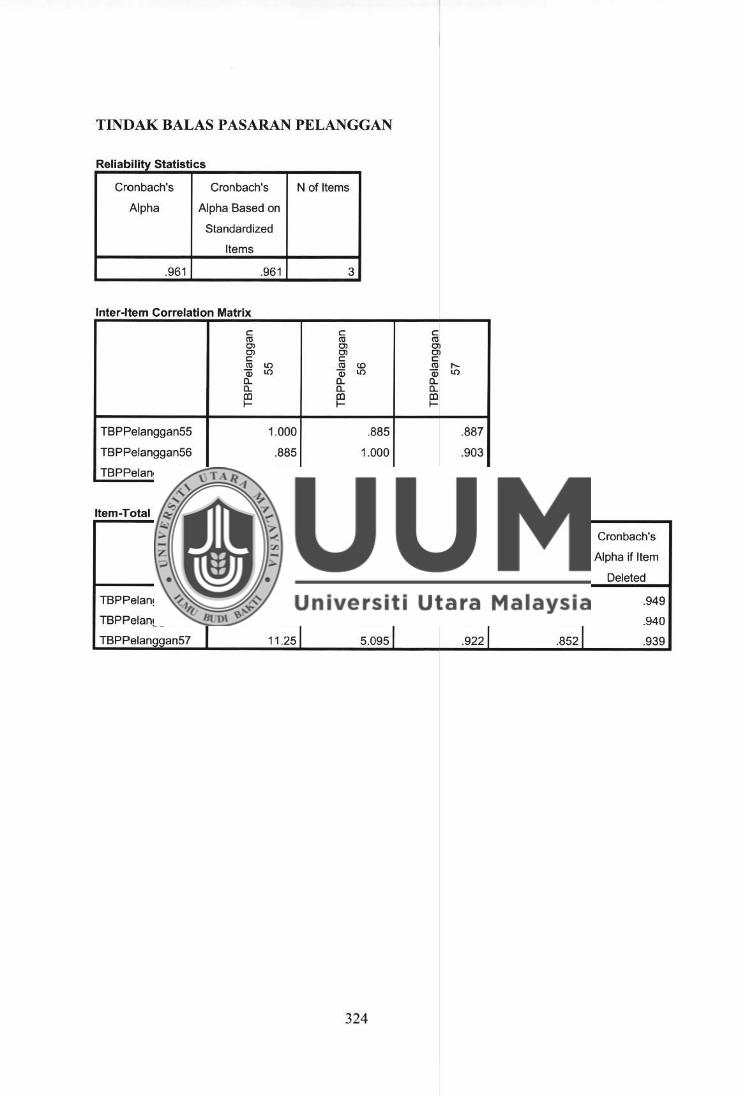
TINDAK BALAS PASARAN PELANGGAN
Reliability Statistics
Cronbach's Cronbach's N of Items
Alpha Alpha Based on
Standardized
Items
.961 .961 3
Inter-Item Correlation Matrix
C C C <11 <11 <11 Ol Ol Ol Ol C
Ol C
Ol C
<11 I() <11 co (1l I'--a3 I() a3 I() a3 I()
a. a. a. a. a. a. Ill Ill Ill t- t- t-
TBPPelanggan55 1.000 .885 .887
TBPPelanggan56 .885 1.000 .903
TBPPelanaaan57 .887 .903 1.000
Item-Total Statistics
Scale Mean if Scale Variance Corrected Item- Squared Cronbach's
Item Deleted if Item Deleted Total Multiple Alpha if Item
Correlation Correlation Deleted
TBPPelanggan55 11.41 4.996 .908 .825 .949
TBPPelanggan56 11.32 5.090 .920 .849 .940
TBPPelanggan57 11.25 5.095 .922 .852 .939
324
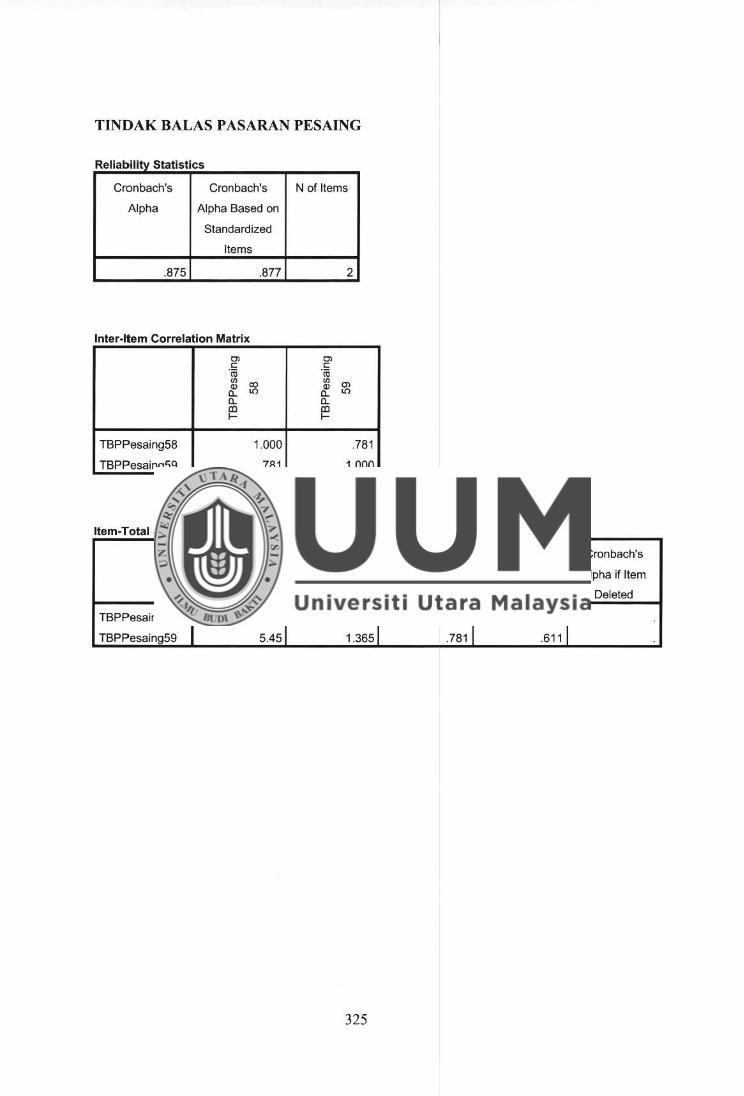
TINDAK BALAS PASARAN PESAING
Reliability Statistics
Cronbach's Cronbach's N of Items
Alpha Alpha Based on
Standardized
Items
.875 .877 2
Inter-Item Correlation Matrix
Cl Cl C: C: ·ro ·ro <I) co <I)
O> Q) Q) a. LO a. LO a. a. co I-
co I-
TBPPesaing58 1.000 .781
TBPPesaing59 .781 1.000
Item-Total Statistics
Scale Mean if Scale Variance Corrected Item- Squared Cronbach's
Item Deleted if Item Deleted Total Multiple Alpha if Item
Correlation Correlation Deleted
TBPPesaing58 5.75 1.121 .781 .611
TBPPesaing59 5.45 1.365 .781 .611
325
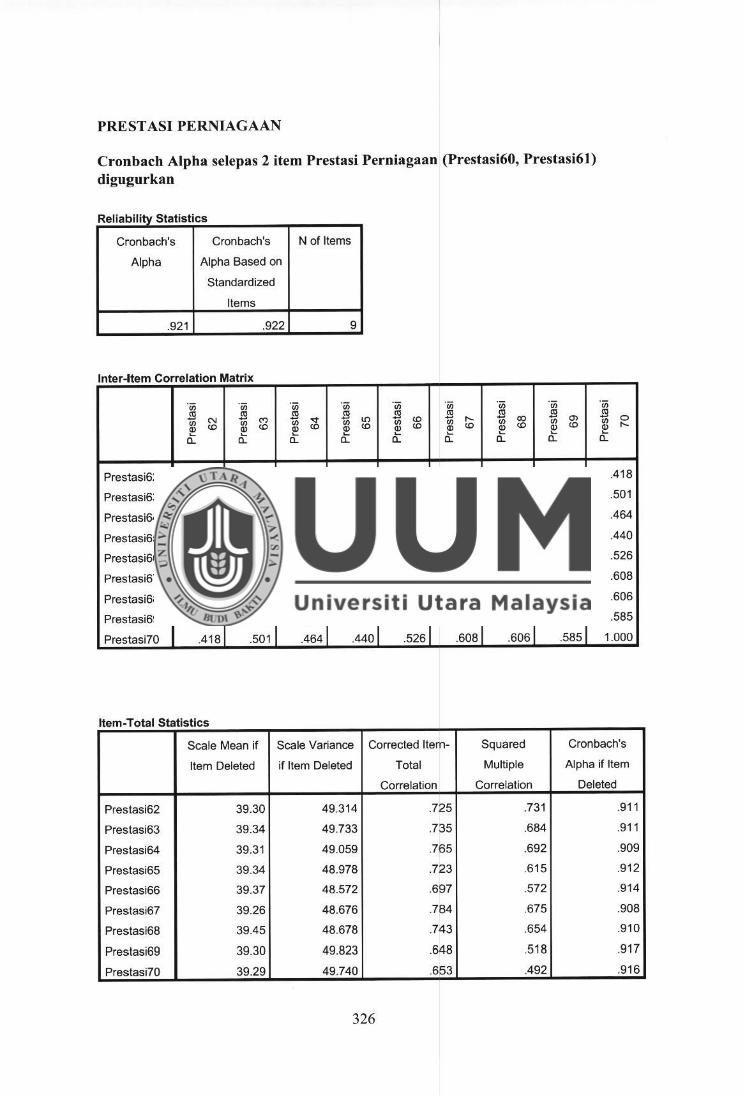
PREST ASI PERNIAGAAN
Cronbach Alpha selepas 2 item Prestasi Perniagaan (Prestasi60, Prestasi6l) digugurkan
Reliability Statistics
Cronbach's Cronbach's N of Items
Alpha Alpha Based on
Standardized
Items
.921 .922 9
Inter-Item Correlation Matrix
·;;; ·;;; ·;;; ·;;; ·;;; ·;;; ·;;; ·;;; ·;;; s .s .s .s ~
ro .s ro s {/) N {/)
C') {/) '<t {/) IO <.O iii r-.. {/) 00 iii 0) {/) 0
~ <.O Q) <.O ~
<.O Q) <.O ~
<.O Q) <.O ~ <.O Q) <.O Q) r-..
a: a: ct .... ct a.. a.. a.. a.. a..
Prestasi62 1.000 .777 .772 .710 .482 .518 .509 .413 .418
Prestasi63 .777 1.000 .718 .668 .448 .576 .486 .468 .501
Prestasi64 .772 .718 1.000 .693 .533 .626 .562 .443 .464
Prestasi65 .710 .668 .693 1.000 .546 .582 .472 .464 .440
Prestasi66 .482 .448 .533 .546 1.000 .703 .651 .510 .526
Prestasi67 .518 .576 .626 .582 .703 1.000 .703 .566 .608
Prestasi68 .509 .486 .562 .472 .651 .703 1.000 .664 .606
Pres1asi69 .413 .468 .443 .464 .510 .566 .664 1.000 .585
Prestasi70 .418 .501 .464 .440 .526 .608 .606 .585 1.000
Item-Total Statistics
Scale Mean if Scale Variance Corrected Item- Squared Cronbach's
Item Deleted if Item Deleted Total Multiple Alpha if Item
Correlation Correlation Deleted
Prestasi62 39.30 49.314 .725 .731 .911
Prestasi63 39.34 49.733 .735 .684 .911
Prestasi64 39.31 49.059 .765 .692 .909
Prestasi65 39.34 48.978 .723 .615 .912
Prestasi66 39.37 48.572 .697 .572 .914
Prestasi67 39.26 48.676 .784 .675 .908
Prestasi68 39.45 48.678 .743 .654 .910
Prestasi69 39.30 49.823 .648 .518 .917
Prestasi70 39.29 49.740 .653 .492 .916
326
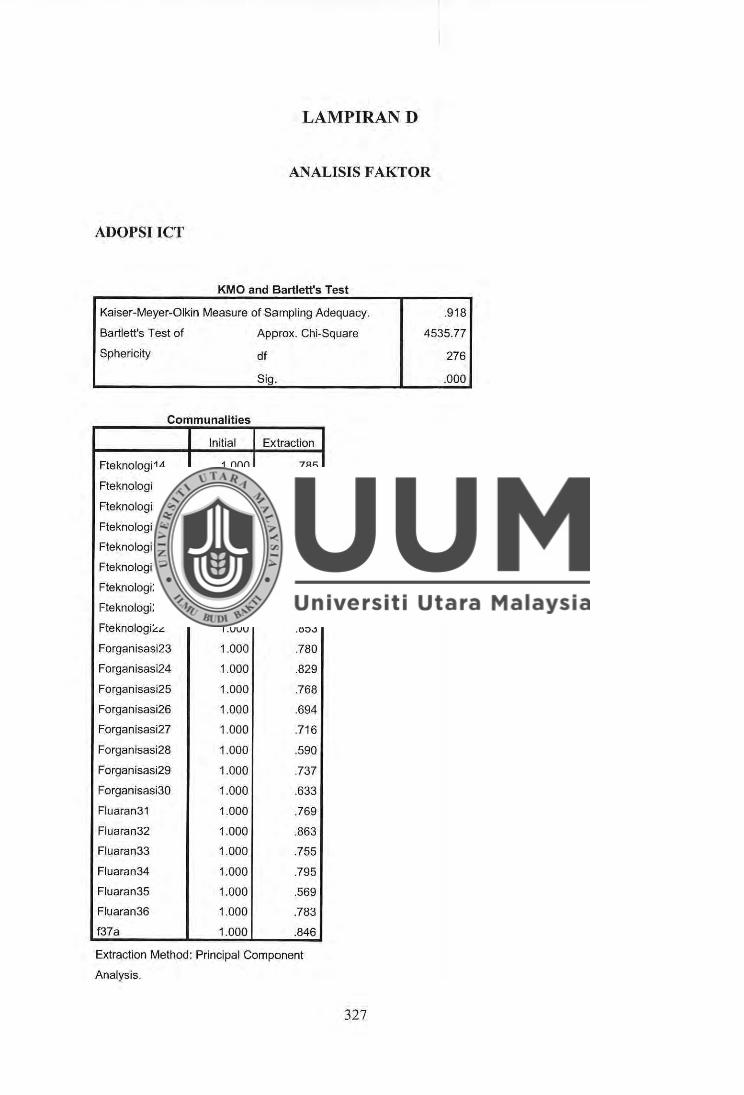
LAMPIRAND
ANALISIS FAKTOR
ADOPSIICT
KMO and Bartlett's Test
Kaiser-Meyer-Olkin Measure of Sampling Adequacy.
Bartlett's Test of
Sphericity
Communalities
Initial
Fteknologi14 1.000
Fteknologi15 1.000
Fteknologi 16 1.000
Fteknologi 17 1.000
Fteknologi 18 1.000
Fteknologi 19 1.000
Fteknologi20 1.000
Fteknologi21 1.000
Fteknologi22 1.000
Forganisasi23 1.000
Forganisasi24 1.000
Forganisasi25 1.000
Forganisasi26 1.000
Forganisasi27 1.000
Forganisasi28 1.000
Forganisasi29 1.000
Forganisasi30 1.000
Fluaran31 1.000
Fluaran32 1.000
Fluaran33 1.000
Fluaran34 1.000
Fluaran35 1.000
Fluaran36 1.000
f37a 1.000
Approx. Chi-Square
df
Sig.
Extraction
.785
.799
.798
.825
.650
.780
.838
.689
.853
.780
.829
.768
.694
.716
.590
.737
.633
.769
.863
.755
.795
.569
.783
.846
Extraction Method: Principal Component
Analysis.
327
.918
4535.77
276
.000
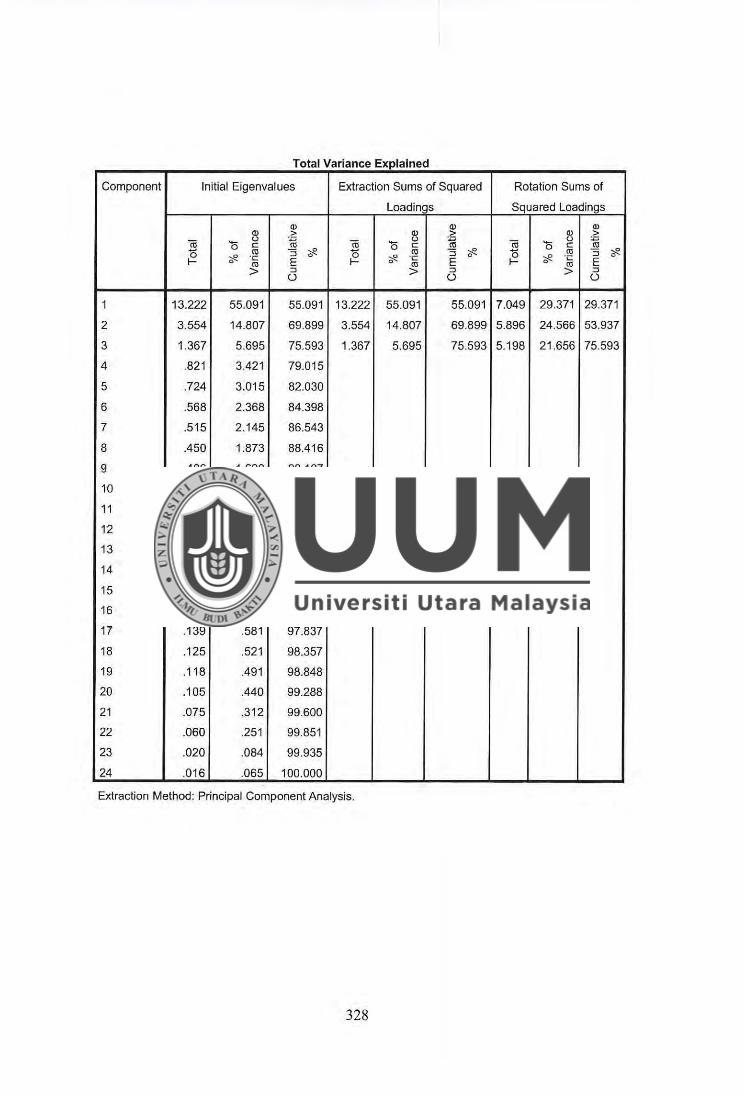
Total Variance Explained
Component Initial Eigenvalues Extraction Sums of Squared Rotation Sums of
Loadings Squared Loadin;:is
Cl) Cl) Cl) Cl) > Cl) > Q) >
! 0 0 ~ cii 0
0 ~ cii 0 0 '; C C C
(1) :5 cF. 0 (1) :5 -,R. 0 (1) :5 -,R. -,R. -~ cF. -~ 0 -,R. ·.:: 0 0 E I- E I- 0 (1) E
> :::J > :::J > :::J u u u
1 13.222 55.091 55.091 13.222 55.091 55.091 7.049 29.371 29.371
2 3.554 14.807 69.899 3.554 14.807 69.899 5.896 24.566 53.937
3 1.367 5.695 75.593 1.367 5.695 75.593 5.198 21.656 75.593
4 .821 3.421 79.015
5 .724 3.015 82.030
6 .568 2.368 84.398
7 .515 2.145 86.543
8 .450 1.873 88.416
9 .406 1.690 90.107
10 .342 1.424 91.530
11 .318 1.324 92.854
12 .257 1.071 93.925
13 .231 .964 94.889
14 .219 .911 95.800
15 .179 .744 96.545
16 .171 .712 97.256
17 .139 .581 97.837
18 .125 .521 98.357
19 .118 .491 98.848
20 .105 .440 99.288
21 .075 .312 99.600
22 .060 .251 99.851
23 .020 .084 99.935
24 .016 .065 100.000
Extraction Method: Principal Component Analysis.
328
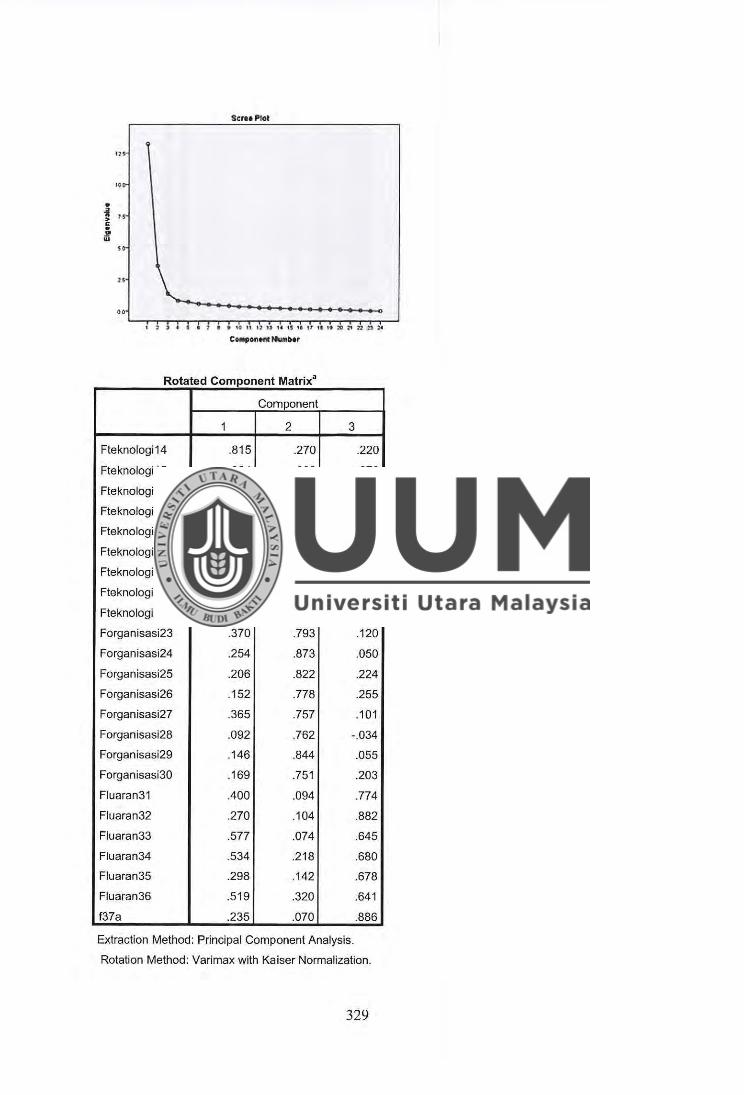
.,. , .
• ! 15
5 • iii ,.
Sct .. Pfol
, • , 1 a • 10 n 1: •> u ,s 1e , ,. 11 .. :'0 71 :: n ~
Rotated Component Matrix"
Component
1 2 3
Fteknologi14 .815 .270 .220
Fteknologi 15 .824 .208 .278
Fteknologi 16 .815 .240 .274
Fteknologi17 .725 .223 .500
Fteknologi18 .701 .288 .275
Fteknologi 19 .715 .260 .448
Fteknologi20 .815 .247 .335
Fteknologi21 .672 .310 .375
Fteknologi22 .820 .250 .344
Forganisasi23 .370 .793 .120
Forganisasi24 .254 .873 .050
Forganisasi25 .206 .822 .224
Forganisasi26 .152 .778 .255
Forganisasi27 .365 .757 .101
Forganisasi28 .092 .762 -.034
Forganisasi29 .146 .844 .055
Forganisasi30 .169 .751 .203
Fluaran31 .400 .094 .774
Fluaran32 .270 .104 .882
Fluaran33 .577 .074 .645
Fluaran34 .534 .218 .680
Fluaran35 .298 .142 .678
Fluaran36 .519 .320 .641
f37a .235 .070 .886
Extraction Method: Principal Component Analysis.
Rotation Method: Varimax with Kaiser Normalization.
329
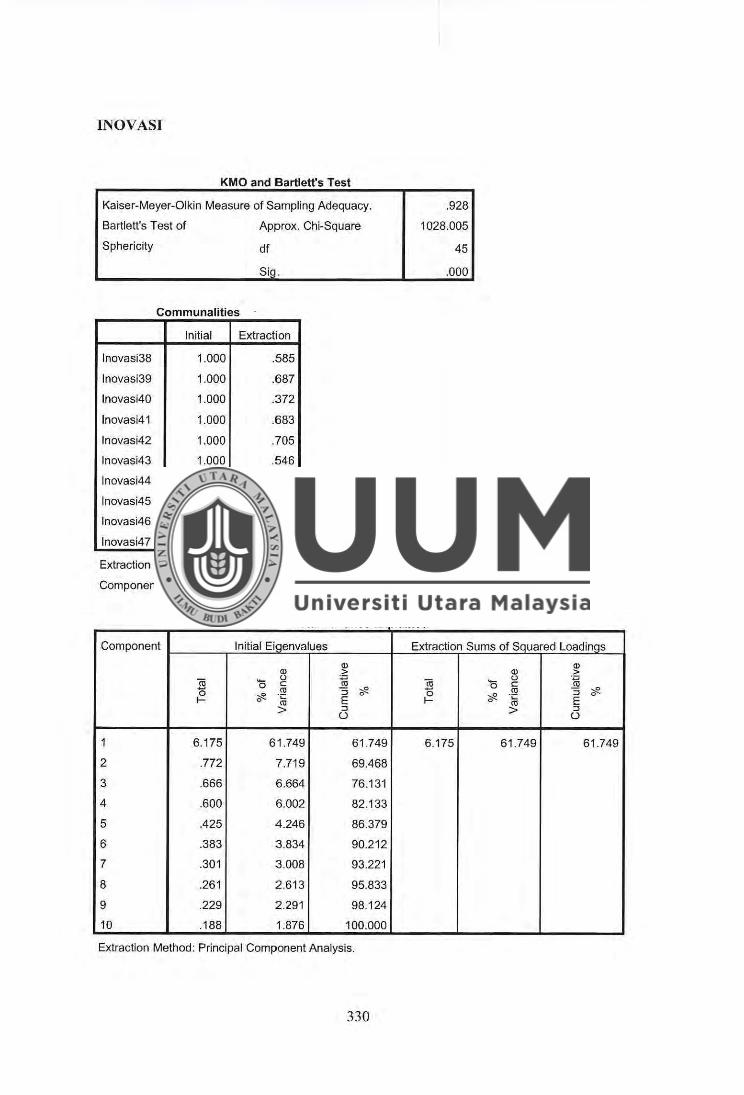
INOVASI
KMO and Bartlett's Test
Kaiser-Meyer-Olkin Measure of Sampling Adequacy.
Bartlett's Test of Approx. Chi-Square
Sphericity
Communalities
df
SiQ.
Initial Extraction
lnovasi38 1.000
lnovasi39 1.000
lnovasi40 1.000
lnovasi41 1.000
lnovasi42 1.000
lnovasi43 1.000
lnovasi44 1.000
lnovasi45 1.000
lnovasi46 1.000
lnovasi47 1.000
Extraction Method: Principal
Component Analysis.
.585
.687
.372
.683
.705
.546
.666
.701
.673
.554
oa anance T t IV .
.928
1028.005
45
.000
E I . d xJ1ame
Component Initial Eiaenvalues Extraction Sums of Squared LoadinQs
Q) Q) Q) > Q) >
~ 0 u ~ ro 0
u ~ C C
Cll "S ~ 0 Cll ::J ~ cf- -~ 0 ~ -~ 0
I- E I- 0 E > ::J > ::J
0 0
1 6.175 61.749 61 .749 6.175 61 .749 61 .749
2 .772 7.719 69.468
3 .666 6.664 76.131
4 .600 6.002 82.133
5 .425 4 .246 86.379
6 .383 3 .834 90.212
7 .301 3.008 93.221
8 .261 2.613 95.833
9 .229 2.291 98.124
10 .188 1.876 100.000
Extraction Method: Principal Component Analysis.
330
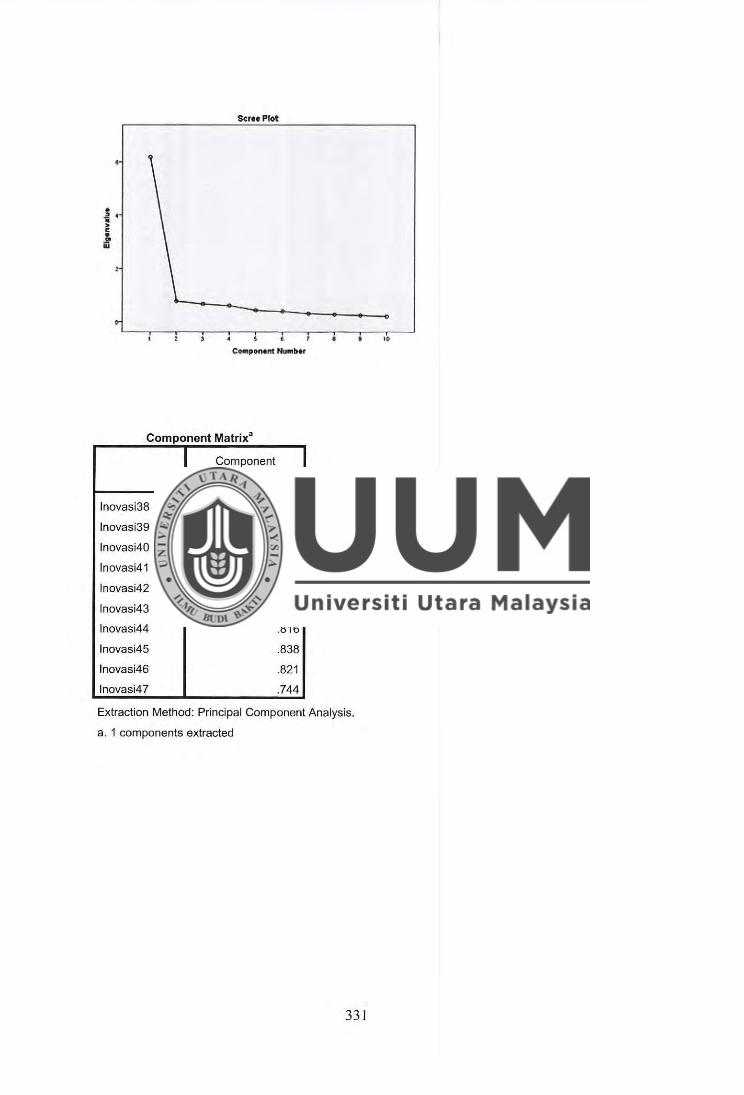
• l! ' ;: " • J/1 .,
• CNlpOMnt HtalbH
Component Matrix"
Component
1
lnovasi38 .765
lnovasi39 .829
lnovasi40 .610
lnovasi41 .826
lnovasi42 .840
lnovasi43 .739
lnovasi44 .816
lnovasi45 .838
lnovasi46 .821
lnovasi47 .744
Extraction Method: Principal Component Analysis.
a. 1 components extracted
331
10
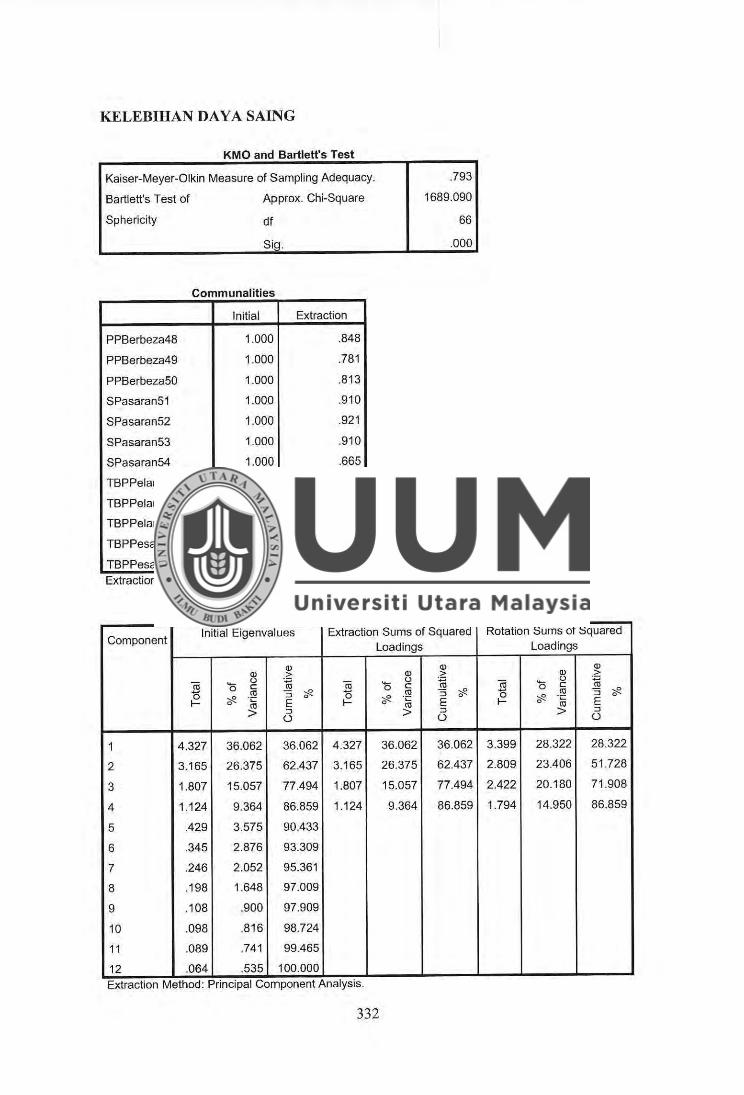
KELEBIHAN DAY A SAING
KMO and Bartlett's Test
Kaiser-Meyer-Olkin Measure of Sampling Adequacy.
Bartlett's Test of Approx. Chi-Square
Sphericity df
Sig.
Communalities
Initial
PPBerbeza48 1.000
PPBerbeza49 1.000
PPBerbeza50 1.000
SPasaran51 1.000
SPasaran52 1.000
SPasaran53 1.000
SPasaran54 1.000
TBPPelanggan55 1.000
TBPPelanggan56 1.000
TBPPelanggan57 1.000
TBPPesaing58 1.000
TBPPesaina59 1.000
Extraction
.848
.781
.813
.910
.921
.910
.665
.919
.938
.934
.889
.895 Extraction Method: Principal Component Analysis.
.793
1689.090
66
.000
Total Variance Explained
Component Initial Eigenvalues Extraction Sums of Squared
Loadings
Q) Q) Q) > Q) .:::
ni 0 (.)
~ ni 0 (.) ro C: C
0 co :::, ~ 0 co 3 ~ ~ ·c: 0 ~ -~
0
f- 0 co E f- 0 E > :::, > :::,
0 0
1 4.327 36.062 36.062 4.327 36.062 36.062
2 3.165 26.375 62.437 3.165 26.375 62.437
3 1.807 15.057 77.494 1.807 15.057 77.494
4 1.124 9.364 86.859 1.124 9.364 86.859
5 .429 3.575 90.433
6 .345 2.876 93.309
7 .246 2.052 95.361
8 .198 1.648 97.009
9 .108 .900 97.909
10 .098 .816 98.724
11 .089 .741 99.465
12 .064 .535 100.000 Extraction Method: Principal Component Analysis.
332
Rotation Sums of Squared Loadings
Q) Q) .:::
ni 0 (.) ro C:
0 co 3 ~ ~ ·.:: 0
f- 0 co E > :::,
0
3.399 28.322 28.322
2.809 23.406 51.728
2.422 20.180 71.908
1.794 14.950 86.859
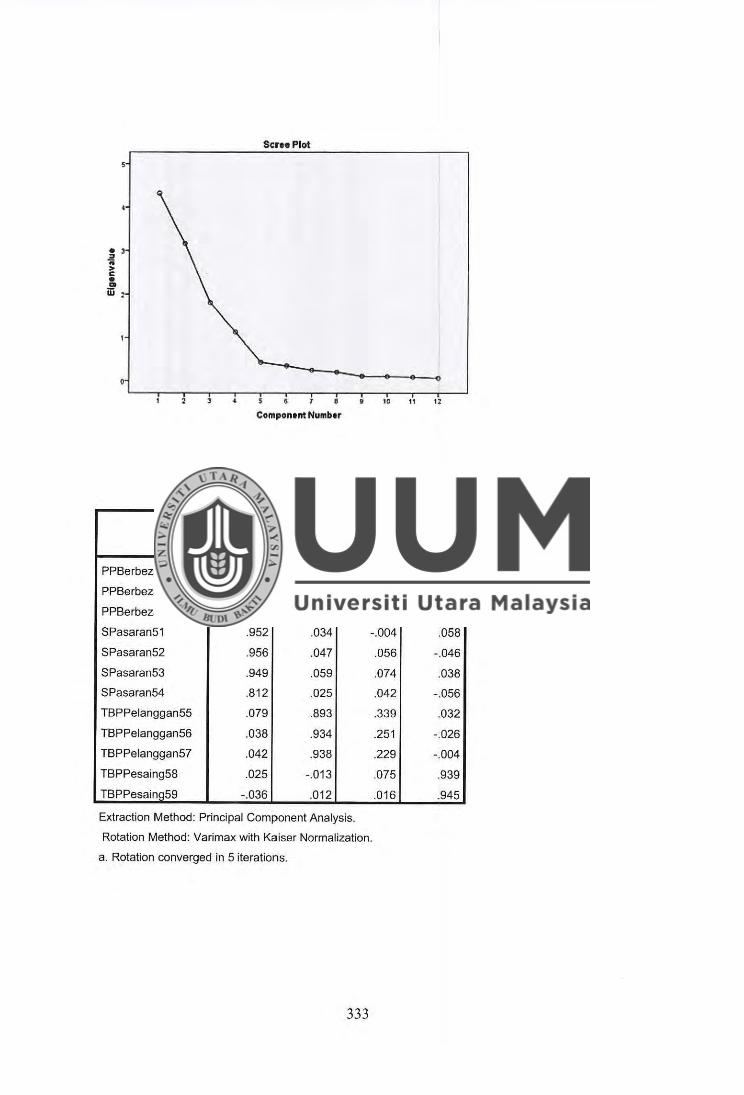
. ' 3 .. a; • a iD :
Scree Plot
a 8 9 10 11 12
Component Number
Rotated Component Matrix"
Component
1 2 3
PPBerbeza48 .035 .366 .843
PPBerbeza49 .033 .307 .828
PPBerbeza50 .079 .152 .883
SPasaran51 .952 .034 -.004
SPasaran52 .956 .047
SPasaran53 .949 .059
SPasaran54 .812 .025
TBPPelanggan55 .079 .893
TBPPelanggan56 .038 .934
TBPPelanggan57 .042 .938
TBPPesaing58 .025 -.013
TBPPesaing59 -.036 .012
Extraction Method: Principal Component Analysis.
Rotation Method: Varimax with Kaiser Normalization.
a. Rotation converged in 5 iterations.
333
.056
.074
.042
.339
.251
.229
.075
.016
4
.048
.002
.067
.058
-.046
.038
-.056
.032
-.026
-.004
.939
.945
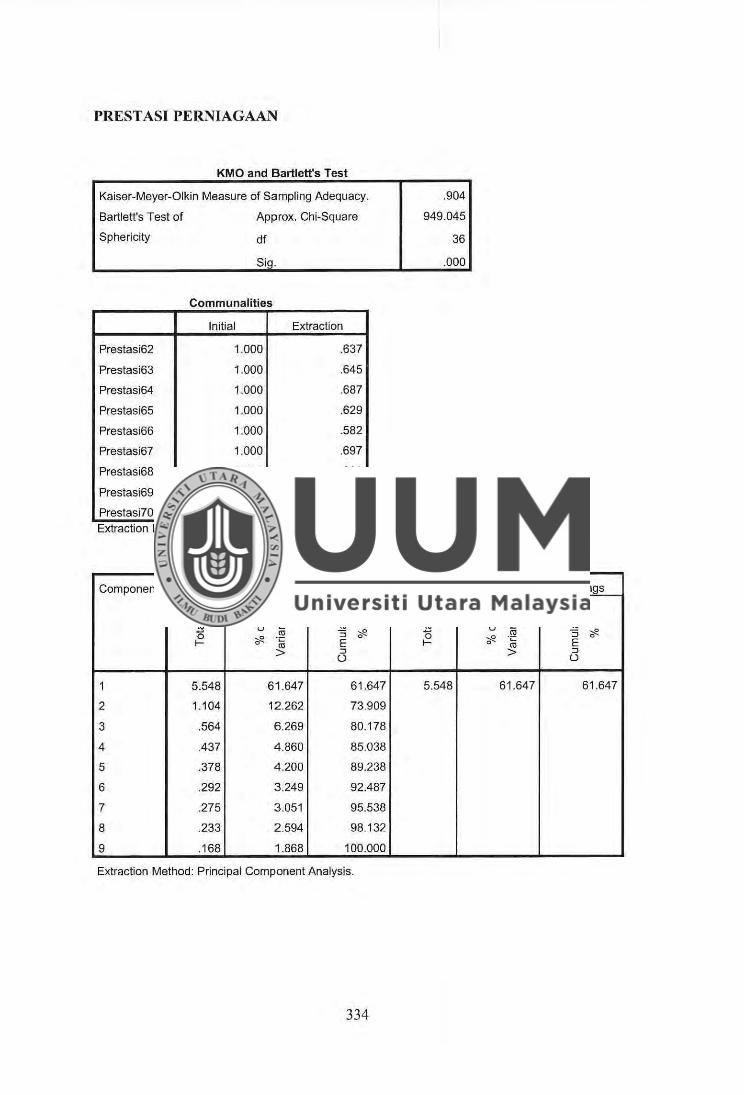
PRESTASIPERNIAGAAN
KMO and Bartlett's Test
Kaiser-Meyer-Olkin Measure of Sampling Adequacy.
Bartlett's Test of Approx. Chi-Square
Sphericity
Prestasi62
Prestasi63
Prestasi64
Prestasi65
Prestasi66
Prestasi67
Prestasi68
Prestasi69
Prestasi70
df
Siq.
Communalities
Initial
1.000
1.000
1.000
1.000
1.000
1.000
1.000
1.000
1.000
Extraction
.637
.645
.687
.629
.582
.697
.638
.512
.521 Extraction Method: Principal Component Analysis.
.904
949.045
36
.000
Total Variance Explained
Component Initial Eigenvalues Extraction Sums of Squared Loadings
Q) Q) Q) .::: Q) >
ro 0 0 cii ro 0
0 ~ C C
0 (1) =i ~ 0 (1) =i ~ ~ -~ 0 ~ ·;:: 0
r- 0 E r- 0 (1) E > :::J > :::J
0 0
1 5.548 61.647 61.647 5.548 61.647 61 .647
2 1.104 12.262 73.909
3 .564 6.269 80.178
4 .437 4.860 85.038
5 .378 4.200 89.238
6 .292 3.249 92.487
7 .275 3.051 95.538
8 .233 2.594 98.132
9 .168 1.868 100.000
Extraction Method: Principal Component Analysis.
334
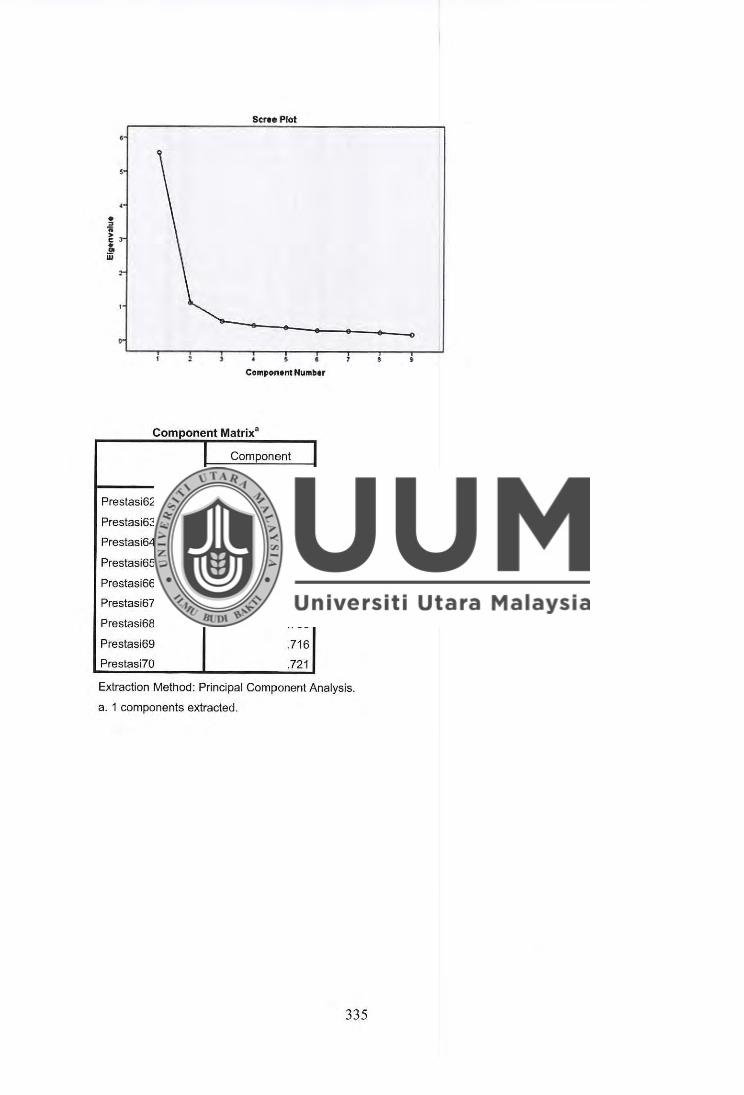
.s
co.,ponent Numb tr
Component Matrix"
Component
1
Prestasi62 .798
Prestasi63 .803
Prestasi64 .829
Prestasi65 .793
Prestasi66 .763
Prestasi67 .835
Prestasi68 .799
Prestasi69 .716
Prestasi70 .721
Extraction Method: Principal Component Analysis.
a. 1 components extracted.
335
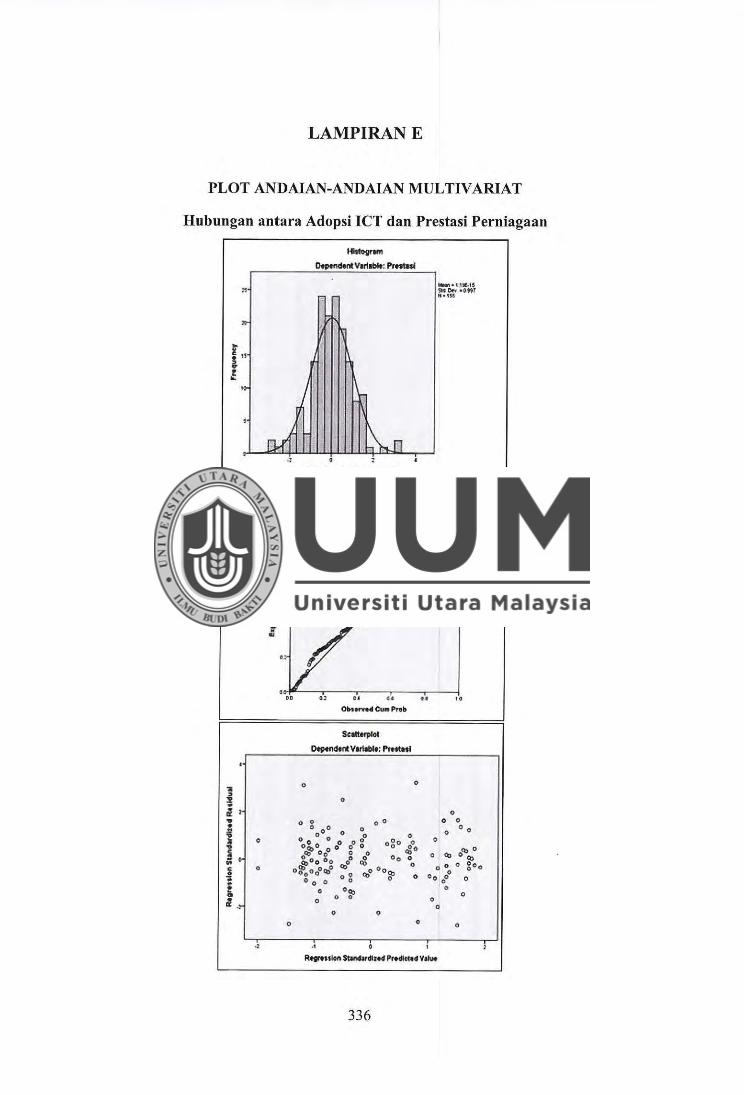
LAMPIRANE
PLOT ANDAIAN-ANDAIAN MULTIV ARIAT
Hubungan antara Adopsi ICT dan Prestasi Perniagaan
0
0
..
Nonna! P.P PlatotR•Gf•HIOII Standllrdl2td R.-.itJ
°"9ff,dtnl Vltl1blt: ,.._
.. .. ..
OM1f'Vff C\JN Preb
0 0
0
0 O 0
336
0
• 0
"
0 0 0 0 0.
0
0
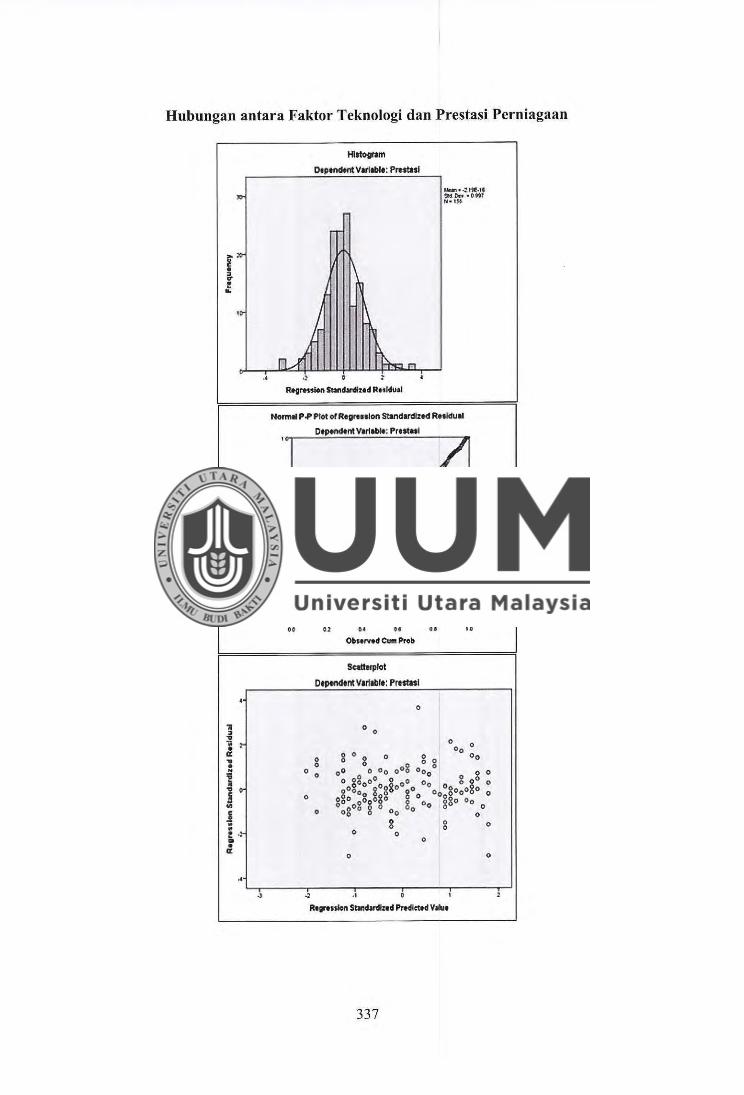
Hubungan antara Faktor Teknologi dan Prestasi Perniagaan
'11
" " I ,.
j j
L -. It
..
Hlstoo,am
O.~tncltn!Vatllllll: Preltlt l
-' .:: 0 t
~l'ffilM SUl!dlNl!ttd Rttlftnl
Normal P.P Plot of Reor-nlon Standardlted Retldull
.)
t ... . ! i t •• ill
Ott)tndtl'ftVlr11111t; Prt._1
Seatl:t,pfot
Ott)tndtntVar1eDle: Prestttl
0
0 0
8 0 0
0
0
0
0
337
0
0
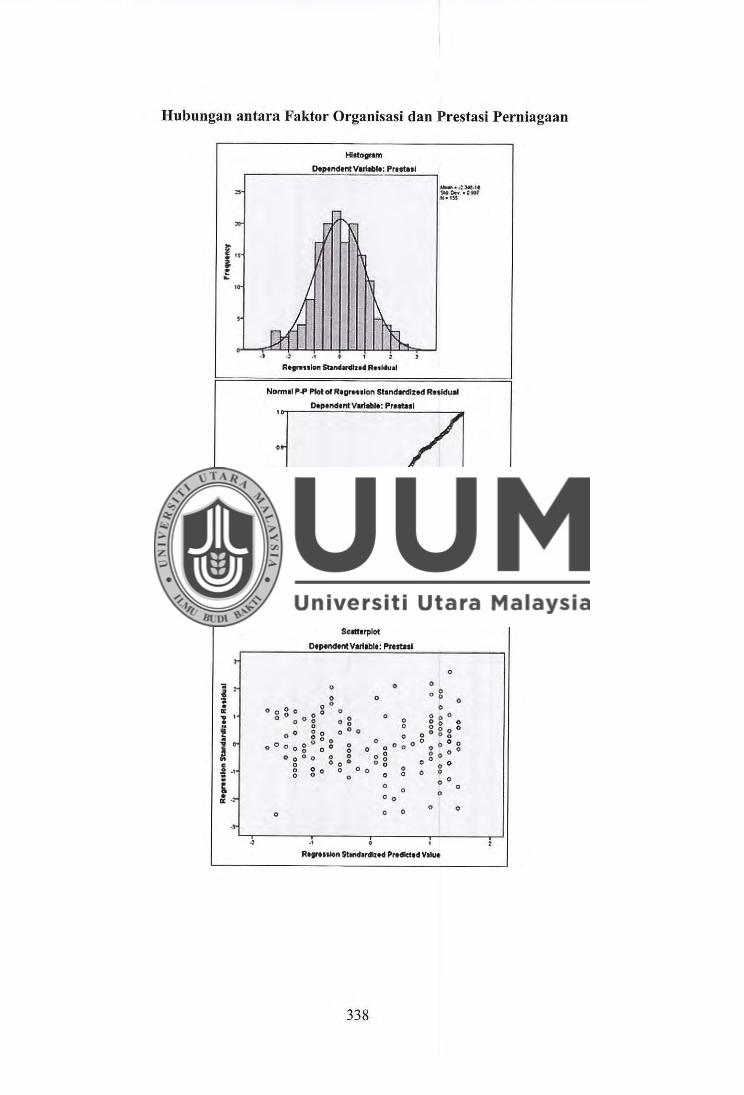
Hubungan antara Faktor Organisasi dan Prestasi Perniagaan
i "' l 1
i • ! " -! -1
' ,_ ..
..
. j
Hlll<>gram
D.ptndtnl Vu!-: PrHIHI
R..,.ttlOl'I ~n• Re-tWuaJ
N<>rm■I P'"' PIGt"' RtgtHllcn St■ndlfdlHd Rttkrual
•
l . I u
1. oil
..
0
D.ptnd■nlVlri-: Pr-I
. , •• .. 0ti ■-r,•• Onn Pra-
Scatt■rplot
Deptndtnt V-.1tblt: PrtftHI
338
0 0
O 0
.. I D
0
0
0 0
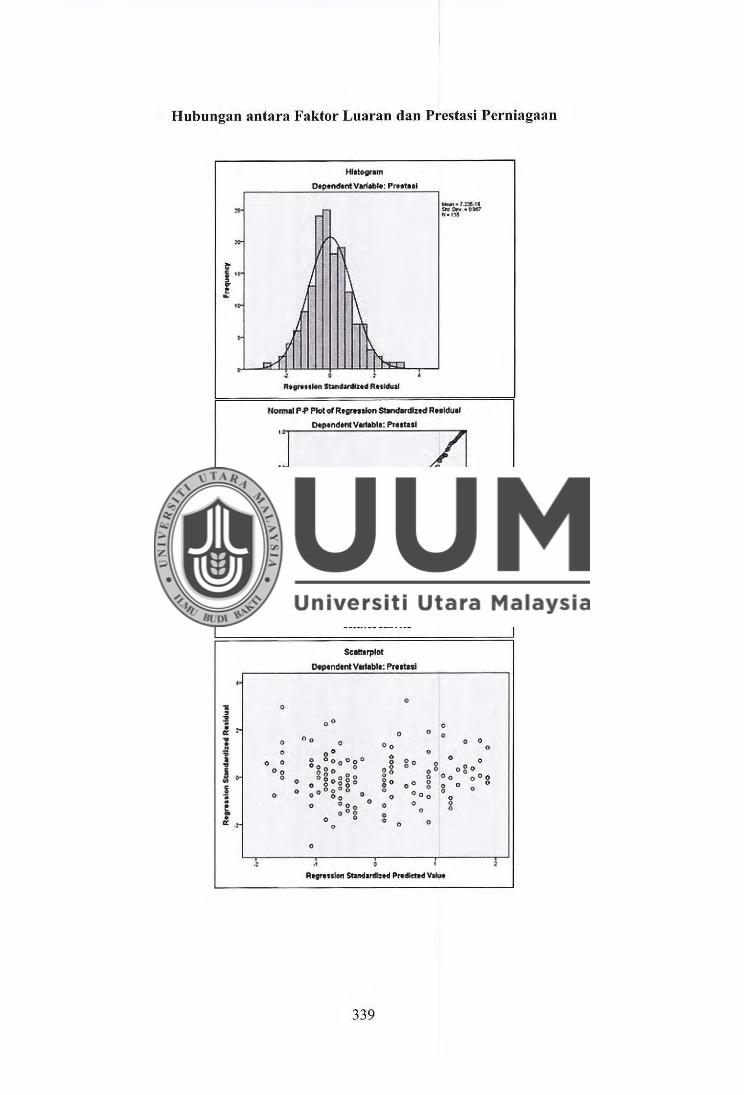
Hubungan antara Faktor Luaran dan Prestasi Perniagaan
,. " ~ • a: ...
i C
a i
l • ~
Hilt01"llffl
Otp-..tVari-: PrHtlill
.. 0
RtttHtltn SUr!-td RHlclv>I
NOffNI P-" P1otof Rlll'ffllon ~<hod Rnldu1I
o.ptnd1nlV_.,.t: ~etul
0 00 • : o, o, ••
01,,.,,.4 c'-- Pn-11
Sc-rplot
DtpendlnlVllllbll: PrtttHI
0 0
00 0 0 0
0 0 Do
0 Oo 0 00
0 0
o o 00 o 0 o go 0 0 0 0 ooo o
'0
0 0 0
0
og o g"' g8 Oo ooo o 0
0 oogog gg go o o 0 0 o 0
o: g g O O 0 0
0 0o 0 oo 0
0 Oo O 0 Oo 0 o ooo o 0 0 g
o oog 0 g
0 0 0
0
., 0
Rtf'111I.., $1,,Mardbo<I Prodldo<I v.hH
339
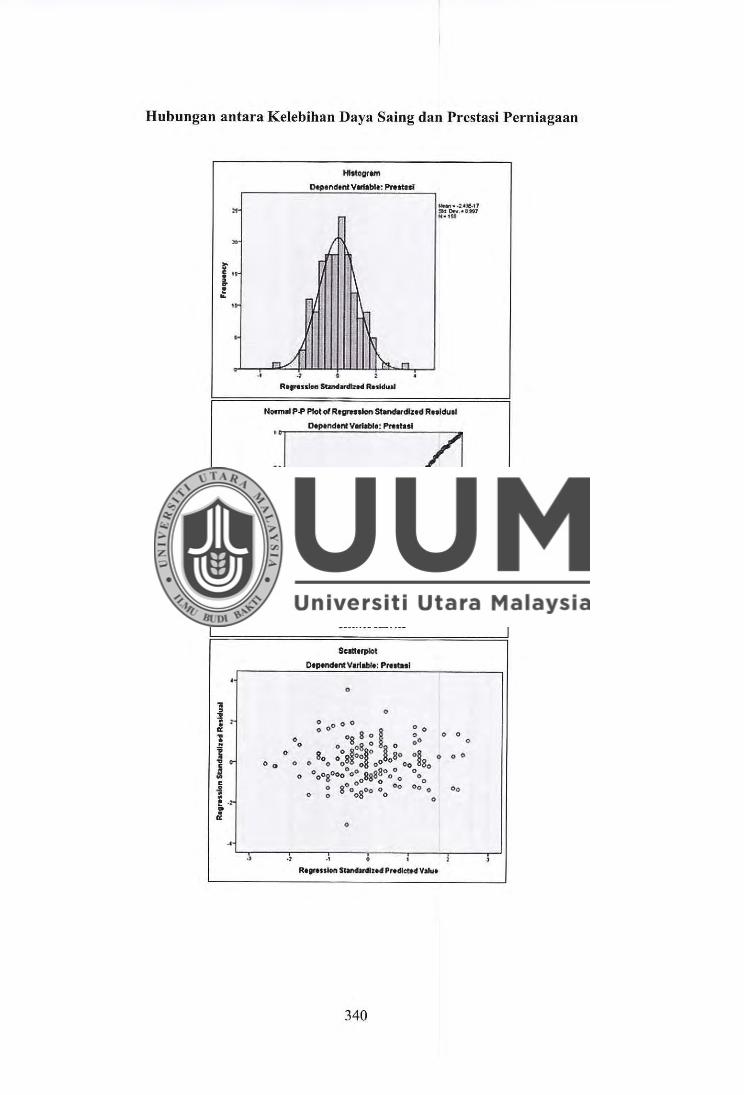
Hubungan antara Kelebihan Daya Saing dan Prestasi Perniagaan
l 1 II:
i e -! ~ . r II:
.. ,)
.. ..
Hbtogram
OtptndtntV-blt: Pnttul
R•f'•nl.., s..n4.-.llz■4 RalldlJII
Noomol P-1' Plot ot Rtgrn"'°" ~<lttd R"ldutl
O.S,.ndtntV-t: PNttUI
! . I u
L. It .,
•• 02 •• •• •• .. ObtNYe4 C&aa PTM
9"1hrplo1
Dlp«ldtntVarlllll•: Pt•-1
0
0
: 00 0 0 0 0
08 8 o ~ o0 o 0
0 0 0 0 o80 0 0
0 So ood~o go 1 o 0 0 0 0 0 0 0 0 oO O Oo 80
o 0 goo o 0 0
00 800;> o Sg8 o O o O 0 o O 0
: 8 oo8oo "o oo Oo o Oo 0
0
0
., ., • R, .... 1on --tod PtHICl>td v••
340
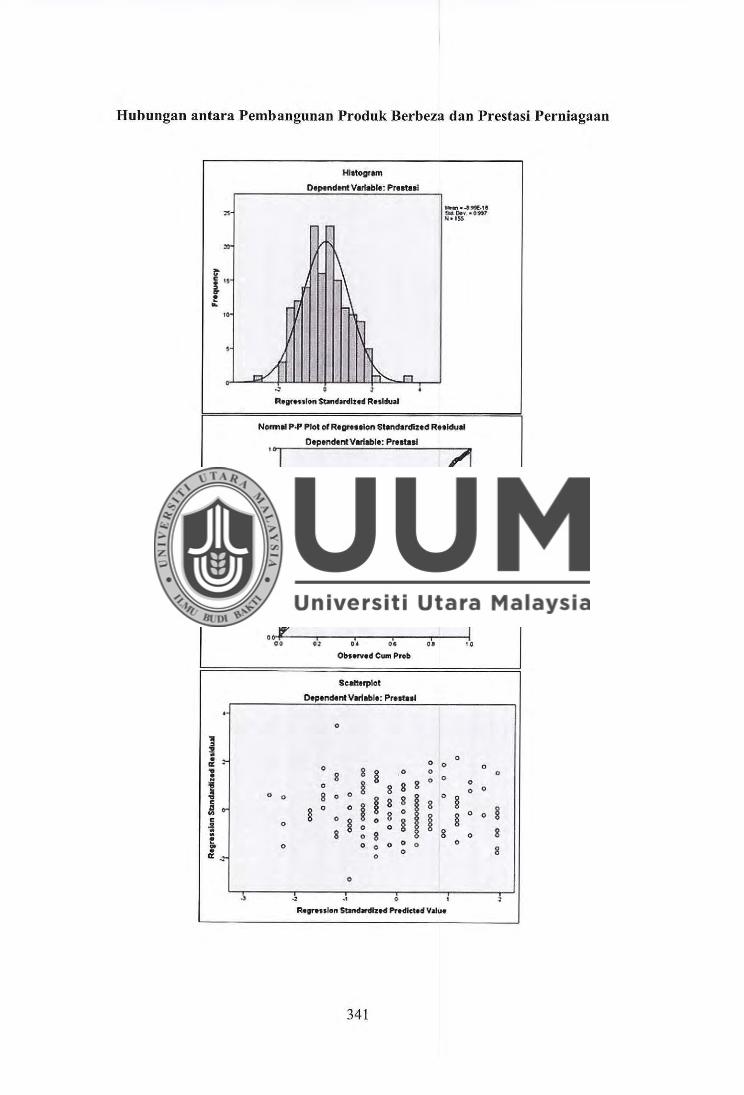
Hubungan antara Pembangunan Produk Berbeza dan Prestasi Perniagaan
~ • ;; • a: l j ! .., I!
-! i! .. ~
.,
Hlstogrem
Otpendtnl VIIJ'lable: Prutul
Normll P.P Plot Of RtDNHlon St10nct.nllttcl Rttlclull
.. I! IL 0
~ u ... i a lt .,
0
0
00
0
0
0
OtptncltntV1111ablt: Prtmlll
., o• •• 01
O~nrvod CUIII P"'b
Scalttrplol
Otptncltnt Vlll1ablt: Prulnl
0
0 0
0 0
8 8 § 0 0 0 0
0 0 0 § 8 8 g
8 8 8 I 0 §
0 " i ff g
§ g 0
i § 0 § 0 0 0 § 8 0 8 g
0 0 0 0 0 0
0 0
0
., 0
Ro.-..,1,n Sto...,_ch..t PH<lleud Value
341
I 0
0 0
0 0 0
0 0 §
0 8
8
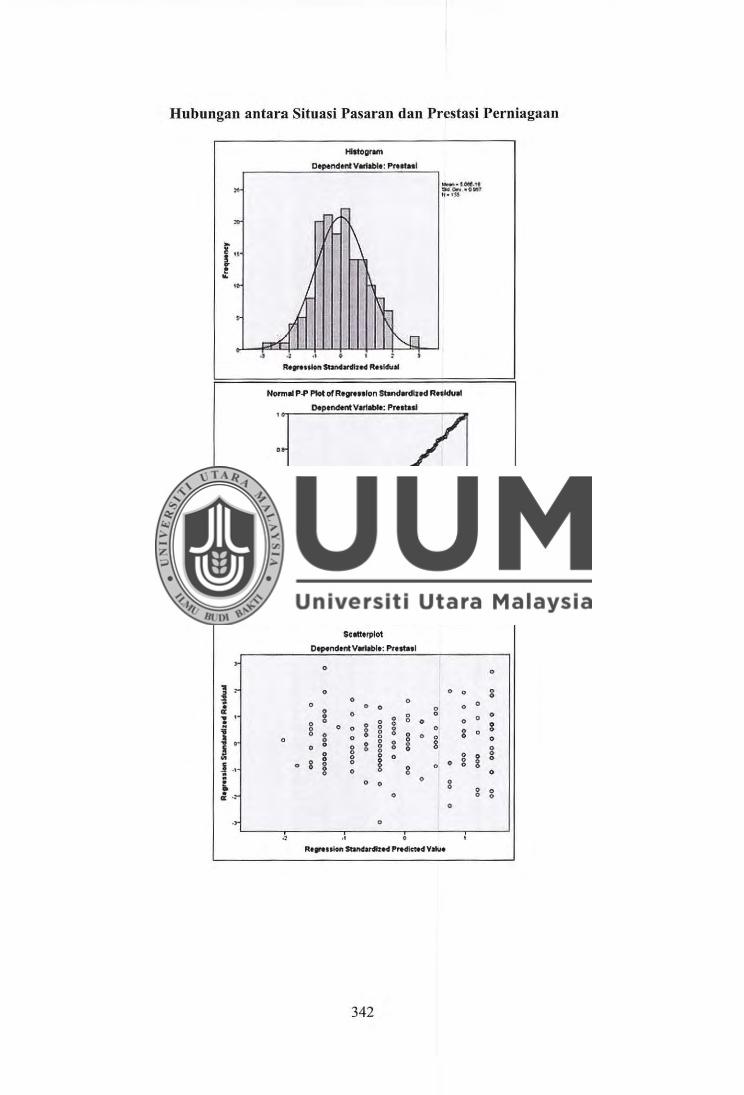
Hubungan antara Situasi Pasaran dan Prestasi Perniagaan
i a
I !
1
! i .. ~
.. .:
HlttOgtttn
DttiendtntVllltable: Pt•-1
~ ... •lion _ _,.., "-•1""11
Nomlel P-1' Ptot of R.-nlon S.....,_dlre<I Rtdduolt
o.p.-vatt-: Prettul
• •• ., •• •• •• 1 0
~••rHd Cua~
$1:-rplot
DttiendffltVomblt: Pt•-' 0
0 0 0
0 0 0
0 0 0 0
8 0 0 0 0 0 i 0 0 0
§ 0 0 § 0 0 8 0
0
I 0 0 0 § 0 0 0 0 0
0 0 8 0 0 0 g 0
I 0 0 0 0 0 g 0 0
0 0 0 g 0 0 0
0 0 0
8 0
0
0
., ., 0
l!t.,.nlofl --•d l'rt,llci.dV-
342
0
0 0
0
0 0
0 8 0
§ 0 0 0
0
8 0 0
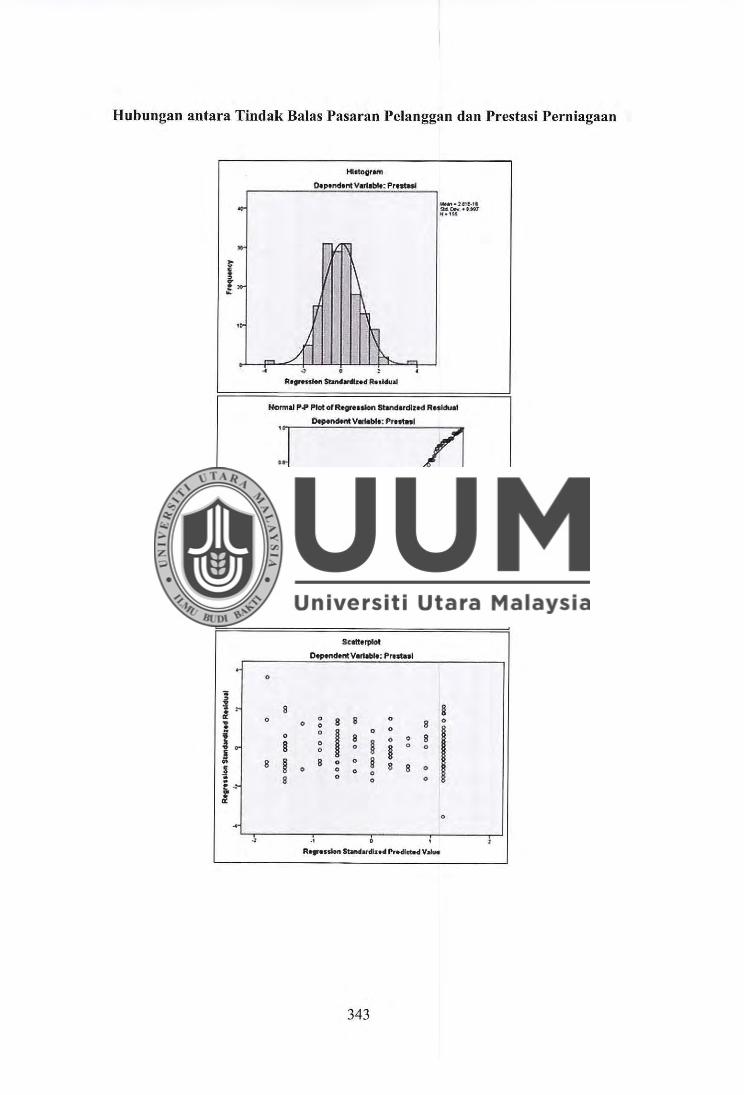
Hubungan antara Tindak Balas Pasaran Pelanggan dan Prestasi Perniagaan
I
1 J l l
i ! ! t ~ l
.,
HIIIOGrtm
OtptndtritVwblt; Prt-
Normal P-" PlotofRegrtHlofl sttnd1n:llrod RHldual
0--Vatablt; f'rt-1
t ... . I u
I t .. ,I)
.. • •• ., ... • • • • ,.
OIH.,,,t4 CUffl P"'b
S~•rplol
~V..tlblt: Prt.._l
0
8 § 0 0 8 8 0 0 0 0 8
I 0
I 0 0
0 8 0 0 8 § " 0 H B
0 0 0
8 B 8 0 0 § 8 0 0 8 0 0 0
8 0 0 0
0
R..,..,sion C-dardlu4 Pr.dlm,d VahN
343
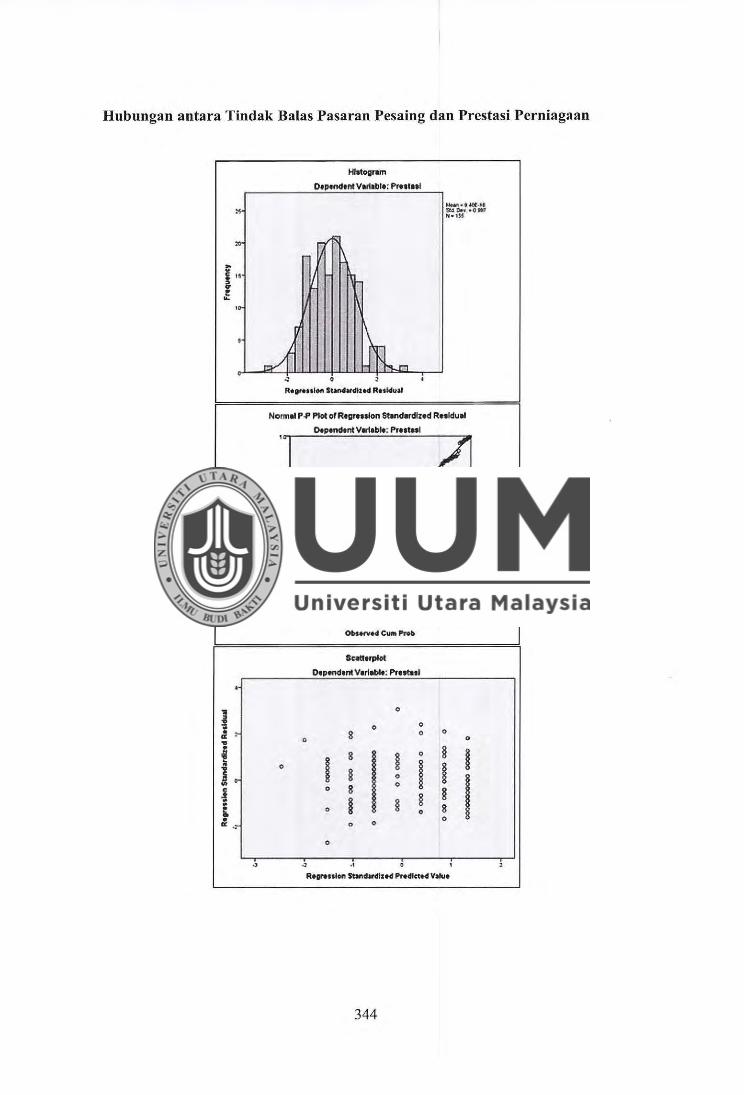
Hubungan antara Tindak Balas Pasaran Pesaing dan Prestasi Perniagaan
.. j .. t J C .t : .. ~
1-htognm
0.Pffldtnt Vtllilbl•: f>q1tas1
~ . , R•a,,.HIOft SUn4•dl .. d Rttf4wl
NcrmelP.P Plot ofR1gn,solrm St.,..,.,rdl,.d RHlduol
Otptndtnt Vtllitbt•: f>q1ml
• •• ., •• •• •• •• OlitHVH CUM Prob
So.thfplot
Otpendtnt Var11111ff: Pr1m1I
0
0 0
8 0 0 0 0
8
I i 0 § I 0 I I I § 0
I 0 0 8 § § I § 8 0 0
0 0 0
0
., ., R~,.HlOfl ftlnclaNll .. d p,.df«od V•o
344
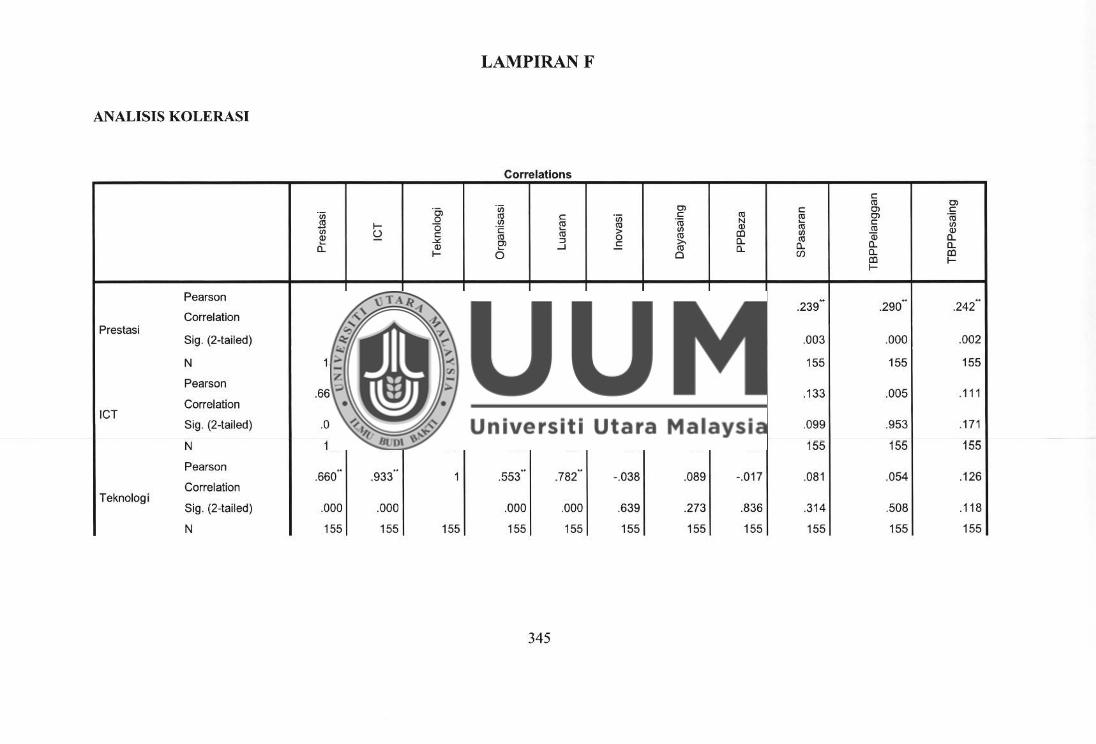
LAMPIRANF
ANALISIS KOLERASI
Correlations
C:
.in <1l 0)
·gi 0) C: 0) C: .in (ti C: .in C: (ti (ti 0) ·n; ~ </)
~ ·n; N <ii C: </) I- 0 ·c (ti Q) ct)
</) () > </) CD </) Q)
~ C: (ti (ti 0 (ti
(ti Qi c.. - ..>:: ::J >, c.. c.. Q) ~ ....I E (ti c.. c.. c.. c..
I- 0 Cl (/) c.. CD CD I-I-
Pearson .. .. .. " .. - .. .. - .. 1 .660 .660 .439 .566 .275 .447 .310 .239 .290 .242
Correlation Prestasi
Sig. (2-tailed) .000 .000 .000 .000 .001 .000 .000 .003 .000 .002
N 155 155 155 155 155 155 155 155 155 155 155
Pearson - - .. -.660 1 .933 .731 .878 -.072 .081 -.041 .1 33 .005 .111 Correlation
ICT Sig. (2-tailed) .000 .000 .000 .000 .374 .317 .612 .099 .953 .171
N 155 155 155 155 155 155 155 155 155 155 155
Pearson - .. .. .660 .933 1 .553
.. .782 -.038 .089 -.017 .081 .054 .126
Correlation Teknologi
Sig. (2-tailed) .000 .000 .000 .000 .639 .273 .836 .314 .508 .1 18
N 155 155 155 155 155 155 155 155 155 155 155
345
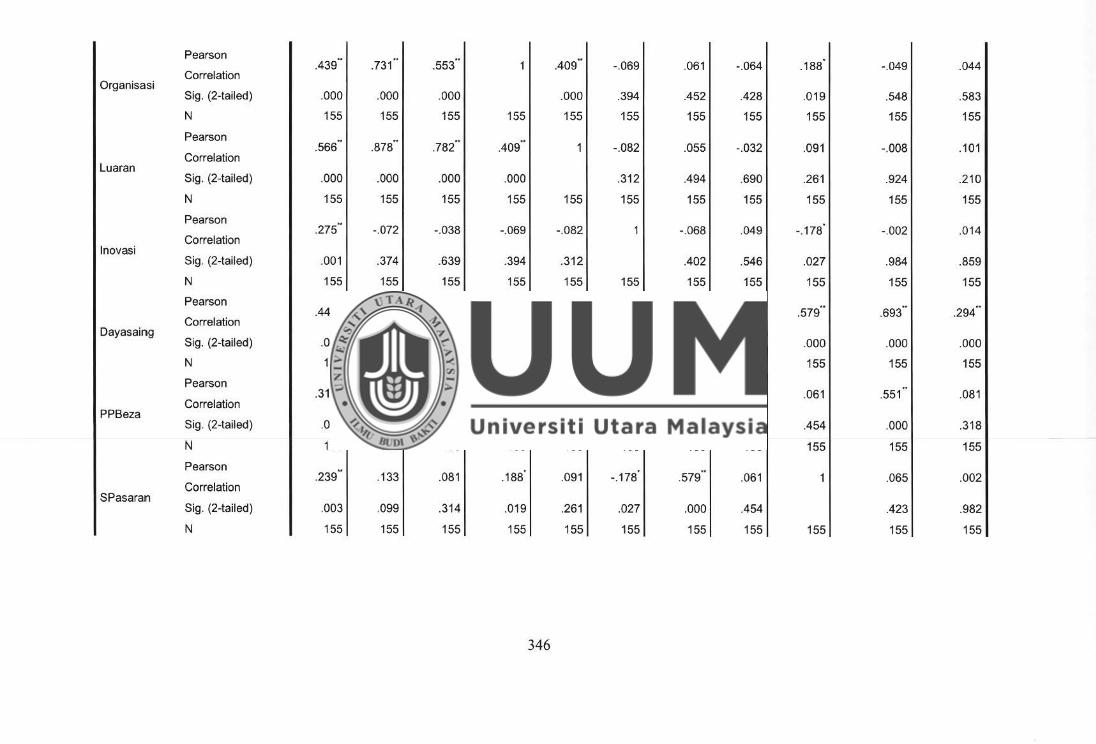
Pearson I .439-1 .731-1 _553"1 1 I _409··1 - .069 I .061 I -.064 I .188. I -.049 I .044
Correlation Organisasi
Sig. (2-tailed) .000 .000 .000 .000 .394 .452 .428 .019 .548 .583
N 155 155 155 155 155 155 155 155 155 155 155
Pearson - - .. w
.566 .878 .782 .409 1 -.082 .055 -.032 .091 -.008 .101 Correlation
Luaran Sig. (2-tailed) .000 .000 .000 .000 .312 .494 .690 .261 .924 .210
N 155 155 155 155 155 155 155 155 155 155 155
Pearson .. .275 -.072 -.038 -.069 -.082 1 -.068 .049 - .178 -.002 .014
Correlation lnovasi
Sig. (2-tailed) .001 .374 .639 .394 .312 .402 .546 .027 .984 .859
N 155 155 155 155 155 155 155 155 155 155 155
Pearson - - .. .. .. .447 .081 .089 .061 .055 -.068 1 .738 .579 .693 .294
Correlation Dayasaing
Sig. (2-tailed) .000 .317 .273 .452 .494 .402 .000 .000 .000 .000
N 155 155 155 155 155 155 155 155 155 155 155
Pearson .. .. .. .310 -.041 -.017 -.064 -.032 .049 .738 1 .061 .551 .081
Correlation PPBeza
Sig. (2-tailed) .000 .612 .836 .428 .690 .546 .000 .454 .000 1 .318
N 155 155 155 155 155 155 155 155 155 155 155
Pearson - w
.0651 .239 .133 .081 .188 .091 -.178 .579 .061 1 .002 Correlation
SPasararn
I 155 1
Sig. (2-tailed) .0031 .099 1 .3141 .0191 .2611 .0271 .0001 .454 1 .4231 .982
N 155 155 155 155 155 155 155 155 155 155
346
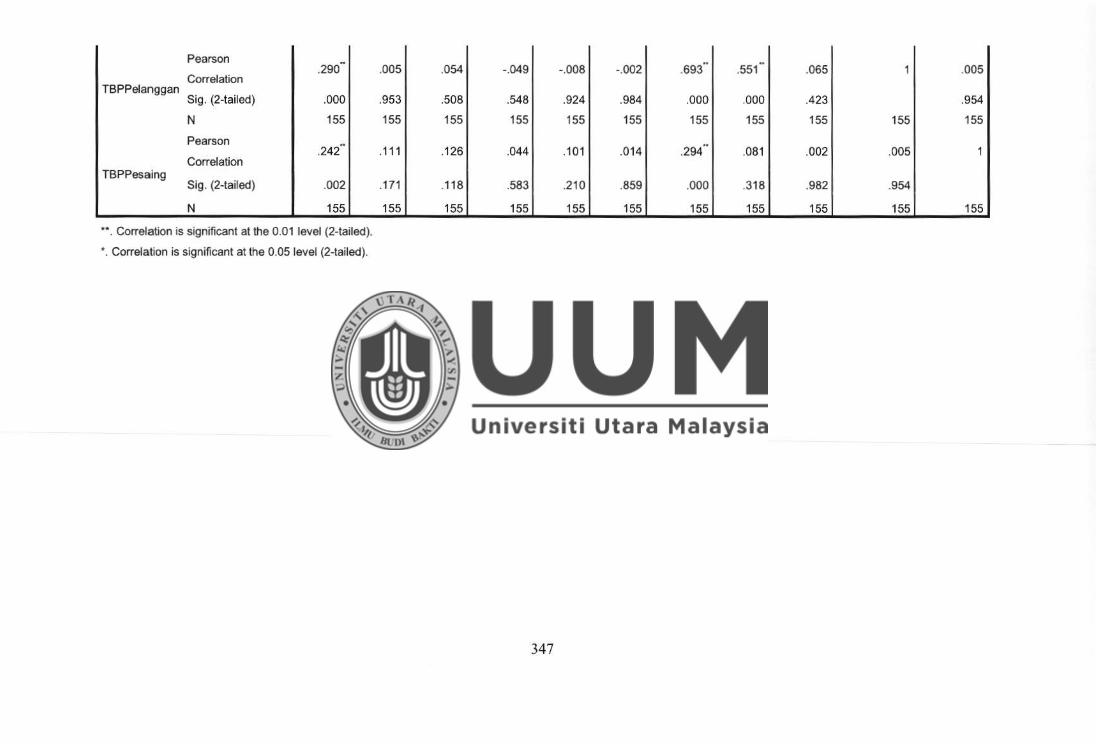
Pearson
Correlation -.290
TBPPelanggan Sig. (2-tailed) .000
N 155
Pearson .. .242
Correlation TBPPesaing
Sig. (2-tailed) .002
N 155
••. Correlation is significant at the 0.01 level (2-tailed).
•. Correlation is significant at the 0.05 level (2-tailed).
. 005 .054 - .049 - .008
.953 .508 .548 .924
155 155 155 155
.111 .126 .044 .101
.171 .118 .583 .210
155 155 155 155
347
-.002 -.693 .551 ..
.065 1 .005
.984 .000 .000 .423 .954
155 155 155 155 155 155
.014 .294 ..
.081 .002 .005 1
.859 .000 .318 .982 .954
155 155 155 155 155 155
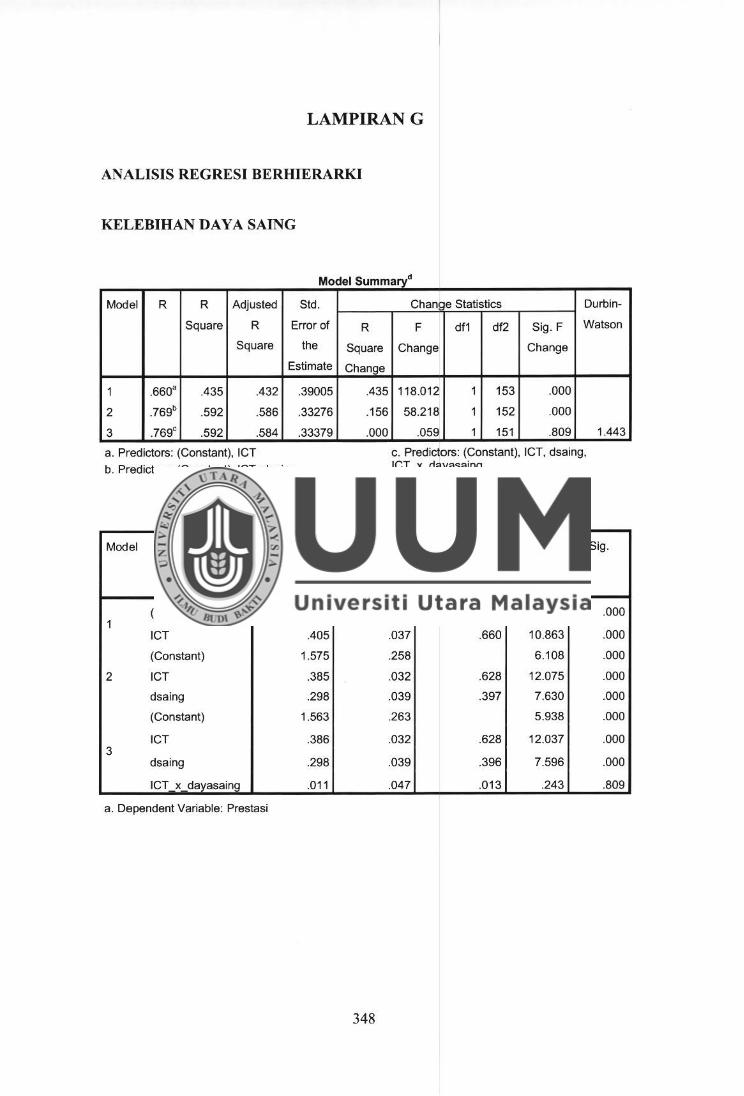
LAMPIRANG
ANALISIS REGRESI BERHIERARKI
KELEBIHAN DAY A SAING
Model Summarv
Model R R Adjusted Std. Change Statistics Durbin-
Square R Error of R F df1 df2 Sig. F Watson
Square the Square Change Change
Estimate Chanae
1 .660a .435 .432 .39005 .435 118.012 1 153 .000
2 .769b .592 .586 .33276 .156 58.218 1 152 .000
3 .769c .592 .584 .33379 .000 .059 1 151 .809 1.443
a. Predictors: (Constant), ICT
b. Predictors: (Constant), ICT, dsaing
c. Predictors: (Constant), ICT, dsaing, ICT_x_dayasaing
d. Dependent Variable: Prestasi
Coefficients a
Model Unstandardized Coefficients Standardized t Sig.
Coefficients
B Std. Error Beta
(Constant) 3.048 .200 15.221 .000 1
ICT .405 .037 .660 10.863 .000
(Constant) 1.575 .258 6 .108 .000
2 ICT .385 .032 .628 12.075 .000
dsaing .298 .039 .397 7.630 .000
(Constant) 1.563 .263 5.938 .000
ICT .386 .032 .628 12.037 .000 3
dsaing .298 .039 .396 7 .596 .000
ICT x dayasaing .011 .047 .013 .243 .809
a. Dependent Variable: Prestasi
348
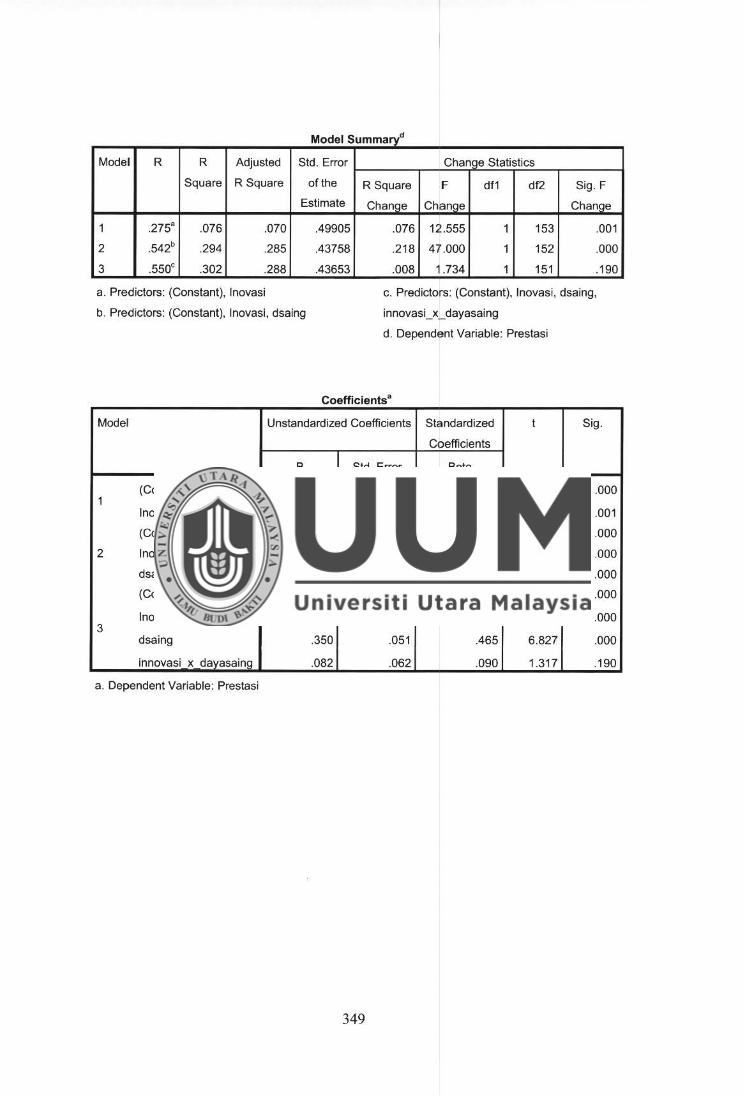
Model Summarl
Model R R Adjusted Std. Error Change Statistics
Square R Square of the R Square F df1 df2 Sig. F
Estimate Chanqe Chanqe Chanqe
1 .215• .076 .070 .49905 .076 12.555 1 153 .001
2 .542b .294 .285 .43758 .218 47.000 1 152 .000
3 .550c .302 .288 .43653 .008 1.734 1 151 .190
a. Predictors: (Constant), lnovasi
b. Predictors: (Constant), lnovasi, dsaing
c. Predictors: (Constant), lnovasi, dsaing,
innovasi_x_dayasaing
d. Dependent Variable: Prestasi
Coefficientsa
Model Unstandardized Coefficients Standardized t Sig.
Coefficients
B Std. Error Beta
1 (Constant) 4.449 .215 20.728 .000
lnovasi .151 .043 .275 3.543 .001
(Constant) 2.501 .341 7.336 .000
2 lnovasi .168 .037 .307 4.496 000
dsaing .352 .051 .468 6.856 .000
(Constant) 2.428 .345 7.047 .000
lnovasi .169 .037 .307 4.51 2 .000 3
dsaing .350 .051 .465 6.827 .000
innovasi x dayasainq .082 .062 .090 1.317 .190
a. Dependent Variable: Prestasi
349
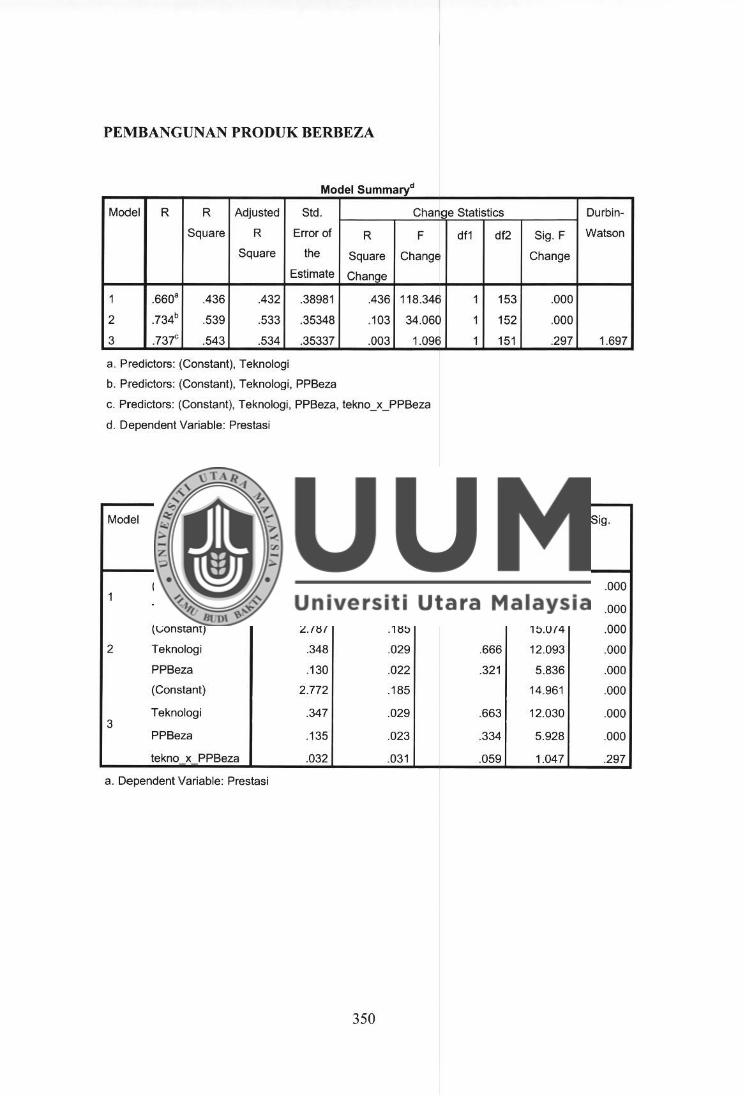
PEMBANGUNAN PROD UK BERBEZA
Model Summaryd
Model R R Adjusted Std. Cham e Statistics Durbin-
Square R Error of R F df1 df2 Sig. F Watson
Square the Square Change Change
Estimate Change
1 .660" .436 .432 .38981 .436 118.346 1 153 .000
2 .734b .539 .533 .35348 .1 03 34.060 1 152 .000
3 .737" .543 .534 .35337 .003 1.096 1 151 .297 1.697
a. Predictors: (Constant), Teknologi
b. Predictors: (Constant), Teknologi, PPBeza
c. Predictors: (Constant), Teknologi, PPBeza, tekno_x_PPBeza
d. Dependent Variable: Prestasi
Coefficients•
Model Unstandardized Coefficients Standardized t Sig.
Coefficients
B Std. Error Beta
1 (Constant) 3.390 .169 20.054 .000
Teknologi .346 .032 .660 10.879 .000
(Constant) 2.787 .185 15.074 .000
2 Teknologi .348 .029 .666 12.093 .000
PPBeza .130 .022 .321 5.836 .000
(Constant) 2.772 .185 14.961 .000
3 Teknologi .347 .029 .663 12.030 .000
PPBeza .135 .023 .334 5.928 .000
tekno x PPBeza .032 .031 .059 1.047 .297
a. Dependent Variable: Prestasi
350
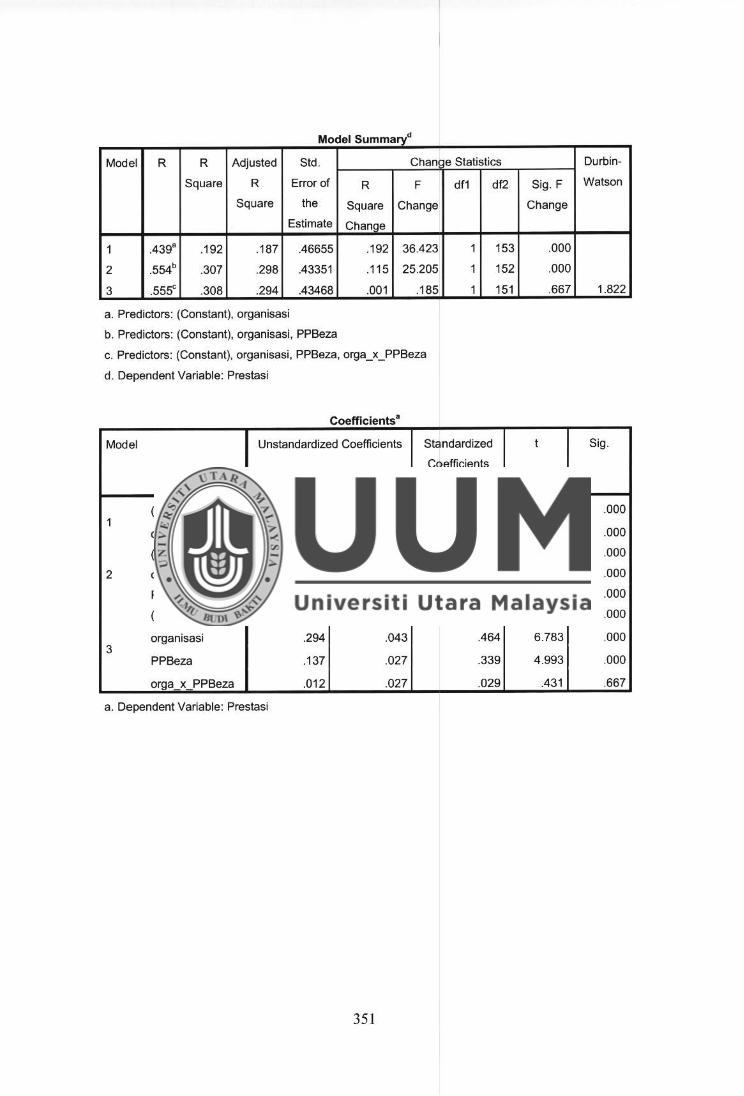
o e ummary· Md IS d
Model R R Adjusted Std. Chan• e Statistics Durbin-
Square R Error of R F df1 df2 Sig. F Watson
Square the Square Change Change
Estimate ChanQe
1 .439" .192 .187 .46655 .192 36.423 1 153 .000
2 .554b .307 .298 .43351 .115 25.205 1 152 .000
3 .555c .308 .294 .43468 .001 .185 1 151 .667 1.822
a. Predictors: (Constant), organisasi
b. Predictors: (Constant), organisasi, PPBeza
c. Predictors: (Constant), organisasi, PPBeza, orga_x_PPBeza
d. Dependent Variable: Prestasi
Coefficients a
Model Unstandardized Coefficients Standardized t Sig.
Coefficients
B Std. Error Beta
1 (Constant) 3.582 .270 13.261 .000
organisasi .278 .046 .439 6.035 .000
(Constant) 2.880 .287 10.024 .000
2 organisasi .292 .043 .460 6.803 .000
PPBeza .138 .027 .340 5.020 .000
(Constant) 2.856 .294 9.725 .000
3 organisasi .294 .043 .464 6.783 .000
PPBeza .137 .027 .339 4.993 .000
orga x PPBeza .012 .027 .029 .431 .667
a. Dependent Variable: Prestasi
351
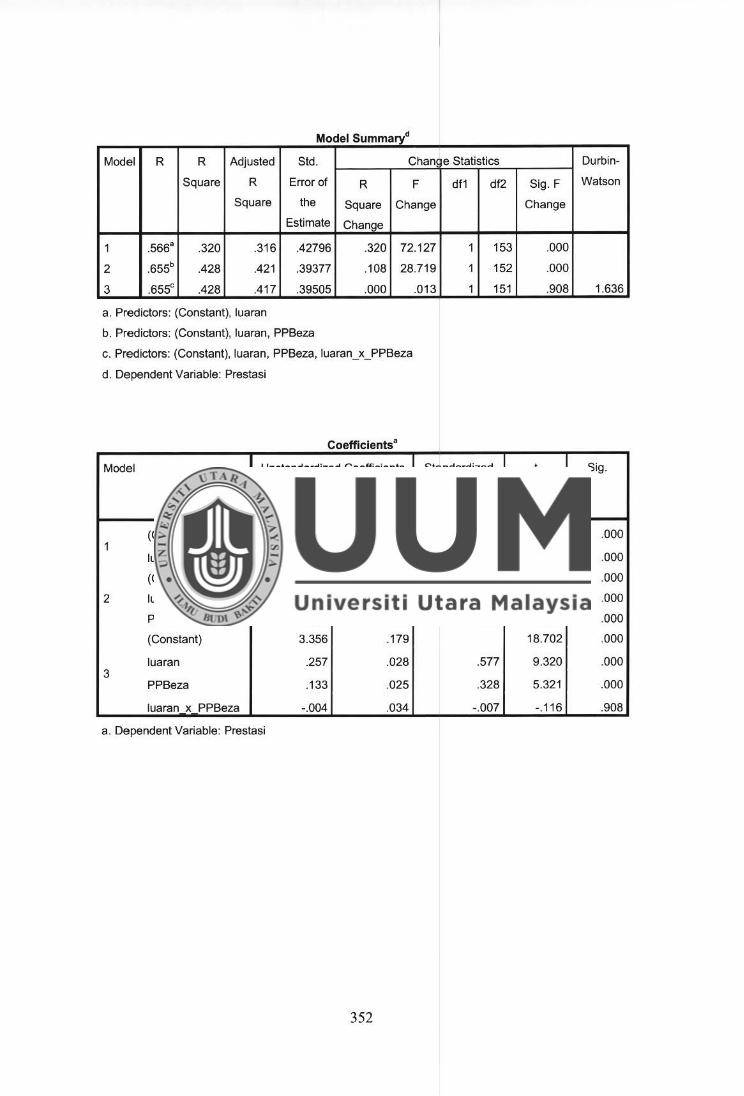
Model Summaryd
Model R R Adjusted Std. Chan! e Statistics Durbin-
Square R Error of R F df1 df2 Sig. F Watson
Square the Square Change Change
Estimate ChanQe
1 .566• .320 .316 .42796 .320 72.127 1 153 .000
2 .655b .428 .421 .39377 .108 28.719 1 152 .000
3 .655° .428 .417 .39505 .000 .013 1 151 .908 1.636
a. Predictors: (Constant}, luaran
b. Predictors: (Constant), luaran, PPBeza
c. Predictors: (Constant), luaran, PPBeza, luaran_x_PPBeza
d. Dependent Variable: Prestasi
Coefficients•
Model Unstandardized Coefficients Standardized t Sig.
Coefficients
B Std. Error Beta
1 (Constant) 3.982 .147 27.065 .000
luaran .252 .030 .566 8.493 .000
(Constant) 3.357 .179 18.790 .000
2 luaran .256 .027 .577 9.399 .000
PPBeza .133 .025 .329 5.359 .000
(Constant) 3.356 .179 18.702 .000
luaran .257 .028 .577 9.320 .000 3
PPBeza .133 .025 .328 5.321 .000
luaran x PPBeza -.004 .034 -.007 - .116 .908
a. Dependent Variable: Prestasi
352

d Model Summarv
Model R R Adjusted Std. Chan, e Statistics Durbin-
Square R Error of R F df1 df2 Sig. F Watson
Square the Square Change Change
Estimate Chanae
1 .275° .076 .070 .49905 .076 12.555 1 153 .001
2 .405b .164 .153 .47618 .088 16.046 1 152 .000
3 .407" .1 65 .149 .47741 .001 .219 1 151 .641 1.877
a. Predictors: (Constant), lnovasi
b. Predictors: (Constant), lnovasi, PPBeza
c. Predictors: (Constant), lnovasi, PPBeza, inno_x_PPBeza
d. Dependent Variable: Prestasi
Coefficients•
Model Unstandardized Coefficients Standardized t Sig.
Coefficients
B Std. Error Beta
(Constant) 4.449 .215 20.728 .000 1
lnovasi .151 .043 .275 3.543 .001
(Constant) 3.944 .241 16.399 .000
2 lnovasi .143 .041 .261 3.513 .001
PPBeza .120 .030 .297 4.006 .000
(Constant) 3.936 .242 16.283 .000
lnovasi .146 .041 .266 3.535 .001 3
PPBeza .119 .030 .294 3.930 .000
inno x PPBeza .018 .038 .035 .468 .641
a. Dependent Variable: Prestasi
353
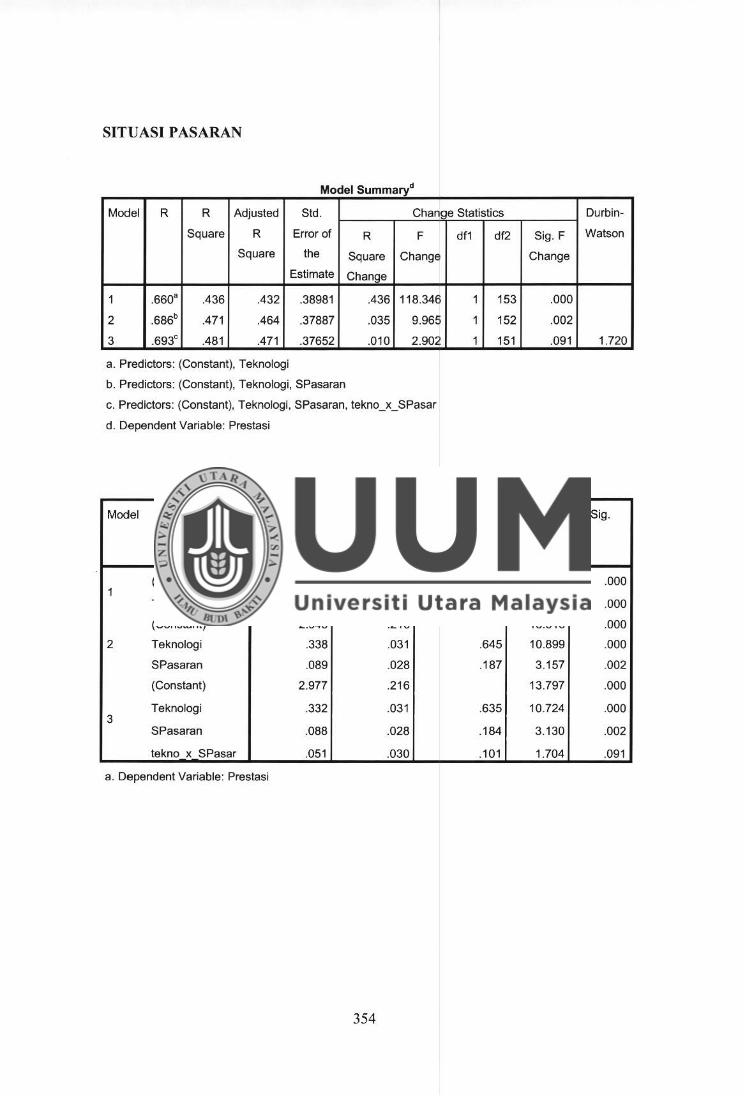
SITUASI PASARAN
Model Summarl
Model R R Adjusted Std. Change Statistics Durbin-
Square R Error of R F df1 df2 Sig. F Watson
Square the Square Change Change
Estimate Change
1 .6608 .436 .432 .38981 .436 118.346 1 153 .000
2 .686b .471 .464 .37887 .035 9.965 1 152 .002
3 .693° .481 .471 .37652 .010 2.902 1 151 .091 1.720
a. Predictors: (Constant), Teknologi
b. Predictors: (Constant), Teknologi, SPasaran
c. Predictors: (Constant), Teknologi, SPasaran, tekno_x_SPasar
d. Dependent Variable: Prestasi
Coefficientsa
Model Unstandardized Coefficients Standardized t Sig.
Coefficients
B Std. Error Beta
1 (Constant) 3.390 .169 20.054 .000
Teknologi .346 .032 .660 10.879 .000
(Constant) 2.945 .216 13.616 .000
2 Teknologi .338 .031 .645 10.899 .000
SPasaran .089 .028 .187 3.157 .002
(Constant) 2.977 .216 13.797 .000
Teknologi .332 .031 .635 10.724 .000 3
SPasaran .088 .028 .184 3.130 .002
tekno x SPasar .051 .030 .101 1.704 .091
a. Dependent Variable: Prestasi
354
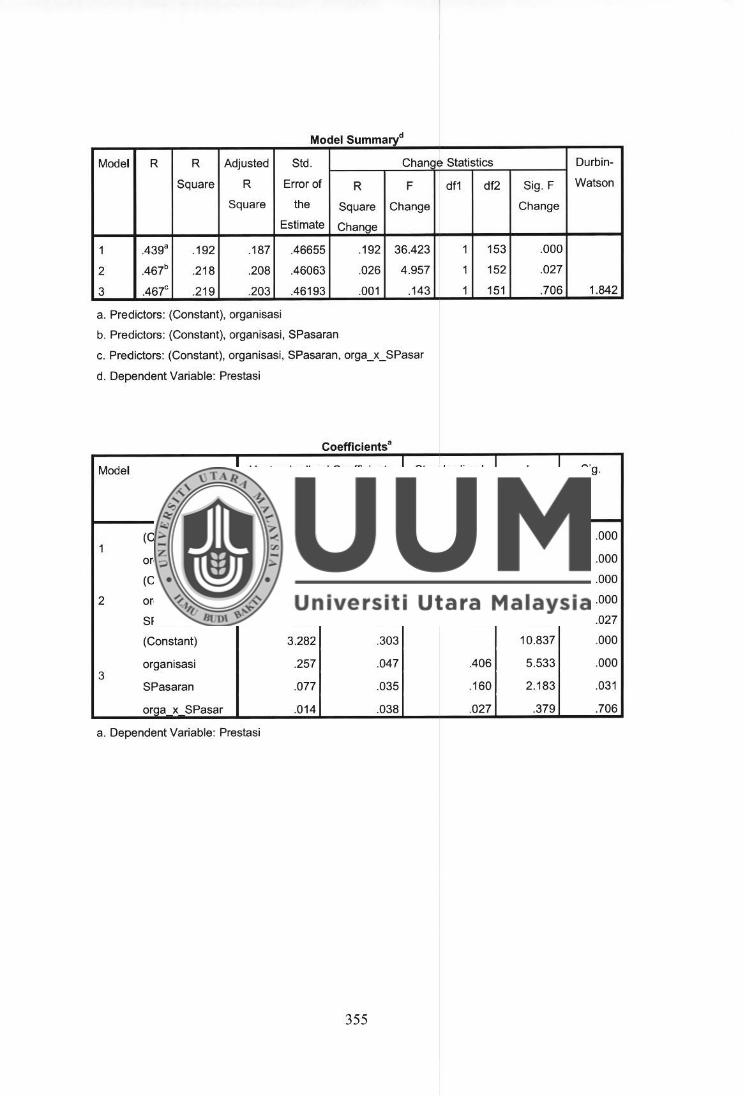
d Model Summary
Model R R Adjusted Std. Chan1 e Statistics Durbin-
Square R Error of R F df1 df2 Sig. F Watson
Square the Square Change Change
Estimate Chanqe
1 .439" .192 .187 .46655 .192 36.423 1 153 .000
2 .467b .218 .208 .46063 .026 4.957 1 152 .027
3 .467c .219 .203 .46193 .001 .143 1 151 .706 1.842
a. Predictors: (Constant), organisasi
b. Predictors: (Constant), organisasi, SPasaran
c. Predictors: (Constant), organisasi, SPasaran, orga_x_SPasar
d. Dependent Variable: Prestasi
Coefficients a
Model Unstandardized Coefficients Standardized t Sig.
Coefficients
B Std. Error Beta
1 (Constant) 3.582 .270 13.261 .000
organisasi .278 .046 .439 6.035 .000
(Constant) 3.272 .301 10.875 .000
2 organisasi .259 .046 .408 5.584 .000
SPasaran .078 .035 .163 2.226 .027
(Constant) 3.282 .303 10.837 000
3 organisasi .257 .047 .406 5.533 .000
SPasaran .077 .035 .160 2.183 .031
orga x SPasar .014 .038 .027 .379 .706
a. Dependent Variable: Prestasi
355

Model Summaryd
Model R R Adjusted Std. Change Statistics Durbin-
Square R Error of R F df1 df2 Sig. F Watson
Square the Square Change Change
Estimate Chanoe
1 .5668 .320 .316 .42796 .320 72.127 1 153 .000
2 .597b .356 .348 .41795 .036 8.410 1 152 .004
3 .606c .368 .355 .41557 .012 2.750 1 151 .099 1.596
a. Predictors: (Constant), luaran
b. Predictors: (Constant), luaran, SPasaran
c. Predictors: (Constant), luaran, SPasaran, luar_x_SPasar
d. Dependent Variable: Prestasi
Coefficients"
Model Unstandardized Coefficients Standardized t Sig.
Coefficients
B Std. Error Beta
1 (Constant) 3.982 .147 27.065 .000
luaran .252 .030 .566 8.493 .000
(Constant) 3.526 .213 16.557 .000
2 luaran .244 .029 .549 8.397 .000
SPasaran .090 .031 .1 90 2.900 .004
(Constant) 3.543 .212 16.713 .000
luaran .243 .029 .548 8.425 .000 3
SPasaran .087 .031 .182 2.793 .006
luar x SPasar .055 .033 .108 1.658 .099
a. Dependent Variable: Prestasi
356

Model Summarl
Model R R Adjusted Std. Chan, e Statistics Durbin-
Square R Error of R F df1 df2 Sig. F Watson
Square the Square Change Change
Estimate Chance
1 .2758 .076 .070 .49905 .076 12.555 1 153 .001
2 .402b .162 .151 .47685 .086 15.578 1 152 .000
3 .404c .163 .147 .47796 .002 .296 1 151 .587 1.748
a. Predictors: (Constant), lnovasi
b. Predictors: (Constant}, lnovasi, SPasaran
c. Predictors: (Constant), lnovasi, SPasaran, inno_x_SPasar
d. Dependent Variable: Prestasi
Coefficients•
Model Unstandardized Coefficients Standardized t Sig.
Coefficients
B Std. Error Beta
(Constant) 4.449 .215 20.728 .000 1
lnovasi .151 .043 .275 3.543 .001
(Constant) 3.531 .310 11 .385 .000
2 lnovasi .180 .041 .328 4.352 .000
SPasaran .142 .036 .298 3.947 .000
(Constant) 3.561 .316 11.276 .000
lnovasi .174 .043 .318 4.065 .000 3
SPasaran .143 .036 .299 3.948 .000
inno x SPasar .019 .035 .042 .544 .587
a. Dependent Variable: Prestasi
357
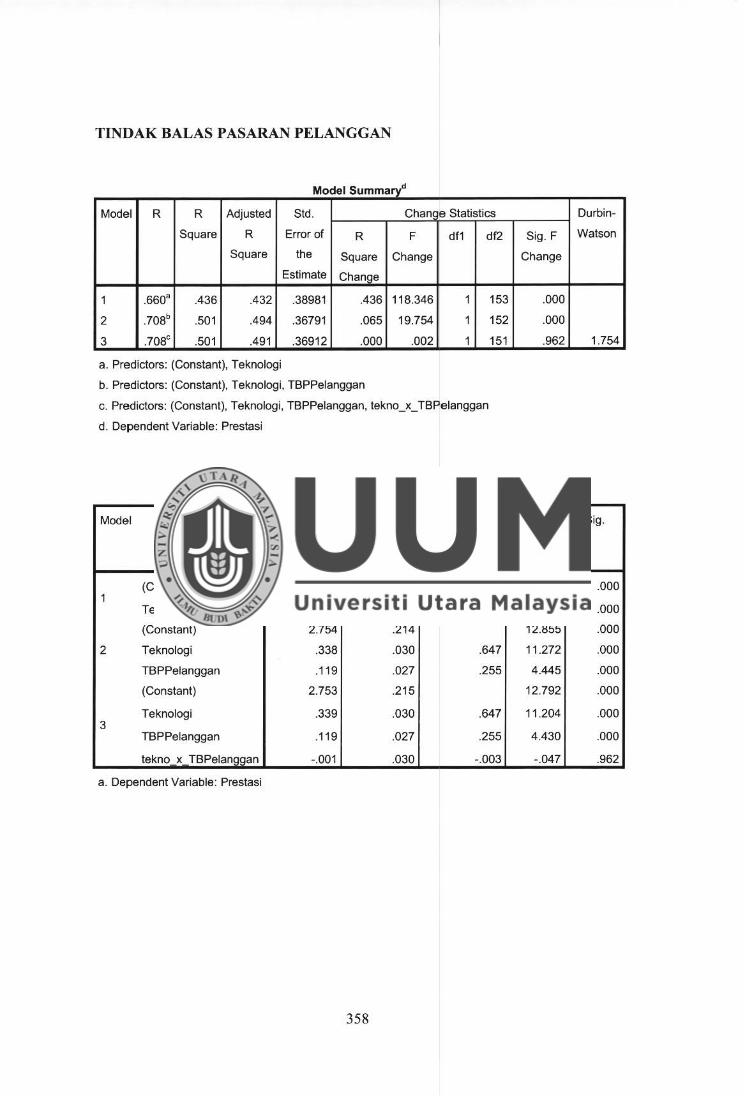
TINDAK BALAS PASARAN PELANGGAN
Model Summaryd
Model R R Adjusted Std. Change Statistics Durbin-
Square R Error of R F df1 df2 Sig. F Watson
Square the Square Change Change
Estimate Change
1 .6608 .436 .432 .38981 .436 118.346 1 153 .000
2 .708b .501 .494 .36791 .065 19.754 1 152 .000
3 .708c .501 .491 .36912 .000 .002 1 151 .962 1.754
a. Predictors: (Constant), Teknologi
b. Predictors: (Constant), Teknologi, TBPPelanggan
c. Predictors: (Constant), Teknologi, TBPPelanggan, tekno_x_TBPelanggan
d. Dependent Variable: Prestasi
Coefficients•
Model Unstandardized Coefficients Standardized t Sig.
Coefficients
B Std. Error Beta
1 (Constant) 3.390 .169 20.054 .000
Teknologi .346 .032 .660 10.879 .000
(Constant) 2.754 .214 12.855 .000
2 Teknologi .338 .030 .647 11.272 .000
TBPPelanggan .119 .027 .255 4.445 .000
(Constant) 2.753 .215 12.792 .000
3 Teknologi .339 .030 .647 11 .204 .000
TBPPelanggan .119 .027 .255 4.430 .000
tekno x TBPelanggan -.001 .030 - .003 -.047 .962
a. Dependent Variable: Prestasi
358

Model Summaryd
Model R R Adjusted Std. Chan1 e Statistics Durbin-
Square R Error of R F df1 df2 Sig. F Watson
Square the Square Change Change
Estimate Chanae
1 .439° .192 .187 .46655 .192 36.423 1 153 .000
2 .538b .289 .280 .43909 .097 20.731 1 152 .000
3 .538c .289 .275 .44049 .000 .036 1 151 .849 1.790
a. Predictors: (Constant), organisasi
b. Predictors: (Constant), organisasi, TBPPelanggan
c. Predictors: (Constant), organisasi, TBPPelanggan, orga_x_TBPelanggan
d. Dependent Variable: Prestasi
Coefficients"
Model Unstandardized Coefficients Standardized t Sig.
Coefficients
B Std. Error Beta
(Constant) 3.582 .270 13.261 .000 1
organisasi .278 .046 .439 6.035 .000
(Constant) 2.704 .319 8.472 .000
2 organisasi .288 .043 .454 6.626 .000
TBPPelanggan .145 .032 .312 4.553 .000
(Constant) 2.703 .320 8.441 .000
organisasi .288 .044 .454 6.606 .000 3
TBPPelanggan .146 .032 .312 4.541 .000
oraa x TBPelanaaan -.007 .035 -.013 -.191 .849
a. Dependent Variable: Prestasi
359
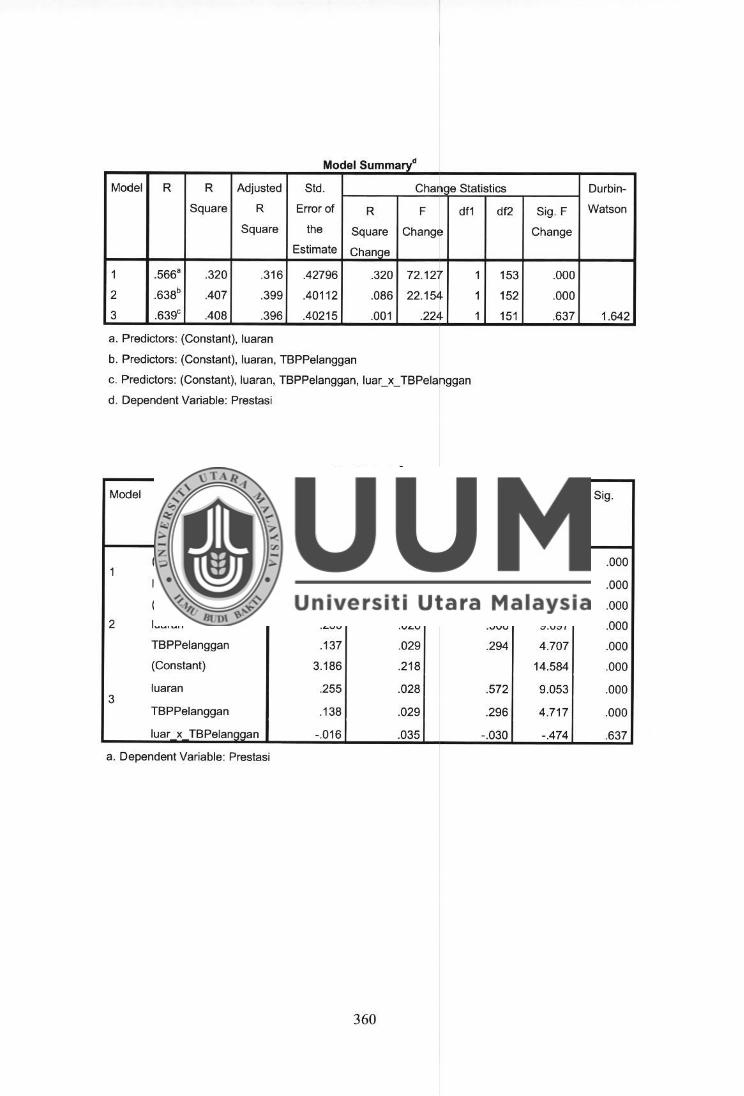
d M d I S o e ummarv
Model R R Adjusted Std. Chan e Statistics Durbin-
Square R Error of R F df1 df2 Sig. F Watson
Square the Square Change Change
Estimate Change
1 .5668 .320 .316 .42796 .320 72.127 1 153 .000
2 .638b .407 .399 .40112 .086 22.154 1 152 .000
3 .639c .408 .396 .40215 .001 .224 1 151 .637 1.642
a. Predictors: (Constant}, luaran
b. Predictors: (Constant), luaran, TBPPelanggan
c. Predictors: (Constant), luaran, TBPPelanggan, luar_x_ TBPelanggan
d. Dependent Variable: Prestasi
Coefficients•
Model Unstandardized Coefficients Standardized t Sig.
Coefficients
B Std. Error Beta
1 (Constant) 3.982 .147 27.065 .000
luaran .252 .030 .566 8.493 .000
(Constant) 3.201 .216 14.839 .000
2 luaran .253 .028 .568 9.097 .000
TBPPelanggan .137 .029 .294 4.707 .000
(Constant) 3.186 .218 14.584 .000
luaran .255 .028 .572 9.053 .000 3
TBPPelanggan .138 .029 .296 4.717 .000
luar x TBPelanooan -.016 .035 -.030 -.474 .637
a. Dependent Variable: Prestasi
360

Model Summarl
Model R R Adjusted Std. Change Statistics Durbin-
Square R Error of R F df1 df2 Sig. F Watson
Square the Square Change Change
Estimate Chanr:ie
1 .2758 .076 .070 .49905 .076 12.555 1 153 .001
2 .400b .160 .149 .47734 .084 15.230 1 152 .000
3 .406c .165 .148 .47754 .005 .875 1 151 .351 1.896
a. Predictors: (Constant), lnovasi
b. Predictors: (Constant), lnovasi, TBPPelanggan
c. Predictors: (Constant), lnovasi, TBPPelanggan, inno_x_TBPelanggan
d. Dependent Variable: Prestasi
Coefficientsa
Model Unstandardized Coefficients Standardized t Sig.
Coefficients
B Std. Error Beta
1 (Constant) 4.449 .215 20.728 .000
lnovasi .151 .043 .275 3.543 .001
(Constant) 3.683 .284 12.958 .000
2 lnovasi .151 .041 .276 3.711 .000
TBPPelanggan .135 .035 .290 3.903 .000
(Constant) 3.664 .285 12.854 .000
lnovasi .153 .041 .278 3.742 .000 3
TBPPelanggan .137 .035 .295 3.953 .000
inno x TBPelanaaan .035 .037 .070 .935 .351
a. Dependent Variable: Prestasi
361

TINDAK BALAS PASARAN PESAING
Model Summaryd
Model R R Adjusted Std. Chane e Statistics Durbin-
Square R Error of R F df1 df2 Sig. F Watson
Square the Square Change Change
Estimate ChanQe
1 .660" .436 .432 .38981 .436 118.346 1 153 .000
2 .679b .462 .455 .38215 .025 7 .190 1 152 .008
3 .680c .462 .451 .38332 .000 .076 1 151 .783 1.769
a. Predictors: (Constant), Teknologi
b. Predictors: (Constant), Teknologi, TBPPesaing
c. Predictors: (Constant), Teknologi, TBPPesaing, tekno_x_ TBPSaing
d. Dependent Variable: Prestasi
Coefficients"
Model Unstandardized Coefficients Standardized t Sig.
Coefficients
B Std. Error Beta
1 (Constant) 3.390 .169 20.054 .000
Teknologi .346 .032 .660 10.879 .000
(Constant) 3.001 .220 13.632 .000
2 Teknologi .335 .031 .640 10.670 .000
TBPPesaing .079 .030 .161 2.681 .008
(Constant) 2.996 .221 13.529 .000
Teknologi .335 .031 .641 10.641 .000 3
TBPPesaing .080 .030 .163 2.687 .008
tekno x TBPSaina -.008 .030 -.017 -.276 .783
a. Dependent Variable: Prestasi
362

d Model Summary
Model R R Adjusted Std. Chan! e Statistics Durbin-
Square R Error of R F df1 df2 Sig. F Watson
Square the Square Change Change
Estimate ChanQe
1 .4398 .192 .187 .46655 .192 36.423 1 153 .000
2 .492b .242 .232 .45353 .049 9.910 1 152 .002
3 .505" .255 -240 .451 13 .013 2.624 1 151 .107 1.886
a. Predictors: (Constant), organisasi
b. Predictors: (Constant), organisasi, TBPPesaing
c. Predictors: (Constant), organisasi, TBPPesaing, orga_x_ TBPSaing
d. Dependent Variable: Prestasi
Coefficients a
Model Unstandardized Coefficients Standardized t Sig.
Coefficients
B Std. Error Beta
1 (Constant) 3.582 .270 13.261 .000
organisasi .278 .046 .439 6.035 .000
(Constant) 3.004 .320 9.376 .000
2 organisasi .272 .045 .429 6.062 .000
TBPPesaing .110 .035 .223 3.148 .002
(Constant) 3.027 .319 9.489 .000
3 organisasi .271 .045 .427 6.074 .000
TBPPesaing .106 .035 .215 3.051 .003
orQa x TBPSaino .060 .037 .1 14 1.620 .107
a. Dependent Variable: Prestasi
363
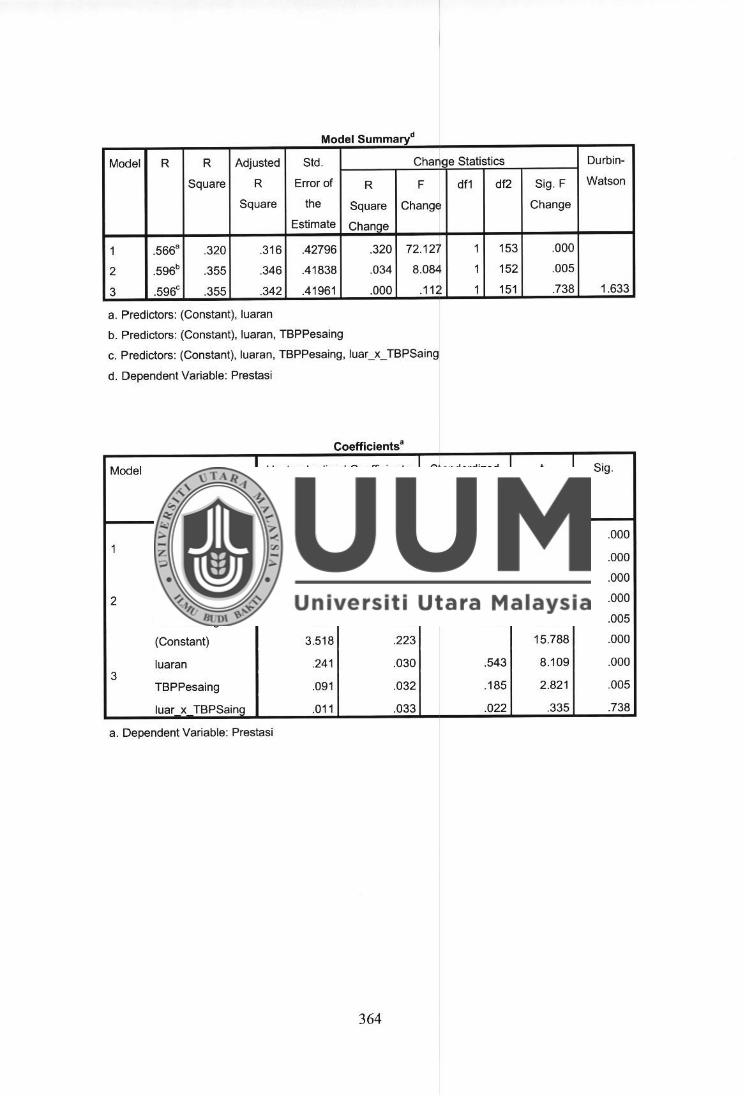
Model Summaryd
Model R R Adjusted Std. Chan, e Statistics Durbin-
Square R Error of R F df1 df2 Sig. F Watson
Square the Square Change Change
Estimate Chanoe
1 .5668 .320 .316 .42796 .320 72.127 1 153 000
2 .596b .355 .346 .41838 .034 8.084 1 152 .005
3 .596c .355 .342 .41961 .000 .112 1 151 .738 1.633
a. Predictors: (Constant), luaran
b. Predictors: (Constant), luaran, TBPPesaing
c. Predictors: (Constant), luaran, TBPPesaing, luar_x_TBPSaing
d. Dependent Variable: Prestasi
Coefficients•
Model Unstandardized Coefficients Standardized t Sig.
Coefficients
B Std. Error Beta
(Constant) 3.982 .147 27.065 .000 1
luaran .252 .030 .566 8.493 .000
(Constant) 3 .508 .220 15.940 .000
2 luaran .243 .029 .547 8 .355 .000
TBPPesaing .092 .032 .186 2.843 .005
(Constant) 3.518 .223 15.788 .000
luaran .241 .030 .543 8.109 .000 3
TBPPesaing .091 .032 .185 2.821 .005
luar x TBPSaino .011 .033 .022 .335 .738
a. Dependent Variable: Prestasi
364

Model Summaryd
Model R R Adjusted Std. Change Statistics Durbin-
Square R Error of R F df1 df2 Sig. F Watson
Square the Square Change Change
Estimate Change
1 .2758 .076 .070 .49905 .076 12.555 1 153 .001
2 .364b .132 .121 .48514 .056 9.897 1 152 .002
3 .377" .142 .125 .48404 .010 1.690 1 151 .196 1.894
a. Predictors: (Constant), lnovasi
b. Predictors: (Constant), lnovasi, TBPPesaing
c. Predictors: (Constant), lnovasi, TBPPesaing, inno_x_ TBPSaing
d. D,ependent Variable: Prestasi
Coefficientsa
Model Unstandardized Coefficients Standardized t Sig.
Coefficients
B Std. Error Beta
1 (Constant) 4.449 .215 20.728 .000
lnovasi .151 .043 .275 3.543 .001
(Constant) 3.802 .293 12.978 .000
2 lnovasi .149 .041 .272 3.599 .000
TBPPesaing .117 .037 .238 3.146 .002
(Constant) 3.719 .299 12.428 .000
lnovasi .160 .042 .292 3.793 .000 3
TBPPesaing .122 .037 .248 3.273 .001
inno x TBPSaing .051 .039 .101 1.300 .196
a. Dependent Variable: Prestasi
365
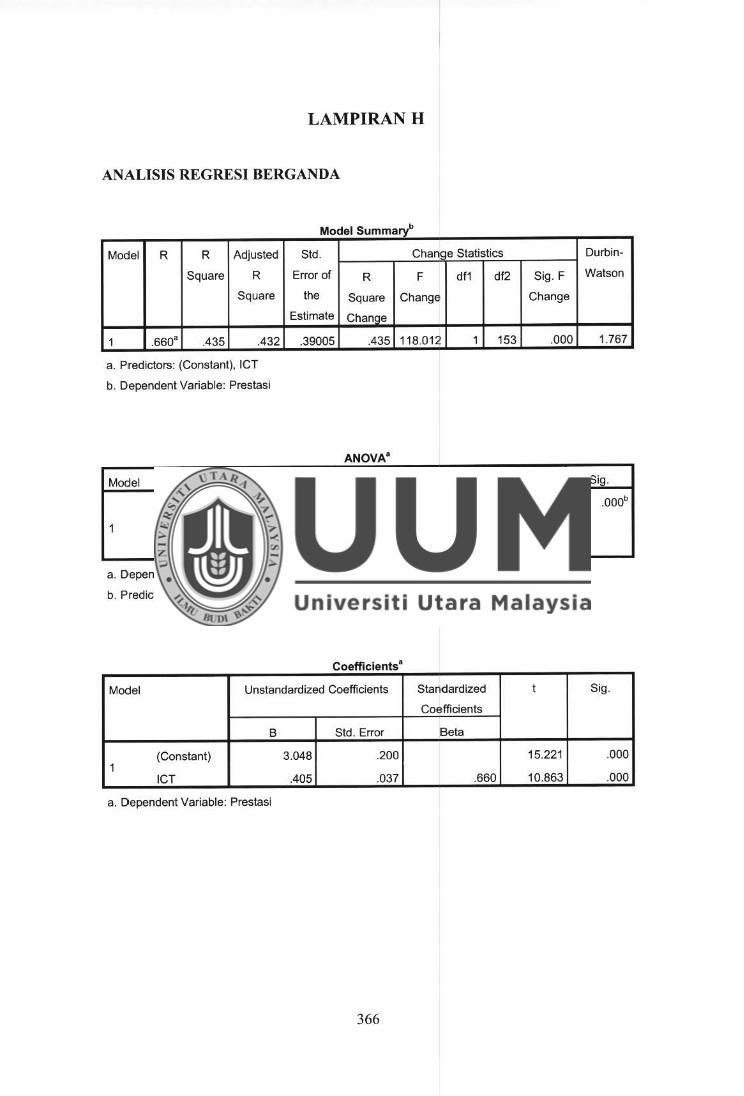
LAMPIRANH
ANALISIS REGRESI BERGANDA
Model Summaryb
Model R R Adjusted Std. Chan• e Statistics Durbin-
Square R Error of R F df1 df2 Sig. F Watson
Square the Square Change Change
Estimate Chanae
1 .660" .435 .432 .39005 .435 118.012 1 153 .000 1.767
a. Predictors: (Constant), ICT
b. Dependent Variable: Prestasi
Model Sum of Squares df Mean Sauare F Sig.
Regression 17.954 1 17.954 118.012 .ooob
1 Residual 23.277 153 .152
Total 41.231 154
a. Dependent Variable: Prestasi
b. Predictors: (Constant), ICT
Coefficients•
Model Unstandardized Coefficients Standardized t Sig.
Coefficients
B Std. Error Beta
(Constant) 3.048 .200 15.221 .000 1
ICT .405 .037 .660 10.863 .000
a. Dependent Variable: Prestasi
366
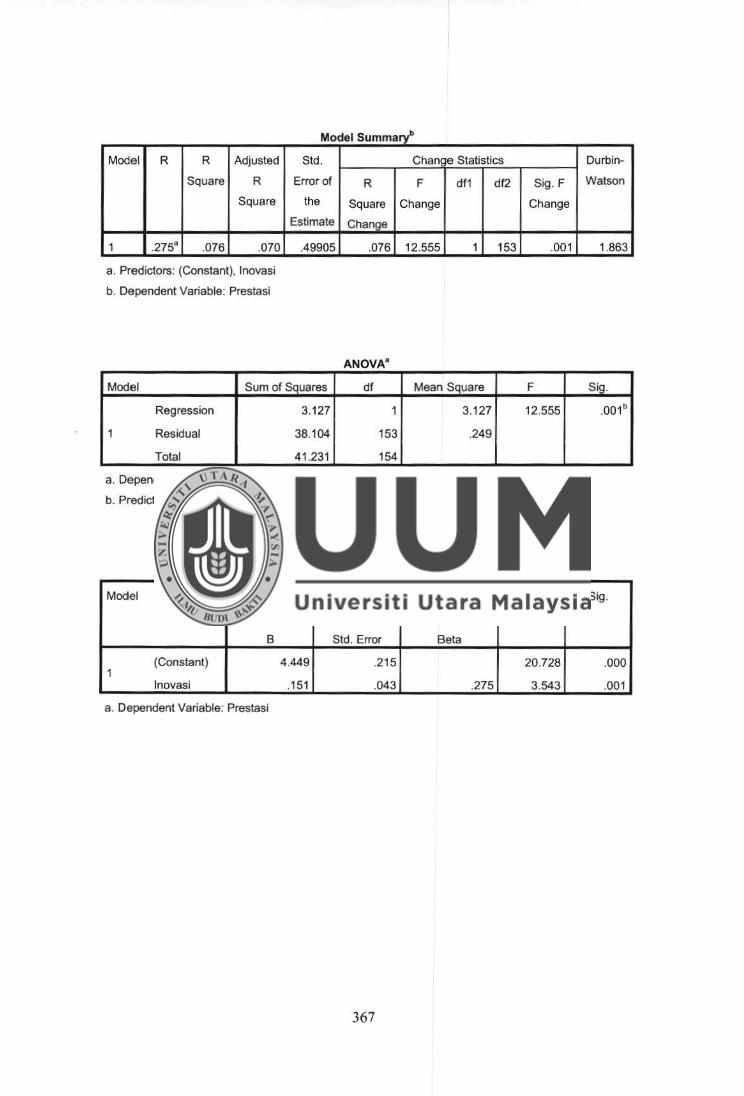
b Model Summary·
Model R R Adjusted Std. Chan~ e Statistics Durbin-
Square R Error of R F df1 df2 Sig. F Watson
Square the Square Change Change
Estimate Change
1 .275a .076 .070 .49905 .076 12.555 1 153 .001 1.863
a . Predictors: (Constant), lnovasi
b. Dependent Variable: Prestasi
ANOVA•
Model Sum of Squares df Mean Square F Sig.
Regression 3.127 1 3.127 12.555 .001b
1 Residual 38.104 153 .249
Total 41 .231 154
a. Dependent Variable: Prestasi
b. Predictors: (Constant), lnovasi
Coefficients a
Model Unstandardized Coefficients Standardized t Sig.
Coefficients
B Std. Error Beta
1 (Constant) 4 .449 .215 20.728 .000
lnovasi .151 .043 .275 3 .543 .001
a. Dependent Variable: Prestasi
367
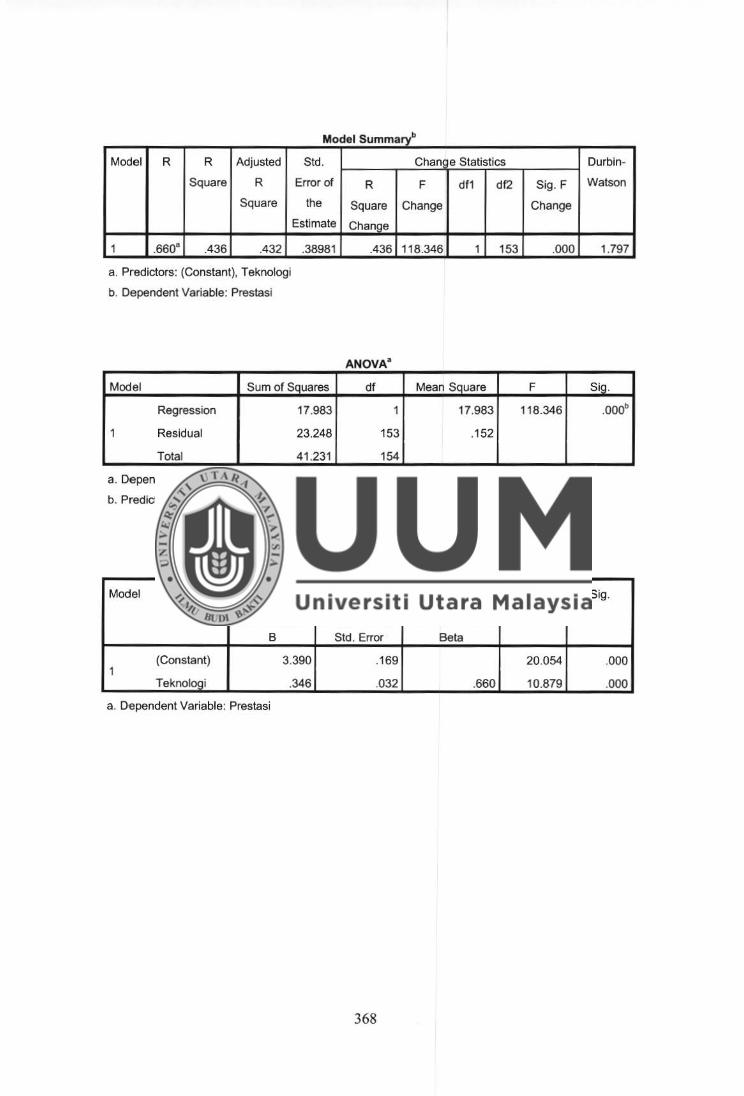
Model SummarY'
Model R R Adjusted Std. Chani e Statistics Durbin-
Square R Error of R F df1 df2 Sig. F Watson
Square the Square Change Change
Estimate Change
1 .660• .436 .432 .38981 .436 118.346 1 153 .000 1.797
a. Predictors: (Constant), Teknologi
b. Dependent Variable: Prestasi
Model Sum of Squares df Mean Square F Sig.
Regression 17.983 1 17.983 118.346 .ooob
1 Residual 23.248 153 .152
Total 41 .231 154
a. Dependent Variable: Prestasi
b. Predictors: (Constant), Teknologi
Coefficients•
Model Unstandardized Coefficients Standardized t Sig.
Coefficients
B Std. Error Beta
(Constant) 3.390 .169 20.054 .000 1
Teknoloai .346 .032 .660 10.879 .000
a. Dependent Variable: Prestasi
368
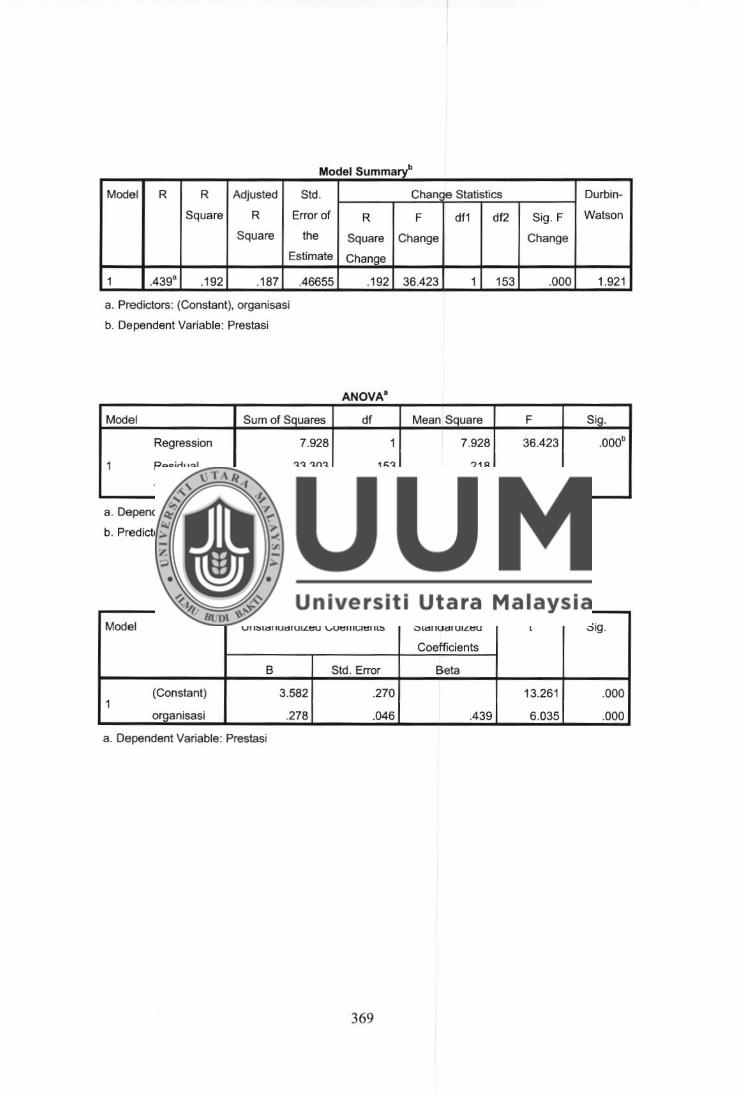
b Model Summary·
Model R R Adjusted Std. Chan, e Statistics Durbin-
Square R Error of R F df1 df2 Sig. F Watson
Square the Square Change Change
Estimate Chanae
1 .4398 .192 .187 .46655 .192 36.423 1 153 .000 1.921
a. Predictors: (Constant), organisasi
b. Dependent Variable: Prestasi
ANOVA"
Model Sum of Squares df Mean Square F Sig.
Regression 7.928 1 7.928 36.423 .ooob
1 Residual 33.303 153 .218
Total 41.231 154
a. Dependent Variable: Prestasi
b. Predictors: (Constant), organisasi
Coefficients•
Model Unstandardized Coefficients Standardized t Sig .
Coefficients
B Std. Error Beta
1 (Constant) 3.582 .270 13.261 .000
organisasi .278 .046 .439 6.035 .000
a . Dependent Variable: Prestasi
369

Model Summary'
Model R R Adjusted Std. Chan ie Statistics Durbin-
Square R Error of R F df1 df2 Sig. F Watson
Square the Square Change Change
Estimate Change
1 .566a .320 .316 .42796 .320 72.127 1 153 .000 1.642
a. Predictors: (Constant), luaran
b. Dependent Variable: Prestasi
Model Sum of Sauares df Mean Sauare F Sig.
Regression 13.210 1 13.210 72.127 .ooob
1 Residual 28.021 153 .183
Total 41.231 154
a. Dependent Variable: Prestasi
b. Predictors: (Constant). luaran
Coefficients•
Model Unstandardized Coefficients Standardized t Sig .
Coefficients
B Std. Error Beta
(Constant) 3.982 .147 27.065 .000 1
luaran .252 .030 .566 8.493 .000
a. Dependent Variable: Prestasi
370