Embed Size (px)
Citation preview
UNIVERSITI UTARA MALAYSIACOLLEGE OF ARTS AND SCIENCES
SCHOOL OF QUANTITATIVE SCIENCES
GROUP ASSIGNMENT SQQS1013 ELEMENTARY STATISTICSSEMESTER FEB SESSION 2013/2014
INSTRUCTIONS:1. Exactly FIVE (5) persons in a group.2. This assignment contains THREE (3) questions on FOUR (4)
pages excluding the front page.3. Answer ALL questions and show all your calculations
clearly.4. Report must be typewrittenusing A4 paper. 5. Every question and answers must be written on a new
page.6. A total marks for the report is 80. Evaluation will be
as follows: 70 marks for answers to all questions 10 marks for preparation of the reports
Front cover as shown in Appendix B. Font (Times New Roman – 12pt, or Arial –11pt)
Spacing – at least 1.15.7. Submit on or before 5.00pm, 5 MAY 2014 (MONDAY)
A132: SQQS1013
QUESTION 1 (30 MARKS)
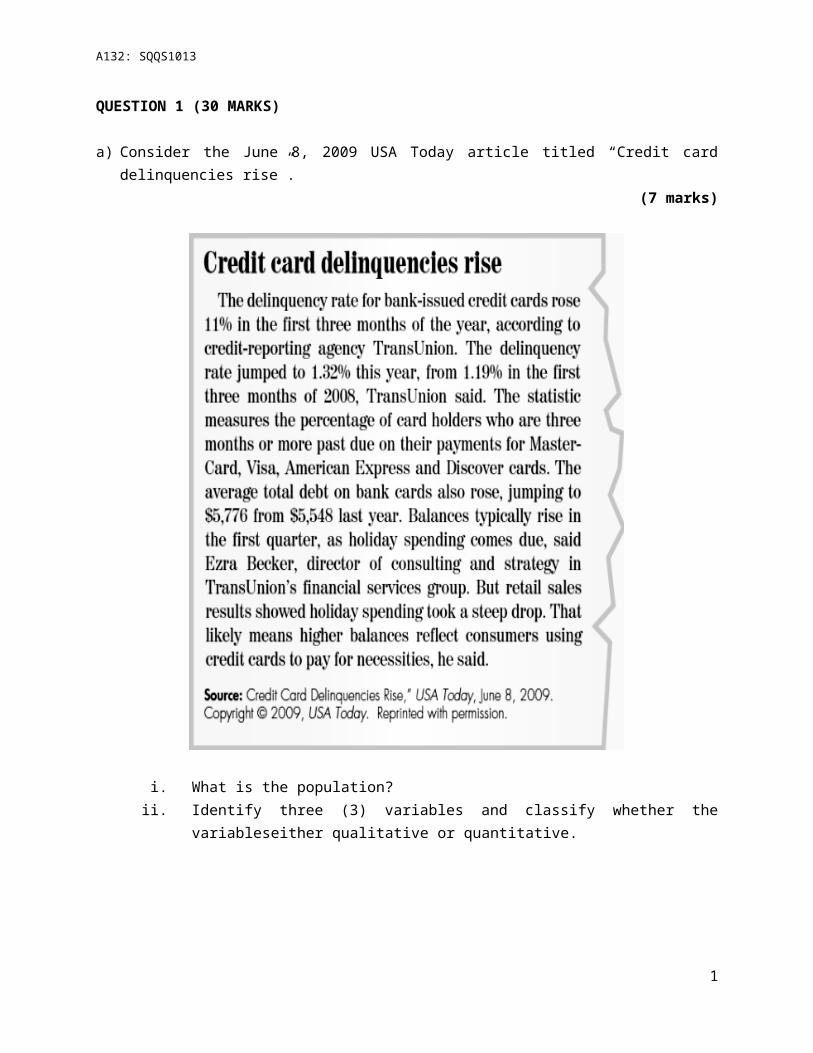
a) Consider the June 8, 2009 USA Today article titled “Credit carddelinquencies rise”.
(7 marks)
i. What is the population?ii. Identify three (3) variables and classify whether the
variableseither qualitative or quantitative.
1
A132: SQQS1013
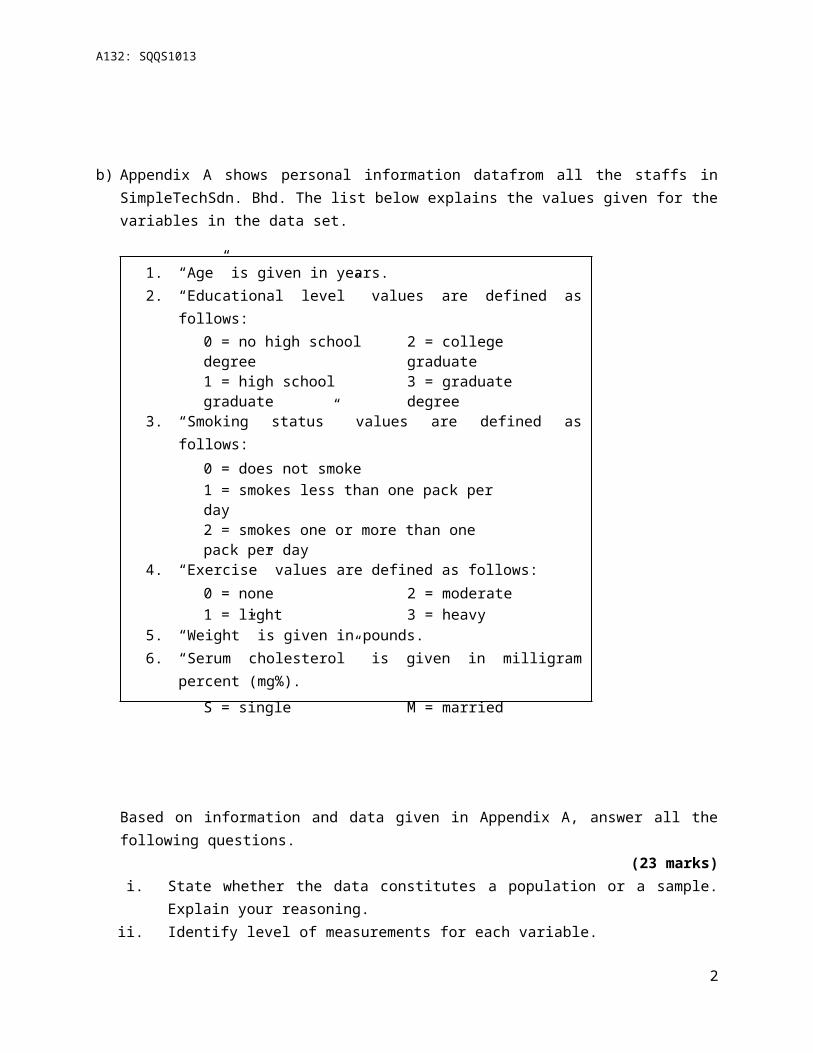
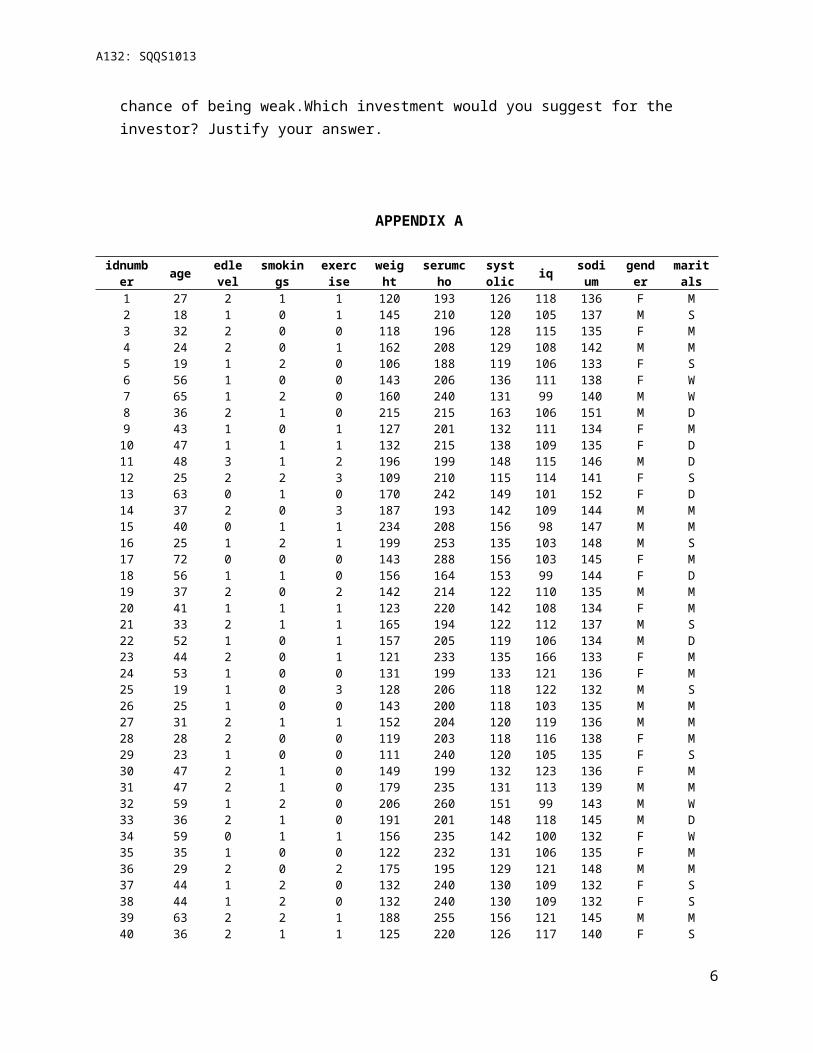
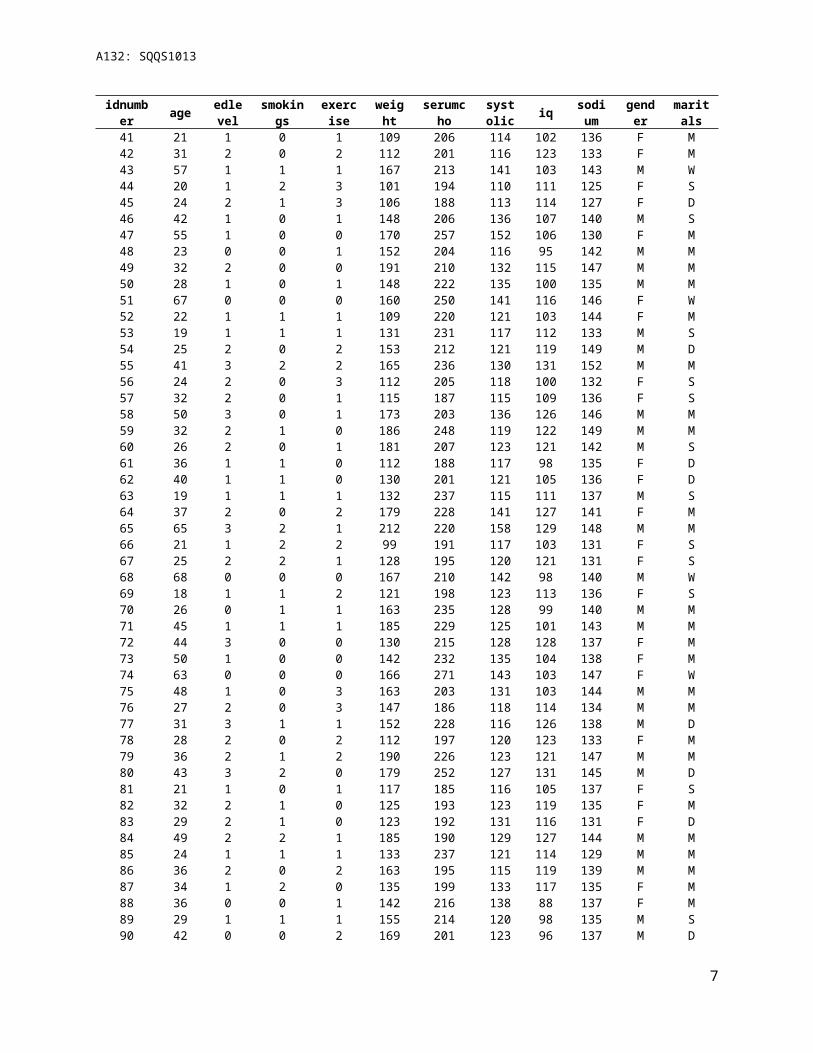
b) Appendix A shows personal information datafrom all the staffs inSimpleTechSdn. Bhd. The list below explains the values given for thevariables in the data set.
Based on information and data given in Appendix A, answer all thefollowing questions.
(23 marks)i. State whether the data constitutes a population or a sample.
Explain your reasoning.ii. Identify level of measurements for each variable.
2
1. “Age” is given in years.2. “Educational level” values are defined as
follows:0 = no high school degree
2 = college graduate
1 = high school graduate
3 = graduate degree
3. “Smoking status” values are defined asfollows:
0 = does not smoke1 = smokes less than one pack perday2 = smokes one or more than one pack per day
4. “Exercise” values are defined as follows:0 = none 2 = moderate1 = light 3 = heavy
5. “Weight” is given in pounds.6. “Serum cholesterol” is given in milligram
percent (mg%).7. “Systolic pressure” is given in millimetresS = single M = married
A132: SQQS1013
iii. Choose ONE qualitative variable and ONE quantitative variable.Present both variables with the most suitable graphical forms.Provide any table(s) if necessary. You MUSTuse Excel insolving this question.
iv. Find any numerical measures that are appropriate to representthe chosen variables.
v. Write a summaryabout both variables according to your findingsin part (iii) and (iv).
QUESTION 2 (20 MARKS)
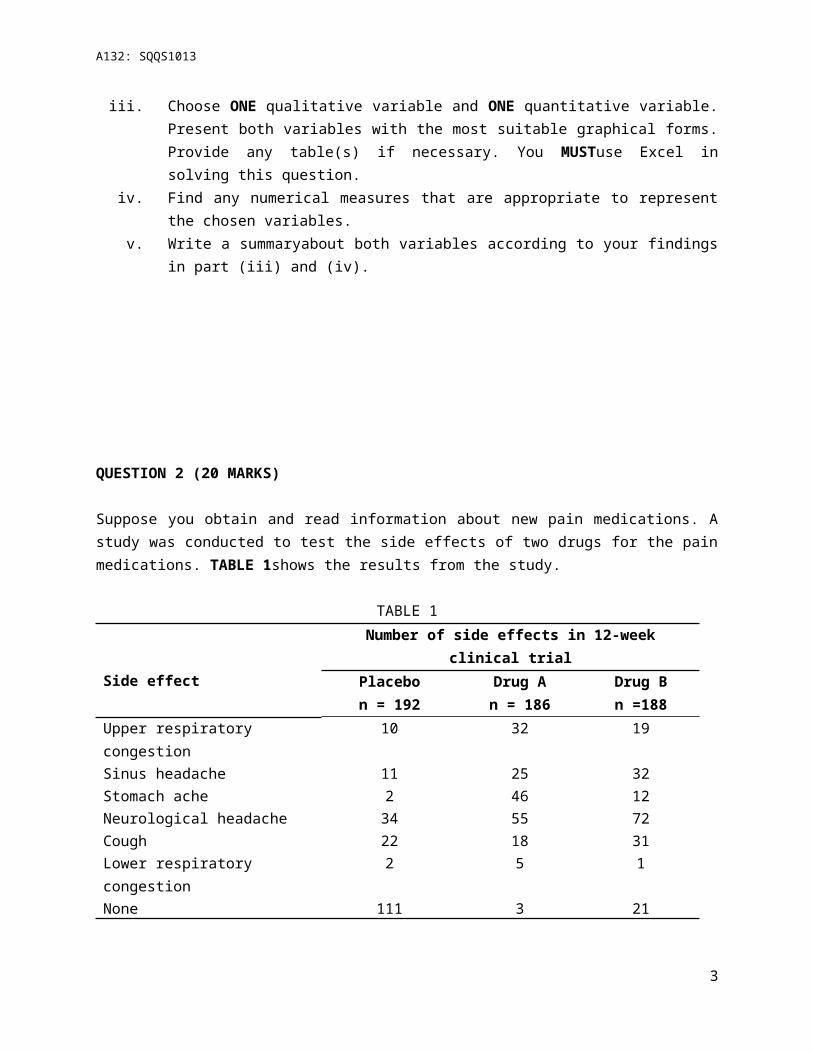
Suppose you obtain and read information about new pain medications. Astudy was conducted to test the side effects of two drugs for the painmedications. TABLE 1shows the results from the study.
TABLE 1
Side effect
Number of side effects in 12-weekclinical trial
Placebon = 192
Drug An = 186
Drug Bn =188
Upper respiratory congestion
10 32 19
Sinus headache 11 25 32Stomach ache 2 46 12Neurological headache 34 55 72Cough 22 18 31Lower respiratory congestion
2 5 1
None 111 3 21
3
A132: SQQS1013
a) State whether the study is observational or experimental. Explain your reason.
b) List all the variables.c) A person is selected at random. Find the probability that the person
wasi. receiving a placebo.ii. receiving drug A or B. Are these events mutually exclusive?
Give the reason. iii. not receiving a placebo or experienced a sinus headache.iv. having a lower respiratory congestion given that he or she
received drug A.
d) Four (4) persons are selected at random for interview session. Two(2) persons from those who received drug A, and the others fromthose who received drug B. Is it unusual that all of them did nothaving any side effects? Justify your answer.
QUESTION 3 (20 MARKS)
a) Prescott National Bank has six (6) tellers available to servecustomers. TABLE 2 indicates the past records of the number oftellers busy with customers at 1:00pm on 100 randomly selected days.It is a random variable since the value varies from day to day anddepends on chance.
4
A132: SQQS1013
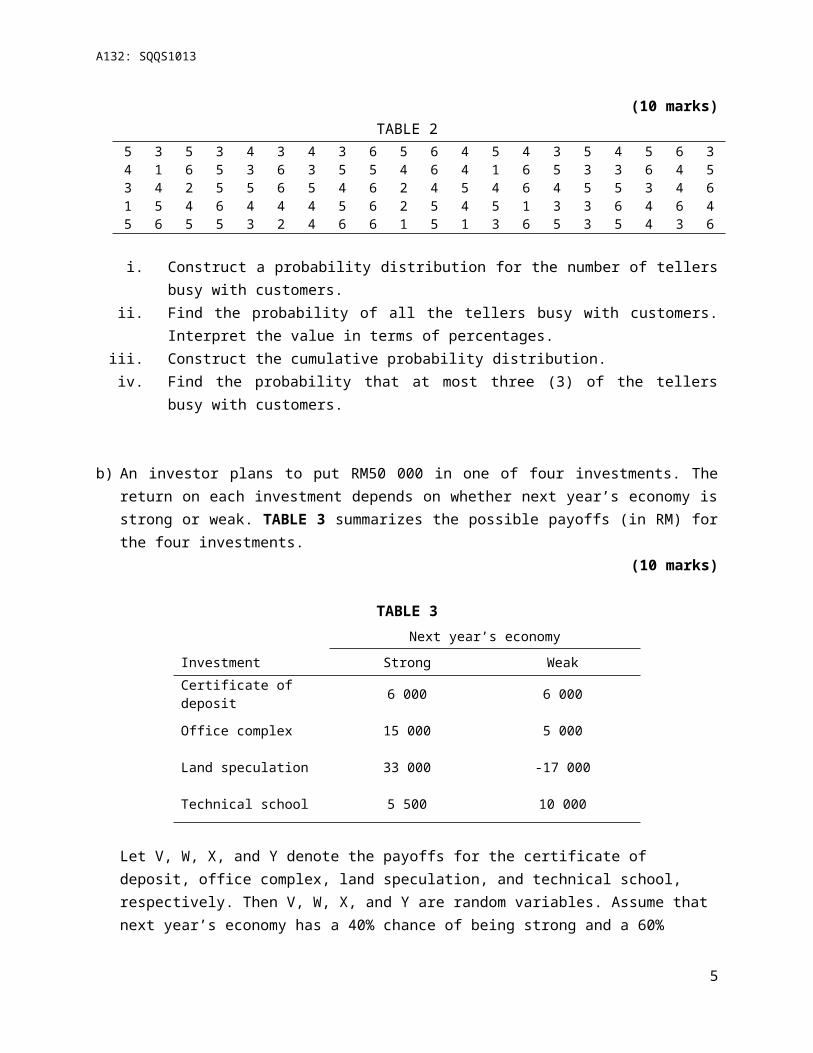
(10 marks)TABLE 2
5 3 5 3 4 3 4 3 6 5 6 4 5 4 3 5 4 5 6 34 1 6 5 3 6 3 5 5 4 6 4 1 6 5 3 3 6 4 53 4 2 5 5 6 5 4 6 2 4 5 4 6 4 5 5 3 4 61 5 4 6 4 4 4 5 6 2 5 4 5 1 3 3 6 4 6 45 6 5 5 3 2 4 6 6 1 5 1 3 6 5 3 5 4 3 6
i. Construct a probability distribution for the number of tellersbusy with customers.
ii. Find the probability of all the tellers busy with customers.Interpret the value in terms of percentages.
iii. Construct the cumulative probability distribution.iv. Find the probability that at most three (3) of the tellers
busy with customers.
b) An investor plans to put RM50 000 in one of four investments. Thereturn on each investment depends on whether next year’s economy isstrong or weak. TABLE 3 summarizes the possible payoffs (in RM) forthe four investments.
(10 marks)
TABLE 3Next year’s economy
Investment Strong WeakCertificate of deposit 6 000 6 000
Office complex 15 000 5 000
Land speculation 33 000 -17 000
Technical school 5 500 10 000
Let V, W, X, and Y denote the payoffs for the certificate of deposit, office complex, land speculation, and technical school, respectively. Then V, W, X, and Y are random variables. Assume that next year’s economy has a 40% chance of being strong and a 60%
5
A132: SQQS1013
chance of being weak.Which investment would you suggest for the investor? Justify your answer.
APPENDIX A
idnumber age edle
velsmokings
exercise
weight
serumcho
systolic iq sodi
umgender
maritals
1 27 2 1 1 120 193 126 118 136 F M2 18 1 0 1 145 210 120 105 137 M S3 32 2 0 0 118 196 128 115 135 F M4 24 2 0 1 162 208 129 108 142 M M5 19 1 2 0 106 188 119 106 133 F S6 56 1 0 0 143 206 136 111 138 F W7 65 1 2 0 160 240 131 99 140 M W8 36 2 1 0 215 215 163 106 151 M D9 43 1 0 1 127 201 132 111 134 F M10 47 1 1 1 132 215 138 109 135 F D11 48 3 1 2 196 199 148 115 146 M D12 25 2 2 3 109 210 115 114 141 F S13 63 0 1 0 170 242 149 101 152 F D14 37 2 0 3 187 193 142 109 144 M M15 40 0 1 1 234 208 156 98 147 M M16 25 1 2 1 199 253 135 103 148 M S17 72 0 0 0 143 288 156 103 145 F M18 56 1 1 0 156 164 153 99 144 F D19 37 2 0 2 142 214 122 110 135 M M20 41 1 1 1 123 220 142 108 134 F M21 33 2 1 1 165 194 122 112 137 M S22 52 1 0 1 157 205 119 106 134 M D23 44 2 0 1 121 233 135 166 133 F M24 53 1 0 0 131 199 133 121 136 F M25 19 1 0 3 128 206 118 122 132 M S26 25 1 0 0 143 200 118 103 135 M M27 31 2 1 1 152 204 120 119 136 M M28 28 2 0 0 119 203 118 116 138 F M29 23 1 0 0 111 240 120 105 135 F S30 47 2 1 0 149 199 132 123 136 F M31 47 2 1 0 179 235 131 113 139 M M32 59 1 2 0 206 260 151 99 143 M W33 36 2 1 0 191 201 148 118 145 M D34 59 0 1 1 156 235 142 100 132 F W35 35 1 0 0 122 232 131 106 135 F M36 29 2 0 2 175 195 129 121 148 M M37 44 1 2 0 132 240 130 109 132 F S38 44 1 2 0 132 240 130 109 132 F S39 63 2 2 1 188 255 156 121 145 M M40 36 2 1 1 125 220 126 117 140 F S
6
A132: SQQS1013
idnumber age edle
velsmokings
exercise
weight
serumcho
systolic iq sodi
umgender
maritals
41 21 1 0 1 109 206 114 102 136 F M42 31 2 0 2 112 201 116 123 133 F M43 57 1 1 1 167 213 141 103 143 M W44 20 1 2 3 101 194 110 111 125 F S45 24 2 1 3 106 188 113 114 127 F D46 42 1 0 1 148 206 136 107 140 M S47 55 1 0 0 170 257 152 106 130 F M48 23 0 0 1 152 204 116 95 142 M M49 32 2 0 0 191 210 132 115 147 M M50 28 1 0 1 148 222 135 100 135 M M51 67 0 0 0 160 250 141 116 146 F W52 22 1 1 1 109 220 121 103 144 F M53 19 1 1 1 131 231 117 112 133 M S54 25 2 0 2 153 212 121 119 149 M D55 41 3 2 2 165 236 130 131 152 M M56 24 2 0 3 112 205 118 100 132 F S57 32 2 0 1 115 187 115 109 136 F S58 50 3 0 1 173 203 136 126 146 M M59 32 2 1 0 186 248 119 122 149 M M60 26 2 0 1 181 207 123 121 142 M S61 36 1 1 0 112 188 117 98 135 F D62 40 1 1 0 130 201 121 105 136 F D63 19 1 1 1 132 237 115 111 137 M S64 37 2 0 2 179 228 141 127 141 F M65 65 3 2 1 212 220 158 129 148 M M66 21 1 2 2 99 191 117 103 131 F S67 25 2 2 1 128 195 120 121 131 F S68 68 0 0 0 167 210 142 98 140 M W69 18 1 1 2 121 198 123 113 136 F S70 26 0 1 1 163 235 128 99 140 M M71 45 1 1 1 185 229 125 101 143 M M72 44 3 0 0 130 215 128 128 137 F M73 50 1 0 0 142 232 135 104 138 F M74 63 0 0 0 166 271 143 103 147 F W75 48 1 0 3 163 203 131 103 144 M M76 27 2 0 3 147 186 118 114 134 M M77 31 3 1 1 152 228 116 126 138 M D78 28 2 0 2 112 197 120 123 133 F M79 36 2 1 2 190 226 123 121 147 M M80 43 3 2 0 179 252 127 131 145 M D81 21 1 0 1 117 185 116 105 137 F S82 32 2 1 0 125 193 123 119 135 F M83 29 2 1 0 123 192 131 116 131 F D84 49 2 2 1 185 190 129 127 144 M M85 24 1 1 1 133 237 121 114 129 M M86 36 2 0 2 163 195 115 119 139 M M87 34 1 2 0 135 199 133 117 135 F M88 36 0 0 1 142 216 138 88 137 F M89 29 1 1 1 155 214 120 98 135 M S90 42 0 0 2 169 201 123 96 137 M D
7
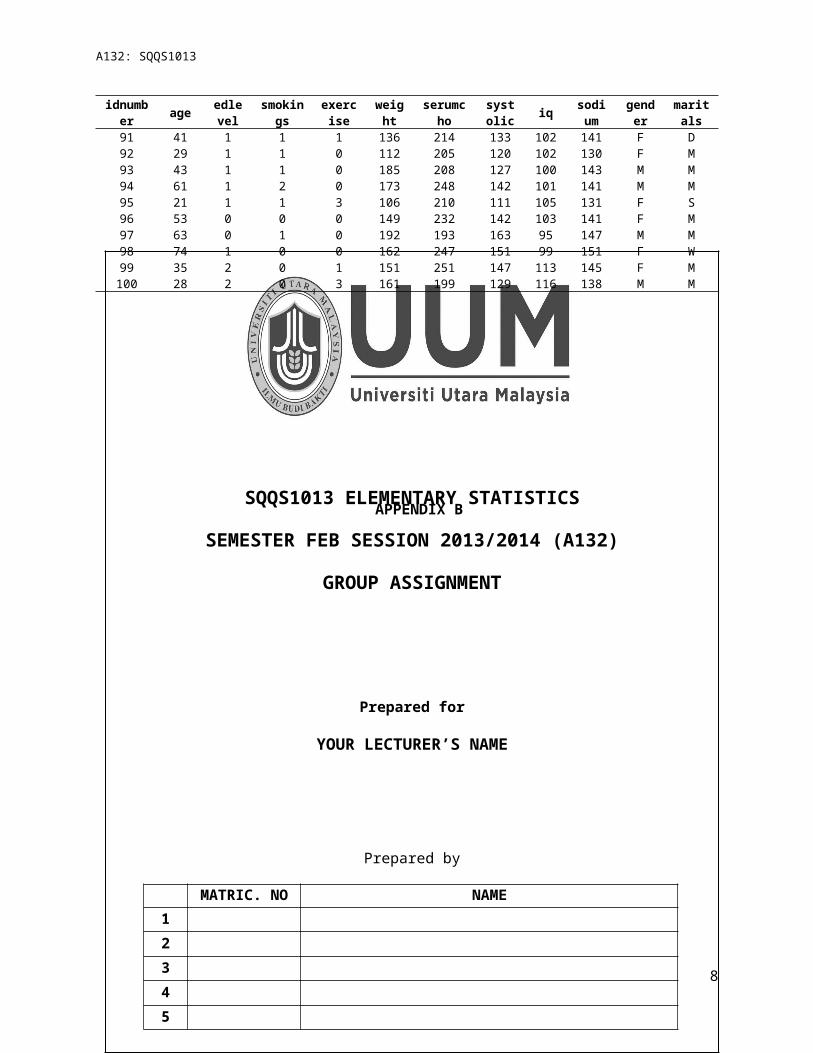
SQQS1013 ELEMENTARY STATISTICS
SEMESTER FEB SESSION 2013/2014 (A132)
GROUP ASSIGNMENT
Prepared for
YOUR LECTURER’S NAME
Prepared by
MATRIC. NO NAME12345
A132: SQQS1013
idnumber age edle
velsmokings
exercise
weight
serumcho
systolic iq sodi
umgender
maritals
91 41 1 1 1 136 214 133 102 141 F D92 29 1 1 0 112 205 120 102 130 F M93 43 1 1 0 185 208 127 100 143 M M94 61 1 2 0 173 248 142 101 141 M M95 21 1 1 3 106 210 111 105 131 F S96 53 0 0 0 149 232 142 103 141 F M97 63 0 1 0 192 193 163 95 147 M M98 74 1 0 0 162 247 151 99 151 F W99 35 2 0 1 151 251 147 113 145 F M100 28 2 0 3 161 199 129 116 138 M M
APPENDIX B
8
A132: SQQS1013
9