Embed Size (px)
Citation preview
Appl. Sci. 2020, 10, 6240; doi:10.3390/app10186240 www.mdpi.com/journal/applsci
Review
Salivary Redox Biomarkers in the Course of Caries and Periodontal Disease
Anna Skutnik‐Radziszewska 1,* and Anna Zalewska 2
1 Doctoral Studies, Medical University of Bialystok, 1 Jana Kilinskiego Street, 15‐089 Bialystok, Poland 2 Laboratory of Experimental Dentistry, Medical University of Bialystok, 24A M. Sklodowskiej‐Curie Street,
15‐276 Bialystok, Poland; [email protected]
* Correspondence: [email protected]
Received: 5 August 2020; Accepted: 31 August 2020; Published: 8 September 2020
Abstract: Caries are a pathological process of extracorporeal nature, characterized by
demineralization of inorganic substances as well as proteolysis triggered by acids produced by
bacteria present in dental plaque, as a result of metabolism of sugars of both external and internal
origin. Periodontal disease, on the other hand, is a multifactorial degenerative disease associated
with inflammation, involving a group of tissues that surround the dental cervix and root of the
tooth. It is believed that one of the mechanisms in the etiopathogenesis of caries and periodontitis
are disorders of local and/or general oxidative stress (OS) parameters. Numerous clinical studies
have confirmed the relationship between oxidative stress markers and oral diseases. In most
analyzed studies, technical and biological variability was so high that none of the markers so far has
proven suitable for routine clinical use. The aim of systematic reviews of the literature is to present
the existing studies on OS parameters, mainly concerning the activity of antioxidant enzymes in
saliva of patients with caries and periodontitis.
Keywords: antioxidants; caries; oxidative stress; periodontitis; saliva
1. Saliva
The use of saliva as a diagnostic material, as opposed to blood and cerebrospinal fluid, offers
numerous advantages. Saliva is an easily accessible bioliquid, obtained in a noninvasive and stress‐
free manner due to painless collection [1,2]. This aspect is extremely important for young children as
well as the elderly. Saliva can be collected at home, without the involvement of nursing staff.
Transportation of saliva to the laboratory requires only low temperature (<4 °C), and the substances
assayed in saliva are resistant to external factors or bacterial proteolysis [3–5].
Saliva is produced by three pairs of large salivary glands: the parotid, submandibular and
sublingual as well as by about 200–400 smaller glands scattered throughout the oral cavity (except
for the gingivae and anterior part of the hard palate). The small salivary glands of the oral cavity
include the buccal, labial, palatine, lingual and molar glands [5,6]. Water accounts for approximately
94–99.5% of saliva, the remainder elements (organic and inorganic components), the amount of which
is highly variable [about 6% in nonstimulated saliva (NS) and 0.5% in stimulated saliva (SS)]. The
main organic components of saliva are proteins: enzymes, mucins and nonglycosylated proteins,
serum proteins, immunoglobulins, blood group substances, kallikrein, lactoferrin, epidermal growth
factor (EGF), histatins, cystatins, statherins, sialin, hormones and vitamins from the groups A, B, C
and K [7–9]. The content of inorganic components in saliva is changeable and their source is blood,
except for bicarbonate ions (HCO3‐) [10]. The primary functions of inorganic components include
regulation of transport through cell membranes, participation in the buffering of acids and enzyme
activation. Moreover, inorganic components of saliva serve as building blocks for hard dental tissues
Appl. Sci. 2020, 10, 6240 2 of 35
(enamel and dentine) [10,11]. Saliva also contains exfoliated epithelial cells, oral bacteria and their
metabolites as well as food residues [12].
Saliva forms the natural environment of the oral cavity. It is important for the integrity of tissues,
both mineralized (teeth) and soft (mucous membrane) as well as for speech, food consumption and
its preparation for digestion. Saliva is also responsible for diluting and removing substances that
enter the oral cavity, including cariogenic carbohydrates [13]. The presence of water and
glycoproteins determines the lubricating properties of saliva. Its protective function (antibacterial,
antifungal and antiviral) resulting from the presence of specific and nonspecific immunity proteins
is also extremely important for good condition of the oral cavity as well as the entire body [14–16].
It should also be noted that the oral cavity is highly exposed to reactive oxygen species (ROS)
and reactive nitrogen species (RNS). The sources of ROS and RNS in the oral cavity under
physiological conditions are, inter alia, oxidative reactions catalyzed by NADPH oxidase or xanthine
oxidase and those generated during cellular respiration in the mitochondrial respiratory chain [17].
Furthermore, one of the most important ROS sources in the oral cavity is periodontal inflammation.
Other sources include: xenobiotics (ethanol, cigarette smoke, drugs), food (high‐fat, high‐protein or
high‐sucrose diet, acrolein), dental treatment (ozone, ultrasound, nonthermal plasma, laser light and
ultraviolet light) and dental materials (fluorides, dental composites, fixed orthodontic appliances and
titanium fixations), UV and ionizing radiation, air pollution, alcohol consumption and smoking [17].
It has been demonstrated that excessive production of ROS in the oral cavity may cause oxidative
stress (OS) and oxidative damage to cellular DNA, lipids and proteins, thus predisposing people to
numerous oral and systemic diseases. The ability of saliva to counteract OS phenomenon is due to
the content of low‐molecular‐weight antioxidants such as: reduced glutathione (GSH), uric acid (UA),
ascorbic acid, melatonin, transferrin, lactoferrin and ceruloplasmin as well as enzymatic antioxidants:
salivary peroxidase (Px), superoxide dismutase (SOD), catalase (CAT) and glutathione peroxidase
(GPx) [12,18,19]. More‐and‐more reports in the literature indicate the key role of OS in salivary gland
dysfunction. Thus, it is a pathogenetic factor in oral diseases—caries and periodontitis [20–27]. The
primary aim of this article is to review the current literature (from the years 2010–2020) on salivary
markers of oxidoreductive balance in the course of caries and periodontitis.
2. Oxidative Stress
The physiological role of free radicals (superoxide anion radical O2•, hydroxyl radical •OH,
hydroperoxyl radical HO2‐•, singlet oxygen 1O2, nitric oxide NO• and nitrogen dioxide NO•2) as
well as reactive oxygen species that are not free radicals (hydrogen peroxide H2O2, hydrochlorous
acid HOCl, peroxynitrous acid ONOOH and hypothiocyanous acid HOSCN) is, inter alia, to control
cell functioning and regulate the rate of cell metabolism.
If the body is in the state of homeostasis, the production and elimination of ROS are in
equilibrium. When there is a sudden or gradual chronic increase in free radicals, a phenomenon
called OS occurs. OS is a situation in which there is a chronic or rapid increase in ROS and RNS levels
leading to direct or indirect metabolic disorders through modulation of signaling pathways,
oxidative modifications to cell components and subsequent cell apoptosis [28–32].
3. Oxidative Stress Biomarkers
There are numerous markers that assess the intensity of OS as well as degree of oxidative
damage caused by it.
Free radicals cause damage to many cell components and disrupt cellular metabolism. The first
element exposed to free radicals is the cell membrane, therefore the earliest symptom of OS is
increased concentration of peroxidation products, mainly phospholipids, membrane glycolipids and
cholesterol [33]. Polyunsaturated fatty acids, i.e., those containing two or more double bonds,
classified as omega−3 (n−3) and omega−6 (n−6) fatty acids, are the most susceptible to peroxidation
[34]. The process of lipid peroxidation consists in the oxidation of polyunsaturated fatty acid radicals
and can occur either without the participation of enzymes or result from enzymatic reactions [35]
(Figure 1). It should be emphasized that both mechanisms of lipid peroxidation may take place
Appl. Sci. 2020, 10, 6240 3 of 35
simultaneously. The enzymatic process starts when large amounts of lipid peroxides are supplied by
nonenzymatic lipid peroxidation. In turn, reactions catalyzed by lipoxygenases may initiate
nonenzymatic processes (Figure 2).
Figure 1. Abbreviation: L—carbon‐centered lipid radical, LO—lipid alkoxyl radical, LOO—lipid
peroxy radical, LOOH—lipid hydroperoxide. Free radical peroxidation of lipids according to [36] as
modified by the authors.
Appl. Sci. 2020, 10, 6240 4 of 35
Figure 2. Abbreviation: AA—arachidonic acid. Diagram of isoprostane formation according to [37] as
modified by the authors.
High ROS concentrations lead to oxidative modifications to proteins. Both single amino acid
residues and an entire polypeptide chain may undergo oxidative modifications. Oxidation of amino
acids results in their modification, breaking of the polypeptide chain and formation of cross‐links
within one or more polypeptide chains [34] (Figure 3). Oxidative damage to proteins leads to the loss
of their biological activity and function, with all consequences for the cell.
Appl. Sci. 2020, 10, 6240 5 of 35
Figure 3. Abbreviation: R—rest of the fatty acid. Oxidation of the polypeptide chain at the α‐carbon
according to [38] as modified by the authors.
Nucleic acids are more resistant to free radicals than fats and proteins. Therefore, they are not
often transformed into free radicals. Moreover, damage to the genetic material is quickly repaired.
Oxidative DNA modifications are mainly caused by •OH, while H2O2 and O2• do not reveal this
ability [35] (Figure 4).
Appl. Sci. 2020, 10, 6240 6 of 35
Figure 4. Abbreviation: dGuo—deoxyguanosine. Oxidative modifications of guanine according to
[38] as modified by the authors.
In some cases, the concentration of oxidatively modified molecules (the only reliable oxidative
stress markers) may be reduced or even unchanged compared to the control due to their elimination
by specific repair systems. Such a result may erroneously suggest a normal redox state of the tested
material. Therefore, an oxidative stress index (OSI) was introduced. OSI enables the assessment of
the relationship between total oxidant status (TOS) and total antioxidant status (TAS), and is a
recognized golden standard in assessing oxidative stress [39–41].
4. Antioxidant Defense
The existence of reactive oxygen species in cells that use oxygen as an energy source in metabolic
processes has led to the creation of protective mechanisms against the effects of ROS. We define these
mechanisms as an antioxidant barrier of the system. It is worth mentioning that the assessment of
changes in the antioxidant barrier activity is used by some researchers to estimate the occurrence and
extent of OS [42–44].
By definition: “antioxidants are compounds which, when in low concentrations compared to the
oxidized substrate, may inhibit the oxidation of this substrate” [45]. The purpose of antioxidants is to
hinder oxidation reactions by reacting with ROS/RNS. This process can be single‐ or two‐stage. In the
Appl. Sci. 2020, 10, 6240 7 of 35
latter, ROS/RNS are transformed into weak radicals. The produced weak radical reacts with another
weak radical, leading to the formation of an inactive molecule.
Based on their mechanism of action, antioxidant compounds can also be divided into enzymatic
and nonenzymatic [46,47].
SOD is found in all tissues that metabolize oxygen. It is a group of enzymes catalyzing the
transformation of O2• to H2O2 and O2 [48–50].
CAT is an enzyme commonly found in body tissues [51,52]. CAT is characterized by high
efficiency in decomposing H2O2 to H2O and O2. During this reaction no new ROS are generated [53–
55].
Px, together with myeloperoxidase secreted by leukocytes, H2O2 and rhodanide ion (SCN‐)
forms the Px system [56]. The most important function of Px is to inhibit the growth and
multiplication of cariogenic bacteria by oxidation of SCN‐ to bactericidal hypothiocyanite ion (OSCN‐
) in neutral environments or to HOSCN in acidic environments [57,58]. A very important function is
the antioxidant activity of Px expressed in regulating the amount H2O2 secreted by bacteria and
leukocytes [19,59,60].
The GSH defense system is the most important cellular detoxification mechanism against ROS
and RNS. This system includes, inter alia, GSH and glutathione reductase (GR) which regenerates
GSH from the reduced form of glutathione disulfide (GSSG) [61]. GSH is responsible for free radical
neutralization reactions directly and indirectly through reactions catalyzed by GPx peroxidase and
other peroxidases, thus neutralizing H2O2 and nitrogen peroxide [62,63].
UA is a nonenzymatic plasma antioxidant formed in the plasma, capable of capturing free
radicals, and accounting for approximately 85% of the total antioxidant capacity of saliva [26]. The
main function of UA is capturing •OH, 1O2 and LOO [64].
Melatonin has a high antioxidant potential, acting both as a free radical scavenger and
preventive antioxidant [65,66]. So far, it has been proven that melatonin is the most effective •OH
scavenger [67]. Moreover, melatonin directly neutralizes HOCl, 1O2 and ONOOH. It also shows
antioxidant effect indirectly by stimulating GSH synthesis, e.g., by increasing GPx and GR activity or
maintaining functional integrity of antioxidant enzymes such as SOD and CAT [68].
5. Materials and Methods
5.1. Searching Strategy
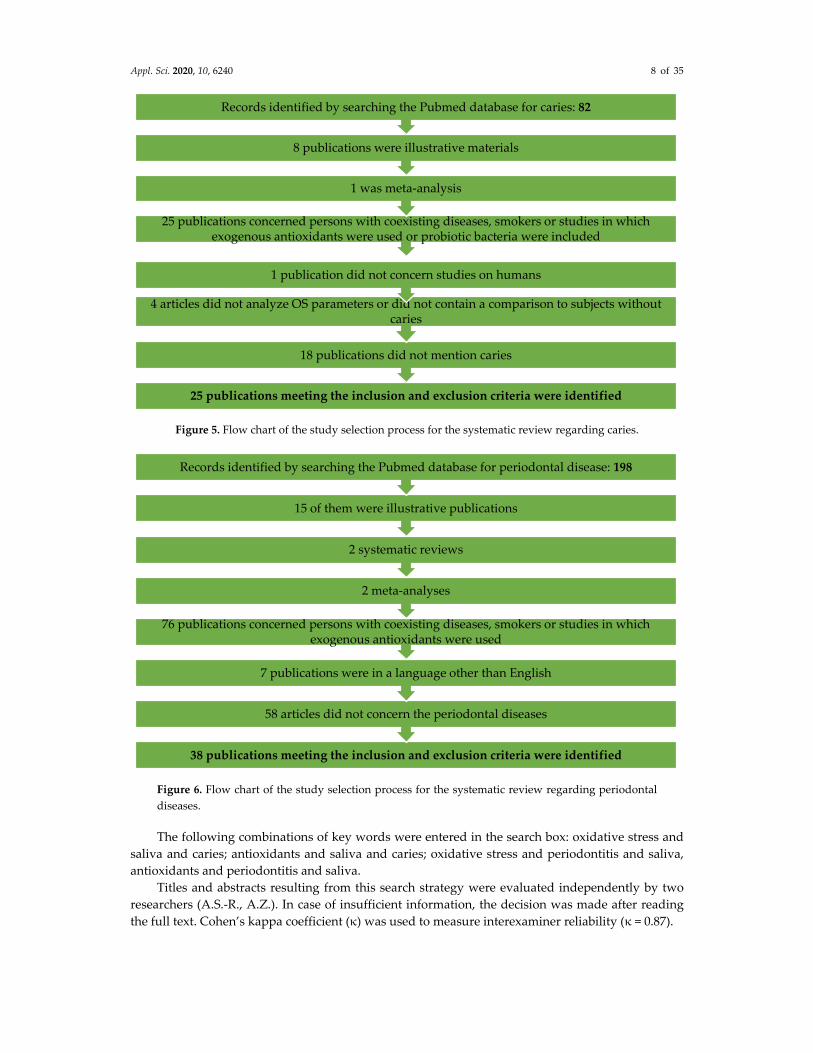
For this review, a literature search was conducted among the results from 2010 to May 2020 in
the Pubmed search engine. The overview referred to all publications in English, including only
original human studies, without review papers, abstracts, letters to editorial offices, meta analyses,
case descriptions or animal model studies (Figures 5 and 6).
Appl. Sci. 2020, 10, 6240 8 of 35
Figure 5. Flow chart of the study selection process for the systematic review regarding caries.
Figure 6. Flow chart of the study selection process for the systematic review regarding periodontal
diseases.
The following combinations of key words were entered in the search box: oxidative stress and
saliva and caries; antioxidants and saliva and caries; oxidative stress and periodontitis and saliva,
antioxidants and periodontitis and saliva.
Titles and abstracts resulting from this search strategy were evaluated independently by two
researchers (A.S.‐R., A.Z.). In case of insufficient information, the decision was made after reading
the full text. Cohen’s kappa coefficient (κ) was used to measure interexaminer reliability (κ = 0.87).
25 publications meeting the inclusion and exclusion criteria were identified
18 publications did not mention caries
4 articles did not analyze OS parameters or did not contain a comparison to subjects without caries
1 publication did not concern studies on humans
25 publications concerned persons with coexisting diseases, smokers or studies in which exogenous antioxidants were used or probiotic bacteria were included
1 was meta‐analysis
8 publications were illustrative materials
Records identified by searching the Pubmed database for caries: 82
38 publications meeting the inclusion and exclusion criteria were identified
58 articles did not concern the periodontal diseases
7 publications were in a language other than English
76 publications concerned persons with coexisting diseases, smokers or studies in which exogenous antioxidants were used
2 meta‐analyses
2 systematic reviews
15 of them were illustrative publications
Records identified by searching the Pubmed database for periodontal disease: 198
Appl. Sci. 2020, 10, 6240 9 of 35
5.2. Inclusion and Exclusion Criteria
The papers were included in the review if they fulfilled all of the following criteria:
the study group consisting of individuals with caries/periodontitis;
subjects of the study refrained from taking antibiotics, antioxidants or any other medicines;
evaluation of at least one oxidative stress biomarker in the saliva;
the control group consisting of caries‐free/periodontally healthy individuals;
individuals qualified for both the study and control group were generally healthy;
The papers were excluded if the studies concerned periodontitis in combination with pregnancy.
5.3. Variables Recorded
The following data were collected for each article: author and year of publication, form of
periodontal disease/caries, sample size, gender and age, variables studied (different antioxidants,
products of oxidative modifications, TAC/TAS/FRAP, TOS, NO and nitrosative stress).
6. Results
Concerning caries: 82 were found, of which 25 publications meeting the inclusion and exclusion
criteria were identified. Fifty‐seven publications were excluded, of which 8 publications were
illustrative materials, 1 was meta‐analysis, 25 publications concerned persons with coexisting
diseases, smokers or studies in which exogenous antioxidants were used or probiotic bacteria were
included, 1 publication did not concern studies on humans, 4 articles did not analyze OS parameters
or did not contain a comparison to subjects without caries and 18 publications did not mention caries.
Concerning periodontal diseases: 198 were found, of which 38 publications meeting the
inclusion and exclusion criteria were identified. One‐hundred‐and‐sixty publications were excluded
from this review—15 of them were illustrative publications, 2 systematic reviews, 2 meta‐analyses,
76 publications concerned persons with coexisting diseases, smokers or studies in which exogenous
antioxidants were used, 7 publications were in a language other than English and 58 articles did not
concern periodontal diseases.
The most frequently studied markers in the case of caries were TAC (16 publications), MDA (7
publications), SOD (4 publications), UA, GSH (3 publications), GSG, GSH/GSSG (2 publications),
TBARS, NO, Px, CAT and AOPP (1 publication).
The markers assessed in periodontitis were TAC (11 publications), 8‐OHdG (9 publications),
MDA (8 publications), SOD, NO (7 publications), TOS (4 publications), GPx, AOPP, melatonin (3
publications), OSI, 4‐HNE, TBARS, AGE, FRAP, CAT, GR, UA (2 publications), thiol, MPO, ALB,
peroxynitrite, S‐nitrosothiols, nitrite level and nitrate level (1 publication).
7. Caries
According to the traditional definition, caries is a bacterial infectious disease of hard tissues of
teeth characterized by demineralization of inorganic substances and the following proteolysis of
organic substances triggered by acids produced by bacteria in dental plaque as a result of the
metabolism of sugars of external and internal origin [20]. The initial stages of the formation of cavities
are asymptomatic, but untreated caries may lead to tooth loss and thus to progressive occlusal
disorders, temporomandibular joint dysfunction, headache and neuralgia in the head and neck [27].
Nowadays, the main theory of caries formation is the plaque theory based on the assumption that
the development of tooth decay results from changed microflora of the oral cavity towards the
development of more cariogenic species causing demineralization processes to prevail over
remineralization processes, which leads to caries [69]. The purifying and antibacterial role of saliva
is generally undisputed in the prevention of caries. However, it is worth noting that studies of recent
years have shown the existence of fluid flow through the dentine and enamel in healthy teeth. It has
also been observed that a high‐sucrose diet may be able to stop the fluid flow and even reverse it.
This discovery was of great importance because instead of a healthy tooth continually purifying itself
Appl. Sci. 2020, 10, 6240 10 of 35
from the inside, plaque could stick to the tooth surface with the fluid flow stopped or reversed,
causing the production of acid and its concentration on the tooth surface and thus the development
of caries. Leonora et al. [70] demonstrated that the parotid glands are capable of secreting the parotid
hormone to control dentinal fluid flow, and that a high‐sucrose diet diminishes the amount of the
parotid hormone. However, how does this relate to redox balance? It was demonstrated that a
carbohydrate‐rich diet increased the mitochondrial respiratory chain and ROS/RNS production. This
triggered mechanisms in the hypothalamus and downregulated the parotid hormone secretion which
simultaneously stopped fluid flow and increased the exposure of the tooth to acid.
The participation of OS in the process of caries development has not been fully explained and is
therefore the subject of intensive scientific research. As already mentioned above, OS may be the
result of antioxidant barrier weakening or excessive production of free oxygen, nitrogen and
nonradical species. Our search for the relationship between OS and caries mainly concerned changes
in the functioning of the salivary antioxidant barrier in children aged 0 to 15 years [22,71–85]. There
are few publications on salivary OS in the course of dental caries in adults [7,20,86–94]. The analysis
of salivary oxidative stress parameters in the course of caries is presented in Table 1.
Interestingly, studies analyzing the redox potential of children (3 to 15 years old) with caries
show a consistency of results characterized by higher antioxidant capacity of saliva in children with
caries compared to the controls. One of the most frequently used methods was TAS determination
proposed by Rice‐Evans et al. [95]. TAS enables the assessment of the total antioxidant content,
although it does not determine which antioxidants are present in the sample [96–98]. Kumar et al.
[74] and Muchandi et al. [75] examined total antioxidant capacity (TAC) in the saliva of 3–6‐year‐old
children and its correlation with early childhood caries (ECC) and rampant caries. Their results
demonstrated higher TAC in caries‐active children and a positive correlation between the number of
teeth with caries and salivary TAC levels, which was consistent with the results obtained in the group
of 6–12‐year‐old children [83]. AlAnazi et al. [85] showed that TAC in the saliva of children with ECC
undergoes significant downregulation as a result of treatment of carious cavities. The lack of
significant differences between the control group and the samples taken a week and 3 months after
the treatment suggests that the reduction in TAC was caused by the removal of inflammation within
dental tissues.
In the studies of Jurczak et al. [72], Dodwad et al. [81] and Banda et al. [84], salivary TAC
increased with the age of the child, which suggests the maturation of the salivary antioxidant system,
similarly to its immune systems [19]. Jurczak et al. [72] demonstrated higher concentrations of GSH,
oxidized glutathione (GSSG) and TAC in the saliva of children with advanced caries compared to
those with noncavitated forms of caries. As in the previously quoted results, the concentrations of the
discussed parameters were significantly higher in the saliva of patients with ECC in comparison with
caries‐free children. The profile of cariogenic bacteria was considerably wider in the saliva of ECC
children compared to caries‐free ones. These authors suggest that the type of cariogenic bacteria and
the development of ECC are positively correlated with GSH/GSSG level [72]. Han et al. [79] found
that 6–14‐year‐olds with high salivary GSH levels had a significantly high salivary Lactobacillus
level, high number of decayed, missing and filled teeth (DMFT) and high number of active cavities,
supporting the assumption that salivary GSH level may be an important component of the oral cavity.
They also observed that the GSH/GSSG ratio increased with salivary Streptococcus mutans and
Lactobacillus counts, but the differences were not significant. The researchers claim that the
concentration of GSH in saliva may enhance oral bacterial immunity by providing protection from
various forms of stress. Accordingly, individuals with a low GSH level in the oral cavity may be
protected against cariogenic and acidogenic bacteria, and thus, dental caries.
Of all redox biomarkers in saliva, there has been a growing interest in the role of nitrates and
nitrites in providing protection against dental caries. It is believed that nitric oxide (NO) acts as an
antibacterial agent in two ways: by inhibiting bacterial growth and/or increasing macrophage‐
mediated cytotoxicity from saliva [99]. The results of Syed et al. [78] confirm the protective role of
NO in relation to caries. They demonstrated significantly higher content of NO and its metabolites in
the saliva of children with healthy teeth compared to the caries‐active group.
Appl. Sci. 2020, 10, 6240 11 of 35
According to Jurczak et al. [72], strong antioxidant defense leads to inactivation of ROS, which
in turn makes cariogenic bacteria more likely to multiply and divide, resulting in the loss of hard
dental tissue. Moreover, in these researchers’ opinion, salivary antioxidant systems participate in the
weakening of oral bacteria resistance, ensuring their elevated vulnerability to different kinds of stress.
Mahjoub et al. [73] suggested that increased TAC level in the saliva of 3–5‐year‐old children occurring
in advanced caries compared to caries‐free children is a compensatory mechanism of the antioxidant
system against early dental caries, as is the case with numerous systemic diseases [1,2,5,73,100–103].
The authors also demonstrated the dependence of increased TAC on the progression of caries and
cariogenic profile. Preethi et al. [80], Dodwad et al. [81] and Pandey et al. [82] argued that increased
TAC in the saliva of 7–14‐year‐olds is caused by raised concentration of salivary protein, which is
considered a protective/adaptive response of the body against bacterial colonization and dental
caries, given that salivary proteins have a protective effect in relation to hard dental tissues [71].
Assuming that 85% of TAC is attributed to the presence of UA, Kumar et al. [74] suggested that higher
TAC level can be connected with diet in ECC. It has been reported that intake of added sugar and
sugar‐sweetened drinks increases UA concentration in serum [104]. In children with ECC we observe
frequent and prolonged consumption of carbohydrates, including fructose which is rapidly
transformed into UA in the blood. This may elevate the salivary UA level (as serum composition is
reflected in saliva to a large extent), leading to an elevated salivary TAC level. Indeed, in the study
by Silva et al. [71], significantly higher UA content was observed in the saliva of ECC children, and it
was positively corelated with the salivary TAC level.
The results of the study on the salivary antioxidant potential in the course of caries in patients
over 15 years of age are contradictory. Salivary and serum TAC levels in 15–19‐year‐old subjects with
active caries and in the caries‐free group showed no statistically significant differences in the study
by Ahmadi‐Motamayel et al. [20]. The results obtained by Ahmadi‐Motamayel et al. [7] and Kumar
et al. [102] proved that caries‐active adolescents had higher TAC content than caries‐free controls.
TAC in patients examined by Hegde et al. [87] demonstrated a positive correlation with their DMFT
scores, as confirmed by Kumar et al. [105]. As TAC is the sum of all antioxidants present in the
sample, its increase in the saliva of adults can be explained by the results of Hedge et al. [84] and
Hendi et al. [89]. Hedge et al. [90] showed an increase in copper and zinc levels in caries‐active adults
(25–50 years old) vs. caries‐free controls. The researchers suggested that elevated copper and zinc
levels in the caries‐positive group are correlated to the increase in SOD concentration, as copper and
zinc serve as cofactors of the metalloenzyme SOD. Hendi et al. [89] showed that caries‐active group
had higher Px, UA, CAT and GPx compared to the caries‐free group.
In the study of Krawczyk et al. [9], the highest TAC was observed in the group of adolescent
patients who had no decay, and decreased TAC in adolescents and young adults with active carious
lesions, which was consistent with the results of Rahmani et al. [86]. According to the authors, the
reduction of TAS in groups with caries results from the exhaustion of the antioxidant barrier due to
excessive ROS production in response to bacteria‐dependent stimulation of the immune system,
including nicotinamide adenine dinucleotide phosphate oxidase (NADPH). They also observed that
the worsening of oral hygiene status entails a significant decrease in TAS level. However, they did
not demonstrate any correlations between TAS and simplified oral hygiene index (OHI‐S). Dodwad
et al. [81], on the other hand, observed lower TAC values in the group of 7–14‐year‐olds with good
oral hygiene and lack of caries, which they explained by the absence of an infectious challenge in the
form of caries or poor oral hygiene that could initiate an inflammatory response and the subsequent
activation of NADPH oxidase 4 (NOX4) and ROS/RNS production.
A strong antioxidant barrier in saliva or, as Subramanyam et al. [77] suggest, the lack of lipid
degradation processes in the pathogenesis of early childhood caries is the most probable cause of
irrelevant changes in the concentration of lipid peroxidation biomarker in saliva of ECC children.
Sarode et al. [88] reported a significant relationship between MDA concentration in dental caries and
control subjects from higher age groups, which, according to the authors, is the reason for reduced
activity of salivary Px and thus modifications of metabolic activity of bacteria and intensified caries,
as confirmed also by another study which demonstrated that an improvement of oral hygiene results
Appl. Sci. 2020, 10, 6240 12 of 35
leads to decreasing the concentration of thiobarbituric acid reactive substances (TBARS) [76]. Similar
results were obtained by Ahmadi‐Motamayel et al. [20,94] in serum and saliva of 15–19‐year‐old
teenagers with caries. They also demonstrated a higher MDA level in female vs. male saliva, which
may be due to hormonal changes typical of the puberty period as well as lower salivary Px and CAT
activities and UA and TAC concentrations in female group, as observed by Pandey et al. [82] and
Hendi et al. [89].
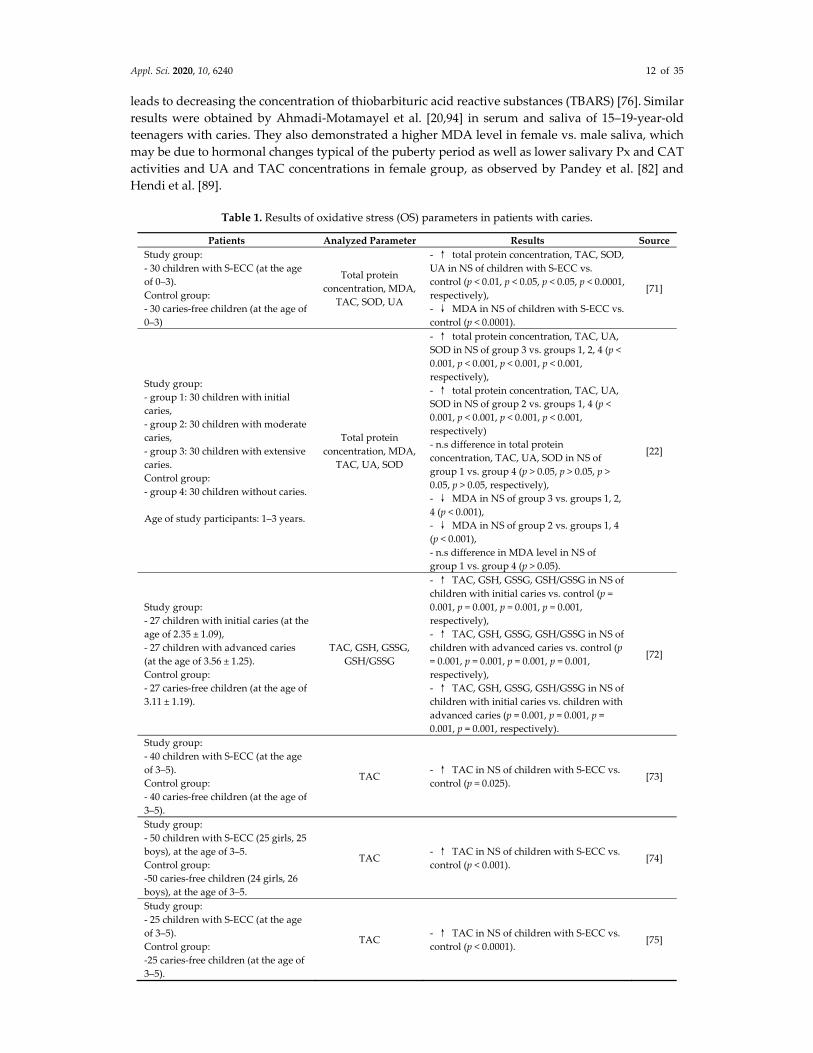
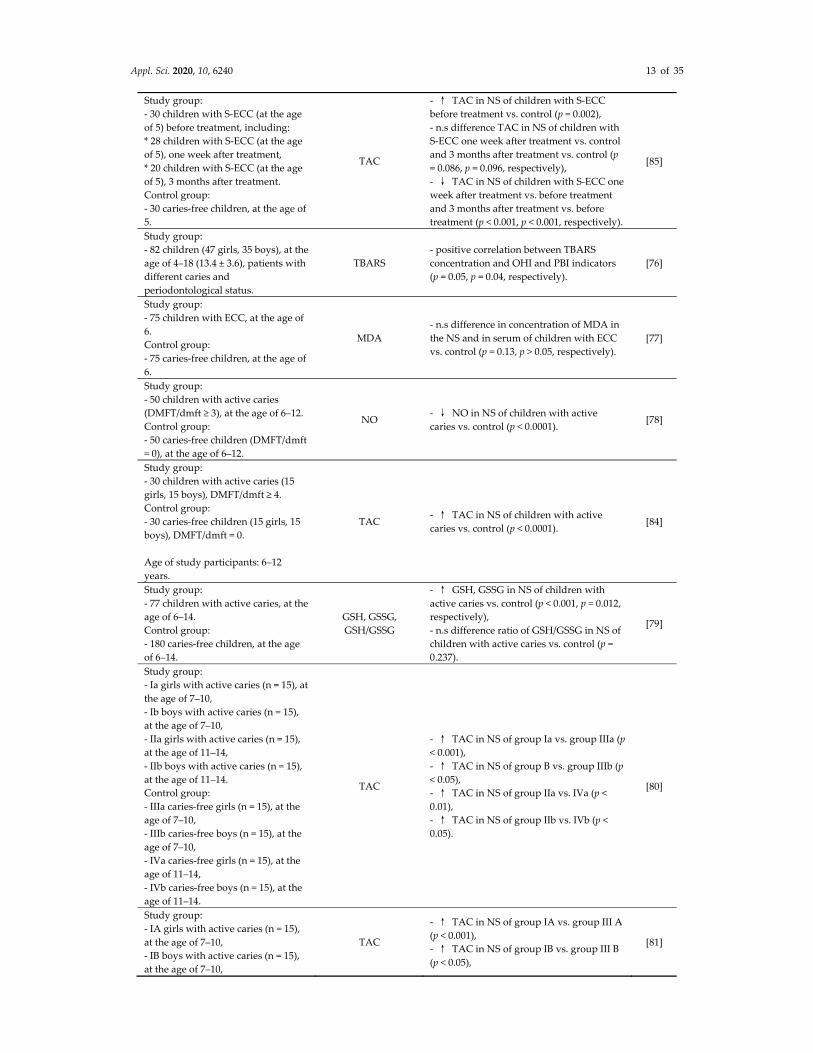
Table 1. Results of oxidative stress (OS) parameters in patients with caries.
Patients Analyzed Parameter Results Source
Study group:
‐ 30 children with S‐ECC (at the age
of 0–3).
Control group:
‐ 30 caries‐free children (at the age of
0–3)
Total protein
concentration, MDA,
TAC, SOD, UA
‐ ↑ total protein concentration, TAC, SOD,
UA in NS of children with S‐ECC vs.
control (p < 0.01, p < 0.05, p < 0.05, p < 0.0001,
respectively),
‐ ↓ MDA in NS of children with S‐ECC vs.
control (p < 0.0001).
[71]
Study group:
‐ group 1: 30 children with initial
caries,
‐ group 2: 30 children with moderate
caries,
‐ group 3: 30 children with extensive
caries.
Control group:
‐ group 4: 30 children without caries.
Age of study participants: 1–3 years.
Total protein
concentration, MDA,
TAC, UA, SOD
‐ ↑ total protein concentration, TAC, UA,
SOD in NS of group 3 vs. groups 1, 2, 4 (p <
0.001, p < 0.001, p < 0.001, p < 0.001,
respectively),
‐ ↑ total protein concentration, TAC, UA,
SOD in NS of group 2 vs. groups 1, 4 (p <
0.001, p < 0.001, p < 0.001, p < 0.001,
respectively)
‐ n.s difference in total protein
concentration, TAC, UA, SOD in NS of
group 1 vs. group 4 (p > 0.05, p > 0.05, p >
0.05, p > 0.05, respectively),
‐ ↓ MDA in NS of group 3 vs. groups 1, 2,
4 (p < 0.001),
‐ ↓ MDA in NS of group 2 vs. groups 1, 4
(p < 0.001),
‐ n.s difference in MDA level in NS of
group 1 vs. group 4 (p > 0.05).
[22]
Study group:
‐ 27 children with initial caries (at the
age of 2.35 ± 1.09),
‐ 27 children with advanced caries
(at the age of 3.56 ± 1.25).
Control group:
‐ 27 caries‐free children (at the age of
3.11 ± 1.19).
TAC, GSH, GSSG,
GSH/GSSG
‐ ↑ TAC, GSH, GSSG, GSH/GSSG in NS of
children with initial caries vs. control (p =
0.001, p = 0.001, p = 0.001, p = 0.001,
respectively),
‐ ↑ TAC, GSH, GSSG, GSH/GSSG in NS of
children with advanced caries vs. control (p
= 0.001, p = 0.001, p = 0.001, p = 0.001,
respectively),
‐ ↑ TAC, GSH, GSSG, GSH/GSSG in NS of
children with initial caries vs. children with
advanced caries (p = 0.001, p = 0.001, p =
0.001, p = 0.001, respectively).
[72]
Study group:
‐ 40 children with S‐ECC (at the age
of 3–5).
Control group:
‐ 40 caries‐free children (at the age of
3–5).
TAC ‐ ↑ TAC in NS of children with S‐ECC vs.
control (p = 0.025). [73]
Study group:
‐ 50 children with S‐ECC (25 girls, 25
boys), at the age of 3–5.
Control group:
‐50 caries‐free children (24 girls, 26
boys), at the age of 3–5.
TAC ‐ ↑ TAC in NS of children with S‐ECC vs.
control (p < 0.001). [74]
Study group:
‐ 25 children with S‐ECC (at the age
of 3–5).
Control group:
‐25 caries‐free children (at the age of
3–5).
TAC ‐ ↑ TAC in NS of children with S‐ECC vs.
control (p < 0.0001). [75]
Appl. Sci. 2020, 10, 6240 13 of 35
Study group:
‐ 30 children with S‐ECC (at the age
of 5) before treatment, including:
* 28 children with S‐ECC (at the age
of 5), one week after treatment,
* 20 children with S‐ECC (at the age
of 5), 3 months after treatment.
Control group:
‐ 30 caries‐free children, at the age of
5.
TAC
‐ ↑ TAC in NS of children with S‐ECC
before treatment vs. control (p = 0.002),
‐ n.s difference TAC in NS of children with
S‐ECC one week after treatment vs. control
and 3 months after treatment vs. control (p
= 0.086, p = 0.096, respectively),
‐ ↓ TAC in NS of children with S‐ECC one
week after treatment vs. before treatment
and 3 months after treatment vs. before
treatment (p < 0.001, p < 0.001, respectively).
[85]
Study group:
‐ 82 children (47 girls, 35 boys), at the
age of 4–18 (13.4 ± 3.6), patients with
different caries and
periodontological status.
TBARS
‐ positive correlation between TBARS
concentration and OHI and PBI indicators
(p = 0.05, p = 0.04, respectively).
[76]
Study group:
‐ 75 children with ECC, at the age of
6.
Control group:
‐ 75 caries‐free children, at the age of
6.
MDA
‐ n.s difference in concentration of MDA in
the NS and in serum of children with ECC
vs. control (p = 0.13, p > 0.05, respectively).
[77]
Study group:
‐ 50 children with active caries
(DMFT/dmft ≥ 3), at the age of 6–12.
Control group:
‐ 50 caries‐free children (DMFT/dmft
= 0), at the age of 6–12.
NO ‐ ↓ NO in NS of children with active
caries vs. control (p < 0.0001). [78]
Study group:
‐ 30 children with active caries (15
girls, 15 boys), DMFT/dmft ≥ 4.
Control group:
‐ 30 caries‐free children (15 girls, 15
boys), DMFT/dmft = 0.
Age of study participants: 6–12
years.
TAC ‐ ↑ TAC in NS of children with active
caries vs. control (p < 0.0001). [84]
Study group:
‐ 77 children with active caries, at the
age of 6–14.
Control group:
‐ 180 caries‐free children, at the age
of 6–14.
GSH, GSSG,
GSH/GSSG
‐ ↑ GSH, GSSG in NS of children with
active caries vs. control (p < 0.001, p = 0.012,
respectively),
‐ n.s difference ratio of GSH/GSSG in NS of
children with active caries vs. control (p =
0.237).
[79]
Study group:
‐ Ia girls with active caries (n = 15), at
the age of 7–10,
‐ Ib boys with active caries (n = 15),
at the age of 7–10,
‐ IIa girls with active caries (n = 15),
at the age of 11–14,
‐ IIb boys with active caries (n = 15),
at the age of 11–14.
Control group:
‐ IIIa caries‐free girls (n = 15), at the
age of 7–10,
‐ IIIb caries‐free boys (n = 15), at the
age of 7–10,
‐ IVa caries‐free girls (n = 15), at the
age of 11–14,
‐ IVb caries‐free boys (n = 15), at the
age of 11–14.
TAC
‐ ↑ TAC in NS of group Ia vs. group IIIa (p
< 0.001),
‐ ↑ TAC in NS of group B vs. group IIIb (p
< 0.05),
‐ ↑ TAC in NS of group IIa vs. IVa (p <
0.01),
‐ ↑ TAC in NS of group IIb vs. IVb (p <
0.05).
[80]
Study group:
‐ IA girls with active caries (n = 15),
at the age of 7–10,
‐ IB boys with active caries (n = 15),
at the age of 7–10,
TAC
‐ ↑ TAC in NS of group IA vs. group III A
(p < 0.001),
‐ ↑ TAC in NS of group IB vs. group III B
(p < 0.05),
[81]
Appl. Sci. 2020, 10, 6240 14 of 35
‐ II A girls with active caries (n = 15),
at the age of 11–14,
‐ II B boys with active caries (n = 15),
at the age of 11–14.
Control group:
‐ III A caries‐free girls (n = 15), at the
age of 7–10,
‐ III B caries‐free (n = 15), at the age
of 7–10,
‐ IV A caries‐free girls (n = 15), at the
age of 11–14,
‐ IV B caries‐free boys (n = 15), at the
age of 11–14.
‐ ↑ TAC in NS of group II A vs. group IV
A (p < 0.01),
‐ ↑ TAC in NS group II B vs. group IV B (p
< 0.05).
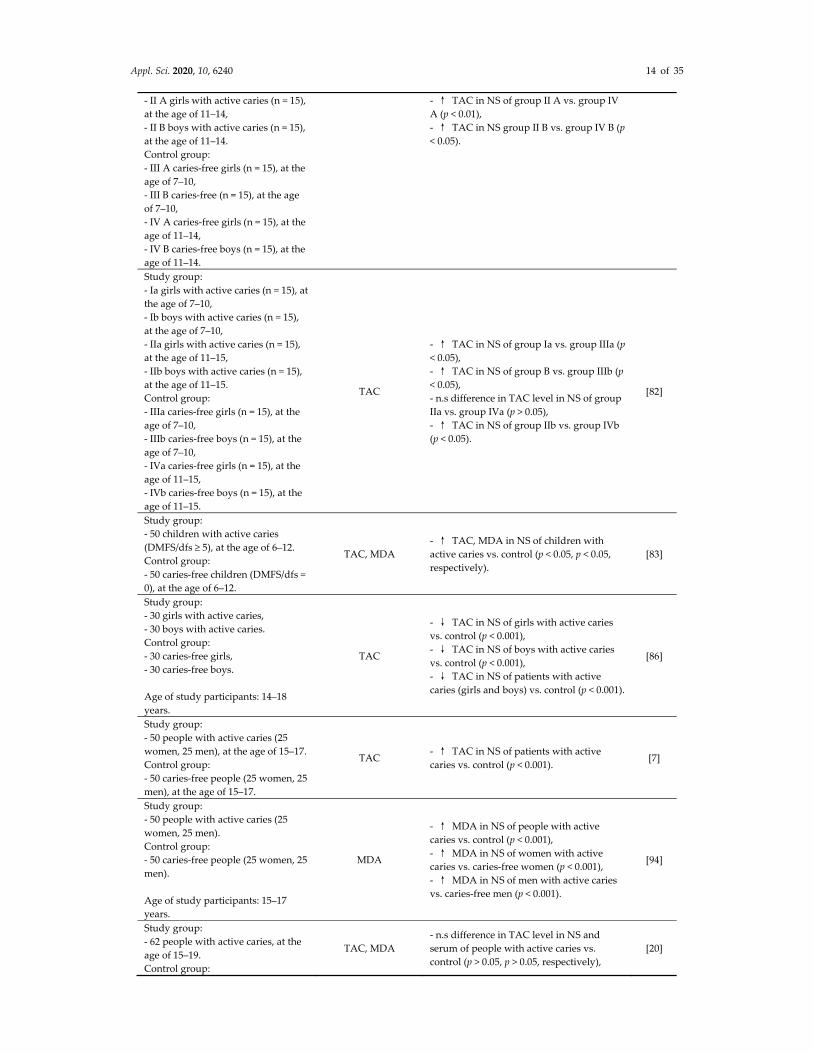
Study group:
‐ Ia girls with active caries (n = 15), at
the age of 7–10,
‐ Ib boys with active caries (n = 15),
at the age of 7–10,
‐ IIa girls with active caries (n = 15),
at the age of 11–15,
‐ IIb boys with active caries (n = 15),
at the age of 11–15.
Control group:
‐ IIIa caries‐free girls (n = 15), at the
age of 7–10,
‐ IIIb caries‐free boys (n = 15), at the
age of 7–10,
‐ IVa caries‐free girls (n = 15), at the
age of 11–15,
‐ IVb caries‐free boys (n = 15), at the
age of 11–15.
TAC
‐ ↑ TAC in NS of group Ia vs. group IIIa (p
< 0.05),
‐ ↑ TAC in NS of group B vs. group IIIb (p
< 0.05),
‐ n.s difference in TAC level in NS of group
IIa vs. group IVa (p > 0.05),
‐ ↑ TAC in NS of group IIb vs. group IVb
(p < 0.05).
[82]
Study group:
‐ 50 children with active caries
(DMFS/dfs ≥ 5), at the age of 6–12.
Control group:
‐ 50 caries‐free children (DMFS/dfs =
0), at the age of 6–12.
TAC, MDA
‐ ↑ TAC, MDA in NS of children with
active caries vs. control (p < 0.05, p < 0.05,
respectively).
[83]
Study group:
‐ 30 girls with active caries,
‐ 30 boys with active caries.
Control group:
‐ 30 caries‐free girls,
‐ 30 caries‐free boys.
Age of study participants: 14–18
years.
TAC
‐ ↓ TAC in NS of girls with active caries
vs. control (p < 0.001),
‐ ↓ TAC in NS of boys with active caries
vs. control (p < 0.001),
‐ ↓ TAC in NS of patients with active
caries (girls and boys) vs. control (p < 0.001).
[86]
Study group:
‐ 50 people with active caries (25
women, 25 men), at the age of 15–17.
Control group:
‐ 50 caries‐free people (25 women, 25
men), at the age of 15–17.
TAC ‐ ↑ TAC in NS of patients with active
caries vs. control (p < 0.001). [7]
Study group:
‐ 50 people with active caries (25
women, 25 men).
Control group:
‐ 50 caries‐free people (25 women, 25
men).
Age of study participants: 15–17
years.
MDA
‐ ↑ MDA in NS of people with active
caries vs. control (p < 0.001),
‐ ↑ MDA in NS of women with active
caries vs. caries‐free women (p < 0.001),
‐ ↑ MDA in NS of men with active caries
vs. caries‐free men (p < 0.001).
[94]
Study group:
‐ 62 people with active caries, at the
age of 15–19.
Control group:
TAC, MDA
‐ n.s difference in TAC level in NS and
serum of people with active caries vs.
control (p > 0.05, p > 0.05, respectively),
[20]
Appl. Sci. 2020, 10, 6240 15 of 35
‐ 57 caries‐free people, at the age of
15–19.
‐ ↑ MDA in NS and serum of people with
active caries vs. control (p = 0.001, p = 0.001,
respectively).
Study group:
‐ group I (n = 25) people with active
caries, DMFT < 3,
‐ group II (n = 25) people with active
caries, DMFT < 10,
‐ group III (n = 25) people with active
caries, DMFT > 10.
Control group:
‐ 25 caries‐free people, DMFT = 0.
Age of study participants: 25–50
years.
TAC
‐ ↑ TAC in NS and serum of group I vs.
control (p < 0.001, p < 0.001, respectively),
‐ ↑ TAC in NS and serum of group II vs.
control (p < 0.001, p < 0.001, respectively),
‐ ↑ TAC in NS and serum of group III vs.
control (p < 0.001, p < 0.001, respectively).
[87]
Study group:
‐ 30 people with active caries (17
women, 13 men), at the age of 17–50.
Control group:
‐ 12 caries‐free people (6 women, 6
men), at the age of 15–60.
MDA ‐ ↑ MDA in NS of people with active
caries vs. control (p < 0.05). [88]
Study group:
‐ 50 people with active caries (25
women, 25 men).
Control group:
‐ 50 caries‐free people (25 women, 25
men).
Age of participants 15–17 years.
SOD, Px, GSH, CAT,
UA
‐ n.s ↑ UA, Px, CAT in NS of people with
active caries vs. control (p = 0.641, p = 0.072,
p = 0.491, respectively),
‐ ↑ GSH in NS of people with active caries
vs. control (p = 0.004),
‐ n.s ↓ SOD in NS of people with active
caries vs. control (p = 0.935),
‐ ↑ CAT in NS of men with active caries
vs. women with active caries (p = 0.042),
‐ ↑ SOD in NS of women with active
caries vs. men with active caries (p <
0.0001).
[89]
Study group:
‐ 60 people with active caries (DMFT
> 10), at the age of 25–50.
Control group:
‐ 20 caries‐free people (DMFT = 0), at
the age of 25–50.
SOD ‐ ↑ SOD in NS of people with active caries
vs. control (p < 0.0001). [90]
Study group:
‐ 204 people with different DMFT
(128 women, 76 men), at the age of
19–83 (41.8 ± 14.5), including:
* group I (CI = 0)—without caries
(control group),
* group II (CI = 1)—caries within the
enamel and dentin,
* group III (CI = 2)—extensive dentin
caries.
AOPP
‐ n.s ↑ AOPP in NS of group II vs. group I
(p > 0.05),
‐ ↓ AOPP in NS of group III vs. group II
(p < 0.05).
[93]
AOPP—advanced oxidation protein products; CAT—catalase; CI—caries index; DMFT—number of
decayed, missing and filled teeth; ECC—early childhood caries; GSH—reduced glutathione; GSSG—
glutathione disulfide; MDA—malondialdehyde; ns—nonsignificant; NO—nitric oxide; NS‐
nonstimulated saliva; OHI—oral hygiene index; PBI—papilla bleeding index; Px—salivary
peroxidase; S‐ECC—severe early childhood caries; SOD—superoxide dismutase; TAC—total
antioxidant capacity; TBARS—thiobarbituric acid reactive substances; UA—uric acid. ↑ increase,
↓ decrease
8. Periodontitis
Periodontitis is a multifactorial degenerative disease associated with inflammation involving a
group of tissues surrounding the dental cervix and root of the tooth [21,106]. Its prevalence today
ranges from 10% to 15% of the world’s population, which makes periodontitis the most common oral
disease [21,107]. The cause of periodontitis is oral colonization by specific pathogenic bacteria
Appl. Sci. 2020, 10, 6240 16 of 35
(Aggregatibacter actinomycetemcomitans, Porphyromonas gingivalis, Prevotella intermedia and
Fusobacterium nucleatum), which may both directly and indirectly lead to the destruction of
periodontal tissues [13,25,108]. The factors predisposing to periodontitis also include genetic
predisposition, smoking, poor oral hygiene and eating disorders [31]. It is noteworthy that the
discussed disease can be divided into chronic (CP) and aggressive (AgP) periodontitis. Both forms
have similar clinical manifestations, but they differ in the progression rate, pattern of periodontal
breakdown and clinical symptoms of inflammation.
It is known that the dominant inflammatory cells in the healthy connective tissue of the gingiva
and gingival epithelium are polymorphonuclear leukocytes (PMNs). Under normal conditions these
cells provide effective antimicrobial mechanisms. In the presence of intensified or persistent
inflammatory reaction, they adversely affect the surrounding tissues, also through OS. In response
to microbial plaque, gingival epithelial cells produce an adaptive immune response and secrete the
chemotaxis factor for neutrophils, antimicrobial biomolecules and pro‐inflammatory cytokines.
PMNs are activated, the respiratory processes stimulated and production of ROS, RNS, and non‐free
radicals increased [109]. It has been evidenced that oxygen and nitrogen radicals derived from
activated PMNs are resistant to antioxidant enzymes produced by Prophyromonas gingivalis, which
is considered one of the causes of periodontal tissue destruction [12].
At present, it is still unclear whether the occurrence of OS in the course of periodontal disease is
caused by a lack of antioxidants or overproduction of ROS/RNS due to inflammation. The
examination of OS parameters in the course of periodontitis appears even more justified because
there is evidence of successful treatment of the disease with antioxidants that slow down and prevent
the progression of inflammation [110–114].
The search for potential biomarkers of periodontitis is advisable because traditional clinical
measurements, such as pocket depth probing, bleeding on probing and the clinical attachment level
are used for the diagnosis of periodontal disease, but they neither evaluate the activity of the disease
nor present any prognostic value.
As mentioned earlier, the body has a wide range of antioxidants than can be used in response to
increased production of ROS/RNS and non‐free radicals. Among them, researchers evaluating the
redox balance in the course of periodontal diseases mostly focus on glutathione reductase (GR), SOD,
CAT, Px, myeloperoxidase, UA, GSH, melatonin and TAC/TAS. The results of these studies, although
often contradictory, univocally indicate that the antioxidant balance and thus the redox balance of
saliva is disturbed in the course of periodontal diseases. Trivedi et al. [115] showed lower activity of
SOD, CAT and GR in the saliva samples of CP patients compared to healthy controls. These authors
demonstrated that the activity of the said enzymes was negatively correlated with clinical parameters
evaluating periodontal disease severity, such as pocket depth (PD), clinical attachment loss (CAL),
gingival index (GI) and plaque index (PI). According to the researchers, these correlations indicate
that antioxidants may have worn out or been oxidatively modified in the process of ROS elimination,
which led to their deficiency and at the same time destruction of periodontal tissues. Similarly, lower
values of salivary UA, TAC and GPx activity in the group of patients with CP vs. the control were
demonstrated by Miricescu et al. [116]. These authors did not confirm the relationship between the
salivary antioxidant defense system and parameters determining the clinical status of patients, but
identified the relationship between antioxidant markers and bone‐loss parameters in the saliva.
Karim et al. [117] observed that SOD activity and thiol antioxidant concentration significantly
increased after treatment in the gingivitis and periodontitis group, which suggests a positive
response to nonsurgical therapy. They also noticed that increased severity of periodontitis was
associated with gradual decrease in antioxidant concentration. However, it should be noted that SOD
activity as well as thiol concentration both before and after the applied nonsurgical treatment was
lower in both mentioned groups than in the control group, and higher in the gingivitis group than in
periodontitis patients, which indicates that antioxidant activity/concentration is evidently
progressively decreasing from healthy subjects to patients with gingivitis and periodontitis.
On the other hand, Villa‐Correa et al. [118] demonstrated significantly higher GR activity in the
saliva of AgP and CP patients compared to the controls, and considerably higher in the saliva of AgP
Appl. Sci. 2020, 10, 6240 17 of 35
subjects vs. those with CP. The authors also observed a positive correlation between GR activity and
PD and CAL as well as extent and severity of periodontal breakdown. Based on the performed
analyses, the researchers assumed that ROS production results in increased GR activity, which is
related to the inflammatory signaling pathway of periodontitis, as was confirmed by previously
published papers [115,119]. According to the authors, given that the aging process is accompanied
by low‐grade inflammation whose triggering mechanism is redox imbalance, aging could increase
the degree of periodontal breakdown in a situation of increased GR activity. Wei et al. [120] and Yang
et al. [121] showed higher activity of SOD, and Meschiari et al. [122] higher activity of
myeloperoxidase (MPO) in the saliva of CP patients vs. the control. The authors claimed that
increased activity of these enzymes was related to periodontitis severity and oral health behaviors.
According to Wei et al. [120] and Novakovic et al. [123], nonsurgical therapy (oral hygiene instruction,
scaling and root surface debridement) seems to restore and control the antioxidant capacity by
decreasing SOD activity, simultaneously increasing TAC and UA concentration as well as GPx
activity to the level observed in the control group. It should be noted that SOD activity before the
therapy was positively correlated with PD, CAL, GI, gingival bleeding index (GBI) and PI. Similar
higher activity of manganese SOD (MnSOD), copper/zinc SOD (CuZnSOD) and CAT as well as
positive correlations between the activity of the studied antioxidant enzymes (CAT, CuZnSOD) and
clinical status parameters (BOP, PI, PD) of patients with periodontal disease were observed by Lee et
al. [124]. It should be highlighted that these results were obtained only in the early stage of the
inflammatory response. Interestingly, the activity of CuZnSOD and CAT considerably increased with
the percentage of sites with PD > 4 mm, whereas the relation between salivary activity of MnSOD
and periodontal clinical parameters was nonsignificant.
Melatonin shows a wide spectrum of activity, including osteopromotive, antioxidant, anti‐
inflammatory and immunomodulating effects. It is even believed that melatonin can act as a potent
antioxidant‐enhancing mechanism that prevents periodontal disease [18]. In two studies, melatonin
concentration was significantly lower in the saliva of periodontitis patients compared to healthy
controls: by Almughrabi et al. [125] and Srinath et al. [126]; and in one study this relationship was
not statistically relevant [18]. Interestingly, the study of Almughrabi et al. [125] revealed that elevated
concentration of melatonin was related to healthy status or low inflammation (gingivitis) but not to
periodontal destruction (periodontitis). The results of these authors showed no statistically
significant differences between CP and AgP patients. They claimed that melatonin can be added to
the list of saliva biomarkers used in the differential diagnosis of periodontal disease typically
accompanied by bone loss and other periodontal disorders without loss of attachment (gingivitis).
The authors also emphasized that reduced salivary melatonin concentration, in addition to
aggravating periodontal tissue destruction, may be the cause of depression or insomnia typical of
periodontitis.
It is widely recognized that TAC is one of the most reliable markers to assess the behavior of
antioxidants in OS prevention. Although there are contradictory results for TAC, the general
assumption is that salivary TAC decreases in the course of periodontitis. The results of only one
publication indicated that inflammation accompanying periodontal disease does not affect the
antioxidant balance of saliva measured based on TAC [7]. Acquier et al. [13] demonstrated that the
level of nonenzymatic antioxidants, measured as total radical trapping antioxidant potential (TRAP),
was elevated in AgP and CP vs. healthy controls, which indicated the response of the antioxidant
barrier to increased production of free radicals. However, patients with AgP showed higher levels of
salivary ROS, which was closely associated with CAL and PD, and lower levels of salivary TRAP vs
CP. According to the authors, a lower increment of TRAP in the AgP group is unable to maintain the
redox balance and the production of ROS exceeds the salivary antioxidant capacity, which results in
more severe damage to periodontal tissues during this form of periodontitis. Miricescu et al. [116],
Zhang et al. [127], Baser et al. [128], Baňasová et al. [129] and Toczewska et al. [130] observed lower
TAC in CP patients compared to the control. Similar relationships in CP patients were obtained by
Baltacıoğlu et al. [131], with TAC values in AgP subjects significantly lower compared to the controls
and CP group. Toczewska et al. [130] divided patients into two subgroups based on the severity of
Appl. Sci. 2020, 10, 6240 18 of 35
periodontitis, and found significantly lower TAS and ferric‐reducing ability of plasma (FRAP) in
nonstimulated and stimulated whole saliva vs. the control. However, neither TAC nor FRAP
differentiated individual stages of periodontitis. Baser et al. [128] did not observe any differences in
salivary TAC between AgP and CP patients or between AgP and the control. Zhang et al. [127]
demonstrated a significant negative correlation between TAC and CAL and only a tendency of
negative relationship between salivary TAC and BOP, while Tóthová et al. [76] showed that TAC was
partially determined by OHI and PBI. These relationships suggest that salivary TAC correlates
negatively with the severity of inflammation in the course of periodontal disease, which confirms a
significant increase of TAC after periodontal tissue healing in response to nonsurgical treatment
[123]. Contrary to the abovementioned studies, Toczewska et al. [130] did not observe any
correlations between TAC in nonstimulated saliva or any clinical parameter in stimulated saliva, only
a weak negative correlation with PI. Zhang et al. [127] also observed that high bacterial load was
positively associated with PD and BOP but presented no dependence on salivary TAS and TOS. The
researchers claimed that, according to their observation, changes in the salivary antioxidant potential
depend on the inflammatory response, and not on enhanced bacterial load. Almerich‐Silla et al. [21]
proved that the combination of Treponema denticola, Tannerella forsythia and Porphyromona
gingivalis produced significantly higher TAC as well as oxidative stress levels measured as MDA
and 8‐hydroxy‐2‐deoxyguanosine (8‐OHdG) concentration.
One of the examined parameters to evaluate the degree of oxidative damage were lipid
peroxidation markers. Önder et al. [132] found that MDA concentration was significantly elevated in
the saliva of CP patients compared to periodontically healthy controls, which is consistent with the
results of other studies [13,21,115,116,129,130,133,134]. However, lipid peroxidation measured as
TBARS was significantly higher in the AgP group compared to CP patients [13]. Önder et al. [132]
also noticed that MDA concentration in saliva, which was elevated compared to that in serum,
indicated a more substantial local enhancement in lipid peroxidation in the periodontitis area.
Interestingly, salivary 4‐HNE concentration did not reveal any differences between CP and the
control group, which the authors explained by dual functions of 4‐HNE [132]. On the one hand, 4‐
HNE may prove increased oxidative lipid destruction; on the other hand, its intensified synthesis
may induce an increase in leukocyte count and production of pro‐inflammatory prostaglandins and
leukotrienes [135]. Another important fact is that numerous studies have shown a positive
relationship between the concentration of lipid peroxidation products and the clinical status of
patients [13,76,115,120,129,132] as well as a significant reduction in MDA concentration after
nonsurgical therapy [132]. Interestingly, in the study by Acquier et al. [13], the abovementioned
correlations were found only in the AgP group and not in CP patients, which suggests that OS leads
to higher intensity of tissue damage in the course of AgP. In the CP group, significant positive
correlations were observed between MDA concentration in the saliva and the level of C‐terminal
telopeptide of type I collagen, i.e., a collagen‐related degradation marker used for the assessment of
bone resorption [116]. Baňasová et al. [129] observed a higher concentration of TBARS in the saliva
of CP males vs. the control, and a similar—but not statistically significant—trend was observed in
females. In our opinion, due to very few women (14 in the CP, 8 in the control group) and men (9 in
the CP, 11 in the control group) in both groups, drawing such conclusions is burdened with high risk.
As salivary advanced oxidation protein products (AOPP) and advanced glycation end products
(AGEs) (markers of carbonyl stress) were not statistically different between the CP and control
groups, Baňasová et al. [129] claimed that lipid peroxidation, not protein oxidation or glycation, is a
key mechanism of oxidative damage to periodontal tissues in the course of periodontitis, which is
consistent with the results of Baltacıoğlu et al. [24]. Although protein carbonyl concentration (PC,
another marker of protein oxidation) in the saliva was significantly higher in the CP vs. AgP group,
salivary PC values in the CP as well as AgP patients did not differ from periodontically healthy
individuals. Moreover, Tóthová et at. [76] did not find any correlations between salivary AOPP and
AGE and PBI in adults as well as children.
The results of Wei et al. [120] are in conflict with the above, although their compatibility should
be noted in connection with a positive correlation of MDA with clinical parameters. The authors
Appl. Sci. 2020, 10, 6240 19 of 35
observed significant changes of MDA in gingival crevicular fluid (GCF) but not in the serum and
saliva of CP patients regardless of the therapy, which—according to them—proves that lipid
peroxidation level of GCF is qualitatively and quantitively distinct form that in serum and saliva.
They also noticed that MDA concentration in GCF was significantly higher than in the saliva,
presumably due to the presence of a large number of activated PMNs, which in turn contributed to
the higher myeloperoxidase activity [56].
It appears that during the last 10 years the most frequently evaluated DNA oxidative damage
parameter was 8‐OHdG marker. In the vast majority of publications, the concentration of 8‐OHdG in
the saliva of patients with periodontal disease was significantly higher than in the control group
[21,116,132,136–139], and higher 8‐OHdG content was observed in the saliva of CP patients compared
to the chronic gingivitis group as well as periodontically healthy individuals. However, no
differences were demonstrated between gingivitis patients and healthy controls, which was
explained by the fact that the inflammation is not sufficient for significant increase of salivary 8‐
OHdG. Raised salivary 8‐OHdG concentration had a strong relationship with the clinical condition
of periodontitis patients (CAL, PPD) [136,138] and not with PI or GI [136]. The researchers also found
that 8‐OHdG in CP patients with CAL > 3 mm was considerably elevated compared to CP patients
with CAL < 3 mm. 8‐OHdG concentration in the saliva of CP patients with CAL < 3 mm did not differ
from its content in patients with chronic gingivitis and the controls. The conclusion is that if CAL is
the most important parameter for detecting the severity of periodontitis, 8‐OHdG may determine the
disease activity. Miricescu et al. [116] were unable to establish any significant relationship between
8‐OHdG concentration and clinical parameters or bone resorption markers, which partly coincides
with the results of Dede et al. [140] and Zamora‐Perez et al. [137], who compared salivary 8‐OHdG
concentration according to the severity of periodontitis. They found that CP and AgP groups showed
significantly higher salivary 8‐OHdG compared to the control, and AgP group presented
considerably higher values of these parameters than CP individuals. Almerich‐Silla et al. [21] found
that the presence of Porphyromonas gingivalis, Treponema denticola and Tannerella forsythia was
strongly related to the increase of 8‐OHdG concentration in the saliva of CP patients, which naturally
results from the bacteria‐dependent intensity of inflammation, ROS production and oxidative
degeneration of periodontal tissue. Önder et al. [132] claimed that a positive correlation between
clinical parameters before and after treatment (PI, GI, PPD, CAL, BOP) as well as significant reduction
of salivary concentration of 8‐OHdG after nonsurgical treatment proves that salivary 8‐OHdG may
be a marker of inflammation in the course of chronic periodontitis. Similar results were obtained by
Anusuya et al. [12] who also observed a negative correlation between 8‐OHdG and PPD and CAL,
and a positive one with BOP after 8 weeks of nonsurgical treatment, which—according to them—
confirms that salivary 8‐OHdG could be a marker assessing the effect of a periodontal therapy.
Conversely, the data presented by Dede et al. [140] did not reveal any significant differences in
8‐OHdG concentration between CP and the control or any decrease in salivary 8‐OHdG after a
periodontal therapy in CP patients. However, the authors emphasized that, unlike in other
publications, their results concern patients with more localized periodontal tissue destruction and it
is highly probable that these conditions do not affect salivary parameters.
As the determination of individual oxidants in the sample would be too expensive and labor‐
consuming and their effect would add up, the test measuring TOS was developed [141]. The results
of studies using TOS measurement mostly indicate a significant increase in the concentration of
salivary oxidants in patients with periodontal disease compared to the controls. Tripathi et al. [134],
Wei et al. [120], Baltacıoğlu et al. [131] and Toczewska et al. [130] showed higher TOS in the saliva of
periodontitis patients vs. the control, and a significantly higher salivary TOS was observed in AgP
vs. CP patients [130,134]. According to Toczewska et al. [130], TOS in nonstimulated and stimulated
saliva could not be helpful in differentiating individual stages of periodontitis. Moreover, Wei et al.
[120] noticed that TOS in the saliva of CP subjects was positively correlated with clinical parameters
before the therapy, was reduced compared to basal levels before non‐surgical treatment and
presented no difference compared to the control group. Toczewska et al. [130] observed a positive
correlation between TOS in nonstimulated and stimulated saliva and a number of teeth in
Appl. Sci. 2020, 10, 6240 20 of 35
periodontitis patients in general as well as in patients with stage IV periodontitis. Interestingly, in
stimulated saliva TOS was higher compared to NS and GCF, which is probably due to the fact that
the parotid glands are the main source of ROS in the oral cavity [142]. In contrast to the above studies,
Zhang et al. [127] did not find any significant discrepancies in the salivary TOS between periodontitis
patients and the control. However, the high percentage of smokers in both compared groups may
have distorted the results. Moreover, TOS demonstrated no correlation with clinical parameters and
bacterial load.
Few publications from the last 10 years have investigated the issue of nitrosative stress in the
saliva of people with periodontal disease. Some studies found higher level of nitrosative stress
biomarkers in CP patients compared to the healthy control [143–145], while other researchers
observed the opposite [146–148]. One publication showed no change in nitrite and nitrate levels in
nonstimulated saliva of patients with CP and gingivitis vs. the control [149]. Interestingly, in the latter
case the authors demonstrated a significant increase in nitrate/nitrite ratio in the saliva of CP and
gingivitis patients compared to healthy controls. The concentration of NO decreased after applying
nonsurgical treatment of periodontitis [144], whereas the results of Meschiari et al. [146] revealed
decreased nitrite concentration only in erythrocytes and not in serum or saliva. Toczewska et al. [143]
observed no correlation between NO, S‐nitrosothiols, peroxynitrite and parameters assessing the
clinical condition of periodontium, which explains their short‐duration activity and the effect of other
external factors on the oral cavity. The levels of NO metabolites depend on gender, being higher in
the saliva of male compared to female patients [150]. Andrukhov et al. [148] noted that men with
periodontitis show lower NO levels in saliva compared to women. These results suggest that gender
may influence NO production in the course of periodontitis. Interestingly, Han et al. [151] observed
a relationship between NO and the development of periodontitis only in women. All datas regarding
periodontitis and oxidative stress are summarized in Table 2.
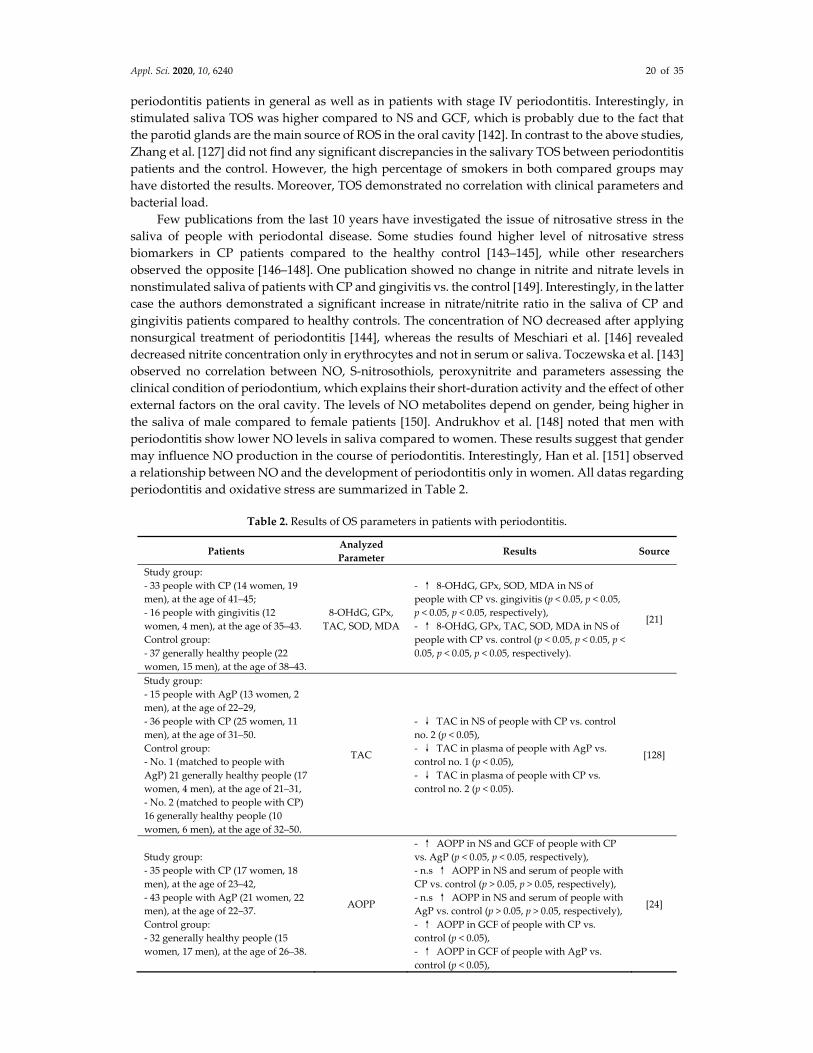
Table 2. Results of OS parameters in patients with periodontitis.
Patients Analyzed
Parameter Results Source
Study group:
‐ 33 people with CP (14 women, 19
men), at the age of 41–45;
‐ 16 people with gingivitis (12
women, 4 men), at the age of 35–43.
Control group:
‐ 37 generally healthy people (22
women, 15 men), at the age of 38–43.
8‐OHdG, GPx,
TAC, SOD, MDA
‐ ↑ 8‐OHdG, GPx, SOD, MDA in NS of
people with CP vs. gingivitis (p < 0.05, p < 0.05,
p < 0.05, p < 0.05, respectively),
‐ ↑ 8‐OHdG, GPx, TAC, SOD, MDA in NS of
people with CP vs. control (p < 0.05, p < 0.05, p <
0.05, p < 0.05, p < 0.05, respectively).
[21]
Study group:
‐ 15 people with AgP (13 women, 2
men), at the age of 22–29,
‐ 36 people with CP (25 women, 11
men), at the age of 31–50.
Control group:
‐ No. 1 (matched to people with
AgP) 21 generally healthy people (17
women, 4 men), at the age of 21–31,
‐ No. 2 (matched to people with CP)
16 generally healthy people (10
women, 6 men), at the age of 32–50.
TAC
‐ ↓ TAC in NS of people with CP vs. control
no. 2 (p < 0.05),
‐ ↓ TAC in plasma of people with AgP vs.
control no. 1 (p < 0.05),
‐ ↓ TAC in plasma of people with CP vs.
control no. 2 (p < 0.05).
[128]
Study group:
‐ 35 people with CP (17 women, 18
men), at the age of 23–42,
‐ 43 people with AgP (21 women, 22
men), at the age of 22–37.
Control group:
‐ 32 generally healthy people (15
women, 17 men), at the age of 26–38.
AOPP
‐ ↑ AOPP in NS and GCF of people with CP
vs. AgP (p < 0.05, p < 0.05, respectively),
‐ n.s ↑ AOPP in NS and serum of people with
CP vs. control (p > 0.05, p > 0.05, respectively),
‐ n.s ↑ AOPP in NS and serum of people with
AgP vs. control (p > 0.05, p > 0.05, respectively),
‐ ↑ AOPP in GCF of people with CP vs.
control (p < 0.05),
‐ ↑ AOPP in GCF of people with AgP vs.
control (p < 0.05),
[24]
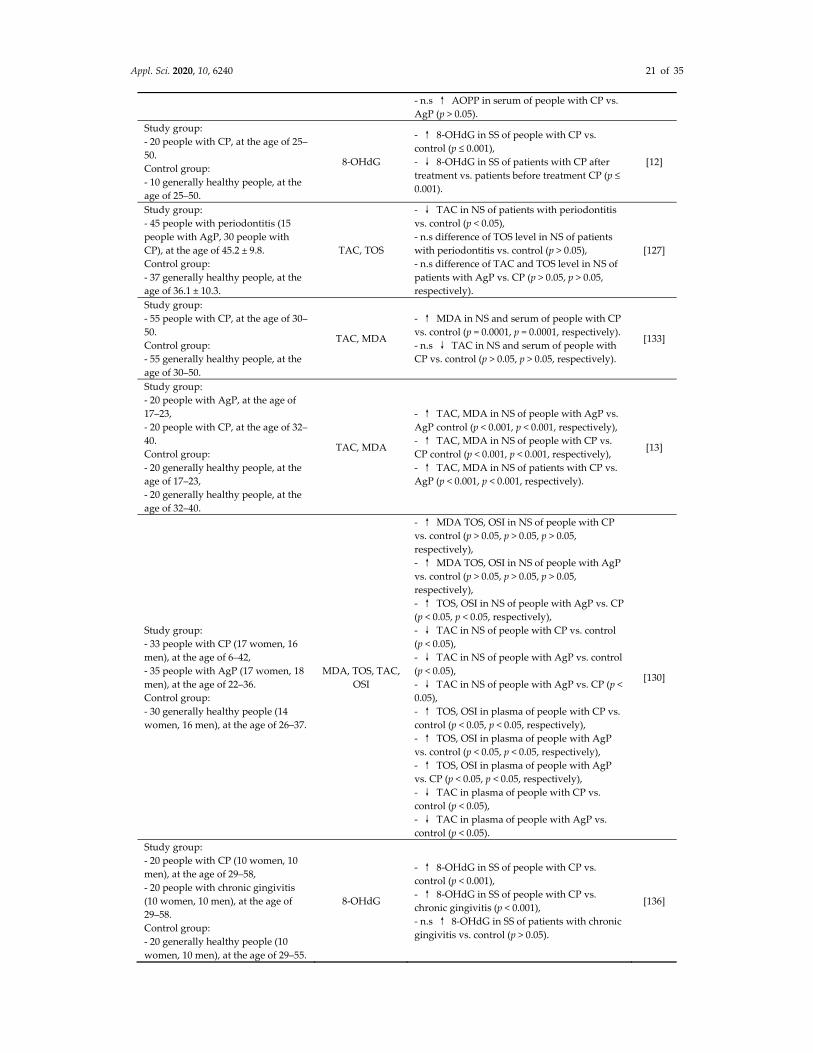
Appl. Sci. 2020, 10, 6240 21 of 35
‐ n.s ↑ AOPP in serum of people with CP vs.
AgP (p > 0.05).
Study group:
‐ 20 people with CP, at the age of 25–
50.
Control group:
‐ 10 generally healthy people, at the
age of 25–50.
8‐OHdG
‐ ↑ 8‐OHdG in SS of people with CP vs.
control (p ≤ 0.001),
‐ ↓ 8‐OHdG in SS of patients with CP after
treatment vs. patients before treatment CP (p ≤
0.001).
[12]
Study group:
‐ 45 people with periodontitis (15
people with AgP, 30 people with
CP), at the age of 45.2 ± 9.8.
Control group:
‐ 37 generally healthy people, at the
age of 36.1 ± 10.3.
TAC, TOS
‐ ↓ TAC in NS of patients with periodontitis
vs. control (p < 0.05),
‐ n.s difference of TOS level in NS of patients
with periodontitis vs. control (p > 0.05),
‐ n.s difference of TAC and TOS level in NS of
patients with AgP vs. CP (p > 0.05, p > 0.05,
respectively).
[127]
Study group:
‐ 55 people with CP, at the age of 30–
50.
Control group:
‐ 55 generally healthy people, at the
age of 30–50.
TAC, MDA
‐ ↑ MDA in NS and serum of people with CP
vs. control (p = 0.0001, p = 0.0001, respectively).
‐ n.s ↓ TAC in NS and serum of people with
CP vs. control (p > 0.05, p > 0.05, respectively).
[133]
Study group:
‐ 20 people with AgP, at the age of
17–23,
‐ 20 people with CP, at the age of 32–
40.
Control group:
‐ 20 generally healthy people, at the
age of 17–23,
‐ 20 generally healthy people, at the
age of 32–40.
TAC, MDA
‐ ↑ TAC, MDA in NS of people with AgP vs.
AgP control (p < 0.001, p < 0.001, respectively),
‐ ↑ TAC, MDA in NS of people with CP vs.
CP control (p < 0.001, p < 0.001, respectively),
‐ ↑ TAC, MDA in NS of patients with CP vs.
AgP (p < 0.001, p < 0.001, respectively).
[13]
Study group:
‐ 33 people with CP (17 women, 16
men), at the age of 6–42,
‐ 35 people with AgP (17 women, 18
men), at the age of 22–36.
Control group:
‐ 30 generally healthy people (14
women, 16 men), at the age of 26–37.
MDA, TOS, TAC,
OSI
‐ ↑ MDA TOS, OSI in NS of people with CP
vs. control (p > 0.05, p > 0.05, p > 0.05,
respectively),
‐ ↑ MDA TOS, OSI in NS of people with AgP
vs. control (p > 0.05, p > 0.05, p > 0.05,
respectively),
‐ ↑ TOS, OSI in NS of people with AgP vs. CP
(p < 0.05, p < 0.05, respectively),
‐ ↓ TAC in NS of people with CP vs. control
(p < 0.05),
‐ ↓ TAC in NS of people with AgP vs. control
(p < 0.05),
‐ ↓ TAC in NS of people with AgP vs. CP (p <
0.05),
‐ ↑ TOS, OSI in plasma of people with CP vs.
control (p < 0.05, p < 0.05, respectively),
‐ ↑ TOS, OSI in plasma of people with AgP
vs. control (p < 0.05, p < 0.05, respectively),
‐ ↑ TOS, OSI in plasma of people with AgP
vs. CP (p < 0.05, p < 0.05, respectively),
‐ ↓ TAC in plasma of people with CP vs.
control (p < 0.05),
‐ ↓ TAC in plasma of people with AgP vs.
control (p < 0.05).
[130]
Study group:
‐ 20 people with CP (10 women, 10
men), at the age of 29–58,
‐ 20 people with chronic gingivitis
(10 women, 10 men), at the age of
29–58.
Control group:
‐ 20 generally healthy people (10
women, 10 men), at the age of 29–55.
8‐OHdG
‐ ↑ 8‐OHdG in SS of people with CP vs.
control (p < 0.001),
‐ ↑ 8‐OHdG in SS of people with CP vs.
chronic gingivitis (p < 0.001),
‐ n.s ↑ 8‐OHdG in SS of patients with chronic
gingivitis vs. control (p > 0.05).
[136]
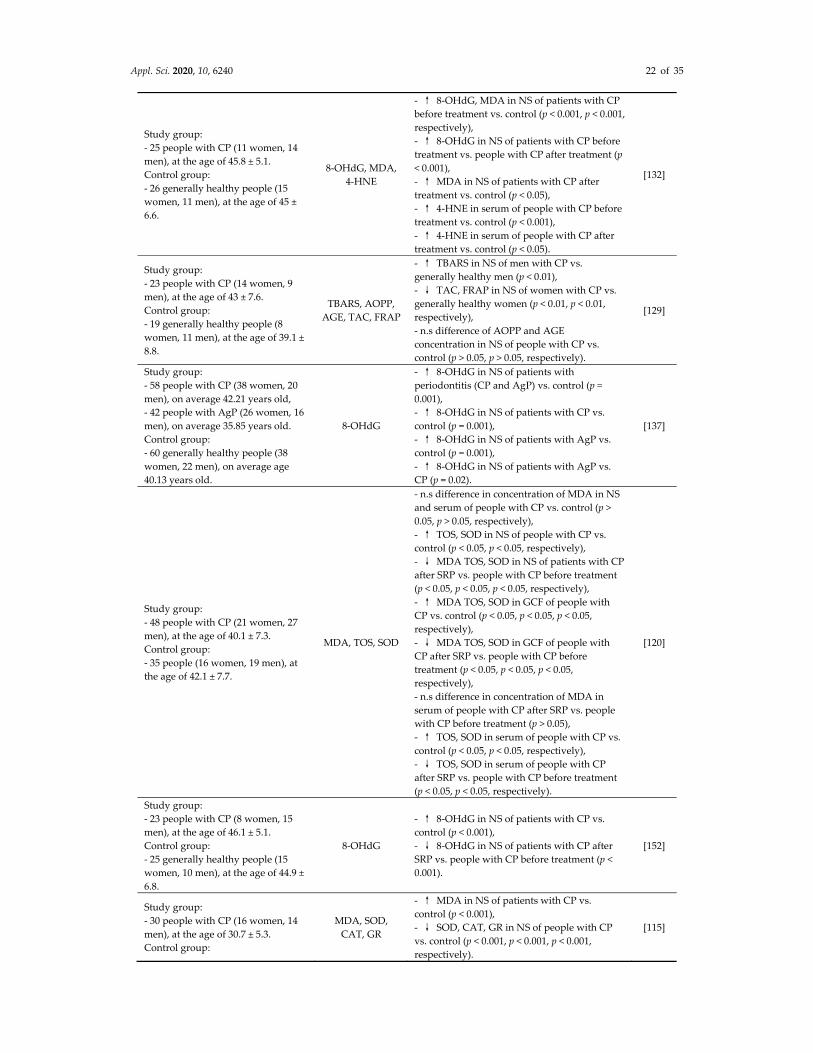
Appl. Sci. 2020, 10, 6240 22 of 35
Study group:
‐ 25 people with CP (11 women, 14
men), at the age of 45.8 ± 5.1.
Control group:
‐ 26 generally healthy people (15
women, 11 men), at the age of 45 ±
6.6.
8‐OHdG, MDA,
4‐HNE
‐ ↑ 8‐OHdG, MDA in NS of patients with CP
before treatment vs. control (p < 0.001, p < 0.001,
respectively),
‐ ↑ 8‐OHdG in NS of patients with CP before
treatment vs. people with CP after treatment (p
< 0.001),
‐ ↑ MDA in NS of patients with CP after
treatment vs. control (p < 0.05),
‐ ↑ 4‐HNE in serum of people with CP before
treatment vs. control (p < 0.001),
‐ ↑ 4‐HNE in serum of people with CP after
treatment vs. control (p < 0.05).
[132]
Study group:
‐ 23 people with CP (14 women, 9
men), at the age of 43 ± 7.6.
Control group:
‐ 19 generally healthy people (8
women, 11 men), at the age of 39.1 ±
8.8.
TBARS, AOPP,
AGE, TAC, FRAP
‐ ↑ TBARS in NS of men with CP vs.
generally healthy men (p < 0.01),
‐ ↓ TAC, FRAP in NS of women with CP vs.
generally healthy women (p < 0.01, p < 0.01,
respectively),
‐ n.s difference of AOPP and AGE
concentration in NS of people with CP vs.
control (p > 0.05, p > 0.05, respectively).
[129]
Study group:
‐ 58 people with CP (38 women, 20
men), on average 42.21 years old,
‐ 42 people with AgP (26 women, 16
men), on average 35.85 years old.
Control group:
‐ 60 generally healthy people (38
women, 22 men), on average age
40.13 years old.
8‐OHdG
‐ ↑ 8‐OHdG in NS of patients with
periodontitis (CP and AgP) vs. control (p =
0.001),
‐ ↑ 8‐OHdG in NS of patients with CP vs.
control (p = 0.001),
‐ ↑ 8‐OHdG in NS of patients with AgP vs.
control (p = 0.001),
‐ ↑ 8‐OHdG in NS of patients with AgP vs.
CP (p = 0.02).
[137]
Study group:
‐ 48 people with CP (21 women, 27
men), at the age of 40.1 ± 7.3.
Control group:
‐ 35 people (16 women, 19 men), at
the age of 42.1 ± 7.7.
MDA, TOS, SOD
‐ n.s difference in concentration of MDA in NS
and serum of people with CP vs. control (p >
0.05, p > 0.05, respectively),
‐ ↑ TOS, SOD in NS of people with CP vs.
control (p < 0.05, p < 0.05, respectively),
‐ ↓ MDA TOS, SOD in NS of patients with CP
after SRP vs. people with CP before treatment
(p < 0.05, p < 0.05, p < 0.05, respectively),
‐ ↑ MDA TOS, SOD in GCF of people with
CP vs. control (p < 0.05, p < 0.05, p < 0.05,
respectively),
‐ ↓ MDA TOS, SOD in GCF of people with
CP after SRP vs. people with CP before
treatment (p < 0.05, p < 0.05, p < 0.05,
respectively),
‐ n.s difference in concentration of MDA in
serum of people with CP after SRP vs. people
with CP before treatment (p > 0.05),
‐ ↑ TOS, SOD in serum of people with CP vs.
control (p < 0.05, p < 0.05, respectively),
‐ ↓ TOS, SOD in serum of people with CP
after SRP vs. people with CP before treatment
(p < 0.05, p < 0.05, respectively).
[120]
Study group:
‐ 23 people with CP (8 women, 15
men), at the age of 46.1 ± 5.1.
Control group:
‐ 25 generally healthy people (15
women, 10 men), at the age of 44.9 ±
6.8.
8‐OHdG
‐ ↑ 8‐OHdG in NS of patients with CP vs.
control (p < 0.001),
‐ ↓ 8‐OHdG in NS of patients with CP after
SRP vs. people with CP before treatment (p <
0.001).
[152]
Study group:
‐ 30 people with CP (16 women, 14
men), at the age of 30.7 ± 5.3.
Control group:
MDA, SOD,
CAT, GR
‐ ↑ MDA in NS of patients with CP vs.
control (p < 0.001),
‐ ↓ SOD, CAT, GR in NS of people with CP
vs. control (p < 0.001, p < 0.001, p < 0.001,
respectively).
[115]
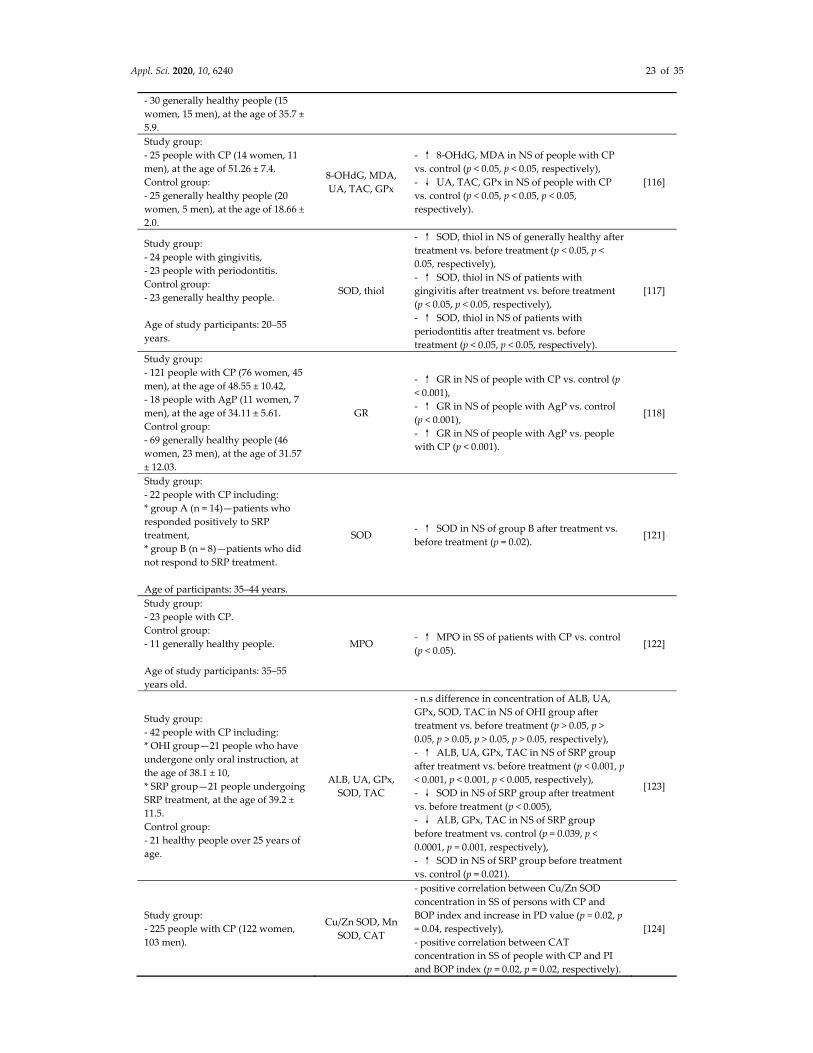
Appl. Sci. 2020, 10, 6240 23 of 35
‐ 30 generally healthy people (15
women, 15 men), at the age of 35.7 ±
5.9.
Study group:
‐ 25 people with CP (14 women, 11
men), at the age of 51.26 ± 7.4.
Control group:
‐ 25 generally healthy people (20
women, 5 men), at the age of 18.66 ±
2.0.
8‐OHdG, MDA,
UA, TAC, GPx
‐ ↑ 8‐OHdG, MDA in NS of people with CP
vs. control (p < 0.05, p < 0.05, respectively),
‐ ↓ UA, TAC, GPx in NS of people with CP
vs. control (p < 0.05, p < 0.05, p < 0.05,
respectively).
[116]
Study group:
‐ 24 people with gingivitis,
‐ 23 people with periodontitis.
Control group:
‐ 23 generally healthy people.
Age of study participants: 20–55
years.
SOD, thiol
‐ ↑ SOD, thiol in NS of generally healthy after
treatment vs. before treatment (p < 0.05, p <
0.05, respectively),
‐ ↑ SOD, thiol in NS of patients with
gingivitis after treatment vs. before treatment
(p < 0.05, p < 0.05, respectively),
‐ ↑ SOD, thiol in NS of patients with
periodontitis after treatment vs. before
treatment (p < 0.05, p < 0.05, respectively).
[117]
Study group:
‐ 121 people with CP (76 women, 45
men), at the age of 48.55 ± 10.42,
‐ 18 people with AgP (11 women, 7
men), at the age of 34.11 ± 5.61.
Control group:
‐ 69 generally healthy people (46
women, 23 men), at the age of 31.57
± 12.03.
GR
‐ ↑ GR in NS of people with CP vs. control (p
< 0.001),
‐ ↑ GR in NS of people with AgP vs. control
(p < 0.001),
‐ ↑ GR in NS of people with AgP vs. people
with CP (p < 0.001).
[118]
Study group:
‐ 22 people with CP including:
* group A (n = 14)—patients who
responded positively to SRP
treatment,
* group B (n = 8)—patients who did
not respond to SRP treatment.
Age of participants: 35–44 years.
SOD ‐ ↑ SOD in NS of group B after treatment vs.
before treatment (p = 0.02). [121]
Study group:
‐ 23 people with CP.
Control group:
‐ 11 generally healthy people.
Age of study participants: 35–55
years old.
MPO ‐ ↑ MPO in SS of patients with CP vs. control
(p < 0.05). [122]
Study group:
‐ 42 people with CP including:
* OHI group—21 people who have
undergone only oral instruction, at
the age of 38.1 ± 10,
* SRP group—21 people undergoing
SRP treatment, at the age of 39.2 ±
11.5.
Control group:
‐ 21 healthy people over 25 years of
age.
ALB, UA, GPx,
SOD, TAC
‐ n.s difference in concentration of ALB, UA,
GPx, SOD, TAC in NS of OHI group after
treatment vs. before treatment (p > 0.05, p >
0.05, p > 0.05, p > 0.05, p > 0.05, respectively),
‐ ↑ ALB, UA, GPx, TAC in NS of SRP group
after treatment vs. before treatment (p < 0.001, p
< 0.001, p < 0.001, p < 0.005, respectively),
‐ ↓ SOD in NS of SRP group after treatment
vs. before treatment (p < 0.005),
‐ ↓ ALB, GPx, TAC in NS of SRP group
before treatment vs. control (p = 0.039, p <
0.0001, p = 0.001, respectively),
‐ ↑ SOD in NS of SRP group before treatment
vs. control (p = 0.021).
[123]
Study group:
‐ 225 people with CP (122 women,
103 men).
Cu/Zn SOD, Mn
SOD, CAT
‐ positive correlation between Cu/Zn SOD
concentration in SS of persons with CP and
BOP index and increase in PD value (p = 0.02, p
= 0.04, respectively),
‐ positive correlation between CAT
concentration in SS of people with CP and PI
and BOP index (p = 0.02, p = 0.02, respectively).
[124]
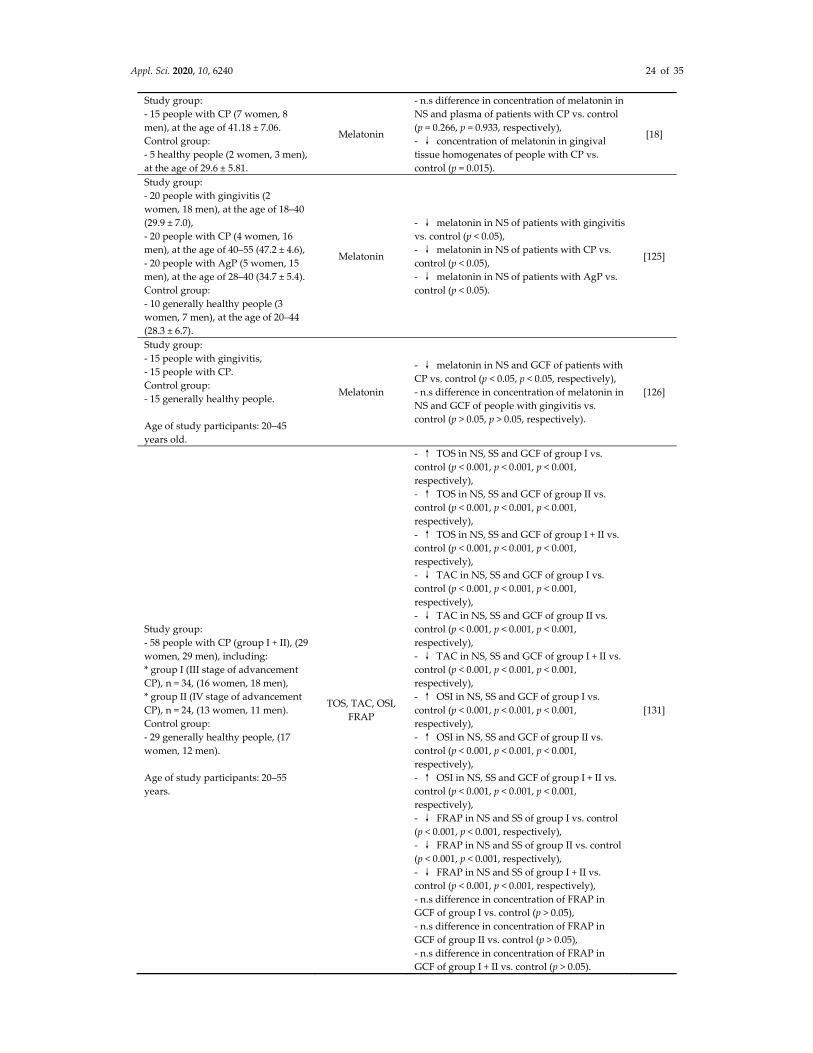
Appl. Sci. 2020, 10, 6240 24 of 35
Study group:
‐ 15 people with CP (7 women, 8
men), at the age of 41.18 ± 7.06.
Control group:
‐ 5 healthy people (2 women, 3 men),
at the age of 29.6 ± 5.81.
Melatonin
‐ n.s difference in concentration of melatonin in
NS and plasma of patients with CP vs. control
(p = 0.266, p = 0.933, respectively),
‐ ↓ concentration of melatonin in gingival
tissue homogenates of people with CP vs.
control (p = 0.015).
[18]
Study group:
‐ 20 people with gingivitis (2
women, 18 men), at the age of 18–40
(29.9 ± 7.0),
‐ 20 people with CP (4 women, 16
men), at the age of 40–55 (47.2 ± 4.6),
‐ 20 people with AgP (5 women, 15
men), at the age of 28–40 (34.7 ± 5.4).
Control group:
‐ 10 generally healthy people (3
women, 7 men), at the age of 20–44
(28.3 ± 6.7).
Melatonin
‐ ↓ melatonin in NS of patients with gingivitis
vs. control (p < 0.05),
‐ ↓ melatonin in NS of patients with CP vs.
control (p < 0.05),
‐ ↓ melatonin in NS of patients with AgP vs.
control (p < 0.05).
[125]
Study group:
‐ 15 people with gingivitis,
‐ 15 people with CP.
Control group:
‐ 15 generally healthy people.
Age of study participants: 20–45
years old.
Melatonin
‐ ↓ melatonin in NS and GCF of patients with
CP vs. control (p < 0.05, p < 0.05, respectively),
‐ n.s difference in concentration of melatonin in
NS and GCF of people with gingivitis vs.
control (p > 0.05, p > 0.05, respectively).
[126]
Study group:
‐ 58 people with CP (group I + II), (29
women, 29 men), including:
* group I (III stage of advancement
CP), n = 34, (16 women, 18 men),
* group II (IV stage of advancement
CP), n = 24, (13 women, 11 men).
Control group:
‐ 29 generally healthy people, (17
women, 12 men).
Age of study participants: 20–55
years.
TOS, TAC, OSI,
FRAP
‐ ↑ TOS in NS, SS and GCF of group I vs.
control (p < 0.001, p < 0.001, p < 0.001,
respectively),
‐ ↑ TOS in NS, SS and GCF of group II vs.
control (p < 0.001, p < 0.001, p < 0.001,
respectively),
‐ ↑ TOS in NS, SS and GCF of group I + II vs.
control (p < 0.001, p < 0.001, p < 0.001,
respectively),
‐ ↓ TAC in NS, SS and GCF of group I vs.
control (p < 0.001, p < 0.001, p < 0.001,
respectively),
‐ ↓ TAC in NS, SS and GCF of group II vs.
control (p < 0.001, p < 0.001, p < 0.001,
respectively),
‐ ↓ TAC in NS, SS and GCF of group I + II vs.
control (p < 0.001, p < 0.001, p < 0.001,
respectively),
‐ ↑ OSI in NS, SS and GCF of group I vs.
control (p < 0.001, p < 0.001, p < 0.001,
respectively),
‐ ↑ OSI in NS, SS and GCF of group II vs.
control (p < 0.001, p < 0.001, p < 0.001,
respectively),
‐ ↑ OSI in NS, SS and GCF of group I + II vs.
control (p < 0.001, p < 0.001, p < 0.001,
respectively),
‐ ↓ FRAP in NS and SS of group I vs. control
(p < 0.001, p < 0.001, respectively),
‐ ↓ FRAP in NS and SS of group II vs. control
(p < 0.001, p < 0.001, respectively),
‐ ↓ FRAP in NS and SS of group I + II vs.
control (p < 0.001, p < 0.001, respectively),
‐ n.s difference in concentration of FRAP in
GCF of group I vs. control (p > 0.05),
‐ n.s difference in concentration of FRAP in
GCF of group II vs. control (p > 0.05),
‐ n.s difference in concentration of FRAP in
GCF of group I + II vs. control (p > 0.05).
[131]
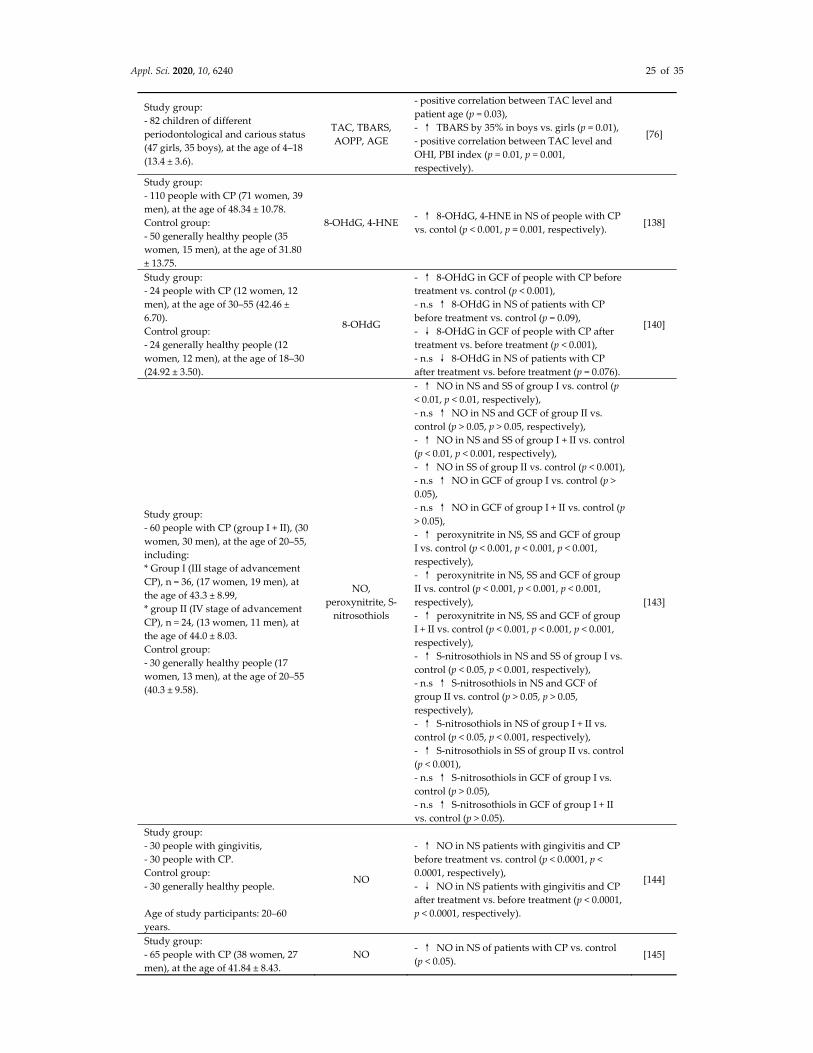
Appl. Sci. 2020, 10, 6240 25 of 35
Study group:
‐ 82 children of different
periodontological and carious status
(47 girls, 35 boys), at the age of 4–18
(13.4 ± 3.6).
TAC, TBARS,
AOPP, AGE
‐ positive correlation between TAC level and
patient age (p = 0.03),
‐ ↑ TBARS by 35% in boys vs. girls (p = 0.01),
‐ positive correlation between TAC level and
OHI, PBI index (p = 0.01, p = 0.001,
respectively).
[76]
Study group:
‐ 110 people with CP (71 women, 39
men), at the age of 48.34 ± 10.78.
Control group:
‐ 50 generally healthy people (35
women, 15 men), at the age of 31.80
± 13.75.
8‐OHdG, 4‐HNE ‐ ↑ 8‐OHdG, 4‐HNE in NS of people with CP
vs. contol (p < 0.001, p = 0.001, respectively). [138]
Study group:
‐ 24 people with CP (12 women, 12
men), at the age of 30–55 (42.46 ±
6.70).
Control group:
‐ 24 generally healthy people (12
women, 12 men), at the age of 18–30
(24.92 ± 3.50).
8‐OHdG
‐ ↑ 8‐OHdG in GCF of people with CP before
treatment vs. control (p < 0.001),
‐ n.s ↑ 8‐OHdG in NS of patients with CP
before treatment vs. control (p = 0.09),
‐ ↓ 8‐OHdG in GCF of people with CP after
treatment vs. before treatment (p < 0.001),
‐ n.s ↓ 8‐OHdG in NS of patients with CP
after treatment vs. before treatment (p = 0.076).
[140]
Study group:
‐ 60 people with CP (group I + II), (30
women, 30 men), at the age of 20–55,
including:
* Group I (III stage of advancement
CP), n = 36, (17 women, 19 men), at
the age of 43.3 ± 8.99,
* group II (IV stage of advancement
CP), n = 24, (13 women, 11 men), at
the age of 44.0 ± 8.03.
Control group:
‐ 30 generally healthy people (17
women, 13 men), at the age of 20–55
(40.3 ± 9.58).
NO,
peroxynitrite, S‐
nitrosothiols
‐ ↑ NO in NS and SS of group I vs. control (p
< 0.01, p < 0.01, respectively),
‐ n.s ↑ NO in NS and GCF of group II vs.
control (p > 0.05, p > 0.05, respectively),
‐ ↑ NO in NS and SS of group I + II vs. control
(p < 0.01, p < 0.001, respectively),
‐ ↑ NO in SS of group II vs. control (p < 0.001),
‐ n.s ↑ NO in GCF of group I vs. control (p >
0.05),
‐ n.s ↑ NO in GCF of group I + II vs. control (p
> 0.05),
‐ ↑ peroxynitrite in NS, SS and GCF of group
I vs. control (p < 0.001, p < 0.001, p < 0.001,
respectively),
‐ ↑ peroxynitrite in NS, SS and GCF of group
II vs. control (p < 0.001, p < 0.001, p < 0.001,
respectively),
‐ ↑ peroxynitrite in NS, SS and GCF of group
I + II vs. control (p < 0.001, p < 0.001, p < 0.001,
respectively),
‐ ↑ S‐nitrosothiols in NS and SS of group I vs.
control (p < 0.05, p < 0.001, respectively),
‐ n.s ↑ S‐nitrosothiols in NS and GCF of
group II vs. control (p > 0.05, p > 0.05,
respectively),
‐ ↑ S‐nitrosothiols in NS of group I + II vs.
control (p < 0.05, p < 0.001, respectively),
‐ ↑ S‐nitrosothiols in SS of group II vs. control
(p < 0.001),
‐ n.s ↑ S‐nitrosothiols in GCF of group I vs.
control (p > 0.05),
‐ n.s ↑ S‐nitrosothiols in GCF of group I + II
vs. control (p > 0.05).
[143]
Study group:
‐ 30 people with gingivitis,
‐ 30 people with CP.
Control group:
‐ 30 generally healthy people.
Age of study participants: 20–60
years.
NO
‐ ↑ NO in NS patients with gingivitis and CP
before treatment vs. control (p < 0.0001, p <
0.0001, respectively),
‐ ↓ NO in NS patients with gingivitis and CP
after treatment vs. before treatment (p < 0.0001,
p < 0.0001, respectively).
[144]
Study group:
‐ 65 people with CP (38 women, 27
men), at the age of 41.84 ± 8.43.
NO ‐ ↑ NO in NS of patients with CP vs. control
(p < 0.05). [145]
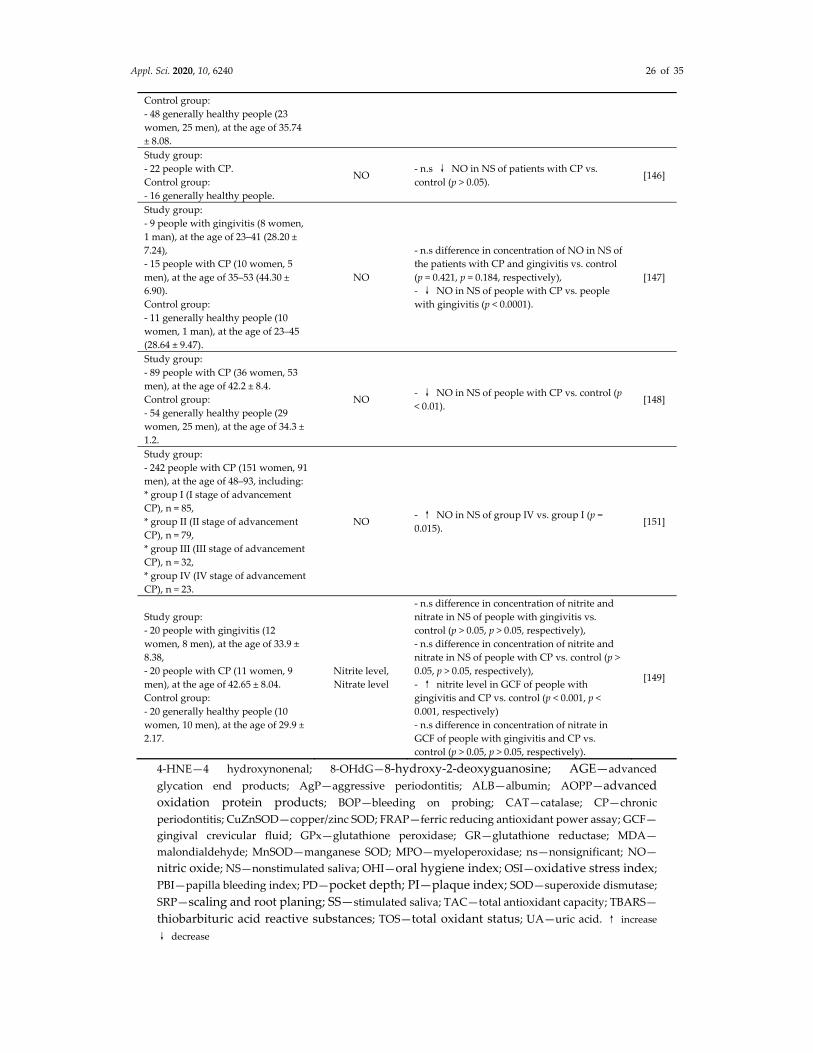
Appl. Sci. 2020, 10, 6240 26 of 35
Control group:
‐ 48 generally healthy people (23
women, 25 men), at the age of 35.74
± 8.08.
Study group:
‐ 22 people with CP.
Control group:
‐ 16 generally healthy people.
NO ‐ n.s ↓ NO in NS of patients with CP vs.
control (p > 0.05). [146]
Study group:
‐ 9 people with gingivitis (8 women,
1 man), at the age of 23–41 (28.20 ±
7.24),
‐ 15 people with CP (10 women, 5
men), at the age of 35–53 (44.30 ±
6.90).
Control group:
‐ 11 generally healthy people (10
women, 1 man), at the age of 23–45
(28.64 ± 9.47).
NO
‐ n.s difference in concentration of NO in NS of
the patients with CP and gingivitis vs. control
(p = 0.421, p = 0.184, respectively),
‐ ↓ NO in NS of people with CP vs. people
with gingivitis (p < 0.0001).
[147]
Study group:
‐ 89 people with CP (36 women, 53
men), at the age of 42.2 ± 8.4.
Control group:
‐ 54 generally healthy people (29
women, 25 men), at the age of 34.3 ±
1.2.
NO ‐ ↓ NO in NS of people with CP vs. control (p
< 0.01). [148]
Study group:
‐ 242 people with CP (151 women, 91
men), at the age of 48–93, including:
* group I (I stage of advancement
CP), n = 85,
* group II (II stage of advancement
CP), n = 79,
* group III (III stage of advancement
CP), n = 32,
* group IV (IV stage of advancement
CP), n = 23.
NO ‐ ↑ NO in NS of group IV vs. group I (p =
0.015). [151]
Study group:
‐ 20 people with gingivitis (12
women, 8 men), at the age of 33.9 ±
8.38,
‐ 20 people with CP (11 women, 9
men), at the age of 42.65 ± 8.04.
Control group:
‐ 20 generally healthy people (10
women, 10 men), at the age of 29.9 ±
2.17.
Nitrite level,
Nitrate level
‐ n.s difference in concentration of nitrite and
nitrate in NS of people with gingivitis vs.
control (p > 0.05, p > 0.05, respectively),
‐ n.s difference in concentration of nitrite and
nitrate in NS of people with CP vs. control (p >
0.05, p > 0.05, respectively),
‐ ↑ nitrite level in GCF of people with
gingivitis and CP vs. control (p < 0.001, p <
0.001, respectively)
‐ n.s difference in concentration of nitrate in
GCF of people with gingivitis and CP vs.
control (p > 0.05, p > 0.05, respectively).
[149]
4‐HNE—4 hydroxynonenal; 8‐OHdG—8‐hydroxy‐2‐deoxyguanosine; AGE—advanced
glycation end products; AgP—aggressive periodontitis; ALB—albumin; AOPP—advanced
oxidation protein products; BOP—bleeding on probing; CAT—catalase; CP—chronic
periodontitis; CuZnSOD—copper/zinc SOD; FRAP—ferric reducing antioxidant power assay; GCF—
gingival crevicular fluid; GPx—glutathione peroxidase; GR—glutathione reductase; MDA—
malondialdehyde; MnSOD—manganese SOD; MPO—myeloperoxidase; ns—nonsignificant; NO—
nitric oxide; NS—nonstimulated saliva; OHI—oral hygiene index; OSI—oxidative stress index;
PBI—papilla bleeding index; PD—pocket depth; PI—plaque index; SOD—superoxide dismutase;
SRP—scaling and root planing; SS—stimulated saliva; TAC—total antioxidant capacity; TBARS—
thiobarbituric acid reactive substances; TOS—total oxidant status; UA—uric acid. ↑ increase
↓ decrease
Appl. Sci. 2020, 10, 6240 27 of 35
9. Conclusions
The role of OS in caries and periodontitis is not entirely understood despite many decades of
studies on its role in etiopathology of these conditions. So far, numerous papers have been published
to prove the potential of OS markers for screening, diagnosis and monitoring of the progress of the
said diseases, but none of these methods has proven suitable for routine clinical use. From the point
of view of research on the role of OS in oral diseases, an important issue is the lack of specificity—
both in diagnosis and treatment. Until now, the source of free radical production is not entirely clear.
Numerous reports indicate PMNs as the main source of ROS and RNS, while other researchers
indicate the key contribution of bacteria (cariogenic and periopathogenic) in the development of OS
in the course of caries and periodontitis [153–155].
Significant limitations of the studies conducted so far include very different methodology of
biochemical tests, low number of patients in study groups, adoption of quite varied definitions of
caries and periodontitis, lack of unambiguous divisions of the severity of caries and periodontitis and
lack of assessment of the influence of caries and periodontitis duration as well as incomplete
eradication of local and general factors affecting the tested antioxidant activity. Therefore, it is
necessary to unify the inclusion and exclusion criteria of study subjects and formulate a new
classification of caries and periodontitis which will more precisely and uniformly rank the severity
of the disease. These solutions may enable, inter alia, the use of antioxidants in the prevention and
treatment of oral diseases.
Author Contributions: Conceptualization, A.S.‐R. and A.Z.; methodology, A.S.‐R. and A.Z.; software, A.S.‐R.
and A.Z.; validation, A.Z.; formal analysis, A.Z.; data curation, A.S.‐R. and A.Z.; writing—original draft
preparation, A.S.‐R. and A.Z.; writing—review and editing, A.S.‐R. and A.Z. visualization, A.S.‐R.; supervision,
A.Z. All authors have read and agreed to the published version of the manuscript.
Funding: this work was supported by grant from the Medical University of Bialystok, Poland (grant number:
SUB/1/DN/20/002/1209).
Conflicts of Interest: the authors declare no potential conflicts of interest with respect to the research, authorship
and/or publication of this article. All authors have read and agreed to the published version of the manuscript
References
1. Klimiuk, A.; Maciejczyk, M.; Choromańska, M.; Fejfer, K.; Waszkiewicz, N.; Zalewska, A. Salivary Redox
Biomarkers in Different Stages of Dementia Severity. J. Clin. Med. 2019, 8, 840, doi:10.3390/jcm8060840.
2. Skutnik‐Radziszewska, A.; Maciejczyk, M.; Fejfer, K.; Krahel, J.; Flisiak, I.; Kołodziej, U.; Zalewska, A.
Salivary Antioxidants and Oxidative Stress in Psoriatic Patients: Can Salivary Total Oxidant Status and
Oxidative Status Index Be a Plaque Psoriasis Biomarker? Oxidative Med. Cell. Longev. 2020, 2020, 1–12,
doi:10.1155/2020/9086024.
3. Choromańska, M.; Klimiuk, A.; Kostecka‐Sochoń, P.; Wilczyńska, K.; Kwiatkowski, M.; Okuniewska, N.;
Waszkiewicz, N.; Zalewska, A.; Maciejczyk, M. Antioxidant Defence, Oxidative Stress and Oxidative
Damage in Saliva, Plasma and Erythrocytes of Dementia Patients. Can Salivary AGE be a Marker of
Dementia? Int. J. Mol. Sci. 2017, 18, 2205, doi:10.3390/ijms18102205.
4. Maciejczyk, M.; Żebrowska, E.; Zalewska, A.; Chabowski, A. Redox Balance, Antioxidant Defense, and
Oxidative Damage in the Hypothalamus and Cerebral Cortex of Rats with High Fat Diet‐Induced Insulin
Resistance. Oxidative Med. Cell. Longev. 2018, 2018, 1–11, doi:10.1155/2018/6940515.
5. Maciejczyk, M.; Zalewska, A.; Ładny, J.R. Salivary Antioxidant Barrier, Redox Status, and Oxidative
Damage to Proteins and Lipids in Healthy Children, Adults, and the Elderly. Oxidative Med. Cell. Longev.
2019, 2019, 1–12, doi:10.1155/2019/4393460.
6. Kołodziej, U.; Maciejczyk, M.; Niklińska, W.; Waszkiel, D.; Żendzian‐Piotrowska, M.; Żukowski, P.;
Zalewska, A. Chronic high‐protein diet induces oxidative stress and alters the salivary gland function in
rats. Arch. Oral Boil. 2017, 84, 6–12, doi:10.1016/j.archoralbio.2017.09.006.
7. Ahmadi‐Motamayel, F.; Goodarzi, M.T.; Hendi, S.; Kasraei, S.; Moghimbeigi, A. Total antioxidant capacity
of saliva and dental caries. Med. Oral Patol. Oral y Cir. Bucal 2013, 18, e553–e556, doi:10.4317/medoral.18762.
8. Evelyn, R.; Javier, M.; Gustavo, M.; Miguel, N.; Patricia, P.; Valeria, G.; Oyarzo, J.F.; Yevenes, I. Caries‐free
subjects have high levels of urease and arginine deiminase activity. J. Appl. Oral Sci. 2014, 22, 235–240.
Appl. Sci. 2020, 10, 6240 28 of 35
9. Krawczyk, D.; Sikorska, M.; Mielnik‐Błaszczak, M.; Pasternak, K.; Kapeć, E.; Sztanke, M. Dental caries and
total antioxidant status of unstimulated mixed whole saliva in patients aged 16–23 years. Adv. Med. Sci.
2012, 57, 163–168, doi:10.2478/v10039‐012‐0015‐9.
10. Hartenbach, F.A.R.R.; Velasquez, É.; Nogueira, F.C.; Domont, G.B.; Ferreira, E.D.O.; Colombo, A.P.V.
Proteomic analysis of whole saliva in chronic periodontitis. J. Proteom. 2020, 213, 103602,
doi:10.1016/j.jprot.2019.103602.
11. Rovera, A.; Rovera, G.; Alzahrani, A.; Hector, M.; Anderson, P. Correlation between parotid saliva
composition and dental caries using 31P‐NMR and ICDAS score. Arch. Oral Boil. 2020, 111, 104651,
doi:10.1016/j.archoralbio.2020.104651.
12. Anusuya, S.; Prabhuji, M.L.; Lazarus, F.; Bhavikatti, S.K.; Babrawala, I.S. Estimation of 8‐Hydroxy‐
deoxyguanosine (8‐OHdG) in Saliva as a Marker of Oxidative Stress in Patients with Chronic Periodontitis:
Preliminary Data. J. Int. Acad. Periodontol. 2017, 19, 95–100.
13. Acquier, A.B.; De Couto Pita, A.K.; Busch, L.; Sánchez, G.A. Parameters of oxidative stress in saliva from
patients with aggressive and chronic periodontitis. Redox Rep. 2016, 22, 119–126,
doi:10.1080/13510002.2016.1198104.
14. Jankowska, A.K.; Waszkiel, D.; Kowalczyk, A. Ślina jako główny składnik ekosystemu jamy ustnej, Część,
I. Mechanizm wydzielania i funkcje. Wiadomości Lek. 2007, 60, 148–154.
15. Jankowska, A.K.; Waszkiel, D.; Kobus, A.; Zwierz, K. Ślina jako główny składnik ekosystemu jamy ustnej,
Część II. Mechanizmy odpornościowe. Wiadomości Lek. 2007, 60, 253–257.
16. Jankowska, A.; Waszkiel, D.; Kobus, A.; Szajda, S.D.; Łuczaj‐ Cepowicz E, Błahuszewska, K.; Snarska, J.
Zwierz K. The differences in salivary lysozyme concentration in caries resistant and caries‐susceptible
young men and women adults. In Środowiskowe Źródła Zagrożeń Zdowotnych; Kaczor, A., Borzécki, A., Iskra,
M., Eds.; Wydawnictwo AM: Nałęczów, Polska, 2007; pp. 1451–1454.
17. Żukowski, P.; Maciejczyk, M.; Waszkiel, D. Sources of free radicals and oxidative stress in the oral cavity.
Arch. Oral Boil. 2018, 92, 8–17, doi:10.1016/j.archoralbio.2018.04.018.
18. Balaji, T.M.; Vasanthi, H.R.; Rao, S.R. Gingival, Plasma and Salivary Levels of Melatonin in Periodontally
Healthy Individuals and Chronic Periodontitis Patients: A Pilot Study. J. Clin. Diagn. Res. 2015, 9, ZC23–
ZC25, doi:10.7860/JCDR/2015/11311.5652.
19. Zalewska, A.; Knaś, M.; Kuźmiuk, A.; Waszkiewicz, N.; Niczyporuk, M.; Waszkiel, D.; Zwierz, K. Salivary
innate defense system in type 1 diabetes mellitus in children with mixed and permanent dentition. Acta
Odontol. Scand. 2013, 71, 1493–1500, doi:10.3109/00016357.2013.773071.
20. Ahmadi‐Motamayel, F.; Goodarzi, M.T.; Mahdavinezhad, A.; Jamshidi, Z.; Darvishi, M. Salivary and
Serum Antioxidant and Oxidative Stress Markers in Dental Caries. Caries Res. 2018, 52, 565–569,
doi:10.1159/000488213.
21. Almerich‐Silla, J.M.; Montiel‐Company, J.M.; Pastor, S.; Serrano, F.; Puig‐Silla, M.; Dasí, F. Oxidative Stress
Parameters in Saliva and Its Association with Periodontal Disease and Types of Bacteria. Dis. Markers 2015,
2015, 1–7, doi:10.1155/2015/653537.
22. Araujo, H.C.; Nakamune, A.C.M.S.; Garcia, W.G.; Pessan, J.P.; Antoniali, C. Carious Lesion Severity
Induces Higher Antioxidant System Activity and Consequently Reduces Oxidative Damage in Children’s
Saliva. Oxidative Med. Cell. Longev. 2020, 2020, 1–9, doi:10.1155/2020/3695683.
23. Babiuch, K.; Bednarczyk, A.; Gawlik, K.; Pawlica‐Gosiewska, D.; Kęsek, B.; Darczuk, D.; Stępień, P.;
Chomyszyn‐Gajewska, M.; Kaczmarzyk, T. Evaluation of enzymatic and non‐enzymatic antioxidant status
and biomarkers of oxidative stress in saliva of patients with oral squamous cell carcinoma and oral
leukoplakia: A pilot study. Acta Odontol. Scand. 2019, 77, 408–418, doi:10.1080/00016357.2019.1578409.
24. Baltacioglu, E.; Sukuroglu, E. Protein carbonyl levels in serum, saliva and gingival crevicular fluid in
patients with chronic and aggressive periodontitis. Saudi Dent. J. 2018, 31, 23–30,
doi:10.1016/j.sdentj.2018.09.003.
25. Govindaraj, J.; Govindaraj, K.; Selvaraj, J.; Ramalingam, M.; Padmavathy, K.; Sumathy, G. 8‐Hydroxy
deoxyguanosine—A potential biomarker in periodontitis. Drug Invent. Today 2019, 11, 1027–1032.
26. Srivastava, K.C. Comparative Evaluation of Saliva’s Oxidant‐Antioxidant Status in Patients with Different
Clinicopathological Types of Oral Leukoplakia. J. Int. Soc. Prev. Community Dent. 2019, 9, 396–402,
doi:10.4103/jispcd.JISPCD_179_19.
27. Thekiso, M.; Yengopal, V.; Rudolph, M.J.; Bhayat, A. Caries status among children in the West Rand District
of Gauteng Province, South Africa. SADJ 2012, 67, 318–320.
Appl. Sci. 2020, 10, 6240 29 of 35
28. Borys, J.; Maciejczyk, M.; Antonowicz, B.; Sidun, J.; Świderska, M.; Zalewska, A. Free radical production,
inflammation and apoptosis in patients treated with titanium mandibular fixations—An observational
study. Front. Immunol. 2019, 10, 2662.
29. Lushchak, V.I. Free radicals, reactive oxygen species, oxidative stress and its classification. Chem. Biol.
Interact. 2014, 224, 164–175, doi:10.1016/j.cbi.2014.10.016.
30. Pietrucha, B.; Heropolitańska‐Pliszka, E.; Maciejczyk, M.; Car, H.; Sawicka‐Powierza, J.; Motkowski, R.;
Karpinska, J.; Hryniewicka, M.; Zalewska, A.; Pac, M.; et al. Comparison of Selected Parameters of Redox
Homeostasis in Patients with Ataxia‐Telangiectasia and Nijmegen Breakage Syndrome. Oxidative Med. Cell.
Longev. 2017, 2017, 1–8, doi:10.1155/2017/6745840.
31. Tóthová, L.; Celec, P. Oxidative Stress and Antioxidants in the Diagnosis and Therapy of Periodontitis.
Front. Physiol. 2017, 8, doi:10.3389/fphys.2017.01055.
32. Sena, L.A.; Chandel, N.S. Physiological Roles of Mitochondrial Reactive Oxygen Species. Mol. Cell 2012, 48,
158–167, doi:10.1016/j.molcel.2012.09.025.
33. Lushchak, V.I. Classification of oxidative stress based on its intensity. EXCLI J. 2014, 13, 922–937.
34. Stadtman, E.R.; Levine, R.L. Free radical‐mediated oxidation of free amino acids and amino acid residues
in proteins. Amino Acids 2003, 25, 207–218, doi:10.1007/s00726‐003‐0011‐2.
35. Cadet, J.; Douki, T.; Gasparutto, D.; Ravanat, J.L. Oxidative damage to DNA: Formation, measurement and
biochemical features. Mutat. Res. Fundam. Mol. Mech. Mutagen. 2003, 531, 5–23,
doi:10.1016/j.mrfmmm.2003.09.001.
36. Sayre, L.M.; Lin, D.; Yuan, Q.; Zhu, X.; Tang, X. Protein Adducts Generated from Products of Lipid
Oxidation: Focus on HNE and ONE. Drug Metab. Rev. 2006, 38, 651–675, doi:10.1080/03602530600959508.
37. Zhong, H.; Yin, H. Role of lipid peroxidation derived 4‐hydoxynonenal (4‐HNE) in cancer: Focusing on
mitochondria. Redox Biol. 2015, 4, 193–199.
38. Grosicka‐Maciąg, E. Biological consequences of oxidative stress induced by pesticides. Postępy Hig. Med.
Dośw. 2001, 65, 357–366.
39. Knaś, M.; Maciejczyk, M.; Daniszewska, I.; Klimiuk, A.; Matczuk, J.; Kołodziej, U.; Waszkiel, D.; Ładny, J.R.;
Żendzian‐Piotrowska, M.; Zalewska, A. Oxidative Damage to the Salivary Glands of Rats with
Streptozotocin‐Induced Diabetes‐Temporal Study: Oxidative Stress and Diabetic Salivary Glands. J.
Diabetes Res. 2016, 2016, 1–13, doi:10.1155/2016/4583742.
40. Ayala, A.; Muñoz, M.F.; Arguelles, S. Lipid Peroxidation: Production, Metabolism, and Signaling
Mechanisms of Malondialdehyde and 4‐Hydroxy‐2‐Nonenal. Oxidative Med. Cell. Longev. 2014, 2014, 1–31,
doi:10.1155/2014/360438.
41. Jaganjac, M.; Tirosh, O.; Cohen, G.; Sasson, S.; Zarkovic, N. Reactive aldehydes—Second messengers of free
radicals in diabetes mellitus. Free Radic. Res. 2013, 47, 39–48, doi:10.3109/10715762.2013.789136.
42. Green, E.A.; Flavell, R.A. The initiation of autoimmune diabetes. Curr. Opin. Immunol. 1999, 11, 663–669,
doi:10.1016/s0952‐7915(99)00034‐5.
43. Ibuki, F.K.; Simões, A.; Nogueira, F.N. Antioxidant enzymatic defense in salivary glands of streptozotocin‐
induced diabetic rats: A temporal study. Cell Biochem. Funct. 2010, 28, 503–508, doi:10.1002/cbf.1683.
44. Nogueira, F.N.; Carvalho, A.M.; Yamaguti, P.M.; Nicolau, J. Antioxidant parameters and lipid peroxidation
in salivary glands of streptozotocin‐induced diabetic rats. Clin. Chim. Acta 2005, 353, 133–139,
doi:10.1016/j.cccn.2004.11.004.
45. Waddington, R.J.; Moseley, R.; Embery, G. Periodontal Disease Mechanisms: Reactive oxygen species: A
potential role in the pathogenesis of periodontal diseases. Oral Dis. 2000, 6, 138–151, doi:10.1111/j.1601‐
0825.2000.tb00325.x.
46. Bartosz, G. Druga Twarz Tlenu. Wolne Rodniki w Przyrodzie; Wydawnictwo Naukowe PWN: Warsow, Poland,
2003.
47. Gruber, B. Enzymy chroniące organizm przed reaktywnymi postaciami tlenu. Farm Pol 1996, 52, 263–271.
48. De Groot, H.; Hegi, U.; Sies, H. Loss of α‐tocopherol upon exposure to nitric oxide or the sydnonimine SIN‐
1. FEBS Lett. 1993, 315, 139–142, doi:10.1016/0014‐5793(93)81150‐x.
49. Lardinois, O.M. Reactions of Bovine Liver Catalase with Superoxide Radicals and Hydrogen Peroxide. Free
Radic. Res. 1995, 22, 251–274, doi:10.3109/10715769509147544.
50. Tainer, J.A.; Getzoff, E.D.; Richardson, J.S.; Richardson, D.C. Structure and mechanism of copper, zinc
superoxide dismutase. Nature 1983, 306, 284–287, doi:10.1038/306284a0.
Appl. Sci. 2020, 10, 6240 30 of 35
51. Antunes, F.; Cadenas, E. Estimation of H2O2 gradients across biomembranes. FEBS Lett. 2000, 475, 121–126,
doi:10.1016/s0014‐5793(00)01638‐0.
52. Safo, M.K.; Musayev, F.N.; Wu, S.‐H.; Abraham, N.J.; Ko, T.‐P. Structure of tetragonal crystals of human
erythrocyte catalase. Acta Crystallogr. Sect. D Biol. Crystallogr. 2001, 57, 1–7, doi:10.1107/s0907444900013767.
53. Lledías, F.; Rangel, P.; Hansberg, W.; Lledías, F. Oxidation of Catalase by Singlet Oxygen. J. Boil. Chem. 1998,
273, 10630–10637, doi:10.1074/jbc.273.17.10630.
54. Cadenas, E. Mechanisms of Antioxidant Action. Free Radicals, Oxidative Stress, and Antioxidants; Springer:
Boston, MA, USA, 1997; pp. 237–251.
55. Von Ossowski, I.; Hausner, G.; Loewen, P.C. Molecular evolutionary analysis based on the amino acid
sequence of catalase. J. Mol. Evol. 1993, 37, 71–76, doi:10.1007/bf00170464.
56. Battino, M.; Ferreiro, M.S.; Gallardo, I.; Newman, H.N.; Bullon, P. The antioxidant capacity of saliva. J. Clin.
Periodontol. 2002, 29, 189–194, doi:10.1034/j.1600‐051x.2002.290301x.x.
57. Kanehira, T.; Shibata, K.; Kashiwazaki, H.; Inoue, N.; Morita, M. Comparison of antioxidant enzymes in
saliva of elderly smokers and non‐smokers. Gerodontology 2006, 23, 38–42, doi:10.1111/j.1741‐
2358.2006.00077.x.
58. Bartosz, G. Superoxide Dismutases and Catalase. In Oxidants and Antioxidant Defense Systems; Springer:
Berlin/Heidelberg, Germany, 2005; pp. 109–149.
59. Reznick, A.Z.; Klein, I.; Eiserich, J.P.; Cross, C.E.; Nagler, R. Inhibition of oral peroxidase activity by
cigarette smoke: In vivo and in vitro studies. Free Radic. Boil. Med. 2003, 34, 377–384, doi:10.1016/s0891‐
5849(02)01297‐2.
60. Matczuk, J.; Zalewska, A.; Łukaszuk, B.; Garbowska, M.; Chabowski, A.; Żendzian‐Piotrowska, M.; Kurek,
K. Effect of streptozotocin‐induced diabetes on lipids metabolism in the salivary glands. Prostaglandins
Other Lipid Mediat. 2016, 126, 9–15, doi:10.1016/j.prostaglandins.2016.08.003.
61. Clancy, R.M.; Levartovsky, D.; Leszczynska‐Piziak, J.; Yegudin, J.; Abramson, S.B. Nitric oxide reacts with
intracellular glutathione and activates the hexose monophosphate shunt in human neutrophils: Evidence
for S‐nitrosoglutathione as a bioactive intermediary. Proc. Natl. Acad. Sci. USA 1994, 91, 3680–3684,
doi:10.1073/pnas.91.9.3680.
62. Anders, M.W. Chemical Toxicology of Reactive Intermediates Formed by the Glutathione‐Dependent
Bioactivation of Halogen‐Containing Compounds. Chem. Res. Toxicol. 2008, 21, 145–159,
doi:10.1021/tx700202w.
63. Liu, L.; Yan, Y.; Zeng, M.; Zhang, J.; Hanes, M.A.; Ahearn, G.; McMahon, T.J.; Dickfeld, T.; Marshall, H.E.;
Que, L.G.; et al. Essential Roles of S‐Nitrosothiols in Vascular Homeostasis and Endotoxic Shock. Cell 2004,
116, 617–628, doi:10.1016/s0092‐8674(04)00131‐x.
64. Maxwell, S.R.J.; Thomason, H.; Sandler, D.; Leguen, C.; Baxter, M.A.; Thorpe, G.H.G.; Jones, A.F.; Barnett,
A.H. Antioxidant status in patients with uncomplicated insulin‐dependent and non‐insulin‐dependent
diabetes mellitus. Eur. J. Clin. Investig. 1997, 27, 484–490, doi:10.1046/j.1365‐2362.1997.1390687.x.
65. Pablos, M.I.; Reiter, R.J.; Chuang, J.‐I.; Ortiz, G.G.; Guerrero, J.M.; Sewerynek, E.; Agapito, M.T.; Melchiorri,
D.; Lawrence, R.; Deneke, S.M. Acutely administered melatonin reduces oxidative damage in lung and
brain induced by hyperbaric oxygen. J. Appl. Physiol. 1997, 83, 354–358, doi:10.1152/jappl.1997.83.2.354.
66. Gilad, E.; Cuzzocrea, S.; Zingarelli, B.; Salzman, A.L.; Szabo, C. Melatonin is a scavenger of peroxynitrite.
Life Sci. 1997, 60, PL169–PL174, doi:10.1016/s0024‐3205(97)00008‐8.
67. Reiter, R.J. Oxidative damage in the central nervous system: Protection by melatonin. Prog. Neurobiol. 1998,
56, 359–384, doi:10.1016/s0301‐0082(98)00052‐5.
68. Gitto, E.; Tan, D.‐X.; Reiter, R.J.; Karbownik, M.; Manchester, L.C.; Cuzzocrea, S.; Fulia, F.; Barberi, I.
Individual and synergistic antioxidative actions of melatonin: Studies with vitamin E, vitamin C,
glutathione and desferrrioxamine (desferoxamine) in rat liver homogenates. J. Pharm. Pharmacol. 2001, 53,
1393–1401, doi:10.1211/0022357011777747.
69. Usha, C.; Sathyanarayanan, R. Dental caries—A complete changeover (Part I). J. Conserv. Dent. 2009, 12, 46–
54, doi:10.4103/0972‐0707.55617.
70. Leonora, J.; Tjäderhane, L.; Tieche, J.‐M. Parotid gland function and dentin apposition in rat molars. J. Dent.
Res. 2002, 81, 259–264, doi:10.1177/154405910208100407.
71. Da Silva, P.V.; Troiano, J.A.; Nakamune, A.C.M.; Pessan, J.P.; Antoniali, C. Increased activity of the
antioxidants systems modulate the oxidative stress in saliva of toddlers with early childhood caries. Arch.
Oral Boil. 2016, 70, 62–66, doi:10.1016/j.archoralbio.2016.06.003.
Appl. Sci. 2020, 10, 6240 31 of 35
72. Jurczak, A.; Kościelniak, D.; Skalniak, A.; Papież, M.A.; Vyhouskaya, P.; Krzyściak, W. The role of the saliva
antioxidant barrier to reactive oxygen species with regard to caries development. Redox Rep. 2017, 22, 524–
533, doi:10.1080/13510002.2017.1301625.
73. Mahjoub, S.; Ghasempour, M.; Gharage, A.; Bijani, A.; Masrourroudsari, J. Comparison of Total
Antioxidant Capacity in Saliva of Children with Severe Early Childhood Caries and Caries‐Free Children.
Caries Res. 2014, 48, 271–275, doi:10.1159/000355581.
74. Kumar, D.; Pandey, R.K.; Agrawal, D.; Agrawal, D. An estimation and evaluation of total antioxidant
capacity of saliva in children with severe early childhood caries. Int. J. Paediatr. Dent. 2011, 21, 459–464,
doi:10.1111/j.1365‐263x.2011.01154.x.
75. Muchandi, S.; Walimbe, H.; Bijle, M.N.A.; Nankar, M.; Chaturvedi, S.; Karekar, P. Comparative Evaluation
and Correlation of Salivary Total Antioxidant Capacity and Salivary pH in Caries‐free and Severe Early
Childhood Caries Children. J. Contemp. Dent. Pract. 2015, 16, 234–237, doi:10.5005/jp‐journals‐10024‐1667.
76. Tóthová, L.; Celecová, V.; Celec, P. Salivary Markers of Oxidative Stress and Their Relation to Periodontal
and Dental Status in Children. Dis. Markers 2013, 34, 9–15, doi:10.1155/2013/591765.
77. Subramanyam, D.; Gurunathan, D.; Gaayathri, R.; Priya, V.V. Comparative evaluation of salivary
malondialdehyde levels as a marker of lipid peroxidation in early childhood caries. Eur. J. Dent. 2018, 12,
067–070, doi:10.4103/ejd.ejd_266_17.
78. Syed, M.; Sachdev, V.; Chopra, R. Intercomparison of salivary nitric oxide as a biomarker of dental caries
risk between caries‐active and caries‐free children. Eur. Arch. Paediatr. Dent. 2016, 17, 239–243,
doi:10.1007/s40368‐016‐0234‐z.
79. Han, D.‐H.; Kim, M.‐J.; Jun, E.‐J.; Kim, J.‐B. The role of glutathione metabolism in cariogenic bacterial
growth and caries in Korean children. Arch. Oral Boil. 2013, 58, 493–499,
doi:10.1016/j.archoralbio.2012.09.021.
80. Preethi, B.P.; Reshma, D.; Anand, P. Evaluation of Flow Rate, pH, Buffering Capacity, Calcium, Total
Proteins and Total Antioxidant Capacity Levels of Saliva in Caries Free and Caries Active Children: An In
Vivo Study. Indian J. Clin. Biochem. 2010, 25, 425–428, doi:10.1007/s12291‐010‐0062‐6.
81. Dodwad, R.; Betigeri, A.V.; Preeti, B.P. Estimation of total antioxidant capacity levels in saliva of caries‐free
and caries‐active children. Contemp. Clin. Dent. 2011, 2, 17–20, doi:10.4103/0976‐237X.79296.
82. Pandey, P.; Reddy, N.V.; Rao, V.A.P.; Saxena, A.; Chaudhary, C.P. Estimation of salivary flow rate, pH,
buffer capacity, calcium, total protein content and total antioxidant capacity in relation to dental caries
severity, age and gender. Contemp. Clin. Dent. 2015, 6, S65–S71, doi:10.4103/0976‐237X.152943.
83. Pyati, S.A.; Naveen Kumar, R.; Kumar, V.; Praveen Kumar, N.H.; Parveen Reddy, K.M. Salivary Flow Rate,
pH, Buffering Capacity, Total Protein, Oxidative Stress and Antioxidant Capacity in Children with and
without Dental Caries. J. Clin. Pediatr. Dent. 2018, 42, 445–449, doi:10.17796/1053‐4625‐42.6.7.
84. Banda, N.R.; Singh, G.; Markam, V. Evaluation of total antioxidant level of saliva in modulation of caries
occurrence and progression in children. J. Indian Soc. Pedod. Prev. Dent. 2016, 34, 227, doi:10.4103/0970‐
4388.186747.
85. Alanazi, G.S.; Pani, S.C.; AlKabbaz, H.J. Salivary antioxidant capacity of children with severe early
childhood caries before and after complete dental rehabilitation. Arch. Oral Boil. 2018, 95, 165–169,
doi:10.1016/j.archoralbio.2018.08.002.
86. Rahmani, M.; Ghoorchi, V.; Rezaei, F.; Raygani, A.V. Evaluation of Total Antioxidant Capacity of Saliva in
High School Students. Glob. J. Health Sci. 2015, 8, 89–94, doi:10.5539/gjhs.v8n4p89.
87. Hegde, M.N.; Hegde, N.D.; Ashok, A.; Shetty, S. Evaluation of total antioxidant capacity of saliva and
serum in caries‐free and caries‐active adults: An in‐vivo study. Indian J. Dent. Res. 2013, 24, 164,
doi:10.4103/0970‐9290.116670.
88. Sarode, G.; Shelar, A.; Sarode, S.; Bagul, N. Association between Dental Caries and Lipid Peroxidation in
Saliva. Int. J. Oral. Maxillofac. Pathol. 2012, 3, 2–4.
89. Hendi, S.; Goodarzi, M.T.; Moghimbeigi, A.; Ahmadi‐Motamayel, F. Evaluation of the status of salivary
antioxidants in dental caries. Infect. Disord. Drug Targets 2019, 19, doi:10.2174/1871526519666191031100432.
90. Hegde, M.N.; Hegde, N.D.; Ashok, A.; Shetty, S. Biochemical Indicators of Dental Caries in Saliva: An in
vivo Study. Caries Res. 2014, 48, 170–173, doi:10.1159/000355580.
91. Öztürk, L.; Furuncuoğlu, H.; Atala, M.; Uluköylü, O.; Akyüz, S.; Yarat, A. Association between dental‐oral
health in young adults and salivary glutathione, lipid peroxidation and sialic acid levels and carbonic
anhydrase activity. Braz. J. Med. Boil. Res. 2008, 41, 956–959, doi:10.1590/s0100‐879x2008005000048.
Appl. Sci. 2020, 10, 6240 32 of 35
92. Tulunoglu, Ö.; Demirtas, S.; Tulunoglu, I. Total antioxidant levels of saliva in children related to caries, age,
and gender. Int. J. Paediatr. Dent. 2006, 16, 186–191, doi:10.1111/j.1365‐263x.2006.00733.x.
93. Celecová, V.; Kamodyova, N.; Tóthová, L.; Kúdela, M.; Celec, P. Salivary markers of oxidative stress are
related to age and oral health in adult non‐smokers. J. Oral Pathol. Med. 2012, 42, doi:10.1111/jop.12008.
94. Ahmadi‐Motamayel, F.; Hendi, S.S.; Goodarzi, M.T. Evaluation of Salivary Lipid Peroxidation End Product
Level in Dental Caries. Infect. Disord. Drug Targets 2020, 20, 65–68, doi:10.2174/1871526519666181123182120.
95. Rice‐Evans, C.A. DAT. Techniques in Free Radical Research. In Laboratory Techniques in Biochemistry and
Molecular Biology; Elsevier Science: London, UK, 1991; pp. 1–291.
96. Pisoschi, A.M.; Pop, A. The role of antioxidants in the chemistry of oxidative stress: A review. Eur. J. Med.
Chem. 2015, 97, 55–74, doi:10.1016/j.ejmech.2015.04.040.
97. Zalewska, A.; Knaś, M.; Żendzian‐Piotrowska, M.; Waszkiewicz, N.; Szulimowska, J.; Prokopiuk, S.;
Waszkiel, D.; Car, H. Antioxidant profile of salivary glands in high fat diet‐induced insulin resistance rats.
Oral Dis. 2013, 20, 560–566, doi:10.1111/odi.12173.
98. Zalewska, A.; Knaś, M.; Maciejczyk, M.; Waszkiewicz, N.; Klimiuk, A.; Choromańska, M.; Matczuk, J.;
Waszkiel, D.; Car, H. Antioxidant profile, carbonyl and lipid oxidation markers in the parotid and
submandibular glands of rats in different periods of streptozotocin induced diabetes. Arch. Oral Boil. 2015,
60, 1375–1386, doi:10.1016/j.archoralbio.2015.06.012.
99. Aparna, A.; Shilpa, S.; Surgery, M. Salivary Nitric Oxide (No2+No3) As Biomarker of Dental Caries in
Adults: An Invivo Study. Int. Res. J. Pharm. 2012, 3, 100–102.
100. Maciejczyk, M.; Szulimowska, J.; Taranta‐Janusz, K.; Werbel, K.; Wasilewska, A.; Zalewska, A. Salivary
FRAP as A Marker of Chronic Kidney Disease Progression in Children. Antioxidants 2019, 8, 409,
doi:10.3390/antiox8090409.
101. Maciejczyk, M.; Szulimowska, J.; Skutnik‐Radziszewska, A.; Taranta‐Janusz, K.; Wasilewska, A.;
Wiśniewska, N.; Zalewska, A. Salivary Biomarkers of Oxidative Stress in Children with Chronic Kidney
Disease. J. Clin. Med. 2018, 7, 209, doi:10.3390/jcm7080209.
102. Skutnik‐Radziszewska, A.; Maciejczyk, M.; Flisiak, I.; Krahel, J.; Kołodziej, J.K.U.; Kotowska‐Rodziewicz,
A.; Klimiuk, A.; Zalewska, A. Enhanced Inflammation and Nitrosative Stress in the Saliva and Plasma of
Patients with Plaque Psoriasis. J. Clin. Med. 2020, 9, 745, doi:10.3390/jcm9030745.
103. Zalewska, A.; Knaś, M.; Waszkiewicz, N.; Klimiuk, A.; Litwin, K.; Sierakowski, S.; Waszkiel, D.;
Gindzienska‐Sieskiewicz, E. Salivary antioxidants in patients with systemic sclerosis. J. Oral Pathol. Med.
2013, 43, 61–68, doi:10.1111/jop.12084.
104. Gao, X.; Qi, L.; Qiao, N.; Choi, H.K.; Curhan, G.; Tucker, K.L.; Ascherio, A. Intake of Added Sugar and
Sugar‐Sweetened Drink and Serum Uric Acid Concentration in US Men and Women. Hypertension 2007, 50,
306–312, doi:10.1161/HYPERTENSIONAHA.107.091041.
105. Kumar, S.; Kumar, R.; Bagewadi, N.; Krishnan, N. A study to correlate dental caries experience with total
antioxidant levels of saliva among adolescents in Mangalore. J. Indian Assoc. Public Health Dent. 2015, 13,
122, doi:10.4103/2319‐5932.159045.
106. Kinane, D.F.; Stathopoulou, P.G.; Papapanou, P.N. Periodontal diseases. Nat. Rev. Dis. Prim. 2017, 3, 17038.
107. Paredes‐Sánchez, E.; Montiel‐Company, J.M.; Iranzo‐Cortés, J.E.; Almerich‐Torres, T.; Bellot‐Arcís, C.;
Almerich‐Silla, J.M. Meta‐Analysis of the Use of 8‐OHdG in Saliva as a Marker of Periodontal Disease. Dis.
Markers 2018, 2018, 1–9, doi:10.1155/2018/7916578.
108. Tatakis, D.N., Kumar, P.S. Etiology and pathogenesis of periodontal diseases. Dent Clin. North Am. 2005,
49, 491–516, doi:10.1016/j.cden.2005.03.001. 109. Martínez‐Herrera, M.; López‐Domènech, S.; Silvestre‐Rangil, J.; Bañuls, C.; Víctor, V.M.; Rocha, M. Chronic
periodontitis impairs polymorphonuclear leucocyte–endothelium cell interactions and oxidative stress in
humans. J. Clin. Periodontol. 2018, 45, 1429–1439, doi:10.1111/jcpe.13027.
110. Chandra, R.; Srinivas, G.; Reddy, A.A.; Reddy, B.H.; Reddy, C.; Nagarajan, S.; Naveen, A. Locally delivered
antioxidant gel as an adjunct to nonsurgical therapy improves measures of oxidative stress and periodontal
disease. J. Periodontal Implant. Sci. 2013, 43, 121–129, doi:10.5051/jpis.2013.43.3.121.
111. Mathur, A.; Mathur, L.; Manohar, B.; Mathur, H.; Shankarapillai, R.; Shetty, N.; Bhatia, A. Antioxidant
therapy as monotherapy or as an adjunct to treatment of periodontal diseases. J. Indian Soc. Periodontol.
2013, 17, 21–24, doi:10.4103/0972‐124x.107469.
Appl. Sci. 2020, 10, 6240 33 of 35
112. Raut, C.P.; Sethi, K.S. Comparative evaluation of co‐enzyme Q10 and Melaleuca alternifolia as antioxidant
gels in treatment of chronic periodontitis: A clinical study. Contemp. Clin. Dent. 2016, 7, 377–381,
doi:10.4103/0976‐237X.188572.
113. Sree, S.L.; Sethupathy, S. Evaluation of the efficacy of taurine as an antioxidant in the management of
patients with chronic periodontitis. Dent. Res. J. (Isfahan) 2014, 11, 228–233.
114. Tóthová, L.; Kamodyova, N.; Červenka, T.; Celec, P. Salivary markers of oxidative stress in oral diseases.
Front. Microbiol. 2015, 5, doi:10.3389/fcimb.2015.00073.
115. Trivedi, S.; Lal, N.; Mahdi, A.; Singh, B.; Pandey, S. Association of Salivary Lipid Peroxidation Levels,
Antioxidant Enzymes, and Chronic Periodontitis. Int. J. Periodontics Restor. Dent. 2015, 35, 14–19.
116. Miricescu, D.; Totan, A.; Calenic, B.; Mocanu, B.; Didilescu, A.; Mohora, M.; Spinu, T.; Greabu, M. Salivary
biomarkers: Relationship between oxidative stress and alveolar bone loss in chronic periodontitis. Acta
Odontol. Scand. 2013, 72, 42–47, doi:10.3109/00016357.2013.795659.
117. Karim, S.; Pratibha, P.K.; Kamath, S.; Bhat, G.S.; Kamath, U.; Dutta, B.; Sharma, N.; Archana, B.; Bhat, K.M.;
Guddattu, V. Superoxide dismutase enzyme and thiol antioxidants in gingival crevicular fluid and saliva.
Dent. Res. J. 2012, 9, 266–272.
118. Villa‐Correa, Y.A.; Isaza‐Guzmán, D.M.; Tobón‐Arroyave, S.I. Influence of Periodontal Clinical Status on
Salivary Levels of Glutathione Reductase. J. Periodontol. 2016, 87, 716–724, doi:10.1902/jop.2016.150618.
119. Bazzichi, L.; Ciompi, M.L.; Betti, L.; Rossi, A.; Melchiorre, D.; Fiorini, M.; Giannaccini, G.; Lucacchini, A.
Impaired gluthathione reductase activity and levels of collagenase and elastase in synovial fluid in
rheumatoid arthritis. Clin. Exp. Rheumatol. 2002, 20, 761–766.
120. Wei, D.; Zhang, X.‐L.; Wang, Y.‐Z.; Yang, C.‐X.; Chen, G. Lipid peroxidation levels, total oxidant status and
superoxide dismutase in serum, saliva and gingival crevicular fluid in chronic periodontitis patients before
and after periodontal therapy. Aust. Dent. J. 2010, 55, 70–78, doi:10.1111/j.1834‐7819.2009.01123.x.
121. Yang, P.‐S.; Huang, W.‐C.; Chen, S.‐Y.; Chen, C.‐H.; Lee, C.‐Y.; Lin, C.‐T.; Huang, Y.‐K. Scaling‐Stimulated
Salivary Antioxidant Changes and Oral‐Health Behavior in an Evaluation of Periodontal Treatment
Outcomes. Sci. World J. 2014, 2014, 1–8, doi:10.1155/2014/814671.
122. Meschiari, C.A.; Marcaccini, A.M.; Moura, B.C.S.; Zuardi, L.R.; Tanus‐Santos, J.E.; Gerlach, R.F. Salivary
MMPs, TIMPs, and MPO levels in periodontal disease patients and controls. Clin. Chim. Acta 2013, 421,
140–146, doi:10.1016/j.cca.2013.03.008.
123. Novaković, N.; Todorovic, T.; Rakic, M.; Milinkovic, I.; Dozic, I.; Jankovic, S.; Aleksic, Z.; Cakic, S. Salivary
antioxidants as periodontal biomarkers in evaluation of tissue status and treatment outcome. J. Periodontal
Res. 2013, 49, 129–136, doi:10.1111/jre.12088.
124. Lee, C.‐Y.; Choy, C.S.; Lai, Y.‐C.; Chang, C.‐C.; Teng, N.‐C.; Huang, W.‐T.; Lin, C.‐T.; Huang, Y.‐K. A Cross‐
Sectional Study of Endogenous Antioxidants and Patterns of Dental Visits of Periodontitis Patients. Int. J.
Environ. Res. Public Health 2019, 16, 180, doi:10.3390/ijerph16020180.
125. AlMughrabi, O.M.; Marzouk, K.M.; Hasanato, R.M.; Shafik, S.S. Melatonin levels in periodontal health and
disease. J. Periodontal Res. 2012, 48, 315–321, doi:10.1111/jre.12010.
126. Srinath, R.; Acharya, A.B.; Thakur, S.L. Salivary and Gingival Crevicular Fluid Melatonin in Periodontal
Health and Disease. J. Periodontol. 2010, 81, 277–283, doi:10.1902/jop.2009.090327.
127. Zhang, T.; Andrukhov, O.; Haririan, H.; Müller‐Kern, M.; Liu, S.; Liu, Z.; Rausch‐Fan, X. Total Antioxidant
Capacity and Total Oxidant Status in Saliva of Periodontitis Patients in Relation to Bacterial Load. Front.
Cell. Infect. Microbiol. 2016, 5, doi:10.3389/fcimb.2015.00097.
128. Baser, U.; Gamsiz‐Isik, H.; Cifcibasi, E.; Ademoglu, E.; Yalcin, F. Plasma and salivary total antioxidant
capacity in healthy controls compared with aggressive and chronic periodontitis patients. Saudi Med. J. 2015,
36, 856–861, doi:10.15537/smj.2015.7.11954.
129. Baňasová, L.; Kamodyova, N.; Janšáková, K.; Tóthová, L.; Stanko, P.; Turna, J.; Celec, P. Salivary DNA and
markers of oxidative stress in patients with chronic periodontitis. Clin. Oral Investig. 2014, 19, 201–207,
doi:10.1007/s00784‐014‐1236‐z.
130. Toczewska, J.; Maciejczyk, M.; Konopka, T.; Zalewska, A. Total Oxidant and Antioxidant Capacity of
Gingival Crevicular Fluid and Saliva in Patients with Periodontitis: Review and Clinical Study. Antioxidants
2020, 9, 450, doi:10.3390/antiox9050450.
131. Baltacıoğlu, E.; Yuva, P.; Aydın, G.; Alver, A.; Kahraman, C.; Karabulut, E.; Akalın, F.A. Lipid Peroxidation
Levels and Total Oxidant/Antioxidant Status in Serum and Saliva From Patients With Chronic and
Appl. Sci. 2020, 10, 6240 34 of 35
Aggressive Periodontitis. Oxidative Stress Index: A New Biomarker for Periodontal Disease? J. Periodontol.
2014, 85, 1432–1441, doi:10.1902/jop.2014.130654.
132. Önder, C.; Kurgan, Ş.; Altıngöz, S.M.; Bağış, N.; Uyanık, M.; Serdar, M.A.; Kantarcı, A.; Günhan, M. Impact
of non‐surgical periodontal therapy on saliva and serum levels of markers of oxidative stress. Clin. Oral
Investig. 2016, 21, 1961–1969, doi:10.1007/s00784‐016‐1984‐z.
133. Ahmadi‐Motamayel, F.; Goodarzi, M.T.; Jamshidi, Z.; Kebriaei, R. Evaluation of Salivary and Serum
Antioxidant and Oxidative Stress Statuses in Patients with Chronic Periodontitis: A Case‐Control Study.
Front. Physiol. 2017, 8, doi:10.3389/fphys.2017.00189.
134. Verma, A.; Tripathi, V.; Singh, S.T.; Singh, C.D.; Gill, J.S.; Sharma, V. Assessment of Lipid Peroxidation
Levels and Total Antioxidant Status in Chronic and Aggressive Periodontitis Patients: An in vivo Study. J.
Contemp. Dent. Pract. 2018, 19, 287–291, doi:10.5005/jp‐journals‐10024‐2254.
135. Spite, M.; Summers, L.; Porter, T.; Srivastava, S.; Bhatnagar, A.; Serhan, C.N. Resolvin D1 controls
inflammation initiated by glutathione‐lipid conjugates formed during oxidative stress. Br. J. Pharmacol. 2009,
158, 1062–1073, doi:10.1111/j.1476‐5381.2009.00234.x.
136. Sezer, U.; Çiçek, Y.; Çanakçi, C.F. Increased Salivary Levels of 8‐Hydroxydeoxyguanosine May Be a Marker
for Disease Activity for Periodontitis. Dis. Markers 2012, 32, 165–172, doi:10.1155/2012/215430.
137. Zamora‐Perez, A.L.; Ortiz‐García, Y.M.; Lazalde‐Ramos, B.P.; Guerrero‐Velázquez, C.; Gómez‐Meda, B.C.;
Ramírez‐Aguilar, M.Á.; Zúñiga‐González, G.M. Increased micronuclei and nuclear abnormalities in buccal
mucosa and oxidative damage in saliva from patients with chronic and aggressive periodontal diseases. J.
Periodontal Res. 2014, 50, 28–36, doi:10.1111/jre.12175.
138. Villa‐Correa, Y.A.; Isaza‐Guzmán, D.M.; Tobón‐Arroyave, S.I. Prognostic Value of 8‐Hydroxy‐2′‐
Deoxyguanosine and Human Neutrophil Elastase/α1‐Proteinase Inhibitor Complex as Salivary Biomarkers
of Oxidative Stress in Chronic Periodontitis. J. Periodontol. 2015, 86, 1260–1267.
139. Badea, V.; Balaban, D.P.; Amariei, C.; Nuca, C.; Bucur, L. Salivary 8‐hidroxy‐2‐deoxy guanosine as
oxidative stress biomarker for the diagnosis of periodontal disease. Farmacia 2010, 58, 660–670.
140. Öngöz, D.F.; Özden, F.O.; Avci, B.; Avcı, B. 8‐Hydroxy‐Deoxyguanosine Levels in Gingival Crevicular
Fluid and Saliva in Patients with Chronic Periodontitis after Initial Periodontal Treatment. J. Periodontol.
2013, 84, 821–828, doi:10.1902/jop.2012.120195.
141. Erel, O. A new automated colorimetric method for measuring total oxidant status. Clin. Biochem. 2005, 38,
1103–1111, doi:10.1016/j.clinbiochem.2005.08.008.
142. Zalewska, A.; Maciejczyk, M.; Szulimowska, J.; Imierska, M.; Blachnio‐Zabielska, A. High‐Fat Diet Affects
Ceramide Content, Disturbs Mitochondrial Redox Balance, and Induces Apoptosis in the Submandibular
Glands of Mice. Biomolecules 2019, 9, 877, doi:10.3390/biom9120877.
143. Toczewska, J.; Konopka, T.; Zalewska, A.; Maciejczyk, M. Nitrosative Stress Biomarkers in the Non‐
Stimulated and Stimulated Saliva, as well as Gingival Crevicular Fluid of Patients with Periodontitis:
Review and Clinical Study. Antioxidants 2020, 9, 259, doi:10.3390/antiox9030259.
144. Parwani, S.; Chitnis, P.; Parwani, R. Salivary nitric oxide levels in inflammatory periodontal disease—A
case‐control and interventional study. Int. J. Dent. Hyg. 2011, 10, 67–73, doi:10.1111/j.1601‐5037.2011.00508.x.
145. Scarel‐Caminaga, R.M.; Cera, F.F.; Pigossi, S.C.; Finoti, L.S.; Kim, Y.J.; Viana, A.C.; Secolin, R.; Montenegro,
M.F.F.; Tanus‐Santos, J.E.; Orrico, S.R.P.; et al. Inducible Nitric Oxide Synthase Polymorphisms and Nitric
Oxide Levels in Individuals with Chronic Periodontitis. Int. J. Mol. Sci. 2017, 18, 1128,
doi:10.3390/ijms18061128.
146. Meschiari, C.A.; Zuardi, L.R.; Gomes, V.A.; De Almeida, G.R.C.; Novaes, A.B.; Gerlach, R.F.; Marcaccini,
A.M. Salivary, blood and plasma nitrite concentrations in periodontal patients and healthy individuals
before and after periodontal treatment. Clin. Chim. Acta 2015, 444, 293–296, doi:10.1016/j.cca.2015.02.045.
147. Ozer, L.; Elgün, S.; Özdemir, B.; Pervane, B.; Özmeriç, N. Arginine–Nitric Oxide–Polyamine Metabolism in
Periodontal Disease. J. Periodontol. 2011, 82, 320–328, doi:10.1902/jop.2010.100199.
148. Andrukhov, O.; Haririan, H.; Bertl, K.; Rausch, W.‐D.; Bantleon, H.‐P.; Moritz, A.; Rausch‐Fan, X. Nitric
oxide production, systemic inflammation and lipid metabolism in periodontitis patients: Possible gender
aspect. J. Clin. Periodontol. 2013, 40, 916–923, doi:10.1111/jcpe.12145.
149. Topcu, A.O.; Akalin, F.A.; Sahbazoglu, K.B.; Yamalik, N.; Kilinç, K.; Karabulut, E.; Tözüm, T.F.; Ali, O.T.
Nitrite and Nitrate Levels of Gingival Crevicular Fluid and Saliva in Subjects with Gingivitis and Chronic
Periodontitis. J. Oral Maxillofac. Res. 2014, 5, doi:10.5037/jomr.2014.5205.
Appl. Sci. 2020, 10, 6240 35 of 35
150. Ghasemi, A.; Zahediasl, S.; Mehrabi, Y.; Saadat, N.; Azizi, F. Serum nitric oxide metabolite levels in a
general healthy population: Relation to sex and age. Life Sci. 2008, 83, 326–331, doi:10.1016/j.lfs.2008.06.010.
151. Han, D.‐H.; Kim, M.‐S.; Shin, H.‐S.; Park, K.P.; Kim, H.‐D. Association between Periodontitis and Salivary
Nitric Oxide Metabolites among Community Elderly Koreans. J. Periodontol. 2013, 84, 776–784,
doi:10.1902/jop.2012.120237.
152. Kurgan, Ş.; Onder, C.; Altıngöz, S.M.; Bagis, N.; Uyanik, M.; Serdar, M.A.; Kantarci, A. High sensitivity
detection of salivary 8‐hydroxy deoxyguanosine levels in patients with chronic periodontitis. J. Periodontal
Res. 2015, 50, 766–774, doi:10.1111/jre.12263.
153. Katsuragi, H.; Ohtake, M.; Kurasawa, I.; Saito, K. Intracellular production and extracellular release of
oxygen radicals by PMNs and oxidative stress on PMNs during phagocytosis of periodontopathic bacteria.
Odontology 2003, 91, 13–18, doi:10.1007/s10266‐003‐0022‐1.
154. Huycke, M.M.; Abrams, V.; Moore, D.R.; Tavan, E.; Cayuela, C.; Antoine, J.‐M.; Trugnan, G.; Chaugier, C.;
Cassand, P. Enterococcus faecalis produces extracellular superoxide and hydrogen peroxide that damages
colonic epithelial cell DNA. Carcinogenesis 2002, 23, 529–536, doi:10.1093/carcin/23.3.529.
155. Vlková, B.; Celec, P. Does Enterococcus faecalis contribute to salivary thiobarbituric acid‐reacting
substances? In Vivo (Brooklyn) 2009, 23, 343–345.
© 2020 by the authors. Licensee MDPI, Basel, Switzerland. This article is an open access
article distributed under the terms and conditions of the Creative Commons Attribution
(CC BY) license (http://creativecommons.org/licenses/by/4.0/).


