Embed Size (px)
Citation preview
AMF Written Coursework Assignment
London School of Business and Finance
Module: Accounting and ManagerialFinance
Title: AMF Written Coursework Assignment
Student: Dzmitry Samsonau
Student number: A4050618
Lecturer: Dr. Fara Madehah Ahmad Farid
Date: 25 January 2012
Dzmitry Samsonau - A4050618 Page 1
AMF Written Coursework AssignmentContents
1. Working Capital Policy.……………………………………………………………3
1.1 Working Capital Trade-Offs…………………………………………………3
1.2 Financing Working Capital.…………………………………………………4
1.3 Working Capital Efficiency.…………………………………………………6
1.4 Rating of the Companies.……………………………………………………8
2. Investment Decision Making...……………………………………………………10
2.1 Shareholder’s Equity.………………………………………………………10
2.2 Share Price.…………………………………………………………………11
2.3 Latest News...………………………………………………………………13
2.4 Summarizing..………………………………………………………………13
References...…………………………………………………………………………15
Dzmitry Samsonau - A4050618 Page 2
AMF Written Coursework Assignment1. Working Capital Policy
The first chapter of the actual work is dedicated toanalysing working capital issues and comparing workingcapital policies of real-world organizations.
Working capital of a firm includes the funds investedin its current assets, namely: inventories, accountsreceivable, cash, marketable securities and other currentassets. Companies need to have appropriate amounts ofworking capital in order to carry out their everydaybusiness operations, such as manufacturing, sales andpayments to counterparts.
Another important characteristic of a firm’s workingcapital is it’s net working capital. It is calculated asthe difference between company’s current assets andcurrent liabilities and indicates firm’s liquidity, i.e.ability to pay all the short-term debts on account of owncurrent assets (Parrino, 2011).
The main features and variations of working capitalpolicies will be analyzed further in relation to threewell-known UK retailers: Tesco Plc., Sainsbury Plc., andMorrison Supermarkets Plc.
1.1 Working Capital Trade-Offs
The management of working capital consists ofmanaging the structure and amounts of current assets aswell as determining the best way to finance them.Companies try to optimize the amount of cash,inventories, receivables and payables as well as to findan appropriate balance between long- and short-termfinancing.
In case a company has large working capital, it ismore likely to meet its financial obligations, ensuresthe availability of materials for production and finishedgoods for sale and provides favorable terms to itscustomers and suppliers. But, in the same time, it isliable to higher inventory carrying costs including
Dzmitry Samsonau - A4050618 Page 3
AMF Written Coursework Assignmentopportunity costs of funds not invested on a high-interest basis, storage costs, taxes, insurance, etc.These are the trade-offs of so-called “flexible” strategyon managing current assets.
On the contrary, when a company constantly keeps itsworking capital amount close to the minimum level itavoids additional inventory carrying costs and is able toinvest funds at a high yield. Such strategy of managingworking capital is called “restrictive” and also has itsdrawbacks in form of shortage costs. Financial shortagecosts arise mainly when a company can’t settleliabilities with its own cash. Consequences may includedisadvantageous emergency borrowing and even bankruptcy.Operating shortage costs result from disruptions inproduction processes and unavailability of goods in stockfor customers (Parrino, 2011).
In the real world companies try to adjust theirstrategy so that the sum of carrying and shortage costsis at the minimum level. That’s why strategies they usecan be identified as relatively flexible or relativelyrestrictive.
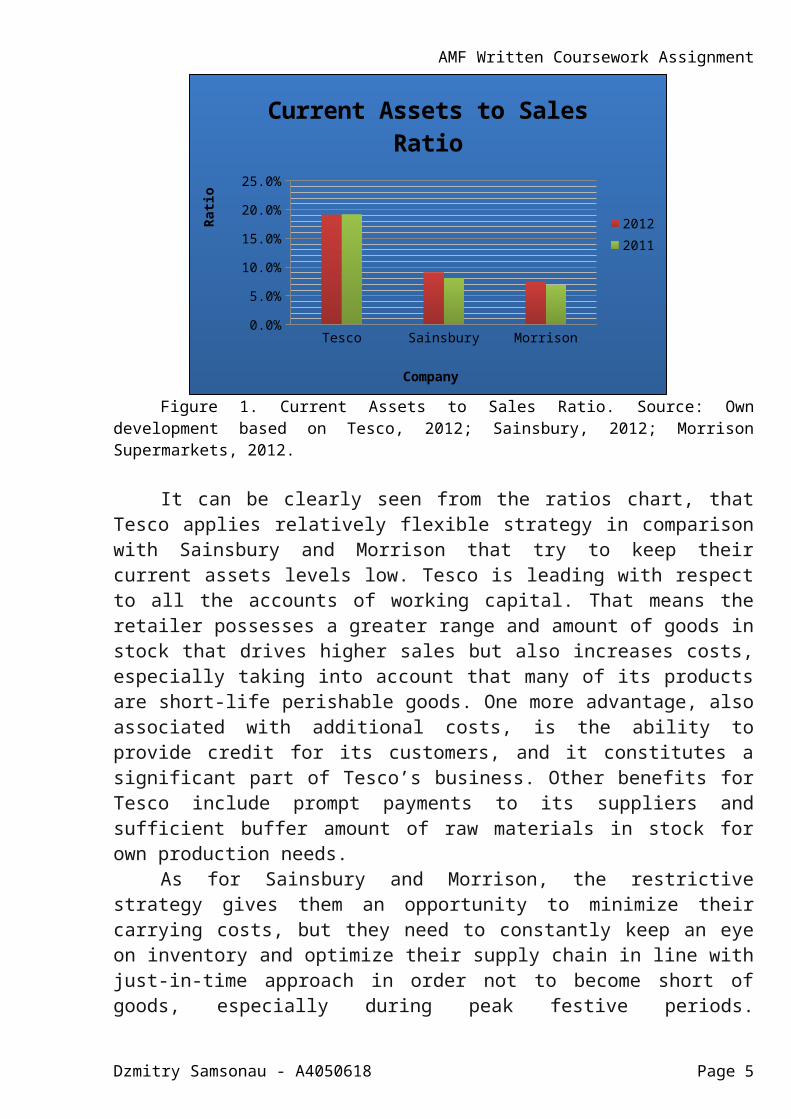
In order to compare the current assets managingstrategies of Tesco, Sainsbury and Morrison, theircurrent assets to sales ratios can be used (Ross, 2008).They are illustrated in Figure 1.
Dzmitry Samsonau - A4050618 Page 4
AMF Written Coursework Assignment
Tesco Sainsbury Morrison0.0%
5.0%
10.0%
15.0%
20.0%
25.0%
Current Assets to Sales Ratio
20122011
Company
Rati
o
Figure 1. Current Assets to Sales Ratio. Source: Owndevelopment based on Tesco, 2012; Sainsbury, 2012; MorrisonSupermarkets, 2012.
It can be clearly seen from the ratios chart, thatTesco applies relatively flexible strategy in comparisonwith Sainsbury and Morrison that try to keep theircurrent assets levels low. Tesco is leading with respectto all the accounts of working capital. That means theretailer possesses a greater range and amount of goods instock that drives higher sales but also increases costs,especially taking into account that many of its productsare short-life perishable goods. One more advantage, alsoassociated with additional costs, is the ability toprovide credit for its customers, and it constitutes asignificant part of Tesco’s business. Other benefits forTesco include prompt payments to its suppliers andsufficient buffer amount of raw materials in stock forown production needs.
As for Sainsbury and Morrison, the restrictivestrategy gives them an opportunity to minimize theircarrying costs, but they need to constantly keep an eyeon inventory and optimize their supply chain in line withjust-in-time approach in order not to become short ofgoods, especially during peak festive periods.
Dzmitry Samsonau - A4050618 Page 5
AMF Written Coursework AssignmentSainsbury’s ratio is a bit higher than Morrison’s thatmeans Sainsbury applies some aspects of the flexiblestrategy, especially concerning cash, as the share ofcash in Sainsbury’s current assets is significantlyhigher than the one of Morrison. This fact can beregarded as an advantage of Sainsbury, because having asubstantial amount of cash on hand is very important forthe overall financial healthiness of a firm and can allowseizing a favorable business opportunity.
1.2 Financing Working Capital
There are three main strategies that describedifferent ways to finance working capital: maturitymatching strategy, long-term funding strategy and short-term funding strategy.
Maturity matching strategy implies financing theworking capital with both short-term and long-term funds.Permanent working capital is financed with long-termfunds. The variable part of working capital, amount ofwhich depends on the season, is financed with short-termfunds.
Firms that use long-term funding strategy finance thewhole working capital with the help of long-term debt.They mobilize enough financial resources to coverpermanent and also seasonal need for working capital andduring the downturn in that need they invest spare fundsin marketable securities to avoid additional carryingcosts.
The last strategy, short-term funding, that is alsocalled aggressive, implies financing the permanentworking capital, a part of seasonal working capital andeven a part of company’s fixed assets with short-termfunds. Managers apply this strategy because of highreturn, although it bares higher risks (Parrino, 2011).
As it can be clearly seen from the balance sheets ofthe companies, Tesco, Sainsbury and Morrison Supermarketsapply short-term, or aggressive financing policy, because
Dzmitry Samsonau - A4050618 Page 6
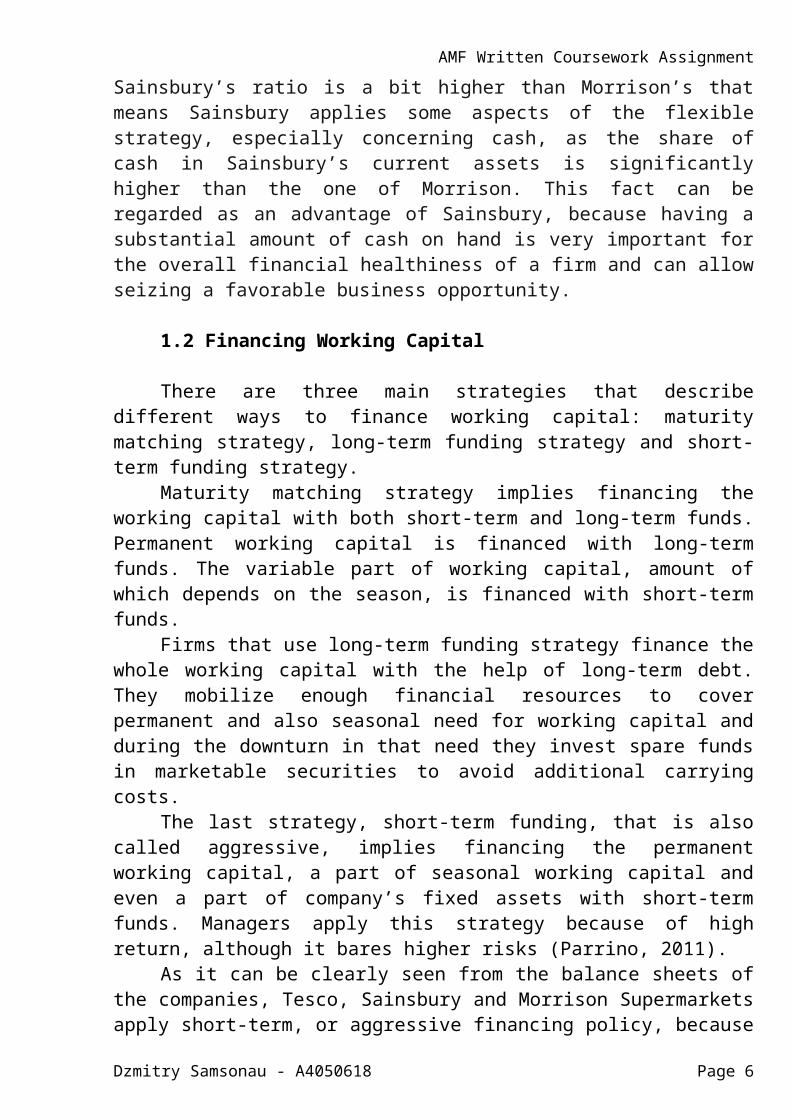
AMF Written Coursework Assignmentthey all have negative working capital that means a partof their current liabilities accounts not just for thewhole amount of current assets, but also for a part offixed ones. See Figure 2.
Assets Liabilities12353 19180
37918 1373117801
Tesco (2012, £m) CurrentNon-currentEquity
Assets Liabilities2032 3136
103083575
5629
Sainsbury (2012, £m)
CurrentNon-currentEquity
Assets Liabilities1322 2303
85372159
5397
Morrison (2012, £m)
CurrentNon-currentEquity
Figure 2. Balance Sheets Structure. Source: Own developmentbased on Tesco, 2012; Sainsbury, 2012; Morrison Supermarkets,2012.
That means a part or the whole permanent workingcapital and a part of fixed assets of all three companiesare funded with short-term debt.
As it can be seen from the companies’ balance sheets,the vast majority of short-term funds come from tradecredit. It is a typical situation for retail sector dueto the nature of supplier-distributor relationship in thefield. It can be said, that suppliers of finished goodspersonally finance the sales of these goods by means ofproviding trade credit to distributors. Another advantageof the named retailers, that gives them an opportunity touse trade credit so widely, is their reputation andproven track of record. Suppliers readily providefavorable terms because they know their goods will besold as soon as possible and paid on time.
At Tesco group, with respect to its banking business,another major source of short-term financing are depositsof customers and other banks. Such an inexpensive source
Dzmitry Samsonau - A4050618 Page 7
AMF Written Coursework Assignmentof funds helps Tesco additionally expand their retailbusiness with less risk, as the company determinesinterest rates basically by itself.
1.3 Working Capital Efficiency
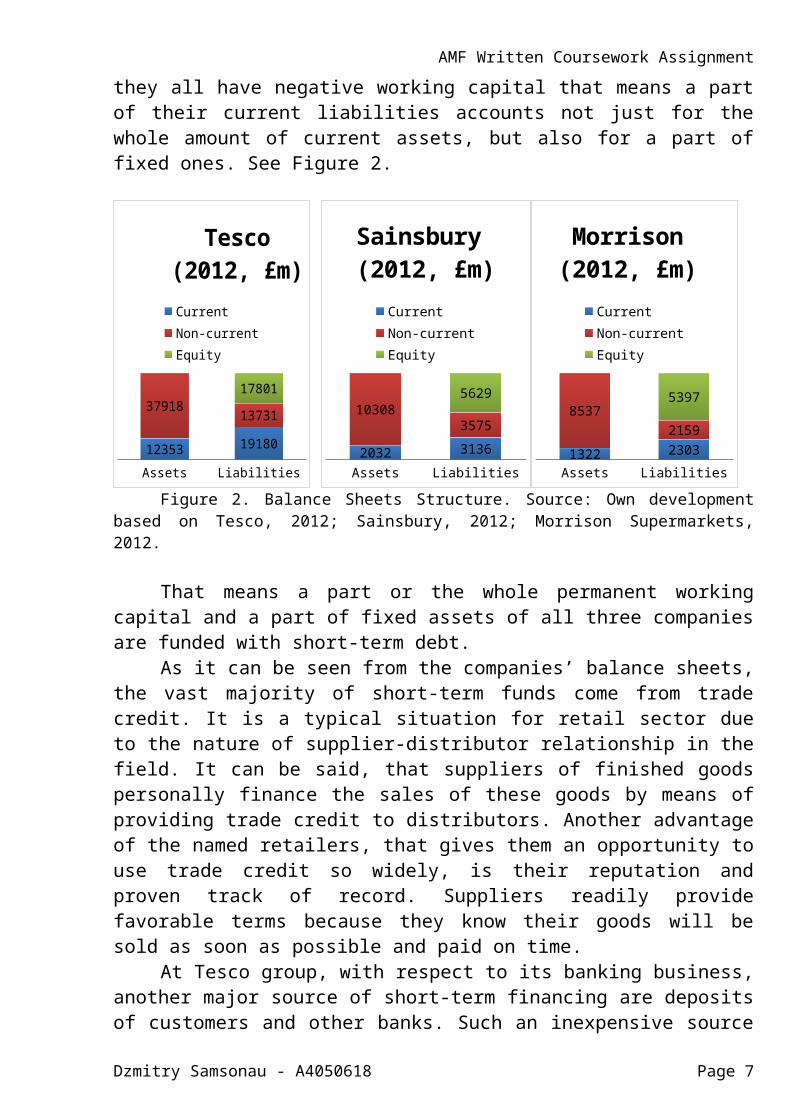
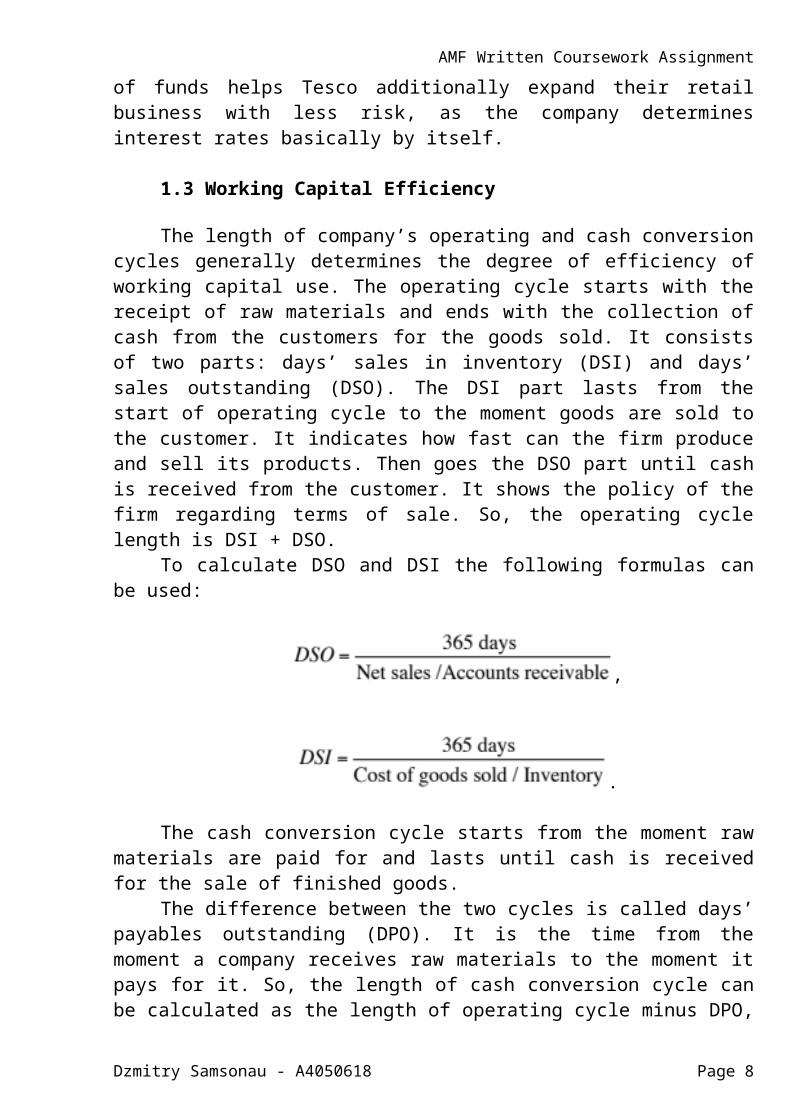
The length of company’s operating and cash conversioncycles generally determines the degree of efficiency ofworking capital use. The operating cycle starts with thereceipt of raw materials and ends with the collection ofcash from the customers for the goods sold. It consistsof two parts: days’ sales in inventory (DSI) and days’sales outstanding (DSO). The DSI part lasts from thestart of operating cycle to the moment goods are sold tothe customer. It indicates how fast can the firm produceand sell its products. Then goes the DSO part until cashis received from the customer. It shows the policy of thefirm regarding terms of sale. So, the operating cyclelength is DSI + DSO.
To calculate DSO and DSI the following formulas canbe used:
,
.
The cash conversion cycle starts from the moment rawmaterials are paid for and lasts until cash is receivedfor the sale of finished goods.
The difference between the two cycles is called days’payables outstanding (DPO). It is the time from themoment a company receives raw materials to the moment itpays for it. So, the length of cash conversion cycle canbe calculated as the length of operating cycle minus DPO,
Dzmitry Samsonau - A4050618 Page 8
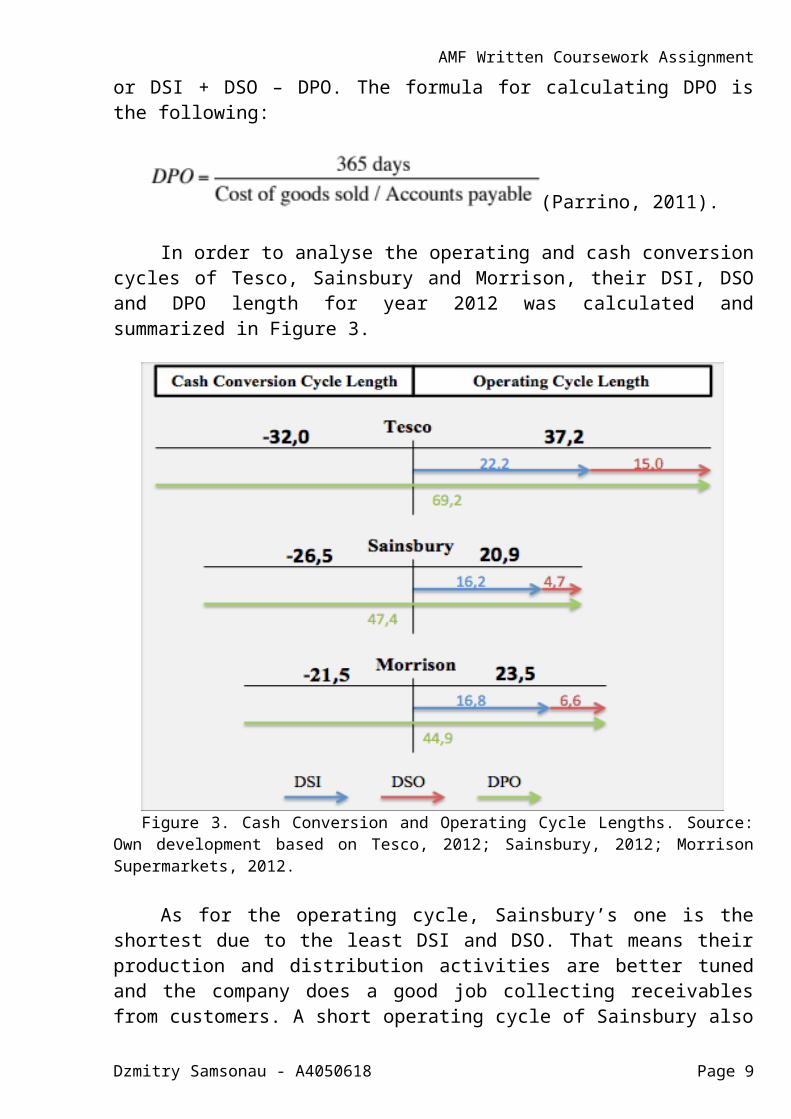
AMF Written Coursework Assignmentor DSI + DSO – DPO. The formula for calculating DPO isthe following:
(Parrino, 2011).
In order to analyse the operating and cash conversioncycles of Tesco, Sainsbury and Morrison, their DSI, DSOand DPO length for year 2012 was calculated andsummarized in Figure 3.
Figure 3. Cash Conversion and Operating Cycle Lengths. Source:Own development based on Tesco, 2012; Sainsbury, 2012; MorrisonSupermarkets, 2012.
As for the operating cycle, Sainsbury’s one is theshortest due to the least DSI and DSO. That means theirproduction and distribution activities are better tunedand the company does a good job collecting receivablesfrom customers. A short operating cycle of Sainsbury also
Dzmitry Samsonau - A4050618 Page 9
AMF Written Coursework Assignmentexplains their ability to invest less in current assets,as the stockturn rate allows saving funds on inventories.Morrison has almost the same situation that also reflectits flexible strategy for working capital management.
The main reason why Tesco needs 60-80% more time thanSainsbury and Morrison to complete its operating cycle isTesco’s DSO that is about 3 times longer than one of itscompetitors. But there are a couple of reasons why Tescocan afford it. First, the favorable terms of sale behindit drive revenues and highly contribute to the success ofTesco on the market. Second, the terms of supply forTesco are so advantageous, that the company’s DPO (69,2days) makes its cash conversion cycle (-32 days) the mosteffective among the three featuring companies. The fact that all three retailers have negative cashconversion cycle length indicates a trend in theindustry: suppliers finance not only the sales of theirproducts and cash collection period, but also a part ofanother operating cycle of retailers. Sainsbury’s DPOlasts even more than two operating cycles.
According to Moss and Stine (1993), this situationcan be explained with the fact that companies in theretail industry often sell their products for cashinstead of credit and also store inventories for arelatively short period, as consumer goods are easier tosell.
Also it should be outlined that the cash conversioncycle of all three companies is much more efficient thanthe industry average -12,9 days primarily due to longerDPO, as DSI and DSO industry averages (17,4 and 5,0) areclose to DSI and DSO of the listed companies (Deloitte,2012). This fact correlates with the study of Moss andStine (1993) that infers shorter cash conversion cycle tobe a feature of larger retail companies.
Another indicator of working capital management efficiency is the liquidity of the company. Two ratios can be used to measure liquidity: current ratio and quickratio.
Dzmitry Samsonau - A4050618 Page10
AMF Written Coursework Assignment
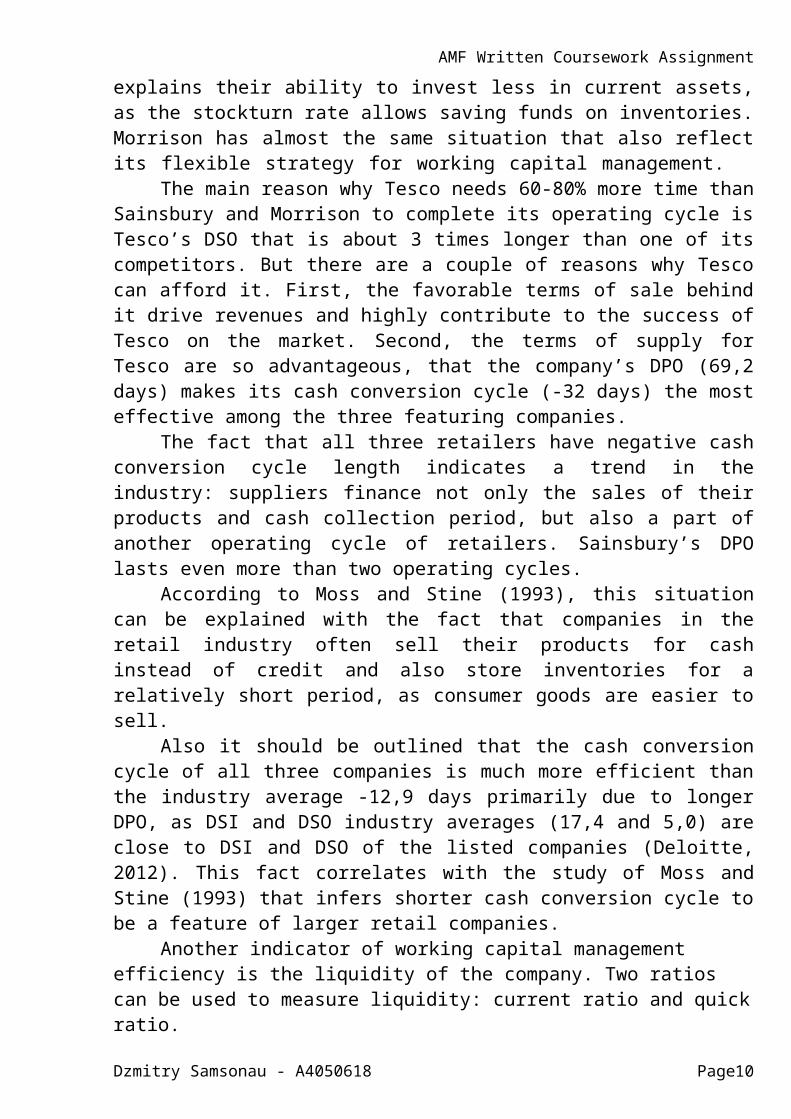
The ratios indicate the following: how much thecurrent liabilities of the firm are backed with all ofits current assets (current ratio) and with the mostliquid assets (quick ratio) (Ross, 2008). Figure 4 allowscomparing the liquidity of Tesco, Sainsbury and Morrisonfor year 2012.
Current ratio
Quick ratio
0% 10% 20% 30% 40% 50% 60% 70%
Liquidity, 2012
TescoSainsburyMorrison
Figure 4. Liquidity Ratios. Source: Own development based
on Tesco, 2012; Sainsbury, 2012; Morrison Supermarkets, 2012.
The current ratio of all three companies is less than100% because of negative net working capital, the cause of which was discussed earlier. The overall leadership inliquidity belongs to Tesco on account of liquid assets, primarily cash, even though Sainsbury has a slightly greater current liquidity.
1.4 Rating of the Companies
As Sainsbury and Morrison have the same restrictivestrategy for investments in working capital andapproximately the same amount of net working capital,
Dzmitry Samsonau - A4050618 Page11
AMF Written Coursework Assignmentthese two companies are easy to compare in terms ofworking capital management efficiency. Sainsbury hasgreater current liquidity than Morrison (65% against57%), greater quick liquidity (35% against 24%), betteroptimized operating and cash conversion cycles. So it canbe stated that Sainsbury manages its working capital in amore efficient way with respect to every aspect.
When comparing Sainsbury with Tesco, their overallworking capital management strategies should be comparedfirst. It can be argued, that restrictive strategyadopted by Sainsbury is more efficient than Tesco’sflexible strategy, as according to Rafuse (1996), “lean”companies, or companies with the lowest level ofinventories possible are systematically better in everyaspect than their competitors. He argues, that reducingstock levels highly improves firm’s performance onaccount of eliminating excessive inventories and thoughcan’t be regarded as a trade-off.
Nevertheless Tesco managed to overcome the maindrawback of their strategy - higher length of theoperating cycle and achieved a faster cash conversionrate (-32 days against Sainsbury’s 26,5 days). Accordingto Nobanee et al. (2011), the cash conversion cyclelength is the main characteristic of working capitalmanagement efficiency, so Tesco gains a lot of credit forthis indicator.
With respect to companies’ liquidity, Tesco hasgreater quick ratio and approximately the same currentratio as Sainsbury. The reason is Tesco, being a providerof banking services and the biggest UK retailer at themoment, possesses significantly higher amounts of cash.This most liquid asset plays crucial role within thebusiness and determines its long-term financial health toa very high extent (Abuzayed, 2012).
So, after summarizing all the points, Tesco can besaid to have the best working capital management amongthe three listed companies. It can be argued, thateffective and efficient management of current assets is
Dzmitry Samsonau - A4050618 Page12
AMF Written Coursework Assignmentone of competitive advantages that drive success of theleading UK retailer.
Dzmitry Samsonau - A4050618 Page13
AMF Written Coursework Assignment2. Investment Decision Making
Some companies possess excessive amounts of cash on ashort-term or long-term basis, for example, as a resultof flexible strategy on managing current assets or due tolong-term strategy of their financing. These companiesneed to invest their cash in marketable securities inorder to stay liquid and not to loose on carrying costs.One of the best solutions in this situation is to buystock of a highly profitable company, but many factorsneed to be considered in order to choose the bestinvestment. So the next part of the actual work is goingto cover some of these factors. The example of Europeanautomobile industry with regard to its three majorcompanies: Volkswagen AG, Daimler AG and Renault SA, willbe used further to carry out a basic comparative analysisof companies’ investment attractiveness.
2.1 Shareholder’s Equity
One of two main ways to raise funds for a firm, inline with borrowing, is issuing ordinary and preferenceshares. The amount of funds raised through these twosources of equity together with retained earnings andsurplus in various reserves constitute the growth ofshareholder’s equity of a firm. The amount ofshareholder’s equity of a company is the differencebetween its total assets and total liabilities. It showsthe funds that will be left to shareholders in case acompany sells all of its assets to pay off all of itsliabilities. The true value of shareholder’s equity canbe calculated if total assets and liabilities arereported at their current market value (Ross, 2008).
The structure and volume of shareholder’s equity canbe the source of information about company’s historical,recent and even future performance. The amount ofshareholders equity of Volkswagen, Daimler and Renault
Dzmitry Samsonau - A4050618 Page14
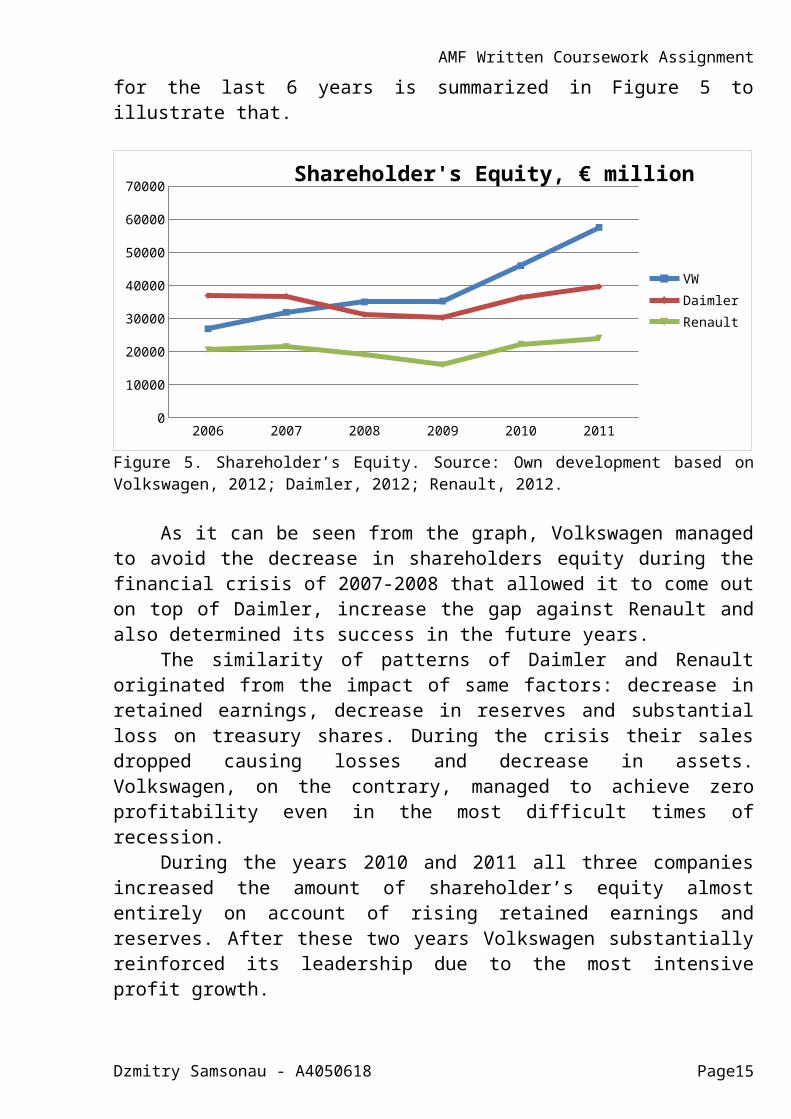
AMF Written Coursework Assignmentfor the last 6 years is summarized in Figure 5 toillustrate that.
2006 2007 2008 2009 2010 20110
10000
20000
30000
40000
50000
60000
70000 Shareholder's Equity, € million
VWDaimlerRenault
Figure 5. Shareholder’s Equity. Source: Own development based onVolkswagen, 2012; Daimler, 2012; Renault, 2012.
As it can be seen from the graph, Volkswagen managedto avoid the decrease in shareholders equity during thefinancial crisis of 2007-2008 that allowed it to come outon top of Daimler, increase the gap against Renault andalso determined its success in the future years.
The similarity of patterns of Daimler and Renaultoriginated from the impact of same factors: decrease inretained earnings, decrease in reserves and substantialloss on treasury shares. During the crisis their salesdropped causing losses and decrease in assets.Volkswagen, on the contrary, managed to achieve zeroprofitability even in the most difficult times ofrecession.
During the years 2010 and 2011 all three companiesincreased the amount of shareholder’s equity almostentirely on account of rising retained earnings andreserves. After these two years Volkswagen substantiallyreinforced its leadership due to the most intensiveprofit growth.
Dzmitry Samsonau - A4050618 Page15
AMF Written Coursework Assignment2.2 Share Price
Another factor to be considered while choosing thebest company to invest in is its share price, because itrepresents the value of future cash flows an investorwill receive from the company. Although it is formed onsecondary markets and doesn’t affect an organizationdirectly, share price can provide some useful informationabout the recent state of things and perspectives in thecompany, as it indicates the amount of supply and demandfor company stock (Ross, 2008).
Firstly, higher stock price, in comparison withcompetitors, displays better general reputation of a firmincluding stable running for a long time, brandperception and successful company management, asshareholders want to keep their money in a safe place.
Secondly, the stock price of an organization highlydepends on its historical profitability. Companies withhigher earnings-per-share indicator usually have a higherstock price, as they are more likely to give out highdividends and prosper in the future, driving their shareprice further up. The last condition is the main one,because investors are usually comfortable with low orzero dividends as far as this leads to future marketvalue growth of their stock (Hussainey et al., 2011).
The main advantage for companies themselves is thathigher share price on the secondary market provides themwith lower costs of equity as primary market prices arehighly influenced by it (Coyle and Graham, 2007).
For investors stock price is sometimes a morevaluable source of information about a firm thanfinancial reports, as the price is an observable,frequently updated indicator and it reflects long-termeffect that news and managerial decisions have oncompany’s performance (Damodaran, 2010).
In order to compare and analyze the share prices ofVolkswagen, Daimler and Renault, the available historical
Dzmitry Samsonau - A4050618 Page16
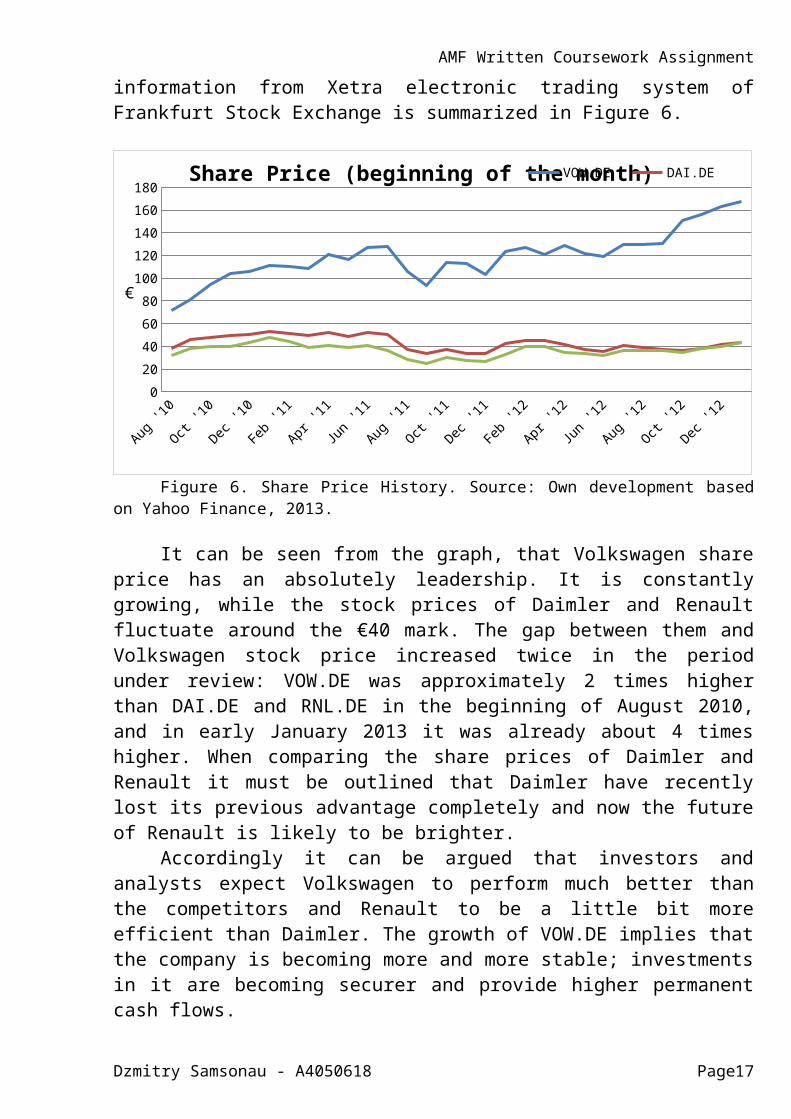
AMF Written Coursework Assignmentinformation from Xetra electronic trading system ofFrankfurt Stock Exchange is summarized in Figure 6.
Aug '10
Oct '10
Dec '10
Feb '11
Apr '11
Jun '11
Aug '11
Oct '11
Dec '11
Feb '12
Apr '12
Jun '12
Aug '12
Oct '12
Dec '12
020406080100120140160180
Share Price (beginning of the month)VOW.DE DAI.DE
€
Figure 6. Share Price History. Source: Own development basedon Yahoo Finance, 2013.
It can be seen from the graph, that Volkswagen shareprice has an absolutely leadership. It is constantlygrowing, while the stock prices of Daimler and Renaultfluctuate around the €40 mark. The gap between them andVolkswagen stock price increased twice in the periodunder review: VOW.DE was approximately 2 times higherthan DAI.DE and RNL.DE in the beginning of August 2010,and in early January 2013 it was already about 4 timeshigher. When comparing the share prices of Daimler andRenault it must be outlined that Daimler have recentlylost its previous advantage completely and now the futureof Renault is likely to be brighter.
Accordingly it can be argued that investors andanalysts expect Volkswagen to perform much better thanthe competitors and Renault to be a little bit moreefficient than Daimler. The growth of VOW.DE implies thatthe company is becoming more and more stable; investmentsin it are becoming securer and provide higher permanentcash flows.
Dzmitry Samsonau - A4050618 Page17
AMF Written Coursework AssignmentOne of the reasons for the actual situation is the
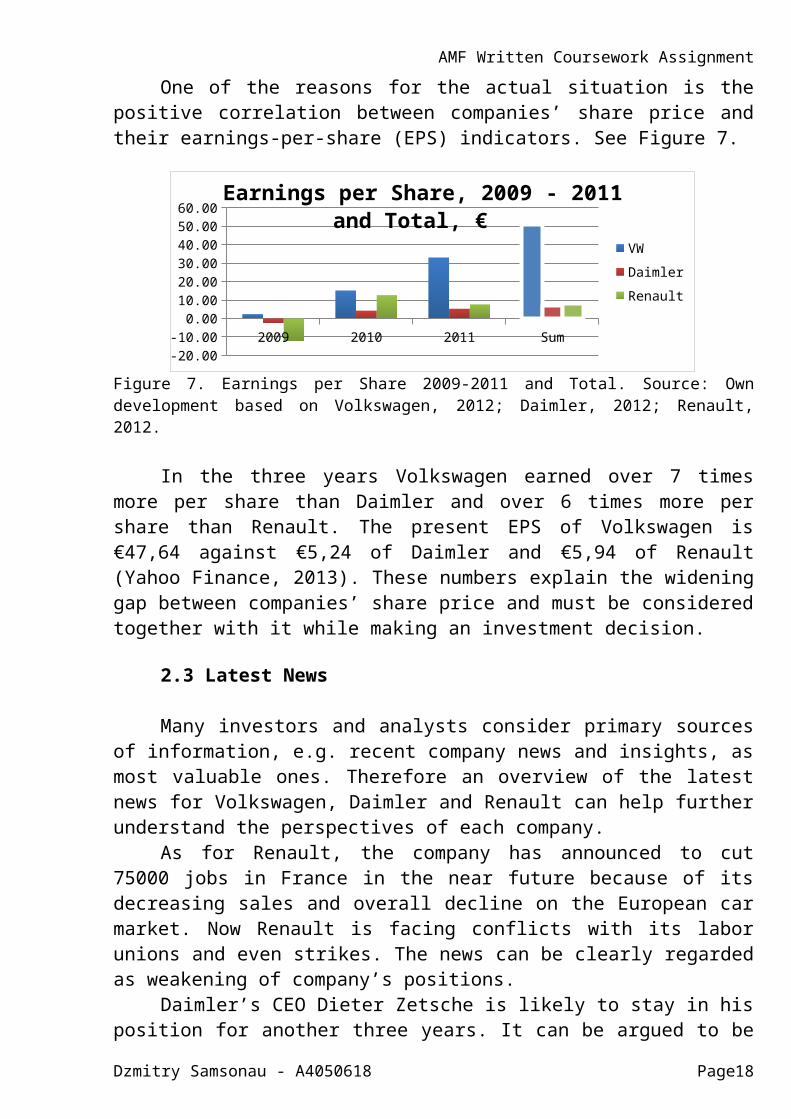
positive correlation between companies’ share price andtheir earnings-per-share (EPS) indicators. See Figure 7.
2009 2010 2011 Sum-20.00-10.000.0010.0020.0030.0040.0050.0060.00
Earnings per Share, 2009 - 2011 and Total, €
VWDaimlerRenault
Figure 7. Earnings per Share 2009-2011 and Total. Source: Owndevelopment based on Volkswagen, 2012; Daimler, 2012; Renault,2012.
In the three years Volkswagen earned over 7 timesmore per share than Daimler and over 6 times more pershare than Renault. The present EPS of Volkswagen is€47,64 against €5,24 of Daimler and €5,94 of Renault(Yahoo Finance, 2013). These numbers explain the wideninggap between companies’ share price and must be consideredtogether with it while making an investment decision.
2.3 Latest News
Many investors and analysts consider primary sourcesof information, e.g. recent company news and insights, asmost valuable ones. Therefore an overview of the latestnews for Volkswagen, Daimler and Renault can help furtherunderstand the perspectives of each company.
As for Renault, the company has announced to cut75000 jobs in France in the near future because of itsdecreasing sales and overall decline on the European carmarket. Now Renault is facing conflicts with its laborunions and even strikes. The news can be clearly regardedas weakening of company’s positions.
Daimler’s CEO Dieter Zetsche is likely to stay in hisposition for another three years. It can be argued to be
Dzmitry Samsonau - A4050618 Page18
AMF Written Coursework Assignmentnegative news for investors, as under his controlMercedes hasn’t been able to bypass its premium carssegment rival brands, i.e. Audi and BMW, although Zetschesays it is going to happen in 2020. Now the company risksto significantly miss the operating profit target andadmits its inability to keep up with competition in smallcars market and in China.
The recent news about Volkswagen say the companyseeks full control over MAN, the lorry brand in whichmore than 75% belongs to the German car manufacturinggroup. The move is going to be followed with ending thecurrent commercial vehicles partnership with Daimler. Thenews show Volkswagen is working towards building an all-sufficient global empire producing cars, trucks andmotorcycles that correlates with its plans to become thenumber one cars manufacturer in the nearest future (YahooFinance, 2013).
2.4 Summarizing
As it was previously outlined, making an investmentdecision requires precise evaluation of numerous factors.To make a final proposition in this regard aboutVolkswagen, Daimler and Renault, several ratios can beused in addition to previous analysis.
First indicator that can be used to measure company’sability to create value for shareholders is market-to-book ratio. It compares company’s market value per shareto its book value per share, or the amount of totalequity divided by the number of shares outstanding.Volkswagen has the best market-to-book ratio among thefeaturing companies. It is 1,37 comparing to 1,17 ofDaimler and only 0,48 of Renault, meaning the marketvalue of Renault investments is lower than its cost(Ross, 2008).
Furthermore, Volkswagen shares have the lowest price-to-earnings ratio that is 3,63 against 8,37 of Daimlerand 7,4 of Renault. According to Kang (2004), the lower
Dzmitry Samsonau - A4050618 Page19
AMF Written Coursework Assignmentthis ratio is the more growth can be expected in thefuture.
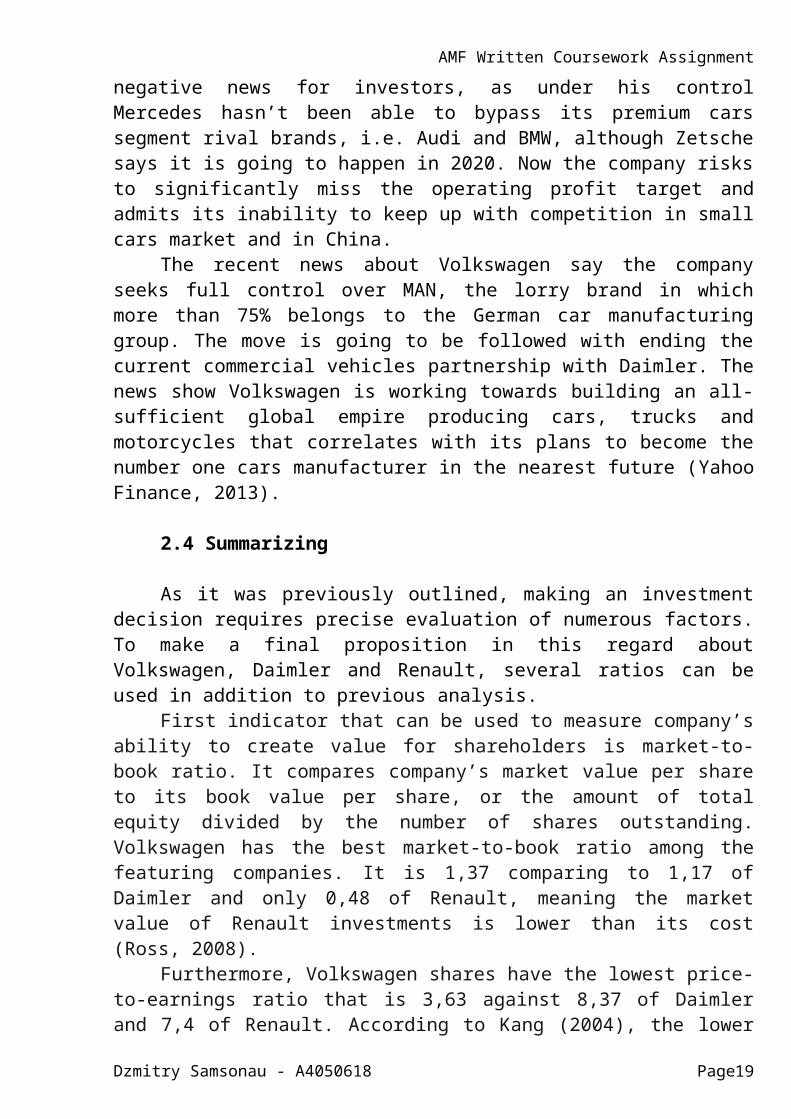
The true bottom line indicator of company’sperformance for its shareholders is return-on-equity thatshows the ratio between company’s net income and theamount of total equity. See Figure 8.
ROE 2009 2010 2011VW 2,58% 15,72% 27,46%Daimler -8,74% 12,85% 15,22%Renault -19,20% 15,70% 8,88%
Figure 8. Return on Equity. Source: Source: Own developmentbased on Volkswagen, 2012; Daimler, 2012; Renault, 2012.
The table shows that Volkswagen shareholdersbenefited most during the three years and ROE of thecompany has the best upward trend that predicts futureshare price increase (Alam and Brown, 2006).
Combining all the above information it can beconcluded, that the best company to invest in among thethree listed is Volkswagen AG. Although the company hasshown significant growth in the last couple of years, itstill has a great reserve for expansion. It is leadingamong the mentioned companies with respect to each andevery factor, including the amount of shareholder’sequity, return on equity, share price, earnings pershare, share price to earnings, market value of a shareto book value and finally the best prospects according tothe news. Thereby it can be argued that purchasingVolkswagen shares would create the best value for anybusinesses or individuals.
Dzmitry Samsonau - A4050618 Page20
AMF Written Coursework AssignmentReferences
1. Abuzayed, B. (2012) Working Capital Management and Firms' Performance in Emerging Markets: the Case of Jordan, International Journal of Managerial Finance, 8 (2), pp.155-179.
2. Alam, P. and Brown, C.A. (2006) Disaggregated Earnings and the Prediction of ROE and Stock Prices, Review of Accounting and Finance, 5 (4), pp.443-463.
3. Coyle, B. and Graham, A. (2007) Capital Structuring. Chicago: Fitzroy Dearborn.
4. Daimler (2012) Annual Reports for 2007-2011 [Online]. Available at: http://www.daimler.com/investor-relations/reports-and-key-figures/reports (Accessed: 16 January 2013).
5. Damodaran, A. (2010) Applied Corporate Finance, 3rd edition.London: Wiley.
6. Deloitte (2012) Working Capital Performance Study [Online]. Available at: http://www.deloitte.com/assets/Dcom-UnitedKingdom/Local%20Assets/Documents/Market%20insights/uk-mi-working-capital-report.pdf (Accessed: 8 January 2013).
7. Hussainey, K., Mgbame, C.O. and Chijoke-Mgbame, A.M. (2011) Dividend Policy and Share Price Volatility: UKEvidence, The Journal of Risk Finance, 12 (1), pp.57-68.
8. Kang, T. (2004) Quality of Earnings Inferred from theProfitability of EP Trading Rules, Managerial Finance, 30(11), pp.30-44.
9. Morrison Supermarkets (2012) Annual Report and Financial Statements 2011/12 [Online]. Available at: http://www.morrisons.co.uk/Documents/Final%20annual%20report%202011_12.pdf (Accessed: 11 January 2013).
10. Moss, J.D. and Stine, B. (1993) Cash Conversion Cycleand Firm Size: a Study of Retail Firms, Managerial Finance, 19 (8), pp.25-34.
11. Nobanee, H., Abdullatif, M. and AlHajjar, M. (2011) Cash Conversion Cycle and Firm's Performance of
Dzmitry Samsonau - A4050618 Page21
AMF Written Coursework AssignmentJapanese Firms, Asian Review of Accounting, 19 (2), pp.147-156.
12. Parrino, R., Kidwell, D.S. and Bates, T.W. (2011) Fundamentals of Corporate Finance, 2nd edition. London: Wiley.
13. Rafuse, M.E. (1996) Working Capital Management: an Urgent Need to Refocus, Management Decision, 34 (2), pp.59-63.
14. Renault (2012) Annual Reports for 2007-2011 [Online]. Available at: http://www.renault.com/en/finance/presentations-et-documents/pages/documents-et-presentations.aspx (Accessed: 16 January 2013).
15. Ross, S.A., Westerfield, R.W. and Jordan, B.D. (2008)Fundamentals of Corporate Finance, 8th edition. London: McGraw-Hill.
16. Sainsbury (2012) Annual Report and Financial Statements 2012 [Online]. Available at: http://annualreport2012.j-sainsbury.co.uk/ (Accessed: 11 January 2013).
17. Tesco (2012) Annual Report and Financial Statements 2012 [Online]. Available at: http://www.tescoplc.com/files/pdf/reports/tesco_annual_report_2012.pdf (Accessed: 11 January 2013).
18. Volkswagen (2012) Annual Reports for 2007-2011 [Online]. Available at: http://www.volkswagenag.com/content/vwcorp/info_center/en/publications/publications.acq.html/archive-on/icr-financial_publications!annual_reports/ (Accessed: 16 January 2013).
19. Yahoo Finance (2013) XETRA Quotes [Online]. Available at: http://uk.finance.yahoo.com/ (Accessed: 16-25 January 2013).
Dzmitry Samsonau - A4050618 Page22


