Embed Size (px)
Citation preview
ASSIGNMENT 1
1.IntroductionPortable computers were originally developed and then modern
laptops were developed which composed of components such as
keyboard, desktop, touch pad and AC adapter which is used as a
rechargeable battery made into a single unit. Laptops are also
called as notebook computers. In September 1975, the first
portable computer was introduced. The flip form factor was the
first laptops introduced in 1980s and it was first released in
Australia by Dulmont Magnum in the period from 1981-1982. But the
laptops were not internationally marketed. Gavilon SC was the one
who first introduced and named the word “laptop” in the year 1983
by the manufacturer.
There are so many techniques developed in order to maximize the
battery life in portable computers and this was also added in the
laptop such as touch pad, handwriting recognition, pointing stick
etc. VGA resolution and increasing screen resolution was
introduced in 1988 and the display feature got upgraded with its
big resolution screen and size.
P a g e | 1
ASSIGNMENT 1 Figure 1:
Samsung symbol
Samsung was started as a small export business in Korea, now it
is one of the largest worlds’s leading in the world in the field
of electronics industries. Samsung’s main specialization is media
and digital appliances. Samsung’s products are more innovative
and considered as the top quality products in the world even
today. Their products and processes expanded widely and its
growth in market share and revenue touched the peak and made the
life of consumers even better in the entire world.
Globally there are approximately 270,000 employees and the
company is operated in 67 countries all over the world. Samsung
mainly believe in ethical management is acting not only as a tool
for prompt changes in business but also acts as a vehicle for
constituting trust in various stakeholders such as customers,
employers, shareholders, business partners and the local
communities. In 2011 revenues, $149 billion which is revolution
in the history of Electronic company in the world.
P a g e | 2
ASSIGNMENT 1
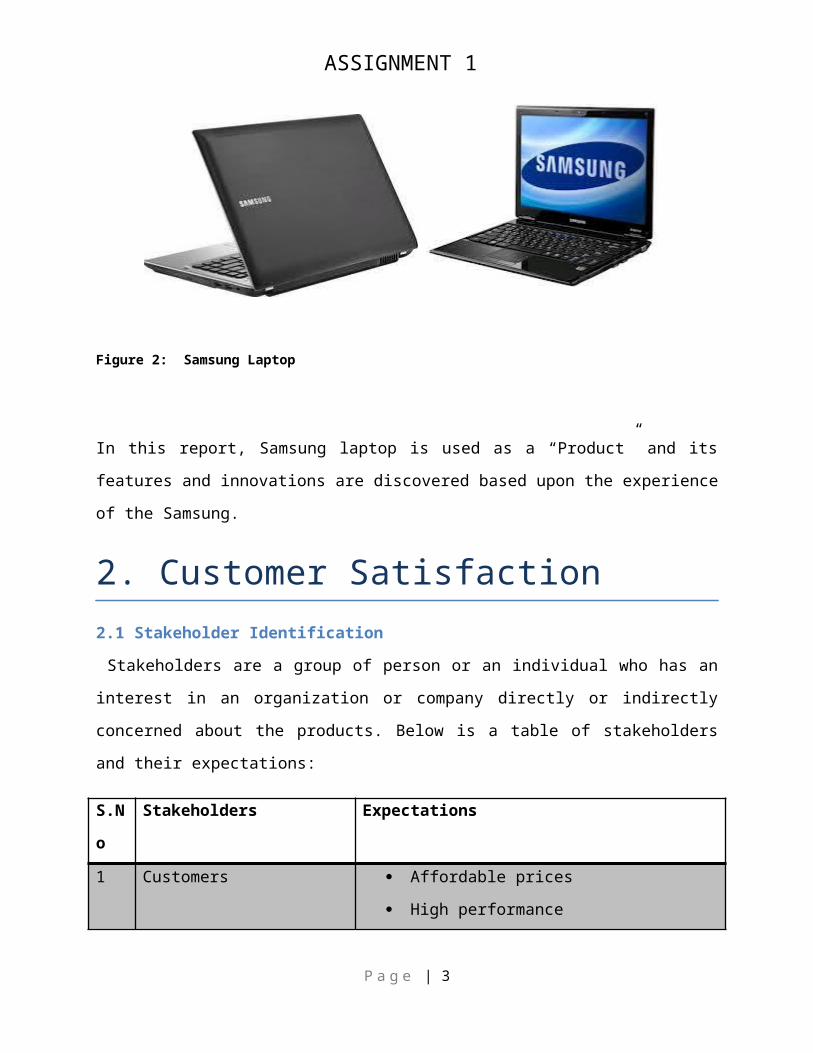
Figure 2: Samsung Laptop
In this report, Samsung laptop is used as a “Product” and its
features and innovations are discovered based upon the experience
of the Samsung.
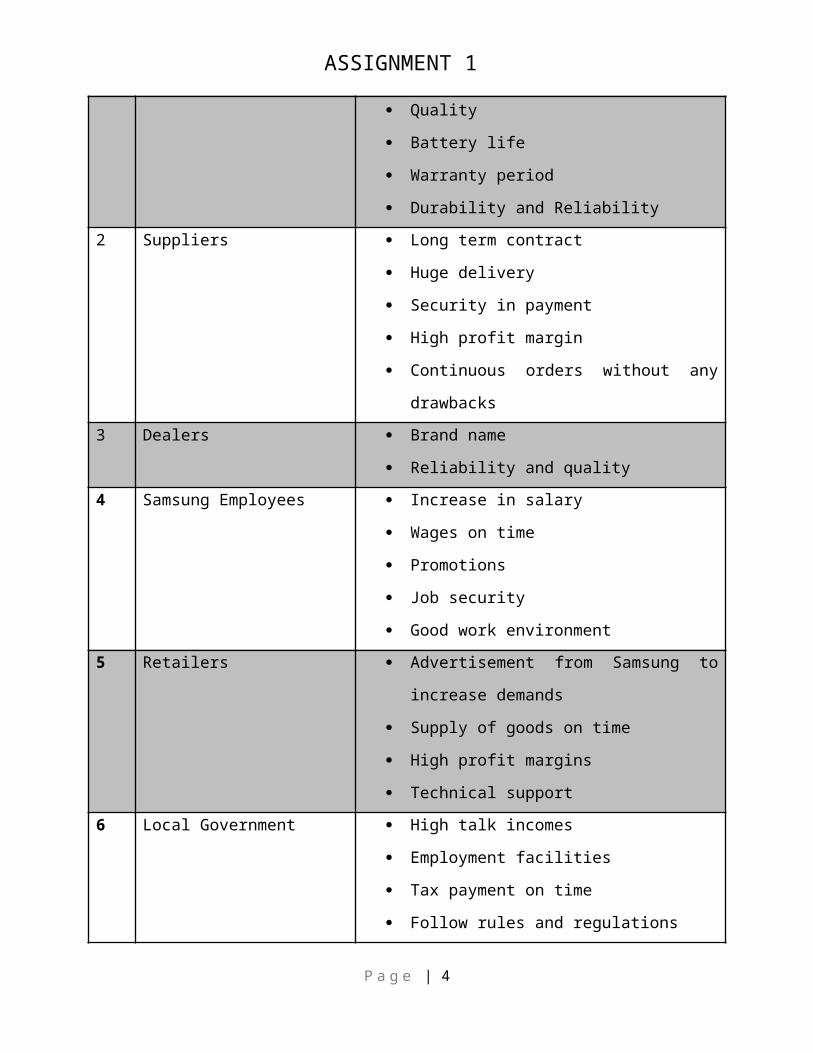
2. Customer Satisfaction2.1 Stakeholder Identification
Stakeholders are a group of person or an individual who has an
interest in an organization or company directly or indirectly
concerned about the products. Below is a table of stakeholders
and their expectations:
S.N
o
Stakeholders Expectations
1 Customers Affordable prices
High performance
P a g e | 3
ASSIGNMENT 1
Quality
Battery life
Warranty period
Durability and Reliability2 Suppliers Long term contract
Huge delivery
Security in payment
High profit margin
Continuous orders without any
drawbacks3 Dealers Brand name
Reliability and quality4 Samsung Employees Increase in salary
Wages on time
Promotions
Job security
Good work environment5 Retailers Advertisement from Samsung to
increase demands
Supply of goods on time
High profit margins
Technical support6 Local Government High talk incomes
Employment facilities
Tax payment on time
Follow rules and regulations
P a g e | 4
ASSIGNMENT 1
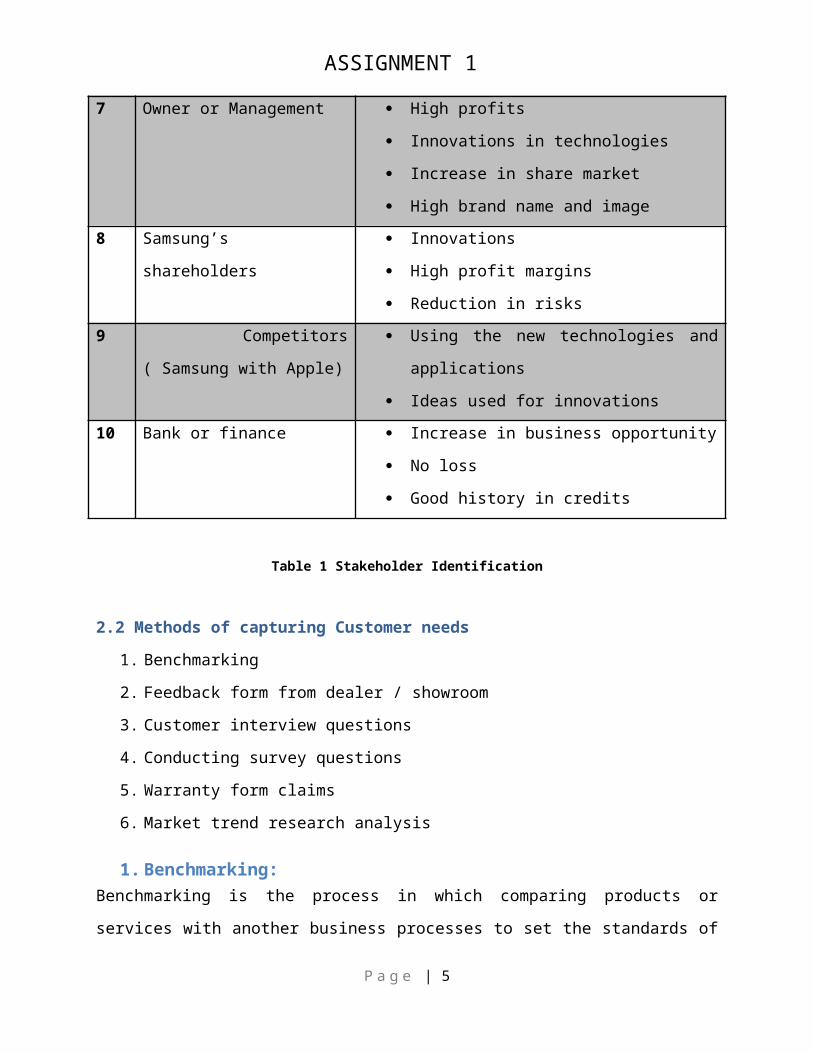
7 Owner or Management High profits
Innovations in technologies
Increase in share market
High brand name and image8 Samsung’s
shareholders
Innovations
High profit margins
Reduction in risks9 Competitors
( Samsung with Apple)
Using the new technologies and
applications
Ideas used for innovations10 Bank or finance Increase in business opportunity
No loss
Good history in credits
Table 1 Stakeholder Identification
2.2 Methods of capturing Customer needs
1. Benchmarking
2. Feedback form from dealer / showroom
3. Customer interview questions
4. Conducting survey questions
5. Warranty form claims
6. Market trend research analysis
1. Benchmarking:Benchmarking is the process in which comparing products or
services with another business processes to set the standards of
P a g e | 5
ASSIGNMENT 1 the industry. Benchmarking helps not only to compare the
different company’s products but also to analyze and identify the
improvements initiated in one’s company or organization. This
will help to achieve target as well as more importantly, products
or process explains how and why these companies are successful.
From this we will know how the customer are getting benefitted
from the product or not and also benchmarking which is against
the competitors can result into tensions as they are feared to
lose competition in the firms.
2. Feedback form from dealer:
In order to know about the purchase of the customer after buying
a product it is important to give the feedback form to the
customers and ask them to fill in because that is directly given
by the customer. Also this is added advantage which will advance
the product and helps to satisfy the needs and wants of the
customer.
3. Customer interview questions:
Customer interviews can be done through face to face or through
telephone calls. Interviews by face to face are expensive and
time consumption will exceed whereas telephone interviews are
quicker and cheaper also. Interview questions may directly state
the needs and satisfaction of the customers. Interviewing the
customer by asking comprehensive questions will avoid confusions
and will be explained by the interviewer. This will help to get
clear customer outcome and answers as well.
P a g e | 6
ASSIGNMENT 1 4. Conducting survey questions:
Instead of conducting interviews, conducting surveys will make
work easy and has good reach because of reach of so many
customers online or by mail. Customers can fill the forms easily
by completing the questions and send it for data processing. All
questions are framed directly to avoid confusions. Mail questions
typically have low rates for the response say approximately 20%
whereas face to face interviews have 85% response.
5. Warranty form claims:Warranty claims can be used for the shortcomings of the products
and to assess the customer satisfaction. Using these the claims
are determined to identify whether the customers are satisfied or
not and if not satisfied they are valued but this is considered
as the expensive source. The products which were returned by the
customers are used for insight of the company and see how
customers handled that products and why mistakes and errors
occurred. By testing these products errors can be detected and
adjustments will be made for the current process or the current
products.
6. Market trend research analysis:
Market research is conducted by marketing agencies to find the
position in a market of a product, performance of a product,
customer needs and satisfaction. There are two ways of research
analysis:
time frame analysis
P a g e | 7
ASSIGNMENT 1 point in time analysis
Time frame analysis is nothing but discovering changes in
behavior with respect to time and point in time analysis is only
for current situation in the research market.
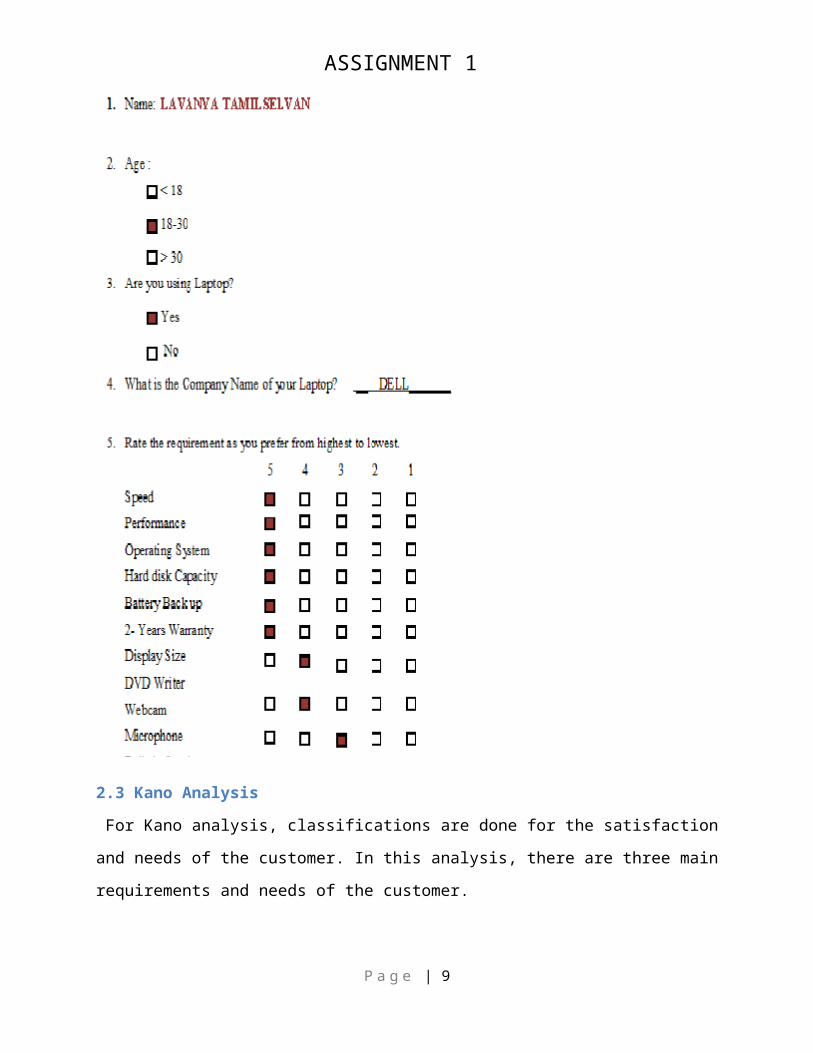
Customer Survey Form
P a g e | 8
ASSIGNMENT 1
2.3 Kano Analysis
For Kano analysis, classifications are done for the satisfaction
and needs of the customer. In this analysis, there are three main
requirements and needs of the customer.
P a g e | 9
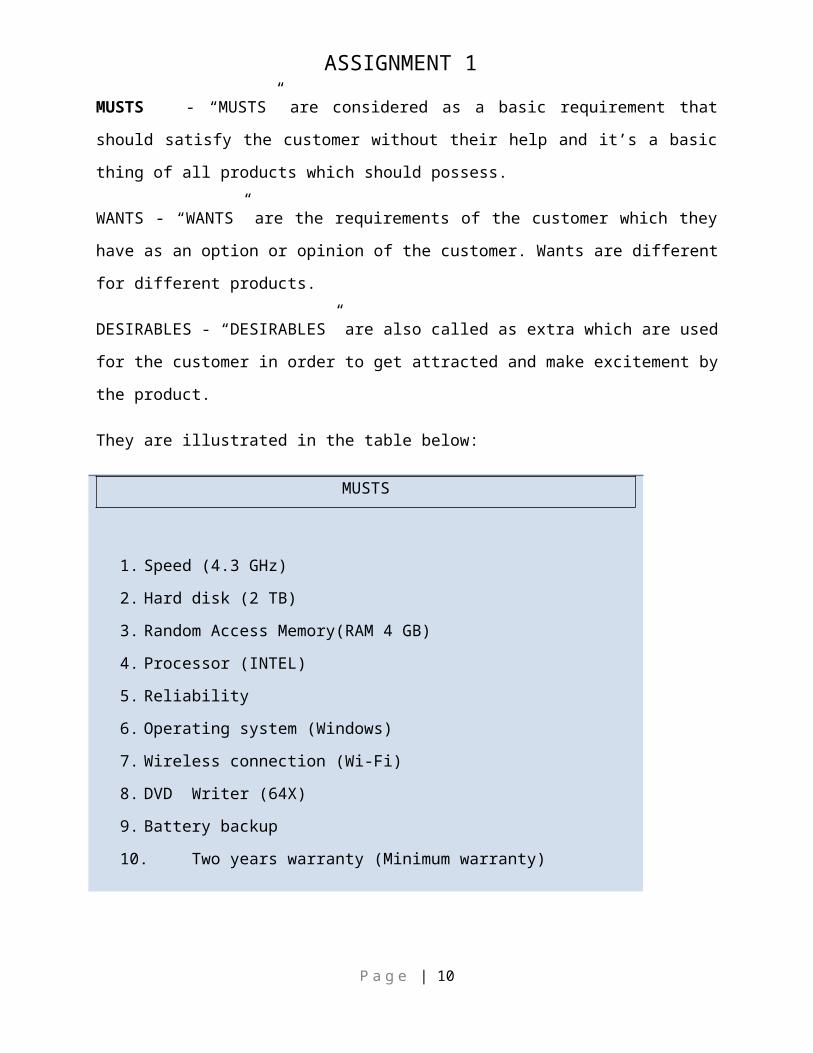
ASSIGNMENT 1 MUSTS - “MUSTS” are considered as a basic requirement that
should satisfy the customer without their help and it’s a basic
thing of all products which should possess.
WANTS - “WANTS” are the requirements of the customer which they
have as an option or opinion of the customer. Wants are different
for different products.
DESIRABLES - “DESIRABLES” are also called as extra which are used
for the customer in order to get attracted and make excitement by
the product.
They are illustrated in the table below:
MUSTS
1. Speed (4.3 GHz)
2. Hard disk (2 TB)
3. Random Access Memory(RAM 4 GB)
4. Processor (INTEL)
5. Reliability
6. Operating system (Windows)
7. Wireless connection (Wi-Fi)
8. DVD Writer (64X)
9. Battery backup
10. Two years warranty (Minimum warranty)
P a g e | 10
ASSIGNMENT 1
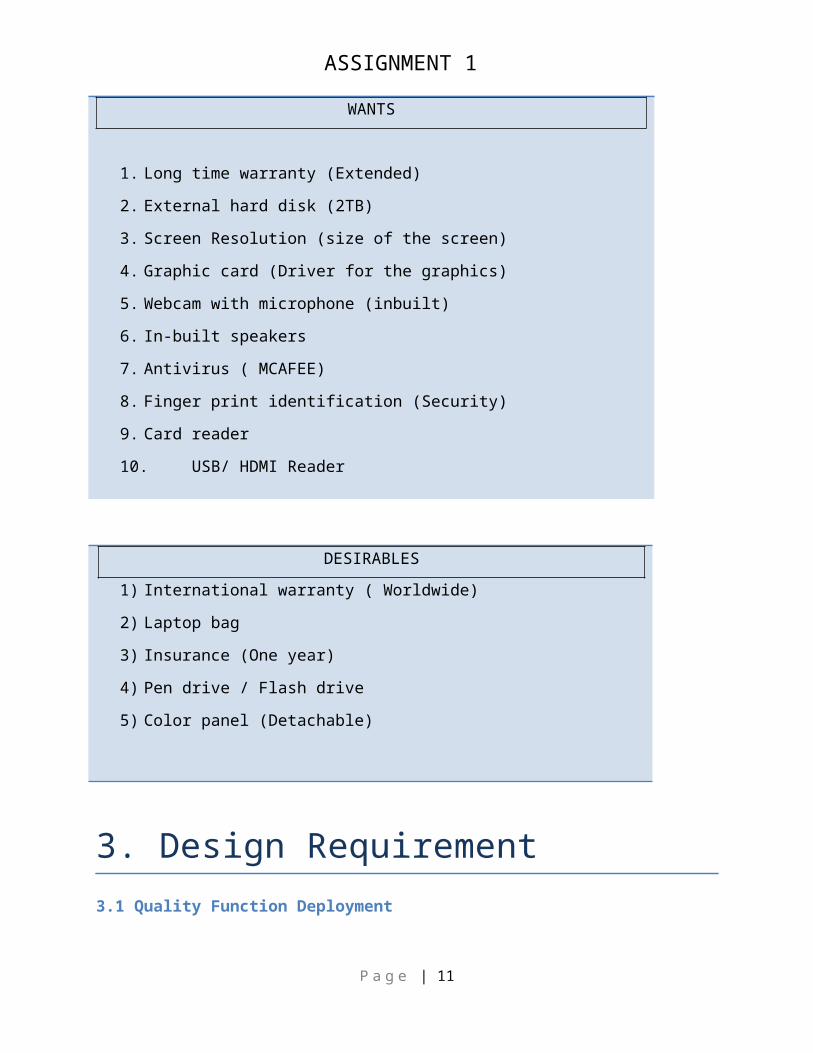
WANTS
1. Long time warranty (Extended)
2. External hard disk (2TB)
3. Screen Resolution (size of the screen)
4. Graphic card (Driver for the graphics)
5. Webcam with microphone (inbuilt)
6. In-built speakers
7. Antivirus ( MCAFEE)
8. Finger print identification (Security)
9. Card reader
10. USB/ HDMI Reader
DESIRABLES1) International warranty ( Worldwide)
2) Laptop bag
3) Insurance (One year)
4) Pen drive / Flash drive
5) Color panel (Detachable)
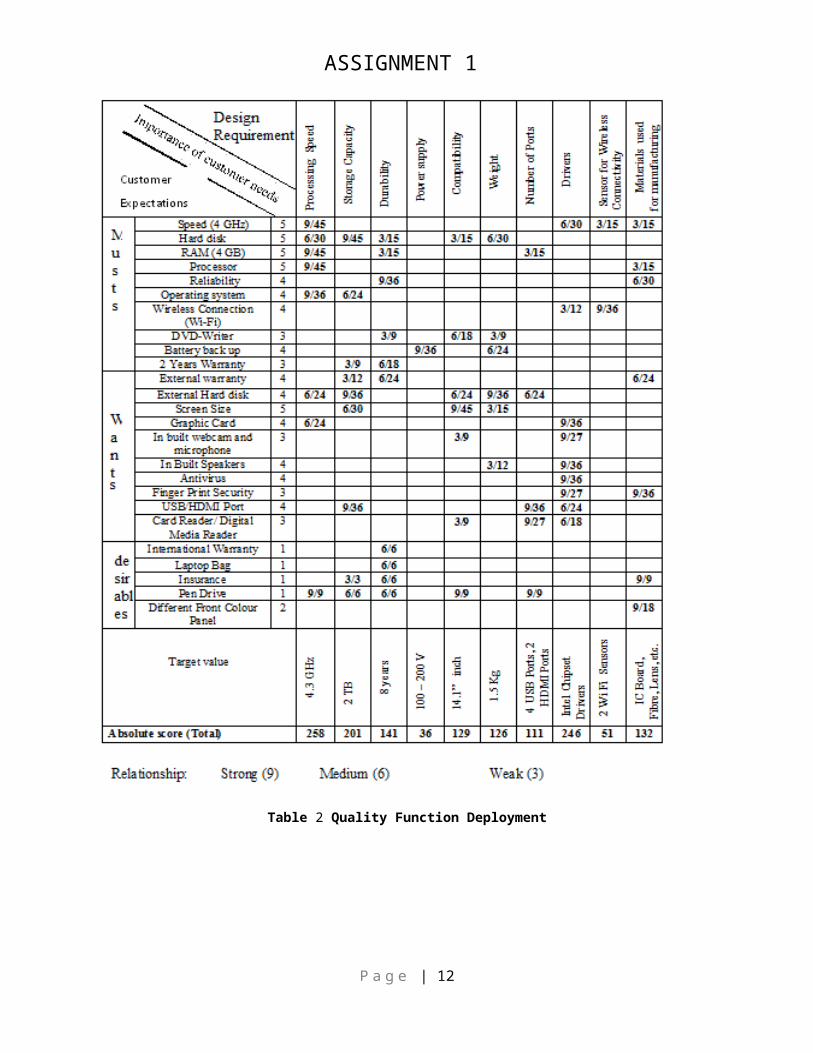
3. Design Requirement3.1 Quality Function Deployment
P a g e | 11
ASSIGNMENT 1
Table 2 Quality Function Deployment
P a g e | 12
ASSIGNMENT 1
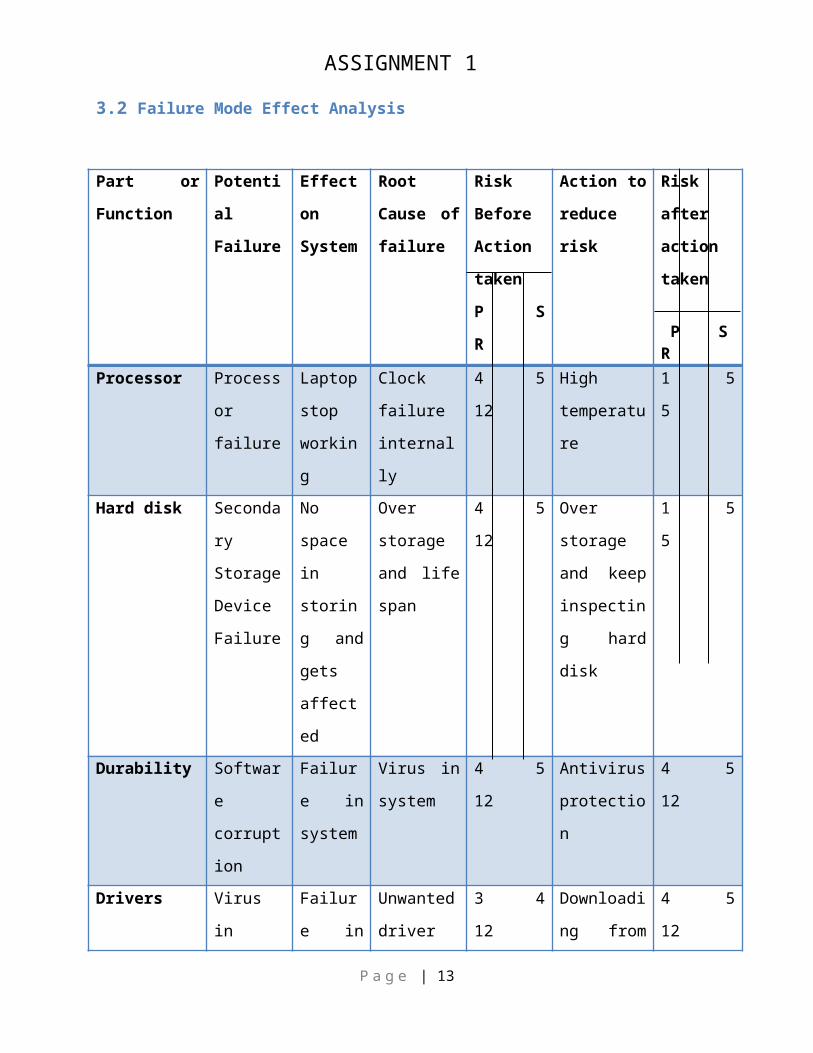
3.2 Failure Mode Effect Analysis
Part or
Function
Potenti
al
Failure
Effect
on
System
Root
Cause of
failure
Risk
Before
Action
taken
P S
R
Action to
reduce
risk
Risk
after
action
taken
P SR
Processor Process
or
failure
Laptop
stop
workin
g
Clock
failure
internal
ly
4 5
12
High
temperatu
re
1 5
5
Hard disk Seconda
ry
Storage
Device
Failure
No
space
in
storin
g and
gets
affect
ed
Over
storage
and life
span
4 5
12
Over
storage
and keep
inspectin
g hard
disk
1 5
5
Durability Softwar
e
corrupt
ion
Failur
e in
system
Virus in
system
4 5
12
Antivirus
protectio
n
4 5
12
Drivers Virus
in
Failur
e in
Unwanted
driver
3 4
12
Downloadi
ng from
4 5
12
P a g e | 13
ASSIGNMENT 1
Drivers device installe
d
proper
siteManufactur
ing
Materials
Life
span
decreas
es
System
breaks
Defects
during
manufact
uring
4 5
12
Increasin
g quality
of
materials
3 4
12
Table 3 Failure Mode Effect Analysis
4. Supplier Selection and Evaluation4.1 Ten major components of Laptop:
Processor
RAM
Hard disk
Display screen
Camera
Speakers
Bluetooth module
P a g e | 14
ASSIGNMENT 1 Wireless network module
USB port
DVD Writer
Battery
4.2 Component criteria for supplier selection:
There are so many components in a laptop mentioned under the
lists of components. Among these components I have chosen
“Display Screen” for further discussion. There are some criteria
which have to be followed by suppliers and they are discussed
below:
Clarity in display
Display screen size options
Image quality
Price condition
Reliability and delivery time
Safety
Warranty time
Trouble shooting problem
Production capacity
Innovation
Stability in market
Experience with supplier
Sustain brand name in market
P a g e | 15
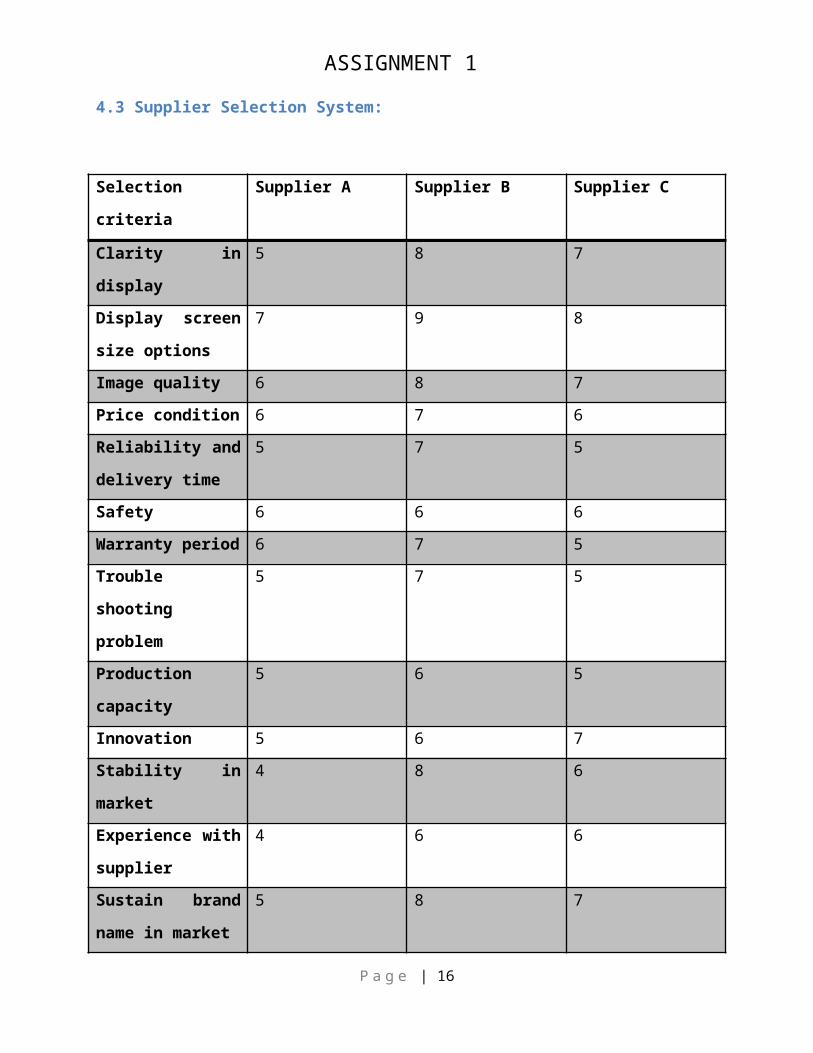
ASSIGNMENT 1 4.3 Supplier Selection System:
Selection
criteria
Supplier A Supplier B Supplier C
Clarity in
display
5 8 7
Display screen
size options
7 9 8
Image quality 6 8 7Price condition 6 7 6Reliability and
delivery time
5 7 5
Safety 6 6 6Warranty period 6 7 5Trouble
shooting
problem
5 7 5
Production
capacity
5 6 5
Innovation 5 6 7Stability in
market
4 8 6
Experience with
supplier
4 6 6
Sustain brand
name in market
5 8 7
P a g e | 16
ASSIGNMENT 1
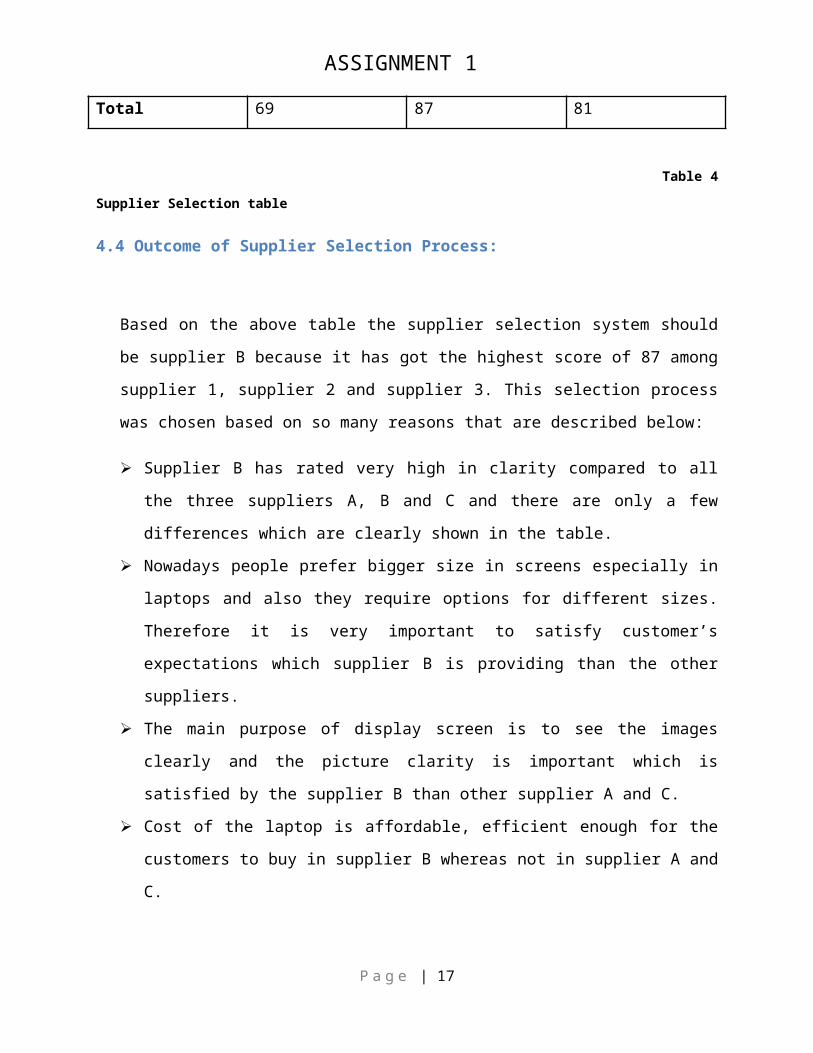
Total 69 87 81
Table 4Supplier Selection table
4.4 Outcome of Supplier Selection Process:
Based on the above table the supplier selection system should
be supplier B because it has got the highest score of 87 among
supplier 1, supplier 2 and supplier 3. This selection process
was chosen based on so many reasons that are described below:
Supplier B has rated very high in clarity compared to all
the three suppliers A, B and C and there are only a few
differences which are clearly shown in the table.
Nowadays people prefer bigger size in screens especially in
laptops and also they require options for different sizes.
Therefore it is very important to satisfy customer’s
expectations which supplier B is providing than the other
suppliers.
The main purpose of display screen is to see the images
clearly and the picture clarity is important which is
satisfied by the supplier B than other supplier A and C.
Cost of the laptop is affordable, efficient enough for the
customers to buy in supplier B whereas not in supplier A and
C.
P a g e | 17
ASSIGNMENT 1 Delivery time for the product is very important because of
the production shortage and this needs time to reach
delivery on time either in shipping or by air mail. This has
to be focused so supplier B has got higher rating compared
to other two suppliers.
Warranty period is also high because customer builds in
trust and needs safe so supplier B has comparatively high.
People by seeing the brand name get attracted and it has
certain values on the product. For this brand image the
product has got higher rating compared to two suppliers.
For every small to big product there should be financial
stability on the cost of the laptop so supplier B scored
high which is 8 points.
By evaluating the performance individually and through complete
assessment by examining and comparing with three suppliers A, B
and C, the maximum score in total is Supplier B.
5. Statistical Process Control
P a g e | 18
ASSIGNMENT 1 5.1 Ten Process Identification
1. The components and the subsystems are very essential for
building the whole system for the laptop called as Supplier
nomination process.
2. In order to produce good products, auditions will be
conducted to ensure about the quality of the product and if
this is successful and approved then the process of final
production is allowed to produce laptop. This is said to be
Supplier quality process.
3. Meeting the requirements of the actual production in terms
of components and sub systems.
4. Ensuring the final components in the term called Bill of
Material (BOM) should fit the conditions of the production
measurements. This is Product matching process.
5. Verifying that the product is built according to the
components which was already defined and should satisfy the
requirements of SAMSUNG. This will ensure that whether they
have built the right laptop. This is called Verification
process.
6. Validating the process that the components of the laptop as
the final product work properly as expected in order to meet
the needs of the customers. This process is known as
Validation process.
7. In producing the final product, SAMSUNG in all need to
manufacture tools which will help in producing components as
P a g e | 19
ASSIGNMENT 1 a whole for end product. This is known as Supplier tooling
process.
8. Supplier delivery process is to make sure that the component
which was delivered by the suppliers has delivered in time
or (JIT) Just in Time, for the product to run smoothly
without any insufficiency.
9. Assembling all the components and elements ready for the
final end product to deliver it to the market and for the
customer use. This is called Final assembling line process.
10. The final important process is delivering to the
customers and to look after the service sector of the
laptop.
5.2 Statistical Control charts for Process Monitoring
Statistical control charts are used to measure the accuracy
and to check whether this process is in control or not. This
process also involved in variation for measuring
effectiveness. There are two variations caused: Special
cause variation and common cause variation. Special cause
variation is very rare whereas the Cause variation is the
differences we find during the process. For differentiating
these variations, control charts are being used. Control
charts are divided into two. They are:
Attribute data:
P a g e | 20
ASSIGNMENT 1 This counts the characteristics of the process and
indicating the scale of acceptance or non-acceptance. The
charts are as follows:
I. C chart
II. P chart
III. NP chart
IV. U chart
Variable data:
This measures the characteristics of the continuous
scale. These include:
I. X chart
II. IMR chart
III. X bar and R chart
IV. X and S chart
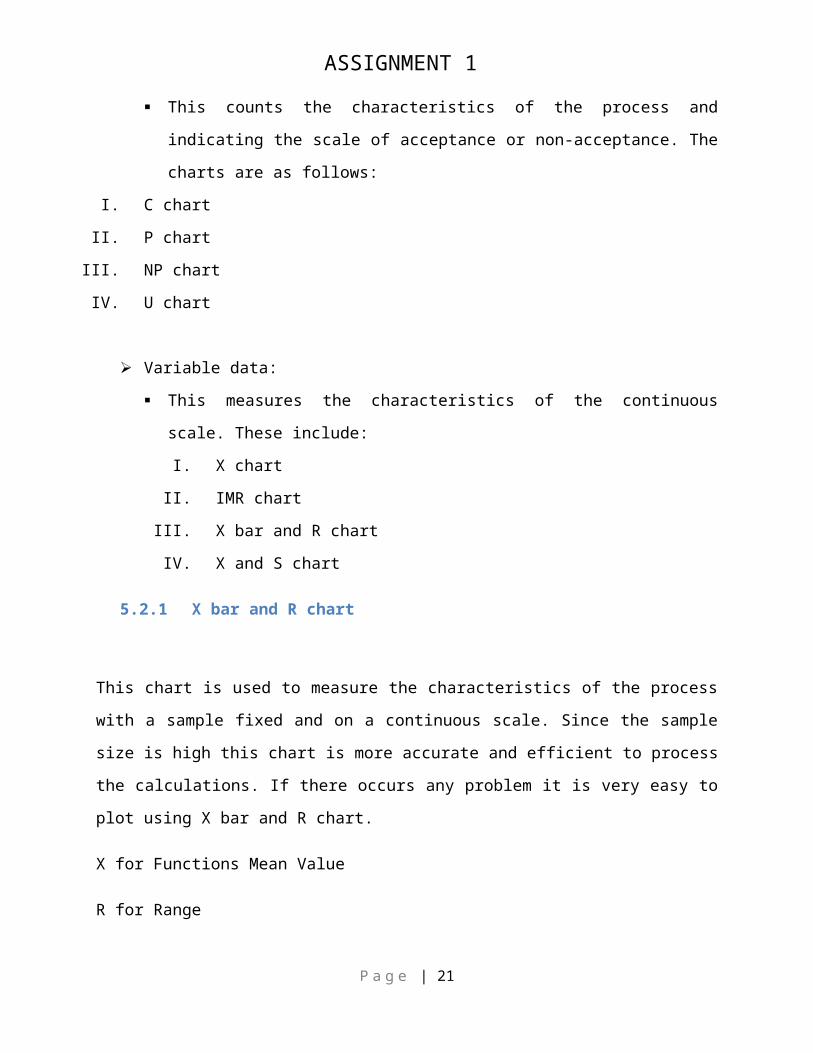
5.2.1 X bar and R chart
This chart is used to measure the characteristics of the process
with a sample fixed and on a continuous scale. Since the sample
size is high this chart is more accurate and efficient to process
the calculations. If there occurs any problem it is very easy to
plot using X bar and R chart.
X for Functions Mean Value
R for Range
P a g e | 21
ASSIGNMENT 1 Thus drawing these charts can clearly check and monitor
deviations in certain levels.
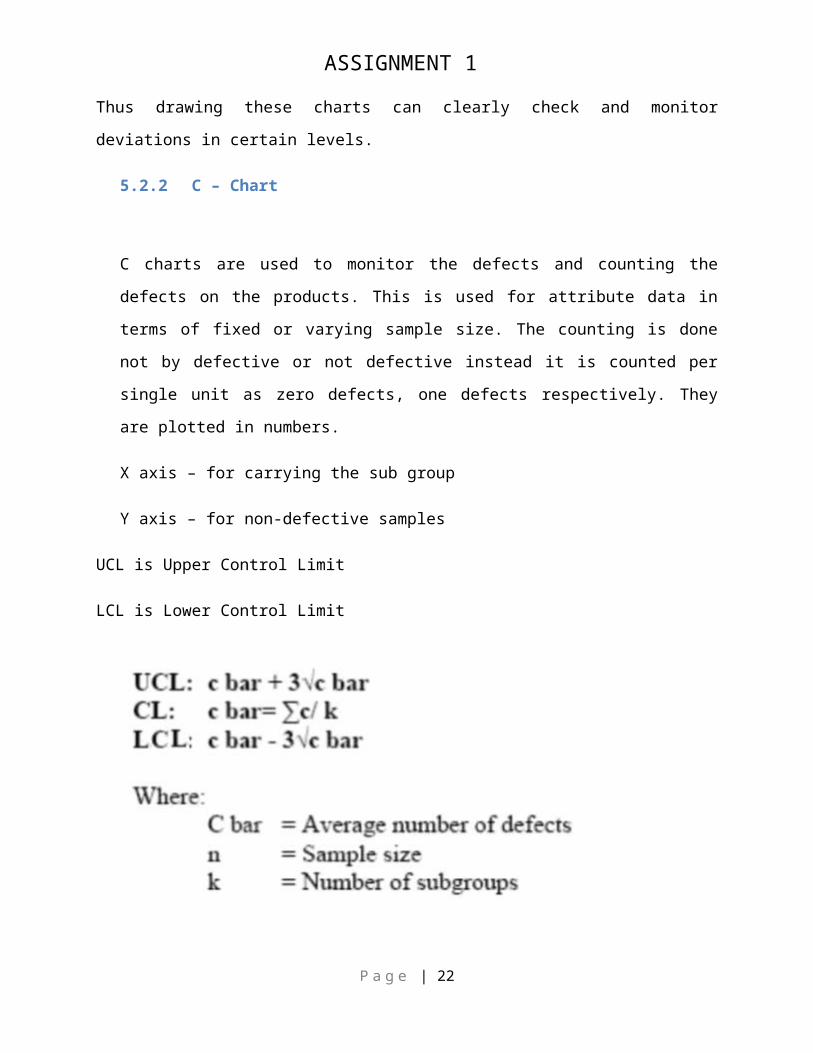
5.2.2 C – Chart
C charts are used to monitor the defects and counting the
defects on the products. This is used for attribute data in
terms of fixed or varying sample size. The counting is done
not by defective or not defective instead it is counted per
single unit as zero defects, one defects respectively. They
are plotted in numbers.
X axis – for carrying the sub group
Y axis – for non-defective samples
UCL is Upper Control Limit
LCL is Lower Control Limit
P a g e | 22
ASSIGNMENT 1 5.2.3 P chart
This is to monitor data of a process which is of
attribute data. Since there are only two possible ways of
counting ‘defective’ or ‘non defective’, so the item has
to counted as one defective item. Defective items are
plotted per sample p in percentage. Using this chart data
can be plotted in such a way that X bar and R chart
cannot plot.
X axis – Time interval
Y axis – Sample space
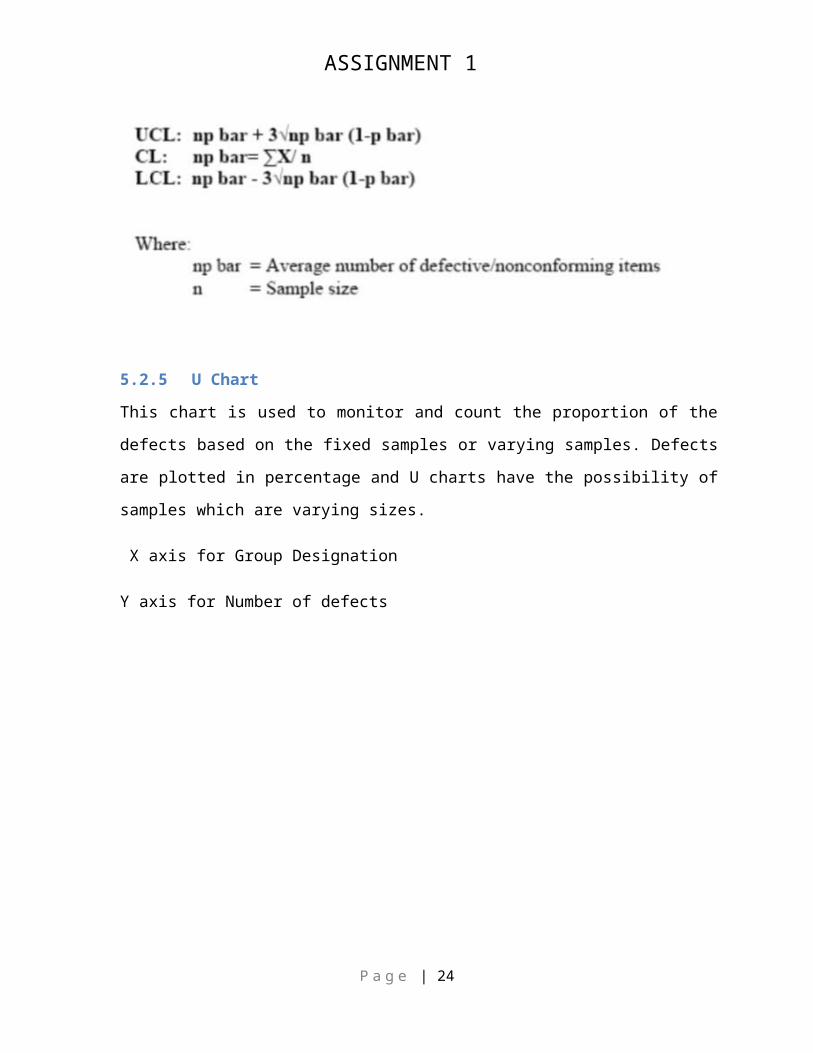
5.2.4 NP chart
This chart is also used to monitor data of a process by
counting the defects of the items but on fixed samples. This
allows counting numbers of defective items.
X axis – Sample space
Y axis – Defective items P a g e | 23
ASSIGNMENT 1
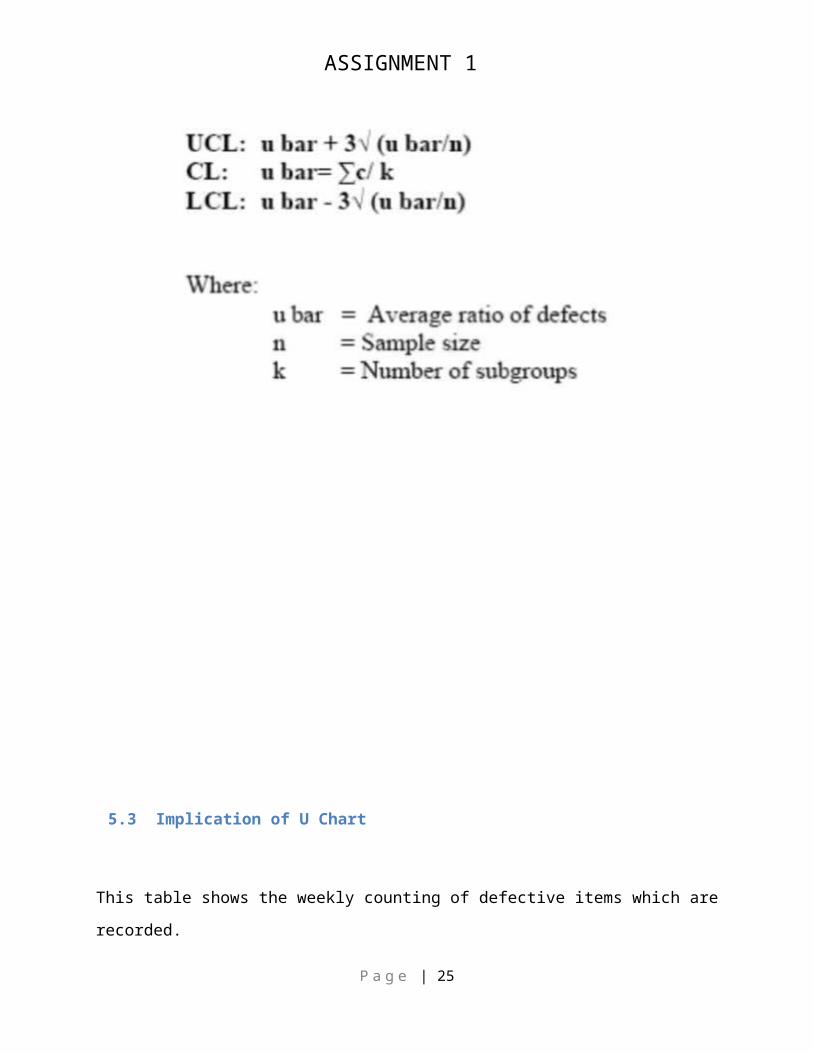
5.2.5 U Chart
This chart is used to monitor and count the proportion of the
defects based on the fixed samples or varying samples. Defects
are plotted in percentage and U charts have the possibility of
samples which are varying sizes.
X axis for Group Designation
Y axis for Number of defects
P a g e | 24
ASSIGNMENT 1
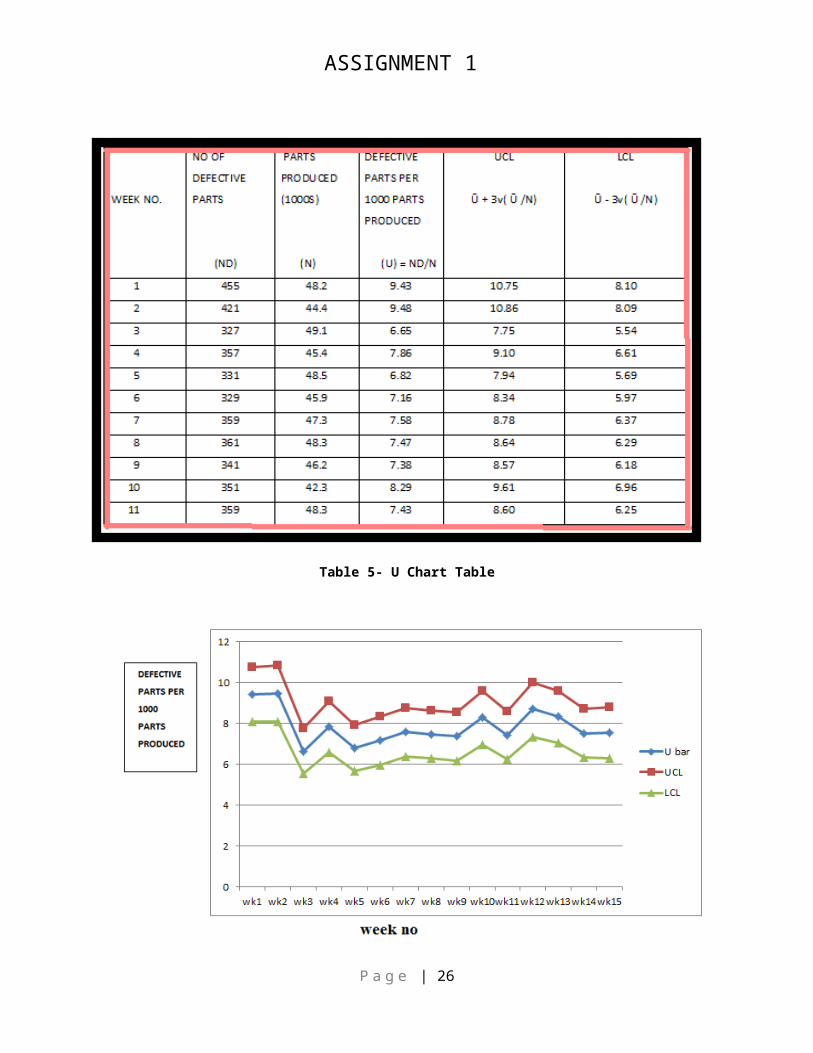
5.3 Implication of U Chart
This table shows the weekly counting of defective items which are
recorded.
P a g e | 25
ASSIGNMENT 1
Table 5- U Chart Table
P a g e | 26
ASSIGNMENT 1 Figure 3 U Chart Graph
6. Continuous Improvement6.1 Product Problems
Various problems can occur during the life cycle of laptop,
which may lead to loss of the product and also lead to
customer dissatisfaction. The various problems are as follows:
Quickly dying out of charge
Operating systems corruption
Network problem
Display faults
Webcam broken
Keypad broken
6.2 Problem Solving Tools
For solving all these problems, there are some problem solving
tools and techniques to be followed. Here are some tools:
1) Gantt Chart
2) Pareto Diagram
3) Run Chart
4) Problem Solving Form
P a g e | 27
ASSIGNMENT 1 5) Brainstorming
6) Mind-Mapping
7) 5 Whys
8) Histogram
9) Data Collection Sheet
10) Cause and Effect Diagram
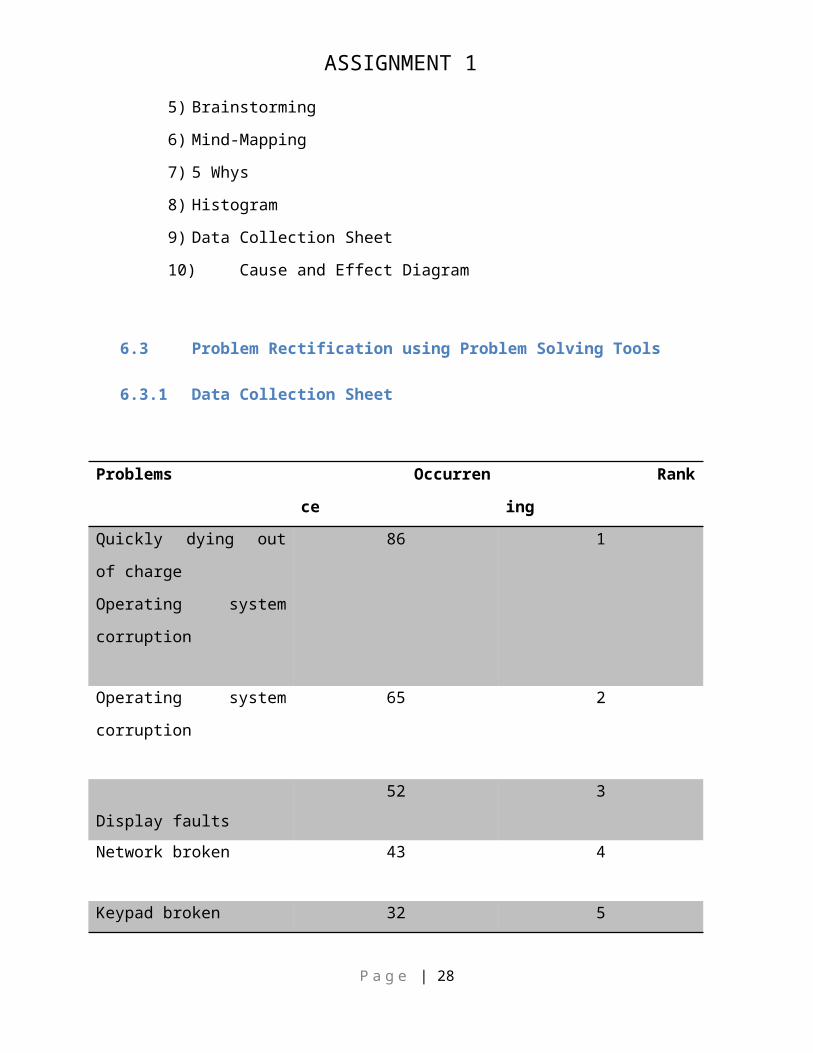
6.3 Problem Rectification using Problem Solving Tools
6.3.1 Data Collection Sheet
Problems Occurren
ce
Rank
ing
Quickly dying out
of charge
Operating system
corruption
86 1
Operating system
corruption
65 2
Display faults52 3
Network broken 43 4
Keypad broken 32 5
P a g e | 28
ASSIGNMENT 1
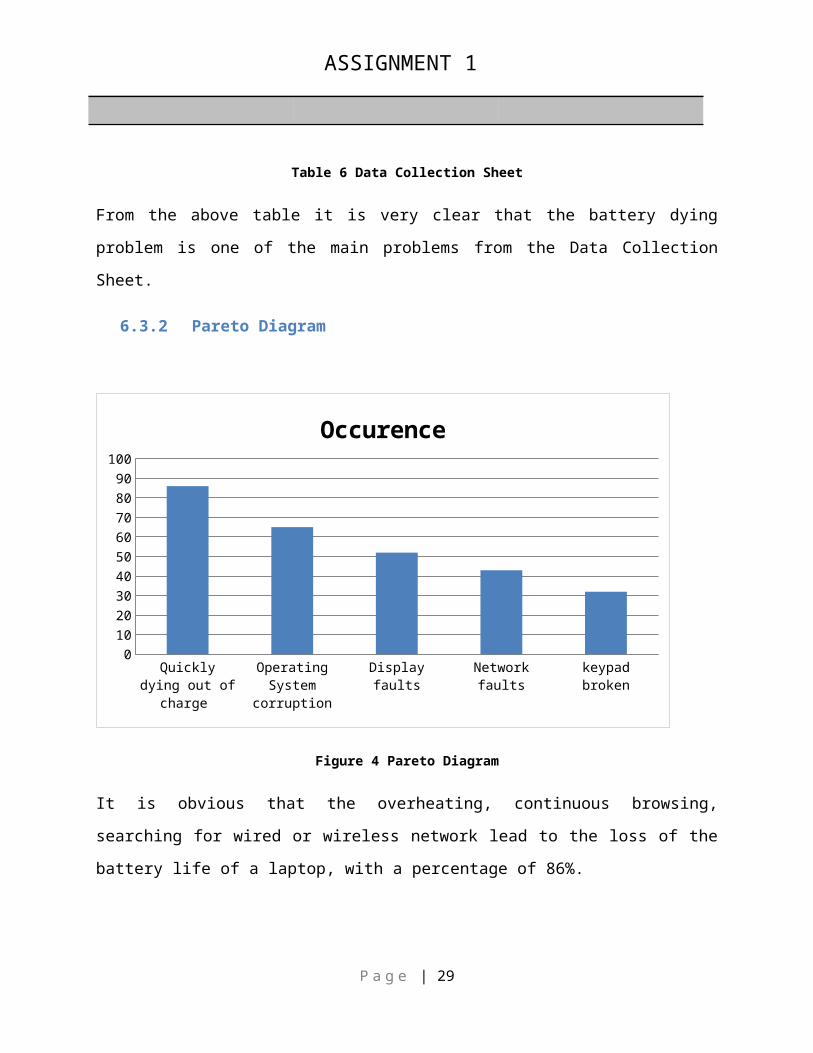
Table 6 Data Collection Sheet
From the above table it is very clear that the battery dying
problem is one of the main problems from the Data Collection
Sheet.
6.3.2 Pareto Diagram
Quickly dying out of
charge
Operating System
corruption
Display faults
Network faults
keypad broken
0102030405060708090100
Occurence
Figure 4 Pareto Diagram
It is obvious that the overheating, continuous browsing,
searching for wired or wireless network lead to the loss of the
battery life of a laptop, with a percentage of 86%.
P a g e | 29
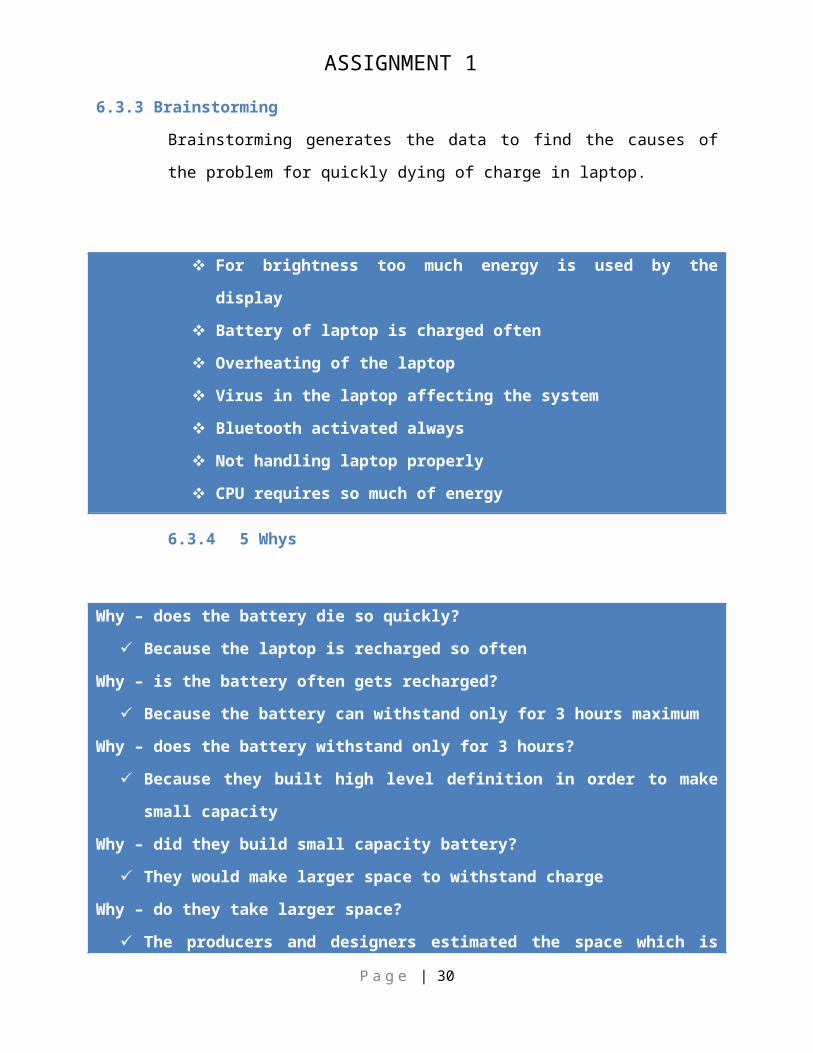
ASSIGNMENT 1 6.3.3 Brainstorming
Brainstorming generates the data to find the causes of
the problem for quickly dying of charge in laptop.
For brightness too much energy is used by the
display
Battery of laptop is charged often
Overheating of the laptop
Virus in the laptop affecting the system
Bluetooth activated always
Not handling laptop properly
CPU requires so much of energy
6.3.4 5 Whys
Why – does the battery die so quickly?
Because the laptop is recharged so often
Why – is the battery often gets recharged?
Because the battery can withstand only for 3 hours maximum
Why – does the battery withstand only for 3 hours?
Because they built high level definition in order to make
small capacity
Why – did they build small capacity battery?
They would make larger space to withstand charge
Why – do they take larger space?
The producers and designers estimated the space which is
P a g e | 30
ASSIGNMENT 1
needed for components of the laptop.
Table 7 Why Analysis Table
7.References:
Mary Bellis, “ History of laptop computers”, Last accessed on 10th October 2012,
<http://inventors.about.com/library/inventors/bllaptop.htm >
Nelson, Lloyd S. (1985), "Interpreting Shewhart X Control Charts",
Journal of Quality Technology, 17:114-16.
Shewart, Walter A. (1931), “Economic Control of Quality of
Manufactured Product”, Princeton, NJ: Van Nostrand Reinhold Co.
(Republished in 1981 by the American Society for Quality
Control, Milwaukee, WI).
Steel, R. G. D. and J. H. Torrie (1980), “Principles and
Procedures of Statistics”, New York: McGraw-Hill. n.d., “Samsung the power “, Samsung, Australia, viewed on 10th
October 2012,
P a g e | 31
ASSIGNMENT 1 <http://sgsg.samsung.com/About_us/05About_Samsung.asp >
P a g e | 32

ASSIGNMENT 1
P a g e | 33

ASSIGNMENT 1
P a g e | 34

ASSIGNMENT 1
P a g e | 35

ASSIGNMENT 1
P a g e | 36

ASSIGNMENT 1
P a g e | 37

ASSIGNMENT 1
P a g e | 38

ASSIGNMENT 1
P a g e | 39