Embed Size (px)
Citation preview
WATER RESOURCES MANAGEMENT…..………………………………………………………………………………………….……….1
________________________________________________________________________________________________
Water resources management in the area of wadis Gasus and Gawasis (south
Safaga-Red Sea) through the geophysical and hydrological studies Galal H. Galal* and Mohamed I. Gad **
* Geophysical Department, Desert Research Center, Cairo, Egypt.
** Hydrology Department, Desert research Center, Cairo, Egypt.
ABSTRACT
To obtain the maximum quantity of water with good quality to meet requirements at least cost,
especially in arid zones, is considered the desired goal in any water management study. In this
paper, water resources management of two selected ungauged drainage basins with different
drainage characteristics (Wadi Gasus and Wadi Gawasis south Safaga-Red Sea) was highlighted
based on the geophysical and hydrological studies.
Methodologies adopted in this paper include both geophysical tools and hydrological tools.
The parametric electrical resistivity measurements for the different formations are carried out in the
field through 11 VES and the quantitative interpretation for the field curves was carried out
applying Zohdy and Vander Velpen models. Hydrological study includes the estimation of rainfall
recurrence period, the delineation of the watershed boundaries and their drainage characteristics
applying WMS model, the estimation of the rainfall-runoff relationship and the generation of the
basin hydrograph using (HEC-1) model.
The geoelctric study along the main channels of the two basins revealed that the study area
is affected by a group of step faults parallel to the Red Sea Coast. Consequently, they consider as
good groundwater conduits. The upstream portion of these wadis composed of three geoelectrical
layers that correlated to Wadi fill, fractured basement and fresh basement with good potentiality.
While the middle part are Wadi fill and sedimentary layers cover the fractured basement (high
potentiality). At the downstream portion the fractured basement was not reached due to the effect of
the normal fault with downthrown side towards the Red Sea coast and due to sea water intrusion.
The salinity of the groundwater increases with depth. The presence of Quseir shale over Nubia
sandstone restrict the recharge and affect its potential.
The results show that the maximum rainfall in one day of 28.5 mm or more can only be
expected in one year out of 20. The drainage characteristics created by WSM model show that Wadi
Gasus chatchment has great tendency to receive flash floods with peak runoff more than that of
Wadi Gawasis catchment. The weighted CN value for the catchments upstream was estimated to be
78 for the AMC-II, and 60 for AMC-I. The runoff volume resulted from maximum rainfall in one
day storm of 28.5 mm reaches 1.44 x 10⁶ m
3 (Wadi Gasus) and 0.15 x 10
6 m
3 (Wadi Gawasis). The
good management of this water resource helps the proposed strategy for Bedouins' development
based on small irrigation communities (2 Feddan/family x 50 family x 3000 m3/Fed x 5 years = 1.5
x 106 m
3). Accordingly, to support future studies, an adequate rainfall-runoff monitoring system
covering the watershed of the two basins should be installed. Flood-recording stations should be
installed and rehabilitated at the three proposed points in the watershed of both two basins near the
proposed sites of storage dams. Detention dams were suggested in areas of high infiltration in order
to replenish the groundwater reservoir, while storage dams and cisterns are recommended in
localities of low infiltration rate for water and soil conservation.
INTRODUCTION Red Sea coastal zone suffers from fresh water scarcity although it is seasonally subjected to
flash floods. These floods cause disasters to the infrastructure. The aim of this paper is to construct
chachment hydrograph as essential tool for water resources management in the drainage basins.
Two ungauged drainage basins that occupy the western side of Red Sea are selected for this study.
The studied basins are restricted to the east by the Red Sea, and to the west by the mountainous
ridges which are the main water divide separating the River Nile drainage system from the Red Sea
WATER RESOURCES MANAGEMENT…..………………………………………………………………………………………….……….2
________________________________________________________________________________________________
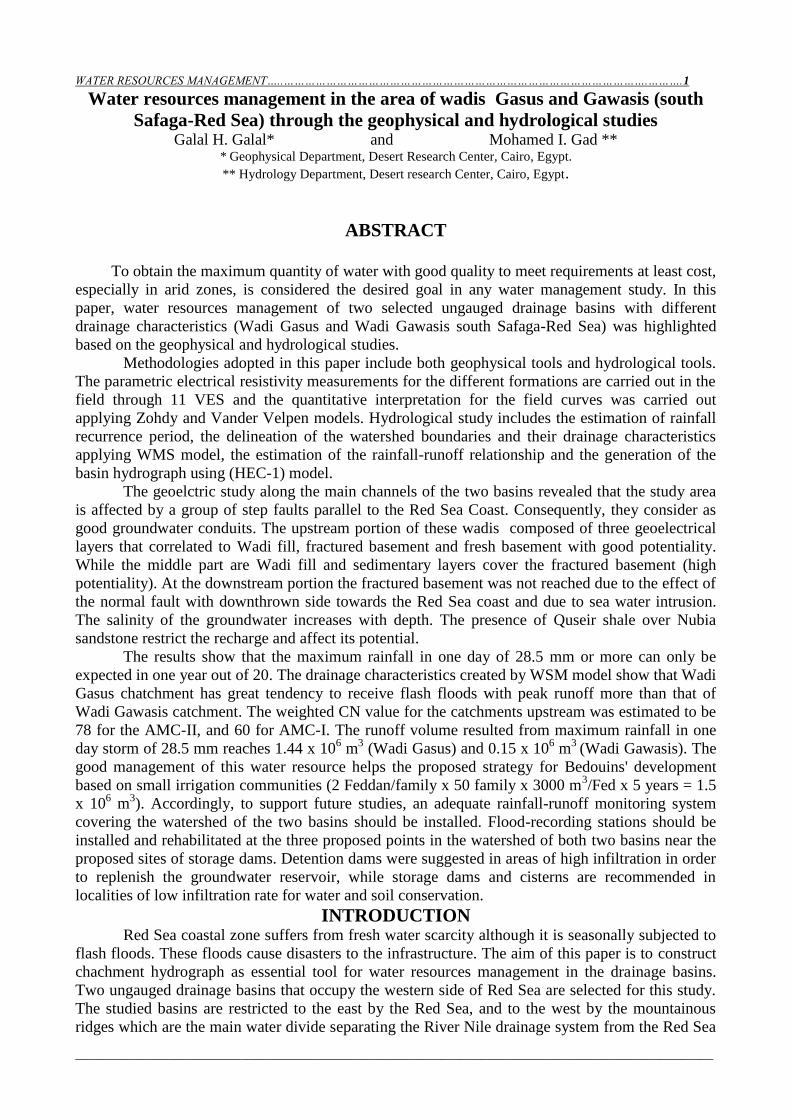
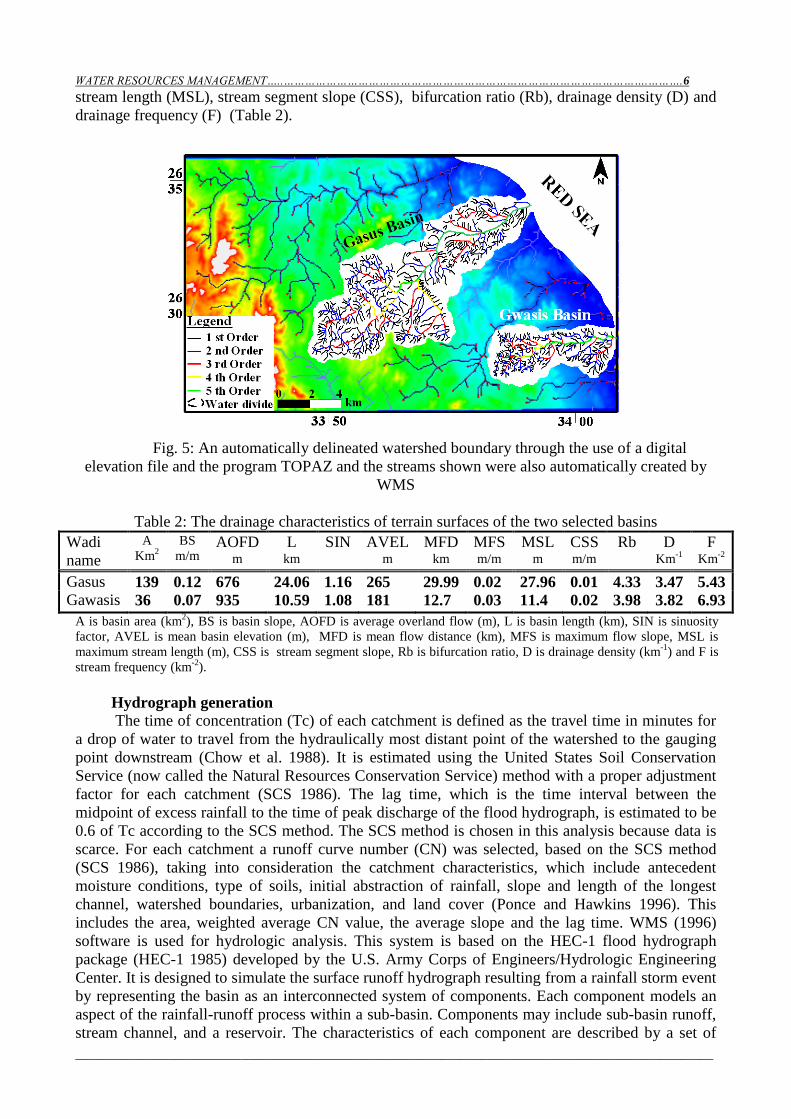
drainage system. The study area is bounded by latitudes 26º 22′ and 26º 35′ N and longitudes 33º
45′ and 34º 05′ E with total surface area of about 300 km2 (Fig.1).
Fig.1 : Location map of the studied drainage basins showing the location of VES Climatic conditions
The Red Sea coastal zone is characterized by long summer months (April-October) with
annual mean of maximum air temperature of 28º C (Quseir station) while the minimum value is
recorded in the short winters (21º C at Quseir station). The mean annual rainfall increases in the
northeast and approaches 20 mm at El Quseir station. The minimum and maximum mean daily
evaporation value varies from 5 mm to 28 mm (in January and June respectively). The recorded
maximum relative humidity at the coastal zone reaches 47 % at Quseir station.
Geomorphologic setting
Based on the studies carried out by Abu El-Izz (1971), Gawish (1981), El-Shamy (1985,
1988 &1992), El-Rakaiby (1989), Philip et al. (1992), Ashmawy (1994), Gomaa (1992) and Aggour
(1997), the study area can be subdivided geomorphologically into the following three units:
i-The coastal plain, which occupies the low land areas parallel to the Red Sea shore. Its
width ranges between few meters at Safaga City and 20 km at Ras Abu Soma and its altitude varies
from sea level up to 90 masl. The relatively small width decreases the possibility of runoff control.
ii- The watershed areas, which can be divided to the Red Sea mountainous terrain, the high
plateaux and the hilly areas. The Red Sea mountainous terrain runs parallel to the Red Sea coast and
surrounds the coastal hilly area to the west (Gabel Abu Furad 1032m, Gabel Waira 1035m and
Gabel Abu Aqarib 775m). Many wadis cut this high land area along the Red Sea in NE-SW
direction (Wadi Safaga, Wadi Gasus and Wadi Gawasis). The mountain area is built up of Pre-
Cambrian basement comprising igneous, volcanic and metamorphic rocks. These rocks with sharp
height and low infiltration rate increase the predicted runoff component of any flood.
In addition, the high plateaux include the Nubia Sandstone Series (El-Ababda Sandstone
Plateau with elevation varing between 400 and 500 masl) and El-Maaza limestone plateau. The
coastal hilly areas constitute the most scenic land feature in the Res Sea coastal zone. Their
elevation ranges from 155m (Gabel Abu Shgili) to 212m ( the outlet of Wadi Gasus). They act as
local watersheds draining by the downstream portions of huge wadis. These sedimentary hills
increase the infiltration capacity and decrease the flow rate of the runoff component.
iii- The water collectors, which are composed of morphotectonic depressions (initiated as a
result of the uplifting of the surrounded basement rocks from east and west directions) and
hydrographic basins (Aggour 1997). The hydrographic basins such as Wadi Gasus and Wadi
Gawasis are classified into sub-basins, according to their catchment areas. They enclose part of the
mountain as well as the coastal hills.
30 32 34 36
22
24
26
28
30
SINAI
RE
D S
EA
Ras
Banas
Quseir
Safaga
Hurgada
SUDAN
Suez G
ulf
Aqab
aG
ulf
MEDITERRANEAN SEA
Study Area
Scal0 85 170 255 km
Qena
Qeft
Nas
er
La
ke
Cairo
WATER RESOURCES MANAGEMENT…..………………………………………………………………………………………….……….3
________________________________________________________________________________________________
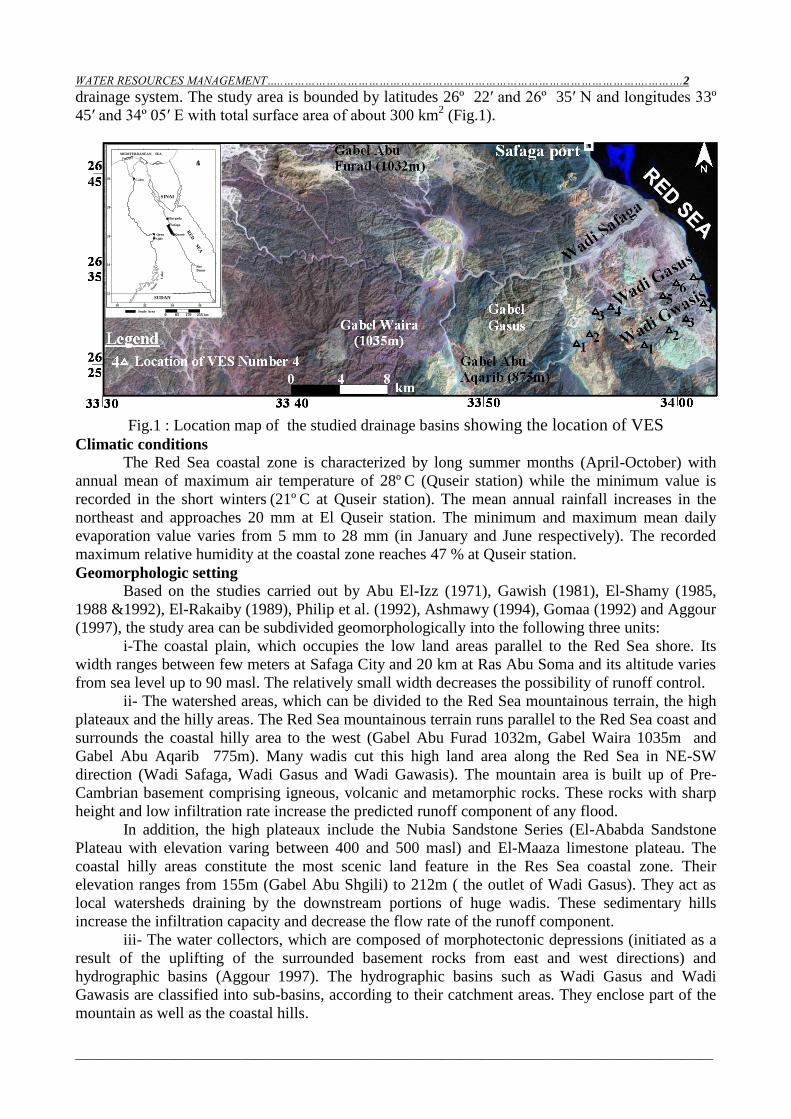
Geologic setting
The rock exposures in the study area have a wide range of geologic time from Precambrian
to Quaternary (Fig. 2). According to Attia (1955), Mansour et al. (1956), Said (1962), El-Tarabili
(1964), El-Akkad and Dardir (1966), Bassyouni (1970), Issawi et al. (1971), El Ramly et al. (1972),
Sabit and Bykov (1976), El-Shazly (1977), Morcoss (1977), El-Akaad & Noweir (1980), Misak and
Abdel-Baki (1991), Saleh (1993), Abdellah (1995), Tolba (1997), Tolba and Amin (1998) and
Hammad (1998), Precambrian age is represented by igneous and metamorphic rocks where the
granitic rocks are the dominant rock type among these rocks. The Upper Cretaceous age is
represented by Nubia Formation (sandstone beds with mudstone intercalations), Quseir variegated
shale Formation (Yussef 1957), Duwi Formation (phosphate, marl, shale and limestone) and Dakhla
Formation (shale & marl). Paleocene–Eocene age is represented by Tarawan Formation (carbonate
beds), Esna Formation (shale) and Thebes Formation (limestone with flint beds). Oligocene age is
represented by Nakheil Formation (breccia, limestone, clays and sandstone). Miocene and later
sediments are represented by eight formations which are: Ranga Formation (conglomerate &
sandstone), Um Mahara Formation (sandy, gypsiferous limestone), Abu Dabbab Formation (gypsum
with rare shale & limestone intercalation), Um Gheig Formation (dolomite), Samh Formation (shale,
sandstone & limestone), Gabir Formation (sandstone, reefal limestone & gravel beds), Shagra
Formation (sandstone minor marl) and
Reefs & raised beaches (reefs &
gravel beds).
Fig. 2: Geological map of the study area (after EGSMA 1978)
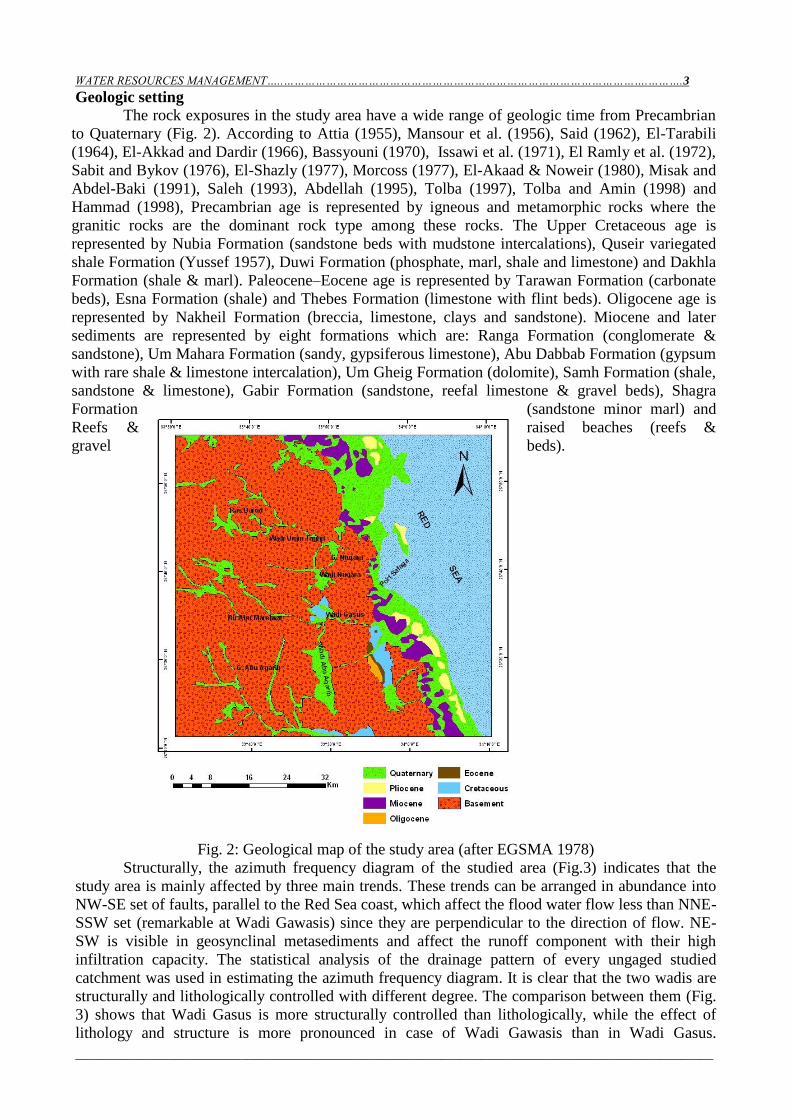
Structurally, the azimuth frequency diagram of the studied area (Fig.3) indicates that the
study area is mainly affected by three main trends. These trends can be arranged in abundance into
NW-SE set of faults, parallel to the Red Sea coast, which affect the flood water flow less than NNE-
SSW set (remarkable at Wadi Gawasis) since they are perpendicular to the direction of flow. NE-
SW is visible in geosynclinal metasediments and affect the runoff component with their high
infiltration capacity. The statistical analysis of the drainage pattern of every ungaged studied
catchment was used in estimating the azimuth frequency diagram. It is clear that the two wadis are
structurally and lithologically controlled with different degree. The comparison between them (Fig.
3) shows that Wadi Gasus is more structurally controlled than lithologically, while the effect of
lithology and structure is more pronounced in case of Wadi Gawasis than in Wadi Gasus.
WATER RESOURCES MANAGEMENT…..………………………………………………………………………………………….……….4
________________________________________________________________________________________________
Accordingly, the high initial abstraction of the soil cover in Wadi Gasus is expected.
Fig. 3: Azimuth frequency diagram of drainage lineation pattern for Wadi Gasus (a) and Wadi
Gawasis (b)
MATERIALS AND METHODS
Two field trips were achieved in both Wadi Gasus and Wadi Gawasis during 2006 to collect
the materials used in this paper. Eleven Vertical Electrical Sounding (VES) were carried out in both
Wadi Gasus (7 VES's) and Wadi Gawasis (4 VES's). The basic hydrologic data of the two studied
basins were obtained during these field trips. In addition, the archival data such as long term rainfall
records were collected from the DRC library beside the recent rainfall records from the world Wide
Web through NASA website. The methodological approach used in this paper is based on the
geophysical study and the hydrologic study.
Water resources management The surface water resources management of any hydrographic basin needs the estimation of
rainfall probability and recurrence period, the delineation of the watershed boundaries and their
drainage characteristics, the estimation of the rainfall-runoff relationship and the generation of the
basin hydrograph.
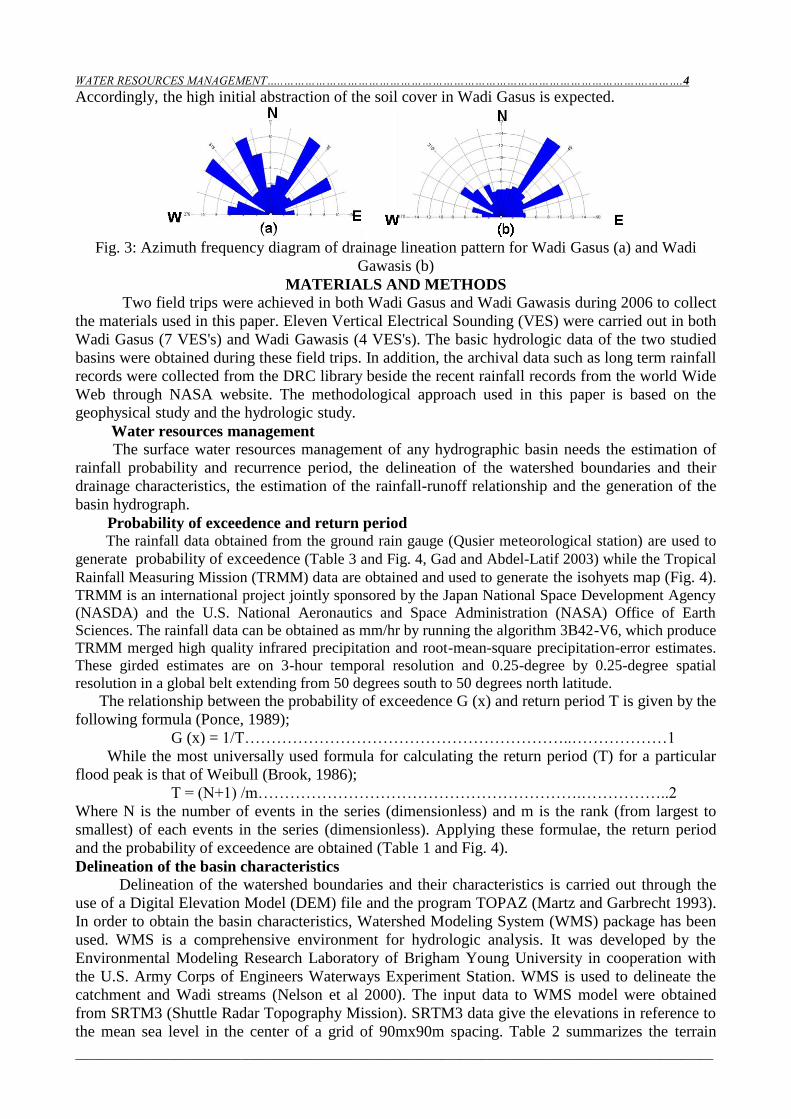
Probability of exceedence and return period The rainfall data obtained from the ground rain gauge (Qusier meteorological station) are used to
generate probability of exceedence (Table 3 and Fig. 4, Gad and Abdel-Latif 2003) while the Tropical
Rainfall Measuring Mission (TRMM) data are obtained and used to generate the isohyets map (Fig. 4). TRMM is an international project jointly sponsored by the Japan National Space Development Agency
(NASDA) and the U.S. National Aeronautics and Space Administration (NASA) Office of Earth
Sciences. The rainfall data can be obtained as mm/hr by running the algorithm 3B42-V6, which produce
TRMM merged high quality infrared precipitation and root-mean-square precipitation-error estimates.
These girded estimates are on 3-hour temporal resolution and 0.25-degree by 0.25-degree spatial
resolution in a global belt extending from 50 degrees south to 50 degrees north latitude. The relationship between the probability of exceedence G (x) and return period T is given by the
following formula (Ponce, 1989);
G (x) = 1/T……………………………………………………..………………1
While the most universally used formula for calculating the return period (T) for a particular
flood peak is that of Weibull (Brook, 1986);
T = (N+1) /m…………………………………………………….……………..2
Where N is the number of events in the series (dimensionless) and m is the rank (from largest to
smallest) of each events in the series (dimensionless). Applying these formulae, the return period
and the probability of exceedence are obtained (Table 1 and Fig. 4).
Delineation of the basin characteristics Delineation of the watershed boundaries and their characteristics is carried out through the
use of a Digital Elevation Model (DEM) file and the program TOPAZ (Martz and Garbrecht 1993).
In order to obtain the basin characteristics, Watershed Modeling System (WMS) package has been
used. WMS is a comprehensive environment for hydrologic analysis. It was developed by the
Environmental Modeling Research Laboratory of Brigham Young University in cooperation with
the U.S. Army Corps of Engineers Waterways Experiment Station. WMS is used to delineate the
catchment and Wadi streams (Nelson et al 2000). The input data to WMS model were obtained
from SRTM3 (Shuttle Radar Topography Mission). SRTM3 data give the elevations in reference to
the mean sea level in the center of a grid of 90mx90m spacing. Table 2 summarizes the terrain
WATER RESOURCES MANAGEMENT…..………………………………………………………………………………………….……….5
________________________________________________________________________________________________
P = 9.949 ln (T) - 1.554
R² = 0.979
0
5
10
15
20
25
30
1 10 100
Ma
xim
um
rain
fall
de
pth
in o
ne
day
P
(mm
)
Recurrence period T (year)
Gwasis Basin
Gasus Basin
RED
SEA
33 50 34 00
2635
2630
Legend1 st Order2 nd Order3 rd Order4 th Order5 th OrderWater divide
0 2 4km
50
52
54
56 58
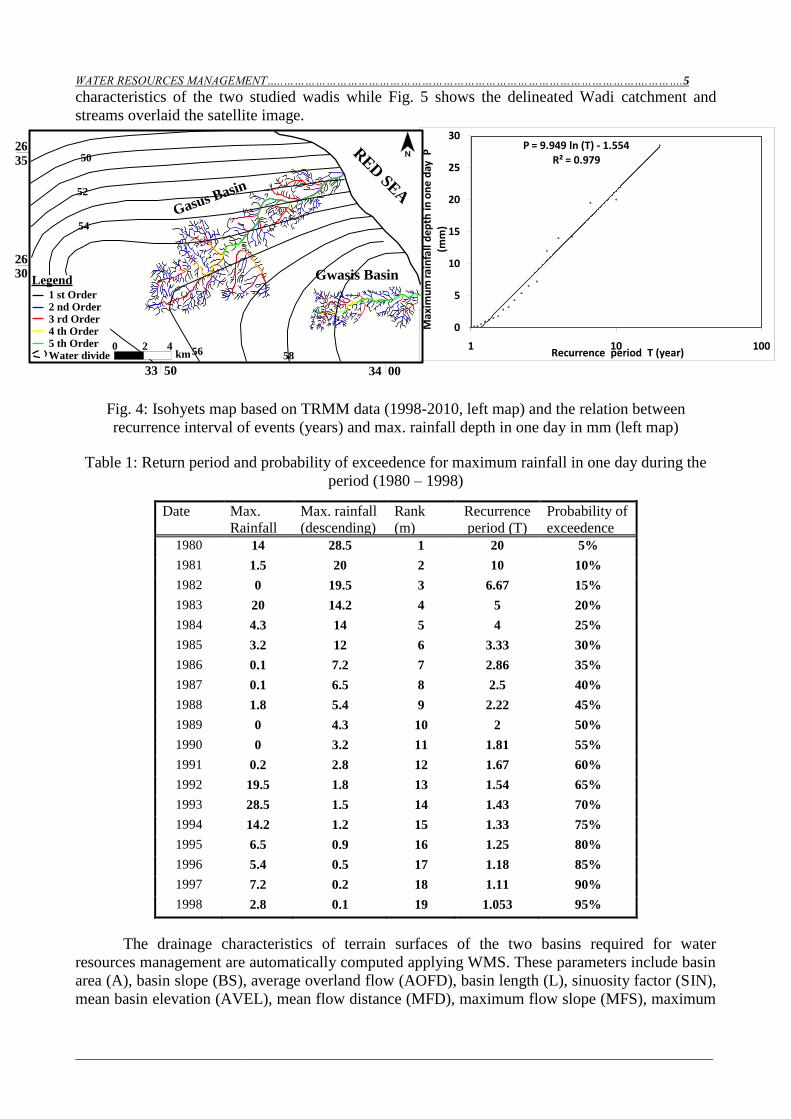
characteristics of the two studied wadis while Fig. 5 shows the delineated Wadi catchment and
streams overlaid the satellite image.
Fig. 4: Isohyets map based on TRMM data (1998-2010, left map) and the relation between
recurrence interval of events (years) and max. rainfall depth in one day in mm (left map)
Table 1: Return period and probability of exceedence for maximum rainfall in one day during the
period (1980 – 1998)
Date Max.
Rainfall
in one
day
(mm)
Max. rainfall
(descending)
Rank
(m)
Recurrence
period (T)
(year)
Probability of
exceedence
(G (x)) (%) 1980 14 28.5 1 20 5%
1981 1.5 20 2 10 10%
1982 0 19.5 3 6.67 15%
1983 20 14.2 4 5 20%
1984 4.3 14 5 4 25%
1985 3.2 12 6 3.33 30%
1986 0.1 7.2 7 2.86 35%
1987 0.1 6.5 8 2.5 40%
1988 1.8 5.4 9 2.22 45%
1989 0 4.3 10 2 50%
1990 0 3.2 11 1.81 55%
1991 0.2 2.8 12 1.67 60%
1992 19.5 1.8 13 1.54 65%
1993 28.5 1.5 14 1.43 70%
1994 14.2 1.2 15 1.33 75%
1995 6.5 0.9 16 1.25 80%
1996 5.4 0.5 17 1.18 85%
1997 7.2 0.2 18 1.11 90%
1998 2.8 0.1 19 1.053 95%
The drainage characteristics of terrain surfaces of the two basins required for water
resources management are automatically computed applying WMS. These parameters include basin
area (A), basin slope (BS), average overland flow (AOFD), basin length (L), sinuosity factor (SIN),
mean basin elevation (AVEL), mean flow distance (MFD), maximum flow slope (MFS), maximum
WATER RESOURCES MANAGEMENT…..………………………………………………………………………………………….……….6
________________________________________________________________________________________________
stream length (MSL), stream segment slope (CSS), bifurcation ratio (Rb), drainage density (D) and
drainage frequency (F) (Table 2).
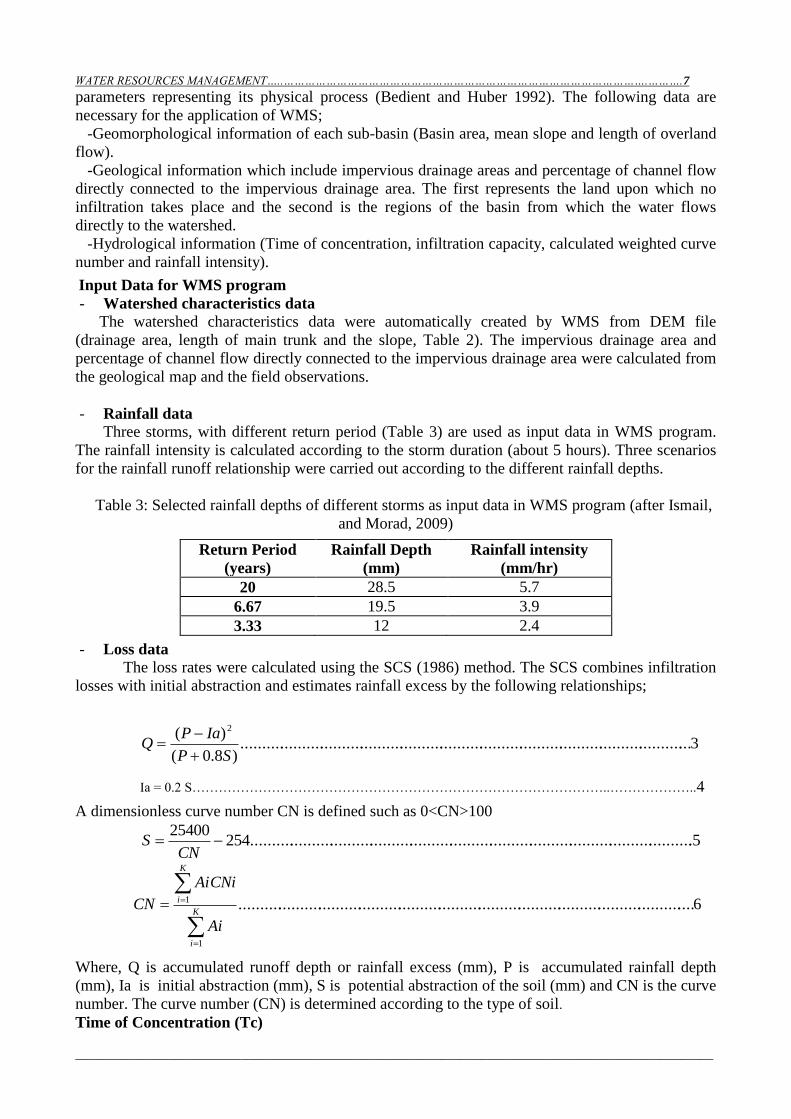
Fig. 5: An automatically delineated watershed boundary through the use of a digital
elevation file and the program TOPAZ and the streams shown were also automatically created by
WMS
Table 2: The drainage characteristics of terrain surfaces of the two selected basins
Wadi
name
A
Km2
BS
m/m AOFD
m
L km
SIN AVEL m
MFD km
MFS m/m
MSL m
CSS m/m
Rb D Km
-1
F Km
-2
Gasus 139 0.12 676 24.06 1.16 265 29.99 0.02 27.96 0.01 4.33 3.47 5.43
Gawasis 36 0.07 935 10.59 1.08 181 12.7 0.03 11.4 0.02 3.98 3.82 6.93
A is basin area (km2), BS is basin slope, AOFD is average overland flow (m), L is basin length (km), SIN is sinuosity
factor, AVEL is mean basin elevation (m), MFD is mean flow distance (km), MFS is maximum flow slope, MSL is
maximum stream length (m), CSS is stream segment slope, Rb is bifurcation ratio, D is drainage density (km-1
) and F is
stream frequency (km-2
).
Hydrograph generation
The time of concentration (Tc) of each catchment is defined as the travel time in minutes for
a drop of water to travel from the hydraulically most distant point of the watershed to the gauging
point downstream (Chow et al. 1988). It is estimated using the United States Soil Conservation
Service (now called the Natural Resources Conservation Service) method with a proper adjustment
factor for each catchment (SCS 1986). The lag time, which is the time interval between the
midpoint of excess rainfall to the time of peak discharge of the flood hydrograph, is estimated to be
0.6 of Tc according to the SCS method. The SCS method is chosen in this analysis because data is
scarce. For each catchment a runoff curve number (CN) was selected, based on the SCS method
(SCS 1986), taking into consideration the catchment characteristics, which include antecedent
moisture conditions, type of soils, initial abstraction of rainfall, slope and length of the longest
channel, watershed boundaries, urbanization, and land cover (Ponce and Hawkins 1996). This
includes the area, weighted average CN value, the average slope and the lag time. WMS (1996)
software is used for hydrologic analysis. This system is based on the HEC-1 flood hydrograph
package (HEC-1 1985) developed by the U.S. Army Corps of Engineers/Hydrologic Engineering
Center. It is designed to simulate the surface runoff hydrograph resulting from a rainfall storm event
by representing the basin as an interconnected system of components. Each component models an
aspect of the rainfall-runoff process within a sub-basin. Components may include sub-basin runoff,
stream channel, and a reservoir. The characteristics of each component are described by a set of
WATER RESOURCES MANAGEMENT…..………………………………………………………………………………………….……….7
________________________________________________________________________________________________
parameters representing its physical process (Bedient and Huber 1992). The following data are
necessary for the application of WMS;
-Geomorphological information of each sub-basin (Basin area, mean slope and length of overland
flow).
-Geological information which include impervious drainage areas and percentage of channel flow
directly connected to the impervious drainage area. The first represents the land upon which no
infiltration takes place and the second is the regions of the basin from which the water flows
directly to the watershed.
-Hydrological information (Time of concentration, infiltration capacity, calculated weighted curve
number and rainfall intensity).
Input Data for WMS program
- Watershed characteristics data
The watershed characteristics data were automatically created by WMS from DEM file
(drainage area, length of main trunk and the slope, Table 2). The impervious drainage area and
percentage of channel flow directly connected to the impervious drainage area were calculated from
the geological map and the field observations.
- Rainfall data
Three storms, with different return period (Table 3) are used as input data in WMS program.
The rainfall intensity is calculated according to the storm duration (about 5 hours). Three scenarios
for the rainfall runoff relationship were carried out according to the different rainfall depths.
Table 3: Selected rainfall depths of different storms as input data in WMS program (after Ismail,
and Morad, 2009)
- Loss data The loss rates were calculated using the SCS (1986) method. The SCS combines infiltration
losses with initial abstraction and estimates rainfall excess by the following relationships;
Ia = 0.2 S…………………………………………………………………………………..………………..4
A dimensionless curve number CN is defined such as 0<CN>100
Where, Q is accumulated runoff depth or rainfall excess (mm), P is accumulated rainfall depth
(mm), Ia is initial abstraction (mm), S is potential abstraction of the soil (mm) and CN is the curve
number. The curve number (CN) is determined according to the type of soil.
Time of Concentration (Tc)
Return Period
(years)
Rainfall Depth
(mm)
Rainfall intensity
(mm/hr)
20 28.5 5.7
6.67 19.5 3.9
3.33 12 2.4
5...............................................................................................................25425400
CN
S
6..................................................................................................................
1
1
K
i
K
i
Ai
AiCNi
CN
3.................................................................................................................)8.0(
)( 2
SP
IaPQ
WATER RESOURCES MANAGEMENT…..………………………………………………………………………………………….……….8
________________________________________________________________________________________________
Time of concentration is calculated for each basin by using the following equation
(Subramanya, 1984),
Where, Tc is time of concentration (min), L is Flow length (m) and S is average slope of the
main water course (m/m) which corresponds to MFD in Table 2.
Output of WMS program
The output of WMS program includes runoff amount and watershed hydrograph. The
hydrographic parameters of the studied ungauged drainage basins include time parameters (the time
of flood concentration Tc, lag time Tl , duration of unit hydrograph D, the time base Tb and the
time to peak Tp, peak flow Qp and flow velocity V. These parameters were estimated by
application of WMS software according to the following relationships (SCS, 1986);
Tl = 0.6 Tc ……………………………………....………………...……..……....……8
D = 0.133 Tc , …... ……………………………………… …………...,..…….….....9
Tb = 2.67 ( 1.2 Tc + 0.5 D )…………………….………..….………………,............…..10
Tp = D/2 + 0.6 Tc ……………….….…….………….………………...…......….11
Qp = 7.4074 x i x A / Tp ………………..………………………...…….……,….….…..12
V = 0.2278 Lb / Tc …………………(Jain et al. 1997)………..……………,,,…....…13
Where, Tc ,Tl, D, Tb, Tp, in minutes, Qp in m3/sec, A is the watershed area in km
2 and V is the
flow velocity (m/sec).
In the other hand, the groundwater management is discussed based on the geophysical study. It
deals with the subsurface conditions that clarify the geometry and configuration of the water
bearing formations. So, geoelectric method was applied using Vertical Electrical Sounding (VES)
of Schlumberger array (Kunetz, 1966). The parametric electrical resistivity measurements for the
different formations are carried out either in laboratory or in the field (11 VES across the main
channel of the two studied wadis). Their values were used during the preparation of the initial
models to interpret the subsurface changes under each VES station. A detailed quantitative
interpretation for the field curves was carried out by using two computer programs (Zohdy, 1989
and Vander Velpen B.P.A, 1988).
RESULTS AND DISCUSSION It is obvious from the isohyets map (Fig. 4) that the annual rainfall depth in the study area
increases in the NW-SE direction. As a general, Wadi Gasus receives less rainfall amount than
Wadi Gawasis. Moreover, Wadi Gasus chatchment receives average annual rainfall depth of 56 mm
while Wadi Gawasis chatchment receives 59 mm based on the TRRM records during 1998-2010. In
addition, Table 1 shows that the relation between the maximum rainfall depth in one day and the
return period is inversely proportional. It is clear from the table and the curve (Fig. 4). The
maximum rainfall in one day depth records during the period 1980-98 ranges from 0.1 and 28.5 mm
with the mean 7.6. The statistical analysis of these records show that the maximum rainfall in one
day with a probability level of 30 percent of exceedence is 12 mm (Table 1). In addition, on average
a maximum rainfall in one day of 28.5 mm or more can only be expected in 1 year out of 20. The
relation between the maximum rainfall in one day P max and recurrence period T is given by the best
fit relation (r2 =0.88);
Pmax = 9.949 ln (T) – 1.554, (r2 = 0.979)…………………………………………..14
This means that Pmax is expected to be 21.3 and 25.3 mm every recurrence period of
magnitude 10 and 15 years respectively. This must be taken into consideration in water
management of surface runoff.
Generally speaking, the drainage characteristics of terrain surfaces of the two basins show
that the stream order of the two basins related to 5th
order (Fig. 5). In addition, Table 2 shows that
7......................................).........1940....(........................................0194.0
385.0
77.0
KirpichS
LTc
WATER RESOURCES MANAGEMENT…..………………………………………………………………………………………….……….9
________________________________________________________________________________________________
Wadi Gasus chatchment has great tendency to receive flash floods with peak runoff more than that
of Wadi Gawasis catchment. The drainage area (A), the basin slope (BS), the sinuosity factor (SIN),
mean basin elevation (AVEL), mean flow distance (MFD), and the bifurcation ratio (Rb) of Wadi
Gasus assure this finding. Otherwise, the short length of average overland flow (AOFD) of Wadi
Gasus reflects quick surface runoff entering the stream. Since the steeper the stream gradient, the
shorter the runoff residence time is, and the higher the potential for flooding (Gad and Abdel-latif
2003), accordingly Wadi Gasus has high potentiality for flooding. Moreover, Wadi Gawasis with
greater stream segment slope (CSS), maximum flow slope (MFS), drainage density (D) and
drainage frequency (F) than those of Wadi Gasus considers highly productive of surface runoff
(Gad 2010).
In the other side, the lack of accurate rainfall-runoff data is a major constraint on model
calibration and validation. The main uncertain parameter that affects the results of the simulation
process applying WMS model is the CN value (Ponce and Hawkins 1996). Selection of this value
depends on judgment about the watershed’s physical characteristics as well as its antecedent
moisture conditions. According to the geological assessment of the catchment areas (Fig. 2), two
main soil categories can be clearly identified. A curve number (CN) was assigned to each category.
The first category consists of Miocene limestone with a relatively thin Quaternary soil cover and
sparse vegetation. For this category, the hydrological soil group ‘‘C’’ was chosen (Gawasis basin).
Thus, for mountain brush mixture with poor conditions the curve number (CN) was estimated to be
75. The second category consists of Cretaceous sandstone and basement rocks with no soil cover.
The hydrological soil group ‘‘D’’ was chosen, which indicates a hard surface with a very slow
infiltration rate (Gasus basin). The corresponding curve number was estimated to be 91. Antecedent
moisture condition (AMC) is another parameter to affect the choice of the CN value. Based on the
rainfall records and the distribution of the rainfall patterns, the average antecedent moisture
condition AMC-II was adopted for the first and third storms. For the second storm, a dry antecedent
moisture condition (AMC-I) was selected. The weighted CN value for the catchments upstream was
estimated to be 78 for the AMC-II, and 60 for AMC-I (Chow et al. 1988). The results of the model
(Table 4 and Fig. 6 and 7) show the following;
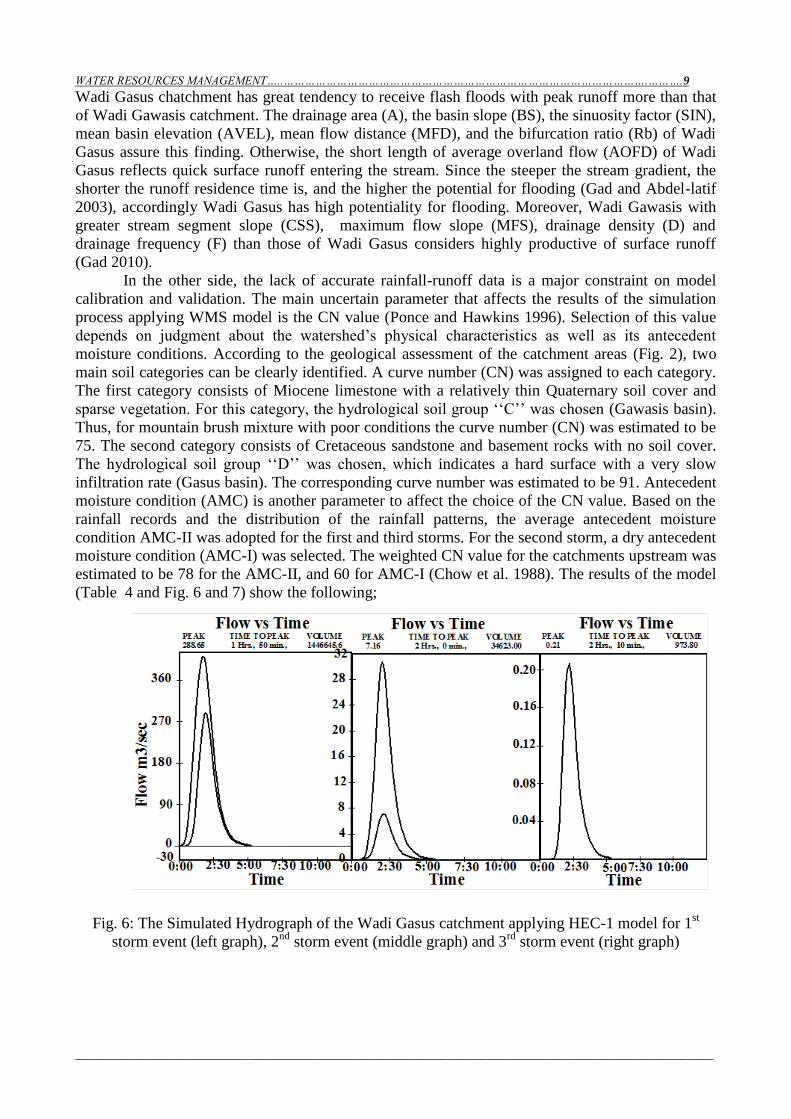
Fig. 6: The Simulated Hydrograph of the Wadi Gasus catchment applying HEC-1 model for 1st
storm event (left graph), 2nd
storm event (middle graph) and 3rd
storm event (right graph)
WATER RESOURCES MANAGEMENT…..………………………………………………………………………………………….……….10
________________________________________________________________________________________________
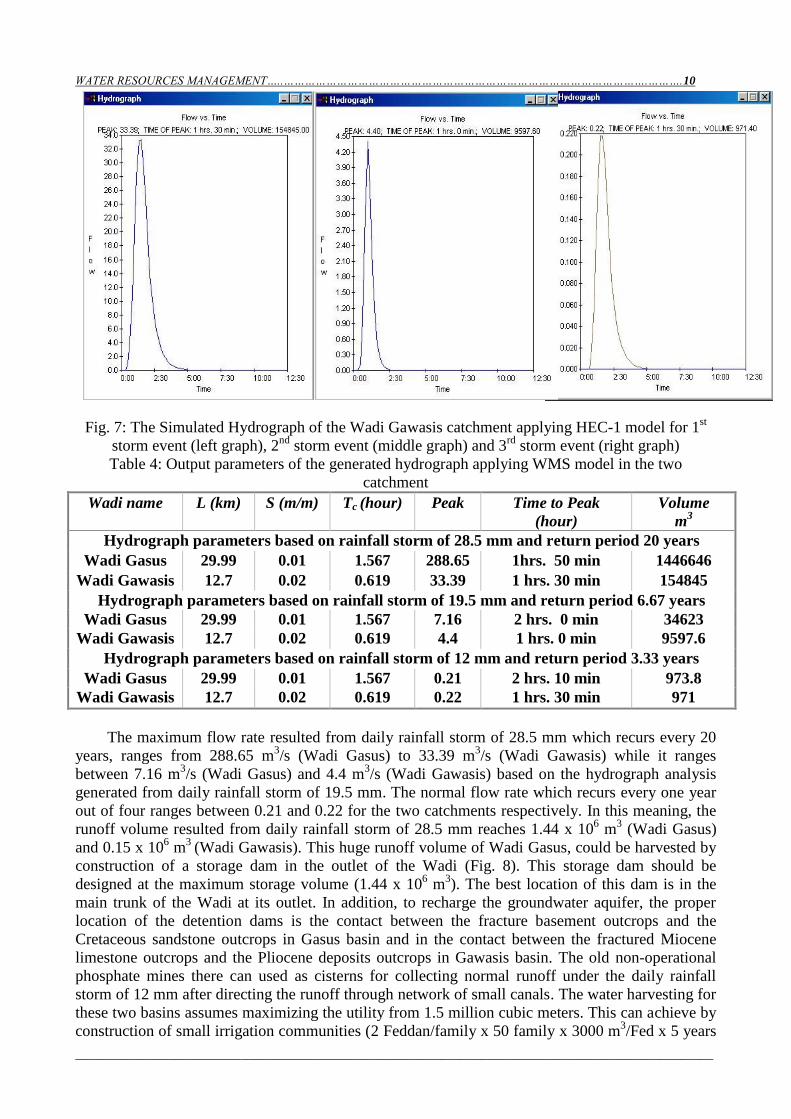
Fig. 7: The Simulated Hydrograph of the Wadi Gawasis catchment applying HEC-1 model for 1st
storm event (left graph), 2nd
storm event (middle graph) and 3rd
storm event (right graph)
Table 4: Output parameters of the generated hydrograph applying WMS model in the two
catchment
Wadi name L (km) S (m/m) Tc (hour) Peak Time to Peak
(hour)
Volume
m3
Hydrograph parameters based on rainfall storm of 28.5 mm and return period 20 years
Wadi Gasus 29.99 0.01 1.567 288.65 1hrs. 50 min 1446646
Wadi Gawasis 12.7 0.02 0.619 33.39 1 hrs. 30 min 154845
Hydrograph parameters based on rainfall storm of 19.5 mm and return period 6.67 years
Wadi Gasus 29.99 0.01 1.567 7.16 2 hrs. 0 min 34623
Wadi Gawasis 12.7 0.02 0.619 4.4 1 hrs. 0 min 9597.6
Hydrograph parameters based on rainfall storm of 12 mm and return period 3.33 years
Wadi Gasus 29.99 0.01 1.567 0.21 2 hrs. 10 min 973.8
Wadi Gawasis 12.7 0.02 0.619 0.22 1 hrs. 30 min 971
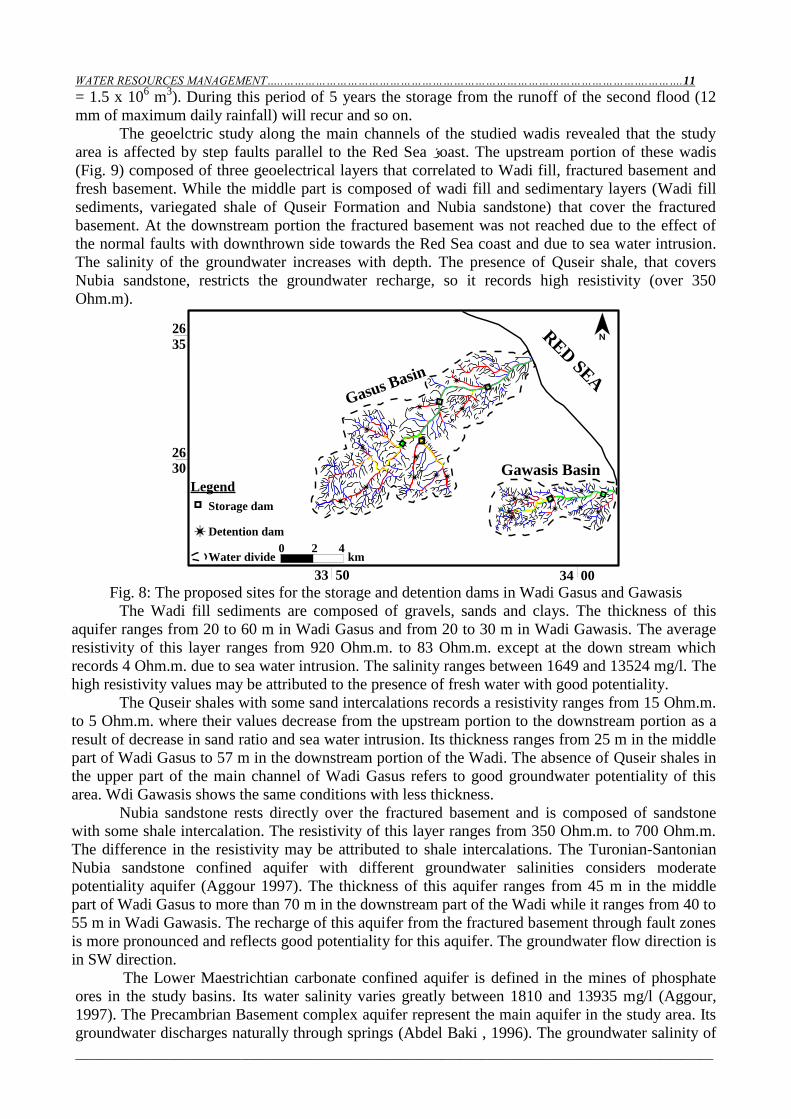
The maximum flow rate resulted from daily rainfall storm of 28.5 mm which recurs every 20
years, ranges from 288.65 m3/s (Wadi Gasus) to 33.39 m
3/s (Wadi Gawasis) while it ranges
between 7.16 m3/s (Wadi Gasus) and 4.4 m
3/s (Wadi Gawasis) based on the hydrograph analysis
generated from daily rainfall storm of 19.5 mm. The normal flow rate which recurs every one year
out of four ranges between 0.21 and 0.22 for the two catchments respectively. In this meaning, the
runoff volume resulted from daily rainfall storm of 28.5 mm reaches 1.44 x 10⁶ m
3 (Wadi Gasus)
and 0.15 x 10⁶ m
3 (Wadi Gawasis). This huge runoff volume of Wadi Gasus, could be harvested by
construction of a storage dam in the outlet of the Wadi (Fig. 8). This storage dam should be
designed at the maximum storage volume (1.44 x 10⁶ m
3). The best location of this dam is in the
main trunk of the Wadi at its outlet. In addition, to recharge the groundwater aquifer, the proper
location of the detention dams is the contact between the fracture basement outcrops and the
Cretaceous sandstone outcrops in Gasus basin and in the contact between the fractured Miocene
limestone outcrops and the Pliocene deposits outcrops in Gawasis basin. The old non-operational
phosphate mines there can used as cisterns for collecting normal runoff under the daily rainfall
storm of 12 mm after directing the runoff through network of small canals. The water harvesting for
these two basins assumes maximizing the utility from 1.5 million cubic meters. This can achieve by
construction of small irrigation communities (2 Feddan/family x 50 family x 3000 m3/Fed x 5 years
WATER RESOURCES MANAGEMENT…..………………………………………………………………………………………….……….11
________________________________________________________________________________________________
= 1.5 x 10⁶ m
3). During this period of 5 years the storage from the runoff of the second flood (12
mm of maximum daily rainfall) will recur and so on.
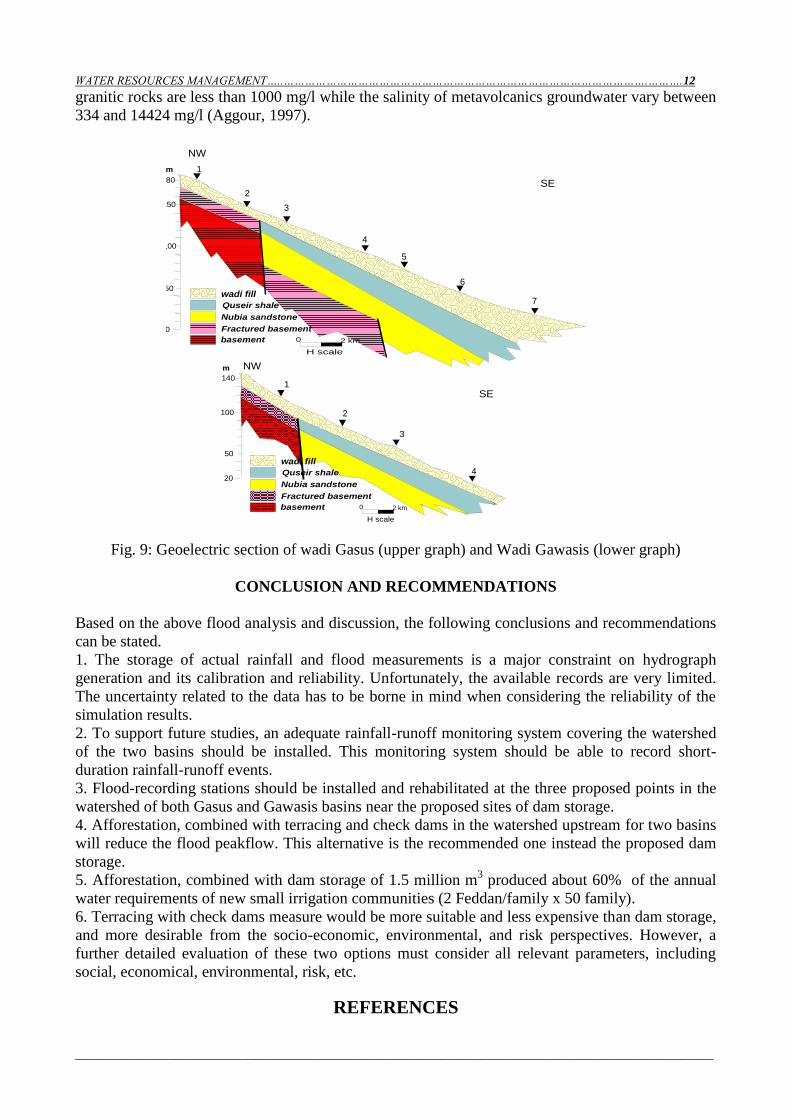
The geoelctric study along the main channels of the studied wadis revealed that the study
area is affected by step faults parallel to the Red Sea ؤoast. The upstream portion of these wadis
(Fig. 9) composed of three geoelectrical layers that correlated to Wadi fill, fractured basement and
fresh basement. While the middle part is composed of wadi fill and sedimentary layers (Wadi fill
sediments, variegated shale of Quseir Formation and Nubia sandstone) that cover the fractured
basement. At the downstream portion the fractured basement was not reached due to the effect of
the normal faults with downthrown side towards the Red Sea coast and due to sea water intrusion.
The salinity of the groundwater increases with depth. The presence of Quseir shale, that covers
Nubia sandstone, restricts the groundwater recharge, so it records high resistivity (over 350
Ohm.m).
Gawasis Basin
Gasus Basin
RED
SEA
33 50 34 00
2635
2630
Legend
Storage dam
Detention dam
Water divide0 2 4
km
Fig. 8: The proposed sites for the storage and detention dams in Wadi Gasus and Gawasis
The Wadi fill sediments are composed of gravels, sands and clays. The thickness of this
aquifer ranges from 20 to 60 m in Wadi Gasus and from 20 to 30 m in Wadi Gawasis. The average
resistivity of this layer ranges from 920 Ohm.m. to 83 Ohm.m. except at the down stream which
records 4 Ohm.m. due to sea water intrusion. The salinity ranges between 1649 and 13524 mg/l. The
high resistivity values may be attributed to the presence of fresh water with good potentiality.
The Quseir shales with some sand intercalations records a resistivity ranges from 15 Ohm.m.
to 5 Ohm.m. where their values decrease from the upstream portion to the downstream portion as a
result of decrease in sand ratio and sea water intrusion. Its thickness ranges from 25 m in the middle
part of Wadi Gasus to 57 m in the downstream portion of the Wadi. The absence of Quseir shales in
the upper part of the main channel of Wadi Gasus refers to good groundwater potentiality of this
area. Wdi Gawasis shows the same conditions with less thickness.
Nubia sandstone rests directly over the fractured basement and is composed of sandstone
with some shale intercalation. The resistivity of this layer ranges from 350 Ohm.m. to 700 Ohm.m. The difference in the resistivity may be attributed to shale intercalations. The Turonian-Santonian
Nubia sandstone confined aquifer with different groundwater salinities considers moderate
potentiality aquifer (Aggour 1997). The thickness of this aquifer ranges from 45 m in the middle
part of Wadi Gasus to more than 70 m in the downstream part of the Wadi while it ranges from 40 to
55 m in Wadi Gawasis. The recharge of this aquifer from the fractured basement through fault zones
is more pronounced and reflects good potentiality for this aquifer. The groundwater flow direction is
in SW direction.
The Lower Maestrichtian carbonate confined aquifer is defined in the mines of phosphate
ores in the study basins. Its water salinity varies greatly between 1810 and 13935 mg/l (Aggour,
1997). The Precambrian Basement complex aquifer represent the main aquifer in the study area. Its
groundwater discharges naturally through springs (Abdel Baki , 1996). The groundwater salinity of
WATER RESOURCES MANAGEMENT…..………………………………………………………………………………………….……….12
________________________________________________________________________________________________
0 2 km
H scale
wadi fill
Quseir shale
Nubia sandstone
Fractured basement
basement
1
2
3
4
5
6
7
NW
SE
0
50
100
150
180
m
1
2
3
4
NW
SE
0 2 km
H scale
wadi fill
Quseir shale
Nubia sandstone
Fractured basement
basement
20
50
100
140
m
granitic rocks are less than 1000 mg/l while the salinity of metavolcanics groundwater vary between
334 and 14424 mg/l (Aggour, 1997).
Fig. 9: Geoelectric section of wadi Gasus (upper graph) and Wadi Gawasis (lower graph)
CONCLUSION AND RECOMMENDATIONS
Based on the above flood analysis and discussion, the following conclusions and recommendations
can be stated.
1. The storage of actual rainfall and flood measurements is a major constraint on hydrograph
generation and its calibration and reliability. Unfortunately, the available records are very limited.
The uncertainty related to the data has to be borne in mind when considering the reliability of the
simulation results.
2. To support future studies, an adequate rainfall-runoff monitoring system covering the watershed
of the two basins should be installed. This monitoring system should be able to record short-
duration rainfall-runoff events.
3. Flood-recording stations should be installed and rehabilitated at the three proposed points in the
watershed of both Gasus and Gawasis basins near the proposed sites of dam storage.
4. Afforestation, combined with terracing and check dams in the watershed upstream for two basins
will reduce the flood peakflow. This alternative is the recommended one instead the proposed dam
storage.
5. Afforestation, combined with dam storage of 1.5 million m3 produced about 60% of the annual
water requirements of new small irrigation communities (2 Feddan/family x 50 family).
6. Terracing with check dams measure would be more suitable and less expensive than dam storage,
and more desirable from the socio-economic, environmental, and risk perspectives. However, a
further detailed evaluation of these two options must consider all relevant parameters, including
social, economical, environmental, risk, etc.
REFERENCES
WATER RESOURCES MANAGEMENT…..………………………………………………………………………………………….……….13
________________________________________________________________________________________________
Abdel-Baki, A. A., (1996): "Groundwater supplies in Safaga area, Red Sea coast, A. R. E." El
Minia Sci., Bull., V. 9 (1). 49-70.
Abdellah, M. (1995): "Geology and Geophysical investigations for groundwater potentialities in
El-Quseir-Abu Ghusun Area, South of the Eastern Desert –Egypt." Unpublished M. Sc.
Thesis. Fac., of Sci., Cairo Univ. 192.
Abu El Izz, M. S., (1971): ''Landforms of Egypt". Am. Univ., Cairo press. 1-249.
Aggour , T. A. O. (1997): "Impact of geomorphological and geological setting on groundwater in
Qena - Safaga district - Central Eastern Desert – Egypt" . Ph.D. Thesis Fac. Sci. , Ain
Shams Univ. , 355.
Ashmawy, M. H., (1994): "assessment of flash flood potential of the Red Sea drainage basins
along the Qena-Safaga highway, Eastern Desert, Egypt." ITC J. N. 94 (2), 119-128.
Attia, M .I. (1955). "Topography, geology and iron-ore deposits of the district east of Aswan". G.
S. Eg., 262.
Bassiouni, M. A. (1970): "Ostracoden aus dem Eozen von Aegypten. Die Unterfamilien
Hemicytherinae, Thacocytherinae und Compylocytherinae." Geol. Jb. 88: 203-234.
Bedient, P. B., and Huber, W. C. (1992): "Hydrology and floodplain analysis", 2nd Ed., Addison-
Wesley, New York.
Chow, V. T., Maidment, D. R., and Mays, L. W. (1988): "Applied hydrology". McGraw-Hill,
New York.
Egyptian Geologic Survey and Mining Authority EGSMA (1978): "Geological map of the
Aswan Quadrangle, Egypt." Published in cooperation with the U.S. Geol. Surv. under
the auspices of the U.S. Agency for int. Dev. (USAID).
El Akaad , M. K. and Noweir , A. (1980): "Geology and lithostratigraphy of the Arabian Desert
orogenic belt of Egypt between lat. 25o 35' and 26
o 30' N." Bull. Innst. Applied Geol.,
King Abdul Aziz Univ. , Jeddah 3(4), 127-135.
El-Akkad, S.E. and Dardir, A. (1966): "Geology of the Red Sea coast between Ras Shagra on
Mersa Alam with short note on exploratory work at Gebel El Rusas lead – Zinc
deposits." Surv. Eg., paper 35, 67.
EL Rmmly, M. et al (1972): "A new geological of the basement rocks in East and Southwest of
Egypt." Annals of Geol. Surv. Egypt. V. 2 1-18.
El Shamy, I. Z., (1985): "Quantitative geomorphology and surface water conservation in Wadi
Matula-Wadi Abbad area, Central Eastern Desert." E., G., S., V. 15, 349-358.
El Shamy, I. Z., (1988): "Quantitative geomorphology and surface runoff control for Wadi Qena,
Central Eastern Desert." E., G., S., 6th
Ann., 13-26.
El Shamy, I. Z., (1992): "Recent recharge and flash flooding opportunities in the Eastern Desert,
Egypt." E., G., S., V. 18, 323-334.
El Rakaiby, M. L., (1989): "Drainage basins and flash flood hazard in selected parts of Egypt." J.
G. 33 (1-2), 307-323.
EL Shazly, M. E., (1977): "The Geology of the Egyptian Region. The Ocean Basins and Margins."
Vol. 4A Plenum press, New York and London.
El-Tarabili, E. (1964): "General outline of the structure of the sedimentary formations in the
central part of the Eastern Desert, Quseir Safaga -Wadi Qena’s southern part." Bull.
Des. Ins. 27-39.
Gad, M. I. M., Farag, M. H. and Zaki, M. H. (2002): "Simulation of direct runoff volumes and
peak rates for some catchments in El Qasr-Umm El Rakham area, northwestern coastal
zone, Egypt." III Reg. Conf. on Civil Eng. Tech. and III Int. Symp. Env. Hyd. (CD).
Gad, M. I. M., and Abdel-Latif, A. (2003): "Hydrology of some drainage basins in the area
between Quseir and Marsa Alam , Eastern Desert, Egypt." Giessener Geologische
Schriften Nr. 70 215S., Germany: 195-215.
Gad, M. I. M. (2010): ''Assessment of surface runoff in some Wadis of West Sidi Barani area,
northwestern coastal zone, Egypt." Egypt. J. P. Sci. V 48: 13-36.
WATER RESOURCES MANAGEMENT…..………………………………………………………………………………………….……….14
________________________________________________________________________________________________
Gawish, A. M. M., (1981): "Wadi Qena Basin, Geomorphologic study." M. Sc. Thesis, Geog.
Dept. Cairo Univ. 188.
Gomaa , M. A. (1992): "Hydrogeological studies between Quseir - Safaga area , Eastern Desert ,
Egypt ." M.Sc. Thesis Fac. Sci. Ain Shams Univ. 150.
Hammad, F. A. (1998): "Flash flood management in Arid and Semi-Arid Regions." Proc., Int.,
Conf. on Desert Dev. in the Arab Gulf Countries. Kuwait Ins. for Sci. Res., Sus. Dev. in
arid zones, 541-560.
HEC-1 flood hydrograph package users manual. (1985): "Hydrologic Engrg." Ctr., U.S. Army
Corps of Engineers, Davis, Calif.
Ismail, Y. L. and Morad, N. A. (2009): "Assessment of the Water Resources in the Southern
Portion of the Red Sea Coastal Area, Southeast Egypt (Case Study Wadi Khuda)". VI
Reg. Conf. on Civil Eng. Tech. and VI Int. Symp. Env. Hyd. (CD).
Issawi B., Francis, M. EL-Hinnawi, M. and EL-Deftar, T. (1971): "Geology of Safaga-Quseir
coastal plain and Mohamed Rabah area." Ann. Geol. Surv. Eg., V. 1, 1-19.
Jain, S. K., Chowdhary, H., Seth, S. M. and Nema, R. K. (1997): "Flood estimation using a
GUIH based on the conceptual rainfall- runoff model and GIS." ITC J., 1, Enschede,
The Netherlands, 20-25.
Kirpich (1940) : "Time of concentration of small agricultural watershed." ASCE., Civil Eng., 10
(6). 362.
Kunetz, G. (1966). "Principles resistivity prospecting. Berlin," 103. of direct current ebruder
Borntraeger,
Mansour, M. S., Bassyouni F. A., and AL-Far D. M. (1956): "Geology of Umm Salatit-El
Hisinat (Barramyia east.sheet)." Geol. Surv. Cairo, 28.
Martz, L.M., and J. Garbrecht, (1993): "DEDNM: A software system for the automated
extraction of channel network and watershed data from raster digital elevation models,"
AWRA Proc. of the Geog. Inf. Sys. and Water Res., 211-220.
Misak, R. F. and Abdel Baki, A. A. (1991): "Classification of Phanerozoic Aquifers in the Eastern
Desert with Emphasis on The Newly Explored Ones." Bull. Fac. Sci., Ass. Univ., 20
(2-F), 19-38.
Morcoss, M. B. (1977): "Photogeological studies on the Precambrian rocks of the Central Eastern
Desert of Egypt." Unpublished Ph. D. Thesis, Cairo Univ., 290.
Nelson, E. James., A.Woodruff Miller, and Eric Dixon, (2000): "Mud Canyon Fire: A
Hydrologic Evaluation of Rainfall Runoff from a Burned Watershed," Int. J. of
Wildland Fire, V. 9, (1), 2000.
Philip G., Eweida, E., and El Gamal, S., (1992): "Quantitative geomorphology of some
watersheds in Wadi Qena in relation to basin hydrogeology." 1st Conf., G. A. W., 159-
165.
Ponce, V.M. (1989): “Engineering Hydrology, Principle and practices”, Prentice-Hall, New Jersy
Ponce, V. M., and Hawkins, R. H. (1996): ‘‘Runoff curve number: Has it reached maturity?’’ J. of
Hyd. Eng., ASCE, 1(1), 11–20.
Sabit and Bykov, B. A. (1976) : "Geological map, Quseir sheet, Eastern Desert, Egypt." Geol.
Surv. Internal report.
Said, R. (1962) : "The geology of Egypt." Elsevier Publ. Co. Amsterdam, New York, 337.
Saleh, M. F. (1993): "Hydrogeological and Hydrogeochemical Studies on Some Localities in South
Eastern Desert, Egypt." Unpublished Ph.D. Thesis, Fac. of Sci., Suez Canal Univ., 314.
WATER RESOURCES MANAGEMENT…..………………………………………………………………………………………….……….15
________________________________________________________________________________________________
Soil Conservation Service SCS (1986): "National Engineering Handbook." U.S. Dept. of Agr.,
Washington, DC.
Tolba, M.E., (1997): "Drainage basin analyses for some basins along the Red Sea coast and their
implications to flash flooding." Al-Azhar Bull. Sci. V.8, (2), 509-523.
Tolba, M. E. and Amin B. M. (1998): "Flash flooding: El-Sokari basin as a case study during
flooding on November 1996." Proceed.11th
Symp. Phaner. Dev. Eg. 21-38.
Van Der Velpen , B.P.A. (1988): "Resist , version 1.0 , a package for the processing of the
resistivity sounding data" M.Sc. Res. Proj., ITC , Delft , the Netherlands.
WMS (1996): "Watershed modeling system reference manual." Brigham Young Univ., Provo,
Utah.
Youssef , M. I. (1957): "Upper Cretaceous rocks in Quseir area." Bull. Ins. Des. Eg. T . V. 2 (2),
35-53.
Zohdy , A.A.R., (1989): "A new method for automatic interpretation of Schlumberger and Wenner
sounding curves." Geophys., V.54, 245-253 .
08910889WMS
HEC-1
0.1011911
1.51
11
1
0.1