Embed Size (px)
Citation preview
Seasonal Movement of Dolly Varden and Cutthroat Troutwith Respect to Stream Discharge in a Second-Order Stream
in Southeast Alaska
M. D. BRYANT*U.S. Department of Agriculture, Forest Service, Southern Research Station,
Center for Bottomland Hardwood Research, Post Office Box 227, Stoneville, Mississippi 38776, USA
M. D. LUKEY
U.S. Department of Agriculture, Forest Service, Pacific Northwest Research Station,Forestry Sciences Laboratory, 2770 Sherwood Lane, Suite 2A, Juneau, Alaska 99801, USA
J. P. MCDONELL, R. A. GUBERNICK, AND R. S. AHO1
U.S. Department of Agriculture, Forest Service, Tongass National Forest,Post Office Box 309, Petersburg, Alaska 99833, USA
Abstract.—The relationship between the movement of small (,150-mm) Dolly Varden Salvelinus malmaand cutthroat trout Oncorhynchus clarkii and stream discharge is not well known in streams of southeast
Alaska. We measured movement in a small headwater stream using passive integrated transponder (PIT) tags
and stationary antennas to record time and date of movement. Fish with PIT tags were detected by transceivers
and stationary antennas in the stream. The date and time of detection at an antenna were matched with stream
discharge (m3/s) at the same date and time. Most Dolly Varden moved upstream during late summer and early
fall. Most cutthroat trout movement was in May, and movement declined through the summer. Few fish
moved during the winter. Most fish moved within a narrow discharge range, with a few moving at higher
discharges. More than 97% of fish from both species were detected as moving upstream at discharges below
the 5% exceedance level during the 4-year period of discharge measurements. Dolly Varden and cutthroat
trout moved throughout the entire length of usable habitat in the stream. Connectivity throughout watersheds
even within headwater streams is important and can be maintained for these species by use of road crossings
that ensure passage over a range of flow conditions such as those described here.
Recent studies in southeast Alaska have demonstrat-
ed that both resident and anadromous salmonids are
present in streams with gradients greater than 5%(Bramblett et al. 2002; Bryant et al. 2004). Bryant et al.
(2004) reported small (,150-mm) Dolly Varden
Salvelinus malma and coastal cutthroat trout Onco-rhynchus clarkii clarkii in reaches with gradients of
15% or higher. Sea-run Dolly Varden were observed
during the fall in pools situated in reaches with average
gradients over 15%. Dolly Varden and cutthroat trout
were the primary species using tributary reaches with
gradients greater than about 6% (Bryant et al. 2004).
Coho salmon O. kisutch fry also were found at
gradients greater than 10% in the upper reaches of
tributaries; however, they were most abundant at
gradients less than 5%.
Movement of salmonids throughout watersheds is a
generally accepted paradigm, and connectivity within
small, high-gradient (.5%) streams and to downstream
reaches is an important concern for management of
these species (Gowan et al. 1994; Gowan and Fausch
1996). Seasonal movement is common among salmo-
nids throughout their range (Peterson 1982; Swales et
al. 1987; Bramblett et al. 2002; Bryant et al. 2004).
Several studies have established that Dolly Varden and
cutthroat trout move both within and among streams
(Armstrong 1974; Swanberg 1997; Bonneau and
Scarnecchia 1998; Adams et al. 2000). However, their
movement patterns with respect to stream discharge in
high-gradient streams are not well known, particularly
for streams in southeast Alaska. Many high-gradient
streams throughout southeast Alaska have road cross-
ings that either do not allow fish passage or are barriers
to movement at most discharge levels (U.S. Depart-
ment of Agriculture 2005).
Two important questions are ‘‘What is the relation-
ship between fish movement upstream and discharge?’’
and ‘‘Do fish move during periods of peak discharge?’’
The goal of this study was to examine movement of
Dolly Varden and cutthroat trout in relation to stream
discharge within a small, second-order, high-gradient
* Corresponding author: [email protected] Retired.
Received February 17, 2009; accepted August 18, 2009Published online November 5, 2009
1728
North American Journal of Fisheries Management 29:1728–1742, 2009American Fisheries Society 2009DOI: 10.1577/M09-022.1
[Article]
(.5%) stream. Specific objectives were to (1)
determine the range of discharges in which Dolly
Varden and cutthroat trout move upstream; (2)
document the seasonal movement of these fish; (3)
determine the distance moved by the fish; and (4)
describe the relationship between upstream movement
and discharge based on the percentage of time
discharge is exceeded.
Methods
Study site.—We intensively sampled a single stream,
Hobo Creek, Alaska, located on a road system with
access throughout the year. The study was designed as
a case study to determine the movement of Dolly
Varden and cutthroat trout in small, high-gradient
streams under naturally occurring discharges. Dolly
Varden and cutthroat trout are the primary species in
these headwater streams. Coho salmon are present in
Hobo Creek, and pink salmon O. gorbuscha spawn in
the lower reaches. A few larger (.250 mm) anadro-
mous Dolly Varden and cutthroat trout may have
entered the stream, but we did not sampled them. The
study required development of a methodology for
measuring real-time fish movement without altering
natural streamflow. Logistical and equipment con-
straints were an important consideration in the selection
of the study site, and the initial phase of the study
required considerable testing, development, and mod-
ification of instrumentation in the stream.
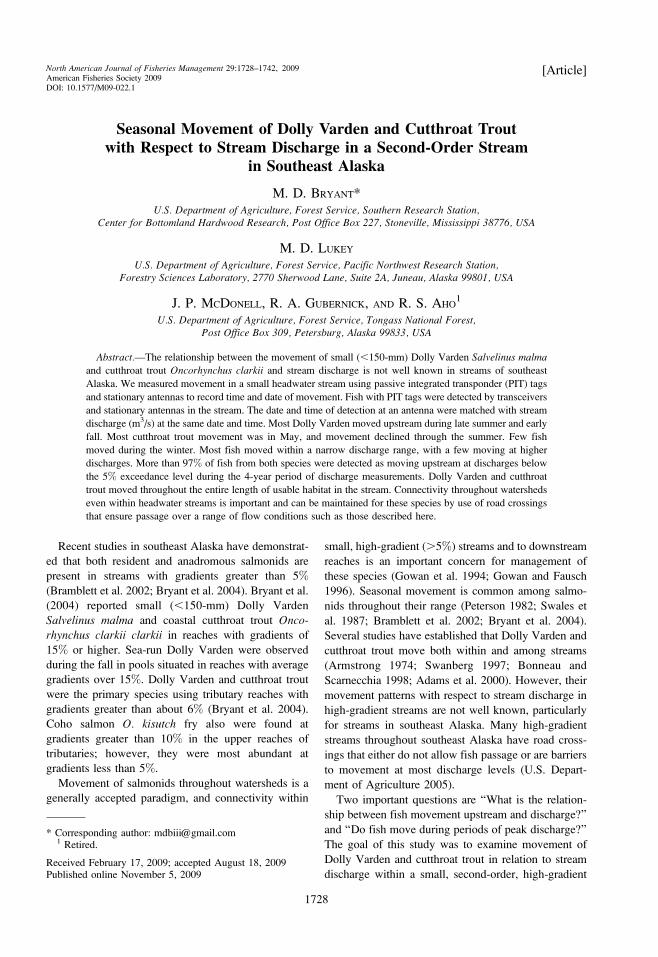
Hobo Creek is located on the Petersburg road system
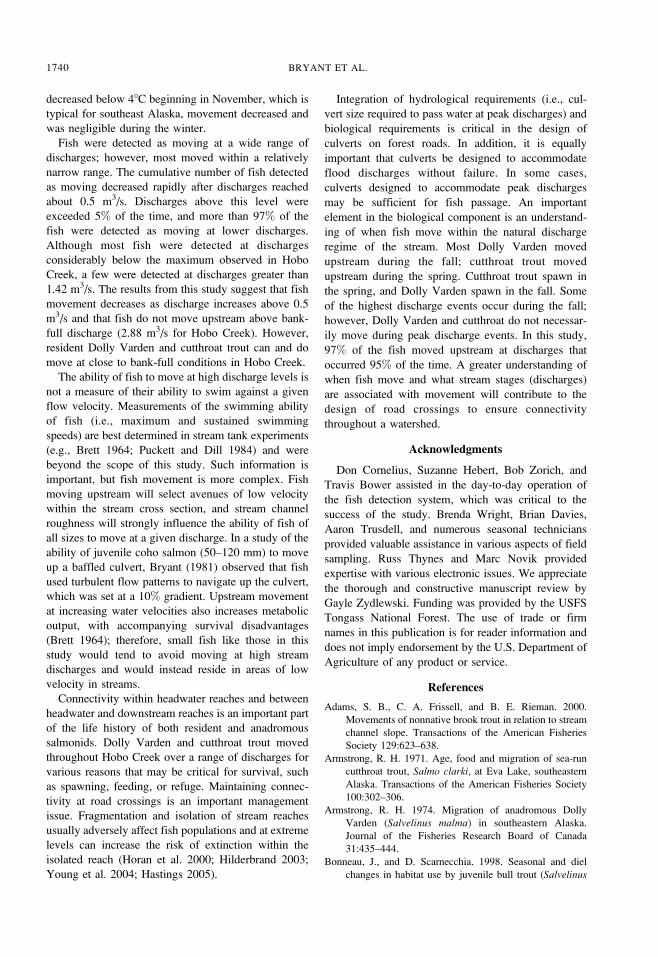
approximately 10 km from Petersburg, southeast
Alaska (Figure 1). Hobo Creek is a second-order
stream with gradients ranging from 2% in the lower
reaches to about 15% in the higher reaches of the study
section. The average width is about 1.5 m. The channel
morphology in Hobo Creek is mainly controlled by
bedrock. Channel form varies from reach to reach, with
step pools in the higher-gradient reaches and plane bed
and pool riffle morphology in the lower-gradient
reaches. Hobo Creek is crossed by a bottomless,
multiplate arch culvert located about 300 m from the
stream’s mouth; the streambed is encompassed within
the culvert structure. Conditions in the culvert match
stream conditions near the culvert, and fish of all sizes
can move through the culvert unimpeded.
Hobo Creek extends 2.5 km from origin to mouth.
The length of our study section was 1,150 m, and this
section began 188 m upstream of saltwater influence.
The upstream boundary of the study section was close
to the upper extent of fish habitat and included most of
the available fish habitat in the stream. The study reach
was divided into 10-m increments and marked with
white, 18-mm-diameter polyvinyl chloride (PVC) pipe
to identify stream sections where fish were captured.
Fish sampling.—The goal of sampling for Dolly
Varden and cutthroat trout was to capture and tag as
many fish as possible during each sample period. The
entire study reach (1,150 m) was sampled at least three
times during the spring, summer, and fall of 2001–
2006. Spring samples occurred in April and May, early
summer samples were taken in June and July, and late-
summer samples were taken in August and September.
Fall samples were completed in October and Novem-
ber. Fish were captured and tagged throughout the
entire length of the study reach.
Fish were captured using minnow traps baited with
salmon eggs that were placed in perforated Whirl-pak
bags (Nasco). Forty traps were spaced at about 2-m
intervals beginning downstream. After at least 1 h, fish
were removed from the traps and the traps were reset
upstream. The entire length was usually completely
sampled in 3 or 4 d. The location (midpoint of the 10-m
section) was recorded for each fish (�60 mm) that was
captured or recaptured. All fish were identified and
measured (fork length, mm) and were scanned for
passive integrated transponder (PIT) tags. Only 60-mm
and larger Dolly Varden and cutthroat trout were
tagged. Location of capture, fish length, and PIT tag
number were recorded. The adipose fin of all tagged
fish was removed to monitor potential tag loss.
Recaptured fish were identified by tag number and
were re-measured. A small number of juvenile coho
salmon also reside in the stream but were not tagged.
Most juvenile coho salmon were smaller than 65 mm,
and these fish do not remain in the stream for more
than two summers.
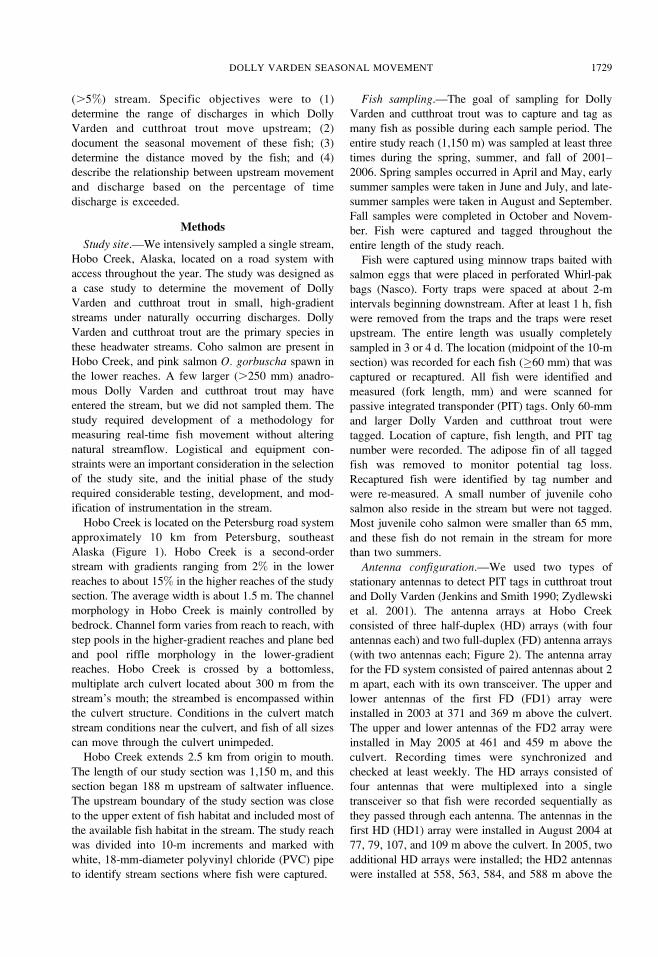
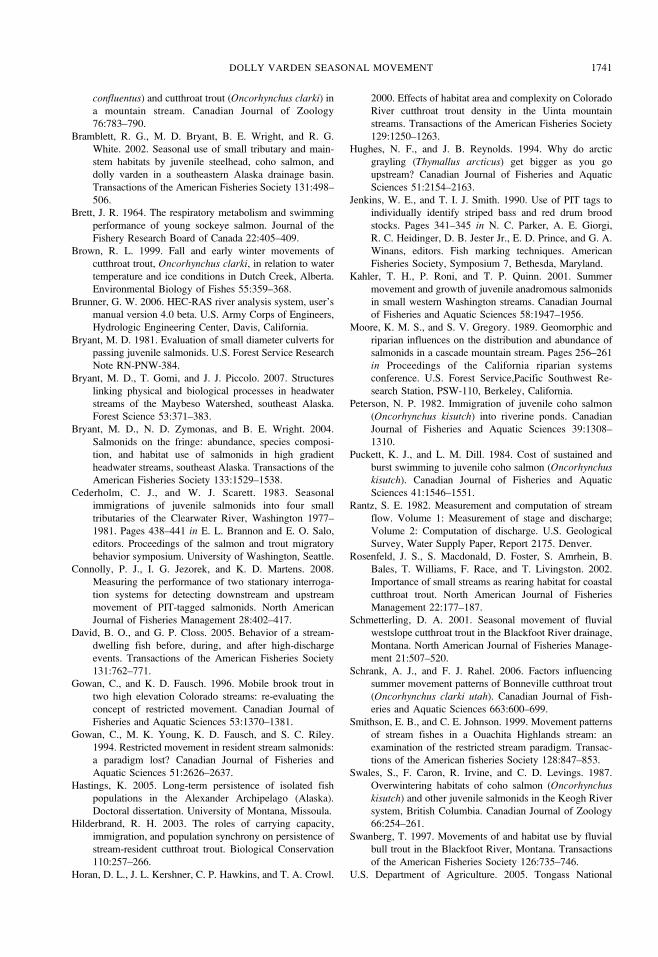
Antenna configuration.—We used two types of
stationary antennas to detect PIT tags in cutthroat trout
and Dolly Varden (Jenkins and Smith 1990; Zydlewski
et al. 2001). The antenna arrays at Hobo Creek
consisted of three half-duplex (HD) arrays (with four
antennas each) and two full-duplex (FD) antenna arrays
(with two antennas each; Figure 2). The antenna array
for the FD system consisted of paired antennas about 2
m apart, each with its own transceiver. The upper and
lower antennas of the first FD (FD1) array were
installed in 2003 at 371 and 369 m above the culvert.
The upper and lower antennas of the FD2 array were
installed in May 2005 at 461 and 459 m above the
culvert. Recording times were synchronized and
checked at least weekly. The HD arrays consisted of
four antennas that were multiplexed into a single
transceiver so that fish were recorded sequentially as
they passed through each antenna. The antennas in the
first HD (HD1) array were installed in August 2004 at
77, 79, 107, and 109 m above the culvert. In 2005, two
additional HD arrays were installed; the HD2 antennas
were installed at 558, 563, 584, and 588 m above the
DOLLY VARDEN SEASONAL MOVEMENT 1729
culvert, and the HD3 antennas were installed at 826,
829, 888, and 890 m above the culvert (Figure 2).
The FD antennas were enclosed in a watertight PVC
casing and were 75 cm across and 30 cm high. The size
of the antenna was limited by the type of transceiver
(DC powered) and did not span the stream width.
Rather than constrict flow, the paired rectangular
antennas were each placed in a structure that contained
the antenna (without altering the stream substrate) on
one side and a high-gradient (.10%), smooth chute on
the other side. The chute effectively blocked upstream
movement of fish at all flows, thereby forcing fish
moving upstream to pass through the two antennas.
However, some fish moving downstream were able to
pass down the chute and were not detected. Detection
of fish moving upstream was our primary concern. The
HD antennas were marine-grade, 12/2-AWG (Ameri-
can wire gauge) cable (10 3 4 mm) that formed a
rectangular loop (approximately 1.5 3 2.0 m depending
on the width of the stream) around the stream cross
FIGURE 1.—Location of the Hobo Creek watershed (cross-hatched area) and study area near Petersburg, Alaska.
1730 BRYANT ET AL.
section. They were anchored on the stream bottom and
secured with support cables. No structure in the stream
was needed to hold the HD antennas.
The 11.5- 3 2.1-mm FD tag was injected into
cutthroat trout (�60 mm) and Dolly Varden (�60 mm)
with a syringe-type injector (Jenkins and Smith 1990).
From 2001 to April 2004, the FD tag was placed in all
60-mm and larger fish. After April 2004, the 23-mm
HD tags were surgically placed into all 110-mm and
larger fish and the FD tags were injected into smaller
fish. Fish smaller than 110 mm were not tagged with
the larger tags because of the potential for inducing
FIGURE 2.—Locations of the full-duplex (FD) and half-duplex (HD) antenna arrays, and antenna distances (m) from the road
crossing, along the study reach in Hobo Creek, Alaska.
DOLLY VARDEN SEASONAL MOVEMENT 1731
mortality or influencing fish movement behavior.
Smaller HD tags were not available at the time of the
study. Initially, all fish tagged with the larger HD tags
and a subset of fish tagged with the FD tags were
retained overnight to monitor tag retention and
survival. No mortalities associated with tagging were
observed.
As fish moved past the antenna, transceivers
recorded the tag number and detection date and time
for each fish. Detection of fish moving upstream was
an important part of the study. For a fish to be
identified as moving upstream, it had to be detected at a
lower antenna at a time earlier than the detection at an
upstream antenna. If fish were not detected sequentially
at two or more antenna, direction could not be
determined. Fish were not used in the analysis of
movement versus discharge if the direction of move-
ment could not be determined. Cutthroat trout and
Dolly Varden were analyzed separately.
Passive integrated transponder tag systems using a
pass-through antenna system where the fish swims
through the antenna are reasonably efficient at a wide
range of flow conditions (Connolly et al. 2008).
Connolly et al. (2008) observed 100% detection at
low discharges and 95% detection at the highest
discharges in their pass-through system. The system
installed in Hobo Creek also was a pass-through
system. The antennas were periodically tested by
passing a tag attached to a stick at various locations
near and through each antenna. The test tag was
detected consistently at discharges higher than 0.5 m3/
s. When the tag was not detected, discharge was less
than 0.5 m3/s, and usually the problem was associated
with low battery power or antenna tuning issues, which
were corrected. These occurrences were rare (,2% of
the tests). The ability of the antenna to detect tags did
not appear to be affected by water flow conditions
during these checks. The water level at these discharge
regimes did not create conditions conducive to fish
movement around the antennas; that is, if fish were
moving, they would have been detected at the
antennas. More than 20,000 detections (all antennas
combined) were recorded over the 2004–2006 sample
period; many of these were multiple detections of the
same fish, instances in which fish direction could not
be determined, or both.
Stream discharge and stage.—A record of stream
discharge was taken to establish flow duration for
Hobo Creek. In October 2000, the Tongass National
Forest (U.S. Department of Agriculture, Forest Service
[USFS]) installed a gaging station with a pressure
transducer approximately 30 m above the road crossing
in a stable pool within a bedrock-controlled reach that
was located upstream of any influences of the existing
culvert (Figure 2). During gage operation, stage (with
date and time) was recorded every 15 min. In October
2004, the U.S. Geological Survey (USGS) installed a
real-time stage monitoring system in the same pool as
the USFS transducer. Data from the USFS gage
continued recording as a backup to the USGS gage
and provided sufficient overlap between gages to
correlate the stage readings between them. To allow
use of the maximum period of record, the USFS and
USGS gages were correlated to correct for differences
between the base stages of the transducers.
Twenty-five discharge measurements were taken at
differing stage heights throughout the period of record
to assist in the development of a stage–discharge rating
curve. The discharge measurements were determined in
accordance with USGS procedures (Rantz 1982).
Discharge measurements ranged from 0.028 to 2.025
m3/s. Discharges correlated to stream stage were used
to develop a River Analysis System (Brunner 2006)
model of the channel section where the gage and stage
measurements were taken. The model was calibrated
with several representative, spaced discharge measure-
ments representing the low to high range of the
recorded discharge, and a rating curve was developed.
Key rating curve descriptor points were taken and
logarithmically expanded to develop an incremental
stage–discharge relationship (Rantz 1992). The stage–
discharge relationship was then correlated to all stage
measurements. Questionable stage measurements due
to ice conditions were removed from the data set.
A flow duration analysis of instantaneous flows for
the period of record (2001–2006) was completed. The
flow duration was used to estimate the exceedance
discharge, defined as the discharge that is equaled or
exceeded for a given percentage of time based on the
period of record. For example, a 5% exceedance
discharge is a discharge that is exceeded 5% of the
time; conversely, flows are less than the 5% exceed-
ance discharge 95% of the time. Table 1 lists the 1, 2,
and 5% exceedance discharge values for Hobo Creek
during the period of record. Exceedance discharge
provides biologists, engineers, and regulatory agencies
with a measure to understand the percentage of time
and thresholds of streamflow when fish passage occurs.
We used the entire period of record to determine
exceedance discharges for fish movement data collect-
ed from 2004 to 2006.
The stream gage was located about 30 m down-
stream from the downstream-most antenna array and
700 m below the upstream-most antenna array;
therefore, the discharge measurements derived from
the stream gage are not precisely the same as those
occurring at the antenna installations when each fish
was detected. The distances between the gaging station
1732 BRYANT ET AL.
and the antennas are relatively short, and the discharge
measurements at the gage are a reasonable approxima-
tion of discharge conditions at the antennas throughout
the stream.
Analysis.—Three interdependent sets of data were
generated during the study: (1) fish that were captured
and tagged, and tagged fish that were recaptured over
the course of the study; (2) fish that were detected at
the antennas; and (3) stream stage converted to
discharge (m3/s). Periodic instream fish sampling
created a population of individually marked fish that
were identified by species, size, and location of
capture. A subset of these fish was recaptured, some
multiple times, over the course of the study. This
created a record of fish size and history of capture for
individual fish. As each fish passed the antenna, the
location of the antenna and tag number were recorded
as well as the date and time of detection at the antenna.
Stream stage was recorded at 15-min intervals along
with the date and time. The three sets of data were
merged to provide the species and size of fish that
passed an antenna at a given date and time and
discharge level.
Direction and distance moved were estimated from
the capture and recapture samples. The direction of
movement was determined by subtracting the previous
capture location (m above the culvert) from most recent
capture location. For example, a fish captured at 70 m
in May and recaptured at 200 m in July moved 130 m
upstream during the interval between the sample
periods. This represents net movement and does not
record all movement that may have occurred during the
interval. We used all fish captured during 2002 through
fall 2006 to determine the distance moved between
sample periods, the number of fish that moved, the
direction of movement, and the number that remained
in the stream section between sample periods.
Fish detected at the antennas during 2004–2006
were used in the analysis of movement and discharge.
The relationships between stream discharge and flows
through the antennas were not reliable as the antennas
were constructed before 2004. The dates and times of
individual fish detections at the antennas were matched
with the dates and times associated with stream
discharge records. Direction of movement was deter-
mined based on the time sequence of fish detections at
the paired antennas. Fish moving upstream were
detected at the lower antenna first. The relationship
between movement and discharge was derived from
fish for which the direction of movement could be
detected and for which the distance moved was 20 m or
greater. Direction of movement could not be deter-
mined for a large number of detections; in most cases,
such fish appeared to reside near the antenna and were
detected on multiple occasions, often over 50 times.
These fish were easily identified by the short distance
moved (usually �2 m) accompanied by multiple
detections within 1 d and were removed from the
analysis.
Stream discharge was derived from stream stage
recorded at 15-min intervals. The stream discharge
nearest to the time of a fish’s detection was used to
determine the relationship between movement and
discharge. The stream discharge data and number of
fish detected during each discharge interval were
merged into a single data set for analysis. The
distribution of movement over the range of stream
discharges was determined by the number of fish
detected during each discharge interval. The relation-
ship between numbers of fish detected and discharge
was described by the cumulative percentage of fish
detected as moving (�20 m) upstream (y) plotted
against discharge (x; m3/s) for all antennas.
Results
Over the course of the study, 695 cutthroat trout and
802 Dolly Varden were tagged. Of these, 221 cutthroat
trout and 238 Dolly Varden were detected at one or
more of the antennas. Many fish were detected multiple
times. Some fish were recaptured but were not detected
at the antennas; 275 cutthroat trout and 375 Dolly
Varden were never recaptured or recorded at any
antenna. These fish may have died or migrated out of
the watershed. Tagged fish were more or less evenly
distributed throughout the stream. Most fish of both
species were 110 mm fork length or smaller, and the
length distribution was skewed toward smaller fish
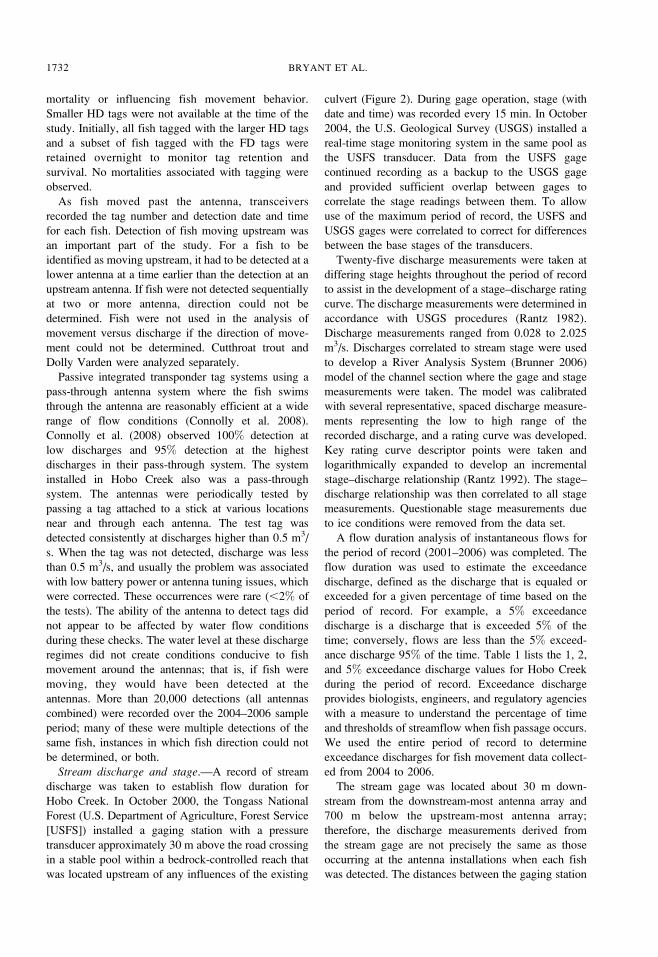
TABLE 1.—Hobo Creek, Alaska, annual exceedance discharge values (m3/s) from each water year and average values over the
period of record (2001–2006).
Exceedancepercentage
Water yearAverage
(2001–2006)2001 2002 2003 2004 2005 2006
1% 1.1241 1.2094 1.1380 1.5087 1.1380 1.2986 1.23632% 0.8583 0.9381 0.7272 0.9172 0.8019 0.8815 0.85405% 0.5069 0.5485 0.4228 0.5151 0.4751 0.4828 0.4918
DOLLY VARDEN SEASONAL MOVEMENT 1733
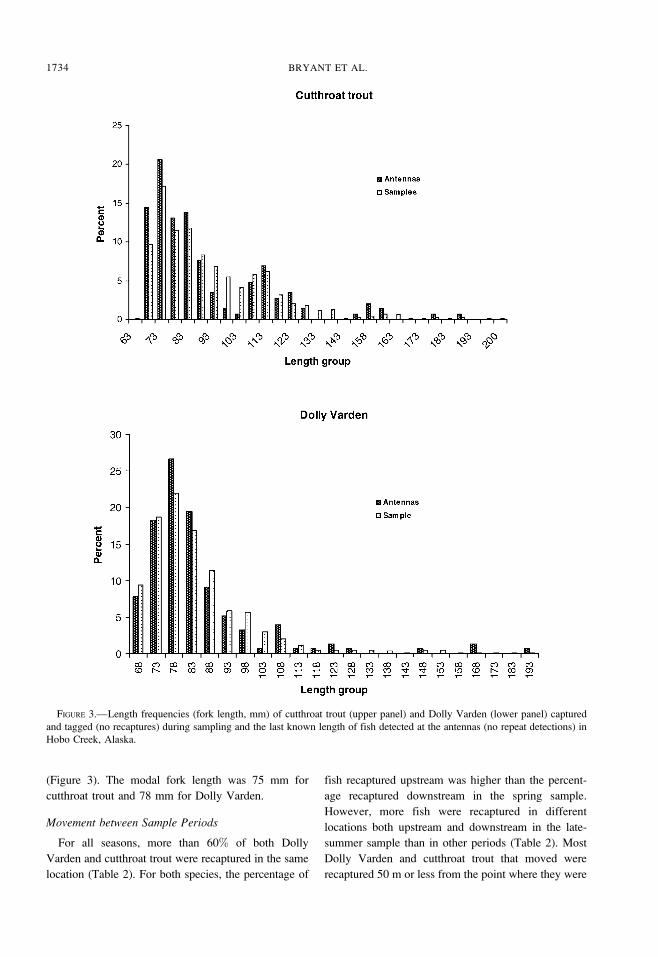
(Figure 3). The modal fork length was 75 mm for
cutthroat trout and 78 mm for Dolly Varden.
Movement between Sample Periods
For all seasons, more than 60% of both Dolly
Varden and cutthroat trout were recaptured in the same
location (Table 2). For both species, the percentage of
fish recaptured upstream was higher than the percent-
age recaptured downstream in the spring sample.
However, more fish were recaptured in different
locations both upstream and downstream in the late-
summer sample than in other periods (Table 2). Most
Dolly Varden and cutthroat trout that moved were
recaptured 50 m or less from the point where they were
FIGURE 3.—Length frequencies (fork length, mm) of cutthroat trout (upper panel) and Dolly Varden (lower panel) captured
and tagged (no recaptures) during sampling and the last known length of fish detected at the antennas (no repeat detections) in
Hobo Creek, Alaska.
1734 BRYANT ET AL.
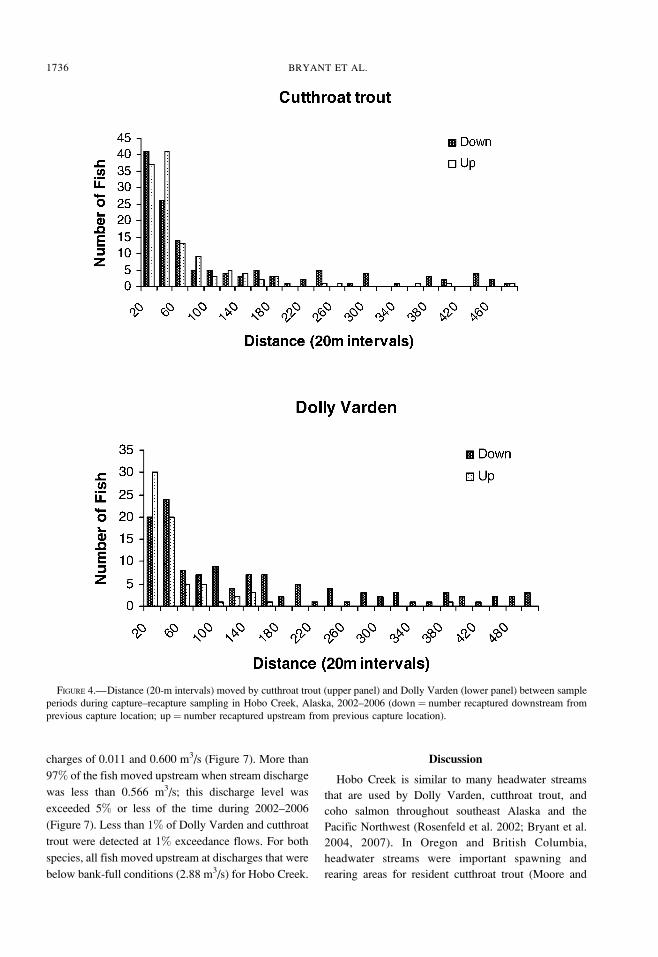
last captured; however, a few fish were recaptured
more than 200 m upstream or downstream (Figure 4).
Stream Discharge
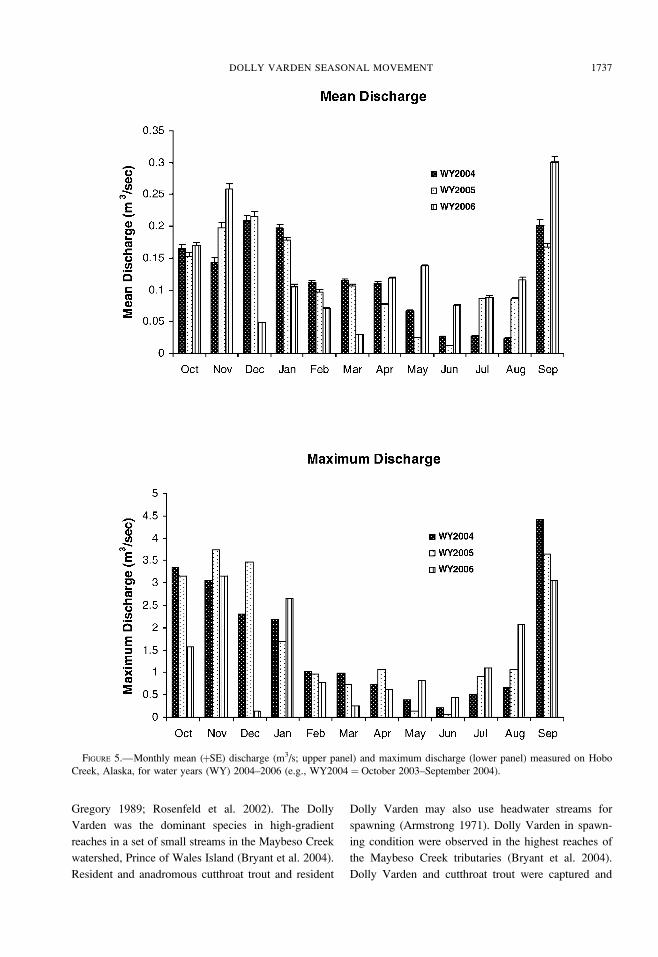
Hobo Creek is a flashy stream that responds rapidly
to intense rainfall. The highest monthly mean dis-
charges occur during September through January.
Maximum discharge may exceed mean monthly
discharge by an order of magnitude. Peak discharges
are of short duration, usually less than 4 h. Based on a
5-year record of discharge measurements in Hobo
Creek, a stream discharge of 1.24 m3/s was exceeded
1% of the time (Table 1). Discharges of 0.85 and 0.50
m3/s were exceeded 2% and 5% of the time,
respectively. The highest discharge events occurred in
September, and discharges greater than 2.88 m3/s were
observed during October through December (Figure 5).
Bank-full conditions in Hobo Creek occur at a
discharge of about 2.88 m3/s and have a 50% chance
of occurring in any given year.
Movement of Fish Detected at Antennas
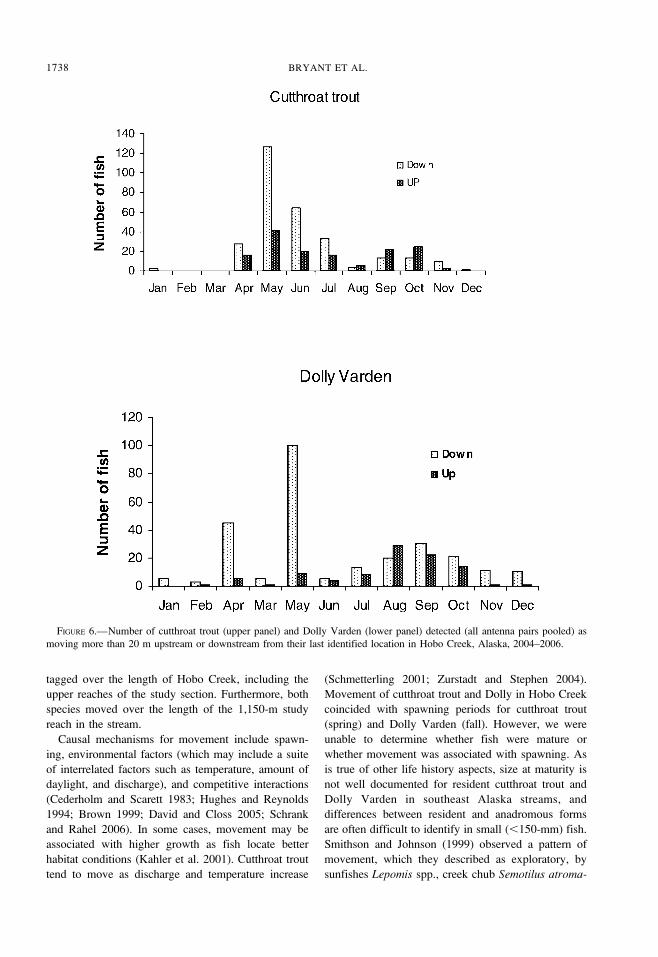
The number of detections of fish moving a distance
of 20 m or more was 363 for Dolly Varden and 444 for
cutthroat trout. Dolly Varden were detected 1,448
times as moving upstream or downstream by a distance
of 2 m or more; cutthroat trout were detected 3,122
times. The totals represent fish that may have been
detected at several times and at several antennas. A
large number of Dolly Varden were detected as moving
downstream in April and May, and most upstream
movement of this species was detected during August
through October (Figure 6). Most upstream movements
of cutthroat trout were detected in May and June, but
upstream movements were also detected in September
and October. No fish were observed moving upstream
in January.
The length frequency distributions of the fish
captured and tagged and of fish detected at the
antennas followed similar patterns for both species
(Figure 3). However, larger fish were detected at the
antennas than were tagged for both species (Kolmo-
gorov–Smirnov two-sample test: P , 0.0001). No
relationship was observed between fork length and
discharge for either species.
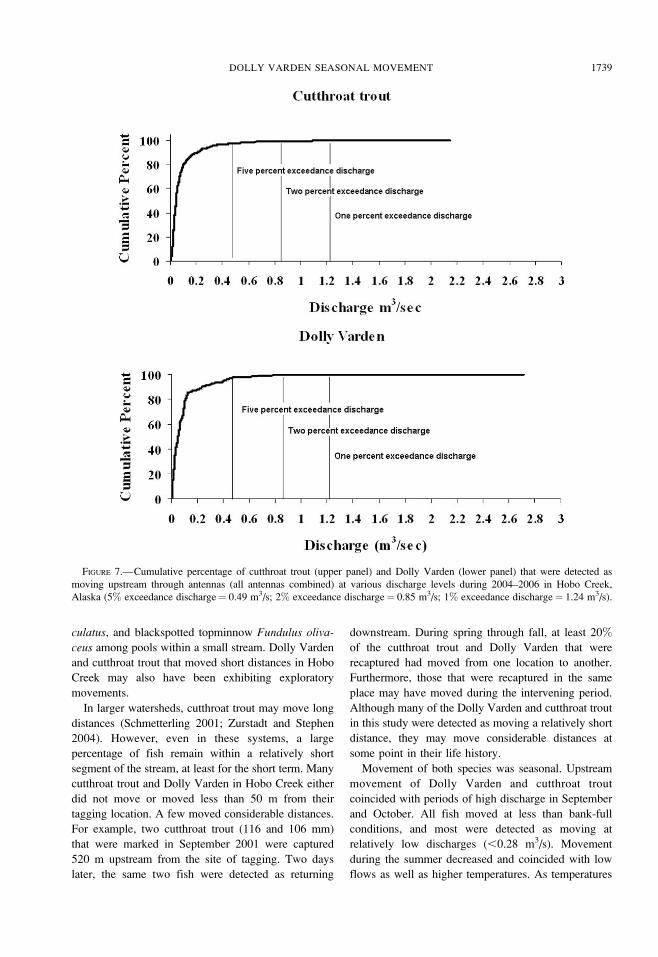
Most Dolly Varden and cutthroat trout were detected
as moving upstream at discharge intervals between
0.01 and 0.10 m3/s (Figure 7). Few fish of either
species were detected at discharge intervals above 0.5
m3/s. Four cutthroat trout and one Dolly Varden were
detected as moving upstream at discharges greater than
0.85 m3/s. The Dolly Varden (85 mm in November
2003) was detected as moving upstream at the FD2
antennas (Figure 2) on 2 December 2004 at a discharge
of 2.7 m3/s. A cutthroat trout (96 mm in June 2003)
was detected as moving upstream at the FD1 antennas
on 5 October 2004 (0825 hours) when discharges were
0.53 m3/s (antenna at 369 m) and 0.55 m3/s (antenna at
371 m). This individual was detected again on 5
October (1117 hours) at the FD2 antennas and was
moving upstream at a discharge of 2.15 m3/s for both
antennas. This cutthroat trout was detected several
other times by one of the FD2 antennas, but the
direction could not be determined. It was detected as
moving downstream through the FD1 antennas on 19
April 2005, when the discharge was 0.55 m3/s. All fish
had moved over 20 m from the point of last capture or
detection when they were detected as moving past the
antennas.
The cumulative percentage of fish detected as
moving upstream rose asymptotically between dis-
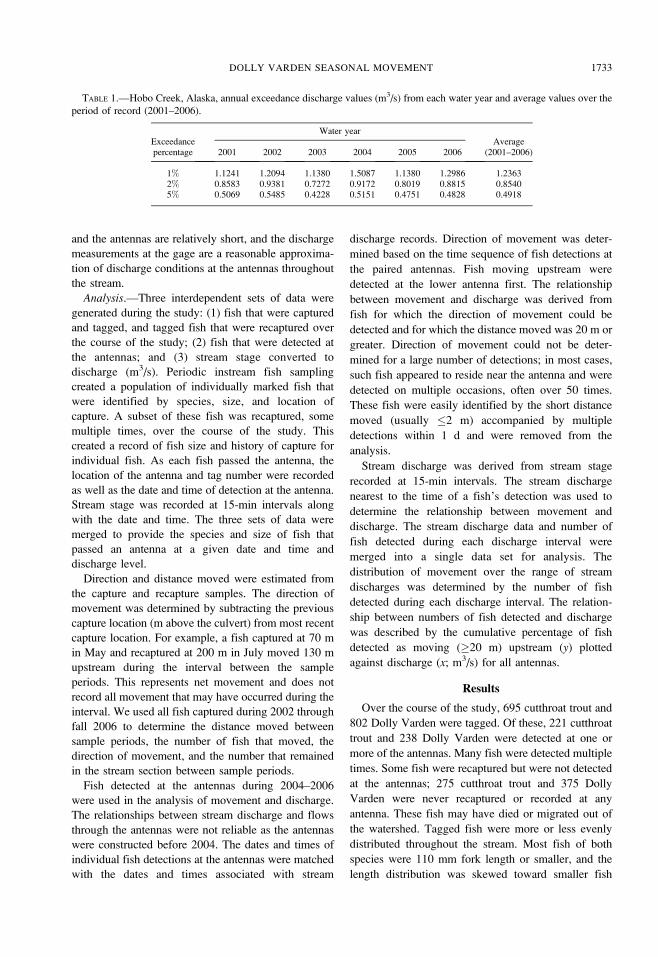
TABLE 2.—Percentage of cutthroat trout and Dolly Varden that moved upstream, moved downstream, or were recaptured in
their previous location by season between capture–recapture sample periods in Hobo Creek, Alaska, 2002–2006 (v2 test: P ¼0.007 for cutthroat trout; P , 0.0001 for Dolly Varden).
Season
Cutthroat trout percentage Dolly Varden percentage
No movement Down Up No movement Down Up
SpringBy direction 60.9 14.7 24.4 75.0 4.7 20.3By season 11.3 17.8 11.3 12.8 19.2 4.8
Early summerBy direction 70.2 13.6 16.2 81.7 6.4 11.9By season 28.9 26.3 23.1 36.6 29.7 17.6
Late summerBy direction 64.2 20.3 15.5 68.5 18.4 13.1By season 38.1 36.2 49.8 33.5 35.7 55.2
FallBy direction 71.2 12.5 16.3 72.7 15.5 11.8By season 21.8 19.7 15.8 17.1 15.4 22.4
DOLLY VARDEN SEASONAL MOVEMENT 1735
charges of 0.011 and 0.600 m3/s (Figure 7). More than
97% of the fish moved upstream when stream discharge
was less than 0.566 m3/s; this discharge level was
exceeded 5% or less of the time during 2002–2006
(Figure 7). Less than 1% of Dolly Varden and cutthroat
trout were detected at 1% exceedance flows. For both
species, all fish moved upstream at discharges that were
below bank-full conditions (2.88 m3/s) for Hobo Creek.
Discussion
Hobo Creek is similar to many headwater streams
that are used by Dolly Varden, cutthroat trout, and
coho salmon throughout southeast Alaska and the
Pacific Northwest (Rosenfeld et al. 2002; Bryant et al.
2004, 2007). In Oregon and British Columbia,
headwater streams were important spawning and
rearing areas for resident cutthroat trout (Moore and
FIGURE 4.—Distance (20-m intervals) moved by cutthroat trout (upper panel) and Dolly Varden (lower panel) between sample
periods during capture–recapture sampling in Hobo Creek, Alaska, 2002–2006 (down ¼ number recaptured downstream from
previous capture location; up ¼ number recaptured upstream from previous capture location).
1736 BRYANT ET AL.
Gregory 1989; Rosenfeld et al. 2002). The Dolly
Varden was the dominant species in high-gradient
reaches in a set of small streams in the Maybeso Creek
watershed, Prince of Wales Island (Bryant et al. 2004).
Resident and anadromous cutthroat trout and resident
Dolly Varden may also use headwater streams for
spawning (Armstrong 1971). Dolly Varden in spawn-
ing condition were observed in the highest reaches of
the Maybeso Creek tributaries (Bryant et al. 2004).
Dolly Varden and cutthroat trout were captured and
FIGURE 5.—Monthly mean (þSE) discharge (m3/s; upper panel) and maximum discharge (lower panel) measured on Hobo
Creek, Alaska, for water years (WY) 2004–2006 (e.g., WY2004¼ October 2003–September 2004).
DOLLY VARDEN SEASONAL MOVEMENT 1737
tagged over the length of Hobo Creek, including the
upper reaches of the study section. Furthermore, both
species moved over the length of the 1,150-m study
reach in the stream.
Causal mechanisms for movement include spawn-
ing, environmental factors (which may include a suite
of interrelated factors such as temperature, amount of
daylight, and discharge), and competitive interactions
(Cederholm and Scarett 1983; Hughes and Reynolds
1994; Brown 1999; David and Closs 2005; Schrank
and Rahel 2006). In some cases, movement may be
associated with higher growth as fish locate better
habitat conditions (Kahler et al. 2001). Cutthroat trout
tend to move as discharge and temperature increase
(Schmetterling 2001; Zurstadt and Stephen 2004).
Movement of cutthroat trout and Dolly in Hobo Creek
coincided with spawning periods for cutthroat trout
(spring) and Dolly Varden (fall). However, we were
unable to determine whether fish were mature or
whether movement was associated with spawning. As
is true of other life history aspects, size at maturity is
not well documented for resident cutthroat trout and
Dolly Varden in southeast Alaska streams, and
differences between resident and anadromous forms
are often difficult to identify in small (,150-mm) fish.
Smithson and Johnson (1999) observed a pattern of
movement, which they described as exploratory, by
sunfishes Lepomis spp., creek chub Semotilus atroma-
FIGURE 6.—Number of cutthroat trout (upper panel) and Dolly Varden (lower panel) detected (all antenna pairs pooled) as
moving more than 20 m upstream or downstream from their last identified location in Hobo Creek, Alaska, 2004–2006.
1738 BRYANT ET AL.
culatus, and blackspotted topminnow Fundulus oliva-
ceus among pools within a small stream. Dolly Varden
and cutthroat trout that moved short distances in Hobo
Creek may also have been exhibiting exploratory
movements.
In larger watersheds, cutthroat trout may move long
distances (Schmetterling 2001; Zurstadt and Stephen
2004). However, even in these systems, a large
percentage of fish remain within a relatively short
segment of the stream, at least for the short term. Many
cutthroat trout and Dolly Varden in Hobo Creek either
did not move or moved less than 50 m from their
tagging location. A few moved considerable distances.
For example, two cutthroat trout (116 and 106 mm)
that were marked in September 2001 were captured
520 m upstream from the site of tagging. Two days
later, the same two fish were detected as returning
downstream. During spring through fall, at least 20%
of the cutthroat trout and Dolly Varden that were
recaptured had moved from one location to another.
Furthermore, those that were recaptured in the same
place may have moved during the intervening period.
Although many of the Dolly Varden and cutthroat trout
in this study were detected as moving a relatively short
distance, they may move considerable distances at
some point in their life history.
Movement of both species was seasonal. Upstream
movement of Dolly Varden and cutthroat trout
coincided with periods of high discharge in September
and October. All fish moved at less than bank-full
conditions, and most were detected as moving at
relatively low discharges (,0.28 m3/s). Movement
during the summer decreased and coincided with low
flows as well as higher temperatures. As temperatures
FIGURE 7.—Cumulative percentage of cutthroat trout (upper panel) and Dolly Varden (lower panel) that were detected as
moving upstream through antennas (all antennas combined) at various discharge levels during 2004–2006 in Hobo Creek,
Alaska (5% exceedance discharge¼ 0.49 m3/s; 2% exceedance discharge¼ 0.85 m3/s; 1% exceedance discharge¼ 1.24 m3/s).
DOLLY VARDEN SEASONAL MOVEMENT 1739
decreased below 48C beginning in November, which is
typical for southeast Alaska, movement decreased and
was negligible during the winter.
Fish were detected as moving at a wide range of
discharges; however, most moved within a relatively
narrow range. The cumulative number of fish detected
as moving decreased rapidly after discharges reached
about 0.5 m3/s. Discharges above this level were
exceeded 5% of the time, and more than 97% of the
fish were detected as moving at lower discharges.
Although most fish were detected at discharges
considerably below the maximum observed in Hobo
Creek, a few were detected at discharges greater than
1.42 m3/s. The results from this study suggest that fish
movement decreases as discharge increases above 0.5
m3/s and that fish do not move upstream above bank-
full discharge (2.88 m3/s for Hobo Creek). However,
resident Dolly Varden and cutthroat trout can and do
move at close to bank-full conditions in Hobo Creek.
The ability of fish to move at high discharge levels is
not a measure of their ability to swim against a given
flow velocity. Measurements of the swimming ability
of fish (i.e., maximum and sustained swimming
speeds) are best determined in stream tank experiments
(e.g., Brett 1964; Puckett and Dill 1984) and were
beyond the scope of this study. Such information is
important, but fish movement is more complex. Fish
moving upstream will select avenues of low velocity
within the stream cross section, and stream channel
roughness will strongly influence the ability of fish of
all sizes to move at a given discharge. In a study of the
ability of juvenile coho salmon (50–120 mm) to move
up a baffled culvert, Bryant (1981) observed that fish
used turbulent flow patterns to navigate up the culvert,
which was set at a 10% gradient. Upstream movement
at increasing water velocities also increases metabolic
output, with accompanying survival disadvantages
(Brett 1964); therefore, small fish like those in this
study would tend to avoid moving at high stream
discharges and would instead reside in areas of low
velocity in streams.
Connectivity within headwater reaches and between
headwater and downstream reaches is an important part
of the life history of both resident and anadromous
salmonids. Dolly Varden and cutthroat trout moved
throughout Hobo Creek over a range of discharges for
various reasons that may be critical for survival, such
as spawning, feeding, or refuge. Maintaining connec-
tivity at road crossings is an important management
issue. Fragmentation and isolation of stream reaches
usually adversely affect fish populations and at extreme
levels can increase the risk of extinction within the
isolated reach (Horan et al. 2000; Hilderbrand 2003;
Young et al. 2004; Hastings 2005).
Integration of hydrological requirements (i.e., cul-
vert size required to pass water at peak discharges) and
biological requirements is critical in the design of
culverts on forest roads. In addition, it is equally
important that culverts be designed to accommodate
flood discharges without failure. In some cases,
culverts designed to accommodate peak discharges
may be sufficient for fish passage. An important
element in the biological component is an understand-
ing of when fish move within the natural discharge
regime of the stream. Most Dolly Varden moved
upstream during the fall; cutthroat trout moved
upstream during the spring. Cutthroat trout spawn in
the spring, and Dolly Varden spawn in the fall. Some
of the highest discharge events occur during the fall;
however, Dolly Varden and cutthroat do not necessar-
ily move during peak discharge events. In this study,
97% of the fish moved upstream at discharges that
occurred 95% of the time. A greater understanding of
when fish move and what stream stages (discharges)
are associated with movement will contribute to the
design of road crossings to ensure connectivity
throughout a watershed.
Acknowledgments
Don Cornelius, Suzanne Hebert, Bob Zorich, and
Travis Bower assisted in the day-to-day operation of
the fish detection system, which was critical to the
success of the study. Brenda Wright, Brian Davies,
Aaron Trusdell, and numerous seasonal technicians
provided valuable assistance in various aspects of field
sampling. Russ Thynes and Marc Novik provided
expertise with various electronic issues. We appreciate
the thorough and constructive manuscript review by
Gayle Zydlewski. Funding was provided by the USFS
Tongass National Forest. The use of trade or firm
names in this publication is for reader information and
does not imply endorsement by the U.S. Department of
Agriculture of any product or service.
References
Adams, S. B., C. A. Frissell, and B. E. Rieman. 2000.
Movements of nonnative brook trout in relation to stream
channel slope. Transactions of the American Fisheries
Society 129:623–638.
Armstrong, R. H. 1971. Age, food and migration of sea-run
cutthroat trout, Salmo clarki, at Eva Lake, southeastern
Alaska. Transactions of the American Fisheries Society
100:302–306.
Armstrong, R. H. 1974. Migration of anadromous Dolly
Varden (Salvelinus malma) in southeastern Alaska.
Journal of the Fisheries Research Board of Canada
31:435–444.
Bonneau, J., and D. Scarnecchia. 1998. Seasonal and diel
changes in habitat use by juvenile bull trout (Salvelinus
1740 BRYANT ET AL.
confluentus) and cutthroat trout (Oncorhynchus clarki) in
a mountain stream. Canadian Journal of Zoology
76:783–790.
Bramblett, R. G., M. D. Bryant, B. E. Wright, and R. G.
White. 2002. Seasonal use of small tributary and main-
stem habitats by juvenile steelhead, coho salmon, and
dolly varden in a southeastern Alaska drainage basin.
Transactions of the American Fisheries Society 131:498–
506.
Brett, J. R. 1964. The respiratory metabolism and swimming
performance of young sockeye salmon. Journal of the
Fishery Research Board of Canada 22:405–409.
Brown, R. L. 1999. Fall and early winter movements of
cutthroat trout, Oncorhynchus clarki, in relation to water
temperature and ice conditions in Dutch Creek, Alberta.
Environmental Biology of Fishes 55:359–368.
Brunner, G. W. 2006. HEC-RAS river analysis system, user’s
manual version 4.0 beta. U.S. Army Corps of Engineers,
Hydrologic Engineering Center, Davis, California.
Bryant, M. D. 1981. Evaluation of small diameter culverts for
passing juvenile salmonids. U.S. Forest Service Research
Note RN-PNW-384.
Bryant, M. D., T. Gomi, and J. J. Piccolo. 2007. Structures
linking physical and biological processes in headwater
streams of the Maybeso Watershed, southeast Alaska.
Forest Science 53:371–383.
Bryant, M. D., N. D. Zymonas, and B. E. Wright. 2004.
Salmonids on the fringe: abundance, species composi-
tion, and habitat use of salmonids in high gradient
headwater streams, southeast Alaska. Transactions of the
American Fisheries Society 133:1529–1538.
Cederholm, C. J., and W. J. Scarett. 1983. Seasonal
immigrations of juvenile salmonids into four small
tributaries of the Clearwater River, Washington 1977–
1981. Pages 438–441 in E. L. Brannon and E. O. Salo,
editors. Proceedings of the salmon and trout migratory
behavior symposium. University of Washington, Seattle.
Connolly, P. J., I. G. Jezorek, and K. D. Martens. 2008.
Measuring the performance of two stationary interroga-
tion systems for detecting downstream and upstream
movement of PIT-tagged salmonids. North American
Journal of Fisheries Management 28:402–417.
David, B. O., and G. P. Closs. 2005. Behavior of a stream-
dwelling fish before, during, and after high-discharge
events. Transactions of the American Fisheries Society
131:762–771.
Gowan, C., and K. D. Fausch. 1996. Mobile brook trout in
two high elevation Colorado streams: re-evaluating the
concept of restricted movement. Canadian Journal of
Fisheries and Aquatic Sciences 53:1370–1381.
Gowan, C., M. K. Young, K. D. Fausch, and S. C. Riley.
1994. Restricted movement in resident stream salmonids:
a paradigm lost? Canadian Journal of Fisheries and
Aquatic Sciences 51:2626–2637.
Hastings, K. 2005. Long-term persistence of isolated fish
populations in the Alexander Archipelago (Alaska).
Doctoral dissertation. University of Montana, Missoula.
Hilderbrand, R. H. 2003. The roles of carrying capacity,
immigration, and population synchrony on persistence of
stream-resident cutthroat trout. Biological Conservation
110:257–266.
Horan, D. L., J. L. Kershner, C. P. Hawkins, and T. A. Crowl.
2000. Effects of habitat area and complexity on Colorado
River cutthroat trout density in the Uinta mountain
streams. Transactions of the American Fisheries Society
129:1250–1263.
Hughes, N. F., and J. B. Reynolds. 1994. Why do arctic
grayling (Thymallus arcticus) get bigger as you go
upstream? Canadian Journal of Fisheries and Aquatic
Sciences 51:2154–2163.
Jenkins, W. E., and T. I. J. Smith. 1990. Use of PIT tags to
individually identify striped bass and red drum brood
stocks. Pages 341–345 in N. C. Parker, A. E. Giorgi,
R. C. Heidinger, D. B. Jester Jr., E. D. Prince, and G. A.
Winans, editors. Fish marking techniques. American
Fisheries Society, Symposium 7, Bethesda, Maryland.
Kahler, T. H., P. Roni, and T. P. Quinn. 2001. Summer
movement and growth of juvenile anadromous salmonids
in small western Washington streams. Canadian Journal
of Fisheries and Aquatic Sciences 58:1947–1956.
Moore, K. M. S., and S. V. Gregory. 1989. Geomorphic and
riparian influences on the distribution and abundance of
salmonids in a cascade mountain stream. Pages 256–261
in Proceedings of the California riparian systems
conference. U.S. Forest Service,Pacific Southwest Re-
search Station, PSW-110, Berkeley, California.
Peterson, N. P. 1982. Immigration of juvenile coho salmon
(Oncorhynchus kisutch) into riverine ponds. Canadian
Journal of Fisheries and Aquatic Sciences 39:1308–
1310.
Puckett, K. J., and L. M. Dill. 1984. Cost of sustained and
burst swimming to juvenile coho salmon (Oncorhynchuskisutch). Canadian Journal of Fisheries and Aquatic
Sciences 41:1546–1551.
Rantz, S. E. 1982. Measurement and computation of stream
flow. Volume 1: Measurement of stage and discharge;
Volume 2: Computation of discharge. U.S. Geological
Survey, Water Supply Paper, Report 2175. Denver.
Rosenfeld, J. S., S. Macdonald, D. Foster, S. Amrhein, B.
Bales, T. Williams, F. Race, and T. Livingston. 2002.
Importance of small streams as rearing habitat for coastal
cutthroat trout. North American Journal of Fisheries
Management 22:177–187.
Schmetterling, D. A. 2001. Seasonal movement of fluvial
westslope cutthroat trout in the Blackfoot River drainage,
Montana. North American Journal of Fisheries Manage-
ment 21:507–520.
Schrank, A. J., and F. J. Rahel. 2006. Factors influencing
summer movement patterns of Bonneville cutthroat trout
(Oncorhynchus clarki utah). Canadian Journal of Fish-
eries and Aquatic Sciences 663:600–699.
Smithson, E. B., and C. E. Johnson. 1999. Movement patterns
of stream fishes in a Ouachita Highlands stream: an
examination of the restricted stream paradigm. Transac-
tions of the American fisheries Society 128:847–853.
Swales, S., F. Caron, R. Irvine, and C. D. Levings. 1987.
Overwintering habitats of coho salmon (Oncorhynchuskisutch) and other juvenile salmonids in the Keogh River
system, British Columbia. Canadian Journal of Zoology
66:254–261.
Swanberg, T. 1997. Movements of and habitat use by fluvial
bull trout in the Blackfoot River, Montana. Transactions
of the American Fisheries Society 126:735–746.
U.S. Department of Agriculture. 2005. Tongass National
DOLLY VARDEN SEASONAL MOVEMENT 1741

Forest annual monitoring and evaluation report for fiscal
year 2005. U.S. Forest Service, Ketchikan, Alaska.
Young, M. K., P. M. Geunther-Gloss, and A. D. Ficke. 2004.
Predicting cutthroat trout (Oncorhynchus clarki) abun-
dance in high-elevation streams: revisiting a model of
translocation success. Canadian Journal of Fisheries and
Aquatic Sciences 62:2399–2408.
Zurstadt, S. F., and K. Stephen. 2004. Seasonal migration
of westslope cutthroat trout in the middle fork Salmon
River Drainage, Idaho. Northwest Science 78:278–
285.
Zydlewski, G. B., A. Haro, K. G. Whalen, and S. D.
McCormick. 2001. Performance of stationary and
portable passive transponder detection systems for
monitoring of fish movements. Journal of Fish Biology
58:1471–1475.
1742 BRYANT ET AL.