Embed Size (px)
Citation preview

1 2 3 4 5 6 7 8 9 10 11 12 13 14 15 16 17 18 19 20 21 22 23 24 25 26 27 28 29 30 31 32 33 34 35 36 37 38 39 40 41 42 43 44 45 46 47 48 49 50 51 52 53 54 55 56 57 58 59 60 61 62 63 64 65
1
Sediment budget in the Lagoon of Venice, Italy
A. Sarretta a1, S. Pillonb, E. Molinarolic, S. Guerzonia*, G. Fontolanb
a CNR-Istituto di Scienze Marine, Riva VII Martiri 1364/A, 30122 Venezia, Italy
b Dipartimento Scienze Geologiche Ambientali e Marine, Università degli Studi - via E. Weiss, 2
- 34127 Trieste, Italy
c Dipartimento di Scienze Ambientali, Università Ca' Foscari, Dorsoduro 2137, 30123 Venezia,
Italy
* Corresponding author. Tel.: +39 041 2404711 ; fax +39 041 5204126
E-mail address: [email protected] (Stefano Guerzoni)
[email protected] (Alessandro Sarretta)
[email protected] (Simone Pillon)
[email protected] (Emanuela Molinaroli)
[email protected] (Giorgio Fontolan)
Abstract
A comparison of 1927, 1970 and 2002 bathymetric surveys in the Lagoon of Venice was used to
reconstruct historical changes in sedimentation. A detailed GIS-based analysis of the charts
1 Present address: European Commission – Joint Research Centre, Institute for Environment and Sustainability, Spatial Data Infrastructures Unit, Via Fermi – TP 262, I-21020 Ispra (VA), Italy. E-mail: [email protected]

1 2 3 4 5 6 7 8 9 10 11 12 13 14 15 16 17 18 19 20 21 22 23 24 25 26 27 28 29 30 31 32 33 34 35 36 37 38 39 40 41 42 43 44 45 46 47 48 49 50 51 52 53 54 55 56 57 58 59 60 61 62 63 64 65
2
revealed the timing and pattern of geomorphic changes and allowed calculation of sediment
deposition and erosion for the entire lagoon and each of its four sub-basins: Treporti, Lido,
Malamocco and Chioggia.
Two main developments are discernible from comparative observation of the areal distribution of
the main elevation ranges: the diminution in area of the saltmarshes, which decreased by more
than 50%, from 68 km2 in 1927 to 32 km2 in 2002, and the progressive deepening of the lagoon,
with a huge increase in the area of subtidal flats (between -0.75 and -2.00 m depth), from 88 to
206 km2 during the same period.
Generally, the lagoon showed a clear-cut change in the most frequent depths (modal depth) from
a value of -0.62 m in 1927 to -0.88 m in 2002. The deepening of the lagoon affected mostly the
lagoonal sub-basins south of the town of Venice, where modal depth increased from -0.65 m to -
1.12 m in Lido, from -0.64 to -1.75 m in Malamocco and from -0.39 m to -0.88 m in Chioggia.
Large changes in lagoonal morphology were caused by human-induced subsidence, the dredging
of navigation channels between 1927 and 1970, and intense natural erosion enhanced by
sediment re-suspension due to Manila clam fishing between 1970 and 2002. There was a net loss
of about 110 Mm3 of sediment from the lagoon, most of which (73 Mm3, ca.70%) was in the
earlier period. A significant amount was lost by dredging and direct disposal outside the system,
either on land or at sea, and there was a net loss of 39 Mm3 from the lagoon to the sea through
the inlets, at an annual rate of 0.5 Mm3.
Comparison of erosion rates in the two periods revealed an alarming acceleration, from a net
sediment loss of 0.3 Mm3y-1 in the period 1927-1970 to 0.8 Mm3y-1 in 1970-2002. Deterioration
caused a shift from a highly differentiated lagoon morphology in the 1930s to a sediment-starved
and subsidence-dominated structure in the 1970s, and from there to the high-energy and more
open (bay-like) lagoon of today.
The results demonstrate the potential application of GIS to reconstruct the recent chronology of
sediment distribution and to improve the understanding of the geomorphic processes shaping the

1 2 3 4 5 6 7 8 9 10 11 12 13 14 15 16 17 18 19 20 21 22 23 24 25 26 27 28 29 30 31 32 33 34 35 36 37 38 39 40 41 42 43 44 45 46 47 48 49 50 51 52 53 54 55 56 57 58 59 60 61 62 63 64 65
3
seafloor, whilst providing an insight into the possible impacts of environmental changes induced
by natural and anthropogenic forcing.
Keywords: bathymetry; morphological evolution; human-driven change; grain-size; lagoon of
Venice, 45°N, 12°E, coastal zoning

1 2 3 4 5 6 7 8 9 10 11 12 13 14 15 16 17 18 19 20 21 22 23 24 25 26 27 28 29 30 31 32 33 34 35 36 37 38 39 40 41 42 43 44 45 46 47 48 49 50 51 52 53 54 55 56 57 58 59 60 61 62 63 64 65
4
1. Introduction
The saltmarshes of the Lagoon of Venice (LV) have experienced intense and varied human
impacts that range from reclamation, waste disposal and livestock grazing to less obvious, more
modern activities such as restoration efforts (Silliman et al. in press). Large expanses of tidal
flats and open saltmarshes near cities were converted to port and industrial complexes, resulting
in their permanent loss (Pinder and Witherick, 1990) and the disappearance of the ecosystem
function they once performed.
The substantial changes that have taken place in the morphology of the Lagoon of Venice during
its history result from a combination of natural processes, human activities, and sedimentological
responses to such activities. Although knowledge of long-term trends in deposition and erosion
are important for proper management of coastal ecosystems, it is difficult to gain this knowledge
from brief field experiments. A long-term, large-scale perspective of the sediment system may be
obtained, however, by analyzing a sequence of bathymetric surveys over a long time period
(Jaffe et al., 2007). Understanding how lagoons have responded to past modification is necessary
in order to prevent further degradation in response to future environmental pressures (Higgins et
al., 2007), including invasive species (which fundamentally alter saltmarsh community structure)
and the relatively unexplored and multifaceted effects of climate change (Bromberg Gedan et al.,
2009).
This paper presents a history of bathymetry, deposition, erosion, and morphological changes
(affecting saltmarshes and tidal flats) in the LV from 1927 to 2002, and relates them to changes
in land-use and the main physical and sedimentological activities affecting the lagoon
environment during the last few decades. The history was reconstructed using computer analysis
(Longley et al., 2001) and hydrographic and topographic surveys conducted by the Venice Water
Authority (Magistrato alle Acque di Venezia, MAV). This study is not the first to address
bathymetric changes in the LV (MAV-CVN, 1999; MAV-CVN, 2004; Pillon et al., 2003 and
Molinaroli et al.,2009) but it is the most comprehensive to date. Molinaroli et al. (2009)

1 2 3 4 5 6 7 8 9 10 11 12 13 14 15 16 17 18 19 20 21 22 23 24 25 26 27 28 29 30 31 32 33 34 35 36 37 38 39 40 41 42 43 44 45 46 47 48 49 50 51 52 53 54 55 56 57 58 59 60 61 62 63 64 65
5
performed a precise division of the LV into four sub-basins using GIS-based techniques (Fig. 1):
Treporti (A), Lido (B), Malamocco (C) and Chioggia (D). The authors also demonstrated that the
morphological and sedimentological variations between 1970 and 2002 were different in each
sub-basin. In this paper we used their partitioning to follow the historic evolution of the
bathymetry of the four sub-basins over more than 70 years, in order to construct two sediment
budgets, one for the period 1927-1970 and another for 1970-2002.
2. Study area and historical background
The Lagoon of Venice is the largest lagoon in the Mediterranean. Like many other coastal areas
around the world, it has been subject to transformations and intense anthropogenic pressure over
the past few decades which have deeply modified the natural environment. The construction of
breakwaters at the lagoon inlets during the period 1808-1927 and the dredging of lagoon
channels for navigation (in 1926 and 1970) have had a significant impact on the lagoon’s
morphology (Guerzoni and Tagliapietra, 2006).
Tides in the area are semidiurnal, with neap, mean and spring tidal ranges of ca. 45, 65 and 100 cm
respectively. Saltmarshes are areas within the lagoon above mean sea level, and tidal flats are the
whole of the remainder of the lagoon below mean sea level except the channels. Tidal flats (mostly
mudflats) are classified as either intertidal or subtidal flats, depending on whether they are above or
below the mean low water spring tide value of -0.50 m.
Riverine sediment input into the lagoon has been almost completely eliminated, and the
breakwaters constructed to defend the inlets have greatly reduced the input of coarse marine
sediment into the lagoon (Day et al., 1998). As a consequence, erosion and subsidence,
particularly during the last century, have caused a three-fold reduction in the area of saltmarshes
in the Venice Lagoon to about 35 km2 at present. In the past 15 years or so, projects have been
undertaken to arrest marsh loss and promote restoration (Scarton et al., 2000).
Insert Table 1

1 2 3 4 5 6 7 8 9 10 11 12 13 14 15 16 17 18 19 20 21 22 23 24 25 26 27 28 29 30 31 32 33 34 35 36 37 38 39 40 41 42 43 44 45 46 47 48 49 50 51 52 53 54 55 56 57 58 59 60 61 62 63 64 65
6
Various events can be recognized as important activities affecting structures and processes in the
morpho-bathymetry of the LV between 1927 and 2002, and are listed in Table 1, chronologically
subdivided in terms of the two periods considered for the bathymetric comparison (1927-1970
and 1970-2002). They are:
1. Saltmarsh destruction from 1927 to 1960 to reclaim land for the construction of the industrial
zone (a total of 22 km2), together with Venice airport and urban development on the lagoon-side
of the city of Mestre (S. Giuliano), the latter two occupying a further 5 km2;
2. modification of hydrodynamic conditions as a result of the dredging of the Malamocco-
Marghera ship canal (the “Oil Canal”), in the central part of the lagoon in the 1960s. This work
affected the first period of the study due to the disposal on land of the dredged material (more
than 40 Mm3), and the second period by influencing lagoon morphology (e.g. saltmarsh
distribution and bathymetric features, such as texture, grain size, depth, and erosion rate)
(Ravera, 2000);
3. increased nutrient and pollutant (trace metals and POPs) loads in the 1960s and 1970s, in
relation to inputs from the industrial area and the catchment basin, and urban waste from the city
of Venice (Cossu and De Fraja Frangipane, 1985; Donazzolo et al., 1982). These activities
produced several million m3 of material with various levels of contamination; the new regulatory
framework established by the Ministry of the Environment in the 1990s (Ministero Ambiente,
1993; Apitz et al., 2007) imposed strict guidelines regarding the disposal of this material;
4. dredging for maintenance purposes carried out in the last decade by the Water Management
Authority of Venice and the Port Authority, amounting to an average of about 1 million m3 y-1 of
sediments (MAV/CVN 2004), which was dumped outside or re-used inside the lagoon; and
5. mechanical clam harvesting by local fishermen since the early 1990s to exploit the newly-
formed banks of Manila clams (Provincia di Venezia, 2000; Pranovi et al., 2004), an alien
species, intentionally introduced into the lagoon in the middle of the 1980s for aquaculture and

1 2 3 4 5 6 7 8 9 10 11 12 13 14 15 16 17 18 19 20 21 22 23 24 25 26 27 28 29 30 31 32 33 34 35 36 37 38 39 40 41 42 43 44 45 46 47 48 49 50 51 52 53 54 55 56 57 58 59 60 61 62 63 64 65
7
which subsequently became widespread throughout the lagoon (Cesari and Pellizzato, 1985;
Pranovi et al., 2006).
3. Materials and Methods
Insert Figure 1
3.1 Bathymetric datasets
The bathymetric datasets used for assessing historical changes in the LV are derived from three
maps published by the MAV after survey campaigns conducted in 1927, 1970 and 2002.
The “1927” bathymetric maps were published by the MAV in 1934. They are the result of a
detailed survey carried out between 1922 and 1933 (central year 1927) and consist of 134 maps
on a scale of 1:5000. The survey was conducted by performing precise tacheometric
measurements and manual soundings. A precise altimetric network covered the entire lagoon
surface. These maps have recently been digitized by the Venice municipal Tide Forecast Centre
as high resolution TIFs.
The “1970” bathymetric maps were published in 1971 by the MAV. They were the result of
surveys carried out from 1968 to 1971. Bathymetric data were collected by multiple sampling
methods: echosounding, tacheometric measurements and stereophotogrammetric analysis.
The “2002 dataset was collected from the end of 1999 to June 2002, further data being collected
in spring 2003. A “Multibeam” bathymetric acquisition system was used for the main channels
(depth >5 m) and the three seaward inlets (Lido, Malamocco, Chioggia). For shallow waters and
secondary channels (depth <5 m), a single-beam echo-sounder was used. At shallower depths
near saltmarshes and on tidal flats, data are collected by the traditional topographic method
(stadia rods coupled to a GPS). The distribution of natural and artificial saltmarshes was
surveyed by stereo aerial photography. Digital data for both the 1970 and 2002 maps were
provided by the MAV.
3.2 Sea-level reference datum and adopted corrections

1 2 3 4 5 6 7 8 9 10 11 12 13 14 15 16 17 18 19 20 21 22 23 24 25 26 27 28 29 30 31 32 33 34 35 36 37 38 39 40 41 42 43 44 45 46 47 48 49 50 51 52 53 54 55 56 57 58 59 60 61 62 63 64 65
8
Comparison of surveys and their related morpho-bathymetric maps requires consideration of the
reference datum used during each survey. For a sediment budget calculation, vertical movement
(of land and sea) also has to be considered, in order to distinguish actual from apparent sediment
losses.
The datum used in the 1927 map is the National Altimetric Network Zero (NANZ), established
in 1910 by the IGM (the Italian Military Geographical Institute) with reference to the tide gauge
at Campo S. Stefano (CSS), Venice. The NANZ corresponds to the average of the high and low
tides recorded from 1884 to 1909, assigned to the median year 1897 (Dorigo, 1961). In 1923 the
reference tide gauge of Venice was transferred to Punta della Salute (PdS). Elevation differences
between benchmarks associated with both CSS and PdS are negligible, in the order of 3-4 mm,
thus within the tolerance errors of levelling between two geodetic elements.
The hydrographic maps of 1970 and 2002 both refer to the datum established in 1952 (and which
is still in use), corresponding to the mean sea level recorded at Genoa in 1942 (IGM42).
Altimetric measurements were carried out in 1968 in order to control and position the new datum
with respect to the NANZ at Venice. Using the PdS benchmark as the reference control, the
IGM42 datum was found to be 23.56 cm higher than the NANZ (Cavazzoni, 1977; Ferla et al.,
2006). This value is a result of both the eustatism and subsidence, natural or human-induced
(Gatto and Carbognin, 1981), which has occurred since the beginning of the last century.
Reference data and sea-level time series are shown in Fig. 2. Mean sea-level data are available
for both Venice and Trieste; the latter is a tectonically stable maritime city located 115 km from
Venice, on the eastern side of the northern Adriatic. A graphic indication of the subsidence
which occurred in Venice during the examined period is given by the differing rates of apparent
sea-level change in the two cities (Fig. 2b). It was about 10 cm greater in Venice than Trieste
during the critical period 1927-70, when there was intensive water extraction from the deep
aquifers underlying the former to supply industries centred on Marghera. According to Gatto and
Carbognin (1981) the relative level of the land fell by a total of 23 cm over 100 years: ca. 3 cm

1 2 3 4 5 6 7 8 9 10 11 12 13 14 15 16 17 18 19 20 21 22 23 24 25 26 27 28 29 30 31 32 33 34 35 36 37 38 39 40 41 42 43 44 45 46 47 48 49 50 51 52 53 54 55 56 57 58 59 60 61 62 63 64 65
9
are due to natural (geological background) subsidence, ca. 9 cm to anthropogenic subsidence and
11 cm to the rise in mean sea-level. Mean sea level is still rising, with absolute values currently
up to 27-28 cm above the NANZ.
Considering the above data and the values shown in the graph (Fig. 2), it is now possible to
specify the correction to use when analysing topographic variations over time.
The differences between mean sea levels measured during, or immediately before, the period of
survey and the reference datum were calculated for each map, using the long term sea-level time
series (Fig. 2). The depth correction for the 1927 map, surveyed during 1922-33 (median year =
1927) is 6 cm, to compensate for the rise in mean sea level compared to the NANZ value (i.e.,
the relative sea level rise which occurred between 1897 and 1927). The average sea level
measured during the period 1922-33 was adopted as the 1927 mean sea-level.
Analogously, considering the mean sea level for both the 1970 and 2002 charts as the mean sea
level calculated over the 10 years before the last year of each survey, no correction is needed for
either of the maps, since the reference datum (IGM42) is only 1.4 cm higher than the 1970 mean
sea-level and approximately the same as the mean sea level in 2002.
Calculation of the sedimentary budget requires a more accurate knowledge of the depth values,
in order to identify the “real” depth changes, i.e., those that are due to erosional or depositional
processes. Thus, the lagoonal mass balance can be only obtained by eliminating vertical
movements of both land and sea occurring between each pair of comparison maps. For the
sediment budget 1927-70, the depth correction adopted is 23 cm, as the approximation of the
absolute difference between the IGM42 and NANZ levels (23.56 cm), measured at the reference
PdS benchmark, which is the product of both eustatism and subsidence. Unfortunately, in this
comparison it was not possible to use differential subsidence values for the individual sub-basins
of the lagoon, since a precise topographic network for monitoring land displacement is available
only for the more recent period.

1 2 3 4 5 6 7 8 9 10 11 12 13 14 15 16 17 18 19 20 21 22 23 24 25 26 27 28 29 30 31 32 33 34 35 36 37 38 39 40 41 42 43 44 45 46 47 48 49 50 51 52 53 54 55 56 57 58 59 60 61 62 63 64 65
10
Given the use of the same reference datum and the small variations in sea level, the 1970-2002
mass balance was calculated from original elevation data corrected only for the differential
subsidence occurring in the lagoon sub-basins during the time span, available from spatial data
reported by Brambati et al. (2003) and Carbognin et al. (2004).
Insert Figure 2
3.3. Sedimentology
Sedimentological information contemporary with the bathymetric chart of 1927 is very scarce.
The few papers from that time dealing with surficial sediment characteristics mainly focus on
benthic communities (Vatova, 1940, 1949), and only a rough description of sand/mud ratios in a
few sub-areas was reported. In contrast, two sampling campaigns performed in the 1970s and in
2000s provide us with much more information (Molinaroli et al., 2009). The samples from the
first campaign were collected between 1976 and 1978 by the Sezione Geo-Mineralogica of Ca’
Foscari University in Venice, when more than 200 sediment samples (~10 cm thick) were
collected with PVC pipes. Samples were collected from the lagoon floor, at water depths of
between 0.1 and 2.4 m. The second set of samples was collected in 2002 by the Institute of
Marine Sciences of Venice when 140 bottom sediment samples (~8 cm thick) were collected
with a PVC pipe from the lagoon floor at depths of between 0.2 and 2.2 m. Molinaroli et al.
(2009) showed that in both cases samples were taken from over the complete lagoon with the
exception of fish farms and reclaimed areas; the analytical procedures used for the two sampling
campaigns were practically the same.
3.4. GIS and spatial analysis
3.4.1 Map georeferencing and digitizing
The three bathymetric datasets (1927, 1970, 2002) were processed to produce three bathymetric
models of the LV. Every step in the analysis was performed using the ESRI ArcGis and QGIS-
GRASS environments. The datasets were of two types: the 1927 one was supplied in raster

1 2 3 4 5 6 7 8 9 10 11 12 13 14 15 16 17 18 19 20 21 22 23 24 25 26 27 28 29 30 31 32 33 34 35 36 37 38 39 40 41 42 43 44 45 46 47 48 49 50 51 52 53 54 55 56 57 58 59 60 61 62 63 64 65
11
format maps (TIFs) by the Venice municipal Tide Forecast Centre, while the other two datasets
(1970, 2002) were in ESRI shape format, as supplied by the MAV.
The 1927 TIFs were georeferenced using control points recognized on a digital map, the
Technical Regional Map in Autocad format, nominal scale 1:5000, based on the Gauss-Boaga
Projection (Italian National Coordinate System). Although the original coordinate system
adopted in 1927 was different, because the national coordinate system was changed in 1952, a
previous comparison between the 1927 and 1970 maps, performed by the same institution which
had published them, stated that the difference was not relevant at the scale involved (Rusconi,
1987).
Once geo-referenced, the TIFs were mosaiced to check for overlap. Where the overlapping
rasters did not match, a check for geo-referencing errors was performed.
The subsequent phase was the digitalization of the morphological features in the lagoon. The
dataset included three different geometric types of object: points, polylines and polygons.
Points were used to represent spot elevation data, while polygons were used to contour the
saltmarshes. Polylines were used as an aid in the process of building the surface.
3.4.2 Bathymetric models
To create the lagoon morphological models, a TIN (Triangulated Irregular Network)
interpolation type was chosen, because it is precise (it maintains the original data at the sample
points) and varies its precision in accordance with data density. The lagoon was subdivided into
three morphological categories (saltmarshes, submarine areas and channels) using specific vector
layers provided by the MAV. Each zone was interpolated individually, to avoid the problems
associated with abrupt changes in slope. The TIN processed using the whole dataset experienced
some interpolation problems, located at the transitions between the three categories. The
interpolated surfaces did not respect the real transition between different morphologies, thus
introducing errors of volume calculation.

1 2 3 4 5 6 7 8 9 10 11 12 13 14 15 16 17 18 19 20 21 22 23 24 25 26 27 28 29 30 31 32 33 34 35 36 37 38 39 40 41 42 43 44 45 46 47 48 49 50 51 52 53 54 55 56 57 58 59 60 61 62 63 64 65
12
The three datasets cover different areas, that of 1927 having the widest coverage. This is because
the area of the lagoon open to tidal circulation varied during the period in question. Therefore an
analysis mask was used to study the evolution on a common surface. The mask represents the
open lagoon surface as it was in 1970 without the fish farming and unfinished reclamation areas.
The analysis mask was supplied by the MAV. All three TINs were checked for interpolation
errors, which were often caused by errors in the digitalization process. Those errors were of two
types: positive-to-negative inversion and misplacement of data points, i.e. channel data points
placed inside saltmarsh polygons. The datasets were thoroughly analyzed to find and correct
these errors. Once the TINs were validated they were converted to Grids (ESRI raster format)
with 10 m cells. The cell dimension was chosen to produce as detailed a representation of the
models as possible while keeping the required processing power within manageable limits.
Rasters cannot represent vectorial models in detail, because the entities are quantized, and
therefore limited to describing features bigger than the cell’s dimensions. This means that the
raster surface area is smaller than the TIN surface area, though the difference amounts to 0.1%.
This problem was particularly evident when the three rasters (saltmarshes, submarine areas and
channels) were combined to build the lagoon model. The resulting raster presented “no-data”
cells at the borders of the three original rasters. This problem was solved by a Map Algebra
operation which assigned to these no-data cells a mean value calculated from the 8 adjacent cells.
Although the same analysis mask was used, the three raster models had different total surface
areas. The difference is small and amounts to 0.2% of the total lagoonal surface area.
Analysis of the data points falling within the polygons of saltmarshes gave different mean
elevations for each dataset: 0.24 m, 0.22 m and 0.30 m for the 1927, 1970 and 2002 surveys
respectively. The elevation of the marshes was sampled with different methods in the three
surveys. Despite being older, the 1927 survey turned out to be most accurate, because the
marshes were surveyed with tacheometric methods whereas in the two more recent surveys the
stereo photogrammetric method was applied. Several recent studies show that the North Adriatic

1 2 3 4 5 6 7 8 9 10 11 12 13 14 15 16 17 18 19 20 21 22 23 24 25 26 27 28 29 30 31 32 33 34 35 36 37 38 39 40 41 42 43 44 45 46 47 48 49 50 51 52 53 54 55 56 57 58 59 60 61 62 63 64 65
13
vegetated marshes have a typical elevation of between 0.25 and 0.30 m, comparable to the mean
value of the 1927 survey (Favero et al., 1992; Albani et al., 2001; Bonometto, 2005; Silvestri et
al., 2005; Marani et al.,2007). The elevation of the saltmarshes is important for the volumetric
calculations. However, given the lack of consistency in the altimetric measuring techniques used
in the three surveys, the saltmarshes were converted to rasters with a constant elevation equal to
the mean value of the 1927 survey, i.e., 0.24 m.
The three rasters were then reclassified to analyze the frequency distribution of the bathymetric
categories. Fourteen classes were chosen following a classification used by Rusconi (1987) in his
analysis of the 1927 and 1970 maps. To perform these analyses the three bathymetric maps were
considered as “snapshots” of the lagoon at the time, so they were corrected only for differences
between the sea-level reference datum used and the mean sea level at the time of the soundings.
Only the 1927 map was corrected, by 6 cm. To calculate volumetric changes, two difference
rasters were produced by a MapAlgebra operation using the ArcGIS “Raster Calculator” tool.
The bathymetric values of the 1927 grid were subtracted from the 1970 values and the values of
the 1970 grid were subtracted from the 2002 values, generating two raster maps of depth
differences with the same resolution as the input maps, enabling a detailed assessment of the
morphological changes occurring during the last 75 years. The final maps were corrected for
datum and subsidence for 1927 and only for subsidence in the period between 1970 and 2002 as
calculated by Brambati et al. (2003).
3.4.3 Geostatistics of sediment data
The 1970 and 2002 sedimentological datasets consisted of two vectorial (point) layers containing
17 intervals of grain-size. An IDW (Inverse Distance Weighted) interpolation was executed for
each interval, obtaining 34 grids with 10m resolution cells, representing the spatial distribution
of specific grain-size dimensions throughout the lagoon. Differences between the sedimentary
maps of 2002 and 1970 were obtained by subtracting each 1970 map grid from its corresponding
2002 map grid.
1 2 3 4 5 6 7 8 9 10 11 12 13 14 15 16 17 18 19 20 21 22 23 24 25 26 27 28 29 30 31 32 33 34 35 36 37 38 39 40 41 42 43 44 45 46 47 48 49 50 51 52 53 54 55 56 57 58 59 60 61 62 63 64 65
14
4. Results and discussion
4.1 Morphological transformations
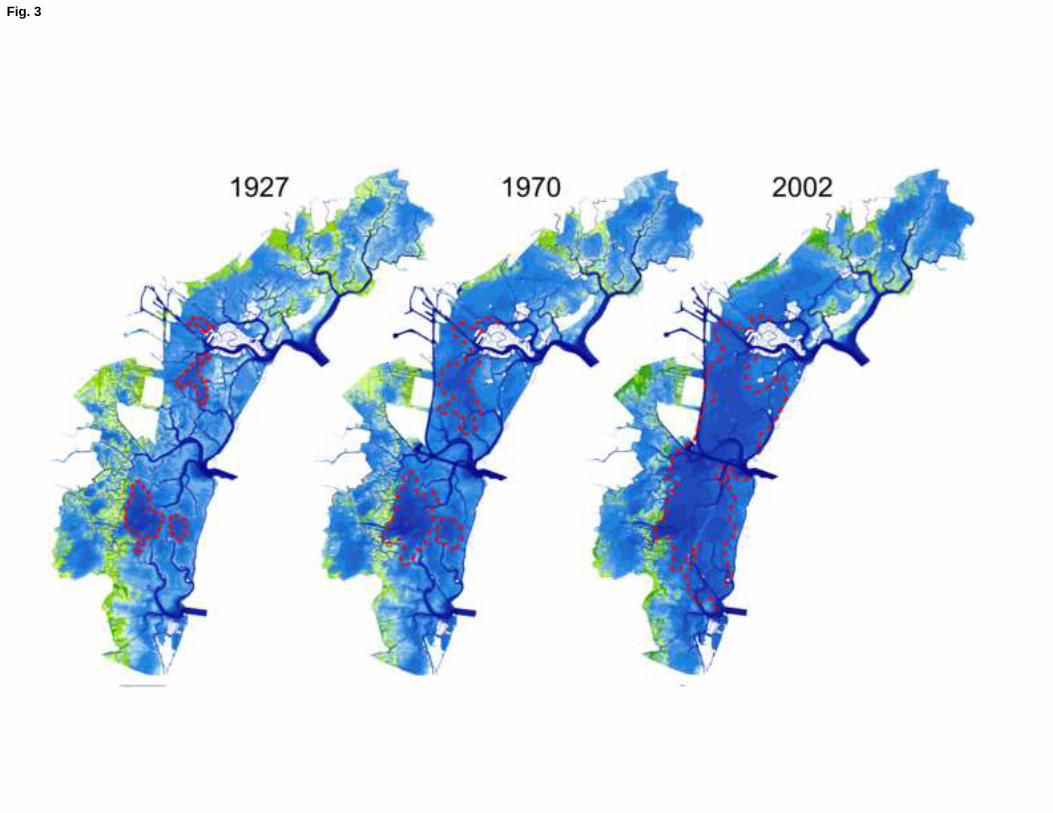
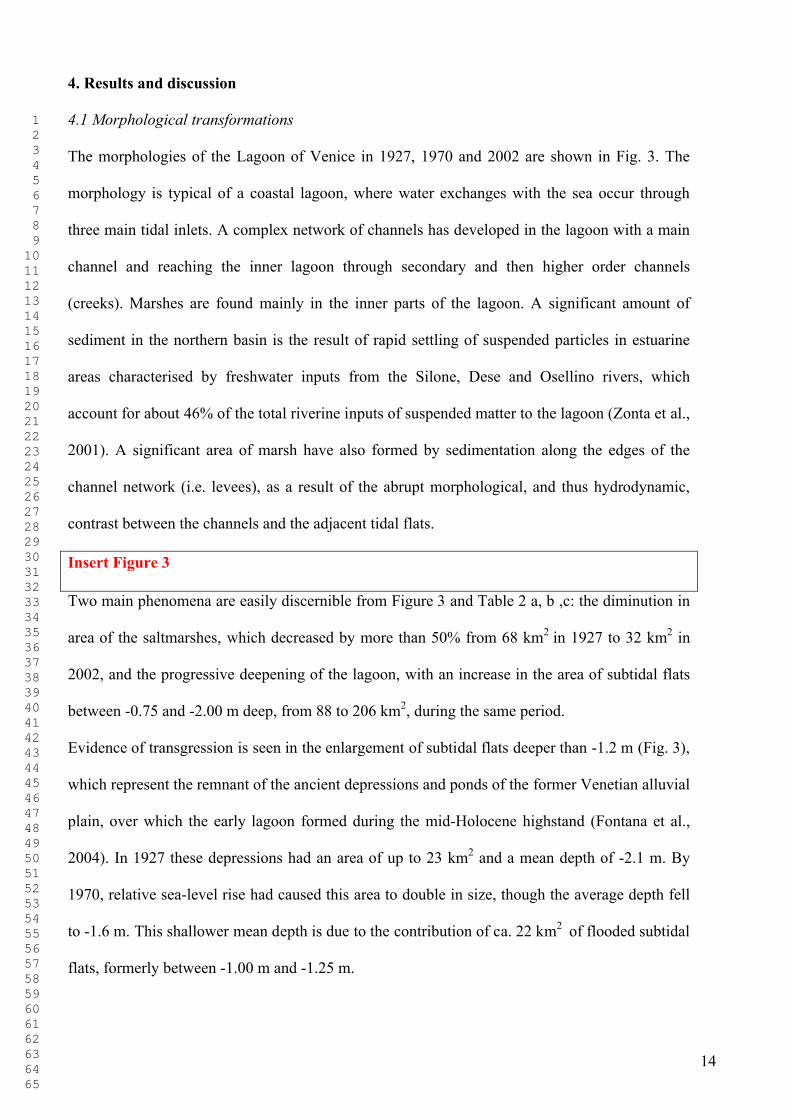
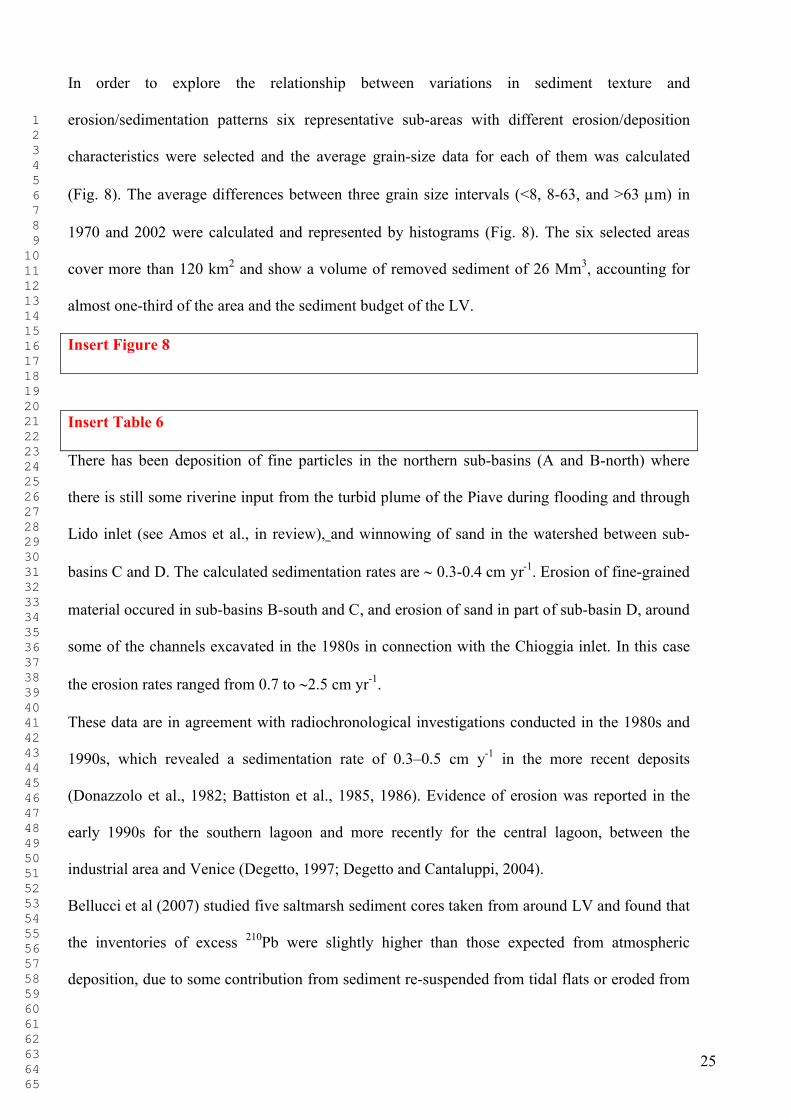
The morphologies of the Lagoon of Venice in 1927, 1970 and 2002 are shown in Fig. 3. The
morphology is typical of a coastal lagoon, where water exchanges with the sea occur through
three main tidal inlets. A complex network of channels has developed in the lagoon with a main
channel and reaching the inner lagoon through secondary and then higher order channels
(creeks). Marshes are found mainly in the inner parts of the lagoon. A significant amount of
sediment in the northern basin is the result of rapid settling of suspended particles in estuarine
areas characterised by freshwater inputs from the Silone, Dese and Osellino rivers, which
account for about 46% of the total riverine inputs of suspended matter to the lagoon (Zonta et al.,
2001). A significant area of marsh have also formed by sedimentation along the edges of the
channel network (i.e. levees), as a result of the abrupt morphological, and thus hydrodynamic,
contrast between the channels and the adjacent tidal flats.
Insert Figure 3
Two main phenomena are easily discernible from Figure 3 and Table 2 a, b ,c: the diminution in
area of the saltmarshes, which decreased by more than 50% from 68 km2 in 1927 to 32 km2 in
2002, and the progressive deepening of the lagoon, with an increase in the area of subtidal flats
between -0.75 and -2.00 m deep, from 88 to 206 km2, during the same period.
Evidence of transgression is seen in the enlargement of subtidal flats deeper than -1.2 m (Fig. 3),
which represent the remnant of the ancient depressions and ponds of the former Venetian alluvial
plain, over which the early lagoon formed during the mid-Holocene highstand (Fontana et al.,
2004). In 1927 these depressions had an area of up to 23 km2 and a mean depth of -2.1 m. By
1970, relative sea-level rise had caused this area to double in size, though the average depth fell
to -1.6 m. This shallower mean depth is due to the contribution of ca. 22 km2 of flooded subtidal
flats, formerly between -1.00 m and -1.25 m.

1 2 3 4 5 6 7 8 9 10 11 12 13 14 15 16 17 18 19 20 21 22 23 24 25 26 27 28 29 30 31 32 33 34 35 36 37 38 39 40 41 42 43 44 45 46 47 48 49 50 51 52 53 54 55 56 57 58 59 60 61 62 63 64 65
15
In 2002, the mean depth was still 1.6 m, although the area of subtidal flats deeper than -1.2 m
was 105 km2. Since relative sea level did not change significantly between 1970 and 2002, this
further doubling of the area of deep subtidal flats indicates erosion due to enhanced
hydrodynamic forcing.
The deepening of the lagoon affected mainly the southern sub-basins C and D, and only part of
basin B, south of the town of Venice, as already shown by Molinaroli et al. (2009) for the 1970-
2002 period. The distribution of area changes (losses and gains) of the different elevation
categories within the lagoon (Table 2 b, c) and within each sub-basin was significantly different
in the two periods. During 1927-70, the greatest area reductions were seen in the saltmarshes and
intertidal flats. The area expansion of the other categories (below -0.75 m) is related to depth
increases, as for the subtidal zones, while for the channels, to the effects of the large scale
excavations carried out in the industrial area. Therefore 0.75 m is the fulcrum depth (i.e. the
depth which separates negative from positive area changes) of the morphological adaptation of
the lagoon to relative sea-level rise caused by the combined effects of eustatism and subsidence.
The following period (1970-2002) saw the enhancement of erosion, leading to an expansion of
subtidal flats below -1 m. In contrast, the categories affected by losses were mainly subtidal flats
at a depth of between -0.5 m and -1 m, the latter depth becoming the new fulcrum of
morphological adaptation of the lagoon system.
For sub-basin C, erosion gave rise to an increase of 26.7 km2 in the area of subtidal flats below -
1.5 m, which is currently the greatest modal depth of the four sub-basins of the LV, and more
than 75 cm deeper than the modal depth of the same sub-basin in 1927.
The frequency distribution of the areas as a function of elevation in 1927, 1970 and 2002, were
calculated for the whole lagoon and for each of the sub-basins A to D (Fig. 4). The frequency
curves of the three periods for the whole LV showed a clear shift in the mode from a value of -
0.62 m in 1927, to -0.87 m in 1970, and -0.88 m in 2002. A similar shift in bathymetry was
observed by Fagherazzi et al. (2006) when comparing the 1901 and 2000 lagoonal morphologies

1 2 3 4 5 6 7 8 9 10 11 12 13 14 15 16 17 18 19 20 21 22 23 24 25 26 27 28 29 30 31 32 33 34 35 36 37 38 39 40 41 42 43 44 45 46 47 48 49 50 51 52 53 54 55 56 57 58 59 60 61 62 63 64 65
16
of the southern lagoon. These authors showed that shallow tidal basins (such as the Lagoon of
Venice) are characterised by extensive tidal flats and saltmarshes that lie within specific ranges
of elevations, between which intermediate elevations ( 0.25 m) are less frequent due to their
inherent instability as a result of fetch (Fagherazzi et al., 2007). With high deposition rates –
such as those of 1901 – the most frequent tidal flat elevation was around -0.50 m, which tended
to shift towards lower elevations when sediment availability was reduced (Fagherazzi et al.,
2006; Marani et al., 2007).
Despite the difficulties of comparison between Fagherazzi et al. (2006) and the authors
frequency analysis of lagoon elevations (since the studied surfaces are not coterminous), a modal
elevation was also observed for the entire lagoon of ca. 0.6 m in 1927. The slight shift from the
previous value of -0.50 m during 1901, may reflect reduced sediment input due to reclamation
for the first industrial zone in the 1930s and the damming of rivers in the 1920s. The significant
additional shift towards -0.87 m by 1970 is related to several reclamations (the 2nd and 3rd
industrial zones, airport and housing in Mestre), together with the dredging of sediment for the
Malamocco-Marghera ship canal, which was mostly disposed of on land. The final shift towards
the value of 0.90 m (seen in 2002) is not so evident as in the previous period, but looking at the
evolution of the individual sub-basins, it coincides with the subtidal flat erosion phase proposed
by Defina et al. (2007). According to these authors, in a “starved” lagoon the instability of the
tidal flats inside basins with large open fetch will ultimately lead to a smooth horizontal bottom
with increased depths of up to 2.0 – 2.5 m. This is clearly seen in the Malamocco and Lido sub-
basins, where the modal depth is 1.75 m and 1.12 m respectively, both significantly deeper than
1970. This means that abrupt change has taken place since the large-scale submergence of the
largest open basin of the lagoon, which caused increased erosion due to wave-induced currents
during strong NE (Bora) wind events (Cavaleri, 1980; Fagherazzi et al., 2007).
By contrast, during the period 1927-1970, the mean depth in basin A changed by the same order
as that of the relative sea-level rise. After 1970 no significant morphological changes occurred

1 2 3 4 5 6 7 8 9 10 11 12 13 14 15 16 17 18 19 20 21 22 23 24 25 26 27 28 29 30 31 32 33 34 35 36 37 38 39 40 41 42 43 44 45 46 47 48 49 50 51 52 53 54 55 56 57 58 59 60 61 62 63 64 65
17
confirming that a complex and mature lagoon morphology inhibits the effect of wave-induced
currents by Bora winds to cause erosion.
Insert Table 2
Insert Figure 4
4.2 Historical deposition, stability and erosion
The differences in bed elevation for the three data sets are presented in the form of erosion maps
(Fig. 5) subdivided into four categories: (1) severe erosion (<-0.5 m difference), (2) moderate
erosion (difference between -0.1 and -0.5 m), (3) stability and (4) deposition. Stability
corresponds to the range ±0.1 m, and deposition corresponds to cells with deposition values
greater than 0.1 m.
Insert Figure 5
4.2.1.Bathymetric chart comparison: 1927-1970
15% of the lagoon is characterized by severe erosion, 29% by moderate erosion, 34% is stable
and 22% is depositional (fig. 5). The areas affected by severe erosion are concentrated mostly in
the channels, mainly the Malamocco-Marghera ship canal (the “Oil Canal”) and the whole of the
industrial area with its canals and docks, which were excavated in the late 1960s. The areas
affected by moderate erosion are mostly tidal flats. Stable areas are evenly distributed across
saltmarshes and tidal flats. Deposition is seen in many channels and on some intertidal flats.
The dominant factor driving morphological transformation in the 1927-1970 interval was
subsidence, which had a significant human-induced component (c.f. 2.2 and 3.1). Most of the
areas of severe erosion coincide with the Oil Canal, Vittorio Emanuele Canal and the industrial
docks, from which about 40 Mm3 of sediment was dredged. The other affected areas were the
saltmarshes, which by 1970 had been reduced to about half the surface area they occupied in
1927, with a loss of 25 Mm3. A common phenomenon throughout the lagoon was the erosion of
the main channels while the secondary channels were characterised by deposition, with some of

1 2 3 4 5 6 7 8 9 10 11 12 13 14 15 16 17 18 19 20 21 22 23 24 25 26 27 28 29 30 31 32 33 34 35 36 37 38 39 40 41 42 43 44 45 46 47 48 49 50 51 52 53 54 55 56 57 58 59 60 61 62 63 64 65
18
the material coming from the erosion of the nearby tidal flats and saltmarshes which suffered
moderate erosion. This process is mainly apparent in the open lagoon, especially in the Lido and
Malamocco sub-basins (B and C), while in the more protected areas where saltmarshes prevail
(the Treporti and western Malamocco sub-basins), the movements of sediment are more
complex. In the lagoon as a whole, tidal flat erosion involved the movement of 66 Mm3, of
which 17 Mm3 was deposited in the channels. On average, the lagoon floor deepened by about 7
cm, while the mean depth of the channels decreased by 5 cm.
The individual sub-basins evolved differently. In the Treporti basin (A), tidal flats and channels
were almost stable (-1 cm and 0 respectively), in the Chioggia sub-basin (D), both tidal flats and
channels deepened (by 4 and 5 cm respectively). The Malamocco (C) and Lido (B) sub-basins
suffered the highest erosion of tidal flats (deepening by 10 and 9 cm respectively). Sub-basin C
also saw the highest rate of deposition in channels (15 cm) followed by sub-basin B (7 cm). In
the Malamocco sub-basin (C), the high rate of deposition in channels is due to the filling-in of a
large meander, which was abandoned after the dredging of the Oil Canal.
4.2.2.Bathymetric chart comparison: 1970-2002
The human activities that caused significant subsidence during the 1950s and 1960s were
stopped in the 1970s but natural subsidence continued to influence the morphology of the
lagoon. Erosion was severe in 69 km2 (17% of the total area), concentrated particularly in the
area around the Malamocco inlet (sub-basin C, 38 km2) and Chioggia inlet (sub-basin D, 16
km2). Moderate erosion affected 32% of the lagoon, especially in large areas to the north and
south of the city of Venice (sub-basin B). Deposition and stability (affecting 28% and 23% of the
entire lagoon respectively) prevailed in the Treporti and Lido sub-basins and were concentrated
especially in the inner part of the lagoon, saltmarshes and surrounding intertidal flats (fig. 5).
The main morphological process in the 1970-2002 period was an extensive deepening, not due to
subsidence, but to serious erosion. The entire area from the island of Venice to Malamocco inlet
was characterised by widespread erosion of tidal flats, corresponding to ~40Mm3 of sediment

1 2 3 4 5 6 7 8 9 10 11 12 13 14 15 16 17 18 19 20 21 22 23 24 25 26 27 28 29 30 31 32 33 34 35 36 37 38 39 40 41 42 43 44 45 46 47 48 49 50 51 52 53 54 55 56 57 58 59 60 61 62 63 64 65
19
(~70% of total erosion), concentrated around the previously dredged Malamocco-Marghera ship
canal. Throughout the lagoon, channels (especially the minor ones) experienced deposition
involving movement of ~20Mm3 of sediments from adjacent eroded tidal flats, which produced a
simplification of the lagoon’s morphological structure. The seaward inlets showed an erosional
tendency at Malamocco and Chioggia and deposition at Lido. The process of saltmarsh erosion,
significant during the 1927-1970 period, continued in the following 30 years with a loss of ~7
km2 (~ 9 Mm3), which was partially compensated by the construction of ~4 km2 of artificial
saltmarshes (~3Mm3). As in the 1927-1970 period, the sheltered areas on the landward side of
the lagoon were the most stable and were characterised by deposition.
Subaqueous areas deepened by an average of ~19 cm in the lagoon as a whole, with significant
differences between sub-basins. Sub-basin A was almost stable, whereas B, C and D saw average
depth differences of -9 cm, -40 cm and -13 cm respectively. Almost 15 km2 of channels
accumulated sediments, and became ~90 cm shallower than previously on average, while 8 km2
of tidal flats were dredged. Channels were characterised by both deposition and erosion,
resulting in an average deposition of ~40 cm of sediments.
4.2.3 Continuity of erosion/deposition processes during the period 1927–2002
The changes of sediment volume described above were combined to calculate the average rates
of deposition and erosion and evaluate the continuity of deposition and erosion processes
through the two examined periods (Fig. 5).
The 75-year area-weighted mean erosion rate for the entire Lagoon was 0.35 cm y-1, while that
of the Malamocco-Marghera sub-basin was twice as high ( 0.7 cm y-1).
Comparison of the two difference maps reveal approximately 90 km2 of the LV characterized by
continuous erosion (.5 cm y-1) throughout the 75-year period, and 135 km2 of permanently
stable or depositional areas. In contrast, 180 km2 of the LV saw a change in tendency in the
second period, either towards instability (becoming erosional) or stability (becoming

1 2 3 4 5 6 7 8 9 10 11 12 13 14 15 16 17 18 19 20 21 22 23 24 25 26 27 28 29 30 31 32 33 34 35 36 37 38 39 40 41 42 43 44 45 46 47 48 49 50 51 52 53 54 55 56 57 58 59 60 61 62 63 64 65
20
depositional). Thus, almost one-half of the lagoon experienced continuously high erosion, with a
severe increase in the final thirty-two years.
More than 35 km2 of tidal flats situated around previously dredged channels in the Malamocco
and Chioggia sub-basins changed from stable or depositional conditions (0-1 cm y-1) to severe
erosion (3.4 cm y-1), with a total deepening of ~50cm. In contrast, nearly 30 km2 of channels
characterised by severe erosion or dredging during the 1927-1970 period showed strong
deposition in the following 32 years, with erosion rates changing from -3.5 cm y-1 to +3 cm y-1.
The acceleration of erosion in the central part of the lagoon is a well-known fact, although there
is debate as to the causes. The already-mentioned hypothesis of Defina et al. (2007) regarding
the natural deepening of lagoons with long wind fetch when lacking new sedimentary inputs
could be the principal cause, but it does not explain the acceleration. A concomitant factor is
suggested by Sfriso et al. (2005), who stressed the extraordinary and progressive increase in
sediment suspension and removal from the tidal flats of the LV since the early 1990s due to the
intensive fishing involving mechanical dredging for Manila clams.
Continuous re-suspension and alteration of the physical properties of the bottom sediment could
be responsible for erosive processes causing loss of fine material from the tidal flats. These
processes have markedly accelerated the deepening. The reduction of the macroalgal beds – both
before and after the start of clam fishing by means of disruptive techniques – has also
significantly contributed to the increase in sediment re-suspension and redistribution, favouring a
loss of material and homogenisation of the grain-size and density of the surface sediment (Sfriso
et al., 2005).
4.3 Sedimentary budgets and the mass balance of the lagoon
Studies of the evolution of recent sediment deposits in the LV are fragmented and provide
information which is not readily comparable. In some cases, the erosion/sedimentation data are
ambiguous since they do not make a distinction between the current status of the phenomenon
and/or its evolution over the past few decades (Degetto and Cantaluppi, 2004). In addition,

1 2 3 4 5 6 7 8 9 10 11 12 13 14 15 16 17 18 19 20 21 22 23 24 25 26 27 28 29 30 31 32 33 34 35 36 37 38 39 40 41 42 43 44 45 46 47 48 49 50 51 52 53 54 55 56 57 58 59 60 61 62 63 64 65
21
several sources of uncertainty occur when attempting to calculate a sediment budget on decadal
time scales using different methods, concerning of different temporal scales and accuracies.
MAV-CVN (1996) reported an average sediment loss of about 1x10⁶ m3 year-1, by analysing
variations in lagoonal sediments over the previous 20 years, excluding eustatism and subsidence.
Pillon et al. (2003) compared bathymetric maps from 1930, 1970 and 1990, and showed a similar
average yearly sediment loss (1x10⁶ m3 y-1). Sarretta (2007) calculated a net removal of
sediments of 0.9±0.1x10⁶ m3 y-1 between 1970 and 2000, and Molinaroli et al. (2009) have
recently made a detailed comparison of 1970 and 2000 bathymetric charts, together with a
comparison of sediment grain sizes, showing marked changes in both morphology and
sedimentation.
4.3.1 Volumetric differences through bathymetric comparison
Using the maps in Fig. 3 a detailed calculation of the sediment budget was made for the two
periods 1927-1970 and 1970-2002. The digitized bathymetric data were used to directly calculate
the sediment volume changes between the surveys in each of the subareas. Table 3 shows all
relevant data for calculating the sediment budget of the LV in the two studied periods, and Fig. 6
shows the eroded and deposited material, together with an estimate of the sediment disposed
either outside the lagoon or lost through the three inlets.
Insert Figure 6
Insert Table 3
In the first period (1927-1970), dredging extracted an estimated 60 Mm3 of material, and erosion
of saltmarshes and tidal flats produced an additional 34 Mm3 (18+16), making a total of 94 Mm3.
All the dredged material was disposed of outside the lagoon, approximately 35-45 Mm3 on land
and the remaining 15-25 Mm3 dumped into the sea outside the lagoon. Of the eroded material, 21
Mm3 was deposited inside the lagoon, either in channels (17 Mm3) or on saltmarshes (4 Mm3)
and the remaining 13 Mm3 were lost seaward through the inlets. The total sediment removal

1 2 3 4 5 6 7 8 9 10 11 12 13 14 15 16 17 18 19 20 21 22 23 24 25 26 27 28 29 30 31 32 33 34 35 36 37 38 39 40 41 42 43 44 45 46 47 48 49 50 51 52 53 54 55 56 57 58 59 60 61 62 63 64 65
22
from the lagoon in forty-three years was thus 73 Mm3 (~ 1.7 Mm3 y-1), of which the flux to the
sea through the inlets was 13 Mm3, i.e. 0.3 Mm3 y-1, almost equally distributed among the four
sub-basins.
In the second period (1970-2002) dredging operations extracted an estimated 11 Mm3 of
material, whilst erosion of saltmarshes and tidal flats lost an additional 61 Mm3, making a total
of 72 Mm3. Approximately 3 Mm3 of the dredged material was re-used to construct artificial
saltmarshes and the remainder (8 Mm3) was disposed of (on land). Of the eroded material, 35
Mm3 was deposited either in the channels (32 Mm3 ) or on the saltmarshes (3 Mm3 ). The total
sediment removal from the lagoon in thirty-two years was thus 34 Mm3 (~1 Mm3 y-1), of which
the flux to the sea was 26 Mm3 , i.e. ~0.8 Mm3 y-1, two-thirds of which was from sub-basin C. In
this period sub-basin A experienced a net gain in sediments, either from the small rivers or from
the Treporti channel at the Lido inlet.
4.3.2. Lagoon/sea interchanges
Direct measurements of the total mass of sediment input and output through the inlets have a
high level of uncertainty. Contrasting data has recently been published, ranging from 300*103
ton y-1 (Bianchi et al., 2004) to 500*103 ton y-1 (Defendi et al., this issue) to 600*103 ton y-1
(Chiarlo and Fornasiero, 2005). Those estimates refer to the present situation.
Table 4 shows the sediment budget subdivided for the four sub-basins. As in Fig. 6, it is derived
from comparison of bathymetric chart. The rate of sediment loss to the sea has been transformed
from m3 to tons, assuming a uniform density of 2,650 kgm-3 and 50% porosity, in order to
compare it with published flux data. Data on riverine input are also listed, but only for the more
recent period, since no useful data are available for the period prior to 1970. It can be seen that
not only was the average total yearly loss from the lagoon quite different during the two periods
(400 and 1100103 ton y-1), but the relative rate of loss from the four sub-basins through the
inlets was also very different. The rates of loss were fairly evenly distributed across the sub-
basins in the period 1927-1970 (between 30 and 150 *103 ton y-1), whereas approximately 80%

1 2 3 4 5 6 7 8 9 10 11 12 13 14 15 16 17 18 19 20 21 22 23 24 25 26 27 28 29 30 31 32 33 34 35 36 37 38 39 40 41 42 43 44 45 46 47 48 49 50 51 52 53 54 55 56 57 58 59 60 61 62 63 64 65
23
of all losses from the LV in the period 1970-2002 ( 1100 *103 ton y-1) came from the
Malamocco sub-basin alone ( 900 *103 ton y-1), while the northern sub-basins (A and B) were
almost stable. In the latter period, river input was negligible for the LV as a whole (less than 3%)
but was significant for sub-basin A, which seems to be the only one which has not lost sediment
and where river input may have positively affected sedimentation. Inputs could be from the
turbid plume of the Piave during flooding and through Lido inlet (see Amos et al., in press).
The historical data matches quite well the estimates of Degetto and Cantaluppi (2004), who
recently used radiochemical methods based on 210Pb and 7Be to obtain the mass balance of
particulate material exchanged at the seaward inlets of the LV. The two radionuclides were
assumed to give different temporal indications, i.e., longer for 210Pb (decades) and much shorter
(one-two years) for 7Be. The results obtained with 7Be were considered reliable enough, albeit
strictly limited to the period investigated (1999-2000), and showed an average yearly imbalance
(sediment loss) of 800*103 ton (range 300-1300) from the lagoon as a whole. The central-south
lagoon was found to be the most highly eroded ( 1100*103 ton y-1), while an accumulation of
300*103 ton y-1 was calculated for the northern lagoon. According to Defendi et al (in press), the
situation seems to have changed, since their recent surveys suggest that most of the sediment
exchange between the LV and the sea (~ 600 *103 ton y-1 in total), is through the Lido inlet (~
400 *103 ton y-1), leaving Malamocco and Chioggia only 10% and 25% of the total budget
respectively.
Insert Table 4
4.4. Relationship between variations in sediment texture and erosion/sedimentation patterns
Recently, Molinaroli et al. (2009) made a detailed comparison of LV sediment grain-size data
from 1970 and 2000. The surficial sediments of the lagoon consist predominantly of clayey silts
in both datasets (mean mud content was 75% for 1970 and 68% for 2000, dry weight)
(Molinaroli et al., 2007). In both datasets the silt fraction dominates over other fractions, but with
a general tendency to decrease between 1970 and 2000, with the exception of basin C. In all sub-

1 2 3 4 5 6 7 8 9 10 11 12 13 14 15 16 17 18 19 20 21 22 23 24 25 26 27 28 29 30 31 32 33 34 35 36 37 38 39 40 41 42 43 44 45 46 47 48 49 50 51 52 53 54 55 56 57 58 59 60 61 62 63 64 65
24
basins, the earlier samples have a lower sand content than the later ones. The 1970 and 2000
samples have a similar clay content, except for sub-basins A and D, where slight differences
between the two datasets are observed (Table 4). The latter authors showed that there was a clear
increase in sand content from 1970 to 2000 throughout sub-basins C and D, especially towards
the landward side. Very high sand content is also evident in 2000 from sub-basin B and around
the city of Venice. The sediment of sub-basin A does not show any significant variation (see Fig.
8 in Molinaroli et al., 2009). The authors also presented data on surficial sediments in the form
of ternary diagrams based on Flemming’s sand/silt/clay ratios (2000). The location of data points
within the diagram reflects specific hydrodynamic energy conditions. The sediment composition
of the LV is described by a diagonal band that gradually expands towards the silt-clay axis. The
textural gradient in sub-basin A shows a shift towards higher silt/clay content between 1970 and
2000, indicating a general decrease in energy in this sub-basin. In sub-basin B, most of the
sediments have become richer in sand, while those of sub-basins C and D have become richer in
silty sands and very silty sands (see also Fig. 7 in Molinaroli et al., 2009), indicating a general
increase in tractive force.
The spatial distribution of differences in sand content (Fig. 7) shows the greatest increases
around the city of Venice, especially on the southern side, between the city and the industrial
area of Porto Marghera and between the city and the Lido inlet. Significant sand enrichment was
also found in the southern part of the lagoon around the watershed between sub-basins C and D.
The spatial distribution of differences in clay shows the greatest enrichment in the northern part
of the lagoon and towards the landward side, from the airport to the industrial area (see Fig. 1).
Other locations in which appreciable enrichments are found are located in the southern lagoon.
Insert Table 5
Insert Figure 7
1 2 3 4 5 6 7 8 9 10 11 12 13 14 15 16 17 18 19 20 21 22 23 24 25 26 27 28 29 30 31 32 33 34 35 36 37 38 39 40 41 42 43 44 45 46 47 48 49 50 51 52 53 54 55 56 57 58 59 60 61 62 63 64 65
25
In order to explore the relationship between variations in sediment texture and
erosion/sedimentation patterns six representative sub-areas with different erosion/deposition
characteristics were selected and the average grain-size data for each of them was calculated
(Fig. 8). The average differences between three grain size intervals (<8, 8-63, and >63 m) in
1970 and 2002 were calculated and represented by histograms (Fig. 8). The six selected areas
cover more than 120 km2 and show a volume of removed sediment of 26 Mm3, accounting for
almost one-third of the area and the sediment budget of the LV.
Insert Figure 8
Insert Table 6
There has been deposition of fine particles in the northern sub-basins (A and B-north) where
there is still some riverine input from the turbid plume of the Piave during flooding and through
Lido inlet (see Amos et al., in review), and winnowing of sand in the watershed between sub-
basins C and D. The calculated sedimentation rates are 0.3-0.4 cm yr-1. Erosion of fine-grained
material occured in sub-basins B-south and C, and erosion of sand in part of sub-basin D, around
some of the channels excavated in the 1980s in connection with the Chioggia inlet. In this case
the erosion rates ranged from 0.7 to 2.5 cm yr-1.
These data are in agreement with radiochronological investigations conducted in the 1980s and
1990s, which revealed a sedimentation rate of 0.3–0.5 cm y-1 in the more recent deposits
(Donazzolo et al., 1982; Battiston et al., 1985, 1986). Evidence of erosion was reported in the
early 1990s for the southern lagoon and more recently for the central lagoon, between the
industrial area and Venice (Degetto, 1997; Degetto and Cantaluppi, 2004).
Bellucci et al (2007) studied five saltmarsh sediment cores taken from around LV and found that
the inventories of excess 210Pb were slightly higher than those expected from atmospheric
deposition, due to some contribution from sediment re-suspended from tidal flats or eroded from

1 2 3 4 5 6 7 8 9 10 11 12 13 14 15 16 17 18 19 20 21 22 23 24 25 26 27 28 29 30 31 32 33 34 35 36 37 38 39 40 41 42 43 44 45 46 47 48 49 50 51 52 53 54 55 56 57 58 59 60 61 62 63 64 65
26
marsh edges. Average accumulation rates were 0.3 cm y-1 (range: 0.1-0.4 cm y-1), comparable
to the average rate of mean sea level rise during the last century in Venice.
The erosion or sedimentation rates at three stations in sub-basin B and one in C were studied by
Sfriso et al (2005) between 1989-1999. They showed that all stations in sub-basin B were
affected by sediment losses, with mean erosion rates of between 0.5 and 3.6 cm yr-1, while the
other, despite being in the most unstable sub-basin of all (C), showed no significant bathymetric
change, due to the sea-grass growing on the bed. The authors stated that their data agreed with
the previous indirect estimation of sediment loss, which was based on the number of fishing
boats operating in the lagoon on an annual basis.
The deterioration of the lagoon in terms of morphological and thus ecosystem complexity is
mainly due to the transgressive effects caused by human-induced subsidence, superimposed on
the natural sea-level rise. It has been demonstrated that in a sediment-starved lagoon such as the
Lagoon of Venice, tidal flats are characterised by instability due to the effect of wave-induced
currents caused by wind acting on large-fetch basins. When morphological complexity and
saltmarshes are lacking, this will ultimately lead to a smooth horizontal lagoon floor of 2.0 – 2.5
m deep (Defina et al., 2007; Fagherazzi et al., 2006, 2007).
Nevertheless, it does not seem that this phenomenon can alone account for the critical erosion of
the Malamocco sub-basin, where the recorded modal depth in 2002 was -1.75 m, i.e. more than
one metre deeper than 75 years before.
The southern lagoon experienced the intense impact of clam fishing with illegal mechanical
harvesting during the 1990s due to the introduction and spread of the exotic Manila clam. In
addition, the Malamocco basin also contains legal Manila clam fishing concessions, which
were granted in order to control farming and exploitation. The practice had serious
consequences, due to the high number of fishing boats dredging the lagoon bed, which caused
re-suspension and alteration of the physical-mechanical properties of the sediment. Thus the
increased susceptibility to sediment erosion due to clam fishing/harvesting, combined with

1 2 3 4 5 6 7 8 9 10 11 12 13 14 15 16 17 18 19 20 21 22 23 24 25 26 27 28 29 30 31 32 33 34 35 36 37 38 39 40 41 42 43 44 45 46 47 48 49 50 51 52 53 54 55 56 57 58 59 60 61 62 63 64 65
27
enhanced bottom shear stress due to more powerful wind waves in a deep lagoon basin with a
large fetch, could easily explain the unexpected deepening of the southern lagoon.
Insert Fig. 9
Comparison of the area distribution of elevation categories in the four sub-basins today clearly
show the striking similarities between the A, B and D sub-basins and the LV as a whole in 1927,
1970 and 2002 respectively (Fig. 10). The current state of the different sub-basins (ontogenesis)
reflects the historic evolution of the lagoon as a whole (phylogenesis): thus sub-basin C possibly
indicates the future trend of the entire lagoon.
While this is a relatively comprehensive study of historical physical changes, it is incomplete in
that the sediment budget is still uncertain. More precise quantification of the modern lagoon
sediment budget will require both a better understanding of fluvial input and extraction of
dredging and a sediment transport model designed to explain historical changes in the sediment
budget. The combination of cartography and modelling used in this study should be applicable to
other systems where large changes in morphology have occurred on historical time scales.
5. Conclusions
A detailed GIS-based analysis of bathymetric surveys carried out in the Lagoon of Venice in the
periods 1922-1933, 1968-1971 and 1999-2003 was used to reconstruct historical sedimentation
patterns. Analysis of available data on bathymetry, morphology and grain-size reveals that large-
scale morphological changes have been directly and indirectly caused by human actions,
including navigational improvements (docks, dredged navigation channels), urban settlement,
industry (water extraction for industrial plants and subsequent subsidence, filling of wetland
areas) and exploitation of natural resources (fish-farming, harvesting of clams with mechanical
dredges). Lesser changes are attributable to natural erosion and sedimentation.
The main results are as follows:

1 2 3 4 5 6 7 8 9 10 11 12 13 14 15 16 17 18 19 20 21 22 23 24 25 26 27 28 29 30 31 32 33 34 35 36 37 38 39 40 41 42 43 44 45 46 47 48 49 50 51 52 53 54 55 56 57 58 59 60 61 62 63 64 65
28
1. Saltmarsh areas decreased by more than 50%, from 68 km2 in 1927 to 32 km2 in 2002.
2. The subaqueous area is progressively deepening, with the modal depth shifting from a
value of -0.62 m in 1927 to -0.87 m in 1970 and -0.88 m in 2002. The final change seems
negligible for the lagoon as a whole but is the result of a compensation effect between the
erosional southern part and the stable-depositional northern part.
3. The deepening is mostly due to the areal expansion of the deepest subtidal flats (between
-0.75 m and -2.00 m in depth), from 88 to 206 km2 during 1927-2002.
4. Depth increases in the 75 year-period mainly affected the Malamocco sub-basin, which
increased from -0.64 to -1.75 m on average, followed by Chioggia, from -0.39 m to -0.88
m, and Lido, from -0.65 m to -1.12 m.
5. There has been a net loss of about 110 Mm3 of sediment from the LV, the majority of
which (73 Mm3, about 70%) occurred during the first period. A significant amount was
lost by direct disposal of dredged sediment outside the LV, either on land or at sea, whilst
39 Mm3 was lost from the lagoon to the sea throughout the inlets, at an annual average
rate of 0.5 Mm3.
6. Considering only the net export of lagoon material to the sea, sedimentary budget
calculations revealed an alarming acceleration of erosion, from a net sediment loss of 0.3
Mm3y-1 during 1927-1970 to 0.8 Mm3y-1 in 1970-2002. As a consequence, the lagoon was
transformed from a highly complex, well-developed microtidal lagoon during the 1930s,
to a sediment-starved and subsidence-dominated lagoon in the 1970s, and then to the high
energy-dominated, flatter-bottomed and more open (bay-like) environment of today,
where the simplified morphology and increased depth of the lagoon bed favour water
exchange with the sea, thus weakening its estuarine features.
Acknowledgements

1 2 3 4 5 6 7 8 9 10 11 12 13 14 15 16 17 18 19 20 21 22 23 24 25 26 27 28 29 30 31 32 33 34 35 36 37 38 39 40 41 42 43 44 45 46 47 48 49 50 51 52 53 54 55 56 57 58 59 60 61 62 63 64 65
29
We thank the Magistrato alle Acque di Venezia for providing data. Mr. George Metcalf revised
the English text. We are grateful to Prof. Graham Evans, an anonymous reviewer and the editor
Carl L. Amos for their careful review, comments and suggestions. This work was financially
supported by a research contract with the former ICRAM (now ISPRA) - Italian Ministry of the
Environment and by the FISR Project "Vector", Research Line 3 (responsible F.Antonioli).

1 2 3 4 5 6 7 8 9 10 11 12 13 14 15 16 17 18 19 20 21 22 23 24 25 26 27 28 29 30 31 32 33 34 35 36 37 38 39 40 41 42 43 44 45 46 47 48 49 50 51 52 53 54 55 56 57 58 59 60 61 62 63 64 65
30
References
Albani, A.D., Serandrei Barbero, R., 2001. The distribution of surface sediments in the lagoon
of Venice (Italy) in the 1980s. Atti Istituto Veneto di Scienze Lettere ed Arti 159, 363–378.
Apitz S.E., Barbanti, A., Bernstein, A.G., Bocci, M., Delaney, E., Montobbio, L., 2007. The
assessment of sediment screening risk in Venice Lagoon and other coastal areas using
international sediment quality guidelines. Journal of Soils and Sediments 7 (5), 326-341.
Battiston, G., Croatto, U., Degetto, S., Sbrignadello, G. and Tositti, L., 1985. Tecniche
radioisotopiche nella datazione di sedimenti recenti. Inquinamento 6, 49-58.
Battiston, G., Croatto, U., Degetto, S., Sbrignadello, G. and Tositti, L., 1986. Studi sulla
diffusione e distribuzione di inquinanti antropogenici mediante tecniche radioisotopiche di
datazione di sedimenti recenti. Ambiente Risorse 1, 81-87.
Bellucci, L.G., Frignani, M., Cochran, J.K., Albertazzi, S., Zaggia, L., Cecconi G., Hopkins,
H., 2007. 210Pb and 137Cs as chronometers for salt marsh accretion in the Venice Lagoon
and links to flooding frequency and climate change. Journal of Environmental
Radioactivity 97, 85-102.
Bianchi, F., Ravagnan, E., Acri, F., Bernardi-Aubry, F., Boldrin, A., Camatti, E., Cassin, D.,
Turchetto, M., 2004. Variability and fluxes of hydrology, nutrients and particulate matter
between the Venice Lagoon and the Adriatic Sea. Preliminary results (years 2001–2002).
Journal of Marine Systems 51, 49-64.
Bonometto, L., 2005. Functional characteristics of salt marshes (barene) in the Venice
Lagoon and environmental restoration scenarios. In: Fletcher, C.A., Spencer, T. (Eds.),
Flooding and environmental challenges for Venice and its lagoon: state of knowledge.
Cambridge University Press, Cambridge, UK, pp. 473-486.
Brambati, A., Carbognin, L., Quaia, T., Teatini, P., Tosi, L., 2003. The Lagoon of Venice:
geological setting, evolution and land subsidence. Episodes 26, 264-268.
Bromberg Gedan, K., Silliman, B.R., Bertness, M.D., 2009. Centuries of human-driven
change in salt-marsh ecosystems. Annual Review of Marine Science 1, 117-141
Carbognin, L., Teatini, P., Tosi, L., 2004. Eustacy and land subsidence in the Venice Lagoon
at the beginning of the new millennium. Journal of Marine System 51, 345-353.
Cavaleri L., 1980. Sediment transport in shallow lagoons. Il Nuovo Cimento 3C (5), 527-540.
Cavazzoni, S., 1977. Variazioni batimetriche ed idrografiche nella Laguna di Venezia,
intercorse tra il 1933 e il 1971. Istituto Veneto di Scienze Lettere ed Arti, Rapporti e Studi
7, 1-18.

1 2 3 4 5 6 7 8 9 10 11 12 13 14 15 16 17 18 19 20 21 22 23 24 25 26 27 28 29 30 31 32 33 34 35 36 37 38 39 40 41 42 43 44 45 46 47 48 49 50 51 52 53 54 55 56 57 58 59 60 61 62 63 64 65
31
Cesari, P., Pellizzato, M., 1985. Insediamento nella Laguna di Venezia e distribuzione
adriatica di Rapana venosa (Valenciennes) (Gastropoda, Thaididae). Lavori Società
Veneta di Scienze Naturali 10, 3-16.
Chiarlo, R., Fornasiero, P., 2005. The ADCP measurements + Sediview method: a rigorous approach
to estimate solid concentration and solid discharge. 4th ADCPs in Action Users Conference, April
4-6, 2005, San Diego, California (USA).
Cossu, R., De Fraja Frangipane, E., 1985. Stato delle conoscenze sull'inquinamento della laguna di
Venezia. Consorzio Venezia Nuova, Servizio Informativo, Technical Report, (Vol. I-IV), 438 pp.
Day, J.W., Scarton, F., Rispondo, A., Are, D., 1998. Rapid deterioration of a salt marsh in
Venice Lagoon. Journal of Coastal Research 14, 583-590.
Defendi, V., Zaggia, L., Kovačević V., (this issue) Estimating suspended sediment transport from
acoustic measurements in the Venice Lagoon inlets,.
Defina, A., Carniello, A., Fagherazzi, S., D’Alpaos, L. 2007. Self-organization of shallow
basins in tidal flats and salt marshes. Journal of Geophysical Research 112, F03001,
doi:10.1029/2006JF000550.
Degetto, S., 1997. Passato e presente dell'inquinamento lagunare attraverso l'analisi di carote
sedimentarie radiodatate. Proceedings of the Conference “Salvaguardia Ambientale e
Sviluppo Sostenibile”, Universita Cà Foscari, Venice, Italy, pp. 36-57.
Degetto, S., Cantaluppi, C., 2004. Radiochemical methodology for the determination of the
mass balance of suspended particulate materials exchanged at the inlets of the Venice
Lagoon. Journal of Marine System 51, 77–94
Donazzolo, R., Orio, A, Pavoni, B., 1982. Radiometric dating and pollutants profiles in a
sediment core from the Lagoon of Venice. Oceanologica Acta 4 Suppl., 101-106.
Dorigo L., 1961. Le osservazioni mareografiche in Laguna di Venezia. Istituto Veneto di
Scienze Lettere ed Arti. Commissione di Studio dei Provvedimenti per la Conservazione e
Difesa della Laguna e della Città di Venezia, Rapporti Preliminari I, Stamperia di
Venezia, 11-38.
Fagherazzi, S., Carniello, L., D’Alpaos, L., Defina, A., 2006. Critical bifurcation of shallow
microtidal landforms in tidal flats and salt marshes. Proceedings of the National Academy
of Sciences of the United States of America, PNAS 103, 8337-8341.
Fagherazzi, S., Palermo, C., Rulli, M.C., Carniello, L., Defina, A., 2007, Wind waves in
shallow microtidal basins and the dynamic equilibrium of tidal flats. Journal of
Geophysical Research 112, F02024, doi:10.1029/2006JF000572.
Favero, V., 1992. Evoluzione morfologica e trasformazioni ambientali dalla conterminazione
lagunare al nostro secolo. In: Conterminazione lagunare: storia, ingegneria, politica e

1 2 3 4 5 6 7 8 9 10 11 12 13 14 15 16 17 18 19 20 21 22 23 24 25 26 27 28 29 30 31 32 33 34 35 36 37 38 39 40 41 42 43 44 45 46 47 48 49 50 51 52 53 54 55 56 57 58 59 60 61 62 63 64 65
32
diritto nella Laguna di Venezia. Proceeding of the Conference “Convegno di studio nel
bicentenario della conterminazione lagunare”, Venice, Italy, 14-16 March 1991, Istituto
Veneto di Scienze Lettere ed Arti, Tipografia La Garangola, Padova, pp. 165-184.
Ferla, M., Cordella, M., Michielli, L., 2006. Aggiornamenti sulle osservazioni dei livelli di
marea a Venezia. Agenzia per la Protezione dell’Ambiente e per i Servizi Tecnici, APAT,
Rapporti 69, Technical Report.
Flemming, B.W., 2000. A revised textural classification of gravel-free muddy sediments on
the basis of ternary diagrams. Continental Shelf Research 20, 1125-1137.
Fontana, A., Mozzi, P., Bondesan, A., 2004, L’evoluzione geomorfologica della pianura
veneto-friulana. In: Bondesan, A., Meneghel, M., (Eds.), Geomorfologia della Provincia di
Venezia. Esedra Editrice, Padova, Italy, pp. 113-138.
Gatto, P., Carbognin, L., 1981. The lagoon of Venice: natural environmental trend and man-
induced modification. Hydrological Sciences Bulletin 26 (4), 379-391.
Guerzoni, S., Tagliapietra, D., 2006. Atlante della Laguna. Venezia tra terra e mare (Atlas of
the Lagoon: Venice between land and sea). Marsilio, Venice, 242 pp.
Higgins, S.A., Jaffe, B., Fuller, C.C., 2007. Reconstructing sediment age profiles from
historical bathymetry changes in San Pablo Bay, California. Estuarine Coastal and Shelf
Sciences 73, 165-174.
Jaffe, B.E., Smith, R.E., Foxgrover, A.C., 2007. Anthropogenic influence on sedimentation
and intertidal mudflat change in San Pablo Bay, California: 1856–1983. Estuarine, Coastal
and Shelf Sciences 73, 175-187.
Longley, P.A., Goodchild, M., Maguire, D.J., Rhind, D.W., Lobley, J., 2001. Geographic
information systems and science. John Wiley & Sons, Chichester, UK. 454 pp.
Marani, M., D’Alpaos, A., Lanzoni, S., Carniello, L., Rinaldo, A., 2007. Biologically-
controlled multiple equilibria of tidal landforms and the fate of the Venice lagoon.
Geophysical Research Letters 34, L11402, doi:10.1029/2007GL030178.
Ministero Ambiente, 1993. Protocollo recante criteri di sicurezza ambientale per gli interventi
di escavazione, trasporto e reimpiego dei fanghi estratti dai canali di Venezia – 8 Aprile
1993, Venice, Italy, Technical Report.
MAV-CVN, 1996. Studio C.4.5/1. Monitoraggio dello sviluppo di velme e barene. Studio per
la formulazione di indirizzi e criteri esecutivi generali. Dati sui sedimenti lagunari.
Magistrato alle Acque di Venezia, Consorzio Venezia Nuova, Venice, Italy, Technical
Report.

1 2 3 4 5 6 7 8 9 10 11 12 13 14 15 16 17 18 19 20 21 22 23 24 25 26 27 28 29 30 31 32 33 34 35 36 37 38 39 40 41 42 43 44 45 46 47 48 49 50 51 52 53 54 55 56 57 58 59 60 61 62 63 64 65
33
MAV-CVN, 1999. Mappatura dell'inquinamento dei fondali lagunari. Studi ed indagini,
relazione finale luglio 1999. Magistrato alle Acque di Venezia, Consorzio Venezia Nuova,
Venice, Italy, Technical Report.
MAV-CVN, 2004. Attività di aggiornamento del piano degli interventi per il recupero
morfologico in applicazione della delibera del Consiglio dei Ministri del 15 Marzo 2001.
Studi di base, linee guida e proposte di intervento del piano morfologico. Magistrato alle
Acque di Venezia, Consorzio Venezia Nuova, Venice, Italy, Technical Report.
Molinaroli, E., Guerzoni, S., Sarretta, A., Masiol, M., Pistolato, M., 2009. Thirty-year
changes (1970 to 2000) in bathymetry and sediment texture recorded in the Lagoon of
Venice sub-basins, Italy. Marine Geology 258, 115-125.
Molinaroli, E., Guerzoni, S., Sarretta, A., Cucco, A., Umgiesser, G., 2007. Link between
hydrology and sedimentology in the Lagoon of Venice, Italy. Journal of Marine System 68,
303-317.
Pinder, D.A,,Witherick, M.E., 1990. Port industrialization, urbanization and wetland loss. In:
Williams, M., (Ed.), Wetlands: A Threatened Landscape, Blackwell, Oxford, UK, pp. 235-
266.
Pranovi, F., Da Ponte, F., Raicevich, S., Giovanardi, O., 2004. A multidisciplinary study of
the immediate effects of mechanical clam harvesting in the Venice Lagoon. ICES Journal
of Marine Science 61 (1), 43-52.
Pranovi, F., Franceschini, G., Casale, M., Zucchetta, M., Torricelli, P., Giovanardi, O., 2006.
An ecological imbalance induced by a non-native species: the Manila clam in the Venice
Lagoon. Biological Invasions 8 (4), 595-609.
Provincia di Venezia, 2000. Piano per la gestione delle risorse alieutiche delle lagune della
provincia di Venezia. Provincia di Venezia, Venice.
Pillon, S., Fontolan, G., Bezzi, A., Burla, I., Tessari, U., Simeoni, U., Zamariolo, A.,
Tromellini, E., Gabellini, M., 2003. A GIS-based morphological evolution of the Venice
Lagoon. In: Proc. VI Int. Conf. on Med. Coast. Env. MEDCOAST03, 2, 1269-1280.
Ravera, O., 2000. The Lagoon of Venice: the result of both natural factors and human
influence. Journal of Limnology 59 (1), 9-30.
Rusconi, A., 1987. Variazioni delle superfici componenti il bacino lagunare. Ufficio
Idrografico del Magistrato alle Acque, Pubblicazione n. 160, Tipoffset Gasparoni,
Venezia.
Sarretta, A., 2007. Integrazione di dati granulometrici e informazioni ambientali nella laguna
di Venezia per lo studio degli habitat di fondo. Ph.D thesis, Università Ca’ Foscari Venezia
Italy, unpublished.

1 2 3 4 5 6 7 8 9 10 11 12 13 14 15 16 17 18 19 20 21 22 23 24 25 26 27 28 29 30 31 32 33 34 35 36 37 38 39 40 41 42 43 44 45 46 47 48 49 50 51 52 53 54 55 56 57 58 59 60 61 62 63 64 65
34
Scarton, F., Day, J.W., Rismondo, A., Lecconi, G., Are, D., 2000. Effects of an intertidal
sediment fence on sediment elevation and vegetation distribution in a Venice (Italy) lagoon
salt marsh. Ecological Engineering 16, 223-233.
Sfriso, A., Facca, C., Marcomini, A., 2005. Sedimentation rates and erosion processes in the
lagoon of Venice. Environment International, Special Issue 31, 983-992.
Silliman, B.R., Grosholz, E., Bertness, M.D., in press. A synthesis of anthropogenic impacts
on North American salt marshes. In: Silliman, B.R., Bertness, M.D., Strong, D., (Eds.),
Anthropogenic Modification of North American Salt Marshes, University of California
Press, Berkeley, CA.
Silvestri, S., Defina, A., Marani, M., 2005. Tidal regime, salinity and salt marsh plant
zonation. Estuarine Coastal and Shelf Science 62, 119-130.
Vatova, A., 1940. Le zoocenosi della laguna veneta. Thalassia 3 (10), 1-28.
Vatova, A., 1949. Caratteri di alcune facies bentoniche della laguna veneta. Nova Thalassia 1
(4), 1-15.
Zonta, R., Bettiol, C., Collarini, F., Fagarazzi, O.E., Zaggia, L., Zuliani, A., 2001. DRAIN
Project - Fresh water and pollutant transfer from the drainage basin to the Venice Lagoon.
Project Report N. 15B, Venice Italy, pp. 1-61.

1 2 3 4 5 6 7 8 9 10 11 12 13 14 15 16 17 18 19 20 21 22 23 24 25 26 27 28 29 30 31 32 33 34 35 36 37 38 39 40 41 42 43 44 45 46 47 48 49 50 51 52 53 54 55 56 57 58 59 60 61 62 63 64 65
35
FIGURE CAPTIONS
Figure 1 – The Lagoon of Venice and four sub-basins (A to D), separated by broken lines.
Figure 2 – ( a) Mean sea level for Venice and Trieste compared to reference datums. Moving
averages (11 years) are in bold. (b) Absolute difference in mean sea level between
Venice and Trieste. Sea level data conventionally refer to a plane located 150 cm
below the National Altimetric Network Zero (NANZ).
Figure 3 – Colour-shaded bathymetric maps of Lagoon of Venice (from left to right: 1927,
1970; 2002). Dotted red line indicates migration of -1.2 m contour line, showing an
overall increase in depth (progressively darker blue colour). Emergent areas are
indicated in green.
Figure 4 – The Distribution of surface areas of specific elevation categories in 1927 ( dotted
line), 1970 (dashed line) and 2002 (solid line) in whole Lagoon of Venice (central
plot) and sub-basins A to D.
Figure 5 – Colour shaded sedimentation maps for 1927-1970 (left) and 1970-2002 (centre),
and map of continuity/change in sedimentary regime from first to second period
(right). Severe erosion means altimetric differences of <-0.5 m, moderate erosion
means differences of between −0.5 and −0.1 m, stability means differences within
0.1 m, deposition means differences of >0.1 m. Histograms show regimes of the
four sub-basins in the two periods. Continuous erosion was seen mainly in the
subtidal flats. Continuously stable and depositional areas are mainly saltmarshes;
changes towards erosion (instability) result from enlargement of permanent erosion
areas; changes towards deposition result mostly from channel infilling.
Figure 6 – The sediment budget for whole lagoon (left:1927-70; right: 1970-2002). Riverine
input was considered negligible. An unknown portion of dredged material was
probably handled more than once. Dashed arrows refer to a negative budget
(erosion or dredging), solid arrows indicate a positive budget (sedimentation).
Numbers inside circles are the sum of dredged (grey) and eroded (black) material
from tidal flats and saltmarshes. Net loss is the result of a balance between eroded
and re-sedimented material. 20 Mm3 of dredged sediment were dumped offshore

1 2 3 4 5 6 7 8 9 10 11 12 13 14 15 16 17 18 19 20 21 22 23 24 25 26 27 28 29 30 31 32 33 34 35 36 37 38 39 40 41 42 43 44 45 46 47 48 49 50 51 52 53 54 55 56 57 58 59 60 61 62 63 64 65
36
during 1930-1970, whereas during 1970-2002, dredged material was partially re-
used for morphological reconstruction (artificial marshes).
Figure 7 – Differences between 2000 and 1970 in distribution of sand (>63 µm, left) and clay
(<2 µm, right).
Figure 8 – Grain-size variations from 1970 to 2000 in six sub-areas (areas I, II, V =
deposition; II, IV, VI = erosion; see Fig. 5 for colour code). Histograms show
combined grain size intervals (<8, 8-63, and >63µm)
Figure 9 – Comparison of area distribution of elevation categories. Above: sub-basins A, B, C
and D in 2002; below: whole Lagoon of Venice in 1927, 1970 and 2002 . Note
similarities between A, B and D and three historic periods. Evolution of different
sub-basins (ontogenesis) reflects the historic evolution of whole lagoon
(phylogenesis). Sub-basin C may indicate future trend of entire lagoon.

1 2 3 4 5 6 7 8 9 10 11 12 13 14 15 16 17 18 19 20 21 22 23 24 25 26 27 28 29 30 31 32 33 34 35 36 37 38 39 40 41 42 43 44 45 46 47 48 49 50 51 52 53 54 55 56 57 58 59 60 61 62 63 64 65
37
TABLE CAPTIONS
Table 1- Chronology of events recognized as strong factors able to affect structures and processes in
the morpho-bathymetry of LV between 1927 and 2002.
Table 2a – Area and areal changes of depth range for 1927, 1970 and 2002; the entire lagoon.
Table 2b – Area by depth range for 1927, 1970 and 2002 for each sub-basin
Table 2c – Areal changes of depth range for 1927, 1970 and 2002 for each sub-basin
Table 3 – Relevant data for the entire lagoonal sediment budget calculation in the two studied
periods. The budgets derive from bathymetric chart comparison. The data on dredged
material disposed of on land was supplied by MAV; the difference indicated was lost though
inlets.
Table 4 – The relevant data for calculating sediment budget of each sub-basin during the two studied
periods. Rates of sediment loss to sea were averaged for 43 years and 32 years respectively
and compared with riverine input. The riverine data for period 1970-2002 are from Collavini
et al.(2005) and refer to years 1999-2000.
Table 5 – Mean values and ranges (in brackets) of surficial sediment grain-size of tidal flats inside
each lagoonal sub-basin; (after Molinaroli et al., 2009, modified)
Table 6– Relevant data for six zones shown in figure 9

FIRST PERIOD
EVENT NOTES
1910-1934 new harbour walls at Chioggia inlet modification of lagoon-sea exchanges
1928 fish farming areas separated from rest of LV reduction of lagoon surface area (85km2) / reduction of water residence time
1917-1935 land reclamation for 1st Industrial Zone (IZ) saltmarsh destruction, (5 km2, West of City of
Venice)
1931-34 construction of trans-lagoon bridge (Ponte della Libertà)
modification of tidal current pattern
1950-53 land reclamation for 2nd Industrial Zone saltmarsh destruction (5 km2, South of 1st IZ)
1957 land reclamation for housing (S. Giuliano, east of
Mestre)
saltmarsh destruction (2 km2, North of trans-lagoon
bridge)
1958-1962 airport construction saltmarsh destruction (~3km2), excavation of new
artificial canal from airport to Venice city
1962 land reclamation for 3rd Industrial Zone (never
completed), now called "Casse di Colmata", i.e.
unfinished reclamation islands
saltmarsh destruction (12km2, South of 2nd IZ)
1966-1969 excavation of Malamocco-Marghera navigation
channel (“Oil Canal”)
30-50 Mm3 of sediments disposed of in landfill
areas outside the lagoon / modification of
hydrodynamic conditions
1930-1970 major development of Industrial activities from 1932 to 1972, ~12 cm of subsidence were due to water extraction for industrial use
SECOND PERIOD
from '70s on dredging of Porto Marghera channels disposal of 5-15 Mm3 of polluted sediments, in part outside lagoon
1970-1980 increased discharges from Industrial area
(nutrients, metals, POPs)
part of sediments becoming more and more
polluted, and thus not suitable for re-use inside
lagoon
80s eutrophication and subsequent macro algae blooms and anoxia
Lagoon bed covered by high quantity of biomass (up to 10-25 kg m-2)
middle '80s introduction of Manila clam for aquaculture purposes
concession of lagoon areas (~14km2) for clam cultivation and harvesting (seagrass loss, sediment re-suspension and alteration of physical properties)
from 1990 dredging for renovation of Port area 3-5Mm3 of sediments, partly disposed of outside lagoon
1992 construction of artificial "Tresse" island to dispose
of polluted industrial waste
saltmarsh destruction (~2 km2)
90s "invasion" of LV by Manila clam disturbance of sediments through mechanical clam
harvesting
1990-2000 construction of artificial saltmarshes (~4 km2) Re-use of non polluted sediments dredged from
channels (3-4 Mm3)
Tab. 1

Tab. 2a –Area (km2) Area changes (km2)
Depth interval
(m) 1927 1970 20021970-1927
2002-1970
2002-1927
<25 0 0 0 0.0 0.0 0.0-25/-20 0 0 0 0.0 0.1 0.1-20/-15 1 2 2 1.1 0.0 1.0-15/-10 5 7 6 2.4 -0.7 1.7-10/-5 20 20 17 -0.3 -2.6 -2.9-5/-2 29 32 39 3.4 6.5 9.9
-2/-1.5 10 18 54 7.3 35.7 43.0-1.5/-1.25 10 21 38 11.5 16.9 28.4-1.25/-1 20 52 55 32.2 3.4 35.6-1/-0.75 48 82 59 34.5 -23.2 11.2
-0.75/-0.5 84 67 49 -16.6 -18.5 -35.0-0.5/-0.25 77 45 37 -31.7 -7.5 -39.2
-0.25/0 39 23 19 -15.9 -3.8 -19.8>0 68 39 32 -28.8 -6.5 -35.3
Total 409 409 408 -0.9 -0.2 -1.1Tab. 2b
Depth interval
(m)
1927 Area (km2) 1970 Area (km2) 2002 Area (km2)
A B C D A B C D A B C D<25 0 0 0 0 0 0 0 0 0 0 0 0
-25/-20 0 0 0 0 0 0 0 0 0 0 0 0-20/-15 0 0 0 0 0 0 1 0 0 0 1 0-15/-10 0 3 2 0 0 4 2 0 0 4 2 0-10/-5 4 6 6 3 4 6 6 4 4 5 5 4-5/-2 5 7 8 8 5 6 9 11 5 7 14 12
-2/-1.5 1 1 4 4 1 3 8 6 1 6 34 12-1.5/-1.25 0 2 4 3 1 5 10 6 1 11 15 12-1.25/-1 1 4 7 8 5 14 17 16 9 20 11 15-1/-0.75 6 11 14 16 13 25 26 18 15 18 9 18
-0.75/-0.5 15 24 25 20 20 11 18 18 21 7 8 13-0.5/-0.25 19 13 24 21 16 8 7 14 15 4 8 10
-0.25/0 16 8 8 8 9 2 5 7 7 3 5 4>0 21 8 19 19 12 3 12 11 10 3 8 10
Total 88 88 121 111 88 87 121 111 88 87 121 111Tab. 2c
Depth interval
(m)
Area changes 1970-1927 (km2)
Area changes 2002-1970 (km2)
Area changes 2002-1927 (km2)
A B C D A B C D A B C D<25 0.0 0.0 0.0 0.0 0.0 0.0 0.0 0.0 0.0 0.0 0.0 0.0
-25/-20 0.0 0.0 0.0 0.0 0.0 0.0 0.1 0.0 0.0 0.0 0.1 0.0-20/-15 0.0 0.1 1.0 0.0 0.0 0.0 0.0 0.0 0.0 0.1 0.9 0.0-15/-10 0.2 1.2 0.9 0.1 0.0 -0.2 -0.7 0.1 0.2 1.0 0.3 0.2-10/-5 -0.2 0.1 -0.7 0.4 -0.5 -0.5 -1.1 -0.4 -0.7 -0.5 -1.7 0.1-5/-2 0.5 -1.2 0.9 3.1 -0.3 0.6 5.2 1.1 0.2 -0.6 6.1 4.2
-2/-1.5 0.5 1.5 3.6 1.8 -0.1 2.8 26.7 6.2 0.4 4.4 30.3 8.0-1.5/-1.25 0.5 2.6 5.4 3.0 -0.1 5.9 5.4 5.6 0.4 8.5 10.8 8.6-1.25/-1 4.2 10.3 9.7 7.9 3.6 6.5 -5.5 -1.2 7.8 16.8 4.2 6.7-1/-0.75 6.5 14.1 12.2 1.7 2.2 -7.8 -17.7 0.0 8.7 6.3 -5.4 1.6
-0.75/-0.5 5.8 -12.9 -6.6 -2.8 0.2 -4.3 -10.2 -4.2 5.9 -17.2 -16.8 -7.0-0.5/-0.25 -2.8 -5.5 -16.5 -6.8 -0.8 -4.1 0.9 -3.6 -3.6 -9.6 -15.6 -10.4
-0.25/0 -6.4 -5.5 -3.0 -1.0 -2.1 0.5 0.5 -2.6 -8.6 -5.0 -2.5 -3.6>0 -8.9 -5.0 -7.2 -7.6 -2.0 0.2 -3.7 -1.0 -10.9 -4.7 -10.9 -8.6
Tab. 2


Entire Lagoon of Venice 1927-70 1970-2002
Km2 Depth variation (m)
Mm3 km2 Depth variation (m)
Mm3
sedimentation inside lagoon
a) within channels 44 0.05 2 50 0.40 20
B completely filled channels 7 2.08 15 14 0.87 12
c) extension of saltmarshes 4 1.08 4 4 0.62 3
dredged sediments 22 -2.78 -60 9 -1.22 -11
sediment eroded
a) tidal and subtidal flats 269 -0.07 -18 287 -0.19 -54
b) saltmarshes 26 -0.63 -16 10 -0.67 -7
artificial saltmarshes 4 0.91 3disposed of outside lagoon 60 8
lost through inlets -13 -26
Tab. 3

Sub-basinBudget (Mm3)
Disposal outside (Mm3)
Lost to sea (Mm3)
Rate of loss in
m3*103yr-1
Rate of loss in
tons^ 103
yr-1
River input
m3 103 yr-1
1927
-197
0 A - Treporti -7,0 6 -1,0 -23 -31B - Lido -20,0 17 -3,0 -70 -92C - Malamocco -34,2 30 -4,2 -98 -130D - Chioggia -12,0 7 -5,0 -116 -153Total Lagoon -73,2 60 -13,2 -307 -406
1970
-200
2 A - Treporti 1,7 0 1,7 54 71 14B - Lido -4,1 2 -2,1 -65 -85 8C - Malamocco -24,1 3 -21,1 -659 -870 4D - Chioggia -8,0 3 -5,0 -156 -206 7Total Lagoon -34,4 8 -26,4 -826 -1090 33
(^) Volume estimates assume uniform density of 2,650 kgm-3and 50% porosity
Tab. 4

Sub-basins
Sand 1970(%)
Sand 2000(%)
Silt 1970(%)
Silt 2000(%)
Clay 1970(%)
Clay 2000(%)
A 8 (0-49) 11 (2-43) 68 (44-84) 61 (45-72) 24 (8-51) 29 (11-43)B 19 (3-64) 31 (1-91) 60 (25-86) 48 (6-70) 21 (8-35) 22 (3-46)C 40 (3-96) 42 (6-83) 41 (2-65) 41 (12-73) 19 (1-45) 18 (3-40)D 39 (0-97) 48 (1-98) 42 (2-73) 36 (1-62) 20 (1-47) 16 (0-45)
Tab. 5

Sub-zone
Area IDErosion/ Deposition regime
km2
Mean depth
variation(m)
Sedimentation/erosion rate (cm yr-1)
Volume (Mm3)
I A SD 19 0.12 0.4 2II A/B SD 28 0.08 0.3 2III B ME 24 -0.23 -0.7 -5IV C SE 27 -0.81 -2.5 -22V C/D SD 16 0.11 0.4 2VI D SE 8 -0.60 -1.9 -5
SD: stability + deposition; ME: moderate erosion; SE: strong erosion
Table 6