Embed Size (px)
Citation preview
Geophysical Journal InternationalGeophys. J. Int. (2013) 195, 1211–1229 doi: 10.1093/gji/ggt287Advance Access publication 2013 August 26
GJI
Sei
smol
ogy
Seismic anisotropy of the crust: electron-backscatter diffractionmeasurements from the Basin and Range
Monica E. Erdman,1,∗ Bradley R. Hacker,1 George Zandt2 and Gareth Seward1
1Earth Science, University of California, Santa Barbara, CA 93106, USA. E-mail: [email protected], University of Arizona, Tucson, AZ 85721, USA
Accepted 2013 July 15. Received 2013 July 12; in original form 2013 April 23
S U M M A R YCrystal preferred orientations were measured in a suite of rocks from three locations in theBasin and Range using electron-backscatter diffraction. Anisotropic velocities were calculatedfor all rocks using single-crystal stiffnesses, the Christoffel equation and Voigt–Reuss–Hillaveraging. Anisotropic velocities were calculated for all three crustal sections using thesevalues combined with rock proportions as exposed in the field. One suite of rocks previouslymeasured in the laboratory was used as a benchmark to evaluate the accuracy of the calculatedvelocities.
Differences in the seismic anisotropy of the Funeral Mountains, Ruby Mountains and EastHumboldt Range sections arise because of differences in mineralogy and strain, with the calc-silicate dominated Ruby Mountains section having higher P-wave speeds and VP/VS ratiosbecause of the reduced quartz content. In all cases, the velocities show either transverseisotropy or nearly so, with a unique slow axis normal to the foliation. Velocity anisotropy canthus be used to infer the flow plane, but not the flow direction in typical crustal rocks. Areaswith a subhorizontal foliation have minimal shear wave splitting for vertically propagatingwaves and are thus good places to measure mantle anisotropy using SKS-splitting.
Key words: Composition of the continental crust; Creep and deformation; Seismicanisotropy; North America.
I N T RO D U C T I O N
The symmetry, magnitude and spatial variation of seismicanisotropy in Earth provide the means to investigate thermal, com-positional and kinematic variations arising from plate tectonics andcrust–mantle interactions (e.g. Schulte-Pelkum et al. 2005; Xu et al.2007; Karato et al. 2008). For example, shear wave splitting of tele-seismic waves propagated through the mantle are often interpretedin terms of mantle flow (e.g. Long & Silver 2008, 2009). The logicis that mantle flow produces a preferred alignment of elasticallyanisotropic olivine crystals, which produces anisotropic wave prop-agation (e.g. Christensen 1984; Nicolas & Christensen 1987; Zhang& Karato 1995; Silver 1996; Savage 1999; Karato et al. 2008). Thepredominant slip systems in olivine produce orthorhombic velocityanisotropy, with the fast propagation direction parallel to the olivineflow direction (e.g. Mehl et al. 2003). The fast polarization plane ofsplit shear waves is thus often used to infer flow within the mantle.
Though first observed in the 1960s (e.g. Hasbrouck 1964), tech-nological advancements now enable more routine measurements ofmid to lower crustal anisotropy. Seismic studies in western North
∗Now at: Earth Science, Rice University, Houston, TX 77005, USA.
America have detected crustal seismic anisotropy using Pn tomog-raphy (Hearn 1996), teleseismic receiver functions (McNamara &Owens 1993; Porter et al. 2011), local earthquake S-wave split-ting (Currie et al. 2004) and ambient noise tomography (Moschetti2010).
Numerous workers have employed the pulse-transmission (PT)technique to rocks in order to relate petrophysical observations toanisotropy in the crust (e.g. Christensen 1965; Burlini & Fountain1993; Ji et al. 1993; Barruol & Kern 1996; Burlini et al. 1998;Ivankina et al. 2005). This approach is excellent in many ways, butcompromised by sample variability, alteration, cracks and (usually)a limitation to three orthogonal directions. An alternative approachto determining the elastic properties of rocks is to measure the crys-tal preferred orientations (CPOs) of the constituent phases and thencalculate rock elasticity from single-crystal stiffnesses (Mainprice& Nicolas 1989). Recent advances in electron-backscatter diffrac-tion (EBSD) enable the complete and rapid characterization of theorientations, composition and abundances of all minerals in a poly-crystalline aggregate. From these parameters, the stiffness tensorof the bulk rock may be calculated, allowing the 3-D seismic prop-erties of the rock to be determined as well. Because this methoduses single-crystal elastic constants to determine bulk properties,it allows for the relationship between microstructure, fabric and
C© The Authors 2013. Published by Oxford University Press on behalf of The Royal Astronomical Society. 1211
Dow
nloaded from https://academ
ic.oup.com/gji/article/195/2/1211/646782 by guest on 31 M
arch 2022
1212 Erdman et al.
seismic properties to be analysed. This paper calculates the velocityanisotropy of three Basin and Range lower crustal sections, and—in conjunction with other work—shows how the magnitude andsymmetry of lower crustal velocity anisotropy can be interpreted interms of rock composition, temperature and/or material flow.
G E O L O G I C A L S E T T I N G
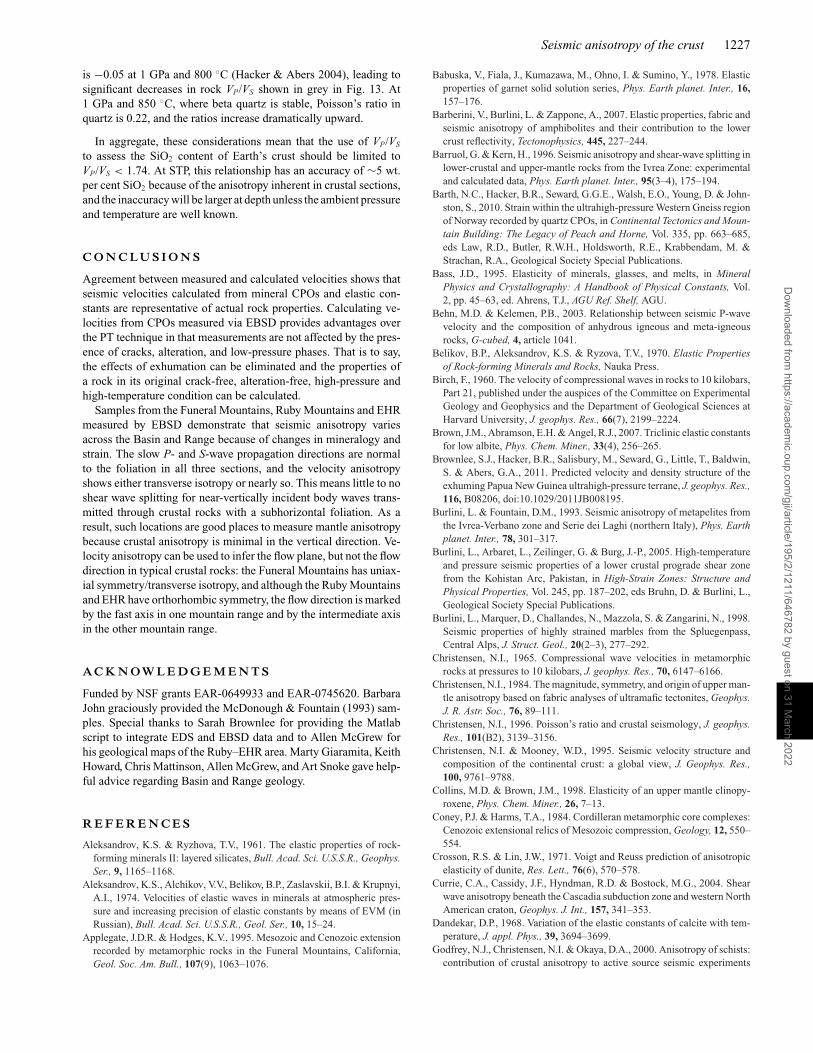
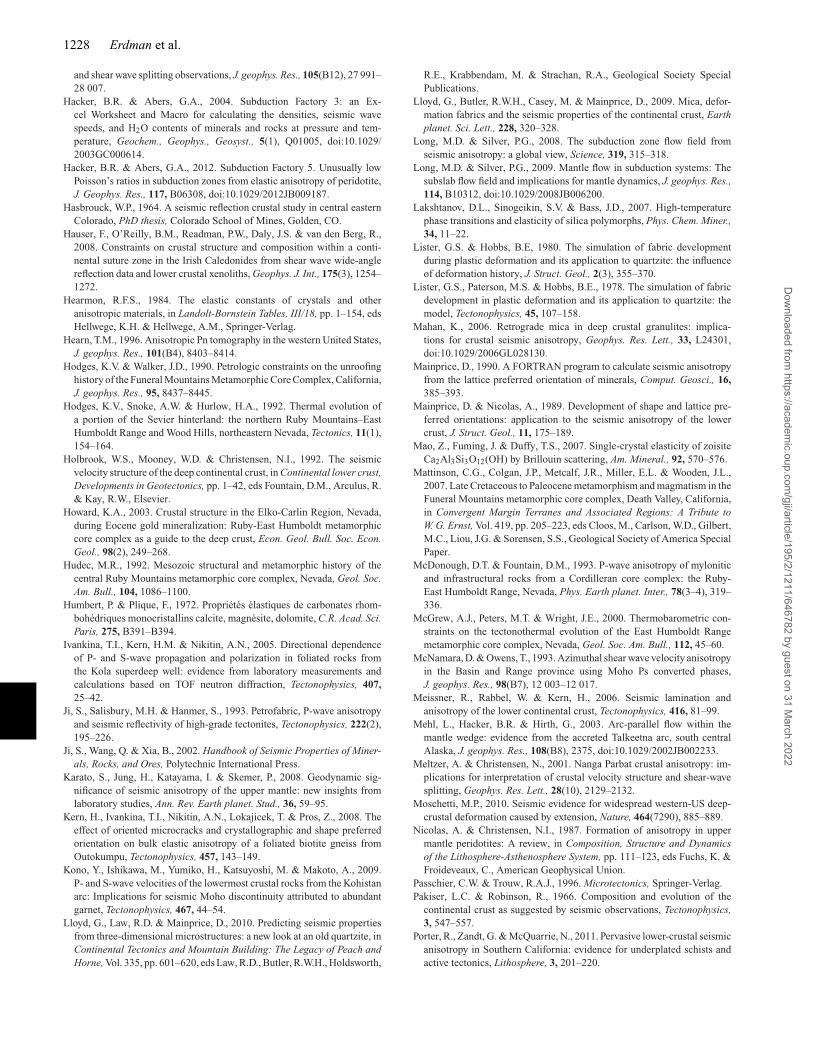
The metamorphic core complex belt of the Basin and RangeProvince in the western United States exposes metamorphic rocks(Coney & Harms 1984) buried during Late Jurassic–Cretaceousshortening and exhumed during the Tertiary (Wright & Snoke 1993;Applegate & Hodges 1995). We collected samples from the Fu-neral Mountains of Death Valley, California and the Ruby–EastHumboldt Range (Ruby–EHR) of northeastern Nevada. Both areasexperienced metamorphic conditions typical of the lower crust: theFuneral Mountains reached peak metamorphic conditions of 650 ◦Cand 7–9 kbar or ∼25–33 km depth (Hodges & Walker 1990; Mat-tinson et al. 2007) and the Ruby–EHR reached peak metamorphicconditions of >9 kbar (∼33 km depth) and 800 ◦C (McGrew et al.2000). The Funeral Mountain samples were collected from the struc-turally deepest unit in Monarch Canyon, in which mixed orthogneissand paragneiss are intruded by leucogranite (Fig. 1). The foliationdips about 35◦ to the northeast and the lineation plunges downdip; the entire section sampled is ∼500 m thick. The Ruby–EHRsamples were collected from Angel Lake cirque, Lizzie’s Basin andLamoille Canyon, where orthogneiss, dolomitic marble, paragneiss,metaquartzite and calc-silicate rocks are intruded by leucogranite(Snoke et al. 1997) (Fig. 2). In the Ruby Mountains, the averagefoliation dips ∼5◦ to the west, the lineation plunges 5◦ towards
345◦ and the sampled section is ∼1000 m thick. The EHR section is1050 m thick, the foliation dips 10◦ to the northeast and the lineationtrends 125◦.
A NA LY T I C A L M E T H O D S
A suite of representative oriented samples was collected at eachstudy site. The samples were cut into XZ (parallel to lineation andnormal to foliation) or XY (parallel to foliation) thin sections de-pending on the abundance of mica; XY sections are preferable forsamples with abundant mica because diffraction patterns from [001]zones in mica are easier to measure than 〈hk0〉 zones. The thinsections were polished with 0.25 µm diamond, colloidal silica andcoated with 6–10 nm of carbon. The CPOs were measured at theUniversity of California, Santa Barbara with an HKL TechnologyEBSD detector and Channel 5 software on an FEI Quanta 400ffield-emission scanning electron microscope. All EBSD measure-ments were made with a 70◦ sample tilt, a 15-mm working distance,100× magnification, a 1–3 nA beam current and a 20 kV accelerat-ing voltage. The step size (250–500 µm) and the mapped area werescaled based on the grain size, with the objective of analysing a largearea and a large number of grains in a reasonable length of time.Every diffraction pattern was saved. Before each automated run,tens of grains were measured manually to verify that the calculateddiffraction patterns fit the observed Kikuchi bands.
All mineral compositions were measured by energy-dispersivespectrometry (EDS) simultaneously with the EBSD measurements.This is necessary to ensure that every point is correctly indexed.After the data collection was complete, the entire dataset was pro-cessed with a Matlab algorithm that used the EDS spectrum (500-ms
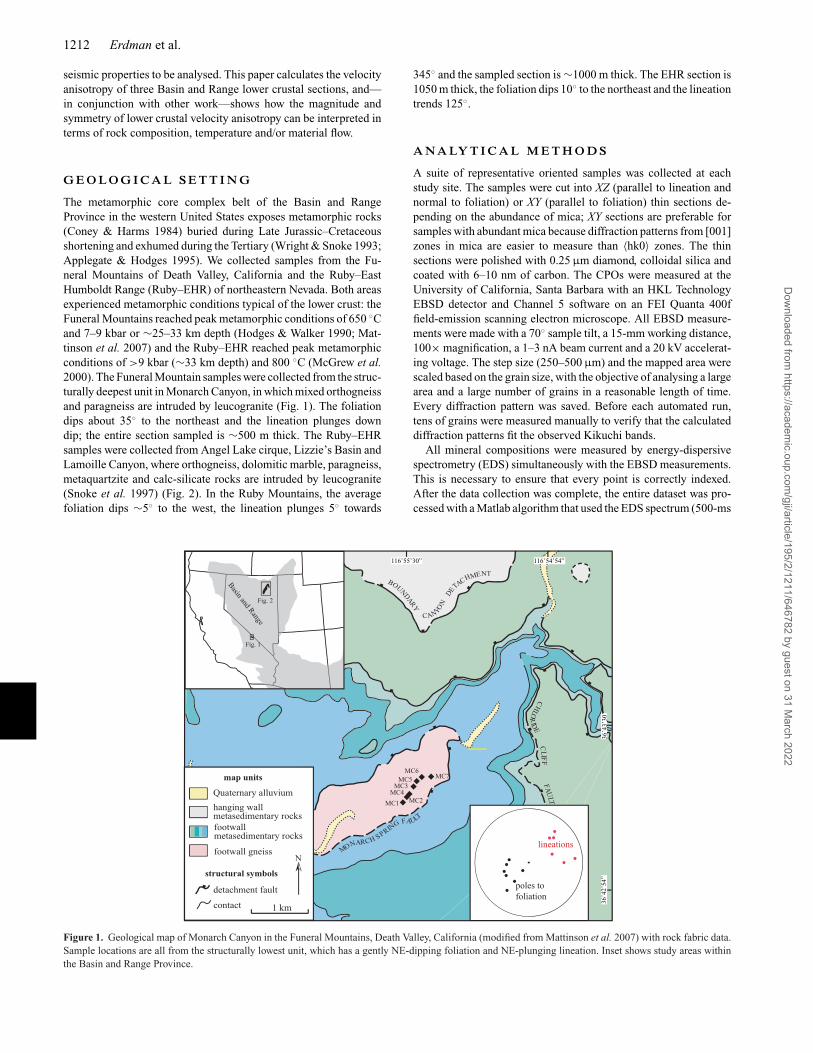
Figure 1. Geological map of Monarch Canyon in the Funeral Mountains, Death Valley, California (modified from Mattinson et al. 2007) with rock fabric data.Sample locations are all from the structurally lowest unit, which has a gently NE-dipping foliation and NE-plunging lineation. Inset shows study areas withinthe Basin and Range Province.
Dow
nloaded from https://academ
ic.oup.com/gji/article/195/2/1211/646782 by guest on 31 M
arch 2022
Seismic anisotropy of the crust 1213
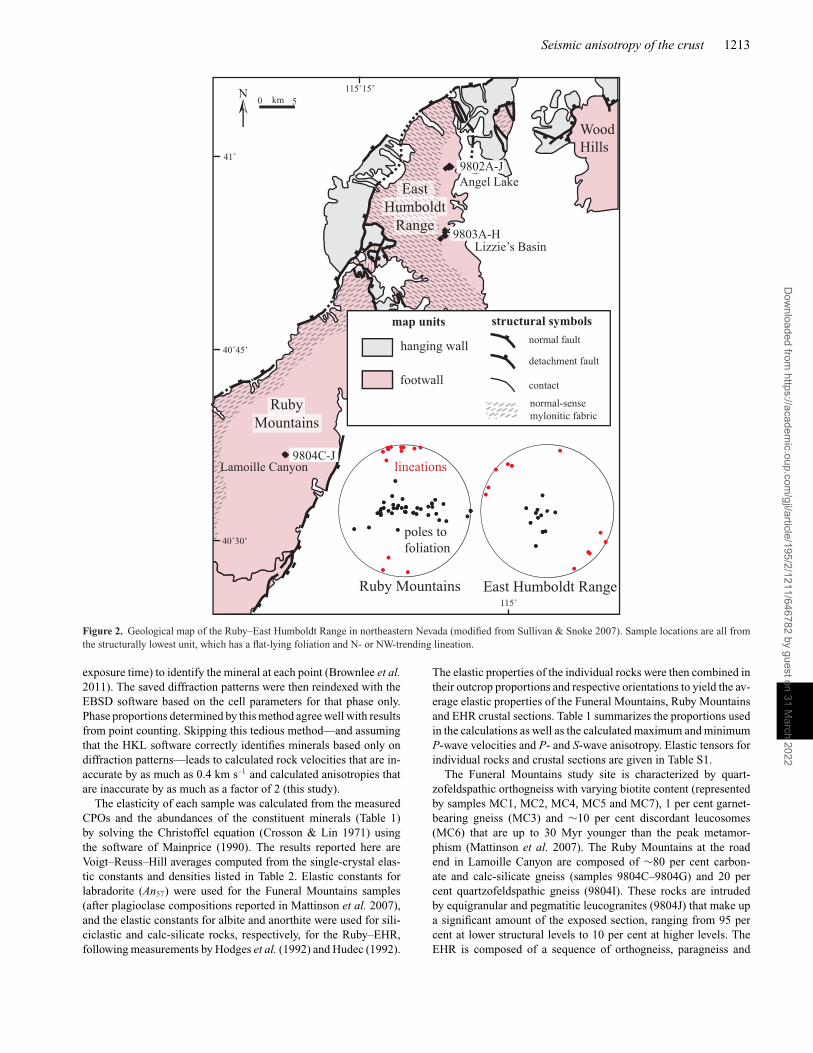
Figure 2. Geological map of the Ruby–East Humboldt Range in northeastern Nevada (modified from Sullivan & Snoke 2007). Sample locations are all fromthe structurally lowest unit, which has a flat-lying foliation and N- or NW-trending lineation.
exposure time) to identify the mineral at each point (Brownlee et al.2011). The saved diffraction patterns were then reindexed with theEBSD software based on the cell parameters for that phase only.Phase proportions determined by this method agree well with resultsfrom point counting. Skipping this tedious method—and assumingthat the HKL software correctly identifies minerals based only ondiffraction patterns—leads to calculated rock velocities that are in-accurate by as much as 0.4 km s–1 and calculated anisotropies thatare inaccurate by as much as a factor of 2 (this study).
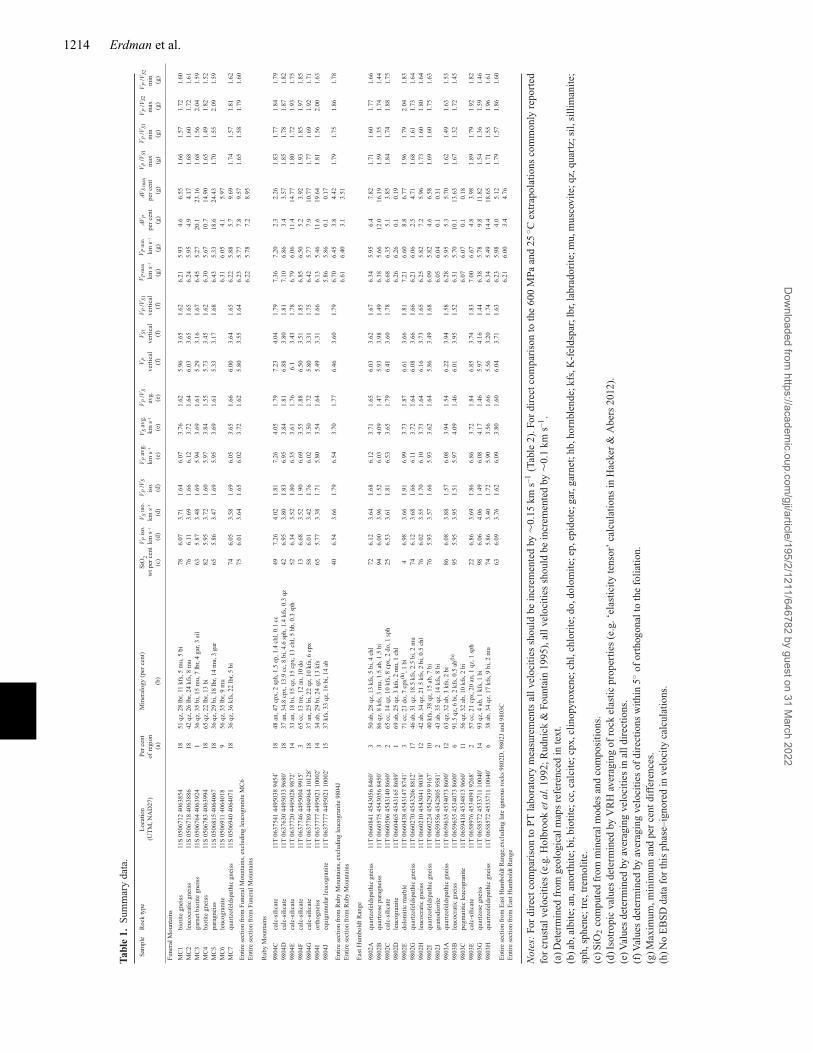
The elasticity of each sample was calculated from the measuredCPOs and the abundances of the constituent minerals (Table 1)by solving the Christoffel equation (Crosson & Lin 1971) usingthe software of Mainprice (1990). The results reported here areVoigt–Reuss–Hill averages computed from the single-crystal elas-tic constants and densities listed in Table 2. Elastic constants forlabradorite (An57) were used for the Funeral Mountains samples(after plagioclase compositions reported in Mattinson et al. 2007),and the elastic constants for albite and anorthite were used for sili-ciclastic and calc-silicate rocks, respectively, for the Ruby–EHR,following measurements by Hodges et al. (1992) and Hudec (1992).
The elastic properties of the individual rocks were then combined intheir outcrop proportions and respective orientations to yield the av-erage elastic properties of the Funeral Mountains, Ruby Mountainsand EHR crustal sections. Table 1 summarizes the proportions usedin the calculations as well as the calculated maximum and minimumP-wave velocities and P- and S-wave anisotropy. Elastic tensors forindividual rocks and crustal sections are given in Table S1.
The Funeral Mountains study site is characterized by quart-zofeldspathic orthogneiss with varying biotite content (representedby samples MC1, MC2, MC4, MC5 and MC7), 1 per cent garnet-bearing gneiss (MC3) and ∼10 per cent discordant leucosomes(MC6) that are up to 30 Myr younger than the peak metamor-phism (Mattinson et al. 2007). The Ruby Mountains at the roadend in Lamoille Canyon are composed of ∼80 per cent carbon-ate and calc-silicate gneiss (samples 9804C–9804G) and 20 percent quartzofeldspathic gneiss (9804I). These rocks are intrudedby equigranular and pegmatitic leucogranites (9804J) that make upa significant amount of the exposed section, ranging from 95 percent at lower structural levels to 10 per cent at higher levels. TheEHR is composed of a sequence of orthogneiss, paragneiss and
Dow
nloaded from https://academ
ic.oup.com/gji/article/195/2/1211/646782 by guest on 31 M
arch 2022
1214 Erdman et al.
Tab
le1.
Sum
mar
yda
ta.
Sam
ple
Roc
k ty
peLo
catio
n (U
TM, N
AD
27)
Per c
ent
Min
eral
ogy
(per
cen
t)Si
O2
V P is
o.V P
/VS
V P /V
SV S
1V P
V P /V
S1V P
max
V P m
inV P
/VS1
V P /V
S1V P
/VS2
V P /V
S2V P
avg
.V S
iso.
V S a
vg.
AVP
AVS
max
Fune
ral M
ount
ains
of re
gion
wt p
er c
ent
km s–
1km
s–1
iso.
km s–
1km
s–1
avg.
verti
cal
verti
cal
verti
cal
km s–
1km
s–1
per c
ent
per c
ent
max
m
in
max
m
in
(a)
(b)
(c)
(d)
(d)
(d)
(e)
(e)
(e)
(f)
(f)
(f)
(g)
(g)
(g)
(g)
(g)
(g)
(g)
(g)
MC
1bi
otite
gne
iss
11S
0506
712
4063
854
1851
qz,
28
lbr,
11 k
fs, 5
mu,
5 b
i78
6.07
3.71
1.64
6.07
3.76
1.62
5.96
3.65
1.62
6.21
5.93
4.6
6.55
1.66
1.57
1.72
1.60
MC
2le
ucoc
ratic
gne
iss
11S
0506
718
4063
886
1842
qz,
26
lbr,
24 k
fs, 8
mu
766.
113.
691.
666.
123.
721.
646.
033.
651.
656.
245.
954.
94.
171.
681.
601.
721.
61M
C3
garn
et b
iotit
e gn
eiss
11S
0506
764
4063
924
136
qz,
35
bi, 1
5 m
u, 7
lbr,
4 ga
r, 3
sil
635.
873.
481.
695.
943.
691.
615.
293.
161.
676.
455.
2720
.123
.16
1.68
1.56
2.04
1.59
MC
4bi
otite
gne
iss
11S
0506
783
4063
994
1865
qz,
22
lbr,
13 b
i82
5.95
3.72
1.60
5.97
3.84
1.55
5.73
3.45
1.62
6.30
5.67
10.7
14.9
01.
651.
491.
821.
52M
C5
para
gnei
ss11
S 05
0681
5 40
6406
718
36 q
z, 2
9 bi
, 18
lbr,
14 m
u, 3
gar
655.
863.
471.
695.
953.
691.
615.
333.
171.
686.
435.
3318
.624
.43
1.70
1.55
2.09
1.59
MC
6le
ucog
rani
te11
S 05
0691
1 40
6401
89
56 q
z, 3
5 lb
r, 9
mu
6.31
6.05
4.1
5.97
MC
7qu
artz
ofel
dspa
thic
gne
iss
11S
0506
940
4064
071
1836
qz,
36
kfs,
22 lb
r, 5
bi74
6.05
3.58
1.69
6.05
3.65
1.66
6.00
3.64
1.65
6.22
5.88
5.7
9.69
1.74
1.57
1.81
1.62
Entir
e se
ctio
n fr
om F
uner
al M
ount
ains
, exc
ludi
ng le
ucog
rani
te M
C6
756.
013.
641.
656.
023.
721.
625.
803.
551.
646.
235.
777.
89.
571.
651.
581.
791.
60
Entir
e se
ctio
n fr
om F
uner
al M
ount
ains
6.22
5.78
7.2
8.95
Rub
y M
ount
ains
9804
Cca
lc-s
ilica
te11
T 06
3754
1 44
9503
8 94
54ʹ
1848
an,
47
cpx,
2 sp
h, 1
.5 e
p, 1
.4 c
hl, 0
.1 c
c49
7.26
4.02
1.81
7.26
4.05
1.79
7.23
4.04
1.79
7.36
7.20
2.3
2.26
1.83
1.77
1.84
1.79
9804
Dca
lc-s
ilica
te11
T 06
3763
0 44
9503
3 96
80ʹ
1837
an,
34.
8 cp
x, 1
3.9
cc, 8
bi,
4.6
sph,
1.4
kfs
, 0.3
qz
426.
953.
801.
836.
953.
841.
816.
883.
801.
817.
106.
863.
43.
571.
851.
781.
871.
8298
04E
calc
-sili
cate
11T
0637
720
4495
028
9872ʹ
1433
an,
18
bi, 1
5 qz
, 15
cpx,
13
chl,
5 hb
, 0.3
sph
526.
343.
521.
806.
353.
611.
766.
13.
431.
786.
796.
0611
.414
.77
1.80
1.72
1.93
1.75
9804
Fca
lc-s
ilica
te11
T 06
3774
6 44
9500
4 99
15ʹ
365
cc,
13
tre, 1
2 an
, 10
do13
6.68
3.52
1.90
6.69
3.55
1.88
6.50
3.51
1.85
6.85
6.50
5.2
3.92
1.93
1.85
1.97
1.85
9804
Gca
lc-s
ilica
te11
T 06
3778
9 44
9496
4 10
128ʹ
1837
an,
25
bi, 2
2 qz
, 10
kfs,
6 cp
x58
6.01
3.42
1.76
6.02
3.50
1.72
5.80
3.31
1.75
6.42
5.77
7.9
10.7
71.
771.
691.
921.
7198
04I
orth
ogne
iss
11T
0637
777
4495
021
1000
2ʹ14
34 a
b, 2
9 bi
, 24
qz, 1
3 kf
s65
5.77
3.38
1.71
5.80
3.54
1.64
5.49
3.31
1.66
6.13
5.46
11.6
19.6
41.
811.
562.
001.
6398
04J
equi
gran
ular
leuc
ogra
nite
11T
0637
777
4495
021
1000
2ʹ15
37 k
fs, 3
3 qz
, 16
bi, 1
4 ab
5.86
5.86
0.1
0.17
Entir
e se
ctio
n fr
om R
uby
Mou
ntai
ns, e
xclu
ding
leuc
ogra
nite
980
4J
406.
543.
661.
796.
543.
701.
776.
463.
601.
796.
706.
453.
84.
421.
791.
751.
861.
78
Entir
e se
ctio
n fr
om R
uby
Mou
ntai
ns6.
616.
403.
13.
51
East
Hum
bold
t Ran
ge
9802
Aqu
artz
ofel
dspa
thic
gne
iss
11T
0660
841
4543
056
8460ʹ
350
ab,
28
qz, 1
3 kf
s, 5
bi, 4
chl
726.
123.
641.
686.
123.
711.
656.
033.
621.
676.
345.
956.
47.
821.
711.
601.
771.
6698
02B
quar
tzos
e pa
ragn
eiss
11T
0660
575
4543
056
8450ʹ
386
qz,
8 k
fs, 3
mu,
1.5
ab,
1.5
bi
946.
003.
961.
526.
034.
091.
475.
933.
981.
496.
385.
6612
.016
.19
1.59
1.35
1.74
1.44
9802
Cca
lc-s
ilica
te11
T 06
6050
6 45
4314
0 86
60ʹ
265
cc,
14
qz, 1
0 kf
s, 8
cpx,
2 d
o, 1
sph
256.
533.
611.
816.
533.
651.
796.
413.
601.
786.
686.
355.
13.
851.
841.
741.
881.
7598
02D
leuc
ogra
nite
11T
0660
465
4543
165
8689ʹ
169
ab,
25
qz, 3
kfs
, 2 m
u, 1
chl
6.26
6.26
0.1
0.19
9802
Edo
lom
itic
mar
ble
11T
0660
438
4543
147
8741ʹ
371
cc,
21
do, 7
cpx
(h) , 1
bi
46.
983.
661.
916.
993.
731.
876.
613.
661.
817.
216.
608.
86.
771.
961.
792.
041.
8398
02G
quar
tzof
elds
path
ic g
neis
s11
T 06
6027
0 45
4320
6 88
12ʹ
1746
ab,
31
qz, 1
8.5
kfs,
2.5
bi, 2
mu
746.
123.
681.
666.
113.
721.
646.
083.
661.
666.
216.
062.
54.
711.
681.
611.
731.
6498
02H
leuc
ocra
tic g
neis
s11
T 06
6021
0 45
4304
1 90
38ʹ
1242
ab,
34
qz, 2
1.5
kfs,
2 bi
, 0.5
chl
766.
023.
551.
706.
103.
731.
646.
163.
731.
656.
255.
827.
25.
961.
731.
601.
801.
6498
02I
quar
tzof
elds
path
ic g
neis
s11
T 06
6022
4 45
4293
9 91
67ʹ
1040
kfs
, 38
qz, 1
5 ab
, 7 b
i76
5.93
3.57
1.66
5.93
3.62
1.64
5.86
3.49
1.68
6.09
5.82
4.6
6.58
1.69
1.60
1.75
1.63
9802
Jgr
anod
iorit
e11
T 06
5955
6 45
4280
5 95
81ʹ
243
ab,
35
qz, 1
4 kf
s, 8
bi6.
056.
040.
10.
3198
03A
quar
tzof
elds
path
ic g
neis
s11
T 06
5963
5 45
3407
3 86
00ʹ
1263
qz,
32
ab, 3
kfs
, 2 b
i86
6.08
3.88
1.57
6.08
3.94
1.54
6.22
3.94
1.58
6.28
5.95
5.3
5.70
1.62
1.49
1.63
1.53
9803
Ble
ucoc
ratic
gne
iss
11T
0659
635
4534
073
8600ʹ
691
.5 q
z, 6
bi,
2 kf
s, 0.
5 ab
(h)
955.
953.
951.
515.
974.
091.
466.
013.
951.
526.
315.
7010
.113
.63
1.67
1.32
1.72
1.45
9803
Cpe
gmat
itic
leuc
ogra
nite
11T
0659
418
4534
813
9660ʹ
1156
qz,
32
ab, 1
0 kf
s, 2
bi6.
076.
070.
10.
1898
03E
calc
-sili
cate
11T
0658
976
4534
091
9268ʹ
257
cc,
21
cpx,
20
an, 1
qz,
1 sp
h22
6.86
3.69
1.86
6.86
3.72
1.84
6.85
3.74
1.83
7.00
6.67
4.8
3.98
1.89
1.79
1.92
1.82
9803
Gqu
artz
ose
gnei
ss11
T 06
5857
2 45
3371
1 10
040ʹ
1493
qz,
4 a
b, 1
kfs
, 1 b
i98
6.06
4.06
1.49
6.08
4.17
1.46
5.97
4.16
1.44
6.38
5.78
9.8
11.8
21.
541.
361.
591.
4698
03H
quar
tzof
elds
path
ic g
neis
s11
T 06
5857
2 45
3371
1 10
040ʹ
638
ab,
34
qz, 1
7 kf
s, 9
bi, 2
mu
745.
863.
401.
725.
903.
561.
665.
563.
201.
746.
345.
4914
.418
.65
1.71
1.55
1.96
1.61
Entir
e se
ctio
n fr
om E
ast H
umbo
ldt R
ange
, exc
ludi
ng la
te ig
neou
s roc
ks 9
802D
, 980
2J a
nd 9
803C
636.
093.
761.
626.
093.
801.
606.
043.
711.
636.
235.
984.
05.
121.
791.
571.
861.
60
Entir
e se
ctio
n fr
om E
ast H
umbo
ldt R
ange
6.21
6.00
3.4
4.76
Not
es:
For
dire
ctco
mpa
riso
nto
PT
labo
rato
rym
easu
rem
ents
allv
eloc
itie
ssh
ould
bein
crem
ente
dby
∼0.1
5km
s–1(T
able
2).F
ordi
rect
com
pari
son
toth
e60
0M
Paan
d25
◦ Cex
trap
olat
ions
com
mon
lyre
port
edfo
rcr
usta
lvel
ocit
ies
(e.g
.Hol
broo
ket
al.1
992;
Rud
nick
&Fo
unta
in19
95),
allv
eloc
itie
ssh
ould
bein
crem
ente
dby
∼0.1
kms–1
.(a
)Det
erm
ined
from
geol
ogic
alm
aps
refe
renc
edin
text
.(b
)ab,
albi
te;a
n,an
orth
ite;
bi,b
ioti
te;c
c,ca
lcit
e;cp
x,cl
inop
yrox
ene;
chl,
chlo
rite
;do,
dolo
mit
e;ep
,epi
dote
;gar
,gar
net;
hb,h
ornb
lend
e;kf
s,K
-fel
dspa
r;lb
r,la
brad
orit
e;m
u,m
usco
vite
;qz,
quar
tz;s
il,s
illi
man
ite;
sph,
sphe
ne;t
re,t
rem
olit
e.(c
)SiO
2co
mpu
ted
from
min
eral
mod
esan
dco
mpo
siti
ons.
(d)I
sotr
opic
valu
esde
term
ined
byV
RH
aver
agin
gof
rock
elas
tic
prop
erti
es(e
.g.‘
elas
tici
tyte
nsor
’ca
lcul
atio
nsin
Hac
ker
&A
bers
2012
).(e
)Val
ues
dete
rmin
edby
aver
agin
gve
loci
ties
inal
ldir
ecti
ons.
(f)V
alue
sde
term
ined
byav
erag
ing
velo
citi
esof
dire
ctio
nsw
ithi
n5◦
ofor
thog
onal
toth
efo
liat
ion.
(g)M
axim
um,m
inim
uman
dpe
rce
ntdi
ffer
ence
s.(h
)No
EB
SD
data
for
this
phas
e–ig
nore
din
velo
city
calc
ulat
ions
.
Dow
nloaded from https://academ
ic.oup.com/gji/article/195/2/1211/646782 by guest on 31 M
arch 2022
Seismic anisotropy of the crust 1215
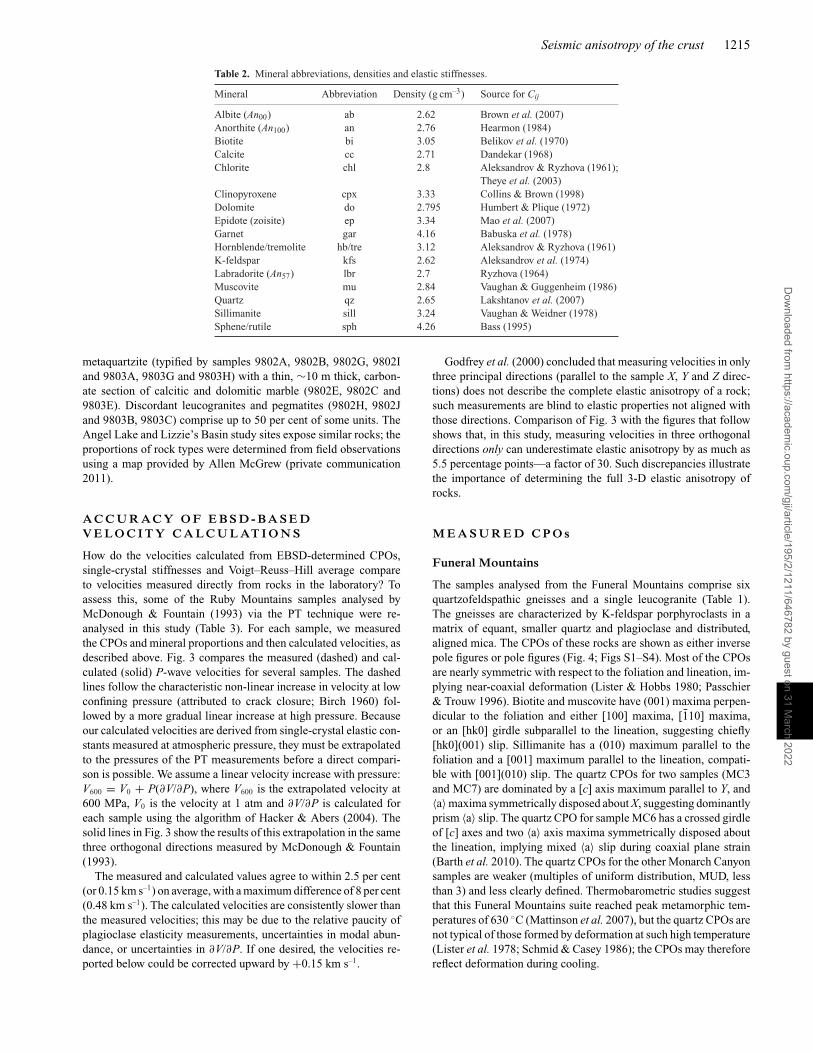
Table 2. Mineral abbreviations, densities and elastic stiffnesses.
Mineral Abbreviation Density (g cm–3) Source for Cij
Albite (An00) ab 2.62 Brown et al. (2007)Anorthite (An100) an 2.76 Hearmon (1984)Biotite bi 3.05 Belikov et al. (1970)Calcite cc 2.71 Dandekar (1968)Chlorite chl 2.8 Aleksandrov & Ryzhova (1961);
Theye et al. (2003)Clinopyroxene cpx 3.33 Collins & Brown (1998)Dolomite do 2.795 Humbert & Plique (1972)Epidote (zoisite) ep 3.34 Mao et al. (2007)Garnet gar 4.16 Babuska et al. (1978)Hornblende/tremolite hb/tre 3.12 Aleksandrov & Ryzhova (1961)K-feldspar kfs 2.62 Aleksandrov et al. (1974)Labradorite (An57) lbr 2.7 Ryzhova (1964)Muscovite mu 2.84 Vaughan & Guggenheim (1986)Quartz qz 2.65 Lakshtanov et al. (2007)Sillimanite sill 3.24 Vaughan & Weidner (1978)Sphene/rutile sph 4.26 Bass (1995)
metaquartzite (typified by samples 9802A, 9802B, 9802G, 9802Iand 9803A, 9803G and 9803H) with a thin, ∼10 m thick, carbon-ate section of calcitic and dolomitic marble (9802E, 9802C and9803E). Discordant leucogranites and pegmatites (9802H, 9802Jand 9803B, 9803C) comprise up to 50 per cent of some units. TheAngel Lake and Lizzie’s Basin study sites expose similar rocks; theproportions of rock types were determined from field observationsusing a map provided by Allen McGrew (private communication2011).
A C C U R A C Y O F E B S D - B A S E DV E L O C I T Y C A L C U L AT I O N S
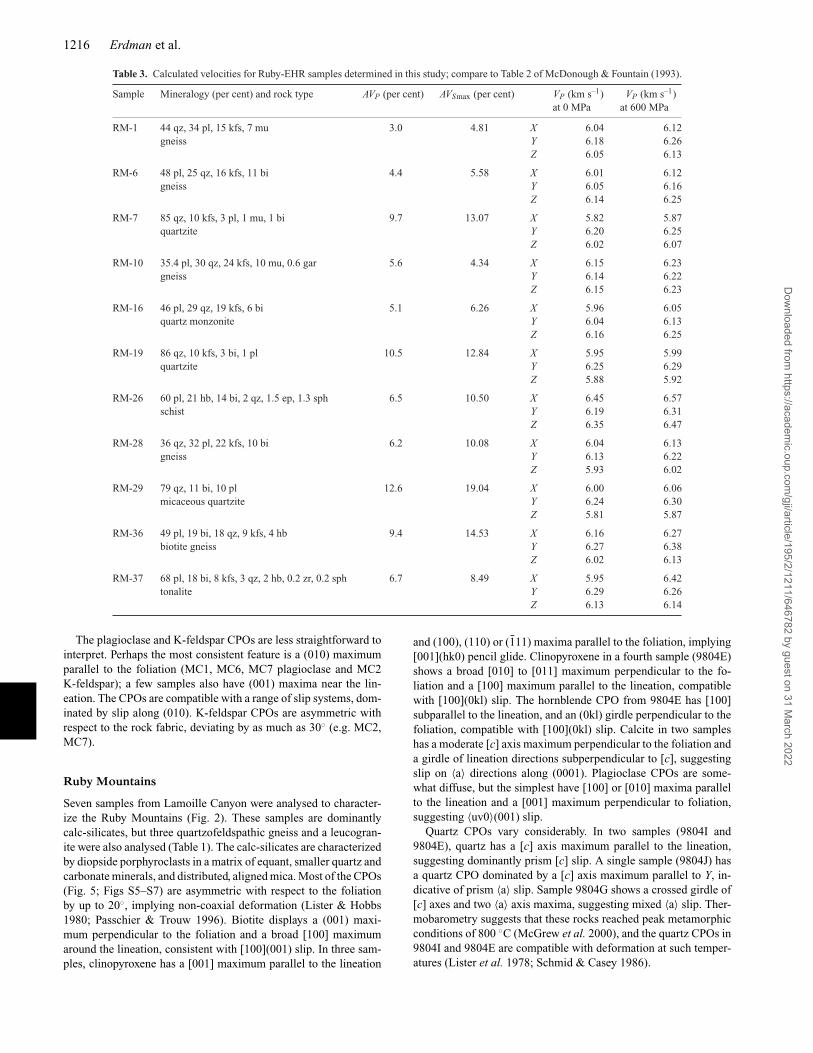
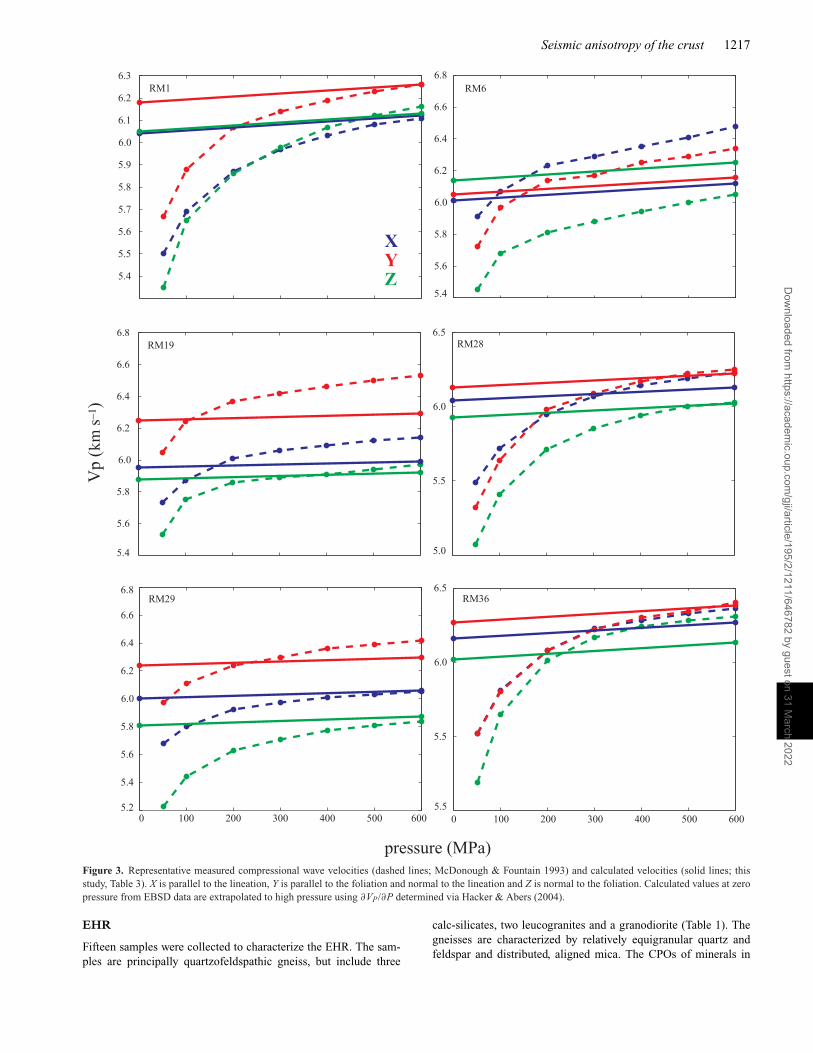
How do the velocities calculated from EBSD-determined CPOs,single-crystal stiffnesses and Voigt–Reuss–Hill average compareto velocities measured directly from rocks in the laboratory? Toassess this, some of the Ruby Mountains samples analysed byMcDonough & Fountain (1993) via the PT technique were re-analysed in this study (Table 3). For each sample, we measuredthe CPOs and mineral proportions and then calculated velocities, asdescribed above. Fig. 3 compares the measured (dashed) and cal-culated (solid) P-wave velocities for several samples. The dashedlines follow the characteristic non-linear increase in velocity at lowconfining pressure (attributed to crack closure; Birch 1960) fol-lowed by a more gradual linear increase at high pressure. Becauseour calculated velocities are derived from single-crystal elastic con-stants measured at atmospheric pressure, they must be extrapolatedto the pressures of the PT measurements before a direct compari-son is possible. We assume a linear velocity increase with pressure:V600 = V0 + P(∂V/∂P), where V600 is the extrapolated velocity at600 MPa, V0 is the velocity at 1 atm and ∂V/∂P is calculated foreach sample using the algorithm of Hacker & Abers (2004). Thesolid lines in Fig. 3 show the results of this extrapolation in the samethree orthogonal directions measured by McDonough & Fountain(1993).
The measured and calculated values agree to within 2.5 per cent(or 0.15 km s–1) on average, with a maximum difference of 8 per cent(0.48 km s–1). The calculated velocities are consistently slower thanthe measured velocities; this may be due to the relative paucity ofplagioclase elasticity measurements, uncertainties in modal abun-dance, or uncertainties in ∂V/∂P. If one desired, the velocities re-ported below could be corrected upward by +0.15 km s–1.
Godfrey et al. (2000) concluded that measuring velocities in onlythree principal directions (parallel to the sample X, Y and Z direc-tions) does not describe the complete elastic anisotropy of a rock;such measurements are blind to elastic properties not aligned withthose directions. Comparison of Fig. 3 with the figures that followshows that, in this study, measuring velocities in three orthogonaldirections only can underestimate elastic anisotropy by as much as5.5 percentage points—a factor of 30. Such discrepancies illustratethe importance of determining the full 3-D elastic anisotropy ofrocks.
M E A S U R E D C P O s
Funeral Mountains
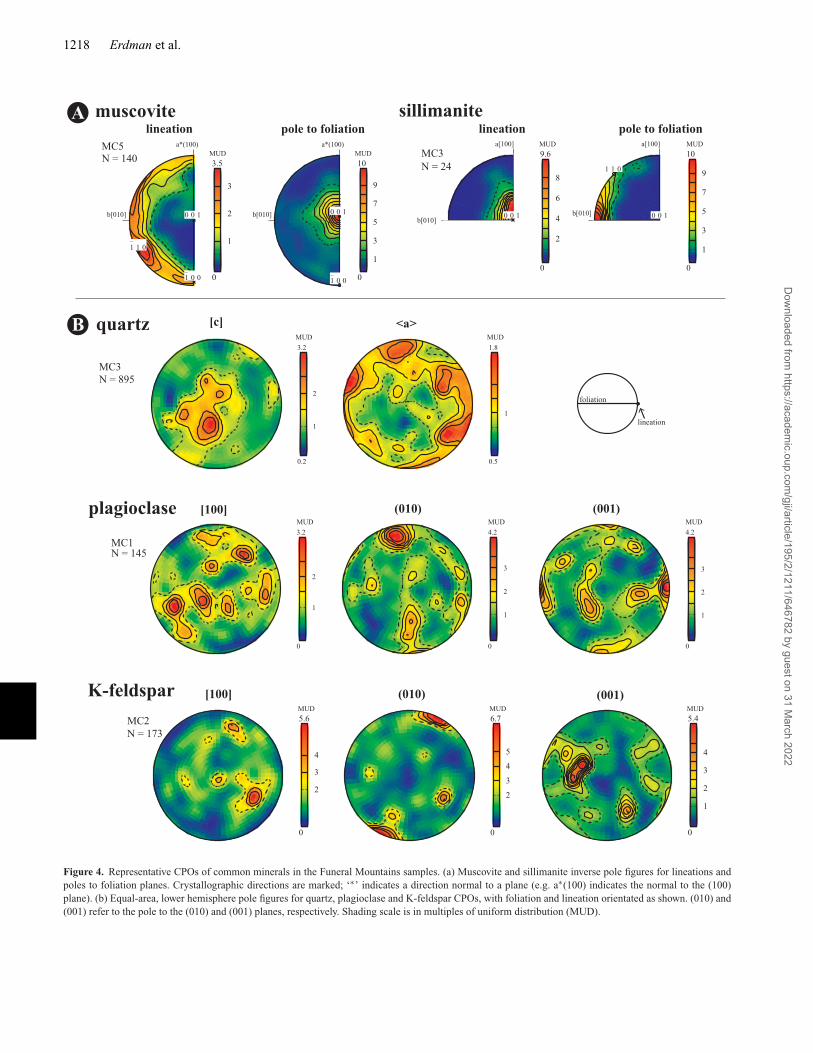
The samples analysed from the Funeral Mountains comprise sixquartzofeldspathic gneisses and a single leucogranite (Table 1).The gneisses are characterized by K-feldspar porphyroclasts in amatrix of equant, smaller quartz and plagioclase and distributed,aligned mica. The CPOs of these rocks are shown as either inversepole figures or pole figures (Fig. 4; Figs S1–S4). Most of the CPOsare nearly symmetric with respect to the foliation and lineation, im-plying near-coaxial deformation (Lister & Hobbs 1980; Passchier& Trouw 1996). Biotite and muscovite have (001) maxima perpen-dicular to the foliation and either [100] maxima, [110] maxima,or an [hk0] girdle subparallel to the lineation, suggesting chiefly[hk0](001) slip. Sillimanite has a (010) maximum parallel to thefoliation and a [001] maximum parallel to the lineation, compati-ble with [001](010) slip. The quartz CPOs for two samples (MC3and MC7) are dominated by a [c] axis maximum parallel to Y, and〈a〉 maxima symmetrically disposed about X, suggesting dominantlyprism 〈a〉 slip. The quartz CPO for sample MC6 has a crossed girdleof [c] axes and two 〈a〉 axis maxima symmetrically disposed aboutthe lineation, implying mixed 〈a〉 slip during coaxial plane strain(Barth et al. 2010). The quartz CPOs for the other Monarch Canyonsamples are weaker (multiples of uniform distribution, MUD, lessthan 3) and less clearly defined. Thermobarometric studies suggestthat this Funeral Mountains suite reached peak metamorphic tem-peratures of 630 ◦C (Mattinson et al. 2007), but the quartz CPOs arenot typical of those formed by deformation at such high temperature(Lister et al. 1978; Schmid & Casey 1986); the CPOs may thereforereflect deformation during cooling.
Dow
nloaded from https://academ
ic.oup.com/gji/article/195/2/1211/646782 by guest on 31 M
arch 2022
1216 Erdman et al.
Table 3. Calculated velocities for Ruby-EHR samples determined in this study; compare to Table 2 of McDonough & Fountain (1993).
Sample Mineralogy (per cent) and rock type AVP (per cent) AVSmax (per cent) VP (km s–1) VP (km s–1)at 0 MPa at 600 MPa
RM-1 44 qz, 34 pl, 15 kfs, 7 mu 3.0 4.81 X 6.04 6.12gneiss Y 6.18 6.26
Z 6.05 6.13
RM-6 48 pl, 25 qz, 16 kfs, 11 bi 4.4 5.58 X 6.01 6.12gneiss Y 6.05 6.16
Z 6.14 6.25
RM-7 85 qz, 10 kfs, 3 pl, 1 mu, 1 bi 9.7 13.07 X 5.82 5.87quartzite Y 6.20 6.25
Z 6.02 6.07
RM-10 35.4 pl, 30 qz, 24 kfs, 10 mu, 0.6 gar 5.6 4.34 X 6.15 6.23gneiss Y 6.14 6.22
Z 6.15 6.23
RM-16 46 pl, 29 qz, 19 kfs, 6 bi 5.1 6.26 X 5.96 6.05quartz monzonite Y 6.04 6.13
Z 6.16 6.25
RM-19 86 qz, 10 kfs, 3 bi, 1 pl 10.5 12.84 X 5.95 5.99quartzite Y 6.25 6.29
Z 5.88 5.92
RM-26 60 pl, 21 hb, 14 bi, 2 qz, 1.5 ep, 1.3 sph 6.5 10.50 X 6.45 6.57schist Y 6.19 6.31
Z 6.35 6.47
RM-28 36 qz, 32 pl, 22 kfs, 10 bi 6.2 10.08 X 6.04 6.13gneiss Y 6.13 6.22
Z 5.93 6.02
RM-29 79 qz, 11 bi, 10 pl 12.6 19.04 X 6.00 6.06micaceous quartzite Y 6.24 6.30
Z 5.81 5.87
RM-36 49 pl, 19 bi, 18 qz, 9 kfs, 4 hb 9.4 14.53 X 6.16 6.27biotite gneiss Y 6.27 6.38
Z 6.02 6.13
RM-37 68 pl, 18 bi, 8 kfs, 3 qz, 2 hb, 0.2 zr, 0.2 sph 6.7 8.49 X 5.95 6.42tonalite Y 6.29 6.26
Z 6.13 6.14
The plagioclase and K-feldspar CPOs are less straightforward tointerpret. Perhaps the most consistent feature is a (010) maximumparallel to the foliation (MC1, MC6, MC7 plagioclase and MC2K-feldspar); a few samples also have (001) maxima near the lin-eation. The CPOs are compatible with a range of slip systems, dom-inated by slip along (010). K-feldspar CPOs are asymmetric withrespect to the rock fabric, deviating by as much as 30◦ (e.g. MC2,MC7).
Ruby Mountains
Seven samples from Lamoille Canyon were analysed to character-ize the Ruby Mountains (Fig. 2). These samples are dominantlycalc-silicates, but three quartzofeldspathic gneiss and a leucogran-ite were also analysed (Table 1). The calc-silicates are characterizedby diopside porphyroclasts in a matrix of equant, smaller quartz andcarbonate minerals, and distributed, aligned mica. Most of the CPOs(Fig. 5; Figs S5–S7) are asymmetric with respect to the foliationby up to 20◦, implying non-coaxial deformation (Lister & Hobbs1980; Passchier & Trouw 1996). Biotite displays a (001) maxi-mum perpendicular to the foliation and a broad [100] maximumaround the lineation, consistent with [100](001) slip. In three sam-ples, clinopyroxene has a [001] maximum parallel to the lineation
and (100), (110) or (111) maxima parallel to the foliation, implying[001](hk0) pencil glide. Clinopyroxene in a fourth sample (9804E)shows a broad [010] to [011] maximum perpendicular to the fo-liation and a [100] maximum parallel to the lineation, compatiblewith [100](0kl) slip. The hornblende CPO from 9804E has [100]subparallel to the lineation, and an (0kl) girdle perpendicular to thefoliation, compatible with [100](0kl) slip. Calcite in two sampleshas a moderate [c] axis maximum perpendicular to the foliation anda girdle of lineation directions subperpendicular to [c], suggestingslip on 〈a〉 directions along (0001). Plagioclase CPOs are some-what diffuse, but the simplest have [100] or [010] maxima parallelto the lineation and a [001] maximum perpendicular to foliation,suggesting 〈uv0〉(001) slip.
Quartz CPOs vary considerably. In two samples (9804I and9804E), quartz has a [c] axis maximum parallel to the lineation,suggesting dominantly prism [c] slip. A single sample (9804J) hasa quartz CPO dominated by a [c] axis maximum parallel to Y, in-dicative of prism 〈a〉 slip. Sample 9804G shows a crossed girdle of[c] axes and two 〈a〉 axis maxima, suggesting mixed 〈a〉 slip. Ther-mobarometry suggests that these rocks reached peak metamorphicconditions of 800 ◦C (McGrew et al. 2000), and the quartz CPOs in9804I and 9804E are compatible with deformation at such temper-atures (Lister et al. 1978; Schmid & Casey 1986).
Dow
nloaded from https://academ
ic.oup.com/gji/article/195/2/1211/646782 by guest on 31 M
arch 2022
Seismic anisotropy of the crust 1217
Figure 3. Representative measured compressional wave velocities (dashed lines; McDonough & Fountain 1993) and calculated velocities (solid lines; thisstudy, Table 3). X is parallel to the lineation, Y is parallel to the foliation and normal to the lineation and Z is normal to the foliation. Calculated values at zeropressure from EBSD data are extrapolated to high pressure using ∂VP/∂P determined via Hacker & Abers (2004).
EHR
Fifteen samples were collected to characterize the EHR. The sam-ples are principally quartzofeldspathic gneiss, but include three
calc-silicates, two leucogranites and a granodiorite (Table 1). Thegneisses are characterized by relatively equigranular quartz andfeldspar and distributed, aligned mica. The CPOs of minerals in
Dow
nloaded from https://academ
ic.oup.com/gji/article/195/2/1211/646782 by guest on 31 M
arch 2022
1218 Erdman et al.
Figure 4. Representative CPOs of common minerals in the Funeral Mountains samples. (a) Muscovite and sillimanite inverse pole figures for lineations andpoles to foliation planes. Crystallographic directions are marked; ‘∗’ indicates a direction normal to a plane (e.g. a∗(100) indicates the normal to the (100)plane). (b) Equal-area, lower hemisphere pole figures for quartz, plagioclase and K-feldspar CPOs, with foliation and lineation orientated as shown. (010) and(001) refer to the pole to the (010) and (001) planes, respectively. Shading scale is in multiples of uniform distribution (MUD).
Dow
nloaded from https://academ
ic.oup.com/gji/article/195/2/1211/646782 by guest on 31 M
arch 2022
Seismic anisotropy of the crust 1219
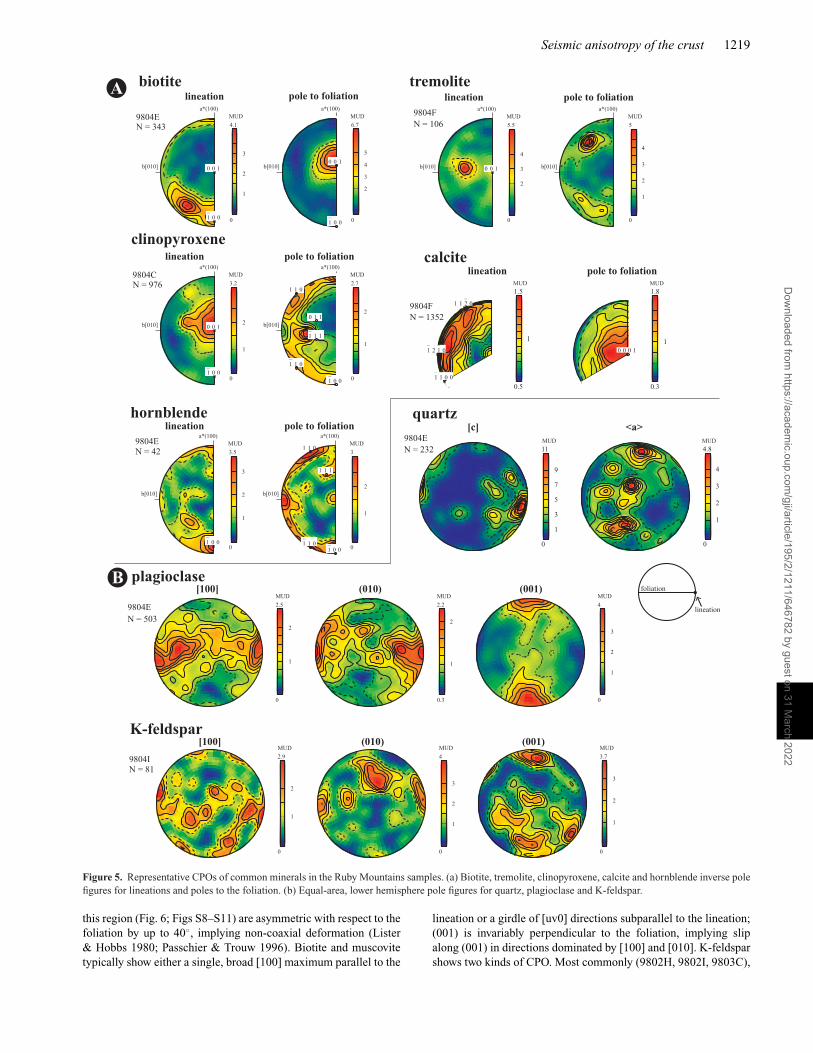
Figure 5. Representative CPOs of common minerals in the Ruby Mountains samples. (a) Biotite, tremolite, clinopyroxene, calcite and hornblende inverse polefigures for lineations and poles to the foliation. (b) Equal-area, lower hemisphere pole figures for quartz, plagioclase and K-feldspar.
this region (Fig. 6; Figs S8–S11) are asymmetric with respect to thefoliation by up to 40◦, implying non-coaxial deformation (Lister& Hobbs 1980; Passchier & Trouw 1996). Biotite and muscovitetypically show either a single, broad [100] maximum parallel to the
lineation or a girdle of [uv0] directions subparallel to the lineation;(001) is invariably perpendicular to the foliation, implying slipalong (001) in directions dominated by [100] and [010]. K-feldsparshows two kinds of CPO. Most commonly (9802H, 9802I, 9803C),
Dow
nloaded from https://academ
ic.oup.com/gji/article/195/2/1211/646782 by guest on 31 M
arch 2022
1220 Erdman et al.
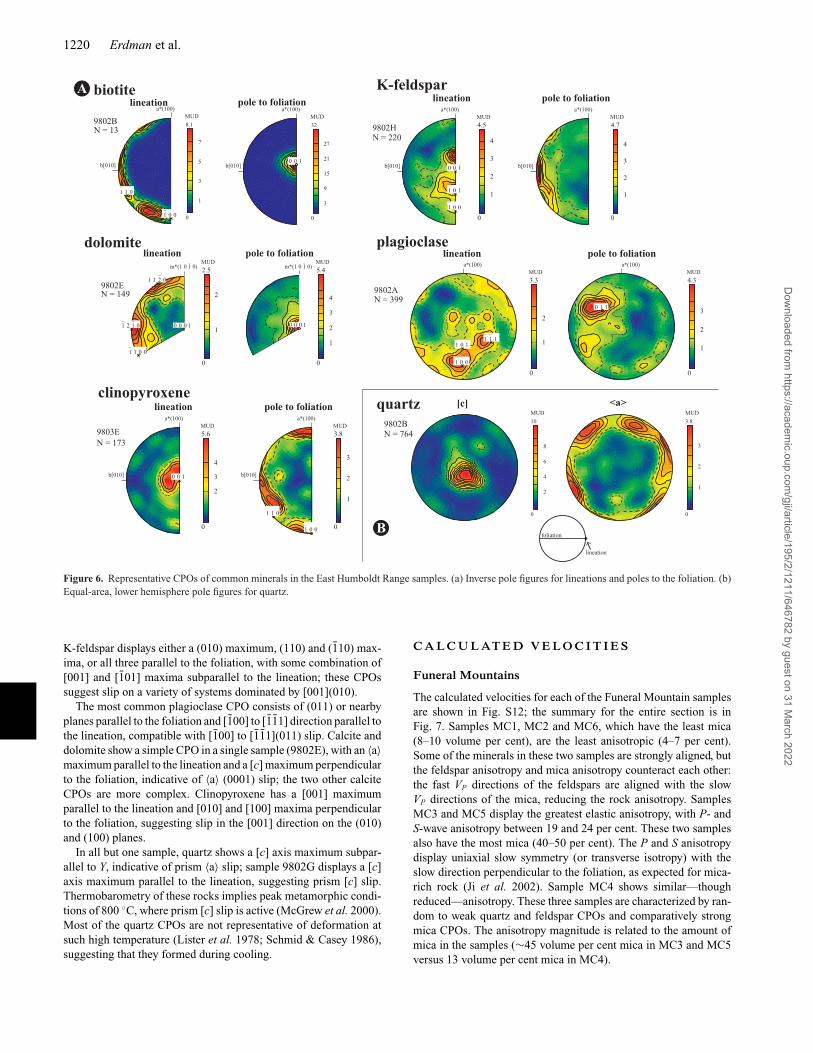
Figure 6. Representative CPOs of common minerals in the East Humboldt Range samples. (a) Inverse pole figures for lineations and poles to the foliation. (b)Equal-area, lower hemisphere pole figures for quartz.
K-feldspar displays either a (010) maximum, (110) and (110) max-ima, or all three parallel to the foliation, with some combination of[001] and [101] maxima subparallel to the lineation; these CPOssuggest slip on a variety of systems dominated by [001](010).
The most common plagioclase CPO consists of (011) or nearbyplanes parallel to the foliation and [100] to [111] direction parallel tothe lineation, compatible with [100] to [111](011) slip. Calcite anddolomite show a simple CPO in a single sample (9802E), with an 〈a〉maximum parallel to the lineation and a [c] maximum perpendicularto the foliation, indicative of 〈a〉 (0001) slip; the two other calciteCPOs are more complex. Clinopyroxene has a [001] maximumparallel to the lineation and [010] and [100] maxima perpendicularto the foliation, suggesting slip in the [001] direction on the (010)and (100) planes.
In all but one sample, quartz shows a [c] axis maximum subpar-allel to Y, indicative of prism 〈a〉 slip; sample 9802G displays a [c]axis maximum parallel to the lineation, suggesting prism [c] slip.Thermobarometry of these rocks implies peak metamorphic condi-tions of 800 ◦C, where prism [c] slip is active (McGrew et al. 2000).Most of the quartz CPOs are not representative of deformation atsuch high temperature (Lister et al. 1978; Schmid & Casey 1986),suggesting that they formed during cooling.
C A L C U L AT E D V E L O C I T I E S
Funeral Mountains
The calculated velocities for each of the Funeral Mountain samplesare shown in Fig. S12; the summary for the entire section is inFig. 7. Samples MC1, MC2 and MC6, which have the least mica(8–10 volume per cent), are the least anisotropic (4–7 per cent).Some of the minerals in these two samples are strongly aligned, butthe feldspar anisotropy and mica anisotropy counteract each other:the fast VP directions of the feldspars are aligned with the slowVP directions of the mica, reducing the rock anisotropy. SamplesMC3 and MC5 display the greatest elastic anisotropy, with P- andS-wave anisotropy between 19 and 24 per cent. These two samplesalso have the most mica (40–50 per cent). The P and S anisotropydisplay uniaxial slow symmetry (or transverse isotropy) with theslow direction perpendicular to the foliation, as expected for mica-rich rock (Ji et al. 2002). Sample MC4 shows similar—thoughreduced—anisotropy. These three samples are characterized by ran-dom to weak quartz and feldspar CPOs and comparatively strongmica CPOs. The anisotropy magnitude is related to the amount ofmica in the samples (∼45 volume per cent mica in MC3 and MC5versus 13 volume per cent mica in MC4).
Dow
nloaded from https://academ
ic.oup.com/gji/article/195/2/1211/646782 by guest on 31 M
arch 2022
Seismic anisotropy of the crust 1221
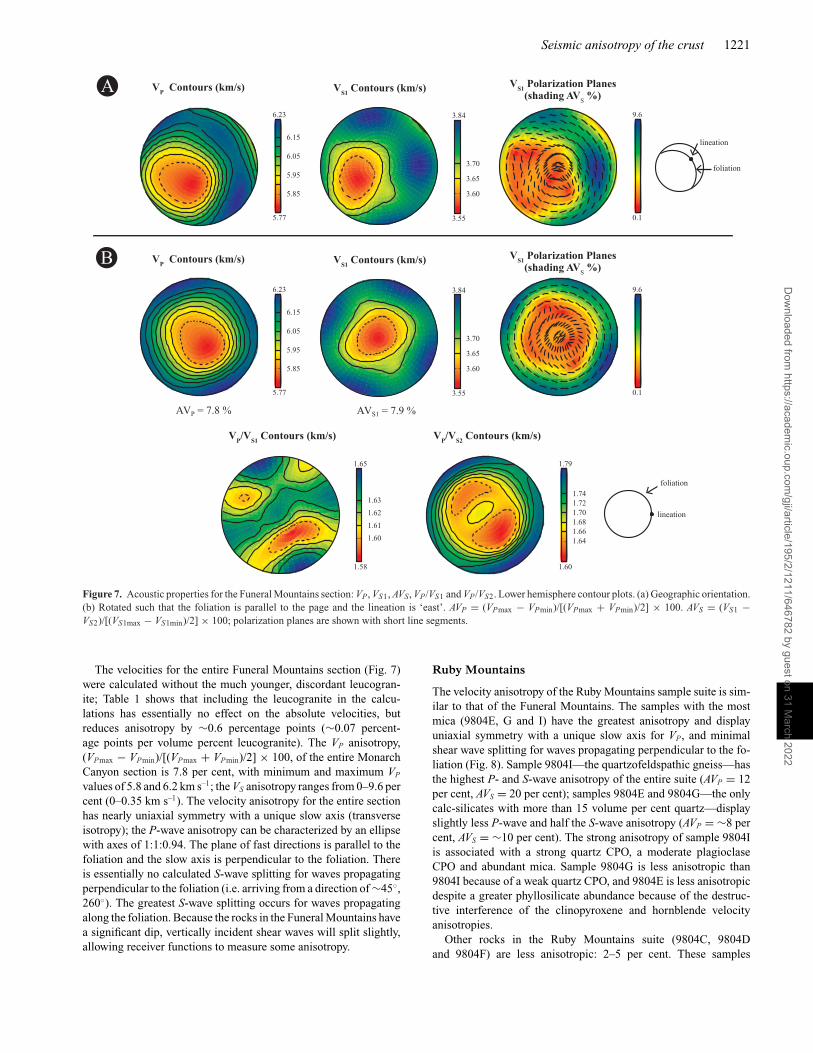
Figure 7. Acoustic properties for the Funeral Mountains section: VP, VS1, AVS, VP/VS1 and VP/VS2. Lower hemisphere contour plots. (a) Geographic orientation.(b) Rotated such that the foliation is parallel to the page and the lineation is ‘east’. AVP = (VPmax − VPmin)/[(VPmax + VPmin)/2] × 100. AVS = (VS1 −VS2)/[(VS1max − VS1min)/2] × 100; polarization planes are shown with short line segments.
The velocities for the entire Funeral Mountains section (Fig. 7)were calculated without the much younger, discordant leucogran-ite; Table 1 shows that including the leucogranite in the calcu-lations has essentially no effect on the absolute velocities, butreduces anisotropy by ∼0.6 percentage points (∼0.07 percent-age points per volume percent leucogranite). The VP anisotropy,(VPmax − VPmin)/[(VPmax + VPmin)/2] × 100, of the entire MonarchCanyon section is 7.8 per cent, with minimum and maximum VP
values of 5.8 and 6.2 km s–1; the VS anisotropy ranges from 0–9.6 percent (0–0.35 km s–1). The velocity anisotropy for the entire sectionhas nearly uniaxial symmetry with a unique slow axis (transverseisotropy); the P-wave anisotropy can be characterized by an ellipsewith axes of 1:1:0.94. The plane of fast directions is parallel to thefoliation and the slow axis is perpendicular to the foliation. Thereis essentially no calculated S-wave splitting for waves propagatingperpendicular to the foliation (i.e. arriving from a direction of ∼45◦,260◦). The greatest S-wave splitting occurs for waves propagatingalong the foliation. Because the rocks in the Funeral Mountains havea significant dip, vertically incident shear waves will split slightly,allowing receiver functions to measure some anisotropy.
Ruby Mountains
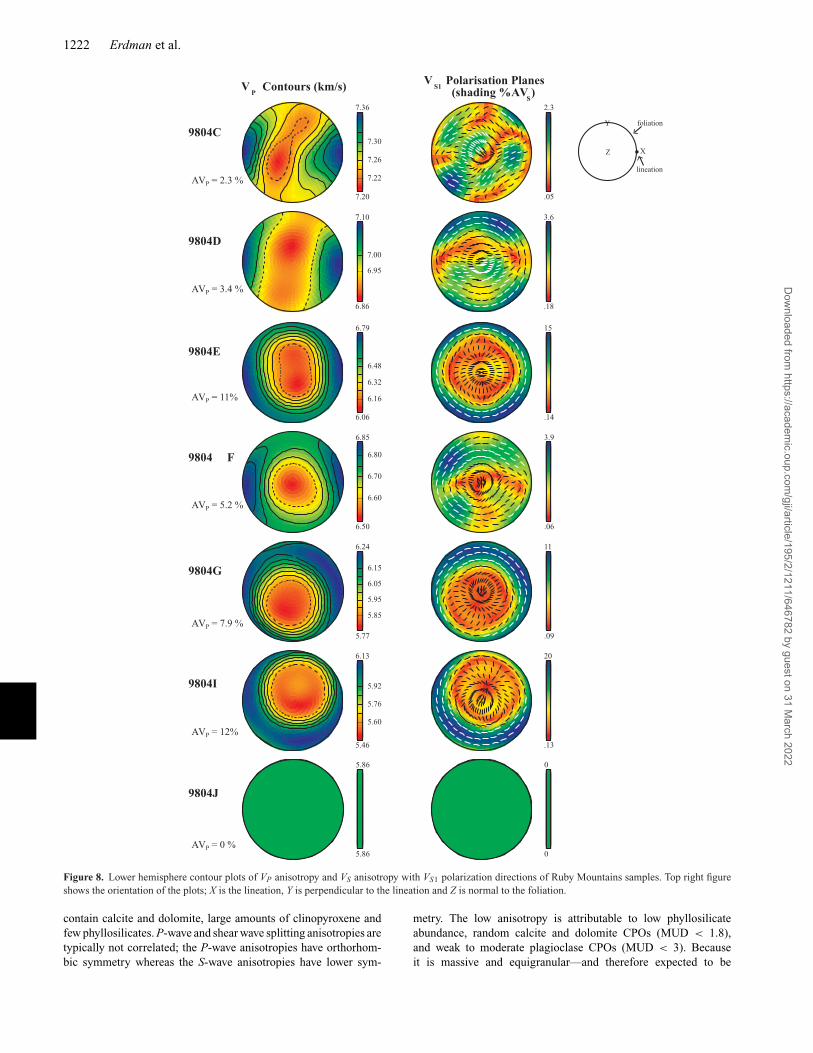
The velocity anisotropy of the Ruby Mountains sample suite is sim-ilar to that of the Funeral Mountains. The samples with the mostmica (9804E, G and I) have the greatest anisotropy and displayuniaxial symmetry with a unique slow axis for VP, and minimalshear wave splitting for waves propagating perpendicular to the fo-liation (Fig. 8). Sample 9804I—the quartzofeldspathic gneiss—hasthe highest P- and S-wave anisotropy of the entire suite (AVP = 12per cent, AVS = 20 per cent); samples 9804E and 9804G—the onlycalc-silicates with more than 15 volume per cent quartz—displayslightly less P-wave and half the S-wave anisotropy (AVP = ∼8 percent, AVS = ∼10 per cent). The strong anisotropy of sample 9804Iis associated with a strong quartz CPO, a moderate plagioclaseCPO and abundant mica. Sample 9804G is less anisotropic than9804I because of a weak quartz CPO, and 9804E is less anisotropicdespite a greater phyllosilicate abundance because of the destruc-tive interference of the clinopyroxene and hornblende velocityanisotropies.
Other rocks in the Ruby Mountains suite (9804C, 9804Dand 9804F) are less anisotropic: 2–5 per cent. These samples
Dow
nloaded from https://academ
ic.oup.com/gji/article/195/2/1211/646782 by guest on 31 M
arch 2022
1222 Erdman et al.
Figure 8. Lower hemisphere contour plots of VP anisotropy and VS anisotropy with VS1 polarization directions of Ruby Mountains samples. Top right figureshows the orientation of the plots; X is the lineation, Y is perpendicular to the lineation and Z is normal to the foliation.
contain calcite and dolomite, large amounts of clinopyroxene andfew phyllosilicates. P-wave and shear wave splitting anisotropies aretypically not correlated; the P-wave anisotropies have orthorhom-bic symmetry whereas the S-wave anisotropies have lower sym-
metry. The low anisotropy is attributable to low phyllosilicateabundance, random calcite and dolomite CPOs (MUD < 1.8),and weak to moderate plagioclase CPOs (MUD < 3). Becauseit is massive and equigranular—and therefore expected to be
Dow
nloaded from https://academ
ic.oup.com/gji/article/195/2/1211/646782 by guest on 31 M
arch 2022
Seismic anisotropy of the crust 1223
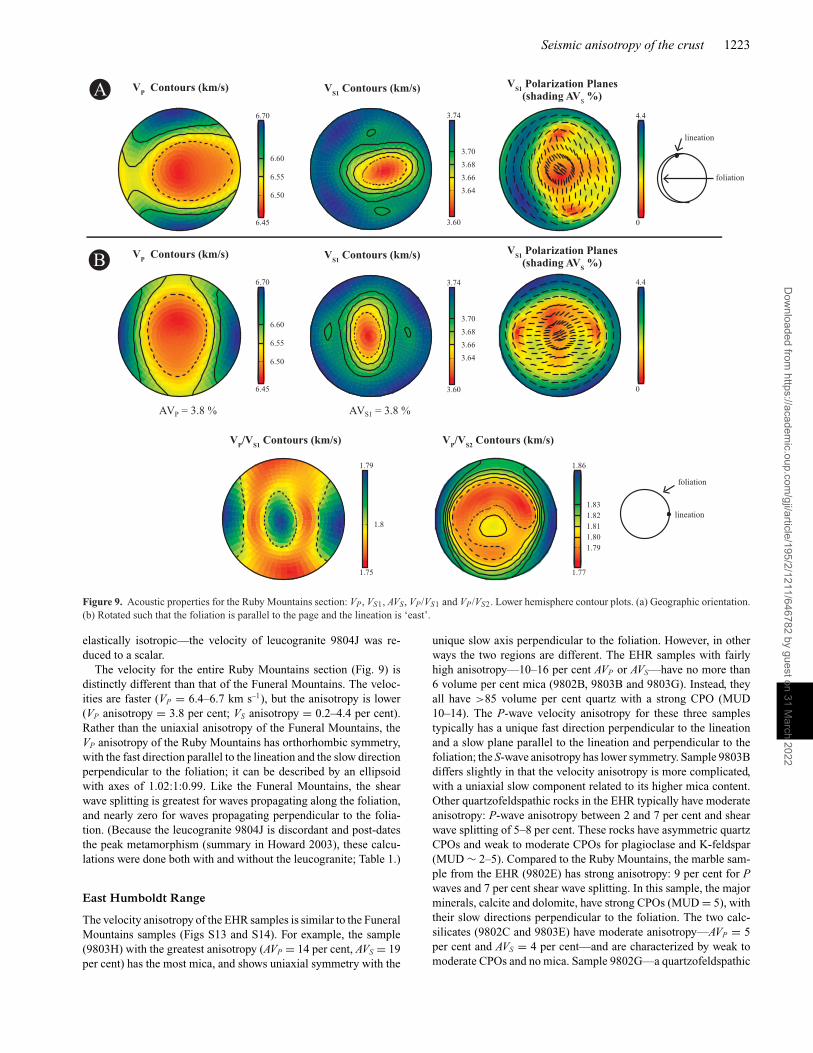
Figure 9. Acoustic properties for the Ruby Mountains section: VP, VS1, AVS, VP/VS1 and VP/VS2. Lower hemisphere contour plots. (a) Geographic orientation.(b) Rotated such that the foliation is parallel to the page and the lineation is ‘east’.
elastically isotropic—the velocity of leucogranite 9804J was re-duced to a scalar.
The velocity for the entire Ruby Mountains section (Fig. 9) isdistinctly different than that of the Funeral Mountains. The veloc-ities are faster (VP = 6.4–6.7 km s–1), but the anisotropy is lower(VP anisotropy = 3.8 per cent; VS anisotropy = 0.2–4.4 per cent).Rather than the uniaxial anisotropy of the Funeral Mountains, theVP anisotropy of the Ruby Mountains has orthorhombic symmetry,with the fast direction parallel to the lineation and the slow directionperpendicular to the foliation; it can be described by an ellipsoidwith axes of 1.02:1:0.99. Like the Funeral Mountains, the shearwave splitting is greatest for waves propagating along the foliation,and nearly zero for waves propagating perpendicular to the folia-tion. (Because the leucogranite 9804J is discordant and post-datesthe peak metamorphism (summary in Howard 2003), these calcu-lations were done both with and without the leucogranite; Table 1.)
East Humboldt Range
The velocity anisotropy of the EHR samples is similar to the FuneralMountains samples (Figs S13 and S14). For example, the sample(9803H) with the greatest anisotropy (AVP = 14 per cent, AVS = 19per cent) has the most mica, and shows uniaxial symmetry with the
unique slow axis perpendicular to the foliation. However, in otherways the two regions are different. The EHR samples with fairlyhigh anisotropy—10–16 per cent AVP or AVS—have no more than6 volume per cent mica (9802B, 9803B and 9803G). Instead, theyall have >85 volume per cent quartz with a strong CPO (MUD10–14). The P-wave velocity anisotropy for these three samplestypically has a unique fast direction perpendicular to the lineationand a slow plane parallel to the lineation and perpendicular to thefoliation; the S-wave anisotropy has lower symmetry. Sample 9803Bdiffers slightly in that the velocity anisotropy is more complicated,with a uniaxial slow component related to its higher mica content.Other quartzofeldspathic rocks in the EHR typically have moderateanisotropy: P-wave anisotropy between 2 and 7 per cent and shearwave splitting of 5–8 per cent. These rocks have asymmetric quartzCPOs and weak to moderate CPOs for plagioclase and K-feldspar(MUD ∼ 2–5). Compared to the Ruby Mountains, the marble sam-ple from the EHR (9802E) has strong anisotropy: 9 per cent for Pwaves and 7 per cent shear wave splitting. In this sample, the majorminerals, calcite and dolomite, have strong CPOs (MUD = 5), withtheir slow directions perpendicular to the foliation. The two calc-silicates (9802C and 9803E) have moderate anisotropy—AVP = 5per cent and AVS = 4 per cent—and are characterized by weak tomoderate CPOs and no mica. Sample 9802G—a quartzofeldspathic
Dow
nloaded from https://academ
ic.oup.com/gji/article/195/2/1211/646782 by guest on 31 M
arch 2022
1224 Erdman et al.
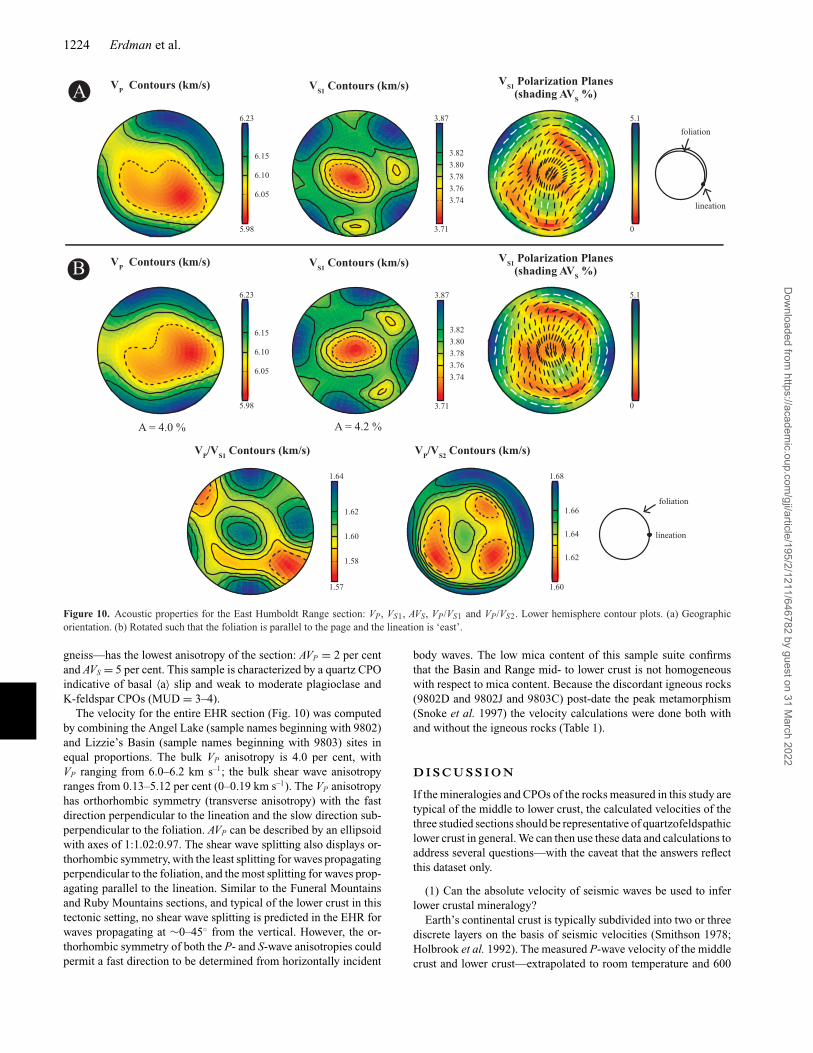
Figure 10. Acoustic properties for the East Humboldt Range section: VP, VS1, AVS, VP/VS1 and VP/VS2. Lower hemisphere contour plots. (a) Geographicorientation. (b) Rotated such that the foliation is parallel to the page and the lineation is ‘east’.
gneiss—has the lowest anisotropy of the section: AVP = 2 per centand AVS = 5 per cent. This sample is characterized by a quartz CPOindicative of basal 〈a〉 slip and weak to moderate plagioclase andK-feldspar CPOs (MUD = 3–4).
The velocity for the entire EHR section (Fig. 10) was computedby combining the Angel Lake (sample names beginning with 9802)and Lizzie’s Basin (sample names beginning with 9803) sites inequal proportions. The bulk VP anisotropy is 4.0 per cent, withVP ranging from 6.0–6.2 km s–1; the bulk shear wave anisotropyranges from 0.13–5.12 per cent (0–0.19 km s–1). The VP anisotropyhas orthorhombic symmetry (transverse anisotropy) with the fastdirection perpendicular to the lineation and the slow direction sub-perpendicular to the foliation. AVP can be described by an ellipsoidwith axes of 1:1.02:0.97. The shear wave splitting also displays or-thorhombic symmetry, with the least splitting for waves propagatingperpendicular to the foliation, and the most splitting for waves prop-agating parallel to the lineation. Similar to the Funeral Mountainsand Ruby Mountains sections, and typical of the lower crust in thistectonic setting, no shear wave splitting is predicted in the EHR forwaves propagating at ∼0–45◦ from the vertical. However, the or-thorhombic symmetry of both the P- and S-wave anisotropies couldpermit a fast direction to be determined from horizontally incident
body waves. The low mica content of this sample suite confirmsthat the Basin and Range mid- to lower crust is not homogeneouswith respect to mica content. Because the discordant igneous rocks(9802D and 9802J and 9803C) post-date the peak metamorphism(Snoke et al. 1997) the velocity calculations were done both withand without the igneous rocks (Table 1).
D I S C U S S I O N
If the mineralogies and CPOs of the rocks measured in this study aretypical of the middle to lower crust, the calculated velocities of thethree studied sections should be representative of quartzofeldspathiclower crust in general. We can then use these data and calculations toaddress several questions—with the caveat that the answers reflectthis dataset only.
(1) Can the absolute velocity of seismic waves be used to inferlower crustal mineralogy?
Earth’s continental crust is typically subdivided into two or threediscrete layers on the basis of seismic velocities (Smithson 1978;Holbrook et al. 1992). The measured P-wave velocity of the middlecrust and lower crust—extrapolated to room temperature and 600
Dow
nloaded from https://academ
ic.oup.com/gji/article/195/2/1211/646782 by guest on 31 M
arch 2022
Seismic anisotropy of the crust 1225
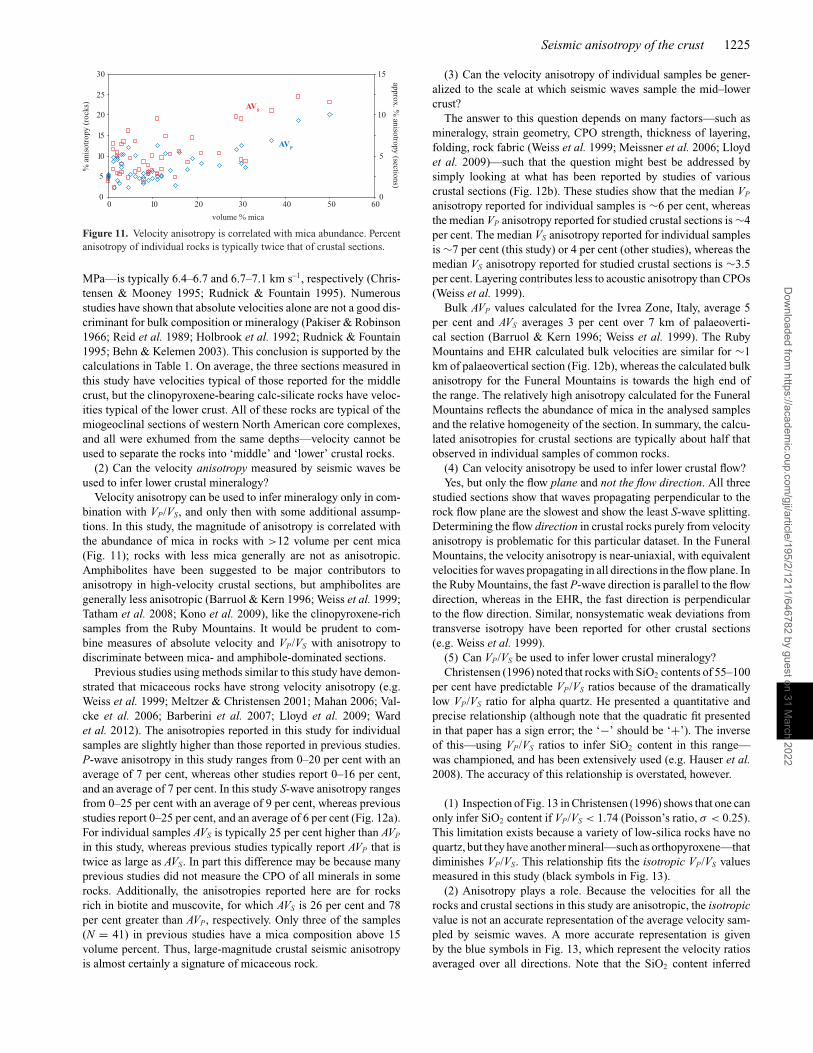
Figure 11. Velocity anisotropy is correlated with mica abundance. Percentanisotropy of individual rocks is typically twice that of crustal sections.
MPa—is typically 6.4–6.7 and 6.7–7.1 km s–1, respectively (Chris-tensen & Mooney 1995; Rudnick & Fountain 1995). Numerousstudies have shown that absolute velocities alone are not a good dis-criminant for bulk composition or mineralogy (Pakiser & Robinson1966; Reid et al. 1989; Holbrook et al. 1992; Rudnick & Fountain1995; Behn & Kelemen 2003). This conclusion is supported by thecalculations in Table 1. On average, the three sections measured inthis study have velocities typical of those reported for the middlecrust, but the clinopyroxene-bearing calc-silicate rocks have veloc-ities typical of the lower crust. All of these rocks are typical of themiogeoclinal sections of western North American core complexes,and all were exhumed from the same depths—velocity cannot beused to separate the rocks into ‘middle’ and ‘lower’ crustal rocks.
(2) Can the velocity anisotropy measured by seismic waves beused to infer lower crustal mineralogy?
Velocity anisotropy can be used to infer mineralogy only in com-bination with VP/VS, and only then with some additional assump-tions. In this study, the magnitude of anisotropy is correlated withthe abundance of mica in rocks with >12 volume per cent mica(Fig. 11); rocks with less mica generally are not as anisotropic.Amphibolites have been suggested to be major contributors toanisotropy in high-velocity crustal sections, but amphibolites aregenerally less anisotropic (Barruol & Kern 1996; Weiss et al. 1999;Tatham et al. 2008; Kono et al. 2009), like the clinopyroxene-richsamples from the Ruby Mountains. It would be prudent to com-bine measures of absolute velocity and VP/VS with anisotropy todiscriminate between mica- and amphibole-dominated sections.
Previous studies using methods similar to this study have demon-strated that micaceous rocks have strong velocity anisotropy (e.g.Weiss et al. 1999; Meltzer & Christensen 2001; Mahan 2006; Val-cke et al. 2006; Barberini et al. 2007; Lloyd et al. 2009; Wardet al. 2012). The anisotropies reported in this study for individualsamples are slightly higher than those reported in previous studies.P-wave anisotropy in this study ranges from 0–20 per cent with anaverage of 7 per cent, whereas other studies report 0–16 per cent,and an average of 7 per cent. In this study S-wave anisotropy rangesfrom 0–25 per cent with an average of 9 per cent, whereas previousstudies report 0–25 per cent, and an average of 6 per cent (Fig. 12a).For individual samples AVS is typically 25 per cent higher than AVP
in this study, whereas previous studies typically report AVP that istwice as large as AVS. In part this difference may be because manyprevious studies did not measure the CPO of all minerals in somerocks. Additionally, the anisotropies reported here are for rocksrich in biotite and muscovite, for which AVS is 26 per cent and 78per cent greater than AVP, respectively. Only three of the samples(N = 41) in previous studies have a mica composition above 15volume percent. Thus, large-magnitude crustal seismic anisotropyis almost certainly a signature of micaceous rock.
(3) Can the velocity anisotropy of individual samples be gener-alized to the scale at which seismic waves sample the mid–lowercrust?
The answer to this question depends on many factors—such asmineralogy, strain geometry, CPO strength, thickness of layering,folding, rock fabric (Weiss et al. 1999; Meissner et al. 2006; Lloydet al. 2009)—such that the question might best be addressed bysimply looking at what has been reported by studies of variouscrustal sections (Fig. 12b). These studies show that the median VP
anisotropy reported for individual samples is ∼6 per cent, whereasthe median VP anisotropy reported for studied crustal sections is ∼4per cent. The median VS anisotropy reported for individual samplesis ∼7 per cent (this study) or 4 per cent (other studies), whereas themedian VS anisotropy reported for studied crustal sections is ∼3.5per cent. Layering contributes less to acoustic anisotropy than CPOs(Weiss et al. 1999).
Bulk AVP values calculated for the Ivrea Zone, Italy, average 5per cent and AVS averages 3 per cent over 7 km of palaeoverti-cal section (Barruol & Kern 1996; Weiss et al. 1999). The RubyMountains and EHR calculated bulk velocities are similar for ∼1km of palaeovertical section (Fig. 12b), whereas the calculated bulkanisotropy for the Funeral Mountains is towards the high end ofthe range. The relatively high anisotropy calculated for the FuneralMountains reflects the abundance of mica in the analysed samplesand the relative homogeneity of the section. In summary, the calcu-lated anisotropies for crustal sections are typically about half thatobserved in individual samples of common rocks.
(4) Can velocity anisotropy be used to infer lower crustal flow?Yes, but only the flow plane and not the flow direction. All three
studied sections show that waves propagating perpendicular to therock flow plane are the slowest and show the least S-wave splitting.Determining the flow direction in crustal rocks purely from velocityanisotropy is problematic for this particular dataset. In the FuneralMountains, the velocity anisotropy is near-uniaxial, with equivalentvelocities for waves propagating in all directions in the flow plane. Inthe Ruby Mountains, the fast P-wave direction is parallel to the flowdirection, whereas in the EHR, the fast direction is perpendicularto the flow direction. Similar, nonsystematic weak deviations fromtransverse isotropy have been reported for other crustal sections(e.g. Weiss et al. 1999).
(5) Can VP/VS be used to infer lower crustal mineralogy?Christensen (1996) noted that rocks with SiO2 contents of 55–100
per cent have predictable VP/VS ratios because of the dramaticallylow VP/VS ratio for alpha quartz. He presented a quantitative andprecise relationship (although note that the quadratic fit presentedin that paper has a sign error; the ‘−’ should be ‘+’). The inverseof this—using VP/VS ratios to infer SiO2 content in this range—was championed, and has been extensively used (e.g. Hauser et al.2008). The accuracy of this relationship is overstated, however.
(1) Inspection of Fig. 13 in Christensen (1996) shows that one canonly infer SiO2 content if VP/VS < 1.74 (Poisson’s ratio, σ < 0.25).This limitation exists because a variety of low-silica rocks have noquartz, but they have another mineral—such as orthopyroxene—thatdiminishes VP/VS. This relationship fits the isotropic VP/VS valuesmeasured in this study (black symbols in Fig. 13).
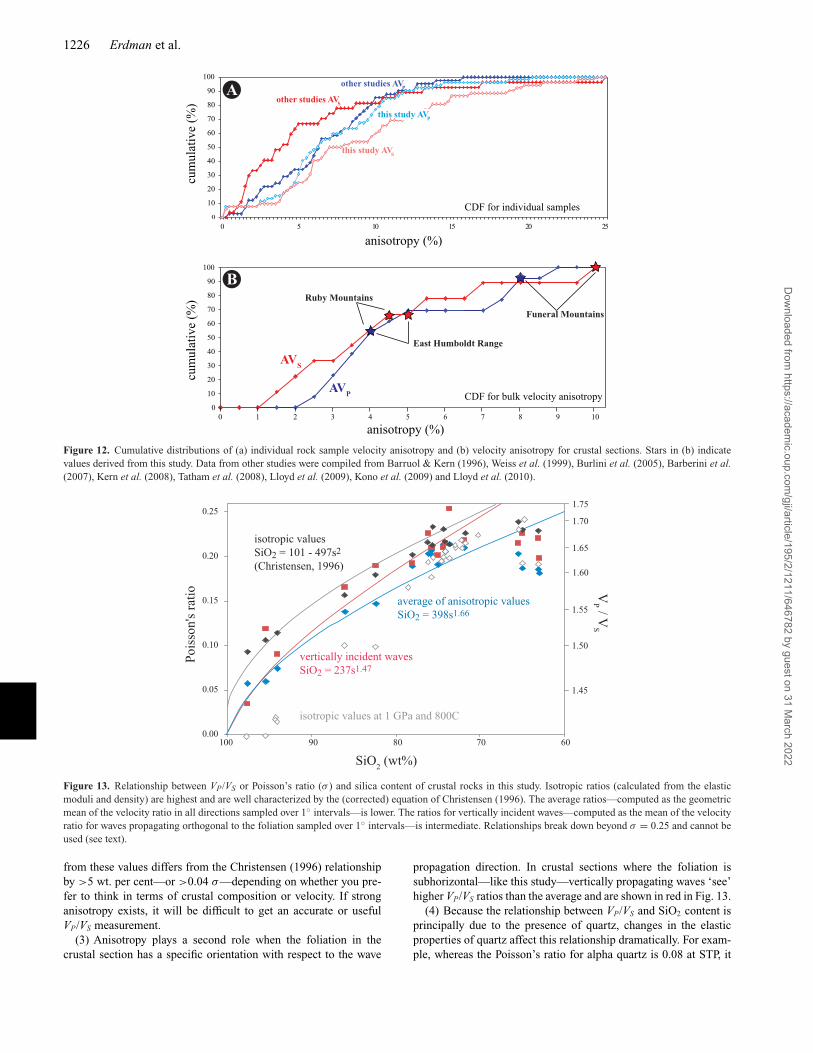
(2) Anisotropy plays a role. Because the velocities for all therocks and crustal sections in this study are anisotropic, the isotropicvalue is not an accurate representation of the average velocity sam-pled by seismic waves. A more accurate representation is givenby the blue symbols in Fig. 13, which represent the velocity ratiosaveraged over all directions. Note that the SiO2 content inferred
Dow
nloaded from https://academ
ic.oup.com/gji/article/195/2/1211/646782 by guest on 31 M
arch 2022
1226 Erdman et al.
Figure 12. Cumulative distributions of (a) individual rock sample velocity anisotropy and (b) velocity anisotropy for crustal sections. Stars in (b) indicatevalues derived from this study. Data from other studies were compiled from Barruol & Kern (1996), Weiss et al. (1999), Burlini et al. (2005), Barberini et al.(2007), Kern et al. (2008), Tatham et al. (2008), Lloyd et al. (2009), Kono et al. (2009) and Lloyd et al. (2010).
Figure 13. Relationship between VP/VS or Poisson’s ratio (σ ) and silica content of crustal rocks in this study. Isotropic ratios (calculated from the elasticmoduli and density) are highest and are well characterized by the (corrected) equation of Christensen (1996). The average ratios—computed as the geometricmean of the velocity ratio in all directions sampled over 1◦ intervals—is lower. The ratios for vertically incident waves—computed as the mean of the velocityratio for waves propagating orthogonal to the foliation sampled over 1◦ intervals—is intermediate. Relationships break down beyond σ = 0.25 and cannot beused (see text).
from these values differs from the Christensen (1996) relationshipby >5 wt. per cent—or >0.04 σ—depending on whether you pre-fer to think in terms of crustal composition or velocity. If stronganisotropy exists, it will be difficult to get an accurate or usefulVP/VS measurement.
(3) Anisotropy plays a second role when the foliation in thecrustal section has a specific orientation with respect to the wave
propagation direction. In crustal sections where the foliation issubhorizontal—like this study—vertically propagating waves ‘see’higher VP/VS ratios than the average and are shown in red in Fig. 13.
(4) Because the relationship between VP/VS and SiO2 content isprincipally due to the presence of quartz, changes in the elasticproperties of quartz affect this relationship dramatically. For exam-ple, whereas the Poisson’s ratio for alpha quartz is 0.08 at STP, it
Dow
nloaded from https://academ
ic.oup.com/gji/article/195/2/1211/646782 by guest on 31 M
arch 2022
Seismic anisotropy of the crust 1227
is −0.05 at 1 GPa and 800 ◦C (Hacker & Abers 2004), leading tosignificant decreases in rock VP/VS shown in grey in Fig. 13. At1 GPa and 850 ◦C, where beta quartz is stable, Poisson’s ratio inquartz is 0.22, and the ratios increase dramatically upward.
In aggregate, these considerations mean that the use of VP/VS
to assess the SiO2 content of Earth’s crust should be limited toVP/VS < 1.74. At STP, this relationship has an accuracy of ∼5 wt.per cent SiO2 because of the anisotropy inherent in crustal sections,and the inaccuracy will be larger at depth unless the ambient pressureand temperature are well known.
C O N C LU S I O N S
Agreement between measured and calculated velocities shows thatseismic velocities calculated from mineral CPOs and elastic con-stants are representative of actual rock properties. Calculating ve-locities from CPOs measured via EBSD provides advantages overthe PT technique in that measurements are not affected by the pres-ence of cracks, alteration, and low-pressure phases. That is to say,the effects of exhumation can be eliminated and the properties ofa rock in its original crack-free, alteration-free, high-pressure andhigh-temperature condition can be calculated.
Samples from the Funeral Mountains, Ruby Mountains and EHRmeasured by EBSD demonstrate that seismic anisotropy variesacross the Basin and Range because of changes in mineralogy andstrain. The slow P- and S-wave propagation directions are normalto the foliation in all three sections, and the velocity anisotropyshows either transverse isotropy or nearly so. This means little to noshear wave splitting for near-vertically incident body waves trans-mitted through crustal rocks with a subhorizontal foliation. As aresult, such locations are good places to measure mantle anisotropybecause crustal anisotropy is minimal in the vertical direction. Ve-locity anisotropy can be used to infer the flow plane, but not the flowdirection in typical crustal rocks: the Funeral Mountains has uniax-ial symmetry/transverse isotropy, and although the Ruby Mountainsand EHR have orthorhombic symmetry, the flow direction is markedby the fast axis in one mountain range and by the intermediate axisin the other mountain range.
A C K N OW L E D G E M E N T S
Funded by NSF grants EAR-0649933 and EAR-0745620. BarbaraJohn graciously provided the McDonough & Fountain (1993) sam-ples. Special thanks to Sarah Brownlee for providing the Matlabscript to integrate EDS and EBSD data and to Allen McGrew forhis geological maps of the Ruby–EHR area. Marty Giaramita, KeithHoward, Chris Mattinson, Allen McGrew, and Art Snoke gave help-ful advice regarding Basin and Range geology.
R E F E R E N C E S
Aleksandrov, K.S. & Ryzhova, T.V., 1961. The elastic properties of rock-forming minerals II: layered silicates, Bull. Acad. Sci. U.S.S.R., Geophys.Ser., 9, 1165–1168.
Aleksandrov, K.S., Alchikov, V.V., Belikov, B.P., Zaslavskii, B.I. & Krupnyi,A.I., 1974. Velocities of elastic waves in minerals at atmospheric pres-sure and increasing precision of elastic constants by means of EVM (inRussian), Bull. Acad. Sci. U.S.S.R., Geol. Ser., 10, 15–24.
Applegate, J.D.R. & Hodges, K.V., 1995. Mesozoic and Cenozoic extensionrecorded by metamorphic rocks in the Funeral Mountains, California,Geol. Soc. Am. Bull., 107(9), 1063–1076.
Babuska, V., Fiala, J., Kumazawa, M., Ohno, I. & Sumino, Y., 1978. Elasticproperties of garnet solid solution series, Phys. Earth planet. Inter., 16,157–176.
Barberini, V., Burlini, L. & Zappone, A., 2007. Elastic properties, fabric andseismic anisotropy of amphibolites and their contribution to the lowercrust reflectivity, Tectonophysics, 445, 227–244.
Barruol, G. & Kern, H., 1996. Seismic anisotropy and shear-wave splitting inlower-crustal and upper-mantle rocks from the Ivrea Zone: experimentaland calculated data, Phys. Earth planet. Inter., 95(3–4), 175–194.
Barth, N.C., Hacker, B.R., Seward, G.G.E., Walsh, E.O., Young, D. & John-ston, S., 2010. Strain within the ultrahigh-pressure Western Gneiss regionof Norway recorded by quartz CPOs, in Continental Tectonics and Moun-tain Building: The Legacy of Peach and Horne, Vol. 335, pp. 663–685,eds Law, R.D., Butler, R.W.H., Holdsworth, R.E., Krabbendam, M. &Strachan, R.A., Geological Society Special Publications.
Bass, J.D., 1995. Elasticity of minerals, glasses, and melts, in MineralPhysics and Crystallography: A Handbook of Physical Constants, Vol.2, pp. 45–63, ed. Ahrens, T.J., AGU Ref. Shelf, AGU.
Behn, M.D. & Kelemen, P.B., 2003. Relationship between seismic P-wavevelocity and the composition of anhydrous igneous and meta-igneousrocks, G-cubed, 4, article 1041.
Belikov, B.P., Aleksandrov, K.S. & Ryzova, T.V., 1970. Elastic Propertiesof Rock-forming Minerals and Rocks, Nauka Press.
Birch, F., 1960. The velocity of compressional waves in rocks to 10 kilobars,Part 21, published under the auspices of the Committee on ExperimentalGeology and Geophysics and the Department of Geological Sciences atHarvard University, J. geophys. Res., 66(7), 2199–2224.
Brown, J.M., Abramson, E.H. & Angel, R.J., 2007. Triclinic elastic constantsfor low albite, Phys. Chem. Miner., 33(4), 256–265.
Brownlee, S.J., Hacker, B.R., Salisbury, M., Seward, G., Little, T., Baldwin,S. & Abers, G.A., 2011. Predicted velocity and density structure of theexhuming Papua New Guinea ultrahigh-pressure terrane, J. geophys. Res.,116, B08206, doi:10.1029/2011JB008195.
Burlini, L. & Fountain, D.M., 1993. Seismic anisotropy of metapelites fromthe Ivrea-Verbano zone and Serie dei Laghi (northern Italy), Phys. Earthplanet. Inter., 78, 301–317.
Burlini, L., Arbaret, L., Zeilinger, G. & Burg, J.-P., 2005. High-temperatureand pressure seismic properties of a lower crustal prograde shear zonefrom the Kohistan Arc, Pakistan, in High-Strain Zones: Structure andPhysical Properties, Vol. 245, pp. 187–202, eds Bruhn, D. & Burlini, L.,Geological Society Special Publications.
Burlini, L., Marquer, D., Challandes, N., Mazzola, S. & Zangarini, N., 1998.Seismic properties of highly strained marbles from the Spluegenpass,Central Alps, J. Struct. Geol., 20(2–3), 277–292.
Christensen, N.I., 1965. Compressional wave velocities in metamorphicrocks at pressures to 10 kilobars, J. geophys. Res., 70, 6147–6166.
Christensen, N.I., 1984. The magnitude, symmetry, and origin of upper man-tle anisotropy based on fabric analyses of ultramafic tectonites, Geophys.J. R. Astr. Soc., 76, 89–111.
Christensen, N.I., 1996. Poisson’s ratio and crustal seismology, J. geophys.Res., 101(B2), 3139–3156.
Christensen, N.I. & Mooney, W.D., 1995. Seismic velocity structure andcomposition of the continental crust: a global view, J. Geophys. Res.,100, 9761–9788.
Collins, M.D. & Brown, J.M., 1998. Elasticity of an upper mantle clinopy-roxene, Phys. Chem. Miner., 26, 7–13.
Coney, P.J. & Harms, T.A., 1984. Cordilleran metamorphic core complexes:Cenozoic extensional relics of Mesozoic compression, Geology, 12, 550–554.
Crosson, R.S. & Lin, J.W., 1971. Voigt and Reuss prediction of anisotropicelasticity of dunite, Res. Lett., 76(6), 570–578.
Currie, C.A., Cassidy, J.F., Hyndman, R.D. & Bostock, M.G., 2004. Shearwave anisotropy beneath the Cascadia subduction zone and western NorthAmerican craton, Geophys. J. Int., 157, 341–353.
Dandekar, D.P., 1968. Variation of the elastic constants of calcite with tem-perature, J. appl. Phys., 39, 3694–3699.
Godfrey, N.J., Christensen, N.I. & Okaya, D.A., 2000. Anisotropy of schists:contribution of crustal anisotropy to active source seismic experiments
Dow
nloaded from https://academ
ic.oup.com/gji/article/195/2/1211/646782 by guest on 31 M
arch 2022
1228 Erdman et al.
and shear wave splitting observations, J. geophys. Res., 105(B12), 27 991–28 007.
Hacker, B.R. & Abers, G.A., 2004. Subduction Factory 3: an Ex-cel Worksheet and Macro for calculating the densities, seismic wavespeeds, and H2O contents of minerals and rocks at pressure and tem-perature, Geochem., Geophys., Geosyst., 5(1), Q01005, doi:10.1029/2003GC000614.
Hacker, B.R. & Abers, G.A., 2012. Subduction Factory 5. Unusually lowPoisson’s ratios in subduction zones from elastic anisotropy of peridotite,J. Geophys. Res., 117, B06308, doi:10.1029/2012JB009187.
Hasbrouck, W.P., 1964. A seismic reflection crustal study in central easternColorado, PhD thesis, Colorado School of Mines, Golden, CO.
Hauser, F., O’Reilly, B.M., Readman, P.W., Daly, J.S. & van den Berg, R.,2008. Constraints on crustal structure and composition within a conti-nental suture zone in the Irish Caledonides from shear wave wide-anglereflection data and lower crustal xenoliths, Geophys. J. Int., 175(3), 1254–1272.
Hearmon, R.F.S., 1984. The elastic constants of crystals and otheranisotropic materials, in Landolt-Bornstein Tables, III/18, pp. 1–154, edsHellwege, K.H. & Hellwege, A.M., Springer-Verlag.
Hearn, T.M., 1996. Anisotropic Pn tomography in the western United States,J. geophys. Res., 101(B4), 8403–8414.
Hodges, K.V. & Walker, J.D., 1990. Petrologic constraints on the unroofinghistory of the Funeral Mountains Metamorphic Core Complex, California,J. geophys. Res., 95, 8437–8445.
Hodges, K.V., Snoke, A.W. & Hurlow, H.A., 1992. Thermal evolution ofa portion of the Sevier hinterland: the northern Ruby Mountains–EastHumboldt Range and Wood Hills, northeastern Nevada, Tectonics, 11(1),154–164.
Holbrook, W.S., Mooney, W.D. & Christensen, N.I., 1992. The seismicvelocity structure of the deep continental crust, in Continental lower crust,Developments in Geotectonics, pp. 1–42, eds Fountain, D.M., Arculus, R.& Kay, R.W., Elsevier.
Howard, K.A., 2003. Crustal structure in the Elko-Carlin Region, Nevada,during Eocene gold mineralization: Ruby-East Humboldt metamorphiccore complex as a guide to the deep crust, Econ. Geol. Bull. Soc. Econ.Geol., 98(2), 249–268.
Hudec, M.R., 1992. Mesozoic structural and metamorphic history of thecentral Ruby Mountains metamorphic core complex, Nevada, Geol. Soc.Am. Bull., 104, 1086–1100.
Humbert, P. & Plique, F., 1972. Proprietes elastiques de carbonates rhom-bohedriques monocristallins calcite, magnesite, dolomite, C.R. Acad. Sci.Paris, 275, B391–B394.
Ivankina, T.I., Kern, H.M. & Nikitin, A.N., 2005. Directional dependenceof P- and S-wave propagation and polarization in foliated rocks fromthe Kola superdeep well: evidence from laboratory measurements andcalculations based on TOF neutron diffraction, Tectonophysics, 407,25–42.
Ji, S., Salisbury, M.H. & Hanmer, S., 1993. Petrofabric, P-wave anisotropyand seismic reflectivity of high-grade tectonites, Tectonophysics, 222(2),195–226.
Ji, S., Wang, Q. & Xia, B., 2002. Handbook of Seismic Properties of Miner-als, Rocks, and Ores, Polytechnic International Press.
Karato, S., Jung, H., Katayama, I. & Skemer, P., 2008. Geodynamic sig-nificance of seismic anisotropy of the upper mantle: new insights fromlaboratory studies, Ann. Rev. Earth planet. Stud., 36, 59–95.
Kern, H., Ivankina, T.I., Nikitin, A.N., Lokajicek, T. & Pros, Z., 2008. Theeffect of oriented microcracks and crystallographic and shape preferredorientation on bulk elastic anisotropy of a foliated biotite gneiss fromOutokumpu, Tectonophysics, 457, 143–149.
Kono, Y., Ishikawa, M., Yumiko, H., Katsuyoshi, M. & Makoto, A., 2009.P- and S-wave velocities of the lowermost crustal rocks from the Kohistanarc: Implications for seismic Moho discontinuity attributed to abundantgarnet, Tectonophysics, 467, 44–54.
Lloyd, G., Law, R.D. & Mainprice, D., 2010. Predicting seismic propertiesfrom three-dimensional microstructures: a new look at an old quartzite, inContinental Tectonics and Mountain Building: The Legacy of Peach andHorne, Vol. 335, pp. 601–620, eds Law, R.D., Butler, R.W.H., Holdsworth,
R.E., Krabbendam, M. & Strachan, R.A., Geological Society SpecialPublications.
Lloyd, G., Butler, R.W.H., Casey, M. & Mainprice, D., 2009. Mica, defor-mation fabrics and the seismic properties of the continental crust, Earthplanet. Sci. Lett., 228, 320–328.
Long, M.D. & Silver, P.G., 2008. The subduction zone flow field fromseismic anisotropy: a global view, Science, 319, 315–318.
Long, M.D. & Silver, P.G., 2009. Mantle flow in subduction systems: Thesubslab flow field and implications for mantle dynamics, J. geophys. Res.,114, B10312, doi:10.1029/2008JB006200.
Lakshtanov, D.L., Sinogeikin, S.V. & Bass, J.D., 2007. High-temperaturephase transitions and elasticity of silica polymorphs, Phys. Chem. Miner.,34, 11–22.
Lister, G.S. & Hobbs, B.E, 1980. The simulation of fabric developmentduring plastic deformation and its application to quartzite: the influenceof deformation history, J. Struct. Geol., 2(3), 355–370.
Lister, G.S., Paterson, M.S. & Hobbs, B.E., 1978. The simulation of fabricdevelopment in plastic deformation and its application to quartzite: themodel, Tectonophysics, 45, 107–158.
Mahan, K., 2006. Retrograde mica in deep crustal granulites: implica-tions for crustal seismic anisotropy, Geophys. Res. Lett., 33, L24301,doi:10.1029/2006GL028130.
Mainprice, D., 1990. A FORTRAN program to calculate seismic anisotropyfrom the lattice preferred orientation of minerals, Comput. Geosci., 16,385–393.
Mainprice, D. & Nicolas, A., 1989. Development of shape and lattice pre-ferred orientations: application to the seismic anisotropy of the lowercrust, J. Struct. Geol., 11, 175–189.
Mao, Z., Fuming, J. & Duffy, T.S., 2007. Single-crystal elasticity of zoisiteCa2Al3Si3O12(OH) by Brillouin scattering, Am. Mineral., 92, 570–576.
Mattinson, C.G., Colgan, J.P., Metcalf, J.R., Miller, E.L. & Wooden, J.L.,2007. Late Cretaceous to Paleocene metamorphism and magmatism in theFuneral Mountains metamorphic core complex, Death Valley, California,in Convergent Margin Terranes and Associated Regions: A Tribute toW. G. Ernst, Vol. 419, pp. 205–223, eds Cloos, M., Carlson, W.D., Gilbert,M.C., Liou, J.G. & Sorensen, S.S., Geological Society of America SpecialPaper.
McDonough, D.T. & Fountain, D.M., 1993. P-wave anisotropy of myloniticand infrastructural rocks from a Cordilleran core complex: the Ruby-East Humboldt Range, Nevada, Phys. Earth planet. Inter., 78(3–4), 319–336.
McGrew, A.J., Peters, M.T. & Wright, J.E., 2000. Thermobarometric con-straints on the tectonothermal evolution of the East Humboldt Rangemetamorphic core complex, Nevada, Geol. Soc. Am. Bull., 112, 45–60.
McNamara, D. & Owens, T., 1993. Azimuthal shear wave velocity anisotropyin the Basin and Range province using Moho Ps converted phases,J. geophys. Res., 98(B7), 12 003–12 017.
Meissner, R., Rabbel, W. & Kern, H., 2006. Seismic lamination andanisotropy of the lower continental crust, Tectonophysics, 416, 81–99.
Mehl, L., Hacker, B.R. & Hirth, G., 2003. Arc-parallel flow within themantle wedge: evidence from the accreted Talkeetna arc, south centralAlaska, J. geophys. Res., 108(B8), 2375, doi:10.1029/2002JB002233.
Meltzer, A. & Christensen, N., 2001. Nanga Parbat crustal anisotropy: im-plications for interpretation of crustal velocity structure and shear-wavesplitting, Geophys. Res. Lett., 28(10), 2129–2132.
Moschetti, M.P., 2010. Seismic evidence for widespread western-US deep-crustal deformation caused by extension, Nature, 464(7290), 885–889.
Nicolas, A. & Christensen, N.I., 1987. Formation of anisotropy in uppermantle peridotites: A review, in Composition, Structure and Dynamicsof the Lithosphere-Asthenosphere System, pp. 111–123, eds Fuchs, K. &Froideveaux, C., American Geophysical Union.
Passchier, C.W. & Trouw, R.A.J., 1996. Microtectonics, Springer-Verlag.Pakiser, L.C. & Robinson, R., 1966. Composition and evolution of the
continental crust as suggested by seismic observations, Tectonophysics,3, 547–557.
Porter, R., Zandt, G. & McQuarrie, N., 2011. Pervasive lower-crustal seismicanisotropy in Southern California: evidence for underplated schists andactive tectonics, Lithosphere, 3, 201–220.
Dow
nloaded from https://academ
ic.oup.com/gji/article/195/2/1211/646782 by guest on 31 M
arch 2022
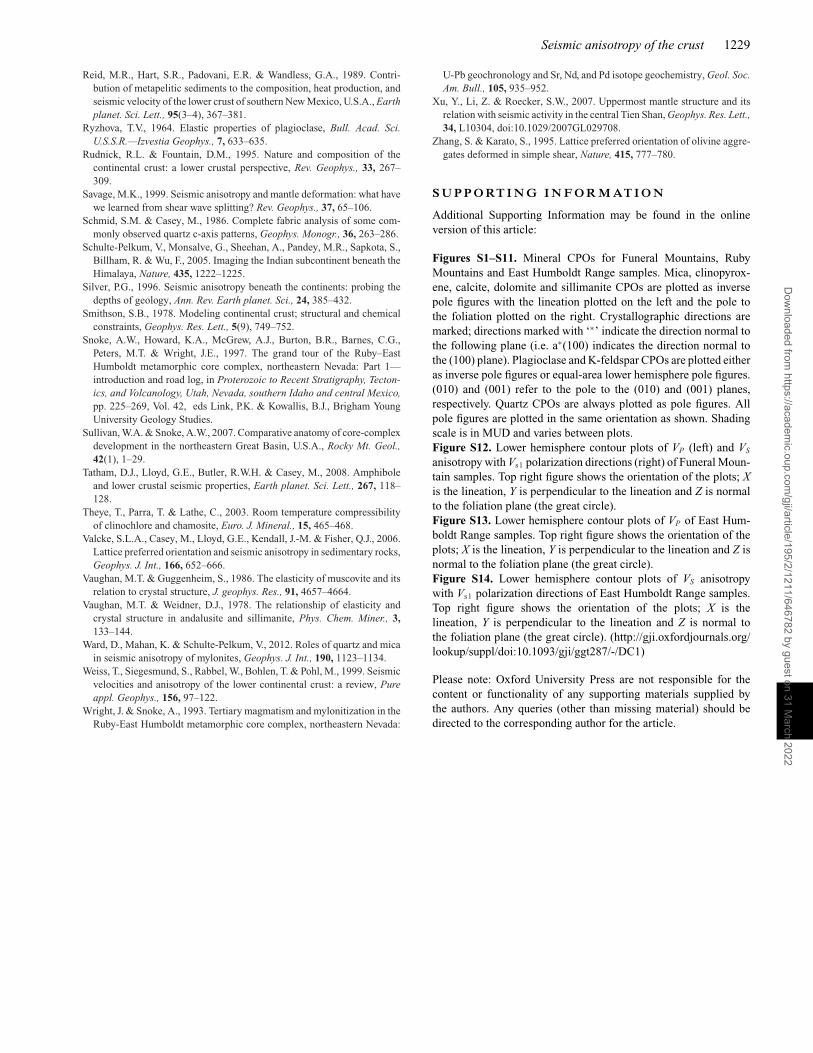
Seismic anisotropy of the crust 1229
Reid, M.R., Hart, S.R., Padovani, E.R. & Wandless, G.A., 1989. Contri-bution of metapelitic sediments to the composition, heat production, andseismic velocity of the lower crust of southern New Mexico, U.S.A., Earthplanet. Sci. Lett., 95(3–4), 367–381.
Ryzhova, T.V., 1964. Elastic properties of plagioclase, Bull. Acad. Sci.U.S.S.R.—Izvestia Geophys., 7, 633–635.
Rudnick, R.L. & Fountain, D.M., 1995. Nature and composition of thecontinental crust: a lower crustal perspective, Rev. Geophys., 33, 267–309.
Savage, M.K., 1999. Seismic anisotropy and mantle deformation: what havewe learned from shear wave splitting? Rev. Geophys., 37, 65–106.
Schmid, S.M. & Casey, M., 1986. Complete fabric analysis of some com-monly observed quartz c-axis patterns, Geophys. Monogr., 36, 263–286.
Schulte-Pelkum, V., Monsalve, G., Sheehan, A., Pandey, M.R., Sapkota, S.,Billham, R. & Wu, F., 2005. Imaging the Indian subcontinent beneath theHimalaya, Nature, 435, 1222–1225.
Silver, P.G., 1996. Seismic anisotropy beneath the continents: probing thedepths of geology, Ann. Rev. Earth planet. Sci., 24, 385–432.
Smithson, S.B., 1978. Modeling continental crust; structural and chemicalconstraints, Geophys. Res. Lett., 5(9), 749–752.
Snoke, A.W., Howard, K.A., McGrew, A.J., Burton, B.R., Barnes, C.G.,Peters, M.T. & Wright, J.E., 1997. The grand tour of the Ruby–EastHumboldt metamorphic core complex, northeastern Nevada: Part 1—introduction and road log, in Proterozoic to Recent Stratigraphy, Tecton-ics, and Volcanology, Utah, Nevada, southern Idaho and central Mexico,pp. 225–269, Vol. 42, eds Link, P.K. & Kowallis, B.J., Brigham YoungUniversity Geology Studies.
Sullivan, W.A. & Snoke, A.W., 2007. Comparative anatomy of core-complexdevelopment in the northeastern Great Basin, U.S.A., Rocky Mt. Geol.,42(1), 1–29.
Tatham, D.J., Lloyd, G.E., Butler, R.W.H. & Casey, M., 2008. Amphiboleand lower crustal seismic properties, Earth planet. Sci. Lett., 267, 118–128.
Theye, T., Parra, T. & Lathe, C., 2003. Room temperature compressibilityof clinochlore and chamosite, Euro. J. Mineral., 15, 465–468.
Valcke, S.L.A., Casey, M., Lloyd, G.E., Kendall, J.-M. & Fisher, Q.J., 2006.Lattice preferred orientation and seismic anisotropy in sedimentary rocks,Geophys. J. Int., 166, 652–666.
Vaughan, M.T. & Guggenheim, S., 1986. The elasticity of muscovite and itsrelation to crystal structure, J. geophys. Res., 91, 4657–4664.
Vaughan, M.T. & Weidner, D.J., 1978. The relationship of elasticity andcrystal structure in andalusite and sillimanite, Phys. Chem. Miner., 3,133–144.
Ward, D., Mahan, K. & Schulte-Pelkum, V., 2012. Roles of quartz and micain seismic anisotropy of mylonites, Geophys. J. Int., 190, 1123–1134.
Weiss, T., Siegesmund, S., Rabbel, W., Bohlen, T. & Pohl, M., 1999. Seismicvelocities and anisotropy of the lower continental crust: a review, Pureappl. Geophys., 156, 97–122.
Wright, J. & Snoke, A., 1993. Tertiary magmatism and mylonitization in theRuby-East Humboldt metamorphic core complex, northeastern Nevada:
U-Pb geochronology and Sr, Nd, and Pd isotope geochemistry, Geol. Soc.Am. Bull., 105, 935–952.
Xu, Y., Li, Z. & Roecker, S.W., 2007. Uppermost mantle structure and itsrelation with seismic activity in the central Tien Shan, Geophys. Res. Lett.,34, L10304, doi:10.1029/2007GL029708.
Zhang, S. & Karato, S., 1995. Lattice preferred orientation of olivine aggre-gates deformed in simple shear, Nature, 415, 777–780.
S U P P O RT I N G I N F O R M AT I O N
Additional Supporting Information may be found in the onlineversion of this article:
Figures S1–S11. Mineral CPOs for Funeral Mountains, RubyMountains and East Humboldt Range samples. Mica, clinopyrox-ene, calcite, dolomite and sillimanite CPOs are plotted as inversepole figures with the lineation plotted on the left and the pole tothe foliation plotted on the right. Crystallographic directions aremarked; directions marked with ‘∗’ indicate the direction normal tothe following plane (i.e. a∗(100) indicates the direction normal tothe (100) plane). Plagioclase and K-feldspar CPOs are plotted eitheras inverse pole figures or equal-area lower hemisphere pole figures.(010) and (001) refer to the pole to the (010) and (001) planes,respectively. Quartz CPOs are always plotted as pole figures. Allpole figures are plotted in the same orientation as shown. Shadingscale is in MUD and varies between plots.Figure S12. Lower hemisphere contour plots of VP (left) and VS
anisotropy with Vs1 polarization directions (right) of Funeral Moun-tain samples. Top right figure shows the orientation of the plots; Xis the lineation, Y is perpendicular to the lineation and Z is normalto the foliation plane (the great circle).Figure S13. Lower hemisphere contour plots of VP of East Hum-boldt Range samples. Top right figure shows the orientation of theplots; X is the lineation, Y is perpendicular to the lineation and Z isnormal to the foliation plane (the great circle).Figure S14. Lower hemisphere contour plots of VS anisotropywith Vs1 polarization directions of East Humboldt Range samples.Top right figure shows the orientation of the plots; X is thelineation, Y is perpendicular to the lineation and Z is normal tothe foliation plane (the great circle). (http://gji.oxfordjournals.org/lookup/suppl/doi:10.1093/gji/ggt287/-/DC1)
Please note: Oxford University Press are not responsible for thecontent or functionality of any supporting materials supplied bythe authors. Any queries (other than missing material) should bedirected to the corresponding author for the article.
Dow
nloaded from https://academ
ic.oup.com/gji/article/195/2/1211/646782 by guest on 31 M
arch 2022


