Embed Size (px)
Citation preview
Sensitivity Analysis of Online Oil Quality Monitoring for EarlyDetection of Water Ingress in Marine Propulsion Systems
Andreas Klausen1, Johannes Kalaoja2, Surya Teja Kandukuri3, and Kjell G. Robbersmyr 4
1,2,3,4 Dept. of Engineering Sciences, University of Agder, Jon Lilletuns vei 9, Grimstad, Norway [email protected], [email protected], [email protected]
ABSTRACT
Gearboxes are critical equipment in the vessel propulsionsystem. Lubrication contamination caused by water ingressor condensation is one of the major failure modes in marinegearboxes leading to accelerated aging of lubricant, resultingin accelerated wear of gearbox components such as bearingand gears. This article presents a systematic evaluation ofmoisture ingress sensitivity of three commercial online oilquality monitoring sensors. A laboratory setup consistingof an industrial multi-stage planetary gearbox is utilised forthe experimental studies. Furthermore, the gearbox vibrationsignatures are analysed to investigate the sensitivity of vibra-tion measurements to water ingress to determine the need foroil quality monitoring when considering this specific failuremode.
1. INTRODUCTION
Gearboxes are critical components in marine propulsion sys-tems. Gearbox failures can result in significant breakdownand towage costs that can potentially lead to millions of USdollars in loss (The Swedish Club, 2018). In many cases,repair of propulsion gearboxes in ships requires dry-dockingand hull teardown to access the equipment, and thus the re-pairs are time-taking, resulting in longer downtimes. There-fore, condition monitoring of gearboxes is an important as-pect to ensure reliable and economical vessel operations.
Gearboxes can fail in several ways; for instance, faulty bear-ings (Feng, Ma, & Zuo, 2016) and wear on gear teeth (Cao,Zhang, Wang, Wang, & Peng, 2019) can result in breakdown.These faults can be detected by means of non-invasive tech-niques using vibration monitoring (Singh & Parey, 2019),motor current measurement (Feng, Chen, & Zuo, 2019) oracoustic emission (Elasha, Greaves, Mba, & Fang, 2017).However, the oil itself can be analysed to detect early stagefaults in the gearbox as the material dislodged due to wear
Andreas Klausen et al. This is an open-access article distributed under theterms of the Creative Commons Attribution 3.0 United States License, whichpermits unrestricted use, distribution, and reproduction in any medium, pro-vided the original author and source are credited.
accumulates in the lubricant. In fact, oil debris monitoring(ODM) can detect wear and chipping of gears with an ac-curacy comparable to that of vibration signatures, with anadvantage of being insensitive to load variations (Dempsey,2000). Typically, the vessels conduct an accurate oil qual-ity assessment offline at a laboratory by sending a sample(Sheng, 2016; Liu, Liu, Xie, & Yao, 2000). However, this islargely inadequate for early fault detection and failure preven-tion as the faults can progress significantly before the resultsare obtained.
Today, there are several commercial sensors that can be in-stalled either in a so-called kidney loop or in the oil sump,to detect these ferrous or non-ferrous debris as well as otherparticulate and fluid contaminants in oil (Zhu, Zhong, & Zhe,2017). Online oil quality assessment for rotating machineryhas received considerable attention in research as well as inthe industry. Sheng (Sheng, 2016) analysed the efficiencyof using online monitoring of ferrous and non-ferrous de-bris in wind turbine gearboxes. Myshkin et al. (Myshkin &Markova, 2018) studied optical debris monitoring in indus-trial applications for detection of ferrous debris. Dempsey etal. (Dempsey & Afjeh, 2002) developed an integrated mon-itoring system using wear debris measurement and vibrationanalysis for gear health monitoring using fuzzy logic classi-fier. However, moisture detection is relatively less addressedand hence the central topic of this article.
Water in oil is one of the most destructive contaminants tolubrication (Lancaster, 1990). Water can enter the oil from avariety of sources such as a humid environment (Cen, Morina,Neville, Pasaribu, & Nedelcu, 2012), absorption and conden-sation (Cen et al., 2012). Water ingress (Soltanahmadi, Mo-rina, van Eijk, Nedelcu, & Neville, 2017; Hamilton & Quail,2011) cause the efficiency of the oil to diminish, reduce filmproduction and lead to corrosion (Hamilton & Quail, 2011).With diminished oil quality, wear on bearing and gear sur-faces accelerate significantly (Schatzberg, 1971). Hence, it isimportant to detect water in the oil to avoid accelerated fail-ure.
In this paper, three different commercially available sensors
1
EUROPEAN CONFERENCE OF THE PROGNOSTICS AND HEALTH MANAGEMENT SOCIETY 2020
Table 1. Electromagnetic properties of oil and water (Lenntech, 2020; Archer & Wang, 1990; Engineering Toolbox, 2016;Bock, 2014).
Materials Electrical conductivity Relative permeability Dielectric constantMineral oil 6 · 10−12 S/m ∼ 1 2.1− 2.4Water 0.0005− 0.05 S/m 0.999902 87.9(0°C)− 55.5(100°C)
are tested for their ability to detect water in the oil besidesother contaminants. These sensors operate based on differentmeasurement methods: magnetic, electrical impedance andinductive sensing. The aim is to determine the solution ofthe three tested sensors that has highest sensitivity for wateringress. In addition, the effect of water ingress on the vibra-tion signature is also studied. Changes in vibration signaturein a fixed-axis gearbox was reported in (Brethee, Gu, & Ball,2017), but the results indicate low sensitivity to diagnose wa-ter ingress. Here, the vibration changes will be analysed ona planetary gearbox rather than a fixed-axis one. The objec-tive of this analysis is to determine a minimal sensor suite todetect failures in gearboxes in addition to lubrication contam-ination.
The rest of the paper is organized as follows. The effectof water in oil is briefly discussed in Section 2. Section 3introduces the test setup and the sensors involved for mea-suring the water ingress. The following Section 4 explainsthe methodology used for performing the tests. Results anddiscussions are given in Section 5. Finally, conclusions aredrawn in Section 6.
2. WATER IN OIL
Water in oil is considered to be one of the most destruc-tive contaminants resulting in failure of film formation be-tween metallic contacts. A high amount of moisture con-tent in oils can result in oxidation of oil, hydrogen genera-tion, corrosion, and accelerated wear of metal components.In the case of bearings, it was found to be the second mostdestructive lubrication contaminant for bearings resulting inreduction of bearing life by more than 100 times (Fitch &Jaggernauth, 1994). While oils are hygroscopic in nature andabsorb a small amount of moisture from atmosphere, the ma-rine water ingress, either as dissolved, from condensation,free water, or leaks, can be particularly detrimental to the ro-tating machinery due to dissolved salts. Free water formsan emulsion which decreases lubricant load carrying capacity(Stachowiak & Batchelor, 2013). Saturation limits depend onchemical characteristics of the oil, additives, the oil condi-tion (Needelman, Barris, LaVallee, et al., 2009), and the en-vironment such as temperature and relative humidity (Troyer,1998; Day & Bauer, 2007). For a detailed insight into the tri-bological aspects of water in oil, the interested reader can re-fer to (Cantley, 1977). Besides, the presence of water changesthe oil film quality in gear contacts, hence making it inter-
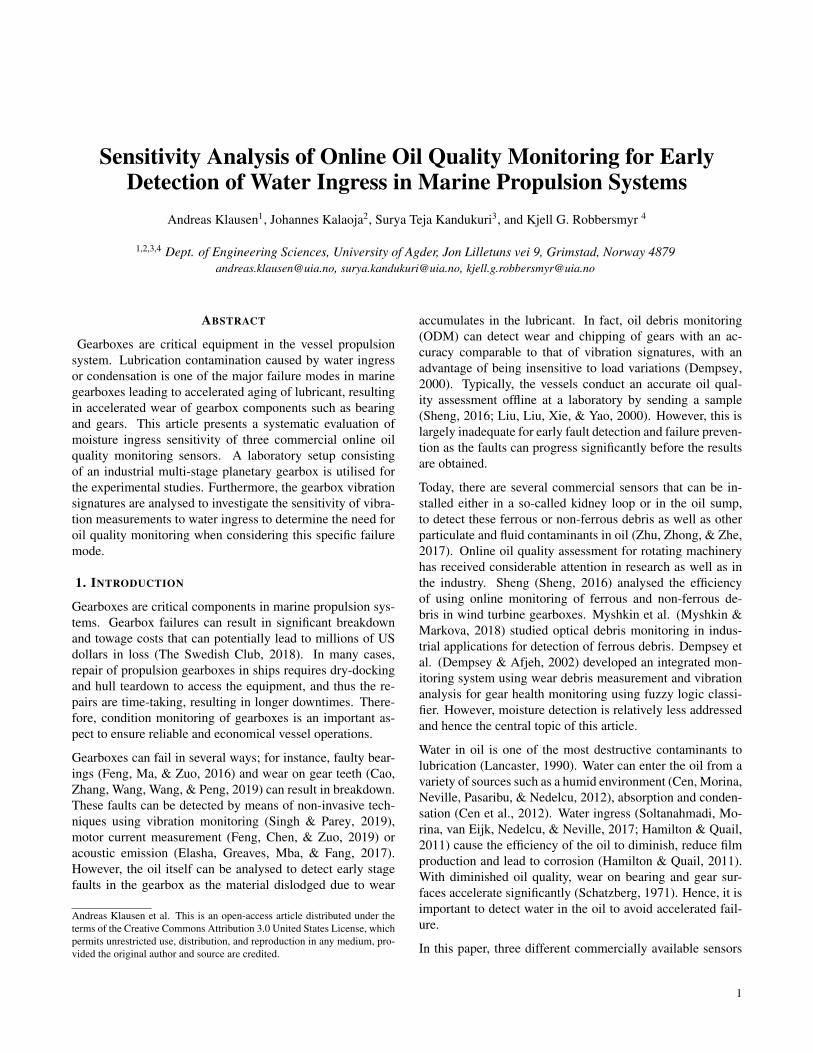
Figure 1. Commercial magnetic oil quality sensor. Courtesy:Gill SC (Limited, 2018).
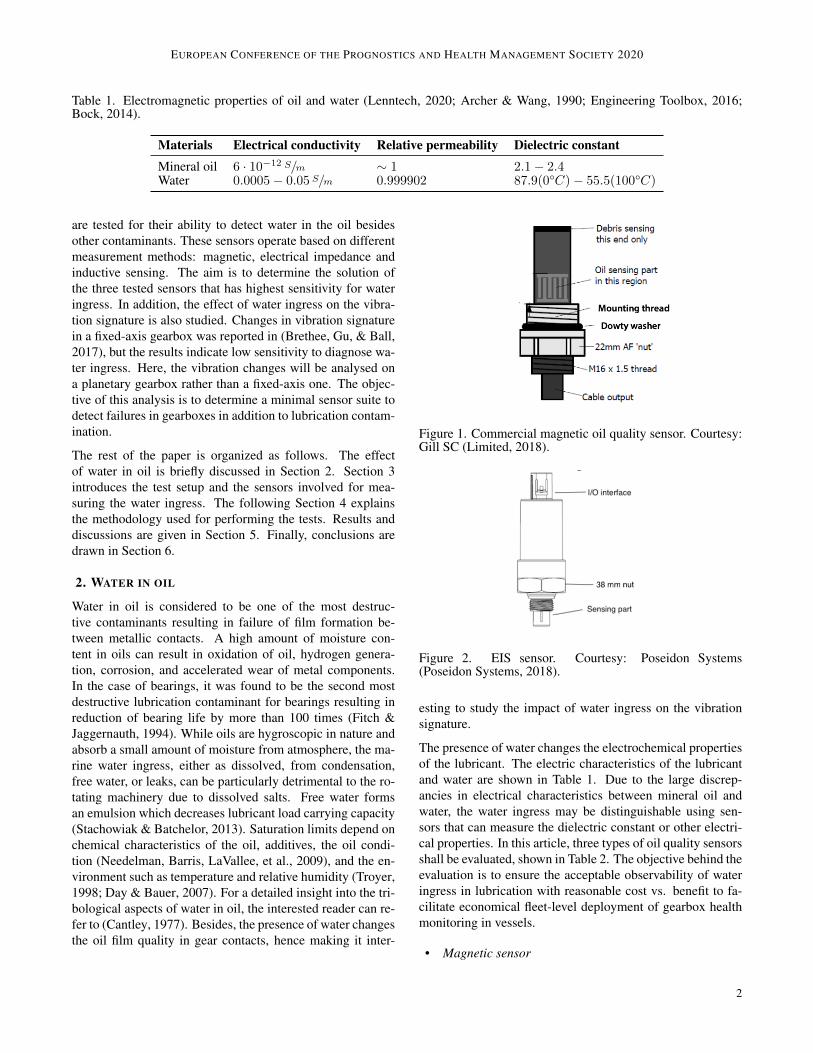
Figure 2. EIS sensor. Courtesy: Poseidon Systems(Poseidon Systems, 2018).
esting to study the impact of water ingress on the vibrationsignature.
The presence of water changes the electrochemical propertiesof the lubricant. The electric characteristics of the lubricantand water are shown in Table 1. Due to the large discrep-ancies in electrical characteristics between mineral oil andwater, the water ingress may be distinguishable using sen-sors that can measure the dielectric constant or other electri-cal properties. In this article, three types of oil quality sensorsshall be evaluated, shown in Table 2. The objective behind theevaluation is to ensure the acceptable observability of wateringress in lubrication with reasonable cost vs. benefit to fa-cilitate economical fleet-level deployment of gearbox healthmonitoring in vessels.
• Magnetic sensor
2
EUROPEAN CONFERENCE OF THE PROGNOSTICS AND HEALTH MANAGEMENT SOCIETY 2020
Table 2. Oil quality sensors in testing.
# Manufacturer Part no. Product description1 Gill 4212-00-038 Magnetic oil condition sensor2 Poseidon Trident QW3100 PS-0113-0200 Electrical impedance sensor for oil contamination3 Parker Kittiwake AS-K19551-KW Inductive coil sensor for metallic wear debris detection
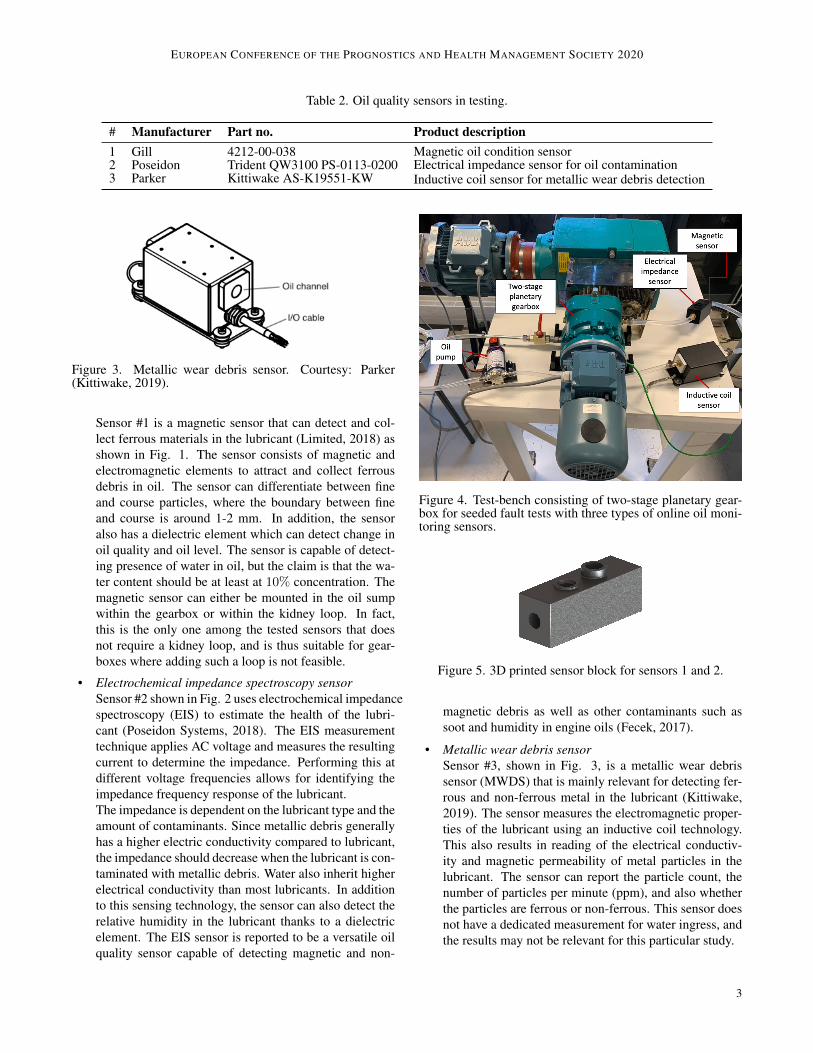
Figure 3. Metallic wear debris sensor. Courtesy: Parker(Kittiwake, 2019).
Sensor #1 is a magnetic sensor that can detect and col-lect ferrous materials in the lubricant (Limited, 2018) asshown in Fig. 1. The sensor consists of magnetic andelectromagnetic elements to attract and collect ferrousdebris in oil. The sensor can differentiate between fineand course particles, where the boundary between fineand course is around 1-2 mm. In addition, the sensoralso has a dielectric element which can detect change inoil quality and oil level. The sensor is capable of detect-ing presence of water in oil, but the claim is that the wa-ter content should be at least at 10% concentration. Themagnetic sensor can either be mounted in the oil sumpwithin the gearbox or within the kidney loop. In fact,this is the only one among the tested sensors that doesnot require a kidney loop, and is thus suitable for gear-boxes where adding such a loop is not feasible.
• Electrochemical impedance spectroscopy sensorSensor #2 shown in Fig. 2 uses electrochemical impedancespectroscopy (EIS) to estimate the health of the lubri-cant (Poseidon Systems, 2018). The EIS measurementtechnique applies AC voltage and measures the resultingcurrent to determine the impedance. Performing this atdifferent voltage frequencies allows for identifying theimpedance frequency response of the lubricant.The impedance is dependent on the lubricant type and theamount of contaminants. Since metallic debris generallyhas a higher electric conductivity compared to lubricant,the impedance should decrease when the lubricant is con-taminated with metallic debris. Water also inherit higherelectrical conductivity than most lubricants. In additionto this sensing technology, the sensor can also detect therelative humidity in the lubricant thanks to a dielectricelement. The EIS sensor is reported to be a versatile oilquality sensor capable of detecting magnetic and non-
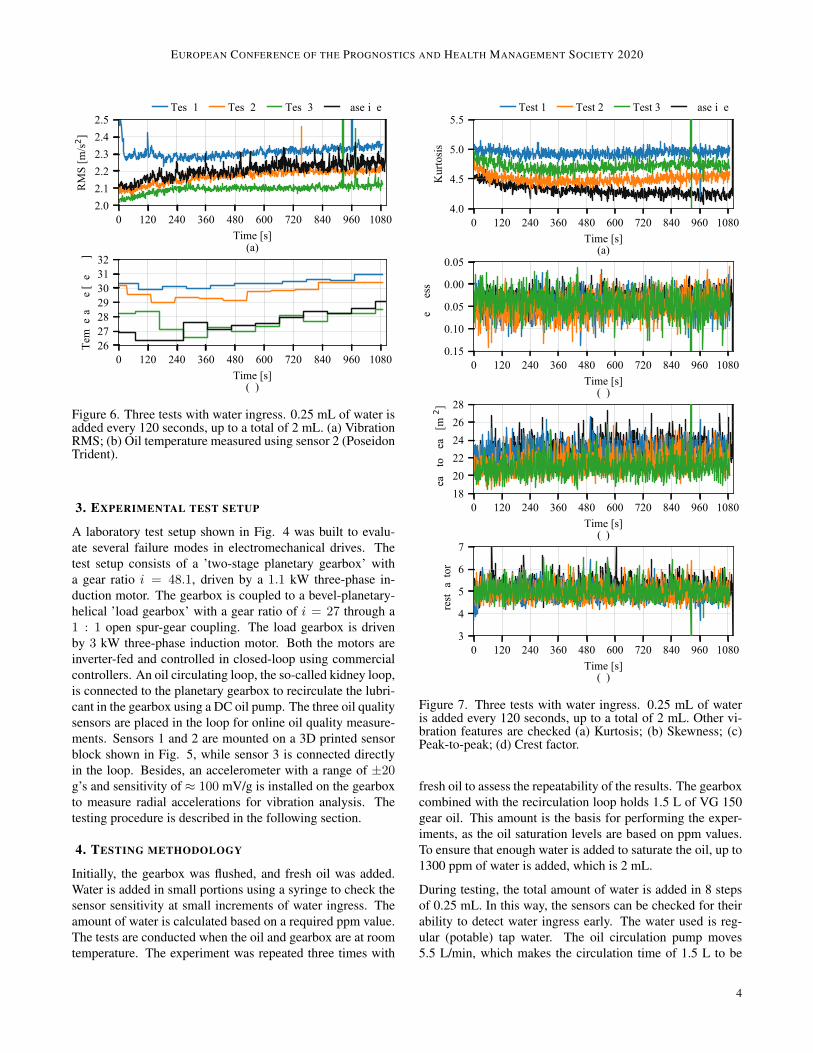
Figure 4. Test-bench consisting of two-stage planetary gear-box for seeded fault tests with three types of online oil moni-toring sensors.
Figure 5. 3D printed sensor block for sensors 1 and 2.
magnetic debris as well as other contaminants such assoot and humidity in engine oils (Fecek, 2017).
• Metallic wear debris sensorSensor #3, shown in Fig. 3, is a metallic wear debrissensor (MWDS) that is mainly relevant for detecting fer-rous and non-ferrous metal in the lubricant (Kittiwake,2019). The sensor measures the electromagnetic proper-ties of the lubricant using an inductive coil technology.This also results in reading of the electrical conductiv-ity and magnetic permeability of metal particles in thelubricant. The sensor can report the particle count, thenumber of particles per minute (ppm), and also whetherthe particles are ferrous or non-ferrous. This sensor doesnot have a dedicated measurement for water ingress, andthe results may not be relevant for this particular study.
3
EUROPEAN CONFERENCE OF THE PROGNOSTICS AND HEALTH MANAGEMENT SOCIETY 2020
� ��� �� ��� � ��� ��� � ��� �� �������"�
����������������
������
�"2 �
���
��"#�� ��"#�� ��"#�� ��"�����
� ��� �� ��� � ��� ��� � ��� �� �������"�
����� ��������
��� �!�#$!����
�����
���
Figure 6. Three tests with water ingress. 0.25 mL of water isadded every 120 seconds, up to a total of 2 mL. (a) VibrationRMS; (b) Oil temperature measured using sensor 2 (PoseidonTrident).
3. EXPERIMENTAL TEST SETUP
A laboratory test setup shown in Fig. 4 was built to evalu-ate several failure modes in electromechanical drives. Thetest setup consists of a ’two-stage planetary gearbox’ witha gear ratio i = 48.1, driven by a 1.1 kW three-phase in-duction motor. The gearbox is coupled to a bevel-planetary-helical ’load gearbox’ with a gear ratio of i = 27 through a1 : 1 open spur-gear coupling. The load gearbox is drivenby 3 kW three-phase induction motor. Both the motors areinverter-fed and controlled in closed-loop using commercialcontrollers. An oil circulating loop, the so-called kidney loop,is connected to the planetary gearbox to recirculate the lubri-cant in the gearbox using a DC oil pump. The three oil qualitysensors are placed in the loop for online oil quality measure-ments. Sensors 1 and 2 are mounted on a 3D printed sensorblock shown in Fig. 5, while sensor 3 is connected directlyin the loop. Besides, an accelerometer with a range of ±20g’s and sensitivity of ≈ 100 mV/g is installed on the gearboxto measure radial accelerations for vibration analysis. Thetesting procedure is described in the following section.
4. TESTING METHODOLOGY
Initially, the gearbox was flushed, and fresh oil was added.Water is added in small portions using a syringe to check thesensor sensitivity at small increments of water ingress. Theamount of water is calculated based on a required ppm value.The tests are conducted when the oil and gearbox are at roomtemperature. The experiment was repeated three times with
� ��� �� �� �� ��� �� �� ��� ������!���&�
��
��
���
���
�(%
'#&�&
���
��&'�� ��&'�� ��&'� ��&� �"�
� ��� �� �� �� ��� �� �� ��� ������!���&�
*����
*����
*����
����
����
���)
"�&&
���
� ��� �� �� �� ��� �� �� ��� ������!���&�
�����������
����
�'#�$
����
�!�2
�
���
� ��� �� �� �� ��� �� �� ��� ������!���&�
�
�
�%�&
'����
'#%
���
Figure 7. Three tests with water ingress. 0.25 mL of wateris added every 120 seconds, up to a total of 2 mL. Other vi-bration features are checked (a) Kurtosis; (b) Skewness; (c)Peak-to-peak; (d) Crest factor.
fresh oil to assess the repeatability of the results. The gearboxcombined with the recirculation loop holds 1.5 L of VG 150gear oil. This amount is the basis for performing the exper-iments, as the oil saturation levels are based on ppm values.To ensure that enough water is added to saturate the oil, up to1300 ppm of water is added, which is 2 mL.
During testing, the total amount of water is added in 8 stepsof 0.25 mL. In this way, the sensors can be checked for theirability to detect water ingress early. The water used is reg-ular (potable) tap water. The oil circulation pump moves5.5 L/min, which makes the circulation time of 1.5 L to be
4
EUROPEAN CONFERENCE OF THE PROGNOSTICS AND HEALTH MANAGEMENT SOCIETY 2020
� � ��� �� ��� �� ��� �� ��� �� �� � ���������� �� !�
�����
����
�����
����
�����
����
�����
�������
��
���
���� ���� ������� �������
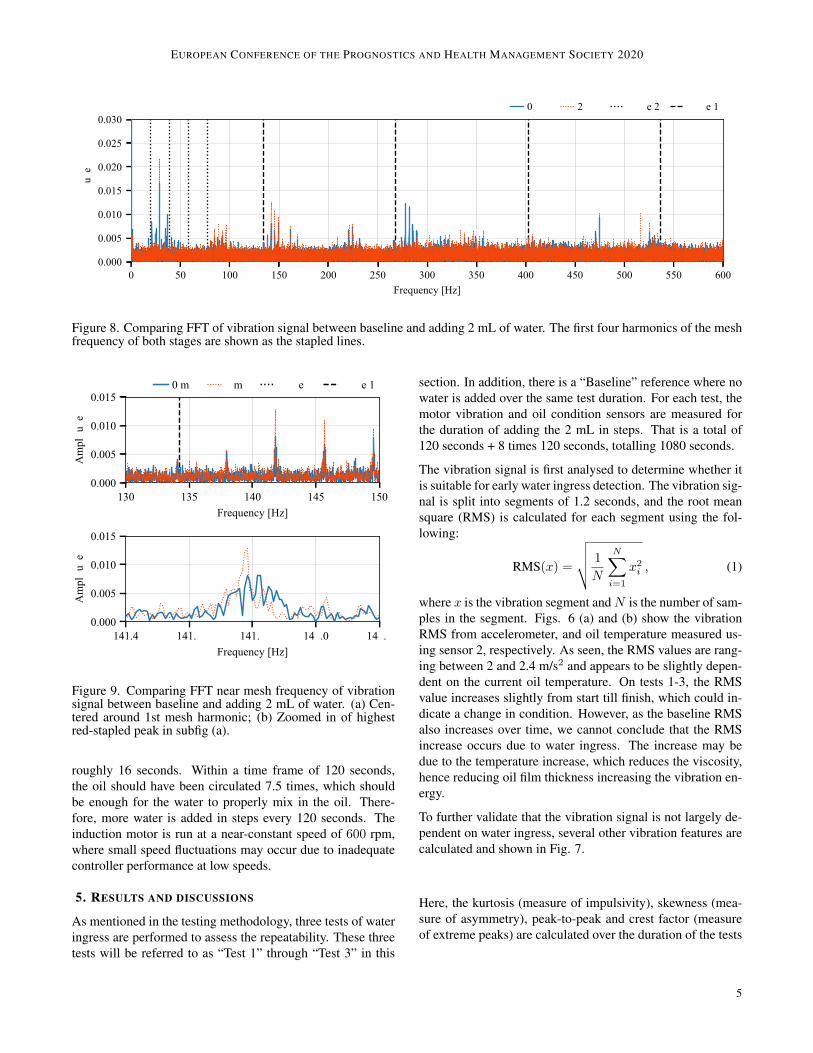
Figure 8. Comparing FFT of vibration signal between baseline and adding 2 mL of water. The first four harmonics of the meshfrequency of both stages are shown as the stapled lines.
��� �� ��� �� �� ���!���"���#�
�����
����
�����
����
��
��� !
��
���
���� ���� � ����� � �����
����� ���� ����� ����� ����� ���!���"���#�
�����
����
�����
����
��
��� !
��
���
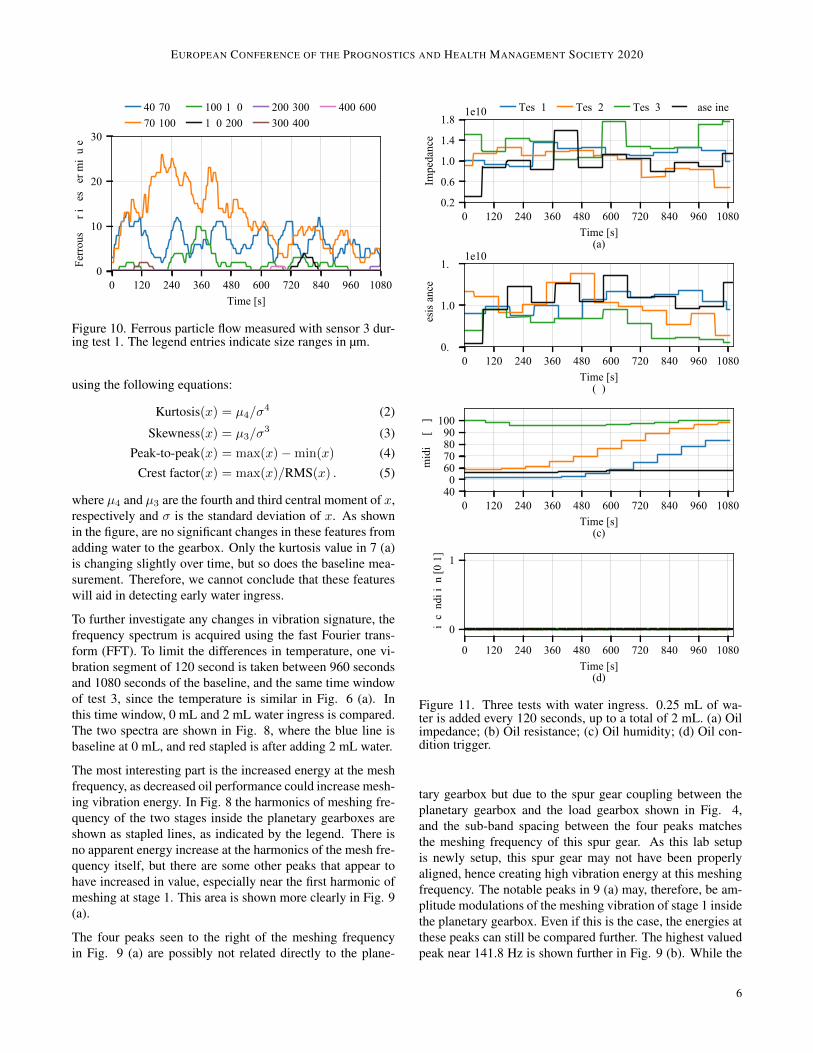
Figure 9. Comparing FFT near mesh frequency of vibrationsignal between baseline and adding 2 mL of water. (a) Cen-tered around 1st mesh harmonic; (b) Zoomed in of highestred-stapled peak in subfig (a).
roughly 16 seconds. Within a time frame of 120 seconds,the oil should have been circulated 7.5 times, which shouldbe enough for the water to properly mix in the oil. There-fore, more water is added in steps every 120 seconds. Theinduction motor is run at a near-constant speed of 600 rpm,where small speed fluctuations may occur due to inadequatecontroller performance at low speeds.
5. RESULTS AND DISCUSSIONS
As mentioned in the testing methodology, three tests of wateringress are performed to assess the repeatability. These threetests will be referred to as “Test 1” through “Test 3” in this
section. In addition, there is a “Baseline” reference where nowater is added over the same test duration. For each test, themotor vibration and oil condition sensors are measured forthe duration of adding the 2 mL in steps. That is a total of120 seconds + 8 times 120 seconds, totalling 1080 seconds.
The vibration signal is first analysed to determine whether itis suitable for early water ingress detection. The vibration sig-nal is split into segments of 1.2 seconds, and the root meansquare (RMS) is calculated for each segment using the fol-lowing:
RMS(x) =
√√√√ 1
N
N∑i=1
x2i , (1)
where x is the vibration segment andN is the number of sam-ples in the segment. Figs. 6 (a) and (b) show the vibrationRMS from accelerometer, and oil temperature measured us-ing sensor 2, respectively. As seen, the RMS values are rang-ing between 2 and 2.4 m/s2 and appears to be slightly depen-dent on the current oil temperature. On tests 1-3, the RMSvalue increases slightly from start till finish, which could in-dicate a change in condition. However, as the baseline RMSalso increases over time, we cannot conclude that the RMSincrease occurs due to water ingress. The increase may bedue to the temperature increase, which reduces the viscosity,hence reducing oil film thickness increasing the vibration en-ergy.
To further validate that the vibration signal is not largely de-pendent on water ingress, several other vibration features arecalculated and shown in Fig. 7.
Here, the kurtosis (measure of impulsivity), skewness (mea-sure of asymmetry), peak-to-peak and crest factor (measureof extreme peaks) are calculated over the duration of the tests
5
EUROPEAN CONFERENCE OF THE PROGNOSTICS AND HEALTH MANAGEMENT SOCIETY 2020
� ��� ��� ��� �� ��� �� �� ��� ��� �������
�
��
��
��
�����
���������
�����
����
�����
���������
��������������
��������������
�������
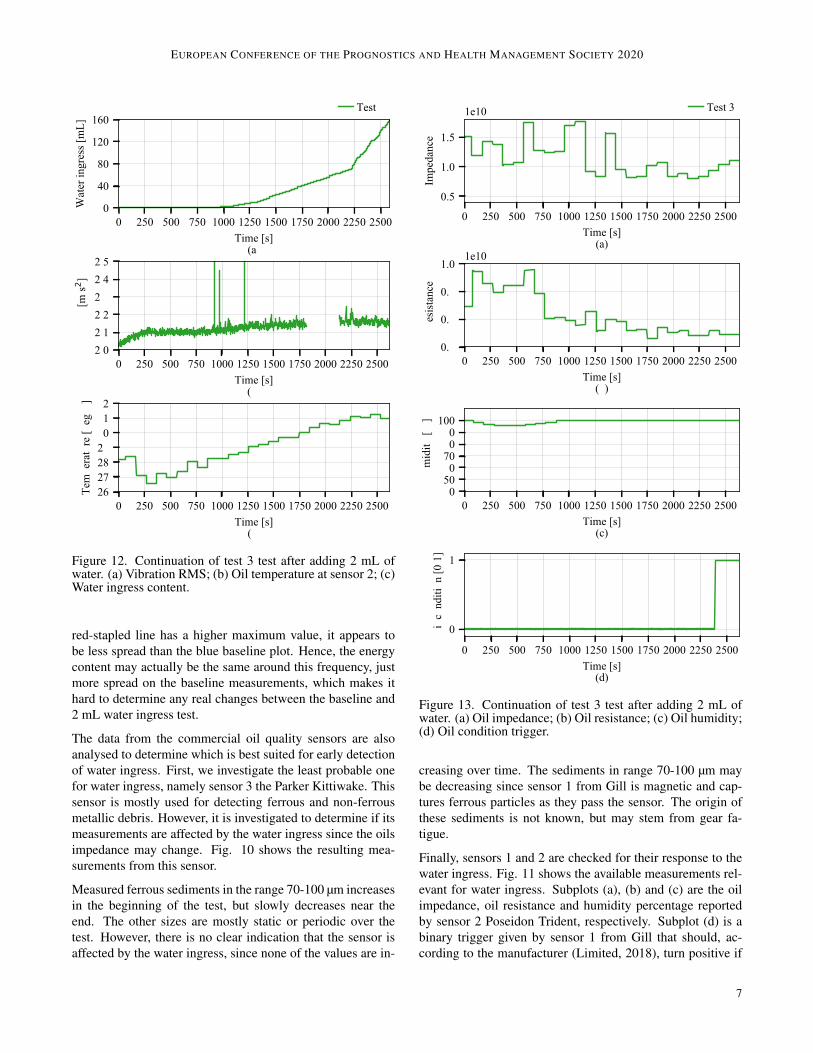
Figure 10. Ferrous particle flow measured with sensor 3 dur-ing test 1. The legend entries indicate size ranges in µm.
using the following equations:
Kurtosis(x) = µ4/σ4 (2)
Skewness(x) = µ3/σ3 (3)
Peak-to-peak(x) = max(x)−min(x) (4)Crest factor(x) = max(x)/RMS(x) . (5)
where µ4 and µ3 are the fourth and third central moment of x,respectively and σ is the standard deviation of x. As shownin the figure, are no significant changes in these features fromadding water to the gearbox. Only the kurtosis value in 7 (a)is changing slightly over time, but so does the baseline mea-surement. Therefore, we cannot conclude that these featureswill aid in detecting early water ingress.
To further investigate any changes in vibration signature, thefrequency spectrum is acquired using the fast Fourier trans-form (FFT). To limit the differences in temperature, one vi-bration segment of 120 second is taken between 960 secondsand 1080 seconds of the baseline, and the same time windowof test 3, since the temperature is similar in Fig. 6 (a). Inthis time window, 0 mL and 2 mL water ingress is compared.The two spectra are shown in Fig. 8, where the blue line isbaseline at 0 mL, and red stapled is after adding 2 mL water.
The most interesting part is the increased energy at the meshfrequency, as decreased oil performance could increase mesh-ing vibration energy. In Fig. 8 the harmonics of meshing fre-quency of the two stages inside the planetary gearboxes areshown as stapled lines, as indicated by the legend. There isno apparent energy increase at the harmonics of the mesh fre-quency itself, but there are some other peaks that appear tohave increased in value, especially near the first harmonic ofmeshing at stage 1. This area is shown more clearly in Fig. 9(a).
The four peaks seen to the right of the meshing frequencyin Fig. 9 (a) are possibly not related directly to the plane-
� ��� �� �� �� ��� �� �� ��� ����������#�
���
���
���
��
���
��"��� ��
����
���
��#$�� ��#$�� ��#$� ��#��� �
� ��� �� �� �� ��� �� �� ��� ����������#�
���
���
���
��#�#
$� ��
����
���
� ��� �� �� �� ��� �� �� ��� ����������#�
����� ��������
�%�
���$&
����
���
� ��� �� �� �� ��� �� �� ��� ����������#�
�
�
�����! ��$�! ���
���
���
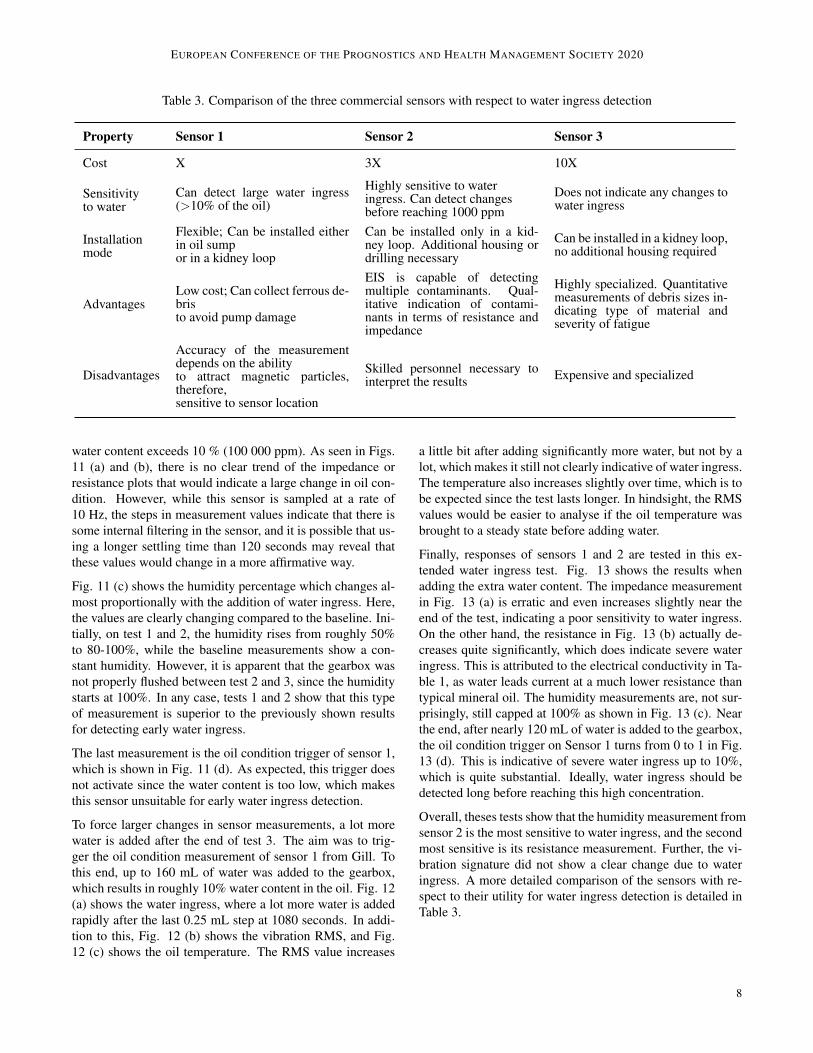
Figure 11. Three tests with water ingress. 0.25 mL of wa-ter is added every 120 seconds, up to a total of 2 mL. (a) Oilimpedance; (b) Oil resistance; (c) Oil humidity; (d) Oil con-dition trigger.
tary gearbox but due to the spur gear coupling between theplanetary gearbox and the load gearbox shown in Fig. 4,and the sub-band spacing between the four peaks matchesthe meshing frequency of this spur gear. As this lab setupis newly setup, this spur gear may not have been properlyaligned, hence creating high vibration energy at this meshingfrequency. The notable peaks in 9 (a) may, therefore, be am-plitude modulations of the meshing vibration of stage 1 insidethe planetary gearbox. Even if this is the case, the energies atthese peaks can still be compared further. The highest valuedpeak near 141.8 Hz is shown further in Fig. 9 (b). While the
6
EUROPEAN CONFERENCE OF THE PROGNOSTICS AND HEALTH MANAGEMENT SOCIETY 2020
� �� �� �� ���� ��� ��� ��� ���� ��� ���������#�
�
�
�
���
���
��$�"��
�"�##�����
���
��#$��
� �� �� �� ���� ��� ��� ��� ���� ��� ���������#�
����������������
������
�#2 �
���
� �� �� �� ���� ��� ��� ��� ���� ��� ���������#�
����� ��������
���!�"�$%"����
�����
���
Figure 12. Continuation of test 3 test after adding 2 mL ofwater. (a) Vibration RMS; (b) Oil temperature at sensor 2; (c)Water ingress content.
red-stapled line has a higher maximum value, it appears tobe less spread than the blue baseline plot. Hence, the energycontent may actually be the same around this frequency, justmore spread on the baseline measurements, which makes ithard to determine any real changes between the baseline and2 mL water ingress test.
The data from the commercial oil quality sensors are alsoanalysed to determine which is best suited for early detectionof water ingress. First, we investigate the least probable onefor water ingress, namely sensor 3 the Parker Kittiwake. Thissensor is mostly used for detecting ferrous and non-ferrousmetallic debris. However, it is investigated to determine if itsmeasurements are affected by the water ingress since the oilsimpedance may change. Fig. 10 shows the resulting mea-surements from this sensor.
Measured ferrous sediments in the range 70-100 µm increasesin the beginning of the test, but slowly decreases near theend. The other sizes are mostly static or periodic over thetest. However, there is no clear indication that the sensor isaffected by the water ingress, since none of the values are in-
� ��� ��� �� ���� ���� ���� � �� ���� ���� ����������"�
���
���
���
��!������
����
���
��"#�
� ��� ��� �� ���� ���� ���� � �� ���� ���� ����������"�
��
���
���
���
��"�"
#����
����
���
� ��� ��� �� ���� ���� ���� � �� ���� ���� ����������"�
����� ��������
�$�
���#%
����
���
� ��� ��� �� ���� ���� ���� � �� ���� ���� ����������"�
�
�
����� ��
�#� �
������
���
Figure 13. Continuation of test 3 test after adding 2 mL ofwater. (a) Oil impedance; (b) Oil resistance; (c) Oil humidity;(d) Oil condition trigger.
creasing over time. The sediments in range 70-100 µm maybe decreasing since sensor 1 from Gill is magnetic and cap-tures ferrous particles as they pass the sensor. The origin ofthese sediments is not known, but may stem from gear fa-tigue.
Finally, sensors 1 and 2 are checked for their response to thewater ingress. Fig. 11 shows the available measurements rel-evant for water ingress. Subplots (a), (b) and (c) are the oilimpedance, oil resistance and humidity percentage reportedby sensor 2 Poseidon Trident, respectively. Subplot (d) is abinary trigger given by sensor 1 from Gill that should, ac-cording to the manufacturer (Limited, 2018), turn positive if
7
EUROPEAN CONFERENCE OF THE PROGNOSTICS AND HEALTH MANAGEMENT SOCIETY 2020
Table 3. Comparison of the three commercial sensors with respect to water ingress detection
Property Sensor 1 Sensor 2 Sensor 3
Cost X 3X 10X
Sensitivityto water
Can detect large water ingress(>10% of the oil)
Highly sensitive to wateringress. Can detect changesbefore reaching 1000 ppm
Does not indicate any changes towater ingress
Installationmode
Flexible; Can be installed eitherin oil sumpor in a kidney loop
Can be installed only in a kid-ney loop. Additional housing ordrilling necessary
Can be installed in a kidney loop,no additional housing required
AdvantagesLow cost; Can collect ferrous de-bristo avoid pump damage
EIS is capable of detectingmultiple contaminants. Qual-itative indication of contami-nants in terms of resistance andimpedance
Highly specialized. Quantitativemeasurements of debris sizes in-dicating type of material andseverity of fatigue
Disadvantages
Accuracy of the measurementdepends on the abilityto attract magnetic particles,therefore,sensitive to sensor location
Skilled personnel necessary tointerpret the results Expensive and specialized
water content exceeds 10 % (100 000 ppm). As seen in Figs.11 (a) and (b), there is no clear trend of the impedance orresistance plots that would indicate a large change in oil con-dition. However, while this sensor is sampled at a rate of10 Hz, the steps in measurement values indicate that there issome internal filtering in the sensor, and it is possible that us-ing a longer settling time than 120 seconds may reveal thatthese values would change in a more affirmative way.
Fig. 11 (c) shows the humidity percentage which changes al-most proportionally with the addition of water ingress. Here,the values are clearly changing compared to the baseline. Ini-tially, on test 1 and 2, the humidity rises from roughly 50%to 80-100%, while the baseline measurements show a con-stant humidity. However, it is apparent that the gearbox wasnot properly flushed between test 2 and 3, since the humiditystarts at 100%. In any case, tests 1 and 2 show that this typeof measurement is superior to the previously shown resultsfor detecting early water ingress.
The last measurement is the oil condition trigger of sensor 1,which is shown in Fig. 11 (d). As expected, this trigger doesnot activate since the water content is too low, which makesthis sensor unsuitable for early water ingress detection.
To force larger changes in sensor measurements, a lot morewater is added after the end of test 3. The aim was to trig-ger the oil condition measurement of sensor 1 from Gill. Tothis end, up to 160 mL of water was added to the gearbox,which results in roughly 10% water content in the oil. Fig. 12(a) shows the water ingress, where a lot more water is addedrapidly after the last 0.25 mL step at 1080 seconds. In addi-tion to this, Fig. 12 (b) shows the vibration RMS, and Fig.12 (c) shows the oil temperature. The RMS value increases
a little bit after adding significantly more water, but not by alot, which makes it still not clearly indicative of water ingress.The temperature also increases slightly over time, which is tobe expected since the test lasts longer. In hindsight, the RMSvalues would be easier to analyse if the oil temperature wasbrought to a steady state before adding water.
Finally, responses of sensors 1 and 2 are tested in this ex-tended water ingress test. Fig. 13 shows the results whenadding the extra water content. The impedance measurementin Fig. 13 (a) is erratic and even increases slightly near theend of the test, indicating a poor sensitivity to water ingress.On the other hand, the resistance in Fig. 13 (b) actually de-creases quite significantly, which does indicate severe wateringress. This is attributed to the electrical conductivity in Ta-ble 1, as water leads current at a much lower resistance thantypical mineral oil. The humidity measurements are, not sur-prisingly, still capped at 100% as shown in Fig. 13 (c). Nearthe end, after nearly 120 mL of water is added to the gearbox,the oil condition trigger on Sensor 1 turns from 0 to 1 in Fig.13 (d). This is indicative of severe water ingress up to 10%,which is quite substantial. Ideally, water ingress should bedetected long before reaching this high concentration.
Overall, theses tests show that the humidity measurement fromsensor 2 is the most sensitive to water ingress, and the secondmost sensitive is its resistance measurement. Further, the vi-bration signature did not show a clear change due to wateringress. A more detailed comparison of the sensors with re-spect to their utility for water ingress detection is detailed inTable 3.
8
EUROPEAN CONFERENCE OF THE PROGNOSTICS AND HEALTH MANAGEMENT SOCIETY 2020
6. CONCLUSIONS
Water ingress in marine gearboxes can lead to rapid degrada-tion in these critical components. In this article three com-mercial oil quality monitors are tested for their sensitivity towater ingress detection. Besides, the effect of water ingresson vibration measurements is also investigated. This is pri-marily to justify the additional expense of oil quality monitor-ing sensor on these systems in addition to vibration measure-ments, which are becoming commonplace. The investigationhas shown that vibration monitoring alone may not be ableto detect water ingress. Among the online oil quality moni-toring sensors, the electrical impedance spectroscopy sensorappears to be the most sensitive to water ingress. In partic-ular the humidity reading has the highest sensitivity of theacquired measurements. Given the criticality of this failuremode based on the vessel history, a cost vs benefit analysismay be conducted prior to large scale deployment of thesesensors. In the future, the authors aim to test these sensorson ferrous and non-ferrous debris to further evaluate the ben-efits of incorporating these sensors in a condition monitoringsystem for marine gearboxes.
ACKNOWLEDGMENT
This work has been funded by the Ministry of Education andResearch in Norway.
REFERENCES
Archer, D. G., & Wang, P. (1990, mar). The dielectric con-stant of water and debye-huckel limiting law slopes.Journal of Physical and Chemical Reference Data,19(2), 371–411. doi: 10.1063/1.555853
Bock, W. (2014). Industrial gear oils. In Encyclopedia oflubricants and lubrication (pp. 977–994). SpringerBerlin Heidelberg. doi: 10.1007/978-3-642-22647-2 282
Brethee, K. F., Gu, F., & Ball, A. D. (2017). Monitoringof water contamination in gearbox lubricant based onvibration analysis. COMADEM.
Cantley, R. (1977). The effect of water in lubricating oil onbearing fatigue life. A.S.L.E. Transactions.
Cao, W., Zhang, H., Wang, N., Wang, H. W., & Peng,Z. X. (2019, apr). The gearbox wears state mon-itoring and evaluation based on on-line wear de-bris features. Wear, 426-427, 1719–1728. doi:10.1016/j.wear.2018.12.068
Cen, H., Morina, A., Neville, A., Pasaribu, R., & Nedelcu,I. (2012, dec). Effect of water on ZDDP anti-wearperformance and related tribochemistry in lubricatedsteel/steel pu re sliding contacts. Tribology Interna-tional, 56, 47–57. doi: 10.1016/j.triboint.2012.06.011
Day, M., & Bauer, C. (2007). Water contamination in hy-draulic and lube systems. Practicing Oil Analysis, 9,
2007.Dempsey, P. (2000). A comparison of vibration and oil de-
bris gear damage detection methods applied to pittingdamage. In Nasa/tm-2000-210371.
Dempsey, P., & Afjeh, A. A. (2002). Integrating oil de-bris and vibration gear damage detection technologiesusing fuzzy logic. International 58th Annual Forumand Technology Display, American Helicopter Society,Montreal, Quebec, Canada (NASA/TM-2002-211126).
Elasha, F., Greaves, M., Mba, D., & Fang, D. (2017, jan). Acomparative study of the effectiveness of vibration andacoustic emission in diagnosing a defective bearing ina planetry gearbox. Applied Acoustics, 115, 181–195.doi: 10.1016/j.apacoust.2016.07.026
Engineering Toolbox. (2016). Permeability. Available atwww.engineeringtoolbox.com.
Fecek, D. P. (2017). Online Detection of Water and Coolantin Engine Oil. MSc Thesis, Graduate School, Pennsyl-vania State University.
Feng, Z., Chen, X., & Zuo, M. J. (2019, apr). Inductionmotor stator current AM-FM model and demodulationanalysis for planetary gearbox fault diagnosis. IEEETransactions on Industrial Informatics, 15(4), 2386–2394. doi: 10.1109/tii.2018.2875447
Feng, Z., Ma, H., & Zuo, M. J. (2016, may). Vibrationsignal models for fault diagnosis of planet bearings.Journal of Sound and Vibration, 370, 372–393. doi:10.1016/j.jsv.2016.01.041
Fitch, J., & Jaggernauth, S. (1994). Moisture–the secondmost destructive lubricant contaminate, and its effectson bearing life. P/PM Technology, 12, 1–4.
Hamilton, A., & Quail, F. (2011, oct). Detailed state of the artreview for the different online/inline oil analysis tech-niques in context of wind turbine gearboxes. Journalof Tribology, 133(4). doi: 10.1115/1.4004903
Kittiwake, P. (2019). Metallic wear debris sensor instructionmanual (12th ed.) [Computer software manual]. 3 - 6Thorgate Road Littlehampton West Sussex BN17 7LUUnited Kingdom.
Lancaster, J. (1990). A review of the influence of environ-mental humidity and water on friction, lubrication andwear. Tribology International, 23(6), 371 - 389.
Lenntech. (2020). Water conductivity. Available atwww.lenntech.com.
Limited, G. S. . C. (2018, 04). Oil condition monitoringsensor user manual (5th ed.) [Computer software man-ual]. Unit 600, Ampress Park, Lymington, Hampshire,SO41 8LW, UK.
Liu, Y., Liu, Z., Xie, Y., & Yao, Z. (2000). Research on anon-line wear condition monitoring system for marinediesel engine. Tribology International, 33(12), 829–835. doi: 10.1016/S0301-679X(00)00128-6
Myshkin, N. K., & Markova, L. V. (2018). Wear predictionfor tribosystems based on debris analysis. In On-line
9
EUROPEAN CONFERENCE OF THE PROGNOSTICS AND HEALTH MANAGEMENT SOCIETY 2020
condition monitoring in industrial lubrication and tri-bology (pp. 131–201). Springer International Publish-ing.
Needelman, W. M., Barris, M. A., LaVallee, G. L., et al.(2009). Contamination control for wind turbine gear-boxes. Power Engineering, 113(11), 112.
Poseidon Systems, L. (2018, 05). Tridentqm3100™/qw3100™user’s manual (C ed.) [Computersoftware manual]. 200 Canal View Blvd. Rochester,NY 14623.
Schatzberg, P. (1971, apr). Inhibition of water-acceleratedrolling-contact fatigue. Journal of Lubrication Tech-nology, 93(2), 231–233. doi: 10.1115/1.3451546
Sheng, S. (2016, jan). Monitoring of wind tur-bine gearbox condition through oil and wear de-bris analysis: A full-scale testing perspective.Tribology Transactions, 59(1), 149–162. doi:10.1080/10402004.2015.1055621
Singh, A., & Parey, A. (2019, jan). Gearbox fault diagno-sis under non-stationary conditions with independent
angular re-sampling technique applied to vibration andsound emission signals. Applied Acoustics, 144, 11–22. doi: 10.1016/j.apacoust.2017.04.015
Soltanahmadi, S., Morina, A., van Eijk, M. C., Nedelcu,I., & Neville, A. (2017, mar). Tribochemicalstudy of micropitting in tribocorrosive lubricated con-tacts: The influence of water and relative humid-ity. Tribology International, 107, 184–198. doi:10.1016/j.triboint.2016.11.031
Stachowiak, G., & Batchelor, A. W. (2013). Engineeringtribology. Butterworth-Heinemann.
The Swedish Club. (2018). Main engine damage study. Avail-able at https://www.swedishclub.com.
Troyer, D. (1998). The visual crackle-a new twist to an oldtechnique. Practicing Oil Analysis magazine.
Zhu, X., Zhong, C., & Zhe, J. (2017, may). Lubricating oilconditioning sensors for online machine health moni-toring – A review. Tribology International, 109, 473–484. doi: 10.1016/j.triboint.2017.01.015
10