Embed Size (px)
Citation preview

SESSION
LEARNING METHODS, E-LEARNING +EDUCATIONAL TOOLS, AND RELATED ISSUES
Chair(s)
TBA
Int'l Conf. e-Learning, e-Bus., EIS, and e-Gov. | EEE'13 | 1

2 Int'l Conf. e-Learning, e-Bus., EIS, and e-Gov. | EEE'13 |
Molly Open Source Online Lecture System Ronald P. Vullo, Ph.D., Natallia Ivaniuk, M.S.I.T., and Sean Boyle, M.S.I.T.
Golisano College of Computing and Information Sciences Rochester Institute of Technology
Rochester, New York 14623
Abstract – For over 13 years, one of the authors has been developing and using a Web-based presentation tool for in-class and distance education. Recent advances in Web technology have made it possible to re-implement the system and incorporate the ability for educators to easily add a video track and synchronize their slides to it. We also added shared permissions multi-user editing capability and several other features. This new version of a time-tested Web-based lecture slide system provides distance learners a classroom-like experience via the Web and makes it easy for educators to develop, edit, share, and reuse presentations.
Keywords: e-Learning, Distance Education, Video, Open Source, Web
1 Introduction For over 13 years, one of the authors (Vullo) has been developing and using a Web-based presentation tool as part of the open source Molly Website development system. Although used primarily in the classroom, it was conceived of originally as a distance education tool, and has been used in the delivery of at least one complete distance education course. In the early days of the system, distance lectures were created with an integrated video of the lecturer that drove and synchronized the slides. This was accomplished via QuickTime's HREF Track mechanism, combined with JavaScript. While it worked, it was fussy and required considerable expertise, time, and effort to author such lectures. Security enhancements to JavaScript eventually broke the system and a second technique — again driven by a special QuickTime track — was used. While more reliable, it was still a complex and tedious process to author a lecture. With the release of the HTML5 standard came the incorporation of the <video> tag. With video now part of the Document Object Model (DOM), it became possible to control both the
video and slides from JavaScript. More importantly, because the control codes and time codes no longer needed to be embedded in the video itself, it became possible to create a simple Web-based authoring environment. This finally made it possible to fulfill the original vision for the Molly system's distance learning component and was the genesis of this project. This paper describes the re-development and expansion of this lecture delivery system. 2 Project Overview The Molly online lecture system emulates a real in-class environment and face-to-face communication with a professor by providing video lectures combined with automatic slide switching functionality. The main audiences for the system are students and faculty members. These user’s groups have different business goals and needs that they wish to accomplish using our system. During the design phase of the project, the requirements and expectations of the main intended audience were collected and analyzed. Students are interested in viewing any class materials online that will help them study their curriculum. Faculty members would like to use the system to share information with remote students as well as to make in-class presentations. The result of this analysis is presented in a form of use case diagrams. There are two main actors in the system: Viewers and Editors. A Viewer is a user who is interested in viewing lecture content. It could be a remote student who is taking online class, as well as a professor who is presenting in class. An Editor is a user who is responsible for available lecture content and material (most typically the lecturer or
Int'l Conf. e-Learning, e-Bus., EIS, and e-Gov. | EEE'13 | 3
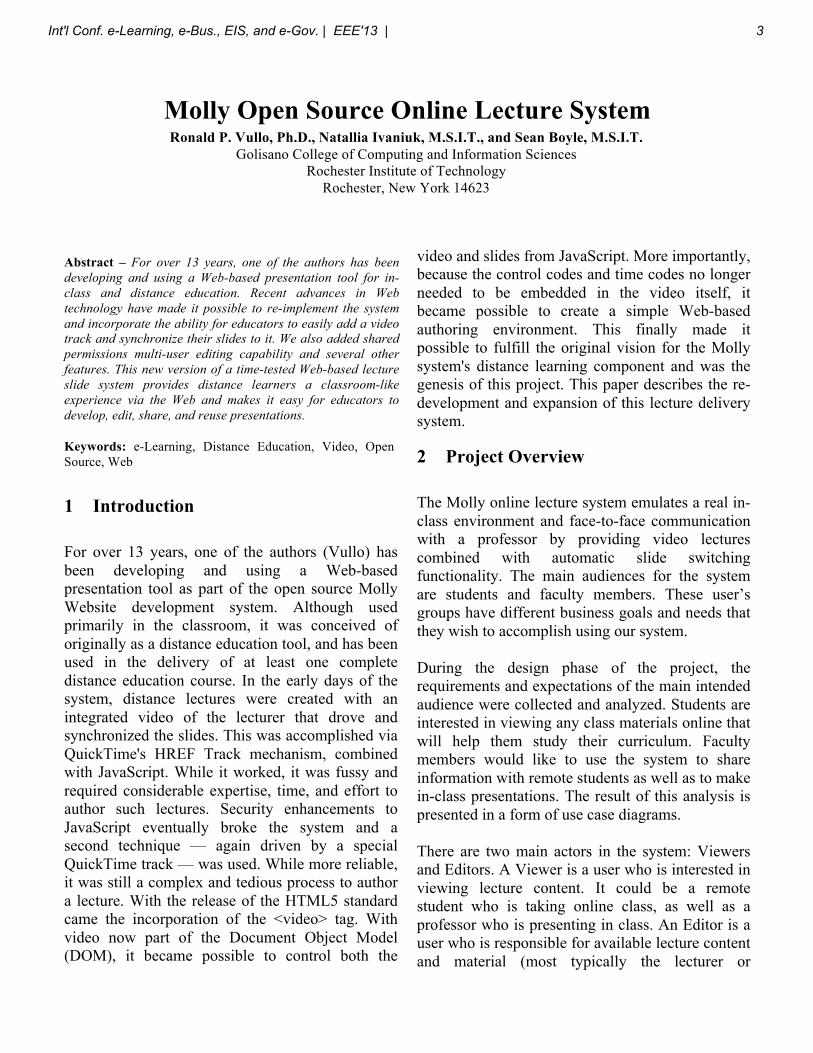
professor). For these audiences, the system has two key components: a presentation portal and a management portal. The presentation portal is intended for the viewing audience, while the management portal is for content administration and management. Figure 1 (below) shows a use case diagram for Viewers. Viewers would like the system to support two presentation modes:
• In-class presentation: for the in-class environment, the presentations are displayed without any video content and with manual slide switching.
• Online presentation: this mode includes video with automatic slide switching. Available lecture content includes slides and any additional notes from the professor. For easy navigation between slides, the user must have the ability to select the next and previous slides, as well as random access to any of the other slides. In addition, students can see other people’s comments, suggestions and notes related to the slide content, and can post their own questions and comments for the whole community of users. In order to leave a comment and/or participate in forum discussions, a user must register themselves in the system. As far as the video, users have the ability to play, pause and seek. A print version is available containing all slide content and an additional notes section.
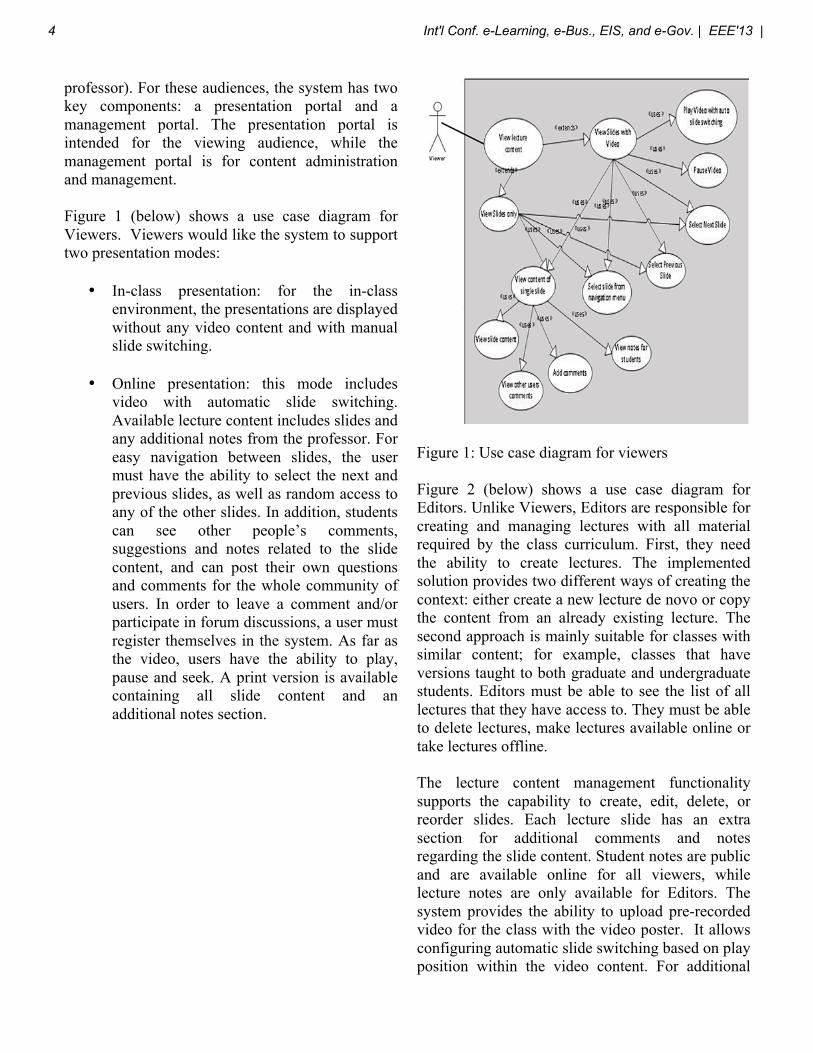
Figure 1: Use case diagram for viewers Figure 2 (below) shows a use case diagram for Editors. Unlike Viewers, Editors are responsible for creating and managing lectures with all material required by the class curriculum. First, they need the ability to create lectures. The implemented solution provides two different ways of creating the context: either create a new lecture de novo or copy the content from an already existing lecture. The second approach is mainly suitable for classes with similar content; for example, classes that have versions taught to both graduate and undergraduate students. Editors must be able to see the list of all lectures that they have access to. They must be able to delete lectures, make lectures available online or take lectures offline. The lecture content management functionality supports the capability to create, edit, delete, or reorder slides. Each lecture slide has an extra section for additional comments and notes regarding the slide content. Student notes are public and are available online for all viewers, while lecture notes are only available for Editors. The system provides the ability to upload pre-recorded video for the class with the video poster. It allows configuring automatic slide switching based on play position within the video content. For additional
4 Int'l Conf. e-Learning, e-Bus., EIS, and e-Gov. | EEE'13 |
security, the owner of the lectures can grant and revoke Editor rights to other users of the system.
Figure 2: Use Case diagram for Editors 3 Application Architecture The system has been developed using a standard three-tier architecture. In this model, the user interface, functional business logic, data storage and access are developed as independent components. This approach provides benefits such as reusability, flexibility, maintainability, and scalability. Presentation Layer This layer presents data to the user (Graphical User Interface). For the current implementation the latest web client-side technology, such as HTML5, CSS3, JavaScript and AJAX were used. The developed system is targeted to support the most common
current browsers: Firefox, IE, Safari, Opera and Chrome. Business Server Layer This layer encapsulates the main business rules and services. This layer enforces required parameter validation, data dependencies and data integrity. For developing the service layer the server-side scripting language PHP5 and Molly middleware (molly.rit.edu) were used. Data Layer The data layer is responsible for data storage and interactions with persistent data. It combines both data sets and the database management system. A MySQL database was used as a backend for the current implemented solution, however Molly uses a database abstraction layer allowing other databases such as Oracle and PostgreSQL. 4 Technologies and Tools The system is implemented using the latest Web technologies such as HTML5, CSS3, JavaScript and AJAX libraries with a MySQL backend. The server-side component had been built using PHP and MAML. Hypertext Markup Language (HTML5, DOM) HTML5 is a new version of HTML that is rapidly penetrating the Web market. HTML5 is a markup language developed for presenting content for web pages. HTML5 was first presented in 2004 by the Web Hypertext Application Technology Working Group. In 2008, the first working draft of the specification was published. Since then, many browsers have started supporting HTML5 features. HTML5 significantly improves standardization for browsers’ behavior and presentation across different platforms. Compared to older HTML versions, it offers new features for easier Web application development and more sophisticated form handling. HTML5 was the driving reason for this new version of the Molly system due to its integrated support for graphics, video and audio. It
Int'l Conf. e-Learning, e-Bus., EIS, and e-Gov. | EEE'13 | 5
provides APIs for embedding and controlling audio and video content. The new Canvas element provides support for 2D graphics animation without use of the Flash or Silverlight plug-ins. Cascading Style Sheets (CSS) Cascading Style Sheets are a set of rules that define how HTML elements are displayed and positioned on a web page. CSS styles can be defined in-line with HTML elements or imported from a separate style sheet. We used separate additional CSS files for this system, in addition to Molly’s built in CSS, to simplify changing and configuring layout and styles of the page. As a result, in one of our future enhancements, users of the system will be able to select their own “skins” for the presentation of their slides. Cascading Style Sheets were introduced 13 years ago, and are now ubiquitous on the Web. Style rules have significantly evolved over the years. The latest version, CSS3, offers very powerful features to make Web pages look cleaner and more sophisticated, such as rounded corners, multi-column layouts, borders for images, etc. CSS also allows slides to be formatted for printing automatically. Cross-browser incompatibility in supporting different CSS styles, which leads to display differences, was a challenge for our design and implementation. In some cases, different attributes were used to support different browsers. JavaScript JavaScript is a lightweight, client-side scripting language. It is embedded in Web browsers in order to provide enhanced user interfaces and dynamic Web pages. JavaScript provides objects and classes to control the browser and its Document Object Model (DOM). It allows Web developers to place elements in an HTML form and respond to user events such as mouse clicks, form input and page navigation. AJAX The acronym AJAX stands for Asynchronous JavaScript and XML. It represents a set of web
technologies used to create dynamic web pages by enabling asynchronous communication between the client and server. Using AJAX, the client makes asynchronous calls to the server to send and/or retrieve data without refreshing the whole Web page. It significantly reduces the user’s wait time and provides a wider and richer range of possibilities for user interactions. PHP PHP (PHP Hypertext Preprocessor) is an open source server-side scripting language used to develop rich Web applications. PHP code can be embedded directly into the HTML page. It runs on every common Web server platform, including Linux, Windows and Mac OS. Commonly, PHP is used as an Apache module, written in C, so it executes quickly and makes efficient use of system resources. PHP provides a rich set of libraries and APIs for graphics, database management, XML support, and much more. Because PHP is open source software, there are many sample solutions and considerable documentation available online. Its community provides reliable and quick support. MAML MAML (Molly Active Markup Language) is an XML markup language, developed by students of the Rochester Institute of Technology under the lead and guidance of Professor Ronald Vullo. The idea behind MAML is to create a generic library of controls to help abstract complex server-side logic, including database access, and help developers focus on client-side functionality. XML Molly tags are included in HTML mark-up. Upon page load, the Molly system parses included tags and replaces them with built-in functionality written in PHP. For this system, we relied on built-in user management functionality, such as login control, and database access from the MAML library. JQuery Library There are many JavaScript libraries available for Web developers. Designing any Web site, we need to carefully consider the choice of additional libraries. We must preserve a balance between
6 Int'l Conf. e-Learning, e-Bus., EIS, and e-Gov. | EEE'13 |
features that the library offers and its impact to the page size and performance. JQuery is a JavaScript open source library (developed by a student of Dr. Vullo’s) that provides better interaction between HTML and JavaScript by simplifying existing DOM APIs and providing cross-browser transparency. JQuery was first released at the beginning of 2006. Today, the lead Web development companies, such as Google, Amazon, IBM, and Microsoft, are all using JQuery for Web applications. According toBuildWith.com, more than 50% of the top Web sites are using jQuery libraries. JQuery has a rich library of methods for AJAX development, which were used in developing our system. This library significantly simplified drag and drop functionality for slide reordering. We also took advantage of its rich API for displaying popups and navigation menus with animated sliding effects. Also, JQuery provides a minimized version for its code that helps reduce its impact on our pages’ load times. KineticJS For implementing slides and video synchronization, we decided to use the KineticJS library. During our search for the most suitable library, we considered some of the most common HTML5 libraries, including Fabric, Paper, Easel and Kinetic. The Fabric library is mostly focused on vector graphics tools. It provides an easy API for manipulating objects in the Canvas. It supports simple objects like circles, rectangles and polygons, as well as more complex shapes. It allows one to dynamically move, scale, rotate and group elements. The size of the library is 78-148kB. Paper is an open source vector graphics scripting framework. It offers a Document Object Model for easy object access and manipulation, and a great deal of powerful functionality to create and work with vector graphics. However, there is no mention in its documentation of support for multi-touch devices. The library size is 219kB. Easel is more suitable for building HTML5 interactive and animated graphics. It would be a good choice for a game project. It has nice and easy
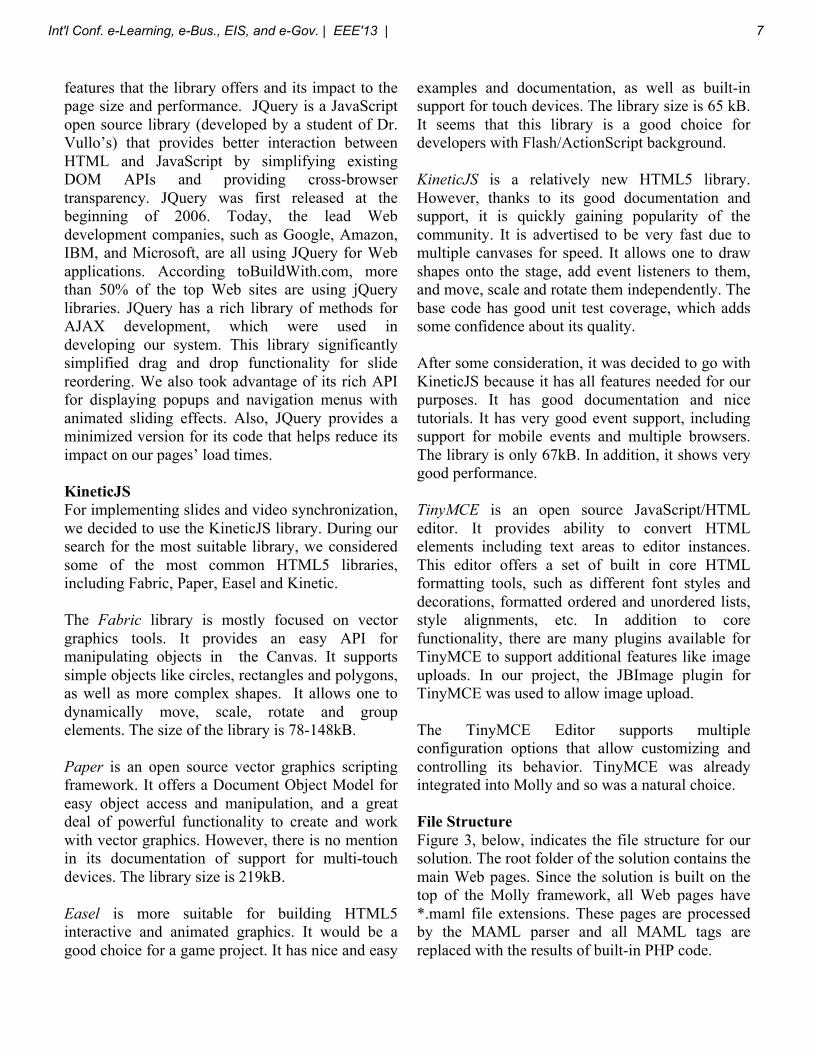
examples and documentation, as well as built-in support for touch devices. The library size is 65 kB. It seems that this library is a good choice for developers with Flash/ActionScript background. KineticJS is a relatively new HTML5 library. However, thanks to its good documentation and support, it is quickly gaining popularity of the community. It is advertised to be very fast due to multiple canvases for speed. It allows one to draw shapes onto the stage, add event listeners to them, and move, scale and rotate them independently. The base code has good unit test coverage, which adds some confidence about its quality. After some consideration, it was decided to go with KineticJS because it has all features needed for our purposes. It has good documentation and nice tutorials. It has very good event support, including support for mobile events and multiple browsers. The library is only 67kB. In addition, it shows very good performance. TinyMCE is an open source JavaScript/HTML editor. It provides ability to convert HTML elements including text areas to editor instances. This editor offers a set of built in core HTML formatting tools, such as different font styles and decorations, formatted ordered and unordered lists, style alignments, etc. In addition to core functionality, there are many plugins available for TinyMCE to support additional features like image uploads. In our project, the JBImage plugin for TinyMCE was used to allow image upload. The TinyMCE Editor supports multiple configuration options that allow customizing and controlling its behavior. TinyMCE was already integrated into Molly and so was a natural choice. File Structure Figure 3, below, indicates the file structure for our solution. The root folder of the solution contains the main Web pages. Since the solution is built on the top of the Molly framework, all Web pages have *.maml file extensions. These pages are processed by the MAML parser and all MAML tags are replaced with the results of built-in PHP code.
Int'l Conf. e-Learning, e-Bus., EIS, and e-Gov. | EEE'13 | 7
The commands folder contains PHP files with main server side logic and database access. Web pages are making AJAX calls to these PHP files to retrieve data or to perform operations on the data. These files are also responsible for data validation and error handling. The includes folder contains files with code snippets that are shared between more than one page. For example, the login control in title, page headers. These files are added to the page using Molly’s <maml:include> tag.
Figure 3: Project File Structure The scripts folder contains JavaScript files. It has our custom scripts as well as third party libraries such as kinetic.js and jQuery scripts. In addition to such scripts, this folder also contains the TinyMCE controls with all required plugins. The css folder contains files with CSS styling. JQuery CSS files are also located in this folder. Each Web page has its own style file with styles
specific to this page. The standard styles used across all pages are combined in the ipad.css file. The MAML controls are using their own styling located in the decor folder of the framework. The images folder contains images for Web pages and controls not included in Molly framework. In addition, any images uploaded by users for lecture slides are stored in this folder. The videotracks folder is where lecture authors store their videos and poster images. Video and images for each lecture are located in their own folders inside videotracks. To preserve folders’ unique names, lecture IDs are used as folder names. 5 Future Enhancements The following features are being considered as part of ongoing development:
• Translation support for multiple languages • Mobile device support • Touch-screen support • Lecture content versioning and the ability to
revert to previous versions • Automatic change-tracking and recording of
change history • Ability to customize the look and feel of
individual lectures by providing different layout templates and skins (currently only possible for the entire site)
6 Conclusion Our university, like many others, is looking to increase the use of technology to facilitate distance learning. This goal is all the more important as we continue to expand our international campuses around the world. The project described in this paper is one important piece of an online education strategy that has the potential to reach a vast number of students and does so with modest technology requirements.
8 Int'l Conf. e-Learning, e-Bus., EIS, and e-Gov. | EEE'13 |

7 References B. Means, Y. Toyama, R. Mupphy, M. Bakia, K. Jones “Evaluation of Evidence-Based Practices in Online Learning: A Meta Analysis and Review of Online Learning Studies”. Ed.gov. US. Department of Education. 2010. Web. 1 Sep 2012. http://www2.ed.gov/rschstat/eval/tech/evidence-based-practices/finalreport.pdf D. Driscoll. Review of Moodle Course Management System. Purdue University. N.d. Web. 1 Sep 2012. http://www.bgsu.edu/cconline/Web_2_0_Reviews/Moodle_Driscoll/index.html “Learning Management System (LMS) Review. Summary of Findings”. Dec 2009. Duke University. Web. 1 Sep 2012. http://elearning.duke.edu/wp-content/uploads/2010/02/LMS-Review-Report.pdf “Premier Learning Unit Case Study”. RMD Studio. 2011. Web. 15 Sep 2012. http://www.rmdstudio.com/archived-projects/40-premier-learning-unit-case-study Sakai. Longsight, Sakai Commercial Affiliate. N.d. Web. 10 Sep 2012. http://www.sakaiproject.org/about-sakai http://support.apple.com/kb/TA25532 http://www.w3schools.com/html/html5_video.asp Vullo, Ronald P., Ph.D.; Molly: Simplifying Development of Complex Web Apps, invited presentation to the Rochester Joint Chapters of the IEEE Computer and Computational Intel-ligence Society, Rochester, New York (June, 2012) Vullo, Ronald P., Ph.D., Bogaard, Daniel S.; Better than HTML Web: XML for Program-ming-Free Dynamically Generated Web sites, WWW@10 (2004)
Vullo, Ronald P., Ph.D., Christopher A. Egert, Ph.D., Daniel S. Bogaard; Molly: Bringing Back Simplicity to Web Site Development and Web Research. White Paper, 2006 Vullo, R.P., et al. (October, 2000). Telemedicine initiatives in International Outreach at St. Jude Children's Research Hospital. Presentation at the American and European Associations for Cancer Education Joint Meeting.
Int'l Conf. e-Learning, e-Bus., EIS, and e-Gov. | EEE'13 | 9

Effective Implementation of e-Learning in Initial
Learning Program: A Case Study
Soumya Hari
Corporate ILP Team, Tata Consultancy Services Limited, Trivandrum, Kerala, India
Abstract - Case studies are effective in dealing with factors
like creativity, innovation and context. This case study
attempts to highlight the outcomes of introducing the concept
of e-learning into teaching technical topics like Dotnet, Java,
Mainframe and C++ of the Initial Learning Program at Tata
Consultancy Services Limited in 2012-2013. These findings
will be of interest to any organization that plans to implement
e-learning methodologies to help its employees learn and
remember the initial lessons of software development and the
various programming languages with limited faculty support.
The outcome of this case study indicates a stable and
prominent increase in the use of e-learning strategies in
consort with the traditional methods of training.
Keywords: e-learning, strategy
1 Introduction
As the world gets more and more dependent on
information technology systems, the leading organizations are
beginning to realize the potential of information and
communication technology (ICT) systems in developing the
competencies of their employees. The knowledge of
appropriate processes, effective strategies and procedures is
essential to improvise the workforce capability through the
implementation of e-learning techniques.
1.1 Objective of the case study
The aim of this case study (Effective Implementation of
e-Learning in Initial Learning Program) is to establish the
factors that affect e-learning in similar organizations and how
best to leverage them and get the best results from e-learning.
This paper is a research review which would increase the
awareness in industry of the development, delivery and impact
of cost-effective and instructionally sound e-learning.
2 Background
Tata Consultancy Services Limited (TCS) recruits
thousands of engineering graduates every year from Computer
Science and non- Computer Science engineering streams
through campus recruitment programs from colleges all over
India. These fresh recruits join in batches to one of the TCS
ILP centres for their initial learning program. They are
allocated to a technical stream like Java, Dotnet, C++,
Mainframe, EIS, BIPM or Testing. During the initial learning
program (ILP), these graduates are provided 60-day rigorous
training on the key programming skills and concepts along
with courses on Business Skills and professional etiquette.
2.1 The Challenges
Conducting the Initial Learning Program (ILP) entirely
through traditional methods of teaching posed some
challenges to the training managers. The challenges faced are
as follows:
2.1.1 Number of learners
As many as 21,822 graduates joined the eight ILP
centers in batches in 2011-2012, and the case has been similar
for previous years as well. Among them, 50.4% were from
Computer Science stream and 49.6% from non-Computer
Science stream. 41.5% of them were allocated to Java, 17.7%
to Mainframe, 14.4% to Dotnet, 13.5% to C++, 7.6% to
BIPM and 5.2% to testing. There were around 400 faculties
catering to them, thus resulting in a high student-faculty ratio.
As a result, the faculties find it difficult to give individual
attention to each student.
2.1.2 Fairness of faculties
Each technical and non-technical stream had faculties
who were popular among the learners and had taken name as
being the “best” because of the learning theories and teaching
style they chose in teaching. It was not practical to engage
them for every joining batch, and hence, the fairness and
consistency in teaching could not be achieved.
10 Int'l Conf. e-Learning, e-Bus., EIS, and e-Gov. | EEE'13 |
2.1.3 Utilization of resources
The recruits included students from all engineering
streams. So, the curriculum included even basic courses on
computers and programming. The Computer Science students
needed such sessions as a refresher course too. The faculties
felt that if the sessions on basic programming topics were
taken off their shoulders, they could save a lot of their
valuable time and utilize it better in assisting the students with
their lab sessions that certainly call for individual attention.
2.1.4 Learner Behavior
Age and behaviour of the learners are interdependent.
Age is also an important characteristic that decides the
effectiveness of learning. The faculties observed that young
learners are more receptive to information from sources other
than traditional classroom sessions. They are tech savvy and
take interest in innovative methods of learning. They prefer
learning through practxice than theory sessions. The faculties
could make use of these aspects of young learners while
designing learning videos for them. The use of learning videos
and simulations to teach concepts could get the learners to
think creatively and utilize their talents in a better way.
2.2 Approach to e-learning
In early 2012, the Corporate ILP team initiated the
processes to create a series of video tutorials to teach the
basic-level technical modules. The aim was to address the
challenges in the existing system and improve the quality of
learning and teaching. This could also seek solutions to
problems associated with faculty crunches and logistics.
2.3 The project
A team of faculties from different technical streams was
chosen to be involved in the project. They were briefed about
the video creation project and their views on it were sought.
After careful consideration, it was decided that e-learning can
never replace traditional classrooms completely, but, can
improve the quality of learning. It could be used in
conjunction with traditional classroom sessions. The first step
was to introduce e-learning into the organization’s Initial
Learning Program (ILP) by using video tutorials to teach the
basic concepts in core technical courses.
3 Video Tutorial Creation
After deciding on the authoring tools and the platform for
video hosting, the first step was to identify the topics in
curriculum that could be moved as video topics. Since faculty-
student interaction would be minimal in e-learning, it was
decided to make videos to address the Level 1 or basic topics
which are ideal for self-learning and do not require faculty
intervention.
This was followed by train-the-trainer programs for the chosen
faculties on the authoring and recording tools. The next step
was to document the guidelines for video creation and to
define the project activities systematically. A check-list was
also put together and the faculties could use it to ensure
consistency across streams in the application of learning
theories and teaching styles.
3.1 Instructional Design Analysis
The instructional designer team analysed the following
factors to design the course modules in each stream. The
following are the observations of the audience and task
analysis activity of the project:
3.1.1 Audience
Graduates (mostly of age-group 22-24) with diverse
cultural background with varying levels of subject knowledge
(The group consisted of both CS and non-CS graduates). Most
of the audience population was well-versed in using
computers.
3.1.2 Course goals
Each course is intended to improve the technical
competencies of the learners in specific technical streams. So,
the learners should be able to grasp the context of a problem
and write code to address the basic programming
requirements.
3.1.3 Details of learning environment
Each video will have appropriate graphics/images; on-
screen text and audio integrated into it and is intended to be
hosted in a video server. The modules will also be integrated
with appropriate Check Your Understanding questions and
assessments.
3.1.4 Number of videos
There were around 50 videos created on each topic. These
videos addressed the Level 1 concepts in every technical
stream. Some of these videos could be re-used as well, to
address the same concepts across technical streams.
3.1.5 Video duration
Each video will be of 12 to 15 minutes duration.
3.1.6 Learning Objectives
The learning objectives are specific for each video.
Int'l Conf. e-Learning, e-Bus., EIS, and e-Gov. | EEE'13 | 11
3.1.7 Interactivity
The instructional designers tried adding scenarios into each
video. These scenarios allow learners to select their options.
Some of these were branching scenarios where the learners
can choose a path to proceed based on their responses to
specific problems.
3.2 Learning Pedagogies
E-Learning was used as a thread that deals with
understanding the learning needs and ways of learning better
with the best use of technology, and then designing the content
to meet these needs. The courses were designed with the view
that technology is not about giving the content on attractive
templates and adding complex animations to it; it is not about
introducing multiple “clicks” to make it user-interactive. It is
about designing appropriate learning objects to teach different
concepts making the best use of available technology. Each
learning object carried the essence of classroom training in
every possible way.
The term “pedagogy” refers to the activities that could be
used to instruct a particular skill or the activities that impart
learning. The faculties were as much involved in deciding on
the right pedagogy as the instructional designers. These
activities were designed based on the learning outcome that
they should bring forth in terms of enhancing the learner’s
knowledge levels and motivating them to learn further. The
faculties put forth a set of activities based on the learners’
experience and the way they learn. Based on this preferred
approach, the instructional designers helped to design each
course, and this helped to make each course learner-friendly.
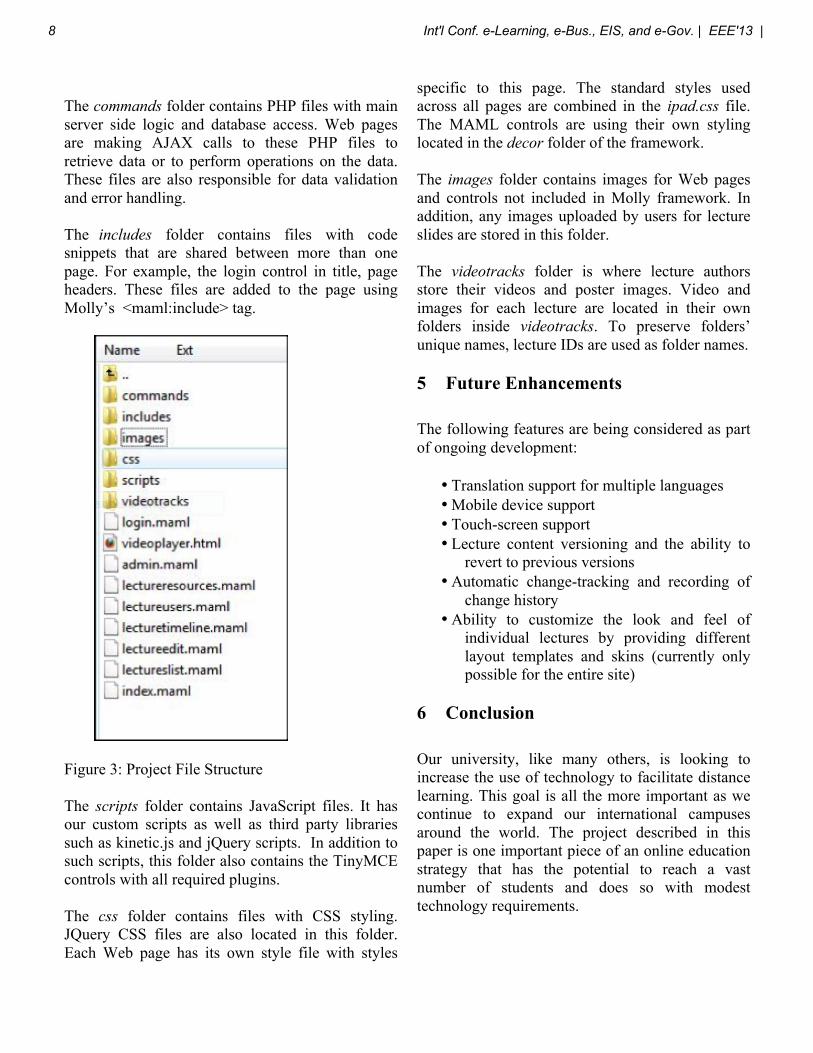
3.2.1 Gagne’s Nine Events of Instruction
In addition to the training on new tools, the faculties were
provided appropriate training on the instructional strategies
and methods that foster effective learning. As a result, they
have applied the nine events of instruction proposed by Robert
Gagne in the development of each tutorial.
Figure 1: Gagne's nine events of instruction
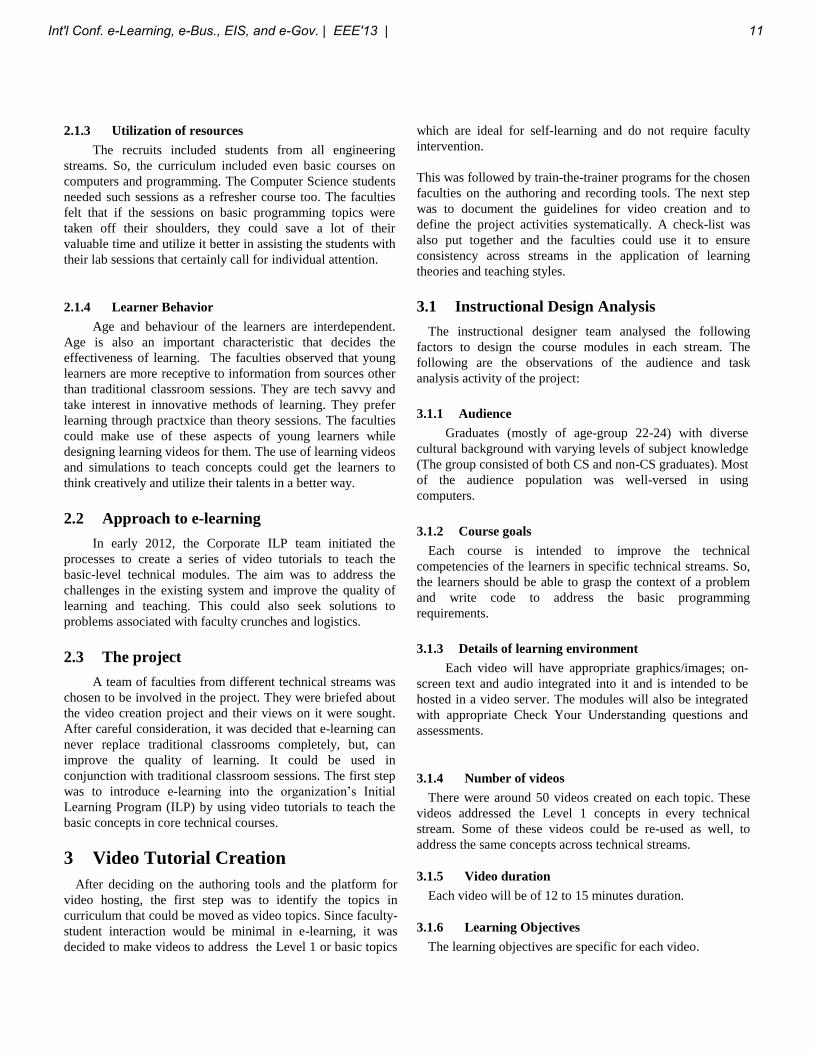
3.2.2 Simulations
Full-motion recording of the screen and screen captures are
used in software demos. For instance, the topic on CRUD in
the Application Understanding module in Java uses
simulations to demonstrate create, read, update and delete
operations in a web-based application.
Figure 2: Simulation
3.2.3 Podcasts
A number of podcasts were recorded by experts in the
particular topics and then included as a part of the video.
12 Int'l Conf. e-Learning, e-Bus., EIS, and e-Gov. | EEE'13 |
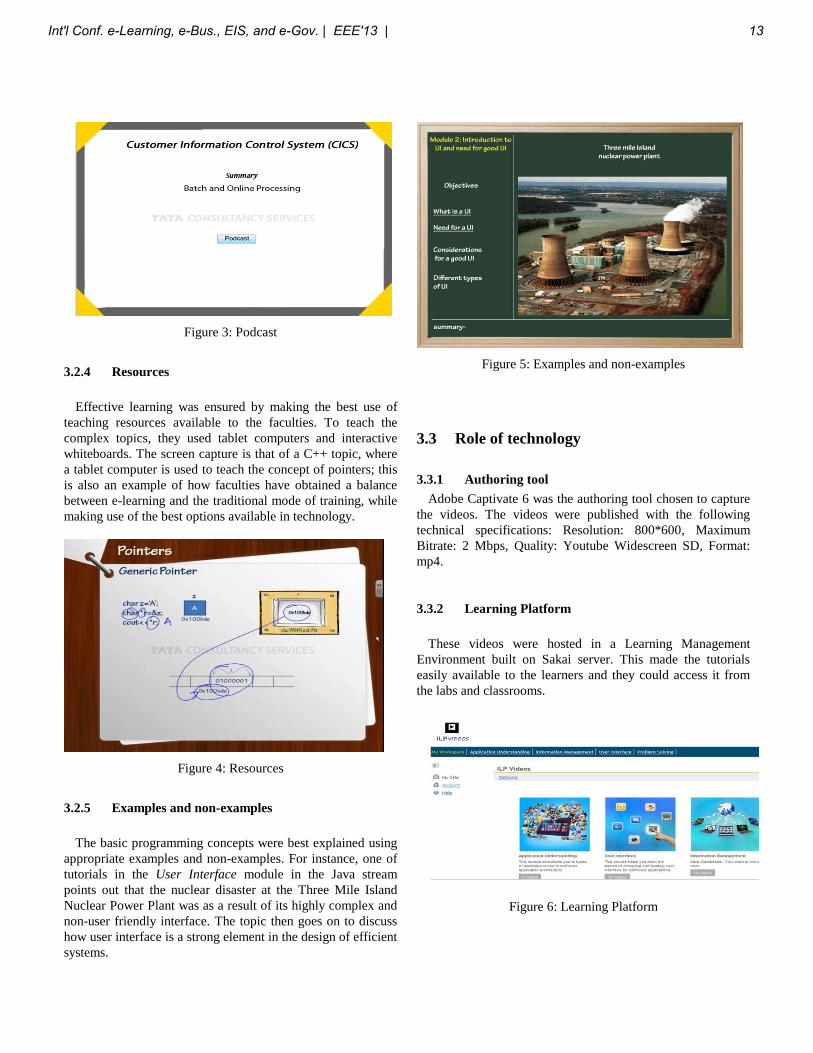
Figure 3: Podcast
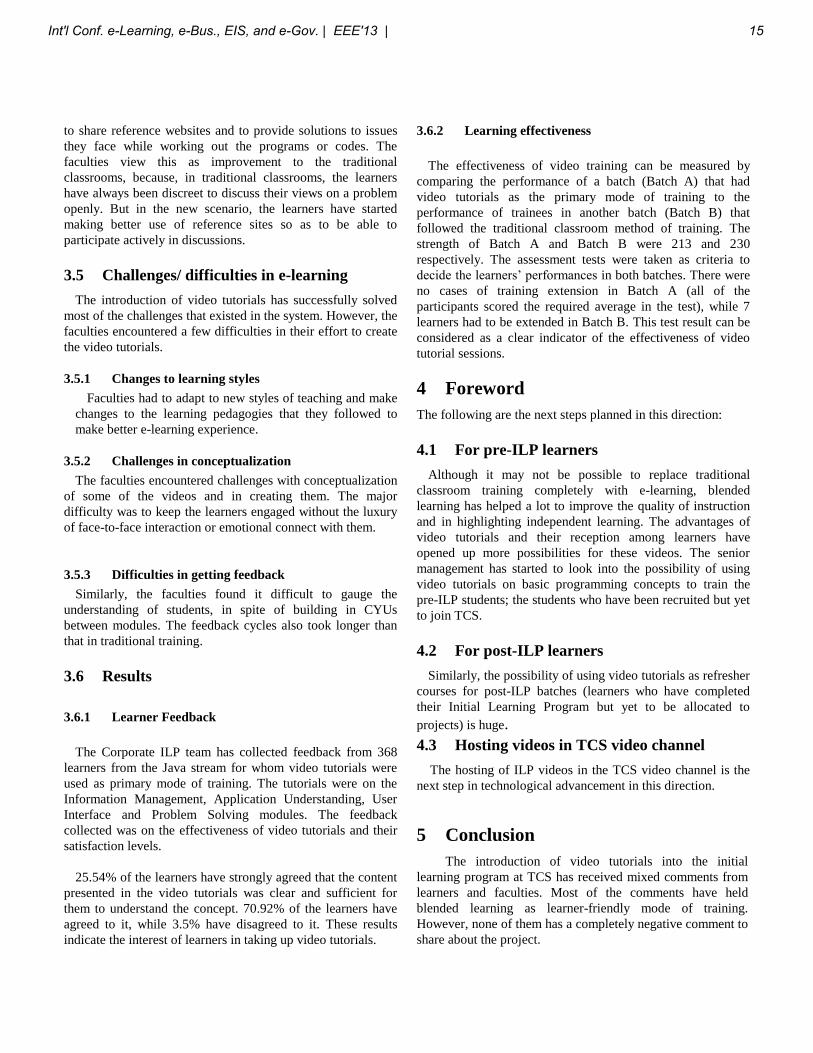
3.2.4 Resources
Effective learning was ensured by making the best use of
teaching resources available to the faculties. To teach the
complex topics, they used tablet computers and interactive
whiteboards. The screen capture is that of a C++ topic, where
a tablet computer is used to teach the concept of pointers; this
is also an example of how faculties have obtained a balance
between e-learning and the traditional mode of training, while
making use of the best options available in technology.
Figure 4: Resources
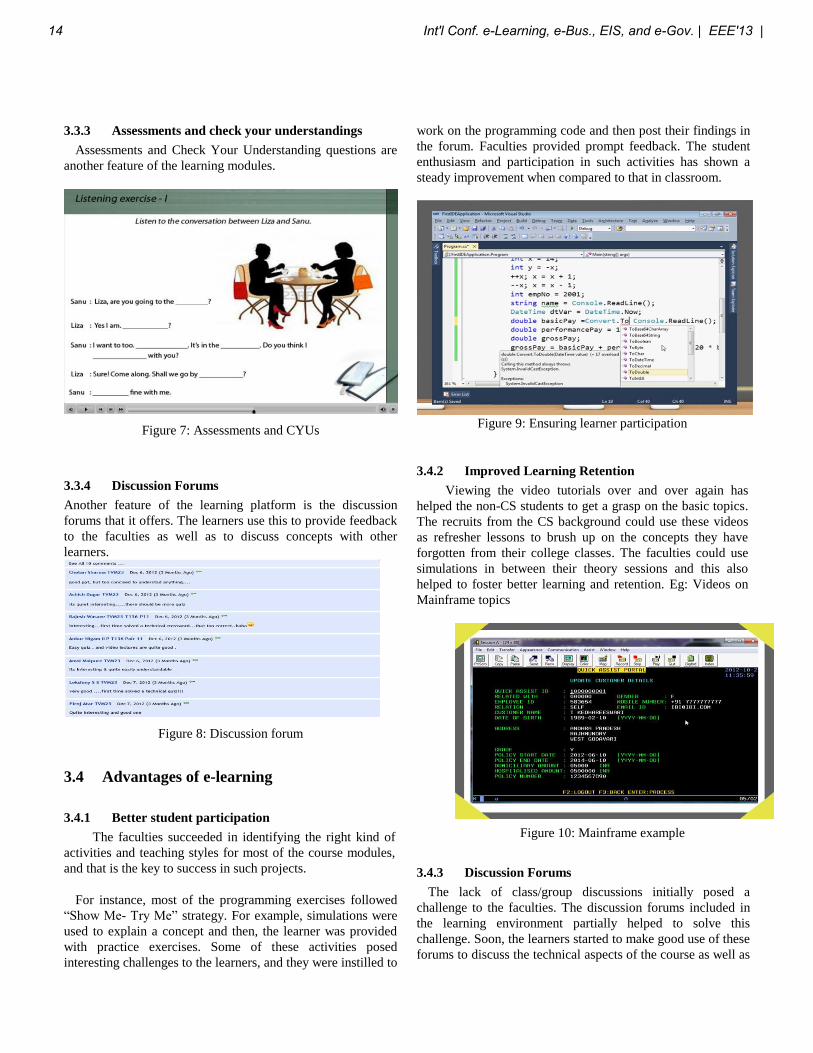
3.2.5 Examples and non-examples
The basic programming concepts were best explained using
appropriate examples and non-examples. For instance, one of
tutorials in the User Interface module in the Java stream
points out that the nuclear disaster at the Three Mile Island
Nuclear Power Plant was as a result of its highly complex and
non-user friendly interface. The topic then goes on to discuss
how user interface is a strong element in the design of efficient
systems.
Figure 5: Examples and non-examples
3.3 Role of technology
3.3.1 Authoring tool
Adobe Captivate 6 was the authoring tool chosen to capture
the videos. The videos were published with the following
technical specifications: Resolution: 800*600, Maximum
Bitrate: 2 Mbps, Quality: Youtube Widescreen SD, Format:
mp4.
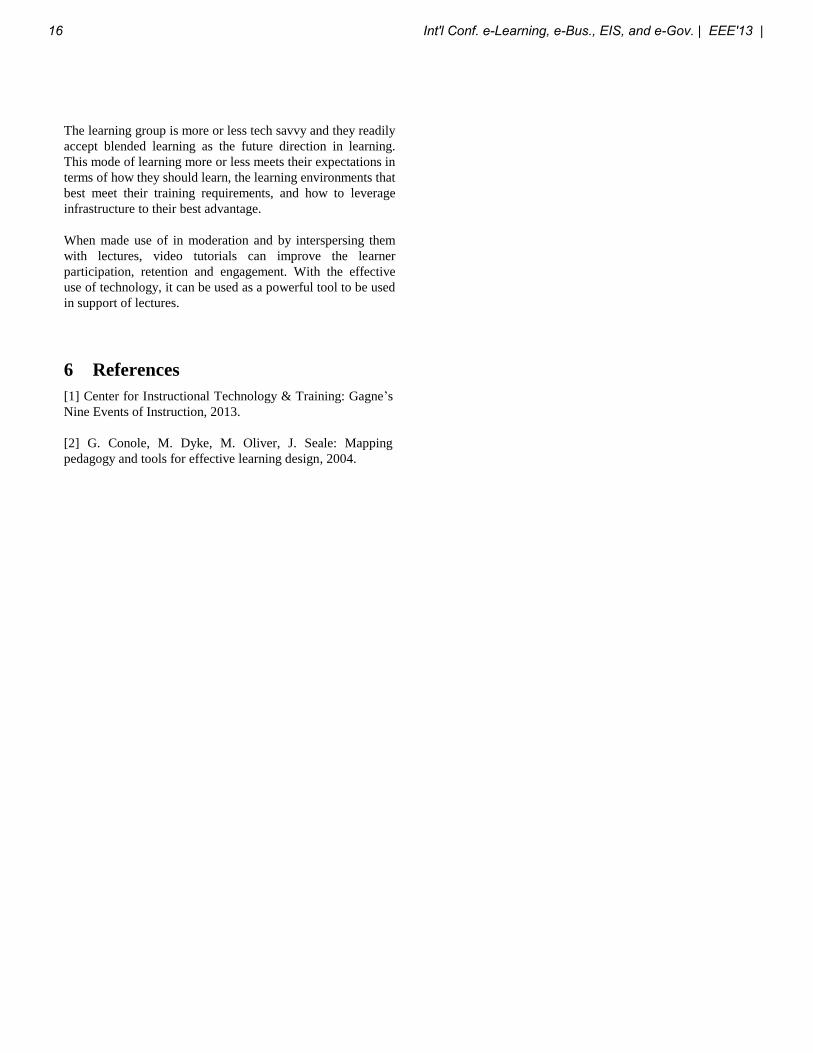
3.3.2 Learning Platform
These videos were hosted in a Learning Management
Environment built on Sakai server. This made the tutorials
easily available to the learners and they could access it from
the labs and classrooms.
Figure 6: Learning Platform
Int'l Conf. e-Learning, e-Bus., EIS, and e-Gov. | EEE'13 | 13
3.3.3 Assessments and check your understandings
Assessments and Check Your Understanding questions are
another feature of the learning modules.
Figure 7: Assessments and CYUs
3.3.4 Discussion Forums
Another feature of the learning platform is the discussion
forums that it offers. The learners use this to provide feedback
to the faculties as well as to discuss concepts with other
learners.
Figure 8: Discussion forum
3.4 Advantages of e-learning
3.4.1 Better student participation
The faculties succeeded in identifying the right kind of
activities and teaching styles for most of the course modules,
and that is the key to success in such projects.
For instance, most of the programming exercises followed
“Show Me- Try Me” strategy. For example, simulations were
used to explain a concept and then, the learner was provided
with practice exercises. Some of these activities posed
interesting challenges to the learners, and they were instilled to
work on the programming code and then post their findings in
the forum. Faculties provided prompt feedback. The student
enthusiasm and participation in such activities has shown a
steady improvement when compared to that in classroom.
Figure 9: Ensuring learner participation
3.4.2 Improved Learning Retention
Viewing the video tutorials over and over again has
helped the non-CS students to get a grasp on the basic topics.
The recruits from the CS background could use these videos
as refresher lessons to brush up on the concepts they have
forgotten from their college classes. The faculties could use
simulations in between their theory sessions and this also
helped to foster better learning and retention. Eg: Videos on
Mainframe topics
Figure 10: Mainframe example
3.4.3 Discussion Forums
The lack of class/group discussions initially posed a
challenge to the faculties. The discussion forums included in
the learning environment partially helped to solve this
challenge. Soon, the learners started to make good use of these
forums to discuss the technical aspects of the course as well as
14 Int'l Conf. e-Learning, e-Bus., EIS, and e-Gov. | EEE'13 |
to share reference websites and to provide solutions to issues
they face while working out the programs or codes. The
faculties view this as improvement to the traditional
classrooms, because, in traditional classrooms, the learners
have always been discreet to discuss their views on a problem
openly. But in the new scenario, the learners have started
making better use of reference sites so as to be able to
participate actively in discussions.
3.5 Challenges/ difficulties in e-learning
The introduction of video tutorials has successfully solved
most of the challenges that existed in the system. However, the
faculties encountered a few difficulties in their effort to create
the video tutorials.
3.5.1 Changes to learning styles
Faculties had to adapt to new styles of teaching and make
changes to the learning pedagogies that they followed to
make better e-learning experience.
3.5.2 Challenges in conceptualization
The faculties encountered challenges with conceptualization
of some of the videos and in creating them. The major
difficulty was to keep the learners engaged without the luxury
of face-to-face interaction or emotional connect with them.
3.5.3 Difficulties in getting feedback
Similarly, the faculties found it difficult to gauge the
understanding of students, in spite of building in CYUs
between modules. The feedback cycles also took longer than
that in traditional training.
3.6 Results
3.6.1 Learner Feedback
The Corporate ILP team has collected feedback from 368
learners from the Java stream for whom video tutorials were
used as primary mode of training. The tutorials were on the
Information Management, Application Understanding, User
Interface and Problem Solving modules. The feedback
collected was on the effectiveness of video tutorials and their
satisfaction levels.
25.54% of the learners have strongly agreed that the content
presented in the video tutorials was clear and sufficient for
them to understand the concept. 70.92% of the learners have
agreed to it, while 3.5% have disagreed to it. These results
indicate the interest of learners in taking up video tutorials.
3.6.2 Learning effectiveness
The effectiveness of video training can be measured by
comparing the performance of a batch (Batch A) that had
video tutorials as the primary mode of training to the
performance of trainees in another batch (Batch B) that
followed the traditional classroom method of training. The
strength of Batch A and Batch B were 213 and 230
respectively. The assessment tests were taken as criteria to
decide the learners’ performances in both batches. There were
no cases of training extension in Batch A (all of the
participants scored the required average in the test), while 7
learners had to be extended in Batch B. This test result can be
considered as a clear indicator of the effectiveness of video
tutorial sessions.
4 Foreword
The following are the next steps planned in this direction:
4.1 For pre-ILP learners
Although it may not be possible to replace traditional
classroom training completely with e-learning, blended
learning has helped a lot to improve the quality of instruction
and in highlighting independent learning. The advantages of
video tutorials and their reception among learners have
opened up more possibilities for these videos. The senior
management has started to look into the possibility of using
video tutorials on basic programming concepts to train the
pre-ILP students; the students who have been recruited but yet
to join TCS.
4.2 For post-ILP learners
Similarly, the possibility of using video tutorials as refresher
courses for post-ILP batches (learners who have completed
their Initial Learning Program but yet to be allocated to
projects) is huge.
4.3 Hosting videos in TCS video channel
The hosting of ILP videos in the TCS video channel is the
next step in technological advancement in this direction.
5 Conclusion
The introduction of video tutorials into the initial
learning program at TCS has received mixed comments from
learners and faculties. Most of the comments have held
blended learning as learner-friendly mode of training.
However, none of them has a completely negative comment to
share about the project.
Int'l Conf. e-Learning, e-Bus., EIS, and e-Gov. | EEE'13 | 15
The learning group is more or less tech savvy and they readily
accept blended learning as the future direction in learning.
This mode of learning more or less meets their expectations in
terms of how they should learn, the learning environments that
best meet their training requirements, and how to leverage
infrastructure to their best advantage.
When made use of in moderation and by interspersing them
with lectures, video tutorials can improve the learner
participation, retention and engagement. With the effective
use of technology, it can be used as a powerful tool to be used
in support of lectures.
6 References
[1] Center for Instructional Technology & Training: Gagne’s
Nine Events of Instruction, 2013.
[2] G. Conole, M. Dyke, M. Oliver, J. Seale: Mapping
pedagogy and tools for effective learning design, 2004.
16 Int'l Conf. e-Learning, e-Bus., EIS, and e-Gov. | EEE'13 |
Improving Knowledge Management in e-Learning:
A Contingent Framework for Efficient
Knowledge Transfer
Dr. Anitha Chennamaneni1 and Jayson G. Brown1
1Computer Information Systems, Texas A&M University – Central Texas, Killeen, TX, USA
Abstract - Knowledge management (KM) is the top most
important factor in e-Learning. This research paper explores
the role of KM in e-Learning and develops a conceptual
framework for successfully managing and transferring
knowledge. We review different types of knowledge and
discuss how varied KM techniques, e-Learning technologies,
platforms and possible solutions improve KM and knowledge
transfer in e-Learning programs. Our research framework is
grounded theoretically in the knowledge creation theory and
the media richness theory. This framework is extremely useful
to the academicians and practitioners alike as it guides them
in implementing a respectable pedagogy for effectively
managing and transferring knowledge in the e-Learning
environment.
Keywords: Knowledge Management, Knowledge Transfer,
Course Combination, Research Framework, Knowledge
Management Systems
1 Introduction E-Learning has become a well-known popular
alternative to traditional education. Today, many colleges
and universities around the world adopt it. Several
universities are starting to teach online versions of their
courses and new logical universities are coming to exist to
include this demographic of the population. A number of
trends such as developments in information and
communication technologies, flexibility and convenience of
distance education have accelerated the demand for e-
Learning. Asynchronous online education allows individuals
to achieve the ability to harness the power of the Internet or a
local Intranet to obtain educational materials and services at
any place or time with accessibility.
However, e-Learning poses some unique challenges as
learning in this environment is distributed with students and
instructors physically separated in space and time. In
addition, the students exercise volitional control of learning
rather than the instructor. The success or failure of learning
in e-Learning courses depends not only on the course design
and quality of the content, but also on how fruitful the
knowledge transfer has been from the instructor to the
students as well as from students to students. Therefore,
knowledge management (KM) is the uppermost factor in any
e-Learning environment.
This research paper explores the role of knowledge
management in e-Learning and develops a conceptual
framework for managing knowledge effectively in e-
Learning programs. We discuss different types of knowledge
and make an analysis of how varied KM techniques, e-
Learning technologies, platforms and online solutions are
usable in managing and disseminating the knowledge. Our
research framework is grounded theoretically in the
knowledge creation theory [1] and the media richness theory
[2]. Our framework is extremely useful to the academicians
and practitioners alike as it provides them the expertise to
implement a respectable pedagogy to maximize the online
students’ learning curves with proper KM management. We
will validate this framework through an assessment by a
panel of experts as well as a lab experiment in a future study.
The rest of this research paper is organized as follows.
The next section discusses the unique facets of learning in
the environment of e-Learning. It will be followed by a
review of KM literature on what constitutes knowledge,
different types of knowledge and how knowledge is created.
Following it, we describe the research framework for
managing and transferring knowledge effectively. Finally, we
conclude the paper with discussion on contributions to
research and implications to practice.
2 The e-Learning environment
An important aspect of KM is the transferring and
sharing of knowledge as opposed to dissemination of
information. For the knowledge to be successfully transferred
and shared there has to be a close interaction between the
student, instructor, learning content and peers in the class.
The e-Learning environment differs from traditional learning
environment in many ways. First, the e-Learning
environment allows both synchronous and asynchronous
learning unlike traditional environment where synchronous
learning is the most common form. The learning in the e-
Learning context is generally self-paced, with zero to many
virtual interactions using tools such as virtual lecture halls,
Skype, chats, discussions and so forth. Second, students tend
to be afraid to ask questions in traditional settings, which
lowers participation, while students in online learning ask
them easily [3]. T h i rd , equal contributions from each
learner can occur in the environment of e-Learning, while
Int'l Conf. e-Learning, e-Bus., EIS, and e-Gov. | EEE'13 | 17
traditional methods must move on to the next lesson to
accommodate their time periods which will leave out
crucial contributions from students. Fourth, online
education allows more time for the individuals to mediate
about the situation and assert an effective meaningful
response. Fifth, e-Learning environment requires the students
to have access to technology and be competent in using the
required technology to access the course content. Traditional
methods will not need technology access and can press on
without these types of amenities. The lack of this feature will
create a technology access barrier against the student in the
knowledge transfer of an e-Learning environment [4]. Several
other differences exist between these two learning
environments, but the above discussion facilitates crucial
facets of e-Learning.
3 Knowledge
Knowledge is the accumulation and awareness of
information, facts, ideas and principles. It can be acquired
by study, investigation, observation and experience.
Knowledge management is critical in harnessing these
varieties of knowledge [6, 7]. Knowledge is the main capital
of knowledge workers and exists in a variety of forms and
media [5]. Knowledge can be explicit or tacit [1, 7]. The
combination of explicit and tacit knowledge makes up the
learning content in e-Learning. Knowledge management is
critical in harnessing these types of knowledge [6, 7].
3.1 Explicit knowledge
Explicit knowledge is knowledge that is consciously
understood and can be formally articulated, codified and
documented [1]. Explicit knowledge exists in forms of
words, documents, computer programs or other means [8].
Content management systems such as Blackboard and Web-
CT support the creation, storage and distribution of
explicit knowledge. The course administrator can upload
the explicit knowledge content into the knowledge
repository for the students to retrieve and review at any
time during the lesson. Non-existence of this content
material will lead the individuals to failure. In the
environment of e-Learning, this is a crucial aspect since
face-to-face meetings do not exist.
3.2 Tacit knowledge
Unlike explicit knowledge, tacit knowledge is
subconsciously understood and applied. It is very difficult
and challenging to articulate, share and leverage this type of
knowledge. Generally speaking, tacit knowledge includes
personal experiences, judgment, skills, individual expertise
and integrates human factors such as beliefs, perspectives and
culture that make it very difficult to interpret [4]. Because of
“tacit-ness” in knowledge, it is not feasible to capture it in a
report or a power point slide. In the e-Learning environment,
articulation and sharing of tacit knowledge requires highly
interactive conversations, shared experiences and the use of
appropriate knowledge transfer techniques, such as
storytelling, mentoring, content maps, tools and technologies
that have the capability to support rich media.
The online environment can have sufficient explicit
materials, but the lack of tacit knowledge will lead to
confusion of the subject matter and the inability to complete
the lesson. An example is in programming, the student might
learn the syntax of the language that resembles the explicit
knowledge but not the actual logic behind the coding, which
is the tacit knowledge. Tacit knowledge is vital to increasing
the learning and knowledge transfer [4]. Several instructors
exhibits different levels of tacit knowledge due to their field
experience and overall wisdom and it is important that this
knowledge be shared with the students.
4 Knowledge transfer
Depending on the knowledge type, four different
processes are involved in knowledge conversion and transfer
[1]. These are socialization, externalization, combination and
internalization [1]. Table 1 presents Nonaka and Takeuchi’s
KM model [1].
Table 1: Nonaka and Takeuchi’s KM model [1]
Nonaka and Takeuchi’s KM model [1]
From
To
Tacit Explicit
Tacit Socialization Externalization
Explicit Internalization Combination
• Socialization involves transferring tacit knowledge from
one person to another person through socializing and
exchanging of ideas and experiences.
• Externalization involves articulating and translating tacit
knowledge into explicit knowledge and storing it in a
repository.
• Internalization involves acquiring explicit knowledge from
repositories, books, Internet and other public sources and
internalizing it, where upon it becomes tacit knowledge.
• Combination involves combining explicit knowledge from
multiple sources to create new explicit knowledge.
4.1 Knowledge transfer in e-Learning
The current students’ obtainment of knowledge requires
a successful learning strategy from the instructor and an
adequate feedback mechanism to determine the potency of
the overall transfer of knowledge in each lesson. The
feedback mechanism will serve to instill changes in the
18 Int'l Conf. e-Learning, e-Bus., EIS, and e-Gov. | EEE'13 |
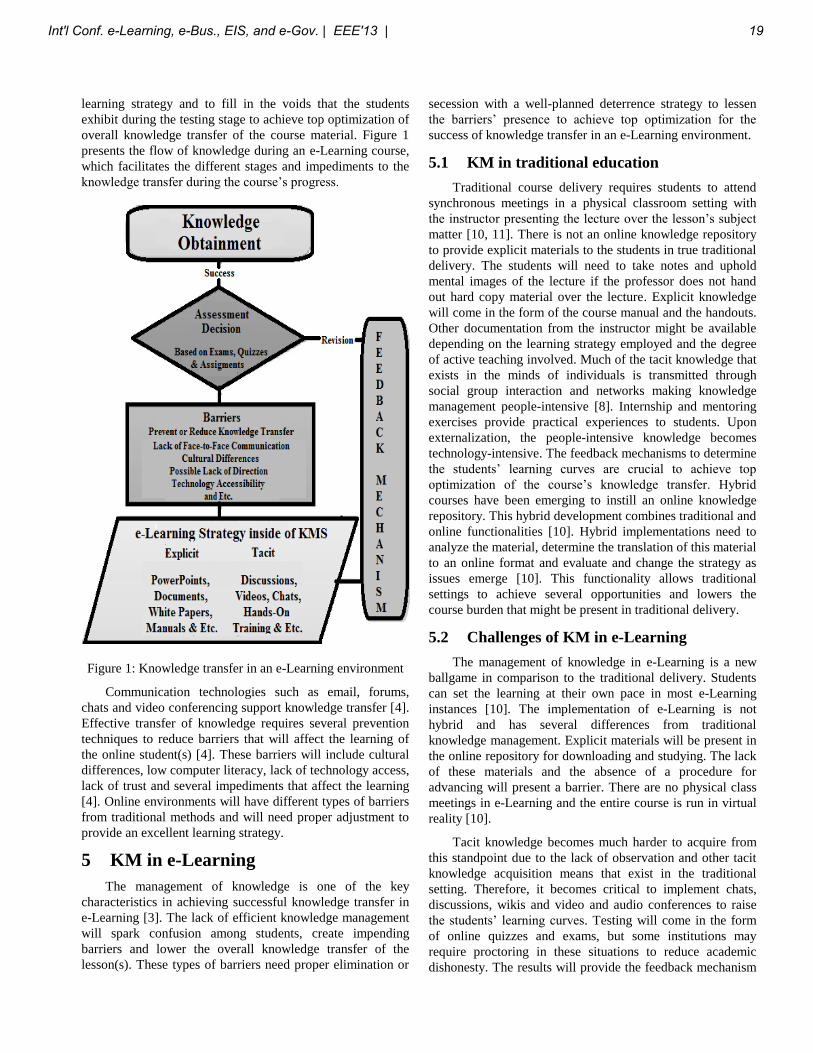
learning strategy and to fill in the voids that the students
exhibit during the testing stage to achieve top optimization of
overall knowledge transfer of the course material. Figure 1
presents the flow of knowledge during an e-Learning course,
which facilitates the different stages and impediments to the
knowledge transfer during the course’s progress.
Figure 1: Knowledge transfer in an e-Learning environment
Communication technologies such as email, forums,
chats and video conferencing support knowledge transfer [4].
Effective transfer of knowledge requires several prevention
techniques to reduce barriers that will affect the learning of
the online student(s) [4]. These barriers will include cultural
differences, low computer literacy, lack of technology access,
lack of trust and several impediments that affect the learning
[4]. Online environments will have different types of barriers
from traditional methods and will need proper adjustment to
provide an excellent learning strategy.
5 KM in e-Learning
The management of knowledge is one of the key
characteristics in achieving successful knowledge transfer in
e-Learning [3]. The lack of efficient knowledge management
will spark confusion among students, create impending
barriers and lower the overall knowledge transfer of the
lesson(s). These types of barriers need proper elimination or
secession with a well-planned deterrence strategy to lessen
the barriers’ presence to achieve top optimization for the
success of knowledge transfer in an e-Learning environment.
5.1 KM in traditional education
Traditional course delivery requires students to attend
synchronous meetings in a physical classroom setting with
the instructor presenting the lecture over the lesson’s subject
matter [10, 11]. There is not an online knowledge repository
to provide explicit materials to the students in true traditional
delivery. The students will need to take notes and uphold
mental images of the lecture if the professor does not hand
out hard copy material over the lecture. Explicit knowledge
will come in the form of the course manual and the handouts.
Other documentation from the instructor might be available
depending on the learning strategy employed and the degree
of active teaching involved. Much of the tacit knowledge that
exists in the minds of individuals is transmitted through
social group interaction and networks making knowledge
management people-intensive [8]. Internship and mentoring
exercises provide practical experiences to students. Upon
externalization, the people-intensive knowledge becomes
technology-intensive. The feedback mechanisms to determine
the students’ learning curves are crucial to achieve top
optimization of the course’s knowledge transfer. Hybrid
courses have been emerging to instill an online knowledge
repository. This hybrid development combines traditional and
online functionalities [10]. Hybrid implementations need to
analyze the material, determine the translation of this material
to an online format and evaluate and change the strategy as
issues emerge [10]. This functionality allows traditional
settings to achieve several opportunities and lowers the
course burden that might be present in traditional delivery.
5.2 Challenges of KM in e-Learning
The management of knowledge in e-Learning is a new
ballgame in comparison to the traditional delivery. Students
can set the learning at their own pace in most e-Learning
instances [10]. The implementation of e-Learning is not
hybrid and has several differences from traditional
knowledge management. Explicit materials will be present in
the online repository for downloading and studying. The lack
of these materials and the absence of a procedure for
advancing will present a barrier. There are no physical class
meetings in e-Learning and the entire course is run in virtual
reality [10].
Tacit knowledge becomes much harder to acquire from
this standpoint due to the lack of observation and other tacit
knowledge acquisition means that exist in the traditional
setting. Therefore, it becomes critical to implement chats,
discussions, wikis and video and audio conferences to raise
the students’ learning curves. Testing will come in the form
of online quizzes and exams, but some institutions may
require proctoring in these situations to reduce academic
dishonesty. The results will provide the feedback mechanism
Int'l Conf. e-Learning, e-Bus., EIS, and e-Gov. | EEE'13 | 19
to implement new materials in the knowledge repository that
will help with the students’ weaknesses. Another barrier in
online setting is cultural differences. Online learning can
harness worldwide or regional cultures that differ widely and
may cause issues such as the ones with language and
linguistics [4]. A last barrier in e-Learning is the lack of trust
that appears in the online environment [4]. Students do not
meet the instructor(s) and therefore may not establish an
emotional bond that facilitates knowledge transfer. This can
create distrust and cause the student(s) to create a mental
block since these individuals are not sure over the legitimacy
of the material or about bias presentation from the individual.
6 Improving KM in e-Learning
Knowledge management (KM) has various paths to
establish sufficient knowledge transfer in e-Learning. A
successful learning strategy or pedagogy with high degree of
knowledge management in the online repository will raise
knowledge transfer and the overall students’ learning curves.
6.1 Media richness
A communication channel facilitates interaction and
sharing of knowledge among individuals. Examples of few
online communication channels include video conferencing,
teleconferencing, chats and the use of social networking tools
such as Web 2.0 technologies. Per media richness theory [2],
each of these channels has its own advantages and
disadvantages and as such is more suited to transfer particular
type of knowledge over the other. The media richness is the
ability of a medium to transfer information and has lean and
rich implementations for each of the two types of knowledge
[12]. Lean material will include electronic mails,
documentation, asynchronous audio and discussions that are
common in either learning methods. Video conferencing,
face-to-face communication, and several other interactive
tools facilitate rich media into an e-Learning environment.
Any medium typically has two types of capacities to carry
information. These are the data carrying capacity and the
symbol carrying capacity [12]. The data carrying capacity is
the ability to transmit overall information such as the
throughput [12]. The symbol carrying capacity refers to the
ability to carry metadata over the situation [12].
Media richness theory defines the richness of a medium
as its capability to reduce uncertainty and equivocality in the
information presented. It asserts that matching the richness of
medium to the task improves the performance of the task.
Further, it claims that richer media is better at supporting
tasks that have both uncertainty and equivocality built into
them. Rich media such as face to face interaction, video
conferencing facilitates users to communicate effectively by
allowing them to convey multiple cues (body language, facial
expressions, voice tone etc.), immediate feedback,
personalization and language variety, thus, improving the
performance of the tasks. Alternatively, lean media is better
suited to less equivocal tasks. The choice of media used to
present contents in an e-Learning program influences how
effectively knowledge is transferred and shared among the
learners in the e-Learning course. For instance, lean media
may be sufficient to transfer explicit knowledge. However,
rich media is necessary to facilitate the effective transfer of
tacit knowledge that requires high interactive conversations,
shared experiences and use of knowledge transfer techniques.
6.2 Research Framework for improving KM
in e-Learning
Our research framework is grounded theoretically in the
knowledge creation theory [1] and the media richness theory
[2]. Based on theoretical conceptualizations of these theories,
we have assessed the various communication media, KM
techniques, tools and technologies for their potential to allow
transferring and sharing of knowledge in the e-Learning
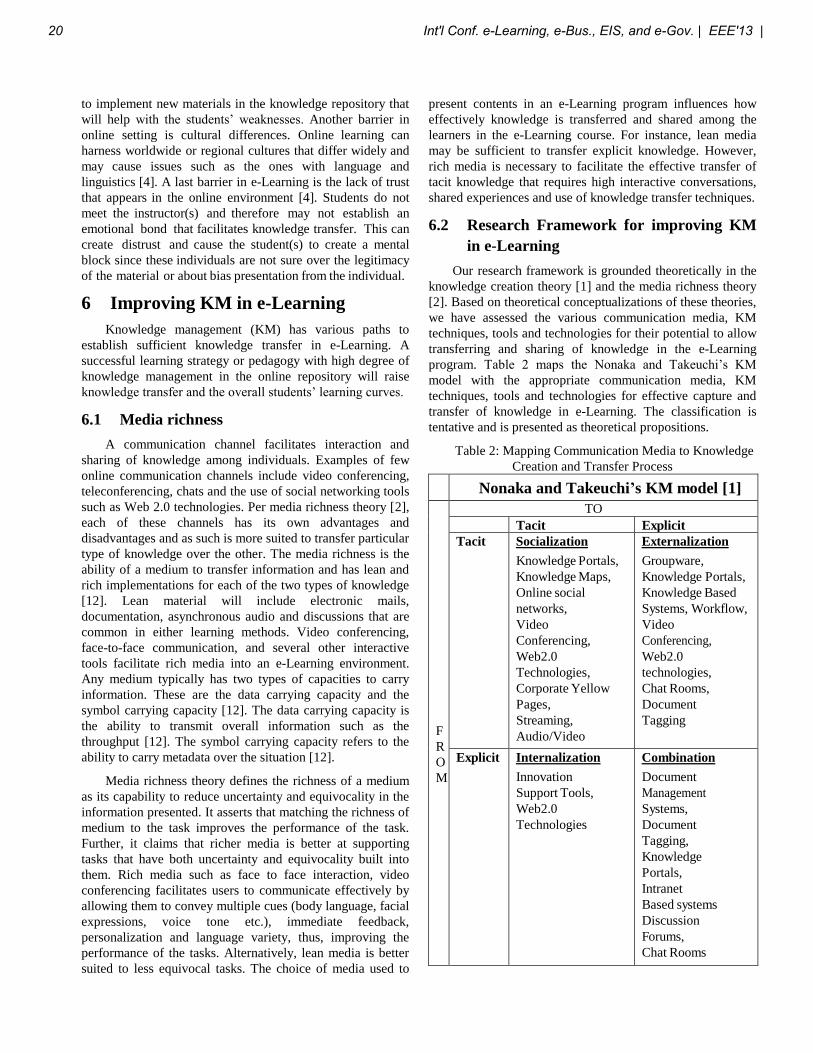
program. Table 2 maps the Nonaka and Takeuchi’s KM
model with the appropriate communication media, KM
techniques, tools and technologies for effective capture and
transfer of knowledge in e-Learning. The classification is
tentative and is presented as theoretical propositions.
Table 2: Mapping Communication Media to Knowledge
Creation and Transfer Process
Nonaka and Takeuchi’s KM model [1]
F
R
O
M
TO
Tacit Explicit Tacit Socialization
Knowledge Portals,
Knowledge Maps,
Online social
networks,
Video
Conferencing,
Web2.0
Technologies,
Corporate Yellow
Pages,
Streaming,
Audio/Video
Externalization
Groupware,
Knowledge Portals,
Knowledge Based
Systems, Workflow,
Video
Conferencing,
Web2.0
technologies,
Chat Rooms,
Document
Tagging
Explicit Internalization
Innovation
Support Tools,
Web2.0
Technologies
Combination
Document
Management
Systems,
Document
Tagging,
Knowledge
Portals,
Intranet
Based systems
Discussion
Forums,
Chat Rooms
20 Int'l Conf. e-Learning, e-Bus., EIS, and e-Gov. | EEE'13 |
E-Learning technologies coupled with KM facilitate
each of these different types of knowledge creation and
conversion processes and allow a high level of knowledge
transfer. Socialization requires the creation of a collaborative
learning environment between the instructor and the students
as well as among the students. Online social networks such as
Facebook, Twitter, Web 2.0 technologies, knowledge portals
and knowledge maps facilitate tacit to tacit knowledge
transfer by identifying and promoting high interaction among
students and instructors with special interests, shared
experiences and knowledge. Online social networks often
function as virtual lounges wherein instructor and students
can converse with one-to-one, one-to-many, and many-to-
many students and collaborate on their school work. Social
networking sites such as KnowledgeBook, BookTag, and
SlideShare are known to facilitate knowledge dissemination.
Externalization involves articulation and translation of
tacit knowledge into explicit knowledge and storing it in a
repository. The knowledge of instructors and other learners in
the e-Learning course can be captured and represented using
appropriate knowledge transfer mechanisms and can be made
available for reuse by others. Some tools that externalize
knowledge in e-Learning include content maps, knowledge
portals, synchronous and asynchronous groupware,
application sharing, instant messaging and learning
management systems. Internalization involves acquiring
explicit knowledge from repositories, books, the Internet and
other public sources then internalizing it, where upon it
becomes a tacit knowledge. Several e-Learning media such as
Web 2.0 technologies, including wikis and blogs, foster an
innovative learning environment. Finally, the combination
technique creates new knowledge in the e-Learning course
using knowledge portals, document management systems,
document tagging and other means. Pedagogical techniques
can also be included in this process.
6.3 Document tagging
E-Learning materials are exponentially rising in quantity
causing difficulty to organize and disseminate materials with
the abundant information [13]. Large collections of
knowledge will become harder to sift through and can cause
delays and confusion. Achieving the ability to index materials
is crucial to the classification and the dissemination of
knowledge in an online repository. Archiving knowledge will
help with successful searching and rendering of information
inside the knowledge repository and raise the efficiency of
the overall knowledge transfer. Marking the documentation
with descriptive tags becomes a common method of
accomplishing efficient future searches [13]. Instilling this
ability into the knowledge will allow efficient results during
searching to the actual information that the user needed and
eliminate false positives.
There is a great demand for knowledge and information
causing information overload which is a serious issue [14].
Information overload is a critical barrier during a student’s
knowledge transfer and reduction of the said will prove vital
to successful knowledge transfer. Adobe Acrobat, FileFold
and several other knowledge control programs allow
metadata tagging with certain versions for portable document
formats or other documents with simple processes. Another
example is Meta tags in HTML documentation that will
permit the parser to optimize search engine results and the
browser’s behavior. A last method is document clustering,
which help group documents and ensure effectiveness with
the proper usage of algorithms to improve accuracy with
similarity matrices and probabilistic methods [14]. Instilling
these types of metadata functionalities in the material will
improve overall knowledge management and benefit the
courses’ knowledge transfer in the e-Learning environment.
6.4 Yellow/White Pages
An expert directory is another managerial technique that
exists to allow a source of obtainment for human capital and
their respective knowledge. Yellow Pages, or sometimes
referred to as White Pages, are essentially a list of available
experts, expertise and contact information [15]. Yellow
Pages foster knowledge communication between co- workers
through the meta-knowledge of experts, but do not maintain
the actual knowledge [15]. Tacit knowledge becomes highly
available with this system and will help improve productivity
and flexibility in these organizations. In the event of the
necessity of knowledge to incur competitive advantage, then
the recipient(s) can review the Yellow Pages and deduce
possible knowledge sources over the particular topic for their
specific issue. Large pools of employees from different
geographical locations disallow the ability to personally
know each of these individuals [15].
Keeping the system up-to-date is critical for efficient
knowledge management. Personal ownership abilities to
update their own respective instance will help eliminate the
principles of neglect and ignorance with ensured
participation. Initiating this directory into an easy to access
area and reminding the users of its existence is another key
aspect. The benefits from Yellow Pages are manifold. The
institution will be able to identify who knows what and share
the knowledge to gain competitive advantage [15]. The
dissemination of knowledge is crucial for sufficient
knowledge transfer to e-Learning students. Lack of expert
directories such as yellow/white pages in the institution will
incur a learning barrier and prevent successful student
learning curves or development of pedagogies for instructors.
6.5 Combining course instances
Many universities generally have multiple sections for
some of the courses taught each semester. Often, the
instructors teaching different sections have different levels of
tacit and explicit knowledge depending on their field
experiences and other factors. Also, the teaching methods
they employ are different. While some are proactive and
provide all the content materials needed to maximize the
Int'l Conf. e-Learning, e-Bus., EIS, and e-Gov. | EEE'13 | 21
student’s learning, others may provide minimal content. This
creates an impediment that will cause unfairness between
these course sections and will cause few of the students not to
achieve their full potential. A simple remedy is to store all the
important content materials in a centralized repository and
give students and instructors to access it.
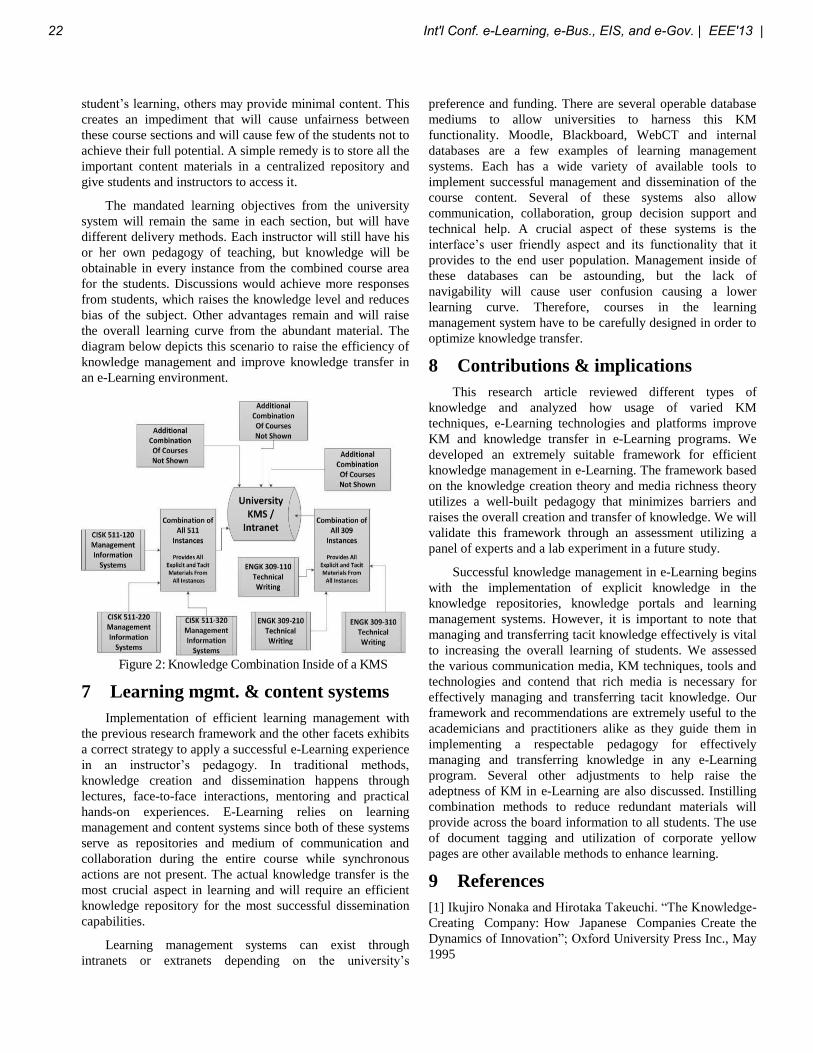
The mandated learning objectives from the university
system will remain the same in each section, but will have
different delivery methods. Each instructor will still have his
or her own pedagogy of teaching, but knowledge will be
obtainable in every instance from the combined course area
for the students. Discussions would achieve more responses
from students, which raises the knowledge level and reduces
bias of the subject. Other advantages remain and will raise
the overall learning curve from the abundant material. The
diagram below depicts this scenario to raise the efficiency of
knowledge management and improve knowledge transfer in
an e-Learning environment.
Figure 2: Knowledge Combination Inside of a KMS
7 Learning mgmt. & content systems
Implementation of efficient learning management with
the previous research framework and the other facets exhibits
a correct strategy to apply a successful e-Learning experience
in an instructor’s pedagogy. In traditional methods,
knowledge creation and dissemination happens through
lectures, face-to-face interactions, mentoring and practical
hands-on experiences. E-Learning relies on learning
management and content systems since both of these systems
serve as repositories and medium of communication and
collaboration during the entire course while synchronous
actions are not present. The actual knowledge transfer is the
most crucial aspect in learning and will require an efficient
knowledge repository for the most successful dissemination
capabilities.
Learning management systems can exist through
intranets or extranets depending on the university’s
preference and funding. There are several operable database
mediums to allow universities to harness this KM
functionality. Moodle, Blackboard, WebCT and internal
databases are a few examples of learning management
systems. Each has a wide variety of available tools to
implement successful management and dissemination of the
course content. Several of these systems also allow
communication, collaboration, group decision support and
technical help. A crucial aspect of these systems is the
interface’s user friendly aspect and its functionality that it
provides to the end user population. Management inside of
these databases can be astounding, but the lack of
navigability will cause user confusion causing a lower
learning curve. Therefore, courses in the learning
management system have to be carefully designed in order to
optimize knowledge transfer.
8 Contributions & implications
This research article reviewed different types of
knowledge and analyzed how usage of varied KM
techniques, e-Learning technologies and platforms improve
KM and knowledge transfer in e-Learning programs. We
developed an extremely suitable framework for efficient
knowledge management in e-Learning. The framework based
on the knowledge creation theory and media richness theory
utilizes a well-built pedagogy that minimizes barriers and
raises the overall creation and transfer of knowledge. We will
validate this framework through an assessment utilizing a
panel of experts and a lab experiment in a future study.
Successful knowledge management in e-Learning begins
with the implementation of explicit knowledge in the
knowledge repositories, knowledge portals and learning
management systems. However, it is important to note that
managing and transferring tacit knowledge effectively is vital
to increasing the overall learning of students. We assessed
the various communication media, KM techniques, tools and
technologies and contend that rich media is necessary for
effectively managing and transferring tacit knowledge. Our
framework and recommendations are extremely useful to the
academicians and practitioners alike as they guide them in
implementing a respectable pedagogy for effectively
managing and transferring knowledge in any e-Learning
program. Several other adjustments to help raise the
adeptness of KM in e-Learning are also discussed. Instilling
combination methods to reduce redundant materials will
provide across the board information to all students. The use
of document tagging and utilization of corporate yellow
pages are other available methods to enhance learning.
9 References
[1] Ikujiro Nonaka and Hirotaka Takeuchi. “The Knowledge-
Creating Company: How Japanese Companies Create the
Dynamics of Innovation”; Oxford University Press Inc., May
1995
22 Int'l Conf. e-Learning, e-Bus., EIS, and e-Gov. | EEE'13 |

[2] Richard Daft and Robert Lengel. “Organizational
Information Requirements, Media Richness and Structural
Design”; Management Science, Vol. 32, No. 5, 554-571,
1986
[3] Md. Shiful Islam, Susumu Kunifuji, Motoki Miura and
Tessai Hayama. “Adopting Knowledge Management in an E-
learning System: Insights and Views of KM and EL Research
Scholars”; Knowledge Management & E-Learning: An
International Journal, Vol.3 No. 3, 375-398, 2011
[4] Nthaniel David Oye, Mazleena Salleh and N.A. Iahad.
“E-Learning Barriers and Solutions to Knowledge
Management and Transfer”; Information Management and
Business Review, Vol. 3 No. 6, 366-372, Dec 2011
[5] Linh-Chi Vo. “Pragmatist Perspective on Knowledge
and Knowledge Management in Organizations”; International
Business Research (Canadian Center of Science and
Education), Vol. 5 No. 9, 78-88, Aug 2012
[6] Rifat Shannak, Ra'ed Masa'deh, Zu'bi Al-Zu'bi, Bader
Obeidat, Muhammad Alshurideh and Hamzah Altamony. “A
Theoretical Perspective on the Relationship between
Knowledge Management Systems, Customer Knowledge
Management, and Firm Competitive Advantage”; European
Journal Of Social Science, Vol. 32 No. 4, 520-532, Aug 2012
[7] Rana Geeta. “Knowledge Management and E-Learning
Activities in the 21st Century to attain Competitive
Advantage”; Advances In Management, Vol. 3 Issue 5, 54-
56, May 2010
[8] William King. “Knowledge Management and
Organizational Learning”; Annals of Information Systems
(Springer-Verlag), Vol. 4, June 2009
[9] Samantha Murray and Joseph Peyrefitte. “Knowledge
Type and Communication Media Choice in the Knowledge
Transfer Process”; Journal of Managerial Issues Vol. 19 No.
1, 111-133, Mar 2007
[10] Genie Black. “A Comparison of Traditional, Online, and
Hybrid Methods of Course Delivery”; Journal of Business
Administration Online, Vol. 1 No. 1, 2002
[11] Roy Howsen and Stephen Lile. “A Comparison of
Course Delivery Methods: An Exercise in Experimental
Economics”; Journal of Economics and Finance Education,
Vol. 7 No. 1, 21-28, Mar 2007
[12] Linda Trevino, Robert Lengel and Richard Daft. “Media
Symbolism, Media Richness, and Media Choice in
Organizations : A Symbolic Interactionist Perspective”;
Communication Research: An International Quarterly, Vol 14
No. 5, 553-574, Oct 1987
[13] Daiga Bekere and Sarma Cakula. “Modeling of
Collaborative Tagging Services for Sharing and Reusing E-
learning Materials on the Web”; ICTE In Regional
Development: 2008 Annual Proceedings, 65-72, 2008
[14] Kam-Fai Wong, Nam-Kiu Chan and Kam-Lai Wong.
“Improving Document Clustering by Utilizing Meta-Data”;
In Proceedings of the Sixth International Workshop on
Information Retrieval with Asian Languages (Association for
Computational Linguistics), Vol 11, 109-115, July 2003
[15] Stéphanie Gretsch, Heinz Mandl and Raphaela Schätz.
“Implementation Process of a Knowledge Management
Initiative: Yellow Pages”; New Research on Knowledge:
Management Models and Methods, 311-332, Mar 2012
Int'l Conf. e-Learning, e-Bus., EIS, and e-Gov. | EEE'13 | 23
Design of Structured Syllabus and Subject Ontology for
Adaptive Learning
Hyun-Sook Chung1, Jung-Min Kim
2, and Eun-Ok Baek
2
1Department of Computer Engineering, Chosun University, Gwangju, South Korea 2Department of Computer Engineering, Daejin University, Pocheon, South Korea
3Science, Math & Technology Education, CSU San Bernardino, San Bernardino, CA, USA
Abstract - In this paper, we introduce our e-learning project
that aims to make of creation, integration and interfacing of
multiple ontologies on different layers, i.e. Curriculum
ontology, Syllabus ontology, and Subject ontology. The
primary objective of our project is to develop ontology-based
e-learning support system which allows learners to build
adaptive learning paths through understanding curriculum,
syllabuses, and subjects of courses deeply. In this paper, we
introduce our ontology model and propose an effective
method for enhancing learning effect of students through
construction of subject ontology. The subject ontology of a
certain course is composed of an ontology made by a teacher
and many ontologies made by students. It is used in discussion,
visual presentation, and knowledge sharing between
instructor and students. We used the subject ontology in two
lectures in practice and found that the subject ontology
enhances learning effect of students in according to the
analysis of feedbacks of students.
Keywords: curriculum, e-learning, learning path, ontology,
syllabus
1 Introduction
Until now, ontology engineering has been applied in
order to conceptualize knowledge of many different domains
including education. Recently, lots of researches performed in
order to apply Semantic Web technologies including ontology
engineering to intelligent e-learning system development[1].
The researches applying ontology technology to education
field are classified into curriculum or syllabus ontology
creation[2],[3], ontology-based learning object organization,
and ontology-based learning contents retrieval. The studies
for education ontology creation include curriculum ontology
creation[4] and personal subject ontology creation[5].
Mizoguchi[6],[7] proposed a ontology-based solution to solve
several problems caused by intelligent instructional systems.
Another works defined metadata of learning objects and
learning path including curriculum based on ontology
engineering technology[8],[9]. These works concentrated on
management of learning objects and materials and
performance enhancement of instructional systems. Ontology
technology, however, can be used to make the knowledge
structure, which improves the interaction among teachers and
students and enables spontaneous learning of students, of
teaching contents and learning materials of students based on
semantic information[10].
Our e-learning project aims to make of creation, integration
and interfacing of multiple ontologies on different layers, i.e.
Curriculum ontology, Syllabus ontology, and Subject
ontology. The primary objective of our project is to develop
ontology-based e-learning support system which allows
learners to build adaptive learning paths through
understanding curriculum, syllabuses, and subjects of courses
deeply. In this paper, we introduce our ontology model and
propose an effective method for enhancing learning effect of
students through constructing learner-based ontologies in
which knowledge discovered by students is conceptualized
and organized. Learner-based ontologies can be merged into
teacher-based ontologies which conceptualize teaching
contents in classes. Thus, our subject ontology is composed of
teacher-based ontologies and learner-based ontologies.
Teachers and students share and understand knowledge of
learning materials based on learning ontologies.
This paper is structured as follows. Section 2 provides an
overview of the layered structure of our learning ontologies.
Section 3 represents the revised syllabus structure for
supporting adaptive learning of students. We describe the
hierarchical structure of subject ontology in Section 4. Section
5 shows the experimental result and in the end the paper
presents our conclusion in Section 6.
2 The structure of learning ontologies
Commonly, a curriculum can be represented as a set of
description of courses and syllabuses. A syllabus, which is
identification and skeleton of a course, can be represented as a
collection of several kinds of resources related to a certain
course. We design the curriculum ontology in order to
organize various semantic relationships, which include
hasSubtype, prerequisiteOf, basicOf, advancedOf,
combinedOf, and so on, existing between individual. The
curriculum ontology conceptualizes the knowledge of
curricula concepts, i.e. ProgramOfStudy, Course, KeyConcept,
24 Int'l Conf. e-Learning, e-Bus., EIS, and e-Gov. | EEE'13 |
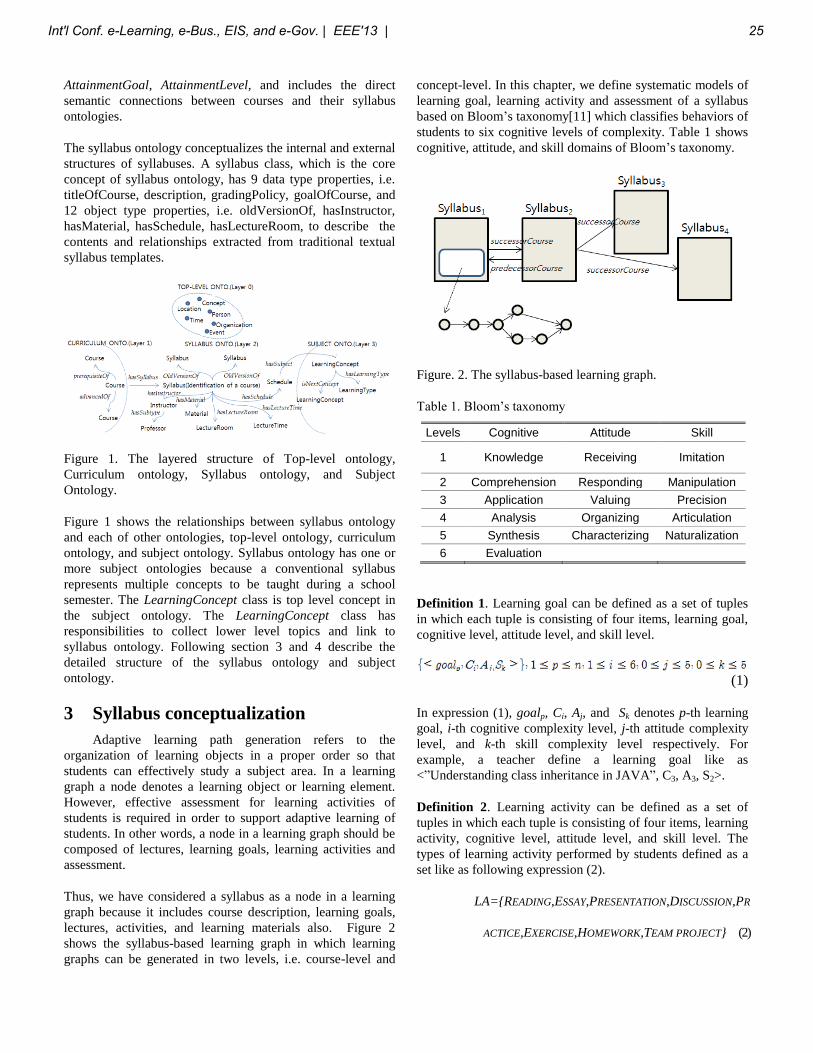
AttainmentGoal, AttainmentLevel, and includes the direct
semantic connections between courses and their syllabus
ontologies.
The syllabus ontology conceptualizes the internal and external
structures of syllabuses. A syllabus class, which is the core
concept of syllabus ontology, has 9 data type properties, i.e.
titleOfCourse, description, gradingPolicy, goalOfCourse, and
12 object type properties, i.e. oldVersionOf, hasInstructor,
hasMaterial, hasSchedule, hasLectureRoom, to describe the
contents and relationships extracted from traditional textual
syllabus templates.
Figure 1. The layered structure of Top-level ontology,
Curriculum ontology, Syllabus ontology, and Subject
Ontology.
Figure 1 shows the relationships between syllabus ontology
and each of other ontologies, top-level ontology, curriculum
ontology, and subject ontology. Syllabus ontology has one or
more subject ontologies because a conventional syllabus
represents multiple concepts to be taught during a school
semester. The LearningConcept class is top level concept in
the subject ontology. The LearningConcept class has
responsibilities to collect lower level topics and link to
syllabus ontology. Following section 3 and 4 describe the
detailed structure of the syllabus ontology and subject
ontology.
3 Syllabus conceptualization
Adaptive learning path generation refers to the
organization of learning objects in a proper order so that
students can effectively study a subject area. In a learning
graph a node denotes a learning object or learning element.
However, effective assessment for learning activities of
students is required in order to support adaptive learning of
students. In other words, a node in a learning graph should be
composed of lectures, learning goals, learning activities and
assessment.
Thus, we have considered a syllabus as a node in a learning
graph because it includes course description, learning goals,
lectures, activities, and learning materials also. Figure 2
shows the syllabus-based learning graph in which learning
graphs can be generated in two levels, i.e. course-level and
concept-level. In this chapter, we define systematic models of
learning goal, learning activity and assessment of a syllabus
based on Bloom’s taxonomy[11] which classifies behaviors of
students to six cognitive levels of complexity. Table 1 shows
cognitive, attitude, and skill domains of Bloom’s taxonomy.
Figure. 2. The syllabus-based learning graph.
Table 1. Bloom’s taxonomy
Levels Cognitive Attitude Skill
1 Knowledge Receiving Imitation
2 Comprehension Responding Manipulation
3 Application Valuing Precision
4 Analysis Organizing Articulation
5 Synthesis Characterizing Naturalization
6 Evaluation
Definition 1. Learning goal can be defined as a set of tuples
in which each tuple is consisting of four items, learning goal,
cognitive level, attitude level, and skill level.
(1)
In expression (1), goalp, Ci, Aj, and Sk denotes p-th learning
goal, i-th cognitive complexity level, j-th attitude complexity
level, and k-th skill complexity level respectively. For
example, a teacher define a learning goal like as
<”Understanding class inheritance in JAVA”, C3, A3, S2>.
Definition 2. Learning activity can be defined as a set of
tuples in which each tuple is consisting of four items, learning
activity, cognitive level, attitude level, and skill level. The
types of learning activity performed by students defined as a
set like as following expression (2).
LA={READING,ESSAY,PRESENTATION,DISCUSSION,PR
ACTICE,EXERCISE,HOMEWORK,TEAM PROJECT} (2)
Int'l Conf. e-Learning, e-Bus., EIS, and e-Gov. | EEE'13 | 25
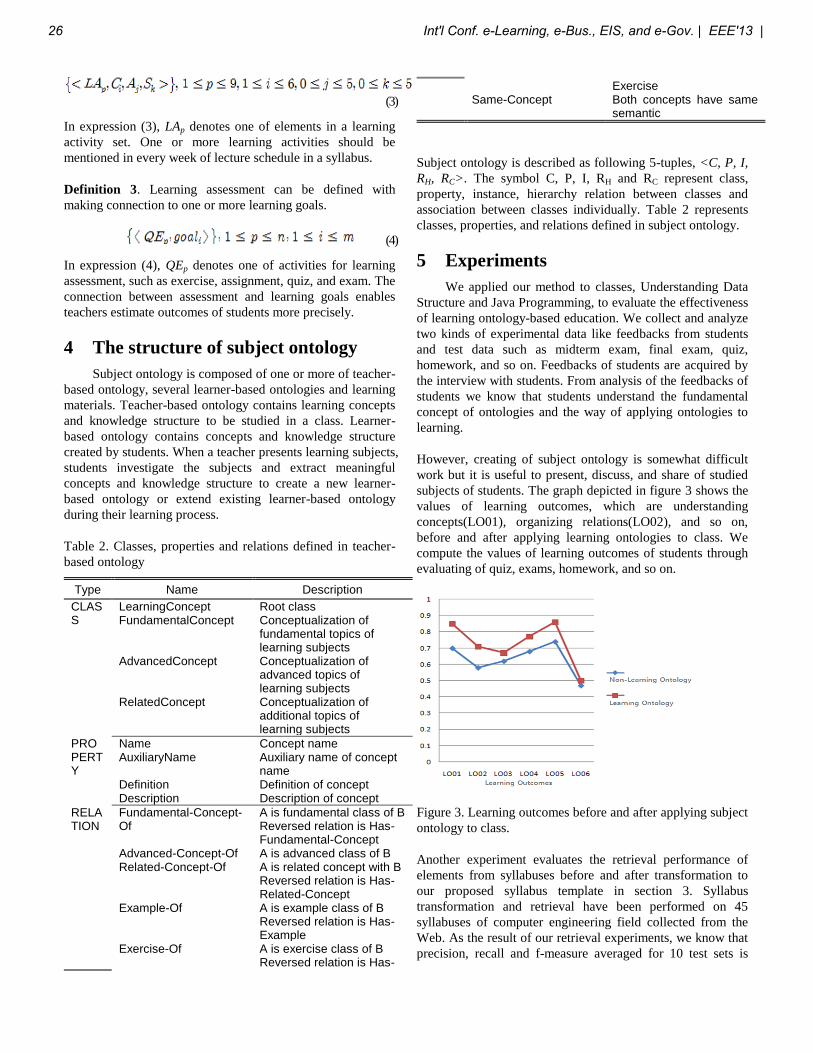
(3)
In expression (3), LAp denotes one of elements in a learning
activity set. One or more learning activities should be
mentioned in every week of lecture schedule in a syllabus.
Definition 3. Learning assessment can be defined with
making connection to one or more learning goals.
(4)
In expression (4), QEp denotes one of activities for learning
assessment, such as exercise, assignment, quiz, and exam. The
connection between assessment and learning goals enables
teachers estimate outcomes of students more precisely.
4 The structure of subject ontology
Subject ontology is composed of one or more of teacher-
based ontology, several learner-based ontologies and learning
materials. Teacher-based ontology contains learning concepts
and knowledge structure to be studied in a class. Learner-
based ontology contains concepts and knowledge structure
created by students. When a teacher presents learning subjects,
students investigate the subjects and extract meaningful
concepts and knowledge structure to create a new learner-
based ontology or extend existing learner-based ontology
during their learning process.
Table 2. Classes, properties and relations defined in teacher-
based ontology
Type Name Description
CLASS
LearningConcept Root class FundamentalConcept Conceptualization of
fundamental topics of learning subjects
AdvancedConcept Conceptualization of advanced topics of learning subjects
RelatedConcept
Conceptualization of additional topics of learning subjects
PROPERTY
Name Concept name AuxiliaryName Auxiliary name of concept
name Definition Definition of concept Description Description of concept
RELATION
Fundamental-Concept-Of
A is fundamental class of B Reversed relation is Has-Fundamental-Concept
Advanced-Concept-Of A is advanced class of B Related-Concept-Of A is related concept with B
Reversed relation is Has-Related-Concept
Example-Of A is example class of B Reversed relation is Has-Example
Exercise-Of A is exercise class of B Reversed relation is Has-
Exercise
Same-Concept Both concepts have same semantic
Subject ontology is described as following 5-tuples, <C, P, I,
RH, RC>. The symbol C, P, I, RH and RC represent class,
property, instance, hierarchy relation between classes and
association between classes individually. Table 2 represents
classes, properties, and relations defined in subject ontology.
5 Experiments
We applied our method to classes, Understanding Data
Structure and Java Programming, to evaluate the effectiveness
of learning ontology-based education. We collect and analyze
two kinds of experimental data like feedbacks from students
and test data such as midterm exam, final exam, quiz,
homework, and so on. Feedbacks of students are acquired by
the interview with students. From analysis of the feedbacks of
students we know that students understand the fundamental
concept of ontologies and the way of applying ontologies to
learning.
However, creating of subject ontology is somewhat difficult
work but it is useful to present, discuss, and share of studied
subjects of students. The graph depicted in figure 3 shows the
values of learning outcomes, which are understanding
concepts(LO01), organizing relations(LO02), and so on,
before and after applying learning ontologies to class. We
compute the values of learning outcomes of students through
evaluating of quiz, exams, homework, and so on.
Figure 3. Learning outcomes before and after applying subject
ontology to class.
Another experiment evaluates the retrieval performance of
elements from syllabuses before and after transformation to
our proposed syllabus template in section 3. Syllabus
transformation and retrieval have been performed on 45
syllabuses of computer engineering field collected from the
Web. As the result of our retrieval experiments, we know that
precision, recall and f-measure averaged for 10 test sets is
26 Int'l Conf. e-Learning, e-Bus., EIS, and e-Gov. | EEE'13 |
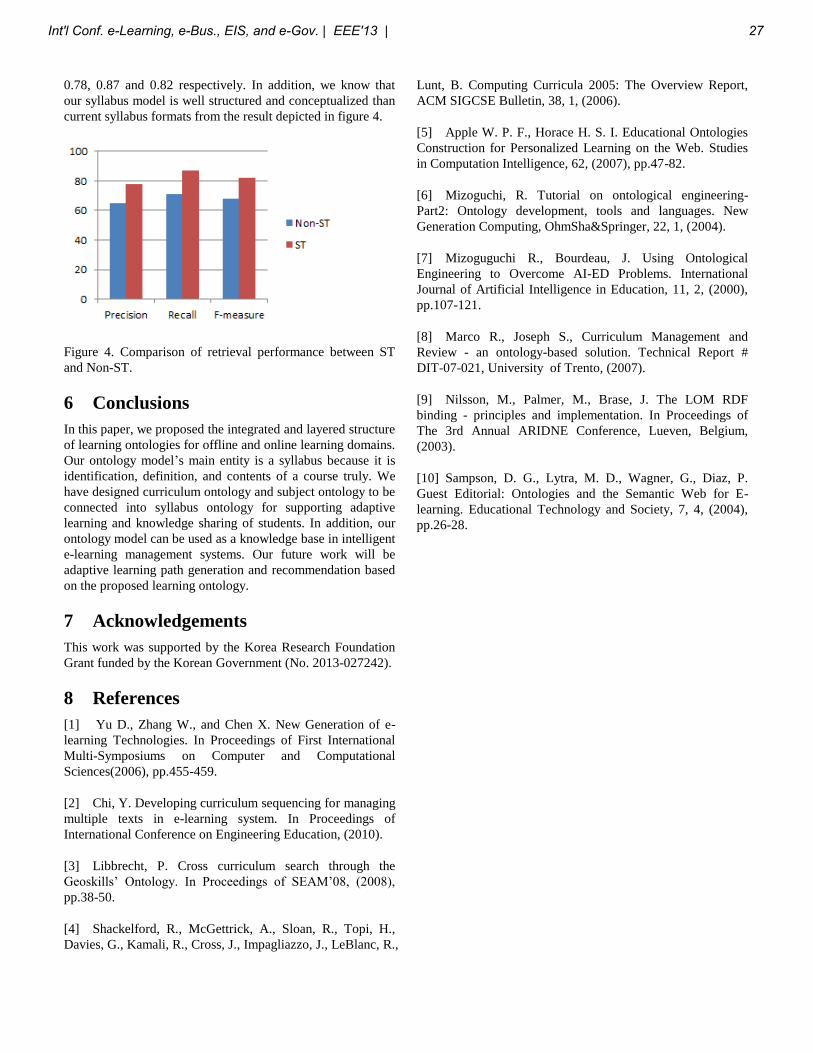
0.78, 0.87 and 0.82 respectively. In addition, we know that
our syllabus model is well structured and conceptualized than
current syllabus formats from the result depicted in figure 4.
Figure 4. Comparison of retrieval performance between ST
and Non-ST.
6 Conclusions
In this paper, we proposed the integrated and layered structure
of learning ontologies for offline and online learning domains.
Our ontology model’s main entity is a syllabus because it is
identification, definition, and contents of a course truly. We
have designed curriculum ontology and subject ontology to be
connected into syllabus ontology for supporting adaptive
learning and knowledge sharing of students. In addition, our
ontology model can be used as a knowledge base in intelligent
e-learning management systems. Our future work will be
adaptive learning path generation and recommendation based
on the proposed learning ontology.
7 Acknowledgements
This work was supported by the Korea Research Foundation
Grant funded by the Korean Government (No. 2013-027242).
8 References
[1] Yu D., Zhang W., and Chen X. New Generation of e-
learning Technologies. In Proceedings of First International
Multi-Symposiums on Computer and Computational
Sciences(2006), pp.455-459.
[2] Chi, Y. Developing curriculum sequencing for managing
multiple texts in e-learning system. In Proceedings of
International Conference on Engineering Education, (2010).
[3] Libbrecht, P. Cross curriculum search through the
Geoskills’ Ontology. In Proceedings of SEAM’08, (2008),
pp.38-50.
[4] Shackelford, R., McGettrick, A., Sloan, R., Topi, H.,
Davies, G., Kamali, R., Cross, J., Impagliazzo, J., LeBlanc, R.,
Lunt, B. Computing Curricula 2005: The Overview Report,
ACM SIGCSE Bulletin, 38, 1, (2006).
[5] Apple W. P. F., Horace H. S. I. Educational Ontologies
Construction for Personalized Learning on the Web. Studies
in Computation Intelligence, 62, (2007), pp.47-82.
[6] Mizoguchi, R. Tutorial on ontological engineering-
Part2: Ontology development, tools and languages. New
Generation Computing, OhmSha&Springer, 22, 1, (2004).
[7] Mizoguguchi R., Bourdeau, J. Using Ontological
Engineering to Overcome AI-ED Problems. International
Journal of Artificial Intelligence in Education, 11, 2, (2000),
pp.107-121.
[8] Marco R., Joseph S., Curriculum Management and
Review - an ontology-based solution. Technical Report #
DIT-07-021, University of Trento, (2007).
[9] Nilsson, M., Palmer, M., Brase, J. The LOM RDF
binding - principles and implementation. In Proceedings of
The 3rd Annual ARIDNE Conference, Lueven, Belgium,
(2003).
[10] Sampson, D. G., Lytra, M. D., Wagner, G., Diaz, P.
Guest Editorial: Ontologies and the Semantic Web for E-
learning. Educational Technology and Society, 7, 4, (2004),
pp.26-28.
Int'l Conf. e-Learning, e-Bus., EIS, and e-Gov. | EEE'13 | 27
Designing an online course to promote deep learning outcomes
B. Morgan
Western Oregon University Monmouth, Oregon, United States
Abstract - Online courses are seen as a means to deliver an educational experience to a wider audience. Often it is believed that face to face courses can simply be put online, in a plug and go model, and that will be sufficient to deliver deep learning outcomes. This paper first considers the difference between surface and deep learning then seeks to provide a pedagogical paradigm that promotes deep learning. The Communities of Inquiry (CoI) model for online course delivery models this paradigm and supports the assertion that deep learning is an obtainable objective, but is far more nuanced and requires far greater resources than the plug and go model suggests.
Deep Surface Focus is on “what is signified”
Focus is on the “signs” (or on the learning as a signifier of something else)
Relates previous knowledge to new knowledge
Focus on unrelated parts of the task
Relates knowledge from different courses
Information for assessment is simply memorized
Relates theoretical ideas to everyday experience
Facts and concepts are associated unreflectively
Relates and distinguishes evidence and argument
Principles are not distinguished from examples Keywords: e-learning, online education model, Communities
of Inquiry, deep learning outcomes, collaborative learning Organizes and structures content into coherent whole
Task is treated as an external imposition
1 Introduction As the tertiary educational system continues to work to minimize expenses, many institutions are turning to distance education as a solution to their financial shortfalls [1]. However, there are still concerns about current technologies and their ability to deliver an educational experience that promotes deep learning [2], [3]. Given the current research into a successful pedagogical paradigm, it can be shown that online courses can be effective in delivering a deep learning experience.
Table 1. Comparison of Deep and Surface Learning [4]
Emphasis is internal, from within the student
Emphasis is external, from demands of assessment
Deep and surface learning are not attributes of the learner; an individual can demonstrate either trait depending on the situation [4]. Research has shown that a “deep strategic approach to studying is generally related to high levels of academic achievement, but only where the assessment procedures emphasize and reward personal understanding” [5, p. 4]. This establishes the necessity to design courses to provide support for and reward critical thinking and a deep approach to learning. Those outcomes may be demonstrated using Bloom’s revised taxonomy [6] to operationalize deep learning by applying concepts 4.0 – 6.3 to student’s communication on forums and written assignments:
This paper begins by defining deep learning followed by applying this definition to the theoretical framework of Communities of Inquiry (CoI), a theory that has been shown to actively engage learners and assist in designing online courses. Finally, an outline of a course model is given.
Structure of the Cognitive Process 2 Definition of Deep Learning Dimension of the Revised Taxonomy [6]
4.0 Analyze – Breaking material into its constituent parts and detecting how the parts relate to one another and to an overall structure or purpose.
Deep learning is often defined along with its contrasting outcome, surface learning. Table 1 is used to demonstrate perceived differences in the two distinct types of learning. Based on this information deep learning can be defined as knowledge that has been assimilated into previous knowledge and is applied to everyday experiences and interdisciplinary concepts. Students demonstrate this knowledge when they can argue or defend ideas broadly and coherently using knowledge and theory from multiple disciplines. Critical thinking is considered a precursor to deep learning.
4.1 Differentiating 4.2 Organizing 4.3 Attributing
5.0 Evaluate – Making judgments based on criteria and standards.
5.1 Checking 5.2 Critiquing
6.0 Create – Putting elements together to form a novel,
28 Int'l Conf. e-Learning, e-Bus., EIS, and e-Gov. | EEE'13 |
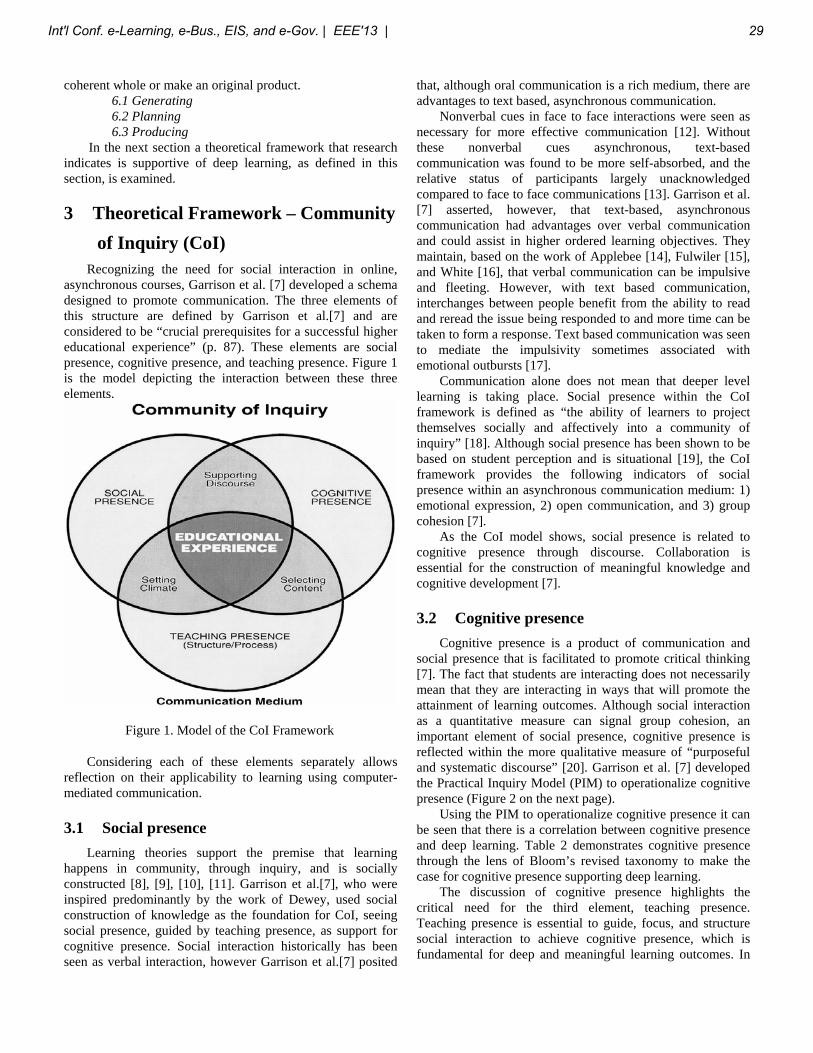
coherent whole or make an original product. 6.1 Generating 6.2 Planning 6.3 Producing
In the next section a theoretical framework that research indicates is supportive of deep learning, as defined in this section, is examined.
3 Theoretical Framework – Community
of Inquiry (CoI) Recognizing the need for social interaction in online, asynchronous courses, Garrison et al. [7] developed a schema designed to promote communication. The three elements of this structure are defined by Garrison et al.[7] and are considered to be “crucial prerequisites for a successful higher educational experience” (p. 87). These elements are social presence, cognitive presence, and teaching presence. Figure 1 is the model depicting the interaction between these three elements.
Figure 1. Model of the CoI Framework
Considering each of these elements separately allows reflection on their applicability to learning using computer-mediated communication. 3.1 Social presence Learning theories support the premise that learning happens in community, through inquiry, and is socially constructed [8], [9], [10], [11]. Garrison et al.[7], who were inspired predominantly by the work of Dewey, used social construction of knowledge as the foundation for CoI, seeing social presence, guided by teaching presence, as support for cognitive presence. Social interaction historically has been seen as verbal interaction, however Garrison et al.[7] posited
that, although oral communication is a rich medium, there are advantages to text based, asynchronous communication. Nonverbal cues in face to face interactions were seen as necessary for more effective communication [12]. Without these nonverbal cues asynchronous, text-based communication was found to be more self-absorbed, and the relative status of participants largely unacknowledged compared to face to face communications [13]. Garrison et al. [7] asserted, however, that text-based, asynchronous communication had advantages over verbal communication and could assist in higher ordered learning objectives. They maintain, based on the work of Applebee [14], Fulwiler [15], and White [16], that verbal communication can be impulsive and fleeting. However, with text based communication, interchanges between people benefit from the ability to read and reread the issue being responded to and more time can be taken to form a response. Text based communication was seen to mediate the impulsivity sometimes associated with emotional outbursts [17]. Communication alone does not mean that deeper level learning is taking place. Social presence within the CoI framework is defined as “the ability of learners to project themselves socially and affectively into a community of inquiry” [18]. Although social presence has been shown to be based on student perception and is situational [19], the CoI framework provides the following indicators of social presence within an asynchronous communication medium: 1) emotional expression, 2) open communication, and 3) group cohesion [7]. As the CoI model shows, social presence is related to cognitive presence through discourse. Collaboration is essential for the construction of meaningful knowledge and cognitive development [7]. 3.2 Cognitive presence Cognitive presence is a product of communication and social presence that is facilitated to promote critical thinking [7]. The fact that students are interacting does not necessarily mean that they are interacting in ways that will promote the attainment of learning outcomes. Although social interaction as a quantitative measure can signal group cohesion, an important element of social presence, cognitive presence is reflected within the more qualitative measure of “purposeful and systematic discourse” [20]. Garrison et al. [7] developed the Practical Inquiry Model (PIM) to operationalize cognitive presence (Figure 2 on the next page). Using the PIM to operationalize cognitive presence it can be seen that there is a correlation between cognitive presence and deep learning. Table 2 demonstrates cognitive presence through the lens of Bloom’s revised taxonomy to make the case for cognitive presence supporting deep learning. The discussion of cognitive presence highlights the critical need for the third element, teaching presence. Teaching presence is essential to guide, focus, and structure social interaction to achieve cognitive presence, which is fundamental for deep and meaningful learning outcomes. In
Int'l Conf. e-Learning, e-Bus., EIS, and e-Gov. | EEE'13 | 29
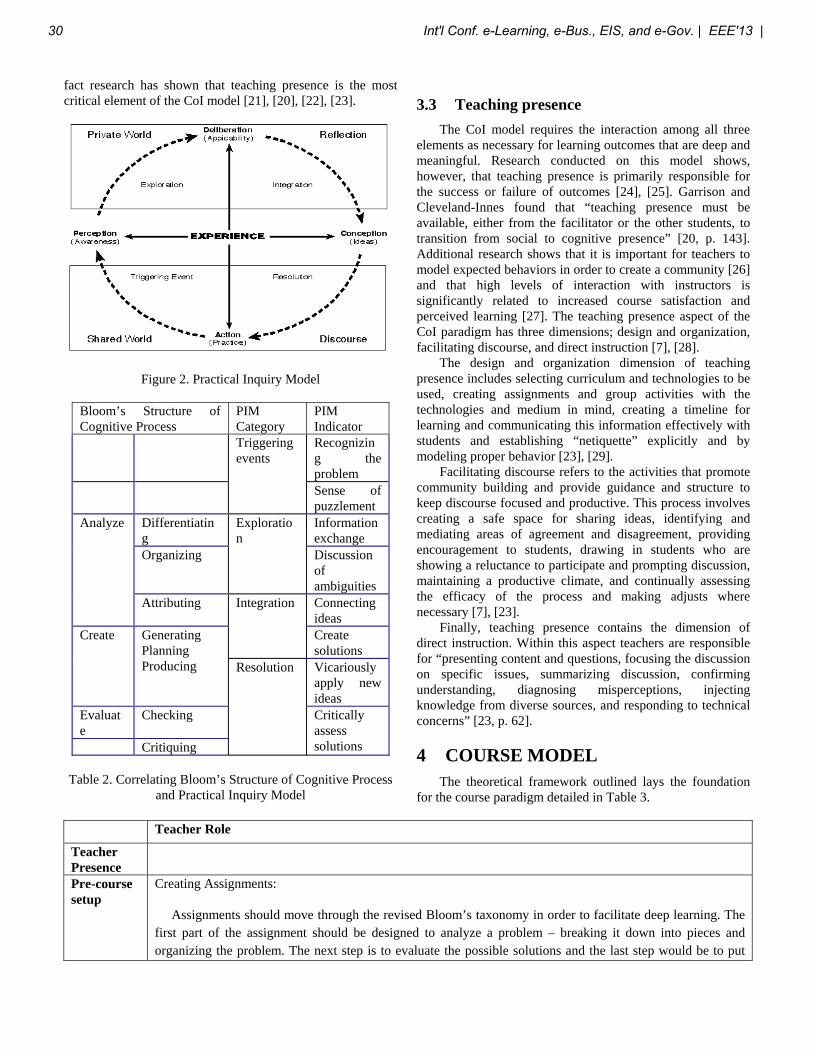
fact research has shown that teaching presence is the most critical element of the CoI model [21], [20], [22], [23].
3.3 Teaching presence
The CoI model requires the interaction among all three elements as necessary for learning outcomes that are deep and meaningful. Research conducted on this model shows, however, that teaching presence is primarily responsible for the success or failure of outcomes [24], [25]. Garrison and Cleveland-Innes found that “teaching presence must be available, either from the facilitator or the other students, to transition from social to cognitive presence” [20, p. 143]. Additional research shows that it is important for teachers to model expected behaviors in order to create a community [26] and that high levels of interaction with instructors is significantly related to increased course satisfaction and perceived learning [27]. The teaching presence aspect of the CoI paradigm has three dimensions; design and organization, facilitating discourse, and direct instruction [7], [28].
Figure 2. Practical Inquiry Model
Bloom’s Structure of Cognitive Process
PIM Category
PIM Indicator
Triggering events
Recognizing the problem
The design and organization dimension of teaching presence includes selecting curriculum and technologies to be used, creating assignments and group activities with the technologies and medium in mind, creating a timeline for learning and communicating this information effectively with students and establishing “netiquette” explicitly and by modeling proper behavior [23], [29].
Sense of puzzlement
Analyze Differentiating
Exploration
Information exchange
Organizing Discussion of ambiguities
Facilitating discourse refers to the activities that promote community building and provide guidance and structure to keep discourse focused and productive. This process involves creating a safe space for sharing ideas, identifying and mediating areas of agreement and disagreement, providing encouragement to students, drawing in students who are showing a reluctance to participate and prompting discussion, maintaining a productive climate, and continually assessing the efficacy of the process and making adjusts where necessary [7], [23].
Attributing Integration Connecting ideas
Create Generating Planning Producing
Create solutions
Resolution Vicariously apply new ideas
Evaluate
Checking Critically assess solutions
Finally, teaching presence contains the dimension of direct instruction. Within this aspect teachers are responsible for “presenting content and questions, focusing the discussion on specific issues, summarizing discussion, confirming understanding, diagnosing misperceptions, injecting knowledge from diverse sources, and responding to technical concerns” [23, p. 62].
Critiquing 4 COURSE MODEL Table 2. Correlating Bloom’s Structure of Cognitive Process
and Practical Inquiry Model The theoretical framework outlined lays the foundation for the course paradigm detailed in Table 3.
Teacher Role
Teacher Presence
Pre-course setup
Creating Assignments:
Assignments should move through the revised Bloom’s taxonomy in order to facilitate deep learning. The first part of the assignment should be designed to analyze a problem – breaking it down into pieces and organizing the problem. The next step is to evaluate the possible solutions and the last step would be to put
30 Int'l Conf. e-Learning, e-Bus., EIS, and e-Gov. | EEE'13 |
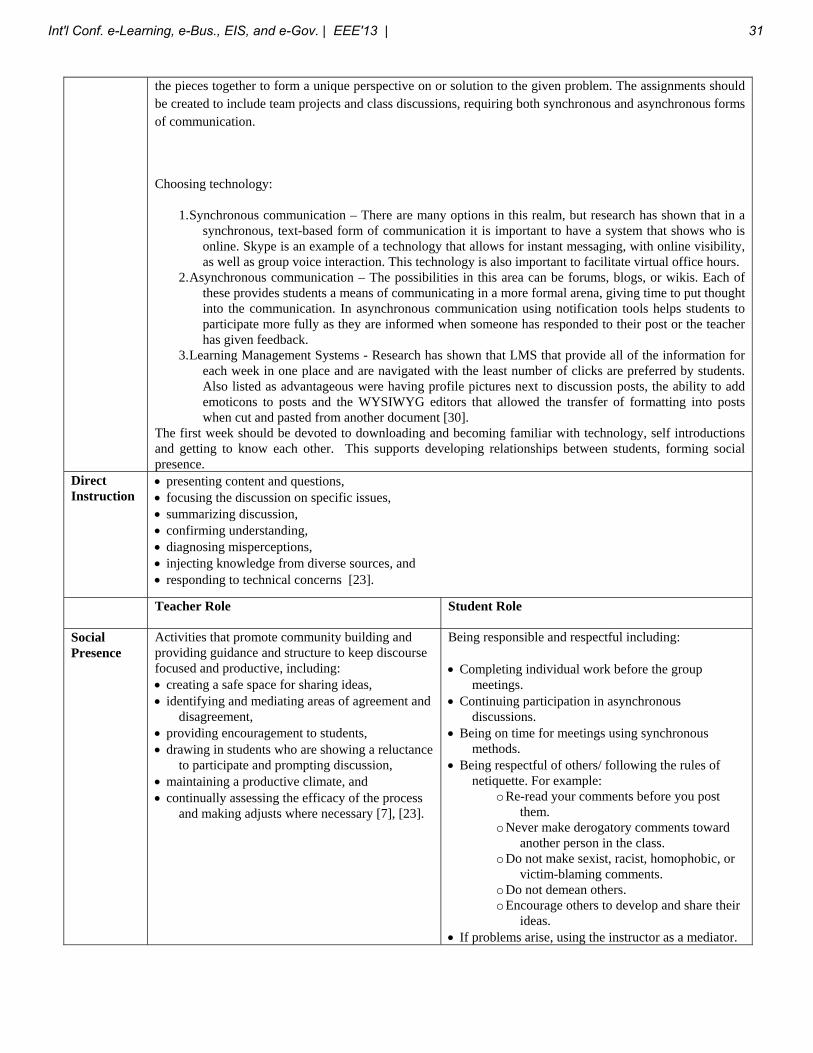
the pieces together to form a unique perspective on or solution to the given problem. The assignments should be created to include team projects and class discussions, requiring both synchronous and asynchronous forms of communication.
Choosing technology:
1. Synchronous communication – There are many options in this realm, but research has shown that in a synchronous, text-based form of communication it is important to have a system that shows who is online. Skype is an example of a technology that allows for instant messaging, with online visibility, as well as group voice interaction. This technology is also important to facilitate virtual office hours.
2. Asynchronous communication – The possibilities in this area can be forums, blogs, or wikis. Each of these provides students a means of communicating in a more formal arena, giving time to put thought into the communication. In asynchronous communication using notification tools helps students to participate more fully as they are informed when someone has responded to their post or the teacher has given feedback.
3. Learning Management Systems - Research has shown that LMS that provide all of the information for each week in one place and are navigated with the least number of clicks are preferred by students. Also listed as advantageous were having profile pictures next to discussion posts, the ability to add emoticons to posts and the WYSIWYG editors that allowed the transfer of formatting into posts when cut and pasted from another document [30].
The first week should be devoted to downloading and becoming familiar with technology, self introductions and getting to know each other. This supports developing relationships between students, forming social presence.
Direct Instruction
• presenting content and questions, • focusing the discussion on specific issues, • summarizing discussion, • confirming understanding, • diagnosing misperceptions, • injecting knowledge from diverse sources, and • responding to technical concerns [23].
Teacher Role Student Role
Social Presence
Activities that promote community building and providing guidance and structure to keep discourse focused and productive, including: • creating a safe space for sharing ideas, • identifying and mediating areas of agreement and
disagreement, • providing encouragement to students, • drawing in students who are showing a reluctance
to participate and prompting discussion, • maintaining a productive climate, and • continually assessing the efficacy of the process
and making adjusts where necessary [7], [23].
Being responsible and respectful including:
• Completing individual work before the group meetings.
• Continuing participation in asynchronous discussions.
• Being on time for meetings using synchronous methods.
• Being respectful of others/ following the rules of netiquette. For example:
o Re-read your comments before you post them.
o Never make derogatory comments toward another person in the class.
o Do not make sexist, racist, homophobic, or victim-blaming comments.
o Do not demean others. o Encourage others to develop and share their
ideas. • If problems arise, using the instructor as a mediator.
Int'l Conf. e-Learning, e-Bus., EIS, and e-Gov. | EEE'13 | 31
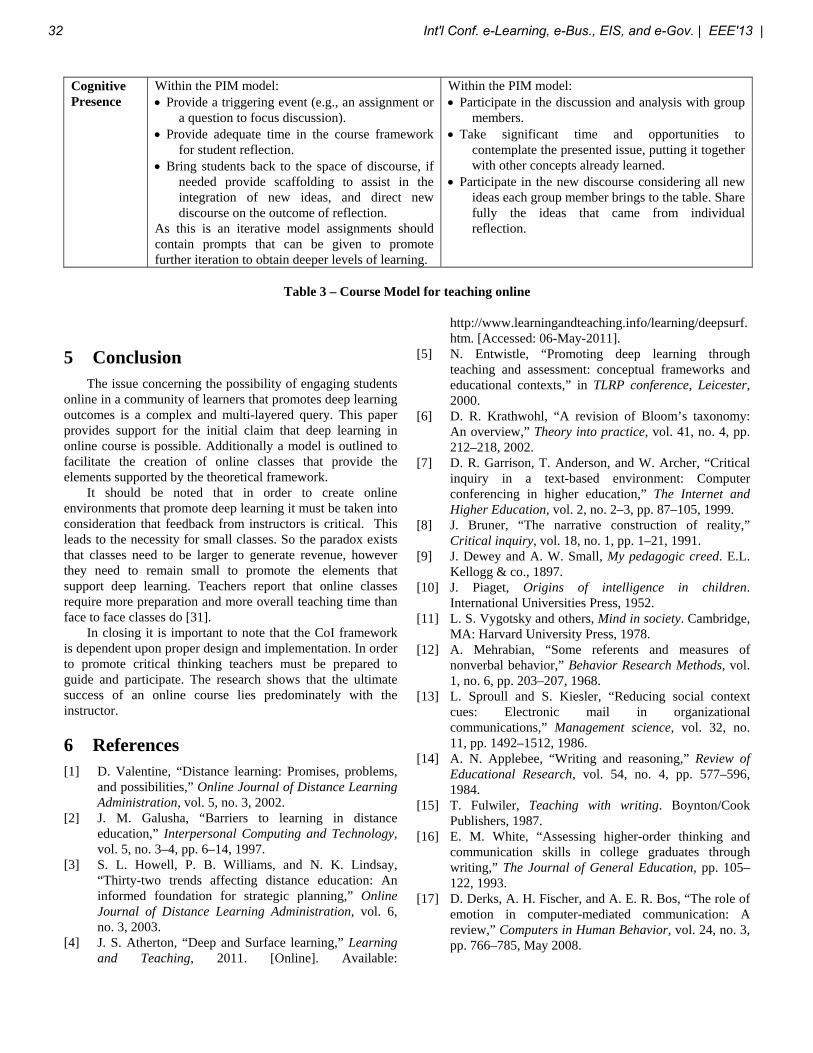
Cognitive Presence
Within the PIM model: • Provide a triggering event (e.g., an assignment or
a question to focus discussion). • Provide adequate time in the course framework
for student reflection. • Bring students back to the space of discourse, if
needed provide scaffolding to assist in the integration of new ideas, and direct new discourse on the outcome of reflection.
As this is an iterative model assignments should contain prompts that can be given to promote further iteration to obtain deeper levels of learning.
Within the PIM model: • Participate in the discussion and analysis with group
members. • Take significant time and opportunities to
contemplate the presented issue, putting it together with other concepts already learned.
• Participate in the new discourse considering all new ideas each group member brings to the table. Share fully the ideas that came from individual reflection.
Table 3 – Course Model for teaching online
5 Conclusion The issue concerning the possibility of engaging students online in a community of learners that promotes deep learning outcomes is a complex and multi-layered query. This paper provides support for the initial claim that deep learning in online course is possible. Additionally a model is outlined to facilitate the creation of online classes that provide the elements supported by the theoretical framework. It should be noted that in order to create online environments that promote deep learning it must be taken into consideration that feedback from instructors is critical. This leads to the necessity for small classes. So the paradox exists that classes need to be larger to generate revenue, however they need to remain small to promote the elements that support deep learning. Teachers report that online classes require more preparation and more overall teaching time than face to face classes do [31]. In closing it is important to note that the CoI framework is dependent upon proper design and implementation. In order to promote critical thinking teachers must be prepared to guide and participate. The research shows that the ultimate success of an online course lies predominately with the instructor. 6 References [1] D. Valentine, “Distance learning: Promises, problems,
and possibilities,” Online Journal of Distance Learning Administration, vol. 5, no. 3, 2002.
[2] J. M. Galusha, “Barriers to learning in distance education,” Interpersonal Computing and Technology, vol. 5, no. 3–4, pp. 6–14, 1997.
[3] S. L. Howell, P. B. Williams, and N. K. Lindsay, “Thirty-two trends affecting distance education: An informed foundation for strategic planning,” Online Journal of Distance Learning Administration, vol. 6, no. 3, 2003.
[4] J. S. Atherton, “Deep and Surface learning,” Learning and Teaching, 2011. [Online]. Available:
http://www.learningandteaching.info/learning/deepsurf.htm. [Accessed: 06-May-2011].
[5] N. Entwistle, “Promoting deep learning through teaching and assessment: conceptual frameworks and educational contexts,” in TLRP conference, Leicester, 2000.
[6] D. R. Krathwohl, “A revision of Bloom’s taxonomy: An overview,” Theory into practice, vol. 41, no. 4, pp. 212–218, 2002.
[7] D. R. Garrison, T. Anderson, and W. Archer, “Critical inquiry in a text-based environment: Computer conferencing in higher education,” The Internet and Higher Education, vol. 2, no. 2–3, pp. 87–105, 1999.
[8] J. Bruner, “The narrative construction of reality,” Critical inquiry, vol. 18, no. 1, pp. 1–21, 1991.
[9] J. Dewey and A. W. Small, My pedagogic creed. E.L. Kellogg & co., 1897.
[10] J. Piaget, Origins of intelligence in children. International Universities Press, 1952.
[11] L. S. Vygotsky and others, Mind in society. Cambridge, MA: Harvard University Press, 1978.
[12] A. Mehrabian, “Some referents and measures of nonverbal behavior,” Behavior Research Methods, vol. 1, no. 6, pp. 203–207, 1968.
[13] L. Sproull and S. Kiesler, “Reducing social context cues: Electronic mail in organizational communications,” Management science, vol. 32, no. 11, pp. 1492–1512, 1986.
[14] A. N. Applebee, “Writing and reasoning,” Review of Educational Research, vol. 54, no. 4, pp. 577–596, 1984.
[15] T. Fulwiler, Teaching with writing. Boynton/Cook Publishers, 1987.
[16] E. M. White, “Assessing higher-order thinking and communication skills in college graduates through writing,” The Journal of General Education, pp. 105–122, 1993.
[17] D. Derks, A. H. Fischer, and A. E. R. Bos, “The role of emotion in computer-mediated communication: A review,” Computers in Human Behavior, vol. 24, no. 3, pp. 766–785, May 2008.
32 Int'l Conf. e-Learning, e-Bus., EIS, and e-Gov. | EEE'13 |
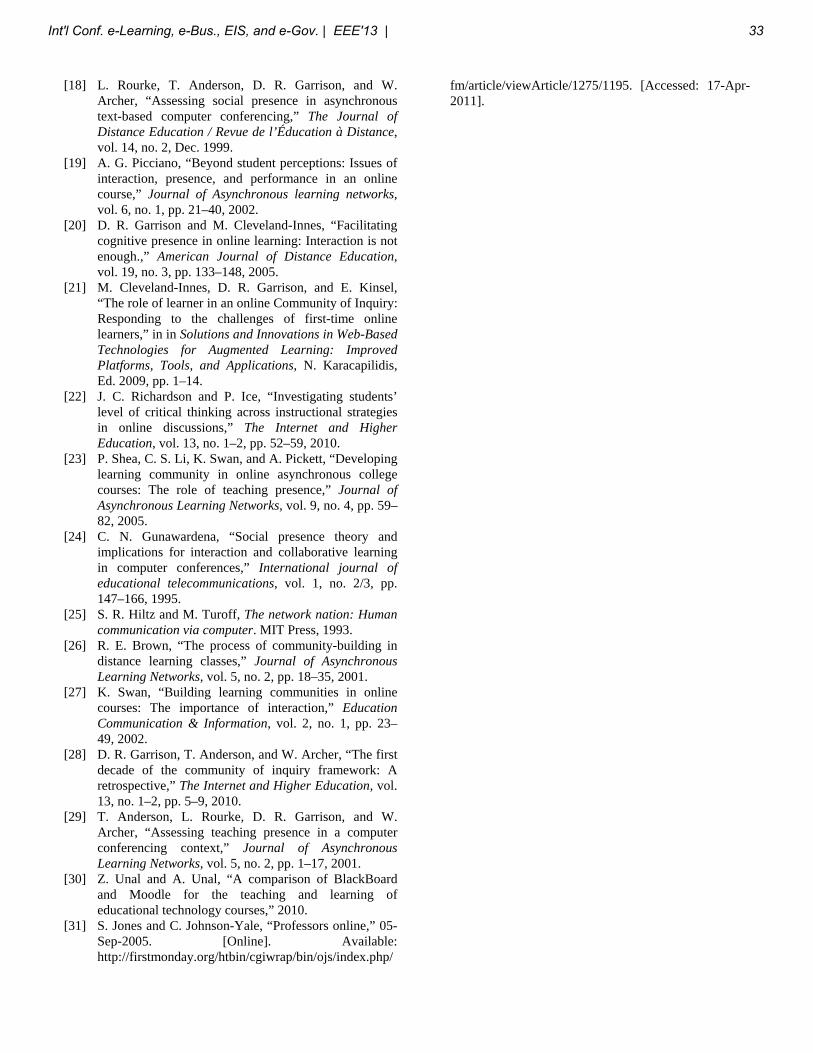
[18] L. Rourke, T. Anderson, D. R. Garrison, and W. Archer, “Assessing social presence in asynchronous text-based computer conferencing,” The Journal of Distance Education / Revue de l’Éducation à Distance, vol. 14, no. 2, Dec. 1999.
[19] A. G. Picciano, “Beyond student perceptions: Issues of interaction, presence, and performance in an online course,” Journal of Asynchronous learning networks, vol. 6, no. 1, pp. 21–40, 2002.
[20] D. R. Garrison and M. Cleveland-Innes, “Facilitating cognitive presence in online learning: Interaction is not enough.,” American Journal of Distance Education, vol. 19, no. 3, pp. 133–148, 2005.
[21] M. Cleveland-Innes, D. R. Garrison, and E. Kinsel, “The role of learner in an online Community of Inquiry: Responding to the challenges of first-time online learners,” in in Solutions and Innovations in Web-Based Technologies for Augmented Learning: Improved Platforms, Tools, and Applications, N. Karacapilidis, Ed. 2009, pp. 1–14.
[22] J. C. Richardson and P. Ice, “Investigating students’ level of critical thinking across instructional strategies in online discussions,” The Internet and Higher Education, vol. 13, no. 1–2, pp. 52–59, 2010.
[23] P. Shea, C. S. Li, K. Swan, and A. Pickett, “Developing learning community in online asynchronous college courses: The role of teaching presence,” Journal of Asynchronous Learning Networks, vol. 9, no. 4, pp. 59–82, 2005.
[24] C. N. Gunawardena, “Social presence theory and implications for interaction and collaborative learning in computer conferences,” International journal of educational telecommunications, vol. 1, no. 2/3, pp. 147–166, 1995.
[25] S. R. Hiltz and M. Turoff, The network nation: Human communication via computer. MIT Press, 1993.
[26] R. E. Brown, “The process of community-building in distance learning classes,” Journal of Asynchronous Learning Networks, vol. 5, no. 2, pp. 18–35, 2001.
[27] K. Swan, “Building learning communities in online courses: The importance of interaction,” Education Communication & Information, vol. 2, no. 1, pp. 23–49, 2002.
[28] D. R. Garrison, T. Anderson, and W. Archer, “The first decade of the community of inquiry framework: A retrospective,” The Internet and Higher Education, vol. 13, no. 1–2, pp. 5–9, 2010.
[29] T. Anderson, L. Rourke, D. R. Garrison, and W. Archer, “Assessing teaching presence in a computer conferencing context,” Journal of Asynchronous Learning Networks, vol. 5, no. 2, pp. 1–17, 2001.
[30] Z. Unal and A. Unal, “A comparison of BlackBoard and Moodle for the teaching and learning of educational technology courses,” 2010.
[31] S. Jones and C. Johnson-Yale, “Professors online,” 05-Sep-2005. [Online]. Available: http://firstmonday.org/htbin/cgiwrap/bin/ojs/index.php/
fm/article/viewArticle/1275/1195. [Accessed: 17-Apr-2011].
Int'l Conf. e-Learning, e-Bus., EIS, and e-Gov. | EEE'13 | 33
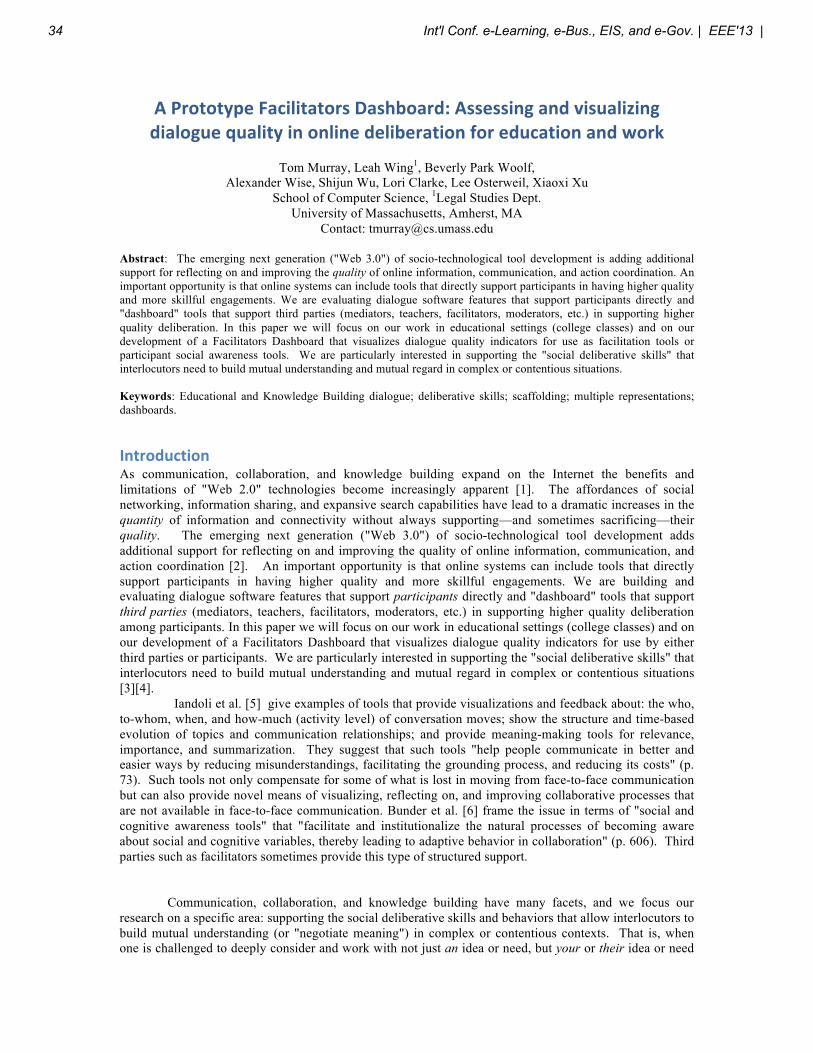
A Prototype Facilitators Dashboard: Assessing and visualizing dialogue quality in online deliberation for education and work
Tom Murray, Leah Wing1, Beverly Park Woolf,
Alexander Wise, Shijun Wu, Lori Clarke, Lee Osterweil, Xiaoxi Xu School of Computer Science, 1Legal Studies Dept.
University of Massachusetts, Amherst, MA Contact: [email protected]
Abstract: The emerging next generation ("Web 3.0") of socio-technological tool development is adding additional support for reflecting on and improving the quality of online information, communication, and action coordination. An important opportunity is that online systems can include tools that directly support participants in having higher quality and more skillful engagements. We are evaluating dialogue software features that support participants directly and "dashboard" tools that support third parties (mediators, teachers, facilitators, moderators, etc.) in supporting higher quality deliberation. In this paper we will focus on our work in educational settings (college classes) and on our development of a Facilitators Dashboard that visualizes dialogue quality indicators for use as facilitation tools or participant social awareness tools. We are particularly interested in supporting the "social deliberative skills" that interlocutors need to build mutual understanding and mutual regard in complex or contentious situations. Keywords: Educational and Knowledge Building dialogue; deliberative skills; scaffolding; multiple representations; dashboards.
Introduction As communication, collaboration, and knowledge building expand on the Internet the benefits and limitations of "Web 2.0" technologies become increasingly apparent [1]. The affordances of social networking, information sharing, and expansive search capabilities have lead to a dramatic increases in the quantity of information and connectivity without always supporting—and sometimes sacrificing—their quality. The emerging next generation ("Web 3.0") of socio-technological tool development adds additional support for reflecting on and improving the quality of online information, communication, and action coordination [2]. An important opportunity is that online systems can include tools that directly support participants in having higher quality and more skillful engagements. We are building and evaluating dialogue software features that support participants directly and "dashboard" tools that support third parties (mediators, teachers, facilitators, moderators, etc.) in supporting higher quality deliberation among participants. In this paper we will focus on our work in educational settings (college classes) and on our development of a Facilitators Dashboard that visualizes dialogue quality indicators for use by either third parties or participants. We are particularly interested in supporting the "social deliberative skills" that interlocutors need to build mutual understanding and mutual regard in complex or contentious situations [3][4].
Iandoli et al. [5] give examples of tools that provide visualizations and feedback about: the who, to-whom, when, and how-much (activity level) of conversation moves; show the structure and time-based evolution of topics and communication relationships; and provide meaning-making tools for relevance, importance, and summarization. They suggest that such tools "help people communicate in better and easier ways by reducing misunderstandings, facilitating the grounding process, and reducing its costs" (p. 73). Such tools not only compensate for some of what is lost in moving from face-to-face communication but can also provide novel means of visualizing, reflecting on, and improving collaborative processes that are not available in face-to-face communication. Bunder et al. [6] frame the issue in terms of "social and cognitive awareness tools" that "facilitate and institutionalize the natural processes of becoming aware about social and cognitive variables, thereby leading to adaptive behavior in collaboration" (p. 606). Third parties such as facilitators sometimes provide this type of structured support.
Communication, collaboration, and knowledge building have many facets, and we focus our research on a specific area: supporting the social deliberative skills and behaviors that allow interlocutors to build mutual understanding (or "negotiate meaning") in complex or contentious contexts. That is, when one is challenged to deeply consider and work with not just an idea or need, but your or their idea or need
34 Int'l Conf. e-Learning, e-Bus., EIS, and e-Gov. | EEE'13 |
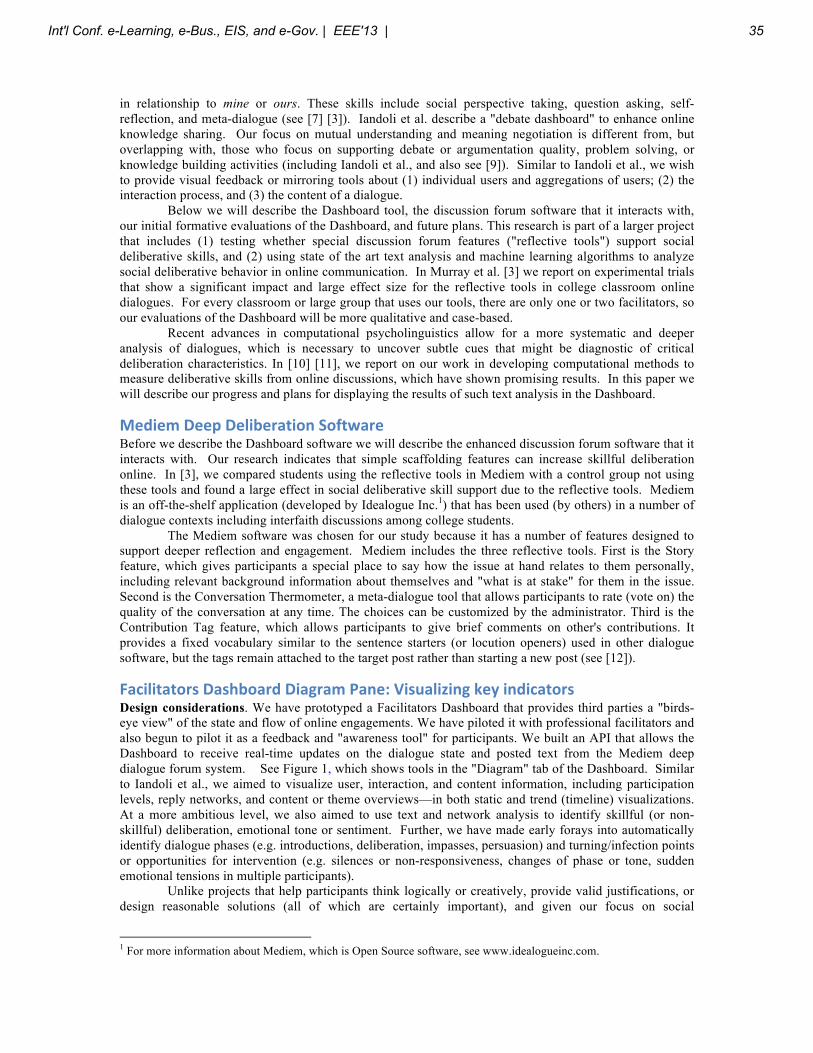
in relationship to mine or ours. These skills include social perspective taking, question asking, self-reflection, and meta-dialogue (see [7] [3]). Iandoli et al. describe a "debate dashboard" to enhance online knowledge sharing. Our focus on mutual understanding and meaning negotiation is different from, but overlapping with, those who focus on supporting debate or argumentation quality, problem solving, or knowledge building activities (including Iandoli et al., and also see [9]). Similar to Iandoli et al., we wish to provide visual feedback or mirroring tools about (1) individual users and aggregations of users; (2) the interaction process, and (3) the content of a dialogue.
Below we will describe the Dashboard tool, the discussion forum software that it interacts with, our initial formative evaluations of the Dashboard, and future plans. This research is part of a larger project that includes (1) testing whether special discussion forum features ("reflective tools") support social deliberative skills, and (2) using state of the art text analysis and machine learning algorithms to analyze social deliberative behavior in online communication. In Murray et al. [3] we report on experimental trials that show a significant impact and large effect size for the reflective tools in college classroom online dialogues. For every classroom or large group that uses our tools, there are only one or two facilitators, so our evaluations of the Dashboard will be more qualitative and case-based.
Recent advances in computational psycholinguistics allow for a more systematic and deeper analysis of dialogues, which is necessary to uncover subtle cues that might be diagnostic of critical deliberation characteristics. In [10] [11], we report on our work in developing computational methods to measure deliberative skills from online discussions, which have shown promising results. In this paper we will describe our progress and plans for displaying the results of such text analysis in the Dashboard.
Mediem Deep Deliberation Software Before we describe the Dashboard software we will describe the enhanced discussion forum software that it interacts with. Our research indicates that simple scaffolding features can increase skillful deliberation online. In [3], we compared students using the reflective tools in Mediem with a control group not using these tools and found a large effect in social deliberative skill support due to the reflective tools. Mediem is an off-the-shelf application (developed by Idealogue Inc.1) that has been used (by others) in a number of dialogue contexts including interfaith discussions among college students.
The Mediem software was chosen for our study because it has a number of features designed to support deeper reflection and engagement. Mediem includes the three reflective tools. First is the Story feature, which gives participants a special place to say how the issue at hand relates to them personally, including relevant background information about themselves and "what is at stake" for them in the issue. Second is the Conversation Thermometer, a meta-dialogue tool that allows participants to rate (vote on) the quality of the conversation at any time. The choices can be customized by the administrator. Third is the Contribution Tag feature, which allows participants to give brief comments on other's contributions. It provides a fixed vocabulary similar to the sentence starters (or locution openers) used in other dialogue software, but the tags remain attached to the target post rather than starting a new post (see [12]).
Facilitators Dashboard Diagram Pane: Visualizing key indicators Design considerations. We have prototyped a Facilitators Dashboard that provides third parties a "birds-eye view" of the state and flow of online engagements. We have piloted it with professional facilitators and also begun to pilot it as a feedback and "awareness tool" for participants. We built an API that allows the Dashboard to receive real-time updates on the dialogue state and posted text from the Mediem deep dialogue forum system. See Figure 1, which shows tools in the "Diagram" tab of the Dashboard. Similar to Iandoli et al., we aimed to visualize user, interaction, and content information, including participation levels, reply networks, and content or theme overviews—in both static and trend (timeline) visualizations. At a more ambitious level, we also aimed to use text and network analysis to identify skillful (or non-skillful) deliberation, emotional tone or sentiment. Further, we have made early forays into automatically identify dialogue phases (e.g. introductions, deliberation, impasses, persuasion) and turning/infection points or opportunities for intervention (e.g. silences or non-responsiveness, changes of phase or tone, sudden emotional tensions in multiple participants).
Unlike projects that help participants think logically or creatively, provide valid justifications, or design reasonable solutions (all of which are certainly important), and given our focus on social
1 For more information about Mediem, which is Open Source software, see www.idealogueinc.com.
Int'l Conf. e-Learning, e-Bus., EIS, and e-Gov. | EEE'13 | 35
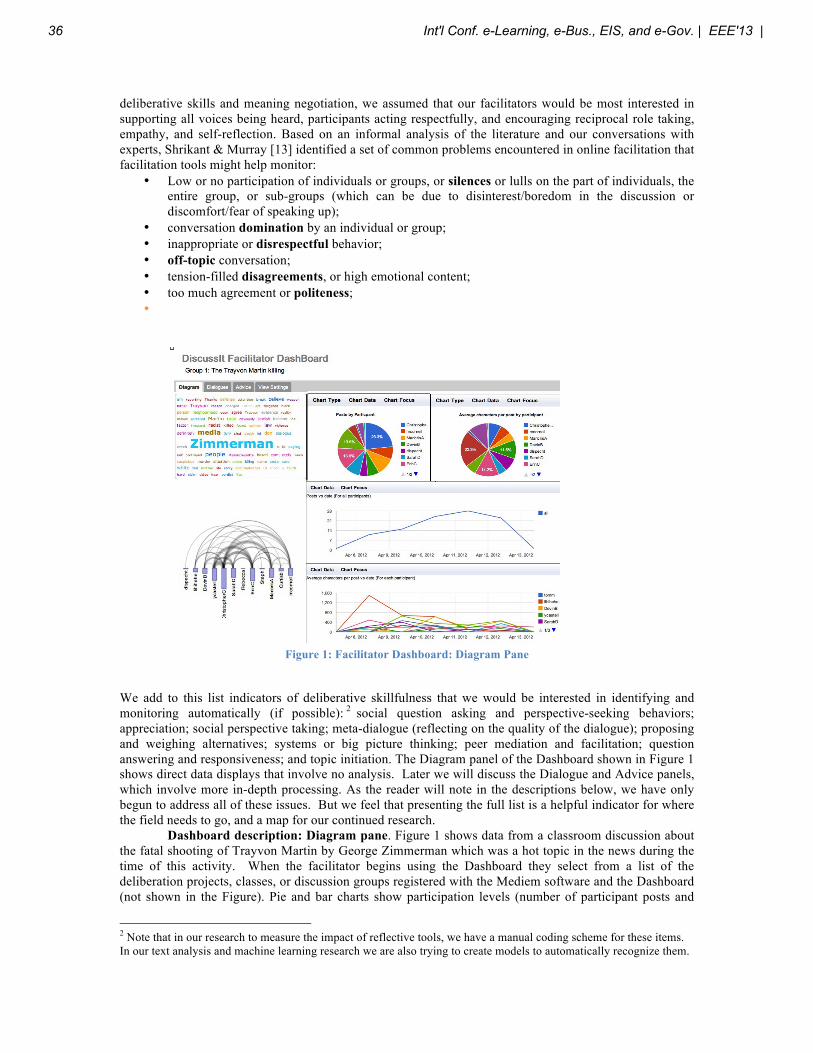
deliberative skills and meaning negotiation, we assumed that our facilitators would be most interested in supporting all voices being heard, participants acting respectfully, and encouraging reciprocal role taking, empathy, and self-reflection. Based on an informal analysis of the literature and our conversations with experts, Shrikant & Murray [13] identified a set of common problems encountered in online facilitation that facilitation tools might help monitor:
• Low or no participation of individuals or groups, or silences or lulls on the part of individuals, the entire group, or sub-groups (which can be due to disinterest/boredom in the discussion or discomfort/fear of speaking up);
• conversation domination by an individual or group; • inappropriate or disrespectful behavior; • off-topic conversation; • tension-filled disagreements, or high emotional content; • too much agreement or politeness; •
Figure 1: Facilitator Dashboard: Diagram Pane
We add to this list indicators of deliberative skillfulness that we would be interested in identifying and monitoring automatically (if possible): 2 social question asking and perspective-seeking behaviors; appreciation; social perspective taking; meta-dialogue (reflecting on the quality of the dialogue); proposing and weighing alternatives; systems or big picture thinking; peer mediation and facilitation; question answering and responsiveness; and topic initiation. The Diagram panel of the Dashboard shown in Figure 1 shows direct data displays that involve no analysis. Later we will discuss the Dialogue and Advice panels, which involve more in-depth processing. As the reader will note in the descriptions below, we have only begun to address all of these issues. But we feel that presenting the full list is a helpful indicator for where the field needs to go, and a map for our continued research.
Dashboard description: Diagram pane. Figure 1 shows data from a classroom discussion about the fatal shooting of Trayvon Martin by George Zimmerman which was a hot topic in the news during the time of this activity. When the facilitator begins using the Dashboard they select from a list of the deliberation projects, classes, or discussion groups registered with the Mediem software and the Dashboard (not shown in the Figure). Pie and bar charts show participation levels (number of participant posts and
2 Note that in our research to measure the impact of reflective tools, we have a manual coding scheme for these items. In our text analysis and machine learning research we are also trying to create models to automatically recognize them.
36 Int'l Conf. e-Learning, e-Bus., EIS, and e-Gov. | EEE'13 |
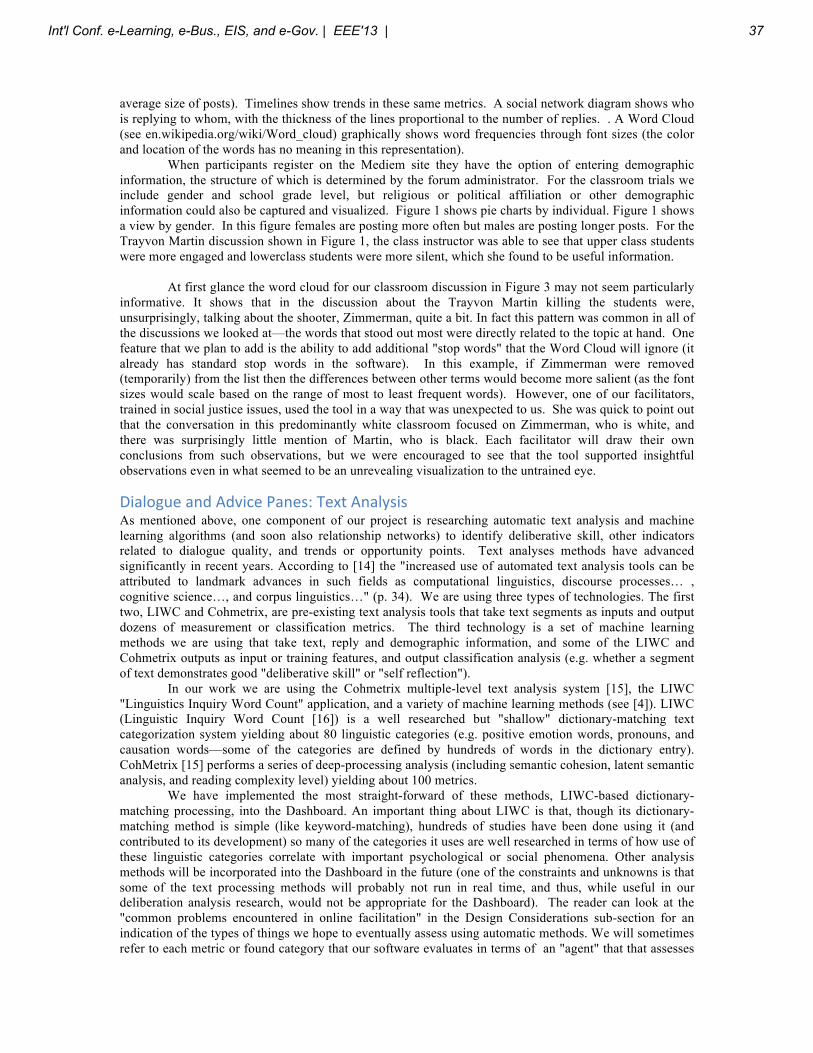
average size of posts). Timelines show trends in these same metrics. A social network diagram shows who is replying to whom, with the thickness of the lines proportional to the number of replies. . A Word Cloud (see en.wikipedia.org/wiki/Word_cloud) graphically shows word frequencies through font sizes (the color and location of the words has no meaning in this representation).
When participants register on the Mediem site they have the option of entering demographic information, the structure of which is determined by the forum administrator. For the classroom trials we include gender and school grade level, but religious or political affiliation or other demographic information could also be captured and visualized. Figure 1 shows pie charts by individual. Figure 1 shows a view by gender. In this figure females are posting more often but males are posting longer posts. For the Trayvon Martin discussion shown in Figure 1, the class instructor was able to see that upper class students were more engaged and lowerclass students were more silent, which she found to be useful information.
At first glance the word cloud for our classroom discussion in Figure 3 may not seem particularly informative. It shows that in the discussion about the Trayvon Martin killing the students were, unsurprisingly, talking about the shooter, Zimmerman, quite a bit. In fact this pattern was common in all of the discussions we looked at—the words that stood out most were directly related to the topic at hand. One feature that we plan to add is the ability to add additional "stop words" that the Word Cloud will ignore (it already has standard stop words in the software). In this example, if Zimmerman were removed (temporarily) from the list then the differences between other terms would become more salient (as the font sizes would scale based on the range of most to least frequent words). However, one of our facilitators, trained in social justice issues, used the tool in a way that was unexpected to us. She was quick to point out that the conversation in this predominantly white classroom focused on Zimmerman, who is white, and there was surprisingly little mention of Martin, who is black. Each facilitator will draw their own conclusions from such observations, but we were encouraged to see that the tool supported insightful observations even in what seemed to be an unrevealing visualization to the untrained eye.
Dialogue and Advice Panes: Text Analysis As mentioned above, one component of our project is researching automatic text analysis and machine learning algorithms (and soon also relationship networks) to identify deliberative skill, other indicators related to dialogue quality, and trends or opportunity points. Text analyses methods have advanced significantly in recent years. According to [14] the "increased use of automated text analysis tools can be attributed to landmark advances in such fields as computational linguistics, discourse processes… , cognitive science…, and corpus linguistics…" (p. 34). We are using three types of technologies. The first two, LIWC and Cohmetrix, are pre-existing text analysis tools that take text segments as inputs and output dozens of measurement or classification metrics. The third technology is a set of machine learning methods we are using that take text, reply and demographic information, and some of the LIWC and Cohmetrix outputs as input or training features, and output classification analysis (e.g. whether a segment of text demonstrates good "deliberative skill" or "self reflection").
In our work we are using the Cohmetrix multiple-level text analysis system [15], the LIWC "Linguistics Inquiry Word Count" application, and a variety of machine learning methods (see [4]). LIWC (Linguistic Inquiry Word Count [16]) is a well researched but "shallow" dictionary-matching text categorization system yielding about 80 linguistic categories (e.g. positive emotion words, pronouns, and causation words—some of the categories are defined by hundreds of words in the dictionary entry). CohMetrix [15] performs a series of deep-processing analysis (including semantic cohesion, latent semantic analysis, and reading complexity level) yielding about 100 metrics.
We have implemented the most straight-forward of these methods, LIWC-based dictionary-matching processing, into the Dashboard. An important thing about LIWC is that, though its dictionary-matching method is simple (like keyword-matching), hundreds of studies have been done using it (and contributed to its development) so many of the categories it uses are well researched in terms of how use of these linguistic categories correlate with important psychological or social phenomena. Other analysis methods will be incorporated into the Dashboard in the future (one of the constraints and unknowns is that some of the text processing methods will probably not run in real time, and thus, while useful in our deliberation analysis research, would not be appropriate for the Dashboard). The reader can look at the "common problems encountered in online facilitation" in the Design Considerations sub-section for an indication of the types of things we hope to eventually assess using automatic methods. We will sometimes refer to each metric or found category that our software evaluates in terms of an "agent" that that assesses
Int'l Conf. e-Learning, e-Bus., EIS, and e-Gov. | EEE'13 | 37
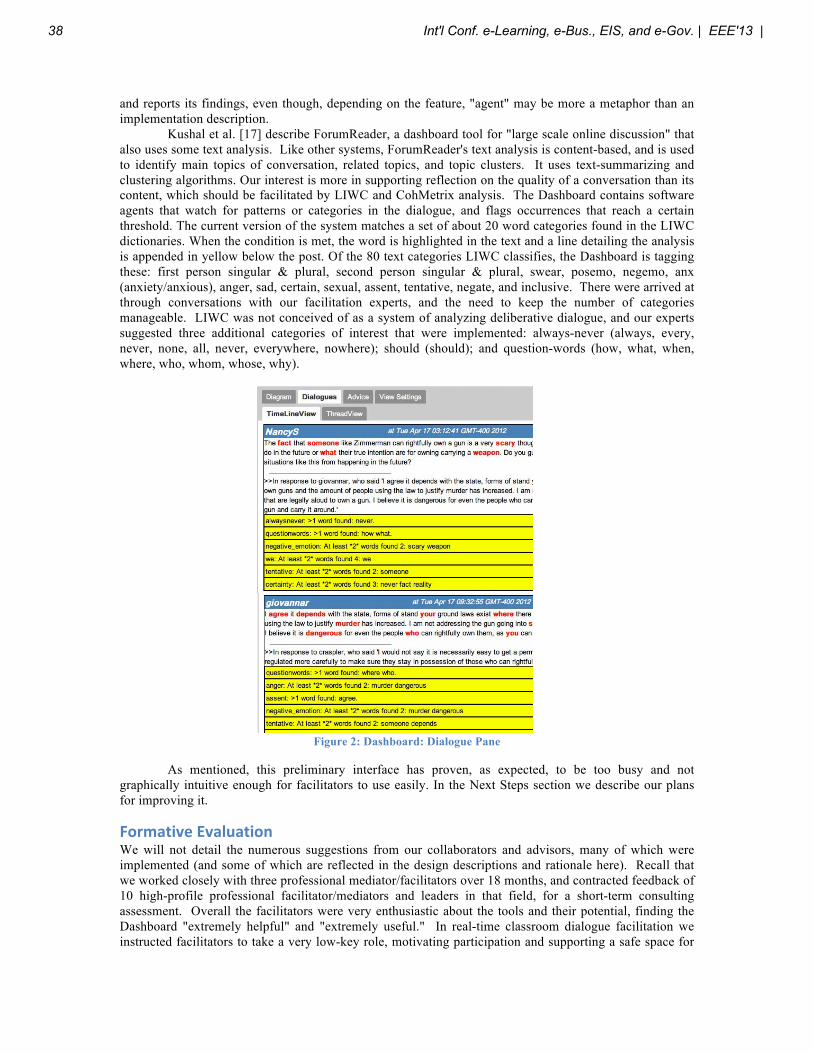
and reports its findings, even though, depending on the feature, "agent" may be more a metaphor than an implementation description.
Kushal et al. [17] describe ForumReader, a dashboard tool for "large scale online discussion" that also uses some text analysis. Like other systems, ForumReader's text analysis is content-based, and is used to identify main topics of conversation, related topics, and topic clusters. It uses text-summarizing and clustering algorithms. Our interest is more in supporting reflection on the quality of a conversation than its content, which should be facilitated by LIWC and CohMetrix analysis. The Dashboard contains software agents that watch for patterns or categories in the dialogue, and flags occurrences that reach a certain threshold. The current version of the system matches a set of about 20 word categories found in the LIWC dictionaries. When the condition is met, the word is highlighted in the text and a line detailing the analysis is appended in yellow below the post. Of the 80 text categories LIWC classifies, the Dashboard is tagging these: first person singular & plural, second person singular & plural, swear, posemo, negemo, anx (anxiety/anxious), anger, sad, certain, sexual, assent, tentative, negate, and inclusive. There were arrived at through conversations with our facilitation experts, and the need to keep the number of categories manageable. LIWC was not conceived of as a system of analyzing deliberative dialogue, and our experts suggested three additional categories of interest that were implemented: always-never (always, every, never, none, all, never, everywhere, nowhere); should (should); and question-words (how, what, when, where, who, whom, whose, why).
Figure 2: Dashboard: Dialogue Pane
As mentioned, this preliminary interface has proven, as expected, to be too busy and not graphically intuitive enough for facilitators to use easily. In the Next Steps section we describe our plans for improving it.
Formative Evaluation We will not detail the numerous suggestions from our collaborators and advisors, many of which were implemented (and some of which are reflected in the design descriptions and rationale here). Recall that we worked closely with three professional mediator/facilitators over 18 months, and contracted feedback of 10 high-profile professional facilitator/mediators and leaders in that field, for a short-term consulting assessment. Overall the facilitators were very enthusiastic about the tools and their potential, finding the Dashboard "extremely helpful" and "extremely useful." In real-time classroom dialogue facilitation we instructed facilitators to take a very low-key role, motivating participation and supporting a safe space for
38 Int'l Conf. e-Learning, e-Bus., EIS, and e-Gov. | EEE'13 |
all to contribute, but trying not to influence the conversation very much (thus we asked them to leave some of their facilitation skills unutilized). Therefore, most of the feedback on the Dashboard has been in noting what was interesting or potentially very useful to know about a group, but little of it lead to interventions in this phase of the formative evaluation. For example, a facilitator might note that males, or seniors, were slightly dominating a conversation. In these trials they did not try to remedy this, but noted how useful the tools would be if they did want to ameliorate such phenomena.
Peer facilitation and group auto-reflection. We mentioned above that we have a goal to test the Dashboard as a group-awareness (or group auto-reflection) tool with participants and peer-mediators or facilitators. Our early forays into this area have consisted of showing participants (college classes) the dashboard in follow-up focus group sessions after they have completed an online dialogue assignment. Verbal responses have been enthusiastic, but it is also clear that we will need a simpler version of the Dashboard for participants as compared with what we offer trained facilitators.
Next Steps Our future plans include evaluating our tools in civic deliberation and online dispute resolution contexts and we have engaged potential collaborators in both of these areas. Above we mentioned our plans for further evaluation of the Dashboard, and noted that we have gathered many comments from facilitators on ways to improve and extend it. In this section we describe some of these design plans. We will add an Alert feature that will highlight high priority dialogue events and properties. As mentioned we plan to add other types of text analysis beyond the dictionary matching LIWC-style agents (as is possible for real-time analysis). These include: deeper structural linguistic properties of the sort measured by Cohmetrix, and agents that search for trends, patterns, or inflection points (facilitation opportunities) over time, and post Alerts. As noted, the "common problems encountered in online facilitation" in the Design Considerations sub-section shows the types of things we hope to eventually assess. Of the dialogue speech acts that we manually code for, which we are attempting to build machine models to recognize, we have noted several that might signal important turning points in a conversation: changes of mind, peer-initiated mediation, apologies, high emotional tone, and acknowledgments/appreciations.
We have mentioned that the information in the text Dialogue pane needs more graphical portrayal, which will include pie charts, bar charts, and trend lines for the deliberative properties identified by text analysis. In addition, the current analysis only tags words and annotates posts according to word categories found in the post. We plan to include visualization tools that show occurrences and frequencies of triggered agents at four levels: post, participant, sub-group, and whole-group. For example, a chart could illustrate how instances of Appreciation or Meta-dialogue compare between participants or groups, or how they trend over the course of a dialogue. A facilitator will be able to focus in on a particular individual (or group) and display all of the analysis for that person. We will also include Settings to toggle on and off particular analysis agents, to reduce clutter and allow facilitators to focus on dialogue properties relevant to the context. The parameters for agents (e.g. triggering threshold values) will be moved from an initialization text file to a user-friendly Settings interface.
We have begun work to include social network analysis in the Dashboard [18]). This will analyze reply or reference structure between participants to measure and visualize: mutuality/reciprocity, centrality/influence, density, cliques and selective responsiveness, and initiators vs. responders.
Conclusions We have described a novel Facilitators Dashboard tool that visualizes dialogue quality indicators for use as facilitation tools or participant social awareness tools that includes textual analysis, and described our initial attempts to use it in educational settings. We are particularly interested in supporting the "social deliberative skills" that interlocutors need to build mutual understanding and mutual regard in complex or contentious situations. Developing methods to scaffold SD-skills in online deliberation, for participants and third parties, could have an impact in many online contexts, e.g. knowledge-building, situated learning, civic engagement, and dispute resolution.
One of the goals of education is to produce competent national and global citizens capable of participating in democratic self-governance and capable of wrestling with the difficult questions and dizzying array of information and opinion they face in our technologically advanced society. Students engaged in extended collaborative knowledge building, discussion, or problem solving eventually
Int'l Conf. e-Learning, e-Bus., EIS, and e-Gov. | EEE'13 | 39
encounter moments of tension in which they are challenged to understand each other's perspectives and opinions. Engaging with others on complex topics requires not only learning the relevant facts and concepts and making logical inferences, but also engaging with the perspectives and opinions of others who may not share one's views or goals. Doing so requires skills that can be systematically supported. Our work points to how such skills can be supported in online deliberation, collaboration, and dispute resolution, in educational settings and beyond.
References [1] O’Reilly, T. and Musser, J. “Web 2.0 principles and best practices”, O’Reilly Radar, November, 2006 [2] Keen, A. The cult of the amateur: How the democratization of the digital world is assaulting our economy, our
culture, and our values. NY: Doubleday Currency, 2007 [3] Murray, T., Xu, X. & Woolf, P.B.. An Exploration of Text Analysis Methods to Identify Social Deliberative Skills.
In Proceedings of 16th International Conference on Artificial Intelligence in Education (AIED-2013). Memphis, TN, July 2013. K. Yacef et al. (Eds.): LNAI 7926, pp. 811–814, 2013.
[4] Murray, T., Stephens, A.L., Woolf, B.P., Wing, L., Xu, X. & Shrikant, N. Supporting Social Deliberative Skills Online: the Effects of Reflective Scaffolding Tools. Proceedings of 15th International Conference on Human-Computer Interaction (HCII-2013). Las Vegas, July 2013.
[5] Iandoli, L., Quinto, I., De Liddo, A. & Shum, S.B. A debate dashboard to enhance online knowledge sharing. VINE: The journal of information and knowledge management systems, Vol. 42 No. 1, 2012, pp. 67-93, 2012.
[6] Buder, J., Bodemer, D., Dehler, J., & Engelmann, T. SCAN tools for collaborative learning. In Proceedings of the 9th international conference on Computer supported collaborative learning-Volume 1 (pp. 606-615). International Society of the Learning Sciences, 2009.
[7] Murray, T., Woolf, B., Xu, X., Shipe, S., Howard, S. & Wing, L.. "Supporting social deliberative skills in online classroom dialogues: Preliminary results using automated text analysis." Proceedings of 11th International Conference on Intelligent Tutoring Systems (ITS-2012). S.A. Cerri and B. Clancey (Eds.). LNCS 7315, pp. 669–671, 2012. June 2012, Chania, Greece, 2012.
[9] Constantino-Gonzales, M. A., Suthers, D., & Escamilla, J. Coaching Web-based Collaborative Learning based on Problem Solution Differences and Participation. International Journal of Artificial Intelligence in Education, 13(2-4), 263-299, 2003.
[10] Xu, X., Murray, T. Woolf, B P. & Smith, D. Mining Social Deliberation in Online Communication -- If You Were Me and I Were You , In Proceedings of the 6th International Conference on Educational Data Mining (EDM), 2013.
[11] Xu, X., Murray, T. Woolf, B P, “ Text Analysis of Deliberative Skills in Undergraduate Online Dialogue: Using L1 Regularized Logistic Regression with Psycholinguistic Features”, In Proceedings of the 12th International Conference on e-Learning, e-Business, Enterprise Information Systems, and e-Government (EEE), 2013.
[12] Soller, A., Martinez, A., Jermann, P., & Muehlenbrock, M. From mirroring to guiding: A review of state of the art technology for supporting collaborative learning. International Journal of Artificial Intelligence in Education, 15, 261-290, 2005.
[13] Shrikant, N. & Murray, T. On Line Facilitation Guidelines for Supporting Social Deliberative Skills in Online Deliberation. Unpublished manuscript available from the authors. 2012.
[14] Graesser, A. C., McNamara, D. S., & Louwerse, M. M. 2 Methods of Automated Text Analysis. Handbook of Reading Research, 4, 34, 2010.
[15] Graesser, A. C., & McNamara, D. S. Computational analyses of multilevel discourse comprehension. Topics in Cognitive Science, 3, 371–398, 2011. [16] Tausczik, Y. R. & Pennebaker, J. W. (2010). The psychological meaning of words: LIWC and computerized text analysis methods. Journal of Language and Social Psychology. [17] Kushal Dave, Martin Wattenberg, Michael Muller. Flash forums and forumReader: navigating a new kind of
large-scale online discussion. In CSCW '04: Proceedings of the 2004 ACM conference on Computer supported cooperative work (2004), pp. 232-241, 2004
[18] D'Andrea, A., Ferri, F. & Grifoni, P. "An Overview of Methods for Virtual Social Network Analysis". In Abraham, A. Hassanien, A. E., & Snášel, V. (Eds.) Computational Social Network Analysis: Trends, Tools and Research Advances. Springer. p. 8, 2009.
40 Int'l Conf. e-Learning, e-Bus., EIS, and e-Gov. | EEE'13 |

An Educational Java Applet for Understanding Principles of Synchronous BCD Counters
Dongsik KIM*, Jaeho CHA*, Seongyong LEE*, Saeron HAN*, Samjun SEO**
*Department of Electrical Engineering, Soonchunhyang University, KOREA
**Department of Electrical & Electronic Engineering, Anyang University, KOREA
Abstract – This paper presents web-based Java
applet for understanding the concepts and principles of synchronous BCD counter. Through our educational Java applet, the learners will be capable of learning the concepts and theories related to digital experiments and how to operate the virtual experimental equipments.
The proposed educational Java applet is composed of three important components: Principle Classroom to explain the concepts and theories of synchronous BCD counters operations, Virtual Experiment Classroom to provide interactive Java applets about the syllabus of off-line laboratory class, Assessment Classroom and Management System. With the aid of the Management System every classroom is organically tied together collaborating to achieve maximum learning efficiency. We have obtained several affirmative effects such as high learning standard, reducing the total experimental hours and the damage rate for experimental equipments.
Keywords : Educational Java Applet, Synchronous
BCD Counters, Web-based Virtual Experiments
1. INTRODUCTION Recently, much interest has been drawn on the web-based solution for the experiments at universities with large number of students due to low cost. Teaching is no longer confined to a time and a place. The time and physical boundaries of the traditional classroom are stretched to a learning space. A growing number of universities worldwide are now offering virtual education problems. A simple search on the World Wide Web will result in hundreds of sites offering virtual courses or resources for developing and delivering such courses. Electrical and electronic experimental study is a very important component in engineering education. It not only acts as a bridge between theory and practice, but also solidifies the theoretical concepts presented in the classroom.[1]-[3] Before the laboratory session, the learners should re-enforce basic concepts, prepare some design and simulation steps, and acquire a clear idea on what they
should expect from the experimental work they will be carrying out in the laboratory. At the laboratory session, the learners are required to assemble the circuits, connect the equipment, make the measurements, compare the data to the expected behavior, and deliver a partial or complete report to the professor at the end of the session. This classical way of experimenting clearly has the following shortcomings.[4]-[6]
• The classroom lectures or the handouts are generally not sufficient for the learners to be fully prepared for a hands-on experiment or to appreciate the significance of the previously explained theory in the experiment to be performed.
• When the learners are passive observers or a semi-active part of an experiment, they will understand neither the correspondence nor the difference between theory and practice. To cope with these difficulties, this paper presents
methodology which can easily be used on the web by simple mouse manipulations. The methodology is to provide the learners with an educational Java applet which can enhance the multimedia capabilities of world-wide web. If the learners have access to the proposed Java applet through a typical web browser, they can make experiment on basic digital logic circuits through simple mouse clicks. Since this interactive educational Java applet is implemented to describe the actual on-campus laboratory, the learners can obtain similar experimental data through it.
In this paper, we implemented synchronous BCD counters by using Java applet as illustration. The implemented Java applet is composed of three important components: Principle Classroom, Virtual Experiment Classroom, Assessment Classroom and Management System. The proposed methodology can be used from elementary digital experiments to advanced electronic experiments included in the curriculum of the college of engineering. It has interactive multimedia contents to get the learners exact understanding of the concepts and theories of
Int'l Conf. e-Learning, e-Bus., EIS, and e-Gov. | EEE'13 | 41
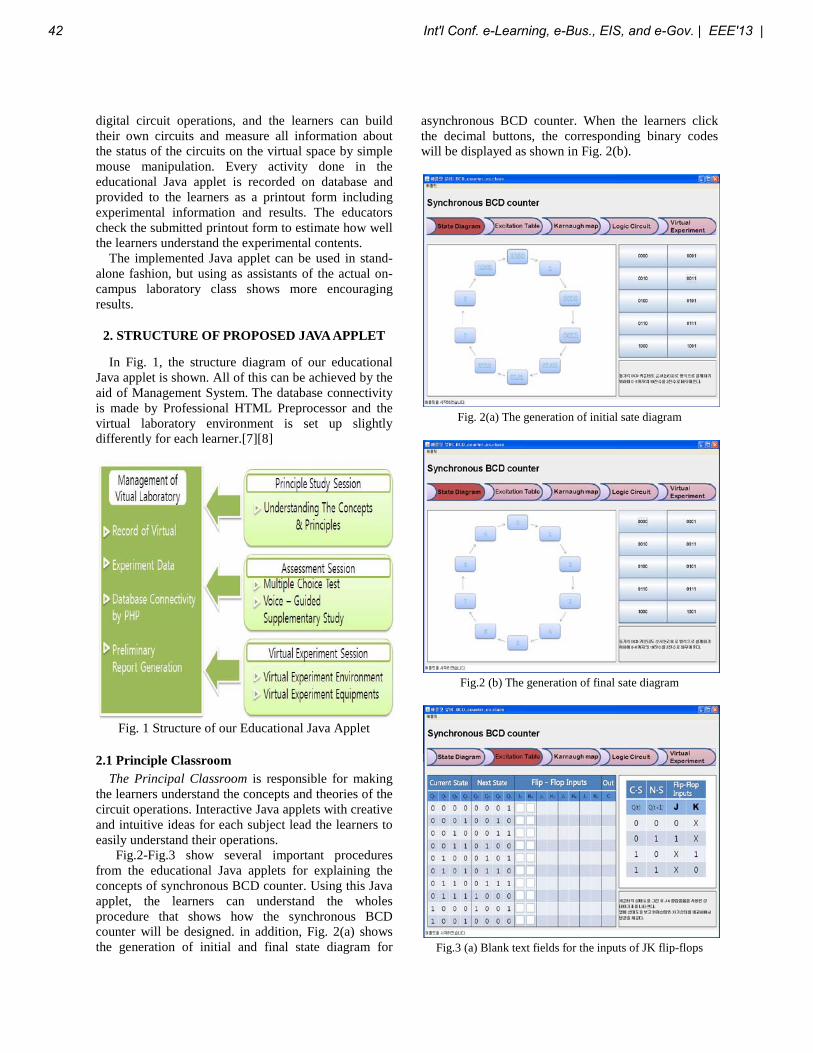
digital circuit operations, and the learners can build their own circuits and measure all information about the status of the circuits on the virtual space by simple mouse manipulation. Every activity done in the educational Java applet is recorded on database and provided to the learners as a printout form including experimental information and results. The educators check the submitted printout form to estimate how well the learners understand the experimental contents.
The implemented Java applet can be used in stand-alone fashion, but using as assistants of the actual on-campus laboratory class shows more encouraging results.
2. STRUCTURE OF PROPOSED JAVA APPLET
In Fig. 1, the structure diagram of our educational
Java applet is shown. All of this can be achieved by the aid of Management System. The database connectivity is made by Professional HTML Preprocessor and the virtual laboratory environment is set up slightly differently for each learner.[7][8]
Fig. 1 Structure of our Educational Java Applet
2.1 Principle Classroom
The Principal Classroom is responsible for making the learners understand the concepts and theories of the circuit operations. Interactive Java applets with creative and intuitive ideas for each subject lead the learners to easily understand their operations.
Fig.2-Fig.3 show several important procedures from the educational Java applets for explaining the concepts of synchronous BCD counter. Using this Java applet, the learners can understand the wholes procedure that shows how the synchronous BCD counter will be designed. in addition, Fig. 2(a) shows the generation of initial and final state diagram for
asynchronous BCD counter. When the learners click the decimal buttons, the corresponding binary codes will be displayed as shown in Fig. 2(b).
Fig. 2(a) The generation of initial sate diagram
Fig.2 (b) The generation of final sate diagram
Fig.3 (a) Blank text fields for the inputs of JK flip-flops
42 Int'l Conf. e-Learning, e-Bus., EIS, and e-Gov. | EEE'13 |
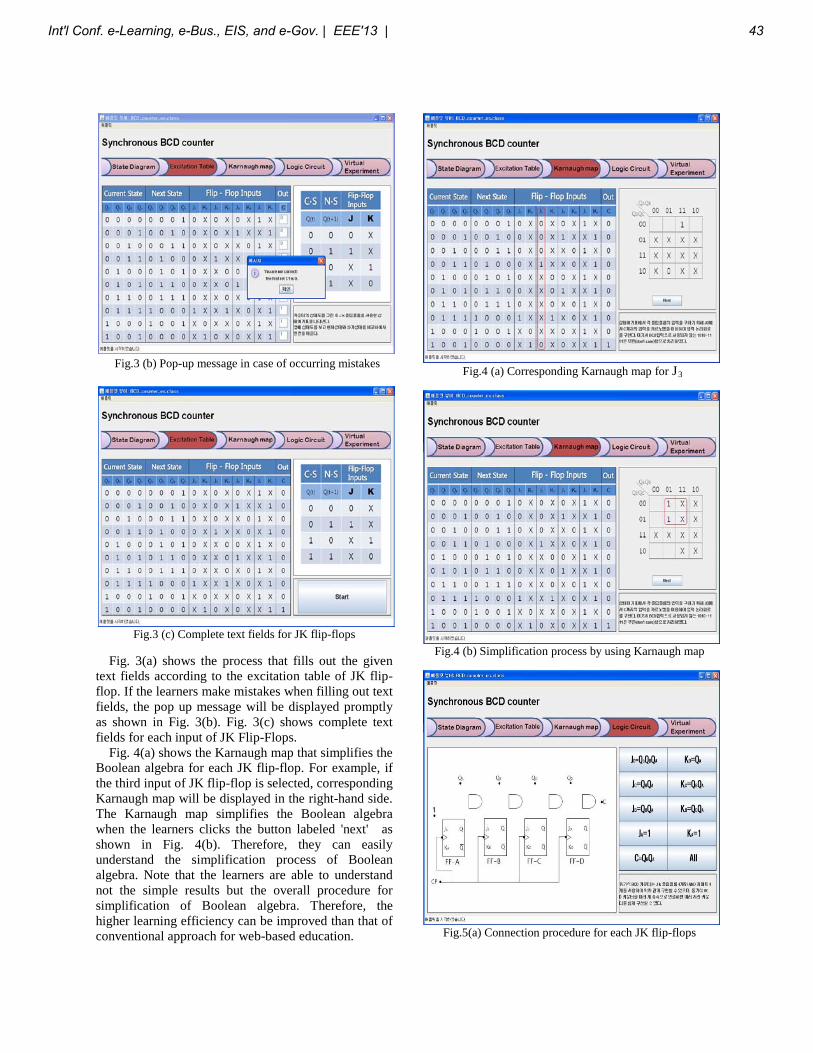
Fig.3 (b) Pop-up message in case of occurring mistakes
Fig.3 (c) Complete text fields for JK flip-flops
Fig. 3(a) shows the process that fills out the given text fields according to the excitation table of JK flip-flop. If the learners make mistakes when filling out text fields, the pop up message will be displayed promptly as shown in Fig. 3(b). Fig. 3(c) shows complete text fields for each input of JK Flip-Flops.
Fig. 4(a) shows the Karnaugh map that simplifies the Boolean algebra for each JK flip-flop. For example, if the third input of JK flip-flop is selected, corresponding Karnaugh map will be displayed in the right-hand side. The Karnaugh map simplifies the Boolean algebra when the learners clicks the button labeled 'next' as shown in Fig. 4(b). Therefore, they can easily understand the simplification process of Boolean algebra. Note that the learners are able to understand not the simple results but the overall procedure for simplification of Boolean algebra. Therefore, the higher learning efficiency can be improved than that of conventional approach for web-based education.
Fig.4 (a) Corresponding Karnaugh map for J
Fig.4 (b) Simplification process by using Karnaugh map
3
Fig.5(a) Connection procedure for each JK flip-flops
Int'l Conf. e-Learning, e-Bus., EIS, and e-Gov. | EEE'13 | 43
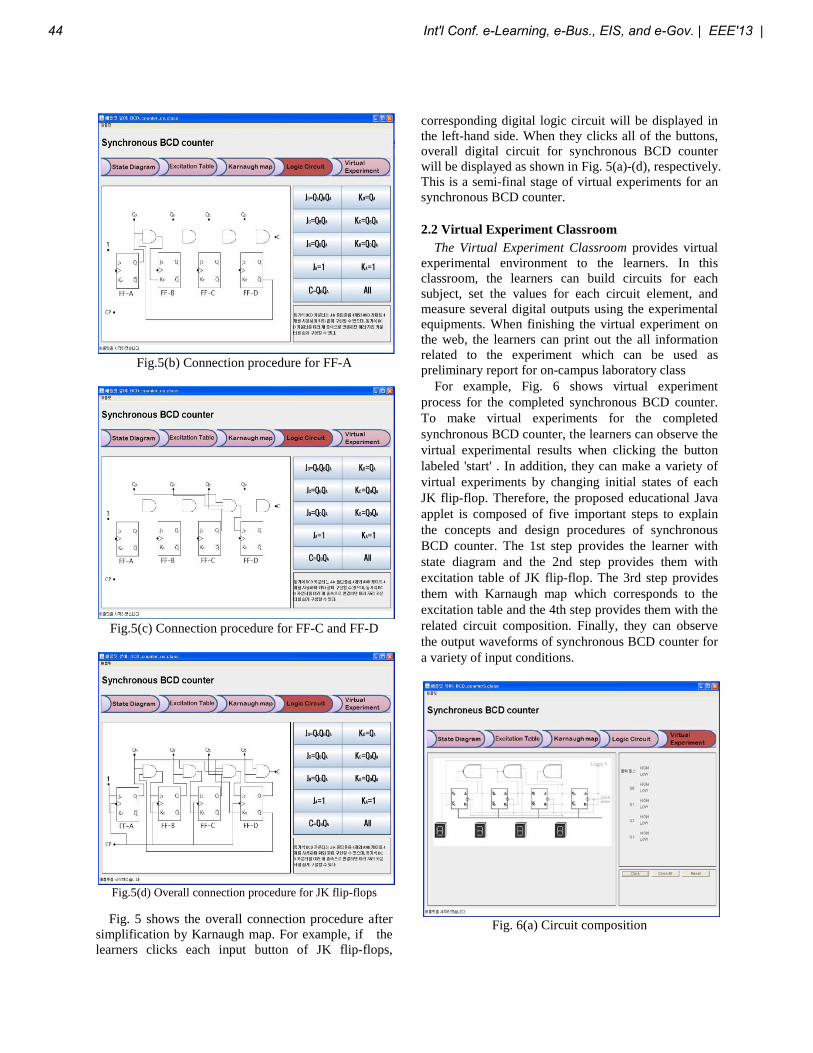
Fig.5(b) Connection procedure for FF-A
Fig.5(c) Connection procedure for FF-C and FF-D
Fig.5(d) Overall connection procedure for JK flip-flops
Fig. 5 shows the overall connection procedure after simplification by Karnaugh map. For example, if the learners clicks each input button of JK flip-flops,
corresponding digital logic circuit will be displayed in the left-hand side. When they clicks all of the buttons, overall digital circuit for synchronous BCD counter will be displayed as shown in Fig. 5(a)-(d), respectively. This is a semi-final stage of virtual experiments for an synchronous BCD counter.
2.2 Virtual Experiment Classroom The Virtual Experiment Classroom provides virtual
experimental environment to the learners. In this classroom, the learners can build circuits for each subject, set the values for each circuit element, and measure several digital outputs using the experimental equipments. When finishing the virtual experiment on the web, the learners can print out the all information related to the experiment which can be used as preliminary report for on-campus laboratory class For example, Fig. 6 shows virtual experiment process for the completed synchronous BCD counter. To make virtual experiments for the completed synchronous BCD counter, the learners can observe the virtual experimental results when clicking the button labeled 'start' . In addition, they can make a variety of virtual experiments by changing initial states of each JK flip-flop. Therefore, the proposed educational Java applet is composed of five important steps to explain the concepts and design procedures of synchronous BCD counter. The 1st step provides the learner with state diagram and the 2nd step provides them with excitation table of JK flip-flop. The 3rd step provides them with Karnaugh map which corresponds to the excitation table and the 4th step provides them with the related circuit composition. Finally, they can observe the output waveforms of synchronous BCD counter for a variety of input conditions.
Fig. 6(a) Circuit composition
44 Int'l Conf. e-Learning, e-Bus., EIS, and e-Gov. | EEE'13 |
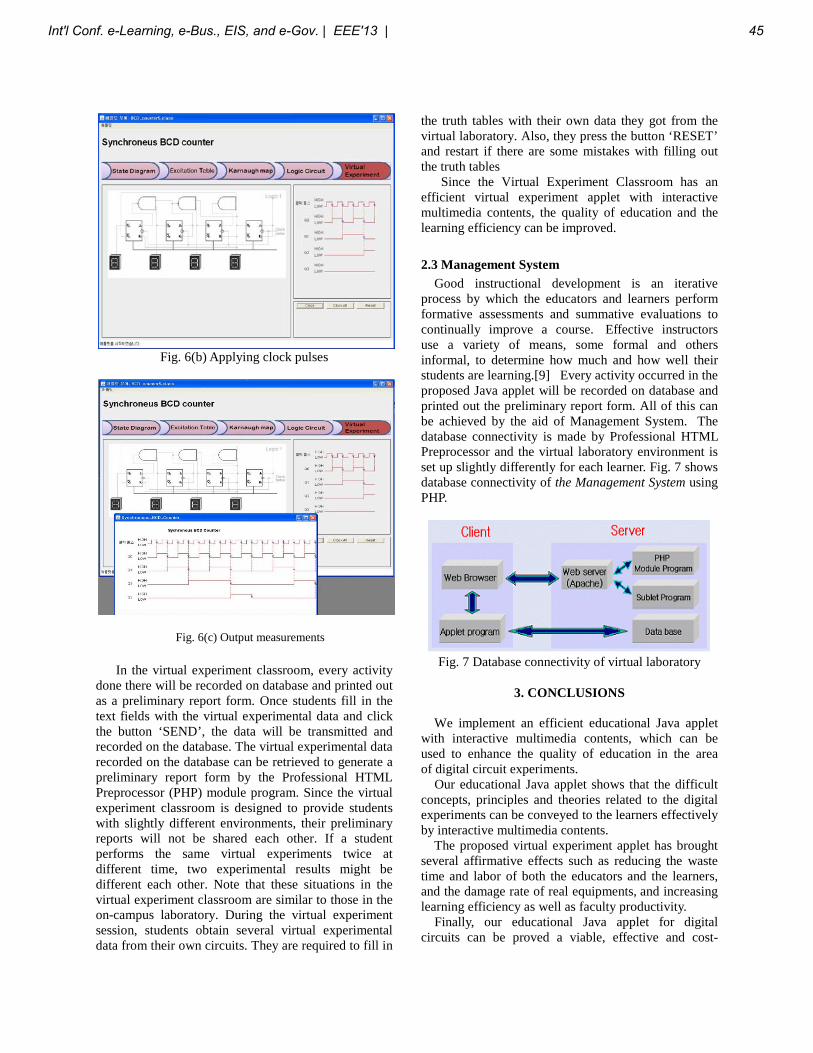
Fig. 6(b) Applying clock pulses
Fig. 6(c) Output measurements
In the virtual experiment classroom, every activity done there will be recorded on database and printed out as a preliminary report form. Once students fill in the text fields with the virtual experimental data and click the button ‘SEND’, the data will be transmitted and recorded on the database. The virtual experimental data recorded on the database can be retrieved to generate a preliminary report form by the Professional HTML Preprocessor (PHP) module program. Since the virtual experiment classroom is designed to provide students with slightly different environments, their preliminary reports will not be shared each other. If a student performs the same virtual experiments twice at different time, two experimental results might be different each other. Note that these situations in the virtual experiment classroom are similar to those in the on-campus laboratory. During the virtual experiment session, students obtain several virtual experimental data from their own circuits. They are required to fill in
the truth tables with their own data they got from the virtual laboratory. Also, they press the button ‘RESET’ and restart if there are some mistakes with filling out the truth tables
Since the Virtual Experiment Classroom has an efficient virtual experiment applet with interactive multimedia contents, the quality of education and the learning efficiency can be improved.
2.3 Management System
Good instructional development is an iterative process by which the educators and learners perform formative assessments and summative evaluations to continually improve a course. Effective instructors use a variety of means, some formal and others informal, to determine how much and how well their students are learning.[9] Every activity occurred in the proposed Java applet will be recorded on database and printed out the preliminary report form. All of this can be achieved by the aid of Management System. The database connectivity is made by Professional HTML Preprocessor and the virtual laboratory environment is set up slightly differently for each learner. Fig. 7 shows database connectivity of the Management System using PHP.
Fig. 7 Database connectivity of virtual laboratory
3. CONCLUSIONS
We implement an efficient educational Java applet
with interactive multimedia contents, which can be used to enhance the quality of education in the area of digital circuit experiments. Our educational Java applet shows that the difficult concepts, principles and theories related to the digital experiments can be conveyed to the learners effectively by interactive multimedia contents. The proposed virtual experiment applet has brought several affirmative effects such as reducing the waste time and labor of both the educators and the learners, and the damage rate of real equipments, and increasing learning efficiency as well as faculty productivity. Finally, our educational Java applet for digital circuits can be proved a viable, effective and cost-
Int'l Conf. e-Learning, e-Bus., EIS, and e-Gov. | EEE'13 | 45
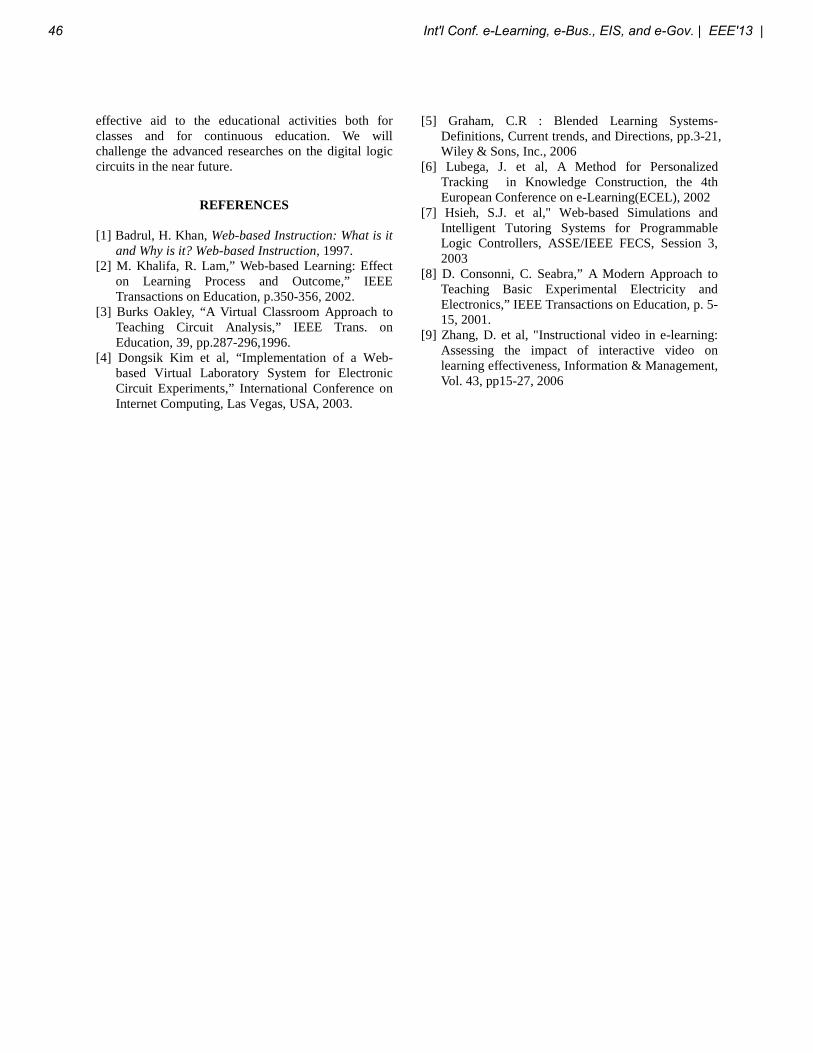
effective aid to the educational activities both for classes and for continuous education. We will challenge the advanced researches on the digital logic circuits in the near future.
REFERENCES [1] Badrul, H. Khan, Web-based Instruction: What is it
and Why is it? Web-based Instruction, 1997. [2] M. Khalifa, R. Lam,” Web-based Learning: Effect
on Learning Process and Outcome,” IEEE Transactions on Education, p.350-356, 2002.
[3] Burks Oakley, “A Virtual Classroom Approach to Teaching Circuit Analysis,” IEEE Trans. on Education, 39, pp.287-296,1996.
[4] Dongsik Kim et al, “Implementation of a Web-based Virtual Laboratory System for Electronic Circuit Experiments,” International Conference on Internet Computing, Las Vegas, USA, 2003.
[5] Graham, C.R : Blended Learning Systems-Definitions, Current trends, and Directions, pp.3-21, Wiley & Sons, Inc., 2006
[6] Lubega, J. et al, A Method for Personalized Tracking in Knowledge Construction, the 4th European Conference on e-Learning(ECEL), 2002
[7] Hsieh, S.J. et al," Web-based Simulations and Intelligent Tutoring Systems for Programmable Logic Controllers, ASSE/IEEE FECS, Session 3, 2003
[8] D. Consonni, C. Seabra,” A Modern Approach to Teaching Basic Experimental Electricity and Electronics,” IEEE Transactions on Education, p. 5-15, 2001.
[9] Zhang, D. et al, "Instructional video in e-learning: Assessing the impact of interactive video on learning effectiveness, Information & Management, Vol. 43, pp15-27, 2006
46 Int'l Conf. e-Learning, e-Bus., EIS, and e-Gov. | EEE'13 |
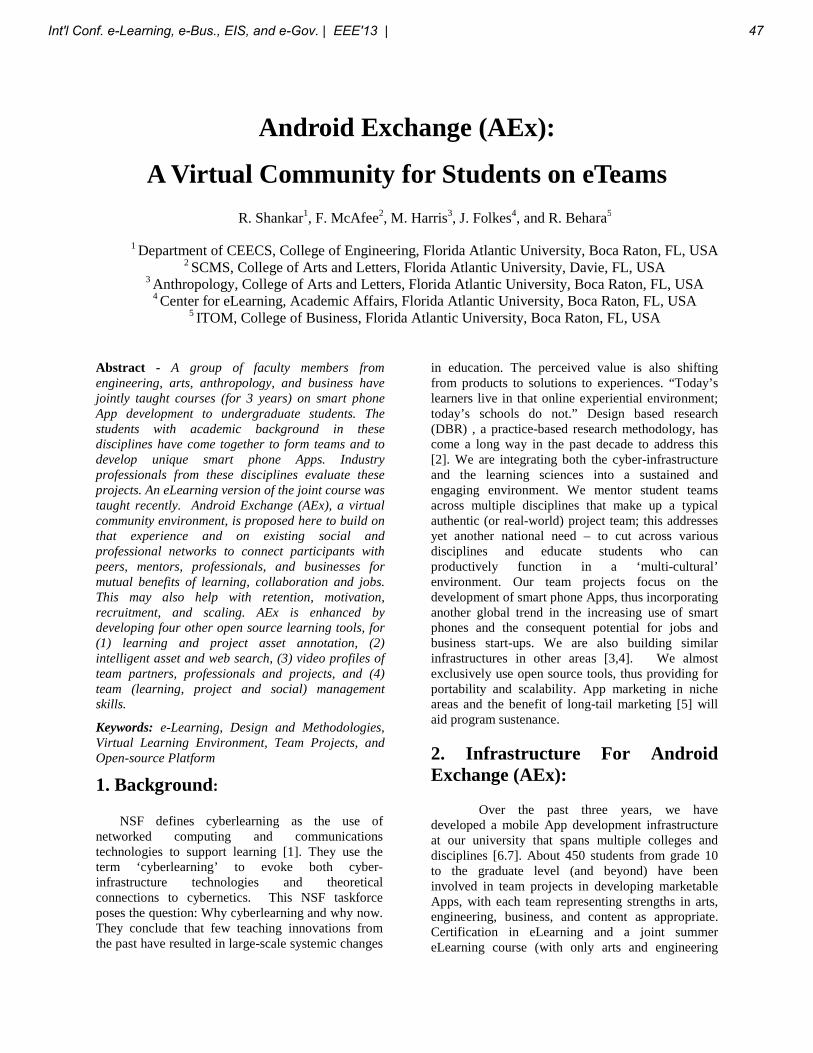
Android Exchange (AEx):
A Virtual Community for Students on eTeams
R. Shankar1, F. McAfee2, M. Harris3, J. Folkes4, and R. Behara5
1 Department of CEECS, College of Engineering, Florida Atlantic University, Boca Raton, FL, USA2 SCMS, College of Arts and Letters, Florida Atlantic University, Davie, FL, USA
3 Anthropology, College of Arts and Letters, Florida Atlantic University, Boca Raton, FL, USA4 Center for eLearning, Academic Affairs, Florida Atlantic University, Boca Raton, FL, USA
5 ITOM, College of Business, Florida Atlantic University, Boca Raton, FL, USA
Abstract - A group of faculty members fromengineering, arts, anthropology, and business havejointly taught courses (for 3 years) on smart phoneApp development to undergraduate students. Thestudents with academic background in thesedisciplines have come together to form teams and todevelop unique smart phone Apps. Industryprofessionals from these disciplines evaluate theseprojects. An eLearning version of the joint course wastaught recently. Android Exchange (AEx), a virtualcommunity environment, is proposed here to build onthat experience and on existing social andprofessional networks to connect participants withpeers, mentors, professionals, and businesses formutual benefits of learning, collaboration and jobs.This may also help with retention, motivation,recruitment, and scaling. AEx is enhanced bydeveloping four other open source learning tools, for(1) learning and project asset annotation, (2)intelligent asset and web search, (3) video profiles ofteam partners, professionals and projects, and (4)team (learning, project and social) managementskills.
Keywords: e-Learning, Design and Methodologies,Virtual Learning Environment, Team Projects, andOpen-source Platform
1. Background:
NSF defines cyberlearning as the use ofnetworked computing and communicationstechnologies to support learning [1]. They use theterm ‘cyberlearning’ to evoke both cyber-infrastructure technologies and theoreticalconnections to cybernetics. This NSF taskforceposes the question: Why cyberlearning and why now.They conclude that few teaching innovations fromthe past have resulted in large-scale systemic changes
in education. The perceived value is also shiftingfrom products to solutions to experiences. “Today’slearners live in that online experiential environment;today’s schools do not.” Design based research(DBR) , a practice-based research methodology, hascome a long way in the past decade to address this[2]. We are integrating both the cyber-infrastructureand the learning sciences into a sustained andengaging environment. We mentor student teamsacross multiple disciplines that make up a typicalauthentic (or real-world) project team; this addressesyet another national need – to cut across variousdisciplines and educate students who canproductively function in a ‘multi-cultural’environment. Our team projects focus on thedevelopment of smart phone Apps, thus incorporatinganother global trend in the increasing use of smartphones and the consequent potential for jobs andbusiness start-ups. We are also building similarinfrastructures in other areas [3,4]. We almostexclusively use open source tools, thus providing forportability and scalability. App marketing in nicheareas and the benefit of long-tail marketing [5] willaid program sustenance.
2. Infrastructure For AndroidExchange (AEx):
Over the past three years, we havedeveloped a mobile App development infrastructureat our university that spans multiple colleges anddisciplines [6.7]. About 450 students from grade 10to the graduate level (and beyond) have beeninvolved in team projects in developing marketableApps, with each team representing strengths in arts,engineering, business, and content as appropriate.Certification in eLearning and a joint summereLearning course (with only arts and engineering
Int'l Conf. e-Learning, e-Bus., EIS, and e-Gov. | EEE'13 | 47
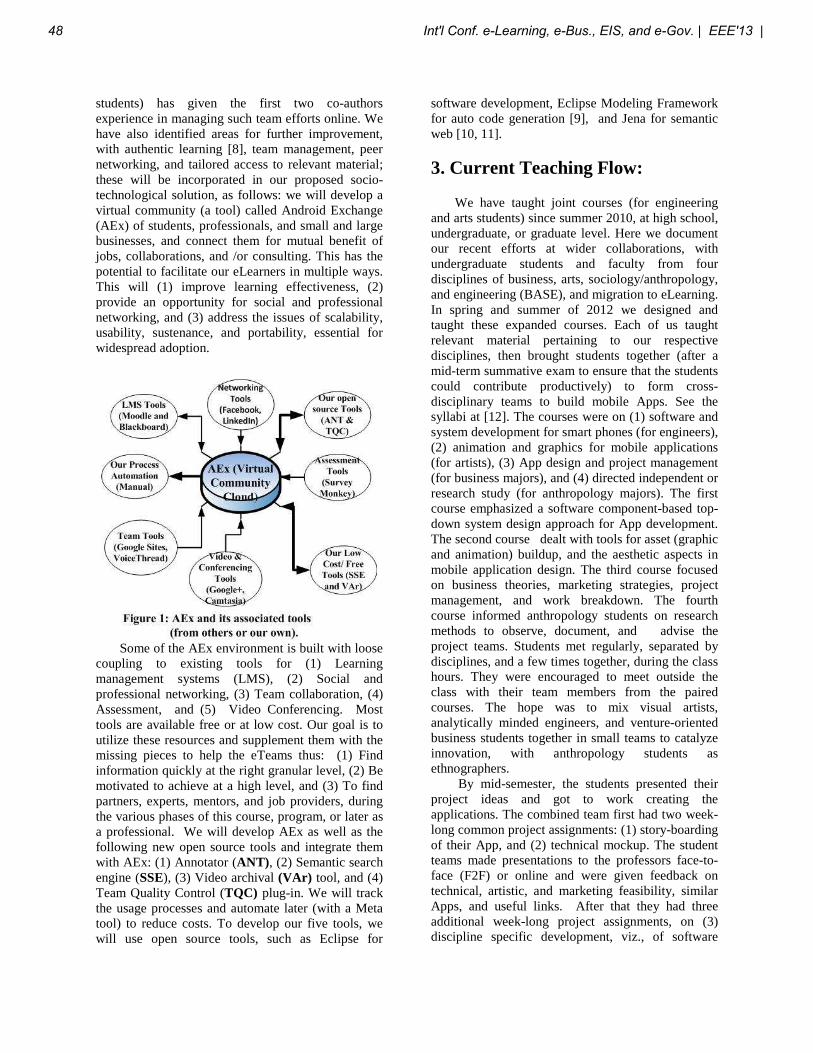
students) has given the first two co-authorsexperience in managing such team efforts online. Wehave also identified areas for further improvement,with authentic learning [8], team management, peernetworking, and tailored access to relevant material;these will be incorporated in our proposed socio-technological solution, as follows: we will develop avirtual community (a tool) called Android Exchange(AEx) of students, professionals, and small and largebusinesses, and connect them for mutual benefit ofjobs, collaborations, and /or consulting. This has thepotential to facilitate our eLearners in multiple ways.This will (1) improve learning effectiveness, (2)provide an opportunity for social and professionalnetworking, and (3) address the issues of scalability,usability, sustenance, and portability, essential forwidespread adoption.
Some of the AEx environment is built with loosecoupling to existing tools for (1) Learningmanagement systems (LMS), (2) Social andprofessional networking, (3) Team collaboration, (4)Assessment, and (5) Video Conferencing. Mosttools are available free or at low cost. Our goal is toutilize these resources and supplement them with themissing pieces to help the eTeams thus: (1) Findinformation quickly at the right granular level, (2) Bemotivated to achieve at a high level, and (3) To findpartners, experts, mentors, and job providers, duringthe various phases of this course, program, or later asa professional. We will develop AEx as well as thefollowing new open source tools and integrate themwith AEx: (1) Annotator (ANT), (2) Semantic searchengine (SSE), (3) Video archival (VAr) tool, and (4)Team Quality Control (TQC) plug-in. We will trackthe usage processes and automate later (with a Metatool) to reduce costs. To develop our five tools, wewill use open source tools, such as Eclipse for
software development, Eclipse Modeling Frameworkfor auto code generation [9], and Jena for semanticweb [10, 11].
3. Current Teaching Flow:
We have taught joint courses (for engineeringand arts students) since summer 2010, at high school,undergraduate, or graduate level. Here we documentour recent efforts at wider collaborations, withundergraduate students and faculty from fourdisciplines of business, arts, sociology/anthropology,and engineering (BASE), and migration to eLearning.In spring and summer of 2012 we designed andtaught these expanded courses. Each of us taughtrelevant material pertaining to our respectivedisciplines, then brought students together (after amid-term summative exam to ensure that the studentscould contribute productively) to form cross-disciplinary teams to build mobile Apps. See thesyllabi at [12]. The courses were on (1) software andsystem development for smart phones (for engineers),(2) animation and graphics for mobile applications(for artists), (3) App design and project management(for business majors), and (4) directed independent orresearch study (for anthropology majors). The firstcourse emphasized a software component-based top-down system design approach for App development.The second course dealt with tools for asset (graphicand animation) buildup, and the aesthetic aspects inmobile application design. The third course focusedon business theories, marketing strategies, projectmanagement, and work breakdown. The fourthcourse informed anthropology students on researchmethods to observe, document, and advise theproject teams. Students met regularly, separated bydisciplines, and a few times together, during the classhours. They were encouraged to meet outside theclass with their team members from the pairedcourses. The hope was to mix visual artists,analytically minded engineers, and venture-orientedbusiness students together in small teams to catalyzeinnovation, with anthropology students asethnographers.
By mid-semester, the students presented theirproject ideas and got to work creating theapplications. The combined team first had two week-long common project assignments: (1) story-boardingof their App, and (2) technical mockup. The studentteams made presentations to the professors face-to-face (F2F) or online and were given feedback ontechnical, artistic, and marketing feasibility, similarApps, and useful links. After that they had threeadditional week-long project assignments, on (3)discipline specific development, viz., of software
48 Int'l Conf. e-Learning, e-Bus., EIS, and e-Gov. | EEE'13 |
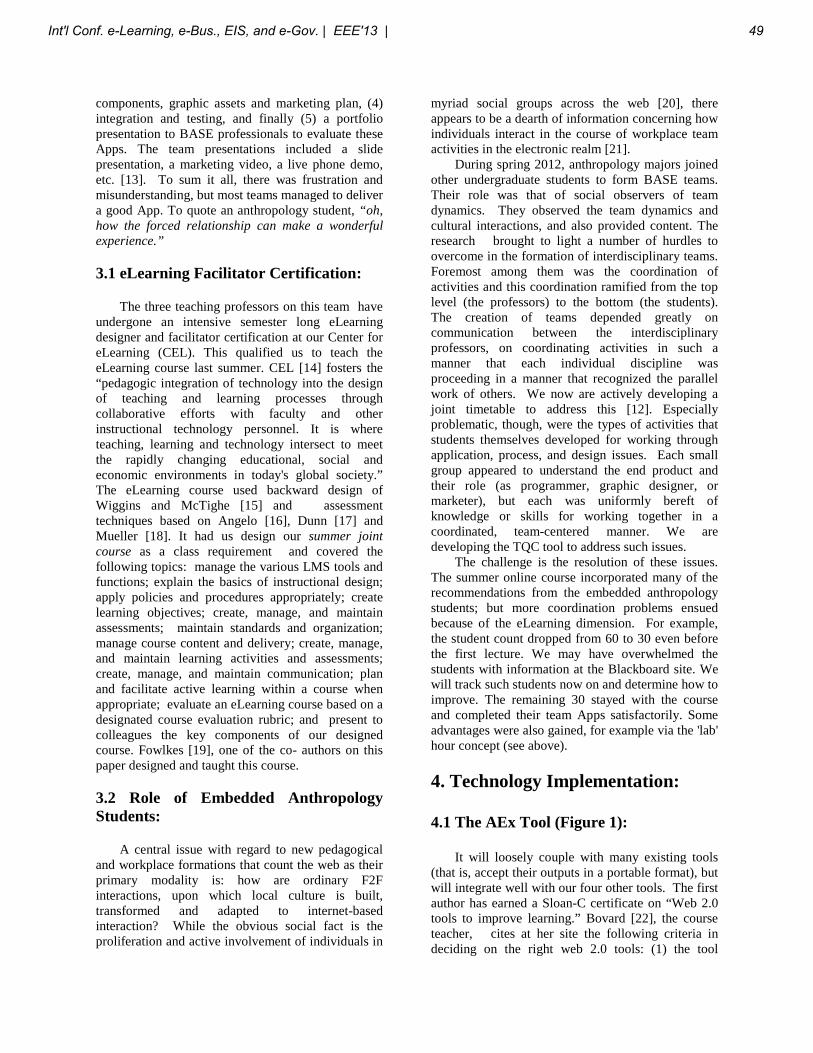
components, graphic assets and marketing plan, (4)integration and testing, and finally (5) a portfoliopresentation to BASE professionals to evaluate theseApps. The team presentations included a slidepresentation, a marketing video, a live phone demo,etc. [13]. To sum it all, there was frustration andmisunderstanding, but most teams managed to delivera good App. To quote an anthropology student, “oh,how the forced relationship can make a wonderfulexperience.”
3.1 eLearning Facilitator Certification:
The three teaching professors on this team haveundergone an intensive semester long eLearningdesigner and facilitator certification at our Center foreLearning (CEL). This qualified us to teach theeLearning course last summer. CEL [14] fosters the“pedagogic integration of technology into the designof teaching and learning processes throughcollaborative efforts with faculty and otherinstructional technology personnel. It is whereteaching, learning and technology intersect to meetthe rapidly changing educational, social andeconomic environments in today's global society.”The eLearning course used backward design ofWiggins and McTighe [15] and assessmenttechniques based on Angelo [16], Dunn [17] andMueller [18]. It had us design our summer jointcourse as a class requirement and covered thefollowing topics: manage the various LMS tools andfunctions; explain the basics of instructional design;apply policies and procedures appropriately; createlearning objectives; create, manage, and maintainassessments; maintain standards and organization;manage course content and delivery; create, manage,and maintain learning activities and assessments;create, manage, and maintain communication; planand facilitate active learning within a course whenappropriate; evaluate an eLearning course based on adesignated course evaluation rubric; and present tocolleagues the key components of our designedcourse. Fowlkes [19], one of the co- authors on thispaper designed and taught this course.
3.2 Role of Embedded AnthropologyStudents:
A central issue with regard to new pedagogicaland workplace formations that count the web as theirprimary modality is: how are ordinary F2Finteractions, upon which local culture is built,transformed and adapted to internet-basedinteraction? While the obvious social fact is theproliferation and active involvement of individuals in
myriad social groups across the web [20], thereappears to be a dearth of information concerning howindividuals interact in the course of workplace teamactivities in the electronic realm [21].
During spring 2012, anthropology majors joinedother undergraduate students to form BASE teams.Their role was that of social observers of teamdynamics. They observed the team dynamics andcultural interactions, and also provided content. Theresearch brought to light a number of hurdles toovercome in the formation of interdisciplinary teams.Foremost among them was the coordination ofactivities and this coordination ramified from the toplevel (the professors) to the bottom (the students).The creation of teams depended greatly oncommunication between the interdisciplinaryprofessors, on coordinating activities in such amanner that each individual discipline wasproceeding in a manner that recognized the parallelwork of others. We now are actively developing ajoint timetable to address this [12]. Especiallyproblematic, though, were the types of activities thatstudents themselves developed for working throughapplication, process, and design issues. Each smallgroup appeared to understand the end product andtheir role (as programmer, graphic designer, ormarketer), but each was uniformly bereft ofknowledge or skills for working together in acoordinated, team-centered manner. We aredeveloping the TQC tool to address such issues.
The challenge is the resolution of these issues.The summer online course incorporated many of therecommendations from the embedded anthropologystudents; but more coordination problems ensuedbecause of the eLearning dimension. For example,the student count dropped from 60 to 30 even beforethe first lecture. We may have overwhelmed thestudents with information at the Blackboard site. Wewill track such students now on and determine how toimprove. The remaining 30 stayed with the courseand completed their team Apps satisfactorily. Someadvantages were also gained, for example via the 'lab'hour concept (see above).
4. Technology Implementation:
4.1 The AEx Tool (Figure 1):
It will loosely couple with many existing tools(that is, accept their outputs in a portable format), butwill integrate well with our four other tools. The firstauthor has earned a Sloan-C certificate on “Web 2.0tools to improve learning.” Bovard [22], the courseteacher, cites at her site the following criteria indeciding on the right web 2.0 tools: (1) the tool
Int'l Conf. e-Learning, e-Bus., EIS, and e-Gov. | EEE'13 | 49
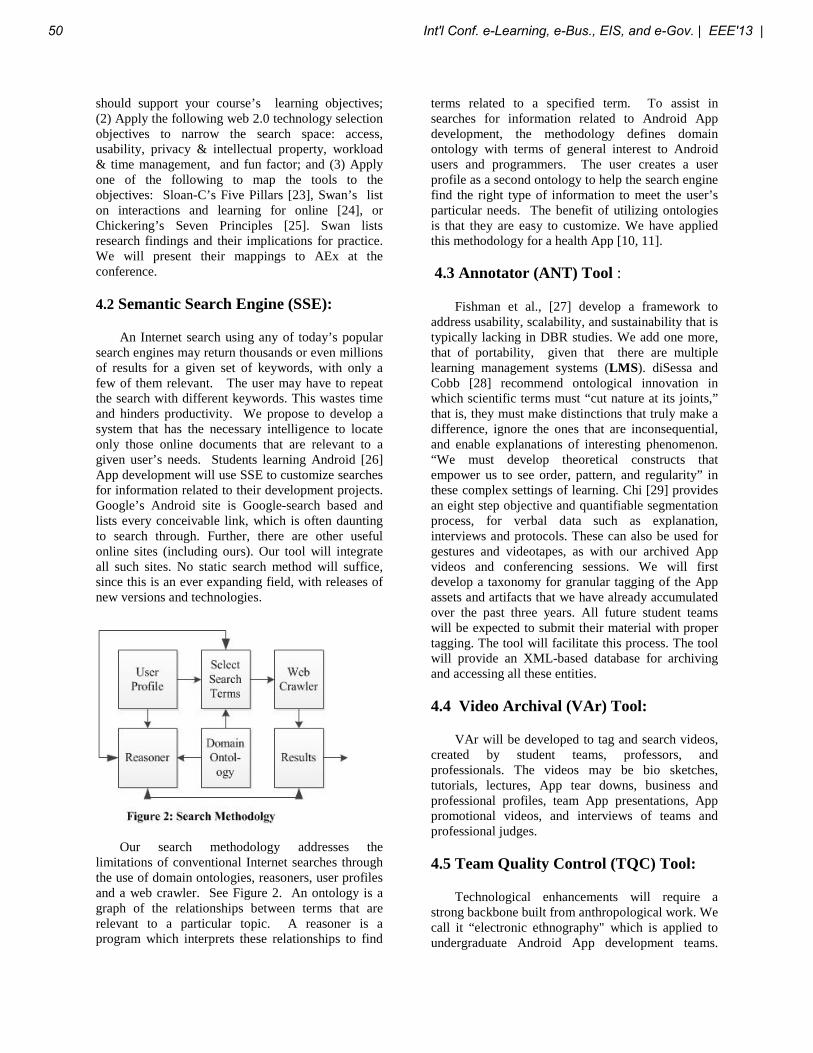
should support your course’s learning objectives;(2) Apply the following web 2.0 technology selectionobjectives to narrow the search space: access,usability, privacy & intellectual property, workload& time management, and fun factor; and (3) Applyone of the following to map the tools to theobjectives: Sloan-C’s Five Pillars [23], Swan’s liston interactions and learning for online [24], orChickering’s Seven Principles [25]. Swan listsresearch findings and their implications for practice.We will present their mappings to AEx at theconference.
4.2 Semantic Search Engine (SSE):
An Internet search using any of today’s popularsearch engines may return thousands or even millionsof results for a given set of keywords, with only afew of them relevant. The user may have to repeatthe search with different keywords. This wastes timeand hinders productivity. We propose to develop asystem that has the necessary intelligence to locateonly those online documents that are relevant to agiven user’s needs. Students learning Android [26]App development will use SSE to customize searchesfor information related to their development projects.Google’s Android site is Google-search based andlists every conceivable link, which is often dauntingto search through. Further, there are other usefulonline sites (including ours). Our tool will integrateall such sites. No static search method will suffice,since this is an ever expanding field, with releases ofnew versions and technologies.
Our search methodology addresses thelimitations of conventional Internet searches throughthe use of domain ontologies, reasoners, user profilesand a web crawler. See Figure 2. An ontology is agraph of the relationships between terms that arerelevant to a particular topic. A reasoner is aprogram which interprets these relationships to find
terms related to a specified term. To assist insearches for information related to Android Appdevelopment, the methodology defines domainontology with terms of general interest to Androidusers and programmers. The user creates a userprofile as a second ontology to help the search enginefind the right type of information to meet the user’sparticular needs. The benefit of utilizing ontologiesis that they are easy to customize. We have appliedthis methodology for a health App [10, 11].
4.3 Annotator (ANT) Tool :
Fishman et al., [27] develop a framework toaddress usability, scalability, and sustainability that istypically lacking in DBR studies. We add one more,that of portability, given that there are multiplelearning management systems (LMS). diSessa andCobb [28] recommend ontological innovation inwhich scientific terms must “cut nature at its joints,”that is, they must make distinctions that truly make adifference, ignore the ones that are inconsequential,and enable explanations of interesting phenomenon.“We must develop theoretical constructs thatempower us to see order, pattern, and regularity” inthese complex settings of learning. Chi [29] providesan eight step objective and quantifiable segmentationprocess, for verbal data such as explanation,interviews and protocols. These can also be used forgestures and videotapes, as with our archived Appvideos and conferencing sessions. We will firstdevelop a taxonomy for granular tagging of the Appassets and artifacts that we have already accumulatedover the past three years. All future student teamswill be expected to submit their material with propertagging. The tool will facilitate this process. The toolwill provide an XML-based database for archivingand accessing all these entities.
4.4 Video Archival (VAr) Tool:
VAr will be developed to tag and search videos,created by student teams, professors, andprofessionals. The videos may be bio sketches,tutorials, lectures, App tear downs, business andprofessional profiles, team App presentations, Apppromotional videos, and interviews of teams andprofessional judges.
4.5 Team Quality Control (TQC) Tool:
Technological enhancements will require astrong backbone built from anthropological work. Wecall it “electronic ethnography" which is applied toundergraduate Android App development teams.
50 Int'l Conf. e-Learning, e-Bus., EIS, and e-Gov. | EEE'13 |
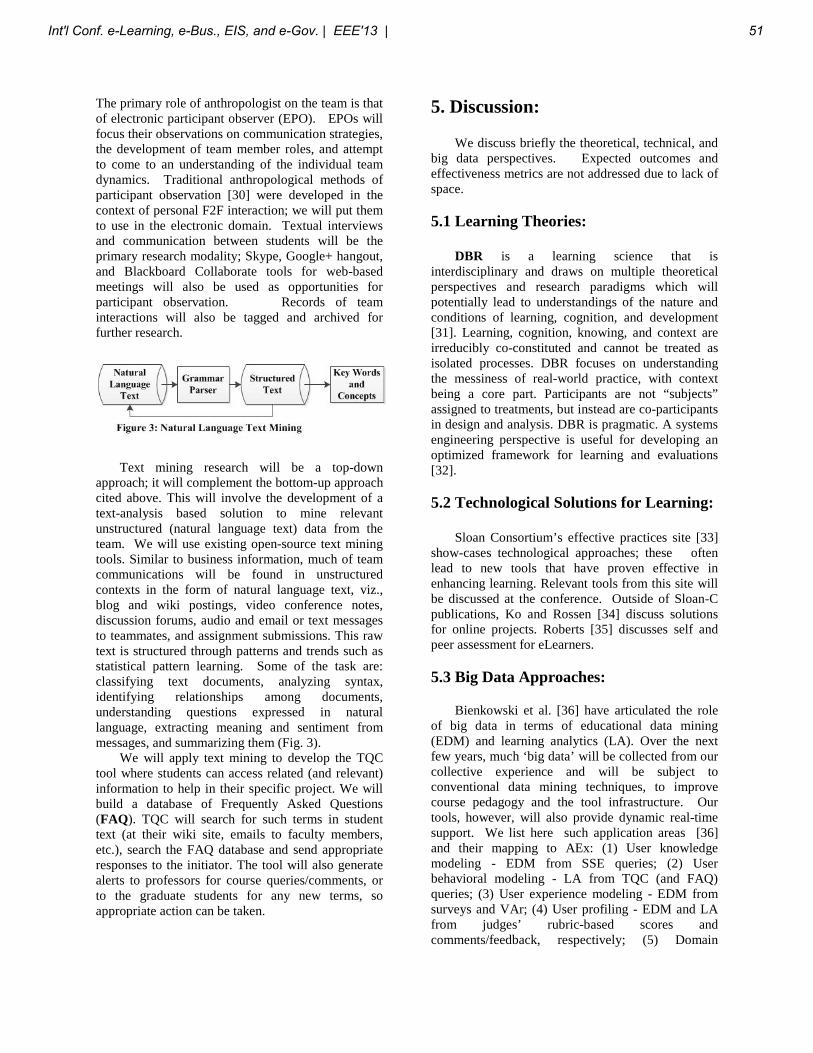
The primary role of anthropologist on the team is thatof electronic participant observer (EPO). EPOs willfocus their observations on communication strategies,the development of team member roles, and attemptto come to an understanding of the individual teamdynamics. Traditional anthropological methods ofparticipant observation [30] were developed in thecontext of personal F2F interaction; we will put themto use in the electronic domain. Textual interviewsand communication between students will be theprimary research modality; Skype, Google+ hangout,and Blackboard Collaborate tools for web-basedmeetings will also be used as opportunities forparticipant observation. Records of teaminteractions will also be tagged and archived forfurther research.
Text mining research will be a top-downapproach; it will complement the bottom-up approachcited above. This will involve the development of atext-analysis based solution to mine relevantunstructured (natural language text) data from theteam. We will use existing open-source text miningtools. Similar to business information, much of teamcommunications will be found in unstructuredcontexts in the form of natural language text, viz.,blog and wiki postings, video conference notes,discussion forums, audio and email or text messagesto teammates, and assignment submissions. This rawtext is structured through patterns and trends such asstatistical pattern learning. Some of the task are:classifying text documents, analyzing syntax,identifying relationships among documents,understanding questions expressed in naturallanguage, extracting meaning and sentiment frommessages, and summarizing them (Fig. 3).
We will apply text mining to develop the TQCtool where students can access related (and relevant)information to help in their specific project. We willbuild a database of Frequently Asked Questions(FAQ). TQC will search for such terms in studenttext (at their wiki site, emails to faculty members,etc.), search the FAQ database and send appropriateresponses to the initiator. The tool will also generatealerts to professors for course queries/comments, orto the graduate students for any new terms, soappropriate action can be taken.
5. Discussion:
We discuss briefly the theoretical, technical, andbig data perspectives. Expected outcomes andeffectiveness metrics are not addressed due to lack ofspace.
5.1 Learning Theories:
DBR is a learning science that isinterdisciplinary and draws on multiple theoreticalperspectives and research paradigms which willpotentially lead to understandings of the nature andconditions of learning, cognition, and development[31]. Learning, cognition, knowing, and context areirreducibly co-constituted and cannot be treated asisolated processes. DBR focuses on understandingthe messiness of real-world practice, with contextbeing a core part. Participants are not “subjects”assigned to treatments, but instead are co-participantsin design and analysis. DBR is pragmatic. A systemsengineering perspective is useful for developing anoptimized framework for learning and evaluations[32].
5.2 Technological Solutions for Learning:
Sloan Consortium’s effective practices site [33]show-cases technological approaches; these oftenlead to new tools that have proven effective inenhancing learning. Relevant tools from this site willbe discussed at the conference. Outside of Sloan-Cpublications, Ko and Rossen [34] discuss solutionsfor online projects. Roberts [35] discusses self andpeer assessment for eLearners.
5.3 Big Data Approaches:
Bienkowski et al. [36] have articulated the roleof big data in terms of educational data mining(EDM) and learning analytics (LA). Over the nextfew years, much ‘big data’ will be collected from ourcollective experience and will be subject toconventional data mining techniques, to improvecourse pedagogy and the tool infrastructure. Ourtools, however, will also provide dynamic real-timesupport. We list here such application areas [36]and their mapping to AEx: (1) User knowledgemodeling - EDM from SSE queries; (2) Userbehavioral modeling - LA from TQC (and FAQ)queries; (3) User experience modeling - EDM fromsurveys and VAr; (4) User profiling - EDM and LAfrom judges’ rubric-based scores andcomments/feedback, respectively; (5) Domain
Int'l Conf. e-Learning, e-Bus., EIS, and e-Gov. | EEE'13 | 51
modeling - From ANT; (6) Learning Componentanalysis and instructional principle analysis - EDMfrom AEx usage statistics (longer term); (7) TrendAnalysis - EDM on App maturity and skill levelfrom judges’ comments/ feedback, and from Appmarketing successes (longer term); and (8)Adaptability and Personalization - LA from TQC(and FAQ), and personalization of SSE.
6. Conclusions:We have developed an eLearning tool
architecture that is ideal for facilitating eTeams. Webelieve that the following outcomes will be positivelyimpacted: (a) sustenance, portability, scalability, andusability for LMS tools, and (b) retention,motivation, and recruitment of students. The toolinfrastructure and potential for big data analyticsprovides for significant improvements in teachingand learning as the tools are deployed and used in ouronline courses.
7. References:[1] NSF, Fostering learning in the networked world:
The cyberlearning opportunity and challenge: A21st century agenda for the National ScienceFoundation. A report of the NSF task Force onCyberlearning. June 24, 2008, Christine L.Borgman (Chair), Retrieved fromhttp://www.nsf.gov/
[2] T. Anderson and J. Shattuck, Design-basedresearch: A decade of progress in educationresearch?, Educational Researcher, FeaturedArticle, 41(1), 16-25, Retrieved fromhttp://edr.sagepub.com/content/current, 2012
[3] Robotics, Florida Atlantic University’s websitefor robotics, http://robotics.fau.edu/ , 2011
[4] Semantic Web, Florida Atlantic University’swebsite for Semantic Web Technologies,http://semanticweb.fau.edu/, 2011
[5] J.S. Brown & R.P Adler, Minds on fire: Openeducation, the long tail, and learning 2.0.EDUCAUSE Review, 43(1), 16–32, 2008
[6] Android, Florida Atlantic University’s website forAndroid smart phones, http://android.fau.edu/,2010
[7] R. Shankar, F. McAfee, & M. Harris, Smartphone app development: A multi-collegeapproach, 2013 ASEE Annual Conf., June 2013,Atlanta, GA, accepted, Seehttp://eteams.pbworks.com/
[8] M.M. Lombardi, Making the grade: The role ofassessment in authentic learning, EducauseLearning Initiative, ELI Paper 1: Retrieved fromhttp://www.educause.edu/library/resources/making-grade-role-assessment-authentic-learning ,2008
[9] R. Shankar, J. Dickson, & C. Mozelny, A toolfor ABET accreditation, 2013 ASEE AnnualConference, June 2013, Atlanta, GA, accepted.Available at http://eteams.pbworks.com/
[10] S. Islam, G. Freytag, & R. Shankar,Intelligent health information system to
empower patient with chronic diseases, IEEE IRIWorkshop on Health Informatics, August 2012,Las Vegas, NV.
[11] S. Islam, R. Shankar, & G. Freytag,Leveraging semantic web to retrieve customizedmedical information, IEEE Systems Conference,April 2013, Orlando, FL, paper presented. Draftavailable at http://eteams.pbworks.com/
[12] eTeams, FAU Professor’s wiki site for jointcourse development.http://eteams.pbworks.com/w/page/61784805/FrontPage , 2012
[13] Videos, Florida Atlantic University webpagewith links to all student marketing videos andmedia articles,http://faculty.eng.fau.edu/shankar/research/smart-phone-apps/, 2013
[14] CEL, Florida Atlantic University’s website forCenter for eLearning. http://www.fau.edu/cel/ ,2012
[15] G. Wiggins, & J. McTighe, Understanding byDesign (2nd Edition). Pearson: Upper SaddleRiver, NJ, 2005
[16] T.A. Angelo, & K.P. Cross, ClassroomAssessment Techniques: A Handbook forCollege Teachers (2nd Ed.), San Francisco, CA:Jossey-Bass, 1993
[17] L. Dunn, C. Morgan, M. O’Reilly, & S. Parry,The Student Assessment Handbook: NewDirections in Traditional & Online Assessment,New York, NY: RoutledgeFalmer, 2004
[18] J. F. Mueller, (Authentic assessment toolbox[website], Retrieved fromhttp://jfmueller.faculty.noctrl.edu/toolbox/, 2011
[19] J.K. Fowlkes, The Yin-yang of Learning,Education Partnership Conference, Sanford, FL,July 2010
[20] C. Kelty, Geeks, social imaginaries andrecursive publics, Cultural Anthropology 20(X):185-214, 2005
52 Int'l Conf. e-Learning, e-Bus., EIS, and e-Gov. | EEE'13 |
[21] T.P. Mackey & T.E. Jacobson, ReframingInformation Literacy as a Metaliteracy, College& Research Libraries 72(1), 62-78, 2011
[22] B. Bovard, Web 2.0 Selection Criteria, TekTrekker’s blog. Retrieved fromhttp://tektrek.wordpress.com/2009/03/02/web-20-selection-criteria/ 2012
[23] Sloan-C, The Five Pillars, Retrieved fromhttp://sloanconsortium.org/5pillars, 2012
[24] K. Swan, Relationship between interactions andlearning in online environments, The SloanConsortium. Retrieved fromsloanconsortium.org/publications/books/pdf/interactions.pdf , 2004
[25] A. Chickering, & S.C. Ehrmann, Implementingthe seven principles: Technology as lever,AAHE Bulletin, October, 3-6, 1996
[26] Android developers website. Retrieved fromhttp://developer.android.com/index.html, 2012
[27] B. Fishman, W. Marx, P. Blumenfeld, J.Krajcik, & E. Soloway, Creating a frameworkfor research on systemic technology innovations,Journal of the Learning Sciences, 13(1), 43-46,2004
[28] A.A. diSessa & P. Cobb, Ontologicalinnovation and the role of theory in designexperiments, Journal of the Learning Sciences,13(1),77-103, 2004
[29] T.H. Chi, Quantifying qualitative analysis ofverbal data: A practical guide. Journal of theLearning Sciences, 6(3), 271-315, 1997
[30] S. Schensul, J.J. Schensul, & M. LeCompte,Essential Ethnographic Methods, AltaMiraPress, 1999
[31] S. Barab, & K. Squire, Design-based research:Putting a stake in the ground, Journal of theLearning Sciences, 13(1), 1-14. Retrieved fromhttp://learnlab.org/research/wiki/images/a/ab/2004_Barab_Squire.pdf, 2004
[32] A. Collins, D. Joseph, & K. Bielaczyc, Designresearch: Theoretical and methodical issues,Journal of the Learning Sciences, 13(1), 15-42.Retrieved fromhttp://treeves.coe.uga.edu/EDIT9990/Collins2004.pdf , 2004
[33] Sloan-C (2012a). Sloan-C Effective Practicessite. http://sloanconsortium.org/effective 2012
[34] S. Ko, & S. Rossen, Teaching online: A practicalguide, Boston, MA: Houghton Mifflin. 2001
[35] T.S. Roberts, Self, Peer, and Group Assessmentin E-Learning: An Introduction. In T. S. Roberts’(Ed.) Self, Peer, and Group Assessment in E-Learning, Queensland, Australia: CentralQueensland University. 2006
[36] M. Bienkowski, M. Feng, and B. Means,Enhancing Teaching and Learning ThroughEducational Data Mining and LearningAnalytics, US Department of Education, October2012, www.ed.gov
Int'l Conf. e-Learning, e-Bus., EIS, and e-Gov. | EEE'13 | 53
Recognizing Classroom Atmosphere with Good Attention to the Ongoing Lecture for Indexing its Archived Video
Koh KAKUSHO1, Yohei KOBAYASHI1, Takeshi OKADOME1, and Masayuki MURAKAMI2
1School of Science and Technology, Kwansei Gakuin University, Sanda, Hyogo, Japan 2Research Center for Multi-Media Education, Kyoto University of Foreign Studies, Kyoto, Japan
Abstract - This article discusses how to recognize the atmosphere in a classroom where the students show good attention on the ongoing lecture from its archived video as a novel video indexing technology for e-learning application. We first show that facial orientations of the students in the classroom can be used as a useful visual feature obtainable from archived videos in order to recognize the classroom atmosphere with good attention from the students to the lecture, based on our analysis on the relationship between the behavior of the students and the classroom atmosphere that our humans actually recognize by watching the videos. Second, we present a method of recognizing the classroom atmosphere by estimating facial orientations of the students in each image frame of the video. In our experiment with a real archived videos, the success rate (F-measure) of the recognition was about 70%.
Keywords: lecture archiving, video indexing, classroom atmosphere, human behavior recognition, facial image processing
1 Introduction
With recent widespread of multimedia technologies to the field of higher education, it becomes quite usual for various universities to archive their lectures in the form including video streams accessible from the Internet[1]-[3]. Each student can watch these archives for review or self-learning of the archived lectures afterward. These lecture archives are also expected to be useful for faculty development of lecturers to improve their lectures.
Since it takes long time, which is actually as long as the amount of time spent for each lecture, to watch each archived lecture video completely, it is desirable that the video is indexed by various situations actually occurred during the lecture[4]. In order to cut down on labor for archiving each lecture by giving indices on the archived video by hand, it has been discussed in previous work how to recognize various kind of situations possible to occur in lectures by employing video image processing, for realizing automatic lecture archiving or video indexing[5]-[16].
We can consider various kinds of situations as those which are possible to occur in each lecture. Among those possible situations, most representative kinds of situations useful for searching scenes of the viewers’ interests in the recorded video should be those concerning with the lecturer. Thus, most of the previous work has focused on recognizing those situations that include positions[5][6] and behaviors[7]-[12] of the lecturer, writing on the blackboard[8][11]-[13], pointed areas on the blackboard or slides[14], and so on.
In contrast to the work on recognizing situations of the lecturer described above, some other work focuses on those of the students: motion of each student[15] or making a question by one of the students[8][16], for example. When archived lecture videos are used for faculty development, in which lecturers are given the chance for reviewing their own lectures by watching the videos, situations of students concerning with their own behaviors during the lectures, their responses to the behavior of the lecturers, and so on are quite useful for considering how the lectures can be further improved afterwards.
Although above situations of the students are mainly concerned with the behavior of each individual student, it is also significant to consider situations of the students as a whole group. A group of students receiving the same lecture in the same classroom creates various kinds of atmosphere together at each moment of the lecture. Recognizing this atmosphere in the classroom should also be one of the important situations for indexing archived lecture videos for the purpose of faculty development. What the lecturers feel about whether they are successful or not are strongly affected by the atmosphere created by the students in the classroom during their lectures. If, for example, lecturers could feel the students are concentrating to their talks during the lectures, they would recognize their lectures are successful in attracting the interests of the students, and if not, they would think that their way of giving lectures or the contents of their lectures should further be improved to attract the interests of the students. These considerations could become possible if the archived lecture videos are given with the indices of the atmosphere of the students.
In the remainder of this article, we will discuss how to recognize the atmosphere created by a group of students from
54 Int'l Conf. e-Learning, e-Bus., EIS, and e-Gov. | EEE'13 |
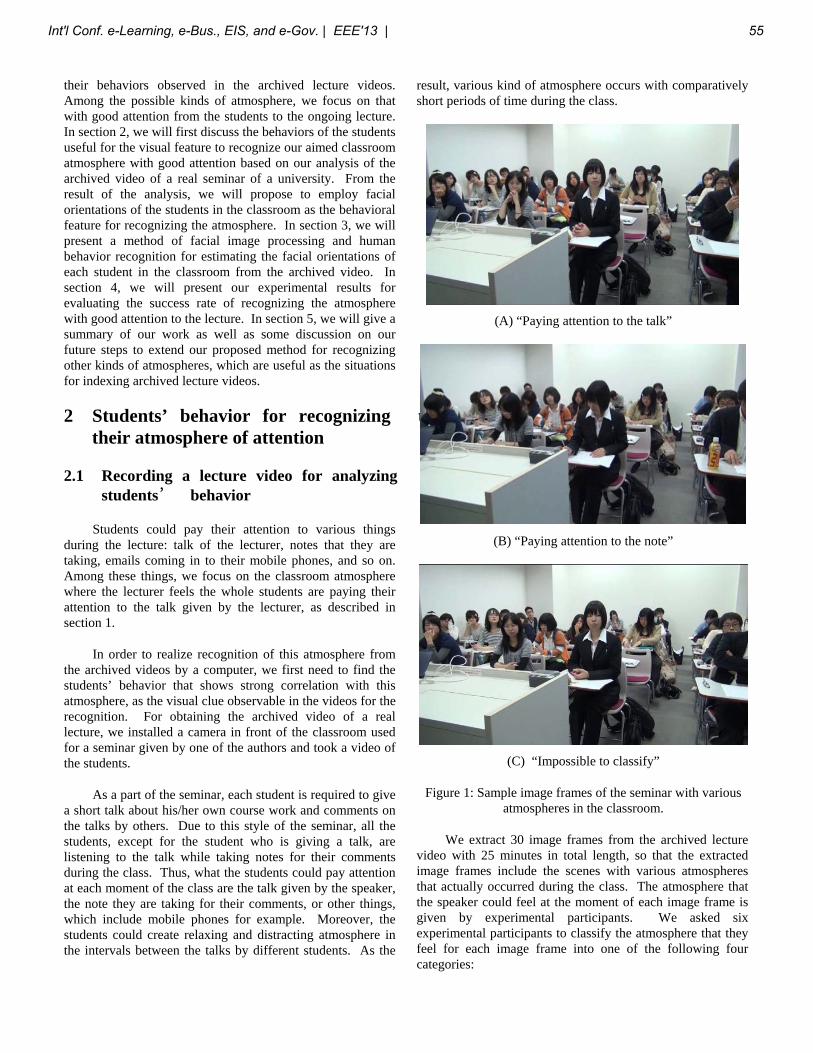
their behaviors observed in the archived lecture videos. Among the possible kinds of atmosphere, we focus on that with good attention from the students to the ongoing lecture. In section 2, we will first discuss the behaviors of the students useful for the visual feature to recognize our aimed classroom atmosphere with good attention based on our analysis of the archived video of a real seminar of a university. From the result of the analysis, we will propose to employ facial orientations of the students in the classroom as the behavioral feature for recognizing the atmosphere. In section 3, we will present a method of facial image processing and human behavior recognition for estimating the facial orientations of each student in the classroom from the archived video. In section 4, we will present our experimental results for evaluating the success rate of recognizing the atmosphere with good attention to the lecture. In section 5, we will give a summary of our work as well as some discussion on our future steps to extend our proposed method for recognizing other kinds of atmospheres, which are useful as the situations for indexing archived lecture videos.
2 Students’ behavior for recognizing t their atmosphere of attention
2.1 Recording a lecture video for analyzing students’ behavior
Students could pay their attention to various things during the lecture: talk of the lecturer, notes that they are taking, emails coming in to their mobile phones, and so on. Among these things, we focus on the classroom atmosphere where the lecturer feels the whole students are paying their attention to the talk given by the lecturer, as described in section 1.
In order to realize recognition of this atmosphere from the archived videos by a computer, we first need to find the students’ behavior that shows strong correlation with this atmosphere, as the visual clue observable in the videos for the recognition. For obtaining the archived video of a real lecture, we installed a camera in front of the classroom used for a seminar given by one of the authors and took a video of the students.
As a part of the seminar, each student is required to give a short talk about his/her own course work and comments on the talks by others. Due to this style of the seminar, all the students, except for the student who is giving a talk, are listening to the talk while taking notes for their comments during the class. Thus, what the students could pay attention at each moment of the class are the talk given by the speaker, the note they are taking for their comments, or other things, which include mobile phones for example. Moreover, the students could create relaxing and distracting atmosphere in the intervals between the talks by different students. As the
result, various kind of atmosphere occurs with comparatively short periods of time during the class.
(A) “Paying attention to the talk”
(B) “Paying attention to the note”
(C) “Impossible to classify”
Figure 1: Sample image frames of the seminar with various atmospheres in the classroom.
We extract 30 image frames from the archived lecture video with 25 minutes in total length, so that the extracted image frames include the scenes with various atmospheres that actually occurred during the class. The atmosphere that the speaker could feel at the moment of each image frame is given by experimental participants. We asked six experimental participants to classify the atmosphere that they feel for each image frame into one of the following four categories:
Int'l Conf. e-Learning, e-Bus., EIS, and e-Gov. | EEE'13 | 55
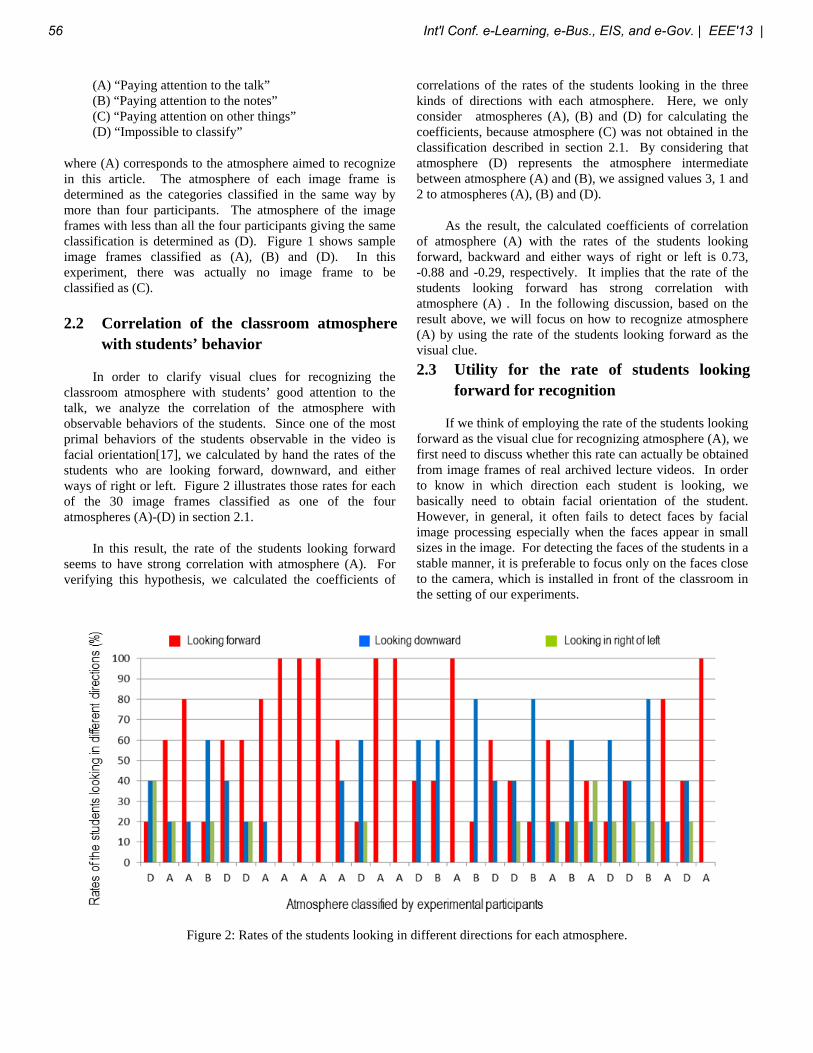
(A) “Paying attention to the talk” (B) “Paying attention to the notes” (C) “Paying attention on other things” (D) “Impossible to classify”
where (A) corresponds to the atmosphere aimed to recognize in this article. The atmosphere of each image frame is determined as the categories classified in the same way by more than four participants. The atmosphere of the image frames with less than all the four participants giving the same classification is determined as (D). Figure 1 shows sample image frames classified as (A), (B) and (D). In this experiment, there was actually no image frame to be classified as (C).
2.2 Correlation of the classroom atmosphere with students’ behavior
In order to clarify visual clues for recognizing the classroom atmosphere with students’ good attention to the talk, we analyze the correlation of the atmosphere with observable behaviors of the students. Since one of the most primal behaviors of the students observable in the video is facial orientation[17], we calculated by hand the rates of the students who are looking forward, downward, and either ways of right or left. Figure 2 illustrates those rates for each of the 30 image frames classified as one of the four atmospheres (A)-(D) in section 2.1.
In this result, the rate of the students looking forward seems to have strong correlation with atmosphere (A). For verifying this hypothesis, we calculated the coefficients of
correlations of the rates of the students looking in the three kinds of directions with each atmosphere. Here, we only consider atmospheres (A), (B) and (D) for calculating the coefficients, because atmosphere (C) was not obtained in the classification described in section 2.1. By considering that atmosphere (D) represents the atmosphere intermediate between atmosphere (A) and (B), we assigned values 3, 1 and 2 to atmospheres (A), (B) and (D).
As the result, the calculated coefficients of correlation of atmosphere (A) with the rates of the students looking forward, backward and either ways of right or left is 0.73, -0.88 and -0.29, respectively. It implies that the rate of the students looking forward has strong correlation with atmosphere (A) . In the following discussion, based on the result above, we will focus on how to recognize atmosphere (A) by using the rate of the students looking forward as the visual clue. 2.3 Utility for the rate of students looking
forward for recognition
If we think of employing the rate of the students looking forward as the visual clue for recognizing atmosphere (A), we first need to discuss whether this rate can actually be obtained from image frames of real archived lecture videos. In order to know in which direction each student is looking, we basically need to obtain facial orientation of the student. However, in general, it often fails to detect faces by facial image processing especially when the faces appear in small sizes in the image. For detecting the faces of the students in a stable manner, it is preferable to focus only on the faces close to the camera, which is installed in front of the classroom in the setting of our experiments.
Figure 2: Rates of the students looking in different directions for each atmosphere.
56 Int'l Conf. e-Learning, e-Bus., EIS, and e-Gov. | EEE'13 |
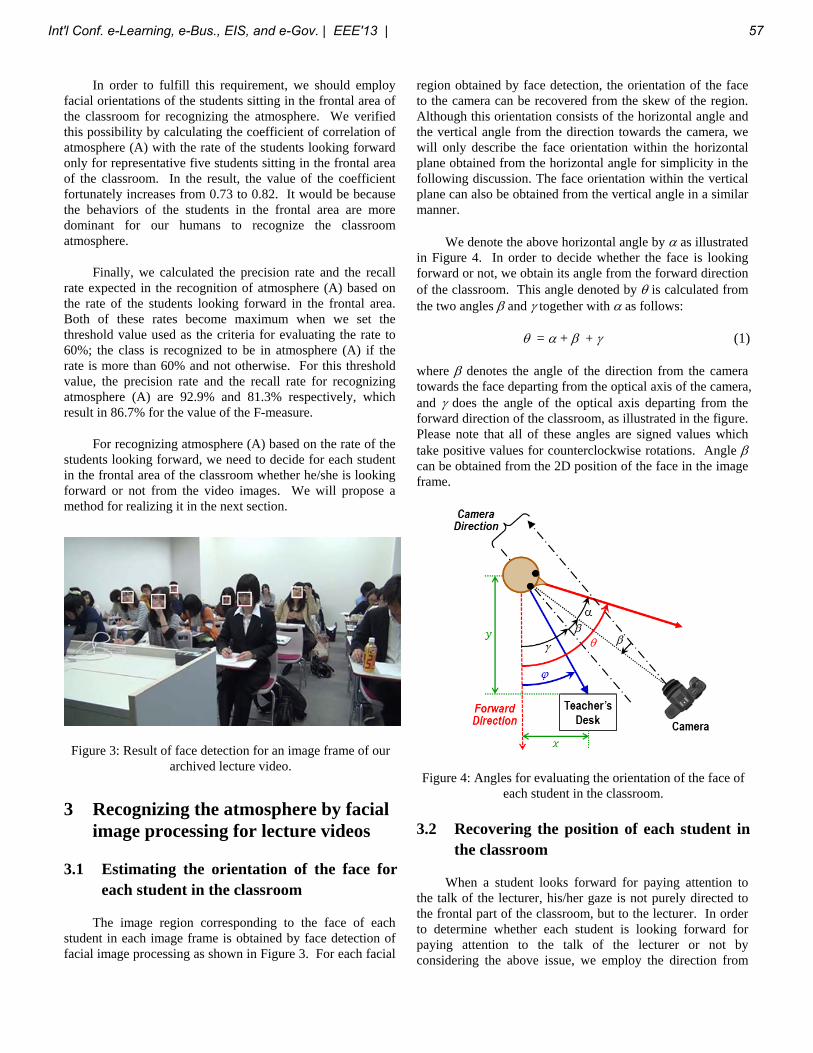
In order to fulfill this requirement, we should employ facial orientations of the students sitting in the frontal area of the classroom for recognizing the atmosphere. We verified this possibility by calculating the coefficient of correlation of atmosphere (A) with the rate of the students looking forward only for representative five students sitting in the frontal area of the classroom. In the result, the value of the coefficient fortunately increases from 0.73 to 0.82. It would be because the behaviors of the students in the frontal area are more dominant for our humans to recognize the classroom atmosphere.
Finally, we calculated the precision rate and the recall rate expected in the recognition of atmosphere (A) based on the rate of the students looking forward in the frontal area. Both of these rates become maximum when we set the threshold value used as the criteria for evaluating the rate to 60%; the class is recognized to be in atmosphere (A) if the rate is more than 60% and not otherwise. For this threshold value, the precision rate and the recall rate for recognizing atmosphere (A) are 92.9% and 81.3% respectively, which result in 86.7% for the value of the F-measure.
For recognizing atmosphere (A) based on the rate of the students looking forward, we need to decide for each student in the frontal area of the classroom whether he/she is looking forward or not from the video images. We will propose a method for realizing it in the next section.
Figure 3: Result of face detection for an image frame of our archived lecture video.
3 Recognizing the atmosphere by facial image processing for lecture videos
3.1 Estimating the orientation of the face for each student in the classroom
The image region corresponding to the face of each student in each image frame is obtained by face detection of facial image processing as shown in Figure 3. For each facial
region obtained by face detection, the orientation of the face to the camera can be recovered from the skew of the region. Although this orientation consists of the horizontal angle and the vertical angle from the direction towards the camera, we will only describe the face orientation within the horizontal plane obtained from the horizontal angle for simplicity in the following discussion. The face orientation within the vertical plane can also be obtained from the vertical angle in a similar manner.
We denote the above horizontal angle by as illustrated in Figure 4. In order to decide whether the face is looking forward or not, we obtain its angle from the forward direction of the classroom. This angle denoted by is calculated from the two angles and together with as follows:
= + + (1)
where denotes the angle of the direction from the camera towards the face departing from the optical axis of the camera, and does the angle of the optical axis departing from the forward direction of the classroom, as illustrated in the figure. Please note that all of these angles are signed values which take positive values for counterclockwise rotations. Angle can be obtained from the 2D position of the face in the image frame.
Figure 4: Angles for evaluating the orientation of the face of each student in the classroom.
3.2 Recovering the position of each student in the classroom
When a student looks forward for paying attention to the talk of the lecturer, his/her gaze is not purely directed to the frontal part of the classroom, but to the lecturer. In order to determine whether each student is looking forward for paying attention to the talk of the lecturer or not by considering the above issue, we employ the direction from
Int'l Conf. e-Learning, e-Bus., EIS, and e-Gov. | EEE'13 | 57
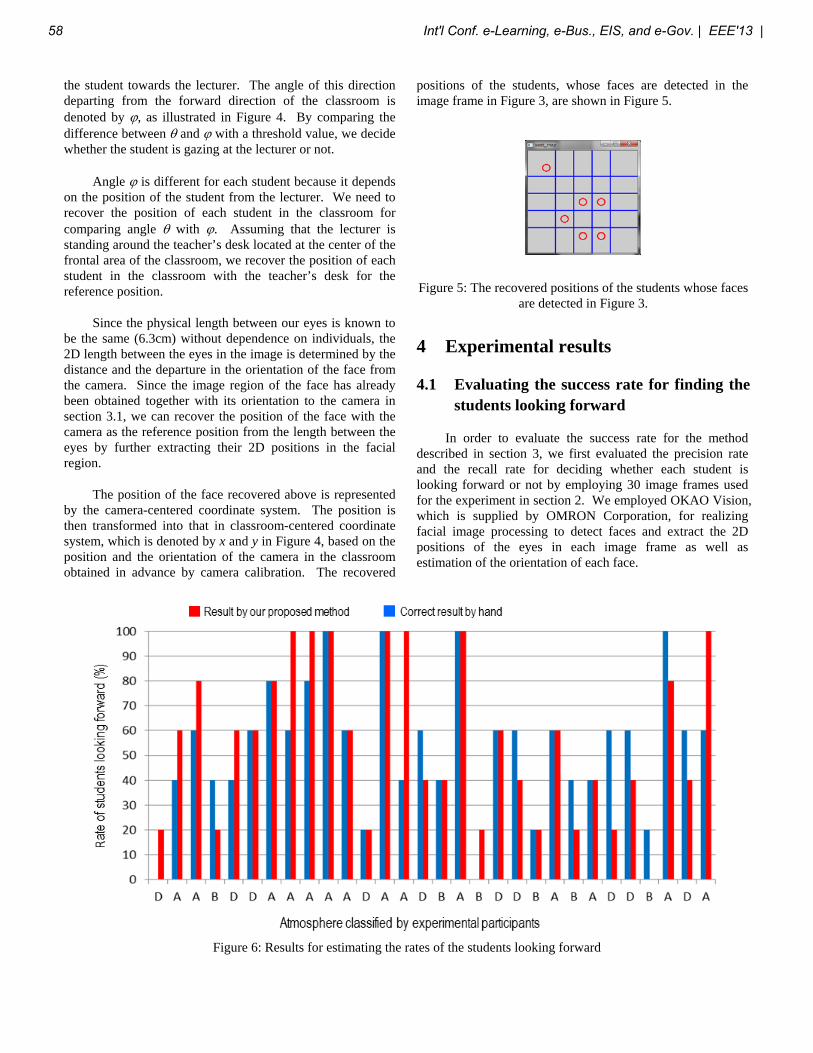
the student towards the lecturer. The angle of this direction departing from the forward direction of the classroom is denoted by , as illustrated in Figure 4. By comparing the difference between and with a threshold value, we decide whether the student is gazing at the lecturer or not.
Angle is different for each student because it depends on the position of the student from the lecturer. We need to recover the position of each student in the classroom for comparing angle with . Assuming that the lecturer is standing around the teacher’s desk located at the center of the frontal area of the classroom, we recover the position of each student in the classroom with the teacher’s desk for the reference position.
Since the physical length between our eyes is known to be the same (6.3cm) without dependence on individuals, the 2D length between the eyes in the image is determined by the distance and the departure in the orientation of the face from the camera. Since the image region of the face has already been obtained together with its orientation to the camera in section 3.1, we can recover the position of the face with the camera as the reference position from the length between the eyes by further extracting their 2D positions in the facial region.
The position of the face recovered above is represented by the camera-centered coordinate system. The position is then transformed into that in classroom-centered coordinate system, which is denoted by x and y in Figure 4, based on the position and the orientation of the camera in the classroom obtained in advance by camera calibration. The recovered
positions of the students, whose faces are detected in the image frame in Figure 3, are shown in Figure 5.
Figure 5: The recovered positions of the students whose faces are detected in Figure 3.
4 Experimental results
4.1 Evaluating the success rate for finding the students looking forward
In order to evaluate the success rate for the method described in section 3, we first evaluated the precision rate and the recall rate for deciding whether each student is looking forward or not by employing 30 image frames used for the experiment in section 2. We employed OKAO Vision, which is supplied by OMRON Corporation, for realizing facial image processing to detect faces and extract the 2D positions of the eyes in each image frame as well as estimation of the orientation of each face.
Figure 6: Results for estimating the rates of the students looking forward
58 Int'l Conf. e-Learning, e-Bus., EIS, and e-Gov. | EEE'13 |
Figure 6 shows the comparison between the results for estimating the rate of the students looking forward by our proposed method and by hand. In this comparison, the rates of precision and recall were 84.0% and 81.0% respectively, which attain 82.4% for the value of the F-measure.
4.2 Evaluating the success rate for recognizing the atmosphere
From the results in section 2.3 and 4.1, the F-measure for recognizing the classroom atmosphere with good attention to the talk of the lecture based on the rate of the students looking forward as the visual clue by deciding whether each student is looking forward or not using the method described in section 3 is expected to be 86.7%×82.4% = 71.4%. For verifying this expectation, we directly evaluate the result for recognition of the atmosphere from the archived lecture video by comparing it with the correct atmosphere classified by the experimental participants in the experiment in section 2.
The actual value of the F-measure obtained as the result of this evaluation was 68.8%, which is almost the same as the expected value above. It implies that the error in recognizing the atmosphere from the rate of the students looking forward and that in deciding whether each student is looking forward or not from the archived lecture video images occur almost independently without negative effect on each other. The above evaluation result can be seen as an average level among the success rates for recognizing various kinds of situations of lectures in previous works, which range from 50 to 90%, depending on the difficulty to recognize the aimed situation.
5 Conclusions
In this article, we discussed the possibility for recognizing classroom atmosphere created by a group of students from observable behaviors of the students. Among various kinds of atmosphere possible to occur during the lectures, we focused on the atmosphere where the lecturers could feel that the students are paying attention to their talks. As the process for attaining our research goal, we first clarified that the rate of the students looking forward is useful as a visual clue for recognizing the atmosphere from our analysis using an archived video of a real seminar of a university. Based on this result, we further proposed a method for estimating the rate of the students looking forward by deciding whether each student is looking forward or not using facial image processing for archived lecture videos. This method attains the success rate with an average level among the previous work on recognizing various kinds of situations of lectures.
Since our work described in this article is still at the early stage for recognizing various kinds of atmospheres of a
group of students during the lecture, there are many things to do as our future steps. First of all, we need to verify the result in section 2 and 4 by employing more archived videos of more various kinds of lectures.
We also plan to apply our method for recognizing other kinds of atmospheres, especially the atmosphere where the students are paying attention to the note they are taking as another future step. From the experimental result in section 2, the atmosphere with students’ attention to the notes seems to have correlation with the rate of the students looking downward, and our method for deciding whether the students are looking forward or not can also be applied for finding those who are looking downward, because both of those students can be found based on the orientations of their faces, which have already been estimated in our method. Thus, it would be comparatively easy to realize recognition of that atmosphere.
References
[1] M.Minoh, S.Nishiguchi: “Environmental Media - In the case of Lecture Archiving System - ,” Knowkedge-Based Intelligent Information and Engineering Systems, PP.1070-1076 (2003).
[2] M.Murakami, S.Nishiguchi, Y.Kameda, M.Minoh: “Effect on Lecturer and Students by Multimedia Lecture Archive System,” International Conference on Information Technology Based Higher Education and Traininig (ITHET), pp.377-380 (2003).
[3] M.Maharaj, A.de Lange: “The Impact of Podcasting on Student Lecture Attendance,” IST-Africa Conference Proceedings (2010).
[4] T.Tuna, J.Subhlok, S.Shar: “Indexing and Keyword Search to Ease Navigation in Lecture Videos,” Applied Imagery Pattern Recognition Workshop (AIPR) (2011).
[5] H-P.Chou, J-M.Wang, C-S.Fuh, S-C.Lin, S-W.Chen: “Automated Lecture Recording System,” (2010).
[6] B.Wulff, R.Rolf: “OpenTrack – Automated Camera Control for Lecture Recording, ” IEEE International Symposium on Multimedia (ISM), pp.549-552 (2011).
[7] S.Tsuruoka, T.Yamaguchi, K.Kato, T. Yoshikawa, T.Shinogi: “A Camera Control Based Fuzzy Behaviour Recognition of Lecturer for Distance Lecture,” IEEE International Conference on Fuzzy Systems, pp.940-943 (2001).
[8] T.Sakiyama, N.Ohno, M.Mukunoki, K.Ikeda:“Video stream selection according to lecture content in remote
Int'l Conf. e-Learning, e-Bus., EIS, and e-Gov. | EEE'13 | 59

lectures,” Systems and Computers in Japan, 34(3), pp. 64-75 (2003).
[9] F.Wang, C-W.Ngo, T-C.Pong: “Gesture Traking and Recognition for Lecture Video Editing,” International Conference on Pattern Recognition (ICPR), pp.934-937 (2004).
[10] A.Shimada, A.Suganuma, R.Taniguchi: “Automatic Camera Control System for a Distant Lecture based on Estimation of Teacher's Behavior,” IASTED International Conference on Computers and Advanced Technology in Education, pp.106-111 (2004).
[11] M.Onishi, K.Fukunaga: “Shooting the Lecture Scene Using Computer-controlled Cameras Based on Situation Understanding and Evaluation of Video Images,” International Conference on Pattern Recognition (ICPR), pp. 781-784 (2004).
[12] M.Onishi, M.Murakami, K.Fukunaga: “Intelligent autofilming of lectures based on interpretation of the scene environment and evaluating video footage,” Systems and Computers in Japan, 37(11), pp.88-99 (2006).
[13] M.Onishi, M.Izumi, K.Fukunaga: “Blackboard Segmentation Using Video Image of Lecture and Its Applications,” International Conference on Pattern Recognition (ICPR), pp.4615-4618 (2000).
[14] T.Sakiyama, M.Mukunoki, K.Ikeda: “Detection of the Indicated Area with an Indication Stick,” International Conference on Multimodal Interface (ICMI), pp.480-487 (2000).
[15] S.Nishiguchi, Y.Kameda, K.Kakusho, M.Minoh, “Automatic video recording of lecture considering variety of motion and equability of scale for observing students,” Journal of Advanced Computational Intelligence and Intelligent Informatics, 8(2), pp.180-188 (2004).
[16] M.Minoh, S.Nishiguchi, H.Higashi: “Recognition of dynamic situations in the classroom using multi-modal sensor information,” Information Processing and Management of Uncertainty in Knowledge-based Systems (IPMU), pp.1757-1762 (2002).
[17] M.Murakami, K.Kakusho, M.Minoh: “Analysis of Students' Eye Movement in Relation to Contents of Multimedia Lecture,” World Conference on E-Learning in Corporate, Government, Healthcare and Higher Education (E-Learn), pp.1965-1968 (2002).
60 Int'l Conf. e-Learning, e-Bus., EIS, and e-Gov. | EEE'13 |
Teaching Teams and Project Management in a Virtual
Environment
C. Balch
Department of Business & Administration Northern Arizona University, Yuma, Arizona, USA
Abstract - My signature class is a junior level Teams and
Project Management learning experience. An important part
of this class is crafting learning outcomes to address changing
stakeholder needs, incorporating constantly changing tools
for virtual team interaction and project management, and
measuring outcomes. This paper provides a snapshot of the
current evolution of this class as taught within the ACBSP
accredited Northern Arizona University Business and
Administration program. Paper content includes best
practices in virtual team building; review of current
technology to facilitate virtual teams; overcoming BlackBoard
Learn limitations; and useful third-party associations.
Synthesis of technologies is demonstrated and time-saving
macros are described.
Keywords: Virtual Teams, Team Building, Project
Management
1 Introduction
With a nod to Six Sigma, TQM, MBO, etc., instructions
to and activities for team participants are constantly evolving.
An important part of the class is for students to actively
critique their learning process during and after [1] The
following is an adaption of a snapshot of an evolving scaffold
students use as a framework as we cover each area in detail
[2].
2 Best Virtual Team Practices
The following should be accomplished by all team members
and receive special focus from team leader and project
manager.
2.1 Define and contact your team
Teams may be assigned or self-forming.
Insure that you have current contact information
for all team members.
Confirm that everyone is aware they are a
member of the team.
2.2 Define the goal
Insure the team is focused on the same and
correct goal.
o If there is anything unclear about the
specification, ask the person who
defined the product for further
specification.
o Identify major stakeholders and
consider their needs.
o Each team member should state that
they understand and agree upon the
goal.
If packaging of the results is unclear, confirm your
understanding of what the deliverable should
look like with the recipient.
2.3 Define communication tools, method(s), and
protocols
Reach a consensus choice of communication tools and
procedures. Insure that all team members agree to use the
consensus tools and procedures.
Tools Choice of tools depends on member
resources including preferences and willingness
to learn new communication tools.
o Teams are likely to need both
communication and file sharing tools.
o It is often desirable to use multiple
tools in each category.
o The ideal tools for a task are not useful
if team members cannot or will not use
them. Thus, search for tools that all
team members will use.
Methods There are two major categories of
communication. Most teams will use a
combination of these.
Int'l Conf. e-Learning, e-Bus., EIS, and e-Gov. | EEE'13 | 61
o Synchronous communication occurs
when all team members may interact at
the same time. Phone calls and video
conferencing are examples of tools for
synchronous communication.
Synchronous communication is
particularly effective for rapid decisions
but it requires that the team agree and
follow up on a meeting time and
method. Unless someone takes notes,
typically there is little or no record of
synchronous communication.
o Asynchronous communication occurs
when team members communicate at
different intervals. Email and Bulletin
Boards are examples of tools for
asynchronous communication.
Asynchronous communication is
particularly effective when team
members have difficulty finding
common times to meet. Typically
asynchronous communication is
automatically recorded for later review.
Protocols are agreed upon team
communication rules. Protocols include:
o Agreed upon meeting times and tools
for synchronous
communication. Robert's Rules of
Order [3] are a great way to organize a
synchronous meeting. At the very least,
a meeting should have and follow an
agenda similar to agendas defined in
Robert's Rules. Distribute the agenda
with enough time for team comments
before the meeting. Keep the
discussion focused on the issue at hand
(motion) and the agenda. There should
be a review of assigned tasks at the end
of the meeting.
o Agreed upon tools and frequency of
checking asynchronous communication.
Asynchronous communication usually
involves discussion threads where a
topic is introduced and commented
upon. For clarity, if you wish to start a
new discussion topic, start a new
thread.
2.4 Define, assign, and set deadlines for tasks. Confirm.
1. Define and assign operational tasks with
outcomes to get from where the team is to the
desired goal.
a. Identify tasks that must be completed
before tasks may begin and which tasks
may be simultaneous.
b. The detail of task description varies.
Routine tasks are often grouped. Novel
tasks may require a detailed breakout.
2. Assign team members to each task. Double
check that every task has an associated team
member.
3. Set Deadlines for every task. Pay special
attention to when the team goal must be
reached and tasks that must be accomplished
before others may begin.
4. Confirm that all team members agree to and
are willing and able to do their assigned tasks.
2.5 Monitor progress
Check on team member progress at regular
intervals.
Agree on a common area where team members
can post their progress, discuss obstacles, and
report completed tasks.
2.6 Third Party Associations
In addition to stakeholder focus groups in which our content
is reviewed by members of the business community,
professional world companies have associations with the
class. Many of these companies are probably not aware that
our students use their products (see "Selected Resources for
Virtual Teams" Balch, 2013c). Here are some notably useful
alliances that require partnerships:
62 Int'l Conf. e-Learning, e-Bus., EIS, and e-Gov. | EEE'13 |
Google Apps are essential to the success of this
class. The combination of these applications
provides strong team coordination and the
ability to work on documents without change
tracking concerns. Google+, Google Drive, and
Google Voice are the most useful apps.
Northern Arizona University subscribes to the
free Google Apps for Education program.
LinkedIn provides a professional networking area
that allows our students and alumni to
communicate in a moderated group. LinkedIn
also allows us to track student success. Some
recent events in our LinkedIn area are notable:
o An alumni contacted me through the
area to announce that he was now in a
position of authority and would like an
intern from our program.
o In a recent Teams and Project
management class assignment where
students were strongly urged (but not
required) to create a free LinkedIn
account, three students received job
offers within a day after creation of
their profile.
We are fortunate to have an alliance with
Microsoft DreamSpark [4] where students
receive a variety of Microsoft Applications at no
cost. As a class requirement, students must
install and use Microsoft Project. Use of
Microsoft Visio is strongly encouraged.
3 Best Practices
Students complete six projects where they must create a web
based presentation. All topics have a business focus. The first
four projects have randomly assigned teams of about eight
members. For the first four projects, I attempt to form teams
composed of members who have not worked together before
in the class. The last two projects follow a hiring hall format
where leaders declare themselves, ask for team recruits, then
leaders choose who they accept.
Parallel to the projects are discussions focused on various
aspects of team building and project management. Discussion
topics enhance class and departmental objectives. Common
student comments include something like, "I recall covering
this topic but we never really discussed it."
Upon completion of projects, students peer review their team
members including themselves using a rubric (Balch, 2013d)
based Google Form. Students also score and comment on all
the projects using a rubric based (Balch, 2013e) . Reviews
include a rubric based score and a comment area. Student
feedback includes all the comments they made and all the
scores and comments made about them for each project.
Lessons learned in Google Forms is to require students to
login using their User Id which is automatically required and
to require students to select the entity they are reviewing from
a drop down list. Failure to force clear data selections creates
a data set that needs much review and editing before it is
usable.
Even with somewhat clean data, much automation is needed
to provide complete feedback. I developed macros to remove
duplicate entries and to group responses and package the
results into email and web pages.
Students receive individual email after each project including
their current class standing and peer comments and scores
from the most recent project. Individual responses are shown
without reference to the team member who made the
comment.
4 References
[1] Antony, J. (2012) "A SWOT analysis on Six Sigma: some perspectives from leading academics and practitioners", International Journal of Productivity and Performance Management, Vol. 61 Iss: 6, pp.691 - 698
[2] Balch, C. 2013a. Building Virtual Teams. nau.edu. Retrieved March 2013 from http://oak.ucc.nau.edu/cvb23/handout/BuildngVirtualTeams.asp
[3] Roberts Rules of Order. Retrieved February 2013 from http://www.robertsrules.org/rulesintro.htm.
[4] DreamSpark. DreamSpark.com. Retrieved March 2013 from https://www.dreamspark.com/
[5] Balch, C. 2013c. Selected Resources for Virtual Teams. nau.edu. Retrieved March 2013 from http://oak.ucc.nau.edu/cvb23/hdoc/PresentationResources.htm
Balch, C. 2013b. On-line Scholarly Research. nau.edu. Retrieved March 2013 from http://oak.ucc.nau.edu/cvb23/handout/onlineresearch.asp
Balch, C. 2013d. Presentation Rubric. nau.edu. Retrieved March 2013 from http://oak.ucc.nau.edu/cvb23/hdoc/PresentationRubric.htm
Balch, C. 2013e. Peer Review Rubric. nau.edu. Retrieved March 2013 from http://oak.ucc.nau.edu/cvb23/hdoc/TeamMemberRubric.htm
Int'l Conf. e-Learning, e-Bus., EIS, and e-Gov. | EEE'13 | 63
Goldman, H. (2005) "The origins and development of quality initiatives in American business", The TQM Magazine, Vol. 17 Iss: 3, pp.217 - 225
Google Apps. Google.com. Retrieved March 2013 from http://www.google.com/apps/index1.html
LinkedIn. LinkedIn.com. Retrieved March 2013 from https://www.linkedin.com/
5 Appendix 1) Selected Technology to
Facilitate Virtual Teams as of March
2013 [5]
The following sites represent the areas I currently find most
useful in facilitating teams. This list is constantly evolving
and my current preferred applications are found at:
http://oak.ucc.nau.edu/cvb23/hdoc/PresentationResources.htm
5.1 Cloud Resource Collections
5.1.1 TechSupportAlert
(http://www.techsupportalert.com/content/best-free-online-
applications-and-services.htm) Best Free Online Resources
Yes
File Sharing / Synch on multiple computers
5.1.2 Box.net
(http://box.net) File sharing website. Allows you to upload
very large files and provide a link that allows others to
download them.
5.1.3 Dropbox
(http://db.tt/lqetUPA) Synchronize files on multiple
computers. Creates a folder that is automatically synchronized
with as many computers as you like. Simply add or update a
file and the contents are update on all the other computers.
Allows you to revert to earlier file versions. Sub folders can
be shared with teams. PS: Use this link to install and we'll
both get extra free storage.
5.1.4 Google Drive
(http://drive.google.com) Synchronize files on multiple
computers. Creates a folder that is automatically synchronized
with as many computers as you like. Simply add or update a
file and the contents are update on all the other computers.
Allows you to revert to earlier file versions. Sub folders can
be shared with teams.
5.2 Gantt Charts
5.2.1 Clocking IT
(http://www.clockingit.com/) An online Gantt system with
included communication tools. Note that this program outside
the NAU domain and be cautious with your identity.
5.2.2 ViewPath
(http://viewpath.com) An online Gantt system with included
communication tools. Note that this program outside the NAU
domain and be cautious with your identity.
5.2.3 Gantter
(http://gantter.com/) An online Gantt system.
5.2.4 Gantt Chart
(http://www.youtube.com/watch?v=dp6J6Bw92d4) How to
put a Gantt chart into a Google Doc. Note that this does not
work with Google Chrome.
5.3 Meeting Scheduler
5.3.1 Doodle
(http://www.doodle.com/) Find times where everyone can
meet.
5.3.2 NeedtoMeet
(http://needtomeet.com/) Simple way to finds that folks can
meet.
5.3.3 ScheduleOnce
(http://www.scheduleonce.com/) Find times where everyone
can meet. Works with Google calendar.
5.4 Development Tools
5.4.1 Audacity
(http://audacity.sourceforge.net/) Record, edit, mix, cut, etc
Audio.
AuthorStream
(http://authorstream.com) Convert PowerPoint to video
automatically.
5.4.2 Bitstrips
(http://www.bitstripsforschools.com/) Create online comics -
30 day free trial.
5.4.3 CamStudio
(http://camstudio.org/) CamStudio is a free video screen and
audio capturing program. You might consider recording a
PowerPoint on your computer as you talk your way through a
presentation then polishing with Movie Maker.
5.4.4 DrupalGardens
(http://www.drupalgardens.com/) Create presentations online
- also hosts.
5.4.5 Free Screen Cast
(http://freescreencast.com/) This screen capture program does
not require that a program be installed on your computer. See
Camtasia for reasons that you might want to do this.
64 Int'l Conf. e-Learning, e-Bus., EIS, and e-Gov. | EEE'13 |
Jing Screen Capture
(http://www.techsmith.com/jing/) Another screen capture
program that does not require program instillation. See
Camtasia for reasons you might want to do this.
5.4.6 Know Case
(http://knowcase.com/) Brainstorming tool
5.4.7 Mind42
(http://www.mind42.com/) Collaborative Mind Mapping
5.4.8 Movie Maker
(http://www.microsoft.com/windowsxp/using/moviemaker/de
fault.mspx) I suggest Movie Maker for creating and editing
videos. There are many tutorials available on the web but this
is a good start. You might consider having team members
recording part of a presentation then using Movie Maker to
combine and polish the final product. Do use transitions and
titles, be careful with special effects.
Movie Maker download for Version 7
(http://explore.live.com/windows-live-essentials?os=win7)
This link shows how to get Movie Maker for Windows 7.
Earlier versions of Windows have Movie Maker already
installed.
PowerPoint simple slide to movie
(http://www.youtube.com/watch?v=PK4XdJ-ywSs) How to
convert a PowerPoint presentation suitable for upload to
YouTube. Note: Powerpoint 2010 offers a variety of tools to
convert content for the web. Another option for conversion is
to do a screen capture.
5.4.9 Prezi
(http://prezi.com) Create and share presentations online -
also hosts. Note: You could use one of the screen capture
tools to make your Prezi presentation into a movie.
5.5 Webs.com
(http://webs.com) Create and share presentations online -
also hosts.
5.5.1 Weebly
(http://weebly.com) Create and share presentations online -
also hosts.
5.5.2 Wix
(http://wix.com) Create presentations online - also hosts.
5.6 Places to host your presentation
5.6.1 You Tube
(http://YouTube.com) You tube makes it very easy to share a
video.
Request NAU Server Space
(https://www4.nau.edu/its/webacct/index.aspx) NAU provides
substantial space on their servers and they will increase your
storage for class projects. You may upload your web
resources here including pages and video.
5.6.2 Google Sites
(http://sites.google.com) Google provides free web space for
projects.
5.6.3 SoundCloud.com
(http://soundcloud.com) Website to host sound
5.6.4 Vocaroo.com
(http://Vocaroo.com) Website to host sound
5.6.5 Wix
(http://wix.com) Create presentations online - also hosts.
5.6.6 Webs.com
(http://webs.com) Create presentations online - also hosts.
5.6.7 Collaboration Tools
5.6.8 Asana
(http://asana.com) Cloud based shared task list
5.6.9 AskClass
(http://askclass.net ) Internet voting tool
5.6.10 Doodle
(http://doodle.com) Group scheduling tool.
5.6.11 Elluminate
(http://elluminate.nau.edu) Collaborate is NAU's adopted
conferncing system of choice. To use Elluminate in our class,
follow the link and search for "Balch" then have your team
login at the same time to your prepared team area. The
passwords are BBA360. Be sure to try the various tools
including WebCams, application sharing, webpage sharing,
and the whiteboard. Try a review of your recording. Here is a
link to Elluminate Help.
5.6.12 Free conference calls
(http://freeconferancecall.com) Free Conference Calls
5.6.13 Google Docs
(http://mail.nau.edu) NAU Google Docs
Google+
(https://plus.google.com/up/start/?et=ad&type=st) Sort of a
combination of Skype and Facebook. Allows for multiple
video feeds. "Start a Hangout" for a "Circle."
5.6.14 GotoMeeting
(http://gotomeeting.com) Another conferencing system.
Int'l Conf. e-Learning, e-Bus., EIS, and e-Gov. | EEE'13 | 65

5.6.15 Join.Me
(http://join.me) Share your screen with multiple viewers.
5.6.16 Second Life
(http://secondlife.com) A virtual reality.
5.6.17 Skype
(http://skype.com) Skype is a free application that allows you
to have audio conferences, face-to-face video, and screen
sharing. You can find me on Skype with my "NAUCharlie"
handle. Yes
5.6.18 Zoho
(http://zoho.com) Document collaboration Yes
66 Int'l Conf. e-Learning, e-Bus., EIS, and e-Gov. | EEE'13 |
New Challenges in Teaching e-Forensics Online
Professor Eamon P. Doherty, CCE, CPP, SSCP
School of Administrative Science, Fairleigh Dickinson University, Teaneck, USA
Abstract - This paper discusses how the topic of forensic
imaging has changed because of the introduction of a new
technology known as the solid state drive (SSD). The
differences between the SSD and the magnetic disk hard drive
are also discussed. This paper highlights the importance of
online education for teaching e-forensics, how it is delivered,
and why it is important for educating certain populations who
cannot get to a traditional classrom. Lastly, this paper also
discusses the need for a conference among many stakeholders
to create a publically known standard, perhaps an ISO
standard, for the SSD and why it would help for court cases
involving the imaging and investigation of SSDs.
Keywords: Computer Forensics, Cyber Forensics, Computer
Security
1 Introduction
Teaching computer forensics online is very important since
many policeman and National Guardsmen often have
unpredictable work schedules and cannot attend and in person
classes [1]. Online learning is also the only option for those
students who want to study a very specialized topic such as e-
forensics when they are deployed with the military and cannot
travel freely. Creating a forensic image or a clone of a hard
drive is considered by some authorities to be the most
important task in computer forensics. The forensic image is a
byte for byte copy of a suspect’s hard drive. It includes both
the used and unused space. A backup is only a subset of a
forensic image because a backup only includes the files with
data and not the unallocated space or “empty space” where
remnants of evidence can be. Forensic examiners need to look
at both allocated and unallocated space for exculpatory
evidence to find someone innocent, not just guilty. If an
examiner only has a backup, a defense attorney might create
some doubt that some exculpatory evidence, finding his or her
client innocent, resides in unallocated space. This is one
concept that is important for new students of e-forensics to
learn. There should also be an identical SHA-1 or MD5 hash
of the forensic image and the suspect’s hard drive or storage
device which verifies that the image is a perfect clone of the
suspect’s drive. All experiments to produce evidence on the
cloned image drive should also work on the suspect’s drive. It
should become obvious how important the forensic image has
become in digital forensics. It is also common knowledge
among people that hold a CCE (Certified Computer
Examination) that some digital forensic examiners can have a
career working for private investigators and lawyers while
only specializing in the forensic imaging of hard drives.
Therefore the forensic imaging of hard drives is a subject of
great importance to anyone who teaches e-forensics. Two
popular digital forensic tools that can be used to create a
forensic image of a disk and provide a hash function for
verification purposes are SMART from ASR Data Acquisition
& Analysis and Winhex from X-Ways Software Technology
AG [2].
This paper will discuss how one university has used online
learning to teach the forensic imaging of hard drives in its
computer forensics classes. In the last two decades the hard
drives that have been encountered have been those with
magnetic platters and read write heads. The methodology of
forensically imaging these types of drives has been well
established and has been accepted in many court cases. When
an investigative technique and set of tools have been accepted
by the legal community, the academic community, and
practitioners, it is said to have passed the Frye Test.
The challenge to the established methodology of the
forensically imaging of hard drives is the introduction of a
new technology known as the solid state drive (SSD). These
hard drives may have over twenty computer chips on their
circuit board instead of platters with read write heads. Many
of these drives also have proprietary algorithms and
technology so that it is not possible to know where the data
lies on the drive. The drive size or storage capacity is not
constant and dynamically changes as blocks are labeled bad
and no longer used by the operating system. There is also a
garbage collection program that runs when the solid state drive
is powered. This means that part of the drive may be deleting
evidence while the computer forensic technician is
simultaneously collecting evidence on another part of the hard
drive. The challenge is further complicated by the various
manufacturers of solid state drives who each have their own
methods of storing and deleting data on the solid state drive.
This means that computer forensic educators need to invite
computer forensic practitioners, SSD manufacturers, and
attorneys to create a national or international conference to
discuss the framework of how to forensically image the solid
state drive and have the image be accepted for use in a court
case. If a set of tools and methodologies for imaging a solid
state drive could be developed and accepted by the academic,
legal, and practitioner communities, this would be a big
breakthrough for computer forensics. It would also mean that
computer forensic examiners would have a set of tools and
Int'l Conf. e-Learning, e-Bus., EIS, and e-Gov. | EEE'13 | 67
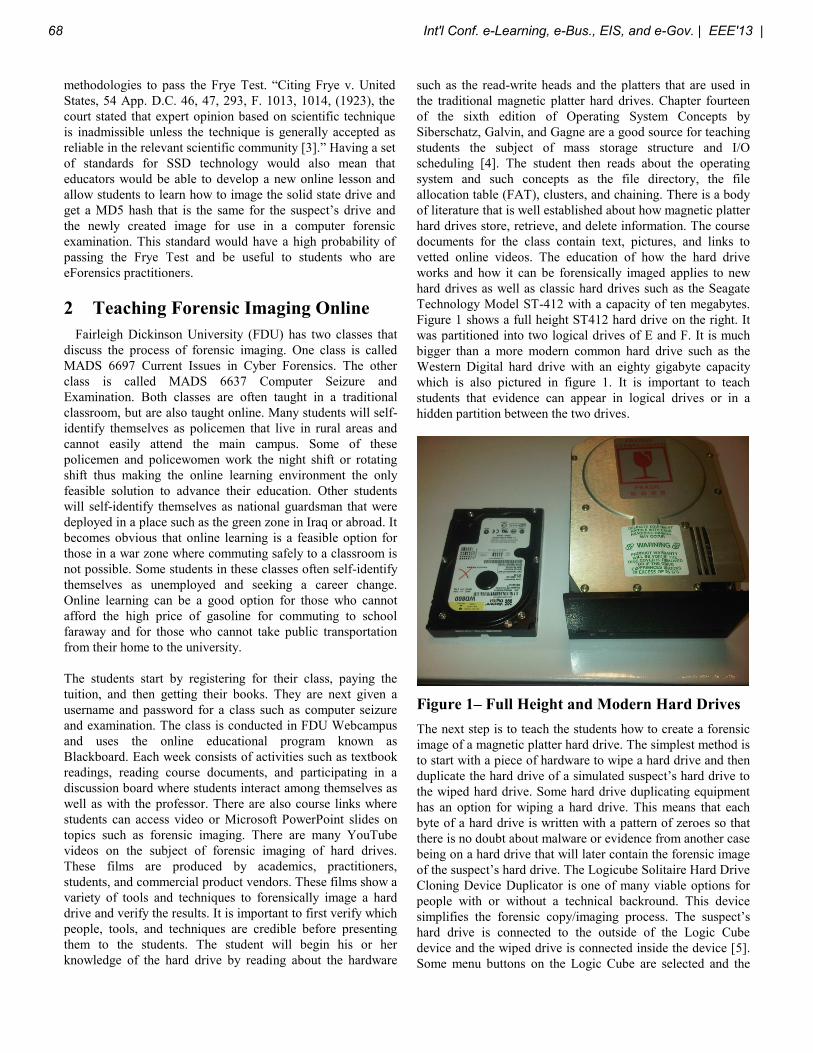
methodologies to pass the Frye Test. “Citing Frye v. United
States, 54 App. D.C. 46, 47, 293, F. 1013, 1014, (1923), the
court stated that expert opinion based on scientific technique
is inadmissible unless the technique is generally accepted as
reliable in the relevant scientific community [3].” Having a set
of standards for SSD technology would also mean that
educators would be able to develop a new online lesson and
allow students to learn how to image the solid state drive and
get a MD5 hash that is the same for the suspect’s drive and
the newly created image for use in a computer forensic
examination. This standard would have a high probability of
passing the Frye Test and be useful to students who are
eForensics practitioners.
2 Teaching Forensic Imaging Online
Fairleigh Dickinson University (FDU) has two classes that
discuss the process of forensic imaging. One class is called
MADS 6697 Current Issues in Cyber Forensics. The other
class is called MADS 6637 Computer Seizure and
Examination. Both classes are often taught in a traditional
classroom, but are also taught online. Many students will self-
identify themselves as policemen that live in rural areas and
cannot easily attend the main campus. Some of these
policemen and policewomen work the night shift or rotating
shift thus making the online learning environment the only
feasible solution to advance their education. Other students
will self-identify themselves as national guardsman that were
deployed in a place such as the green zone in Iraq or abroad. It
becomes obvious that online learning is a feasible option for
those in a war zone where commuting safely to a classroom is
not possible. Some students in these classes often self-identify
themselves as unemployed and seeking a career change.
Online learning can be a good option for those who cannot
afford the high price of gasoline for commuting to school
faraway and for those who cannot take public transportation
from their home to the university.
The students start by registering for their class, paying the
tuition, and then getting their books. They are next given a
username and password for a class such as computer seizure
and examination. The class is conducted in FDU Webcampus
and uses the online educational program known as
Blackboard. Each week consists of activities such as textbook
readings, reading course documents, and participating in a
discussion board where students interact among themselves as
well as with the professor. There are also course links where
students can access video or Microsoft PowerPoint slides on
topics such as forensic imaging. There are many YouTube
videos on the subject of forensic imaging of hard drives.
These films are produced by academics, practitioners,
students, and commercial product vendors. These films show a
variety of tools and techniques to forensically image a hard
drive and verify the results. It is important to first verify which
people, tools, and techniques are credible before presenting
them to the students. The student will begin his or her
knowledge of the hard drive by reading about the hardware
such as the read-write heads and the platters that are used in
the traditional magnetic platter hard drives. Chapter fourteen
of the sixth edition of Operating System Concepts by
Siberschatz, Galvin, and Gagne are a good source for teaching
students the subject of mass storage structure and I/O
scheduling [4]. The student then reads about the operating
system and such concepts as the file directory, the file
allocation table (FAT), clusters, and chaining. There is a body
of literature that is well established about how magnetic platter
hard drives store, retrieve, and delete information. The course
documents for the class contain text, pictures, and links to
vetted online videos. The education of how the hard drive
works and how it can be forensically imaged applies to new
hard drives as well as classic hard drives such as the Seagate
Technology Model ST-412 with a capacity of ten megabytes.
Figure 1 shows a full height ST412 hard drive on the right. It
was partitioned into two logical drives of E and F. It is much
bigger than a more modern common hard drive such as the
Western Digital hard drive with an eighty gigabyte capacity
which is also pictured in figure 1. It is important to teach
students that evidence can appear in logical drives or in a
hidden partition between the two drives.
Figure 1– Full Height and Modern Hard Drives
The next step is to teach the students how to create a forensic
image of a magnetic platter hard drive. The simplest method is
to start with a piece of hardware to wipe a hard drive and then
duplicate the hard drive of a simulated suspect’s hard drive to
the wiped hard drive. Some hard drive duplicating equipment
has an option for wiping a hard drive. This means that each
byte of a hard drive is written with a pattern of zeroes so that
there is no doubt about malware or evidence from another case
being on a hard drive that will later contain the forensic image
of the suspect’s hard drive. The Logicube Solitaire Hard Drive
Cloning Device Duplicator is one of many viable options for
people with or without a technical backround. This device
simplifies the forensic copy/imaging process. The suspect’s
hard drive is connected to the outside of the Logic Cube
device and the wiped drive is connected inside the device [5].
Some menu buttons on the Logic Cube are selected and the
68 Int'l Conf. e-Learning, e-Bus., EIS, and e-Gov. | EEE'13 |
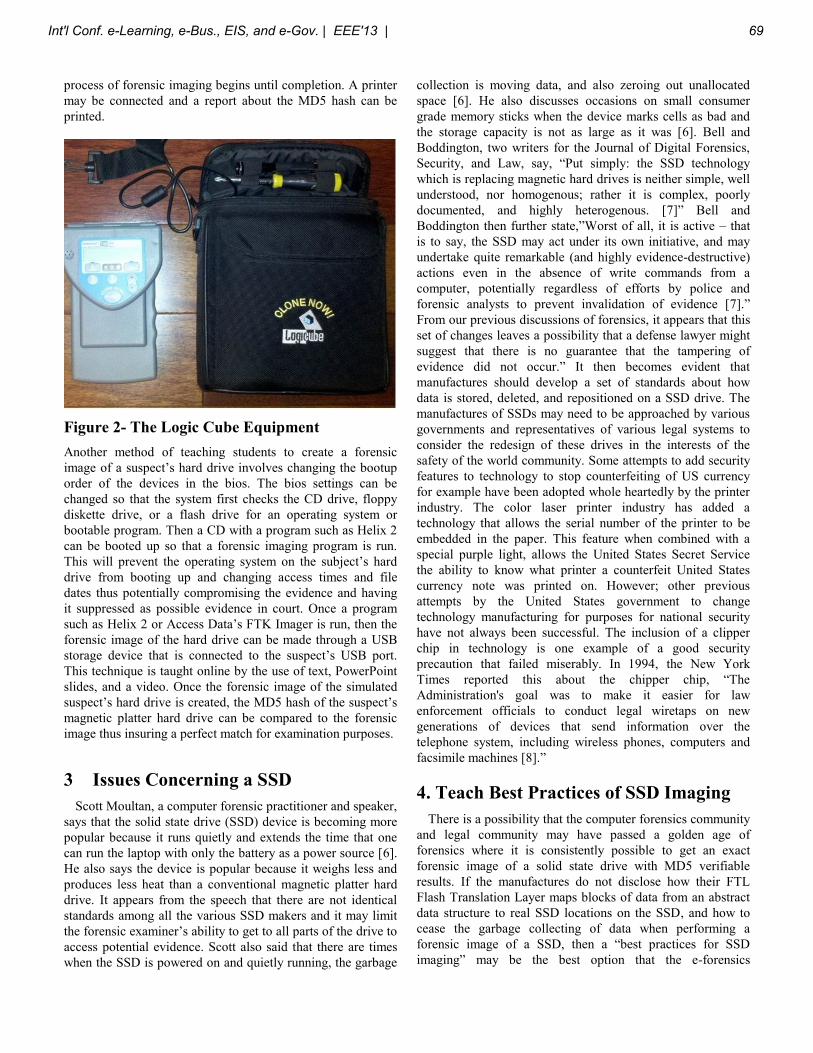
process of forensic imaging begins until completion. A printer
may be connected and a report about the MD5 hash can be
printed.
Figure 2- The Logic Cube Equipment
Another method of teaching students to create a forensic
image of a suspect’s hard drive involves changing the bootup
order of the devices in the bios. The bios settings can be
changed so that the system first checks the CD drive, floppy
diskette drive, or a flash drive for an operating system or
bootable program. Then a CD with a program such as Helix 2
can be booted up so that a forensic imaging program is run.
This will prevent the operating system on the subject’s hard
drive from booting up and changing access times and file
dates thus potentially compromising the evidence and having
it suppressed as possible evidence in court. Once a program
such as Helix 2 or Access Data’s FTK Imager is run, then the
forensic image of the hard drive can be made through a USB
storage device that is connected to the suspect’s USB port.
This technique is taught online by the use of text, PowerPoint
slides, and a video. Once the forensic image of the simulated
suspect’s hard drive is created, the MD5 hash of the suspect’s
magnetic platter hard drive can be compared to the forensic
image thus insuring a perfect match for examination purposes.
3 Issues Concerning a SSD
Scott Moultan, a computer forensic practitioner and speaker,
says that the solid state drive (SSD) device is becoming more
popular because it runs quietly and extends the time that one
can run the laptop with only the battery as a power source [6].
He also says the device is popular because it weighs less and
produces less heat than a conventional magnetic platter hard
drive. It appears from the speech that there are not identical
standards among all the various SSD makers and it may limit
the forensic examiner’s ability to get to all parts of the drive to
access potential evidence. Scott also said that there are times
when the SSD is powered on and quietly running, the garbage
collection is moving data, and also zeroing out unallocated
space [6]. He also discusses occasions on small consumer
grade memory sticks when the device marks cells as bad and
the storage capacity is not as large as it was [6]. Bell and
Boddington, two writers for the Journal of Digital Forensics,
Security, and Law, say, “Put simply: the SSD technology
which is replacing magnetic hard drives is neither simple, well
understood, nor homogenous; rather it is complex, poorly
documented, and highly heterogenous. [7]” Bell and
Boddington then further state,”Worst of all, it is active – that
is to say, the SSD may act under its own initiative, and may
undertake quite remarkable (and highly evidence-destructive)
actions even in the absence of write commands from a
computer, potentially regardless of efforts by police and
forensic analysts to prevent invalidation of evidence [7].”
From our previous discussions of forensics, it appears that this
set of changes leaves a possibility that a defense lawyer might
suggest that there is no guarantee that the tampering of
evidence did not occur.” It then becomes evident that
manufactures should develop a set of standards about how
data is stored, deleted, and repositioned on a SSD drive. The
manufactures of SSDs may need to be approached by various
governments and representatives of various legal systems to
consider the redesign of these drives in the interests of the
safety of the world community. Some attempts to add security
features to technology to stop counterfeiting of US currency
for example have been adopted whole heartedly by the printer
industry. The color laser printer industry has added a
technology that allows the serial number of the printer to be
embedded in the paper. This feature when combined with a
special purple light, allows the United States Secret Service
the ability to know what printer a counterfeit United States
currency note was printed on. However; other previous
attempts by the United States government to change
technology manufacturing for purposes for national security
have not always been successful. The inclusion of a clipper
chip in technology is one example of a good security
precaution that failed miserably. In 1994, the New York
Times reported this about the chipper chip, “The
Administration's goal was to make it easier for law
enforcement officials to conduct legal wiretaps on new
generations of devices that send information over the
telephone system, including wireless phones, computers and
facsimile machines [8].”
4. Teach Best Practices of SSD Imaging
There is a possibility that the computer forensics community
and legal community may have passed a golden age of
forensics where it is consistently possible to get an exact
forensic image of a solid state drive with MD5 verifiable
results. If the manufactures do not disclose how their FTL
Flash Translation Layer maps blocks of data from an abstract
data structure to real SSD locations on the SSD, and how to
cease the garbage collecting of data when performing a
forensic image of a SSD, then a “best practices for SSD
imaging” may be the best option that the e-forensics
Int'l Conf. e-Learning, e-Bus., EIS, and e-Gov. | EEE'13 | 69
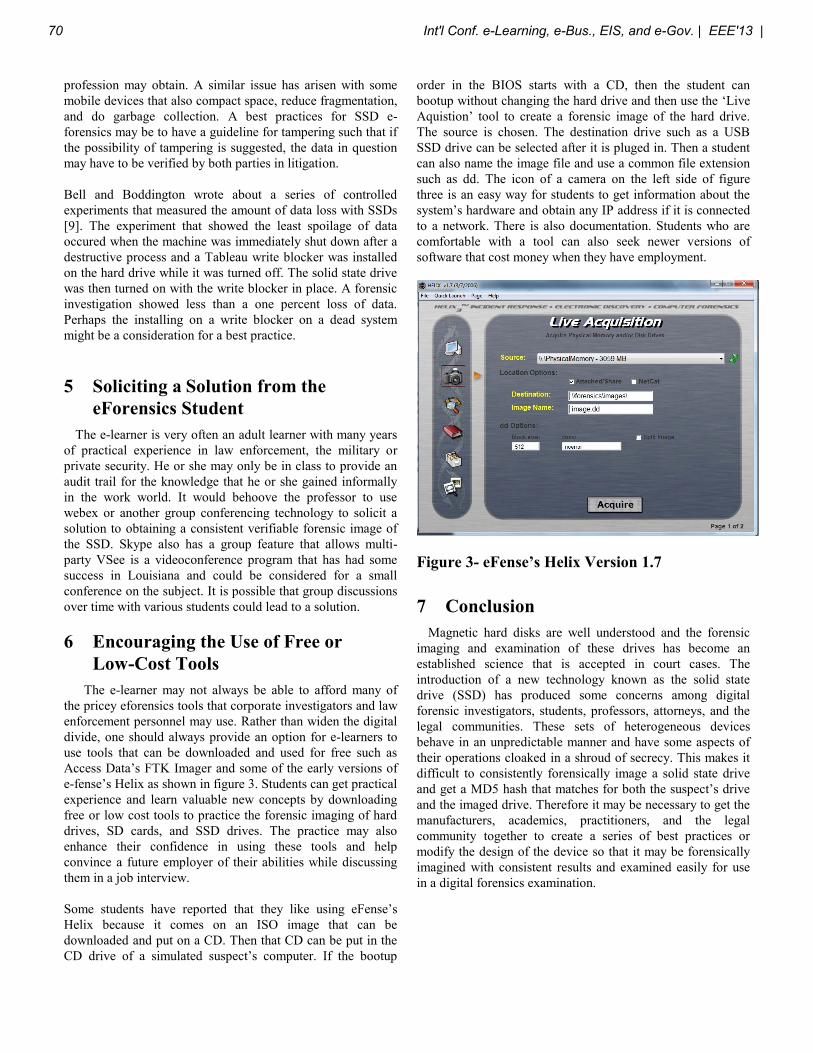
profession may obtain. A similar issue has arisen with some
mobile devices that also compact space, reduce fragmentation,
and do garbage collection. A best practices for SSD e-
forensics may be to have a guideline for tampering such that if
the possibility of tampering is suggested, the data in question
may have to be verified by both parties in litigation.
Bell and Boddington wrote about a series of controlled
experiments that measured the amount of data loss with SSDs
[9]. The experiment that showed the least spoilage of data
occured when the machine was immediately shut down after a
destructive process and a Tableau write blocker was installed
on the hard drive while it was turned off. The solid state drive
was then turned on with the write blocker in place. A forensic
investigation showed less than a one percent loss of data.
Perhaps the installing on a write blocker on a dead system
might be a consideration for a best practice.
5 Soliciting a Solution from the
eForensics Student
The e-learner is very often an adult learner with many years
of practical experience in law enforcement, the military or
private security. He or she may only be in class to provide an
audit trail for the knowledge that he or she gained informally
in the work world. It would behoove the professor to use
webex or another group conferencing technology to solicit a
solution to obtaining a consistent verifiable forensic image of
the SSD. Skype also has a group feature that allows multi-
party VSee is a videoconference program that has had some
success in Louisiana and could be considered for a small
conference on the subject. It is possible that group discussions
over time with various students could lead to a solution.
6 Encouraging the Use of Free or
Low-Cost Tools
The e-learner may not always be able to afford many of
the pricey eforensics tools that corporate investigators and law
enforcement personnel may use. Rather than widen the digital
divide, one should always provide an option for e-learners to
use tools that can be downloaded and used for free such as
Access Data’s FTK Imager and some of the early versions of
e-fense’s Helix as shown in figure 3. Students can get practical
experience and learn valuable new concepts by downloading
free or low cost tools to practice the forensic imaging of hard
drives, SD cards, and SSD drives. The practice may also
enhance their confidence in using these tools and help
convince a future employer of their abilities while discussing
them in a job interview.
Some students have reported that they like using eFense’s
Helix because it comes on an ISO image that can be
downloaded and put on a CD. Then that CD can be put in the
CD drive of a simulated suspect’s computer. If the bootup
order in the BIOS starts with a CD, then the student can
bootup without changing the hard drive and then use the ‘Live
Aquistion’ tool to create a forensic image of the hard drive.
The source is chosen. The destination drive such as a USB
SSD drive can be selected after it is pluged in. Then a student
can also name the image file and use a common file extension
such as dd. The icon of a camera on the left side of figure
three is an easy way for students to get information about the
system’s hardware and obtain any IP address if it is connected
to a network. There is also documentation. Students who are
comfortable with a tool can also seek newer versions of
software that cost money when they have employment.
Figure 3- eFense’s Helix Version 1.7
7 Conclusion
Magnetic hard disks are well understood and the forensic
imaging and examination of these drives has become an
established science that is accepted in court cases. The
introduction of a new technology known as the solid state
drive (SSD) has produced some concerns among digital
forensic investigators, students, professors, attorneys, and the
legal communities. These sets of heterogeneous devices
behave in an unpredictable manner and have some aspects of
their operations cloaked in a shroud of secrecy. This makes it
difficult to consistently forensically image a solid state drive
and get a MD5 hash that matches for both the suspect’s drive
and the imaged drive. Therefore it may be necessary to get the
manufacturers, academics, practitioners, and the legal
community together to create a series of best practices or
modify the design of the device so that it may be forensically
imagined with consistent results and examined easily for use
in a digital forensics examination.
70 Int'l Conf. e-Learning, e-Bus., EIS, and e-Gov. | EEE'13 |
8 References
[1]. Doherty, E. P. (2011). Teaching Cell Phone Forensics and
E-Learning, 2011 International Conference on e-Learning, e-
Business, Enterprise Information Systems, and e-Government
(EEE'11: July 18-21, 2011, Las Vegas, Nevada, USA).
Conference Proceedings,Pages 161-5, ISBN 1-60132-176-7.
[2]. Solomon, M. G., Barrett, D., and Broom, N. (2005).
Computer Forensics Jump Start. Alameda, CA: Sybex Inc.
ISBN 0-7821-4375-X. p. 170-171.
[3]. Smith, F. C. and Bace, R. G. (2003). A Guide to Forensic
Testimony, The Art and Practice of Presenting Testimony as
an Expert Technical Witness. Boston, MA: Pearson
Education, Inc. Addison Wesley. ISBN 0-201-75279-4. p.
407.
[4] Silberschatz, A., Galvin, P. B., and Gagne, G. (2003).
Operating Systems Concepts, Sixth Edition. New York, NY:
John Wiley & Sons, Inc. ISBN 0-471-25060-0. p. 491-536.
[5] Doherty, E. P., Stephenson, G., Liebesfeld, J., and Bruno,
K. (2006). EForensics and Signal Intelligence for Everyone.
Bloomington, IN: AuthorHouse. ISBN 978-1-4259-6861-8. p.
63-66.
[6] Moultan, S. (uploaded Jan. 24, 2009). Solid State Drives
will ruin forensics part 1, 2 and 3. Presentation at Defcon 16.
Youtube.com. Retrieved from:
http://www.youtube.com/watch?v=WcO7xn0wJ2I&list=PLC3
37FACBF12BDCE2&index=1
[7] Bell, G. and Boddington, R. (2010). Solid State Drives:
The Beginning of the End for Current Practice in Digital
Forensic Recovery?. The Journal of Digital Forensics,
Security and Law, volume 5, number 3, page 4. Retrieved
From: http://www.jdfsl.org/subscriptions/JDFSL-V5N3-
Bell.pdf
[8]. Lewis, P. H. (April 24, 1994). Of Privacy and Security:
The Clipper Chip Debate. The New York Times, Technology
Section. Retrieved from:
http://www.nytimes.com/1994/04/24/business/of-privacy-and-
security-the-clipper-chip-
debate.html?pagewanted=all&src=pm
[9]. Bell, G. and Boddington, R. (2010). Solid State Drives:
The Beginning of the End for Current Practice in Digital
Forensic Recovery?. The Journal of Digital Forensics,
Security and Law, volume 5, number 3, pages 7-12.
Int'l Conf. e-Learning, e-Bus., EIS, and e-Gov. | EEE'13 | 71
A Framework for the Development of Mobile Learning Resource: An Analysis of the Case “Reciting Chinese
Ancient Poetry”
Yong Huang1, Qingchun Hu2 1 Shanghai Audio-video Education Center, Shanghai Distance Education Group
2 School of Information Science & Engineering, East China University of Science and Technology, Shanghai, China
Abstract –The paper analyzes our study on the project named “Reciting Chinese Ancient Poetry” which is implemented on smart phones and PDAs. It focuses on how to develop and assess effective and high quality mobile learning resource. A framework of the key factors we consider in the development is proposed. Especially, a multi-dimensions assessment approach is highlighted in the whole development process. Based on what we have done, some suggestions are put forward for the future research.
Keywords: M-Learning Resource; Assessment; User Interface Design
1 Introduction Mobile devices deeply impact our society currently,
changing the way we communicate with another. Today’s students have grown up with a new class of technologies that the previous generation might not have imagined, including smart phones and PDAs. Nevertheless, mobile devices are no longer simply a method of communication. They are changing the way we work and our everyday life, According to the Horizon Reports (www.nmc.org/horizon), experts have expected phones to have an impact on education. Some studies have reported that social web and mobile devices are the most important technologies for the near future in education [1].
Many studies on mobile learning (m-learning) have reported that students participating in m-learning can enhance their learning [2-4] .Currently, there it is not enough and high quality learning resource to establish m-learning for students in the outdoor education environment.
What we have done is to develop mobile learning resource to support primary students to learning Chinese Ancient Poetry through mobile devices, such as smart phones and PDAs. Our work is the pilot study and a sub part belongs to the project of “E-Bags”. The project of “E-Bags” is organized and funded by Shanghai Municipal Education Commission. The main goal of “E-Bags” is to develop learning resource to support students’ learning for K-12 in Shanghai. Currently, the project has launched [5-7]. In our
work, one goal is to convert and integrate the existing e-learning resource into m-learning resource.
The major contribution of this study is the introduction of the assessment approaches when developing the m-learning resource. These suggestions and lessons come from our current work, which will contribute to the development of m-learning resource, including PDAs, smart phones for the researchers.
2 Highlighting Assessment Activities in the Development Process
Because m-learning is a relatively new and the m-learning resource is a relatively new pedagogical research field. The m-learning is characterized with not only its electrical and convenient, but also its pedagogical quality. The design, development and implementation of m-learning are very complex process.
There are many things we should to consider. First of all, not all learning contents are suitable for m-learning, how to choose the topics to develop, and what key points we should consider compared with the common education software used in the personal computer.
Currently, although existing e-learning resource is abundance all over the world, not all e-learning resource is suitable for m-learning. Thus, in our development framework, the first stage is to select appropriate topics which are suitable to be implemented in smart phones and PDAs.
Besides the selecting appropriate topics, another attention is how to improve the usability of m-learning resource. Some e-learning resources are “low usability and poor quality”.
During the curriculum reform in China since 2005, a lot of educational software has been developed. For instance, in Shanghai, there has been an e-learning resource repository, (http://www.sherc.net/sherc/index/), which is funded and organized by Shanghai Municipal Education Commission. However, in the repository, some e-learning resource is seldom accessed since it was put into the repository. Based on the analysis of the infrequency access towards existing e-learning, we highlight the assessment activities in the whole development process (See Figure 1).
72 Int'l Conf. e-Learning, e-Bus., EIS, and e-Gov. | EEE'13 |
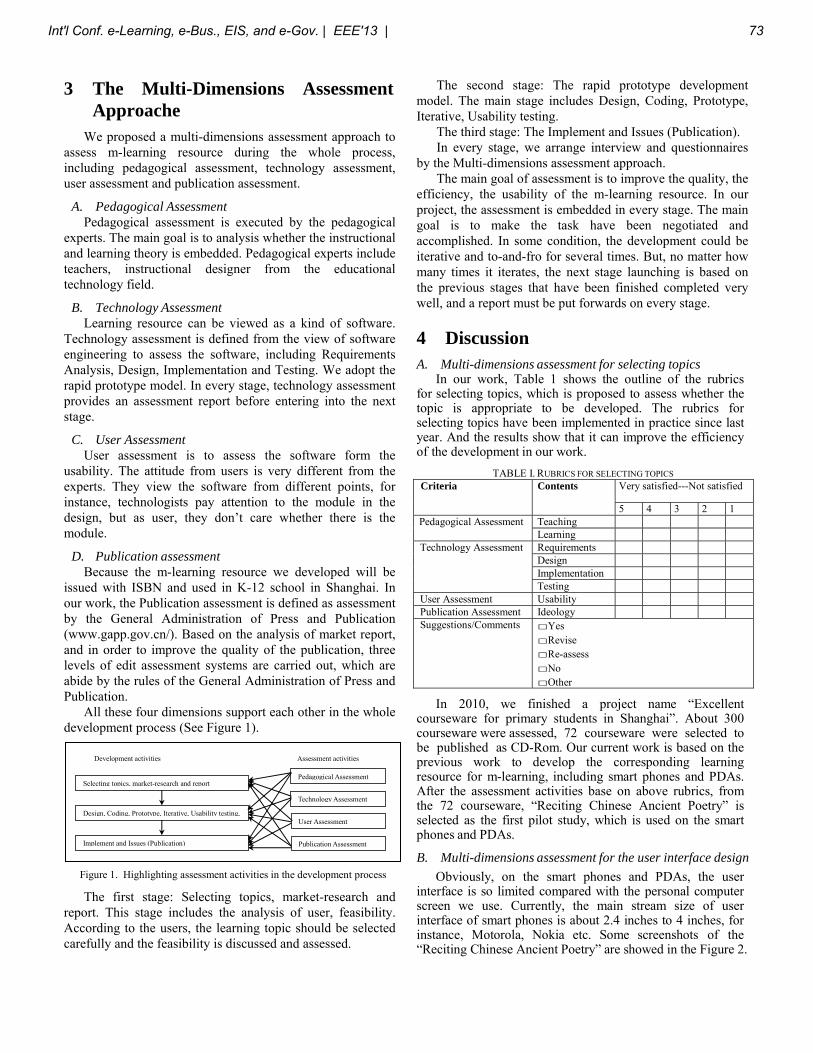
3 The Multi-Dimensions Assessment Approache
We proposed a multi-dimensions assessment approach to assess m-learning resource during the whole process, including pedagogical assessment, technology assessment, user assessment and publication assessment.
A. Pedagogical Assessment Pedagogical assessment is executed by the pedagogical
experts. The main goal is to analysis whether the instructional and learning theory is embedded. Pedagogical experts include teachers, instructional designer from the educational technology field.
B. Technology Assessment Learning resource can be viewed as a kind of software.
Technology assessment is defined from the view of software engineering to assess the software, including Requirements Analysis, Design, Implementation and Testing. We adopt the rapid prototype model. In every stage, technology assessment provides an assessment report before entering into the next stage.
C. User Assessment User assessment is to assess the software form the
usability. The attitude from users is very different from the experts. They view the software from different points, for instance, technologists pay attention to the module in the design, but as user, they don’t care whether there is the module.
D. Publication assessment Because the m-learning resource we developed will be
issued with ISBN and used in K-12 school in Shanghai. In our work, the Publication assessment is defined as assessment by the General Administration of Press and Publication (www.gapp.gov.cn/). Based on the analysis of market report, and in order to improve the quality of the publication, three levels of edit assessment systems are carried out, which are abide by the rules of the General Administration of Press and Publication.
Development activities Assessment activities
Selecting topics, market-research and report
Design, Coding, Prototype, Iterative, Usability testing,
Implement and Issues (Publication)
Pedagogical Assessment
User Assessment
Technology Assessment
Publication Assessment
All these four dimensions support each other in the whole development process (See Figure 1).
Figure 1. Highlighting assessment activities in the development process
The first stage: Selecting topics, market-research and report. This stage includes the analysis of user, feasibility. According to the users, the learning topic should be selected carefully and the feasibility is discussed and assessed.
The second stage: The rapid prototype development model. The main stage includes Design, Coding, Prototype, Iterative, Usability testing.
The third stage: The Implement and Issues (Publication). In every stage, we arrange interview and questionnaires
by the Multi-dimensions assessment approach. The main goal of assessment is to improve the quality, the
efficiency, the usability of the m-learning resource. In our project, the assessment is embedded in every stage. The main goal is to make the task have been negotiated and accomplished. In some condition, the development could be iterative and to-and-fro for several times. But, no matter how many times it iterates, the next stage launching is based on the previous stages that have been finished completed very well, and a report must be put forwards on every stage.
4 Discussion A. Multi-dimensions assessment for selecting topics
In our work, Table 1 shows the outline of the rubrics for selecting topics, which is proposed to assess whether the topic is appropriate to be developed. The rubrics for selecting topics have been implemented in practice since last year. And the results show that it can improve the efficiency of the development in our work.
TABLE I. RUBRICS OR SELECTING TOPICS F
Very satisfied---Not satisfiedCriteria Contents
5 4 3 2 1 Teaching Pedagogical AssessmentLearning Requir ments eDesign Implementation
Technology Assessment
Testing User Assessment Usability Publication Assessment Ideology Suggestions/Comments □Yes
□Revise □Re-assess □No □Other
In 2010, we finished a project name “Excellent courseware for primary students in Shanghai”. About 300 courseware were assessed, 72 courseware were selected to be published as CD-Rom. Our current work is based on the previous work to develop the corresponding learning resource for m-learning, including smart phones and PDAs. After the assessment activities base on above rubrics, from the 72 courseware, “Reciting Chinese Ancient Poetry” is selected as the first pilot study, which is used on the smart phones and PDAs.
B. Multi-dimensions assessment for the user interface design
Obviously, on the smart phones and PDAs, the user interface is so limited compared with the personal computer screen we use. Currently, the main stream size of user interface of smart phones is about 2.4 inches to 4 inches, for instance, Motorola, Nokia etc. Some screenshots of the “Reciting Chinese Ancient Poetry” are showed in the Figure 2.
Int'l Conf. e-Learning, e-Bus., EIS, and e-Gov. | EEE'13 | 73
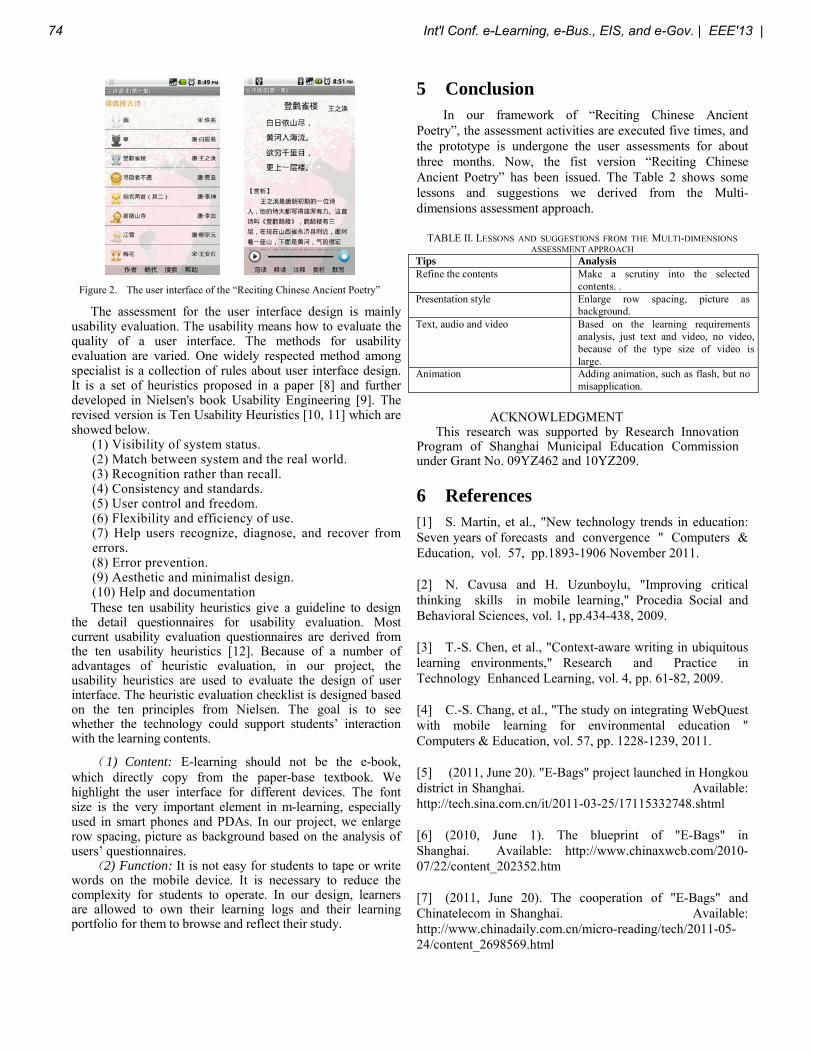
Figure 2. The user interface of the “Reciting Chinese Ancient Poetry”
The assessment for the user interface design is mainly usability evaluation. The usability means how to evaluate the quality of a user interface. The methods for usability evaluation are varied. One widely respected method among specialist is a collection of rules about user interface design. It is a set of heuristics proposed in a paper [8] and further developed in Nielsen's book Usability Engineering [9]. The revised version is Ten Usability Heuristics [10, 11] which are showed below.
(1) Visibility of system status. (2) Match between system and the real world. (3) Recognition rather than recall. (4) Consistency and standards. (5) User control and freedom. (6) Flexibility and efficiency of use. (7) Help users recognize, diagnose, and recover from errors. (8) Error prevention. (9) Aesthetic and minimalist design. (10) Help and documentation These ten usability heuristics give a guideline to design
the detail questionnaires for usability evaluation. Most current usability evaluation questionnaires are derived from the ten usability heuristics [12]. Because of a number of advantages of heuristic evaluation, in our project, the usability heuristics are used to evaluate the design of user interface. The heuristic evaluation checklist is designed based on the ten principles from Nielsen. The goal is to see whether the technology could support students’ interaction with the learning contents.
( 1) Content: E-learning should not be the e-book, which directly copy from the paper-base textbook. We highlight the user interface for different devices. The font size is the very important element in m-learning, especially used in smart phones and PDAs. In our project, we enlarge row spacing, picture as background based on the analysis of users’ questionnaires.
(2) Function: It is not easy for students to tape or write words on the mobile device. It is necessary to reduce the complexity for students to operate. In our design, learners are allowed to own their learning logs and their learning portfolio for them to browse and reflect their study.
5 Conclusion In our framework of “Reciting Chinese Ancient
Poetry”, the assessment activities are executed five times, and the prototype is undergone the user assessments for about three months. Now, the fist version “Reciting Chinese Ancient Poetry” has been issued. The Table 2 shows some lessons and suggestions we derived from the Multi-dimensions assessment approach.
TABLE II. LESSONS AND SUGGESTIONS FROM THE MULTI-DIMENSIONS ASSESSMENT APPRO CH A
Analysis Tips Refine the contents Make a rutiny into the selected sc
contents. . Presentation style Enlarge ro spacing, picture asw
background. Text, audio and video Based on the learning requirements
analysis, just text and video, no video, because of the type size of video is large.
Animation Adding animat n, such as flash, but noiomisapplication.
ACKNOWLEDGMENT This research was supported by Research Innovation
Program of Shanghai Municipal Education Commission under Grant No. 09YZ462 and 10YZ209.
6 References [1] S. Martin, et al., "New technology trends in education: Seven years of forecasts and convergence " Computers & Education, vol. 57, pp.1893-1906 November 2011.
[2] N. Cavusa and H. Uzunboylu, "Improving critical thinking skills in mobile learning," Procedia Social and Behavioral Sciences, vol. 1, pp.434-438, 2009.
[3] T.-S. Chen, et al., "Context-aware writing in ubiquitous learning environments," Research and Practice in Technology Enhanced Learning, vol. 4, pp. 61-82, 2009.
[4] C.-S. Chang, et al., "The study on integrating WebQuest with mobile learning for environmental education " Computers & Education, vol. 57, pp. 1228-1239, 2011.
[5] (2011, June 20). "E-Bags" project launched in Hongkou district in Shanghai. Available: http://tech.sina.com.cn/it/2011-03-25/17115332748.shtml
[6] (2010, June 1). The blueprint of "E-Bags" in Shanghai. Available: http://www.chinaxwcb.com/2010-07/22/content_202352.htm
[7] (2011, June 20). The cooperation of "E-Bags" and Chinatelecom in Shanghai. Available: http://www.chinadaily.com.cn/micro-reading/tech/2011-05-24/content_2698569.html
74 Int'l Conf. e-Learning, e-Bus., EIS, and e-Gov. | EEE'13 |
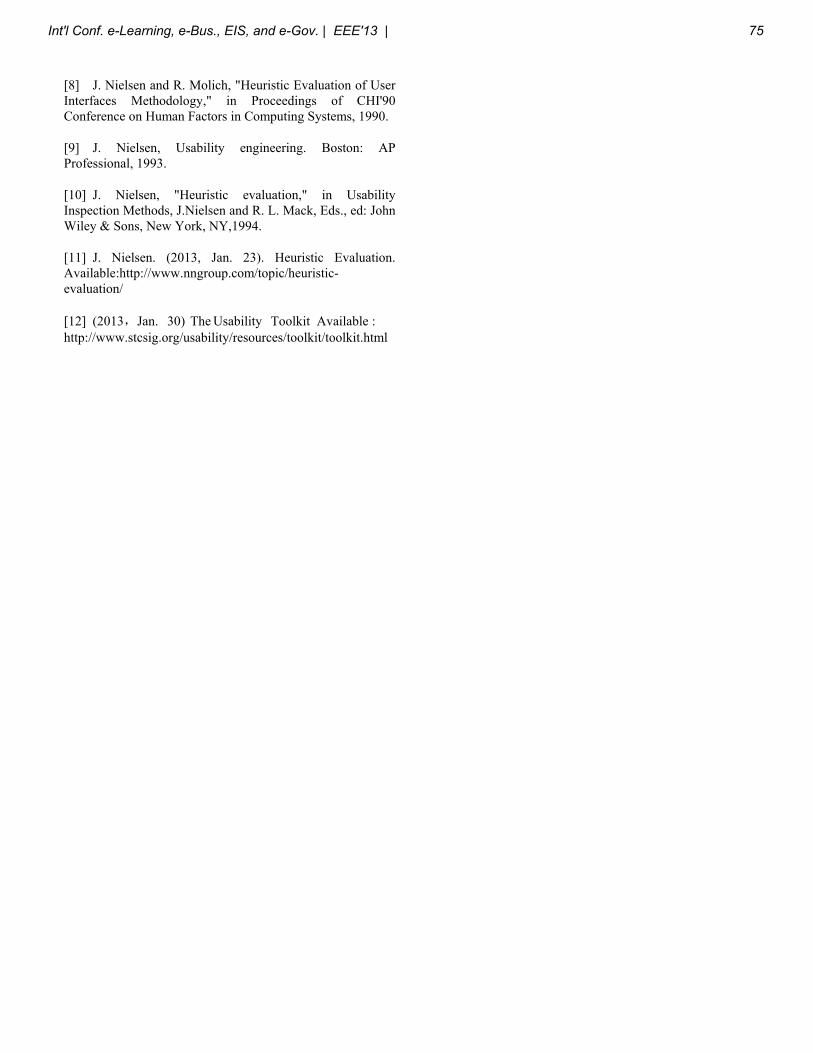
[8] J. Nielsen and R. Molich, "Heuristic Evaluation of User Interfaces Methodology," in Proceedings of CHI'90 Conference on Human Factors in Computing Systems, 1990.
[9] J. Nielsen, Usability engineering. Boston: AP Professional, 1993.
[10] J. Nielsen, "Heuristic evaluation," in Usability Inspection Methods, J.Nielsen and R. L. Mack, Eds., ed: John Wiley & Sons, New York, NY,1994.
[11] J. Nielsen. (2013, Jan. 23). Heuristic Evaluation. Available:http://www.nngroup.com/topic/heuristic-evaluation/
[12] (2013,Jan. 30) The Usability Toolkit Available : http://www.stcsig.org/usability/resources/toolkit/toolkit.html
Int'l Conf. e-Learning, e-Bus., EIS, and e-Gov. | EEE'13 | 75
Text Analysis of Deliberative Skills in Undergraduate Online Dialogue: Using L1 Regularized Logistic Regression with Psycholinguistic Features
Xiaoxi Xu, Tom Murray and Beverly Park Woolf
School of Computer Science University of Massachusetts, Amherst, MA
xiaoxi@, tmurray@, [email protected]
Abstract: We report on a text analysis and machine learning study of social deliberative skill using online dialogues on controversial topics from a college class. We report on our comparison between using the LIWC and Coh-Metrix text analysis feature sets, as well as demographic feature information in an L1 Regularized Logistic Regression machine learning algorithm. Keywords: social deliberative skills, online dialogue and collaboration, machine learning, text classification
Introduction Leaders, organizations, and nations are increasingly faced with complex issues requiring higher order
thinking skills, and in particular what we call "social deliberative skills." King & Baxter [1] note that "in times of increased global interdependence, producing interculturally competent citizens who can engage in informed, ethical decision-making when confronted with problems that involve a diversity of perspectives is becoming an urgent educational priority…these skills; however, 'they are what corporations find in shortest supply among entry-level candidates' [2]." Jordan et al. [3] propose two important skill sets for skillfully addressing "complex societal issues, such as gang-related crime, deteriorating residential areas, environmental problems, long-term youth unemployment, [and] racist violence" (p. 34.) Jordan calls these skill sets "complexity awareness" and "perspective awareness," and they have significant overlap with social deliberative skills.1 Ill-defined (or "wicked") social problems are defined as: have many interacting factors; have multiple stakeholders with heterogeneous viewpoints; are chronic and, while improvable, are not completely 'solvable' in any decisive sense; and require ongoing flexible attention because conditions evolve over time [3] [4]. Though these characteristics are used to describe intransigent social problems, they define many mundane situations as well. Parenting, perusing a career, maintaining intimate relationships, planning and managing a project, and "composing a life" in such a way as to balance one's many needs and constraints—these all present one with mini wicked problems on a regular basis. They require complexity awareness and perspective awareness to address the mental and moral demands of modern life [5]. It is important that we support the development of these skills in the educational systems.
Our overall research goals are to better understand, assess, and support SD-skills in online contexts. A prerequisite to researching how to support SD-skills is being able to measure, identify or assess them. This paper describes an aspect of our ongoing attempts to assess SD-skills using linguistic models. As part of our work investigating online support of SD-skills we have developed a hand-coding scheme for categorizing segments of online text. It has been used to evaluate software features in college classes, with encouraging results [6]. In parallel we are using text classification tools and machine learning to develop automated methods to categorize text to ascertain SD-skills and related indicators of deliberative dialogue quality, which we report on here. We are using automated assessment of SD-skills for two purposes: (1) to assess skill differences and correlations in our evaluative research [7] [8] [9], and (2) to display facets of
1 According to Jordan: "Complexity awareness [is] a person’s propensity to notice…that phenomena are compounded and variable, depend on varying conditions, are results of causal processes that may be…multivariate and systemic, and are embedded in processes [that involve non-simple information feedback loops]…If a person does not notice the complexity in which an issue is embedded, he or she will fail to consider many conditions, causes and consequences that may be significant for managing the issue (Kuhn, 1991)…Perspective awareness [is] the propensity to notice and operate with properties of one’s own and others’ perspectives" (Jordan, 2013, p. 41, italics added).
76 Int'l Conf. e-Learning, e-Bus., EIS, and e-Gov. | EEE'13 |
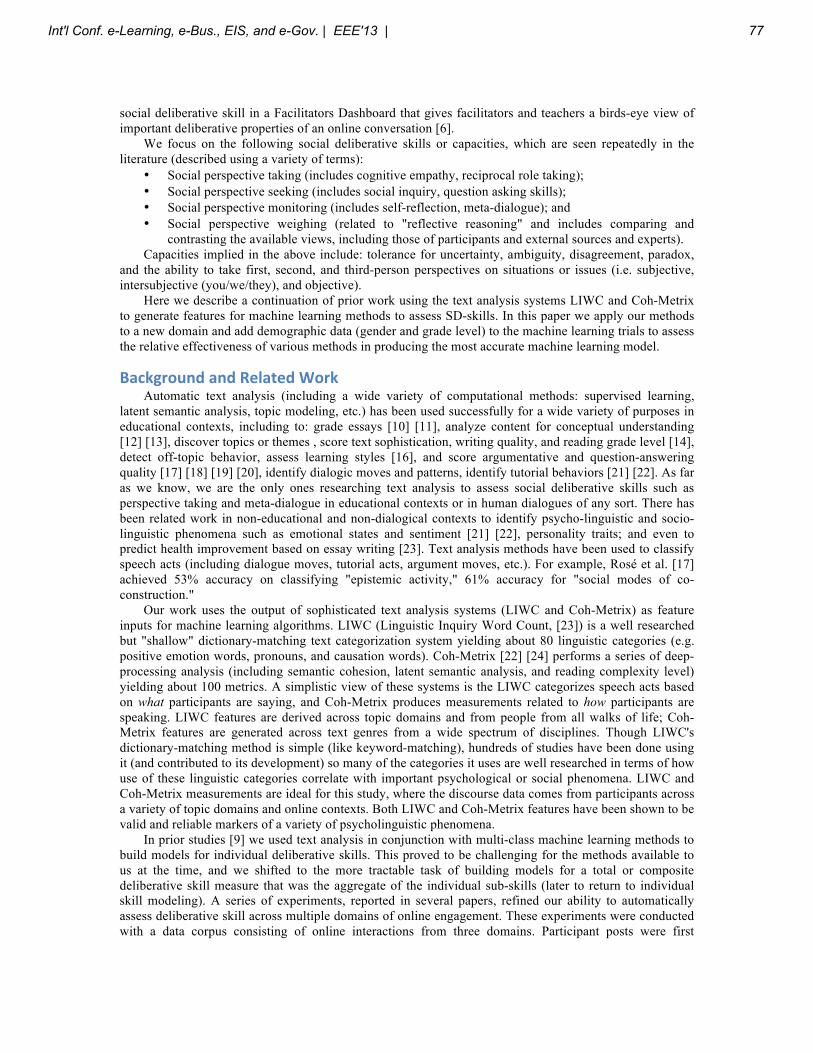
social deliberative skill in a Facilitators Dashboard that gives facilitators and teachers a birds-eye view of important deliberative properties of an online conversation [6].
We focus on the following social deliberative skills or capacities, which are seen repeatedly in the literature (described using a variety of terms):
• Social perspective taking (includes cognitive empathy, reciprocal role taking); • Social perspective seeking (includes social inquiry, question asking skills); • Social perspective monitoring (includes self-reflection, meta-dialogue); and • Social perspective weighing (related to "reflective reasoning" and includes comparing and
contrasting the available views, including those of participants and external sources and experts). Capacities implied in the above include: tolerance for uncertainty, ambiguity, disagreement, paradox,
and the ability to take first, second, and third-person perspectives on situations or issues (i.e. subjective, intersubjective (you/we/they), and objective).
Here we describe a continuation of prior work using the text analysis systems LIWC and Coh-Metrix to generate features for machine learning methods to assess SD-skills. In this paper we apply our methods to a new domain and add demographic data (gender and grade level) to the machine learning trials to assess the relative effectiveness of various methods in producing the most accurate machine learning model.
Background and Related Work Automatic text analysis (including a wide variety of computational methods: supervised learning,
latent semantic analysis, topic modeling, etc.) has been used successfully for a wide variety of purposes in educational contexts, including to: grade essays [10] [11], analyze content for conceptual understanding [12] [13], discover topics or themes , score text sophistication, writing quality, and reading grade level [14], detect off-topic behavior, assess learning styles [16], and score argumentative and question-answering quality [17] [18] [19] [20], identify dialogic moves and patterns, identify tutorial behaviors [21] [22]. As far as we know, we are the only ones researching text analysis to assess social deliberative skills such as perspective taking and meta-dialogue in educational contexts or in human dialogues of any sort. There has been related work in non-educational and non-dialogical contexts to identify psycho-linguistic and socio-linguistic phenomena such as emotional states and sentiment [21] [22], personality traits; and even to predict health improvement based on essay writing [23]. Text analysis methods have been used to classify speech acts (including dialogue moves, tutorial acts, argument moves, etc.). For example, Rosé et al. [17] achieved 53% accuracy on classifying "epistemic activity," 61% accuracy for "social modes of co-construction."
Our work uses the output of sophisticated text analysis systems (LIWC and Coh-Metrix) as feature inputs for machine learning algorithms. LIWC (Linguistic Inquiry Word Count, [23]) is a well researched but "shallow" dictionary-matching text categorization system yielding about 80 linguistic categories (e.g. positive emotion words, pronouns, and causation words). Coh-Metrix [22] [24] performs a series of deep-processing analysis (including semantic cohesion, latent semantic analysis, and reading complexity level) yielding about 100 metrics. A simplistic view of these systems is the LIWC categorizes speech acts based on what participants are saying, and Coh-Metrix produces measurements related to how participants are speaking. LIWC features are derived across topic domains and from people from all walks of life; Coh-Metrix features are generated across text genres from a wide spectrum of disciplines. Though LIWC's dictionary-matching method is simple (like keyword-matching), hundreds of studies have been done using it (and contributed to its development) so many of the categories it uses are well researched in terms of how use of these linguistic categories correlate with important psychological or social phenomena. LIWC and Coh-Metrix measurements are ideal for this study, where the discourse data comes from participants across a variety of topic domains and online contexts. Both LIWC and Coh-Metrix features have been shown to be valid and reliable markers of a variety of psycholinguistic phenomena.
In prior studies [9] we used text analysis in conjunction with multi-class machine learning methods to build models for individual deliberative skills. This proved to be challenging for the methods available to us at the time, and we shifted to the more tractable task of building models for a total or composite deliberative skill measure that was the aggregate of the individual sub-skills (later to return to individual skill modeling). A series of experiments, reported in several papers, refined our ability to automatically assess deliberative skill across multiple domains of online engagement. These experiments were conducted with a data corpus consisting of online interactions from three domains. Participant posts were first
Int'l Conf. e-Learning, e-Bus., EIS, and e-Gov. | EEE'13 | 77
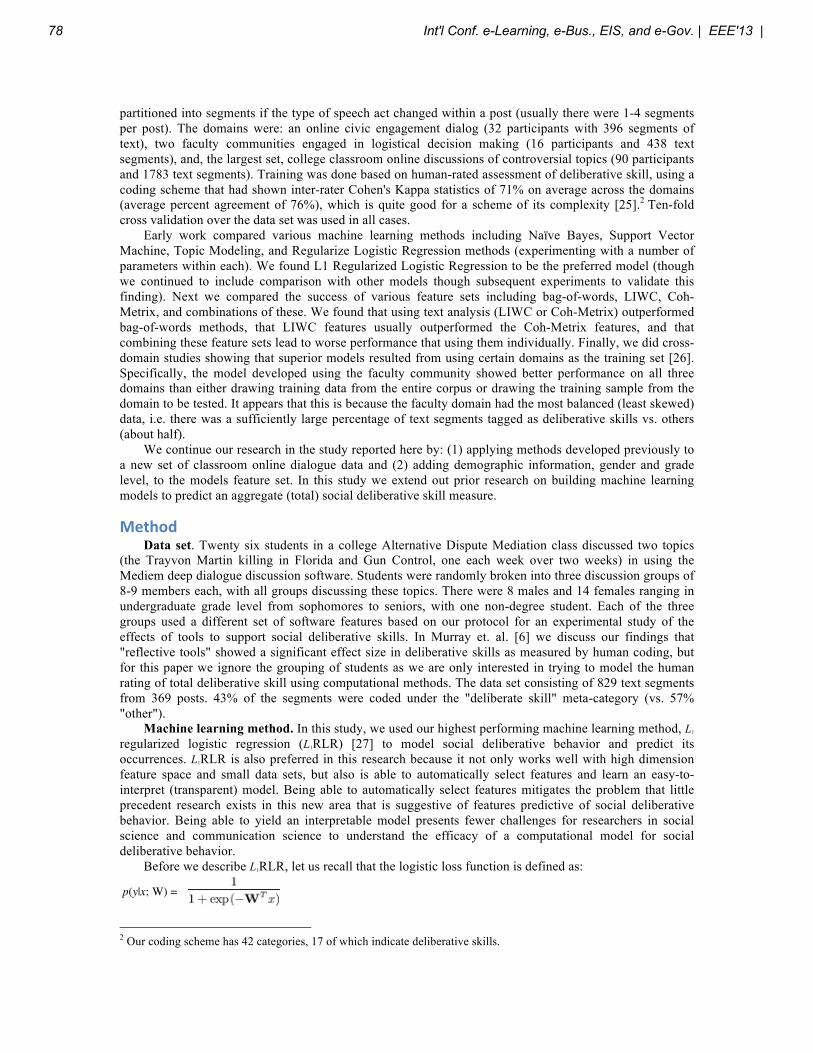
partitioned into segments if the type of speech act changed within a post (usually there were 1-4 segments per post). The domains were: an online civic engagement dialog (32 participants with 396 segments of text), two faculty communities engaged in logistical decision making (16 participants and 438 text segments), and, the largest set, college classroom online discussions of controversial topics (90 participants and 1783 text segments). Training was done based on human-rated assessment of deliberative skill, using a coding scheme that had shown inter-rater Cohen's Kappa statistics of 71% on average across the domains (average percent agreement of 76%), which is quite good for a scheme of its complexity [25].2 Ten-fold cross validation over the data set was used in all cases.
Early work compared various machine learning methods including Naïve Bayes, Support Vector Machine, Topic Modeling, and Regularize Logistic Regression methods (experimenting with a number of parameters within each). We found L1 Regularized Logistic Regression to be the preferred model (though we continued to include comparison with other models though subsequent experiments to validate this finding). Next we compared the success of various feature sets including bag-of-words, LIWC, Coh-Metrix, and combinations of these. We found that using text analysis (LIWC or Coh-Metrix) outperformed bag-of-words methods, that LIWC features usually outperformed the Coh-Metrix features, and that combining these feature sets lead to worse performance that using them individually. Finally, we did cross-domain studies showing that superior models resulted from using certain domains as the training set [26]. Specifically, the model developed using the faculty community showed better performance on all three domains than either drawing training data from the entire corpus or drawing the training sample from the domain to be tested. It appears that this is because the faculty domain had the most balanced (least skewed) data, i.e. there was a sufficiently large percentage of text segments tagged as deliberative skills vs. others (about half).
We continue our research in the study reported here by: (1) applying methods developed previously to a new set of classroom online dialogue data and (2) adding demographic information, gender and grade level, to the models feature set. In this study we extend out prior research on building machine learning models to predict an aggregate (total) social deliberative skill measure.
Method Data set. Twenty six students in a college Alternative Dispute Mediation class discussed two topics
(the Trayvon Martin killing in Florida and Gun Control, one each week over two weeks) in using the Mediem deep dialogue discussion software. Students were randomly broken into three discussion groups of 8-9 members each, with all groups discussing these topics. There were 8 males and 14 females ranging in undergraduate grade level from sophomores to seniors, with one non-degree student. Each of the three groups used a different set of software features based on our protocol for an experimental study of the effects of tools to support social deliberative skills. In Murray et. al. [6] we discuss our findings that "reflective tools" showed a significant effect size in deliberative skills as measured by human coding, but for this paper we ignore the grouping of students as we are only interested in trying to model the human rating of total deliberative skill using computational methods. The data set consisting of 829 text segments from 369 posts. 43% of the segments were coded under the "deliberate skill" meta-category (vs. 57% "other").
Machine learning method. In this study, we used our highest performing machine learning method, L1 regularized logistic regression (L1RLR) [27] to model social deliberative behavior and predict its occurrences. L1RLR is also preferred in this research because it not only works well with high dimension feature space and small data sets, but also is able to automatically select features and learn an easy-to-interpret (transparent) model. Being able to automatically select features mitigates the problem that little precedent research exists in this new area that is suggestive of features predictive of social deliberative behavior. Being able to yield an interpretable model presents fewer challenges for researchers in social science and communication science to understand the efficacy of a computational model for social deliberative behavior.
Before we describe L1RLR, let us recall that the logistic loss function is defined as:
p(y|x; W) =
2 Our coding scheme has 42 categories, 17 of which indicate deliberative skills.
78 Int'l Conf. e-Learning, e-Bus., EIS, and e-Gov. | EEE'13 |
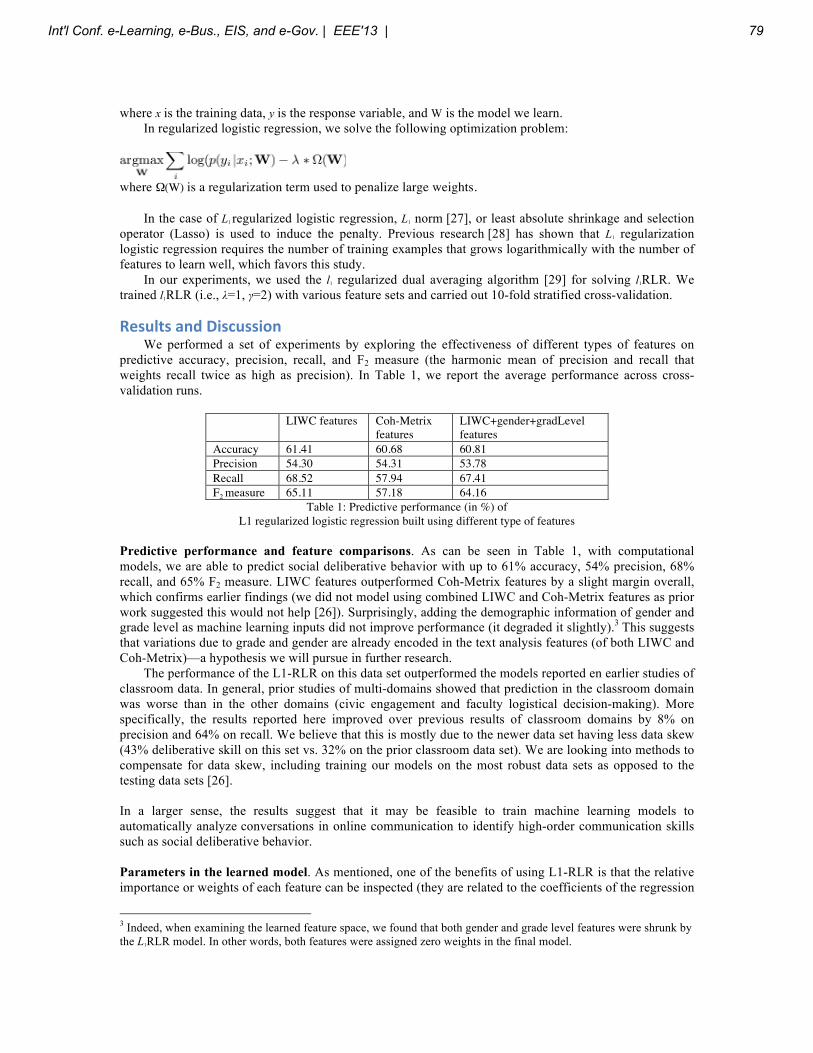
where x is the training data, y is the response variable, and W is the model we learn. In regularized logistic regression, we solve the following optimization problem:
where Ω(W) is a regularization term used to penalize large weights.
In the case of L1 regularized logistic regression, L1 norm [27], or least absolute shrinkage and selection operator (Lasso) is used to induce the penalty. Previous research [28] has shown that L1 regularization logistic regression requires the number of training examples that grows logarithmically with the number of features to learn well, which favors this study.
In our experiments, we used the l1 regularized dual averaging algorithm [29] for solving l1RLR. We trained l1RLR (i.e., λ=1, γ=2) with various feature sets and carried out 10-fold stratified cross-validation.
Results and Discussion We performed a set of experiments by exploring the effectiveness of different types of features on
predictive accuracy, precision, recall, and F2 measure (the harmonic mean of precision and recall that weights recall twice as high as precision). In Table 1, we report the average performance across cross-validation runs.
LIWC features Coh-Metrix
features LIWC+gender+gradLevel features
Accuracy 61.41 60.68 60.81 Precision 54.30 54.31 53.78 Recall 68.52 57.94 67.41 F2 measure 65.11 57.18 64.16
Table 1: Predictive performance (in %) of L1 regularized logistic regression built using different type of features
Predictive performance and feature comparisons. As can be seen in Table 1, with computational models, we are able to predict social deliberative behavior with up to 61% accuracy, 54% precision, 68% recall, and 65% F2 measure. LIWC features outperformed Coh-Metrix features by a slight margin overall, which confirms earlier findings (we did not model using combined LIWC and Coh-Metrix features as prior work suggested this would not help [26]). Surprisingly, adding the demographic information of gender and grade level as machine learning inputs did not improve performance (it degraded it slightly).3 This suggests that variations due to grade and gender are already encoded in the text analysis features (of both LIWC and Coh-Metrix)—a hypothesis we will pursue in further research.
The performance of the L1-RLR on this data set outperformed the models reported en earlier studies of classroom data. In general, prior studies of multi-domains showed that prediction in the classroom domain was worse than in the other domains (civic engagement and faculty logistical decision-making). More specifically, the results reported here improved over previous results of classroom domains by 8% on precision and 64% on recall. We believe that this is mostly due to the newer data set having less data skew (43% deliberative skill on this set vs. 32% on the prior classroom data set). We are looking into methods to compensate for data skew, including training our models on the most robust data sets as opposed to the testing data sets [26]. In a larger sense, the results suggest that it may be feasible to train machine learning models to automatically analyze conversations in online communication to identify high-order communication skills such as social deliberative behavior. Parameters in the learned model. As mentioned, one of the benefits of using L1-RLR is that the relative importance or weights of each feature can be inspected (they are related to the coefficients of the regression
3 Indeed, when examining the learned feature space, we found that both gender and grade level features were shrunk by the L1RLR model. In other words, both features were assigned zero weights in the final model.
Int'l Conf. e-Learning, e-Bus., EIS, and e-Gov. | EEE'13 | 79
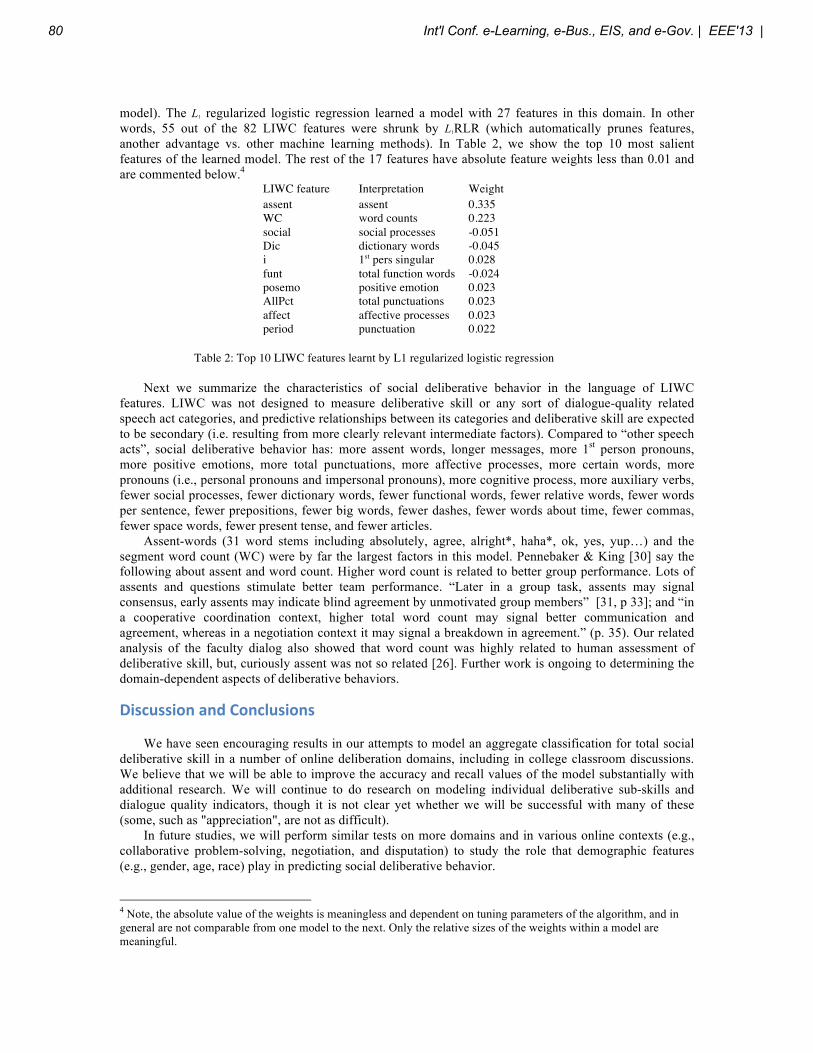
model). The L1 regularized logistic regression learned a model with 27 features in this domain. In other words, 55 out of the 82 LIWC features were shrunk by L1RLR (which automatically prunes features, another advantage vs. other machine learning methods). In Table 2, we show the top 10 most salient features of the learned model. The rest of the 17 features have absolute feature weights less than 0.01 and are commented below.4
LIWC feature Interpretation Weight assent assent 0.335
WC word counts 0.223 social social processes -0.051 Dic dictionary words -0.045 i 1st pers singular 0.028 funt total function words -0.024 posemo positive emotion 0.023 AllPct total punctuations 0.023 affect affective processes 0.023 period punctuation 0.022
Table 2: Top 10 LIWC features learnt by L1 regularized logistic regression
Next we summarize the characteristics of social deliberative behavior in the language of LIWC features. LIWC was not designed to measure deliberative skill or any sort of dialogue-quality related speech act categories, and predictive relationships between its categories and deliberative skill are expected to be secondary (i.e. resulting from more clearly relevant intermediate factors). Compared to “other speech acts”, social deliberative behavior has: more assent words, longer messages, more 1st person pronouns, more positive emotions, more total punctuations, more affective processes, more certain words, more pronouns (i.e., personal pronouns and impersonal pronouns), more cognitive process, more auxiliary verbs, fewer social processes, fewer dictionary words, fewer functional words, fewer relative words, fewer words per sentence, fewer prepositions, fewer big words, fewer dashes, fewer words about time, fewer commas, fewer space words, fewer present tense, and fewer articles.
Assent-words (31 word stems including absolutely, agree, alright*, haha*, ok, yes, yup…) and the segment word count (WC) were by far the largest factors in this model. Pennebaker & King [30] say the following about assent and word count. Higher word count is related to better group performance. Lots of assents and questions stimulate better team performance. “Later in a group task, assents may signal consensus, early assents may indicate blind agreement by unmotivated group members” [31, p 33]; and “in a cooperative coordination context, higher total word count may signal better communication and agreement, whereas in a negotiation context it may signal a breakdown in agreement.” (p. 35). Our related analysis of the faculty dialog also showed that word count was highly related to human assessment of deliberative skill, but, curiously assent was not so related [26]. Further work is ongoing to determining the domain-dependent aspects of deliberative behaviors.
Discussion and Conclusions
We have seen encouraging results in our attempts to model an aggregate classification for total social deliberative skill in a number of online deliberation domains, including in college classroom discussions. We believe that we will be able to improve the accuracy and recall values of the model substantially with additional research. We will continue to do research on modeling individual deliberative sub-skills and dialogue quality indicators, though it is not clear yet whether we will be successful with many of these (some, such as "appreciation", are not as difficult).
In future studies, we will perform similar tests on more domains and in various online contexts (e.g., collaborative problem-solving, negotiation, and disputation) to study the role that demographic features (e.g., gender, age, race) play in predicting social deliberative behavior.
4 Note, the absolute value of the weights is meaningless and dependent on tuning parameters of the algorithm, and in general are not comparable from one model to the next. Only the relative sizes of the weights within a model are meaningful.
80 Int'l Conf. e-Learning, e-Bus., EIS, and e-Gov. | EEE'13 |
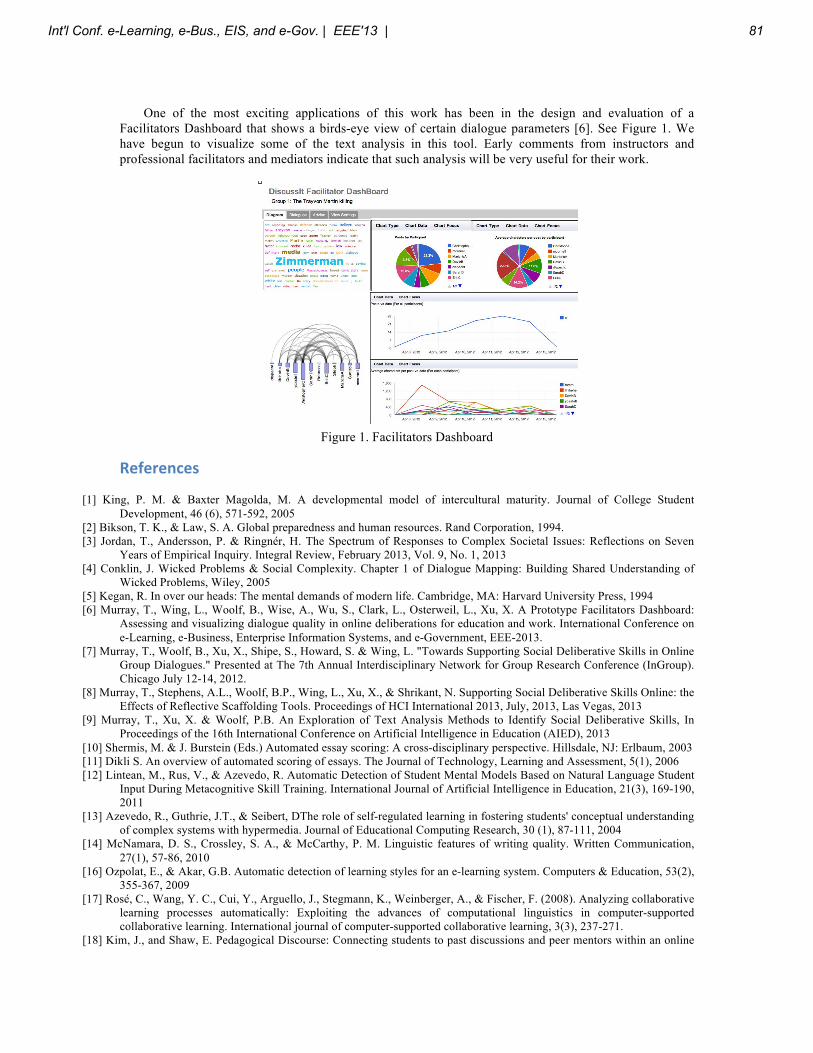
One of the most exciting applications of this work has been in the design and evaluation of a Facilitators Dashboard that shows a birds-eye view of certain dialogue parameters [6]. See Figure 1. We have begun to visualize some of the text analysis in this tool. Early comments from instructors and professional facilitators and mediators indicate that such analysis will be very useful for their work.
Figure 1. Facilitators Dashboard
References [1] King, P. M. & Baxter Magolda, M. A developmental model of intercultural maturity. Journal of College Student
Development, 46 (6), 571-592, 2005 [2] Bikson, T. K., & Law, S. A. Global preparedness and human resources. Rand Corporation, 1994. [3] Jordan, T., Andersson, P. & Ringnér, H. The Spectrum of Responses to Complex Societal Issues: Reflections on Seven
Years of Empirical Inquiry. Integral Review, February 2013, Vol. 9, No. 1, 2013 [4] Conklin, J. Wicked Problems & Social Complexity. Chapter 1 of Dialogue Mapping: Building Shared Understanding of
Wicked Problems, Wiley, 2005 [5] Kegan, R. In over our heads: The mental demands of modern life. Cambridge, MA: Harvard University Press, 1994 [6] Murray, T., Wing, L., Woolf, B., Wise, A., Wu, S., Clark, L., Osterweil, L., Xu, X. A Prototype Facilitators Dashboard:
Assessing and visualizing dialogue quality in online deliberations for education and work. International Conference on e-Learning, e-Business, Enterprise Information Systems, and e-Government, EEE-2013.
[7] Murray, T., Woolf, B., Xu, X., Shipe, S., Howard, S. & Wing, L. "Towards Supporting Social Deliberative Skills in Online Group Dialogues." Presented at The 7th Annual Interdisciplinary Network for Group Research Conference (InGroup). Chicago July 12-14, 2012.
[8] Murray, T., Stephens, A.L., Woolf, B.P., Wing, L., Xu, X., & Shrikant, N. Supporting Social Deliberative Skills Online: the Effects of Reflective Scaffolding Tools. Proceedings of HCI International 2013, July, 2013, Las Vegas, 2013
[9] Murray, T., Xu, X. & Woolf, P.B. An Exploration of Text Analysis Methods to Identify Social Deliberative Skills, In Proceedings of the 16th International Conference on Artificial Intelligence in Education (AIED), 2013
[10] Shermis, M. & J. Burstein (Eds.) Automated essay scoring: A cross-disciplinary perspective. Hillsdale, NJ: Erlbaum, 2003 [11] Dikli S. An overview of automated scoring of essays. The Journal of Technology, Learning and Assessment, 5(1), 2006 [12] Lintean, M., Rus, V., & Azevedo, R. Automatic Detection of Student Mental Models Based on Natural Language Student
Input During Metacognitive Skill Training. International Journal of Artificial Intelligence in Education, 21(3), 169-190, 2011
[13] Azevedo, R., Guthrie, J.T., & Seibert, DThe role of self-regulated learning in fostering students' conceptual understanding of complex systems with hypermedia. Journal of Educational Computing Research, 30 (1), 87-111, 2004
[14] McNamara, D. S., Crossley, S. A., & McCarthy, P. M. Linguistic features of writing quality. Written Communication, 27(1), 57-86, 2010
[16] Ozpolat, E., & Akar, G.B. Automatic detection of learning styles for an e-learning system. Computers & Education, 53(2), 355-367, 2009
[17] Rosé, C., Wang, Y. C., Cui, Y., Arguello, J., Stegmann, K., Weinberger, A., & Fischer, F. (2008). Analyzing collaborative learning processes automatically: Exploiting the advances of computational linguistics in computer-supported collaborative learning. International journal of computer-supported collaborative learning, 3(3), 237-271.
[18] Kim, J., and Shaw, E. Pedagogical Discourse: Connecting students to past discussions and peer mentors within an online
Int'l Conf. e-Learning, e-Bus., EIS, and e-Gov. | EEE'13 | 81
discussion board, Innovative Applications of Artificial Intelligence, IAAAI 09, 2009 [19] Ravi, S., Kim, J. Profiling student interactions in threaded discussions with speech act classifiers. IOS Press, 2007 [20] Rus, V., Cai, Z., & Graesser, A. C. Evaluation in natural language generation: The question generation task. In
Proceedings of the Workshop on Shared Tasks and Comparative Evaluation in Natural Language Generation (pp. 20-21), 2007
[21] D'Mello, Sidney, Olney, Andrew, & Person, Natalie. Mining collaborative patterns in tutorial dialogues. Journal of Educational Data Mining, 2(1), 1-37, 2010
[22] Graesser, A. C., Jeon, M., Yang, Y., & Cai, Z. Discourse cohesion in text and tutorial dialogue. Information Design Journal, 15, 199–213, 2007
[23] Pennebaker, J. W., Chung, C. K., Ireland, M., Gonzales, A. L., & Booth, R. J. The development and psychometric properties of LIWC2007. Austin, TX: www.LIWC.net, 2007
[24] Graesser, A., & McNamara, D. Computational analyses of multilevel discourse comprehension. Topics in Cognitive Science 3(2), 371–398. 2010.
[25] Altman, DG, Practical statistics for medical research. London: Chapman and Hall, 1991 [26] Xu, X., Murray, T. Woolf, B. & Smith, D. Mining Social Deliberation in Online Communication -- If You Were Me and I
Were You , In Proceedings of the 6th International Conference on Educational Data Mining (EDM), 2013 [27] Tibshirani, R. Regression shrinkage and selection via the lasso. Journal of the Royal Statistical Society. Series B
(Methodological) pp. 267–288, 1996 [28] Ng, A. Feature selection, l1 vs. l2 regularization, and rotational invariance. In Proceedings of the twenty-first international
conference on Machine learning, page 78. ACM, 2004 [29] Xiao, L. Dual averaging methods for regularized stochastic learning and online optimization. The Journal of Machine
Learning Research, 11:2543–2596, 2010 [30] Pennebaker, J. W., & King, L. A. Linguistic styles: Language use as an individual difference. Journal of personality and
social psychology, 77(6), 1296-1312, 1999. [31] Tausczik, Y. R. & Pennebaker, J. W. The psychological meaning of words: LIWC and computerized text analysis
methods. Journal of Language and Social Psychology, 2010.
82 Int'l Conf. e-Learning, e-Bus., EIS, and e-Gov. | EEE'13 |
ByTE – A Flexible Binary Tree Editor
A. Chan1
1Dept. of Math. and Computer Science, Fayetteville State University, Fayetteville, North Carolina, USA
Abstract - We describe the development of ByTE, a flexible
Binary Tree Editor that is aimed at academic usage. The
software allows easy incorporation of the created trees into
other documents, and hence is beneficial to instructors for
preparing presentation material. The files created by the
software are saved as text files in XML format, allowing
instructors to perform automated grading and/or manual
inspection/modification of the trees. The software will be
released free for non-profit use.
Keywords: Online learning; Binary tree; Data structures;
Algorithms, Online tools; Software application.
1 Introduction
In this article, we describe the development of ByTE, a
flexible Binary Tree Editor. Binary trees are important data
structures in computer science education, especially in data
structures and algorithms courses. They also occur in higher-
level courses and can be used to implement many other high-
level algorithms such as AVL trees, red-black trees, etc. It is
important that students understand how binary trees operate
in order to master the course material. There are many
software packages available on the Internet. These software
packages allow the users to create/manipulate/experiment
with binary trees. However, many of these software packages
are written as course projects and/or for demonstrating the
operations of certain specialized data structures implemented
with binary trees, and therefore have limitations that hinder
their usages as academic tools. Furthermore, many of these
software packages are written as Java applets [3] that operate
directly inside the Internet browsers and have no access to the
local file systems (and consequently, will not allow the users
to save/load work to/from files). We were looking for tools
that could create binary trees with (almost) no restrictions and
allow easy incorporation of the created trees into presentation
for class use. Unfortunately, we could not find any existing
software package that fit our requirements. Therefore, we
decided to create our own software.
The structure of this article is as follows. We review
some of the existing and related work in Section 2. In Section
3, we list some of the driving requirements of ByTE. Section
4 discusses the design and implementation of ByTE. We
discuss how ByTE is packaged and distributed in Section 5;
and Section 6 concludes our discussion.
2 Related Work
There are many interactive binary trees builders
available on the Internet; most of them appear in the form of
Java applets; and many of them are designed for specialized
binary trees.
Gustafson and Kjensli [6] have created a Java applet
named Binary Treesome. This applet started as a course
project. In addition to normal binary trees, the applet can
handle specialized binary trees, including binary search trees
and AVL trees. The applet restricts the labels in the nodes to
be non-duplicated integers between 1 and 99 inclusive, and it
allows binary trees of up to a height of 7. The applet
automatically adjusts the width between nodes. However,
when the tree becomes too wide for the applet window, part
of the tree will run off the applet window and some of the
nodes become inaccessible. We note that the limitation on
node labels gives a natural restriction on the size of the trees
created (that is, 99 nodes at most).
On his web page, Kloss hosts an animated binary tree
applet [10]. Like the Binary Treesome applet, it restricts the
labels in the nodes to be non-duplicated integers between 1
and 99 inclusive, and the binary trees will be configured into
binary search trees automatically. There seems to be no limit
on the height of the trees. However, when the tree becomes
too large, part of the tree will run off the applet window and
that part of the tree will be inaccessible to users.
Ierardi hosts on his web page another animated binary
search tree applet [9]. In this applet, the users have no control
over the labels of the nodes. The node labels are assigned
automatically and are not visible to the users. There seems to
be no limit on the height of the trees, and the applet makes an
effort to keep all nodes inside the applet window. However,
when the tree becomes too large, nodes start to overlap each
other and become indistinguishable to the users.
Gogeshvili created an applet that is very similar (in
functionality) to the Binary Treesome applet mentioned
above [7]. In addition to binary search trees and AVL trees, it
also supports red-black trees and splay trees, but it seems that
there is no support for vanilla plain binary trees. Like the
Binary Treesome applet, node labels are restricted to be non-
duplicated integers between 1 and 99 inclusive. However,
there seems to be no limit on the height of the trees, and when
the tree becomes too large for the applet window, controls are
available to adjust the spacing of the nodes to make the tree
Int'l Conf. e-Learning, e-Bus., EIS, and e-Gov. | EEE'13 | 83
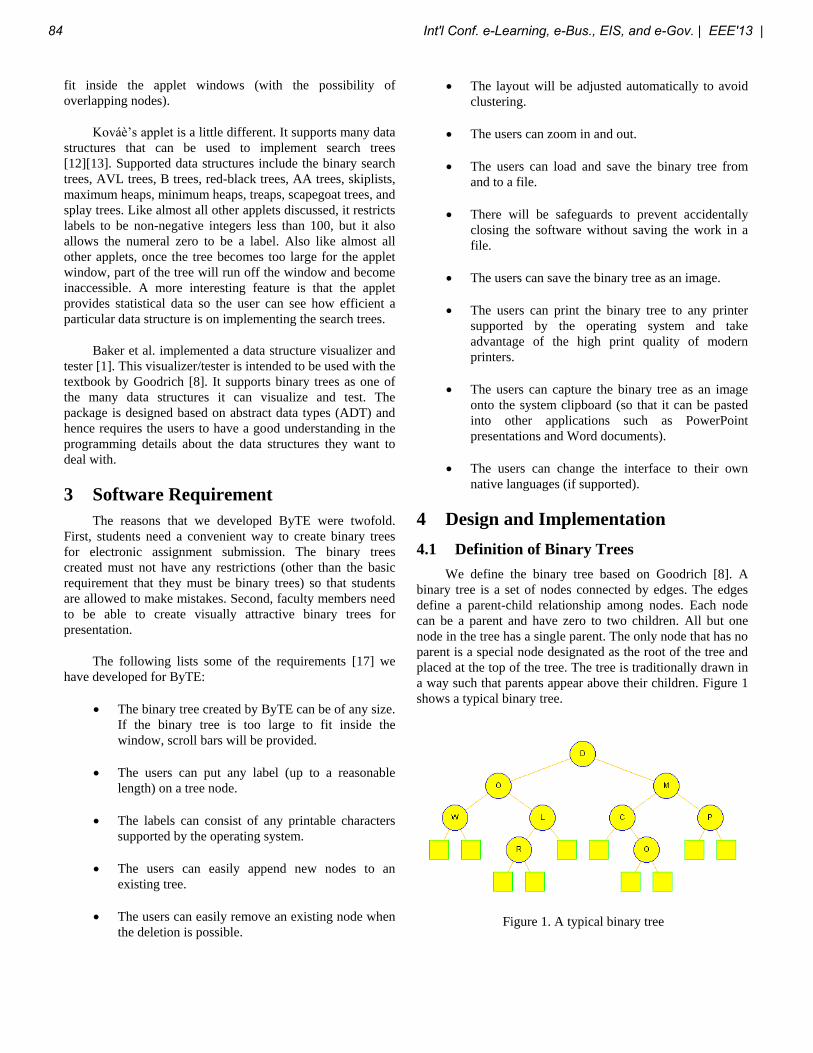
fit inside the applet windows (with the possibility of
overlapping nodes).
Kováè’s applet is a little different. It supports many data
structures that can be used to implement search trees
[12][13]. Supported data structures include the binary search
trees, AVL trees, B trees, red-black trees, AA trees, skiplists,
maximum heaps, minimum heaps, treaps, scapegoat trees, and
splay trees. Like almost all other applets discussed, it restricts
labels to be non-negative integers less than 100, but it also
allows the numeral zero to be a label. Also like almost all
other applets, once the tree becomes too large for the applet
window, part of the tree will run off the window and become
inaccessible. A more interesting feature is that the applet
provides statistical data so the user can see how efficient a
particular data structure is on implementing the search trees.
Baker et al. implemented a data structure visualizer and
tester [1]. This visualizer/tester is intended to be used with the
textbook by Goodrich [8]. It supports binary trees as one of
the many data structures it can visualize and test. The
package is designed based on abstract data types (ADT) and
hence requires the users to have a good understanding in the
programming details about the data structures they want to
deal with.
3 Software Requirement
The reasons that we developed ByTE were twofold.
First, students need a convenient way to create binary trees
for electronic assignment submission. The binary trees
created must not have any restrictions (other than the basic
requirement that they must be binary trees) so that students
are allowed to make mistakes. Second, faculty members need
to be able to create visually attractive binary trees for
presentation.
The following lists some of the requirements [17] we
have developed for ByTE:
The binary tree created by ByTE can be of any size.
If the binary tree is too large to fit inside the
window, scroll bars will be provided.
The users can put any label (up to a reasonable
length) on a tree node.
The labels can consist of any printable characters
supported by the operating system.
The users can easily append new nodes to an
existing tree.
The users can easily remove an existing node when
the deletion is possible.
The layout will be adjusted automatically to avoid
clustering.
The users can zoom in and out.
The users can load and save the binary tree from
and to a file.
There will be safeguards to prevent accidentally
closing the software without saving the work in a
file.
The users can save the binary tree as an image.
The users can print the binary tree to any printer
supported by the operating system and take
advantage of the high print quality of modern
printers.
The users can capture the binary tree as an image
onto the system clipboard (so that it can be pasted
into other applications such as PowerPoint
presentations and Word documents).
The users can change the interface to their own
native languages (if supported).
4 Design and Implementation
4.1 Definition of Binary Trees
We define the binary tree based on Goodrich [8]. A
binary tree is a set of nodes connected by edges. The edges
define a parent-child relationship among nodes. Each node
can be a parent and have zero to two children. All but one
node in the tree has a single parent. The only node that has no
parent is a special node designated as the root of the tree and
placed at the top of the tree. The tree is traditionally drawn in
a way such that parents appear above their children. Figure 1
shows a typical binary tree.
Figure 1. A typical binary tree
84 Int'l Conf. e-Learning, e-Bus., EIS, and e-Gov. | EEE'13 |
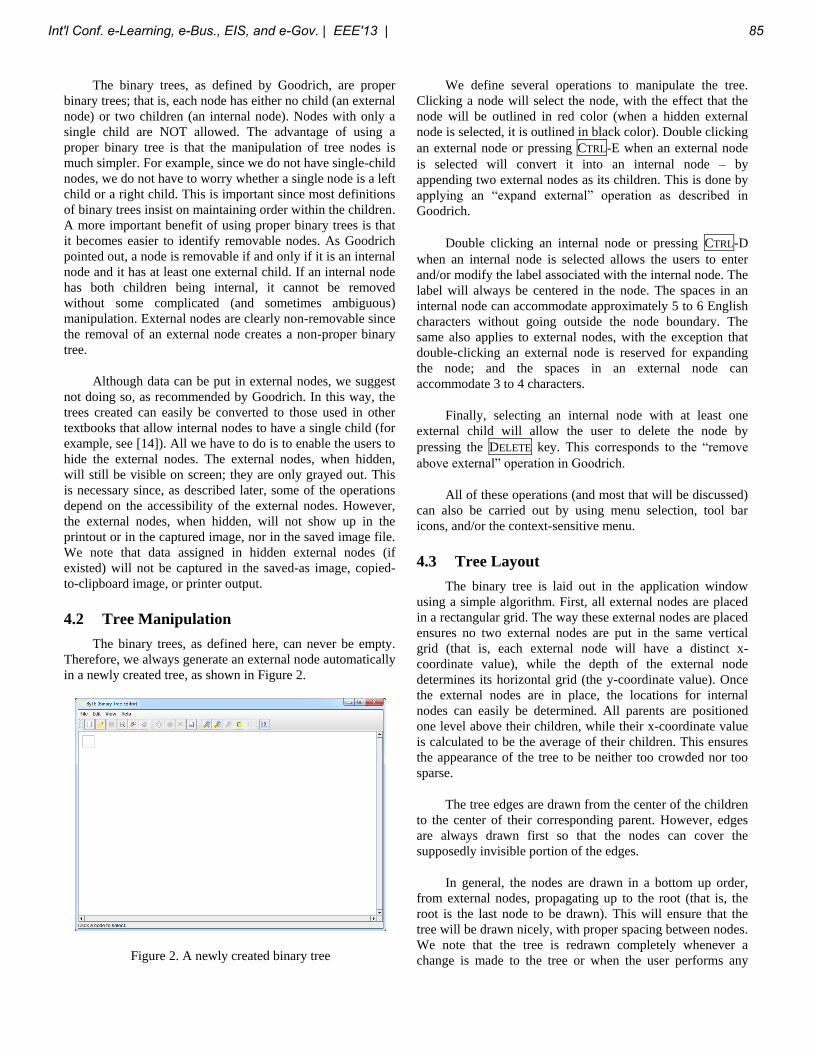
The binary trees, as defined by Goodrich, are proper
binary trees; that is, each node has either no child (an external
node) or two children (an internal node). Nodes with only a
single child are NOT allowed. The advantage of using a
proper binary tree is that the manipulation of tree nodes is
much simpler. For example, since we do not have single-child
nodes, we do not have to worry whether a single node is a left
child or a right child. This is important since most definitions
of binary trees insist on maintaining order within the children.
A more important benefit of using proper binary trees is that
it becomes easier to identify removable nodes. As Goodrich
pointed out, a node is removable if and only if it is an internal
node and it has at least one external child. If an internal node
has both children being internal, it cannot be removed
without some complicated (and sometimes ambiguous)
manipulation. External nodes are clearly non-removable since
the removal of an external node creates a non-proper binary
tree.
Although data can be put in external nodes, we suggest
not doing so, as recommended by Goodrich. In this way, the
trees created can easily be converted to those used in other
textbooks that allow internal nodes to have a single child (for
example, see [14]). All we have to do is to enable the users to
hide the external nodes. The external nodes, when hidden,
will still be visible on screen; they are only grayed out. This
is necessary since, as described later, some of the operations
depend on the accessibility of the external nodes. However,
the external nodes, when hidden, will not show up in the
printout or in the captured image, nor in the saved image file.
We note that data assigned in hidden external nodes (if
existed) will not be captured in the saved-as image, copied-
to-clipboard image, or printer output.
4.2 Tree Manipulation
The binary trees, as defined here, can never be empty.
Therefore, we always generate an external node automatically
in a newly created tree, as shown in Figure 2.
Figure 2. A newly created binary tree
We define several operations to manipulate the tree.
Clicking a node will select the node, with the effect that the
node will be outlined in red color (when a hidden external
node is selected, it is outlined in black color). Double clicking
an external node or pressing CTRL-E when an external node
is selected will convert it into an internal node – by
appending two external nodes as its children. This is done by
applying an “expand external” operation as described in
Goodrich.
Double clicking an internal node or pressing CTRL-D
when an internal node is selected allows the users to enter
and/or modify the label associated with the internal node. The
label will always be centered in the node. The spaces in an
internal node can accommodate approximately 5 to 6 English
characters without going outside the node boundary. The
same also applies to external nodes, with the exception that
double-clicking an external node is reserved for expanding
the node; and the spaces in an external node can
accommodate 3 to 4 characters.
Finally, selecting an internal node with at least one
external child will allow the user to delete the node by
pressing the DELETE key. This corresponds to the “remove
above external” operation in Goodrich.
All of these operations (and most that will be discussed)
can also be carried out by using menu selection, tool bar
icons, and/or the context-sensitive menu.
4.3 Tree Layout
The binary tree is laid out in the application window
using a simple algorithm. First, all external nodes are placed
in a rectangular grid. The way these external nodes are placed
ensures no two external nodes are put in the same vertical
grid (that is, each external node will have a distinct x-
coordinate value), while the depth of the external node
determines its horizontal grid (the y-coordinate value). Once
the external nodes are in place, the locations for internal
nodes can easily be determined. All parents are positioned
one level above their children, while their x-coordinate value
is calculated to be the average of their children. This ensures
the appearance of the tree to be neither too crowded nor too
sparse.
The tree edges are drawn from the center of the children
to the center of their corresponding parent. However, edges
are always drawn first so that the nodes can cover the
supposedly invisible portion of the edges.
In general, the nodes are drawn in a bottom up order,
from external nodes, propagating up to the root (that is, the
root is the last node to be drawn). This will ensure that the
tree will be drawn nicely, with proper spacing between nodes.
We note that the tree is redrawn completely whenever a
change is made to the tree or when the user performs any
Int'l Conf. e-Learning, e-Bus., EIS, and e-Gov. | EEE'13 | 85
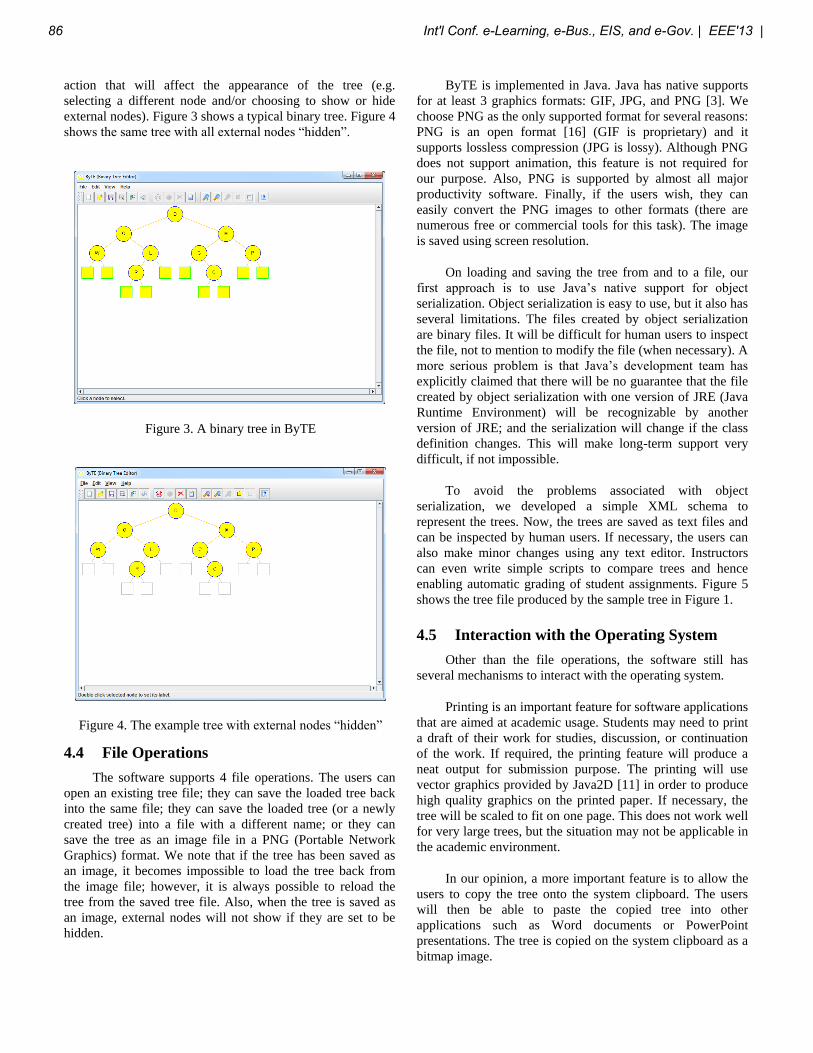
action that will affect the appearance of the tree (e.g.
selecting a different node and/or choosing to show or hide
external nodes). Figure 3 shows a typical binary tree. Figure 4
shows the same tree with all external nodes “hidden”.
Figure 3. A binary tree in ByTE
Figure 4. The example tree with external nodes “hidden”
4.4 File Operations
The software supports 4 file operations. The users can
open an existing tree file; they can save the loaded tree back
into the same file; they can save the loaded tree (or a newly
created tree) into a file with a different name; or they can
save the tree as an image file in a PNG (Portable Network
Graphics) format. We note that if the tree has been saved as
an image, it becomes impossible to load the tree back from
the image file; however, it is always possible to reload the
tree from the saved tree file. Also, when the tree is saved as
an image, external nodes will not show if they are set to be
hidden.
ByTE is implemented in Java. Java has native supports
for at least 3 graphics formats: GIF, JPG, and PNG [3]. We
choose PNG as the only supported format for several reasons:
PNG is an open format [16] (GIF is proprietary) and it
supports lossless compression (JPG is lossy). Although PNG
does not support animation, this feature is not required for
our purpose. Also, PNG is supported by almost all major
productivity software. Finally, if the users wish, they can
easily convert the PNG images to other formats (there are
numerous free or commercial tools for this task). The image
is saved using screen resolution.
On loading and saving the tree from and to a file, our
first approach is to use Java’s native support for object
serialization. Object serialization is easy to use, but it also has
several limitations. The files created by object serialization
are binary files. It will be difficult for human users to inspect
the file, not to mention to modify the file (when necessary). A
more serious problem is that Java’s development team has
explicitly claimed that there will be no guarantee that the file
created by object serialization with one version of JRE (Java
Runtime Environment) will be recognizable by another
version of JRE; and the serialization will change if the class
definition changes. This will make long-term support very
difficult, if not impossible.
To avoid the problems associated with object
serialization, we developed a simple XML schema to
represent the trees. Now, the trees are saved as text files and
can be inspected by human users. If necessary, the users can
also make minor changes using any text editor. Instructors
can even write simple scripts to compare trees and hence
enabling automatic grading of student assignments. Figure 5
shows the tree file produced by the sample tree in Figure 1.
4.5 Interaction with the Operating System
Other than the file operations, the software still has
several mechanisms to interact with the operating system.
Printing is an important feature for software applications
that are aimed at academic usage. Students may need to print
a draft of their work for studies, discussion, or continuation
of the work. If required, the printing feature will produce a
neat output for submission purpose. The printing will use
vector graphics provided by Java2D [11] in order to produce
high quality graphics on the printed paper. If necessary, the
tree will be scaled to fit on one page. This does not work well
for very large trees, but the situation may not be applicable in
the academic environment.
In our opinion, a more important feature is to allow the
users to copy the tree onto the system clipboard. The users
will then be able to paste the copied tree into other
applications such as Word documents or PowerPoint
presentations. The tree is copied on the system clipboard as a
bitmap image.
86 Int'l Conf. e-Learning, e-Bus., EIS, and e-Gov. | EEE'13 |
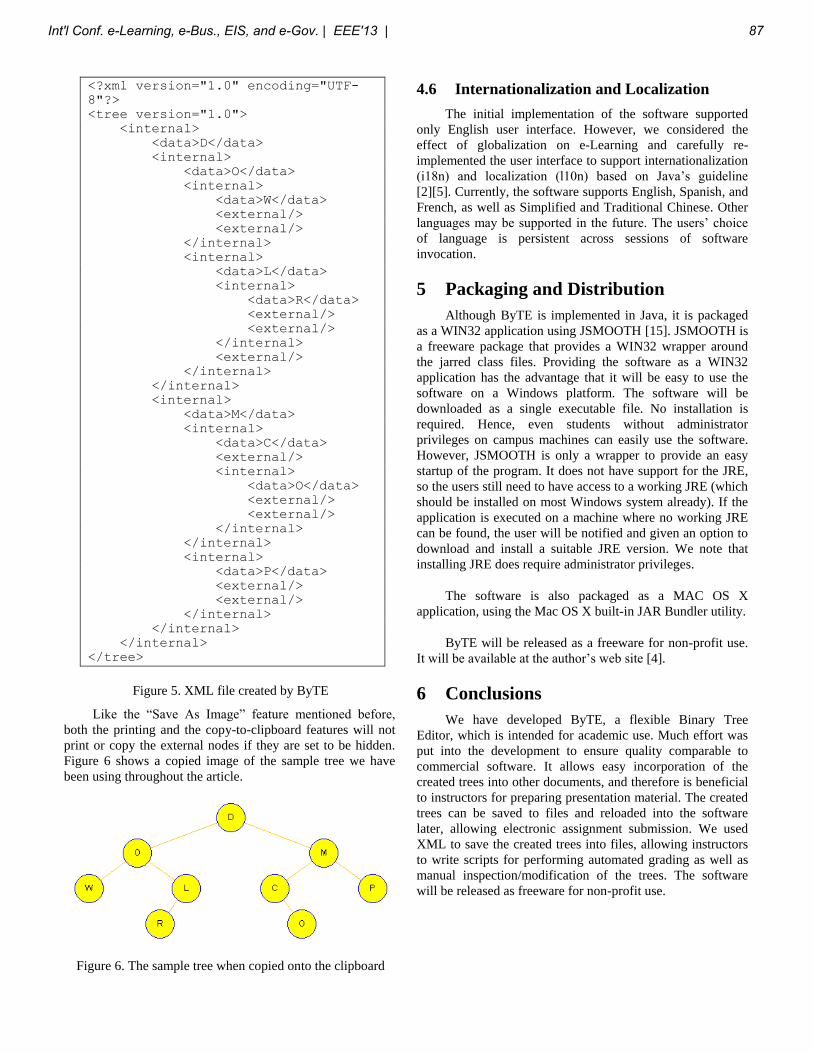
<?xml version="1.0" encoding="UTF-
8"?>
<tree version="1.0">
<internal>
<data>D</data>
<internal>
<data>O</data>
<internal>
<data>W</data>
<external/>
<external/>
</internal>
<internal>
<data>L</data>
<internal>
<data>R</data>
<external/>
<external/>
</internal>
<external/>
</internal>
</internal>
<internal>
<data>M</data>
<internal>
<data>C</data>
<external/>
<internal>
<data>O</data>
<external/>
<external/>
</internal>
</internal>
<internal>
<data>P</data>
<external/>
<external/>
</internal>
</internal>
</internal>
</tree>
Figure 5. XML file created by ByTE
Like the “Save As Image” feature mentioned before,
both the printing and the copy-to-clipboard features will not
print or copy the external nodes if they are set to be hidden.
Figure 6 shows a copied image of the sample tree we have
been using throughout the article.
Figure 6. The sample tree when copied onto the clipboard
4.6 Internationalization and Localization
The initial implementation of the software supported
only English user interface. However, we considered the
effect of globalization on e-Learning and carefully re-
implemented the user interface to support internationalization
(i18n) and localization (l10n) based on Java’s guideline
[2][5]. Currently, the software supports English, Spanish, and
French, as well as Simplified and Traditional Chinese. Other
languages may be supported in the future. The users’ choice
of language is persistent across sessions of software
invocation.
5 Packaging and Distribution
Although ByTE is implemented in Java, it is packaged
as a WIN32 application using JSMOOTH [15]. JSMOOTH is
a freeware package that provides a WIN32 wrapper around
the jarred class files. Providing the software as a WIN32
application has the advantage that it will be easy to use the
software on a Windows platform. The software will be
downloaded as a single executable file. No installation is
required. Hence, even students without administrator
privileges on campus machines can easily use the software.
However, JSMOOTH is only a wrapper to provide an easy
startup of the program. It does not have support for the JRE,
so the users still need to have access to a working JRE (which
should be installed on most Windows system already). If the
application is executed on a machine where no working JRE
can be found, the user will be notified and given an option to
download and install a suitable JRE version. We note that
installing JRE does require administrator privileges.
The software is also packaged as a MAC OS X
application, using the Mac OS X built-in JAR Bundler utility.
ByTE will be released as a freeware for non-profit use.
It will be available at the author’s web site [4].
6 Conclusions
We have developed ByTE, a flexible Binary Tree
Editor, which is intended for academic use. Much effort was
put into the development to ensure quality comparable to
commercial software. It allows easy incorporation of the
created trees into other documents, and therefore is beneficial
to instructors for preparing presentation material. The created
trees can be saved to files and reloaded into the software
later, allowing electronic assignment submission. We used
XML to save the created trees into files, allowing instructors
to write scripts for performing automated grading as well as
manual inspection/modification of the trees. The software
will be released as freeware for non-profit use.
Int'l Conf. e-Learning, e-Bus., EIS, and e-Gov. | EEE'13 | 87
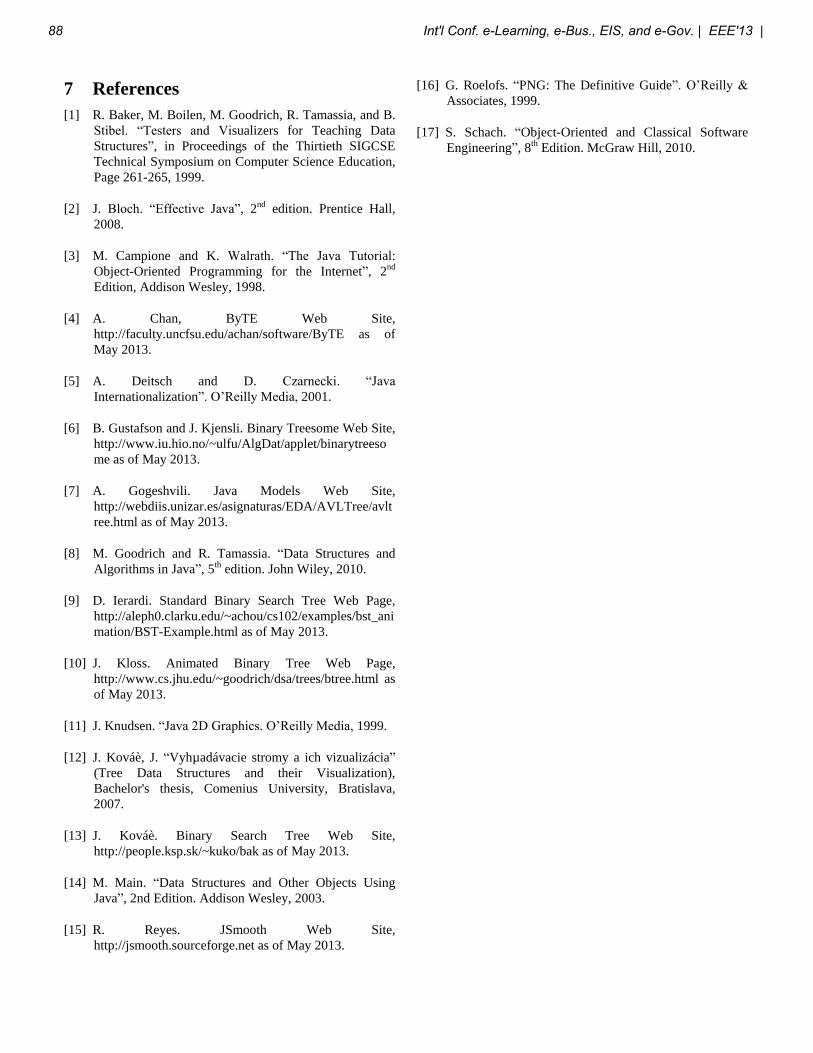
7 References
[1] R. Baker, M. Boilen, M. Goodrich, R. Tamassia, and B.
Stibel. “Testers and Visualizers for Teaching Data
Structures”, in Proceedings of the Thirtieth SIGCSE
Technical Symposium on Computer Science Education,
Page 261-265, 1999.
[2] J. Bloch. “Effective Java”, 2nd edition. Prentice Hall,
2008.
[3] M. Campione and K. Walrath. “The Java Tutorial:
Object-Oriented Programming for the Internet”, 2nd
Edition, Addison Wesley, 1998.
[4] A. Chan, ByTE Web Site,
http://faculty.uncfsu.edu/achan/software/ByTE as of
May 2013.
[5] A. Deitsch and D. Czarnecki. “Java
Internationalization”. O’Reilly Media, 2001.
[6] B. Gustafson and J. Kjensli. Binary Treesome Web Site,
http://www.iu.hio.no/~ulfu/AlgDat/applet/binarytreeso
me as of May 2013.
[7] A. Gogeshvili. Java Models Web Site,
http://webdiis.unizar.es/asignaturas/EDA/AVLTree/avlt
ree.html as of May 2013.
[8] M. Goodrich and R. Tamassia. “Data Structures and
Algorithms in Java”, 5th edition. John Wiley, 2010.
[9] D. Ierardi. Standard Binary Search Tree Web Page,
http://aleph0.clarku.edu/~achou/cs102/examples/bst_ani
mation/BST-Example.html as of May 2013.
[10] J. Kloss. Animated Binary Tree Web Page,
http://www.cs.jhu.edu/~goodrich/dsa/trees/btree.html as
of May 2013.
[11] J. Knudsen. “Java 2D Graphics. O’Reilly Media, 1999.
[12] J. Kováè, J. “Vyhµadávacie stromy a ich vizualizácia”
(Tree Data Structures and their Visualization),
Bachelor's thesis, Comenius University, Bratislava,
2007.
[13] J. Kováè. Binary Search Tree Web Site,
http://people.ksp.sk/~kuko/bak as of May 2013.
[14] M. Main. “Data Structures and Other Objects Using
Java”, 2nd Edition. Addison Wesley, 2003.
[15] R. Reyes. JSmooth Web Site,
http://jsmooth.sourceforge.net as of May 2013.
[16] G. Roelofs. “PNG: The Definitive Guide”. O’Reilly &
Associates, 1999.
[17] S. Schach. “Object-Oriented and Classical Software
Engineering”, 8th Edition. McGraw Hill, 2010.
88 Int'l Conf. e-Learning, e-Bus., EIS, and e-Gov. | EEE'13 |
Technological Gap: The Education Case of the State of
Puebla, Mexico
Juan Carlos Botello1, Martin Dávila
2
1 Escuela de Negocios, Universidad Popular Autónoma del Estado de Puebla, Puebla, Puebla, Mexico
2 Departamento de Ciencias Sociales, Universidad Popular Autónoma del Estado de Puebla, Puebla, Puebla,
Mexico
Abstract - The teaching-learning process may have several
obstacles; one of those would be a cultural situation of
students but also the ICT (information and communication
technologies) resource distribution per children. When we
refer to cultural situation, we mean the language or dialect
that they speak. In the state of Puebla, Mexico, there are
primary schools in which courses are taught to students who
do not speak Spanish and they only speak their own dialect.
On the other hand, the use of information and communication
technologies in primary schools in Puebla is a fact but a main
concern in schools is that the languages in which are operated
is Spanish. The present article will also deal with the
distribution of enciclomedia sets per children population in
the 217 communities of the state of Puebla. To analyze this
situation, we find that turns out to be very important and with
a negative effect on both the implementation and acceptance
of a multimedia program in these schools, generating a
technological gap between students. The government efforts
are being decimated because of this cultural divide prevalent
in many communities in the state of Puebla, Mexico.
Keywords: Primary schools, information technology,
resource distribution, cultural gap, technological gap.
1 Introduction
Various studies have demonstrated the importance and
the impact of diverse material resources and equipment of
different types [1] to improve efficiency, the learning process
and teaching results [2]. According to the Director of
UNESCO, Mr. Koichiro Matsura, in his discourse delivered
on the 19th of December 2007, “…the information and
communication technologies have the power to increase
learning access, especially for vulnerable communities in
remote areas…”, additionally,”…these new technologies can
help governments to monitor, manage and apportion
educational services in a more efficient way…” he
acknowledges information and communication technologies
as a basic tool to close the digital divide [3] between cities
and countryside, as defined by Inclán [3] as well as between
nations.
The basic public educational sector in Mexico is one of the
least favored with respect to the use of information
technologies which is unacceptable if the digital divide is to
be closed [4]. It is undeniable that in a nation of well-educated
citizens there is a profound contribution to the development of
a knowledge-based society [5], of a more just and
participative society. However, insufficient availability and
utilization of information and communication technologies,
the low budget increases in educational resources [6] and the
inefficient use of available resources [7] are characteristic for
the Mexico educational system, which still has not completely
manage to appropriate ICT in spite of the presence of
approved programs by the UNESCO as in the case of the
enciclomedia system, the program of Physics Education with
Technology and the Program of Mathematics Education with
Technology whose objective is to incorporate the use of
information and communication technologies in the teaching
of physics and mathematics in secondary public schools.
This paper will try to portrait the current situation in Puebla´s
primary school system with respect to the inclusion and use of
the information and communication technologies as an
educational tool in teaching and learning process, especially
the use of the enciclomedia system in the 5th and 6th grades
of primary schools since very few publications have touched
on the problem and have seldom taken it into consideration as
a factor in educational quality improvement. Consequently,
there has been negative impact on productive tasks and the
creation of new forms of social interaction in Mexico which
could be the foundation of understanding the importance
which ICT has in today´s education [8].
The initial step of this paper is to offer an exploration of the
operation of the Mexico educational system, thereafter
information related to the enciclomedia program, the
equipping of classrooms for the 5th and 6th primary grades
between the 217 counties of the State of Puebla with this tool
will be presented. A model will be developed with the
objective of analyzing the impact of the number of systems in
relation to the localization of primary schools, according to
total indian population numbers per county, per school
modality (state, federal, indigenous and indigenous shelter)
and the number of enciclomedia sets according to children
Int'l Conf. e-Learning, e-Bus., EIS, and e-Gov. | EEE'13 | 89
population in the state of Puebla. Finally, conclusions will be
offered.
2 Literature review
The Mexico educational system is based on the General
Educational Law which, in turn, is based upon Article 3 of the
Mexican Constitution. In it are established the general
provisions, organization and general structure of the Mexico
educational system. In the institutional framework are basic
education, middle schools and higher education, each with its
different levels and modalities.
In primary education, three modalities are recognized: the
General Primary School (urban and rural), the Indigenous
Primary School and the Community Primary School. Primary
education consists of a 6 year cycle and is obligatory for all
mexicans. For purposes of this paper, general state, federal
state, indigenous and indigenous shelter schools in the 217
counties of the state of Puebla will be dealt with.
During the schoolyear 2005-2006, approximately 32 million
students were enrolled in the Mexico School System in all of
its different levels, types and modalities in 230 000 education
centers. The largest number of students, nearly 25 million,
were enrolled in basic education (secondary and primary
schools) this also includes secondary schools for the working
population. This level represents 80.4% of total student
enrolment in 92.3% of the school installations (214,394).
14,548,194 students were enrolled in primary education
(13,371,543 in public schools and 1,176,651 in private
schools) in 98,045 schools (90,896 public schools and 7,149
private schools). 5,979,256 students were enrolled in the
secondary education system, (5,531,111 in public schools and
448,145 in private schools) in a total of 31,667 schools
(28,246 public and 3,766 private). At the high school level a
total of 3,658,754 students (2,924,529 in public schools and
743,225 in private schools) attended 12,841 schools (7,590
public and 5,257 private).
The efforts to create a wide infrastructure coverage at the
different education levels has been impressive but still not
sufficient during various federal administrative periods [9].
For example; 90% of the recourses destined for the education
sector in 2006 were for current operation costs and only the
small remainder went forward investment and innovation.
Various studies offer information with respect to the impact of
the quantity and quality of educational recourses used [10]. In
this context, in a study covering the year 2004 education
inequalities in Mexico [11] it is pointed out that the use of
some inputs are related with the yield, as was the case of the
use of computers in spanish and mathematics courses where
the impact was positive.
In Mexico´s National Development Plan for 2007-2012 it is
acknowledged as well that there are still lags in the
educational system such as the lack of opportunities to access
to quality education as well as in advances in technology and
information. Therefore, the Plan establishes a collection of
objectives and strategies to foment development. Objective
number nine: “Elevating the quality of education postulates a
series of considerations to achieve this objective which is
designed to comply with a combination of strategies. Strategy
9.3 recognizes that educational methodologies must adapt
themselves to a changing world to assure the integration of
knowledge through new information technologies.
Respectively, strategy 9.4, objective 10 and strategy 10.1
describe the importance of the apportionment of resources in
an efficient and equitable manner (through our model we will
demonstrate that the apportionment of resources in the State
of Puebla for equipping classrooms with the enciclomedia
system is done differently) to reduce regional inequalities,
modernizing and broadering educational infrastructure.
The stated objective of the National Development Plan
recognizes the necessity of spurring development and
utilization of new technologies in the educational system to
permit the integration of the students into the knowledge
society. Therefore, strategy 11.1 has been designed
specifically to reinforce the use of new technologies in the
teaching process and in the development of abilities in the use
of information and communication technologies starting at the
basic education level.
In this same context, the State Plan for the Development of
the State of Puebla 2005-2011, recognizes the necessity to
broaden educational infrastructure to guarantee equal
opportunity of access to and continuance in the system for all
Puebla citizens. Consequently, at the administrative level
effective deconcentration is fundamental in establishing an
integral administrative modernization program which
contemplates efficiency in planning structure and the
operation of the department. In the diagnosis of the Primary
educational level it was established that deteriorating
infrastructure still prevails and that there is scarcity of
resources. In that sense, if students or children find out that
conditions of ICT in schools are not appropriate for
educational purposes, then they will have to solve their
problem by using home computers. From 2001 through 2004,
there has been a substantial increase in the use of computers
in Mexico by children above 6 years old [12] at home, which
means that more than 25% of the total of children population
uses a computer at home. In 2011, 33.5% of total population
of the state of Puebla was considered as a computer user [13];
below national mean (41.9%).
For its part, the National Institute for the evaluation of
education (INEE), an organization created in Mexico for the
evaluation of quality in the Mexico educational system has
conducted various studies [26] [27] [28] [29], which reveal
the state of school resources available in the matter of
90 Int'l Conf. e-Learning, e-Bus., EIS, and e-Gov. | EEE'13 |
information and communication technologies for primary and
secondary schools, plus physical space, teaching aids (which
includes the availability of computer science teachers) the
number of computers and/or other electronic devices, study
programs and financial resources.
In the context of the above, we acknowledge that the current
educational policy of the Mexican government has evolved,
passing from being an indicator of social welfare to being a
product adapted to serving that which determines the new
political and economic order [14]. As shown, the
technological revolution is an element which has obliged
nations to adapt their public policies [15] in light of this factor
and educational policy [16] it cannot and must not be
disregarded in this context that the educational context has
changed [17]. The democratization of education, for its part,
appears to be part of the objective of the new economic policy
with the eagerness to reduce social inequalities by bringing
education to all corners of nation [18].
Emphazing just how much attention must be paid to the
incorporation of information and communication technologies
in education, various programs of Mexico´s federal
government (Ernesto Zedillo, Vicente Fox and Felipe
Calderón) have acknowledged its importance and
consequently programs like enciclomedia (during the
administration of Vicente Fox) were created for basic
education. That is to say, the investment which the
government must make in order to adopt new information
technologies in the educational sector is essential [15] and not
to be delayed [19]. The assignment of this resource must be
made in such a way, that it does not contribute to the
broadering of social inequalities. In that, special care must be
taken in deciding which order and how the government will
employ this resource and where it will come from [18].
The focus of this paper is the primary school and the
incorporation of information and communication technologies
through the enciclomedia program in the classroom.
Information and communication technologies have been
incorporated in the primary school in different ways around
the world as well as in its different levels [20] [21]. Some
schools have established laboratories and/or computer rooms,
multi-media rooms and/or audiovisual rooms, computers
and/or audiovisual equipment in the classrooms [22] with the
intent to have equipment which could help the educational
community to develop abilities to compete in the marketplace
and have better working conditions in the future [18] but,
people might choose not to use them for reasons other than
the lack of technological skills [23]. Therefore, the digital
divide can also be expressed in terms of the abilities needed to
take advantage of the information and communication
technologies [24] such as the use of English language as the
most common used in the internet. In this sense, there are
countries that the official spoken language is not English but
dialects are or something between an official language and
dialects.
Enciclomedia is an educational strategy which originated in
1998 and consists of a system of articulated resources which,
through digitalization of textbooks and the incorporation of
various multimedia resources like videos, photos, maps,
graphs, encyclopedias [3] and electronic blackboards [20].
Enciclomedia has linked its lessons in order to contribute to
the qualitative improvement of education in public schools in
Mexico and is now totally linked to fulfill the educational
objectives. It is an innovative way of using technology in the
school and thereby can contribute to overcome current issues
in education in Mexico. For example, teachers can consult
ENCARTA to disspel any doubts that may have arisen among
the students during class or the teachers can flesh out the
information they are imparting to the students about pre-
hispanic cultures with videos of the principal archaeological
zones, students can also find interactive excercises on
mathematics among others.
The gradual incorporation of information and communication
technologies into the classroom, the modernization of
pedagogical practice, the production of new educational
materials are characteristic of this system.
Enciclomedia began to be used in classrooms of the 5th and
6th grades of primary schools of the 2003-2004 schoolyear
and has still not reached its end. At present, it consists of two
stages: in the first stage (school year 2004-2005) 21,434
electronic blackboards were installed in classrooms in 7,211
schools as well as in 548 teacher training centers. 670,062
students in the general primary system, 15649 in the
indigenous primary system and about 25,000 teachers have
benefitted from the enciclomedia system. In its 2nd phase,
school years 2005-2007, 150,000 electronic blackboards have
been installed in the same number of schoolrooms in Mexico
[25].
3 Objectives, variables, hypotheses and
data
3.1 Objectives
Some factors affect the broadening of the digital gap in
developing countries. One of those factors is the way in which
educational resources are distributed in public schools but
also the social access. The objective of this paper is to analyze
the relationship between the equipping of classrooms with
Enciclomedia in public primary schools in the State of Puebla
and its geographic location, its modality, the size, the type of
indian population in every county in the state of Puebla and
distribution of Enciclomedia sets per children population.
3.2 Variables
3.2.1 numeq (Number of classrooms equipped with
Enciclomedia)
Int'l Conf. e-Learning, e-Bus., EIS, and e-Gov. | EEE'13 | 91

Numeq has been selected as a dependent variable
relative to the number of classrooms of the 5th and 6th grades
of Primary Schools in the State of Puebla equipped with
Enciclomedia. The independent variables in their different
modalities which will be considered are:
3.2.2 primest (State Primary School)
This variable refers to the State Primary modality in the
State of Puebla. It is a dummy type of variable because the
presence of the State Primary in the database is expressed
with a 1 and the other modalities with a 0.
3.2.3 primfed (Federal Primary School)
This variable refers to the Federal Primary modality in
the State of Puebla. It is a dummy type of variable because the
existence of Federal Primary in the database is expressed with
a 1 and the other modalities with a 0.
3.2.4 primindi (Indigenous Primary School)
This variable refers to the Indigenous Primary modality
in the State of Puebla. It is a dummy type of variable because
the existence of the Indigenous Primary in the database is
expressed with a 1 and the other modalities with a 0.
3.2.5 Dist (Distance in km. Between the City of Puebla and
the surroundings counties)
This variable refers to the existing distance in kilometers
between the Capital City of the State Puebla and its counties.
3.2.6 habindi (Indian Inhabitants)
This variable refers to the total of Indian inhabitants for
all the municipalities of the State of Puebla.
3.2.7 numdial (number of dialects spoken in State of Puebla)
This variable refers to the total number of dialects
spoken in all the municipalities of the State of Puebla.
3.2.8 popinf (number of children population)
This variable refers to the total number of children
population in all the municipalities of the State of Puebla.
3.3 Hypotheses
H1 = The number of Enciclomedia sets depends on the
distance between the capital city of Puebla State and the
municipalities.
H2= The number of Enciclomedia sets depends on the total of
Indian inhabitants for all the counties of the State of Puebla.
H3 = The number of Enciclomedia sets depend on the
distance, Indian inhabitants, federal primary school, state
primary school and indigenous primary school.
H4 = The number of Enciclomedia sets depend on the number
of dialects spoken in the State of Puebla.
H5 = The number of Enciclomedia sets depend on the number
of children population in the State of Puebla.
3.4 Data
The State Coordination of Distance Education of the
Ministry of Public Education of the State of Puebla in Mexico
(CETE-SEP) provided us with a database which contained the
following information of the State of Puebla: County name
and its localities (these data had to be verified individually to
correct errors with respect to names and number of localities
referred to), the number of classrooms equipped with
Enciclomedia in the fifth and sixth grades of Primary School
(2532 school rooms is the total of the sample), school
modality (Federal Primary, State Primary, Indigenous
Primary).
Herby item, this database displays 3 levels of Enciclomedia
classroom equipment. The two first levels contain the
information of equipment in Enciclomedia classrooms for
fifth and sixth grades of Primary School in different stages (I
and II) and the third level (III) has information of equipment
for the first grade of Secondary. In this paper only level II of
equipment for fifth and sixth grades of Primary School for the
years 2005 and 2006 will be dealt with.
Added to the database mentioned above, are four more
variables. The first variable is the distance in kilometers
existing between the capital of the State of Puebla and the 216
counties in the rest of the State, the second variable is the
number of Indian inhabitants in each county of the State of
Puebla, the third variable is the number of dialects spoken in
the State of Puebla. The dialects are: Náhuatl, totonaco,
mixteco, mazateco, zapoteco, popolaca, chocho, otomí,
tlapaneco, tepehua and the last variable includes the total
number of children in the 217 municipalities of Puebla.
92 Int'l Conf. e-Learning, e-Bus., EIS, and e-Gov. | EEE'13 |
4 Descriptive Statistics
4.1 Research variables
Table 1 shows descriptive statistics for the research
variables used in this paper. The number of observations is
217 that correspond to the total number of municipalities. The
maximum classrooms equipped with enciclomedia systems are
650 and the mean corresponds to 27.68 enciclomedia sets per
county. The major distance from the City of Puebla is 300 km.
the average of distance is 120.27 km. The maximum Indian
inhabitants in one municipality are 47,199. The mean of
Indian inhabitants in all counties is 2,772 and the standard
deviation is 5,591. The mean of children population in all the
counties is 8,894.
Variable Mean Std. Dev. Min Max
numeq 27.68 48.81 1 650
dist 120.27 66.04 1 300
habindi 2,772 5,591 0 47,199
popinf 8,894 28,289 132 400,228
Table 1 Descriptive statistics for variables listed above
4.2 School modality
In table 2 is shown the descriptive statistics of the school
modality variables used in this work. The average of state
primary schools equipped with enciclomedia sets per county is
2.36 while in the federal primary schools are 6.51.Finally,
there are more federal primary schools than state primary
schools or indigenous primary schools.
Variable Mean Std. Dev. Min Max
primest 2.36 4.85 0 66
primfed 6.51 8.39 0 78
primin 2.61 5.34 0 38
Table 2 Descriptive statistics for modality
4.3 Dialects spoken
In table 3 is shown the percentages for each dialect spoken
in the State of Puebla. The most spoken dialect is Nahuatl as
shown in the table. The less spoken dialect spoken is Tepehua.
Dialect percentage Dialect percentage
náhuatl 62.42% popoloca 2.68%
totonaco 16.44% zapoteco 2.01%
mixteco 8.39% Chocho 0.67%
otomí 3.36% tlapaneco 0.67%
mazateco 3.02% tepehua 0.34%
Table 3 Dialects spoken in the State of Puebla
5 Models, methodology and results
5.1 Models
The following equations are the proposal models to prove
the hypotheses postulated earlier:
Model = β + β0 1
num eq dist (1)
Model = β + β0 1
num eq habindi (2)
Model =β +β +β +β +β +β0 1 2 3 4 5
numeq dist habindi primest primfed primindi (3)
Model = β + β0 1
num eq numdial (4)
Model 0 1num eq pop in f= β + β (5)
5.2 Methodology
The methodology that we follow is with a linear
regression by ordinary least squares was utilized in such
form as to permit arriving at the relationships.
5.3 Results
5.3.1 Hypothesis 1
In table A1, there is a relationship between the number of
enciclomedia sets and the distance between Puebla City and
the remaining municipalities. The furthest (300 km far away
from Puebla city) the less primary school equipped with the
enciclomedia system.
Int'l Conf. e-Learning, e-Bus., EIS, and e-Gov. | EEE'13 | 93
5.3.2 Hypothesis 2
In table A2, we can demonstrate that the municipalities with
more inhabitants deserve more equipped classrooms with
enciclomedia system.
5.3.3 Hypothesis 3
The number of Enciclomedia sets is related to the distance,
the number of Indian inhabitants and the school modality
(Table A3).
5.3.4 Hypothesis 4
In table A4, we can demonstrate that the municipalities with
most spoken dialect deserve more enciclomedia sets.
5.3.5 Hypothesis 5
Findings in table A5 show that the more children population
in municipalities the more enciclomedia sets they get.
6 Conclusions The National Development Action Plan of México has
included within its action iniciatives, the incorporation and
use of information and communication technologies in the
education sector, particularly for the basic education, with the
proposal of introducing the student to the Knowledge society.
In table 2 it can be seen that there are a larger number of
Federal Primary Schools equipped with Enciclomedia in the
State of Puebla with 78, while in the Puebla State Plan for
Development no mention is made of information and
communication technology in the education sector and it can
be seen that only 66 State Primary Schools are equipped with
Enciclomedia. As Stiglitz [22] has indicated, the assignation
of this resource must be made in such a way as to not
contribute to the widening of the social inequalities,
wherefore special care must be taken in deciding which order
the government apply this resource, as well as from which
sources it will come, so that the way in which this resource is
distributed to primary schools in the State of Puebla does not
contribute to the broadening of the digital gap between
Federal Primary Schools and State Primary Schools.
Apparently, results from hypothesis 5, indicate that children
deserve more enciclomedia sets but the bad resource
distribution is a fact in the state of Puebla.
It can be said in Table A1, that the farther away any of the
216 municipalities are from the State Capital, the lower the
number of Primary Schools with Enciclomedia equipment,
this point is particularly important for decision makers in so
far as in equipping classrooms with Enciclomedia [30],
without regard as to what might be the motive for why the
most distant Primary Schools are less equipped, the end result
is that these areas have less access to information and
communication technology, and from that we can conclude
the State Plan for Development in Education and the National
Plan for Development in Education are not pursuing the same
objective, at least in the incorporation of information and
communication technology in Primary Schools. In Table A2
we show that the number of Indian inhabitants with respect to
the number of equipment sets have a positive relationship,
this means that a major number of Indian inhabitants the
government provides more enciclomedia sets for that kind of
population. But at the same time, government realizes that
municipalities with more Indian population should have more
enciclomedia sets.
Finally, the municipalities with more than two spoken dialects
are the most favored with enciclomedia sets, in order to
reduce the cultural and technological gap.
7 References
[1] Ruiz Cuellar, Guadalupe. (2006). La calidad de la
educación básica en México. Capítulo 3. Docentes,
infraestructura y equipamiento de las escuelas. p.p. 117.
México. INEE
[2] Fernández, T., Banegas, I., Blanco, E. (2004). Sistema
de Cuestionarios de Contexto INEE 2005 – 2008.
Fundamentos teóricos de los conceptos propuestos a ser
observados en los módulos permanentes del Sistema de
Cuestionarios de Contexto para el ciclo de evaluaciones 2005
– 2008. México: INEE
[3] Reimers, Fernando. (2006). Aprender mas y mejor.
Fondo de Cultura Económica.
[4] Quéau, Philippe, Governing the Global Knowledge
Society, citado en “Desarrollo de la Sociedad de la
Información en América Latina y el Caribe”. Menezes,
Claudio, Consejero Regional, División de la Sociedad de la
Información, UNESCO-Montevideo
[5] Vilaseca, Jordi. (2002). La economía del conocimiento:
paradigma tecnológico y cambio estructural. Working Paper
Series WP02-003. UOC.
[6] Cárdenas, Oscar. “El gasto educativo: una propuesta de
financiamiento a la educación básica”. Volumen XVI.
Número 2. II Semestre de 2007. Gestión y Política Pública.
[7] Bracho, Teresa. “Perfil nacional encargado para el
Informe de Seguimiento de la EPT en el mundo 2008,
Educación para Todos en 2015 - ¿Alcanzaremos la meta?”.
México. Estudio de Caso. UNESCO, 2007.
[8] Botello, Juan Carlos (2008). “Las Tic´s y el Sistema
Educativo Mexicano”. Working paper. Congreso
Internacional de Investigación en Ciencias Administrativas.
Tijuana, México.
[9] Alcántara, Armando. (2006). 25 años de políticas
educativas en México. IISUE-UNAM.
[10] Schmelkes, S. (1997). La calidad de la educación
primaria: Un estudio de caso. México: Fondo de Cultura
Económica.
[11] Treviño, E. y Treviño, G. (2004). Estudio sobre las
desigualdades educativas en México: la incidencia de la
escuela en el desempeño académico de los alumnos y el rol
94 Int'l Conf. e-Learning, e-Bus., EIS, and e-Gov. | EEE'13 |
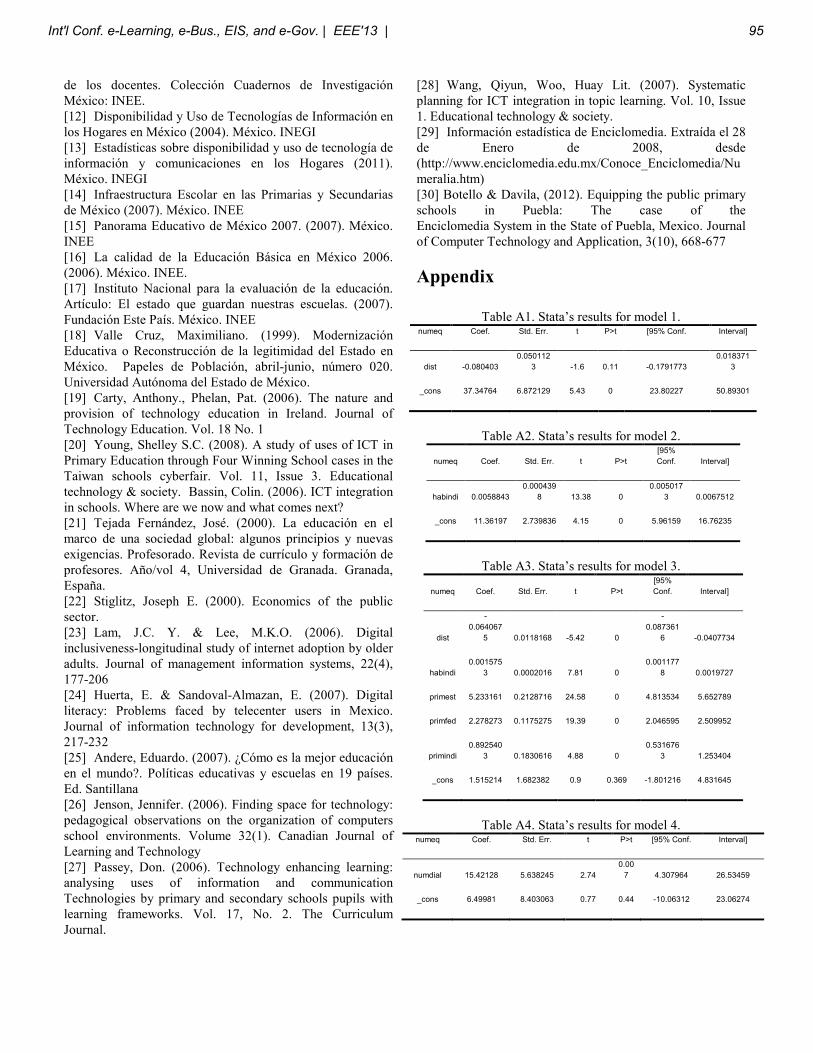
de los docentes. Colección Cuadernos de Investigación
México: INEE.
[12] Disponibilidad y Uso de Tecnologías de Información en
los Hogares en México (2004). México. INEGI
[13] Estadísticas sobre disponibilidad y uso de tecnología de
información y comunicaciones en los Hogares (2011).
México. INEGI
[14] Infraestructura Escolar en las Primarias y Secundarias
de México (2007). México. INEE
[15] Panorama Educativo de México 2007. (2007). México.
INEE
[16] La calidad de la Educación Básica en México 2006.
(2006). México. INEE.
[17] Instituto Nacional para la evaluación de la educación.
Artículo: El estado que guardan nuestras escuelas. (2007).
Fundación Este País. México. INEE
[18] Valle Cruz, Maximiliano. (1999). Modernización
Educativa o Reconstrucción de la legitimidad del Estado en
México. Papeles de Población, abril-junio, número 020.
Universidad Autónoma del Estado de México.
[19] Carty, Anthony., Phelan, Pat. (2006). The nature and
provision of technology education in Ireland. Journal of
Technology Education. Vol. 18 No. 1
[20] Young, Shelley S.C. (2008). A study of uses of ICT in
Primary Education through Four Winning School cases in the
Taiwan schools cyberfair. Vol. 11, Issue 3. Educational
technology & society. Bassin, Colin. (2006). ICT integration
in schools. Where are we now and what comes next?
[21] Tejada Fernández, José. (2000). La educación en el
marco de una sociedad global: algunos principios y nuevas
exigencias. Profesorado. Revista de currículo y formación de
profesores. Año/vol 4, Universidad de Granada. Granada,
España.
[22] Stiglitz, Joseph E. (2000). Economics of the public
sector.
[23] Lam, J.C. Y. & Lee, M.K.O. (2006). Digital
inclusiveness-longitudinal study of internet adoption by older
adults. Journal of management information systems, 22(4),
177-206
[24] Huerta, E. & Sandoval-Almazan, E. (2007). Digital
literacy: Problems faced by telecenter users in Mexico.
Journal of information technology for development, 13(3),
217-232
[25] Andere, Eduardo. (2007). ¿Cómo es la mejor educación
en el mundo?. Políticas educativas y escuelas en 19 países.
Ed. Santillana
[26] Jenson, Jennifer. (2006). Finding space for technology:
pedagogical observations on the organization of computers
school environments. Volume 32(1). Canadian Journal of
Learning and Technology
[27] Passey, Don. (2006). Technology enhancing learning:
analysing uses of information and communication
Technologies by primary and secondary schools pupils with
learning frameworks. Vol. 17, No. 2. The Curriculum
Journal.
[28] Wang, Qiyun, Woo, Huay Lit. (2007). Systematic
planning for ICT integration in topic learning. Vol. 10, Issue
1. Educational technology & society.
[29] Información estadística de Enciclomedia. Extraída el 28
de Enero de 2008, desde
(http://www.enciclomedia.edu.mx/Conoce_Enciclomedia/Nu
meralia.htm)
[30] Botello & Davila, (2012). Equipping the public primary
schools in Puebla: The case of the
Enciclomedia System in the State of Puebla, Mexico. Journal
of Computer Technology and Application, 3(10), 668-677
Appendix
Table A1. Stata’s results for model 1.
numeq Coef. Std. Err. t P>t [95% Conf. Interval]
dist -0.080403
0.050112
3 -1.6 0.11 -0.1791773
0.018371
3
_cons 37.34764 6.872129 5.43 0 23.80227 50.89301
Table A2. Stata’s results for model 2.
numeq Coef. Std. Err. t P>t
[95%
Conf. Interval]
habindi 0.0058843
0.000439
8 13.38 0
0.005017
3 0.0067512
_cons 11.36197 2.739836 4.15 0 5.96159 16.76235
Table A3. Stata’s results for model 3.
numeq Coef. Std. Err. t P>t
[95%
Conf. Interval]
dist
-
0.064067
5 0.0118168 -5.42 0
-
0.087361
6 -0.0407734
habindi
0.001575
3 0.0002016 7.81 0
0.001177
8 0.0019727
primest 5.233161 0.2128716 24.58 0 4.813534 5.652789
primfed 2.278273 0.1175275 19.39 0 2.046595 2.509952
primindi
0.892540
3 0.1830616 4.88 0
0.531676
3 1.253404
_cons 1.515214 1.682382 0.9 0.369 -1.801216 4.831645
Table A4. Stata’s results for model 4. numeq Coef. Std. Err. t P>t [95% Conf. Interval]
numdial 15.42128 5.638245 2.74
0.00
7 4.307964 26.53459
_cons 6.49981 8.403063 0.77 0.44 -10.06312 23.06274
Int'l Conf. e-Learning, e-Bus., EIS, and e-Gov. | EEE'13 | 95

Table A5. Stata’s results for model 5. numeq Coef. Std. Err. t P>t [95% Conf. Interval]
popinf 0.0016445
0.000035
6 46.16 0.000 0.0015742
0.001714
7
_cons 14.03861 1.048015 13.40 0.000 11.97291 16.10431
96 Int'l Conf. e-Learning, e-Bus., EIS, and e-Gov. | EEE'13 |
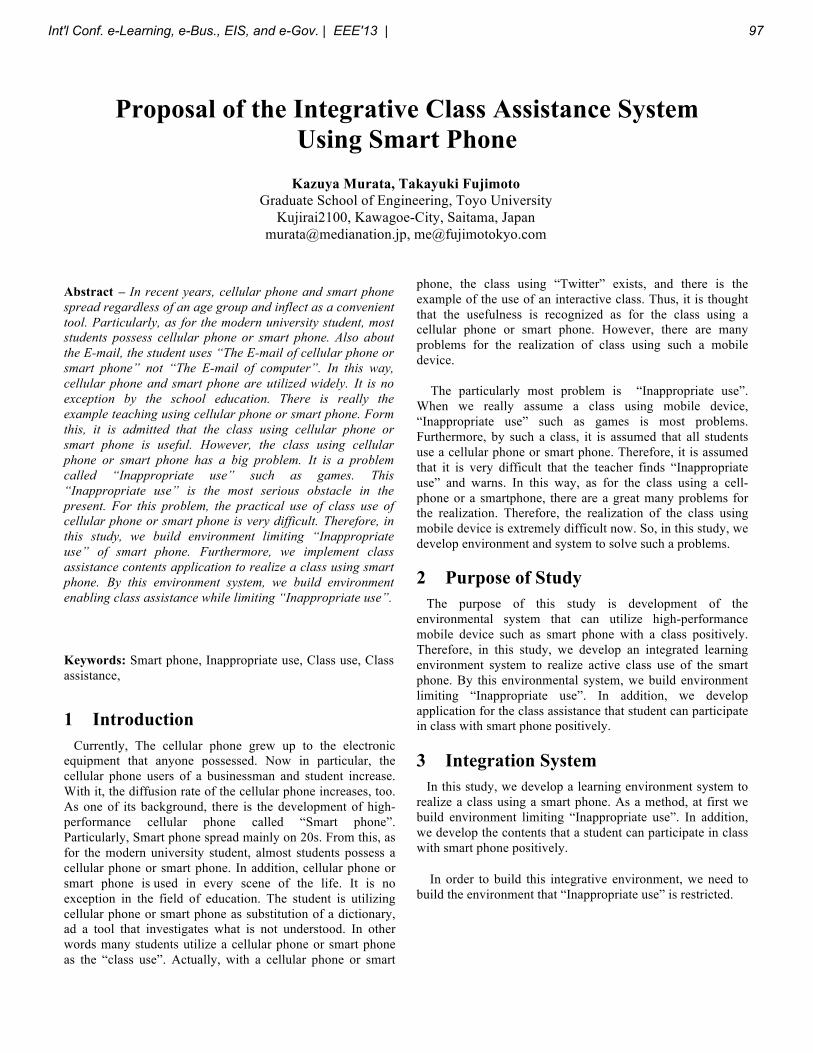
Proposal of the Integrative Class Assistance System Using Smart Phone
Kazuya Murata, Takayuki Fujimoto
Graduate School of Engineering, Toyo University Kujirai2100, Kawagoe-City, Saitama, Japan
[email protected], [email protected]
Abstract – In recent years, cellular phone and smart phone spread regardless of an age group and inflect as a convenient tool. Particularly, as for the modern university student, most students possess cellular phone or smart phone. Also about the E-mail, the student uses “The E-mail of cellular phone or smart phone” not “The E-mail of computer”. In this way, cellular phone and smart phone are utilized widely. It is no exception by the school education. There is really the example teaching using cellular phone or smart phone. Form this, it is admitted that the class using cellular phone or smart phone is useful. However, the class using cellular phone or smart phone has a big problem. It is a problem called “Inappropriate use” such as games. This “Inappropriate use” is the most serious obstacle in the present. For this problem, the practical use of class use of cellular phone or smart phone is very difficult. Therefore, in this study, we build environment limiting “Inappropriate use” of smart phone. Furthermore, we implement class assistance contents application to realize a class using smart phone. By this environment system, we build environment enabling class assistance while limiting “Inappropriate use”.
Keywords: Smart phone, Inappropriate use, Class use, Class assistance,
1 Introduction Currently, The cellular phone grew up to the electronic equipment that anyone possessed. Now in particular, the cellular phone users of a businessman and student increase. With it, the diffusion rate of the cellular phone increases, too. As one of its background, there is the development of high-performance cellular phone called “Smart phone”. Particularly, Smart phone spread mainly on 20s. From this, as for the modern university student, almost students possess a cellular phone or smart phone. In addition, cellular phone or smart phone is used in every scene of the life. It is no exception in the field of education. The student is utilizing cellular phone or smart phone as substitution of a dictionary, ad a tool that investigates what is not understood. In other words many students utilize a cellular phone or smart phone as the “class use”. Actually, with a cellular phone or smart
phone, the class using “Twitter” exists, and there is the example of the use of an interactive class. Thus, it is thought that the usefulness is recognized as for the class using a cellular phone or smart phone. However, there are many problems for the realization of class using such a mobile device. The particularly most problem is “Inappropriate use”. When we really assume a class using mobile device, “Inappropriate use” such as games is most problems. Furthermore, by such a class, it is assumed that all students use a cellular phone or smart phone. Therefore, it is assumed that it is very difficult that the teacher finds “Inappropriate use” and warns. In this way, as for the class using a cell-phone or a smartphone, there are a great many problems for the realization. Therefore, the realization of the class using mobile device is extremely difficult now. So, in this study, we develop environment and system to solve such a problems. 2 Purpose of Study The purpose of this study is development of the environmental system that can utilize high-performance mobile device such as smart phone with a class positively. Therefore, in this study, we develop an integrated learning environment system to realize active class use of the smart phone. By this environmental system, we build environment limiting “Inappropriate use”. In addition, we develop application for the class assistance that student can participate in class with smart phone positively.
3 Integration System In this study, we develop a learning environment system to realize a class using a smart phone. As a method, at first we build environment limiting “Inappropriate use”. In addition, we develop the contents that a student can participate in class with smart phone positively.
In order to build this integrative environment, we need to build the environment that “Inappropriate use” is restricted.
Int'l Conf. e-Learning, e-Bus., EIS, and e-Gov. | EEE'13 | 97
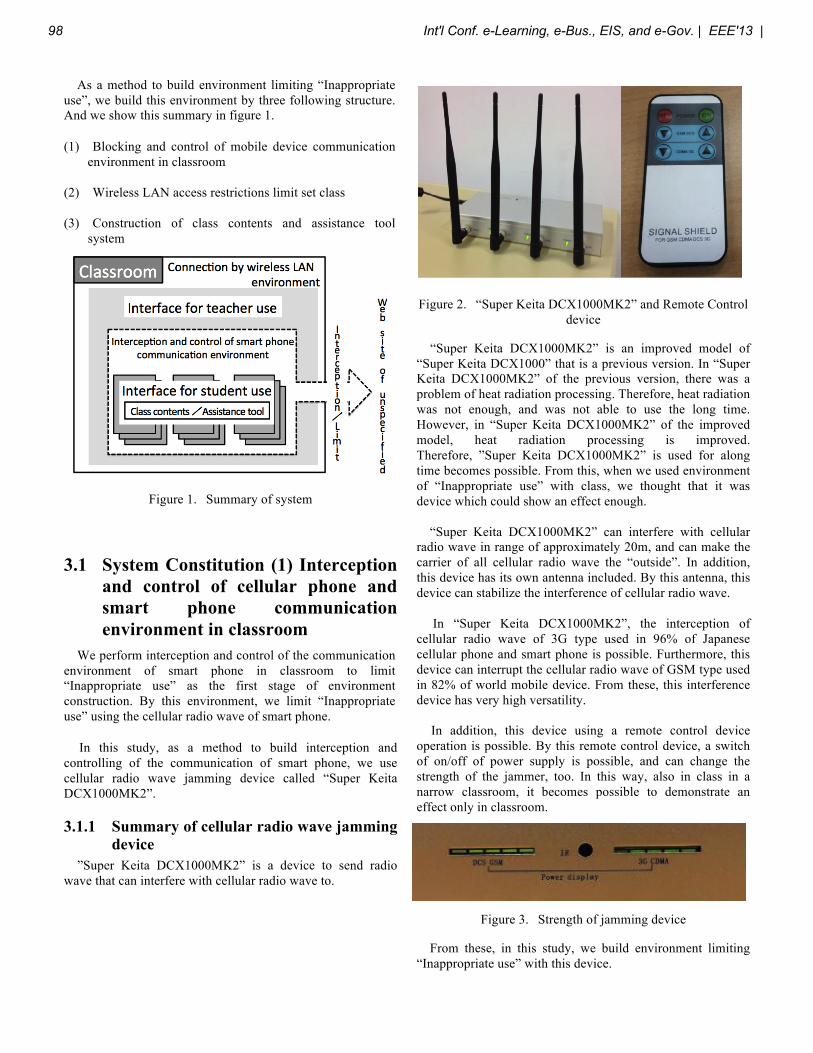
As a method to build environment limiting “Inappropriate use”, we build this environment by three following structure. And we show this summary in figure 1.
(1) Blocking and control of mobile device communication environment in classroom
(2) Wireless LAN access restrictions limit set class (3) Construction of class contents and assistance tool
system
Figure 1. Summary of system
3.1 System Constitution (1) Interception and control of cellular phone and smart phone communication environment in classroom
We perform interception and control of the communication environment of smart phone in classroom to limit “Inappropriate use” as the first stage of environment construction. By this environment, we limit “Inappropriate use” using the cellular radio wave of smart phone.
In this study, as a method to build interception and controlling of the communication of smart phone, we use cellular radio wave jamming device called “Super Keita DCX1000MK2”.
3.1.1 Summary of cellular radio wave jamming device
”Super Keita DCX1000MK2” is a device to send radio wave that can interfere with cellular radio wave to.
Figure 2. “Super Keita DCX1000MK2” and Remote Control
device
“Super Keita DCX1000MK2” is an improved model of “Super Keita DCX1000” that is a previous version. In “Super Keita DCX1000MK2” of the previous version, there was a problem of heat radiation processing. Therefore, heat radiation was not enough, and was not able to use the long time. However, in “Super Keita DCX1000MK2” of the improved model, heat radiation processing is improved. Therefore, ”Super Keita DCX1000MK2” is used for along time becomes possible. From this, when we used environment of “Inappropriate use” with class, we thought that it was device which could show an effect enough. “Super Keita DCX1000MK2” can interfere with cellular radio wave in range of approximately 20m, and can make the carrier of all cellular radio wave the “outside”. In addition, this device has its own antenna included. By this antenna, this device can stabilize the interference of cellular radio wave. In “Super Keita DCX1000MK2”, the interception of cellular radio wave of 3G type used in 96% of Japanese cellular phone and smart phone is possible. Furthermore, this device can interrupt the cellular radio wave of GSM type used in 82% of world mobile device. From these, this interference device has very high versatility. In addition, this device using a remote control device operation is possible. By this remote control device, a switch of on/off of power supply is possible, and can change the strength of the jammer, too. In this way, also in class in a narrow classroom, it becomes possible to demonstrate an effect only in classroom.
Figure 3. Strength of jamming device
From these, in this study, we build environment limiting “Inappropriate use” with this device.
98 Int'l Conf. e-Learning, e-Bus., EIS, and e-Gov. | EEE'13 |
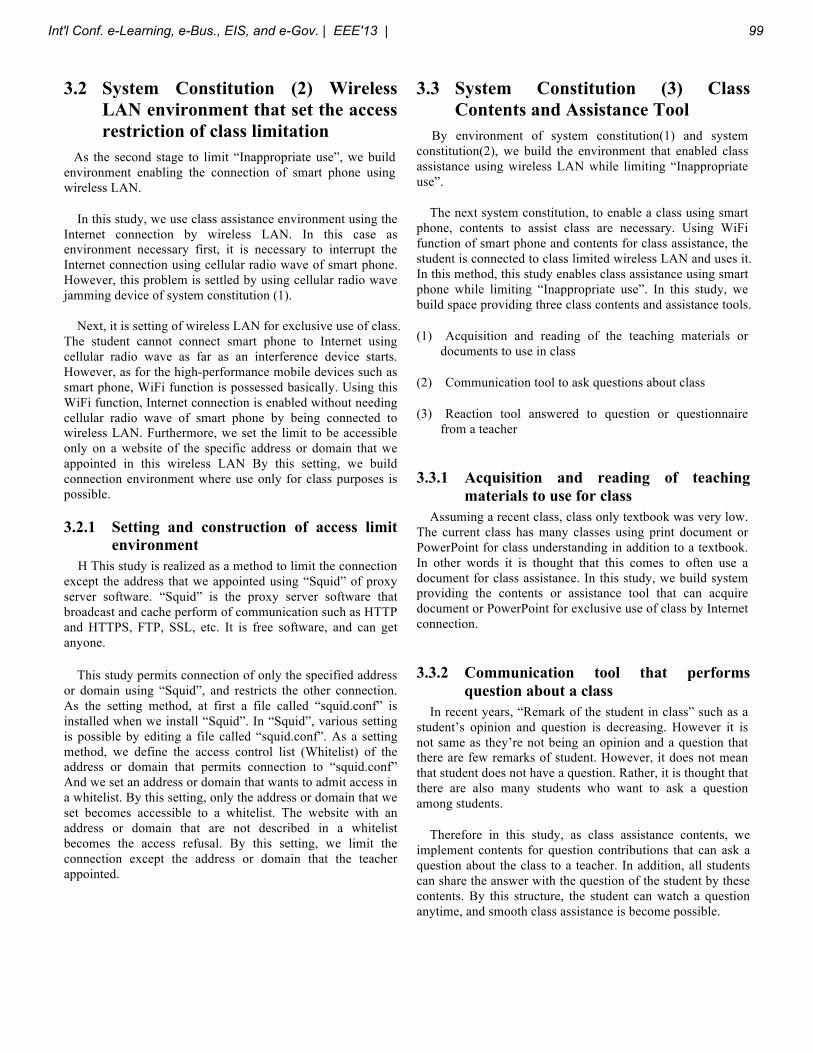
3.2 System Constitution (2) Wireless LAN environment that set the access restriction of class limitation
As the second stage to limit “Inappropriate use”, we build environment enabling the connection of smart phone using wireless LAN.
In this study, we use class assistance environment using the Internet connection by wireless LAN. In this case as environment necessary first, it is necessary to interrupt the Internet connection using cellular radio wave of smart phone. However, this problem is settled by using cellular radio wave jamming device of system constitution (1). Next, it is setting of wireless LAN for exclusive use of class. The student cannot connect smart phone to Internet using cellular radio wave as far as an interference device starts. However, as for the high-performance mobile devices such as smart phone, WiFi function is possessed basically. Using this WiFi function, Internet connection is enabled without needing cellular radio wave of smart phone by being connected to wireless LAN. Furthermore, we set the limit to be accessible only on a website of the specific address or domain that we appointed in this wireless LAN By this setting, we build connection environment where use only for class purposes is possible.
3.2.1 Setting and construction of access limit environment
H This study is realized as a method to limit the connection except the address that we appointed using “Squid” of proxy server software. “Squid” is the proxy server software that broadcast and cache perform of communication such as HTTP and HTTPS, FTP, SSL, etc. It is free software, and can get anyone. This study permits connection of only the specified address or domain using “Squid”, and restricts the other connection. As the setting method, at first a file called “squid.conf” is installed when we install “Squid”. In “Squid”, various setting is possible by editing a file called “squid.conf”. As a setting method, we define the access control list (Whitelist) of the address or domain that permits connection to “squid.conf” And we set an address or domain that wants to admit access in a whitelist. By this setting, only the address or domain that we set becomes accessible to a whitelist. The website with an address or domain that are not described in a whitelist becomes the access refusal. By this setting, we limit the connection except the address or domain that the teacher appointed.
3.3 System Constitution (3) Class Contents and Assistance Tool
By environment of system constitution(1) and system constitution(2), we build the environment that enabled class assistance using wireless LAN while limiting “Inappropriate use”.
The next system constitution, to enable a class using smart phone, contents to assist class are necessary. Using WiFi function of smart phone and contents for class assistance, the student is connected to class limited wireless LAN and uses it. In this method, this study enables class assistance using smart phone while limiting “Inappropriate use”. In this study, we build space providing three class contents and assistance tools.
(1) Acquisition and reading of the teaching materials or documents to use in class
(2) Communication tool to ask questions about class
(3) Reaction tool answered to question or questionnaire from a teacher
3.3.1 Acquisition and reading of teaching materials to use for class
Assuming a recent class, class only textbook was very low. The current class has many classes using print document or PowerPoint for class understanding in addition to a textbook. In other words it is thought that this comes to often use a document for class assistance. In this study, we build system providing the contents or assistance tool that can acquire document or PowerPoint for exclusive use of class by Internet connection.
3.3.2 Communication tool that performs question about a class
In recent years, “Remark of the student in class” such as a student’s opinion and question is decreasing. However it is not same as they’re not being an opinion and a question that there are few remarks of student. However, it does not mean that student does not have a question. Rather, it is thought that there are also many students who want to ask a question among students.
Therefore in this study, as class assistance contents, we implement contents for question contributions that can ask a question about the class to a teacher. In addition, all students can share the answer with the question of the student by these contents. By this structure, the student can watch a question anytime, and smooth class assistance is become possible.
Int'l Conf. e-Learning, e-Bus., EIS, and e-Gov. | EEE'13 | 99
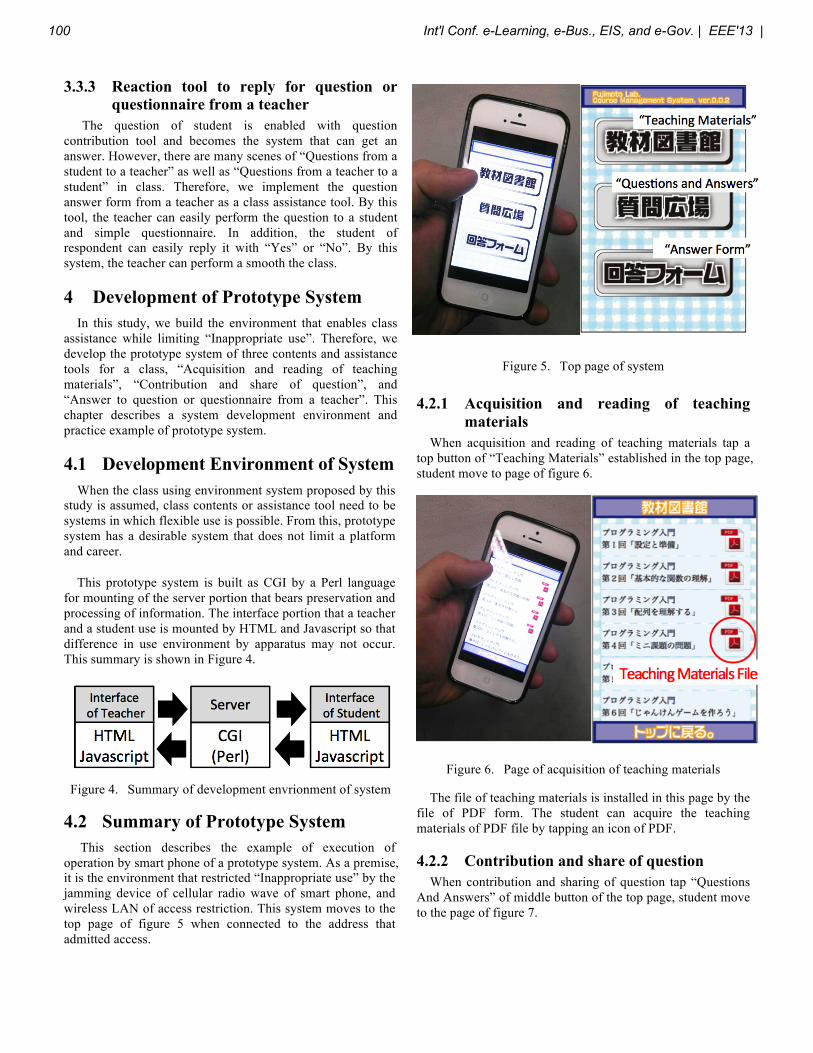
3.3.3 Reaction tool to reply for question or questionnaire from a teacher
The question of student is enabled with question contribution tool and becomes the system that can get an answer. However, there are many scenes of “Questions from a student to a teacher” as well as “Questions from a teacher to a student” in class. Therefore, we implement the question answer form from a teacher as a class assistance tool. By this tool, the teacher can easily perform the question to a student and simple questionnaire. In addition, the student of respondent can easily reply it with “Yes” or “No”. By this system, the teacher can perform a smooth the class. 4 Development of Prototype System In this study, we build the environment that enables class assistance while limiting “Inappropriate use”. Therefore, we develop the prototype system of three contents and assistance tools for a class, “Acquisition and reading of teaching materials”, “Contribution and share of question”, and “Answer to question or questionnaire from a teacher”. This chapter describes a system development environment and practice example of prototype system. 4.1 Development Environment of System When the class using environment system proposed by this study is assumed, class contents or assistance tool need to be systems in which flexible use is possible. From this, prototype system has a desirable system that does not limit a platform and career.
This prototype system is built as CGI by a Perl language for mounting of the server portion that bears preservation and processing of information. The interface portion that a teacher and a student use is mounted by HTML and Javascript so that difference in use environment by apparatus may not occur. This summary is shown in Figure 4.
Figure 4. Summary of development envrionment of system
4.2 Summary of Prototype System This section describes the example of execution of operation by smart phone of a prototype system. As a premise, it is the environment that restricted “Inappropriate use” by the jamming device of cellular radio wave of smart phone, and wireless LAN of access restriction. This system moves to the top page of figure 5 when connected to the address that admitted access.
Figure 5. Top page of system
4.2.1 Acquisition and reading of teaching
materials When acquisition and reading of teaching materials tap a top button of “Teaching Materials” established in the top page, student move to page of figure 6.
Figure 6. Page of acquisition of teaching materials
The file of teaching materials is installed in this page by the file of PDF form. The student can acquire the teaching materials of PDF file by tapping an icon of PDF.
4.2.2 Contribution and share of question When contribution and sharing of question tap “Questions And Answers” of middle button of the top page, student move to the page of figure 7.
100 Int'l Conf. e-Learning, e-Bus., EIS, and e-Gov. | EEE'13 |
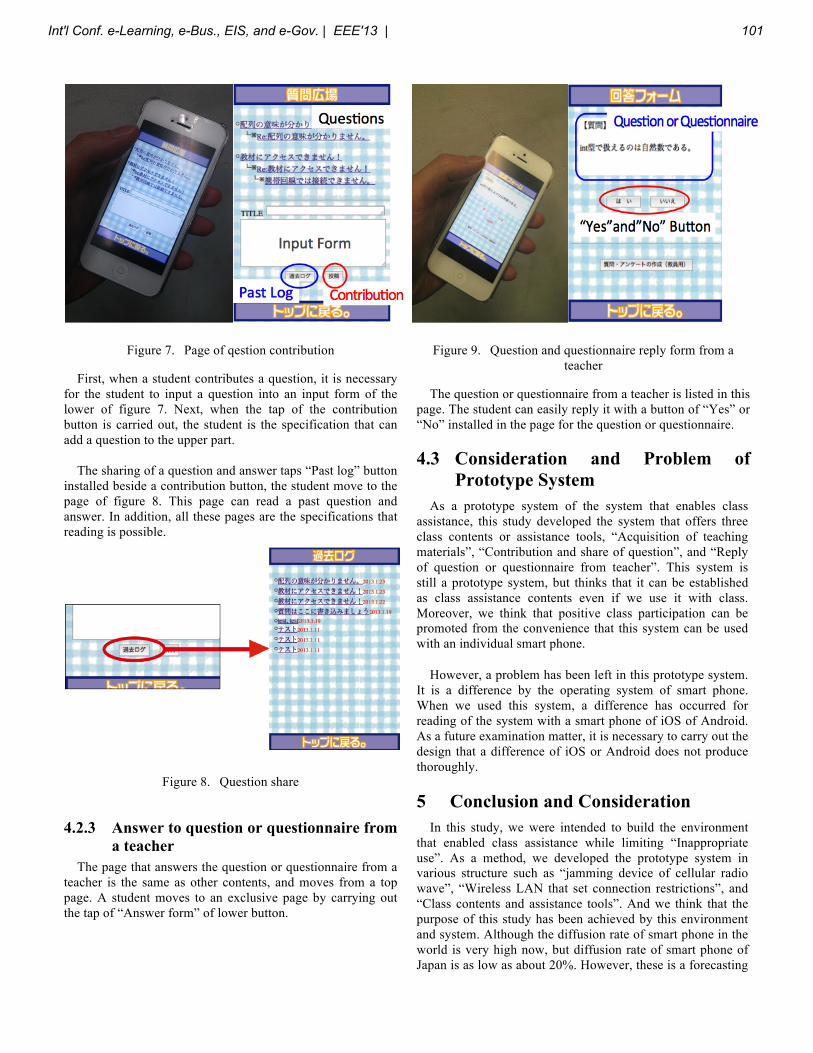
Figure 7. Page of qestion contribution
First, when a student contributes a question, it is necessary for the student to input a question into an input form of the lower of figure 7. Next, when the tap of the contribution button is carried out, the student is the specification that can add a question to the upper part. The sharing of a question and answer taps “Past log” button installed beside a contribution button, the student move to the page of figure 8. This page can read a past question and answer. In addition, all these pages are the specifications that reading is possible.
Figure 8. Question share
4.2.3 Answer to question or questionnaire from a teacher
The page that answers the question or questionnaire from a teacher is the same as other contents, and moves from a top page. A student moves to an exclusive page by carrying out the tap of “Answer form” of lower button.
Figure 9. Question and questionnaire reply form from a teacher
The question or questionnaire from a teacher is listed in this page. The student can easily reply it with a button of “Yes” or “No” installed in the page for the question or questionnaire. 4.3 Consideration and Problem of
Prototype System As a prototype system of the system that enables class assistance, this study developed the system that offers three class contents or assistance tools, “Acquisition of teaching materials”, “Contribution and share of question”, and “Reply of question or questionnaire from teacher”. This system is still a prototype system, but thinks that it can be established as class assistance contents even if we use it with class. Moreover, we think that positive class participation can be promoted from the convenience that this system can be used with an individual smart phone.
However, a problem has been left in this prototype system. It is a difference by the operating system of smart phone. When we used this system, a difference has occurred for reading of the system with a smart phone of iOS of Android. As a future examination matter, it is necessary to carry out the design that a difference of iOS or Android does not produce thoroughly.
5 Conclusion and Consideration In this study, we were intended to build the environment that enabled class assistance while limiting “Inappropriate use”. As a method, we developed the prototype system in various structure such as “jamming device of cellular radio wave”, “Wireless LAN that set connection restrictions”, and “Class contents and assistance tools”. And we think that the purpose of this study has been achieved by this environment and system. Although the diffusion rate of smart phone in the world is very high now, but diffusion rate of smart phone of Japan is as low as about 20%. However, these is a forecasting
Int'l Conf. e-Learning, e-Bus., EIS, and e-Gov. | EEE'13 | 101
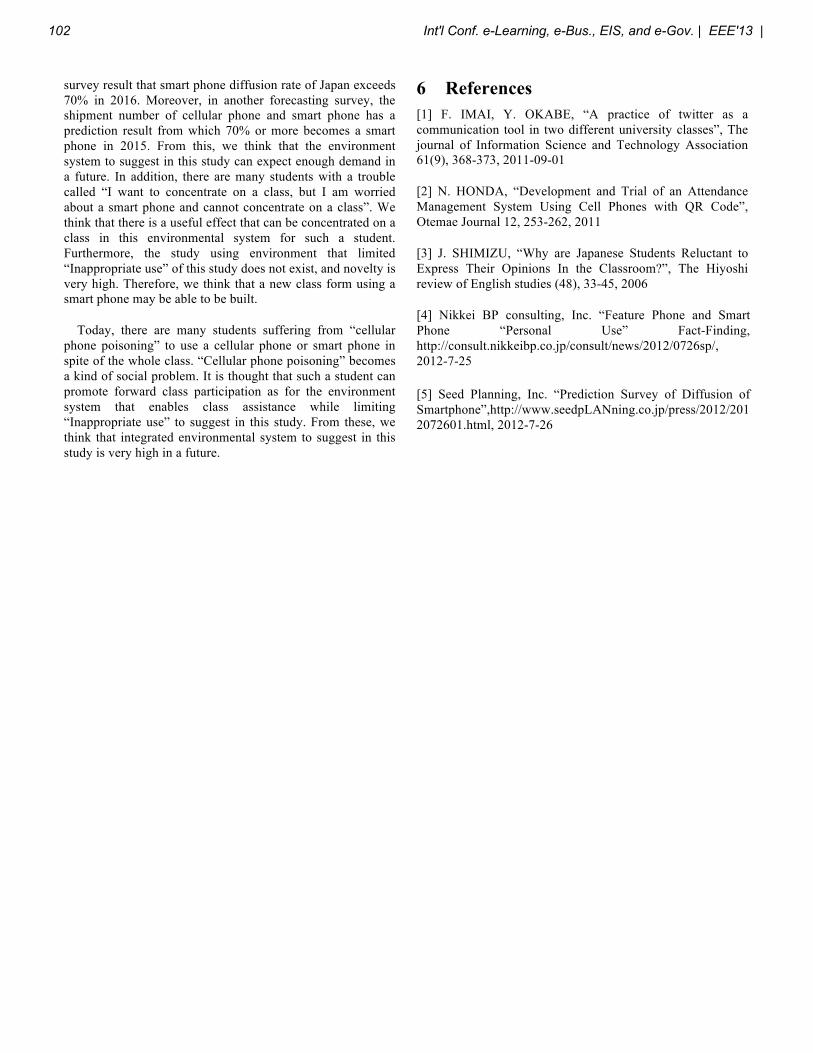
survey result that smart phone diffusion rate of Japan exceeds 70% in 2016. Moreover, in another forecasting survey, the shipment number of cellular phone and smart phone has a prediction result from which 70% or more becomes a smart phone in 2015. From this, we think that the environment system to suggest in this study can expect enough demand in a future. In addition, there are many students with a trouble called “I want to concentrate on a class, but I am worried about a smart phone and cannot concentrate on a class”. We think that there is a useful effect that can be concentrated on a class in this environmental system for such a student. Furthermore, the study using environment that limited “Inappropriate use” of this study does not exist, and novelty is very high. Therefore, we think that a new class form using a smart phone may be able to be built.
Today, there are many students suffering from “cellular phone poisoning” to use a cellular phone or smart phone in spite of the whole class. “Cellular phone poisoning” becomes a kind of social problem. It is thought that such a student can promote forward class participation as for the environment system that enables class assistance while limiting “Inappropriate use” to suggest in this study. From these, we think that integrated environmental system to suggest in this study is very high in a future.
6 References [1] F. IMAI, Y. OKABE, “A practice of twitter as a communication tool in two different university classes”, The journal of Information Science and Technology Association 61(9), 368-373, 2011-09-01
[2] N. HONDA, “Development and Trial of an Attendance Management System Using Cell Phones with QR Code”, Otemae Journal 12, 253-262, 2011
[3] J. SHIMIZU, “Why are Japanese Students Reluctant to Express Their Opinions In the Classroom?”, The Hiyoshi review of English studies (48), 33-45, 2006
[4] Nikkei BP consulting, Inc. “Feature Phone and Smart Phone “Personal Use” Fact-Finding, http://consult.nikkeibp.co.jp/consult/news/2012/0726sp/, 2012-7-25 [5] Seed Planning, Inc. “Prediction Survey of Diffusion of Smartphone”,http://www.seedpLANning.co.jp/press/2012/2012072601.html, 2012-7-26
102 Int'l Conf. e-Learning, e-Bus., EIS, and e-Gov. | EEE'13 |
Integration of Massive Open Online Education
(MOOC) System with in-Classroom Interaction and
Assessment and Accreditation: An extensive report
from a pilot study
A. I. Maria Joseph 1, B. Asoke Nath
2
1,2Department of Computer Science, St. Xavier’s College (Autonomous), Kolkata, India
e-mail: [email protected], [email protected]
Abstract : The advent of Massive Open Online Course
(MOOC) in the arena of online education in the recent
years has catapulted several novel ventures, both
commercial and non-commercial, offering access to
quality online courses at higher education level.
MOOC, by its very definition, throws open the door of
knowledge to any motivated individual learners anytime
and anywhere for free, but having no formal
accreditation attached to it. The new MOOC wave into
the sea of higher education has obviously attracted an
incredible number of individual learners in tens of
thousands globally. Contrary to the notion of MOOC
courses having no formal accreditation, the authors
propose a clear purpose of participation and
accreditation by transferring ‘credits’ of successful
students towards completion of undergraduate degree
program. This paper explores a possibility of
integrating Winter 2013 DB Course, a MOOC course
by Stanford University, for a group of students within a
formal higher education institution in India combining
classroom interaction, proctored evaluation of this
online course and a clear purpose of transfer of credits
towards completion of the home institution’s “An
Introduction to Database Management System Course”.
This paper presents a study of this experiment and its
opportunities and challenges, and suggests
recommendations for its effective implementation in the
future.
Key Words: Massive Open Online Education (MOOC),
Open Educational Resources (OER), Technology Enabled
Teaching Learning, academic credentialing, Blended learning
1. Introduction
Modern digital and web technologies have opened up a
plethora of revolutionary opportunities to enhance online
teaching and learning experience. They redefine the domain
of higher education. These developments have spawned
new online ‘disruptive’ models to educate large number
of students at college degree levels at no cost. One such
disruptive model is Massive Open Online Course
(MOOC), not so surprisingly termed by Forbes as the
“Next Big Profitable Thing – the $1 Trillion
Opportunity”[2], which has a huge potential to usher in
new learning models, methods, and learners as a
significant change agent in the current traditional
education system. A survey by Babson Survey
Research Group, Massachusetts, USA, in 2012, reveals
the rate of growth in online education is significantly
increased by ten times as against the 2 per cent growth
rate in the overall all higher education student
population. The survey further indicates that in USA
alone over 6.7 million students are taking at least one
online course as compared to previous year and 65 per
cent of higher education institutions view that online
learning is a critical part of their long term strategy[2].
This online revolution can benefit people who had
previously no access to quality higher education at low
cost. Interestingly, it is observed that almost one third of
these massive online students are from non-US
countries such as India, China and Brazil [9,10,16].
MOOC’s amazing features are the large enrolment of
thousands of motivated global learners, its efforts to
make available free academic courses, and its
scalability[9,13]. Though there is a huge rush in tens of
thousands of people registering for MOOCs, the
completion rate is rather dismal to mere 10 or less per
cent.[9,10,13,22]. Though there are various factors
contributing to this ‘low’ result, lack of time and formal
accreditation as incentive for completion of MOOC
courses are cited excuses [7]. In this context one of the
authors (MJ) blended, on an experimental basis, the
Stanford’s Winter 2013 DB Course with campus
classroom instruction in St., Xavier’s College, Kolkata,
with a clear purpose of deeper participation and
transferring of credits towards the completion of a
course titled “An Introduction to Database Management
System” As part of this pilot study, the author(MJ)
conducted key quizzes, assignment and exams of this
MOOC course together with home institution’s required
exams in a proctored manner ensuring authenticity of
Int'l Conf. e-Learning, e-Bus., EIS, and e-Gov. | EEE'13 | 103

students engaged in online learning which is one of the
key contentions related to MOOC courses [9,16]. This
paper presents the pilot study and its opportunities and
challenges. This paper first introduces the concept of
MOOC and its characteristics, then explores related
works implementing a hybrid model using MOOC, then
highlights the details of pilot study and its opportunities
and challenges, and finally draws conclusion and future
scope.
2. Overview of Massive Open Online
Education (MOOC)
The term MOOC stands for Massive Open Online
Course. Massive refers to scale giving opportunity for
connections among participants, Open doesn’t mean
just free but refers to open access, open syllabi and self-
directed learning outcomes, Online points to making
materials available on internet in abundance, and
Course referring to structure of the online course[22,
Dave Cromier in an MOOC and Business Plan
discussion]. In other words, it is meant to “integrate the
connectivity of social networking, the facilitation of an
acknowledged expert in a field of study, and a collection
of freely accessible online resources” [22]. A key
characteristics of a MOOC is flexibility so that students
can choose their level of participation in an “a la carte”
manner without fees and any prerequisites other than
internet access and interest, no predefined expectations
for participation including no formal
accreditation”[9,22].
The first MOOC was a course on “Connectivism and
Connective Knowledge(CCK08)” in 2008 by George
Siemens and Stephen Downes and is distinguished
from other MOOCs as cMOOC. cMOOC means
Connectivist-MOOC emphasizing on its distributed
participatory networked learning [13,22, 23]. As
MOOC is transitioning from “free education resources”
to “scalable free courses” [9], many popular higher
education institution ventured into MOOC such as MIT,
Harvard, Stanford, UC Berkeley Princeton, University
of Pennsylvania, Duke University, to name a few.
MITx, edX (a joint initiative of MIT and Harvard),
Coursera, Udacity and Udemy are platforms whose
courses are termed as xMOOC. It provides typical
instruction oriented online courses. Some of the other
prominent MOOCs offered by Stanford faculty in fall
2011-courses were in Artificial Intelligence, Databases
and Machine Learning. These trio courses attracted
several hundreds of thousands of students crossing
300,000 together[10,32, 33].
It is further classified as network-based, Task-based and
Content-based[21]. Network-based relies on
connectivist-style methods of connection, constructing
knowledge distributed on the open web platforms.
While Task-based MOOCs focus on developing skills
by emphasizing on completion of a set of outlined
activities, Content-based MOOCs, offered by big
universities and non/commercial entities for a large
number of students with automated testing with a goal
of acquisition of specific content.
As there are a large number of students taking MOOCs,
there are varieties of student archetypes as well. They
could be broadly categorized into four major
types[7,17]. First, “lurkers/indifferent students” – they
do not engage with others. Most of these students are
registered with MOOC just to observe and watch a few
videos and learning materials. Second, “passive
students”- they view the course as a source of
information and are expected ‘to be taught’ as in
traditional in-classroom model and do not actively
participate in activities such as class / forum
discussions. Third, “partially engaged /Drop-In
students” - they are interested in specific topics and
direct most of their active participation within the
course for that topic and do not complete the course.
Fourth, “active/memorably engaged students”- set
goals for themselves, get connected with others, peer
grade others works and get engaged with materials in
personal learning network especially using social media
such as discussion forums, blogs, twitter, flickr,
YouTube, etc.
However these archetypes are not static. Students may
move from one to the other within a course or change
over time from being passive to active participants or
drop out and leave the course. Therefore, level and
completion of MOOC courses largely depends on their
motivation level, self-discipline and learning styles.
There is no external pressure on them to complete
courses. So the rate of completion of MOOC courses is
at 10 per cent or less [10]. Some cited reasons include
lack of time and other commitments in life, but
importantly lack of incentives or recognition in terms of
certificates and employment opportunities on
completion [7].
The authors are concerned that all students should be
encouraged to stay active at least through the entire
duration of course by incorporating it within one’s
classroom environment as well as to integrate it within
its assessment and grading system of the home
institution. An experiment was carried out to test this
idea into formal teaching-learning environment and is
described in the following sections.
104 Int'l Conf. e-Learning, e-Bus., EIS, and e-Gov. | EEE'13 |

3. Some similar work as MOOC :
MOOC, by its definition, charges no fee and offers no
certificates. Departing from this position, since the first
ever MOOC was offered, it was informally practiced
that a higher education institution which offers MOOCs
is free to accept the credits of its successful students
enrolled in a MOOC course. The first instance took
place in the University of Manitoba, Canada, for 25 of
its students enrolled in the CCK08 facilitated by George
Siemens and Stephen Downes[22]. But it was also
reported that a higher education institute which was not
an organiser of a MOOC Course evaluated and accepted
the credits of one of its student who took CCK08 [15].
Similarly the University of Freiburg, Germany, accepted
credits of successful students of Stanford’s CS221
Artificial Intelligence course and transferred the credits
towards the completion of its course on Artificial
Intelligence at the Department of Computer Science of
the same university, after its own internal evaluation of
its students [35]. The University of Helsinki, Finland,
used the credits of a MOOC Course offered by itself, as
part of admission process in their university in 2012 by
acknowledging formal credits of CS1 Computer Science
Course and admitting them into their own
university[35].
In another interesting development in March 2012,
Tony Hyun Kim[29] integrated edX’s online materials
with face-to-face teaching for a group of 20 teenagers in
Ulan Bator, the capital of Mongolia, who were a tiny
part of a huge 155,000 participants from 160 countries
mainly from the US, India, UK, Columbia, Spain,
Pakistan, Canada, Brazil, Greece and Mexico. The
course was MIT’s 6.002x on “Circuits and Electronics”
and the results were amazing. Of these 20 students, 12
earned certificates of completion and 1 fifteen year old
teen aced the course, that was, one of 320 students
worldwide.
In a major variation from the traditional practices of
credentialing of MOOC courses, in September 2012,
edX[28] announced that students enrolled in its MOOC
courses will have a choice of getting their learning
validated with a proctored final exam administered by a
third party. edX has named Pearson VUE Service for
this purpose. This third party will charge a nominal fee
for final academic evaluation service. However there is
no evidence as to whether it is implemented. In yet
another milestone move in the U.S., Colorado State
University-Global Campus[24] has announced that it
will transfer academic credits towards completion of a
Bachelor’s degree at the Global Campus for a Udacity
course on “Introduction to Computer Science: Building
a Search Engine”. Apart from this, several universities
in Austria and Germany[24] such as the University of
Salzburg, the University of Freiburg, the Free
University of Berlin, and the Technical University of
Munich, have begun implementing transfer of credits
for courses offered by Udacity. It should be noted that
Udacity charges a nominal fee per course for issuing a
certificate of completion which could be used in some
of these universities for transfer of credits towards
Bachelor degree[24].
The novelty of this pilot study is to make another leap
towards integrating free quality online courses offered
by xMOOC platforms into the academic system of
traditional Universities and Colleges which will
facilitate the evaluation and acceptance of such credits
of their successful students within the home institution.
This paper evaluates such an attempt in the next section
of the paper.
3.1 The context and rationale of pilot study
The structure and method of offering MOOC could
really benefit students learning in difficult situations
where there is no access to consistent high quality
higher education due to lack of qualified faculty,
infrastructure and academic facilities, and high cost of
higher education. This is a typical situation in the
developing world. There is greater need for quality
higher education in the developing world. Therefore it is
obvious that one third of student population of many of
the popular courses of MITx, edX, Udacity and
Coursera, is from the developing world[16]. As against
this reception of MOOC, there is a strong criticism on
the low completion rate and the negative perception of
the media hype about MOOC. In an interesting survey
of 103 professors who taught a MOOC by the
Chronicle of Higher Education[18] in March 2013,
indicate only 28 per cent believe that students who
succeed in their MOOC deserve a formal credit from
their home institutions though 79 per cent believe that
MOOC is ‘worth the hype’. In a similar survey of Chief
Academic Officers by Babson Survey Research
Group[2], the recent estimate in 2012 stands at 30 per
cent “accept the value and legitimacy of online
education”
It is in this context, the authors propose to approach
MOOC, not as a replacement of traditional in-class
instruction, but rather to integrate selectively those
courses which are in line with the academic courses of
home institutions which are not organisers of any
MOOC. This pilot study attempts to test the following
research questions:
Int'l Conf. e-Learning, e-Bus., EIS, and e-Gov. | EEE'13 | 105
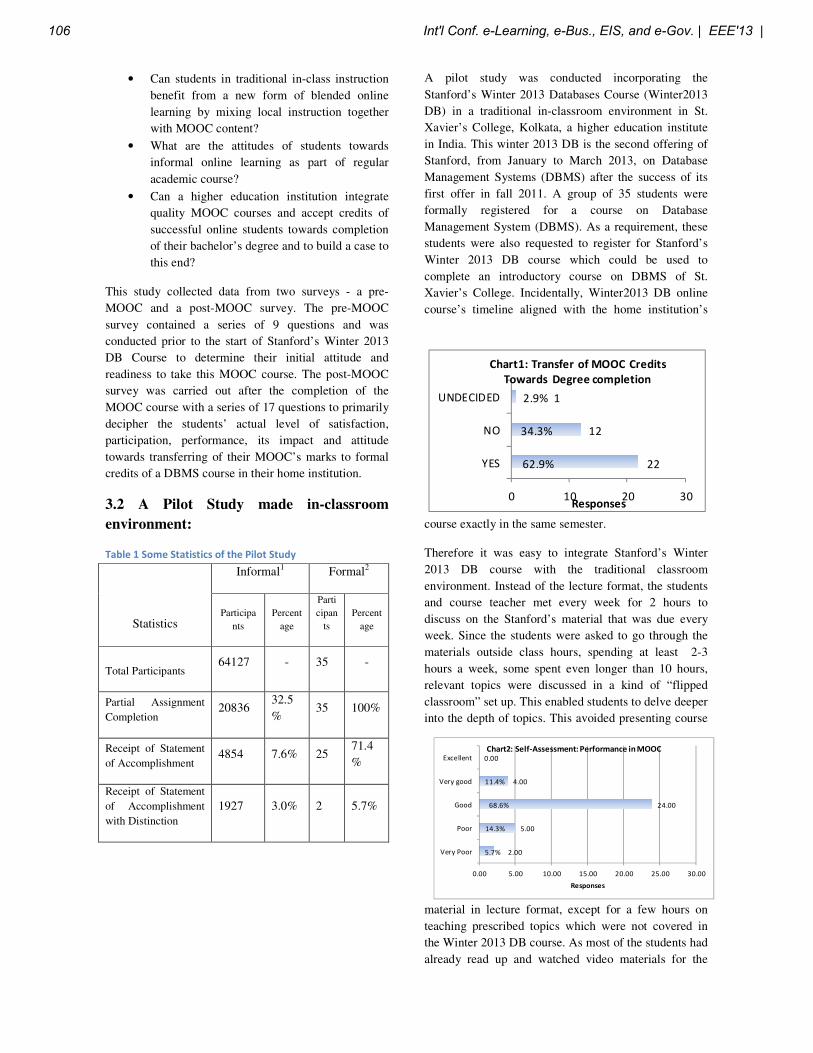
• Can students in traditional in-class instruction
benefit from a new form of blended online
learning by mixing local instruction together
with MOOC content?
• What are the attitudes of students towards
informal online learning as part of regular
academic course?
• Can a higher education institution integrate
quality MOOC courses and accept credits of
successful online students towards completion
of their bachelor’s degree and to build a case to
this end?
This study collected data from two surveys - a pre-
MOOC and a post-MOOC survey. The pre-MOOC
survey contained a series of 9 questions and was
conducted prior to the start of Stanford’s Winter 2013
DB Course to determine their initial attitude and
readiness to take this MOOC course. The post-MOOC
survey was carried out after the completion of the
MOOC course with a series of 17 questions to primarily
decipher the students’ actual level of satisfaction,
participation, performance, its impact and attitude
towards transferring of their MOOC’s marks to formal
credits of a DBMS course in their home institution.
3.2 A Pilot Study made in-classroom
environment:
Table 1 Some Statistics of the Pilot Study
A pilot study was conducted incorporating the
Stanford’s Winter 2013 Databases Course (Winter2013
DB) in a traditional in-classroom environment in St.
Xavier’s College, Kolkata, a higher education institute
in India. This winter 2013 DB is the second offering of
Stanford, from January to March 2013, on Database
Management Systems (DBMS) after the success of its
first offer in fall 2011. A group of 35 students were
formally registered for a course on Database
Management System (DBMS). As a requirement, these
students were also requested to register for Stanford’s
Winter 2013 DB course which could be used to
complete an introductory course on DBMS of St.
Xavier’s College. Incidentally, Winter2013 DB online
course’s timeline aligned with the home institution’s
course exactly in the same semester.
Therefore it was easy to integrate Stanford’s Winter
2013 DB course with the traditional classroom
environment. Instead of the lecture format, the students
and course teacher met every week for 2 hours to
discuss on the Stanford’s material that was due every
week. Since the students were asked to go through the
materials outside class hours, spending at least 2-3
hours a week, some spent even longer than 10 hours,
relevant topics were discussed in a kind of “flipped
classroom” set up. This enabled students to delve deeper
into the depth of topics. This avoided presenting course
material in lecture format, except for a few hours on
teaching prescribed topics which were not covered in
the Winter 2013 DB course. As most of the students had
already read up and watched video materials for the
Informal1 Formal2
Statistics Participa
nts
Percent
age
Parti
cipan
ts
Percent
age
Total Participants 64127 - 35 -
Partial Assignment
Completion 20836
32.5
% 35 100%
Receipt of Statement
of Accomplishment 4854 7.6% 25
71.4
%
Receipt of Statement
of Accomplishment
with Distinction
1927 3.0% 2 5.7%
22
12
1
62.9%
34.3%
2.9%
0 10 20 30
YES
NO
UNDECIDED
Responses
Chart1: Transfer of MOOC Credits
Towards Degree completion
2.00
5.00
24.00
4.00
0.00
5.7%
14.3%
68.6%
11.4%
0.00 5.00 10.00 15.00 20.00 25.00 30.00
Very Poor
Poor
Good
Very good
Excellent
Responses
Chart2: Self-Assessment: Performance in MOOC
106 Int'l Conf. e-Learning, e-Bus., EIS, and e-Gov. | EEE'13 |
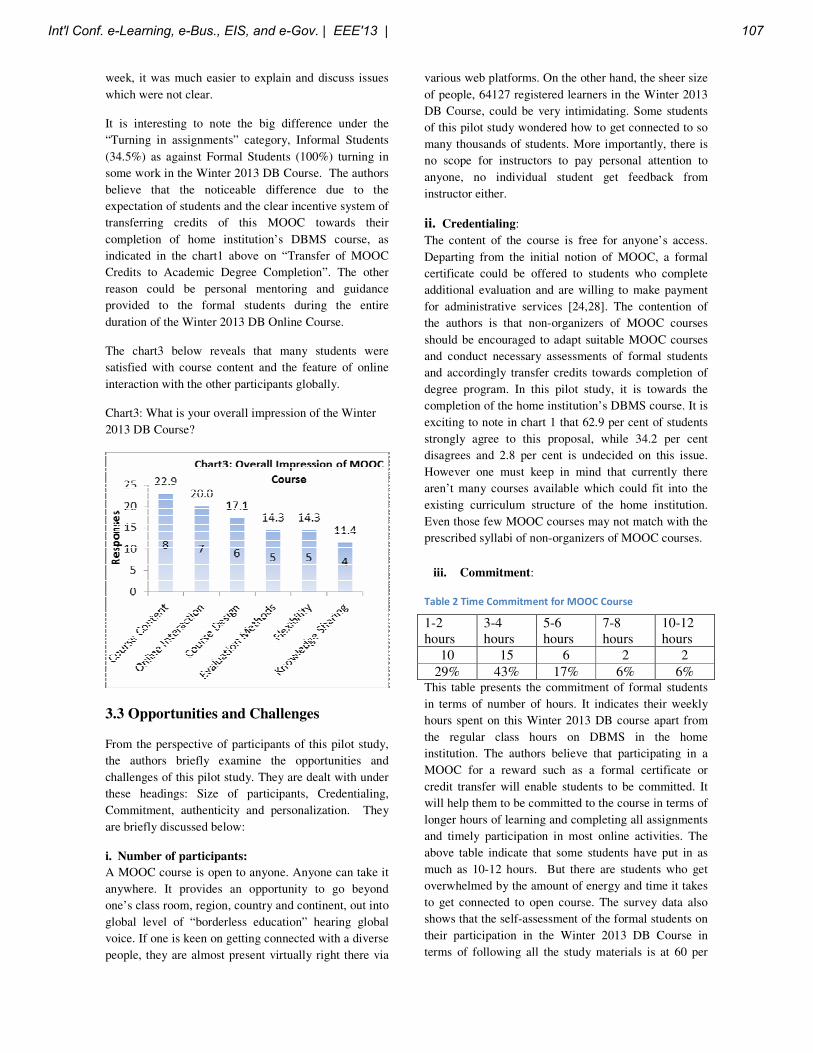
week, it was much easier to explain and discuss issues
which were not clear.
It is interesting to note the big difference under the
“Turning in assignments” category, Informal Students
(34.5%) as against Formal Students (100%) turning in
some work in the Winter 2013 DB Course. The authors
believe that the noticeable difference due to the
expectation of students and the clear incentive system of
transferring credits of this MOOC towards their
completion of home institution’s DBMS course, as
indicated in the chart1 above on “Transfer of MOOC
Credits to Academic Degree Completion”. The other
reason could be personal mentoring and guidance
provided to the formal students during the entire
duration of the Winter 2013 DB Online Course.
The chart3 below reveals that many students were
satisfied with course content and the feature of online
interaction with the other participants globally.
Chart3: What is your overall impression of the Winter
2013 DB Course?
3.3 Opportunities and Challenges
From the perspective of participants of this pilot study,
the authors briefly examine the opportunities and
challenges of this pilot study. They are dealt with under
these headings: Size of participants, Credentialing,
Commitment, authenticity and personalization. They
are briefly discussed below:
i. Number of participants:
A MOOC course is open to anyone. Anyone can take it
anywhere. It provides an opportunity to go beyond
one’s class room, region, country and continent, out into
global level of “borderless education” hearing global
voice. If one is keen on getting connected with a diverse
people, they are almost present virtually right there via
various web platforms. On the other hand, the sheer size
of people, 64127 registered learners in the Winter 2013
DB Course, could be very intimidating. Some students
of this pilot study wondered how to get connected to so
many thousands of students. More importantly, there is
no scope for instructors to pay personal attention to
anyone, no individual student get feedback from
instructor either.
ii. Credentialing:
The content of the course is free for anyone’s access.
Departing from the initial notion of MOOC, a formal
certificate could be offered to students who complete
additional evaluation and are willing to make payment
for administrative services [24,28]. The contention of
the authors is that non-organizers of MOOC courses
should be encouraged to adapt suitable MOOC courses
and conduct necessary assessments of formal students
and accordingly transfer credits towards completion of
degree program. In this pilot study, it is towards the
completion of the home institution’s DBMS course. It is
exciting to note in chart 1 that 62.9 per cent of students
strongly agree to this proposal, while 34.2 per cent
disagrees and 2.8 per cent is undecided on this issue.
However one must keep in mind that currently there
aren’t many courses available which could fit into the
existing curriculum structure of the home institution.
Even those few MOOC courses may not match with the
prescribed syllabi of non-organizers of MOOC courses.
iii. Commitment:
Table 2 Time Commitment for MOOC Course
This table presents the commitment of formal students
in terms of number of hours. It indicates their weekly
hours spent on this Winter 2013 DB course apart from
the regular class hours on DBMS in the home
institution. The authors believe that participating in a
MOOC for a reward such as a formal certificate or
credit transfer will enable students to be committed. It
will help them to be committed to the course in terms of
longer hours of learning and completing all assignments
and timely participation in most online activities. The
above table indicate that some students have put in as
much as 10-12 hours. But there are students who get
overwhelmed by the amount of energy and time it takes
to get connected to open course. The survey data also
shows that the self-assessment of the formal students on
their participation in the Winter 2013 DB Course in
terms of following all the study materials is at 60 per
1-2 hours
3-4 hours
5-6 hours
7-8 hours
10-12 hours
10 15 6 2 2
29% 43% 17% 6% 6%
Int'l Conf. e-Learning, e-Bus., EIS, and e-Gov. | EEE'13 | 107
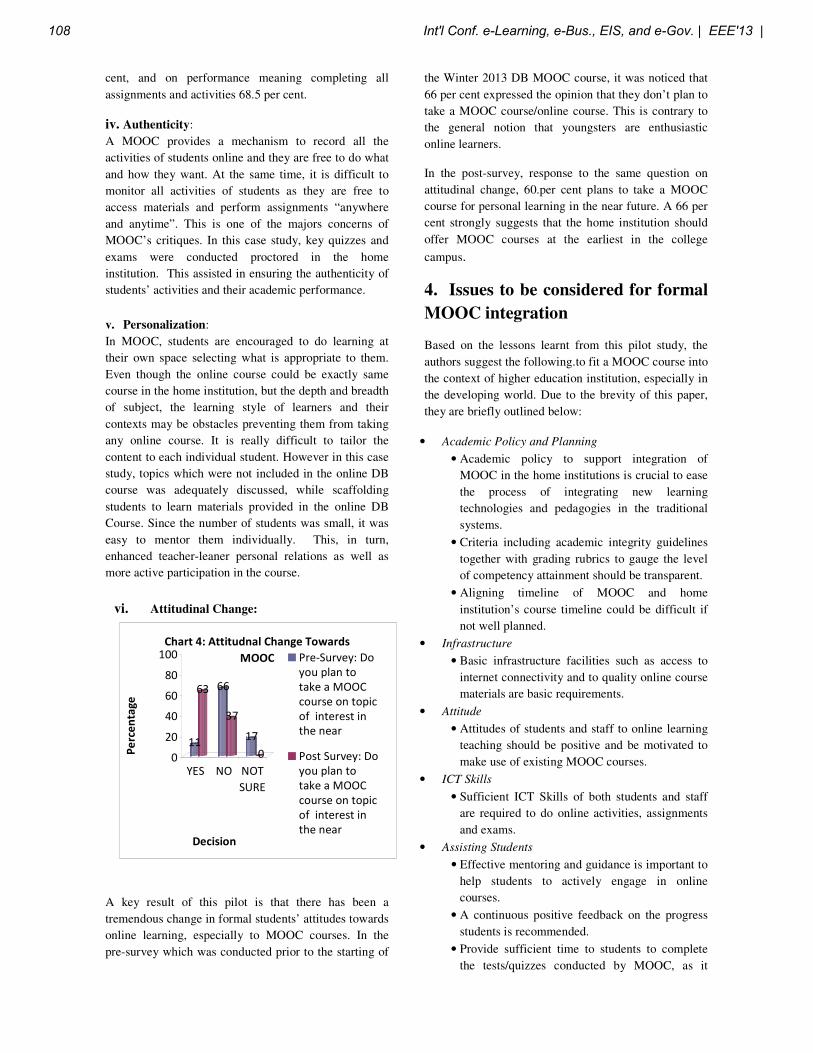
cent, and on performance meaning completing all
assignments and activities 68.5 per cent.
iv. Authenticity:
A MOOC provides a mechanism to record all the
activities of students online and they are free to do what
and how they want. At the same time, it is difficult to
monitor all activities of students as they are free to
access materials and perform assignments “anywhere
and anytime”. This is one of the majors concerns of
MOOC’s critiques. In this case study, key quizzes and
exams were conducted proctored in the home
institution. This assisted in ensuring the authenticity of
students’ activities and their academic performance.
v. Personalization:
In MOOC, students are encouraged to do learning at
their own space selecting what is appropriate to them.
Even though the online course could be exactly same
course in the home institution, but the depth and breadth
of subject, the learning style of learners and their
contexts may be obstacles preventing them from taking
any online course. It is really difficult to tailor the
content to each individual student. However in this case
study, topics which were not included in the online DB
course was adequately discussed, while scaffolding
students to learn materials provided in the online DB
Course. Since the number of students was small, it was
easy to mentor them individually. This, in turn,
enhanced teacher-leaner personal relations as well as
more active participation in the course.
vi. Attitudinal Change:
11
63 66
37
17
00
20
40
60
80
100
Pe
rce
nta
ge
YES NO NOT
SURE
Decision
Chart 4: Attitudnal Change Towards
MOOC Pre-Survey: Do
you plan to
take a MOOC
course on topic
of interest in
the near
Post Survey: Do
you plan to
take a MOOC
course on topic
of interest in
the near
A key result of this pilot is that there has been a
tremendous change in formal students’ attitudes towards
online learning, especially to MOOC courses. In the
pre-survey which was conducted prior to the starting of
the Winter 2013 DB MOOC course, it was noticed that
66 per cent expressed the opinion that they don’t plan to
take a MOOC course/online course. This is contrary to
the general notion that youngsters are enthusiastic
online learners.
In the post-survey, response to the same question on
attitudinal change, 60.per cent plans to take a MOOC
course for personal learning in the near future. A 66 per
cent strongly suggests that the home institution should
offer MOOC courses at the earliest in the college
campus.
4. Issues to be considered for formal
MOOC integration
Based on the lessons learnt from this pilot study, the
authors suggest the following.to fit a MOOC course into
the context of higher education institution, especially in
the developing world. Due to the brevity of this paper,
they are briefly outlined below:
• Academic Policy and Planning
• Academic policy to support integration of
MOOC in the home institutions is crucial to ease
the process of integrating new learning
technologies and pedagogies in the traditional
systems.
• Criteria including academic integrity guidelines
together with grading rubrics to gauge the level
of competency attainment should be transparent.
• Aligning timeline of MOOC and home
institution’s course timeline could be difficult if
not well planned.
• Infrastructure
• Basic infrastructure facilities such as access to
internet connectivity and to quality online course
materials are basic requirements.
• Attitude
• Attitudes of students and staff to online learning
teaching should be positive and be motivated to
make use of existing MOOC courses.
• ICT Skills
• Sufficient ICT Skills of both students and staff
are required to do online activities, assignments
and exams.
• Assisting Students
• Effective mentoring and guidance is important to
help students to actively engage in online
courses.
• A continuous positive feedback on the progress
students is recommended.
• Provide sufficient time to students to complete
the tests/quizzes conducted by MOOC, as it
108 Int'l Conf. e-Learning, e-Bus., EIS, and e-Gov. | EEE'13 |
might require more time than proposed
timeframe of MOOC course calendar.
• Providing learning materials in languages and
cultures which are relevant to local context is
highly encouraged.
4.1 Some recommendations:
The authors make a few recommendations which will
aid non-MOOC organizers planning to integrate MOOC
courses with their academic systems. Based on the
experiment of this pilot study, the following
recommendations highlight key aspects like facilitation,
the role of teachers and assessment. These are briefly
discussed below:
• Facilitation: The home institution must facilitate in
two ways: infrastructure facility and instructors’
role.
o Facilitation by the home institution: The home
institution should be committed to enhance
infrastructure facilities such as PCs, robust
network, internet access and library resources
which will aid in the integration of a MOOC
course within the campus.
o Instructors’ Role: This refers to the changed role
of the teachers who will use MOOC courses within
his/her academic course. The teachers should take
on the role of mentor and guide, rather than
instructor. This will help build healthy relationship
among the teachers and students in online learning.
• Flipped Classroom: When appropriately MOOC
courses are integrated, there will be extra class hours
gained especially by avoiding lecture format classes.
The extra class hours could be utilised positively for
more interaction and in depth discussion of relevant
topics. Activities like project or research work or
creating knowledge artefacts could be introduced.
Robert Beichner’s “SCALE-UP” and Eric Mazur’s[14]
“peer instruction” could be of some help in this process
of ‘flipped classroom’ scenario. This implies that
teachers should participate in the ‘flipped classroom’
approach as learners so that they genuinely facilitate
enriched learning in the classroom.
• Proctored Assessment: As discussed in the section
‘Similar work on MOOC’ in this paper, there are several
ways of integrating MOOC courses within a home
institution. The authors suggest a method in which a
home institution integrates a MOOC course equivalent
to its academic course. The home institution allows its
students to get registered for these MOOC courses and
assist them to engage with the online course materials
and other participants globally. At the same time, the
home institution can conduct important online quizzes
and exams proctored manner so that it could be used for
transferring of credits towards completion of specific
courses. This also implies that formal students are not
burdened with external evaluations and monetary
payment. This however does not prevent capable
students to take any external evaluation of MOOC
course done by an external institution like Udacity.
5. Conclusion and Future Scope
Digital advancement provides many opportunities for
enhancing online teaching and learning experiences.
MOOC has brought in lots of innovative changes in the
realm of higher education. MOOC provides access to
quality online courses to anyone and anywhere at no
cost. As MOOC continues to gain currency, many take
up self-spaced online learning. However higher
education institutions remain sceptical of MOOC’s
legitimacy as formal academic credit, as there is lack of
authenticity of online leaners. To address this issue, this
pilot study was conducted. It explored a new method of
integrating MOOC in a higher education institution. In
this method, a home institute combines face-to-face
interaction as well as monitoring of key online quizzes
and exams of MOOC courses. This will assist in
establishing the authenticity of students’ academic
works which can be further assessed by the home
institution’s evaluation method. As a result, MOOC’s
credits of successful students could be counted towards
completion of a specific home institution’s course.
However there are challenges which need to be
addressed such as infrastructure facilities, academic
policy for accreditation of MOOC course, the role of
teachers as mentor and guide, staff and students’
attitudes towards online learning, specific plans to flip
the classroom with learning activities, and proper
assessment systems. An initial experiment could be
cumbersome, but it is worth the effort to get a positive
result. One such positive result is the change of attitudes
of students to online learning. Now many students feel
confident that they can take MOOC courses for their
personal learning. They even suggest that the home
institution should move in the direction of offering
MOOC courses. It is important to have more evidences
to build a case for this approach. Therefore the authors
intend to continue similar experiments on other MOOC
courses to augment more data evidence and apply it in
an innovative blended learning in higher education.
Int'l Conf. e-Learning, e-Bus., EIS, and e-Gov. | EEE'13 | 109
6. Acknowledgement
The authors are very grateful to the Department of
Computer Science, St. Xavier’s College (Autonomous),
Kolkata, for allowing do research work on MOOC and
emerging online teaching methodologies. The authors
are very much grateful to Fr. Dr J. Felix Raj, Principal,
St. Xavier’s College (Autonomous), Kolkata, for his
constant encouragement in research work.
7. References
[1] Agariya, A. K. & Singh, D. (2012). e-Learning
quality: Scale development and validation in Indian
context. An International Journal of Knowledge
Management and E-Learning. 4(4). 500-517.
Retrieved form www.kmel-
journal.org/ojs/index.php/online-publication
[2] Allen, I. E.,&Seaman, J.(2013 January). Changing
Course – Ten Years of Tracking Online Education in
the United States, Babson Survey Research Group,
Massachusetts, USA
[3] Anderson, T., &Dron, J. (2012 September).
Learning technologies through three generations of
technology enhanced distance education pedagogy.
European Journal of Open Distance and E-Learning.
Retrieved from http://www.eurodl.org/
[4] Bacow, L. S., Bowen, W. G., Guthrie, K.M., Lack,
K. A. & Lon, M. P. (2012 May). Barriers to
adoption of online learning systems in U.S. Higher
Education. ITHAKA S+R. Retrieved from
http://www.sr.ithaka.org/research-publications/
[5] Bregar, L., Bavdoz, M., Orgrajensek, I. Papic, M., &
Bester, J. (1999 December). On-line course: From
experimental use to integration into a university
programme. Retrieved from www.eurodl.org
[6] Bowen, W. G., Chingos, M. M., Lack, K. A., &
Nygren, T.I. (2012 May). Interactive Learning
Online at Public Universities: Evidence from
Randomized Trails. ITHAKA S+R
[7] Chamberlin, L., &T. Parish, MOOCs: Massive Open
Online Courses or Massive and Often Obtuse
Courses?
[8] Christensen, C. M., Horn M. B., & Johnson, C. W.
(2008). Disrupting Class – How disruptive
innovation will change the way the world learns.
MGraw Hill. New York
[9] Cooper, S., & Sahami, M. (2013 February).
Reflections on Stanford’s Moocs. Communication of
ACM 56(2), 28-30
[10] Daniel, J. (2012 September). Making Sense of
MOOCs: Musings in a Maze of Myth, Paradox and
Possibility, KNOU
[11] Davidson, N. (2012, Dec 10). Size isn’t everything,
The Chronicle Review - The chronicle of Education,
retrieved from http://chronicle.com
[12] Day, J., & Foley, J. (2006 November). Evaluating a
web lecture intervention in a human-computer
interaction course, IEEE Transactions on Education,
49(4)
[13] Educause. (2011 November). Seven Things you
should know about MOOCs
[14] Fagen, A. P., C.H. Crouch, & E. Mazur. (2012).
Peer Instruction: Results from a range of classrooms,
The Physics Teacher, 40
[15] Fini, A. (2009 November). The technological
dimension of a Massive Open Online course: The
case of the CCK08course tools. The International
Review of Research in Open and Distnace Learning.
Retrieved from
http://www.irrodl.org/index.php/irrodl/article/view/6
43/1402
[16] Hayman, P. (2012 December). In the year of
Disruptive Education, Communication of the ACM
55(12), 20-22
[17] Hill, P. (2013 March). The four student archetypes
emerging in MOOCs. E-Literate [Web log
blog].Retrieved from http://mfeldstein.com/
[18] Kolowich, S. (2013, Mar 18). The minds behind the
MOOCs. The Chronicle of Higher Education.
Retrieved from http://chronicle.com
[19] Jahng, N., Krug, D., & Zhang, Z. (2007 January).
Student Achievement in Online Distance Education
Compared to Face-to-Face Education. European
Journal of Open Distance and E-Learning. Retrieved
from http://www.eurodl.org/
[20] Jung, M. L., Loria, K., Saha, R.M.P (2008). E-
Learning: Investigating University Student’s
Acceptance of Technology. European Journal of
Open Distance and E-Learning. Retrieved from
http://www.eurodl.org/
[21] Lane, L. M. (2012). Three Classification of MOOCs,
retrieved from http://lisahistory.net
[22] McAuley, A., Stewart, B., Siemens, G., &Cormier,
D. (2010).The MOOC Model for Digital
Practice.Retrieved from http://www.elearnspace.org
[23] Machun, P. A., & Wang, M. (2012). MOOCs: Is
There An App For That?-Expanding Mobilegogy
Through An Analysis Of MOOCs And iTunes
University
[24] Mangan, K. (2012, Sep 6). A First for Udacity: a
U.S. University will accept transfer credit for one of
its courses, The Chronicle of Education, 6
September 2012 – retrieved from
http://chronicle.com/article/
110 Int'l Conf. e-Learning, e-Bus., EIS, and e-Gov. | EEE'13 |
[25] Martin, F. G. (2012 August). Will massive open
online courses change how we teach?
Communications of the ACM 55(8)
[26] Morrison, D. (2013 March). A Tale of Two MOOCs
@ Coursera: Divided by Pedagogy. Online Learning
Insights [Web log blog]. Retrieved from
http://onlinelearninginsights.wordpress.com
[27] Pantò E., Comas-Quinn A. (2013), The Challenge of
Open Education, Journal of e-Learning and
Knowledge Society, v.9, n.1, 11-22.
[28] Parry, M. (2013, Mar 20) edX Offers Proctored
Exams for Open Online Course, http://chronicle.com
[29] Parry, M. (2012, Oct 1). 5 ways that edX could
change education, The Chronicle of Higher
Education, Retrieved from http://chronicle.com
[30] Piech, C., Sahami, M., Koller, D., Cooper, S. and
Blikstein, P. (2012). Modeling how students learn to
program. In Proceedings of the 43rd ACM Technical
Symposium on Computer Science Education
(SIGCSE ‘12). ACM. New York. 153–160
[31] Rajasingham, L. (2011 June). New Challenges
Facing Universities in the Internet-Driven global
Environment. European Journal of Open Distance
and E-Learning. Retrieved from
http://www.eurodl.org/
[32] Rodriguez, C. O. (2012 July). MOOCs and the AI-
Stanford like courses: Two successful and distinct
course format for Massive Open Online Courses.
Retrieved from http://www.eurodl.org/
[33] Sahami, M., Martin, F. G., Guzial, M., &Parlante,
N. (2013 March). The Revolution will be Televised:
Perspectives on Massive Open Online Education.
SIGCSE of ACM, 457-458.doi: 978-1-4503-1868-
6/13/3
[34] Vardi, M.Y. (2012 Noember). Will MOOCs destroy
academia? Commun. ACM 55(11), 5.
[35] Vihavainen, a., Luukkainen, & Kurhila, J. (2012
October). Multifacted support for MOOC in
Programming. SIGITE’12 of ACM. 171-176. doi:
978-1-4503-1464-0
Int'l Conf. e-Learning, e-Bus., EIS, and e-Gov. | EEE'13 | 111
A Programmer Self-training System with Programming SkillEvaluation and Personalized Task Recommendation
Shu Lin, Qinjian Zhang, and Wenxin LiDepartment of Computer Science, Peking University, Beijing, P.R.China
Abstract— Thanks to the widespread use of computers, thebasic programming ability is becoming an essential skillfor almost all the college students. Although many currentonline judge systems provide stable and efficient servicesin automated programs testing [1], it seems that there islimited help to the learners since few study suggestions isgiven to them. In this case, learners may feel disorientedduring their studies. This paper aims to solve this problemby implementing a system based on one existing platform– Bailian, which will evaluate the learner’s programmingskills by combining three scores from different perspectivesseparately, and then recommend some suitable tasks to themaccording to the grades of both learners and problems.The system also includes an automatic contest generatorto generate contests for self-testing. The quality of thesecontests is guaranteed since the grades as well as thecategories of problems are considered during generating.
Keywords: Online judge system, Bailian, programming skillevaluation, personalized task recommendation, automatic contestgeneration
1. IntroductionWith the advent of information era and the popularization
of computers, programming is no longer a peculiar skillof programmers. Almost all subjects requires programmingskills – for example, we need to process large data sets orsolve complex formulas in mathematics and physics, tabulatestatistics data or predict the developing trade of some objectin social science, design and produce fantastic animationsin arts, and so on. Without programming, these jobs wouldbecome tall orders.
Nowadays, there are many kinds of platforms designedfor helping learning programming, and the most efficientone is called Online Judge System, or “OJ” for short. Anonline judge system may contain hundreds of thousandsof problems which demand diverse ideas and techniquesto solve. A learner can practice his programming skills byregistering a new account, opening one problem and readingits description, coding a program which does exactly whatthe problems demand, and submitting the solution to theonline judge system. Because the online judge system usesrobot judges instead of humans, it will return an objectiveverdict in mere fractions of seconds just after the submission.Thus the learner is able to know whether his solution is
correct or not, and may correct the errors according to theresult [2].
However, it is far from enough for learners. Since most ofonline judge systems are initially designed for programmingcontests, beginners will be completely flummoxed by thesea of problems – in another word, the green hands haveno idea where to begin. Even old hands may lose theirpositions if they are not aware of their actual grades. Ithappens occasionally when a learner
• Tries to solve hard problems which beyond his ability,or
• Has solved many similar problems redundantly, whichhe should not have to.
Both of them are wasting learner’s precious time.Another flaw in most of the current online judge systems
is the utilization rate of problems is quite low. Learnersprefer to solve “famous” problems, because these problemshave been solved many times, and proved to be good ones.Also it is easy to find lots of reference solutions for theseproblems, which is really helpful once a learner is gettinginto trouble. If things continue in this way, the “famous”will become more “famous”, fewer and fewer learners showtheir interest in other “infamous” problems, even some ofthose “infamous” ones may be good.
In this paper, we are going to design and implement asystem that
• Evaluates programming skill of learners;• Gives some personalized study advices (by task recom-
mendations) to learners;• Generates contests for testing learner’s programming
ability.The system is based on OpenJudge, an existing online judgesystem maintained by Peking University.
In order to provide a better programming learning plat-form, at first we have graded all problems according to thelevels of difficulty. We have also classified them by whatalgorithm is used during solving. Then for each learner, wedetermine the grade of his programming skill by the gradesas well as the classifications of solved problems. After that,we can recommend some proper problems to the learner.Finally, we provide a service that generates contests individ-ually for each learner, which will test learner’s programmingskill in a more effective way.
The next section describes the current online judge sys-tems in detail. From Section 3 to Section 7 shows the current
112 Int'l Conf. e-Learning, e-Bus., EIS, and e-Gov. | EEE'13 |
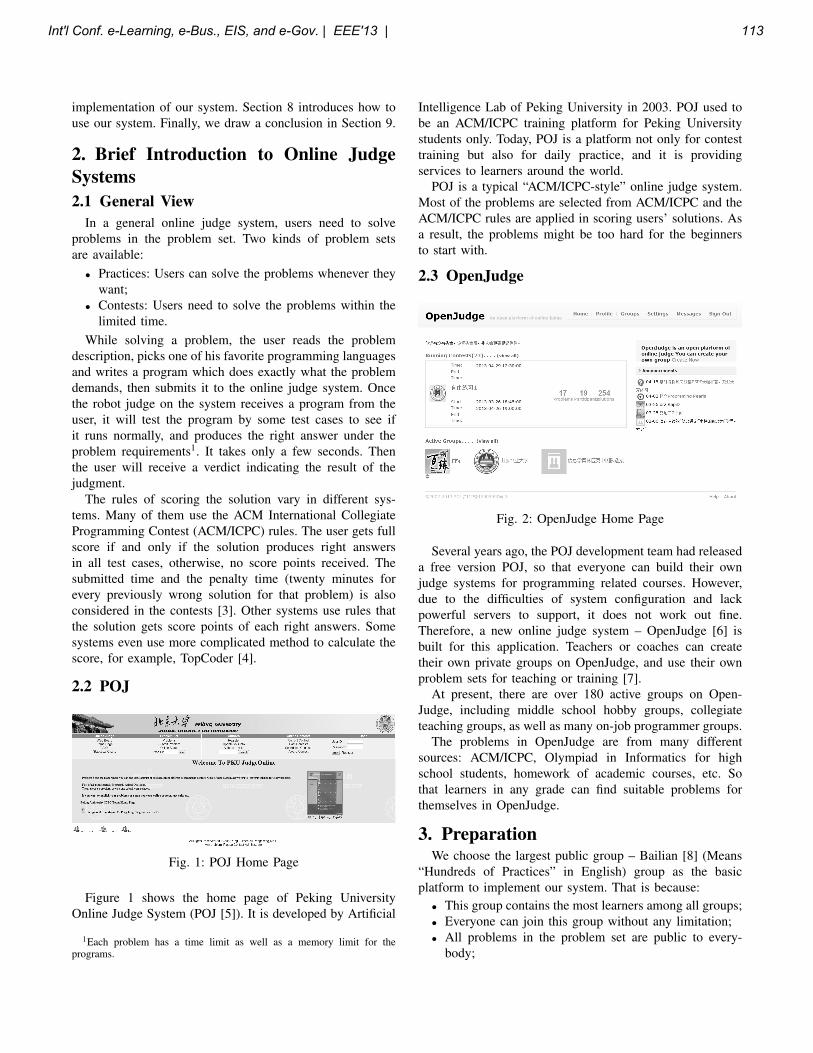
implementation of our system. Section 8 introduces how touse our system. Finally, we draw a conclusion in Section 9.
2. Brief Introduction to Online JudgeSystems2.1 General View
In a general online judge system, users need to solveproblems in the problem set. Two kinds of problem setsare available:
• Practices: Users can solve the problems whenever theywant;
• Contests: Users need to solve the problems within thelimited time.
While solving a problem, the user reads the problemdescription, picks one of his favorite programming languagesand writes a program which does exactly what the problemdemands, then submits it to the online judge system. Oncethe robot judge on the system receives a program from theuser, it will test the program by some test cases to see ifit runs normally, and produces the right answer under theproblem requirements1. It takes only a few seconds. Thenthe user will receive a verdict indicating the result of thejudgment.
The rules of scoring the solution vary in different sys-tems. Many of them use the ACM International CollegiateProgramming Contest (ACM/ICPC) rules. The user gets fullscore if and only if the solution produces right answersin all test cases, otherwise, no score points received. Thesubmitted time and the penalty time (twenty minutes forevery previously wrong solution for that problem) is alsoconsidered in the contests [3]. Other systems use rules thatthe solution gets score points of each right answers. Somesystems even use more complicated method to calculate thescore, for example, TopCoder [4].
2.2 POJ
Fig. 1: POJ Home Page
Figure 1 shows the home page of Peking UniversityOnline Judge System (POJ [5]). It is developed by Artificial
1Each problem has a time limit as well as a memory limit for theprograms.
Intelligence Lab of Peking University in 2003. POJ used tobe an ACM/ICPC training platform for Peking Universitystudents only. Today, POJ is a platform not only for contesttraining but also for daily practice, and it is providingservices to learners around the world.
POJ is a typical “ACM/ICPC-style” online judge system.Most of the problems are selected from ACM/ICPC and theACM/ICPC rules are applied in scoring users’ solutions. Asa result, the problems might be too hard for the beginnersto start with.
2.3 OpenJudge
Fig. 2: OpenJudge Home Page
Several years ago, the POJ development team had releaseda free version POJ, so that everyone can build their ownjudge systems for programming related courses. However,due to the difficulties of system configuration and lackpowerful servers to support, it does not work out fine.Therefore, a new online judge system – OpenJudge [6] isbuilt for this application. Teachers or coaches can createtheir own private groups on OpenJudge, and use their ownproblem sets for teaching or training [7].
At present, there are over 180 active groups on Open-Judge, including middle school hobby groups, collegiateteaching groups, as well as many on-job programmer groups.
The problems in OpenJudge are from many differentsources: ACM/ICPC, Olympiad in Informatics for highschool students, homework of academic courses, etc. Sothat learners in any grade can find suitable problems forthemselves in OpenJudge.
3. PreparationWe choose the largest public group – Bailian [8] (Means
“Hundreds of Practices” in English) group as the basicplatform to implement our system. That is because:
• This group contains the most learners among all groups;• Everyone can join this group without any limitation;• All problems in the problem set are public to every-
body;
Int'l Conf. e-Learning, e-Bus., EIS, and e-Gov. | EEE'13 | 113
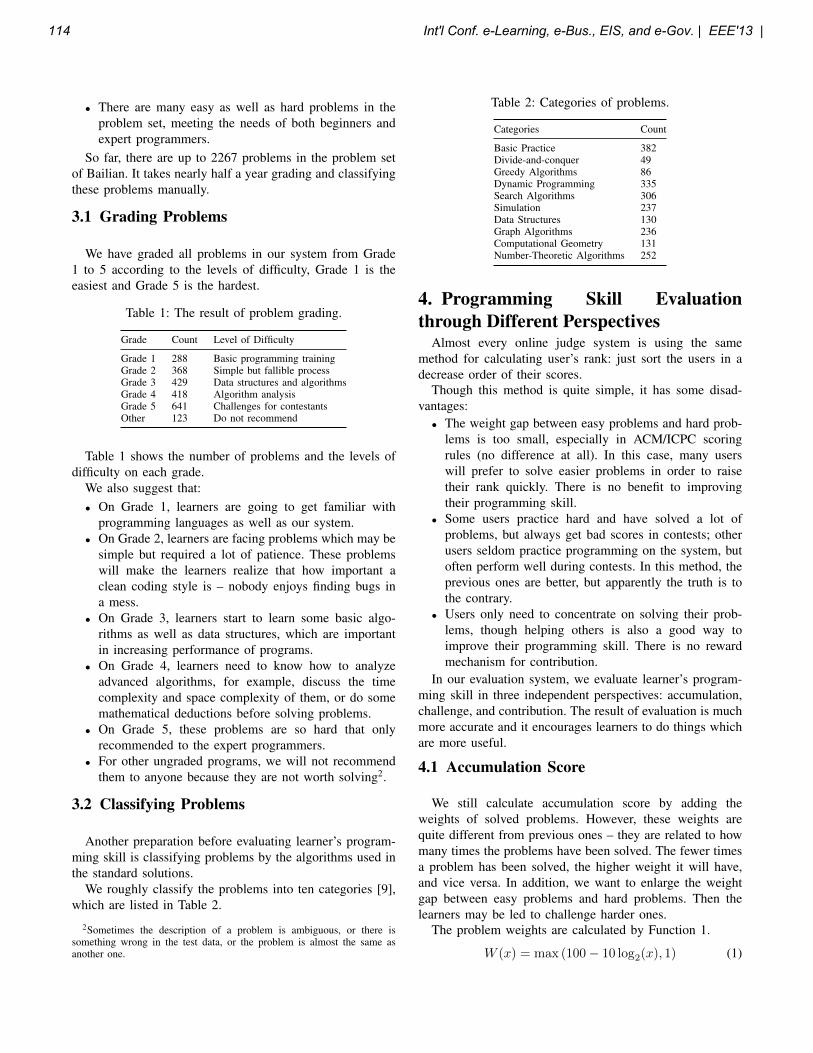
• There are many easy as well as hard problems in theproblem set, meeting the needs of both beginners andexpert programmers.
So far, there are up to 2267 problems in the problem setof Bailian. It takes nearly half a year grading and classifyingthese problems manually.
3.1 Grading Problems
We have graded all problems in our system from Grade1 to 5 according to the levels of difficulty, Grade 1 is theeasiest and Grade 5 is the hardest.
Table 1: The result of problem grading.
Grade Count Level of Difficulty
Grade 1 288 Basic programming trainingGrade 2 368 Simple but fallible processGrade 3 429 Data structures and algorithmsGrade 4 418 Algorithm analysisGrade 5 641 Challenges for contestantsOther 123 Do not recommend
Table 1 shows the number of problems and the levels ofdifficulty on each grade.
We also suggest that:• On Grade 1, learners are going to get familiar with
programming languages as well as our system.• On Grade 2, learners are facing problems which may be
simple but required a lot of patience. These problemswill make the learners realize that how important aclean coding style is – nobody enjoys finding bugs ina mess.
• On Grade 3, learners start to learn some basic algo-rithms as well as data structures, which are importantin increasing performance of programs.
• On Grade 4, learners need to know how to analyzeadvanced algorithms, for example, discuss the timecomplexity and space complexity of them, or do somemathematical deductions before solving problems.
• On Grade 5, these problems are so hard that onlyrecommended to the expert programmers.
• For other ungraded programs, we will not recommendthem to anyone because they are not worth solving2.
3.2 Classifying Problems
Another preparation before evaluating learner’s program-ming skill is classifying problems by the algorithms used inthe standard solutions.
We roughly classify the problems into ten categories [9],which are listed in Table 2.
2Sometimes the description of a problem is ambiguous, or there issomething wrong in the test data, or the problem is almost the same asanother one.
Table 2: Categories of problems.
Categories Count
Basic Practice 382Divide-and-conquer 49Greedy Algorithms 86Dynamic Programming 335Search Algorithms 306Simulation 237Data Structures 130Graph Algorithms 236Computational Geometry 131Number-Theoretic Algorithms 252
4. Programming Skill Evaluationthrough Different Perspectives
Almost every online judge system is using the samemethod for calculating user’s rank: just sort the users in adecrease order of their scores.
Though this method is quite simple, it has some disad-vantages:
• The weight gap between easy problems and hard prob-lems is too small, especially in ACM/ICPC scoringrules (no difference at all). In this case, many userswill prefer to solve easier problems in order to raisetheir rank quickly. There is no benefit to improvingtheir programming skill.
• Some users practice hard and have solved a lot ofproblems, but always get bad scores in contests; otherusers seldom practice programming on the system, butoften perform well during contests. In this method, theprevious ones are better, but apparently the truth is tothe contrary.
• Users only need to concentrate on solving their prob-lems, though helping others is also a good way toimprove their programming skill. There is no rewardmechanism for contribution.
In our evaluation system, we evaluate learner’s program-ming skill in three independent perspectives: accumulation,challenge, and contribution. The result of evaluation is muchmore accurate and it encourages learners to do things whichare more useful.
4.1 Accumulation Score
We still calculate accumulation score by adding theweights of solved problems. However, these weights arequite different from previous ones – they are related to howmany times the problems have been solved. The fewer timesa problem has been solved, the higher weight it will have,and vice versa. In addition, we want to enlarge the weightgap between easy problems and hard problems. Then thelearners may be led to challenge harder ones.
The problem weights are calculated by Function 1.
W (x) = max (100− 10 log2(x), 1) (1)
114 Int'l Conf. e-Learning, e-Bus., EIS, and e-Gov. | EEE'13 |
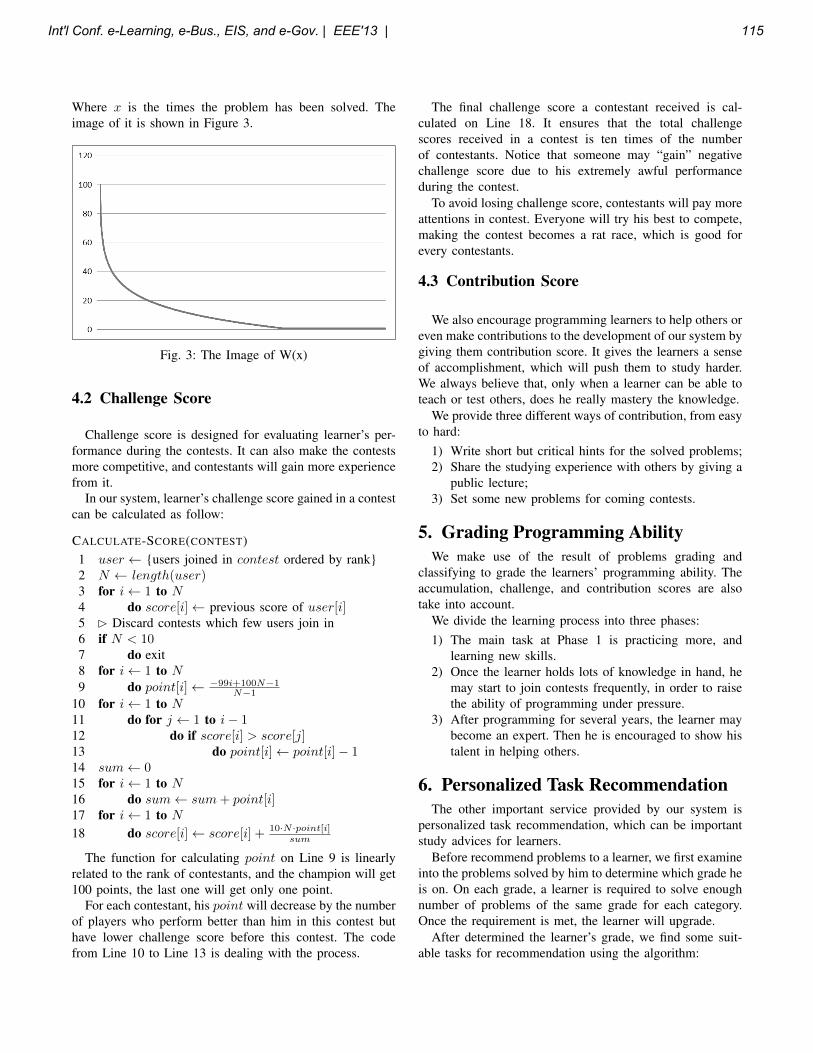
Where x is the times the problem has been solved. Theimage of it is shown in Figure 3.
Fig. 3: The Image of W(x)
4.2 Challenge Score
Challenge score is designed for evaluating learner’s per-formance during the contests. It can also make the contestsmore competitive, and contestants will gain more experiencefrom it.
In our system, learner’s challenge score gained in a contestcan be calculated as follow:
CALCULATE-SCORE(CONTEST)1 user ← {users joined in contest ordered by rank}2 N ← length(user)3 for i← 1 to N4 do score[i]← previous score of user[i]5 � Discard contests which few users join in6 if N < 107 do exit8 for i← 1 to N9 do point[i]← −99i+100N−1
N−1
10 for i← 1 to N11 do for j ← 1 to i− 112 do if score[i] > score[j]13 do point[i]← point[i]− 114 sum← 015 for i← 1 to N16 do sum← sum+ point[i]17 for i← 1 to N
18 do score[i]← score[i] + 10·N ·point[i]sum
The function for calculating point on Line 9 is linearlyrelated to the rank of contestants, and the champion will get100 points, the last one will get only one point.
For each contestant, his point will decrease by the numberof players who perform better than him in this contest buthave lower challenge score before this contest. The codefrom Line 10 to Line 13 is dealing with the process.
The final challenge score a contestant received is cal-culated on Line 18. It ensures that the total challengescores received in a contest is ten times of the numberof contestants. Notice that someone may “gain” negativechallenge score due to his extremely awful performanceduring the contest.
To avoid losing challenge score, contestants will pay moreattentions in contest. Everyone will try his best to compete,making the contest becomes a rat race, which is good forevery contestants.
4.3 Contribution Score
We also encourage programming learners to help others oreven make contributions to the development of our system bygiving them contribution score. It gives the learners a senseof accomplishment, which will push them to study harder.We always believe that, only when a learner can be able toteach or test others, does he really mastery the knowledge.
We provide three different ways of contribution, from easyto hard:
1) Write short but critical hints for the solved problems;2) Share the studying experience with others by giving a
public lecture;3) Set some new problems for coming contests.
5. Grading Programming AbilityWe make use of the result of problems grading and
classifying to grade the learners’ programming ability. Theaccumulation, challenge, and contribution scores are alsotake into account.
We divide the learning process into three phases:1) The main task at Phase 1 is practicing more, and
learning new skills.2) Once the learner holds lots of knowledge in hand, he
may start to join contests frequently, in order to raisethe ability of programming under pressure.
3) After programming for several years, the learner maybecome an expert. Then he is encouraged to show histalent in helping others.
6. Personalized Task RecommendationThe other important service provided by our system is
personalized task recommendation, which can be importantstudy advices for learners.
Before recommend problems to a learner, we first examineinto the problems solved by him to determine which grade heis on. On each grade, a learner is required to solve enoughnumber of problems of the same grade for each category.Once the requirement is met, the learner will upgrade.
After determined the learner’s grade, we find some suit-able tasks for recommendation using the algorithm:
Int'l Conf. e-Learning, e-Bus., EIS, and e-Gov. | EEE'13 | 115
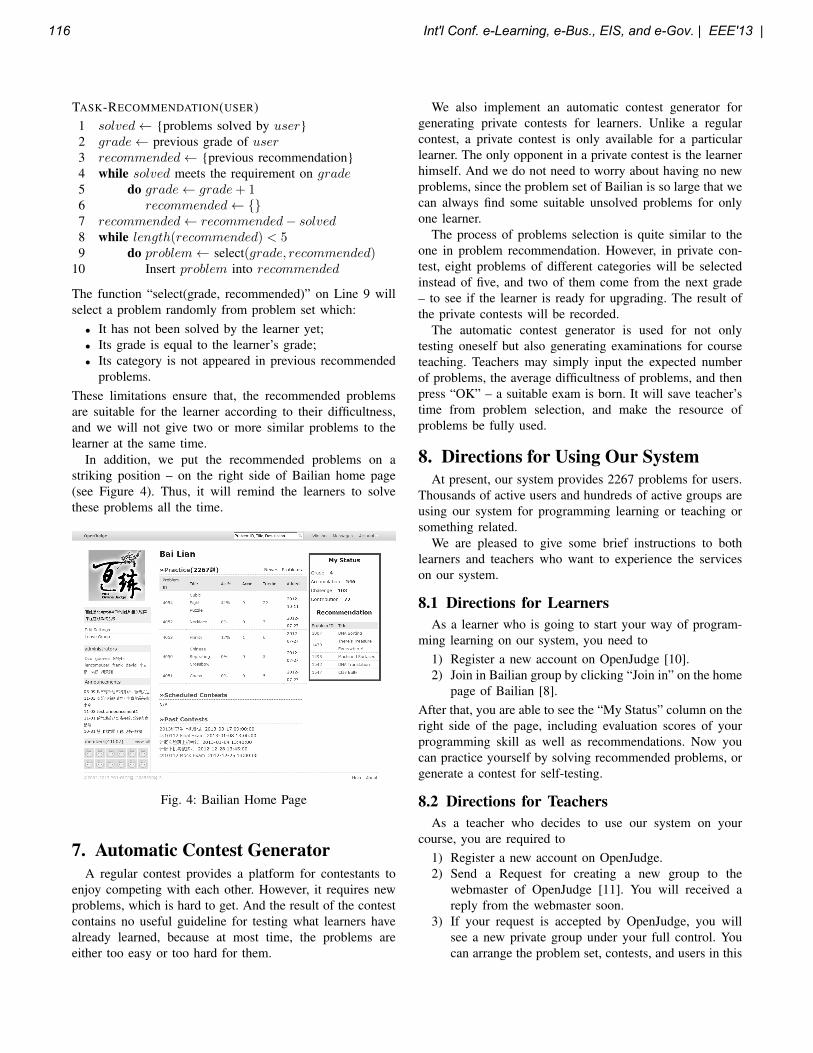
TASK-RECOMMENDATION(USER)1 solved← {problems solved by user}2 grade← previous grade of user3 recommended← {previous recommendation}4 while solved meets the requirement on grade5 do grade← grade+ 16 recommended← {}7 recommended← recommended− solved8 while length(recommended) < 59 do problem← select(grade, recommended)
10 Insert problem into recommended
The function “select(grade, recommended)” on Line 9 willselect a problem randomly from problem set which:
• It has not been solved by the learner yet;• Its grade is equal to the learner’s grade;• Its category is not appeared in previous recommended
problems.These limitations ensure that, the recommended problemsare suitable for the learner according to their difficultness,and we will not give two or more similar problems to thelearner at the same time.
In addition, we put the recommended problems on astriking position – on the right side of Bailian home page(see Figure 4). Thus, it will remind the learners to solvethese problems all the time.
Fig. 4: Bailian Home Page
7. Automatic Contest GeneratorA regular contest provides a platform for contestants to
enjoy competing with each other. However, it requires newproblems, which is hard to get. And the result of the contestcontains no useful guideline for testing what learners havealready learned, because at most time, the problems areeither too easy or too hard for them.
We also implement an automatic contest generator forgenerating private contests for learners. Unlike a regularcontest, a private contest is only available for a particularlearner. The only opponent in a private contest is the learnerhimself. And we do not need to worry about having no newproblems, since the problem set of Bailian is so large that wecan always find some suitable unsolved problems for onlyone learner.
The process of problems selection is quite similar to theone in problem recommendation. However, in private con-test, eight problems of different categories will be selectedinstead of five, and two of them come from the next grade– to see if the learner is ready for upgrading. The result ofthe private contests will be recorded.
The automatic contest generator is used for not onlytesting oneself but also generating examinations for courseteaching. Teachers may simply input the expected numberof problems, the average difficultness of problems, and thenpress “OK” – a suitable exam is born. It will save teacher’stime from problem selection, and make the resource ofproblems be fully used.
8. Directions for Using Our SystemAt present, our system provides 2267 problems for users.
Thousands of active users and hundreds of active groups areusing our system for programming learning or teaching orsomething related.
We are pleased to give some brief instructions to bothlearners and teachers who want to experience the serviceson our system.
8.1 Directions for LearnersAs a learner who is going to start your way of program-
ming learning on our system, you need to1) Register a new account on OpenJudge [10].2) Join in Bailian group by clicking “Join in” on the home
page of Bailian [8].After that, you are able to see the “My Status” column on theright side of the page, including evaluation scores of yourprogramming skill as well as recommendations. Now youcan practice yourself by solving recommended problems, orgenerate a contest for self-testing.
8.2 Directions for TeachersAs a teacher who decides to use our system on your
course, you are required to1) Register a new account on OpenJudge.2) Send a Request for creating a new group to the
webmaster of OpenJudge [11]. You will received areply from the webmaster soon.
3) If your request is accepted by OpenJudge, you willsee a new private group under your full control. Youcan arrange the problem set, contests, and users in this
116 Int'l Conf. e-Learning, e-Bus., EIS, and e-Gov. | EEE'13 |
group freely. And you can use the automatic contestgenerator as many times as you want.
4) You need to ask your students to join in this groupfirst, or they will have no access permissions on theresource in it.
9. ConclusionThe evaluation and recommendation system and the auto-
matic contest generator we have implemented make a greatimprovement on the original Bailian group. The purpose isto provide a more suitable programming learning platformfor learners at all levels. Learners can be able to studyingprogramming on our system by themselves. As well, they areencouraged to exchange their experience and ideas duringlearning. And the system can be applied in any programmingrelated courses.
There is still room for improvement in our system. Forexample, grade problems in an automatic way. Although theresult of classifying a problem’s category is quite unanimousamong most experienced programmers, the grade of theproblem may be controversial. That is because the difficultyof the problem depends on subjective judgments from dif-ferent people. In this case, we need to do more researchon automatic problem grading to make the grades moreobjective and forcible.
We also plan to evaluate the actual effectiveness of oursystem by tracking learner’s behavior. We will collect thefeedbacks from learners as well as the records of learner’sactions, in order to figure out how much has the systemchanged in learner’s programming learning.
We are welcoming programming learners from all over theworld into our system for studying programming. And weare also looking forward to seeing more and more teachersare using our system in their courses.
References[1] Wikipedia. (2013) Online judge - Wikipedia, the free encyclopedia.
[Online]. Available: http://en.wikipedia.org/wiki/Online_judge[2] S. S. Skiena, M. A. Revilla, Programming Challenges, 2003 ed. New
York, USA: Springer, 2003.[3] ACM/ICPC. (2013) World Finals Rules. [Online]. Available: http:
//icpc.baylor.edu/worldfinals/rules[4] Topcoder. (2012) Algorithm Competition Rating System. [On-
line]. Available: http://apps.topcoder.com/wiki/display/tc/Algorithm+Competition+Rating+System
[5] (2013) The POJ website. [Online]. Available: http://poj.org/[6] (2013) The OpenJudge website. [Online]. Available: http://openjudge.
cn/[7] OpenJudge. (2013) About. [Online]. Available: http://openjudge.cn/
about.html[8] (2013) The Bailian website. [Online]. Available: http://poj.grids.cn/[9] T. H. Cormen, C. E. Leiserson, R. L. Rivest, C. Stein, Introduction to
Algorithms, 3rd ed. Cambridge, USA: MIT Press, 2009.[10] OpenJudge. (2013) Register. [Online]. Available: http://openjudge.cn/
register/[11] OpenJudge. (2013) Create New Group. [Online]. Available: http:
//openjudge.cn/groups/new
Int'l Conf. e-Learning, e-Bus., EIS, and e-Gov. | EEE'13 | 117
An Online Methodology For Individualized Education
Daniel D. Gajski1, Quoc-Viet Dang1, and WenLiang He2 1Henry Samueli School of Engineering, University of California, Irvine, CA, United States
2School of Education, University of California, Irvine, CA, United States
Abstract - Online courses have been debated by various sources, including Governor Jerry Brown, the UC regents, and numerous college administrators, faculty, and students. The motivation behind such discussion is varied. Since there is no standard in online education, it has produced erratic results in terms of student performance and costs to students as well as administration. Online tools, if managed and prepared for properly, have the opportunity to provide the highly regarded individualized learning experience of the small classroom with the lower costs of large lecture halls while decreasing overall overhead costs. This article presents tools and a methodology to provide the small classroom experience in a much larger setting while keeping overall costs and time commitment down as well as improve overall student performance.
Keywords: Online Methodology, In-Class Improvement, Flipping Classroom
1 Introduction Online courses, the latest hot topic in education, have been debated by various sources, including Governor Jerry Brown [1], the UC regents, and numerous college administrators, faculty, and students. The motivation behind such discussion is varied. Administrators see offering online courses as a way to increase the number of students despite the shortage of large lecture halls, while generating some financial savings. Faculty and students are more skeptical, fearing they will miss the face to face student-lecturer interaction in and out of the classroom. Of course, with some traditional in-class courses, having hundreds of students with varying backgrounds and motivation, the student-lecturer interaction has already been severely diminished from smaller classroom sizes, which are no longer feasible due to the shrinking educational budget. Since there is no standard in online education, it has produced erratic results in terms of student performance and costs to students as well as administration.
However, online tools, if managed and prepared for properly, have the opportunity to provide the highly regarded individualized learning experience of the small classroom with the lower costs of large lecture halls while decreasing overall overhead costs. In fact, the tools used for online courses can be utilized to improve the existing traditional
classroom dynamic. Students are trained from high school to prepare for testing by memorizing as many facts and examples as possible in order to answer each question. On the other hand, college professors tend to follow a top-down approach in teaching where they cover concepts, some math or algorithms, and methods or processes of finding proper solutions. These processes, especially in Engineering, must be understood and not just memorized because they have many steps involved: specification, analysis, design and synthesis, optimization, verification, implementation, and testing. In a small college classroom of 20-30 students, lecturers can help students who fall behind individually by expending their out-of-class time. In a larger class of 150 students or more, the small classroom teaching style doesn’t work as well since the time commitment for both the lecturer and students are dramatically increased for the same duration of time.
The tools and methodology presented in this article aid in providing the small classroom experience in a much larger setting while keeping overall costs and time commitment down. Such tools and methodology can be applied to any learning environment, not just online, to better prepare students for learning concepts and solving problems. It must cover
a) Lectures
b) Sample problems with solutions
c) Questions and answers
d) Homework
e) Tests
2 Improving the In-Class Environment We will compare the typical teaching methodology for a large classroom with a modified methodology that utilizes online tools to provide a richer learning environment for students. Our initial research compares two groups of students (Group A & Group B) taking a Digital Logic Design Engineering course during two separate quarters. Online course material consisted of custom content developed specifically for this Digital Design course as well as existing UCI tools through EEE (Electronic Educational Environment). We compare the students across 3 exams:
Exam 1: Both groups are taught based on a typical teaching methodology (overviewed below). Online lecture videos are
118 Int'l Conf. e-Learning, e-Bus., EIS, and e-Gov. | EEE'13 |
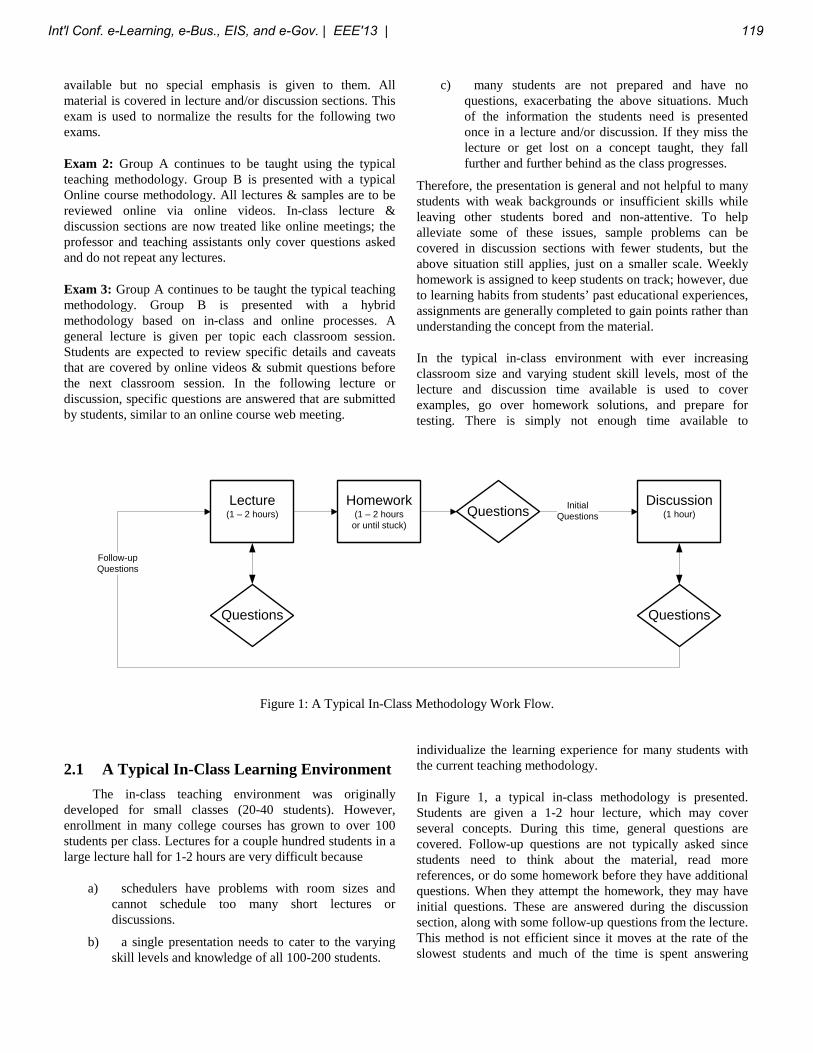
available but no special emphasis is given to them. All material is covered in lecture and/or discussion sections. This exam is used to normalize the results for the following two exams.
Exam 2: Group A continues to be taught using the typical teaching methodology. Group B is presented with a typical Online course methodology. All lectures & samples are to be reviewed online via online videos. In-class lecture & discussion sections are now treated like online meetings; the professor and teaching assistants only cover questions asked and do not repeat any lectures.
Exam 3: Group A continues to be taught the typical teaching methodology. Group B is presented with a hybrid methodology based on in-class and online processes. A general lecture is given per topic each classroom session. Students are expected to review specific details and caveats that are covered by online videos & submit questions before the next classroom session. In the following lecture or discussion, specific questions are answered that are submitted by students, similar to an online course web meeting.
2.1 A Typical In-Class Learning Environment The in-class teaching environment was originally developed for small classes (20-40 students). However, enrollment in many college courses has grown to over 100 students per class. Lectures for a couple hundred students in a large lecture hall for 1-2 hours are very difficult because
a) schedulers have problems with room sizes and cannot schedule too many short lectures or discussions.
b) a single presentation needs to cater to the varying skill levels and knowledge of all 100-200 students.
c) many students are not prepared and have no questions, exacerbating the above situations. Much of the information the students need is presented once in a lecture and/or discussion. If they miss the lecture or get lost on a concept taught, they fall further and further behind as the class progresses.
Therefore, the presentation is general and not helpful to many students with weak backgrounds or insufficient skills while leaving other students bored and non-attentive. To help alleviate some of these issues, sample problems can be covered in discussion sections with fewer students, but the above situation still applies, just on a smaller scale. Weekly homework is assigned to keep students on track; however, due to learning habits from students’ past educational experiences, assignments are generally completed to gain points rather than understanding the concept from the material.
In the typical in-class environment with ever increasing classroom size and varying student skill levels, most of the lecture and discussion time available is used to cover examples, go over homework solutions, and prepare for testing. There is simply not enough time available to
individualize the learning experience for many students with the current teaching methodology.
In Figure 1, a typical in-class methodology is presented. Students are given a 1-2 hour lecture, which may cover several concepts. During this time, general questions are covered. Follow-up questions are not typically asked since students need to think about the material, read more references, or do some homework before they have additional questions. When they attempt the homework, they may have initial questions. These are answered during the discussion section, along with some follow-up questions from the lecture. This method is not efficient since it moves at the rate of the slowest students and much of the time is spent answering
Lecture(1 – 2 hours)
Discussion(1 hour)
Homework(1 – 2 hours
or until stuck)
Questions
Questions
Questions
Follow-upQuestions
InitialQuestions
Figure 1: A Typical In-Class Methodology Work Flow.
Int'l Conf. e-Learning, e-Bus., EIS, and e-Gov. | EEE'13 | 119
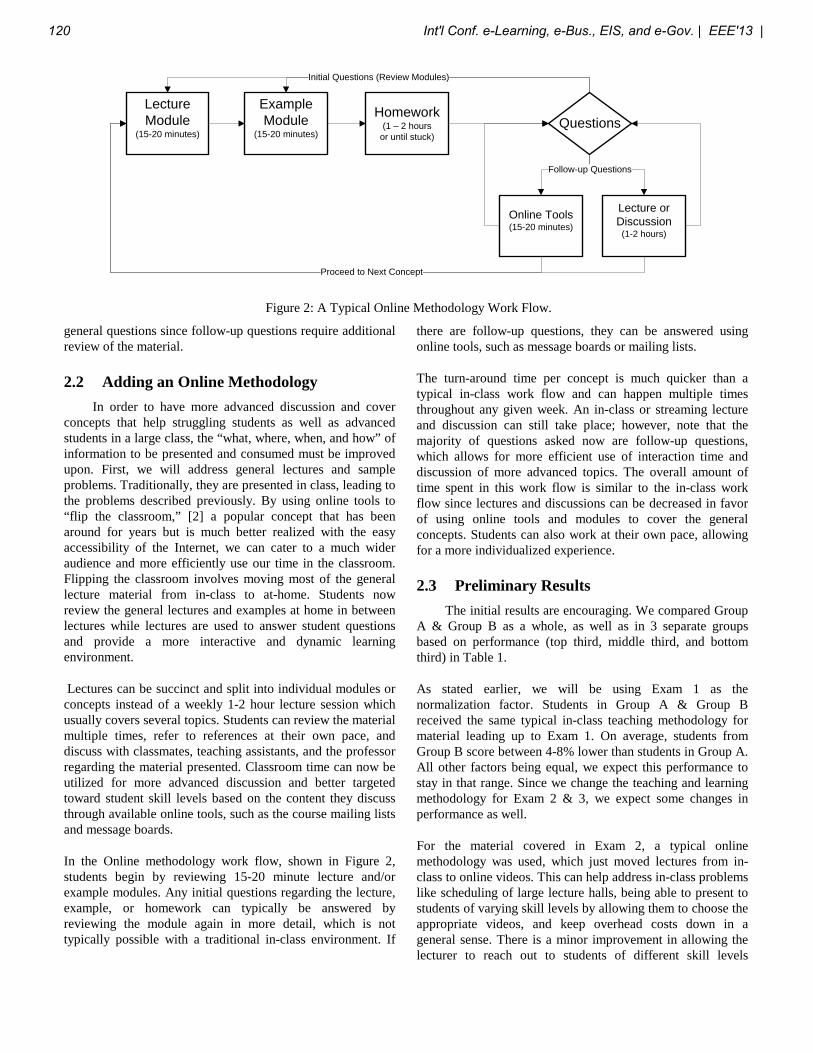
general questions since follow-up questions require additional review of the material.
2.2 Adding an Online Methodology In order to have more advanced discussion and cover concepts that help struggling students as well as advanced students in a large class, the “what, where, when, and how” of information to be presented and consumed must be improved upon. First, we will address general lectures and sample problems. Traditionally, they are presented in class, leading to the problems described previously. By using online tools to “flip the classroom,” [2] a popular concept that has been around for years but is much better realized with the easy accessibility of the Internet, we can cater to a much wider audience and more efficiently use our time in the classroom. Flipping the classroom involves moving most of the general lecture material from in-class to at-home. Students now review the general lectures and examples at home in between lectures while lectures are used to answer student questions and provide a more interactive and dynamic learning environment.
Lectures can be succinct and split into individual modules or concepts instead of a weekly 1-2 hour lecture session which usually covers several topics. Students can review the material multiple times, refer to references at their own pace, and discuss with classmates, teaching assistants, and the professor regarding the material presented. Classroom time can now be utilized for more advanced discussion and better targeted toward student skill levels based on the content they discuss through available online tools, such as the course mailing lists and message boards.
In the Online methodology work flow, shown in Figure 2, students begin by reviewing 15-20 minute lecture and/or example modules. Any initial questions regarding the lecture, example, or homework can typically be answered by reviewing the module again in more detail, which is not typically possible with a traditional in-class environment. If
there are follow-up questions, they can be answered using online tools, such as message boards or mailing lists.
The turn-around time per concept is much quicker than a typical in-class work flow and can happen multiple times throughout any given week. An in-class or streaming lecture and discussion can still take place; however, note that the majority of questions asked now are follow-up questions, which allows for more efficient use of interaction time and discussion of more advanced topics. The overall amount of time spent in this work flow is similar to the in-class work flow since lectures and discussions can be decreased in favor of using online tools and modules to cover the general concepts. Students can also work at their own pace, allowing for a more individualized experience.
2.3 Preliminary Results The initial results are encouraging. We compared Group A & Group B as a whole, as well as in 3 separate groups based on performance (top third, middle third, and bottom third) in Table 1.
As stated earlier, we will be using Exam 1 as the normalization factor. Students in Group A & Group B received the same typical in-class teaching methodology for material leading up to Exam 1. On average, students from Group B score between 4-8% lower than students in Group A. All other factors being equal, we expect this performance to stay in that range. Since we change the teaching and learning methodology for Exam 2 & 3, we expect some changes in performance as well.
For the material covered in Exam 2, a typical online methodology was used, which just moved lectures from in-class to online videos. This can help address in-class problems like scheduling of large lecture halls, being able to present to students of varying skill levels by allowing them to choose the appropriate videos, and keep overhead costs down in a general sense. There is a minor improvement in allowing the lecturer to reach out to students of different skill levels
Lecture Module
(15-20 minutes)
ExampleModule
(15-20 minutes)
Homework(1 – 2 hours
or until stuck)Questions
Initial Questions (Review Modules)
Online Tools(15-20 minutes)
Lecture or Discussion
(1-2 hours)
Follow-up Questions
Proceed to Next Concept
Figure 2: A Typical Online Methodology Work Flow.
120 Int'l Conf. e-Learning, e-Bus., EIS, and e-Gov. | EEE'13 |
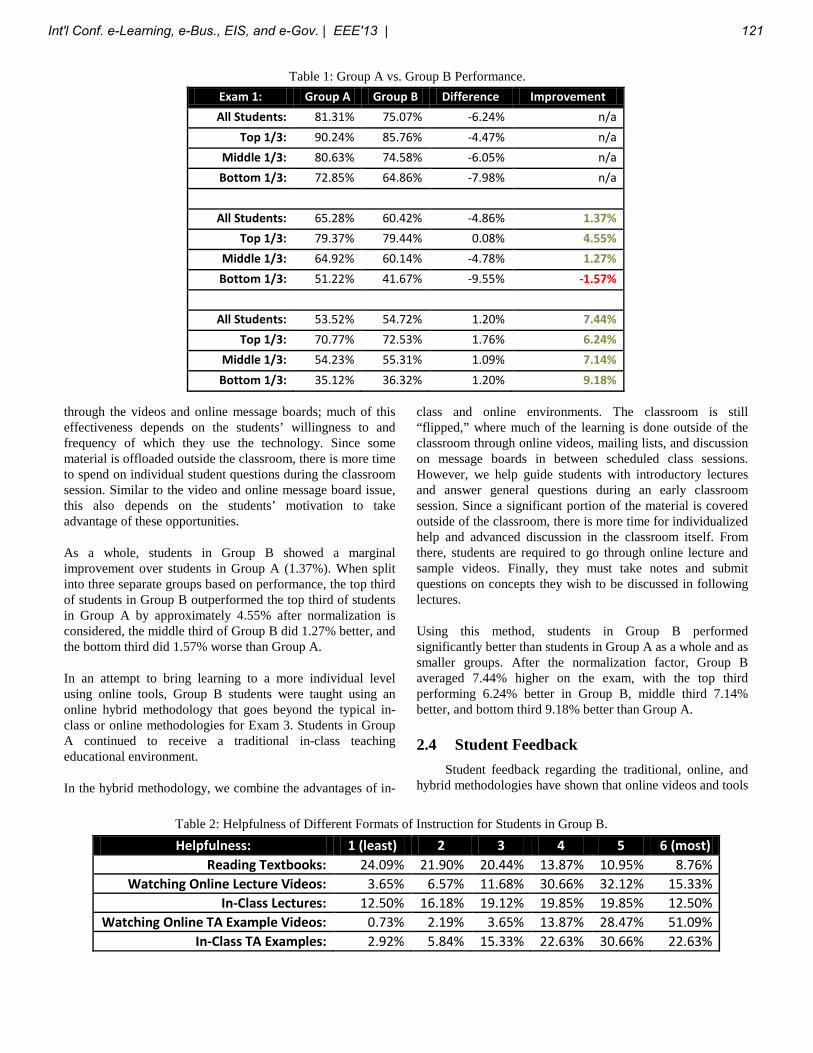
through the videos and online message boards; much of this effectiveness depends on the students’ willingness to and frequency of which they use the technology. Since some material is offloaded outside the classroom, there is more time to spend on individual student questions during the classroom session. Similar to the video and online message board issue, this also depends on the students’ motivation to take advantage of these opportunities.
As a whole, students in Group B showed a marginal improvement over students in Group A (1.37%). When split into three separate groups based on performance, the top third of students in Group B outperformed the top third of students in Group A by approximately 4.55% after normalization is considered, the middle third of Group B did 1.27% better, and the bottom third did 1.57% worse than Group A.
In an attempt to bring learning to a more individual level using online tools, Group B students were taught using an online hybrid methodology that goes beyond the typical in-class or online methodologies for Exam 3. Students in Group A continued to receive a traditional in-class teaching educational environment.
In the hybrid methodology, we combine the advantages of in-
class and online environments. The classroom is still “flipped,” where much of the learning is done outside of the classroom through online videos, mailing lists, and discussion on message boards in between scheduled class sessions. However, we help guide students with introductory lectures and answer general questions during an early classroom session. Since a significant portion of the material is covered outside of the classroom, there is more time for individualized help and advanced discussion in the classroom itself. From there, students are required to go through online lecture and sample videos. Finally, they must take notes and submit questions on concepts they wish to be discussed in following lectures.
Using this method, students in Group B performed significantly better than students in Group A as a whole and as smaller groups. After the normalization factor, Group B averaged 7.44% higher on the exam, with the top third performing 6.24% better in Group B, middle third 7.14% better, and bottom third 9.18% better than Group A.
2.4 Student Feedback Student feedback regarding the traditional, online, and hybrid methodologies have shown that online videos and tools
Table 1: Group A vs. Group B Performance.
Helpfulness: 1 (least) 2 3 4 5 6 (most) Reading Textbooks: 24.09% 21.90% 20.44% 13.87% 10.95% 8.76%
Watching Online Lecture Videos: 3.65% 6.57% 11.68% 30.66% 32.12% 15.33% In-Class Lectures: 12.50% 16.18% 19.12% 19.85% 19.85% 12.50%
Watching Online TA Example Videos: 0.73% 2.19% 3.65% 13.87% 28.47% 51.09% In-Class TA Examples: 2.92% 5.84% 15.33% 22.63% 30.66% 22.63%
Table 2: Helpfulness of Different Formats of Instruction for Students in Group B.
Exam 1: Group A Group B Difference Improvement All Students: 81.31% 75.07% -6.24% n/a
Top 1/3: 90.24% 85.76% -4.47% n/a Middle 1/3: 80.63% 74.58% -6.05% n/a Bottom 1/3: 72.85% 64.86% -7.98% n/a Exam 2: Group A Group B Difference Improvement All Students: 65.28% 60.42% -4.86% 1.37%
Top 1/3: 79.37% 79.44% 0.08% 4.55% Middle 1/3: 64.92% 60.14% -4.78% 1.27% Bottom 1/3: 51.22% 41.67% -9.55% -1.57% Exam 3: Group A Group B Difference Improvement All Students: 53.52% 54.72% 1.20% 7.44%
Top 1/3: 70.77% 72.53% 1.76% 6.24% Middle 1/3: 54.23% 55.31% 1.09% 7.14% Bottom 1/3: 35.12% 36.32% 1.20% 9.18%
Int'l Conf. e-Learning, e-Bus., EIS, and e-Gov. | EEE'13 | 121
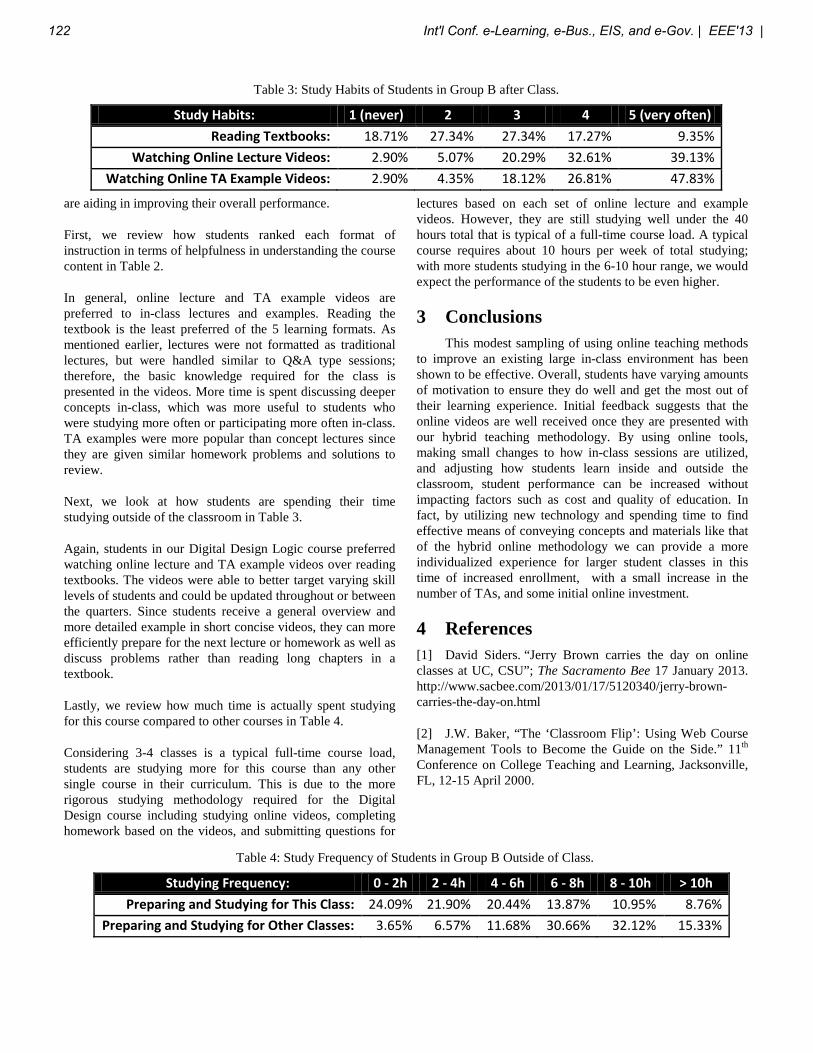
are aiding in improving their overall performance.
First, we review how students ranked each format of instruction in terms of helpfulness in understanding the course content in Table 2.
In general, online lecture and TA example videos are preferred to in-class lectures and examples. Reading the textbook is the least preferred of the 5 learning formats. As mentioned earlier, lectures were not formatted as traditional lectures, but were handled similar to Q&A type sessions; therefore, the basic knowledge required for the class is presented in the videos. More time is spent discussing deeper concepts in-class, which was more useful to students who were studying more often or participating more often in-class. TA examples were more popular than concept lectures since they are given similar homework problems and solutions to review.
Next, we look at how students are spending their time studying outside of the classroom in Table 3.
Again, students in our Digital Design Logic course preferred watching online lecture and TA example videos over reading textbooks. The videos were able to better target varying skill levels of students and could be updated throughout or between the quarters. Since students receive a general overview and more detailed example in short concise videos, they can more efficiently prepare for the next lecture or homework as well as discuss problems rather than reading long chapters in a textbook.
Lastly, we review how much time is actually spent studying for this course compared to other courses in Table 4.
Considering 3-4 classes is a typical full-time course load, students are studying more for this course than any other single course in their curriculum. This is due to the more rigorous studying methodology required for the Digital Design course including studying online videos, completing homework based on the videos, and submitting questions for
lectures based on each set of online lecture and example videos. However, they are still studying well under the 40 hours total that is typical of a full-time course load. A typical course requires about 10 hours per week of total studying; with more students studying in the 6-10 hour range, we would expect the performance of the students to be even higher.
3 Conclusions This modest sampling of using online teaching methods to improve an existing large in-class environment has been shown to be effective. Overall, students have varying amounts of motivation to ensure they do well and get the most out of their learning experience. Initial feedback suggests that the online videos are well received once they are presented with our hybrid teaching methodology. By using online tools, making small changes to how in-class sessions are utilized, and adjusting how students learn inside and outside the classroom, student performance can be increased without impacting factors such as cost and quality of education. In fact, by utilizing new technology and spending time to find effective means of conveying concepts and materials like that of the hybrid online methodology we can provide a more individualized experience for larger student classes in this time of increased enrollment, with a small increase in the number of TAs, and some initial online investment.
4 References [1] David Siders. “Jerry Brown carries the day on online classes at UC, CSU”; The Sacramento Bee 17 January 2013. http://www.sacbee.com/2013/01/17/5120340/jerry-brown-carries-the-day-on.html
[2] J.W. Baker, “The ‘Classroom Flip’: Using Web Course Management Tools to Become the Guide on the Side.” 11th Conference on College Teaching and Learning, Jacksonville, FL, 12-15 April 2000.
Table 3: Study Habits of Students in Group B after Class.
Table 4: Study Frequency of Students in Group B Outside of Class.
Study Habits: 1 (never) 2 3 4 5 (very often) Reading Textbooks: 18.71% 27.34% 27.34% 17.27% 9.35%
Watching Online Lecture Videos: 2.90% 5.07% 20.29% 32.61% 39.13% Watching Online TA Example Videos: 2.90% 4.35% 18.12% 26.81% 47.83%
Studying Frequency: 0 - 2h 2 - 4h 4 - 6h 6 - 8h 8 - 10h > 10h Preparing and Studying for This Class: 24.09% 21.90% 20.44% 13.87% 10.95% 8.76%
Preparing and Studying for Other Classes: 3.65% 6.57% 11.68% 30.66% 32.12% 15.33%
122 Int'l Conf. e-Learning, e-Bus., EIS, and e-Gov. | EEE'13 |
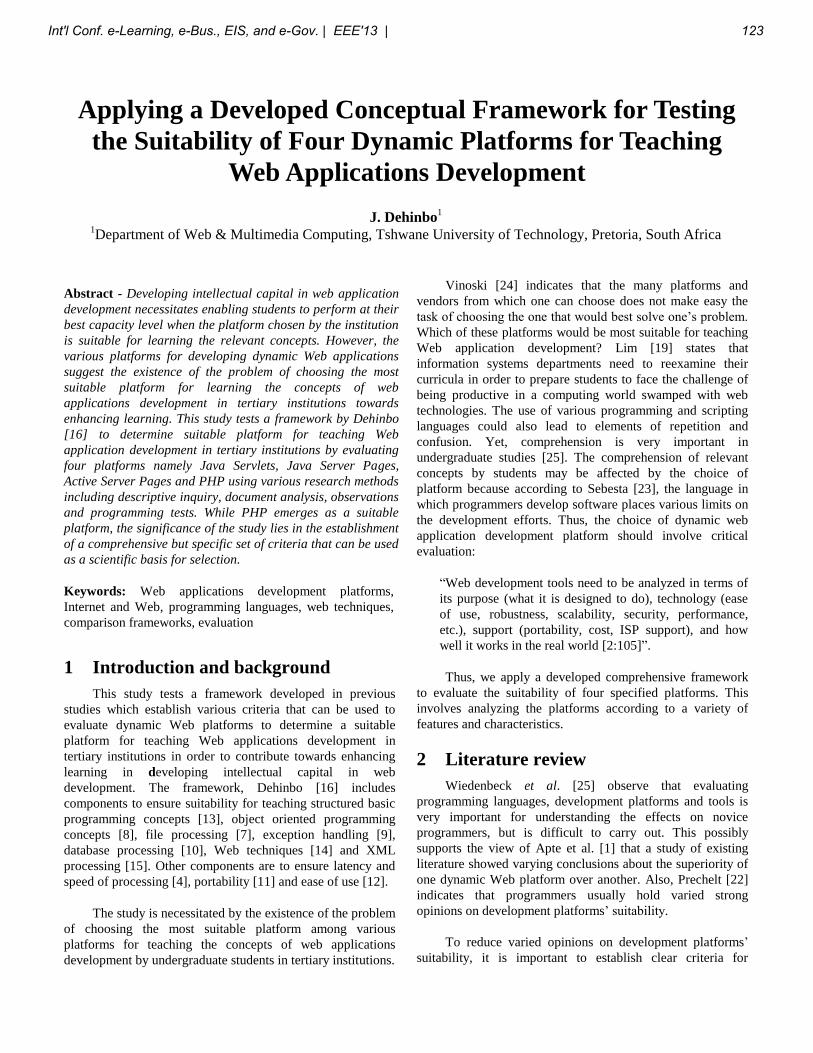
Applying a Developed Conceptual Framework for Testing
the Suitability of Four Dynamic Platforms for Teaching
Web Applications Development
J. Dehinbo1
1Department of Web & Multimedia Computing, Tshwane University of Technology, Pretoria, South Africa
Abstract - Developing intellectual capital in web application
development necessitates enabling students to perform at their
best capacity level when the platform chosen by the institution
is suitable for learning the relevant concepts. However, the
various platforms for developing dynamic Web applications
suggest the existence of the problem of choosing the most
suitable platform for learning the concepts of web
applications development in tertiary institutions towards
enhancing learning. This study tests a framework by Dehinbo
[16] to determine suitable platform for teaching Web
application development in tertiary institutions by evaluating
four platforms namely Java Servlets, Java Server Pages,
Active Server Pages and PHP using various research methods
including descriptive inquiry, document analysis, observations
and programming tests. While PHP emerges as a suitable
platform, the significance of the study lies in the establishment
of a comprehensive but specific set of criteria that can be used
as a scientific basis for selection.
Keywords: Web applications development platforms,
Internet and Web, programming languages, web techniques,
comparison frameworks, evaluation
1 Introduction and background
This study tests a framework developed in previous
studies which establish various criteria that can be used to
evaluate dynamic Web platforms to determine a suitable
platform for teaching Web applications development in
tertiary institutions in order to contribute towards enhancing
learning in developing intellectual capital in web
development. The framework, Dehinbo [16] includes
components to ensure suitability for teaching structured basic
programming concepts [13], object oriented programming
concepts [8], file processing [7], exception handling [9],
database processing [10], Web techniques [14] and XML
processing [15]. Other components are to ensure latency and
speed of processing [4], portability [11] and ease of use [12].
The study is necessitated by the existence of the problem
of choosing the most suitable platform among various
platforms for teaching the concepts of web applications
development by undergraduate students in tertiary institutions.
Vinoski [24] indicates that the many platforms and
vendors from which one can choose does not make easy the
task of choosing the one that would best solve one’s problem.
Which of these platforms would be most suitable for teaching
Web application development? Lim [19] states that
information systems departments need to reexamine their
curricula in order to prepare students to face the challenge of
being productive in a computing world swamped with web
technologies. The use of various programming and scripting
languages could also lead to elements of repetition and
confusion. Yet, comprehension is very important in
undergraduate studies [25]. The comprehension of relevant
concepts by students may be affected by the choice of
platform because according to Sebesta [23], the language in
which programmers develop software places various limits on
the development efforts. Thus, the choice of dynamic web
application development platform should involve critical
evaluation:
“Web development tools need to be analyzed in terms of
its purpose (what it is designed to do), technology (ease
of use, robustness, scalability, security, performance,
etc.), support (portability, cost, ISP support), and how
well it works in the real world [2:105]”.
Thus, we apply a developed comprehensive framework
to evaluate the suitability of four specified platforms. This
involves analyzing the platforms according to a variety of
features and characteristics.
2 Literature review
Wiedenbeck et al. [25] observe that evaluating
programming languages, development platforms and tools is
very important for understanding the effects on novice
programmers, but is difficult to carry out. This possibly
supports the view of Apte et al. [1] that a study of existing
literature showed varying conclusions about the superiority of
one dynamic Web platform over another. Also, Prechelt [22]
indicates that programmers usually hold varied strong
opinions on development platforms’ suitability.
To reduce varied opinions on development platforms’
suitability, it is important to establish clear criteria for
Int'l Conf. e-Learning, e-Bus., EIS, and e-Gov. | EEE'13 | 123
evaluation. The most important criterion for evaluating a tool
is the suitability for doing the job for which the tool is needed.
In this regard, Ashenfelter [2:105] emphasize that web
development tools need to be analyzed in terms of their
purpose. Thus, for choosing a language or platform that is
suitable for learning introductory programming, Holt et al.
[17] use the criteria that it should be appropriate for
introducing programming concepts used in the real world such
as in business, science and government; and it should
encourage systematic problem solving. Similarly, Kolling and
Rosenberg [18] suggest enabling useful concepts from
theoretical model and avoidance of conceptual redundancy, as
achieving the same thing in a variety of ways can mean
flexibility to the expert, but usually confuses beginners.
For more information on related literature review,
Dehinbo [14] presents a summarized view. A key point
observed is that choosing a suitable platform should involve
exhaustive evaluations of various options based on various
relevant criteria that are backed by scientific facts and results.
These studies relating to the established framework fill this
gap in the body of knowledge by being unique in the
following ways: The advantages and strengths of platforms
should be examined and ranked in the light of certain desired
qualities relevant to specific use such as the suitability for
teaching Web techniques. This is just as for example, the ease
of teaching increases productivity in institutions than
platform’s flexibility which could be preferable in industries.
This informs our identification of desirable concepts of Web
application development before establishing the criteria used
for the evaluations.
3 Research Design and Methodology
An interpretive research design is used involving
elements of descriptive, analytical and comparative studies.
McMillan and Schumacher [20:33] state that while a
descriptive study describes a system with the aim of
characterizing it as it is, by using numbers, comparative study
investigates the differences, thereby taking descriptive study a
step further. Therefore, a descriptive approach is used to
characterize desirable features of the platforms towards
establishing a set of criteria [16]. In applying the established
criteria, an analytical approach is used to analyze and evaluate
platforms to determine the level of satisfaction of the criteria
for learning Web concepts. Also, an experimental approach is
used to estimate the latency of the platforms.
a) The descriptive method used in establishing the framework
involves document review and study of various manuals and
textbooks for different platforms from various sources and
established body of knowledge, including those written by the
designers and originators of the platforms as well as various
websites for the applicable web servers such as Microsoft
Internet Information Server (IIS) and Apache tomcat. This is
to identify features that could enhance the teaching of
techniques in Web applications development. These features
were characterized to establish criteria for evaluating the
suitability of platforms for learning Web techniques. The
established criteria serve as a model. Bowling [3:141]
describes models as abstract representations of the essential
characteristics of phenomena of interest that make explicit,
the relationships and comparison between the characteristics.
The model for this study presented in [16] is hereby applied
for analyzing, evaluating and comparing specific platforms.
In testing the framework, the analytical method is aimed
at evaluating specific platforms to ascertain their level of
satisfaction of the established criteria. Therefore, documents
were reviewed for the specific platforms to be evaluated and
compared, and answers were sought to the questions and the
availability of features that serve as the criteria.
Moreover, experience was used to physically observe
the support for various Web techniques by the platforms.
Bowling [3:358] describes observation as a research method
in which the investigator systematically watches, listens to and
records the phenomenon of interest. Scores were then
assigned to each platform based on the availability of desired
features, the level of support enabled on specific tasks or the
inherent characteristics of the platform
Using close-ended "Yes/No" questions, the measuring
tool has values on a scale of 1 to 3, where:
3 = "Yes"; 2 = "Not quite or with minor
workaround", and 1= "No".
Establishing reliability: As a way of increasing validity,
answers to the criteria questions were sought from established
and recognized sources. The accompanying references are
provided for verification or for more information. This is
supplemented with practical experiences and programming
tests confirming the satisfaction of some of the criteria
established. Also, to increase reliability, the quantitative
characterization and evaluation using numbers would enhance
clarity in the choice of platform with the highest score. This is
unlike just using qualitative sentences to evaluate the
platforms, at the end of which it could be difficult to say
which platform is really more suitable. Furthermore,
reliability is enhanced with the scale of 1 and 3 thereby
avoiding subjective situations of distinguishing between, say,
a score of 3 or 4 on a scale of 1 to 5.
b) The latency experiment aims to estimate the execution
speed for programs written using each of the dynamic Web
platforms in order to gain information on the suitability of
these platforms for recurrent program testing in a practical
laboratory session. Dehinbo [4] presents the full details of this
experiment and then ranks the performance of the platforms.
It should be pointed out that users of the framework can
conduct their own latency experiment, as long as a ranking of
the platforms eventually emerges.
124 Int'l Conf. e-Learning, e-Bus., EIS, and e-Gov. | EEE'13 |
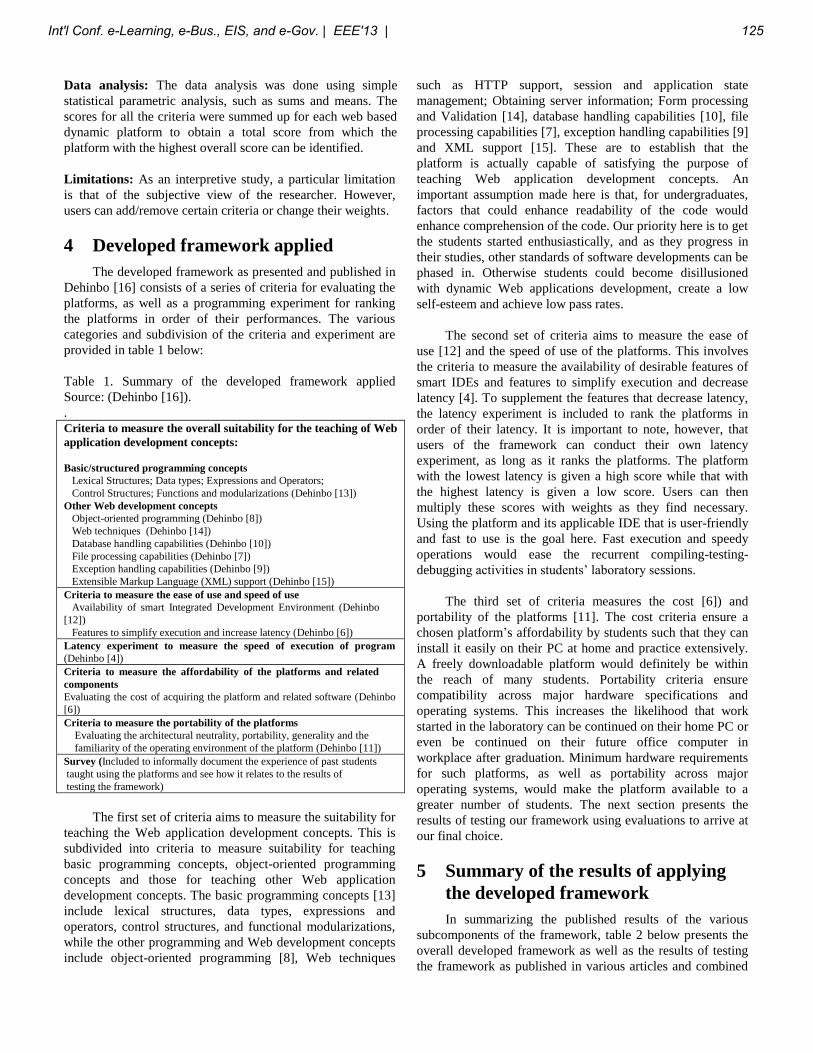
Data analysis: The data analysis was done using simple
statistical parametric analysis, such as sums and means. The
scores for all the criteria were summed up for each web based
dynamic platform to obtain a total score from which the
platform with the highest overall score can be identified.
Limitations: As an interpretive study, a particular limitation
is that of the subjective view of the researcher. However,
users can add/remove certain criteria or change their weights.
4 Developed framework applied
The developed framework as presented and published in
Dehinbo [16] consists of a series of criteria for evaluating the
platforms, as well as a programming experiment for ranking
the platforms in order of their performances. The various
categories and subdivision of the criteria and experiment are
provided in table 1 below:
Table 1. Summary of the developed framework applied
Source: (Dehinbo [16]).
.
Criteria to measure the overall suitability for the teaching of Web
application development concepts:
Basic/structured programming concepts
Lexical Structures; Data types; Expressions and Operators;
Control Structures; Functions and modularizations (Dehinbo [13])
Other Web development concepts
Object-oriented programming (Dehinbo [8])
Web techniques (Dehinbo [14])
Database handling capabilities (Dehinbo [10])
File processing capabilities (Dehinbo [7])
Exception handling capabilities (Dehinbo [9])
Extensible Markup Language (XML) support (Dehinbo [15]) Criteria to measure the ease of use and speed of use
Availability of smart Integrated Development Environment (Dehinbo
[12])
Features to simplify execution and increase latency (Dehinbo [6]) Latency experiment to measure the speed of execution of program
(Dehinbo [4])
Criteria to measure the affordability of the platforms and related
components
Evaluating the cost of acquiring the platform and related software (Dehinbo
[6]) Criteria to measure the portability of the platforms
Evaluating the architectural neutrality, portability, generality and the
familiarity of the operating environment of the platform (Dehinbo [11]) Survey (Included to informally document the experience of past students
taught using the platforms and see how it relates to the results of
testing the framework)
The first set of criteria aims to measure the suitability for
teaching the Web application development concepts. This is
subdivided into criteria to measure suitability for teaching
basic programming concepts, object-oriented programming
concepts and those for teaching other Web application
development concepts. The basic programming concepts [13]
include lexical structures, data types, expressions and
operators, control structures, and functional modularizations,
while the other programming and Web development concepts
include object-oriented programming [8], Web techniques
such as HTTP support, session and application state
management; Obtaining server information; Form processing
and Validation [14], database handling capabilities [10], file
processing capabilities [7], exception handling capabilities [9]
and XML support [15]. These are to establish that the
platform is actually capable of satisfying the purpose of
teaching Web application development concepts. An
important assumption made here is that, for undergraduates,
factors that could enhance readability of the code would
enhance comprehension of the code. Our priority here is to get
the students started enthusiastically, and as they progress in
their studies, other standards of software developments can be
phased in. Otherwise students could become disillusioned
with dynamic Web applications development, create a low
self-esteem and achieve low pass rates.
The second set of criteria aims to measure the ease of
use [12] and the speed of use of the platforms. This involves
the criteria to measure the availability of desirable features of
smart IDEs and features to simplify execution and decrease
latency [4]. To supplement the features that decrease latency,
the latency experiment is included to rank the platforms in
order of their latency. It is important to note, however, that
users of the framework can conduct their own latency
experiment, as long as it ranks the platforms. The platform
with the lowest latency is given a high score while that with
the highest latency is given a low score. Users can then
multiply these scores with weights as they find necessary.
Using the platform and its applicable IDE that is user-friendly
and fast to use is the goal here. Fast execution and speedy
operations would ease the recurrent compiling-testing-
debugging activities in students’ laboratory sessions.
The third set of criteria measures the cost [6]) and
portability of the platforms [11]. The cost criteria ensure a
chosen platform’s affordability by students such that they can
install it easily on their PC at home and practice extensively.
A freely downloadable platform would definitely be within
the reach of many students. Portability criteria ensure
compatibility across major hardware specifications and
operating systems. This increases the likelihood that work
started in the laboratory can be continued on their home PC or
even be continued on their future office computer in
workplace after graduation. Minimum hardware requirements
for such platforms, as well as portability across major
operating systems, would make the platform available to a
greater number of students. The next section presents the
results of testing our framework using evaluations to arrive at
our final choice.
5 Summary of the results of applying
the developed framework
In summarizing the published results of the various
subcomponents of the framework, table 2 below presents the
overall developed framework as well as the results of testing
the framework as published in various articles and combined
Int'l Conf. e-Learning, e-Bus., EIS, and e-Gov. | EEE'13 | 125
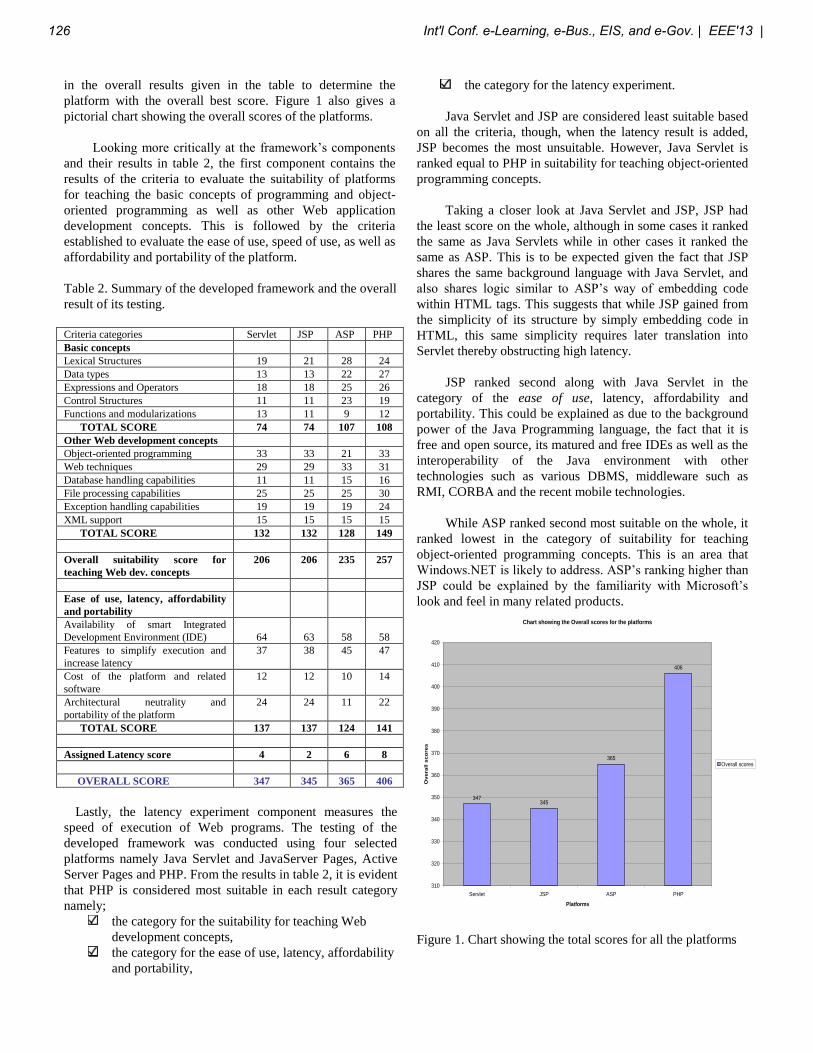
in the overall results given in the table to determine the
platform with the overall best score. Figure 1 also gives a
pictorial chart showing the overall scores of the platforms.
Looking more critically at the framework’s components
and their results in table 2, the first component contains the
results of the criteria to evaluate the suitability of platforms
for teaching the basic concepts of programming and object-
oriented programming as well as other Web application
development concepts. This is followed by the criteria
established to evaluate the ease of use, speed of use, as well as
affordability and portability of the platform.
Table 2. Summary of the developed framework and the overall
result of its testing.
Criteria categories Servlet JSP ASP PHP
Basic concepts
Lexical Structures 19 21 28 24
Data types 13 13 22 27
Expressions and Operators 18 18 25 26
Control Structures 11 11 23 19
Functions and modularizations 13 11 9 12
TOTAL SCORE 74 74 107 108
Other Web development concepts
Object-oriented programming 33 33 21 33
Web techniques 29 29 33 31
Database handling capabilities 11 11 15 16
File processing capabilities 25 25 25 30
Exception handling capabilities 19 19 19 24
XML support 15 15 15 15
TOTAL SCORE 132 132 128 149
Overall suitability score for
teaching Web dev. concepts
206 206 235 257
Ease of use, latency, affordability
and portability
Availability of smart Integrated
Development Environment (IDE)
64
63
58
58
Features to simplify execution and
increase latency
37 38 45 47
Cost of the platform and related
software
12 12 10 14
Architectural neutrality and
portability of the platform
24 24 11 22
TOTAL SCORE 137 137 124 141
Assigned Latency score 4 2 6 8
OVERALL SCORE 347 345 365 406
Lastly, the latency experiment component measures the
speed of execution of Web programs. The testing of the
developed framework was conducted using four selected
platforms namely Java Servlet and JavaServer Pages, Active
Server Pages and PHP. From the results in table 2, it is evident
that PHP is considered most suitable in each result category
namely;
the category for the suitability for teaching Web
development concepts,
the category for the ease of use, latency, affordability
and portability,
the category for the latency experiment.
Java Servlet and JSP are considered least suitable based
on all the criteria, though, when the latency result is added,
JSP becomes the most unsuitable. However, Java Servlet is
ranked equal to PHP in suitability for teaching object-oriented
programming concepts.
Taking a closer look at Java Servlet and JSP, JSP had
the least score on the whole, although in some cases it ranked
the same as Java Servlets while in other cases it ranked the
same as ASP. This is to be expected given the fact that JSP
shares the same background language with Java Servlet, and
also shares logic similar to ASP’s way of embedding code
within HTML tags. This suggests that while JSP gained from
the simplicity of its structure by simply embedding code in
HTML, this same simplicity requires later translation into
Servlet thereby obstructing high latency.
JSP ranked second along with Java Servlet in the
category of the ease of use, latency, affordability and
portability. This could be explained as due to the background
power of the Java Programming language, the fact that it is
free and open source, its matured and free IDEs as well as the
interoperability of the Java environment with other
technologies such as various DBMS, middleware such as
RMI, CORBA and the recent mobile technologies.
While ASP ranked second most suitable on the whole, it
ranked lowest in the category of suitability for teaching
object-oriented programming concepts. This is an area that
Windows.NET is likely to address. ASP’s ranking higher than
JSP could be explained by the familiarity with Microsoft’s
look and feel in many related products.
Chart showing the Overall scores for the platforms
347345
365
406
310
320
330
340
350
360
370
380
390
400
410
420
Servlet JSP ASP PHP
Platforms
Overa
ll s
co
res
Overall scores
Figure 1. Chart showing the total scores for all the platforms
126 Int'l Conf. e-Learning, e-Bus., EIS, and e-Gov. | EEE'13 |
Pedagogically, ASP and PHP, from experience, seem to
be more suitable for teaching and learning Web techniques
due to the simplicity of their commands and functions. In
summary, applying the established criteria reveals that PHP
has the highest score followed by ASP and then the Java-
based platforms. It should however be noted that the scores
are subjectively based on the author’s knowledge and
experience as well as the current design version of the
platforms. They are thus subject to change.
Therefore, the emphasis of this study is on the
establishment of the criteria that enables the selection among
the platforms. Users can thus adapt these criteria to their own
taste and can also test or apply the criteria on other platforms.
Finally, it is worthy to note that the ranking of the
overall results, as shown in figure 1 above, differs slightly
from the trend in the rankings in the results of the survey. The
difference is that the survey results for JSP are higher than
those for Java Servlets. This could be because students are
interested in the simplicity of structure in JSP and have little
regard for other important criteria. This highlights the
relevance of the study as it considers results using various
criteria and looks at the research problem from different
angles.
6 Conclusions
We applied a conceptual framework that can be used to
determine a suitable platform for teaching dynamic Web
applications development in tertiary institutions. The
framework has taken into consideration the need to satisfy
certain requirements that are considered important to the
effective comprehension of Web application development
concepts. These are aimed at ensuring: effective teaching of
dynamic Web applications development concepts; suitability
for real life programming that students will be exposed to as
they graduate; affordability to allow for individual ownership
of the chosen platform by students, so that they can practice
on their own.
Other requirements that are considered important are: to
enhance comprehension by using commands that have a
reasonable number of unique basic syntactical components
with syntax, semantics and meanings that make commands
easy to remember; allowing an efficient teaching environment
by ensuring suitability for completing tasks within a
reasonable time period with features that promote good
readability of code, tracing and debugging aids with useful
and smart integrated editing environments equipped with
context sensitive helps.
Further affordability is ensured through the requirements
for the use of minimum disk space and memory resources,
with simpler architecture to facilitate speedy operations, and
simpler execution steps because of higher-level commands as
well as ensuring portability among major operating systems
through the affordability, architectural neutrality, generality
and familiarity of the operating environment.
The results of applying the framework indicate that out
of the four dynamic Web platforms evaluated, PHP is
considered most suitable. This could probably be due to the
fact that it is suitable for teaching structured programming,
object oriented programming as well as web application
development concepts. Moreover, it is a Free and Open
Source Software (FOSS) that is free both in cost and license’s
freedom to modify source code. Furthermore, PHP is portable
and equipped with a free easy-to-use IDE as well as free
DBMS (MySQL). It also supports various Web servers,
DBMS and interoperates with other technologies.
7 Recommendations
Based on the essence of this study, it is recommended
that comparisons of platforms be done with specific uses and
criteria in mind. Rather than merely listing the advantages and
strengths of each platform in a comparison, the advantages
and strengths of each platform should be examined and
ranked in the light of certain desired qualities relevant to
specific “context of use”. This is because certain strengths
may be of highest priority to specific “context of use” only.
For example, at the University of Technologies, the ease of
learning a programming language increases our productivity
more than the flexibility of the programming language or
platform.
8 Research contributions
While not aimed at persuading readers that one dynamic
Web platform is better than another, the main contribution of
the research is to help readers make a more informed decision
on which platform is more suitable for teaching Web
application development in tertiary institutions. This implies
that the framework ensures that although the chosen platform
may or may not be the most powerful or most common in the
market, it is the one that has features that contribute to the
accomplishment of Web application development expertise by
students in tertiary institutions. Further contributions emanate
from the insights provided into the analysis of various features
of specified platforms.
We need no longer have to rely only on features
promised by the platform development teams, since according
to Olivier [21:41], such might contain marketing or publicity
hype. Neither do we have to rely simply on general
comparisons. The choice of a platform using our developed
framework provides a level of certainty with a systematic way
of choosing a suitable dynamic Web platform to enhance
teaching of Web application development in tertiary
institutions. This provides the possibility of increasing the
learners’ potential in such a way that could lead to developed
intellectual capital and higher productivity.
Int'l Conf. e-Learning, e-Bus., EIS, and e-Gov. | EEE'13 | 127
9 References
[1] Apte, V., Hansen, T. and Reeser, P. (2003)
“Performance comparison of dynamic Web platforms.”
Computer Communications. Vol. 26, No. 8, pp. 888 – 898.
[2] Ashenfelter, J.P. (1999). "Choosing a Database for
Your Web Site", USA : Wiley Computer Publishing.
[3] Bowling, A. (2002). "Research methods in health".
2nd
edition. UK: Open University Press.
[4] Dehinbo, J. (2005). "The performance of web-based
2-tier middleware systems". Journal of Issues in Informing
Science and Information Technology. Vol. 2, No. 2005, pp.
757-769. Online. Available from
http://2005papers.iisit.org/I59f23dehin.pdf Retrieved
13/05/05.
[5] Dehinbo. J. (2006a). "Determining a suitable
programming language for the B.Tech. degree in Computer
studies dept, TNG.", In: Proceedings of the Information
Systems Education conference (ISECON). Held in Dallas, TX.
USA. 2-5 November 2006. Online. Available from
http://isedj.org/isecon/2006/3144/ISECON.2006.Dehinbo.pdf
[6] Dehinbo, J. (2006b). "Towards a framework for
determining a platform for teaching Web application
development in tertiary institutions in South Africa". MSc
Dissertation. Unpublished. School of Computing, UNISA,
Pretoria.
[7] Dehinbo. J. (2007). "Evaluating the suitability of
dynamic Web platforms for teaching File Information
processing". In: R. Carlsen et al. (Eds.), Proceedings of
Society for Information Technology and Teacher Education
International Conference (SITE). ISBN: 1-880094-51-4. Vol.
2007, No. 1, pp. 2985-2992. Chesapeake, VA: AACE. Held in
San Antonio, Texas. USA. 27-31 March 2007. Online.
Available from: http://www.editlib.org/p/25060
[8] Dehinbo. J. (2008). "Evaluating the suitability of
dynamic Web platforms for teaching object-oriented
programming". In: K. McFerrin et al. (Eds.), Proceedings of
Society for Information Technology and Teacher Education
International Conference (SITE). ISBN: 1-880094-51-4. Vol.
2008, No. 1, pp. 3729-3735. Chesapeake, VA: AACE. Held in
Las Vegas, NV. 3-7 March 2008. Online.
http://www.editlib.org/p/27828.
[9] Dehinbo. J. (2009a). "Evaluating the suitability of
dynamic Web platforms for teaching Exception handling".
Information Systems Education Journal. Vol. 7, No. 12, pp.
1-13. ISSN: 1545-679X. Available online.
http://isedj.org/7/12/ISEDJ.7(12).Dehinbo.pdf Retrieved
24/03/09.
[10] Dehinbo. J. (2009b). "Establishing and applying the
criteria for evaluating the suitability of dynamic Web
platforms for teaching Database processing concepts". In:
Proceedings of the Information Systems Education
conference (ISECON). Held in Crystal City/Washington, DC.
USA. 5-8 November 2009. Online.
http://proc.isecon.org/2009/3752/ISECON.2009.Dehinbo.pdf
[11] Dehinbo. J. (2010). "Establishing and applying
criteria for evaluating the portability of dynamic e-learning
development platforms in tertiary institutions". In J. Sanchez
& K. Zhang (Eds.), Proceedings of World Conference on E-
Learning in Corporate, Government, Healthcare, and Higher
Education Vol. 2010, No. 1, pp. 467-474. Chesapeake, VA:
AACE. Held in Orlando, FL. 18-22 October, 2010. Online.
http://www.editlib.org/p/35589
[12] Dehinbo. J. (2011a). "Establishing and Applying
Criteria for Evaluating the Ease of Use of Dynamic Platforms
for Teaching Web Application Development". Information
Systems Education Journal. Vol. 9, No. 5, pp. 86-96. October
2011. Available online. http://isedj.org/2011-
9/N5/ISEDJVol9No5.pdf ISSN: 1545-679X Retrieved
24/07/2011.
[13] Dehinbo. J. (2011b). "Establishing criteria for
evaluating the suitability of Web application development
platforms for teaching basic programming concepts". In: M.
Koehler & P. Mishra (Eds.), Proceedings of Society for
Information Technology & Teacher Education International
Conference, Vol. 2011, No. 1, pp. 1795-1802. Chesapeake,
VA: AACE. Held in Nashville, TN. USA. 7-11 March 2011.
Online. http://www.editlib.org/p/36558
[14] Dehinbo. J. (2011c). "Establishing the suitability of
dynamic Web application development platforms for learning
Web techniques". In: Proceedings of the 2nd
International
Conference on Information Management and Evaluation
(ICIME 2011), Held in Toronto, Canada, 27-28 April 2011.
Online. Available from http://www.academic-
conferences.org/icime/icime2011/icime11-proceedings.htm
[15] Dehinbo. J. (2012). "Suitability for teaching
Extensible Markup Language (XML) processing in selecting
dynamic Web platform for teaching Web application
development". In P. Resta (Ed.), Proceedings of Society for
Information Technology & Teacher Education International
Conference, pp. 1722-1728. Chesapeake, VA: AACE. Held in
Austin, TX. USA. 5-9 March 2012. Online. Available from
http://www.editlib.org/p/39837
[16] Dehinbo. J. (2013). "A comprehensive framework for
establishing dynamic Web platform for teaching Web
application development in tertiary institutions". In : R.
McBride & M. Searson (Eds.), Proceedings of Society for
Information Technology & Teacher Education International
Conference (SITE 2013), pp. 2063-2069. Chesapeake, VA:
128 Int'l Conf. e-Learning, e-Bus., EIS, and e-Gov. | EEE'13 |
AACE. Held in New Orleans. USA. 25-29 March 2013.
Online. Available from http://www.editlib.org/p/48407
[17] Holt, R., Wortman, D., Barnard, D. and Cordy, J.R.
(1977) “SP/k: a system for teaching computer programming.”,
Communications of the ACM. Vol. 20, No. 5, pp. 301-309.
[18] Kolling, M. and Rosenberg, A. (1996) “Blue: A
language for teaching object-oriented programming.” In :
Proceedings of the 27th SIGCSE Technical Symposium on
Computer Science Education, Philadelphia. New York.
pp.190-194.
[19] Lim, B.L. (2002). "Teaching web development
technologies: Past, present, and (near) future". Journal of
Information Systems Education. Vol. 13, No. 2, pp. 117-123.
[20] McMillan, J.H. and Schumacher, S. (2001).
"Research in education". 5th
edition. USA: Addison Wesley
Longman, Inc.
[21] Olivier, M.S. (1999). "Information Technology
Research: A Practical Guide", 2nd
edition. Pretoria: Van
Schaik.
[22] Prechelt, L. (2000). "An Empirical Comparison of
Seven Programming Languages". Computer. Vol. 33, No. 10,
pp. 23-29.
[23] Sebesta, R.W. 1996. "Concepts of Programming
Languages", 3rd
ed. USA: Addison-Wesley Publishing
Company.
[24] Vinoski, S. (2003). “The performance presumption”,
IEEE Internet Computing. Vol. 7, No. 2, pp. 88-90.
[25] Wiedenbeck, S., Ramalingam, V., Sarasamma, S. and
Corritore, C.L. (1999). "A comparison of the comprehension
of object-oriented and procedural programs by novice
programmers". Interacting with Computers. Vol. 11, No. 3,
pp. 252-282.
Int'l Conf. e-Learning, e-Bus., EIS, and e-Gov. | EEE'13 | 129

An Investigation in the Impact of Mobile Learning on
today’s Educational Environment
Faisal Manga, Joan Lu
Department of Informatics, University of Huddersfield, Huddersfield, West Yorkshire, United Kingdom
Abstract - Integrating mobile learning with pervasive
learning may change the education environment and open
new doors to possible opportunities in the coming years.
This paper will consist of a literature review, mobile
education, technologies used to deliver content, present
findings, discussions, and an evaluation. It concludes that
technology-enhanced learning encourages student
engagement. However, the limitations of current mobile
technologies do cause the barriers on the adoption of the
new technology in a wide range of classrooms and
learning environments.
Keywords: Audience Response Systems, e-Learning, m-
Learning, Individual Response System, Pervasive Mobile
Learning
1 Introduction
The 21st Century has seen a vast growth in
technologies [20]. Introducing new technologies has
transformed education in terms of learning and teaching
[6]. It has transformed the way in which people are able to
share and access information with the introduction of
social networking sites and various sharing platforms that
allow users to share the information over the Internet.
Having the latest technologies such as Smartphone
and tablets allows learners to learn from any location at any
given time. Web based learning tends to be an integration
of e-Learning and m-Learning together. The idea of
introducing mobile devices has enriched student
experiences and enhances their educational environment.
Various tools and technologies allow students to adapt
themselves into new learning environments.
Technology has advanced over the years. New
technologies are being introduced to the market on a
regular basis but customers are finding it hard to stay with
the current trends, because the technology market has
changed rapidly with the introduction of touch screen
Smartphone and tablets [17]. Having introduced these
devices, they are turning out to be more popular than
desktops seen as more consumers are buying tablets, as
they are easy to carry around wherever you go.
The way in which lessons used to be taught before has
been changed [6]. The days when staff used to educate
students with text books and blackboards are possibly no
longer apparent [3]. Back then the technology was limited
[3], because nowadays staff are integrating technology and
learning together, however some staff feel that using too
much technology may have a negative impact on the
students, academia and the educational environment.
This paper presents some investigation in the impact
of Mobile Learning on today‟s Educational Environment.
Due to the rapid increase in technologies, learners are able
to learn at any place at any given time as long as they have
an Internet connection. With pervasive learning, the learner
is able to access information based on their location, and
learning materials can be accessed on their smart phone
devices.
2 Background
As there is no single definition of mobile learning,
IADIS [8] define mobile learning as:
“Any educational provision where the sole or dominant
technologies are handheld or palmtop devices.”
The above definition states that mobile learning can
be done via smartphones, tablets and other mobile
technologies.
The history of mobile learning dates back to the
1990s where Apple Classrooms of Tomorrow (ACOT)
were in partnership with Orange Grove Middle school, who
are based in Arizona [4]. The name of the project was
“Wireless Coyote”; the aim of this project was to see how
staff and students would use mobile computers that were
connected by Wireless Local Area Network (WLAN) and
Wide Area Network (WAN) [4]. The study consisted of
different people ranging from 6th grade students, teachers
and research personnel who were from Apple Computer
[4]. The group created their own program where real time
130 Int'l Conf. e-Learning, e-Bus., EIS, and e-Gov. | EEE'13 |

data was shared, as well as having voice-activated walkie-
talkies so students were able to discuss their findings [4].
In the mid 2002 – 2003 there was a project where 150
teachers from 30 schools in England took part in [14]. The
teachers were asked to evaluate different devices such as
PDAs, laptops and mobile phones. Part of the test was to
see that would help support staff in their teaching. Some of
the advantages from the project were how portable the
devices were, and the cost was cheaper for PDAs compared
to using laptops. There were some disadvantages such as
the screen was small, not enough technical support, and
problems occurred when connecting with the networks
[14].
Two other projects were conducted one focused on
“Learning2Go” which was conducted in Wolverhampton
(UK) and the other one was “Hand-e-Learning” which was
carried out in Bristol (UK) [14]. Both the projects ensured
that both the staff and the students carried a mobile device
with them [14]. Funding and support were provided by the
parents for these projects to be tested out [14]. Project was
re-launched again after undergoing some changes, the
study found that the students could carry the portable
devices where ever they went, large amount of data could
be stored such as notes from the lesson and maybe tasks
which needed to be completed [14].
3 Mobile Education
There still isn‟t one single definition of mobile
learning that is something which will be determined in the
future when mobile learning becomes more evolved and
effective in everyday practice.
Who would have thought that technology would have
moved at a rapid pace, especially if you look at the Internet
which was developed in the 1960s? [12].
A quote once said by a former US President [16],
was:
“You’re talking about the Internet, you’re talking about
cell phones, and you’re talking about computers.”
The quote was mentioned in 2001, since then the field
of technology has vastly improved. A newspaper article
mentioned in the Guardian stated that mobile learning has
the potential to improve education and the way it is
accessed in developing countries [16]. Allowing mobile
learning in developing countries allows young students to
explore the life of education and face the employment
challenges [16]. By introducing mobile learning it
improves not only for the student but also benefits staff and
the way which education is looked at from a different
perspective [16] [9].
3.1 Introducing mobile education at
Colleges & Universities
If mobile learning was introduced at
College/Universities it would be a better opportunity due
the size of some classes [19]. Especially for top
Universities where there are a few hundred students. With
the infrastructure and the money, which is spent at a
University, compared to a College it would benefit
students, seen as they would move around the campus but
still be connected to the University Wi-Fi [19].
Mobile learning (m-Learning) is when a learner isn‟t
in a specific location, the user can be anywhere at any time.
Many people nowadays carry the latest gadgets ranging
from smart mobile phones to the latest tablets, whether they
are using 3G networks or even the latest 4G Network [7].
In this day and age it‟s possible for students to
communicate through the FaceTime feature which is
available on the iPhone, or even the latest form of video
calling Skype [18]. As of January, statistics show that there
are over 31 million users worldwide who use this service
[18]. You can be at any side of the world but as long as you
have an Internet connection you can talk to family and
friends. You can discuss your work with your friends and
have discussion on certain topics [18].
3.2 Mobile Education Frame Model
A model for framing mobile learning has been created
by Koole [1] [13]. The model looks at the technical aspects
of mobile devices as well as the social and the personal
aspects of learning. The FRAME model looks at the
learning experiences using a mobile device. Information is
consumed whether it‟s done individually or done
collectively [1].
Below Table 1, Table 2 shows the different
characteristics of mobile learning and the different suitable
devices for mobile learning.
Int'l Conf. e-Learning, e-Bus., EIS, and e-Gov. | EEE'13 | 131
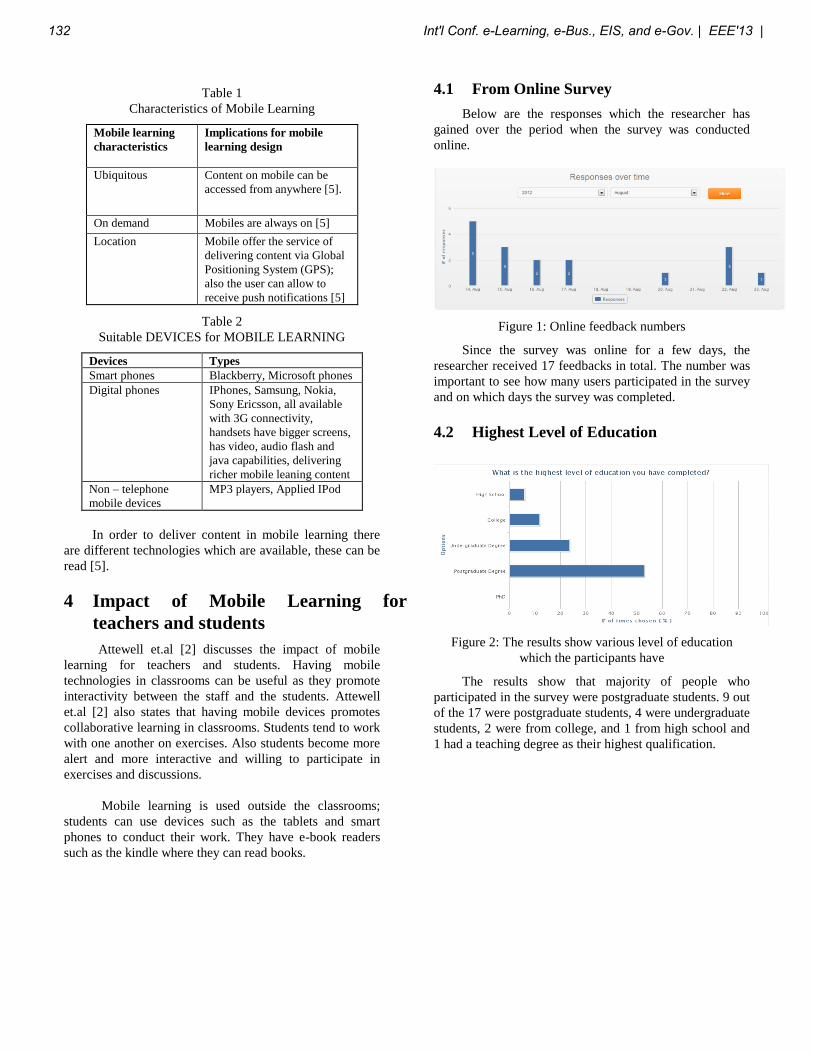
Table 1
Characteristics of Mobile Learning
Mobile learning
characteristics
Implications for mobile
learning design
Ubiquitous Content on mobile can be
accessed from anywhere [5].
On demand Mobiles are always on [5]
Location Mobile offer the service of
delivering content via Global
Positioning System (GPS);
also the user can allow to
receive push notifications [5]
Table 2
Suitable DEVICES for MOBILE LEARNING
Devices Types
Smart phones Blackberry, Microsoft phones
Digital phones IPhones, Samsung, Nokia,
Sony Ericsson, all available
with 3G connectivity,
handsets have bigger screens,
has video, audio flash and
java capabilities, delivering
richer mobile leaning content
Non – telephone
mobile devices
MP3 players, Applied IPod
In order to deliver content in mobile learning there
are different technologies which are available, these can be
read [5].
4 Impact of Mobile Learning for
teachers and students
Attewell et.al [2] discusses the impact of mobile
learning for teachers and students. Having mobile
technologies in classrooms can be useful as they promote
interactivity between the staff and the students. Attewell
et.al [2] also states that having mobile devices promotes
collaborative learning in classrooms. Students tend to work
with one another on exercises. Also students become more
alert and more interactive and willing to participate in
exercises and discussions.
Mobile learning is used outside the classrooms;
students can use devices such as the tablets and smart
phones to conduct their work. They have e-book readers
such as the kindle where they can read books.
4.1 From Online Survey
Below are the responses which the researcher has
gained over the period when the survey was conducted
online.
Figure 1: Online feedback numbers
Since the survey was online for a few days, the
researcher received 17 feedbacks in total. The number was
important to see how many users participated in the survey
and on which days the survey was completed.
4.2 Highest Level of Education
Figure 2: The results show various level of education
which the participants have
The results show that majority of people who
participated in the survey were postgraduate students. 9 out
of the 17 were postgraduate students, 4 were undergraduate
students, 2 were from college, and 1 from high school and
1 had a teaching degree as their highest qualification.
132 Int'l Conf. e-Learning, e-Bus., EIS, and e-Gov. | EEE'13 |
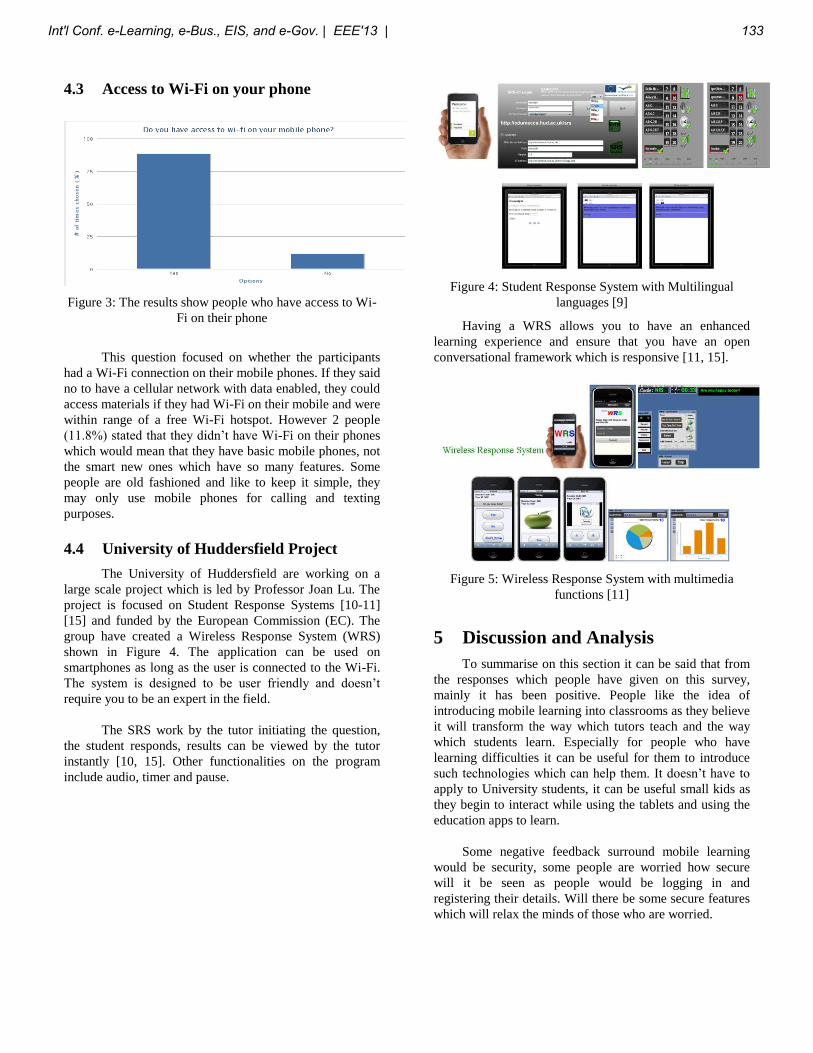
4.3 Access to Wi-Fi on your phone
Figure 3: The results show people who have access to Wi-
Fi on their phone
This question focused on whether the participants
had a Wi-Fi connection on their mobile phones. If they said
no to have a cellular network with data enabled, they could
access materials if they had Wi-Fi on their mobile and were
within range of a free Wi-Fi hotspot. However 2 people
(11.8%) stated that they didn‟t have Wi-Fi on their phones
which would mean that they have basic mobile phones, not
the smart new ones which have so many features. Some
people are old fashioned and like to keep it simple, they
may only use mobile phones for calling and texting
purposes.
4.4 University of Huddersfield Project
The University of Huddersfield are working on a
large scale project which is led by Professor Joan Lu. The
project is focused on Student Response Systems [10-11]
[15] and funded by the European Commission (EC). The
group have created a Wireless Response System (WRS)
shown in Figure 4. The application can be used on
smartphones as long as the user is connected to the Wi-Fi.
The system is designed to be user friendly and doesn‟t
require you to be an expert in the field.
The SRS work by the tutor initiating the question,
the student responds, results can be viewed by the tutor
instantly [10, 15]. Other functionalities on the program
include audio, timer and pause.
Figure 4: Student Response System with Multilingual
languages [9]
Having a WRS allows you to have an enhanced
learning experience and ensure that you have an open
conversational framework which is responsive [11, 15].
Figure 5: Wireless Response System with multimedia
functions [11]
5 Discussion and Analysis
To summarise on this section it can be said that from
the responses which people have given on this survey,
mainly it has been positive. People like the idea of
introducing mobile learning into classrooms as they believe
it will transform the way which tutors teach and the way
which students learn. Especially for people who have
learning difficulties it can be useful for them to introduce
such technologies which can help them. It doesn‟t have to
apply to University students, it can be useful small kids as
they begin to interact while using the tablets and using the
education apps to learn.
Some negative feedback surround mobile learning
would be security, some people are worried how secure
will it be seen as people would be logging in and
registering their details. Will there be some secure features
which will relax the minds of those who are worried.
Int'l Conf. e-Learning, e-Bus., EIS, and e-Gov. | EEE'13 | 133
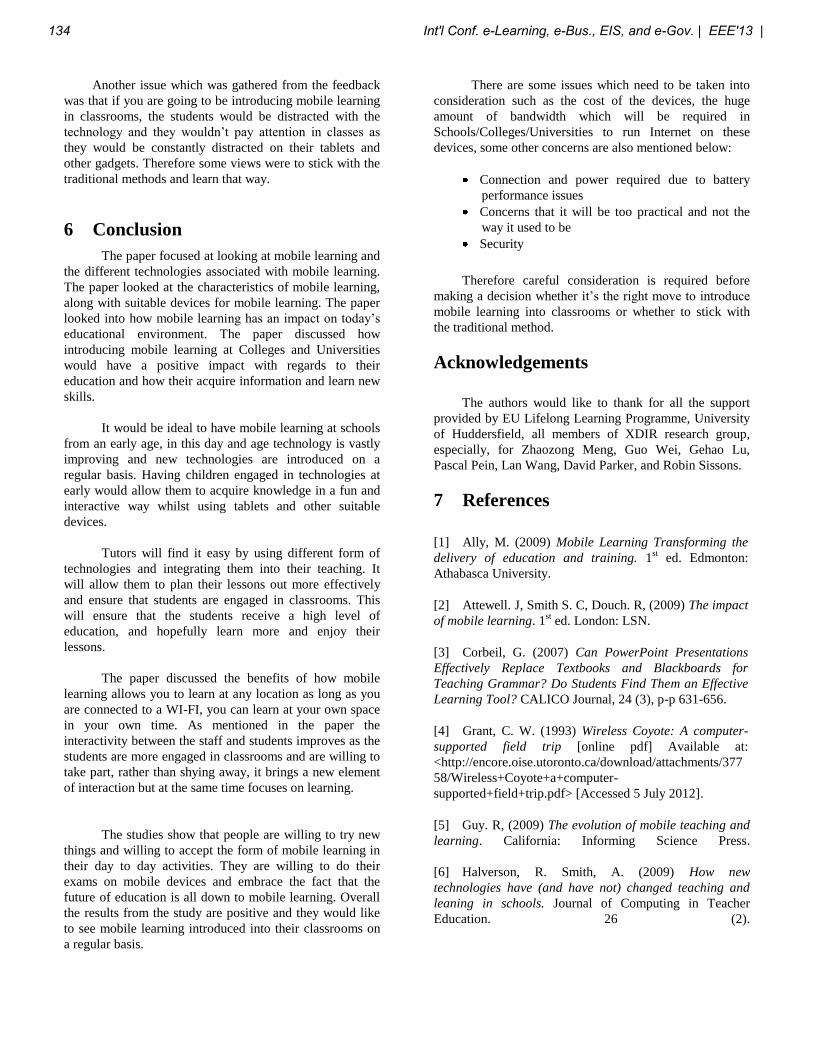
Another issue which was gathered from the feedback
was that if you are going to be introducing mobile learning
in classrooms, the students would be distracted with the
technology and they wouldn‟t pay attention in classes as
they would be constantly distracted on their tablets and
other gadgets. Therefore some views were to stick with the
traditional methods and learn that way.
6 Conclusion
The paper focused at looking at mobile learning and
the different technologies associated with mobile learning.
The paper looked at the characteristics of mobile learning,
along with suitable devices for mobile learning. The paper
looked into how mobile learning has an impact on today‟s
educational environment. The paper discussed how
introducing mobile learning at Colleges and Universities
would have a positive impact with regards to their
education and how their acquire information and learn new
skills.
It would be ideal to have mobile learning at schools
from an early age, in this day and age technology is vastly
improving and new technologies are introduced on a
regular basis. Having children engaged in technologies at
early would allow them to acquire knowledge in a fun and
interactive way whilst using tablets and other suitable
devices.
Tutors will find it easy by using different form of
technologies and integrating them into their teaching. It
will allow them to plan their lessons out more effectively
and ensure that students are engaged in classrooms. This
will ensure that the students receive a high level of
education, and hopefully learn more and enjoy their
lessons.
The paper discussed the benefits of how mobile
learning allows you to learn at any location as long as you
are connected to a WI-FI, you can learn at your own space
in your own time. As mentioned in the paper the
interactivity between the staff and students improves as the
students are more engaged in classrooms and are willing to
take part, rather than shying away, it brings a new element
of interaction but at the same time focuses on learning.
The studies show that people are willing to try new
things and willing to accept the form of mobile learning in
their day to day activities. They are willing to do their
exams on mobile devices and embrace the fact that the
future of education is all down to mobile learning. Overall
the results from the study are positive and they would like
to see mobile learning introduced into their classrooms on
a regular basis.
There are some issues which need to be taken into
consideration such as the cost of the devices, the huge
amount of bandwidth which will be required in
Schools/Colleges/Universities to run Internet on these
devices, some other concerns are also mentioned below:
Connection and power required due to battery
performance issues
Concerns that it will be too practical and not the
way it used to be
Security
Therefore careful consideration is required before
making a decision whether it‟s the right move to introduce
mobile learning into classrooms or whether to stick with
the traditional method.
Acknowledgements
The authors would like to thank for all the support
provided by EU Lifelong Learning Programme, University
of Huddersfield, all members of XDIR research group,
especially, for Zhaozong Meng, Guo Wei, Gehao Lu,
Pascal Pein, Lan Wang, David Parker, and Robin Sissons.
7 References
[1] Ally, M. (2009) Mobile Learning Transforming the
delivery of education and training. 1st ed. Edmonton:
Athabasca University.
[2] Attewell. J, Smith S. C, Douch. R, (2009) The impact
of mobile learning. 1st ed. London: LSN.
[3] Corbeil, G. (2007) Can PowerPoint Presentations
Effectively Replace Textbooks and Blackboards for
Teaching Grammar? Do Students Find Them an Effective
Learning Tool? CALICO Journal, 24 (3), p-p 631-656.
[4] Grant, C. W. (1993) Wireless Coyote: A computer-
supported field trip [online pdf] Available at:
<http://encore.oise.utoronto.ca/download/attachments/377
58/Wireless+Coyote+a+computer-
supported+field+trip.pdf> [Accessed 5 July 2012].
[5] Guy. R, (2009) The evolution of mobile teaching and
learning. California: Informing Science Press.
[6] Halverson, R. Smith, A. (2009) How new
technologies have (and have not) changed teaching and
leaning in schools. Journal of Computing in Teacher
Education. 26 (2).
134 Int'l Conf. e-Learning, e-Bus., EIS, and e-Gov. | EEE'13 |

[7] HT Media Ltd. (2012) „Airtel introduces 4G network‟
General Interest Periodicals-India.
[8] IADIS (2005) Defining Mobile Learning.
International Conference Mobile Learning.
[9] Lu, J (2012) Learning with Mobile Technologies,
Handheld Devices, and Smart Phones: Innovative
Methods. IGI Global, Hershey, PA , USA.
[10] Lu, J. Pein, P R, Hansen, G. Nielsen, KL. (2010)
User Centred Mobile Aided Learning System: Student
Response System (SRS), Technology (CIT), Bradford, UK.
[11] Lua, J. Meng, Z. Lu, G. Stav, B, J. (2010) A new
approach in improving operational efficiency of wireless
response system. This paper appears in: Computer and
Information Technology (CIT), 2010 IEEE 10th
International Conference. Braford, UK.
[12] Leiner. B, Cerf. V, Clark. D, Kahn. R, Kleinrock. L,
Lynch.D, Postel. J, Roberts.L, Wolff. S. (2012) Brief
history of the Internet [online] Available at:
<http://www.internetsociety.org/internet/internet-
51/history-internet/brief-history-internet> [Accessed 7 July
2012].
[13] Mobileben, (2009) A model for mobile learning
[online] Available at:
<http://mobileben.wordpress.com/2009/04/15/a-model-for-
mobile-learning/> [Accessed 9 July 2012].
[14] Pachler, N., Bachmair, B., Cook, J. (2010) Mobile
Learning: Structures, Agencies, Practices. 1st ed. New
York: Springer.
[15] Pein R. P., Lu J. and Stav J. B. (2009)
(2009) Integrating Mobile Computing Solutions into
Distance Learning Environments. In: International
Conference on Mobile Communications and Pervasive
Computing (MCPC 2009), 23rd-25th March 2009, Leipzig,
Germany.
[16] Roopanarine, L. (2012) Mobile phone boom in
developing world could boost e-learning [online]
Available at: <http://www.guardian.co.uk/global-
development/2012/may/30/mobile-phone-developing-
world-elearning> [Accessed 8 July 2012].
[17] Smarttech. (2012) SMART board 800 series
interactive whiteboard [online] Available at:
<http://smarttech.com/us/Solutions/Higher+Education+Sol
utions/Products+for+higher+education/Interactive+whitebo
ards+and+displays/SMART+Board+interactive+whiteboar
ds/SMART+Board+800> [Accessed 5 August 2012].
[18] Statistic Brain. (2012) Skype Statistics [online]
Available at: <http://www.statisticbrain.com/skype-
statistics/> [Accessed 10 July 2012].
[19] Traxler. J, (2007) Defining, discussing and
evaluating mobile learning: the moving finger writes and
having writ…. IRRODL, 8 (2).
[20] Vinu P. V, Sherimon P. C, Krishanan. R, (2011)
„Towards pervasive mobile learning – the vision of 21st
century’ Procedia Social and Behavioral Sciences. 15, pp.
3067-3073.
Int'l Conf. e-Learning, e-Bus., EIS, and e-Gov. | EEE'13 | 135

Problems of Establishing Effective Development for E-Learning Academic Staff at Universities in
Developing Countries
N. Moussa1
1Advisor to the president and Mathematics Professor, Ahlia University, Al Manama, Bahrain
Abstract - In this paper some problems of the
establishment of e-learning academic staff development at
Universities in developing countries are given. The current
situation of academic staff development in many
universities in developing countries is illustrated. A set of
measures to achieve an effective e-learning academic staff
development are proposed. Those measures include an
action plan and a follow-up plan. Some recommendations
and conclusion are stated.
Keywords: E-Learning, Academic Staff Development,
Developing Countries, Problems, Action Plan, Follow-up
Plan.
1. Introduction The current situation of academic staff development in general at
many universities in developing country is illustrated in section 2.
Some problems of establishing an effective e-learning academic
staff development are discussed in section 3. In section 4 a
comprehensive set of measures to be considered in the process of
establishing an effective e-learning academic staff development
including an action plan and a follow-up plan is proposed. Some
recommendations are given in section 5. Finally a conclusion is
then stated in section 6
2. Current Situation Among other aspects, the academic staff development in general
at universities in several developing countries is not effective in
almost all aspects, e.g. for faculty, students and communities (see
[1], [2], [3], [4]).
3. Problems Applying internationally acknowledged measures for academic
staff development is highly recommended for universities in
developing countries (see [5], [6], [7]). Unfortunately the
following typical problems in developing countries hinder this
process:
Heavy teaching load for all faculty.
Very crowded classes even at private universities.
Attending many long meetings,
Poor IT facilities and poor skills of faculty.
Assigning unsuitable slots for workshops and/or
seminars.
Assigning unsuitable slots for workshops and/or
seminars.
Less acknowledgement for attendees of the workshops
and/or seminars.
Assigning limited budget for e-learning academic staff
development.
Little exchange with internationally acknowledged
universities.
More interest of faculty in doing research.
More interest of faculty in doing consultation for higher
living standards.
Bad coordination between different colleges and
directorates.
Cultural problems for expatriate faculty
4. Measures
4.1 Action plan The proposed action plan is as follows (see [8], [9], [10], [11],
[12]):
Reducing the normal teaching load and restricting extra
teaching loads.
Reducing the number of students in all courses..
Updating the IT facilities.
Enhancing the IT skills of the e-learning academic staff.
Offering helpful workshops and seminars.
Assigning suitable slots for workshops and seminars.
Accommodating those slots into the university teaching
schedule.
Advising the administration to avoid numerous long
meetings.
Advising the administration to avoid numerous long
meetings
Requesting the administration to acknowledge
attendance of faculty of offered workshops and seminars.
Advising the administration to assure good coordination
between colleges and directorates.
Requesting the administration to enhance exchange with
international acknowledged universities in this field.
Encouraging faculty to including development in their
interests beside doing research and consultations
Assigning certain budget for development.
136 Int'l Conf. e-Learning, e-Bus., EIS, and e-Gov. | EEE'13 |
4.2 Follow-up plan The members of the standing e-learning academic staff
development committee should do the following actions:
Holding general lecture each semester to motivate
faculty to attend offered workshops and seminars.
Visiting faculty individually and responding to their
needs.
Meeting with department chairs and responding to their
needs.
Visiting Deans and responding to their comments and
proposals.
Getting individual feedback from the faculty after
attending workshops and/or seminars.
Publishing the committee recommendations.
5. Recommendations To solve the problems given in section #3 towards establishing
effective development for e-learning academic staff at universities
in developing countries successfully we recommend to:
Decreasing the teaching load and restricting extra
course for all faculty, especially the junior ones.
Limiting the number of enrolled students in all sections.
Updating IT facilities and Enhancing IT skills of
faculty.
Assigning suitable slots for workshops and seminars
and allocating them in the schedule.
Acknowledging workshops’ and seminars’ attendees
moralic and financial through assigning a special budget
for e-learning academic staff development (salary,
increment, and promotion).
Encouraging faculty to devote time and effort beside
doing research and consultations.
Increase exchange with internationally acknowledged
universities in the field.
6. Conclusion Solving problems for establishing an effective development for e-
learning academic staff needs a huge effort from the
administration, the standing development committee, and faculty
at universities in developing countries. This goal could be
achieved through a practical action plan and an effective follow-
up plan. Also enhancing exchanging knowledge with international
acknowledged universities is highly recommended
7. REFERENCES [1] Moussa, N., Saleh, D., “Optimizing the Process of Internal
Quality Assurance of E-Learning in Developing Countries”,
for presentation and publication in the Proceedings of the
WORLDCOM11 International Conference on e-Learning, e-
Business, Enterprise Information Systems, e-Government &
Outsourcing (EEE’11) , Las Vegas, Nevada, U.S.A., July
2011 pp 141- 147.
[2] Moussa, N., “Internal Quality Assurance of E-Learning in
Developing Countries”, Proceedings of the WORLDCOM10
International Conference on e-Learning, e-Business,
Enterprise Information Systems, e-Government &
Outsourcing (EEE’10) , Las Vegas, Nevada, U.S.A. July
2010, pp. 114-120
[3] Moussa, N., Moussa, S., “Quality Assurance of E-Learning
in Developing Countries”, Journal of Nonlinear Analysis,
Volume 71, December 2009, pp e32-e34.
[4] Moussa, N., Moussa, S., “Economical and Social Impacts of
E-Learning in Developing Countries”, Proceedings of the
WORLDCOM09 International Conference on e-Learning, e-
Business, Enterprise Information Systems, e-Government &
Outsourcing (EEE’09) , Las Vegas, Nevada, U.S.A. July
2009, pp. 155-161
[5] Nabil Moussa, “Quality of Education in Developing
Countries”, A Chapter in the Book : “Higher Education in
the Twenty-First Century: Issues and Challenges -Al-Hawaj,
Elali & Twizell (eds)”, Taylor & Francis Group, London,
ISBN 978-0-415- 48000-0, pp. 109 – 112.
[6] Mohamed, A., “Accreditation of Higher Learning
Institution”, A Chapter in the Book : “Higher Education in
the Twenty-First Century: Issues and Challenges – Al-
Hawaj, Elali & Twizell (eds)”, Taylor & Francis Group,
London, ISBN 978-0-415-48000-0, pp. 85-94.
[7] UNESCO’s Centre of Higher Education in Europe, 2007.
[8] Karin Crawford, “Influences on Academics’ Approaches to
Development: Voices from Below”, International Journal for
Academic Development, Volume 15, Issue 3, 2010, pp 189-
202.
[9] Academics’ Perceptions of their Professional Development
Needs Related to Leadership and Management: What Can we
[10] Tony Harland, David Staniforthb, “Academic Development
as Academic Work”, International Journal for Academic
Development, Volume 8, Issue 1-2, 2003, pp 25-35.
[11] Barbaraington-Miller, “Developing New Academic
Developers: Doing before Being”, International Journal for
Academic Development, Volume 17, Issue 2, 2012, pp 121-
133.
[12] Moussa, N., “Academic Staff Development at Universities in
Developing Countries”, Proceedings of the 6th International
Conference on Power Control Optimization (PCO2012),
Volume 1, 2012, pp 1-2
Int'l Conf. e-Learning, e-Bus., EIS, and e-Gov. | EEE'13 | 137
Some Issues and Challenges in E-learning Methodologies
and E-assessment System
Maria Joseph Israel1 and Asoke Nath
2
Email: [email protected] [email protected]
1,2 Department of Computer Science, St. Xavier’s College (Autonomous), Kolkata, India
Abstract - E-Learning, or Computer Assisted Learning is
now one prime research area of computer science as well as
in Education Science. E-learning can be defined as
learning through the new Information and Communication
Technologies or ICT. In Education we have various types of
teaching learning methodologies such as conventional
educational system or face to face interaction, postal
coaching based on printed study materials, distance
education system where teaching learning process has two
major components one is study material and the second is
counseling sessions and now after year 2001 we have added
one more education system called e-learning methodologies.
E-learning is assisted by e-assessment or Computer Assisted
Assessment (CAA). The CAA has an important role to issue
certificates to the successful candidates in e-learning. The e-
learning will not be a successful method if it is not
supplemented by proper computer assisted evaluation
process. In the present paper we have made a thorough
study on different aspects of e-learning methodologies,
Learning Objects(LO) and Computer Assisted Assessment.
The CAA platform is called as eWorkbook. The system can
be used for evaluating a learner’s knowledge by conducting
learner on-line tests. The time is coming when e-learning
will be the best possible method of transmitting education
among people located far away from any academic
institution. Moreover due to flexible time policy in e-
learning the busy people can also take the advantage of it.
The authors have tried to explore different features of e-
learning methodologies and also the e-testing mechanism.
Keywords: e-learning, Computer assisted learning, ICT, Computer assisted assessment
1 Introduction
e-learning may be defined as “learning through the new Information and Communication Technologies or ICT. The word e-learning is a combination of two fields one is Distance Education and the other is Computer Based Training(CBT). In CBT Computer is used as the main tool
for learning process. The CBT software and the materials are now available in different media such as CD, Internet website etc. Normally the software is made in such a way that anyone can learn the subject using self-learning instructional material. Distance Education or Distance Learning is not a new teaching learning methodology. The distance education slowly developed due to the requirement of the learners those who reside in remote places and cannot come to take education from a reputed institute which may be far away from him/her. The distance education can be thought of three generations. The first generation is the nineteenth-century native teaching through postal communication. The second generation starts in the 70s and makes use of TV, Radio and satellites. The third generation based on data networks. The word E-learning came when the CBT was combined with the collaborative use of data networks. This event coincides with the time in which hypermedia resources started to be distributed through the Internet, that is, with the introduction of the World Wide Web. E-Learning is an interdisciplinary area of scientific research. To make E-Learning successful the researchers from education science and computer science have to apply their mind together. The education scientists have to give more interests in pedagogical aspects of e-learning and the computer scientists have to give more interest on the technology part of the e-learning process. To design e-learning system one has to design the intelligent tutoring systems, to standardize e-learning system, to design e-testing methodology, use of Web Technology including usability and accessibility etc. The use of e-learning in education has implied a transition from an institution–centered model to a learner-centered model. In e-learning sometimes one has to mix traditional instructional materials with newer technology based material. This approach, called blended learning method and it is more suitable in those environments in which the pedagogical aspect prevails over the mere competency transfer one. Blended learning forecasts that the normal lessons are integrated with on-line lessons and with the availability of instructors and learners of synchronous (chat, videoconference) and asynchronous (e-mail, forum) communication tools. In any academic institution the blended learning approach is commonly used e-learning methodology.
138 Int'l Conf. e-Learning, e-Bus., EIS, and e-Gov. | EEE'13 |
A piece of e-learning material, of any granularity, is commonly referred to as Learning Object (LO). According to IEEE Learning Technology Standard Committee (IEEE LTSC, 2007), the Learning Object (LO) is any entity, digital or non-digital, that may be used for teaching and learning process. According to ADL SCORM (ADL, 2007) LOs in the minimal form of teaching learning objects are called assets. An aggregation of LOs, which can be distributed in a content package, is a Content Aggregation. Another important characteristic of LOs, according to SCORM’s classification, is their capacity of being launched in the learning environment and of establishing a communication with it. A LO equipped with a module which gives such functionalities to it is called a Sharable Content Object (SCO). The software system for the production of LOs is the LO authoring tool, while the software system for administering LOs to learners and for creating a collaborative learning environment is commonly called Learning Management System (LMS). One important aspect of e-learning is the standardization of e-learning systems. Standardization in e-learning methodology is mainly aimed at achieving interoperability among Learning Management Systems (LMSs) and Learning Object (LO) authoring tools. The term Computer Managed Instruction (CMI) or SCORM Run-Time Environment often refers to a set of functionalities which allow LOs to be launched in the LMS and to exchange data with it. Their adoption is crucial in the achievement of full interoperability among LMSs and LO authoring tools. Even desirable, standard compliancy and guideline adoption are difficult to obtain for LMS producers. In the present work the authors have presented a thorough study on adoption of CMI functionalities in Object-Oriented and Message-Oriented LMS systems, respectively. The former is framework, named CMIFramework, which allows LMS
developers to rapidly adopt CMI functionalities in Object-Oriented systems. The latter is a Service Oriented Architecture (SOA)-based reference model for offering the CMI functionalities as a service, external to the LMS.
2 What is E-Learning?
E-learning is not just about training and instruction but also about learning that is made for individuals. There are different terminologies which have been used to define on-line teaching and learning process. There is no straight forward definition of e-learning is available till now. To define e-learning the commonly used terms are Internet learning, distributed learning, networked learning, tele-learning , virtual learning, computer-assisted learning, Web-based learning, and distance learning. E-learning also includes the delivery of learning material through Internet, satellite broadcast, audio-video tape/CD, interactive TV program and CD-ROM. All of these terms mean that the learner is at a distance from the tutor or instructor, and the learner uses some form of technology (usually a computer)
to access the learning material, and that the learner uses technology to interact with the tutor or instructor and other learners, and that some form of support is provided to learners. E-learning refers to the use of information and communication technology (ICT) to enhance and/or support learning in tertiary education. However this encompasses an ample array of systems, from students using e-mail and accessing course materials online while following a course on campus to programs delivered entirely online. E-learning can be different types, a campus-based institution may be offering courses, but using E-learning is tied to the Internet or other online network. So we can say that E-learning is an education process or system via the Internet, network, or standalone computer. E-learning processes include Web-based training, computer-based training, virtual classrooms and digital collaboration. E-learning means the teaching material is delivered via the Internet, intranet, audio or video tape, satellite TV, and CD-ROM. So one can define e-learning is basically Internet-Based training or Web-Based training. Today you will still find these terms being used, along with variations of E-learning (EL). EL is not only about training and instruction but also about learning that is tailored to individual. Different terminologies have been used to define learning that takes place online.
3 Different Components of E-Learning
System:
E-learning system can be broadly categorized into the following:
3.1 E-Learning Courses:
The most important component of e-learning is to prepare educational courses. Educational course materials or courseware are usually modified and added with various different media and are uploaded to a networked environment for online accessing. There are several popular learning management systems such as WebCT and Blackboard which are commonly used by educational institutions to introduce e-learning education system. In achieving a more motivating courseware, courseware designers have began to add innovative presentation such as simulations, storytelling and various other innovative materials. E-learning is very similar to classroom teaching environment whereby both of the learners and the instructors are together related to the common course arrangement and flow.
3.2 Blended Learning
Blended learning or Integrated Learning provides a good transition from classroom learning to e-learning. Blended learning is a combination of a face to face teaching and online learning. This method is most effective for any higher education where both face to face and on-line training is required. It encourages educational and information review beyond the classroom settings. It combines several different
Int'l Conf. e-Learning, e-Bus., EIS, and e-Gov. | EEE'13 | 139
delivery methods, such as collaboration software, web-based courses and computer communication practices with face to face instruction. Integrated learning utilizes the best of classrooms with the best of online learning.
3.3 Informal Learning
Information learning can be said to be one of the most dynamic and adaptable features of learning but it is least recognized. To get any new information we use some search Engine like Google. Each search Engine is coupled with information storage tools, personal management tools. That is why we get any information so fast from Google search engine. Sometimes we get more information during break time than in formal learning environment. We progress more in our jobs through informal learning, sometimes using trial and error and other times through conversations.
3.4 Collaborative Teaching and Study
It is very old style but very effective. This method enables learners to learn something in a small group, then to find similar type of group and then interact with them about one’s doubts. This way one can learn a new subject very fast. Collaborative teaching is a teaching method by a group composed of teachers. To implement this method teacher should focus on the plans he/she put together, teaching, appraisal and making detailed discussions and arrangements of the course outline and content. Collaborative teaching as an innovative teaching method makes use of two or more teachers and assistants contributing their talents in one or several classes and curricula. Collaborative teaching changed the traditional teaching style. With each teacher’s academic specialty being employed more diversified learning directions and boundless thought space can be provided for students. Collaborative teaching research was conducted on the core “introduction to design” courses hoping that the teachers could contribute their talents, gain more professional knowledge and form a long-term collaborative group amongst themselves. This is the first motivation. Moreover, the learning motivation is an important factor for effective learning. The teachers should adopt various teaching methods and stimulate students’ learning motivation.
3.5 Knowledge Management
Globalization is focused on e-learning because e-learning technology has the potential to bring improved learning opportunities to a larger audience than has ever previously been possible. Knowledge management is an essential process which is concerned with how to create atmosphere for people to share knowledge on distribution, adoption and information exchange activities in an organization. The impression of knowledge management and the theory of e-learning reveal powerful relationship which is causing disarray between the two fields.
3.6 Networks of Learning
Learning network is a procedure of developing and preserving relationship with people and information and
communicating to support each other’s learning. Therefore Learning network is enhanced and offers chances to its members to engage online with each other, sharing knowledge and expertise. Now the use of pen and paper in our educational system today is producing inadequacy and challenges in the digital era that we are in today where subject matter is changing speedily. The application of personal learning networks will create connections and develop knowledge for workers to remain current in their field.
4 E-Learning Methodologies
E-learning exploits Web technology as its basic technical infrastructure to deliver knowledge. The current trend in any academic or industry is to increase the use of e- learning and in the near future a higher demand of technology support is expected.
4.1 Interaction in Learning
Learner(s) and Tutors(s) Interaction, then Learner(s) and Learner(s) Interaction are two types of interactions are among humans. We are familiar with these types of interactions. Most of the research studies are based on these two types of interaction, especially in the research of Computer Assisted Collaborative Learning (CACL). If collaborative type of study is used in an online class then students should be more motivated to actively participate in online social interactions. This increased active group interaction and participation in the online course, hence, resulted in higher perceptions of self-reported learning. Whereas individuals working alone online tended to be less motivated, perceive lower levels of learning, and score lower on the test of mastery. In CACL, researchers usually distinguish two types of interactions. One is called synchronous interaction, requires that all participants of interaction are online at the same time. Examples of synchronous interaction include Internet voice telephone, video teleconferencing, text-based chat systems, instant messaging systems, text-based virtual learning environments, graphical virtual reality environments, and net based virtual auditorium or lecture room systems. Synchronous interaction promotes faster problem solving, scheduling and decision making, and provides increased opportunities for developing. However, the cost of synchronous interaction is usually very high, and synchronous interaction is more constricted due to time differences. The second method is asynchronous interaction, in which learners or tutors have freedom of time and location to participate in the interaction, examples including interaction using e-mail, discussion forums, and bulletin board systems. It has been reported that by extending interactions to times outside of classes, more persistent interaction and closer interpersonal bonds among students can occur. Thus, while one cannot totally simulate a real
140 Int'l Conf. e-Learning, e-Bus., EIS, and e-Gov. | EEE'13 |
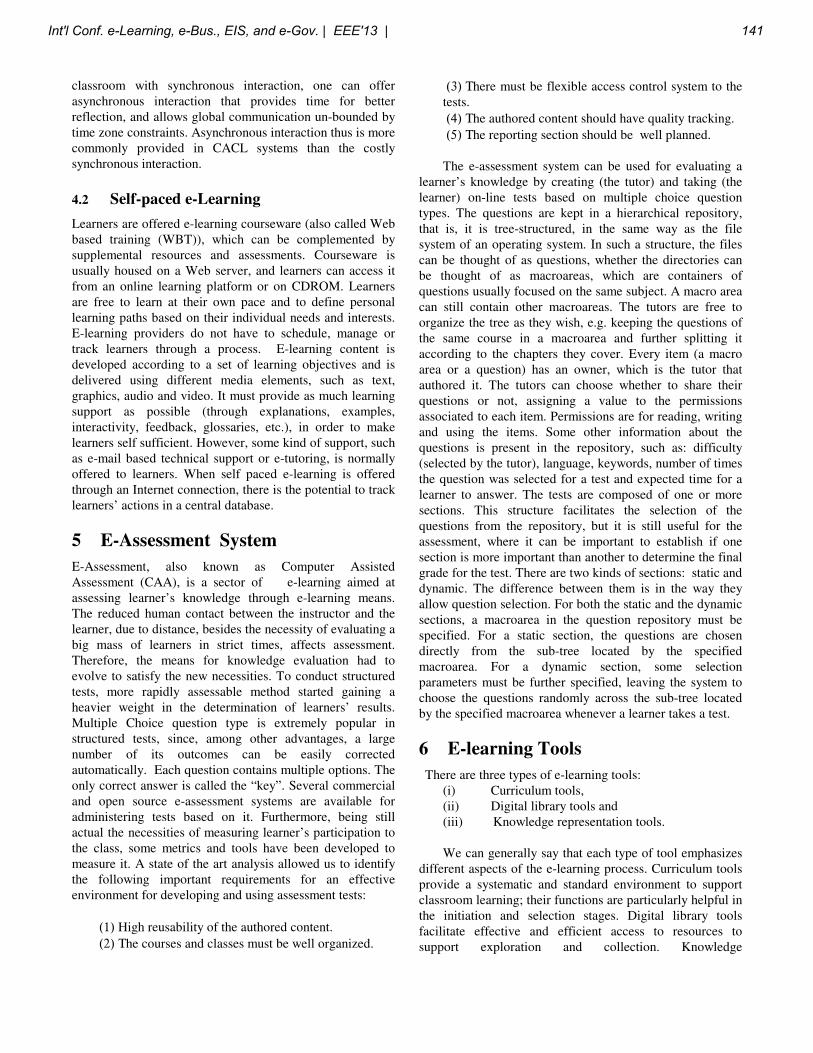
classroom with synchronous interaction, one can offer asynchronous interaction that provides time for better reflection, and allows global communication un-bounded by time zone constraints. Asynchronous interaction thus is more commonly provided in CACL systems than the costly synchronous interaction.
4.2 Self-paced e-Learning
Learners are offered e-learning courseware (also called Web based training (WBT)), which can be complemented by supplemental resources and assessments. Courseware is usually housed on a Web server, and learners can access it from an online learning platform or on CDROM. Learners are free to learn at their own pace and to define personal learning paths based on their individual needs and interests. E-learning providers do not have to schedule, manage or track learners through a process. E-learning content is developed according to a set of learning objectives and is delivered using different media elements, such as text, graphics, audio and video. It must provide as much learning support as possible (through explanations, examples, interactivity, feedback, glossaries, etc.), in order to make learners self sufficient. However, some kind of support, such as e-mail based technical support or e-tutoring, is normally offered to learners. When self paced e-learning is offered through an Internet connection, there is the potential to track learners’ actions in a central database.
5 E-Assessment System
E-Assessment, also known as Computer Assisted Assessment (CAA), is a sector of e-learning aimed at assessing learner’s knowledge through e-learning means. The reduced human contact between the instructor and the learner, due to distance, besides the necessity of evaluating a big mass of learners in strict times, affects assessment. Therefore, the means for knowledge evaluation had to evolve to satisfy the new necessities. To conduct structured tests, more rapidly assessable method started gaining a heavier weight in the determination of learners’ results. Multiple Choice question type is extremely popular in structured tests, since, among other advantages, a large number of its outcomes can be easily corrected automatically. Each question contains multiple options. The only correct answer is called the “key”. Several commercial and open source e-assessment systems are available for administering tests based on it. Furthermore, being still actual the necessities of measuring learner’s participation to the class, some metrics and tools have been developed to measure it. A state of the art analysis allowed us to identify the following important requirements for an effective environment for developing and using assessment tests:
(1) High reusability of the authored content.
(2) Τhe courses and classes must be well organized.
(3) Τhere must be flexible access control system to the tests.
(4) Τhe authored content should have quality tracking.
(5) Τhe reporting section should be well planned. The e-assessment system can be used for evaluating a
learner’s knowledge by creating (the tutor) and taking (the learner) on-line tests based on multiple choice question types. The questions are kept in a hierarchical repository, that is, it is tree-structured, in the same way as the file system of an operating system. In such a structure, the files can be thought of as questions, whether the directories can be thought of as macroareas, which are containers of questions usually focused on the same subject. A macro area can still contain other macroareas. The tutors are free to organize the tree as they wish, e.g. keeping the questions of the same course in a macroarea and further splitting it according to the chapters they cover. Every item (a macro area or a question) has an owner, which is the tutor that authored it. The tutors can choose whether to share their questions or not, assigning a value to the permissions associated to each item. Permissions are for reading, writing and using the items. Some other information about the questions is present in the repository, such as: difficulty (selected by the tutor), language, keywords, number of times the question was selected for a test and expected time for a learner to answer. The tests are composed of one or more sections. This structure facilitates the selection of the questions from the repository, but it is still useful for the assessment, where it can be important to establish if one section is more important than another to determine the final grade for the test. There are two kinds of sections: static and dynamic. The difference between them is in the way they allow question selection. For both the static and the dynamic sections, a macroarea in the question repository must be specified. For a static section, the questions are chosen directly from the sub-tree located by the specified macroarea. For a dynamic section, some selection parameters must be further specified, leaving the system to choose the questions randomly across the sub-tree located by the specified macroarea whenever a learner takes a test.
6 E-learning Tools
There are three types of e-learning tools: (i) Curriculum tools, (ii) Digital library tools and (iii) Knowledge representation tools. We can generally say that each type of tool emphasizes
different aspects of the e-learning process. Curriculum tools provide a systematic and standard environment to support classroom learning; their functions are particularly helpful in the initiation and selection stages. Digital library tools facilitate effective and efficient access to resources to support exploration and collection. Knowledge
Int'l Conf. e-Learning, e-Bus., EIS, and e-Gov. | EEE'13 | 141
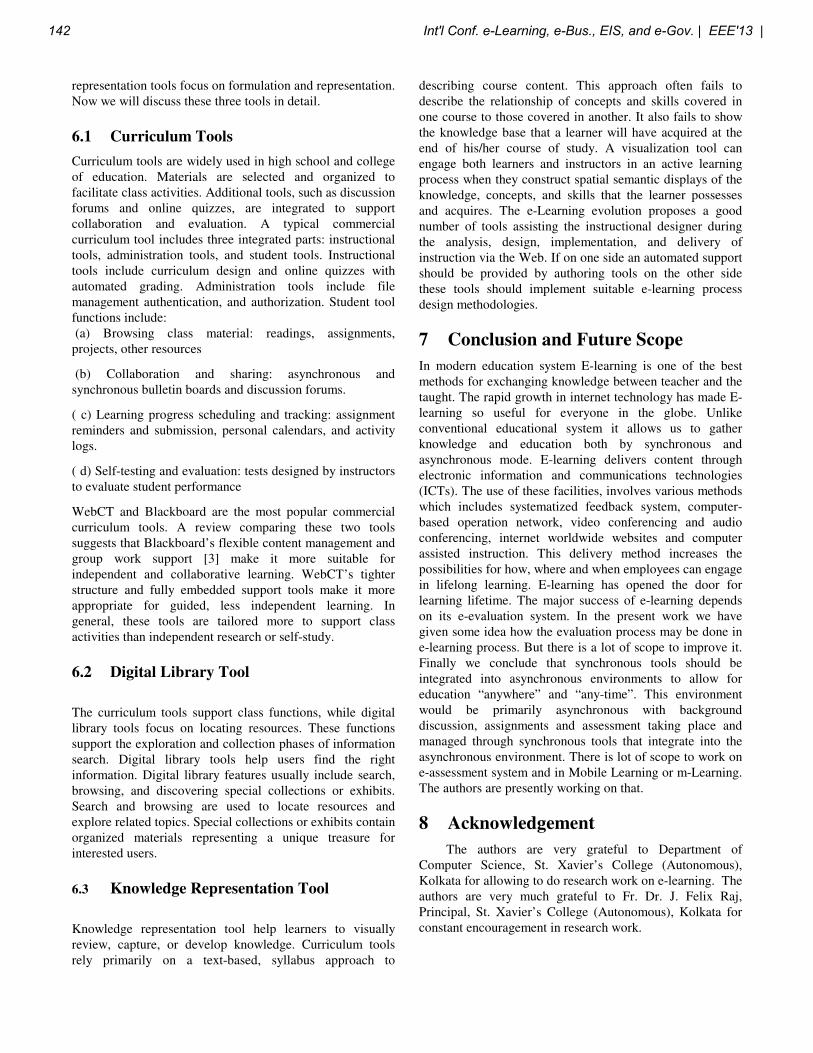
representation tools focus on formulation and representation. Now we will discuss these three tools in detail.
6.1 Curriculum Tools
Curriculum tools are widely used in high school and college of education. Materials are selected and organized to facilitate class activities. Additional tools, such as discussion forums and online quizzes, are integrated to support collaboration and evaluation. A typical commercial curriculum tool includes three integrated parts: instructional tools, administration tools, and student tools. Instructional tools include curriculum design and online quizzes with automated grading. Administration tools include file management authentication, and authorization. Student tool functions include: (a) Browsing class material: readings, assignments, projects, other resources
(b) Collaboration and sharing: asynchronous and synchronous bulletin boards and discussion forums.
( c) Learning progress scheduling and tracking: assignment reminders and submission, personal calendars, and activity logs.
( d) Self-testing and evaluation: tests designed by instructors to evaluate student performance
WebCT and Blackboard are the most popular commercial curriculum tools. A review comparing these two tools suggests that Blackboard’s flexible content management and group work support [3] make it more suitable for independent and collaborative learning. WebCT’s tighter structure and fully embedded support tools make it more appropriate for guided, less independent learning. In general, these tools are tailored more to support class activities than independent research or self-study.
6.2 Digital Library Tool
The curriculum tools support class functions, while digital library tools focus on locating resources. These functions support the exploration and collection phases of information search. Digital library tools help users find the right information. Digital library features usually include search, browsing, and discovering special collections or exhibits. Search and browsing are used to locate resources and explore related topics. Special collections or exhibits contain organized materials representing a unique treasure for interested users.
6.3 Knowledge Representation Tool
Knowledge representation tool help learners to visually review, capture, or develop knowledge. Curriculum tools rely primarily on a text-based, syllabus approach to
describing course content. This approach often fails to describe the relationship of concepts and skills covered in one course to those covered in another. It also fails to show the knowledge base that a learner will have acquired at the end of his/her course of study. A visualization tool can engage both learners and instructors in an active learning process when they construct spatial semantic displays of the knowledge, concepts, and skills that the learner possesses and acquires. The e-Learning evolution proposes a good number of tools assisting the instructional designer during the analysis, design, implementation, and delivery of instruction via the Web. If on one side an automated support should be provided by authoring tools on the other side these tools should implement suitable e-learning process design methodologies.
7 Conclusion and Future Scope
In modern education system E-learning is one of the best methods for exchanging knowledge between teacher and the taught. The rapid growth in internet technology has made E-learning so useful for everyone in the globe. Unlike conventional educational system it allows us to gather knowledge and education both by synchronous and asynchronous mode. E-learning delivers content through electronic information and communications technologies (ICTs). The use of these facilities, involves various methods which includes systematized feedback system, computer-based operation network, video conferencing and audio conferencing, internet worldwide websites and computer assisted instruction. This delivery method increases the possibilities for how, where and when employees can engage in lifelong learning. E-learning has opened the door for learning lifetime. The major success of e-learning depends on its e-evaluation system. In the present work we have given some idea how the evaluation process may be done in e-learning process. But there is a lot of scope to improve it. Finally we conclude that synchronous tools should be integrated into asynchronous environments to allow for education “anywhere” and “any-time”. This environment would be primarily asynchronous with background discussion, assignments and assessment taking place and managed through synchronous tools that integrate into the asynchronous environment. There is lot of scope to work on e-assessment system and in Mobile Learning or m-Learning. The authors are presently working on that.
8 Acknowledgement
The authors are very grateful to Department of Computer Science, St. Xavier’s College (Autonomous), Kolkata for allowing to do research work on e-learning. The authors are very much grateful to Fr. Dr. J. Felix Raj, Principal, St. Xavier’s College (Autonomous), Kolkata for constant encouragement in research work.
142 Int'l Conf. e-Learning, e-Bus., EIS, and e-Gov. | EEE'13 |
9 References:
[1] Douglas, I.(2001). “Instructional Design Based on Reusable Learning Object: Applying Lessons of Object-Oriented Software Engineering to Learning System Design”. In Proceeding ASEE/IEEE Frontiers in Education Conference, Reno, NV, 2001. Vol. 3. pp.: F4E1-F4E5.
[2] N.D. Oye , M. Salleh, and N.A. Iahad, “Challenges of E-learning in Nigerian University Education Based on the Experience of Developed Countries,” International Journal of Managing Information Technology, vol. 3, no. 2, 2011, pp. 39-48. [3] M. Lorrain, “Strategies to Engage Online students and Reduce Attrition Rates.,” The Journal of Educator Online.2007.
[4] Haythornthwaite, C.(1999). "Collaborative Work Networks among Distributed Learners,"Proceedings of the 32nd Hawaii International Conference on System Sciences, IEEE Computer Society Press, 1999.
[5] Li, T., Sambasivam, S.E. (2003). Question Difficulty Assessment in Intelligent Tutor Systems for Computer Architecture. Information Systems Education Journal, Vol. 1 (51) [6] Lin, N.H., Shih, T.K., Hui-huang, H., Chang, H. P., Chang, H. B., Ko, W. C.; Lin, L.J. (2004), Pocket SCORM, Proceedings of 24th International Conference on Distributed Computing Systems Workshops, Tokyo, Japan, pp. 274-279
[7] Oye N.D, Mazleena Salleh, N.A. Iahad, E-Learning Methodologies and Tools, IJACSA, Vol.3, No.2,2012 [8] Xiaofei L., El Saddik, A., Georganas, N.D. (2003), An implementable architecture of an elearning system, Proceedings of IEEE Canadian Conference on Electrical and Computer Engineering, pp. 717 - 720 vol.2Advanced Distributed Learning (ADL) Initiative. Available at: http://www.adlnet.org, 2004. [9] Antelmo, D., Costagliola, G., Ferrucci, F., Fuccella, V. (2005), A Web-based Computer Aided Assessment Tool Supporting Question Quality Improvement, Proceedings of IADIS International ConferenceWWW/Internet 2005, pp. 77-84 [10] Costagliola, G., Ferrucci, F., Fuccella, V., Gioviale, F. (2004b), eWorkbook: a Web Based Tool for Assessment and Self-Assessment, Atti di DIDAMATICA, pp. 621-630 [11] Ausburn, L.J. (2004) ‘Course design elements most valued by adult learners in blended online education environments: An American perspective’, Educational Media International, vol. 41, no. 4, pp. 328-337. [12] Baker, C. (1992). Attitudes and Language. Clevedon: Multilingual Matters. [13] Cooner, T. S. (2005) ‘Dialectical constructivism: Reflections on creating a Web-mediated enquiry-based learning environment’, Social Work Education, vol. 24, no. 4, pp. 375-390.
[14] Garnham, C., & Kaleta, R. (2002). Introduction to Hybrid Courses. Teaching with Technology Today, 8(6). [15] Oye , N.D, Mazleena Salleh, N.A. Iahad, E-Learning Methodologies and Tools, International Journal of Advanced Computer Science and Applications, Vol.3, No.2, Ppp. 49-52(2012) [16] N.D. Oye , M. Salleh, and N.A. Iahad, “Challenges of E-learning in Nigerian University Education Based on the Experience of Developed Countries,” International Journal of Managing Information Technology, vol. 3, no. 2, 2011, pp. 39-48.
Int'l Conf. e-Learning, e-Bus., EIS, and e-Gov. | EEE'13 | 143

E-Learning Factors and Definitions
Abdullah Abdulaziz AlShoshan Mehdi Zargham 1 1000 FANER Drive 2125-4511 1000 FANER Drive 2125 -4511 Southern Illinois University Southern Illinois University Carbondale Illinois 62901 Carbondale Illinois 62901 2 Technical and Vocational Training Corporation - Saudi Arabia [email protected] [email protected]
Contact author: AlShoshan
EEE ‘13 Abstract - This research has focused on the key factors that affect e-learning. These factors have been grouped into four broad categories of instructor, student, interface design and resource support. In terms of the instructors, this mainly refers to the ability of the teacher to provide different e-learning activities and facilitate the learning process. The student perspective involves the ability and willingness of students to collaborate in the teaching/learning process, as well as his/her ability to give feedback relating to the e-learning experience. Other influential factors relate to the interface design that refers to the appearance of the learning environment. Under this, consideration is given to the availability and security of the system, user-friendliness and the content that is delivered. The final category relates to resource support encompassing the availability and speed of the systems. Online help and support are also critical elements in enhancing learners’ experience. Key words: e-Learning, e-Learning plans, e-Learning resources, e-Instructor, e-Student
INTRODUCTION
Volery and Lord [1] address e-learning within three frame works: technology, instructor and student knowledge of technology. Slime [2] has, however, grouped e-learning into four categories: instructor, student, information technology and university support. Ozkan [3] suggests areas to be: system quality, service quality, content quality, learner perspective, and instructor attitudes. Others studies have partitioned and categorized e-learning in different circles: human part, technical part and course part. This study is going to measure an efficacy of e-learning models for comparative purposes. From the review of variety of sources, we believe and have surmised the best development and
deployment of e-learning into four dimensions: Instructor, Student, Interface Design and Resource Support. The rest of this paper defines and provide examples for each of the dimensions. At the end of the paper a summery is provided.
INSTRUCTOR
Educational environment through e-learning relies on several factors to obtain high quality of learning and each plays an important role for the learning outcomes. Volery highlights three areas while defining traditional instructor “instructor technical competence, attitudes towards students and classroom interaction”[1]. Gillette [4] notes “teaching through the web requires instructors to reconsider their previous assumptions about the nature of teaching, lecture, testing, and student/teacher interaction”. E-instruction is "instruction delivered via an electronic network such as the Internet"[5]. E-learning instructor, sometimes called e-instructor, is the person who chooses suitable technology materials for clarifying and explaining course contents. The instructor is responsible to evaluate students and give the qualification assessments. An instructor in e-learning could use technology as part of the course or the course completely works via technology support. Instructor’s evaluation is a result for determining characteristics related to instructor responses, teaching aims and students’ knowledge. Instructor’s characteristics [6] are “Instructor attitude towards student, Instructor attitude towards e-learning and Computer skill”. Puri [7] mentions many factors related to instructor in e-learning including: alternative submission of assignments, interactive course, teacher as facilitator and pedagogy. Nathan [8] mentions learning styles as an important element
144 Int'l Conf. e-Learning, e-Bus., EIS, and e-Gov. | EEE'13 |
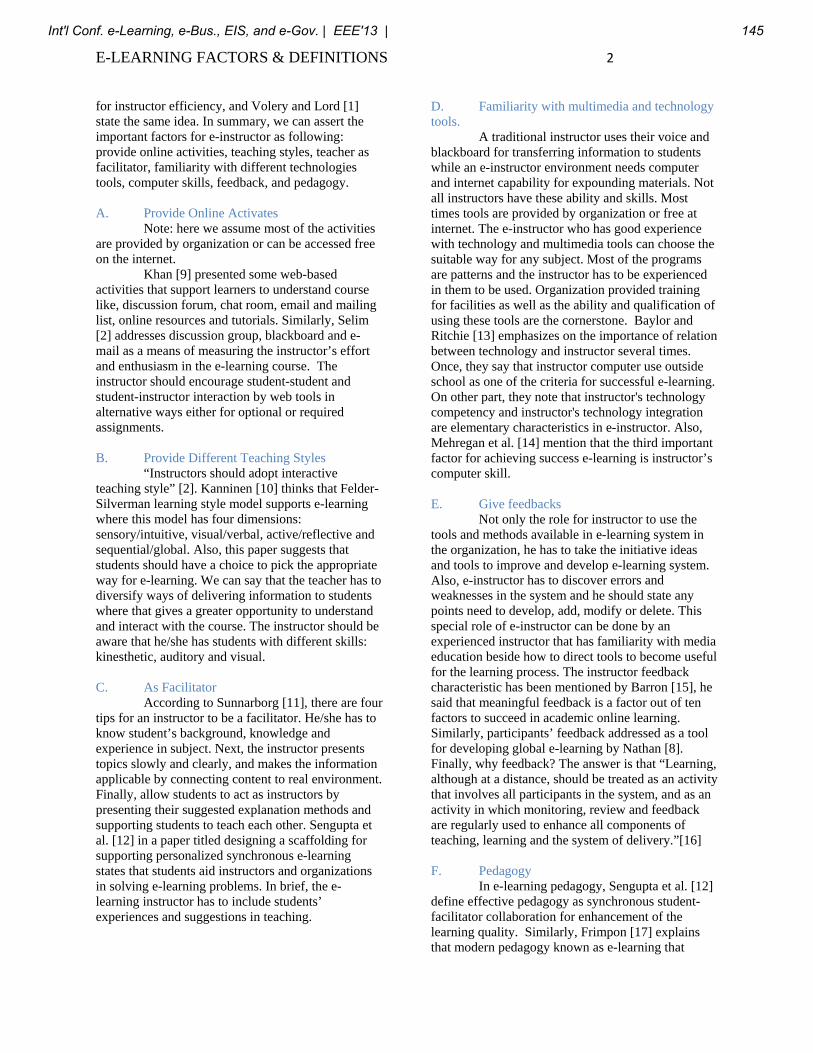
E-LEARNING FACTORS & DEFINITIONS 2
for instructor efficiency, and Volery and Lord [1] state the same idea. In summary, we can assert the important factors for e-instructor as following: provide online activities, teaching styles, teacher as facilitator, familiarity with different technologies tools, computer skills, feedback, and pedagogy.
A. Provide Online Activates
Note: here we assume most of the activities are provided by organization or can be accessed free on the internet.
Khan [9] presented some web-based activities that support learners to understand course like, discussion forum, chat room, email and mailing list, online resources and tutorials. Similarly, Selim [2] addresses discussion group, blackboard and e-mail as a means of measuring the instructor’s effort and enthusiasm in the e-learning course. The instructor should encourage student-student and student-instructor interaction by web tools in alternative ways either for optional or required assignments.
B. Provide Different Teaching Styles
“Instructors should adopt interactive teaching style” [2]. Kanninen [10] thinks that Felder-Silverman learning style model supports e-learning where this model has four dimensions: sensory/intuitive, visual/verbal, active/reflective and sequential/global. Also, this paper suggests that students should have a choice to pick the appropriate way for e-learning. We can say that the teacher has to diversify ways of delivering information to students where that gives a greater opportunity to understand and interact with the course. The instructor should be aware that he/she has students with different skills: kinesthetic, auditory and visual.
C. As Facilitator
According to Sunnarborg [11], there are four tips for an instructor to be a facilitator. He/she has to know student’s background, knowledge and experience in subject. Next, the instructor presents topics slowly and clearly, and makes the information applicable by connecting content to real environment. Finally, allow students to act as instructors by presenting their suggested explanation methods and supporting students to teach each other. Sengupta et al. [12] in a paper titled designing a scaffolding for supporting personalized synchronous e-learning states that students aid instructors and organizations in solving e-learning problems. In brief, the e-learning instructor has to include students’ experiences and suggestions in teaching.
D. Familiarity with multimedia and technology tools.
A traditional instructor uses their voice and blackboard for transferring information to students while an e-instructor environment needs computer and internet capability for expounding materials. Not all instructors have these ability and skills. Most times tools are provided by organization or free at internet. The e-instructor who has good experience with technology and multimedia tools can choose the suitable way for any subject. Most of the programs are patterns and the instructor has to be experienced in them to be used. Organization provided training for facilities as well as the ability and qualification of using these tools are the cornerstone. Baylor and Ritchie [13] emphasizes on the importance of relation between technology and instructor several times. Once, they say that instructor computer use outside school as one of the criteria for successful e-learning. On other part, they note that instructor's technology competency and instructor's technology integration are elementary characteristics in e-instructor. Also, Mehregan et al. [14] mention that the third important factor for achieving success e-learning is instructor’s computer skill.
E. Give feedbacks
Not only the role for instructor to use the tools and methods available in e-learning system in the organization, he has to take the initiative ideas and tools to improve and develop e-learning system. Also, e-instructor has to discover errors and weaknesses in the system and he should state any points need to develop, add, modify or delete. This special role of e-instructor can be done by an experienced instructor that has familiarity with media education beside how to direct tools to become useful for the learning process. The instructor feedback characteristic has been mentioned by Barron [15], he said that meaningful feedback is a factor out of ten factors to succeed in academic online learning. Similarly, participants’ feedback addressed as a tool for developing global e-learning by Nathan [8]. Finally, why feedback? The answer is that “Learning, although at a distance, should be treated as an activity that involves all participants in the system, and as an activity in which monitoring, review and feedback are regularly used to enhance all components of teaching, learning and the system of delivery.”[16]
F. Pedagogy
In e-learning pedagogy, Sengupta et al. [12] define effective pedagogy as synchronous student-facilitator collaboration for enhancement of the learning quality. Similarly, Frimpon [17] explains that modern pedagogy known as e-learning that
Int'l Conf. e-Learning, e-Bus., EIS, and e-Gov. | EEE'13 | 145
E-LEARNING FACTORS & DEFINITIONS 3
delivered via all electronic media for the purposes of effective learning process. Also, Nathan [8] states “identified technology and pedagogy issues, and corporate culture as factors that contribute as barriers to the successful use of e-learning”. We can define e-instructor pedagogy is the instructor effort through technology tools by innovating methods for fruitful e-learning.
STUDENT
Student is any person who studies and is engaged in learning (dictionary.com). Student can be: learner, pupil, trainee, and anyone who is improving his knowledge through any kind of educational system. The e-learning system is affected by student skills and background. According to Musa and Othman [18], student characteristics have been classified in three types: students computing competency, student collaboration activities, and course contents and design. Mehregan et al. [14] consider that computer skill, motivation, commitment and learning speed are student characteristics that should measure to evaluate e-learning. Selim [2] emphasized that students need to have time management in e-learning. Frimpon [17] mentions students’ (discipline, computer competency, attitude towards, participation and involvement) as critical success factors for e-learning. In my view, I consider student characteristics that effect on e-learning are collaboration (participation and involvement), learning speed, discipline (commitment), computer skill, motivation, and giving feedback. Let’s define them one by one:
A. Collaboration (participation and involvement)
As reported by Musa & Othman [18], collaboration is an involvement of students and the instructor in e-discussion groups. Students’ participation in e-learning consists of reading messages in the course discussion group and interacting with messages. Discussion groups could be live chat discussion, discussion forums, or any unrestricted online tool for discussion. Learning community and ease interaction with others are foundations for participation. Also, the e-learning could fail if students do not participate in working groups [17]. We can say that e-teacher has to encourage, create and be involved with internet activities along side e-students for successful e-learning courses.
B. Learning speed
Student learning speed counted as a significant issue in e-learning [14]. Learning speed compared to the traditional learning is what we try to
explain here. Students can understand and deal with course materials through e-learning tools, and feel it is equal or more advantages than face-to-face learning. Learning speed can be defined by student satisfaction on e-learning which is measured by: student enjoyment, comfortable, not intimidate and absorption to the course [2].
C. Discipline (commitment)
The e-learning environment depends on online interaction. In regular courses students have to attend and participate in classroom. E-learning environment gives flexibility in location and time for courses participation. We should note that flexibility could be generating negligent students, if the students do not have enough skills in “time management”. Student’s discipline is indicated by involvement in discussions, assignments, quizzes, tests and other online activities.
D. Computer skills
“Student prior IT experience such as having a computer at home and attitude towards e-learning is critical to e-learning success.”[2] Student who enrolled in e-learning course should have basic abilities for using hardware and software (computer literacy) like, typing, using the Internet, installing programs, downloading and browsing files. The computer skills are required because all of e-learning undertakings are in virtual environment that need computer as a tool in between.
E. Motivation
Keller [19] defined motivation as “the choices people make to what experiences they will approach or avoid, and the degree of effort they will exert in that respect”. Nathan [8] stated that “successful e-learning depends largely on the self-motivation of individuals to study effectively. Tampa Bay Times released an article “Success of Florida Virtual School is difficult to measure” [20] that pointed out that motivation is a significant driver impacting a student’s aptitude to success in e-learning. E-student who has dissatisfaction on e-learning mostly would not accept its tools and would not reach its goals. Motivation depends on intrinsic characteristics and some extrinsic characteristics of the student. Smith [21] gave four factors to raise motivation. First, engage students in e-course by attracting their attention. Second, organization or course advisor clarifies the goals for students and makes the course consistent to student’s experiences. Third, give confidence by forwarding attribution that student “is capable of performing in a certain manner to attain certain goals”. Finally, inspire positive
146 Int'l Conf. e-Learning, e-Bus., EIS, and e-Gov. | EEE'13 |
E-LEARNING FACTORS & DEFINITIONS 4
feeling to student that creates satisfaction state to e-learning.
F. Giving feedbacks
Feedbacks are student’s evaluations for course content, instructor, design, facilities and any related topics, and suggestions to improve course inputs, outputs and outcomes.
INTERFACE DESIGN
Puri [7] defines “interface design” as a concern with the look and feel of e-learning environment. The interface design is the intermediate atmosphere for the e-learning environment. Ignoring principles of ease of use, and quality of “interface design” would negatively effect outcomes of e-learning. Here we talk about website features that are designed to support interaction and the quality of the users’ experience and include: website reliability, website speed, website backup, error tracking, website friendliness, course platform, web security, and update.
A. Internet connection
Bandwidth of a website on e-learning is a very important issue because slow website gives a negative sense to the users (students and teachers). Also, speed of website related to time at tasks, like chat or online exam, can prove frustrating for users. The bandwidth could limit contents of a course because contents take long time in upload and download. The content types like videos may be avoided if speed is not suitable to the case. The internet bandwidth depends on the number of connections to a website and speed of the connections.
B. System Reliability and Availability
This is one of the most important technological factors in e-learning. Without access to e-learning facilities, the learning cannot take place. Therefore, before choosing a given type of media for e-learning or engaging in any e-learning activities, it is important to consider the technological barriers that may affect the availability and reliability of the system. According to Mungania [22], organizations which target international students need to focus on the language, infrastructural and geographical barriers that can affect access to the e-learning system. The size of graphic images and the sizes of files which may be downloaded need to be limited. This may also involve limiting the number of items that can be downloaded. Such measures help to guarantee the availability of the system [22].
The availability of services may also be improved by making use of redundant
hardware/software such as servers and routers [23]. Periodic assessment of the performance and loading of the system by the administrators helps to ensure that services are uninterrupted, which ensures that student satisfaction with e-learning is enhanced. Such assessments help to identify those critical areas that need to be attended to in order to enhance efficiency and availability of the system.
C. System Backup Procedures
Backup procedures help to address technological concerns where measures should be put in place to avoid loss of data and critical information. E-learning involves a variety of materials such as journals and books online, and it is important that such material is accessed unaltered. Regular backups of data are an essential element in analyzing risk. In addition, students need to back up their courses/materials periodically or as soon as changes are made to them [23]. The learning institution needs to develop a backup procedure by following certain guidelines.
First, the personnel to be involved in the backup procedure need to be identified. Secondly, the learning institution needs to consider the frequency with which the backing procedure will be carried out. Thirdly, it is important to understand who is to be notified in the event that a backup problem occurs. This involves understanding the support that can be obtained from the vendors of hardware and software components in the event of such a problem. For instance, if copies of data are stored on stored media, it is important to consider the exact location of such media.
D. System Error Tracking
Bugs are a common occurrence in the development of many systems. These errors usually occur during the technical design phase. In e-learning, this is a major concern that needs to be addressed in order to guarantee the security of the e-learning system. During an e-learning project life cycle, there are various bugs that will be identified. It is therefore important to develop a tool that tracks such bugs and ensure that these bugs are resolved after the project is completed. This may involve using a simple tool such as a simple database [24].
For instance, an excel spread sheet may be used to record these errors by having columns that clearly show the item, the type of error, the owner and priority [24]. In addition, a variety of server tools exist which may be used to enable the users enter the comments directly into the database and allow the managers of the project run the bug reports once. This helps to avoid running error databases separately which may be time consuming. In addition, tracking
Int'l Conf. e-Learning, e-Bus., EIS, and e-Gov. | EEE'13 | 147
E-LEARNING FACTORS & DEFINITIONS 5
software can help to manage the development process, and this is mainly achieved through reusable templates. Such templates can be used for a variety of purposes, including testing and debugging [24].
E. User Friendly Learning System
Some of the pedagogical features of a virtual learning environment involve easy and structured methods of finding and sharing information, as well as communicating with the tutors and peers. This means that the technical infrastructure needs to be robust and user-friendly [16]. Therefore, navigation within the learning environment needs to be easy where it is easy for the students to get course content. It should take a short time to get to the required course content, easy downloading of files and well-constructed websites that are easily navigated [22].
This is one of the technological barriers that can limit how an e-learning system is used. The selection of the tools and the Learning Management Systems greatly affects the interaction between the students and the teachers [16]. The choice of the learning systems should be based on the pedagogical requirements and the technical environment of the learning institution. In a learning institution where technology is widely used, it is likely that most of the learners and teachers will find the e-learning system user-friendly. However, for those institutions that do not heavily employ technology, the choice of the learning system should be based on ease of use. It is important that the e-learning system is stable enough to serve the needs of the diverse learners, content creators and administrators. This requires that the access and delivery of material must be prepared in a manner that is easy to use and should be highly intuitive. This helps to guarantee usability of the e-learning system [25].
F. Courses (Content, Maintenance and Platform)
The amount of material that is produced for e-learning is enormous. The main issue regarding this aspect relates to the selection and the sequencing of the learning materials, and the quality of material produced and used in a course [25]. Although the content may involve printed material, it is highly digital and hence very diverse. In this case, the content used in e-learning is not entirely produced by the teachers. With e-learning, students have become producers of the learning materials, and this makes quality a major concern issue when examining content [16]. The development of this content should extend into consideration of the materials that will be downloaded and those that will be presented on screen.
In addition, the institution should focus on the learning support needs for the teachers and students, especially if such material is to be used by others [26]. The learning platform is also a critical factor as far as e-learning courses are concerned. The e-learning platform forms the core of the e-learning systems which is supposed to meet for main functions: management of students, the dissemination of knowledge, testing and facilitation of communication. The use of these platforms allows the learning institution to leverage the available resources efficiently so as to enhance the learning and teaching processes. These platforms are supposed to ensure that students interact with course material in an engaging and efficient manner. In addition, these platforms have functionalities that allow students to perform self-test in order to check their own level of knowledge [25]. Other aspects of the courses such as multimedia presentations and virtual labs are launched from these platforms.
G. Network Security
E-learning highly depends on information and communication technologies. It is based on: updating, storage, distribution and sharing of information via the internet; and delivery of content to the end user via a network. This makes the concept of network security a major consideration in e-learning [23]. Network security in e-learning should thus focus on user authentication, protection of information from unauthorized access and maintenance of data integrity.
There are a number of approaches that have been adopted to address the problem of network society. First, a firewall may be used to control access. This is a combination of software and hardware security systems which help to prevent unauthorized persons from accessing an institution’s network from outside that institution. In this case, traffic that flows from outside the institution has to pass through the firewall and this is achieved by blocking access of the local network and only permitting access via the firewall. Secondly, digital right management may be employed which might help to protect the assets stored over the internet such as pdf files [23].
One of the approaches used is cryptography where secret and public key algorithms are used to protect the information. For instance, in public key algorithm, one key is used in the encryption of messages or data and another key is used to decrypt these messages. In addition, other authentication techniques such as passwords, digital signatures and digital certificates may be used in order to limit unauthorized access to the network. This can also be
148 Int'l Conf. e-Learning, e-Bus., EIS, and e-Gov. | EEE'13 |
E-LEARNING FACTORS & DEFINITIONS 6
enhanced by biometric authentication which helps to give more enhanced security [23].
H. Evaluate and Update
Evaluation in e-learning involves the assessment of learners as well as an evaluation of the learning and instruction environment. Assessment of students is classified into two broad categories: the summative assessment which grades students to demonstrate their achievement, and these judgments are made based on the set objectives. Secondly, formative assessment is employed as a diagnostic tool for teachers and students in order to identify the weak areas that require improvement.
By undertaking formative evaluation, the learning product can be improved during the development phase. The designers consider the leaner’s feedback and thus communicate with the producers to make the necessary updates [27]. There are several elements that are considered during the evaluation stage. First, in terms of pedagogy, consideration is given as to how the contents are presented and how they support the learning activities.
Secondly, technological evaluations involve understanding the effectiveness of the learning management systems in delivery the online content as well as how it manages this content [27]. Furthermore, this stage involves considering how well the learning materials are managed and maintained. In terms of the institution, an evaluation has to be made regarding how the content is aligned with the desired academic quality of the institution [27]. Finally, this evaluation seeks to identify how the learners perceive the look and feel of the content that is governed [27]. In general, these evaluations are important in identifying those areas that need to be updated in order to enhance the efficiency of the e-learning system.
RESOURCE SUPPORT
A. Staff Qualifications and Experiences This is one of the dimensions that affect the
quality of a give e-learning program. The staff members are involved in a variety of activities that are crucial to the success of the e-learning program. First, the staff should be able to design, produce and test new learning materials. Having qualified and experienced staff will ensure that the content produced meets the required standards as set by the institution, staff members are required to test these materials before dispatching them to the students.
Secondly, it is the responsibility of the staff to ensure that the materials are stored and dispatched as required. There is a need to have qualified personnel who manage the learning materials and
protect it against loss or damage. Third, it is the responsibility of the staff to ensure that the learners are well arranged in order to facilitate their access to the learning materials. For instance, the learners could be arranged in learning centers in order to ensure that they access the learning materials with ease. Fourth, it is important to have qualified and experienced staff members who monitor the progress of the learners. This also involves assessing as well as accrediting the learners depending on their qualifications.
Finally, in order to maintain an effective learning system, it is important to have an evaluating team who will periodically evaluate the learning systems. This may comprise of network administrators and IT experts. In general, the qualifications and experiences of the staff members involved affect the distribution of the materials and the efficiency of the learning system.
B. Online Help System and Online Chat
One of the important aspects in e-learning is interactivity. This relates to how students interact with their teachers, peers and the learning materials. In broad terms, this interaction relates to the interactions students have with the content and with people. This interaction might be via asynchronous modes of communication, commonly known as chat [28]. There are four main advantages of having an online help and support system in e-learning. First, it helps to facilitate student assessment as well as collecting feedback from learners. This may involve the use of quizzes and peer reviews [28]. Secondly, students are able to engage in discussions with either of their peers and/or their teachers. This helps to enhance their experiences in e-learning. Thirdly, such systems help in the enrichment of content where resources are made to be more interactive. As noted earlier, these students are not only users of learning materials, but also actively engage in the creation of such materials. Students and teachers engage in the process of enhancing the content through online communications. Finally, such systems enable for skill support through the use of various resources such lecture notes [28]. The use of online help systems and chat has the advantage of extending the reach where remote audiences actively take part in the learning process simultaneously. This helps to extend education to those persons who could not attend at a given time.
C. Speed and Availability
Availability is one of the confidence building requirements in an e-learning environment. For e-learning to be successfully adopted, it is important that network based applications remain
Int'l Conf. e-Learning, e-Bus., EIS, and e-Gov. | EEE'13 | 149
E-LEARNING FACTORS & DEFINITIONS 7
available all the time in order to enhance the productivity of users. For instance, if a learning system is too slow because of a denial of service attack, the users end up taking more time to access materials and complete their work, and this greatly affects their productivity. Speed and availability are critical components that help students achieve their desired educational goals [29]. For example, students are required in getting critical information at the beginning of a course relating to the subjects, lecturers, assignment schedules and material required [29]. Such information needs to be available to the learners in a form that is concise and understandable whenever and where ever it is accessed.
The availability of the e-learning system is thus affected by its design. For instance, if the site has too much content or too complicated, availability is affected. It is therefore important for such considerations to be made when designing the e-learning systems [29]. In addition, for those sites that have a high volume of material, there is the need to have a high speed internet connection to effectively load pages [29]. These two aspects also affect the efficiency of the systems where if a system is unavailable, it will be inefficient and students find it difficult to complete the required tasks. It is crucial for users of such systems to ensure that the devices they use have the necessary capabilities to guarantee high speed connection and availability.
D. Training for Students and Staff
The adoption of e-learning requires that both the teachers and students acquire new skills in order to effectively embrace it. This is because the education shifts from being purely teacher centered to one that is more collaborative where teachers become facilitators and act as the intermediaries between the students and the materials [30]. Lack of adequate training for both staff and students can lead to lack of engagement in the e-learning activities. The training of these two groups should mainly focus on the use of modern ICT tools in learning and teaching.
Some of these technologies include social media, computers and teleconferencing tools. In addition, this training needs to focus on their attitudes towards ICT and other educational technologies. For instance, staff members are likely to experience many problems when their institutions adopt flexible and open learning and make use of ideas that they do not fully understand or are not in accord with their traditional practices [30]. Therefore, training of staff and students is a step taken in ensuring all stakeholders fully engage in e-learning. In addition, this also ensures that the benefits of e-learning are realized through full exploitation of communication and education technologies.
REFERENCE
[1] T. Volery and D. Lord, “Critical success factors in online education,” International Journal of Educational Management, vol. 14(5), pp. 216-223, 2000 [2] H. M Selim “Critical success factors for e-learning acceptance: Confirmatory factor models,” Computers & Education, vol. 49(2), pp. 396-413, 2007. [3] S. Ozkan and R. Koseler, “Multi-dimentional students evaluation of e-learning systems in the higher education context: An empirical investigation,” Computer & Education, vol. 53, pp. 1285-1296, 2009. [4] D. Gillette, “Pedagogy, architecture, and the virtual classroom,” Technical Communication Quarterly, vol. 8(1), pp. 21-36, 1999. [5] G. Gregory, “Academic senate of California polytechnic state university,”[online] in Academic Senate, 2012. http://www.academicsenate.calpoly.edu/sites/academicsenate.wcms.calpoly.edu/files/agendas/12-13_agendas/sa111312.pdf (Accessed: 11 January 2013) [6] M. Momeni, M Jamporazmey, and F. Bahadori, “Comprehensive framework for evaluating e-learning systems: Using BSC framework,” International Journal on E-Learning, vol. 12(1), pp. 81-98, 2013. [7] G. Puri, “Critical success Factors in e-Learning–An empirical study,” International Journal of Multidisciplinary Research, vol. 2(1), pp. 149-161, 2012. [8] E. P. Nathan, Critical success factors: How one multinational company develops global e-learning,” Ph.D. dissertation, Ithaca College, New York, 2009. [9] B. H. Khan, “A framework for e-learning,” [online] LTI magazine, 2001. http://lomo.kyberia.net/diplomovka/webdownload/partial/elearningmag.com/E-Learning%20-%20A%20Framework%20for%20E-learning.pdf (Accessed: 15 May 2013) [10] E. Kanninen, “Learning styles and e-learning,” M.S. thesis, Science, Tampere University of Technology, Tampere, Finland, 2008. [11] M. Sunnarborg, “From teacher to facilitator,” [online] Learning Solutions Magazine, 2008. http://www.learningsolutionsmag.com/articles/74/from-teacher-to-facilitator (Accessed: 27 January 2013) [12] S. Sengupta, B. Mukherjee and S. Bhattacharya, “Designing a scaffolding for supporting personalized synchronous e-learning,” CS & IT-CSCP, vol. 6, pp. 505-511, 2012.
150 Int'l Conf. e-Learning, e-Bus., EIS, and e-Gov. | EEE'13 |

E-LEARNING FACTORS & DEFINITIONS 8
[13] A. L. Baylor and D. Ritchie, “What factors facilitate teacher skill, teacher morale, and perceived student learning in technology-using classrooms?,” Computers & Education, vol. 39(4), pp. 395-414, 2002. [14] M. R. Mehregan, M. Jamporazmey and M. Mehrafrouz, “Application of fuzzy analytic hierarchy process in ranking modern educational systems’ success criteria,” International Journal of e-Education, e-Business, e-Management and e-Learning, vol. 1(4), pp. 299-304, 2011. [15] B. Barron, “Interest and self-sustained learning as catalysts of development: A learning ecology perspective,” Human Development, vol. 49(4), pp. 193-224, 2006. [16] Swedish national agency for higher education , ” E-learning quality: Aspects and criteria for evaluation of e-learning in higher education,”. in 45 Tryckeri AB, Solna, pp. 1-91, 2008. [17] M. Frimpon, “A re-structuring of the critical success factors for e-learning deployment,” American International Journal of Contemporary Research, vol. 2(3), pp. 115-127, 2012. [18] M. A. Musa and M. S. Othman “Critical success factor in e-Learning: an examination of technology and student factors,” International Journal of Advances in Engineering & Technology, vol. 3(2), pp. 140-148, 2012. [19] J. M. Keller, “Motivational design of instruction.” Instructional Design Theories and Models: 3860433, Hillsdale, NJ, 1983. [20] R. Catalanello and M. Sokol, “Success of Florida virtual school is difficult to measure,” [online] Tampa Bay Times, 2012. http://www.tampabay.com/news/education/k12/success-of-florida-virtual-school-is-difficult-to-measure/1209497 (Accessed: 29 October 2012) [21] R. Smith, “Motivational factors in e-learning,” [online] George Washington University, 2008. http://www.ruthcsmith.com/ (Accessed: 15 January 2013) [22] P. Mungania, “The seven e-learning barriers facing employees,” [online] the Masie Center, pp. 1-80, 2003. http://aerckenya.org/docs/ElearningReport.pdf (Accessed: 25 February 2013) [23] N. Barik and S. Karforma, “Risks and Remedies in E-learning System,” International Journal of Network Security & Its Applications (IJNSA), vol. 4(1). Pp.51-59, 2012. [24] M. Harrison, “Four technology tips for e-learning project managers,” Kineo Insight, pp. 1-22, 2007.
[25] A. Al-Dahoud and T. Walkowiak, “Dependable e-learning systems,” E-Learning, Experiences and Future, Safeeullah Soomro, Ed, Rijeka, Croatia, InTech, 2010, pp. 295-304. [26] Backroad Connections Pty Ltd, “Developing e-learning content,” Australian Flexible Learning Framework Quick Guides series, Australian National Training Authority, pp. 1-16, 2003. [27] B. Khan “Program Evaluation in E-Learning,” [online] 2008. http://asianvu.com/bk/elearning_evaluation_article.pdf (Accessed: 25 February 2013) [28] C. McNaught.,P. Lam, C. Keing and K. F. Cheng, “Improving e-learning support and infrastructure: An evidence-based,” in Technology Supported Learning and Teaching: A Staff Perspective, Hershey, PA, Information Science Publishing, Idea Group Inc. pp. 71-89, 2006. [29] A. Y. Alsabawy and A. Cater-Steel, “Identifying the Determinants of E-learning Service Delivery Quality,” 23rd Australasian Conference on Information Systems, 2012, pp. 1-10. [30] V. Vrana et al, “Analyzing academic staff and students’ attitudes towards the adoption of e-learning,” [online] http://asiapacific-odl.oum.edu.my/C70/F275.pdf (Accessed: 25 February 2013)
Int'l Conf. e-Learning, e-Bus., EIS, and e-Gov. | EEE'13 | 151

152 Int'l Conf. e-Learning, e-Bus., EIS, and e-Gov. | EEE'13 |

SESSION
E-GOVERNMENT AND ISSUES OF INTEREST TOGOVERNMENT, ELECTED OFFICIALS, AND
RELEVANT AGENCIES
Chair(s)
TBA
Int'l Conf. e-Learning, e-Bus., EIS, and e-Gov. | EEE'13 | 153

154 Int'l Conf. e-Learning, e-Bus., EIS, and e-Gov. | EEE'13 |
Personal information systems usability and contents tailoring by users
C. Detraux 1 and D. L. Scapin 1
1 INRIA, Domaine de Voluceau, 78153, Le Chesnay Cedex, France
Abstract - This paper describes an experiment on the usability of a new personal information management system on internet (PIMI). The goals are to evaluate its usability, and to assess user tailoring as an evaluation technique. Thirty users participated to the study : a first part consisted in a standard user test (SUT) and a second part was a usability test with tailoring by users (UTT). Overall, a total of 51 usability problems were diagnosed. Among those, 32 resulted from SUT, and 19 from UTT. Part of the latter (11) are additional to the ones identified during SUT, and to those diagnosed previously by usability inspection (UI with Ergonomic Criteria). The active involvement of users through customization scenarios appear to provide additional cues for usability assessment, and for design (new generic usability recommendations).
Keywords: Usability evaluation; evaluation methods; user tailoring; personal information systems; e-gov.
1 Introduction Personal information management systems (PIMs) and tools are now widely offered on internet and smartphones to support our daily lives, as citizen, employees, stakeholders, family members, friends, etc. Such novel systems and tools need to be usable, especially for reaching the goal of various government initiatives for “paperless” administrative procedures. The study presented here has been conducted with that goal, in a ANR-PIMI project which aims at developing a Personal Information Space on Internet for supporting remote e-procedures (getting a passport, paying taxes, obtaining social services, etc.). This study follows up on previous work that contributed to the iterative design of the current prototype. An initial research [1] carried out several usability studies: 1 administrative forms analysis; 3 "focus groups" on information storage, and on sharing; 1 online questionnaire on the same topics for a wider range of audience; 1 "card-sorting" study to validate categories created by users and to organize their information. All the design/ evaluation iterative steps led to a PIMI mock-up, taking into account users' needs as they were collected. Another research [2] complemented the approach through an experiment to validate the information content and structure of the mock-up that was partly modifiable. The results allowed to validate the item structure for the future personal space,
and started assessing user modifications as evaluation cues, and provided usability recommendations. Going further, in the current study, the goal is twofold: evaluate the usability of the advanced PIMI prototype (in terms of contents and structure), and investigate the role of various methods in usability problems diagnosis. In the experiment, a standard user test (SUT) and a test with tailoring (UTT) are compared. The results are then compared to a previous usability inspection (UI). This paper first reviews some aspects of the literature on PIMs, on user tailoring, and on usability methods comparisons. Then, the experiment method, procedure, material, participants, and main results are presented. The conclusion discusses lessons learned and directions for future work.
2 Other Work Personal Information Management Systems (PIMs) refers to studies on how users manage their data and personal documents. From a usability point of view, the literature is not yet very rich. Some are partly covered in CSCW conferences [3], of course mainly on cooperation, groups, social interactions; and on societal aspects in [4]. Other papers are more directly concerned with usability for individuals, such as « user's personal digital ecosystem » in [5], or about the evolution of usage with tablets in [6], or on privacy in [7], and [8]. Also contributions concerned facilitated form-filling in [9], web search in [10], and supporting flexibility between devices in [11]. Some studies attempted, through longitudinal studies, to understand how people make notes and archive their information in [12], or looked at mobile practices in [13]. However, very little can be found on usability assessment, as reported in [2, op.cit.], in which, besides a review of 15 PIM tools, highlights are provided about the organization and information retrieval aspects among which hierarchical structures seem still to be the most widespread and users favorite [14] [15] [16] [17], but that also show users difficulties in creating consistent and meaningful hierarchical structures, and in naming categories/items. Our current experiment attempts to go further on those issues of personal information structure and naming.
User tailoring. Previous work [2, op.cit.] reviewed the literature on tailoring and personalization. No real
Int'l Conf. e-Learning, e-Bus., EIS, and e-Gov. | EEE'13 | 155
novel contributions were found beyond [18] [19] [20] [21] on user modifications in systems design/development, its usability and impact on usability measurements. On the other hand, many papers relate to other issues, such as recommender systems [22], social networks [23], games [24], physical environments [25], e-learning [26], etc. In short, very few experimental results exist about user modifications as a means of usability evaluation. This study on a prototype intends to complement this by providing new empirical results.
Usability evaluation methods (UEMs) are numerous (see [27]). Comparing them is very complex and lengthy, especially when following guidelines and criteria such as in [28] [29]. In a thorough literature review [30] issues were reported (see [31] [28 & 29, op.cit] [32]), such as using appropriate metrics, problem severity, whether putative usability problems extracted in analyses are genuine, thoroughness, problem similarity, and usability problem interpretation. In the current study, we attempted to alleviate these difficulties through a thorough problem coding. However, while we used a rather large set of participants in the experiment, the usability inspection carried out was only co-conducted by 2 experts, unlike the above study [30, op.cit.].
3 Experiment The goal of the experiment is to evaluate the PIMI prototype through information on the intuitive user behavior. The specific objectives are to verify: the usability of the user interface when entering/ filling information; finding items; modifying contents (categories/ sections names, items display order, deactivating items); the understandability of current naming of categories, sections, and items; the appropriateness of the information structure; and the level of tailoring that users intuitively perform; and its role on usability problems diagnosis. 3.1 Method and procedure The sessions were conducted individually and supervised by the experimenter. They were conducted in the participants’ own working or study environment (offices for researchers and administrative staff; computer room for students). This allowed easy access to their personal belongings (bags, wallets, diaries, personal or work computers) for the tasks required. The prototype was presented on a laptop computer and sessions recorded with a screen capture software (video and sound). A pilot test was conducted with one subject to assess the experimenter’s discourse and to calibrate scenarios duration (in order, for the experiment to last less than one hour). The sessions were conducted in three main phases:
- Initially: presentation of the project, of the experiment objectives, and of the prototype (how to navigate, enter,
save and modify the PIMI). The participants were encouraged to think aloud about their difficulties in relation to the task scenarios, the tool, the data.
- A phase of work on the tasks and scenarios: in a first part, 4 task scenarios were proposed consecutively: Scenario 1: personal identification tasks (e.g., enter name, identity card information, address, phone); Scenario 2: tasks about professional contacts and student curriculum.; Scenario 3: data entry tasks on two types of forms; Scenario 4: to verify whether proposed redundancies are understood, accepted and the path(s) followed to find them. In a second part, two steps were proposed: a first step where a scenario required to make changes according to the instructions (function "Custom PIMI" or "Customization Options" to "Enter and View Information"). A second step required the participants to browse the entire prototype structure to make the changes they wished.
- Finally, a questionnaire allowed the participants to comment on the prototype, and on the difficulties they had. The questions were "closed" (yes-no or list of options). However, the experimenter encouraged the participants to justify their answers orally (audio recording) or in writing.
3.2 Material Information items. The latest results from a previous study [2] resulted in a structure of information items with 10 categories, with 35 sub-categories : Identity (personal identity, ID papers, family); Work (current work/ affiliation details, career, student curriculum, and professional contacts); Papers (ID papers, salary sheets, social security card); Contacts (personal & professional); Agenda (personal & professional); Transportation (private, public); Codes (entry codes, locks, phones, passwords, websites, credit cards); Finance (income and benefits, investments, loans, bank accounts); Taxes (income tax reference, tax deductions, tax bracket, property tax, housing tax); Health (social security & health insurance, physicians, medical records, emergency contact person), for a total of 73 information items.
Prototype. The PIMI prototype (PC V0.3) was available locally with a Firefox browser on a Windows platform. Figure 1 shows a screen shot of the prototype.
Experimenter’s equipment : video screen capture software: NCH Software : it allows recording the entire sessions through video capture of the screen, as well as all the user comments (with the participants’ authorization). Observation checklists cards are also completed by the experimenter during the sessions to gather the most relevant information on various aspects explained in the scenario descriptions.
Participants’ equipment : laptop with prototype and capture software installed. Description sheets with
156 Int'l Conf. e-Learning, e-Bus., EIS, and e-Gov. | EEE'13 |
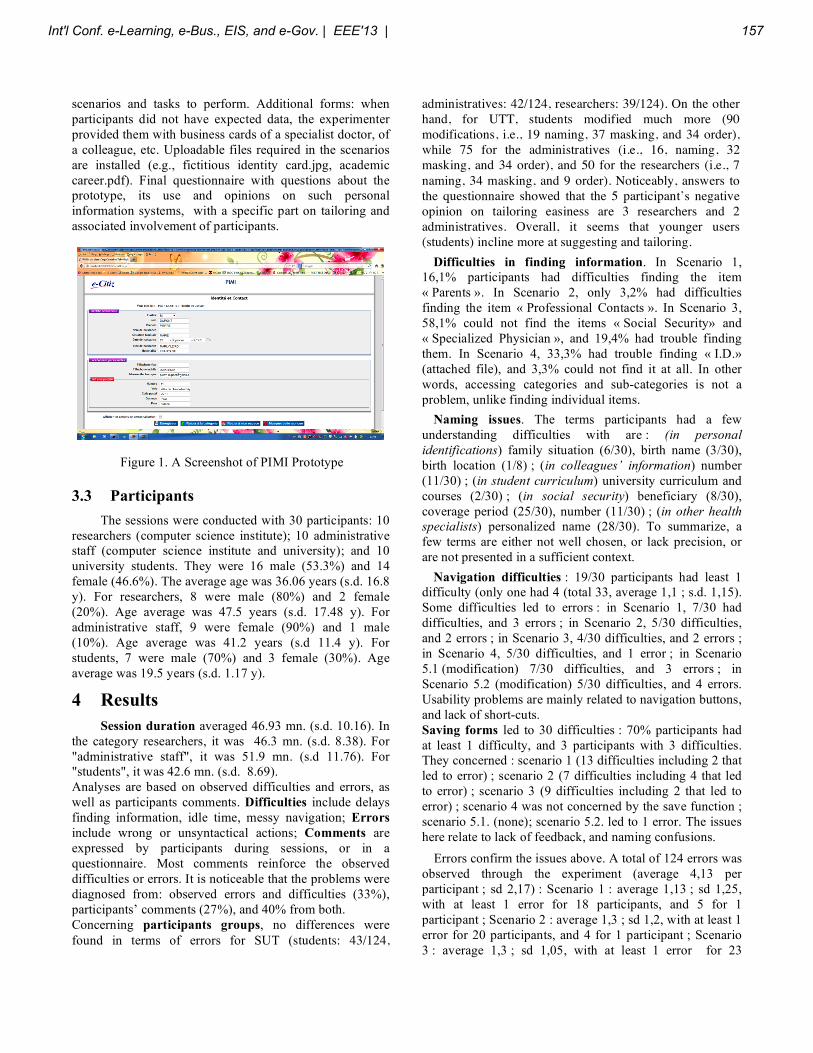
scenarios and tasks to perform. Additional forms: when participants did not have expected data, the experimenter provided them with business cards of a specialist doctor, of a colleague, etc. Uploadable files required in the scenarios are installed (e.g., fictitious identity card.jpg, academic career.pdf). Final questionnaire with questions about the prototype, its use and opinions on such personal information systems, with a specific part on tailoring and associated involvement of participants.
Figure 1. A Screenshot of PIMI Prototype
3.3 Participants The sessions were conducted with 30 participants: 10 researchers (computer science institute); 10 administrative staff (computer science institute and university); and 10 university students. They were 16 male (53.3%) and 14 female (46.6%). The average age was 36.06 years (s.d. 16.8 y). For researchers, 8 were male (80%) and 2 female (20%). Age average was 47.5 years (s.d. 17.48 y). For administrative staff, 9 were female (90%) and 1 male (10%). Age average was 41.2 years (s.d 11.4 y). For students, 7 were male (70%) and 3 female (30%). Age average was 19.5 years (s.d. 1.17 y).
4 Results Session duration averaged 46.93 mn. (s.d. 10.16). In the category researchers, it was 46.3 mn. (s.d. 8.38). For "administrative staff", it was 51.9 mn. (s.d 11.76). For "students", it was 42.6 mn. (s.d. 8.69). Analyses are based on observed difficulties and errors, as well as participants comments. Difficulties include delays finding information, idle time, messy navigation; Errors include wrong or unsyntactical actions; Comments are expressed by participants during sessions, or in a questionnaire. Most comments reinforce the observed difficulties or errors. It is noticeable that the problems were diagnosed from: observed errors and difficulties (33%), participants’ comments (27%), and 40% from both. Concerning participants groups, no differences were found in terms of errors for SUT (students: 43/124,
administratives: 42/124, researchers: 39/124). On the other hand, for UTT, students modified much more (90 modifications, i.e., 19 naming, 37 masking, and 34 order), while 75 for the administratives (i.e., 16, naming, 32 masking, and 34 order), and 50 for the researchers (i.e., 7 naming, 34 masking, and 9 order). Noticeably, answers to the questionnaire showed that the 5 participant’s negative opinion on tailoring easiness are 3 researchers and 2 administratives. Overall, it seems that younger users (students) incline more at suggesting and tailoring.
Difficulties in finding information. In Scenario 1, 16,1% participants had difficulties finding the item « Parents ». In Scenario 2, only 3,2% had difficulties finding the item « Professional Contacts ». In Scenario 3, 58,1% could not find the items « Social Security» and « Specialized Physician », and 19,4% had trouble finding them. In Scenario 4, 33,3% had trouble finding « I.D.» (attached file), and 3,3% could not find it at all. In other words, accessing categories and sub-categories is not a problem, unlike finding individual items.
Naming issues. The terms participants had a few understanding difficulties with are : (in personal identifications) family situation (6/30), birth name (3/30), birth location (1/8) ; (in colleagues’ information) number (11/30) ; (in student curriculum) university curriculum and courses (2/30) ; (in social security) beneficiary (8/30), coverage period (25/30), number (11/30) ; (in other health specialists) personalized name (28/30). To summarize, a few terms are either not well chosen, or lack precision, or are not presented in a sufficient context.
Navigation difficulties : 19/30 participants had least 1 difficulty (only one had 4 (total 33, average 1,1 ; s.d. 1,15). Some difficulties led to errors : in Scenario 1, 7/30 had difficulties, and 3 errors ; in Scenario 2, 5/30 difficulties, and 2 errors ; in Scenario 3, 4/30 difficulties, and 2 errors ; in Scenario 4, 5/30 difficulties, and 1 error ; in Scenario 5.1 (modification) 7/30 difficulties, and 3 errors ; in Scenario 5.2 (modification) 5/30 difficulties, and 4 errors. Usability problems are mainly related to navigation buttons, and lack of short-cuts. Saving forms led to 30 difficulties : 70% participants had at least 1 difficulty, and 3 participants with 3 difficulties. They concerned : scenario 1 (13 difficulties including 2 that led to error) ; scenario 2 (7 difficulties including 4 that led to error) ; scenario 3 (9 difficulties including 2 that led to error) ; scenario 4 was not concerned by the save function ; scenario 5.1. (none); scenario 5.2. led to 1 error. The issues here relate to lack of feedback, and naming confusions.
Errors confirm the issues above. A total of 124 errors was observed through the experiment (average 4,13 per participant ; sd 2,17) : Scenario 1 : average 1,13 ; sd 1,25, with at least 1 error for 18 participants, and 5 for 1 participant ; Scenario 2 : average 1,3 ; sd 1,2, with at least 1 error for 20 participants, and 4 for 1 participant ; Scenario 3 : average 1,3 ; sd 1,05, with at least 1 error for 23
Int'l Conf. e-Learning, e-Bus., EIS, and e-Gov. | EEE'13 | 157
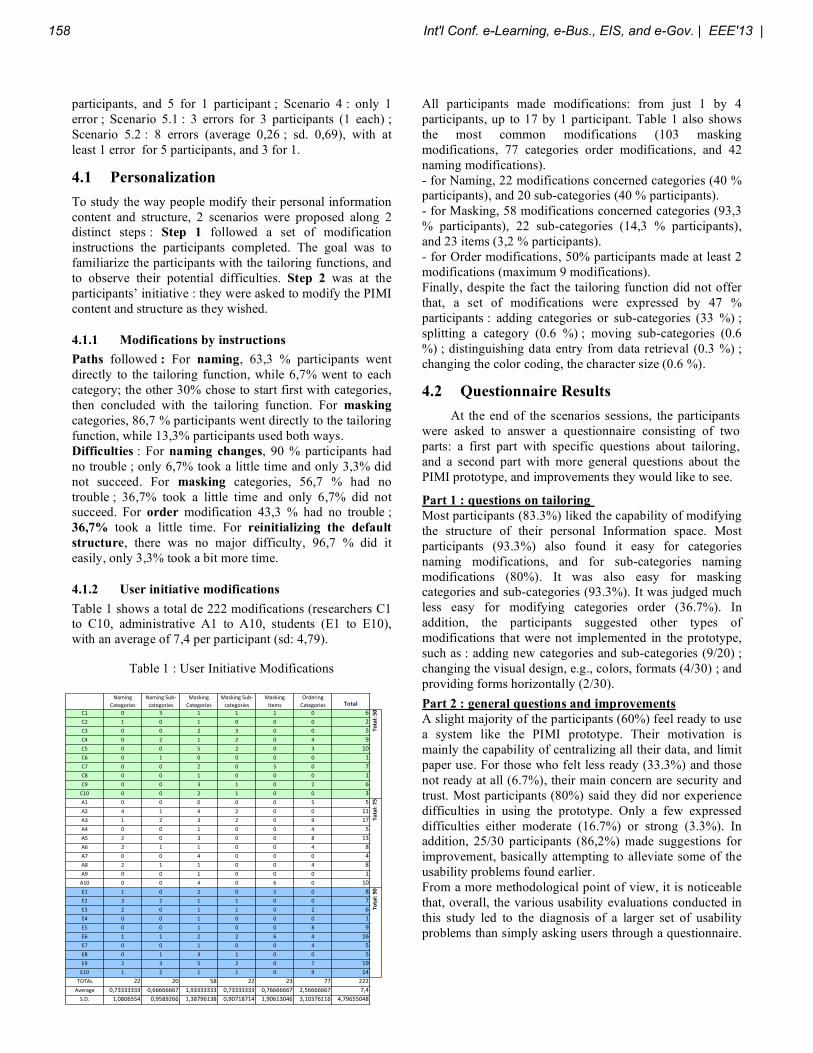
participants, and 5 for 1 participant ; Scenario 4 : only 1 error ; Scenario 5.1 : 3 errors for 3 participants (1 each) ; Scenario 5.2 : 8 errors (average 0,26 ; sd. 0,69), with at least 1 error for 5 participants, and 3 for 1.
4.1 Personalization To study the way people modify their personal information content and structure, 2 scenarios were proposed along 2 distinct steps : Step 1 followed a set of modification instructions the participants completed. The goal was to familiarize the participants with the tailoring functions, and to observe their potential difficulties. Step 2 was at the participants’ initiative : they were asked to modify the PIMI content and structure as they wished.
4.1.1 Modifications by instructions Paths followed : For naming, 63,3 % participants went directly to the tailoring function, while 6,7% went to each category; the other 30% chose to start first with categories, then concluded with the tailoring function. For masking categories, 86,7 % participants went directly to the tailoring function, while 13,3% participants used both ways. Difficulties : For naming changes, 90 % participants had no trouble ; only 6,7% took a little time and only 3,3% did not succeed. For masking categories, 56,7 % had no trouble ; 36,7% took a little time and only 6,7% did not succeed. For order modification 43,3 % had no trouble ; 36,7% took a little time. For reinitializing the default structure, there was no major difficulty, 96,7 % did it easily, only 3,3% took a bit more time.
4.1.2 User initiative modifications Table 1 shows a total de 222 modifications (researchers C1 to C10, administrative A1 to A10, students (E1 to E10), with an average of 7,4 per participant (sd: 4,79).
Table 1 : User Initiative Modifications
All participants made modifications: from just 1 by 4 participants, up to 17 by 1 participant. Table 1 also shows the most common modifications (103 masking modifications, 77 categories order modifications, and 42 naming modifications). - for Naming, 22 modifications concerned categories (40 % participants), and 20 sub-categories (40 % participants). - for Masking, 58 modifications concerned categories (93,3 % participants), 22 sub-categories (14,3 % participants), and 23 items (3,2 % participants). - for Order modifications, 50% participants made at least 2 modifications (maximum 9 modifications). Finally, despite the fact the tailoring function did not offer that, a set of modifications were expressed by 47 % participants : adding categories or sub-categories (33 %) ; splitting a category (0.6 %) ; moving sub-categories (0.6 %) ; distinguishing data entry from data retrieval (0.3 %) ; changing the color coding, the character size (0.6 %).
4.2 Questionnaire Results At the end of the scenarios sessions, the participants were asked to answer a questionnaire consisting of two parts: a first part with specific questions about tailoring, and a second part with more general questions about the PIMI prototype, and improvements they would like to see.
Part 1 : questions on tailoring Most participants (83.3%) liked the capability of modifying the structure of their personal Information space. Most participants (93.3%) also found it easy for categories naming modifications, and for sub-categories naming modifications (80%). It was also easy for masking categories and sub-categories (93.3%). It was judged much less easy for modifying categories order (36.7%). In addition, the participants suggested other types of modifications that were not implemented in the prototype, such as : adding new categories and sub-categories (9/20) ; changing the visual design, e.g., colors, formats (4/30) ; and providing forms horizontally (2/30).
Part 2 : general questions and improvements A slight majority of the participants (60%) feel ready to use a system like the PIMI prototype. Their motivation is mainly the capability of centralizing all their data, and limit paper use. For those who felt less ready (33.3%) and those not ready at all (6.7%), their main concern are security and trust. Most participants (80%) said they did nor experience difficulties in using the prototype. Only a few expressed difficulties either moderate (16.7%) or strong (3.3%). In addition, 25/30 participants (86,2%) made suggestions for improvement, basically attempting to alleviate some of the usability problems found earlier. From a more methodological point of view, it is noticeable that, overall, the various usability evaluations conducted in this study led to the diagnosis of a larger set of usability problems than simply asking users through a questionnaire.
!"#$%&'
(")*&+,$*-
!"#$%&'./01
2")*&+,$*-
3"-4$%&'
(")*&+,$*-
3"-4$%&'./01
2")*&+,$*-'
3"-4$%&'''''''
5)*#-
6,7*,$%&''''''
(")*&+,$*- !"#$%&
(8 9 : 8 8 8 9 ;
(< 8 9 8 9 9 9 <
(: 9 9 < : 9 9 =
(> 9 < 8 < 9 > ?
(= 9 9 = < 9 : 89
(; 9 8 9 9 9 9 8
(@ 9 9 < 9 = 9 @
(A 9 9 8 9 9 9 8
(? 9 9 : 8 9 < ;
(89 9 9 < 8 9 9 :
B8 9 9 9 9 9 = =
B< > 8 > < 9 9 88
B: 8 < : < 9 ? 8@
B> 9 9 8 9 9 > =
B= < 9 : 9 9 A 8:
B; < 8 8 9 9 > A
B@ 9 9 > 9 9 9 >
BA < 8 8 9 9 > A
B? 9 9 8 9 9 9 8
B89 9 9 > 9 ; 9 89
C8 8 9 < 9 = 9 A
C< : < 8 8 9 9 @
C: < 9 8 8 9 < ;
C> 9 9 8 9 9 9 8
C= 9 9 8 9 9 A ?
C; 8 8 < < ; > 8;
C@ 9 9 8 9 9 > =
CA 9 8 : 8 9 9 =
C? < : = < 9 @ 8?
C89 8 < 8 8 9 ? 8>
D6DBE << <9 =A << <: @@ <<<
BF*,"&*' 9G@::::::: 9G;;;;;;;@ 8G?::::::: 9G@::::::: 9G@;;;;;;@ <G=;;;;;;@ @G>
.HIH 8G9A9;==> 9G?=A?<;; 8G:A@?;8:A 9G?9@8A@8> 8G?9;8:9>; :G89:@;88; >G@?;==9>A
!"#$%'&()
&&&&&&&&&&&&&&&&&&&&&&&&&&&&&&&&&&&&&&&&&&&&&&&&&!"#$%'&*)
!"#$%'&+*
158 Int'l Conf. e-Learning, e-Bus., EIS, and e-Gov. | EEE'13 |
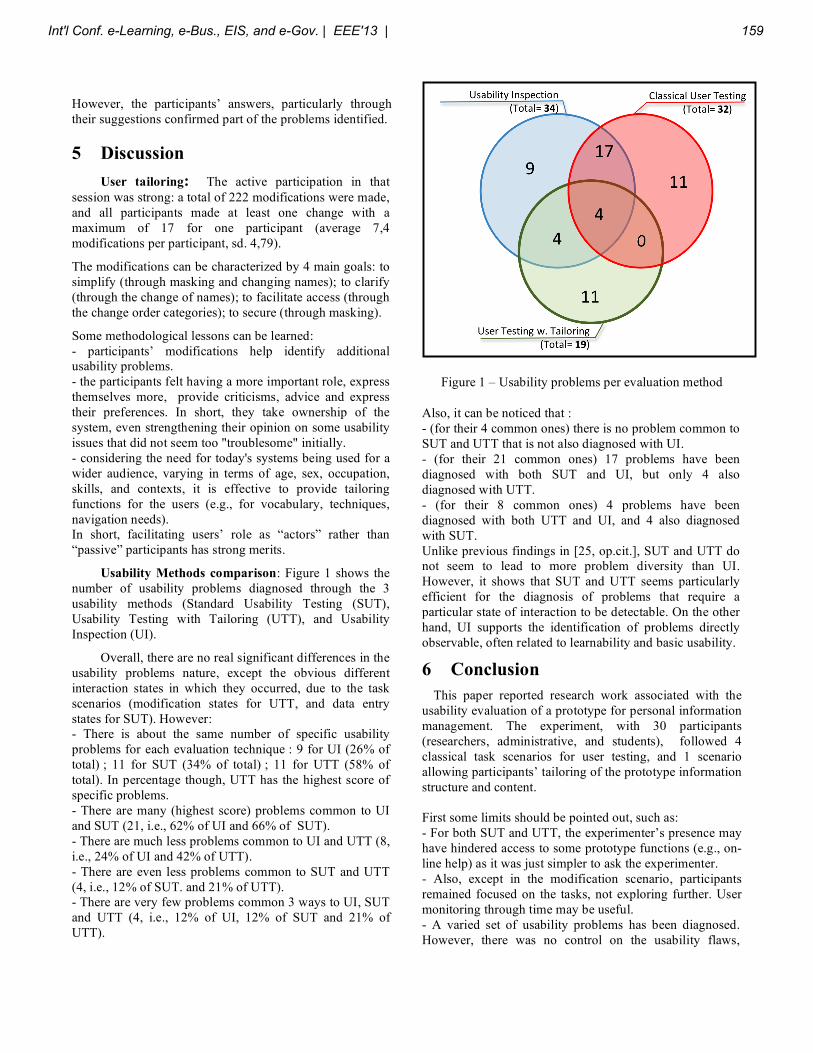
However, the participants’ answers, particularly through their suggestions confirmed part of the problems identified. 5 Discussion User tailoring: The active participation in that session was strong: a total of 222 modifications were made, and all participants made at least one change with a maximum of 17 for one participant (average 7,4 modifications per participant, sd. 4,79).
The modifications can be characterized by 4 main goals: to simplify (through masking and changing names); to clarify (through the change of names); to facilitate access (through the change order categories); to secure (through masking).
Some methodological lessons can be learned: - participants’ modifications help identify additional usability problems. - the participants felt having a more important role, express themselves more, provide criticisms, advice and express their preferences. In short, they take ownership of the system, even strengthening their opinion on some usability issues that did not seem too "troublesome" initially. - considering the need for today's systems being used for a wider audience, varying in terms of age, sex, occupation, skills, and contexts, it is effective to provide tailoring functions for the users (e.g., for vocabulary, techniques, navigation needs). In short, facilitating users’ role as “actors” rather than “passive” participants has strong merits.
Usability Methods comparison: Figure 1 shows the number of usability problems diagnosed through the 3 usability methods (Standard Usability Testing (SUT), Usability Testing with Tailoring (UTT), and Usability Inspection (UI).
Overall, there are no real significant differences in the usability problems nature, except the obvious different interaction states in which they occurred, due to the task scenarios (modification states for UTT, and data entry states for SUT). However: - There is about the same number of specific usability problems for each evaluation technique : 9 for UI (26% of total) ; 11 for SUT (34% of total) ; 11 for UTT (58% of total). In percentage though, UTT has the highest score of specific problems. - There are many (highest score) problems common to UI and SUT (21, i.e., 62% of UI and 66% of SUT). - There are much less problems common to UI and UTT (8, i.e., 24% of UI and 42% of UTT). - There are even less problems common to SUT and UTT (4, i.e., 12% of SUT. and 21% of UTT). - There are very few problems common 3 ways to UI, SUT and UTT (4, i.e., 12% of UI, 12% of SUT and 21% of UTT).
Figure 1 – Usability problems per evaluation method
Also, it can be noticed that : - (for their 4 common ones) there is no problem common to SUT and UTT that is not also diagnosed with UI. - (for their 21 common ones) 17 problems have been diagnosed with both SUT and UI, but only 4 also diagnosed with UTT. - (for their 8 common ones) 4 problems have been diagnosed with both UTT and UI, and 4 also diagnosed with SUT. Unlike previous findings in [25, op.cit.], SUT and UTT do not seem to lead to more problem diversity than UI. However, it shows that SUT and UTT seems particularly efficient for the diagnosis of problems that require a particular state of interaction to be detectable. On the other hand, UI supports the identification of problems directly observable, often related to learnability and basic usability.
6 Conclusion This paper reported research work associated with the usability evaluation of a prototype for personal information management. The experiment, with 30 participants (researchers, administrative, and students), followed 4 classical task scenarios for user testing, and 1 scenario allowing participants’ tailoring of the prototype information structure and content. First some limits should be pointed out, such as: - For both SUT and UTT, the experimenter’s presence may have hindered access to some prototype functions (e.g., on-line help) as it was just simpler to ask the experimenter. - Also, except in the modification scenario, participants remained focused on the tasks, not exploring further. User monitoring through time may be useful. - A varied set of usability problems has been diagnosed. However, there was no control on the usability flaws,
Int'l Conf. e-Learning, e-Bus., EIS, and e-Gov. | EEE'13 | 159

resulting (involuntarily) from the design by a partner company specialized in e-government applications and tools design. This prevents of course from generalizing fully to all other applications of this kind. In the future, it would be interesting to introduce voluntarily a large set of usability flaws over all states of the application, with a full variation of usability problem types, in order to have a control on the total number of problems, their nature and location, therefore allowing to extract the full set of diagnoses according to each evaluation technique ... but that is quite complex to do and very time consuming. - only the information structure and content of the prototype were evaluated, but not yet its e-procedures which will be implemented later this year.
The results allowed the diagnosis of 51 usability problems and led to recommendations for improving the final version of the prototype. From a methodological point of view, we investigated the relative role of the two evaluation methods used in the experiment (standard user test (SUT) and user test with tailoring (UTT)). Additionally, the results were also compared to results from a usability inspection (UI). The three evaluation techniques are quite complementary, but direct involvement of the users through a tailoring scenario enriches the evaluation, pointing at unexpected paths, function use, understanding of concepts, etc.
While usability inspection based on Ergonomic Criteria allowed to make a general diagnosis for usability problems (several types and in many states of the interface), user test allowed to identify similar types of problems, but with a more detailed focus, despite only on a fewer interaction states.
Using tailoring scenarios allows users to express themselves more about the system by showing their preferences and thus promoting a more collaborative design and evaluation process.
Overall, the active and direct participation of users by providing new structures, terms, pathways, and functions lead to very rich usability cues for evaluation and design.
For future research work, several issues seem worth investigating: - security and trust is still an issue, even though a positive perception seems facilitated by user involvement in tailoring structure and content, but little is known yet about the full picture, with e-procedures. - real usage: one must find ways of actually evaluating real use through innovative and intelligent tools for collecting real-time user data, including on evolutionary tailoring. - mobility: PIMs, such as the prototype evaluated in our study with a PC, will obviously need to be used on smartphones and other tablets. A mobile PIMI version is being developed, but its usability, and compatibility with PC version, including its plasticity will need to be assessed.
Acknowledgement: This research was supported by the ANR project PIMI.
7 References [1] D. L. Scapin, P. Marie-Dessoude , M. Winckler, C. Detraux. Personal Information Systems: User Views and Information Categorization, in "Proc. Centric2011-4th. Intl. Conf. on Advances in Human-oriented and Personalized Mechanisms, Technologies, and Services", Barcelona, Spain, 2011.
[2] C. Detraux, D. L. Scapin. User Modifications as Usability Evaluation Cues for a Personal Information Space, in EEE2012, Intl. Conf. on e-Learning, e-Business, Enterprise Information Systems, and e-Government", Las Vegas, USA, 2012.
[3] CSCW13-1. Proc. of the 2013 ACM Conference on Computer Supported Cooperative Work v.1 / Amy Bruckman / Scott Counts / Cliff Lampe / Loren Terveen San Antonio, Texas 2013-02-23 2013-02-27 2013 ACM n.141 p.1566
[4] Oakley, R. L. and Salam, A. F. Cyber Citizens and Cyber Deviance: Exploring Social and Technical Factors as Antecedents to Cyber Deviance and the Implications for Cyber Citizenship. Proc. of the 2012 AIS SIGHCI Workshop on HCI Research in MIS 2012-12-16 p.7.
[5] Kay, J., Kummerfeld, B. Creating personalized systems that people can scrutinize and control: Drivers, principles and experience. ACM Transactions on Interactive Intelligent Systems 2012-12 v.2 n.4 p.24
[6] Buttfield-Addison, P., Lueg, C., Ellis, C., and Manning, J, "Everything goes into or out of the iPad": the iPad, information scraps and personal information management. Proc. of 2012 Australian CHI Conference 2012-11-26 p.61-67.
[7] Ploderer, B. Smith, W., Howard, S., Pearce, J., and Borland, R.. Things you don't want to know about yourself: ambivalence about tracking and sharing personal information for behaviour change. Proc. of 2012 Australian Computer-Human Interaction Conference 2012-11-26 p.489-492
[8] Rawassizadeh, R. Towards sharing life-log information with society / Behaviour and Information Technology 2012-11 v.31 n.11 p.1057-1067 .
[9] Winckler, M., Gaits, V., Vo, D.-B., Firmenich, S., and Rossi, G. An approach and tool support for assisting users to fill-in web forms with personal information New frontiers in documentation II / ACM 29th Intl. Conf. on Design of Communication 2011-10-03 p.195-202.
[10] Nitsche, M., and Nuernberger, A. InFrame-Browsing: Enhancing Standard Web Search Poster Papers. Proc. of Symposium on HCI and Information Retrieval 2012-10-04 p.16
[11] Ardito, C., Costabile, M. F., Desolda, G., Matera, M. Piccinno, A., and Picozzi, M. Composition of situational
160 Int'l Conf. e-Learning, e-Bus., EIS, and e-Gov. | EEE'13 |
interactive spaces by end users: a case for cultural heritage Living history Proc. 7th Nordic Conference on HCI 2012-10-14 p.79-88.
[12] Van Kleek, Max G., Styke, W., Schraefel, M. C., Karger, D. Finders/keepers: a longitudinal study of people managing information scraps in a micro-note tool Reading & writing / Proc. ACM CHI 2011 2011-05-07 v.1 p.2907-2916
[13] Lindroth, T., and Bergquist, M. Breadcrumbs of interaction: situating personal information management Proc. Fifth Nordic Conference on HCI 2008-10-10 p.266-273.
[14] F. Evequoz and D. Lalanne, “I thought you would show me how to do it - studying and supporting PIM strategy changes”. PIM Workshop, ASIS&T 2009, 35-42.
[15] S. Henderson. and A. Srinivasan, “An empirical analysis of personal digital document structures”, Proc. HCI International 2009, Berlin, Heidelberg: Springer-Verlag, 2009, pp. 394–403.
[16] S. Henderson, “Guidelines for the design of personal document management user interfaces”. PIM Workshop, ASIS&T 2009, 2009, pp. 65-72.
[17] K. Voit, K. Andrews and W. Slany, “Why personal information management (PIM) technologies are not widespread”. PIM Workshop, ASIS&T 2009. (2009) 60-64.
[18] A. I. Mørch and N. D. Mehandjiev, “Tailoring as collaboration: the mediating tole of multiple representations and application units”. Computer Supported Cooperative Work. 9(1) (2000): 75-100.
[19] L. Zhu, I. Vaghi, B. R. Barriceli, “A meta-reflective wiki for collaborative design”. Proc. of the 7th International Symposium on Wikis and Open Collaboration (WikiSym'11).ACM, (2011), 53-62.
[20] R. Demunieux, V. Ganneau, G. Calvary and E. Gegovska, “Les interfaces plastiques : premiers retours utilisateurs, évaluations en laboratoire” .Ergo-IA 2008. 117-124.
[21] C. Dörner, F. Yetim, V. Pipek and V. Wulf, “Supporting business process experts in tailoring business processes”. Interact. Comput. 23, 3 (2011), 226-238.
[22] Heung-Nam, K., Majdi, R., and El Saddik, A. Tailoring recommendations to groups of users: a graph walk-based approach. Proc. of the 2013 International Conference on Intelligent User Interfaces 2013-03-19 v.1 p.15-24
[23] Zimmerman, A., And Lorentz, A. LISTEN: a user-adaptive audio-augmented museum guide Special issue on
Personalizing Cultural Heritage Exploration. User Modeling and User-Adapted Interaction 2008-11 v.18 n.5 p.389-416
[24] Gamberini, L., Spagnolli, A., Carradi, N., Jacucci, G., Tusa, G., Mikkola, T., Zamboni, L., and Hoggan, E. Tailoring Feedback to Users' Actions in a Persuasive Game for Household Electricity Conservation. Proc. of the 2012 International Conference on Persuasive Technology 2012-06-06 p.100-111.
[25] Mirri, S., Salomoni, P., and Prandi, C. Augment browsing and standard profiling for enhancing web accessibility. Proc. of the 2011 International Cross-Disciplinary Conference on Web Accessibility (W4A) 2011-03-28 v.2 p.5.
[26] Kolås, L. & Staupe, A. (2007). A Personalized E-learning Interface. In: The Proceedings of the international IEEE Conference on Computer as a tool. Eurocon 2007 (pp. 2670-2675). Poland: IEEE Computer Society.
[27] D. L. Scapin, E. Law, Nigel Bevan, and the WG1 contributors (2008). Final Report MAUSE COST 294 WG 1 :Critical Review and Analysis of Individual UEMs. COST-294 Project MAUSE (December 2008)
[28] Gray, W. D. and Salzman, M. C., 1998, Damaged merchandise? A review of experiments that compare usability evaluation methods. Human-Computer Interaction, 13, pp. 203-261.
[29] Hartson, H. R., Andre, T. S. and Williges, R. C., 2001, Criteria for evaluating usability evaluation methods. International Journal of Human-Computer Interaction, 13, pp. 373-410.
[30] Bach, C. and Scapin, D. L.. Comparing Inspections and User Testing for the Evaluation of Virtual Environments, in "International Journal of Human-Computer Interaction", 2010, vol. 26, no 8, p. 786-824
[31] Cockton, G., Woolrych, A., Hall, L., and Hidemarch, M., 2003, Changing Analysts' Tunes: The Surprising Impact of a New Instrument for Usability Inspection Method Assessment. In Proc. of People and Computers XVII: Designing for Society, Springer Verlag, pp. 145-162.
[32] Hornbæk, K. and Frøkjær, E., 2005, Comparing usability problems and redesign proposals as input to practical systems development. In Proc. of ACM Conference on Human Factors in Computing Systems, (New York, NY: ACM Press), pp. 391-400.
Int'l Conf. e-Learning, e-Bus., EIS, and e-Gov. | EEE'13 | 161
A Strategic Framework for E-Democracy Development
Ayo1 C.K., *Oni
1 A.A. and Mbarika
2 V.W.
1Department of Computer and Information Sciences, Covenant University, Ota, Nigeria,
2Department of Marketing and E-Business, Southern University, Baton Rouge, USA
Abstract - There are several e-participation
projects initiated by different actors around the world
but sustainability and citizens’ acceptance of online
public participation remains a difficult task.
Examples of good practice are extremely rare in e-
democracy implementation. Most government
particularly, in the developing countries, do not have
detailed and well established strategy for e-
democracy realization, sustainability and citizens
acceptance. This work argues that e-democracy
implementation, especially in the resource poor
countries, should be driven by a strategic approach
guided by quality designs that will enhance
sustainability and make tools for online engagement
accessible to all segments of the society. This work
adopts a qualitative approach using Grounded
Theory Method (GTM) to develop a strategic
framework for e-democracy development, which is
largely missing from most national e-democracy
strategies. The work introduces a strategic
framework which serves as a generic abstraction of
existing e-democracy strategies, implementation and
best practices.
Keywords: e-democracy, strategy, best
practice, strategic, framework,
1. Introduction
Most government have achieved substantial
progress in using ICT to connect with citizens. Most
government have developed e-government strategy to
increase transparency, and efficiency in public
administration. However, the potential of ICT in
governance is yet to be fully drawn. What is most
available around the world is provision of e-services.
Only few countries have advanced their policies and
strategy for ICT enabled governance to participatory
e-democracy stage. Several authors have worked on
having a lasting e-democracy implementation, but no
effort have produced a generic and structured
framework that integrates the most fundamental
elements of a successful implementation.
A strategy is the basic directional decisions
for purposes and missions. It can also be referred to
as what top management does that is of great
importance to the organization. Strategy helps
management to identify what to do and outcomes to
expect [15]. We define e-democracy strategy as a
plan for e-democracy systems, their supporting
infrastructure, people and process which maximise
government’s ability to achieve an informed and
engaged citizenry.
This work aims at developing a strategic
framework which will serve as generic abstraction of
e-democracy strategies and implementation. This
study adopts a systematic literature review based on
Grounded Theory Method (GTM) to develop the
strategic framework. Choice of literature was based
on the availability of published documents on e-
democracy strategies, implementation and practices
of countries within the top 20 position in e-
participation ranking according UN e-government
report [20]. Materials were sourced from academic
database, international development organisations
(EU, UN, UNPAN, OECD), research institutions
(Demo-net, Hansard Society, Democracies Online
Newswire), and countries specific Web sites.
This diversity provides a comprehensive view of
strategies, implementation and good practices in e-
democracy implementation from different domains.
2 Related Works
One of the key issues in e-democracy
development is the acquisition of system that
considerably meet government’s needs and the needs
of the citizens to participate in the democratic
process. Different scholars have worked on having a
lasting e-democracy implementation, such notable
efforts are found in [1] [4] [12] [9] [6].
Critical keys and potential barriers to the
success of e-democracy development must be
162 Int'l Conf. e-Learning, e-Bus., EIS, and e-Gov. | EEE'13 |
considered to achieve a successful development [1].
They therefore, identified six key issues to be
considered in e-democracy development which
include investment, leadership, training,
technological flexibility, access and digital divide,
and privacy and security.
Similarly, Clift in his approach to e-democracy
development, proposed a “top ten e-democracy: to do
list” that will help government jumpstart the use of
ICT in improving their democratic process [4]. These
include among others announcing all public meetings
online in a systematic and reliable way, putting
“Democracy Button” on site’s top page, holding
government sponsored online consultations,
developing e-democracy legislation, Internet
education for elected officials, and etc.
Furthermore, a framework for sustainable e-
Democracy development based on governance
development standard called COBIT 4.1 was
presented by [6]. The framework presented a 4 + 1
construct of e-democracy development process
comprising: Stakeholders and policy; Information
and Communication Technology; Development
methodology; Process and project management;
Environment and e-Democracy components.
A framework for e-Democracy development
based on a promising relationship between e-
Democracy and spatial dimension was proposed by
[9]. The system presents an extensive use of the
spatial dimension in a wiki collaboration
environment to capture and integrate e-democracy
information.
Strategic e-democracy framework which
includes directional plan and basic component of e-
democracy programme is still missing both in
literature and in government strategies.
3.0 Research Methodology
This research adopts a systematic literature
review involves a rigorous and well defined
procedure applies to an existing literature [17].
Review methodologies in Information Systems
research include: the eight steps for systematic
literature review [17], systematic approach to
literature review [11], writing a literature review [21],
grounded theory method for literature review [23]
and structured case [3]. We considered grounded
theory approach as an appropriate method for
framework development in this research because it
support development of concepts and constructs that
are grounded in data.
Grounded theory is an inductive method of
analysing data with the aim of generating concepts,
themes or theory that is grounded in qualitative data
[19]. Grounded theory method has a set of principles
and techniques which makes it suitable for quality
qualitative research. These include principle of
emergence, constant comparative analysis and
theoretical sampling. Analysis of data to develop
concepts, themes, and theory using grounded theory
approach employs three analytical techniques. The
three techniques are open coding, axial coding and
selective coding [7]. Open coding involves
identifying concepts, categories and their properties
in a corpus [7]. Axial coding involves establishing
relationships of identified categories and sub-
categories of concepts or themes focusing on
answering why, where, when, and how about the
categories [14]. Selective coding involves selection
of core variables of the emerging theory or concept.
Table 1.0 summarized how GTM was used to review
literature beginning with domain identification.
Previous studies were used as data so that
concepts for the strategic framework could emerge.
The sample composed of secondary data drawn from
materials sourced from Information Systems centric
publications and e-democracy strategy and
implementation report documents. Electronic
databases were searched for peer-reviewed journal
articles, book chapters and conference proceedings
on e-democracy. The Web sites of government
agencies and those of international organisation and
academic institution dealing with piloting and
reporting e-practices were searched for relevant data.
This includes OECD and Demo.net, and public.net.
4.0 The Proposed E-democracy
Framework
The analysis of the major contents/focal points
of e-democracy strategies, research and practice in
literature was the starting point in developing the
framework. These major contents which we referred
to as constructs spelled out directional plan for the
component strategic framework. We examined each
of these components from our sample literatures in
detail with an effort to structure the emerging
strategic framework of e-democracy. It is important
to understand the basic elements of each of these
components as well as the relationships among them.
Going through this process enables us to determine
why and when relationship between the components
[7] This also enables further classification of the
components of the framework and in turn makes it
very simple and clear. The next section presents some
of the components and Figure 1.0 presents the
strategic framework.
Int'l Conf. e-Learning, e-Bus., EIS, and e-Gov. | EEE'13 | 163
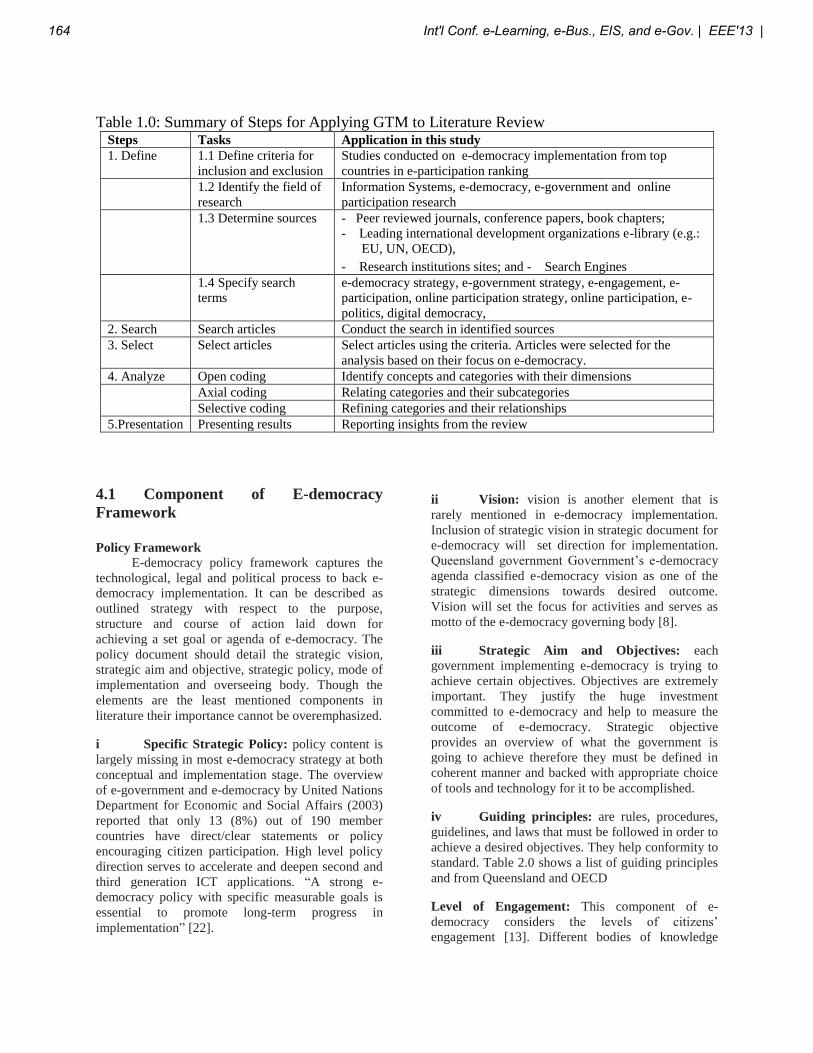
Table 1.0: Summary of Steps for Applying GTM to Literature Review Steps Tasks Application in this study
1. Define 1.1 Define criteria for
inclusion and exclusion
Studies conducted on e-democracy implementation from top
countries in e-participation ranking
1.2 Identify the field of
research
Information Systems, e-democracy, e-government and online
participation research
1.3 Determine sources - Peer reviewed journals, conference papers, book chapters;
- Leading international development organizations e-library (e.g.:
EU, UN, OECD),
- Research institutions sites; and - Search Engines
1.4 Specify search
terms
e-democracy strategy, e-government strategy, e-engagement, e-
participation, online participation strategy, online participation, e-
politics, digital democracy,
2. Search Search articles Conduct the search in identified sources
3. Select Select articles Select articles using the criteria. Articles were selected for the
analysis based on their focus on e-democracy.
4. Analyze Open coding Identify concepts and categories with their dimensions
Axial coding Relating categories and their subcategories
Selective coding Refining categories and their relationships
5.Presentation Presenting results Reporting insights from the review
4.1 Component of E-democracy
Framework
Policy Framework
E-democracy policy framework captures the
technological, legal and political process to back e-
democracy implementation. It can be described as
outlined strategy with respect to the purpose,
structure and course of action laid down for
achieving a set goal or agenda of e-democracy. The
policy document should detail the strategic vision,
strategic aim and objective, strategic policy, mode of
implementation and overseeing body. Though the
elements are the least mentioned components in
literature their importance cannot be overemphasized.
i Specific Strategic Policy: policy content is
largely missing in most e-democracy strategy at both
conceptual and implementation stage. The overview
of e-government and e-democracy by United Nations
Department for Economic and Social Affairs (2003)
reported that only 13 (8%) out of 190 member
countries have direct/clear statements or policy
encouraging citizen participation. High level policy
direction serves to accelerate and deepen second and
third generation ICT applications. “A strong e-
democracy policy with specific measurable goals is
essential to promote long-term progress in
implementation” [22].
ii Vision: vision is another element that is
rarely mentioned in e-democracy implementation.
Inclusion of strategic vision in strategic document for
e-democracy will set direction for implementation.
Queensland government Government’s e-democracy
agenda classified e-democracy vision as one of the
strategic dimensions towards desired outcome.
Vision will set the focus for activities and serves as
motto of the e-democracy governing body [8].
iii Strategic Aim and Objectives: each
government implementing e-democracy is trying to
achieve certain objectives. Objectives are extremely
important. They justify the huge investment
committed to e-democracy and help to measure the
outcome of e-democracy. Strategic objective
provides an overview of what the government is
going to achieve therefore they must be defined in
coherent manner and backed with appropriate choice
of tools and technology for it to be accomplished.
iv Guiding principles: are rules, procedures,
guidelines, and laws that must be followed in order to
achieve a desired objectives. They help conformity to
standard. Table 2.0 shows a list of guiding principles
and from Queensland and OECD
Level of Engagement: This component of e-
democracy considers the levels of citizens’
engagement [13]. Different bodies of knowledge
164 Int'l Conf. e-Learning, e-Bus., EIS, and e-Gov. | EEE'13 |
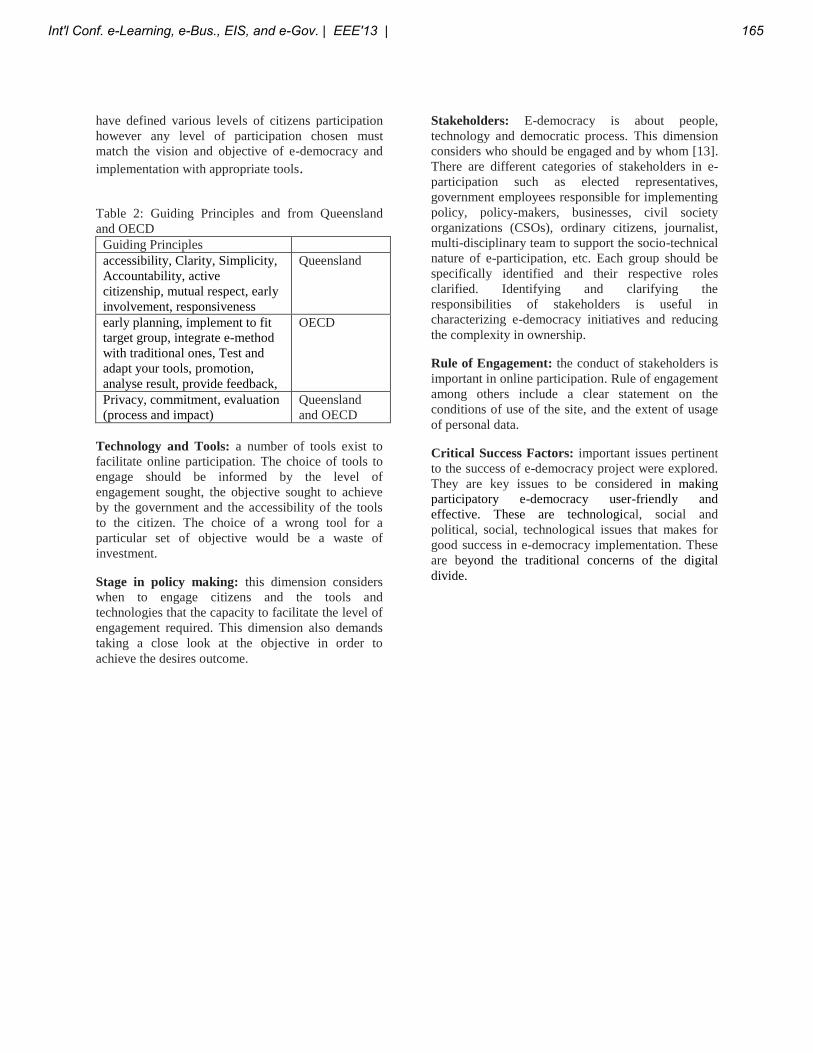
have defined various levels of citizens participation
however any level of participation chosen must
match the vision and objective of e-democracy and
implementation with appropriate tools.
Table 2: Guiding Principles and from Queensland
and OECD
Guiding Principles
accessibility, Clarity, Simplicity,
Accountability, active
citizenship, mutual respect, early
involvement, responsiveness
Queensland
early planning, implement to fit
target group, integrate e-method
with traditional ones, Test and
adapt your tools, promotion,
analyse result, provide feedback,
OECD
Privacy, commitment, evaluation
(process and impact)
Queensland
and OECD
Technology and Tools: a number of tools exist to
facilitate online participation. The choice of tools to
engage should be informed by the level of
engagement sought, the objective sought to achieve
by the government and the accessibility of the tools
to the citizen. The choice of a wrong tool for a
particular set of objective would be a waste of
investment.
Stage in policy making: this dimension considers
when to engage citizens and the tools and
technologies that the capacity to facilitate the level of
engagement required. This dimension also demands
taking a close look at the objective in order to
achieve the desires outcome.
Stakeholders: E-democracy is about people,
technology and democratic process. This dimension
considers who should be engaged and by whom [13].
There are different categories of stakeholders in e-
participation such as elected representatives,
government employees responsible for implementing
policy, policy-makers, businesses, civil society
organizations (CSOs), ordinary citizens, journalist,
multi-disciplinary team to support the socio-technical
nature of e-participation, etc. Each group should be
specifically identified and their respective roles
clarified. Identifying and clarifying the
responsibilities of stakeholders is useful in
characterizing e-democracy initiatives and reducing
the complexity in ownership.
Rule of Engagement: the conduct of stakeholders is
important in online participation. Rule of engagement
among others include a clear statement on the
conditions of use of the site, and the extent of usage
of personal data.
Critical Success Factors: important issues pertinent
to the success of e-democracy project were explored.
They are key issues to be considered in making
participatory e-democracy user-friendly and
effective. These are technological, social and
political, social, technological issues that makes for
good success in e-democracy implementation. These
are beyond the traditional concerns of the digital
divide.
Int'l Conf. e-Learning, e-Bus., EIS, and e-Gov. | EEE'13 | 165
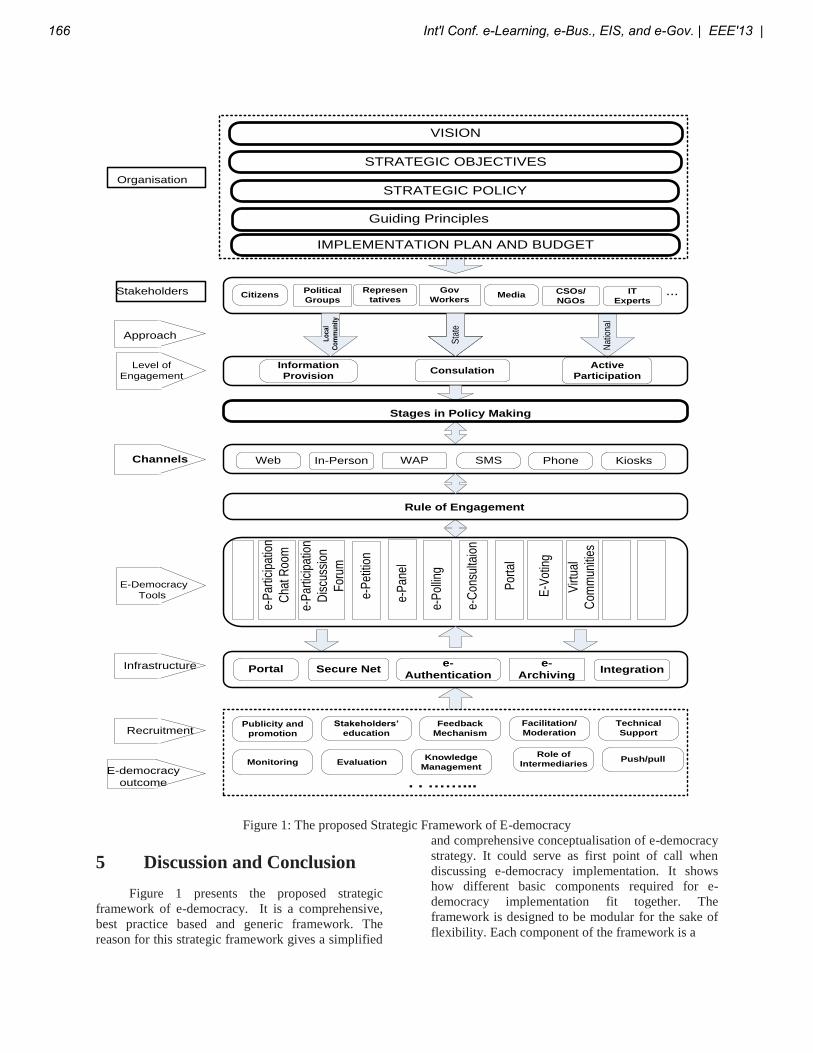
VISION
Stakeholders
Guiding Principles
Nat
iona
l
Sta
te
Approach
e-P
artic
ipat
ion
Dis
cuss
ion
For
um
Por
tal
E-V
otin
g
Virt
ual
Com
mun
ities
e-P
artic
ipat
ion
Cha
t Roo
m
e-P
etiti
on
e-P
ollin
g
e-C
onsu
ltaio
n
STRATEGIC POLICY
IMPLEMENTATION PLAN AND BUDGET
KiosksWeb In-Person WAP SMS Phone
Recruitment
Channels
STRATEGIC OBJECTIVES
...Citizens CSOs/
NGOs
Gov
Workers
Represen
tativesPolitical
GroupsIT
ExpertsMedia
Level of
Engagement
Information
ProvisionConsulation
Active
Participation
e-P
anel
E-Democracy
Tools
Infrastructure e-
ArchivingPortal Secure Net
e-
AuthenticationIntegration
Publicity and
promotion
Stakeholders’
education
E-democracy
outcome
Organisation
Sta
te
Lo
cal
Co
mm
un
ity
Stages in Policy Making
Feedback
Mechanism
Facilitation/
Moderation
Rule of Engagement
Monitoring EvaluationKnowledge
Management
Technical
Support
Role of
IntermediariesPush/pull
. . ……...
Figure 1: The proposed Strategic Framework of E-democracy
5 Discussion and Conclusion
Figure 1 presents the proposed strategic
framework of e-democracy. It is a comprehensive,
best practice based and generic framework. The
reason for this strategic framework gives a simplified
and comprehensive conceptualisation of e-democracy
strategy. It could serve as first point of call when
discussing e-democracy implementation. It shows
how different basic components required for e-
democracy implementation fit together. The
framework is designed to be modular for the sake of
flexibility. Each component of the framework is a
166 Int'l Conf. e-Learning, e-Bus., EIS, and e-Gov. | EEE'13 |
module in itself and its interaction with other
modules can be depicted from the diagram. It is an
extensible generic framework and requires local
customization. It is thus easy to add a new module or
update a module. The strategic framework is meant to
add value to detailed textual strategy where available
or to serve as a quick alternative in the absence of
textual strategy.
In conclusion, this framework is a result of
comprehensive study of e-democracy strategy and
implementation report produced by (34) cutting-edge
research across different countries among the top 20
countries in e-participation implementation.
Framework is a top-level documentation of strategic
directions, goals, components, principles and
implementation guidelines. Framework serves as a
generic abstraction of an e-democracy
implementation. This graphical representation gives a
lot of information at a glance, makes planning and
foreseeing of discrepancies a lot easier at the early
stage of e-democracy implementation. It would save
governments a lot of time, research, money and
disappointments. It helps to identify contradiction,
misalignment and out of orchestration with the
general policies early.
5 References
[1] Black, A. and Noble, P. “E-Democracy
around the World: A Survey for the Bertlesmann
Foundation”; Phil Noble and Associate, Charleston,
SC, pp. 1-88, 2001.
[2] Blumler, J.G. and Coleman, S. “Realizing
Democracy Online: A Civic Commons in
Cyberspace”; Institute for Public policy Research,
London, 2001.
[3] Carroll, J. M. and Swatman, P. A.
“Structured-case: A methodological framework for
building theory in information systems research”;
Proc of ECIS, Vienna, Austria, 2000.
[4] Clift, S. L. “E-government and Democracy:
Representation and Citizen Engagement in the
Information Age”; 2004. Retrieved Nov., 2010,
[www.publicus.net]
[5] Coleman, S. and Gotze, J. “Bowling
Together: Online Public Engagement in Policy
Deliberation”. Hansard Society. 2001. Retrieved 8th
Oct., 2010 [www.hansardsociety.org.uk]
[6] Funilkul, S. and Chutimaskul W. “The
Framework for Sustainable eDemocracy
Development,”; Transforming People, Process and
Policy, Vol 3 No 1, pp 16-31, 2009.
[7] Glaser, B. “Basics of Grounded Theory
Analysis. Mill Valley”; Sociology Press, 1992.
[8] Hogan, M., Cook, N., and Henderson, M.
“The Queensland Government’s e-democracy
Agenda”; Australian Electronic Government
Conference, Centre for Public Policy, University of
Melbourne, 2004.
[9] Jayasena, G.N. and Karunaratna, D.D.
“Towards an Enabling Framework for eDemocracy
through the Integration of Citizen Participation along
the Spatial Dimension Using Free and Open Source
Technologies”; Proceedings of the 24th South East
Asia Regional Computer Conference, November 18-
19, 2007, Bangkok, Thailand.
[10] Kotsiopoulos, I. “Bringing Together and
Accelerating e-Government Research in the EU”;
ICT for Government and Public Service Unit,
European Commission, 2009.
[11] Levy, Y. and Ellis, T. A Systems Approach
to conduct an effective literature review in support of
information systems research. Informing Science
Journal, 9, pp 181-212, 2006.
[12] Local E-Democracy National Project.
“Deeper and Wider Community Engagement: e-
Democracy and its Benefits for Local Authorities,
Councilors, and Communities”; NorthLincsNet,
Improvement and Development Agency, London, pp.
1-38, 2006.
[13] Macintosh, A. “Characterizing E-
Participation in Policy-Making”. Proceedings of the
37th Hawaii International Conference on System
Sciences, Computer Society Press, 2004.
[14] Matavire, R. and Brown, I. “Profiling
grounded theory approaches in Information Systems
research. European Journal of Information Systems”;
1-11, 2011.
[15] Mintzberg, H. “The Rise and Fall of
Strategic Planning”; New York: Free Press, 1994.
[16] OECD, “Promise and Problems of E-
Democracy: Challenges of Online Citizen
Engagement”’ 2003. [Online], Retrieved Dec., 2010
[www.oecd.org/dataoecd/9/11/35176328 .pdf]
Int'l Conf. e-Learning, e-Bus., EIS, and e-Gov. | EEE'13 | 167
[17] Okoli, C. and Schabram, K. “A guide to
conducting a systematic literature review of
information systems research”; Sprouts: Working
Papers on Information Systems, 10(26), 2010.
http://sprouts.aisnet.org/10-26.
[18] Rabaiah, A. & Vandijct, E. “A Strategic
Framework of e-Government: Generic and best
Practice”; In Les Worrall (ed) Leading Issues in e-
Government Research, Academic Publishing
International Ltd. Pp 1-32, 2011.
[19] Strauss, A. and Corbin, J. “The Basics of
Qualitative Research: Techniques and Procedures for
Developing Grounded Theory”; London: Sage 1998.
[20] UN E-Government Survey. “Leveraging E-
government at a Time of Financial and Economic
Crisis”; UN Economic and Social Affairs, 2010.
[21] Webster, J. and Watson, R. “Analyzing the
past to prepare for the future: Writing a literature
review”; MIS Quarterly, 26(2), xxi-xxii, 2002.
[22] Henderson, M., Hogarth, F. and Jeans, D.
“E-Democracy Policy in Queensland”;
Encyclopaedia of Digital Government. IGI Global,
2007. 455-461. Web. 3 Jun. 2013. doi:10.4018/978-
1-59140-789-8.ch069
[23] Wolfswinkel, J., Furtmueller, E. and
Wilderom, C. “Using grounded theory as a method
for rigorously reviewing literature”; European
Journal of Information Systems, 1-11, 2011.
168 Int'l Conf. e-Learning, e-Bus., EIS, and e-Gov. | EEE'13 |
Information Quality Assessment for E-Government Systems Mona A. Alkhattabi Assistant Professor
College of Computer Sciences and Information
Imam Mohammad Bin Saud University
P.O.Box 92309 Riyadh11653 Saudi Arabia
Abstract. E-government systems offer a promising solution
as an information exchanging channel. Enhanced
technology could signify faster and easier access to
information but does not of necessity guarantee the quality
of this information. Hence it is crucial to develop valid and
consistent methods of quality measurement and accomplish
careful information quality assessments. Information
quality frameworks are developed to appraise the quality of
information systems, in general from the designers’
perspective. The latest proliferation of e-services and e-
government mainly, rises the require for a new quality
framework in the context of e-government systems. The
major contribution of this research is to propose a new
information quality framework, we will report the results
based on original survey data and factor analysis.
Furthermore, we will validate the anticipated framework
using an empirical approach on the basis of data from an
original questionnaire and structural equation modelling
(SEM) analysis, confirmatory factor analysis (CFA) in
particular. Nevertheless, it is complicated to evaluate
information quality in an e-government context since the
perception of information quality is difficult and it is
expected that the measurements will be multidimensional in
nature. Reliable measures need to be achieving in a
systematic approach, whilst considering the reason of the
measurement. Hence, we will adopt a Goal Question
Metrics (GQM) approach to expand a set of quality metrics
for the identified quality attributes within the anticipated
framework. We then will identify an assessment model and
measurement proposal, based on a multi element analysis
technique.
Keywords: E-government, Information quality,
Information system, Information extraction, Quality
framework, Quality metrics.
1 Introduction
This research focuses on the assessment of IQ
(Information quality) in the context of e-government
systems, particularly, on identifying the key dimensions
for IQ from the users’ point of view, in order to build a
framework for IQ in e-government systems. The research
will classify a set of quality metrics to measure the quality
of the information. This will be based on the anticipated
framework and will eventually facilitate the evaluation,
allow comparison, and investigation of IQ. Moreover, it
will examine the opportunity of incorporating a web
mining approach, information extraction method, in order
to mechanize the appraisal process. The purpose of this
paper is to present an indication of the research problem,
the rationale, and the organisational perspective for the
study.
E-government services and technologies present users with
distributive, collaborative, and interactive features which
facilitate to overcome the limitations of space and time,
this authorize information to be distributed. In fact, e-
government has improvement from basically a delivery
tool to a fundamental mechanism for a wide range of
government services. However, the lack of direct contact
among users, which is considered to be an important
barrier in shaping the efficiency of the entire process,
raises many issues on the overall quality of the presented
services. In this field, literature examines the quality of the
published resources in two ways: firstly, focusing on the
content of these materials and secondly investigative the
technique in which such content will be delivered to the
users.
The majorities of methodologies which are used to
appraise the quality of the distributed materials are
qualitative and are in general user oriented since they
depend on linguistic proposals from the students.
Furthermore, the measurement procedure is based on the
user’s viewpoint, while the particular criteria are required
to be simply comprehensible by the user. Therefore, the
measurement methods are user centred because they
generate linguistic recommendations of the material, these
are based on the user’s linguistic opinion judgments. The
major problem with these traditional measurement
methods is that they rely on human judgment, this can be
doubtful and inaccurate, and in addition involves huge
amounts of effort and time. It as a result appears logical to
acquire advantage of web mining techniques to
computerize the retrieval methods of the information
required in the quality measurement.
Int'l Conf. e-Learning, e-Bus., EIS, and e-Gov. | EEE'13 | 169
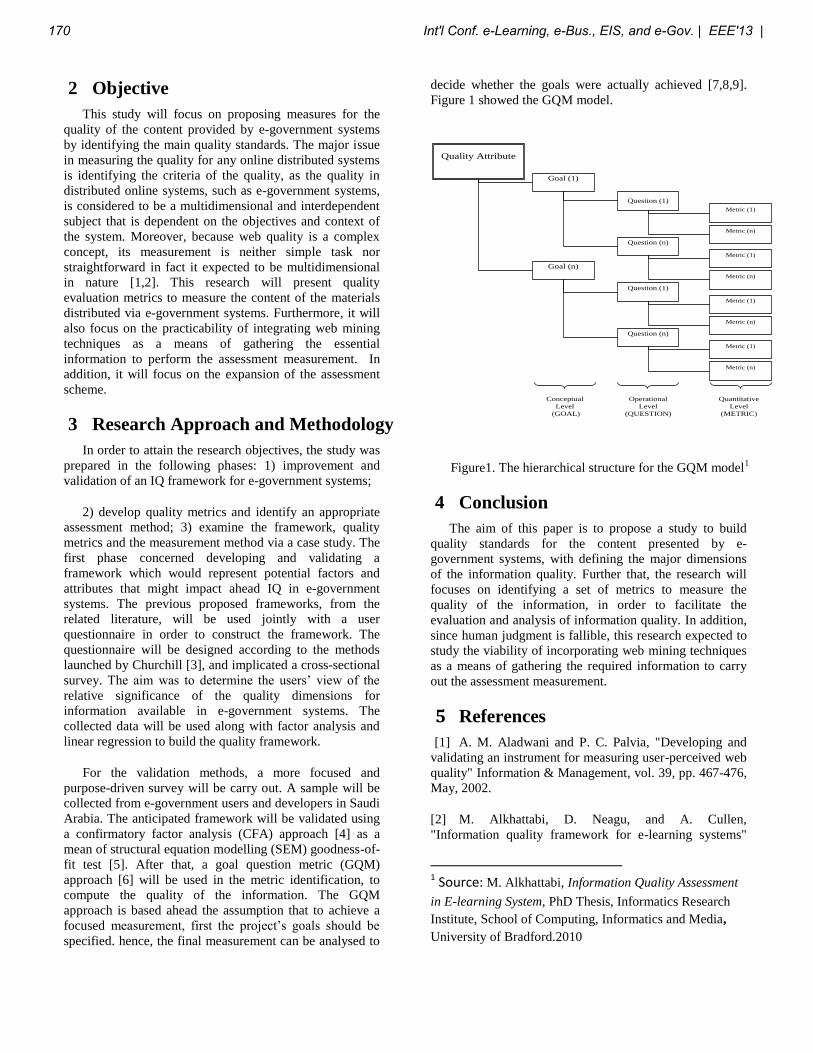
2 Objective
This study will focus on proposing measures for the
quality of the content provided by e-government systems
by identifying the main quality standards. The major issue
in measuring the quality for any online distributed systems
is identifying the criteria of the quality, as the quality in
distributed online systems, such as e-government systems,
is considered to be a multidimensional and interdependent
subject that is dependent on the objectives and context of
the system. Moreover, because web quality is a complex
concept, its measurement is neither simple task nor
straightforward in fact it expected to be multidimensional
in nature [1,2]. This research will present quality
evaluation metrics to measure the content of the materials
distributed via e-government systems. Furthermore, it will
also focus on the practicability of integrating web mining
techniques as a means of gathering the essential
information to perform the assessment measurement. In
addition, it will focus on the expansion of the assessment
scheme.
3 Research Approach and Methodology
In order to attain the research objectives, the study was
prepared in the following phases: 1) improvement and
validation of an IQ framework for e-government systems;
2) develop quality metrics and identify an appropriate
assessment method; 3) examine the framework, quality
metrics and the measurement method via a case study. The
first phase concerned developing and validating a
framework which would represent potential factors and
attributes that might impact ahead IQ in e-government
systems. The previous proposed frameworks, from the
related literature, will be used jointly with a user
questionnaire in order to construct the framework. The
questionnaire will be designed according to the methods
launched by Churchill [3], and implicated a cross-sectional
survey. The aim was to determine the users’ view of the
relative significance of the quality dimensions for
information available in e-government systems. The
collected data will be used along with factor analysis and
linear regression to build the quality framework.
For the validation methods, a more focused and
purpose-driven survey will be carry out. A sample will be
collected from e-government users and developers in Saudi
Arabia. The anticipated framework will be validated using
a confirmatory factor analysis (CFA) approach [4] as a
mean of structural equation modelling (SEM) goodness-of-
fit test [5]. After that, a goal question metric (GQM)
approach [6] will be used in the metric identification, to
compute the quality of the information. The GQM
approach is based ahead the assumption that to achieve a
focused measurement, first the project’s goals should be
specified. hence, the final measurement can be analysed to
decide whether the goals were actually achieved [7,8,9].
Figure 1 showed the GQM model.
Quality Attribute
Goal (1)
Goal (n)
Question (1)
Question (n)
Question (1)
Question (n)
Metric (1)
Metric (n)
Metric (1)
Metric (n)
Metric (1)
Metric (n)
Metric (1)
Metric (n)
Conceptual
Level
(GOAL)
Operational
Level
(QUESTION)
Quantitative
Level
(METRIC)
Figure1. The hierarchical structure for the GQM model
1
4 Conclusion
The aim of this paper is to propose a study to build
quality standards for the content presented by e-
government systems, with defining the major dimensions
of the information quality. Further that, the research will
focuses on identifying a set of metrics to measure the
quality of the information, in order to facilitate the
evaluation and analysis of information quality. In addition,
since human judgment is fallible, this research expected to
study the viability of incorporating web mining techniques
as a means of gathering the required information to carry
out the assessment measurement.
5 References
[1] A. M. Aladwani and P. C. Palvia, "Developing and
validating an instrument for measuring user-perceived web
quality" Information & Management, vol. 39, pp. 467-476,
May, 2002.
[2] M. Alkhattabi, D. Neagu, and A. Cullen,
"Information quality framework for e-learning systems"
1 Source: M. Alkhattabi, Information Quality Assessment
in E-learning System, PhD Thesis, Informatics Research
Institute, School of Computing, Informatics and Media,
University of Bradford.2010
170 Int'l Conf. e-Learning, e-Bus., EIS, and e-Gov. | EEE'13 |

Knowledge Management & E-Learning: An International
Journal (KM&EL), 2010, Vol 2, No 4
[3] J. Churchill, Marketing research: Methodological
foundation (7th .ed), Hinsdale, IL: The Dryden Press,
1999.
[4] D. Harrington, Confirmatory factor analysis, (1st .ed),
New York: Oxford University Press, 2009.
[5] B. Byrne, Structural equation modeling with amos:
Basic concepts, applications and programming (1st .ed),
Mahawa, New Jersey: Psychology Press, 2001.
[6] H. Koziolek, "Goal, question, metric" chapter in:
Dependability metrics: Advanced lectures, I. Eusgeld, F.C.
Freiling, and R. Reussner, Berlin: Springer-Verlag Berlin,
2008, pp. 39-42.
[7] V. Basili, G. Caldiera, and D. H. Rombach, 1994,
The goal question metric approach [Online]. Available:
https://docweb.lrz-muenchen.de/cgi-bin/doc/nph-
webdoc.cgi/000110A/http/scholar.google.de/scholar=3fhl=
3dde&lr=3d&cluster=3d4068380033007143449
[8] K. M. Khan, "Assessing quality of web based
systems" in proceedings of International Conference on
Computer Systems and Applications ( IEEE/ACS), pp.
763-769, Doha, Qatar, March 31-April 04, 2008
[9] F. Alfonso, L. Luigi, M. Sandro, C. Stefano, O.
Giandomenico, and O. Elena, "Applying gqm in an
industrial software factory" ACM Transactions on
Software Engineering and Methodology (TOSEM) vol. 7,
pp. 411-448, 1998.
[10] K. Buvaneswari, W. A. Venkataraman, and J. Ward,
"An introduction to software quality" US Army Corps of
Engineers, Waterways Experiment Station (WES),
Washington, DC, Technical Report, no. ITL-99-4, June,
1999.
[11] K. Kahn and M. Ramakrishnan, "Assessment model
for software maintenance tools: A conceptual framework"
in proceedings of Pasific Asia conference on Information
systems (PACIS ), pp. 527-536, Brisbane, Australia, 1997
[12] M. Alkhattabi, D. Neagu, and A. Cullen, Assessing
information quality of e-learning systems, Computers in
Human Behavior, Elsevier,2011, 27 (2): 862-873.
Int'l Conf. e-Learning, e-Bus., EIS, and e-Gov. | EEE'13 | 171
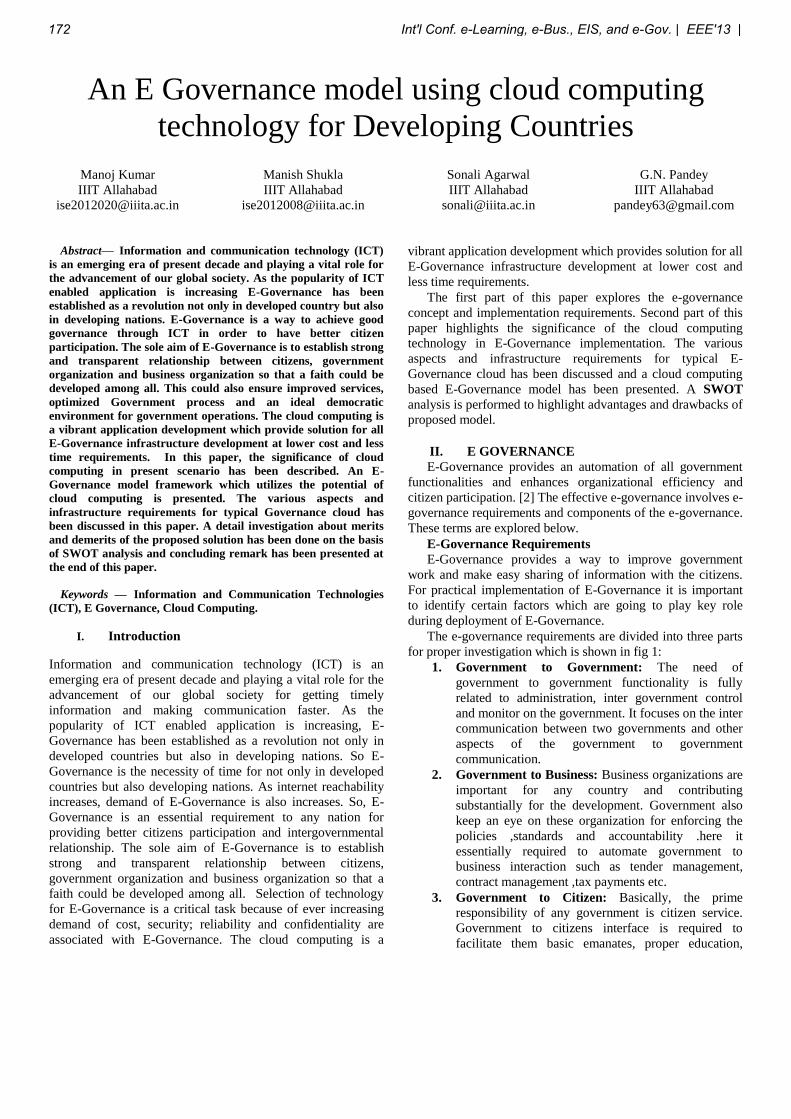
An E Governance model using cloud computing
technology for Developing Countries
Manoj Kumar
IIIT Allahabad
Manish Shukla
IIIT Allahabad
Sonali Agarwal
IIIT Allahabad
G.N. Pandey
IIIT Allahabad
Abstract— Information and communication technology (ICT)
is an emerging era of present decade and playing a vital role for
the advancement of our global society. As the popularity of ICT
enabled application is increasing E-Governance has been
established as a revolution not only in developed country but also
in developing nations. E-Governance is a way to achieve good
governance through ICT in order to have better citizen
participation. The sole aim of E-Governance is to establish strong
and transparent relationship between citizens, government
organization and business organization so that a faith could be
developed among all. This could also ensure improved services,
optimized Government process and an ideal democratic
environment for government operations. The cloud computing is
a vibrant application development which provide solution for all
E-Governance infrastructure development at lower cost and less
time requirements. In this paper, the significance of cloud
computing in present scenario has been described. An E-
Governance model framework which utilizes the potential of
cloud computing is presented. The various aspects and
infrastructure requirements for typical Governance cloud has
been discussed in this paper. A detail investigation about merits
and demerits of the proposed solution has been done on the basis
of SWOT analysis and concluding remark has been presented at
the end of this paper.
Keywords — Information and Communication Technologies
(ICT), E Governance, Cloud Computing.
I. Introduction
Information and communication technology (ICT) is an
emerging era of present decade and playing a vital role for the
advancement of our global society for getting timely
information and making communication faster. As the
popularity of ICT enabled application is increasing, E-
Governance has been established as a revolution not only in
developed countries but also in developing nations. So E-
Governance is the necessity of time for not only in developed
countries but also developing nations. As internet reachability
increases, demand of E-Governance is also increases. So, E-
Governance is an essential requirement to any nation for
providing better citizens participation and intergovernmental
relationship. The sole aim of E-Governance is to establish
strong and transparent relationship between citizens,
government organization and business organization so that a
faith could be developed among all. Selection of technology
for E-Governance is a critical task because of ever increasing
demand of cost, security; reliability and confidentiality are
associated with E-Governance. The cloud computing is a
vibrant application development which provides solution for all
E-Governance infrastructure development at lower cost and
less time requirements.
The first part of this paper explores the e-governance
concept and implementation requirements. Second part of this
paper highlights the significance of the cloud computing
technology in E-Governance implementation. The various
aspects and infrastructure requirements for typical E-
Governance cloud has been discussed and a cloud computing
based E-Governance model has been presented. A SWOT
analysis is performed to highlight advantages and drawbacks of
proposed model.
II. E GOVERNANCE
E-Governance provides an automation of all government
functionalities and enhances organizational efficiency and
citizen participation. [2] The effective e-governance involves e-
governance requirements and components of the e-governance.
These terms are explored below.
E-Governance Requirements
E-Governance provides a way to improve government
work and make easy sharing of information with the citizens.
For practical implementation of E-Governance it is important
to identify certain factors which are going to play key role
during deployment of E-Governance.
The e-governance requirements are divided into three parts
for proper investigation which is shown in fig 1:
1. Government to Government: The need of
government to government functionality is fully
related to administration, inter government control
and monitor on the government. It focuses on the inter
communication between two governments and other
aspects of the government to government
communication.
2. Government to Business: Business organizations are
important for any country and contributing
substantially for the development. Government also
keep an eye on these organization for enforcing the
policies ,standards and accountability .here it
essentially required to automate government to
business interaction such as tender management,
contract management ,tax payments etc.
3. Government to Citizen: Basically, the prime
responsibility of any government is citizen service.
Government to citizens interface is required to
facilitate them basic emanates, proper education,
172 Int'l Conf. e-Learning, e-Bus., EIS, and e-Gov. | EEE'13 |
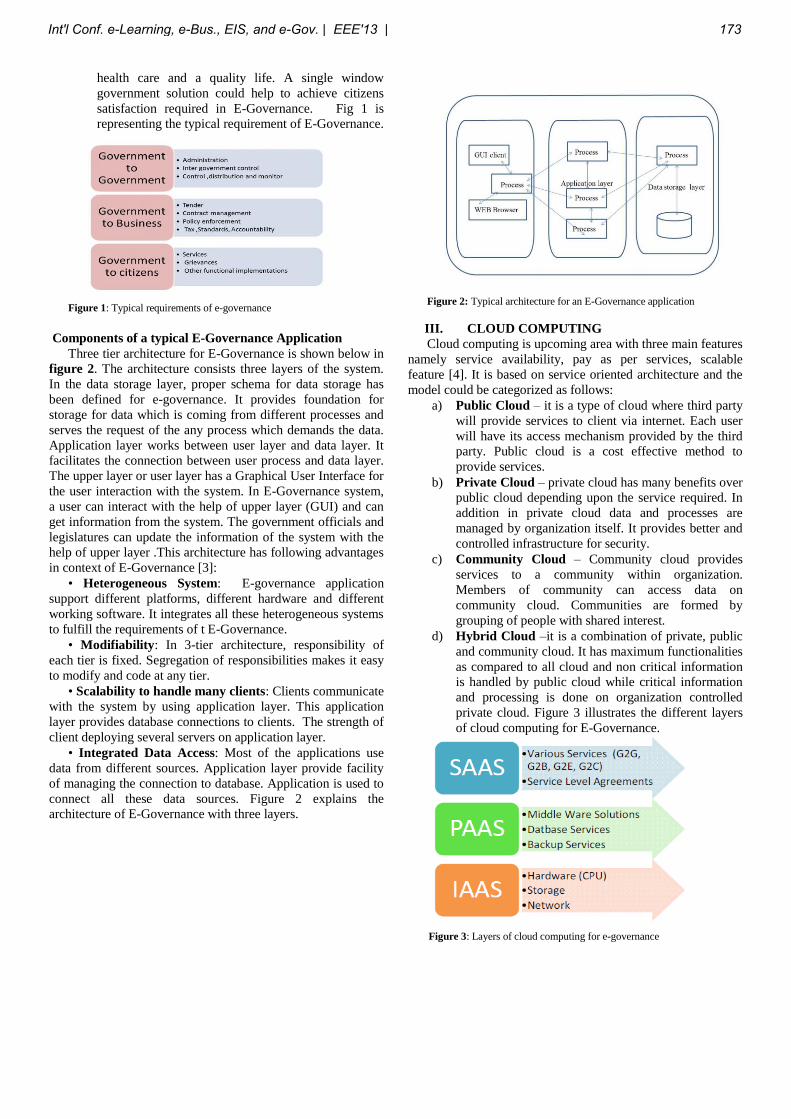
health care and a quality life. A single window
government solution could help to achieve citizens
satisfaction required in E-Governance. Fig 1 is
representing the typical requirement of E-Governance.
Figure 1: Typical requirements of e-governance
Components of a typical E-Governance Application
Three tier architecture for E-Governance is shown below in
figure 2. The architecture consists three layers of the system.
In the data storage layer, proper schema for data storage has
been defined for e-governance. It provides foundation for
storage for data which is coming from different processes and
serves the request of the any process which demands the data.
Application layer works between user layer and data layer. It
facilitates the connection between user process and data layer.
The upper layer or user layer has a Graphical User Interface for
the user interaction with the system. In E-Governance system,
a user can interact with the help of upper layer (GUI) and can
get information from the system. The government officials and
legislatures can update the information of the system with the
help of upper layer .This architecture has following advantages
in context of E-Governance [3]:
• Heterogeneous System: E-governance application
support different platforms, different hardware and different
working software. It integrates all these heterogeneous systems
to fulfill the requirements of t E-Governance.
• Modifiability: In 3-tier architecture, responsibility of
each tier is fixed. Segregation of responsibilities makes it easy
to modify and code at any tier.
• Scalability to handle many clients: Clients communicate
with the system by using application layer. This application
layer provides database connections to clients. The strength of
client deploying several servers on application layer.
• Integrated Data Access: Most of the applications use
data from different sources. Application layer provide facility
of managing the connection to database. Application is used to
connect all these data sources. Figure 2 explains the
architecture of E-Governance with three layers.
Figure 2: Typical architecture for an E-Governance application
III. CLOUD COMPUTING
Cloud computing is upcoming area with three main features
namely service availability, pay as per services, scalable
feature [4]. It is based on service oriented architecture and the
model could be categorized as follows:
a) Public Cloud – it is a type of cloud where third party
will provide services to client via internet. Each user
will have its access mechanism provided by the third
party. Public cloud is a cost effective method to
provide services.
b) Private Cloud – private cloud has many benefits over
public cloud depending upon the service required. In
addition in private cloud data and processes are
managed by organization itself. It provides better and
controlled infrastructure for security.
c) Community Cloud – Community cloud provides
services to a community within organization.
Members of community can access data on
community cloud. Communities are formed by
grouping of people with shared interest.
d) Hybrid Cloud –it is a combination of private, public
and community cloud. It has maximum functionalities
as compared to all cloud and non critical information
is handled by public cloud while critical information
and processing is done on organization controlled
private cloud. Figure 3 illustrates the different layers
of cloud computing for E-Governance.
Figure 3: Layers of cloud computing for e-governance
Int'l Conf. e-Learning, e-Bus., EIS, and e-Gov. | EEE'13 | 173
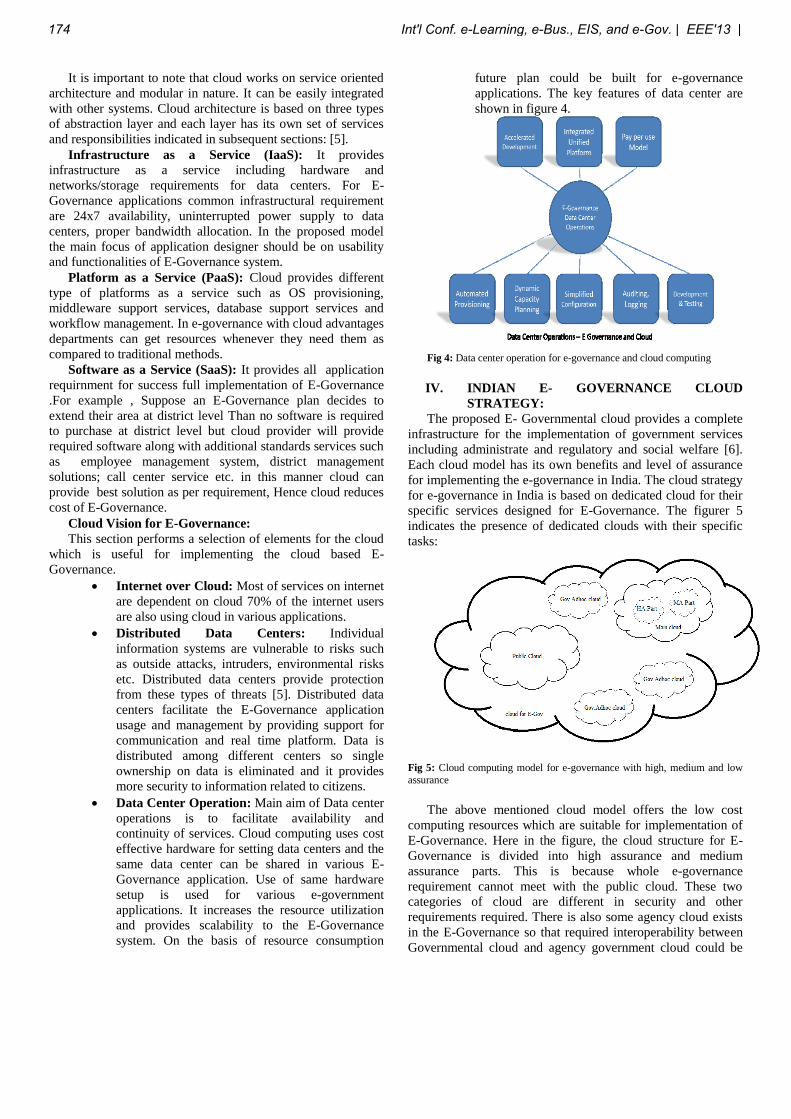
It is important to note that cloud works on service oriented
architecture and modular in nature. It can be easily integrated
with other systems. Cloud architecture is based on three types
of abstraction layer and each layer has its own set of services
and responsibilities indicated in subsequent sections: [5].
Infrastructure as a Service (IaaS): It provides
infrastructure as a service including hardware and
networks/storage requirements for data centers. For E-
Governance applications common infrastructural requirement
are 24x7 availability, uninterrupted power supply to data
centers, proper bandwidth allocation. In the proposed model
the main focus of application designer should be on usability
and functionalities of E-Governance system.
Platform as a Service (PaaS): Cloud provides different
type of platforms as a service such as OS provisioning,
middleware support services, database support services and
workflow management. In e-governance with cloud advantages
departments can get resources whenever they need them as
compared to traditional methods.
Software as a Service (SaaS): It provides all application
requirnment for success full implementation of E-Governance
.For example , Suppose an E-Governance plan decides to
extend their area at district level Than no software is required
to purchase at district level but cloud provider will provide
required software along with additional standards services such
as employee management system, district management
solutions; call center service etc. in this manner cloud can
provide best solution as per requirement, Hence cloud reduces
cost of E-Governance.
Cloud Vision for E-Governance:
This section performs a selection of elements for the cloud
which is useful for implementing the cloud based E-
Governance.
Internet over Cloud: Most of services on internet
are dependent on cloud 70% of the internet users
are also using cloud in various applications.
Distributed Data Centers: Individual
information systems are vulnerable to risks such
as outside attacks, intruders, environmental risks
etc. Distributed data centers provide protection
from these types of threats [5]. Distributed data
centers facilitate the E-Governance application
usage and management by providing support for
communication and real time platform. Data is
distributed among different centers so single
ownership on data is eliminated and it provides
more security to information related to citizens.
Data Center Operation: Main aim of Data center
operations is to facilitate availability and
continuity of services. Cloud computing uses cost
effective hardware for setting data centers and the
same data center can be shared in various E-
Governance application. Use of same hardware
setup is used for various e-government
applications. It increases the resource utilization
and provides scalability to the E-Governance
system. On the basis of resource consumption
future plan could be built for e-governance
applications. The key features of data center are
shown in figure 4.
Fig 4: Data center operation for e-governance and cloud computing
IV. INDIAN E- GOVERNANCE CLOUD
STRATEGY:
The proposed E- Governmental cloud provides a complete
infrastructure for the implementation of government services
including administrate and regulatory and social welfare [6].
Each cloud model has its own benefits and level of assurance
for implementing the e-governance in India. The cloud strategy
for e-governance in India is based on dedicated cloud for their
specific services designed for E-Governance. The figurer 5
indicates the presence of dedicated clouds with their specific
tasks:
Fig 5: Cloud computing model for e-governance with high, medium and low
assurance
The above mentioned cloud model offers the low cost
computing resources which are suitable for implementation of
E-Governance. Here in the figure, the cloud structure for E-
Governance is divided into high assurance and medium
assurance parts. This is because whole e-governance
requirement cannot meet with the public cloud. These two
categories of cloud are different in security and other
requirements required. There is also some agency cloud exists
in the E-Governance so that required interoperability between
Governmental cloud and agency government cloud could be
174 Int'l Conf. e-Learning, e-Bus., EIS, and e-Gov. | EEE'13 |
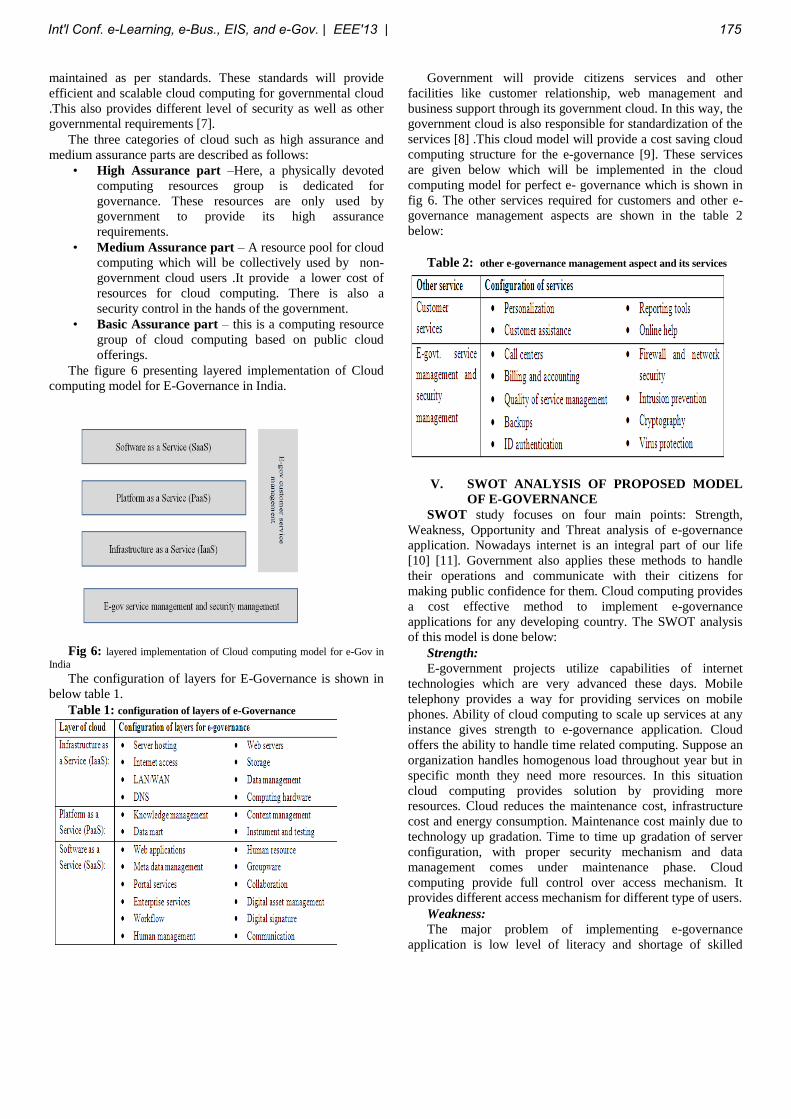
maintained as per standards. These standards will provide
efficient and scalable cloud computing for governmental cloud
.This also provides different level of security as well as other
governmental requirements [7].
The three categories of cloud such as high assurance and
medium assurance parts are described as follows:
• High Assurance part –Here, a physically devoted
computing resources group is dedicated for
governance. These resources are only used by
government to provide its high assurance
requirements.
• Medium Assurance part – A resource pool for cloud
computing which will be collectively used by non-
government cloud users .It provide a lower cost of
resources for cloud computing. There is also a
security control in the hands of the government.
• Basic Assurance part – this is a computing resource
group of cloud computing based on public cloud
offerings.
The figure 6 presenting layered implementation of Cloud
computing model for E-Governance in India.
Fig 6: layered implementation of Cloud computing model for e-Gov in
India
The configuration of layers for E-Governance is shown in
below table 1.
Table 1: configuration of layers of e-Governance
Government will provide citizens services and other
facilities like customer relationship, web management and
business support through its government cloud. In this way, the
government cloud is also responsible for standardization of the
services [8] .This cloud model will provide a cost saving cloud
computing structure for the e-governance [9]. These services
are given below which will be implemented in the cloud
computing model for perfect e- governance which is shown in
fig 6. The other services required for customers and other e-
governance management aspects are shown in the table 2
below:
Table 2: other e-governance management aspect and its services
V. SWOT ANALYSIS OF PROPOSED MODEL
OF E-GOVERNANCE
SWOT study focuses on four main points: Strength,
Weakness, Opportunity and Threat analysis of e-governance
application. Nowadays internet is an integral part of our life
[10] [11]. Government also applies these methods to handle
their operations and communicate with their citizens for
making public confidence for them. Cloud computing provides
a cost effective method to implement e-governance
applications for any developing country. The SWOT analysis
of this model is done below:
Strength:
E-government projects utilize capabilities of internet
technologies which are very advanced these days. Mobile
telephony provides a way for providing services on mobile
phones. Ability of cloud computing to scale up services at any
instance gives strength to e-governance application. Cloud
offers the ability to handle time related computing. Suppose an
organization handles homogenous load throughout year but in
specific month they need more resources. In this situation
cloud computing provides solution by providing more
resources. Cloud reduces the maintenance cost, infrastructure
cost and energy consumption. Maintenance cost mainly due to
technology up gradation. Time to time up gradation of server
configuration, with proper security mechanism and data
management comes under maintenance phase. Cloud
computing provide full control over access mechanism. It
provides different access mechanism for different type of users.
Weakness:
The major problem of implementing e-governance
application is low level of literacy and shortage of skilled
Int'l Conf. e-Learning, e-Bus., EIS, and e-Gov. | EEE'13 | 175
employee for development of e-government projects. E-
governance applications have no usefulness in low level areas
such daily use applications because of bandwidth shortage.
Organization worried about losing physical control over data
and information. Cloud service providers are also unable to
give information about data servers and location data to the
client. It creates situation of confusion in mind of clients.
Cloud providers continuously try to resolve these issues. But
due to this weakness large organizations do not rely on cloud
based systems for critical applications.
Opportunities:
The main part of providing e-governance services is to
provide hardware setup at low cost. Availability of e-
governance in rural areas is achieved by providing services on
cheap mobile phones. Mobile technology can be used to
provide services at government level. Media can play
important role in spreading awareness about e-government
services. Public private partnership will also be useful in e-gov
application.
Developing countries can use the information and
communication technologies with the cloud computing and
could allow the business organizations and citizens to benefit
from these technologies.
Threats:
Some basic threats in cloud e-governance are associated
with increasing manpower cost, increment in the broadband
cost and no reachability of internet. Without support of
legislators, cloud e-governance cannot be implemented. There
is also a regional language factor in the success of the cloud e-
governance. A major threat is associated with the security of
the cloud based governmental data which may be hacked. PPP
model may make impact on the partnership with the private
sector so it may be a threat to the private sector. There is a big
threat from the entrenched incumbents. There are some threats
from the lack of standards in cloud technology. So it may
create a problem in the implementation of the e-governance
with the help of the cloud computing. Basically, cloud
computing based e-governance is most interoperable so there
should be enough support from the legislators.
VI. CONCLUSIONS
Cloud provides a better way to offer services to clients
related to different regions. Cloud follow service oriented
architecture and provide low cost hardware/software resources.
E-governance could use both service oriented architecture and
cloud architecture and can provide services to citizens and
governments at low operating cost. In this paper, a novel cloud
computing based E-Governance model has been presented .A
SWOT analysis is also performed to highlight the strength and
challenges of the proposed model. The paper also suggesting
three tier cloud architecture especially for Indian scenario
which could transform the nation into information society.
REFERENCES:
1. Minqi Zhou, Rong Zhang, Dadan Zeng, Weining
Qian; Services in the Cloud Computing era: A survey,
IEEE Software, p40-46, Oct. 2010.
2. Marawar, T, Kale, S, Araspure, K., E-
Governance,IEEE Software, p183-186, Feb. 2010.
3. Nataraja, P, Raju, G.T, A novel approach towards
proliferation of E-Learning in India through the
analysis of existing ICT scenario, IEEE Software,
p1298 – 1302, 2011.
4. Gong Zhang, Chiu, L, Ling Liu, Adaptive Data
Migration in Multi-tiered Storage Based Cloud
Environment, IEEE software, p148 – 155, 2010.
5. Department of Information
Technologyhttp://www.mit.gov.in
6. Poonam R Gupta, D K Jain, Road map for E-
Governance.
7. Arun Chandrasekaran & Mayank Kapoor,State of
Cloud Computing in the Public Sector – A Strategic
analysis of the business case and overview of
initiatives across Asia Pacific.
http://www.frost.com/prod/servlet/cio/232651119.pdf.
8. White paper on cloud computing for e-governance.
9. Grant, G., and Chau, D., “Developing a Generic
Framework for E-Government”, Journal of Global
Information Management, Volume 13, Number 1, pp
1-30, year 2005
10. Armbrust, M., Fox, A., Griffith, R., Katz, R.,
Konwinski, A., Lee,G., Patterson, D., Rabkin, A.,
Stoika, I., Zaharia, M., “Above the Clouds: a Berkeley
view of Cloud Computing”, Technical report,
available at http://abovetheclouds.cs.berkeley.edu
11. Coursey, D. and Norris, D. “Models of e-
Government; Are they correct? An empirical
assessment” , Public Administration, Review, volume
68, Number 3, pp 523-536, 2008
176 Int'l Conf. e-Learning, e-Bus., EIS, and e-Gov. | EEE'13 |
A Statistical and Simulation Model for Environmental
Sustainability
John Wang, Montclair State University, 1 Normal Ave., USA
ARTICLE INFO ABSTRACT
________________________ _____________________________________________________________
________________________
Keywords:
Sustainability
Economic sustainability
Health sustainability
Social sustainability
Environmental sustainability
Simulation
________________________ ____________________________________________________________
1. Introduction
Global sustainability is development that meets the
needs of the present without compromising the ability
of future generations to meet their own needs [4] [1].
Without sustainability, we will see a rapid
deterioration in our quality of life. In order to
maintain or improve the quality of life, we must find
innovative ways to improve our ways without
increasing the use of natural and physical resources
beyond the capacity of the environment to supply
them indefinitely [27]. Each and every day, we are
faced with decisions that affect the environment.
Decisions such as using a plastic water bottle,
unnecessarily printing papers, cutting down trees, or
abusing electric and gas consumption lead to a
deterioration in the sustainability of the Earth.
It’s hard not to notice the shift in tone of
political leaders, the media, and many people over
the past decade when it comes to the preservation of
our planet. With “green” initiatives such as reducing
carbon footprints to growing organic foods, people
are more conscious of how they treat the Earth and
also how they treat their bodies. People want to live
longer and enjoy a quality of life that can be passed
down to future generations. This is called
sustainability - to keep up or keep going, as an action
or process [35] [17]. In order for us to maintain a
presence on this planet we have to learn how to
manage our natural resources wisely. In order to
manage something you must first be able to measure
it. There are a many indicators that help us to identify
problematic areas of sustainable development; these
measures are expressed in numerical form. With this
information in hand, it will be easy to compare
sustainability standards of different countries.
In our opinion, sustainable development can
be divided into four categories: economic
sustainability, health sustainability, social
sustainability, and environmental sustainability.
People, corporations, and governments need to work
to establish policies, standards, and guidelines to
work towards short and long term goals in order to
achieve high sustainability. A high level of
sustainability is not easy to achieve since the
complex factors and every day issues that arise
affecting the results, as well as the decisions made by
people on a daily basis throughout the world.
The purpose of this paper is to analyze a
number of elements within each category in order to
compare the relevance of each against the level of
sustainability among twenty-one countries. For each
category, three to five subcategories have been
identified and defined. Data has been collected and
analyzed for each subcategory. We will create an
index that measures each country’s sustainability
relative to one another and rank them accordingly.
This paper is structured as follows. In the
next section, we begin with discussion of the relevant
literature. This is followed by our model
development. Using a statistical and simulation
model, it is shown that mathematical evaluation can
be performed in the collected dataset. Next, a
Sustainability is the key to finding solutions to problems facing the Earth
such as insufficient access to food, environmental degradation, declining
natural resources, vanishing forests and deteriorating communities.
Sustainable development is a common challenge for the global
community, which has become a widely recognized goal for human
society. This paper compares the sustainability of U.S. with other twenty
countries. The mathematical comparison was completed using a statistical
and simulation model to compare and analyze the five categories across
each country.
Int'l Conf. e-Learning, e-Bus., EIS, and e-Gov. | EEE'13 | 177
theoretical foundation has been provided. The paper
concludes with a discussion of current ranking and
potential research directions.
2. Model development
2.1 Economic indicators
The measurement of welfare and sustainability is a
fundamental aspect in assessing a nation’s
development and quality of life. Economic growth is
a major component in measuring a countries level of
sustainability [2]. Macroeconomic data presentation
has become internationally standardized which has
established a coherent, consistent and integrated set
of macroeconomic accounts, balance sheets and
tables based on a set of internationally agreed
concepts, definitions and classifications. A
comprehensive economic framework within which
data can be compiled and presented in a format that is
designed for purposes of economic analysis and
policy-making [24]. It also serves as a basis for the
calculation of key indicators of economic
performance including GDP, net national savings,
unemployment and investment.
2.1.1 Gross domestic product (GDP)
The GDP is one of the primary indicators used to
gauge the health of a country’s economy. It
represents the total dollar value of all goods and
services produced over a specific time period. GDP is
expressed as a comparison to the previous quarter or
year. The addition of consumption, investment,
government spending and net exports is the more
commonly used approach at deriving at GDP. A high
GDP typically indicates a nation with healthy
economic production and growth [6].
GDP is in many ways the central measure of
an economy’s growth. The faster the growth in the
real GDP for that nation, the faster the growth in jobs
will soon occur. Although the relationship between
the measure and inflation is more tenuous, it is
generally acknowledged that if the level of real GDP
exceeds that of potential real GDP, inflation will
increase. GDP’s high correlation with unemployment
and inflation make it a key measure of a country’s
economic stability [13].
2.1.2 Unemployment
According to United Nations Statistic division, the
adult unemployment rate refers to the proportion of
the adult (aged 15 years and older) labour force that
is unemployed, unless otherwise specified. The
unemployed are persons who are currently without
work, who are currently available for work, and who
are seeking or have sought work recently. The base
for these statistics is the labour force (that is, the
economically active portion of the population), not
the total population [32].
The national definitions used vary from one
country to another as regards inter alia age limits,
reference periods, criteria for seeking work, treatment
of persons temporarily laid off and of persons
seeking work for the first time. Inter-country
comparisons are further hampered by the variety of
types of source used to obtain information on
unemployment and the differences in the scope and
coverage of such sources [14].
2.1.3 Gross national income
Gross national income (GNI) is the sum of value
added by all resident producers plus any product
taxes (less subsidies) not included in the valuation of
output plus net receipts of primary income
(compensation of employees and property income)
from abroad. In other words, GNI measures the total
income of all people who are citizens of a particular
country while GDP (gross domestic product)
measures the total output of all persons living in that
particular country’s borders [28].
Gross national savings is equal to gross
domestic savings (gross domestic product minus final
consumption) plus net income and net current
transfers from abroad. The United Nations system of
national accounts defines gross national income as
"the aggregate value of the balances of gross primary
incomes for all sectors; (gross national income is
identical to gross national product (GNP) as hitherto
understood in national accounts generally)" [32].
2.1.4 Foreign direct investment
Foreign direct investment is net inflows of
investment to acquire a lasting management interest
(10 percent or more of voting stock) in an enterprise
operating in an economy other than that of the
investor. It is the sum of equity capital, reinvestment
of earnings, other long-term capital, and short term
capital, as shown in the balance of payments [3].
2.2 Health indicators Over the past 50 years data relating to health
indicators have significantly improved. The world
has seen considerable health gains, and childhood
mortality has been decreasing due to control and
prevention of diseases. Advancement in technology
and medicine has increased life expectancy rates
178 Int'l Conf. e-Learning, e-Bus., EIS, and e-Gov. | EEE'13 |
around the world. Health and sustainable
development are closely connected. Development in
countries cannot be achieved or sustained when the
population is suffering from poor health conditions
and inadequate access to healthcare. Economic
growth and a clean environment contribute to
improved health and an individual’s well-being [23].
2.2.1 Health expenditure per capita (PPP)
Total health expenditure per capita is the per capita
amount of the total public and private health
expenditure. Health expenditure includes health
services, family planning activities, and nutrition
activities, but excludes the provision of water and
sanitation. Purchasing Power Parity (PPP), known as
the international dollar, are rates of currency
conversion constructed to account for differences in
price levels between countries [34]. Per capita
spending is directly associated with the quantity of
resources purchased to benefit an individual’s health
to provide effective healthcare.
2.2.2 Health expenditure (% of GDP)
Total expenditure on health in the country given as a
percentage of its GDP is rising more rapidly than
overall economic growth in countries around the
world. Data from the Organization for Economic
Cooperation and Development (OECD) show that
over the past 50 years healthcare spending has
increased by an average of 2 percentage points higher
than the growth of GDP. Healthcare spending in 40
years is predicted to be more than 10% of the GDP
for most countries [7]. The United States, not only
spends much more per capita on health care, but has
also had one of the highest spending growth rates.
The share of GDP devoted to health care spending
was 17.3% in 2009, which is a 7 percentage point
increase in health spending within the past thirty
years and is one of the largest among other countries
[9].
There have been several independent studies
carried out in different countries researching the
reason behind the increasing numbers in healthcare
spending. These studies took place during various
time periods and used different researching
techniques, but all came to similar conclusions. The
aging of the population accounts for about 20% of the
increase in spending. Technological change,
described as the enhanced capabilities of medicine,
accounts for 50% of the increase. Growth in real
incomes, an aging population and technological
change are the primary cause of increased healthcare
spending [7]. In addition, history shows during
recessions many countries experienced an increase in
health spending share of GDP [10].
2.2.3 Measles immunization
Measles are one of the most highly contagious human
diseases. In 1980, prior to the use of the vaccine, an
estimated 2.6 million deaths occurred worldwide due
to measles. It was the leading cause of high infant
mortality rates during the pre-vaccine era with 90
percent of children having measles by the age of 15.
One of the Millennium Development Goals set by the
United Nations is to reduce the overall deaths among
children by two-thirds, by 2015. Spreading the
measles vaccination to areas around the world to
reduce mortality among children is used as an
indicator towards the progress of this goal. The
improvement of living conditions, better nutrition
status, and areas where vaccinations have been
instituted have decreased the spread of measles
significantly [29].
2.2.4 Life expectancy at birth
Life expectancy at birth is frequently used as a
component of demographic data for countries around
the world. It represents the average lifespan of a
newborn, and is an indicator of the overall health and
quality of life in a country. Less developed regions
that suffer from famine and disease result in lower
life expectancies. During the twentieth century life
expectancy grew rapidly due to improvements in
public health, nutrition and the availability of
medicine for curable illnesses. Global life expectancy
reached 68 years within 2005-2010. High-income
developed countries rose to 80 years, compared to 67
years decades ago. Over the same time period, low-
income countries rose from 38 to 60 years [11].
Communicable diseases, mainly infections,
were the cause of 31% of all deaths in the world.
Non-communicable diseases, such as cancer and
heart attacks, are responsible for 60%, and injuries
for 10%. These totals varied significantly by
geographic area, but there is one common factor in
life expectancy throughout the world and within all
income groups, women almost always live longer
than men. Globally, females have a life expectancy of
70 years, compared to 65 for males. This discrepancy
is highest in Europe by 13 years and lowest in Africa
by two years. Overall, Africa has the world’s lowest
life expectancies due to the unfortunate AIDS
epidemic [21].
2.3 Social indicators
Int'l Conf. e-Learning, e-Bus., EIS, and e-Gov. | EEE'13 | 179
The extensive range of social indicators includes
many measures towards a country’s sustainable
development. Social indicators provide information
regarding the conditions in which people live, and the
actions taken by governments to improve and
preserve them without compromising the future
generations’ ability to meet their own needs. Many
social indicators assess the availability and ability for
an individual to access opportunities, which will
enhance their quality of life. Over the years literacy
rates have increased, education has improved and
there have been more opportunities available,
indicating progress towards international
sustainability [28].
2.3.1 Literacy rates
Literacy, the percentage of people who are able to
read and write, is the root to human development and
economic growth. According to the latest data, 793
million adults, two-thirds of them being women,
continue to lack basic literacy skills. Globally,
literacy rates are on the rise, up 2.3% in the past 10
years, and 10.6% in the past 20 years. More than half
of the global illiterate population is in the region of
South and West Asia where there are growing
populations, internal conflict, gender inequality, and
inadequate funding for basic education [31].
Literacy is one of the key steps towards
improving the economic, health and social indicators
of sustainability development. It is a means for
development, the key to communication, and enables
learning of all kinds improving the quality of life.
Poor literacy skills result in a lack of participation in
education, employment, and community life and the
inability to capitalize on basic skills needed to
improve the standard of living. Literacy is also linked
with poverty reduction, economic growth and wealth
creation and it is the start to lifelong learning [19].
2.3.2 School life expectancy
School life expectancy is defined as the total number
of years of schooling a child can expect to receive.
When using this indicator in international
comparisons the education structure in the different
countries must be taken into consideration. A year or
grade completed in one country is not necessarily the
same in terms of educational content or quality as a
year or grade completed in another country.
According to United Nations statistics,
around 67 million children do not attend primary
school, and 72 million adolescents are missing out on
their right to secondary education. If these current
trends continue, it is projected that there could be
more children out of school in 2015 than there are
today, resulting in lower levels of literacy rates [32].
2.3.3 Internet users
Worldwide, the total number of Internet user will
grow from 2 billion in 2010 to 2.7 billion in 2015,
when 40% of the world's population will have access
to its vast resources. The McKinsey Global Institute
constructed a study in May 2011, which aimed to
estimate the extent of the impact the Internet has on
numerous countries and the world economy. It’s
evident that the use of the Internet is and has been
changing lives, and many still debate about the effect
the Internet has, and how to control its power for the
common good. However, this report finds that the
Internet has delivered substantial economic growth
and created jobs on a large scale. It contributes to
GDP more than the agriculture and energy sectors
combined. Developed countries experienced a 21%
growth in GDP linked to the increasing number of
users over the past 5 years. The study concluded that
the Internet correlates with wealth creation, and is
one of the largest contributors to global economic
growth and sustainability [12].
2.3.4 Human Development Index (HDI)
The United Nations Development Program designed
the Human Development Index in 1990 as a measure
of the quality of life through the availability of
essential choices needed for human development. An
individual should have the option to acquire
knowledge, access resources needed for a decent
standard of living, and the opportunity to lead a long
and healthy life [22].
The 2011 Human Development Report
states that global challenges of sustainability and
equity must be addressed together to improve human
development. There has been remarkable progress in
living standards for decades within most countries.
Continuous efforts towards ending social inequalities
and reducing environmental risks must be made for
the benefit of future generations as well as for those
living today. “Promoting human development
requires addressing sustainability—locally, nationally
and globally—and this can and should be done in
ways that are equitable and empowering” [30].
2.4 Environmental indicators
(pollution)
2.4.1 Industrial greenhouse gas (GHG)
emissions
180 Int'l Conf. e-Learning, e-Bus., EIS, and e-Gov. | EEE'13 |
The “greenhouse effect” occurs naturally, making life
as we know it possible. During the past century,
however, human activities have substantially
increased the amount of greenhouse gases in the
atmosphere, changing the composition of the
atmosphere and influencing climate. Some
greenhouse gases are almost entirely man-made.
Other greenhouse gases come from a combination of
natural sources and human activities.
Greenhouse gas emission is an extremely
important sub-category in our report. The excessive
amounts of greenhouse gas emission modify the
greenhouse effect process in a harmful way.
Moreover, the negatively modified greenhouse effect
causes high amounts of global warming, which
directly interferes with future generations’
survivability and the sustainability of the
environment respectively. The major greenhouse
gases emitted into the atmosphere through human
activities are carbon dioxide, methane, nitrous oxide,
and fluorinated gases. Many of these gases can
remain in the atmosphere for tens to hundreds of
years after being released [33].
2.4.2 Fresh water pollution
Fresh water is a strategic resource for humans as well
as for nature. It is a source of energy, an avenue for
transportation, habitat for organisms, and absolutely
essential for life. Water resource developments have
substantially changed freshwater flow and inundation
regimes, and are fundamentally altering the life
histories - thereby threatening the long-term survival
- of thousands of species, including humans. We
consider human and environmental wellbeing to be
congruent with sustained disease resistance (or
avoidance), good nutrition, and persistence of
species-appropriate population dynamics. Quality
fresh waters are increasingly scarce throughout most
of the world, and fresh waters environments are
experiencing declines in biodiversity far greater than
those in the most impacted terrestrial and marine
ecosystems. If trends in human demands for water
remain unaltered, and if species losses continue at
current rates, the opportunity to maintain much of the
remaining biodiversity will soon vanish. The human
crisis associated with pollution and declining water
quality is already severe, with perhaps 40% of the
Earth’s population lacking clean water or adequate
sanitation [16].
2.5 Environmental indicators (natural
resources)
2.5.1 Arable land (% of total land)
The first subcategory is the arable lands. This
subcategory represents the measure on the potential
food production. The potential food production gives
an idea about how a country is sustaining the use of
its lands for the future generations. For the food
industry, the depletion of arable land and a growing
world population demand controlling the
sustainability of agricultural inputs to the industry.
Controlling the sustainability of these supplies means
controlling the economic, social, and environmental
performance of the supply chain [5].
2.5.2 Protected areas - areas managed for
sustainable use and natural reserves
The second category is the Protected Areas. We
thought this is an important subcategory because it is
represents a country’s concern on how much it cares
to protect the basic habitat which started it all. This
care shows a country’s dedication to expertise on
how to balance the sustainability via protecting
species and creating a clean economy out of it.
2.5.3 Forests (% of total land)
Forests, which are an integral component of the
biosphere, cover about 30% of the world's total land
area. Forests provide many significant resources and
functions including wood products, habitat for
wildlife, water and soil conservation and serve as a
filter for pollutants. Forests thus support employment
and biodiversity. The larger the forest area the better,
healthier and more sustainable is the country. It also
implies that the government is working on forest
growth and regeneration [26].
3. Mathematical evaluation
After collecting the data for each sub-category, and
organizing each in a table (see table 1), we altered the
data to value each factor similarly for comparison
purposes. In order to do so, we utilized a ranking
system on a scale from 0 to 9, with 0 being the lowest
and 9 being the highest. The ranked data is displayed
in a table (see table 2) for comparison and analysis.
The ranking was automatically completed
utilizing a computer simulation built in excel. The
simulation ranked the data elements on the scale of 0
to 9. The values were ranked based on whether a
higher or lower value was better. For example, GDP
is usually ranked from highest to lowest, with the
highest values typically indicating a healthy
economic climate with in the country. On the other
hand, the unemployment rate is usually ranked from
Int'l Conf. e-Learning, e-Bus., EIS, and e-Gov. | EEE'13 | 181
lowest to highest, with the lower values indicating a
high job placement or number of jobs available
within in that country. Our group used our judgment
and the definition of each sub-category to decide
whether or not each would be ranked on a high or
low scale. Regardless of whether the values were
ranked on a high or low scale, 0 remains the lowest
and 9 remains the highest across all sub-categories.
Once all data has been ranked on the same
scale, we can now analyze the data in order to
compare the sustainability among the twenty-one
countries based on the five indicators: Economic,
Health, Social, Pollution, and Natural Resources.
Using Pareto Optimization, the simulation built in
excel converted the ranked sub-category data and
translated it to scores out of 100 for each of the five
categories (see table 3). The higher the score, the
better the country ranked in sustainability, with zero
being the lowest and one hundred being the highest.
Due to the various real life diverse factors, issues,
and situations that affect each indicator, it is not
easily determined which solution will optimize the
sustainability for one country.
Once the categories for each country were
scored on a scale of 0 to 100, we calculated the
overall scores across all countries and then sorted
highest to lowest based on the countries average (see
analysis). This was done to compare all five
indicators as one variable across all countries in order
to rank the countries based on their sustainability.
The results are described in the conclusion section.
4. Conclusions
For the analysis of the sustainability of various
countries, we collected data of key indicators, which
combined and evaluated give an overall picture of
sustainability. Note that differences such as political
environments and types of government have not been
included. Instead we evaluated each country on the
same scale and scored them accordingly to their
performance. The model analyzes and scores the
countries in following four areas: Economic, Social,
Health, and Environment. Environment consists of
two categories: natural resources and pollution.
Within these five categories we have included a total
of 20 subcategories to analyze the performance of
these areas for different indicators. By keeping other
things equal, we can set aside many arguable
differences and focus on the results of the data, which
are represented by an average of the five categories;
all populations are dependents of for their long term
sustainability.
From evaluating our model and sorting the
scored averages in descending order, interestingly
eight of the ten countries are in the continent of. The
United States is ranked as ninth out of twenty one.
The reason for the moderate performance is due to
the not strong environmental score, whereas all other
categories performed quite well. This is an indication
of the importance of a balanced score between the
variables, and no sector can be neglected if long-term
sustainability is the objective since all sectors are
interdependent of each other.
References
1. Abbott, K.W. (2012) ‘Engaging the public and the
private in global sustainability governance’,
International Affairs, Vol. 88, No. 3, pp.543-564.
DOI: 10.1111/j.1468-2346.2012.01088.x.
2. Beça, P. and Santos, R. (2010) ‘Measuring
sustainable welfare: a new approach to the ISEW’,
Ecological Economics, Vol. 69, No. 4, pp.810-819.
3. Daily, G. and Ehrlich, P. (1992) ‘Population,
sustainability, and earth's carrying capacity’,
BioScience, Vol. 42, No. 10, pp. 761-771.
4. Faucheux, S., Muir, E. and O'Connor, M. (1997)
‘Neoclassical natural capital theory and "weak"
indicators for sustainability’, Land Economics, Vol.
73, No. 4, pp.528-552.
5. Hamprecht, J., Corsten, D., Noll, M. and Meier, E.
(2005) ‘Controlling the sustainability of food supply
chains’, Supply Chain Management, Vol. 10, No. 1,
pp.7-10.
6. Hobijn, B. and Steindel, C. (2009) ‘Do alternative
measures of GDP affect its interpretation?’,
Economics and Finance, Vol.15, No. 7, pp.1-7.
7. Jackson, M. P. (2009) ‘Debate: we just do not know:
healthcare expenditure trends’, Public Money and
Management, Vol. 29, No., 3, pp.9-10.
8. Kao, C. (1994) ‘Evaluation of junior colleges of
technology: the Taiwan case’, European Journal of
Operational Research, Vol. 72, No., 1, pp.43-51.
9. Kaiser Family Foundation. (2011) ‘Health care costs:
health care spending in the United States and selected
OECD countries’, available at
http://www.kff.org/insurance/snapshot/OECD042111
.cfm (accessed on June 16, 2012).
10. Kemp, R. and Martens, P. (2007) ‘How to manage
sustainable development’, Sustainability: Science,
Practice, & Policy, Vol. 3, No. 2, pp.5-14.
11. Kondro, W. (2010) ‘Global life expectancy rises’,
Canadian Medical Association Journal, Vol. 182,
No. 6, pp.E342-E343.
12. Manyika, J., Hazan, E., Bughin, J., Chui, M., Pélissié
du Rausas M. and Said, E. (2011) ‘Internet matters:
the net’s sweeping impact on growth, jobs, and
prosperity’, McKinsey Global Institute, available at
http://www.mckinsey.com/Insights/MGI/Research/Te
182 Int'l Conf. e-Learning, e-Bus., EIS, and e-Gov. | EEE'13 |
chnology_and_Innovation/Internet_matters (accessed
on June 16, 2012).
13. Menon, A. and Welsh, J. (2011) ‘Understanding
NATO's sustainability: the limits of institutionalist
theory’, Global Governance, Vol. 17, No. 1, pp.81-
94.
14. Michelon, G. (2011) ‘Sustainability disclosure and
reputation: a comparative study’, Corporate
Reputation Review, Summer, Vol. 14, pp.79-96.
15. Moldan, B., Hák, T., Kovanda, J., Havránek, M. and
Kušková, P. (2004) ‘Composite indicators of
environmental sustainability’, Statistics, Knowledge
and Policy, Vol. 1, No. 2, pp.1-10.
16. Naiman, R. J. and Dudgeon, D. (2011) ‘Global
alteration of freshwaters: influences on human and
environmental well-being’, Ecological Research,
Vol. 26, No., 5, pp.865-873.
17. Nierenberg, D. (2012) ‘World watch presents:
growing solutions’, Harvard International Review,
April, Vol. 33, pp.72-75.
18. OECD. (2011) ‘Health at a glance, health expenditure
and financing’, available at
http://www.oecdilibrary.org/docserver/download/
(accessed on June 16, 2012).
19. Richmond, M., Robinson, C. and Sachs-Israel, M.
(2008) ‘The global literacy challenge; a profile of
youth and adult literacy at the mid-point of the
United Nations literacy decade 2003 – 2012’,
available at
http://unesdoc.unesco.org/images/0016/001631/
163170e.pdf (accessed on June 16, 2012).
20. Roca, L.C., and Searcy, C. (2012) ‘An analysis of
indicators disclosed in corporate sustainability
reports’, Journal of Cleaner Production, Vol. 20, No.,
1, pp.103-118.
21. Rosenberg, M. (2010) ‘Overview of life expectancy’,
available at
http://geography.about.com/od/populationgeography/
a/lifeexpectancy.htm (accessed on June 16, 2012).
22. Roy, M. and Fink, N. (2010) ‘“Healthy” human
development indices’, Social Indicators Research.
Vol. 99, No. 1, pp.61-80.
23. Schirnding, Y. (2011) ‘Health in sustainable
development: the role of indicators’, World Summit
on Sustainable Development, World Health
Organization, available at
http://www.who.int/wssd/resources/indicators/en/
(accessed on June 16, 2012).
24. Schneidewind, U. and Augenstein, K. (2012)
‘Analyzing a transition to a sustainability-oriented
science system in Germany’, Environmental
Innovation and Societal Transitions, In Press,
Corrected Proof, Available online 24 May 2012.
25. Searcy, C., & Elkhawas, D. (2012) ‘Corporate
sustainability ratings: an investigation into how
corporations use the Dow Jones sustainability’,
Journal of Cleaner Production, Vol. 35, pp.79-92.
26. Sharma, N. and Rowe, R. (1992) ‘Managing the
world’s forests’, Finance & Development, Vol. 29,
No. 2, p.31.
27. Spence, M., Ben Boubaker Gherib, J. and Ondoua
Biwolé, V. (2011) ‘Sustainable entrepreneurship: is
entrepreneurial will enough? A north-south
comparison’, Journal of Business Ethics, Vol. 99, No.
3, pp.335-367. DOI: 10.1007/s10551-010-0656-1.
28. Stevens, C. (2005) ‘Measuring sustainable
development’, Statistics Brief, No. 10, September,
OECD, Paris.
29. Strebel, P., Cochi, S., Hoekstra, E., Rota, P.,
Featherstone, D., Bellini, W. and Katz, S. (2011)
‘The journal of infectious diseases, A world
without measles’, Oxford Journal of Medicine, Vol.
204, Suppl. 1, pp.S1-S3.
30. United Nations Development Program (UNDP).
(2011) ‘Human development report 2011,
sustainability and equity: a better future for all’,
available
athttp://hdr.undp.org/en/reports/global/hdr2011/
(accessed on June 16, 2012).
31. UNESCO. (2009) ‘Rates are rising, but progress is
slow’, available at
http://www.uis.unesco.org/literacy/Pages/Literacy-
adult-youth-2011.aspx (accessed on June 16, 2012).
32. United Nations Statistics Division. (2011)
‘Demographic and social statistics’, United Nations
Statistics Division, available at
http://unstats.un.org/unsd/demographic/ (accessed on
June 16, 2012).
33. Vong, S., Boruff, B.J. and Morrison-Saunders, A.
(2011) ‘Addressing climate change through
environmental impact assessment: International perspectives from a survey of IAIA members’,
Impact Assessment & Project Appraisal, Vol. 29, No.
4, pp.317-326. DOI:
10.3152/146155111X12959673796001.
34. World Health Organization. (2011) ‘World health
indicators’, available at
http://apps.who.int/whosis/database/country/compare.
cfm?country=CUB&indicator=PcTotEOHinIntD&la
nguage=english (accessed on June 16, 2012).
35. Warner, K. (2011) ‘Environmental change and
migration: methodological considerations from
ground-breaking global survey’, Population &
Environment, Vol. 33, pp.3-27. DOI:
10.1007/s11111-011-015.
Int'l Conf. e-Learning, e-Bus., EIS, and e-Gov. | EEE'13 | 183
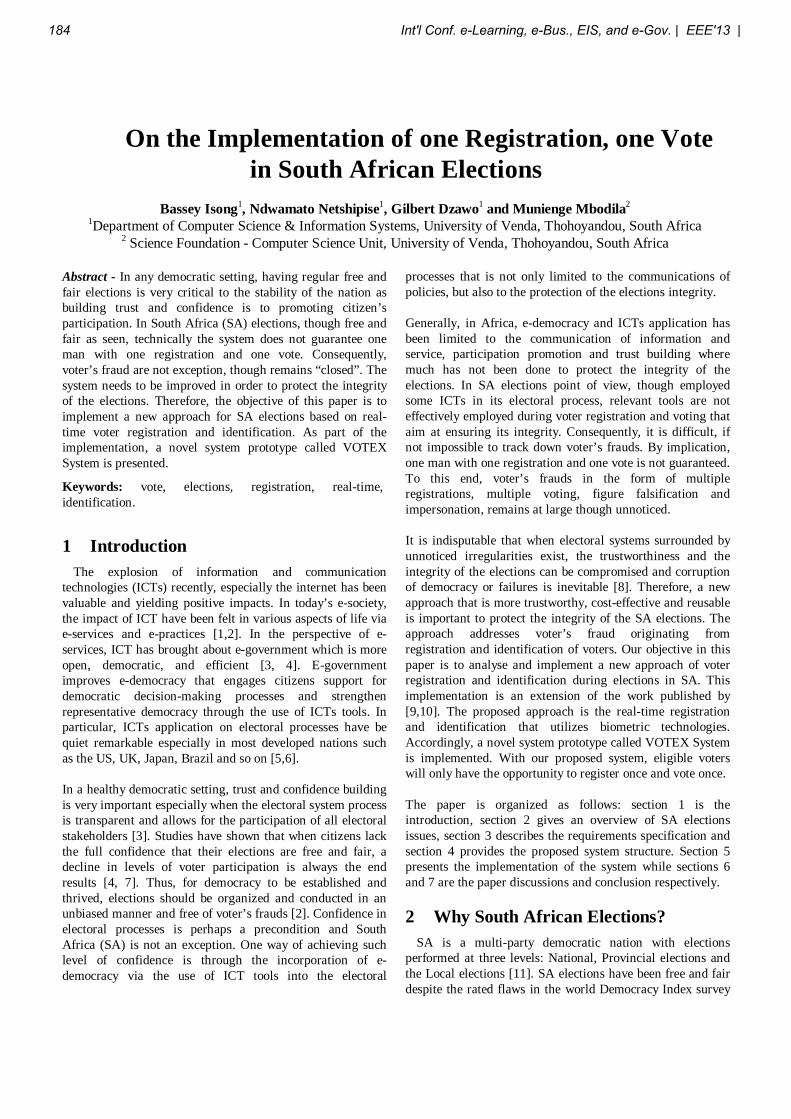
On the Implementation of one Registration, one Vote in South African Elections
Bassey Isong1, Ndwamato Netshipise1, Gilbert Dzawo1 and Munienge Mbodila2
1Department of Computer Science & Information Systems, University of Venda, Thohoyandou, South Africa 2 Science Foundation - Computer Science Unit, University of Venda, Thohoyandou, South Africa
Abstract - In any democratic setting, having regular free and fair elections is very critical to the stability of the nation as building trust and confidence is to promoting citizen’s participation. In South Africa (SA) elections, though free and fair as seen, technically the system does not guarantee one man with one registration and one vote. Consequently, voter’s fraud are not exception, though remains “closed”. The system needs to be improved in order to protect the integrity of the elections. Therefore, the objective of this paper is to implement a new approach for SA elections based on real-time voter registration and identification. As part of the implementation, a novel system prototype called VOTEX System is presented.
Keywords: vote, elections, registration, real-time, identification.
1 Introduction The explosion of information and communication technologies (ICTs) recently, especially the internet has been valuable and yielding positive impacts. In today’s e-society, the impact of ICT have been felt in various aspects of life via e-services and e-practices [1,2]. In the perspective of e-services, ICT has brought about e-government which is more open, democratic, and efficient [3, 4]. E-government improves e-democracy that engages citizens support for democratic decision-making processes and strengthen representative democracy through the use of ICTs tools. In particular, ICTs application on electoral processes have be quiet remarkable especially in most developed nations such as the US, UK, Japan, Brazil and so on [5,6]. In a healthy democratic setting, trust and confidence building is very important especially when the electoral system process is transparent and allows for the participation of all electoral stakeholders [3]. Studies have shown that when citizens lack the full confidence that their elections are free and fair, a decline in levels of voter participation is always the end results [4, 7]. Thus, for democracy to be established and thrived, elections should be organized and conducted in an unbiased manner and free of voter’s frauds [2]. Confidence in electoral processes is perhaps a precondition and South Africa (SA) is not an exception. One way of achieving such level of confidence is through the incorporation of e-democracy via the use of ICT tools into the electoral
processes that is not only limited to the communications of policies, but also to the protection of the elections integrity. Generally, in Africa, e-democracy and ICTs application has been limited to the communication of information and service, participation promotion and trust building where much has not been done to protect the integrity of the elections. In SA elections point of view, though employed some ICTs in its electoral process, relevant tools are not effectively employed during voter registration and voting that aim at ensuring its integrity. Consequently, it is difficult, if not impossible to track down voter’s frauds. By implication, one man with one registration and one vote is not guaranteed. To this end, voter’s frauds in the form of multiple registrations, multiple voting, figure falsification and impersonation, remains at large though unnoticed.
It is indisputable that when electoral systems surrounded by unnoticed irregularities exist, the trustworthiness and the integrity of the elections can be compromised and corruption of democracy or failures is inevitable [8]. Therefore, a new approach that is more trustworthy, cost-effective and reusable is important to protect the integrity of the SA elections. The approach addresses voter’s fraud originating from registration and identification of voters. Our objective in this paper is to analyse and implement a new approach of voter registration and identification during elections in SA. This implementation is an extension of the work published by [9,10]. The proposed approach is the real-time registration and identification that utilizes biometric technologies. Accordingly, a novel system prototype called VOTEX System is implemented. With our proposed system, eligible voters will only have the opportunity to register once and vote once. The paper is organized as follows: section 1 is the introduction, section 2 gives an overview of SA elections issues, section 3 describes the requirements specification and section 4 provides the proposed system structure. Section 5 presents the implementation of the system while sections 6 and 7 are the paper discussions and conclusion respectively. 2 Why South African Elections? SA is a multi-party democratic nation with elections performed at three levels: National, Provincial elections and the Local elections [11]. SA elections have been free and fair despite the rated flaws in the world Democracy Index survey
184 Int'l Conf. e-Learning, e-Bus., EIS, and e-Gov. | EEE'13 |
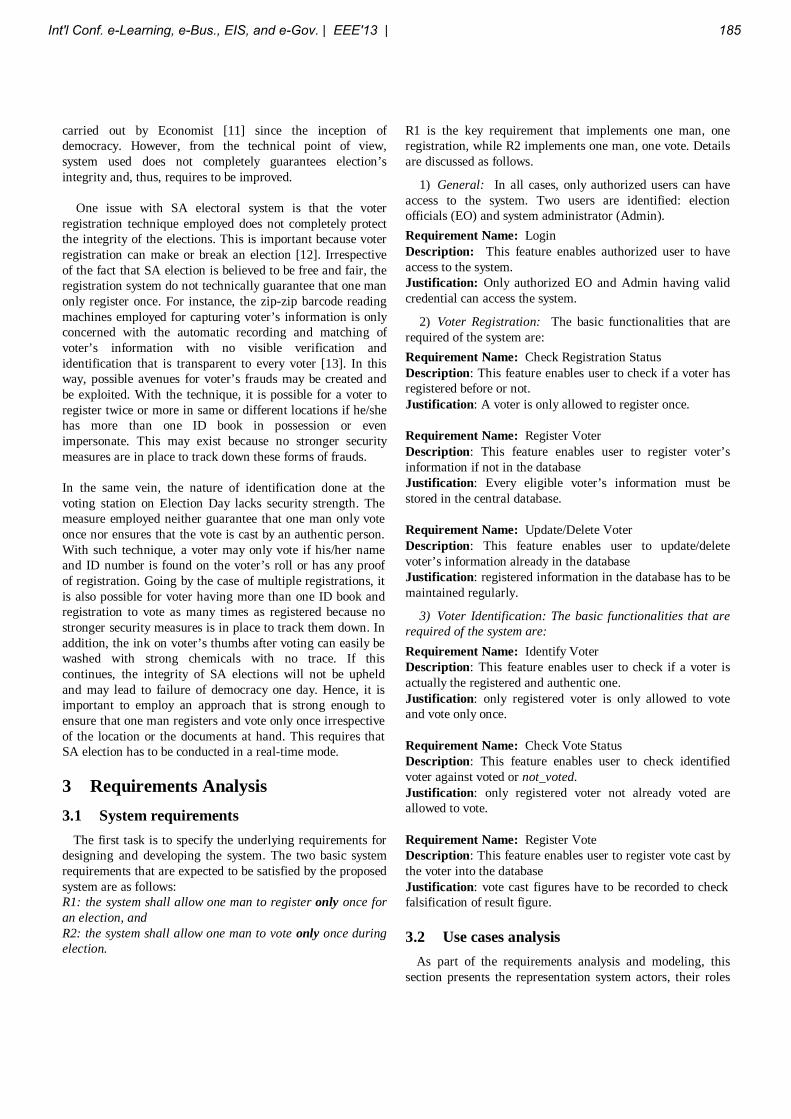
carried out by Economist [11] since the inception of democracy. However, from the technical point of view, system used does not completely guarantees election’s integrity and, thus, requires to be improved.
One issue with SA electoral system is that the voter
registration technique employed does not completely protect the integrity of the elections. This is important because voter registration can make or break an election [12]. Irrespective of the fact that SA election is believed to be free and fair, the registration system do not technically guarantee that one man only register once. For instance, the zip-zip barcode reading machines employed for capturing voter’s information is only concerned with the automatic recording and matching of voter’s information with no visible verification and identification that is transparent to every voter [13]. In this way, possible avenues for voter’s frauds may be created and be exploited. With the technique, it is possible for a voter to register twice or more in same or different locations if he/she has more than one ID book in possession or even impersonate. This may exist because no stronger security measures are in place to track down these forms of frauds. In the same vein, the nature of identification done at the voting station on Election Day lacks security strength. The measure employed neither guarantee that one man only vote once nor ensures that the vote is cast by an authentic person. With such technique, a voter may only vote if his/her name and ID number is found on the voter’s roll or has any proof of registration. Going by the case of multiple registrations, it is also possible for voter having more than one ID book and registration to vote as many times as registered because no stronger security measures is in place to track them down. In addition, the ink on voter’s thumbs after voting can easily be washed with strong chemicals with no trace. If this continues, the integrity of SA elections will not be upheld and may lead to failure of democracy one day. Hence, it is important to employ an approach that is strong enough to ensure that one man registers and vote only once irrespective of the location or the documents at hand. This requires that SA election has to be conducted in a real-time mode.
3 Requirements Analysis 3.1 System requirements The first task is to specify the underlying requirements for designing and developing the system. The two basic system requirements that are expected to be satisfied by the proposed system are as follows: R1: the system shall allow one man to register only once for an election, and R2: the system shall allow one man to vote only once during election.
R1 is the key requirement that implements one man, one registration, while R2 implements one man, one vote. Details are discussed as follows.
1) General: In all cases, only authorized users can have access to the system. Two users are identified: election officials (EO) and system administrator (Admin). Requirement Name: Login Description: This feature enables authorized user to have access to the system. Justification: Only authorized EO and Admin having valid credential can access the system.
2) Voter Registration: The basic functionalities that are required of the system are: Requirement Name: Check Registration Status Description: This feature enables user to check if a voter has registered before or not. Justification: A voter is only allowed to register once. Requirement Name: Register Voter Description: This feature enables user to register voter’s information if not in the database Justification: Every eligible voter’s information must be stored in the central database. Requirement Name: Update/Delete Voter Description: This feature enables user to update/delete voter’s information already in the database Justification: registered information in the database has to be maintained regularly.
3) Voter Identification: The basic functionalities that are required of the system are: Requirement Name: Identify Voter Description: This feature enables user to check if a voter is actually the registered and authentic one. Justification: only registered voter is only allowed to vote and vote only once. Requirement Name: Check Vote Status Description: This feature enables user to check identified voter against voted or not_voted. Justification: only registered voter not already voted are allowed to vote. Requirement Name: Register Vote Description: This feature enables user to register vote cast by the voter into the database Justification: vote cast figures have to be recorded to check falsification of result figure.
3.2 Use cases analysis As part of the requirements analysis and modeling, this section presents the representation system actors, their roles
Int'l Conf. e-Learning, e-Bus., EIS, and e-Gov. | EEE'13 | 185
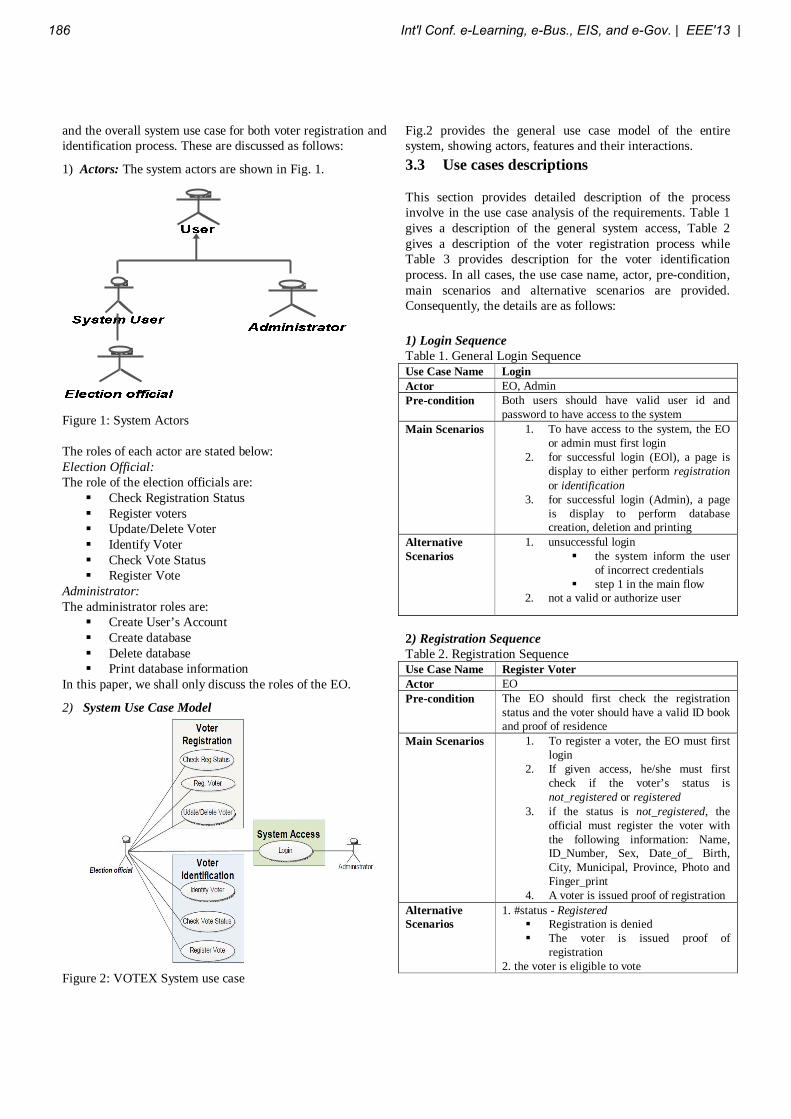
and the overall system use case for both voter registration and identification process. These are discussed as follows:
1) Actors: The system actors are shown in Fig. 1.
Figure 1: System Actors The roles of each actor are stated below: Election Official: The role of the election officials are:
Check Registration Status Register voters Update/Delete Voter Identify Voter Check Vote Status Register Vote
Administrator: The administrator roles are:
Create User’s Account Create database Delete database Print database information
In this paper, we shall only discuss the roles of the EO.
2) System Use Case Model
Figure 2: VOTEX System use case
Fig.2 provides the general use case model of the entire system, showing actors, features and their interactions. 3.3 Use cases descriptions
This section provides detailed description of the process involve in the use case analysis of the requirements. Table 1 gives a description of the general system access, Table 2 gives a description of the voter registration process while Table 3 provides description for the voter identification process. In all cases, the use case name, actor, pre-condition, main scenarios and alternative scenarios are provided. Consequently, the details are as follows: 1) Login Sequence Table 1. General Login Sequence Use Case Name Login Actor EO, Admin Pre-condition Both users should have valid user id and
password to have access to the system Main Scenarios 1. To have access to the system, the EO
or admin must first login 2. for successful login (EOl), a page is
display to either perform registration or identification
3. for successful login (Admin), a page is display to perform database creation, deletion and printing
Alternative Scenarios
1. unsuccessful login the system inform the user
of incorrect credentials step 1 in the main flow
2. not a valid or authorize user
2) Registration Sequence Table 2. Registration Sequence Use Case Name Register Voter Actor EO Pre-condition The EO should first check the registration
status and the voter should have a valid ID book and proof of residence
Main Scenarios 1. To register a voter, the EO must first login
2. If given access, he/she must first check if the voter’s status is not_registered or registered
3. if the status is not_registered, the official must register the voter with the following information: Name, ID_Number, Sex, Date_of_ Birth, City, Municipal, Province, Photo and Finger_print
4. A voter is issued proof of registration Alternative Scenarios
1. #status - Registered Registration is denied The voter is issued proof of
registration 2. the voter is eligible to vote
186 Int'l Conf. e-Learning, e-Bus., EIS, and e-Gov. | EEE'13 |
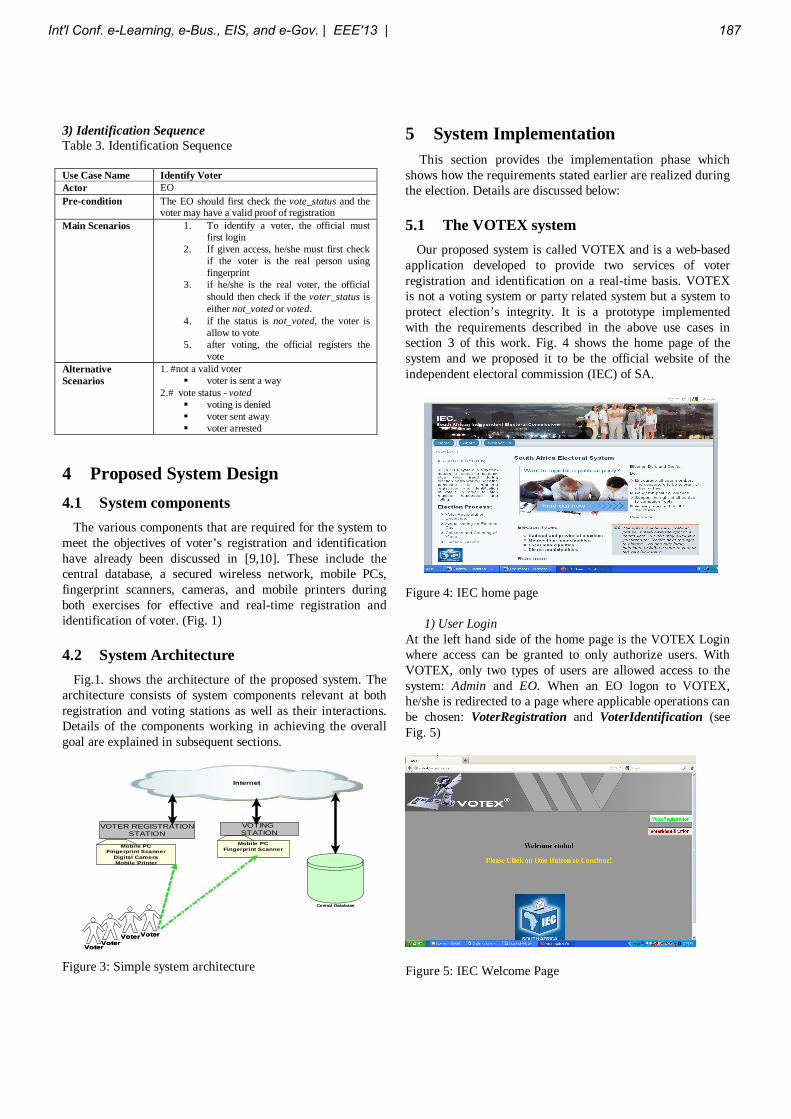
3) Identification Sequence Table 3. Identification Sequence Use Case Name Identify Voter Actor EO Pre-condition The EO should first check the vote_status and the
voter may have a valid proof of registration Main Scenarios 1. To identify a voter, the official must
first login 2. If given access, he/she must first check
if the voter is the real person using fingerprint
3. if he/she is the real voter, the official should then check if the voter_status is either not_voted or voted.
4. if the status is not_voted, the voter is allow to vote
5. after voting, the official registers the vote
Alternative Scenarios
1. #not a valid voter voter is sent a way
2.# vote status - voted voting is denied voter sent away voter arrested
4 Proposed System Design 4.1 System components The various components that are required for the system to meet the objectives of voter’s registration and identification have already been discussed in [9,10]. These include the central database, a secured wireless network, mobile PCs, fingerprint scanners, cameras, and mobile printers during both exercises for effective and real-time registration and identification of voter. (Fig. 1) 4.2 System Architecture Fig.1. shows the architecture of the proposed system. The architecture consists of system components relevant at both registration and voting stations as well as their interactions. Details of the components working in achieving the overall goal are explained in subsequent sections.
Internet
VoterVoter
Central DatabaseCentral Database
VOTER REGISTRATIONSTATION
VOTING STATION
Mobile PCFingerprint Scanner
Digital CameraMobile Printer
Mobile PCFingerprint Scanner
VoterVoterVoterVoter
VoterVoter
Figure 3: Simple system architecture
5 System Implementation This section provides the implementation phase which
shows how the requirements stated earlier are realized during the election. Details are discussed below: 5.1 The VOTEX system Our proposed system is called VOTEX and is a web-based application developed to provide two services of voter registration and identification on a real-time basis. VOTEX is not a voting system or party related system but a system to protect election’s integrity. It is a prototype implemented with the requirements described in the above use cases in section 3 of this work. Fig. 4 shows the home page of the system and we proposed it to be the official website of the independent electoral commission (IEC) of SA.
Figure 4: IEC home page
1) User Login
At the left hand side of the home page is the VOTEX Login where access can be granted to only authorize users. With VOTEX, only two types of users are allowed access to the system: Admin and EO. When an EO logon to VOTEX, he/she is redirected to a page where applicable operations can be chosen: VoterRegistration and VoterIdentification (see Fig. 5)
Figure 5: IEC Welcome Page
Int'l Conf. e-Learning, e-Bus., EIS, and e-Gov. | EEE'13 | 187
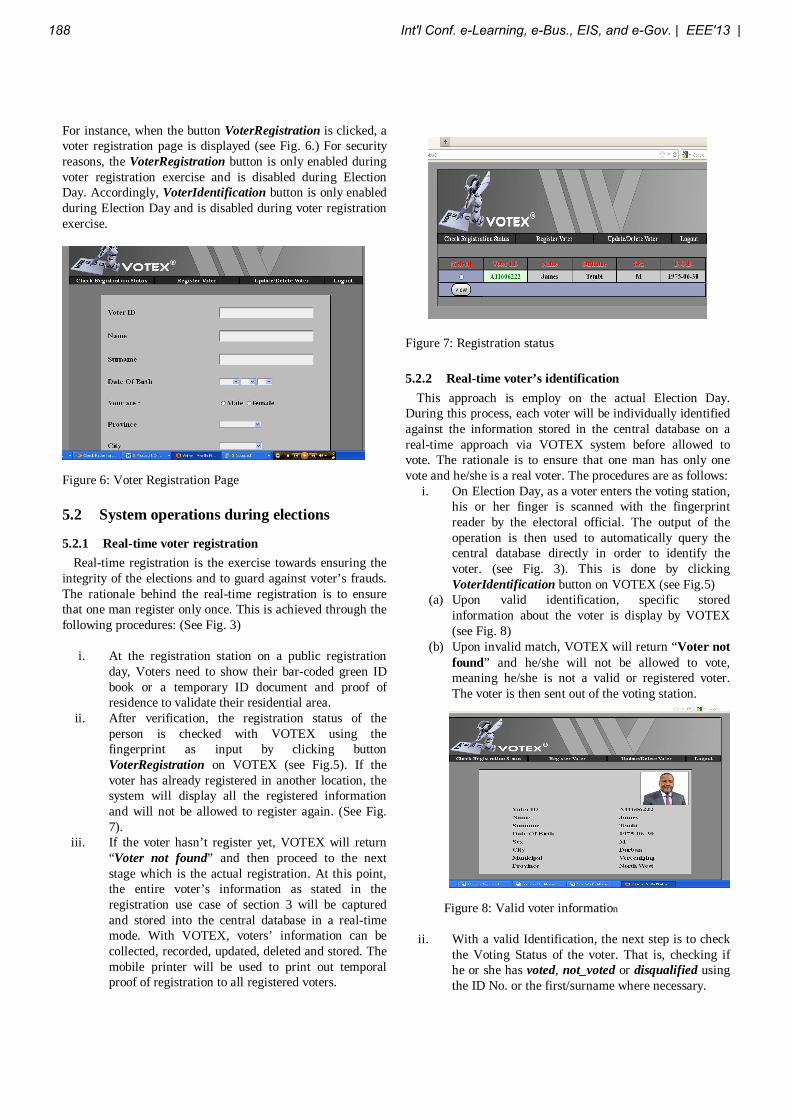
For instance, when the button VoterRegistration is clicked, a voter registration page is displayed (see Fig. 6.) For security reasons, the VoterRegistration button is only enabled during voter registration exercise and is disabled during Election Day. Accordingly, VoterIdentification button is only enabled during Election Day and is disabled during voter registration exercise.
Figure 6: Voter Registration Page 5.2 System operations during elections
5.2.1 Real-time voter registration Real-time registration is the exercise towards ensuring the integrity of the elections and to guard against voter’s frauds. The rationale behind the real-time registration is to ensure that one man register only once. This is achieved through the following procedures: (See Fig. 3)
i. At the registration station on a public registration day, Voters need to show their bar-coded green ID book or a temporary ID document and proof of residence to validate their residential area.
ii. After verification, the registration status of the person is checked with VOTEX using the fingerprint as input by clicking button VoterRegistration on VOTEX (see Fig.5). If the voter has already registered in another location, the system will display all the registered information and will not be allowed to register again. (See Fig. 7).
iii. If the voter hasn’t register yet, VOTEX will return “Voter not found” and then proceed to the next stage which is the actual registration. At this point, the entire voter’s information as stated in the registration use case of section 3 will be captured and stored into the central database in a real-time mode. With VOTEX, voters’ information can be collected, recorded, updated, deleted and stored. The mobile printer will be used to print out temporal proof of registration to all registered voters.
Figure 7: Registration status
5.2.2 Real-time voter’s identification This approach is employ on the actual Election Day. During this process, each voter will be individually identified against the information stored in the central database on a real-time approach via VOTEX system before allowed to vote. The rationale is to ensure that one man has only one vote and he/she is a real voter. The procedures are as follows:
i. On Election Day, as a voter enters the voting station, his or her finger is scanned with the fingerprint reader by the electoral official. The output of the operation is then used to automatically query the central database directly in order to identify the voter. (see Fig. 3). This is done by clicking VoterIdentification button on VOTEX (see Fig.5)
(a) Upon valid identification, specific stored information about the voter is display by VOTEX (see Fig. 8)
(b) Upon invalid match, VOTEX will return “Voter not found” and he/she will not be allowed to vote, meaning he/she is not a valid or registered voter. The voter is then sent out of the voting station.
Figure 8: Valid voter information
ii. With a valid Identification, the next step is to check
the Voting Status of the voter. That is, checking if he or she has voted, not_voted or disqualified using the ID No. or the first/surname where necessary.
188 Int'l Conf. e-Learning, e-Bus., EIS, and e-Gov. | EEE'13 |
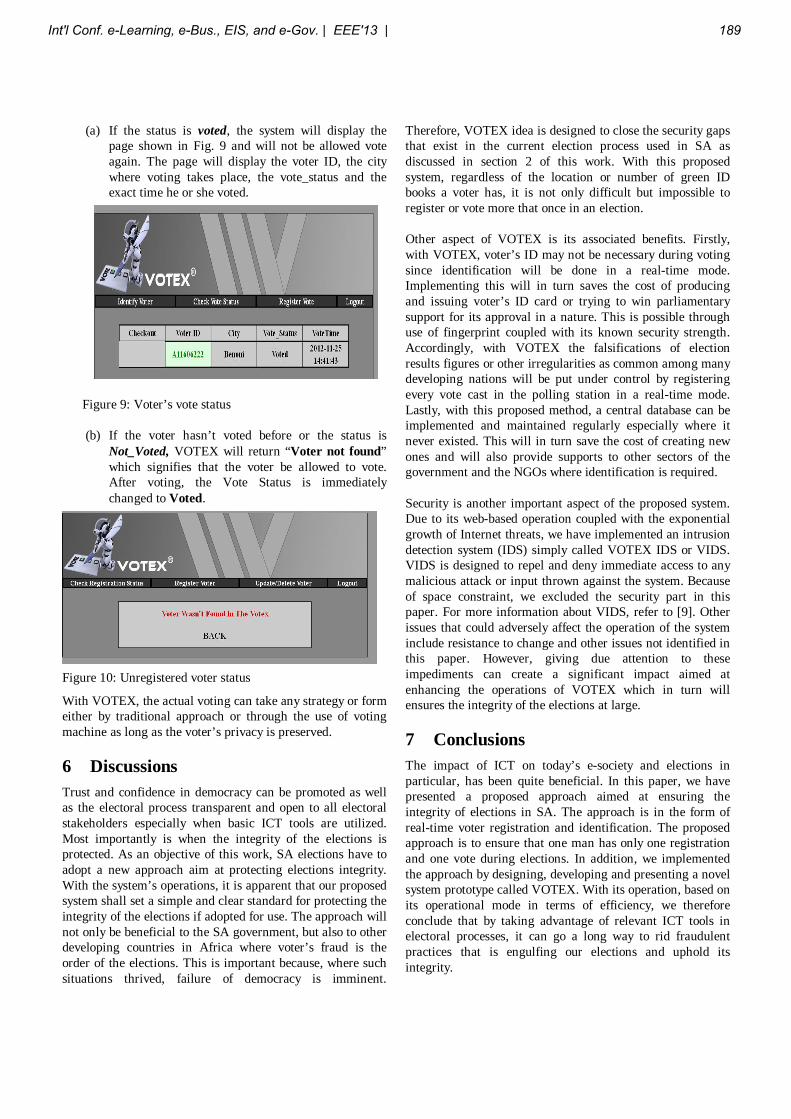
(a) If the status is voted, the system will display the page shown in Fig. 9 and will not be allowed vote again. The page will display the voter ID, the city where voting takes place, the vote_status and the exact time he or she voted.
Figure 9: Voter’s vote status
(b) If the voter hasn’t voted before or the status is Not_Voted, VOTEX will return “Voter not found” which signifies that the voter be allowed to vote. After voting, the Vote Status is immediately changed to Voted.
Figure 10: Unregistered voter status
With VOTEX, the actual voting can take any strategy or form either by traditional approach or through the use of voting machine as long as the voter’s privacy is preserved. 6 Discussions Trust and confidence in democracy can be promoted as well as the electoral process transparent and open to all electoral stakeholders especially when basic ICT tools are utilized. Most importantly is when the integrity of the elections is protected. As an objective of this work, SA elections have to adopt a new approach aim at protecting elections integrity. With the system’s operations, it is apparent that our proposed system shall set a simple and clear standard for protecting the integrity of the elections if adopted for use. The approach will not only be beneficial to the SA government, but also to other developing countries in Africa where voter’s fraud is the order of the elections. This is important because, where such situations thrived, failure of democracy is imminent.
Therefore, VOTEX idea is designed to close the security gaps that exist in the current election process used in SA as discussed in section 2 of this work. With this proposed system, regardless of the location or number of green ID books a voter has, it is not only difficult but impossible to register or vote more that once in an election. Other aspect of VOTEX is its associated benefits. Firstly, with VOTEX, voter’s ID may not be necessary during voting since identification will be done in a real-time mode. Implementing this will in turn saves the cost of producing and issuing voter’s ID card or trying to win parliamentary support for its approval in a nature. This is possible through use of fingerprint coupled with its known security strength. Accordingly, with VOTEX the falsifications of election results figures or other irregularities as common among many developing nations will be put under control by registering every vote cast in the polling station in a real-time mode. Lastly, with this proposed method, a central database can be implemented and maintained regularly especially where it never existed. This will in turn save the cost of creating new ones and will also provide supports to other sectors of the government and the NGOs where identification is required. Security is another important aspect of the proposed system. Due to its web-based operation coupled with the exponential growth of Internet threats, we have implemented an intrusion detection system (IDS) simply called VOTEX IDS or VIDS. VIDS is designed to repel and deny immediate access to any malicious attack or input thrown against the system. Because of space constraint, we excluded the security part in this paper. For more information about VIDS, refer to [9]. Other issues that could adversely affect the operation of the system include resistance to change and other issues not identified in this paper. However, giving due attention to these impediments can create a significant impact aimed at enhancing the operations of VOTEX which in turn will ensures the integrity of the elections at large. 7 Conclusions The impact of ICT on today’s e-society and elections in particular, has been quite beneficial. In this paper, we have presented a proposed approach aimed at ensuring the integrity of elections in SA. The approach is in the form of real-time voter registration and identification. The proposed approach is to ensure that one man has only one registration and one vote during elections. In addition, we implemented the approach by designing, developing and presenting a novel system prototype called VOTEX. With its operation, based on its operational mode in terms of efficiency, we therefore conclude that by taking advantage of relevant ICT tools in electoral processes, it can go a long way to rid fraudulent practices that is engulfing our elections and uphold its integrity.
Int'l Conf. e-Learning, e-Bus., EIS, and e-Gov. | EEE'13 | 189
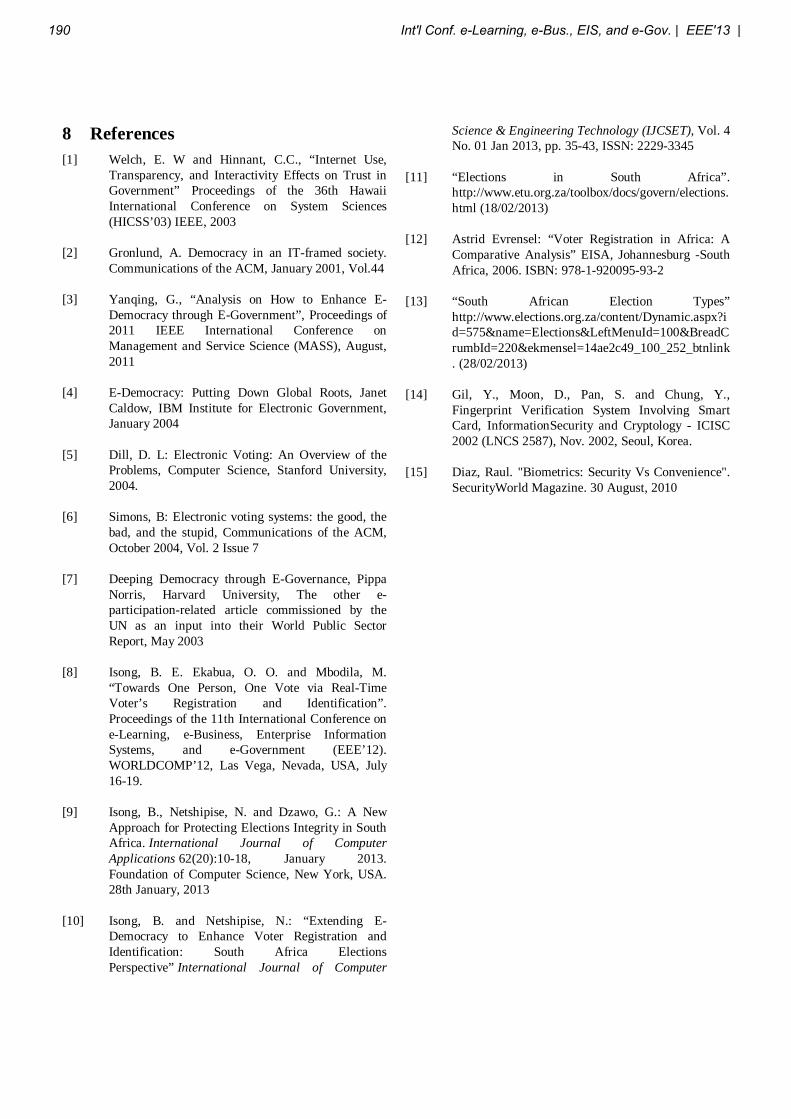
8 References [1] Welch, E. W and Hinnant, C.C., “Internet Use,
Transparency, and Interactivity Effects on Trust in Government” Proceedings of the 36th Hawaii International Conference on System Sciences (HICSS’03) IEEE, 2003
[2] Gronlund, A. Democracy in an IT-framed society.
Communications of the ACM, January 2001, Vol.44 [3] Yanqing, G., “Analysis on How to Enhance E-
Democracy through E-Government”, Proceedings of 2011 IEEE International Conference on Management and Service Science (MASS), August, 2011
[4] E-Democracy: Putting Down Global Roots, Janet
Caldow, IBM Institute for Electronic Government, January 2004
[5] Dill, D. L: Electronic Voting: An Overview of the
Problems, Computer Science, Stanford University, 2004.
[6] Simons, B: Electronic voting systems: the good, the
bad, and the stupid, Communications of the ACM, October 2004, Vol. 2 Issue 7
[7] Deeping Democracy through E-Governance, Pippa
Norris, Harvard University, The other e-participation-related article commissioned by the UN as an input into their World Public Sector Report, May 2003
[8] Isong, B. E. Ekabua, O. O. and Mbodila, M.
“Towards One Person, One Vote via Real-Time Voter’s Registration and Identification”. Proceedings of the 11th International Conference on e-Learning, e-Business, Enterprise Information Systems, and e-Government (EEE’12). WORLDCOMP’12, Las Vega, Nevada, USA, July 16-19.
[9] Isong, B., Netshipise, N. and Dzawo, G.: A New
Approach for Protecting Elections Integrity in South Africa. International Journal of Computer Applications 62(20):10-18, January 2013. Foundation of Computer Science, New York, USA. 28th January, 2013
[10] Isong, B. and Netshipise, N.: “Extending E-
Democracy to Enhance Voter Registration and Identification: South Africa Elections Perspective” International Journal of Computer
Science & Engineering Technology (IJCSET), Vol. 4 No. 01 Jan 2013, pp. 35-43, ISSN: 2229-3345
[11] “Elections in South Africa”.
http://www.etu.org.za/toolbox/docs/govern/elections.html (18/02/2013)
[12] Astrid Evrensel: “Voter Registration in Africa: A
Comparative Analysis” EISA, Johannesburg -South Africa, 2006. ISBN: 978-1-920095-93-2
[13] “South African Election Types”
http://www.elections.org.za/content/Dynamic.aspx?id=575&name=Elections&LeftMenuId=100&BreadCrumbId=220&ekmensel=14ae2c49_100_252_btnlink. (28/02/2013)
[14] Gil, Y., Moon, D., Pan, S. and Chung, Y.,
Fingerprint Verification System Involving Smart Card, InformationSecurity and Cryptology - ICISC 2002 (LNCS 2587), Nov. 2002, Seoul, Korea.
[15] Diaz, Raul. "Biometrics: Security Vs Convenience".
SecurityWorld Magazine. 30 August, 2010
190 Int'l Conf. e-Learning, e-Bus., EIS, and e-Gov. | EEE'13 |
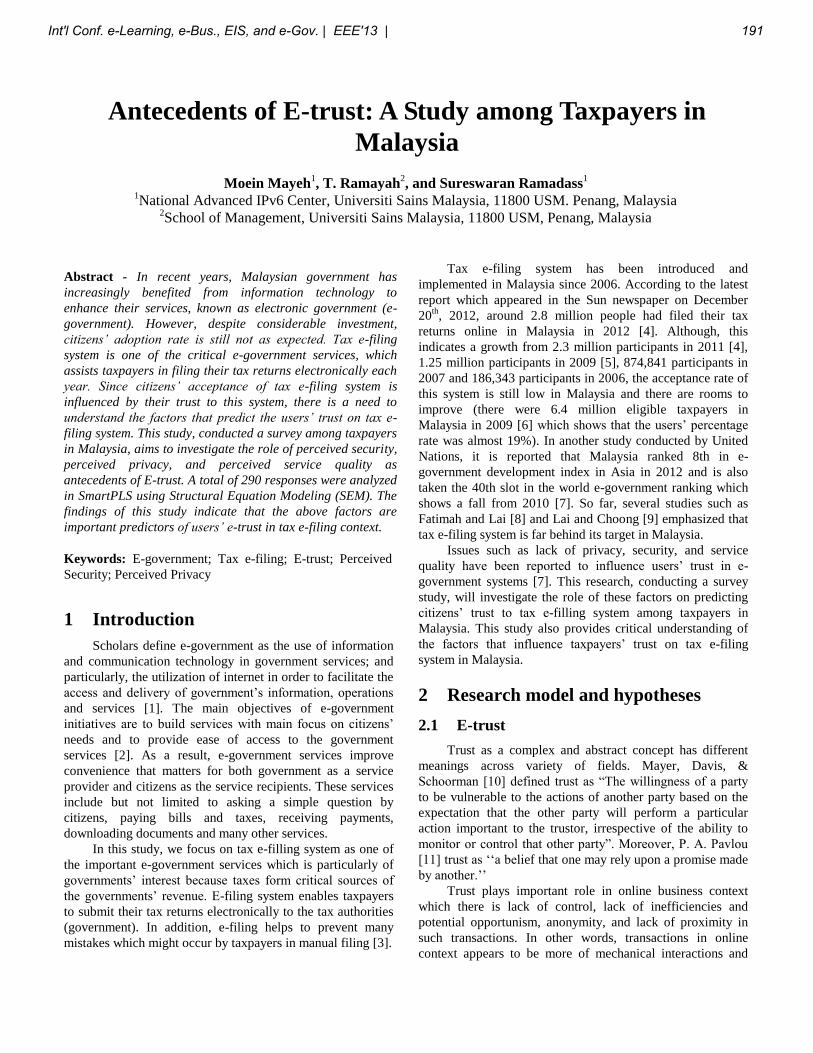
Antecedents of E-trust: A Study among Taxpayers in
Malaysia
Moein Mayeh1, T. Ramayah
2, and Sureswaran Ramadass
1
1National Advanced IPv6 Center, Universiti Sains Malaysia, 11800 USM. Penang, Malaysia
2School of Management, Universiti Sains Malaysia, 11800 USM, Penang, Malaysia
Abstract - In recent years, Malaysian government has
increasingly benefited from information technology to
enhance their services, known as electronic government (e-
government). However, despite considerable investment,
citizens’ adoption rate is still not as expected. Tax e-filing
system is one of the critical e-government services, which
assists taxpayers in filing their tax returns electronically each
year. Since citizens’ acceptance of tax e-filing system is
influenced by their trust to this system, there is a need to
understand the factors that predict the users’ trust on tax e-
filing system. This study, conducted a survey among taxpayers
in Malaysia, aims to investigate the role of perceived security,
perceived privacy, and perceived service quality as
antecedents of E-trust. A total of 290 responses were analyzed
in SmartPLS using Structural Equation Modeling (SEM). The
findings of this study indicate that the above factors are
important predictors of users’ e-trust in tax e-filing context.
Keywords: E-government; Tax e-filing; E-trust; Perceived
Security; Perceived Privacy
1 Introduction
Scholars define e-government as the use of information
and communication technology in government services; and
particularly, the utilization of internet in order to facilitate the
access and delivery of government’s information, operations
and services [1]. The main objectives of e-government
initiatives are to build services with main focus on citizens’
needs and to provide ease of access to the government
services [2]. As a result, e-government services improve
convenience that matters for both government as a service
provider and citizens as the service recipients. These services
include but not limited to asking a simple question by
citizens, paying bills and taxes, receiving payments,
downloading documents and many other services.
In this study, we focus on tax e-filling system as one of
the important e-government services which is particularly of
governments’ interest because taxes form critical sources of
the governments’ revenue. E-filing system enables taxpayers
to submit their tax returns electronically to the tax authorities
(government). In addition, e-filing helps to prevent many
mistakes which might occur by taxpayers in manual filing [3].
Tax e-filing system has been introduced and
implemented in Malaysia since 2006. According to the latest
report which appeared in the Sun newspaper on December
20th
, 2012, around 2.8 million people had filed their tax
returns online in Malaysia in 2012 [4]. Although, this
indicates a growth from 2.3 million participants in 2011 [4],
1.25 million participants in 2009 [5], 874,841 participants in
2007 and 186,343 participants in 2006, the acceptance rate of
this system is still low in Malaysia and there are rooms to
improve (there were 6.4 million eligible taxpayers in
Malaysia in 2009 [6] which shows that the users’ percentage
rate was almost 19%). In another study conducted by United
Nations, it is reported that Malaysia ranked 8th in e-
government development index in Asia in 2012 and is also
taken the 40th slot in the world e-government ranking which
shows a fall from 2010 [7]. So far, several studies such as
Fatimah and Lai [8] and Lai and Choong [9] emphasized that
tax e-filing system is far behind its target in Malaysia.
Issues such as lack of privacy, security, and service
quality have been reported to influence users’ trust in e-
government systems [7]. This research, conducting a survey
study, will investigate the role of these factors on predicting
citizens’ trust to tax e-filling system among taxpayers in
Malaysia. This study also provides critical understanding of
the factors that influence taxpayers’ trust on tax e-filing
system in Malaysia.
2 Research model and hypotheses
2.1 E-trust
Trust as a complex and abstract concept has different
meanings across variety of fields. Mayer, Davis, &
Schoorman [10] defined trust as “The willingness of a party
to be vulnerable to the actions of another party based on the
expectation that the other party will perform a particular
action important to the trustor, irrespective of the ability to
monitor or control that other party”. Moreover, P. A. Pavlou
[11] trust as ‘‘a belief that one may rely upon a promise made
by another.’’
Trust plays important role in online business context
which there is lack of control, lack of inefficiencies and
potential opportunism, anonymity, and lack of proximity in
such transactions. In other words, transactions in online
context appears to be more of mechanical interactions and
Int'l Conf. e-Learning, e-Bus., EIS, and e-Gov. | EEE'13 | 191
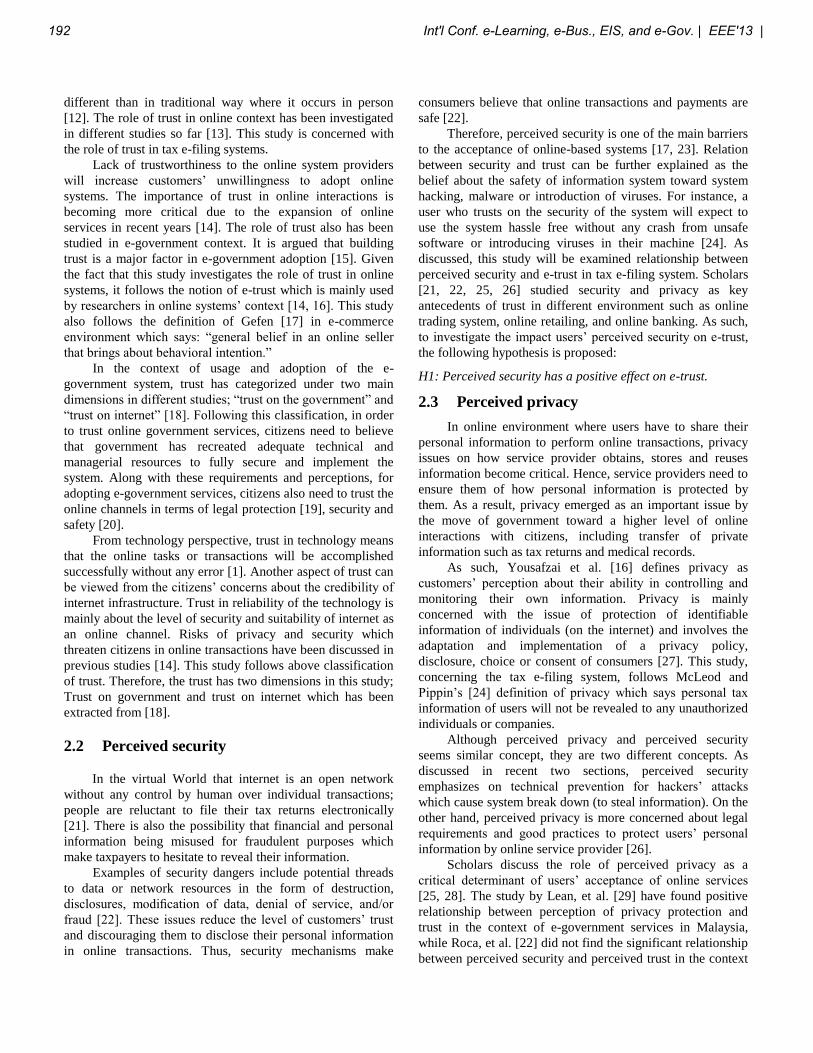
different than in traditional way where it occurs in person
[12]. The role of trust in online context has been investigated
in different studies so far [13]. This study is concerned with
the role of trust in tax e-filing systems.
Lack of trustworthiness to the online system providers
will increase customers’ unwillingness to adopt online
systems. The importance of trust in online interactions is
becoming more critical due to the expansion of online
services in recent years [14]. The role of trust also has been
studied in e-government context. It is argued that building
trust is a major factor in e-government adoption [15]. Given
the fact that this study investigates the role of trust in online
systems, it follows the notion of e-trust which is mainly used
by researchers in online systems’ context [14, 16]. This study
also follows the definition of Gefen [17] in e-commerce
environment which says: “general belief in an online seller
that brings about behavioral intention.”
In the context of usage and adoption of the e-
government system, trust has categorized under two main
dimensions in different studies; “trust on the government” and
“trust on internet” [18]. Following this classification, in order
to trust online government services, citizens need to believe
that government has recreated adequate technical and
managerial resources to fully secure and implement the
system. Along with these requirements and perceptions, for
adopting e-government services, citizens also need to trust the
online channels in terms of legal protection [19], security and
safety [20].
From technology perspective, trust in technology means
that the online tasks or transactions will be accomplished
successfully without any error [1]. Another aspect of trust can
be viewed from the citizens’ concerns about the credibility of
internet infrastructure. Trust in reliability of the technology is
mainly about the level of security and suitability of internet as
an online channel. Risks of privacy and security which
threaten citizens in online transactions have been discussed in
previous studies [14]. This study follows above classification
of trust. Therefore, the trust has two dimensions in this study;
Trust on government and trust on internet which has been
extracted from [18].
2.2 Perceived security
In the virtual World that internet is an open network
without any control by human over individual transactions;
people are reluctant to file their tax returns electronically
[21]. There is also the possibility that financial and personal
information being misused for fraudulent purposes which
make taxpayers to hesitate to reveal their information.
Examples of security dangers include potential threads
to data or network resources in the form of destruction,
disclosures, modification of data, denial of service, and/or
fraud [22]. These issues reduce the level of customers’ trust
and discouraging them to disclose their personal information
in online transactions. Thus, security mechanisms make
consumers believe that online transactions and payments are
safe [22].
Therefore, perceived security is one of the main barriers
to the acceptance of online-based systems [17, 23]. Relation
between security and trust can be further explained as the
belief about the safety of information system toward system
hacking, malware or introduction of viruses. For instance, a
user who trusts on the security of the system will expect to
use the system hassle free without any crash from unsafe
software or introducing viruses in their machine [24]. As
discussed, this study will be examined relationship between
perceived security and e-trust in tax e-filing system. Scholars
[21, 22, 25, 26] studied security and privacy as key
antecedents of trust in different environment such as online
trading system, online retailing, and online banking. As such,
to investigate the impact users’ perceived security on e-trust,
the following hypothesis is proposed:
H1: Perceived security has a positive effect on e-trust.
2.3 Perceived privacy
In online environment where users have to share their
personal information to perform online transactions, privacy
issues on how service provider obtains, stores and reuses
information become critical. Hence, service providers need to
ensure them of how personal information is protected by
them. As a result, privacy emerged as an important issue by
the move of government toward a higher level of online
interactions with citizens, including transfer of private
information such as tax returns and medical records.
As such, Yousafzai et al. [16] defines privacy as
customers’ perception about their ability in controlling and
monitoring their own information. Privacy is mainly
concerned with the issue of protection of identifiable
information of individuals (on the internet) and involves the
adaptation and implementation of a privacy policy,
disclosure, choice or consent of consumers [27]. This study,
concerning the tax e-filing system, follows McLeod and
Pippin’s [24] definition of privacy which says personal tax
information of users will not be revealed to any unauthorized
individuals or companies.
Although perceived privacy and perceived security
seems similar concept, they are two different concepts. As
discussed in recent two sections, perceived security
emphasizes on technical prevention for hackers’ attacks
which cause system break down (to steal information). On the
other hand, perceived privacy is more concerned about legal
requirements and good practices to protect users’ personal
information by online service provider [26].
Scholars discuss the role of perceived privacy as a
critical determinant of users’ acceptance of online services
[25, 28]. The study by Lean, et al. [29] have found positive
relationship between perception of privacy protection and
trust in the context of e-government services in Malaysia,
while Roca, et al. [22] did not find the significant relationship
between perceived security and perceived trust in the context
192 Int'l Conf. e-Learning, e-Bus., EIS, and e-Gov. | EEE'13 |
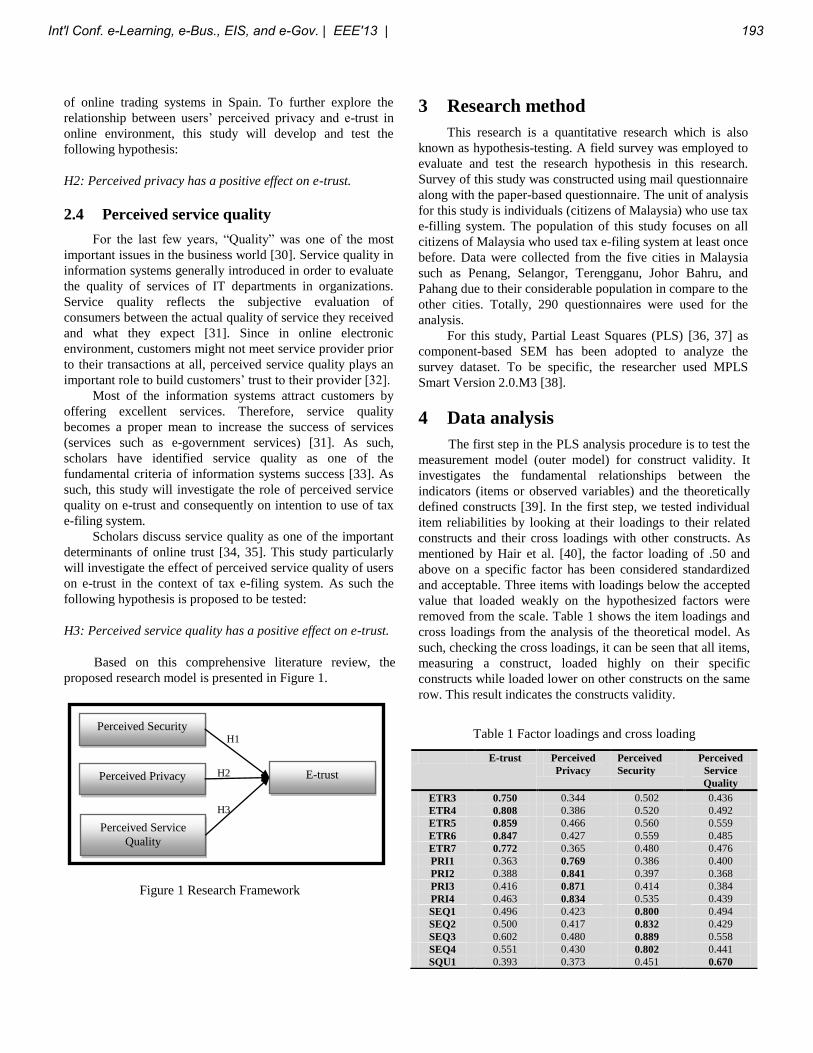
of online trading systems in Spain. To further explore the
relationship between users’ perceived privacy and e-trust in
online environment, this study will develop and test the
following hypothesis:
H2: Perceived privacy has a positive effect on e-trust.
2.4 Perceived service quality
For the last few years, “Quality” was one of the most
important issues in the business world [30]. Service quality in
information systems generally introduced in order to evaluate
the quality of services of IT departments in organizations.
Service quality reflects the subjective evaluation of
consumers between the actual quality of service they received
and what they expect [31]. Since in online electronic
environment, customers might not meet service provider prior
to their transactions at all, perceived service quality plays an
important role to build customers’ trust to their provider [32].
Most of the information systems attract customers by
offering excellent services. Therefore, service quality
becomes a proper mean to increase the success of services
(services such as e-government services) [31]. As such,
scholars have identified service quality as one of the
fundamental criteria of information systems success [33]. As
such, this study will investigate the role of perceived service
quality on e-trust and consequently on intention to use of tax
e-filing system.
Scholars discuss service quality as one of the important
determinants of online trust [34, 35]. This study particularly
will investigate the effect of perceived service quality of users
on e-trust in the context of tax e-filing system. As such the
following hypothesis is proposed to be tested:
H3: Perceived service quality has a positive effect on e-trust.
Based on this comprehensive literature review, the
proposed research model is presented in Figure 1.
3 Research method
This research is a quantitative research which is also
known as hypothesis-testing. A field survey was employed to
evaluate and test the research hypothesis in this research.
Survey of this study was constructed using mail questionnaire
along with the paper-based questionnaire. The unit of analysis
for this study is individuals (citizens of Malaysia) who use tax
e-filling system. The population of this study focuses on all
citizens of Malaysia who used tax e-filing system at least once
before. Data were collected from the five cities in Malaysia
such as Penang, Selangor, Terengganu, Johor Bahru, and
Pahang due to their considerable population in compare to the
other cities. Totally, 290 questionnaires were used for the
analysis.
For this study, Partial Least Squares (PLS) [36, 37] as
component-based SEM has been adopted to analyze the
survey dataset. To be specific, the researcher used MPLS
Smart Version 2.0.M3 [38].
4 Data analysis
The first step in the PLS analysis procedure is to test the
measurement model (outer model) for construct validity. It
investigates the fundamental relationships between the
indicators (items or observed variables) and the theoretically
defined constructs [39]. In the first step, we tested individual
item reliabilities by looking at their loadings to their related
constructs and their cross loadings with other constructs. As
mentioned by Hair et al. [40], the factor loading of .50 and
above on a specific factor has been considered standardized
and acceptable. Three items with loadings below the accepted
value that loaded weakly on the hypothesized factors were
removed from the scale. Table 1 shows the item loadings and
cross loadings from the analysis of the theoretical model. As
such, checking the cross loadings, it can be seen that all items,
measuring a construct, loaded highly on their specific
constructs while loaded lower on other constructs on the same
row. This result indicates the constructs validity.
Table 1 Factor loadings and cross loading
E-trust Perceived
Privacy
Perceived
Security
Perceived
Service
Quality
ETR3 0.750 0.344 0.502 0.436
ETR4 0.808 0.386 0.520 0.492
ETR5 0.859 0.466 0.560 0.559
ETR6 0.847 0.427 0.559 0.485
ETR7 0.772 0.365 0.480 0.476
PRI1 0.363 0.769 0.386 0.400
PRI2 0.388 0.841 0.397 0.368
PRI3 0.416 0.871 0.414 0.384
PRI4 0.463 0.834 0.535 0.439
SEQ1 0.496 0.423 0.800 0.494
SEQ2 0.500 0.417 0.832 0.429
SEQ3 0.602 0.480 0.889 0.558
SEQ4 0.551 0.430 0.802 0.441
SQU1 0.393 0.373 0.451 0.670
Perceived Security
Perceived Privacy
Perceived Service
Quality
E-trust
H1
H2
H3
Figure 1 Research Framework
Int'l Conf. e-Learning, e-Bus., EIS, and e-Gov. | EEE'13 | 193
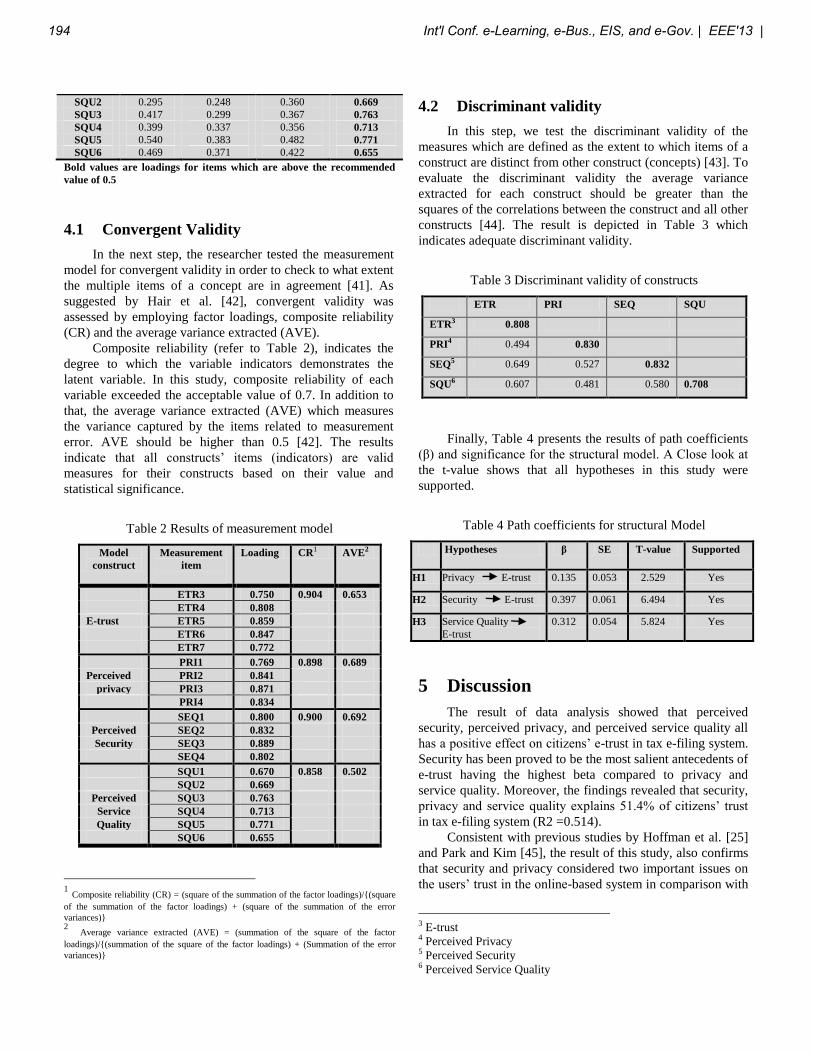
SQU2 0.295 0.248 0.360 0.669
SQU3 0.417 0.299 0.367 0.763
SQU4 0.399 0.337 0.356 0.713
SQU5 0.540 0.383 0.482 0.771
SQU6 0.469 0.371 0.422 0.655
Bold values are loadings for items which are above the recommended
value of 0.5
4.1 Convergent Validity
In the next step, the researcher tested the measurement
model for convergent validity in order to check to what extent
the multiple items of a concept are in agreement [41]. As
suggested by Hair et al. [42], convergent validity was
assessed by employing factor loadings, composite reliability
(CR) and the average variance extracted (AVE).
Composite reliability (refer to Table 2), indicates the
degree to which the variable indicators demonstrates the
latent variable. In this study, composite reliability of each
variable exceeded the acceptable value of 0.7. In addition to
that, the average variance extracted (AVE) which measures
the variance captured by the items related to measurement
error. AVE should be higher than 0.5 [42]. The results
indicate that all constructs’ items (indicators) are valid
measures for their constructs based on their value and
statistical significance.
Table 2 Results of measurement model
Model
construct
Measurement
item
Loading CR1 AVE2
ETR3 0.750 0.904 0.653
ETR4 0.808
E-trust ETR5 0.859
ETR6 0.847
ETR7 0.772
PRI1 0.769 0.898 0.689
Perceived PRI2 0.841
privacy PRI3 0.871
PRI4 0.834
SEQ1 0.800 0.900 0.692
Perceived SEQ2 0.832
Security SEQ3 0.889
SEQ4 0.802
SQU1 0.670 0.858 0.502
SQU2 0.669
Perceived SQU3 0.763
Service SQU4 0.713
Quality SQU5 0.771
SQU6 0.655
1 Composite reliability (CR) = (square of the summation of the factor loadings)/{(square
of the summation of the factor loadings) + (square of the summation of the error
variances)}
2 Average variance extracted (AVE) = (summation of the square of the factor
loadings)/{(summation of the square of the factor loadings) + (Summation of the error
variances)}
4.2 Discriminant validity
In this step, we test the discriminant validity of the
measures which are defined as the extent to which items of a
construct are distinct from other construct (concepts) [43]. To
evaluate the discriminant validity the average variance
extracted for each construct should be greater than the
squares of the correlations between the construct and all other
constructs [44]. The result is depicted in Table 3 which
indicates adequate discriminant validity.
Table 3 Discriminant validity of constructs
ETR PRI SEQ SQU
ETR3 0.808
PRI4 0.494 0.830
SEQ5 0.649 0.527 0.832
SQU6 0.607 0.481 0.580 0.708
Finally, Table 4 presents the results of path coefficients
(β) and significance for the structural model. A Close look at
the t-value shows that all hypotheses in this study were
supported.
Table 4 Path coefficients for structural Model
Hypotheses β SE T-value Supported
H1 Privacy E-trust 0.135 0.053 2.529 Yes
H2 Security E-trust 0.397 0.061 6.494 Yes
H3 Service Quality
E-trust
0.312 0.054 5.824 Yes
5 Discussion
The result of data analysis showed that perceived
security, perceived privacy, and perceived service quality all
has a positive effect on citizens’ e-trust in tax e-filing system.
Security has been proved to be the most salient antecedents of
e-trust having the highest beta compared to privacy and
service quality. Moreover, the findings revealed that security,
privacy and service quality explains 51.4% of citizens’ trust
in tax e-filing system (R2 =0.514).
Consistent with previous studies by Hoffman et al. [25]
and Park and Kim [45], the result of this study, also confirms
that security and privacy considered two important issues on
the users’ trust in the online-based system in comparison with
3 E-trust 4 Perceived Privacy 5 Perceived Security 6 Perceived Service Quality
194 Int'l Conf. e-Learning, e-Bus., EIS, and e-Gov. | EEE'13 |
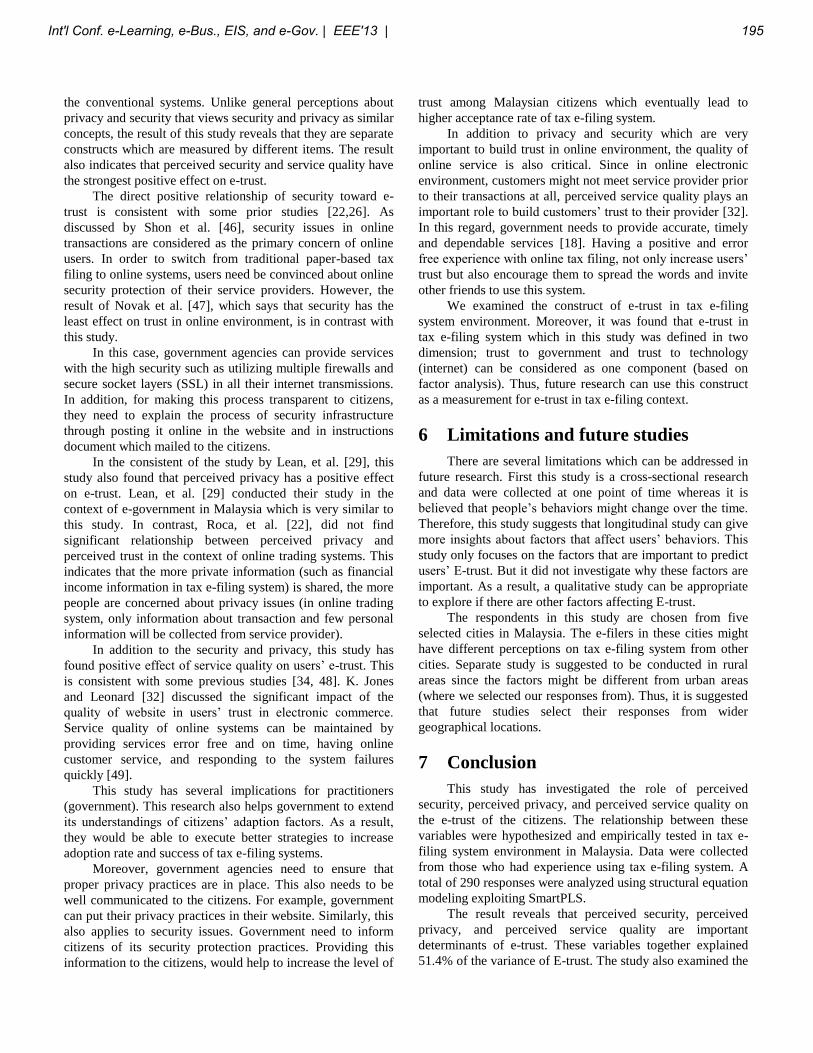
the conventional systems. Unlike general perceptions about
privacy and security that views security and privacy as similar
concepts, the result of this study reveals that they are separate
constructs which are measured by different items. The result
also indicates that perceived security and service quality have
the strongest positive effect on e-trust.
The direct positive relationship of security toward e-
trust is consistent with some prior studies [22,26]. As
discussed by Shon et al. [46], security issues in online
transactions are considered as the primary concern of online
users. In order to switch from traditional paper-based tax
filing to online systems, users need be convinced about online
security protection of their service providers. However, the
result of Novak et al. [47], which says that security has the
least effect on trust in online environment, is in contrast with
this study.
In this case, government agencies can provide services
with the high security such as utilizing multiple firewalls and
secure socket layers (SSL) in all their internet transmissions.
In addition, for making this process transparent to citizens,
they need to explain the process of security infrastructure
through posting it online in the website and in instructions
document which mailed to the citizens.
In the consistent of the study by Lean, et al. [29], this
study also found that perceived privacy has a positive effect
on e-trust. Lean, et al. [29] conducted their study in the
context of e-government in Malaysia which is very similar to
this study. In contrast, Roca, et al. [22], did not find
significant relationship between perceived privacy and
perceived trust in the context of online trading systems. This
indicates that the more private information (such as financial
income information in tax e-filing system) is shared, the more
people are concerned about privacy issues (in online trading
system, only information about transaction and few personal
information will be collected from service provider).
In addition to the security and privacy, this study has
found positive effect of service quality on users’ e-trust. This
is consistent with some previous studies [34, 48]. K. Jones
and Leonard [32] discussed the significant impact of the
quality of website in users’ trust in electronic commerce.
Service quality of online systems can be maintained by
providing services error free and on time, having online
customer service, and responding to the system failures
quickly [49].
This study has several implications for practitioners
(government). This research also helps government to extend
its understandings of citizens’ adaption factors. As a result,
they would be able to execute better strategies to increase
adoption rate and success of tax e-filing systems.
Moreover, government agencies need to ensure that
proper privacy practices are in place. This also needs to be
well communicated to the citizens. For example, government
can put their privacy practices in their website. Similarly, this
also applies to security issues. Government need to inform
citizens of its security protection practices. Providing this
information to the citizens, would help to increase the level of
trust among Malaysian citizens which eventually lead to
higher acceptance rate of tax e-filing system.
In addition to privacy and security which are very
important to build trust in online environment, the quality of
online service is also critical. Since in online electronic
environment, customers might not meet service provider prior
to their transactions at all, perceived service quality plays an
important role to build customers’ trust to their provider [32].
In this regard, government needs to provide accurate, timely
and dependable services [18]. Having a positive and error
free experience with online tax filing, not only increase users’
trust but also encourage them to spread the words and invite
other friends to use this system.
We examined the construct of e-trust in tax e-filing
system environment. Moreover, it was found that e-trust in
tax e-filing system which in this study was defined in two
dimension; trust to government and trust to technology
(internet) can be considered as one component (based on
factor analysis). Thus, future research can use this construct
as a measurement for e-trust in tax e-filing context.
6 Limitations and future studies
There are several limitations which can be addressed in
future research. First this study is a cross-sectional research
and data were collected at one point of time whereas it is
believed that people’s behaviors might change over the time.
Therefore, this study suggests that longitudinal study can give
more insights about factors that affect users’ behaviors. This
study only focuses on the factors that are important to predict
users’ E-trust. But it did not investigate why these factors are
important. As a result, a qualitative study can be appropriate
to explore if there are other factors affecting E-trust.
The respondents in this study are chosen from five
selected cities in Malaysia. The e-filers in these cities might
have different perceptions on tax e-filing system from other
cities. Separate study is suggested to be conducted in rural
areas since the factors might be different from urban areas
(where we selected our responses from). Thus, it is suggested
that future studies select their responses from wider
geographical locations.
7 Conclusion
This study has investigated the role of perceived
security, perceived privacy, and perceived service quality on
the e-trust of the citizens. The relationship between these
variables were hypothesized and empirically tested in tax e-
filing system environment in Malaysia. Data were collected
from those who had experience using tax e-filing system. A
total of 290 responses were analyzed using structural equation
modeling exploiting SmartPLS.
The result reveals that perceived security, perceived
privacy, and perceived service quality are important
determinants of e-trust. These variables together explained
51.4% of the variance of E-trust. The study also examined the
Int'l Conf. e-Learning, e-Bus., EIS, and e-Gov. | EEE'13 | 195
role of antecedent variables in predicting e-trust of online
taxpayers. It is also found that e-trust in tax e-filing system
context is unidimensional (unlike what previous studies
found). Moreover, we have found out that security and
privacy are two different concepts in tax e-filing environment.
Finally, understanding these factors would help government
to adopt proper strategies which eventually increase the
acceptance of tax e-filing system.
8 References
[1] Teo, Srivastava, and Jiang, Trust and electronic
government success: an empirical study. Journal of
Management Information Systems, 2008. 25(3): p. 99-
132.
[2] Sahu, G.P. and M. Gupta, Users' acceptance of e-
government: A study of Indian Central Excise. 2008.
[3] Berdykhanova, D., A. Dehghantanha, and K. Hariraj.
Trust challenges and issues of e-government: E-tax
prospective. in Information Technology (ITSim), 2010
International Symposium in. 2010.
[4] Loo, C. (2012, Dec 20), E-filing of 2011 tax returns
ends on Dec 31, in thesundaily. Retreived from
http://www.thesundaily.my/news/5659747.
[5] Azmi, A.C. and N.L. Bee, The Acceptance of the e-
Filing System by Malaysian Taxpayers: A Simplified
Model. Electronic Journal of e-Government, 2010. 8(1):
p. 13-22.
[6] Bernama. IRB Notes 30 Per Cent Increase In E-Filing.
2009 [cited 2011 31 May]; Available from:
http://www.bernama.com/bernama//v3/news_lite.php?id
=408209.
[7] Nations, U., United Nations E-Government Survey 2012.
2012, Department of Economic and Social Affairs: New
york.
[8] Fatimah bt Alwi and L.M. Ling. Embracing Electronic
Tax Filing: Survey Evidence from Members of
Malaysian Institute of Taxation. in International
Accounting and Business Conference 2008. 2008. Johor:
Faculty of Business Management and Faculty of
Accountancy, UiTM Johor.
[9] Lai, M.L. and K.F. Choong, Motivators, Barriers and
Concerns in Adoption of Electronic Filing System:
Survey Evidence from Malaysian Professional
Accountants. American Journal of Applied Sciences,
2010. 7(4): p. 562-567.
[10] Mayer, R.C., J.H. Davis, and F.D. Schoorman, An
integrative model of organizational trust. The Academy
of Management Review, 1995. 20(3): p. 709-734.
[11] Pavlou, P.A., Consumer acceptance of electronic
commerce: Integrating trust and risk with the
technology acceptance model. International Journal of
Electronic Commerce, 2003. 7(3): p. 101-134.
[12] Hsu, L.C. and C.H. Wang, A study of e-trust in online
auctions. Journal of Electronic Commerce Research,
2008. 9(4): p. 310-321.
[13] Kim, D. and I. Benbasat, Trust-related arguments in
Internet stores: A framework for evaluation. Journal of
Electronic Commerce Research, 2003. 4(2): p. 49-64.
[14] Belanger, F., J.S. Hiller, and W.J. Smith,
Trustworthiness in electronic commerce: the role of
privacy, security, and site attributes. The Journal of
Strategic Information Systems, 2002. 11(3): p. 245-270.
[15] Srivastava, S.C. and T. Teo. Citizen trust development
for e-government adoption: Case of Singapore. in
Pacific Asia Conference on Information Systems
(PACIS). 2005: AIS Electronic Library (AISeL).
[16] Yousafzai, S.Y., J.G. Pallister, and G.R. Foxall, A
proposed model of e-trust for electronic banking.
Technovation, 2003. 23(11): p. 847-860.
[17] Gefen, D., E-commerce: the role of familiarity and trust.
The International Journal of Management Science 2000.
28: p. 725-737.
[18] Carter, L. and F. Bélanger, The utilization of e
government services: citizen trust, innovation and
acceptance factors*. Information Systems Journal, 2005.
15(1): p. 5-25.
[19] Felix B. Tan and P. Sutherland, Online Consumer Trust:
A Multi-Dimensional Model. Journal of Electronic
Commerce in Organizations, 2004. 2(3).
[20] McKnight, D.H., V. Choudhury, and C. Kacmar,
Developing and validating trust measures for e-
commerce: An integrative typology. Information systems
research, 2003. 13(3): p. 334-359.
[21] Mukherjee, A. and P. Nath, Role of electronic trust in
online retailing: a re-examination of the commitment-
trust theory. European Journal of Marketing, 2007.
41(9/10): p. 1173-1202.
[22] Roca, J.C., J.J. García, and J.J. de la Vega, The
importance of perceived trust, security and privacy in
online trading systems. Information Management &
Computer Security, 2009. 17(2): p. 96-113.
[23] Jarvenpaa, S.L., N. Tractinsky, and L. Saarinen,
Consumer Trust in an Internet Store: A Cross-Cultural
Validation. Journal of Computer-Mediated
Communication, 1999. 5(2).
[24] McLeod, A. and S.E. Pippin. Security and Privacy Trust
in E-Government: Understanding System and
Relationship Trust Antecedents. in 42nd Hawaii
International Conference on System Sciences. 2009.
Hawaii: IEEE.
[25] Hoffman, D.L., T.P. Novak, and M. Peralta, Building
consumer trust online. Communications of the ACM,
1999. 42(4): p. 80-85.
[26] Casaló, L.V., C. Flavián, and M. Guinalíu, The role of
security, privacy, usability and reputation in the
development of online banking. Online Information
Review, 2007. 31(5): p. 583-603.
[27] Yakov Bart, V.S., Fareena Sultan, & Glen L. Urban, Are
the drivers and role of online trust the same for all web
sites and consumers? A large-scale exploratory
196 Int'l Conf. e-Learning, e-Bus., EIS, and e-Gov. | EEE'13 |
empirical study. Journal of Marketing, 2005. 69: p. 133-
152.
[28] Poon, W.C., Users' adoption of e-banking services: the
Malaysian perspective. Journal of Business & Industrial
Marketing, 2007. 23(1): p. 59-69.
[29] Lean, O.K., et al., Factors influencing intention to use e-
government services among citizens in Malaysia.
International Journal of Information Management, 2009.
29(6): p. 458-475.
[30] Chang, I., An empirical study on the impact of quality
antecedents on tax payers' acceptance of Internet tax-
filing systems. Government Information Quarterly, 2005.
22(3): p. 389-410.
[31] Pitt, L.F., R.T. Watson, and C.B. Kavan, Service
quality: a measure of information systems effectiveness.
MIS quarterly, 1995. 19(2): p. 173-187.
[32] Jones, K. and L.N.K. Leonard, Trust in consumer-to-
consumer electronic commerce. Information &
Management, 2008. 45(2): p. 88-95.
[33] Rai, A., S.S. Lang, and R.B. Welker, Assessing the
validity of IS success models: An empirical test and
theoretical analysis. Information systems research, 2002.
13(1): p. 50.
[34] Chee-Wee, T., I. Benbasat, and R.T. Cenfetelli. Building
citizen trust towards e-government services: do high
quality websites matter? in Hawaii International
Conference on System Sciences, Proceedings of the 41st
Annual. 2008: IEEE.
[35] Islam, M.D.A., et al., Factors affecting user satisfaction
in the Malaysian income tax e-filing system. African
Journal of Business Management, 2012. 6(21): p. 6447-
6455.
[36] Wold, H., Causal flows with latent variables: partings
of the ways in the light of NIPALS modelling. European
Economic Review, 1974. 5(1): p. 67-86.
[37] Wold, H., Systems analysis by partial least squares.
Measuring the unmeasurable, 1985: p. 221-252.
[38] Ringle, C.M., S. Wende, and A. Will, SmartPLS 2.0 M3.
University of Hamburg, 2005.
[39] Lim, K., et al., Do I Trust You Online, and If So, Will I
Buy? An Empirical Study of Two Trust-Building
Strategies. J. Manage. Inf. Syst., 2006. 23(2): p. 233-
266.
[40] Jarvenpaa, S.L., N. Tractinsky, and M. Vitale, Consumer
trust in an Internet store. Inf. Technol. and
Management, 2000. 1(1-2): p. 45-71.
[41] Schurr, P.H. and J.L. Ozanne, Influences on exchange
processes: Buyers' preconceptions of a seller's
trustworthiness and bargaining toughness. Journal of
Consumer Research, 1985: p. 939-953.
[42] Hair, J.F. and R.E. Anderson, Multivariate data
analysis. 2010: Prentice Hall.
[43] Ramayah, T., J.W.C. Lee, and J.B.C. In, Network
collaboration and performance in the tourism sector.
Service Business, 2011: p. 1-18.
[44] Fornell, C. and D.F. Larcker, Evaluating structural
equation models with unobservable variables and
measurement error. Journal of Marketing Research,
1981: p. 39-50.
[45] Park, C.H. and Y.G. Kim, Identifying key factors
affecting consumer purchase behavior in an online
shopping context. International Journal of Retail &
Distribution Management, 2003. 31(1): p. 16-29.
[46] Shon, Z.-Y., F.-Y. Chen, and Y.-H. Chang, Airline e-
commerce: the revolution in ticketing channels. Journal
of Air Transport Management, 2003. 9(5): p. 325-331.
[47] Novak, T.P., D.L. Hoffman, and Y.F. Yung, Measuring
the customer experience in online environments: A
structural modeling approach. Marketing Science, 2000.
19(1): p. 22-42.
[48] MD. Aminul Islam, D.H.M.Y., Wan Sallha Yusoff and
Atikah Nor Binti Johari, Factors affecting user
satisfaction in the Malaysian income tax e-filing system.
African Journal of Business Management, 2012. 6(21):
p. 6447-6455.
[49] Parasuraman, A., V.A. Zeithaml, and A. Malhotra, ES-
QUAL: a multiple-item scale for assessing electronic
service quality. Journal of Service Research, 2005. 7(3):
p. 213-233.
Int'l Conf. e-Learning, e-Bus., EIS, and e-Gov. | EEE'13 | 197
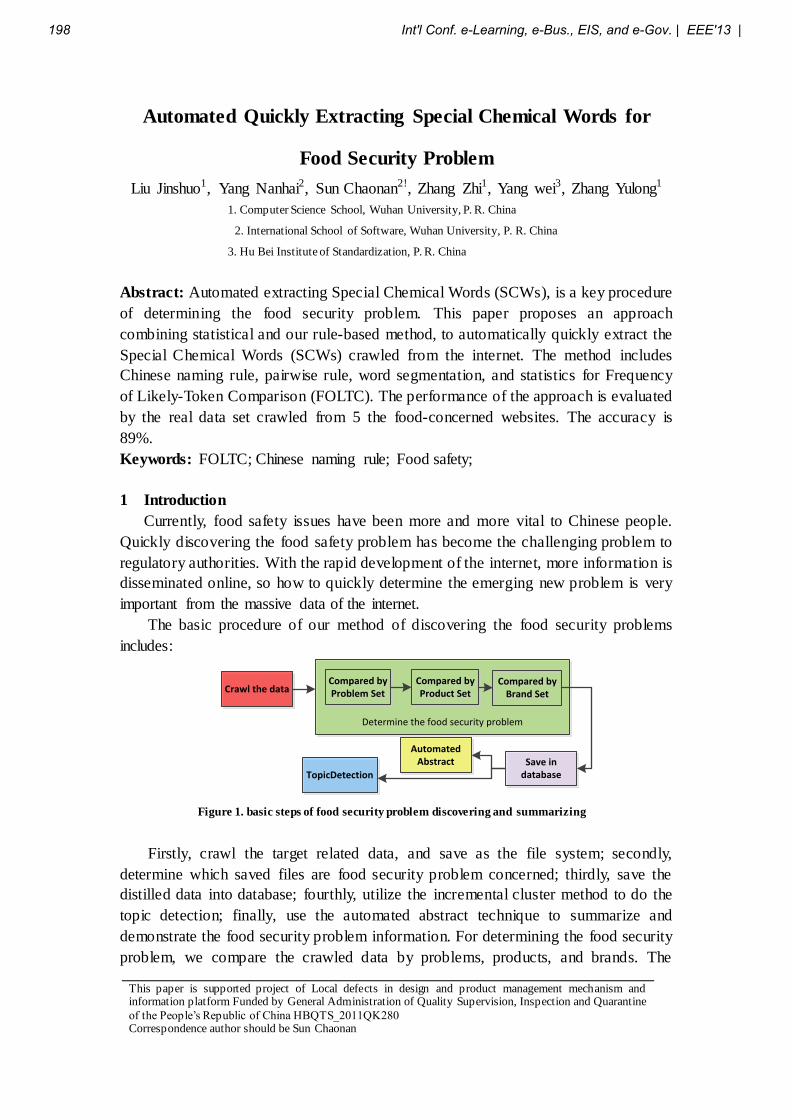
Automated Quickly Extracting Special Chemical Words for
Food Security Problem
Liu Jinshuo1, Yang Nanhai2, Sun Chaonan2!, Zhang Zhi1, Yang wei3, Zhang Yulong1
1. Computer Science School, Wuhan University, P. R. China
2. International School of Software, Wuhan University, P. R. China
3. Hu Bei Institute of Standardization, P. R. China
Abstract: Automated extracting Special Chemical Words (SCWs), is a key procedure
of determining the food security problem. This paper proposes an approach
combining statistical and our rule-based method, to automatically quickly extract the
Special Chemical Words (SCWs) crawled from the internet. The method includes
Chinese naming rule, pairwise rule, word segmentation, and statistics for Frequency
of Likely-Token Comparison (FOLTC). The performance of the approach is evaluated
by the real data set crawled from 5 the food-concerned websites. The accuracy is
89%.
Keywords: FOLTC; Chinese naming rule; Food safety;
1 Introduction
Currently, food safety issues have been more and more vital to Chinese people.
Quickly discovering the food safety problem has become the challenging problem to
regulatory authorities. With the rapid development of the internet, more information is
disseminated online, so how to quickly determine the emerging new problem is very
important from the massive data of the internet.
The basic procedure of our method of discovering the food security problems
includes:
Determine the food security problem
Crawl the dataCompared by Problem Set
Compared by Problem Set
Compared by Product Set
Compared by Product Set
Compared by Brand Set
Compared by Brand Set
Save in databaseTopicDetection
AutomatedAbstract
Figure 1. basic steps of food security problem discovering and summarizing
Firstly, crawl the target related data, and save as the file system; secondly,
determine which saved files are food security problem concerned; thirdly, save the
distilled data into database; fourthly, utilize the incremental cluster method to do the
topic detection; finally, use the automated abstract technique to summarize and
demonstrate the food security problem information. For determining the food security
problem, we compare the crawled data by problems, products, and brands. The
This paper is supported project of Local defects in design and product management mechanism and information platform Funded by General Administration of Quality Supervision, Inspection and Quarantine
of the People’s Republic of China HBQTS_2011QK280 Correspondence author should be Sun Chaonan
198 Int'l Conf. e-Learning, e-Bus., EIS, and e-Gov. | EEE'13 |
problems are partially manually collected and partially automated extracted by our
model. Automated quickly extracting SCWs are one part of expanding the problem
dataset. But in general, SCWs are very hard to automatically quickly and correctly
distill, as proper nouns include Chinese person names, place names and brand names
etc.
At present, the United States, India, Japan and most of the advanced Europe
countries have already done quantities of related researches aimed at Named Entity
Recognition. MuktaMajumder[1], proposed a novel technique using the feature set and
active learning to train the conditional random filed model, then corrected the low
confident annotations by human supervision. The selected candidate features include
word feature, affix feature, capitalization information, numerical feature and
parts-of-speech information. Prof Jianhan Zhu[2], Victoria Uren and Enrico Motta
presented a adapting method, developed a browser plug- in called ESpotter, which
recognizes entities of various types on Web pages and highlights them. The plug- in
can addresses the problem of certain domains by self-adapting lexicon and patterns to
these domains. The Japanese expert TomoyaIwakura[3] used NE-related labels of
words repeatedly from unlabeled data. It used the method’s priority NEs—IREX to do
the experiment. Recently, the domestic researches about Named-Entity extraction
come to a booming period. Ying Chen[4] developed a robust web personal name
information extraction system. Its main task is clustering and then extracting the
attributions of the focus web person. Lin and Mei[5] applied their theory of
Named-Entity extraction in TaoBao, based in the supervised method of product name
entity recognition, the conditional random filed model, hidden markov model and
maximum entropy mode have been utilized separately, and successfully recognized
the proper name of products.
Previous approaches either built a name entity database, or only used static
information from the published word segmentation. We built up the unsafe problems
database with 2182 names. After matching real texts against this database, we found
out that this approach cannot achieve a plausible result because of the following two
reasons: (1) Current Chinese word segmentation system, is unable to update its
database in time which leads to inappropriate segmentation. For example, “苯并芘”
which English name is ‘benzopyrene’ , is splited into “苯”, “并”, and “芘” , when
processed by word segmentation. This case has nothing to do with food safety. (2)
The existing created problems databases need to be updated continuously as new
things come out at any time on the Internet. As updating database demands a great
deal of work, it will be unrealistic if operated manually.
Our method of automated extract the SCWs includes: ① . The problems
database is built up based on the official food safety website. ②. Analyze the SCWs
among the training set, then obtain the probability. ③. Construct a rule base, which
contains the rules based on Chinese naming rule. ④. Select the candidates based
upon the probability estimation token. ⑤. Confirm the candidates by applying
Chinese naming rules. The system is tested on a real news corpus. The recall and
precision are 11% and 91% respectively.
The structure of this paper: part 1 introduce the FOLTC; part 2 is the theoretical
Int'l Conf. e-Learning, e-Bus., EIS, and e-Gov. | EEE'13 | 199
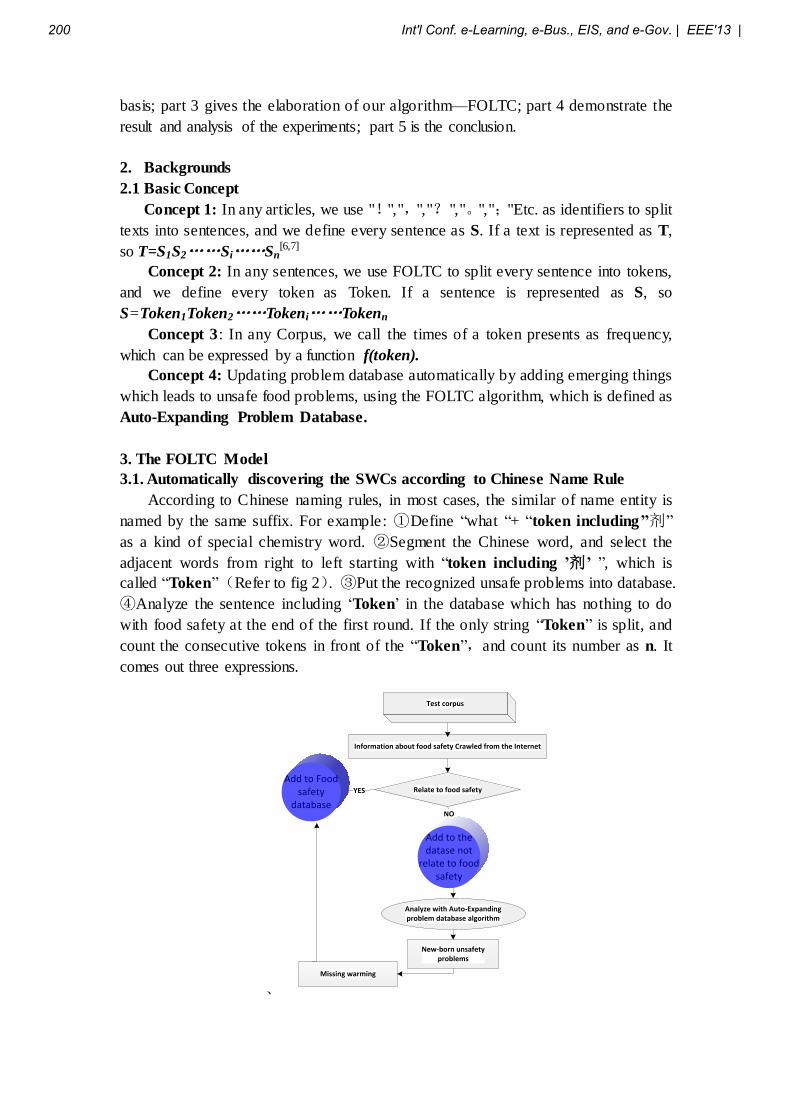
basis; part 3 gives the elaboration of our algorithm—FOLTC; part 4 demonstrate the
result and analysis of the experiments; part 5 is the conclusion.
2. Backgrounds
2.1 Basic Concept
Concept 1: In any articles, we use "!",",","?","。",";"Etc. as identifiers to split
texts into sentences, and we define every sentence as S. If a text is represented as T,
so T=S1S2……Si……Sn[6,7]
Concept 2: In any sentences, we use FOLTC to split every sentence into tokens,
and we define every token as Token. If a sentence is represented as S, so
S=Token1Token2……Tokeni……Tokenn
Concept 3: In any Corpus, we call the times of a token presents as frequency,
which can be expressed by a function f(token).
Concept 4: Updating problem database automatically by adding emerging things
which leads to unsafe food problems, using the FOLTC algorithm, which is defined as
Auto-Expanding Problem Database.
3. The FOLTC Model
3.1. Automatically discovering the SWCs according to Chinese Name Rule
According to Chinese naming rules, in most cases, the similar of name entity is
named by the same suffix. For example: ①Define “what “+ “token including’’剂”
as a kind of special chemistry word. ②Segment the Chinese word, and select the
adjacent words from right to left starting with “token including ’剂’ ”, which is
called “Token” (Refer to fig 2). ③Put the recognized unsafe problems into database.
④Analyze the sentence including ‘Token’ in the database which has nothing to do
with food safety at the end of the first round. If the only string “Token” is split, and
count the consecutive tokens in front of the “Token”,and count its number as n. It
comes out three expressions.
、
Add to the datase not
relate to food safety
Information about food safety Crawled from the Internet
Test corpus
Relate to food safetyYES
NO
New-born unsafety problems
Missing warming
Analyze with Auto-Expanding problem database algorithm
Add to Food safety
database
200 Int'l Conf. e-Learning, e-Bus., EIS, and e-Gov. | EEE'13 |
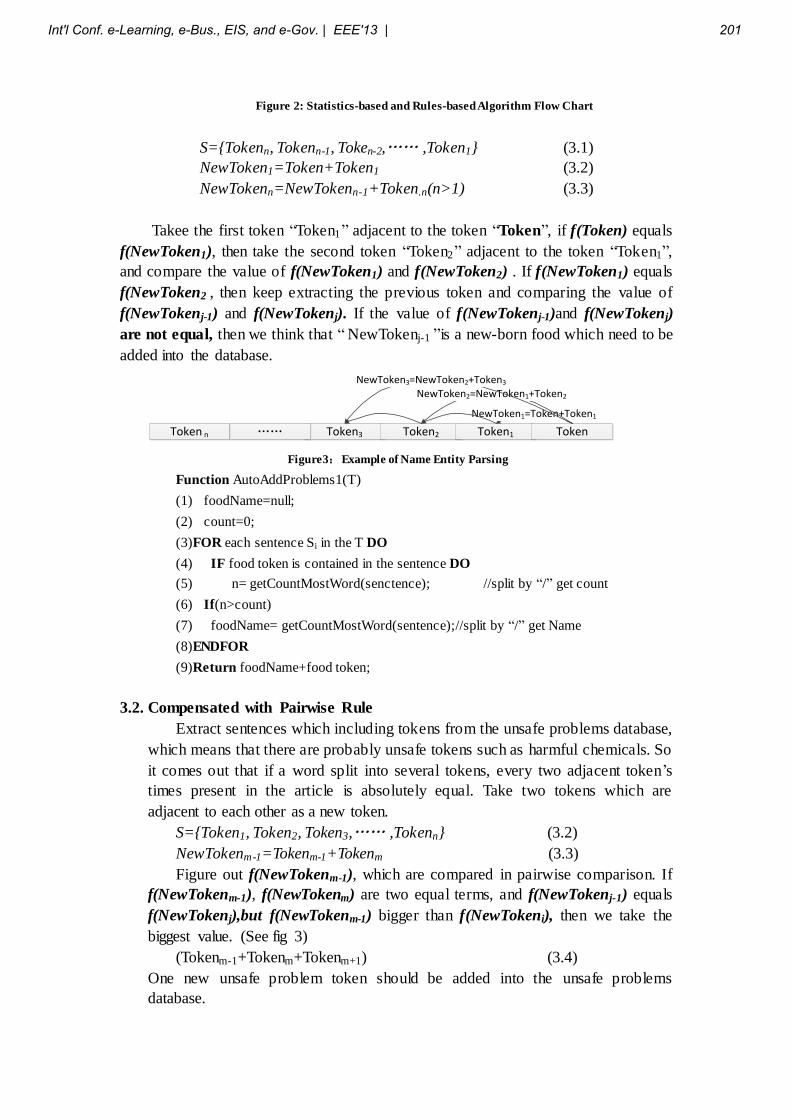
Figure 2: Statistics-based and Rules-based Algorithm Flow Chart
S={Tokenn, Tokenn-1, Token-2,…… ,Token1} (3.1)
NewToken1=Token+Token1 (3.2)
NewTokenn=NewTokenn-1+Token.n(n>1) (3.3)
Takee the first token “Token1” adjacent to the token “Token”, if f(Token) equals
f(NewToken1), then take the second token “Token2” adjacent to the token “Token1”,
and compare the value of f(NewToken1) and f(NewToken2) . If f(NewToken1) equals
f(NewToken2 , then keep extracting the previous token and comparing the value of
f(NewTokenj-1) and f(NewTokenj). If the value of f(NewTokenj-1)and f(NewTokenj)
are not equal, then we think that “ NewTokenj-1 ”is a new-born food which need to be
added into the database.
Token3 Token2 Token1 Token ……Token n
NewToken1=Token+Token1
NewToken2=NewToken1+Token2
NewToken3=NewToken2+Token3
Figure3:Example of Name Entity Parsing
Function AutoAddProblems1(T)
(1) foodName=null;
(2) count=0;
(3)FOR each sentence Si in the T DO
(4) IF food token is contained in the sentence DO
(5) n= getCountMostWord(senctence); //split by “/” get count
(6) If(n>count)
(7) foodName= getCountMostWord(sentence);//split by “/” get Name
(8)ENDFOR
(9)Return foodName+food token;
3.2. Compensated with Pairwise Rule
Extract sentences which including tokens from the unsafe problems database,
which means that there are probably unsafe tokens such as harmful chemicals. So
it comes out that if a word split into several tokens, every two adjacent token’s
times present in the article is absolutely equal. Take two tokens which are
adjacent to each other as a new token.
S={Token1, Token2, Token3,…… ,Tokenn} (3.2)
NewTokenm-1=Tokenm-1+Tokenm (3.3)
Figure out f(NewTokenm-1), which are compared in pairwise comparison. If
f(NewTokenm-1), f(NewTokenm) are two equal terms, and f(NewTokenj-1) equals
f(NewTokenj),but f(NewTokenm-1) bigger than f(NewTokeni), then we take the
biggest value. (See fig 3)
(Tokenm-1+Tokenm+Tokenm+1) (3.4)
One new unsafe problem token should be added into the unsafe problems
database.
Int'l Conf. e-Learning, e-Bus., EIS, and e-Gov. | EEE'13 | 201
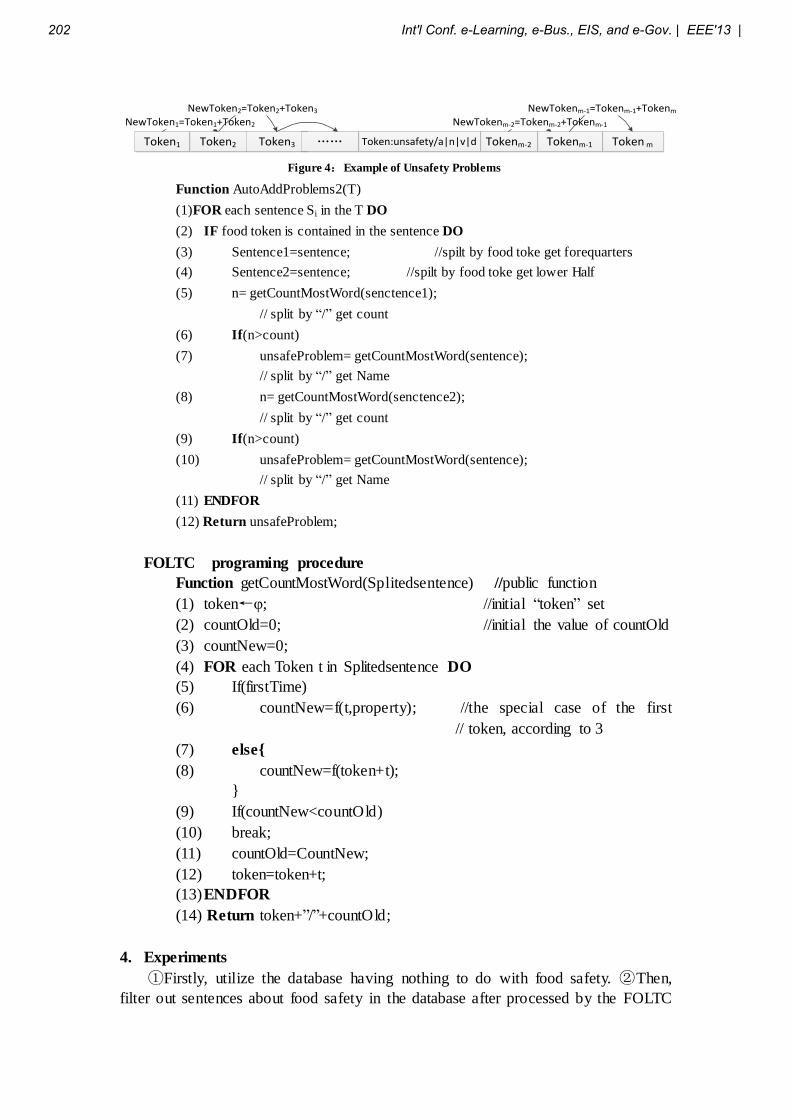
Token mTokenm-1Tokenm-2Token:unsafety/a|n|v|dToken2Token1 Token3 ……
NewToken1=Token1+Token2
NewToken2=Token2+Token3
NewTokenm-2=Tokenm-2+Tokenm-1
NewTokenm-1=Tokenm-1+Tokenm
Figure 4:Example of Unsafety Problems
Function AutoAddProblems2(T)
(1)FOR each sentence Si in the T DO
(2) IF food token is contained in the sentence DO
(3) Sentence1=sentence; //spilt by food toke get forequarters
(4) Sentence2=sentence; //spilt by food toke get lower Half
(5) n= getCountMostWord(senctence1);
// split by “/” get count
(6) If(n>count)
(7) unsafeProblem= getCountMostWord(sentence);
// split by “/” get Name
(8) n= getCountMostWord(senctence2);
// split by “/” get count
(9) If(n>count)
(10) unsafeProblem= getCountMostWord(sentence);
// split by “/” get Name
(11) ENDFOR
(12) Return unsafeProblem;
FOLTC programing procedure
Function getCountMostWord(Splitedsentence) //public function
(1) token←φ; //initial “token” set
(2) countOld=0; //initial the value of countOld
(3) countNew=0;
(4) FOR each Token t in Splitedsentence DO
(5) If(firstTime)
(6) countNew=f(t,property); //the special case of the first
// token, according to 3
(7) else{
(8) countNew=f(token+t);
}
(9) If(countNew<countOld)
(10) break;
(11) countOld=CountNew;
(12) token=token+t;
(13) ENDFOR
(14) Return token+”/”+countOld;
4. Experiments
①Firstly, utilize the database having nothing to do with food safety. ②Then,
filter out sentences about food safety in the database after processed by the FOLTC
202 Int'l Conf. e-Learning, e-Bus., EIS, and e-Gov. | EEE'13 |

which proves the missing warning. ③Count the number of the sentences of database
concerned with food safety. ④Figure out the Remedial rate. Remedial rate is the core
parameter of the FOLTC’s function. The lager the value of the Remedial rate, the
more efficient the FOLTC is.
The following is an example of automatic recognition of unsafe problems token:
· Original text: 被检验出致癌物质苯并芘。
· Segmented text: 被(Token1)/ 检验(Token2)/ 出(Token3)/ 致癌(Token4)/ 物
质(Token5)/ 苯(Token6)/ 并(Token8)/ 芘(Token9)
· New combined token:被检验 (NewToken1)/检验出(NewToken2)/物质苯
(NewToken3)/苯并(NewToken4)/并芘(NewToken5)
Table 3: Automatic Recognition of Unsafe Problems Token in Real News
Unsafe problems
token(Token)
Frequency of the NewToken1
Frequency of the NewToken2
Frequency of the NewToken3
Frequency of the NewToken4
Frequency of the NewToken5
致癌 1 1 2 6 6
Because the value of f(NewToken4) equals f(NewToken5), as described in the
3.2 .so we can figure out that (Token4+ Token5 +Token6) which is namely “苯并芘” in
this example, is new unsafe problem which should be added into Unsafe Problem
database.
The testing corpus consists of the articles are crawled from the official food
safety websites: http://www.xinhuanet.com/food/, http://www.cfqn.com.cn/,
http://shipin.people.com.cn/, http://pc.39.net/sp/ (websites),
http://t.qq.com/zhangwuji9/ (twitter). After the corpus is tagged by initial recognition
module, 17436 food news, 789 brand names and 173 unsafe problems are recognized,
among which 718 brand names are correct, boundary-error are 12%, entirely incorrect
51, meanwhile there are 20 names cannot be recognized. Then, we apply the FOLTC
to process these unrecognized names, and 16 names are recognized. Finally, the recall
and precision obtained are 89%and 12% respectively.
Some errors cannot be overcome by the system. We ignore the special cases
because of the unfamiliar naming way. The proposed proposal is based on statistics.
We may take normal tokens as candidates, such as automatic recognition of unsafe
problems. We count two groups with same value, which one holds a new-born unsafe
problem, while the other does not. The latter case may lead to information redundancy
warning.
5. Conclusion
This paper introduces FOLTC’s application background, algorithm’s content, and
test analysis. The experimental results show that the combination of statistical and
rule-based techniques is effective and efficient in the automatic recognition of SCWs
for unsafe problems. As updating database manually demands a great deal of work
and is inefficient. In addition, imperfect statistics may cause low accuracy. So FOLTC
will win popularity. The FOLTC is not only oriented for SWCs of food safety test, but
also for auto field such as garment industry etc. According to special Chinese naming
Int'l Conf. e-Learning, e-Bus., EIS, and e-Gov. | EEE'13 | 203
rules, imperfect Chinese word segmentation, and continuously updated database,
FOLTC will be developed into any auto-update database. To increase the accuracy of
recognizing candidates and develop rules with word similarity will be our future
work.
6. References
[1] MuktaMajumder*, Utsav Barman, Rahul Prasad, Kumar Saurabh, Sujan Kumar
Saha.A Novel Technique for Name Identification from HomeopathyDiagnosis
Discussion Forum.2nd International Conference on Communication, Computing
& Security [ICCCS-2012]
[2] Jianhan Zhu, Victoria Uren, Enrico Motta.Espotter:adaptive named entity
recognition for web browing. Professional Knowledge Management :Lecture Notes in
Computer Science Volume 3782, 2005, pp 518-529
[3] TomoyaIwakura. A Named Entity Extraction Using Word Information Repeatedly
Collected from Unlabeled Data.Computational Linguistics and Intelligent Text Processing.
Lecture Notes in Computer Science Volume 6008, 2010, pp 212-223.
[4] Ying Chen, Sophia Yat Mei Lee, Chu-Ren Huang.A robust web personal name
information extraction system .Expert Systems with Applications Volume 39, Issue 3, 15
February 2012, Pages 2690–2699
[5] Feng Mei, Researches of product name entity recognition and normalization.
Master's thesis, Language technology processing center of Harbin Institute of
Technology, 2011.
[6] Weisong Zuo. Studies on Sentiment Analysis of Chapter Based on Rule and
Statistics. Computer Software and Theory College of Information and Engineering.
2010.5
[7] ZHU Yan-lan, MIN Jin, ZHOU Ya-qian, HUANG Xuan-jing,WU Li-de. Semantic
Orientation Computing Based on HowNet. Department of Computer Science and
Technology , Fudan University. 2005.5
204 Int'l Conf. e-Learning, e-Bus., EIS, and e-Gov. | EEE'13 |

SESSION
E-BUSINESS, E-COMMERCE, E-BANKING,ENTERPRISE INFORMATION SYSTEMS, AND
SECURITY
Chair(s)
TBA
Int'l Conf. e-Learning, e-Bus., EIS, and e-Gov. | EEE'13 | 205

206 Int'l Conf. e-Learning, e-Bus., EIS, and e-Gov. | EEE'13 |
Consumers’ knowledge acquisition through eWOM: from social networks to retailing
Eleonora Pantano Department of Mechanical, Energetics
and Management Engineering University of Calabria
Arcavacata di Rende (CS), Italy [email protected]
Piero Migliarese Department of Mechanical, Energetics
and Management Engineering University of Calabria
Arcavacata di Rende (CS), Italy [email protected]
Vincenzo Corvello Department of Mechanical, Energetics
and Management Engineering University of Calabria
Arcavacara di Rende (CS), Italy [email protected]
Abstract—Due to the large diffusion of social networks, these media offer a huge platform where users share judgements, comments and opinions that organization could exploit for achieving information on consumers’ preferences and market trends, with benefits for the development of more effective marketing strategies. In particular, this paper focuses on the use of Facebook among youth, with emphasis on consumers’ knowledge of social network as influencing factor on their interest towards others’ posts and on the use of the medium for directly interacting with the firms. Hence, this work aims at deeply understanding how this medium can be used for acquiring knowledge on clients emerging from both the consumer-to-consumer and consumer-to-business interactions, and transferring this knowledge in products/services.
Keywords—knowledge acquisition, knowledge management, eWOM (e-word of mouth communication), social networks, retailing
I. INTRODUCTION Past studies identified the critical role of knowledge
acquisition for the success of an organization [1]. Similarly, the knowledge acquisition of consumers is a fundamental factor for business profitability, by developing new and effective retail strategies. In this scenario, previous researches highlighted the pervasive impact of social networks like Facebook by affecting organizational and marketing strategies, social and educational process, research, etc. [2], due to their ability to provide efficient e-business platforms, research and education networks, direct channel between client and vendors, social communities, etc. [2].
From a consumers’ perspective, they use this interactive channel for expressing opinions, accessing others’ comments, asking suggestions and recommendations. Due to the extensive use of this channel for retrieving information and posting observations and judgements especially by youth [3], organizations might exploit social networks like Facebook for acquiring knowledge on consumers’ preferences and market trends. For instance, this channel is dramatically changing the tourism industry, which usually involves the purchase of intangible (e.g. tourism packages) and unknown products (e.g.
possible future tourism destinations), by proposing new way for promoting localities and supporting cultural heritage [3].
Hence, on the one hand the online posts show the popularity level of products and brands, on the other these comments represent a review of the current marketing strategies and the level of consumers’ satisfaction. In this way, the online consumer-to-consumer interactions provide recommendations and advise on a huge number of current firms/services/products, while the consumer-to-business interaction shows clients’ evaluations of the current firm’s product/service [4] [5] [6]. In particular, these interactions are part of the eWOM (electronic word of mouth communication) and represent an informal way of communication through the electronic channel, which consumers perceive as more trustworthy and persuasive than traditional media such as television or newspapers [7] [8] [9].
Since the information retrieved online support the decision-making process held offline [10], the interactions among consumers are able to influence consumers’ buying decision and purchasing behaviour also while consumers are physically in the point of sale, by affecting especially client’ confidence with the recommended product [7] [11]. For these reasons, many firms solicit consumers’ positive reviews to encourage other users. Although consumers take into account the rate of the products available online, they pay attention more to the full comments posted by others to collect more detailed information before the choice [7].
The aim of this paper is to investigate how social networks like Facebook may be considered a powerful source for acquiring knowledge on consumers’ behaviours for the development of more efficient strategies, and how this knowledge can be transferred in retail strategies. To achieve this goal, the research focuses on consumers’ knowledge of social network as influencing factor on their interest towards others’ posts, and on the use of the medium for directly interact with firms, with emphasis on the contents of consumers’ posts. In this way, it is possible to deeply understand to what extent this medium can be used for acquiring knowledge on clients emerging from both the consumer-to-consumer and consumer-to-business interactions.
Int'l Conf. e-Learning, e-Bus., EIS, and e-Gov. | EEE'13 | 207
In particular, the first part of the paper is devoted to the use of eWOM (electronic word of mouth communication) as knowledge source for business purposes, while the second one employs a qualitative research involving consumers’ knowledge of social networks, their attitude towards posting online judgements and complains for firms, their interest towards others’ posts, and their specific attention towards such elements of the comments.
II. THEORETICAL BACKGROUND Consumers’ needs have been largely recognized as a driver
for the efficient product innovation. Thus, consumers’ knowledge acquisition plays a critical role especially for developing new successful strategies [12]. Despite the important role of knowledge sharing in innovation process, developers’ and consumers’ viewpoint may be different. For this reason, efficient methods and technologies for measuring and achieving information on customers’ preferences are compulsory for business profitability. Despite the large usage of questionnaires for this purpose [13], many current studies are focusing on the adoption of new and more efficient techniques for acquiring a large amount of helpful users’ creative contribution [14] [15] [16]. In this context, different and more interactive methods might be able to solicit consumers’ ideas and access also to a so-called tacit knowledge, which has a critical importance for achieving competitive advantages.
Social networks offer a new platform able to provide data on consumers’ behaviour and preferences constantly updated and detailed. In fact, consumers take care of updating their profile, sharing their preferences or the new experiences, creating lists of interests, and suggesting products and brands. Hence, this media brings together large communities of consumers, who spontaneously exchange knowledge [17]. Users’ comments are intended to communicate pieces of information to other individuals. However, they are available in a written form that firms can exploit for learning about users’ interests, opinions and behaviours, as well as for predicting market trends. In fact, existing literature has often focused on the possibility to exploit users comments, reviews and discussions as a source of knowledge on products and brands [18] [19] [20]. This information can be then converted into knowledge on market for developing customized products and marketing campaigns, targeting extant products and services, etc. [20]. Furthermore, from social networks also consumers can obtain knowledge on products and on the business that produces them [21]. On the one hand, they seek knowledge from other consumers, which are perceived as a more reliable source compared to vendors [6] [22]; on the other one, they seek firm’s news concerning launching new product, services, reward campaigns, etc..
The role of eWOM has been found to be growing in the Internet shopping sector [23]. Although eWOM can be considered a sort of word-of-mouth communication held online, it has peculiarities that go beyond the potentialities of traditional word-of-mouth: it is quicker, involves larger numbers of people and can be stored, aggregated and analysed more efficiently [3] [8]. For instance, concerning consumer-to-consumer know-how exchanges, it has been found that this
interaction has a direct relationship with loyalty intentions, as well as an indirect relationship with the overall value of firm’s offering [24]. The number of available comments can be very large and their quality variable, in terms of quality and quantity of the posts (i.e. some opinion are expressed with more words, others with just a couple, others with a rate, etc.), and presence of provocative suggestions or insult [25] [26]. For instance, customers exploit the eWOM to acquire knowledge and information especially when they want to purchase risky, intangible products or unknown items, such as in the case of booking a hotel or choosing the destination of the next holiday [3]. Other studies have found that low involvement users tends to conform to eWOM both when it is negative and positive, while high involvement users tend to conform only in the case of negative reviews [27]. Negative eWOM can be considered as a negative statement concerning a certain product or organization widely available through Internet [28] [29] [30]. Consumers usually pay more attention to negative reviews than to positive ones, because they consider the negative ones more informative [29] [31]. Since negative eWOM provides valuable information [32], it can be considered a further opportunity for organizations to acquire knowledge made available on social networks for improving the current products/strategies, and achieve an evaluation on the current products and strategies. Hence, while positive eWOM collects consumers’ positive considerations of product/firm characteristics and desires for developing new products, negative eWOM provides a detailed evaluation of the existing ones for improving the actual offer.
From a marketing and management perspective, extant research has studied eWOM from several points of view: motivation to post online, information searching and sharing process and decision-making process. The point of view of organizations and vendors, instead, is still under-investigated. The literature still misses detailed studies on the impact of social networks from an organizational perspective. Although some authors have found that an organization’s experience with social media influences its attitude towards eWOM and negative eWOM [8], there is still a gap in literature concerning firms’ behaviours, perceptions and reaction towards consumers’ reviews [33]. Despite the growing body of literature on social networks like Facebook and on eWOM, the point of view of organizations’ with emphasis on the eWOM as a source of knowledge on costumers has not been addressed in previous studies, as well as the research on the use of eWOM for extracting knowledge on consumers is still in progress.
III. METHODOLOGY OF RESEARCH This paper aims at investigating how to acquire knowledge
on consumers’ needs and opinions for marketing purposes through their interaction within social networks like Facebook. To achieve this goal, we evaluated consumers’ interest towards others’ posts and their attitude towards posting comments directed to firms with personal judgements on products and services, with emphasis on the contents of these posts. In particular, the research involved 507 subjects randomly recruited in Italy between November and December 2012 (242 male and 265 female). Participants were asked to fill an anonymous questionnaire concerning their usage of social networks. We chose a qualitative approach because it is
208 Int'l Conf. e-Learning, e-Bus., EIS, and e-Gov. | EEE'13 |
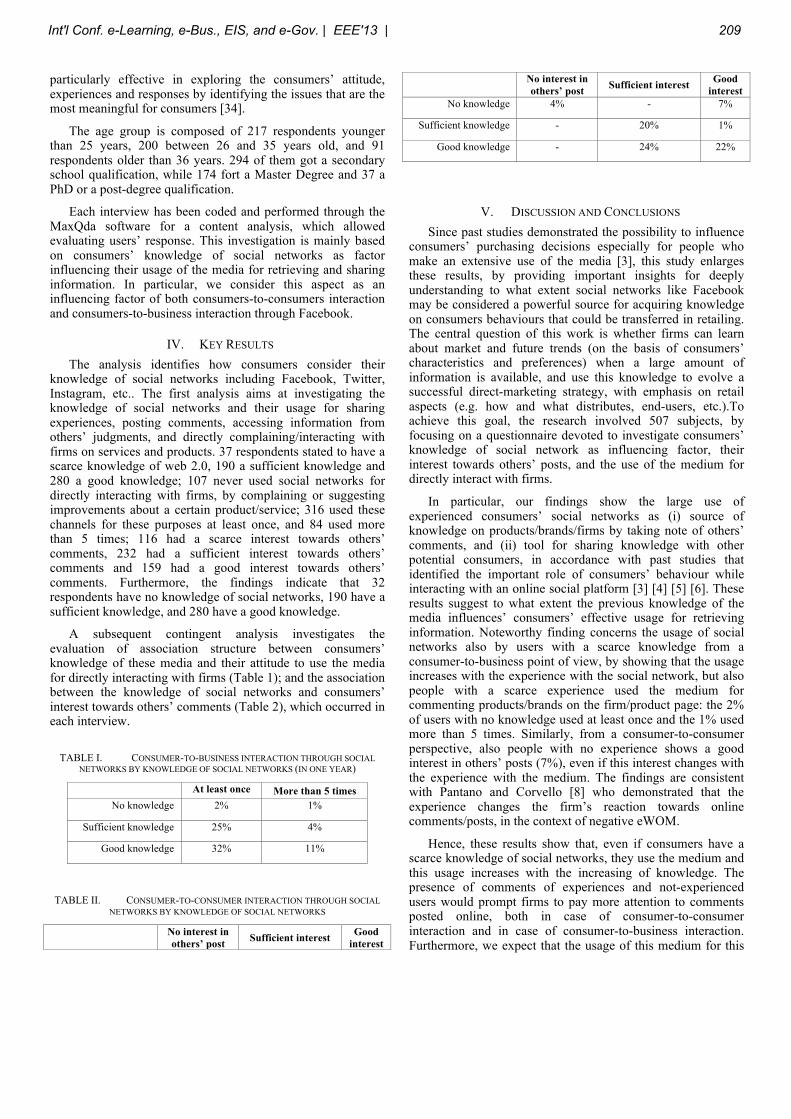
particularly effective in exploring the consumers’ attitude, experiences and responses by identifying the issues that are the most meaningful for consumers [34].
The age group is composed of 217 respondents younger than 25 years, 200 between 26 and 35 years old, and 91 respondents older than 36 years. 294 of them got a secondary school qualification, while 174 fort a Master Degree and 37 a PhD or a post-degree qualification.
Each interview has been coded and performed through the MaxQda software for a content analysis, which allowed evaluating users’ response. This investigation is mainly based on consumers’ knowledge of social networks as factor influencing their usage of the media for retrieving and sharing information. In particular, we consider this aspect as an influencing factor of both consumers-to-consumers interaction and consumers-to-business interaction through Facebook.
IV. KEY RESULTS The analysis identifies how consumers consider their
knowledge of social networks including Facebook, Twitter, Instagram, etc.. The first analysis aims at investigating the knowledge of social networks and their usage for sharing experiences, posting comments, accessing information from others’ judgments, and directly complaining/interacting with firms on services and products. 37 respondents stated to have a scarce knowledge of web 2.0, 190 a sufficient knowledge and 280 a good knowledge; 107 never used social networks for directly interacting with firms, by complaining or suggesting improvements about a certain product/service; 316 used these channels for these purposes at least once, and 84 used more than 5 times; 116 had a scarce interest towards others’ comments, 232 had a sufficient interest towards others’ comments and 159 had a good interest towards others’ comments. Furthermore, the findings indicate that 32 respondents have no knowledge of social networks, 190 have a sufficient knowledge, and 280 have a good knowledge.
A subsequent contingent analysis investigates the evaluation of association structure between consumers’ knowledge of these media and their attitude to use the media for directly interacting with firms (Table 1); and the association between the knowledge of social networks and consumers’ interest towards others’ comments (Table 2), which occurred in each interview.
TABLE I. CONSUMER-TO-BUSINESS INTERACTION THROUGH SOCIAL NETWORKS BY KNOWLEDGE OF SOCIAL NETWORKS (IN ONE YEAR)
At least once More than 5 times No knowledge 2% 1%
Sufficient knowledge 25% 4%
Good knowledge 32% 11%
TABLE II. CONSUMER-TO-CONSUMER INTERACTION THROUGH SOCIAL NETWORKS BY KNOWLEDGE OF SOCIAL NETWORKS
No interest in others’ post Sufficient interest Good
interest
No interest in others’ post Sufficient interest Good
interest No knowledge 4% - 7%
Sufficient knowledge - 20% 1%
Good knowledge - 24% 22%
V. DISCUSSION AND CONCLUSIONS Since past studies demonstrated the possibility to influence
consumers’ purchasing decisions especially for people who make an extensive use of the media [3], this study enlarges these results, by providing important insights for deeply understanding to what extent social networks like Facebook may be considered a powerful source for acquiring knowledge on consumers behaviours that could be transferred in retailing. The central question of this work is whether firms can learn about market and future trends (on the basis of consumers’ characteristics and preferences) when a large amount of information is available, and use this knowledge to evolve a successful direct-marketing strategy, with emphasis on retail aspects (e.g. how and what distributes, end-users, etc.).To achieve this goal, the research involved 507 subjects, by focusing on a questionnaire devoted to investigate consumers’ knowledge of social network as influencing factor, their interest towards others’ posts, and the use of the medium for directly interact with firms.
In particular, our findings show the large use of experienced consumers’ social networks as (i) source of knowledge on products/brands/firms by taking note of others’ comments, and (ii) tool for sharing knowledge with other potential consumers, in accordance with past studies that identified the important role of consumers’ behaviour while interacting with an online social platform [3] [4] [5] [6]. These results suggest to what extent the previous knowledge of the media influences’ consumers’ effective usage for retrieving information. Noteworthy finding concerns the usage of social networks also by users with a scarce knowledge from a consumer-to-business point of view, by showing that the usage increases with the experience with the social network, but also people with a scarce experience used the medium for commenting products/brands on the firm/product page: the 2% of users with no knowledge used at least once and the 1% used more than 5 times. Similarly, from a consumer-to-consumer perspective, also people with no experience shows a good interest in others’ posts (7%), even if this interest changes with the experience with the medium. The findings are consistent with Pantano and Corvello [8] who demonstrated that the experience changes the firm’s reaction towards online comments/posts, in the context of negative eWOM.
Hence, these results show that, even if consumers have a scarce knowledge of social networks, they use the medium and this usage increases with the increasing of knowledge. The presence of comments of experiences and not-experienced users would prompt firms to pay more attention to comments posted online, both in case of consumer-to-consumer interaction and in case of consumer-to-business interaction. Furthermore, we expect that the usage of this medium for this
Int'l Conf. e-Learning, e-Bus., EIS, and e-Gov. | EEE'13 | 209
purpose will increase with the diffusion of Internet ubiquitous access (i.e. the reducing cost of smartphone and internet connection increases the Internet access anywhere and anytime).
Hence, our results provide some useful indications on the content of the knowledge shared during the consumer-to-business interactions. In fact, consumers’ post directed to firms contain mainly complaining, which consists of a detailed judgement related to (i) a malfunctioning of the service, (ii) a malfunctioning of the product, (iii) a wrong (broken) service/product, (iv) dissatisfaction concerning firm’s behaviour, and (v) request for a different service/product. Since the social networks allow storing consumers’ comments, firms are able to collect a large amount of comments (by focusing on the most recent ones) and investigating through content analysis software for achieving a detailed evaluation of the current product/service, and of their expectations. In fact, the current client’s dissatisfaction includes the expectation of a different (better) product/service, which can become the starting point for developing a new product/service or enhancing the existing one.
For these reasons, in the one hand firms should take into account all the comments posted on their virtual walls for understanding both the elements that consumers like more and the ones that they dislike; in the other they should pay more attention on the posts devoted to other users to understand the main characteristic of a product/service that attract consumers’ attention. Hence, all these elements are able to affect the marketing strategies and the organizational process, as anticipated by previous studies [2] [8], for instance by considering the possibility to develop the role of expert of social networks and eWOM communications for deeply understanding consumers evaluations and perception, and proposing improving and corrections of current strategies. In this way, the firm would be ready to efficiently manage the large amount of information available online, and fast reply to consumers’ changeable needs and preferences, as well as to predict the new trends.
Furthermore, the eWOM communication seems to be more useful for extracting knowledge on consumers’ preferences than the standard questionnaire that firms would submit for directly asking consumers’ opinion. In fact, one of the benefits of the eWOM is that it has the characteristics of informal communication able to solicit subjects’ spontaneity and sincerity [17] [25] [26] [32]. This spontaneity is able to involve more people in discussions for proving different points of views and more information, by involving a huge number of active participants [14] [15] [16], with benefits for the reliability and validity of the achieved information. Through the our analysis of the ways which consumers use social network and contribute to evaluating firms’ activity, the results might be considered a first step towards enabling online strategic learning with numerous, frequent and sparse consumers’ information by the firms.
VI. FUTUREWORKS Future works could improve our findings, by employing
quantitative research and Structural Equation Model analysis
for testing the value of the relationships emerging in our study (consumers’ knowledge of these media and their attitude to use the media for directly interacting with firms; and the knowledge of social networks and consumers’ interest towards others’ comments) and the effective impact on innovation process and retailing.
Due to the increasing importance of consumers’ eWOM through Facebook from both a client and vendor point of view, future applications concerning retailing would explore the possibility to integrate the social networks like Facebook directly in the point of sale, by investigating to what extent this integration could influence the decision-making process and the subsequent purchasing behavior. Further research question will focus on to what extent eWOM and online interaction (through social networks) (i) will substitute the traditional face-to-face interactions in retail domain, (ii) will dramatically change the social experience linked to shopping activity, and (iii) will modify the traditional client-vendor relationship, in terms of consumers’ requests of vendor opinion about a certain product.
REFERENCES [1] V. Corvello, and P. Migliarese, “Learning and knowledge and knowledge
substitution: two approaches to knowledge acquisition in geographically distributed organizations”, in the 10th World Multi-Conference on Systemics, Cybernetics and Informatics, vol. 6, pp. 260-265, 2006.
[2] F.J. Garrigos-Simon, R. Lapiedra Alcami, and T. Barbera Ribera, “Social networks and web 3.0: their impact on the management and marketing of organization”, Management Decision, vol. 50 no. 10, pp. 1880-1890, 2012.
[3] L. Di Pietro, and E. Pantano, “An empirical investigation of social network infl uence on consumer purchasing decision: The case of Facebook”, Journal of Direct, Data and Digital Marketing Practice, vol. 14 no. 1, pp. 18-29, 2012.
[4] T. Hogg, “Inferring preference correlations from social networks”, Electronic Commerce Research and Applications, vol. 9 no. 1, pp. 29-37, 2009.
[5] O. Hinz, C. Schulze, and C. Takac, “New product adoption in social networks: Why direction matters”, Journal of Business Research, in press.
[6] N. Archak, A. Ghose, and P. Ipeirotis, “‘Show me the money!’: Deriving the pricing power of product features by mining consumer reviews” , in the 13th ACM International Conference on Knowledge Discovery and Data Mining, pp. 56 – 65, 2007.
[7] S. Utz, P. Kerkhof, and J. van den Bos, “Consumers rule: how consumer reviews influence perceived trustworthiness of online stores”, Electronic Commerce Research and Applications, vol. 11 no. 1, pp. 49-58, 2012.
[8] E. Pantano and V. Corvello, “The impact of experience on companies’ reaction to negative comments on social networks”, Journal of Direct, Data and Digital Marketing Practice, in press.
[9] C.M.K. Cheung, and D.R. Thadani D.R., “The impact of electronic word-of-mouth communication: a literature analysis and integrative model”, Decision Support Systems, vol. 54 no. 1, pp. 461-470, 2012.
[10] Y.Y.Y. Chan, and E.W.T. Ngai, “Conceptualising electronic word of mouth activity: An input-process-output perspective”, Marketing Intelligence & Planning, vol. 29 no. 5, pp. 488-516, 2011.
[11] J. Harris, P. Gupta, “‘You should buy this one!’” The influence of online recommendations on product attitudes and choice confidence, International Journal of Electronic Marketing and Retailing, vol. 2 no. 2, pp. 176-189, 2008.
[12] J. Hauser, G.J. Tells, and A. Griffin, “Research on innovation: a review and agenda for Marketing Science”, vol. 25 no. 6, pp. 687-717, 2006.
210 Int'l Conf. e-Learning, e-Bus., EIS, and e-Gov. | EEE'13 |
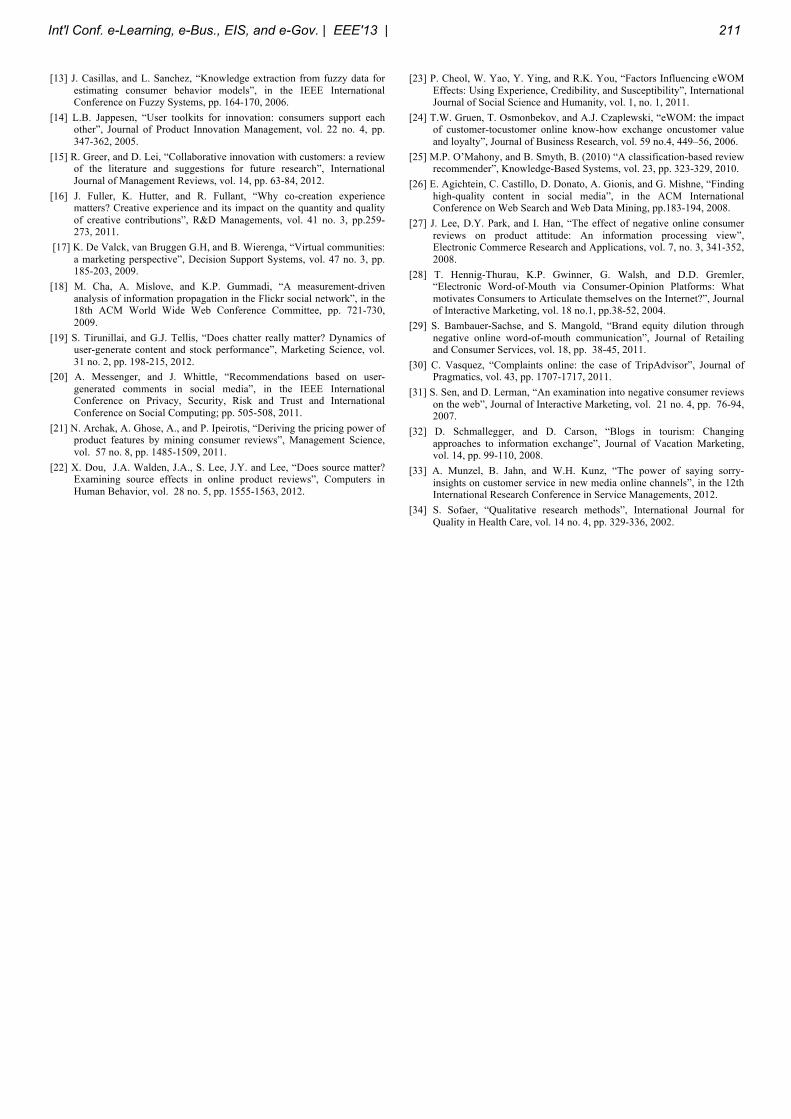
[13] J. Casillas, and L. Sanchez, “Knowledge extraction from fuzzy data for estimating consumer behavior models”, in the IEEE International Conference on Fuzzy Systems, pp. 164-170, 2006.
[14] L.B. Jappesen, “User toolkits for innovation: consumers support each other”, Journal of Product Innovation Management, vol. 22 no. 4, pp. 347-362, 2005.
[15] R. Greer, and D. Lei, “Collaborative innovation with customers: a review of the literature and suggestions for future research”, International Journal of Management Reviews, vol. 14, pp. 63-84, 2012.
[16] J. Fuller, K. Hutter, and R. Fullant, “Why co-creation experience matters? Creative experience and its impact on the quantity and quality of creative contributions”, R&D Managements, vol. 41 no. 3, pp.259-273, 2011.
[17] K. De Valck, van Bruggen G.H, and B. Wierenga, “Virtual communities: a marketing perspective”, Decision Support Systems, vol. 47 no. 3, pp. 185-203, 2009.
[18] M. Cha, A. Mislove, and K.P. Gummadi, “A measurement-driven analysis of information propagation in the Flickr social network”, in the 18th ACM World Wide Web Conference Committee, pp. 721-730, 2009.
[19] S. Tirunillai, and G.J. Tellis, “Does chatter really matter? Dynamics of user-generate content and stock performance”, Marketing Science, vol. 31 no. 2, pp. 198-215, 2012.
[20] A. Messenger, and J. Whittle, “Recommendations based on user-generated comments in social media”, in the IEEE International Conference on Privacy, Security, Risk and Trust and International Conference on Social Computing; pp. 505-508, 2011.
[21] N. Archak, A. Ghose, A., and P. Ipeirotis, “Deriving the pricing power of product features by mining consumer reviews”, Management Science, vol. 57 no. 8, pp. 1485-1509, 2011.
[22] X. Dou, J.A. Walden, J.A., S. Lee, J.Y. and Lee, “Does source matter? Examining source effects in online product reviews”, Computers in Human Behavior, vol. 28 no. 5, pp. 1555-1563, 2012.
[23] P. Cheol, W. Yao, Y. Ying, and R.K. You, “Factors Influencing eWOM Effects: Using Experience, Credibility, and Susceptibility”, International Journal of Social Science and Humanity, vol. 1, no. 1, 2011.
[24] T.W. Gruen, T. Osmonbekov, and A.J. Czaplewski, “eWOM: the impact of customer-tocustomer online know-how exchange oncustomer value and loyalty”, Journal of Business Research, vol. 59 no.4, 449–56, 2006.
[25] M.P. O’Mahony, and B. Smyth, B. (2010) “A classification-based review recommender”, Knowledge-Based Systems, vol. 23, pp. 323-329, 2010.
[26] E. Agichtein, C. Castillo, D. Donato, A. Gionis, and G. Mishne, “Finding high-quality content in social media”, in the ACM International Conference on Web Search and Web Data Mining, pp.183-194, 2008.
[27] J. Lee, D.Y. Park, and I. Han, “The effect of negative online consumer reviews on product attitude: An information processing view”, Electronic Commerce Research and Applications, vol. 7, no. 3, 341-352, 2008.
[28] T. Hennig-Thurau, K.P. Gwinner, G. Walsh, and D.D. Gremler, “Electronic Word-of-Mouth via Consumer-Opinion Platforms: What motivates Consumers to Articulate themselves on the Internet?”, Journal of Interactive Marketing, vol. 18 no.1, pp.38-52, 2004.
[29] S. Bambauer-Sachse, and S. Mangold, “Brand equity dilution through negative online word-of-mouth communication”, Journal of Retailing and Consumer Services, vol. 18, pp. 38-45, 2011.
[30] C. Vasquez, “Complaints online: the case of TripAdvisor”, Journal of Pragmatics, vol. 43, pp. 1707-1717, 2011.
[31] S. Sen, and D. Lerman, “An examination into negative consumer reviews on the web”, Journal of Interactive Marketing, vol. 21 no. 4, pp. 76-94, 2007.
[32] D. Schmallegger, and D. Carson, “Blogs in tourism: Changing approaches to information exchange”, Journal of Vacation Marketing, vol. 14, pp. 99-110, 2008.
[33] A. Munzel, B. Jahn, and W.H. Kunz, “The power of saying sorry- insights on customer service in new media online channels”, in the 12th International Research Conference in Service Managements, 2012.
[34] S. Sofaer, “Qualitative research methods”, International Journal for Quality in Health Care, vol. 14 no. 4, pp. 329-336, 2002.
Int'l Conf. e-Learning, e-Bus., EIS, and e-Gov. | EEE'13 | 211
For Your Eyes Only – Biometric Protection of PDF Documents
J. Siciarek1, M. Smiatacz1, and B. Wiszniewski11Dept. of Intelligent Interactive Systems, Faculty of ETI, Gdansk University of Technology, Gdansk, Poland
Abstract— The paper introduces a concept of a digital doc-ument content encryption/decryption with facial biometricdata coming from a legitimate user. Access to the documentcontent is simple and straightforward, especially during col-laborative work with mobile devices equipped with cameras.Various contexts of document exchange are presented withregard to the next generation pro-active digital documentsproposed by authors. An important point is that documentsdeveloped in the project referred in the paper use commonformats, it this particular case PDF.
Keywords: Face recognition, biometric password, encryption
1. IntroductionDocuments play a key role in any organized structure
invented by human civilization, as they are both informationunits and interface units to collaborating people. This phe-nomenon is particularly common in knowledge based orga-nizations, whose members, often called knowledge workers,cooperate by exchanging documents to make decisions,discover facts or accumulate knowledge.
The MENAID project [1] addresses these issues by ap-proaching collaborative computing and virtual cooperationwith next generation pro-active digital documents, which aremobile, interactive, executable and intelligent. Before goingto the main theme of the paper let us refer to two basicconcepts of such documents developed during the project,namely a Mobile Interactive Document (MIND) architectureof documents capable of traveling through Internet as au-tonomous agents, and an Interactive Open Document Archi-tecture (IODA) enabling implementation of executable pa-pers that may be freely transferred between digital libraries.By referring to MIND and IODA we can emphasize betterthe issue of protecting content from unauthorized accessduring various document exchange scenarios. An importantpoint is that our architectures do not require any specificrepresentation format for the document, as any contentconformant to the MIME standard may be exchanged.
1.1 Mobile documentsArchitecture of MIND is based on a simple combination
of two popular Web concepts: automatic XML data bindingwith Java objects, and mobile agents. Data binding allowsfor converting units of information contained in documentcomponents into functional objects in a computer memory,augmented next with mobility to make them autonomous
objects, capable of migrating in an open distributed sys-tem [2]. Owing to this, a static representation of an electronicdocument is transformed into a set of dynamic objects thatcan migrate to remote locations, and perform actions at theselocations by interacting locally with their users and services(see Figure 1).
document
hub
dynamic component
dynamic component
dynamic component
...
final document
document
originatorknowledge
workersarchivist
other policies
services
security policy
migration path
repositorydocument
templates
Fig. 1: Components of the MIND mobile document
Lifecycle of a MIND document is initiated by its origi-nator, a worker who is responsible for designing a logicalstructure of a hub document, possibly by using a repositoryof document templates. Logical structure of the documentincludes in particular: a document migration path, and spec-ification of services required by it during its journey throughvarious locations of the collaborating workers’ organization.Document security policy specifies access rights to variousdocument parts between subsequent collaborators, indicatedas participants of the workflow process defined by thedocument migration path.
Migration path is specified with a workflow definitionlanguage, in terms of activities to be performed by eachrespective worker upon document delivery, and transitions ofdocuments to other workers. In our current implementationof MIND we utilize email messaging for document tran-sitions. A lightweight email client, implemented by us forthat purpose, can automatically retrieve documents attachedto the email message from the receiving worker’s mailbox,authenticate the worker, and make them executable objectsby unmarshaling. Upon completion of one activity, the emailclient interprets a document migration path to determine thenext activity and workers, serializes documents and sendsthem as email attachments.
Knowledge workers interact with dynamic componentscurrently residing on their personal devices and contributeto their content when performing the required activity. Uponcompletion of the last activity specified by the migrationpath, document components return to their originator to beintegrated into a final document and archived.
212 Int'l Conf. e-Learning, e-Bus., EIS, and e-Gov. | EEE'13 |
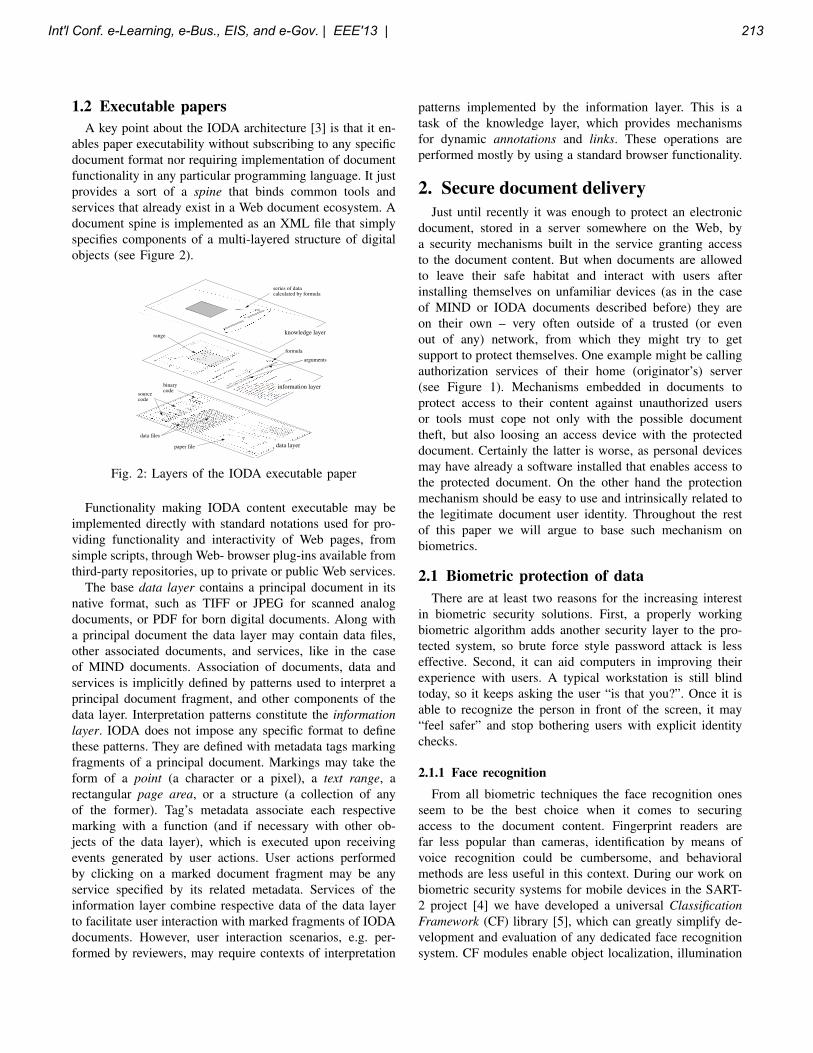
1.2 Executable papersA key point about the IODA architecture [3] is that it en-
ables paper executability without subscribing to any specificdocument format nor requiring implementation of documentfunctionality in any particular programming language. It justprovides a sort of a spine that binds common tools andservices that already exist in a Web document ecosystem. Adocument spine is implemented as an XML file that simplyspecifies components of a multi-layered structure of digitalobjects (see Figure 2).
binarycode
sourcecode
series of datacalculated by formula
data files
range
arguments
formula
paper file
knowledge layer
information layer
data layer
Fig. 2: Layers of the IODA executable paper
Functionality making IODA content executable may beimplemented directly with standard notations used for pro-viding functionality and interactivity of Web pages, fromsimple scripts, through Web- browser plug-ins available fromthird-party repositories, up to private or public Web services.
The base data layer contains a principal document in itsnative format, such as TIFF or JPEG for scanned analogdocuments, or PDF for born digital documents. Along witha principal document the data layer may contain data files,other associated documents, and services, like in the caseof MIND documents. Association of documents, data andservices is implicitly defined by patterns used to interpret aprincipal document fragment, and other components of thedata layer. Interpretation patterns constitute the informationlayer. IODA does not impose any specific format to definethese patterns. They are defined with metadata tags markingfragments of a principal document. Markings may take theform of a point (a character or a pixel), a text range, arectangular page area, or a structure (a collection of anyof the former). Tag’s metadata associate each respectivemarking with a function (and if necessary with other ob-jects of the data layer), which is executed upon receivingevents generated by user actions. User actions performedby clicking on a marked document fragment may be anyservice specified by its related metadata. Services of theinformation layer combine respective data of the data layerto facilitate user interaction with marked fragments of IODAdocuments. However, user interaction scenarios, e.g. per-formed by reviewers, may require contexts of interpretation
patterns implemented by the information layer. This is atask of the knowledge layer, which provides mechanismsfor dynamic annotations and links. These operations areperformed mostly by using a standard browser functionality.
2. Secure document deliveryJust until recently it was enough to protect an electronic
document, stored in a server somewhere on the Web, bya security mechanisms built in the service granting accessto the document content. But when documents are allowedto leave their safe habitat and interact with users afterinstalling themselves on unfamiliar devices (as in the caseof MIND or IODA documents described before) they areon their own – very often outside of a trusted (or evenout of any) network, from which they might try to getsupport to protect themselves. One example might be callingauthorization services of their home (originator’s) server(see Figure 1). Mechanisms embedded in documents toprotect access to their content against unauthorized usersor tools must cope not only with the possible documenttheft, but also loosing an access device with the protecteddocument. Certainly the latter is worse, as personal devicesmay have already a software installed that enables access tothe protected document. On the other hand the protectionmechanism should be easy to use and intrinsically related tothe legitimate document user identity. Throughout the restof this paper we will argue to base such mechanism onbiometrics.
2.1 Biometric protection of dataThere are at least two reasons for the increasing interest
in biometric security solutions. First, a properly workingbiometric algorithm adds another security layer to the pro-tected system, so brute force style password attack is lesseffective. Second, it can aid computers in improving theirexperience with users. A typical workstation is still blindtoday, so it keeps asking the user “is that you?”. Once it isable to recognize the person in front of the screen, it may“feel safer” and stop bothering users with explicit identitychecks.
2.1.1 Face recognitionFrom all biometric techniques the face recognition ones
seem to be the best choice when it comes to securingaccess to the document content. Fingerprint readers arefar less popular than cameras, identification by means ofvoice recognition could be cumbersome, and behavioralmethods are less useful in this context. During our work onbiometric security systems for mobile devices in the SART-2 project [4] we have developed a universal ClassificationFramework (CF) library [5], which can greatly simplify de-velopment and evaluation of any dedicated face recognitionsystem. CF modules enable object localization, illumination
Int'l Conf. e-Learning, e-Bus., EIS, and e-Gov. | EEE'13 | 213
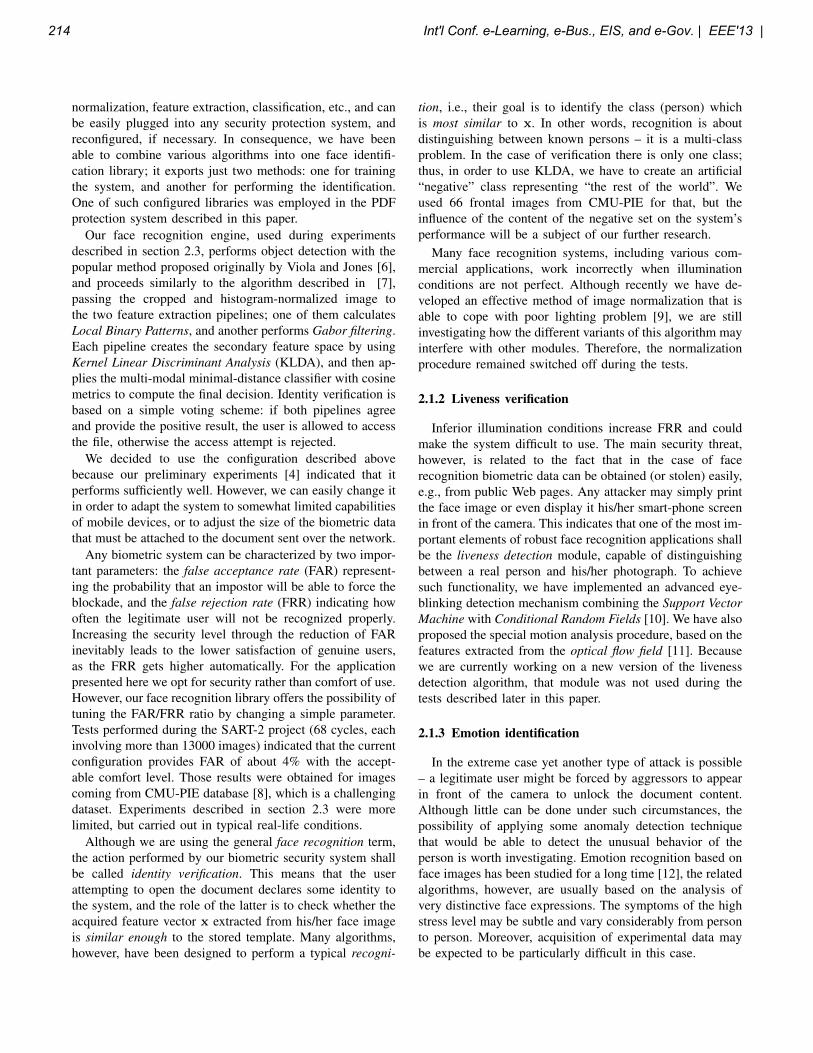
normalization, feature extraction, classification, etc., and canbe easily plugged into any security protection system, andreconfigured, if necessary. In consequence, we have beenable to combine various algorithms into one face identifi-cation library; it exports just two methods: one for trainingthe system, and another for performing the identification.One of such configured libraries was employed in the PDFprotection system described in this paper.
Our face recognition engine, used during experimentsdescribed in section 2.3, performs object detection with thepopular method proposed originally by Viola and Jones [6],and proceeds similarly to the algorithm described in [7],passing the cropped and histogram-normalized image tothe two feature extraction pipelines; one of them calculatesLocal Binary Patterns, and another performs Gabor filtering.Each pipeline creates the secondary feature space by usingKernel Linear Discriminant Analysis (KLDA), and then ap-plies the multi-modal minimal-distance classifier with cosinemetrics to compute the final decision. Identity verification isbased on a simple voting scheme: if both pipelines agreeand provide the positive result, the user is allowed to accessthe file, otherwise the access attempt is rejected.
We decided to use the configuration described abovebecause our preliminary experiments [4] indicated that itperforms sufficiently well. However, we can easily change itin order to adapt the system to somewhat limited capabilitiesof mobile devices, or to adjust the size of the biometric datathat must be attached to the document sent over the network.
Any biometric system can be characterized by two impor-tant parameters: the false acceptance rate (FAR) represent-ing the probability that an impostor will be able to force theblockade, and the false rejection rate (FRR) indicating howoften the legitimate user will not be recognized properly.Increasing the security level through the reduction of FARinevitably leads to the lower satisfaction of genuine users,as the FRR gets higher automatically. For the applicationpresented here we opt for security rather than comfort of use.However, our face recognition library offers the possibility oftuning the FAR/FRR ratio by changing a simple parameter.Tests performed during the SART-2 project (68 cycles, eachinvolving more than 13000 images) indicated that the currentconfiguration provides FAR of about 4% with the accept-able comfort level. Those results were obtained for imagescoming from CMU-PIE database [8], which is a challengingdataset. Experiments described in section 2.3 were morelimited, but carried out in typical real-life conditions.
Although we are using the general face recognition term,the action performed by our biometric security system shallbe called identity verification. This means that the userattempting to open the document declares some identity tothe system, and the role of the latter is to check whether theacquired feature vector x extracted from his/her face imageis similar enough to the stored template. Many algorithms,however, have been designed to perform a typical recogni-
tion, i.e., their goal is to identify the class (person) whichis most similar to x. In other words, recognition is aboutdistinguishing between known persons – it is a multi-classproblem. In the case of verification there is only one class;thus, in order to use KLDA, we have to create an artificial“negative” class representing “the rest of the world”. Weused 66 frontal images from CMU-PIE for that, but theinfluence of the content of the negative set on the system’sperformance will be a subject of our further research.
Many face recognition systems, including various com-mercial applications, work incorrectly when illuminationconditions are not perfect. Although recently we have de-veloped an effective method of image normalization that isable to cope with poor lighting problem [9], we are stillinvestigating how the different variants of this algorithm mayinterfere with other modules. Therefore, the normalizationprocedure remained switched off during the tests.
2.1.2 Liveness verification
Inferior illumination conditions increase FRR and couldmake the system difficult to use. The main security threat,however, is related to the fact that in the case of facerecognition biometric data can be obtained (or stolen) easily,e.g., from public Web pages. Any attacker may simply printthe face image or even display it his/her smart-phone screenin front of the camera. This indicates that one of the most im-portant elements of robust face recognition applications shallbe the liveness detection module, capable of distinguishingbetween a real person and his/her photograph. To achievesuch functionality, we have implemented an advanced eye-blinking detection mechanism combining the Support VectorMachine with Conditional Random Fields [10]. We have alsoproposed the special motion analysis procedure, based on thefeatures extracted from the optical flow field [11]. Becausewe are currently working on a new version of the livenessdetection algorithm, that module was not used during thetests described later in this paper.
2.1.3 Emotion identification
In the extreme case yet another type of attack is possible– a legitimate user might be forced by aggressors to appearin front of the camera to unlock the document content.Although little can be done under such circumstances, thepossibility of applying some anomaly detection techniquethat would be able to detect the unusual behavior of theperson is worth investigating. Emotion recognition based onface images has been studied for a long time [12], the relatedalgorithms, however, are usually based on the analysis ofvery distinctive face expressions. The symptoms of the highstress level may be subtle and vary considerably from personto person. Moreover, acquisition of experimental data maybe expected to be particularly difficult in this case.
214 Int'l Conf. e-Learning, e-Bus., EIS, and e-Gov. | EEE'13 |
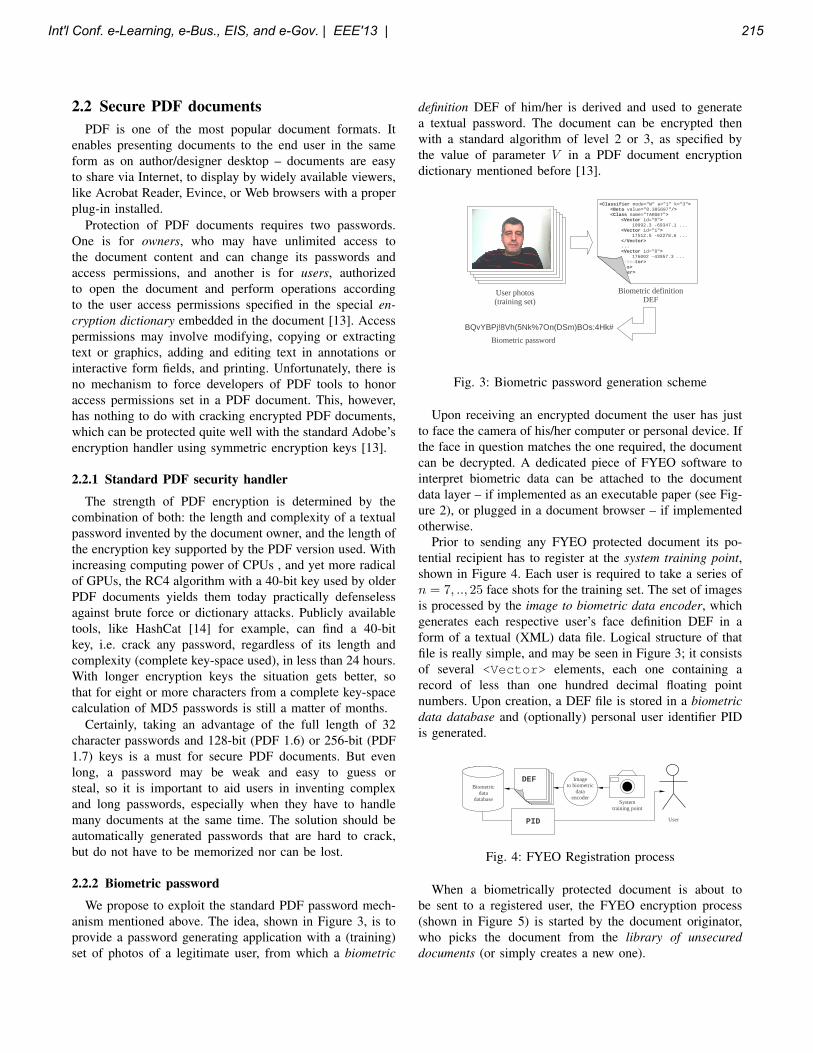
2.2 Secure PDF documentsPDF is one of the most popular document formats. It
enables presenting documents to the end user in the sameform as on author/designer desktop – documents are easyto share via Internet, to display by widely available viewers,like Acrobat Reader, Evince, or Web browsers with a properplug-in installed.
Protection of PDF documents requires two passwords.One is for owners, who may have unlimited access tothe document content and can change its passwords andaccess permissions, and another is for users, authorizedto open the document and perform operations accordingto the user access permissions specified in the special en-cryption dictionary embedded in the document [13]. Accesspermissions may involve modifying, copying or extractingtext or graphics, adding and editing text in annotations orinteractive form fields, and printing. Unfortunately, there isno mechanism to force developers of PDF tools to honoraccess permissions set in a PDF document. This, however,has nothing to do with cracking encrypted PDF documents,which can be protected quite well with the standard Adobe’sencryption handler using symmetric encryption keys [13].
2.2.1 Standard PDF security handler
The strength of PDF encryption is determined by thecombination of both: the length and complexity of a textualpassword invented by the document owner, and the length ofthe encryption key supported by the PDF version used. Withincreasing computing power of CPUs , and yet more radicalof GPUs, the RC4 algorithm with a 40-bit key used by olderPDF documents yields them today practically defenselessagainst brute force or dictionary attacks. Publicly availabletools, like HashCat [14] for example, can find a 40-bitkey, i.e. crack any password, regardless of its length andcomplexity (complete key-space used), in less than 24 hours.With longer encryption keys the situation gets better, sothat for eight or more characters from a complete key-spacecalculation of MD5 passwords is still a matter of months.
Certainly, taking an advantage of the full length of 32character passwords and 128-bit (PDF 1.6) or 256-bit (PDF1.7) keys is a must for secure PDF documents. But evenlong, a password may be weak and easy to guess orsteal, so it is important to aid users in inventing complexand long passwords, especially when they have to handlemany documents at the same time. The solution should beautomatically generated passwords that are hard to crack,but do not have to be memorized nor can be lost.
2.2.2 Biometric password
We propose to exploit the standard PDF password mech-anism mentioned above. The idea, shown in Figure 3, is toprovide a password generating application with a (training)set of photos of a legitimate user, from which a biometric
definition DEF of him/her is derived and used to generatea textual password. The document can be encrypted thenwith a standard algorithm of level 2 or 3, as specified bythe value of parameter V in a PDF document encryptiondictionary mentioned before [13].
User photos (training set)
Biometric definitionDEF
BQvYBPj!8Vh(5Nk%7On(DSm)BOs:4Hk#
Biometric password
<Classifier mode="W" a="1" k="3"><Beta value="0.385697"/><Class name="TARGET">
<Vector id="0">10992.3 -69347.1 ...
<Vector id="1">17512.5 -62278.6 ...
</Vector>...<Vector id="8">
176002 -43957.3 ...</Vector>
</Class></Classifier>
Fig. 3: Biometric password generation scheme
Upon receiving an encrypted document the user has justto face the camera of his/her computer or personal device. Ifthe face in question matches the one required, the documentcan be decrypted. A dedicated piece of FYEO software tointerpret biometric data can be attached to the documentdata layer – if implemented as an executable paper (see Fig-ure 2), or plugged in a document browser – if implementedotherwise.
Prior to sending any FYEO protected document its po-tential recipient has to register at the system training point,shown in Figure 4. Each user is required to take a series ofn = 7, .., 25 face shots for the training set. The set of imagesis processed by the image to biometric data encoder, whichgenerates each respective user’s face definition DEF in aform of a textual (XML) data file. Logical structure of thatfile is really simple, and may be seen in Figure 3; it consistsof several <Vector> elements, each one containing arecord of less than one hundred decimal floating pointnumbers. Upon creation, a DEF file is stored in a biometricdata database and (optionally) personal user identifier PIDis generated.
System training point
Imageto biometric
dataencoder
User
Biometricdata
database
PID
DEF
Fig. 4: FYEO Registration process
When a biometrically protected document is about tobe sent to a registered user, the FYEO encryption process(shown in Figure 5) is started by the document originator,who picks the document from the library of unsecureddocuments (or simply creates a new one).
Int'l Conf. e-Learning, e-Bus., EIS, and e-Gov. | EEE'13 | 215
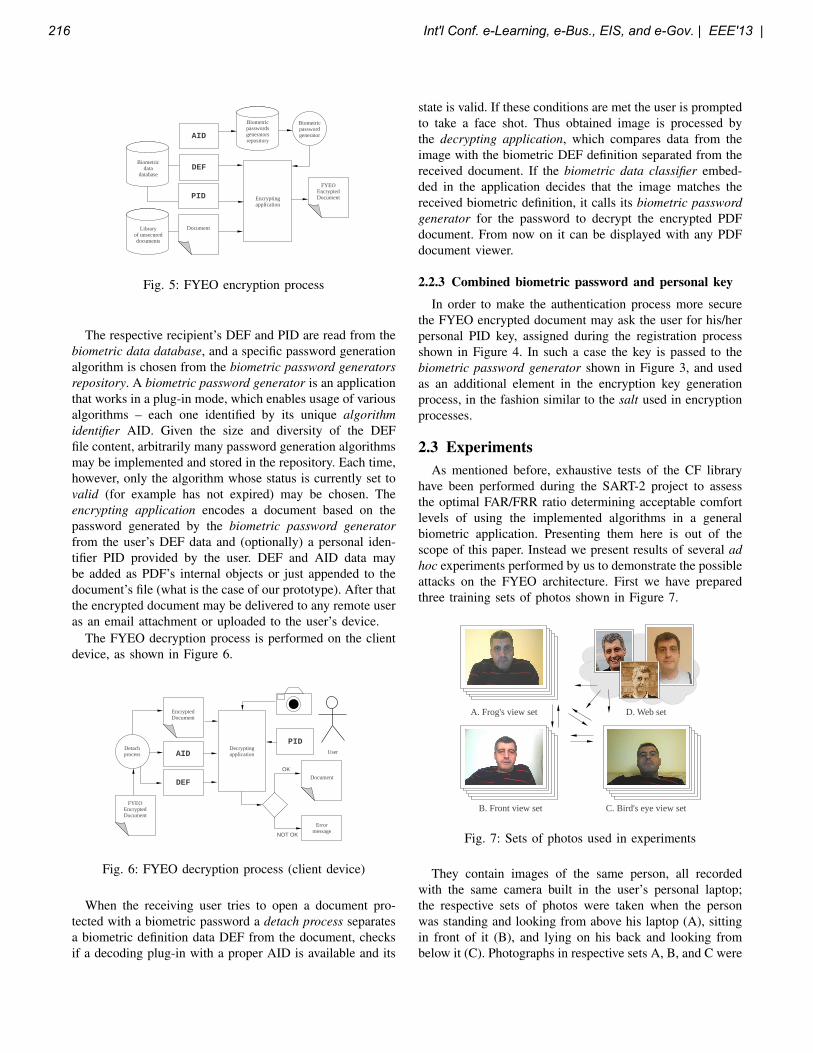
System training point
Biometricdata
database
Libraryof unsecureddocuments
DEF
Encryptingapplication
PID
Biometricpasswordsgeneratorsrepository
Biometricpasswordgenerator
Document
FYEOEncryptedDocument
AID
Fig. 5: FYEO encryption process
The respective recipient’s DEF and PID are read from thebiometric data database, and a specific password generationalgorithm is chosen from the biometric password generatorsrepository. A biometric password generator is an applicationthat works in a plug-in mode, which enables usage of variousalgorithms – each one identified by its unique algorithmidentifier AID. Given the size and diversity of the DEFfile content, arbitrarily many password generation algorithmsmay be implemented and stored in the repository. Each time,however, only the algorithm whose status is currently set tovalid (for example has not expired) may be chosen. Theencrypting application encodes a document based on thepassword generated by the biometric password generatorfrom the user’s DEF data and (optionally) a personal iden-tifier PID provided by the user. DEF and AID data maybe added as PDF’s internal objects or just appended to thedocument’s file (what is the case of our prototype). After thatthe encrypted document may be delivered to any remote useras an email attachment or uploaded to the user’s device.
The FYEO decryption process is performed on the clientdevice, as shown in Figure 6.
DEF
Decryptingapplication
PID
FYEOEncryptedDocument
Detachprocess
EncryptedDocument
AID User
Document
Errormessage
NOT OK
OK
Fig. 6: FYEO decryption process (client device)
When the receiving user tries to open a document pro-tected with a biometric password a detach process separatesa biometric definition data DEF from the document, checksif a decoding plug-in with a proper AID is available and its
state is valid. If these conditions are met the user is promptedto take a face shot. Thus obtained image is processed bythe decrypting application, which compares data from theimage with the biometric DEF definition separated from thereceived document. If the biometric data classifier embed-ded in the application decides that the image matches thereceived biometric definition, it calls its biometric passwordgenerator for the password to decrypt the encrypted PDFdocument. From now on it can be displayed with any PDFdocument viewer.
2.2.3 Combined biometric password and personal key
In order to make the authentication process more securethe FYEO encrypted document may ask the user for his/herpersonal PID key, assigned during the registration processshown in Figure 4. In such a case the key is passed to thebiometric password generator shown in Figure 3, and usedas an additional element in the encryption key generationprocess, in the fashion similar to the salt used in encryptionprocesses.
2.3 ExperimentsAs mentioned before, exhaustive tests of the CF library
have been performed during the SART-2 project to assessthe optimal FAR/FRR ratio determining acceptable comfortlevels of using the implemented algorithms in a generalbiometric application. Presenting them here is out of thescope of this paper. Instead we present results of several adhoc experiments performed by us to demonstrate the possibleattacks on the FYEO architecture. First we have preparedthree training sets of photos shown in Figure 7.
A. Frog's view set
B. Front view set C. Bird's eye view set
D. Web set
Fig. 7: Sets of photos used in experiments
They contain images of the same person, all recordedwith the same camera built in the user’s personal laptop;the respective sets of photos were taken when the personwas standing and looking from above his laptop (A), sittingin front of it (B), and lying on his back and looking frombelow it (C). Photographs in respective sets A, B, and C were
216 Int'l Conf. e-Learning, e-Bus., EIS, and e-Gov. | EEE'13 |
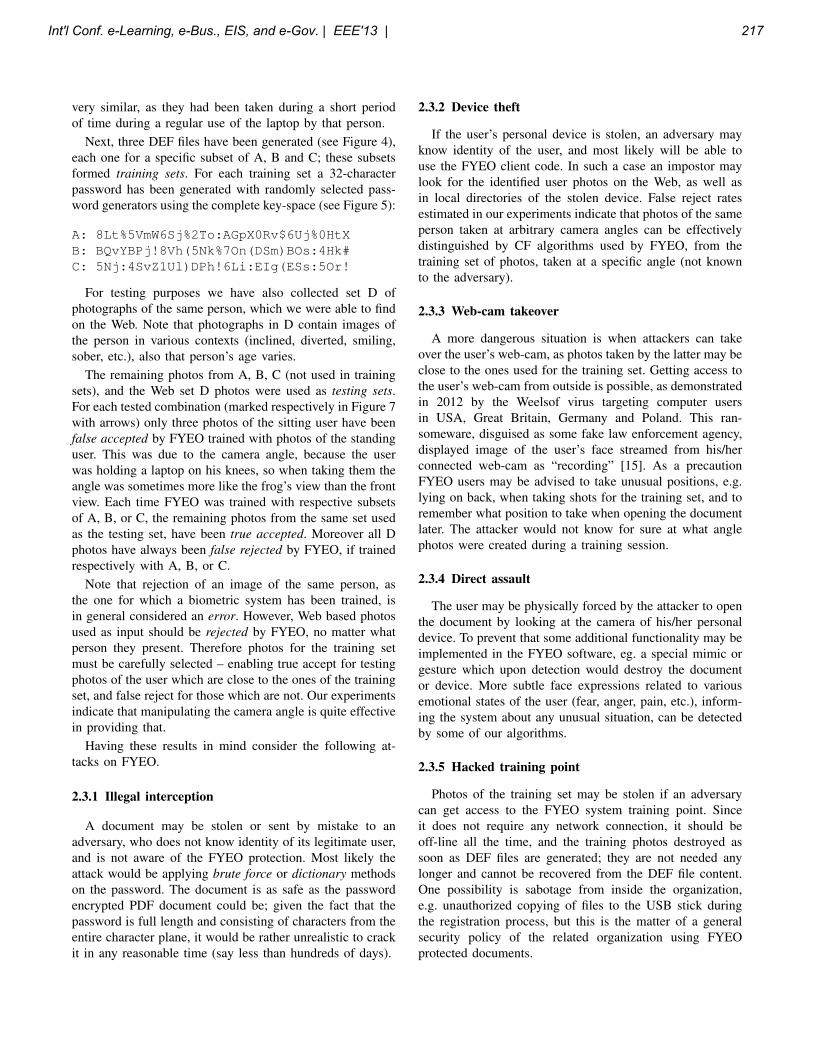
very similar, as they had been taken during a short periodof time during a regular use of the laptop by that person.
Next, three DEF files have been generated (see Figure 4),each one for a specific subset of A, B and C; these subsetsformed training sets. For each training set a 32-characterpassword has been generated with randomly selected pass-word generators using the complete key-space (see Figure 5):
A: 8Lt%5VmW6Sj%2To:AGpX0Rv$6Uj%0HtXB: BQvYBPj!8Vh(5Nk%7On(DSm)BOs:4Hk#C: 5Nj:4SvZ1Ul)DPh!6Li:EIg(ESs:5Or!
For testing purposes we have also collected set D ofphotographs of the same person, which we were able to findon the Web. Note that photographs in D contain images ofthe person in various contexts (inclined, diverted, smiling,sober, etc.), also that person’s age varies.
The remaining photos from A, B, C (not used in trainingsets), and the Web set D photos were used as testing sets.For each tested combination (marked respectively in Figure 7with arrows) only three photos of the sitting user have beenfalse accepted by FYEO trained with photos of the standinguser. This was due to the camera angle, because the userwas holding a laptop on his knees, so when taking them theangle was sometimes more like the frog’s view than the frontview. Each time FYEO was trained with respective subsetsof A, B, or C, the remaining photos from the same set usedas the testing set, have been true accepted. Moreover all Dphotos have always been false rejected by FYEO, if trainedrespectively with A, B, or C.
Note that rejection of an image of the same person, asthe one for which a biometric system has been trained, isin general considered an error. However, Web based photosused as input should be rejected by FYEO, no matter whatperson they present. Therefore photos for the training setmust be carefully selected – enabling true accept for testingphotos of the user which are close to the ones of the trainingset, and false reject for those which are not. Our experimentsindicate that manipulating the camera angle is quite effectivein providing that.
Having these results in mind consider the following at-tacks on FYEO.
2.3.1 Illegal interception
A document may be stolen or sent by mistake to anadversary, who does not know identity of its legitimate user,and is not aware of the FYEO protection. Most likely theattack would be applying brute force or dictionary methodson the password. The document is as safe as the passwordencrypted PDF document could be; given the fact that thepassword is full length and consisting of characters from theentire character plane, it would be rather unrealistic to crackit in any reasonable time (say less than hundreds of days).
2.3.2 Device theft
If the user’s personal device is stolen, an adversary mayknow identity of the user, and most likely will be able touse the FYEO client code. In such a case an impostor maylook for the identified user photos on the Web, as well asin local directories of the stolen device. False reject ratesestimated in our experiments indicate that photos of the sameperson taken at arbitrary camera angles can be effectivelydistinguished by CF algorithms used by FYEO, from thetraining set of photos, taken at a specific angle (not knownto the adversary).
2.3.3 Web-cam takeover
A more dangerous situation is when attackers can takeover the user’s web-cam, as photos taken by the latter may beclose to the ones used for the training set. Getting access tothe user’s web-cam from outside is possible, as demonstratedin 2012 by the Weelsof virus targeting computer usersin USA, Great Britain, Germany and Poland. This ran-someware, disguised as some fake law enforcement agency,displayed image of the user’s face streamed from his/herconnected web-cam as “recording” [15]. As a precautionFYEO users may be advised to take unusual positions, e.g.lying on back, when taking shots for the training set, and toremember what position to take when opening the documentlater. The attacker would not know for sure at what anglephotos were created during a training session.
2.3.4 Direct assault
The user may be physically forced by the attacker to openthe document by looking at the camera of his/her personaldevice. To prevent that some additional functionality may beimplemented in the FYEO software, eg. a special mimic orgesture which upon detection would destroy the documentor device. More subtle face expressions related to variousemotional states of the user (fear, anger, pain, etc.), inform-ing the system about any unusual situation, can be detectedby some of our algorithms.
2.3.5 Hacked training point
Photos of the training set may be stolen if an adversarycan get access to the FYEO system training point. Sinceit does not require any network connection, it should beoff-line all the time, and the training photos destroyed assoon as DEF files are generated; they are not needed anylonger and cannot be recovered from the DEF file content.One possibility is sabotage from inside the organization,e.g. unauthorized copying of files to the USB stick duringthe registration process, but this is the matter of a generalsecurity policy of the related organization using FYEOprotected documents.
Int'l Conf. e-Learning, e-Bus., EIS, and e-Gov. | EEE'13 | 217
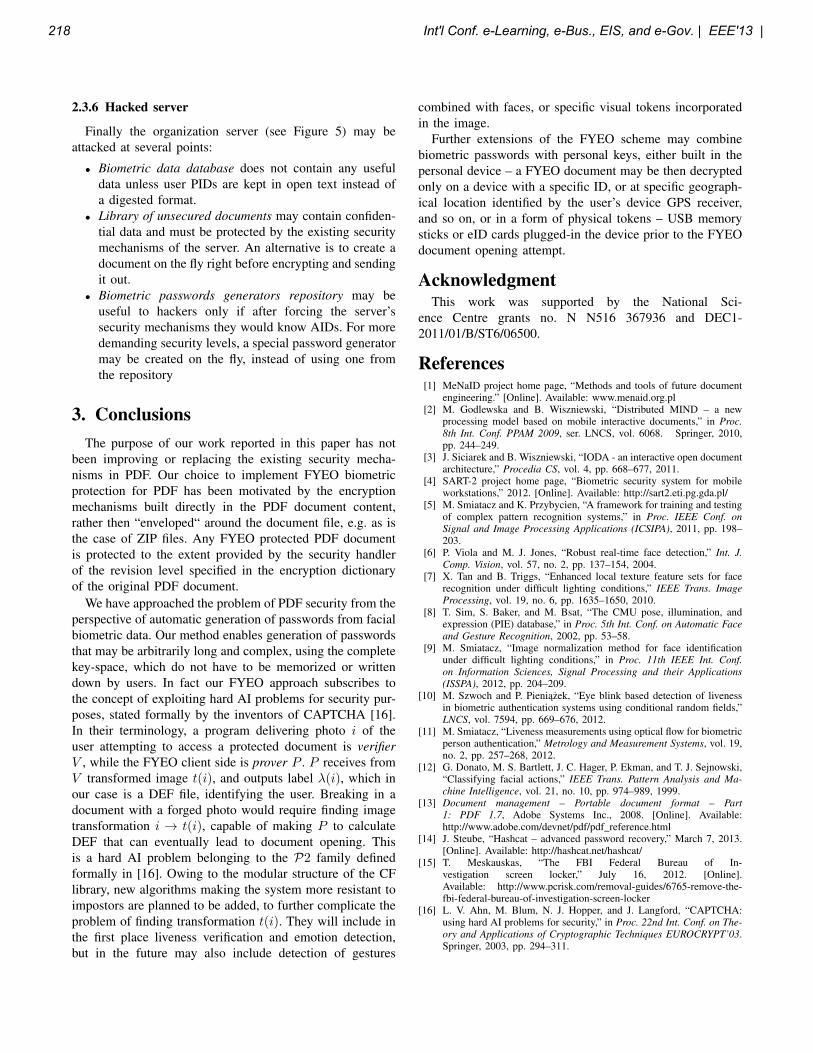
2.3.6 Hacked server
Finally the organization server (see Figure 5) may beattacked at several points:
• Biometric data database does not contain any usefuldata unless user PIDs are kept in open text instead ofa digested format.
• Library of unsecured documents may contain confiden-tial data and must be protected by the existing securitymechanisms of the server. An alternative is to create adocument on the fly right before encrypting and sendingit out.
• Biometric passwords generators repository may beuseful to hackers only if after forcing the server’ssecurity mechanisms they would know AIDs. For moredemanding security levels, a special password generatormay be created on the fly, instead of using one fromthe repository
3. ConclusionsThe purpose of our work reported in this paper has not
been improving or replacing the existing security mecha-nisms in PDF. Our choice to implement FYEO biometricprotection for PDF has been motivated by the encryptionmechanisms built directly in the PDF document content,rather then “enveloped“ around the document file, e.g. as isthe case of ZIP files. Any FYEO protected PDF documentis protected to the extent provided by the security handlerof the revision level specified in the encryption dictionaryof the original PDF document.
We have approached the problem of PDF security from theperspective of automatic generation of passwords from facialbiometric data. Our method enables generation of passwordsthat may be arbitrarily long and complex, using the completekey-space, which do not have to be memorized or writtendown by users. In fact our FYEO approach subscribes tothe concept of exploiting hard AI problems for security pur-poses, stated formally by the inventors of CAPTCHA [16].In their terminology, a program delivering photo i of theuser attempting to access a protected document is verifierV , while the FYEO client side is prover P . P receives fromV transformed image t(i), and outputs label λ(i), which inour case is a DEF file, identifying the user. Breaking in adocument with a forged photo would require finding imagetransformation i → t(i), capable of making P to calculateDEF that can eventually lead to document opening. Thisis a hard AI problem belonging to the P2 family definedformally in [16]. Owing to the modular structure of the CFlibrary, new algorithms making the system more resistant toimpostors are planned to be added, to further complicate theproblem of finding transformation t(i). They will include inthe first place liveness verification and emotion detection,but in the future may also include detection of gestures
combined with faces, or specific visual tokens incorporatedin the image.
Further extensions of the FYEO scheme may combinebiometric passwords with personal keys, either built in thepersonal device – a FYEO document may be then decryptedonly on a device with a specific ID, or at specific geograph-ical location identified by the user’s device GPS receiver,and so on, or in a form of physical tokens – USB memorysticks or eID cards plugged-in the device prior to the FYEOdocument opening attempt.
AcknowledgmentThis work was supported by the National Sci-
ence Centre grants no. N N516 367936 and DEC1-2011/01/B/ST6/06500.
References[1] MeNaID project home page, “Methods and tools of future document
engineering.” [Online]. Available: www.menaid.org.pl[2] M. Godlewska and B. Wiszniewski, “Distributed MIND – a new
processing model based on mobile interactive documents,” in Proc.8th Int. Conf. PPAM 2009, ser. LNCS, vol. 6068. Springer, 2010,pp. 244–249.
[3] J. Siciarek and B. Wiszniewski, “IODA - an interactive open documentarchitecture,” Procedia CS, vol. 4, pp. 668–677, 2011.
[4] SART-2 project home page, “Biometric security system for mobileworkstations,” 2012. [Online]. Available: http://sart2.eti.pg.gda.pl/
[5] M. Smiatacz and K. Przybycien, “A framework for training and testingof complex pattern recognition systems,” in Proc. IEEE Conf. onSignal and Image Processing Applications (ICSIPA), 2011, pp. 198–203.
[6] P. Viola and M. J. Jones, “Robust real-time face detection,” Int. J.Comp. Vision, vol. 57, no. 2, pp. 137–154, 2004.
[7] X. Tan and B. Triggs, “Enhanced local texture feature sets for facerecognition under difficult lighting conditions,” IEEE Trans. ImageProcessing, vol. 19, no. 6, pp. 1635–1650, 2010.
[8] T. Sim, S. Baker, and M. Bsat, “The CMU pose, illumination, andexpression (PIE) database,” in Proc. 5th Int. Conf. on Automatic Faceand Gesture Recognition, 2002, pp. 53–58.
[9] M. Smiatacz, “Image normalization method for face identificationunder difficult lighting conditions,” in Proc. 11th IEEE Int. Conf.on Information Sciences, Signal Processing and their Applications(ISSPA), 2012, pp. 204–209.
[10] M. Szwoch and P. Pieniazek, “Eye blink based detection of livenessin biometric authentication systems using conditional random fields,”LNCS, vol. 7594, pp. 669–676, 2012.
[11] M. Smiatacz, “Liveness measurements using optical flow for biometricperson authentication,” Metrology and Measurement Systems, vol. 19,no. 2, pp. 257–268, 2012.
[12] G. Donato, M. S. Bartlett, J. C. Hager, P. Ekman, and T. J. Sejnowski,“Classifying facial actions,” IEEE Trans. Pattern Analysis and Ma-chine Intelligence, vol. 21, no. 10, pp. 974–989, 1999.
[13] Document management – Portable document format – Part1: PDF 1.7, Adobe Systems Inc., 2008. [Online]. Available:http://www.adobe.com/devnet/pdf/pdf_reference.html
[14] J. Steube, “Hashcat – advanced password recovery,” March 7, 2013.[Online]. Available: http://hashcat.net/hashcat/
[15] T. Meskauskas, “The FBI Federal Bureau of In-vestigation screen locker,” July 16, 2012. [Online].Available: http://www.pcrisk.com/removal-guides/6765-remove-the-fbi-federal-bureau-of-investigation-screen-locker
[16] L. V. Ahn, M. Blum, N. J. Hopper, and J. Langford, “CAPTCHA:using hard AI problems for security,” in Proc. 22nd Int. Conf. on The-ory and Applications of Cryptographic Techniques EUROCRYPT’03.Springer, 2003, pp. 294–311.
218 Int'l Conf. e-Learning, e-Bus., EIS, and e-Gov. | EEE'13 |
Exploring Chinese Users’ Acceptance of Social Commerce Sites
Jia Shen
Department of Information Systems and Supply Chain Management College of Business Administration
Rider University Lawrenceville, NJ, USA
Abstract – With its rapid economic growth and the largest number of Internet users worldwide, China and its vast online markets are of particular interests to companies globally. This paper describes a study of Chinese users’ acceptance of an emerging E-commerce technology: social commerce websites. Leveraging the power of social networking technologies with online shopping, social commerce sites have emerged in recent years to address the fundamental nature of shopping as a social experience. Despite tremendous business interest and anticipated potential benefits, some central issues remain such as whether Chinese Internet users will adopt such websites and the factors that affect the adoption. This study extends the Technology Acceptance Model (TAM) with social factors such as social comparison, social presence, and enjoyment in the acceptance of social commerce websites. Results provide significant support of the extended model.
Keywords: social commerce, social comparison, social presence, enjoyment, user acceptance
1 Introduction
As home to the world’s largest Internet population, China is rapidly developing e-commerce systems, and is catching the attention of companies with global ambitions. By 2012, China had 538 million Internet users (www.internetworldstats.com), and the number of e-commerce shoppers is projected to grow into 329 million by 2015 [1]. The vast online market and its cultural background draw attention to study Chinese online consumers for unique opportunities. Meanwhile, online social networking and social media technologies continue to gain recognition in China and worldwide. Seeking to tap into the potentials of these technologies for E-commerce, businesses are exploring ways to combine the power of social networking with online shopping for better
service and new business opportunities. For example, there is an upward trend of merchants creating ads and retails pages on Facebook, with the intention of attracting online social network users and their friends [2]. Additionally, a new wave of start-up firms are developing text mining algorithms to track "social relationship data" between online users, that can be used to target behavior-oriented ads. However the evidence is still inconclusive that these are the best online platforms to increase sales using social networking.
Social commerce sites have emerged as a strong potential platform to combine online social networking with online shopping. Gathering people in an online place to exchange shopping ideas, social commerce sites offer features similar to social networking sites such as personal blog and profile webpage, with the addition of E-commerce tools and software to allow users to easily copy product pictures and post them on their web pages. Users can also post product recommendations, create wish lists, comment on items, and make purchases. The result is the creation of online social commerce communities. Examples of social commerce sites include Kaboodle.com, ShopStyle.com, ThisNext.com, and Wists.com, all launched between 2006 and 2007. In China, similar social commerce sites emerged around 2009, such as Taobao’s Taojianghu (Tao World) section, Meilishuo (Beauty Legend), and Mogujie (Mushroom Street).
Social commerce aims at addressing the fundamental nature of shopping as a social experience. Despite tremendous business interest and anticipated potential benefits, some central questions remain. Will consumers adopt social commerce technology? What are the factors that lead to the adoption? Although technology adoption in general and e-commerce adoption in particular are both well studied, the specificity of social commerce clearly calls for further theoretical development. Such understanding will also better inform business managers who make strategic decisions regarding the integration of social networking and online
Int'l Conf. e-Learning, e-Bus., EIS, and e-Gov. | EEE'13 | 219
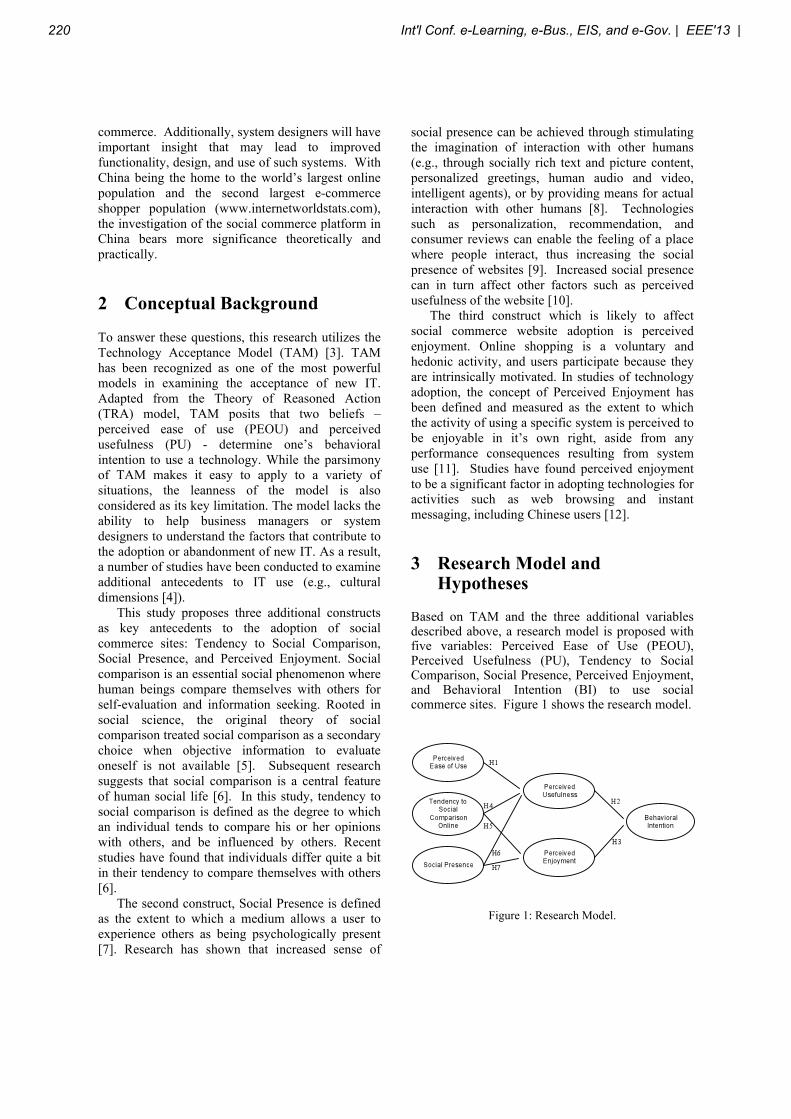
commerce. Additionally, system designers will have important insight that may lead to improved functionality, design, and use of such systems. With China being the home to the world’s largest online population and the second largest e-commerce shopper population (www.internetworldstats.com), the investigation of the social commerce platform in China bears more significance theoretically and practically.
2 Conceptual Background
To answer these questions, this research utilizes the Technology Acceptance Model (TAM) [3]. TAM has been recognized as one of the most powerful models in examining the acceptance of new IT. Adapted from the Theory of Reasoned Action (TRA) model, TAM posits that two beliefs – perceived ease of use (PEOU) and perceived usefulness (PU) - determine one’s behavioral intention to use a technology. While the parsimony of TAM makes it easy to apply to a variety of situations, the leanness of the model is also considered as its key limitation. The model lacks the ability to help business managers or system designers to understand the factors that contribute to the adoption or abandonment of new IT. As a result, a number of studies have been conducted to examine additional antecedents to IT use (e.g., cultural dimensions [4]).
This study proposes three additional constructs as key antecedents to the adoption of social commerce sites: Tendency to Social Comparison, Social Presence, and Perceived Enjoyment. Social comparison is an essential social phenomenon where human beings compare themselves with others for self-evaluation and information seeking. Rooted in social science, the original theory of social comparison treated social comparison as a secondary choice when objective information to evaluate oneself is not available [5]. Subsequent research suggests that social comparison is a central feature of human social life [6]. In this study, tendency to social comparison is defined as the degree to which an individual tends to compare his or her opinions with others, and be influenced by others. Recent studies have found that individuals differ quite a bit in their tendency to compare themselves with others [6].
The second construct, Social Presence is defined as the extent to which a medium allows a user to experience others as being psychologically present [7]. Research has shown that increased sense of
social presence can be achieved through stimulating the imagination of interaction with other humans (e.g., through socially rich text and picture content, personalized greetings, human audio and video, intelligent agents), or by providing means for actual interaction with other humans [8]. Technologies such as personalization, recommendation, and consumer reviews can enable the feeling of a place where people interact, thus increasing the social presence of websites [9]. Increased social presence can in turn affect other factors such as perceived usefulness of the website [10].
The third construct which is likely to affect social commerce website adoption is perceived enjoyment. Online shopping is a voluntary and hedonic activity, and users participate because they are intrinsically motivated. In studies of technology adoption, the concept of Perceived Enjoyment has been defined and measured as the extent to which the activity of using a specific system is perceived to be enjoyable in it’s own right, aside from any performance consequences resulting from system use [11]. Studies have found perceived enjoyment to be a significant factor in adopting technologies for activities such as web browsing and instant messaging, including Chinese users [12].
3 Research Model and Hypotheses
Based on TAM and the three additional variables described above, a research model is proposed with five variables: Perceived Ease of Use (PEOU), Perceived Usefulness (PU), Tendency to Social Comparison, Social Presence, Perceived Enjoyment, and Behavioral Intention (BI) to use social commerce sites. Figure 1 shows the research model.
Figure 1: Research Model.
220 Int'l Conf. e-Learning, e-Bus., EIS, and e-Gov. | EEE'13 |
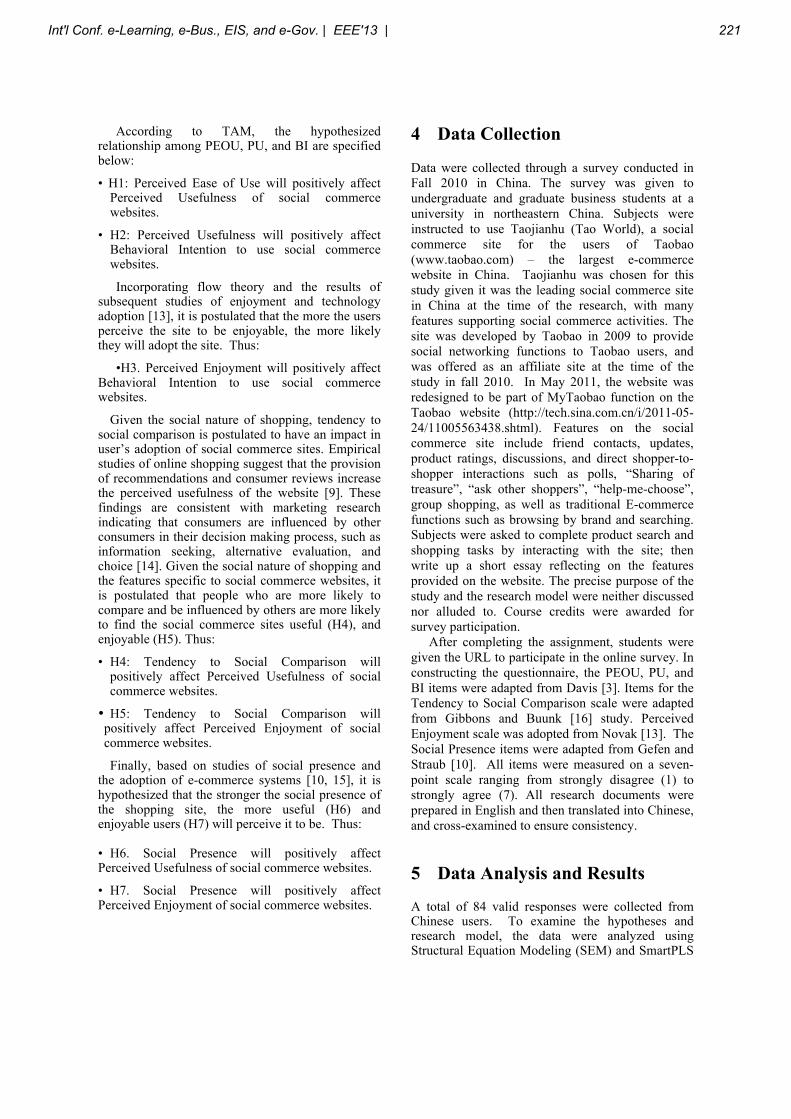
According to TAM, the hypothesized relationship among PEOU, PU, and BI are specified below:
• H1: Perceived Ease of Use will positively affect Perceived Usefulness of social commerce websites.
• H2: Perceived Usefulness will positively affect Behavioral Intention to use social commerce websites.
Incorporating flow theory and the results of subsequent studies of enjoyment and technology adoption [13], it is postulated that the more the users perceive the site to be enjoyable, the more likely they will adopt the site. Thus:
•H3. Perceived Enjoyment will positively affect Behavioral Intention to use social commerce websites.
Given the social nature of shopping, tendency to social comparison is postulated to have an impact in user’s adoption of social commerce sites. Empirical studies of online shopping suggest that the provision of recommendations and consumer reviews increase the perceived usefulness of the website [9]. These findings are consistent with marketing research indicating that consumers are influenced by other consumers in their decision making process, such as information seeking, alternative evaluation, and choice [14]. Given the social nature of shopping and the features specific to social commerce websites, it is postulated that people who are more likely to compare and be influenced by others are more likely to find the social commerce sites useful (H4), and enjoyable (H5). Thus:
• H4: Tendency to Social Comparison will positively affect Perceived Usefulness of social commerce websites.
• H5: Tendency to Social Comparison will positively affect Perceived Enjoyment of social commerce websites.
Finally, based on studies of social presence and the adoption of e-commerce systems [10, 15], it is hypothesized that the stronger the social presence of the shopping site, the more useful (H6) and enjoyable users (H7) will perceive it to be. Thus:
• H6. Social Presence will positively affect Perceived Usefulness of social commerce websites.
• H7. Social Presence will positively affect Perceived Enjoyment of social commerce websites.
4 Data Collection
Data were collected through a survey conducted in Fall 2010 in China. The survey was given to undergraduate and graduate business students at a university in northeastern China. Subjects were instructed to use Taojianhu (Tao World), a social commerce site for the users of Taobao (www.taobao.com) – the largest e-commerce website in China. Taojianhu was chosen for this study given it was the leading social commerce site in China at the time of the research, with many features supporting social commerce activities. The site was developed by Taobao in 2009 to provide social networking functions to Taobao users, and was offered as an affiliate site at the time of the study in fall 2010. In May 2011, the website was redesigned to be part of MyTaobao function on the Taobao website (http://tech.sina.com.cn/i/2011-05-24/11005563438.shtml). Features on the social commerce site include friend contacts, updates, product ratings, discussions, and direct shopper-to-shopper interactions such as polls, “Sharing of treasure”, “ask other shoppers”, “help-me-choose”, group shopping, as well as traditional E-commerce functions such as browsing by brand and searching. Subjects were asked to complete product search and shopping tasks by interacting with the site; then write up a short essay reflecting on the features provided on the website. The precise purpose of the study and the research model were neither discussed nor alluded to. Course credits were awarded for survey participation.
After completing the assignment, students were given the URL to participate in the online survey. In constructing the questionnaire, the PEOU, PU, and BI items were adapted from Davis [3]. Items for the Tendency to Social Comparison scale were adapted from Gibbons and Buunk [16] study. Perceived Enjoyment scale was adopted from Novak [13]. The Social Presence items were adapted from Gefen and Straub [10]. All items were measured on a seven-point scale ranging from strongly disagree (1) to strongly agree (7). All research documents were prepared in English and then translated into Chinese, and cross-examined to ensure consistency.
5 Data Analysis and Results
A total of 84 valid responses were collected from Chinese users. To examine the hypotheses and research model, the data were analyzed using Structural Equation Modeling (SEM) and SmartPLS
Int'l Conf. e-Learning, e-Bus., EIS, and e-Gov. | EEE'13 | 221
software [17]. This approach allows simultaneous analysis of the measurement model (factors), and the structural model (path analysis), and has been widely used. In the measurement model, the reliability of the constructs as measured in the AVE and composite reliabilities of the different measures all exceed the recommended 0.70 level, indicating that the measures are robust. Tests on convergent validity and discriminant validity were conducted, and the results supported the measurement model. Analysis on the mean and standard deviation (SD) for each of the main constructs in the model reveal that subjects reported overall positive attitude towards the social commerce site, and found it easy to use, useful, enjoyable, and are likely to use it in their shopping tasks in the future. Details on the measurement model are not discussed due to space limitations.
Figure 2 shows the results of the structural model. The test yields results of path coefficients (β), which indicates the positive and negative relationships between the constructs, the strength of the relationships, and their statistical significance. The test also yields squared multiple correlations (R2) values, which indicate the amount of variance of the dependent construct that can be explained by the independent constructs.
Figure 2: Research Model Results.
Overall, the China model accounts for 42% of variance in Behavioural Intention, 50% in Perceived Usefulness, and 34% in Perceived Enjoyment. Perceived Ease of Use is an antecedent to Perceived Usefulness (β= .44, p<.01). Perceived Usefulness has a strong effect on Behaviour Intention (β= .39, p<.001). Perceived Enjoyment also affects Behaviour Intention significantly (β=.30, p<.01). Social Comparison does not have a significant effect on Perceived Enjoyment or Perceived Usefulness. Social Presence has a strong effect on Perceived Enjoyment (β= .56, p<.001), and a modest one on Perceived Usefulness (β= .34, p<.05).
Thus hypotheses H1, H2, H3, H6, and H7 were supported. H4 and H5 were not supported.
6 Discussions
This study examined factors associated with Chinese users’ intentions to use social commerce websites. The TAM antecedents are verified in the social commerce context: perceived ease of use and perceived usefulness are both significant factors affecting intentions to adopt social commerce websites. This study also reveals that perceived enjoyment is a significant antecedent to intentions. As the use of social media continues to grow among Internet users and consumers, our results strongly suggest that businesses should consider the potential power associated with integrating online social networking technologies with their e-commerce strategies in creating an easy-to-use, enjoyable, and useful shopping experience.
The results show that social presence significantly affects both perceived usefulness (with a coefficient of .34), and perceived enjoyment (with a coefficient of .56). This suggests that establishing the presence of other online shoppers and creating a sense of an online shopping community are critical in the adoption of such social commerce websites.
One interesting result is that tendency to social comparison does not affect perceived usefulness and perceived enjoyment directly. This result is worth further investigation in future studies from directions such as the impact of strength of social ties (weak ties vs. strong ties) as a moderating factor on the impact of tendency to social comparison.
In the open-ended questions, Chinese study participants reported that one of the main reasons they would adopt the website in future shopping activities was because of the social interactions with other shoppers online: “I would use it because it allows my friends to help me choose products and provide their inputs.” “When I can’t make up my mind, others can help me on this site.” “It enables sharing of shopping experiences.”
The social features of the website not only enable social interactions among web users, but can also serve other purposes such as making new discoveries of products online. “The most useful feature of the Taojianghua site is the ability to keep in touch with family and friends – so one’s aware of their latest updates and shopping ideas;” “It combines shopping with social networking on one site;” “The sharing-of-treasures function allows me to make new discoveries”; “It allows me to share my
222 Int'l Conf. e-Learning, e-Bus., EIS, and e-Gov. | EEE'13 |
shopping experiences with others; and vice versa – there are a lot of valuable advice offered on the site.”
When asked about concerns that prevent them from using the site in the future, privacy concerns topped the list. “The registration process was too complicated, and required too much personal information”. One unique feature in E-commerce website registration in China is the requirement to use a valid cell phone number for each account for verification purpose. Many felt it made the registration process long, and could lead to potential security breaches. “I am concerned about the information I provide may be used for other purposes.” Additionally, authenticity of products for sale on the websites was another issue that some were concerned about. “I did not trust the quality of products on the site.” This reflected a general concern of product quality which is a broader issue affecting commerce both online and offline in China in the rapid economic development stage.
7 Contributions and Future
Research
This research is among the first to empirically examine the merging of social networking with E-commerce technologies for Chinese online consumers. Theoretically, this research contributes by extending the Technology Acceptance Model with factors extracted from social comparison theory, social presence, and enjoyment. The two additional factors: social presence and perceived enjoyment were significant in the model in addition to PEOU and PU.
Understanding consumer perceptions and intentions to use a social commerce website have direct management implications. A recent study on Chinese E-commerce development suggests that Chinese consumers are the most likely in the world to check for product recommendations on social networking sites [1]. Largely because of consumer wariness and distrust of merchants, forty percent of online consumers in China say they’ve read and posted reviews—more than double the rate in the United States. Conversely, only 19 percent of consumers in China go to official brand or manufacturer sites, compared with 41 to 60 percent in Japan, the United States, and the European Union [1]. This reinforces the findings in this study in terms of the potentials of social commerce sites in China.
From a practical perspective, the current research model suggests that in addition to focusing on ease of use and usefulness, the site should foster a sense
of other online shoppers, and create enjoyment in the shopping process. The result can produce a greater likelihood that Chinese consumers will find the site useful, use the site, and increase product sales.
One possible direction for future research is to examine the type of online shopping tasks that are most suitable for social commerce websites. Will users prefer using social commerce sites than traditional E-commerce site for certain shopping activities, such as browsing or searching [18]? Will they prefer the site when they are more involved with the product, i.e., when the product is more relevant to them? Also, will the strength of the social ties affect users’ use of such shopping sites, such as family and friends vs. other online shoppers? With the growing popularity of social media and E-commerce technology integration, research in this area is timely and important.
8 References
[1] J. Walters, Y. Kuo, W. Jap, and H. Hsu, "The World's Next E-commerce Superpower: Navigating China's Unique Online-Shopping Ecosystem," The Boston consulting Group Report, Novembe, 2011.
[2] S. E. Needleman, "Merchants Push Sales Through Social Media - Early Adopters Add Shopping-Cart Apps to Fan Pages to Sell Items," in Wall Street Journal, June 1 2010.
[3] F. D. Davis, "Perceived Usefulness, Perceived Ease of Use and User Acceptance of Information Technology," MIS Quarterly, vol. 13, pp. 319-340, 1989.
[4] E. Mao and P. Palvia, "Testing an extended model of IT acceptance in the Chinese cultural context," ACM SIGMIS Database, vol. 37, pp. 20-32, 2006.
[5] L. Festinger, "A Theory of Social Comparison Processes," Human Relations, vol. 7, pp. 117-140, 1954.
[6] A. P. Buunk and F. X. Gibbons, "Social comparison: The end of a theory and the emergence of a field," Organizational Behavior and Human Decision Processes, vol. 102, pp. 3-21, Jan 2007.
[7] J. Fulk, C. W. Steinfield, J. Schmitz, and J. G. Power, "A social information processing model of media use in organizations," Communication Research, vol. 14, pp. 529-552, 1987.
[8] K. Hassanein and M. Head, "Manipulating social presence through the web interface and
Int'l Conf. e-Learning, e-Bus., EIS, and e-Gov. | EEE'13 | 223
its impact on attitude towards online shopping," International Journal of Human-Computer Studies, vol. 65, pp. 689-708, 2007.
[9] N. Kumar and I. Benbasat, "The Influence of Recommendations and Consumer Reviews on Evaluations of Websites," Information Systems Research, vol. 17, pp. 425-439, Dec 2006.
[10] D. Gefen and D. Straub, "Managing User Trust in B2C e-Services," E-Service Journal, vol. 2, pp. 7-24, 2003.
[11] F. D. Davis and R. P. Bagozzi, "What Do Intention Scales Measure?," The Journal of General Psychology, vol. 119, pp. 391-407, 1992.
[12] Y. Lu, T. Zhou, and B. Wang, "Exploring Chinese Users' Acceptance of Instant Messaging Using the Theory of Planned Behavior, the Technology Acceptance Model, and the Flow Theory," Computers in Human Behavior, vol. 6, pp. 1-11, 2008.
[13] T. P. Novak, D. L. Hoffman, and Y.-F. Yung, "Measuring the Customer Experience in Online Environments: A Structural Modeling Approach," Marketing Science, vol. 19, pp. 22-42, 2000.
[14] H. H. Friedman and R. B. Fireworker, "The susceptibility of consumers to unseen group influence," Journal of Social Psychology, vol. 102, pp. 155-156, 1977.
[15] B. Suh and I. Han, "Effect of trust on customer acceptance of Internet banking," Electronic Commerce Research and Applications, vol. 1, pp. 247-263, Autumn-Winter 2002.
[16] F. X. Gibbons and B. P. Buunk, "Individual differences in social comparison: Development of a scale of social comparison orientation," Journal of Personality and Social Psychology, vol. 76, pp. 129-142, Jan 1999.
[17] C. M. Ringle, S. Wende, and A. Will, "SmartPLS ", 2.0 (beta) ed Hamburg, Germany University of Hamburg 2005.
[18] W. Hong, J. Y. L. Thong, and K. Y. Tam, "The Effects of Information Format and Shopping Task on Consumers' Online Shopping Behavior: A Cognitive Fit Perspective," Journal of Management Information Systems, vol. 21, pp. 149-184, 2004.
224 Int'l Conf. e-Learning, e-Bus., EIS, and e-Gov. | EEE'13 |
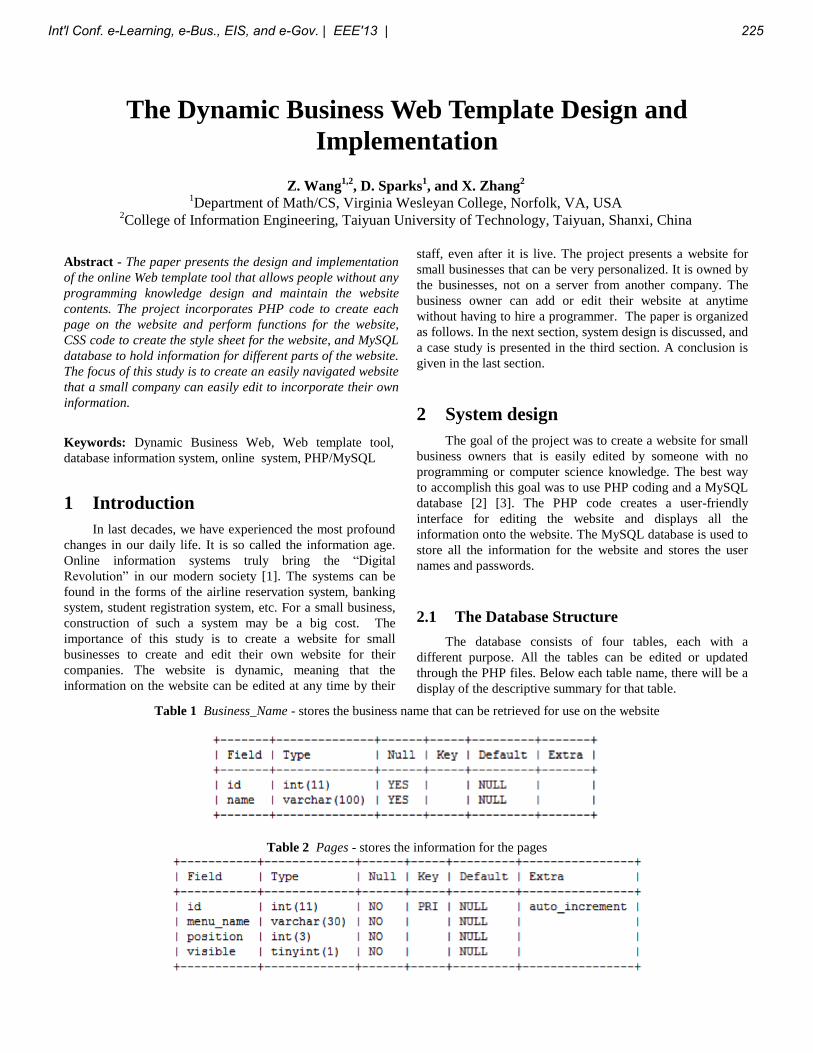
The Dynamic Business Web Template Design and
Implementation
Z. Wang1,2
, D. Sparks1, and X. Zhang
2
1Department of Math/CS, Virginia Wesleyan College, Norfolk, VA, USA
2College of Information Engineering, Taiyuan University of Technology, Taiyuan, Shanxi, China
Abstract - The paper presents the design and implementation
of the online Web template tool that allows people without any
programming knowledge design and maintain the website
contents. The project incorporates PHP code to create each
page on the website and perform functions for the website,
CSS code to create the style sheet for the website, and MySQL
database to hold information for different parts of the website.
The focus of this study is to create an easily navigated website
that a small company can easily edit to incorporate their own
information.
Keywords: Dynamic Business Web, Web template tool,
database information system, online system, PHP/MySQL
1 Introduction
In last decades, we have experienced the most profound
changes in our daily life. It is so called the information age.
Online information systems truly bring the “Digital
Revolution” in our modern society [1]. The systems can be
found in the forms of the airline reservation system, banking
system, student registration system, etc. For a small business,
construction of such a system may be a big cost. The
importance of this study is to create a website for small
businesses to create and edit their own website for their
companies. The website is dynamic, meaning that the
information on the website can be edited at any time by their
staff, even after it is live. The project presents a website for
small businesses that can be very personalized. It is owned by
the businesses, not on a server from another company. The
business owner can add or edit their website at anytime
without having to hire a programmer. The paper is organized
as follows. In the next section, system design is discussed, and
a case study is presented in the third section. A conclusion is
given in the last section.
2 System design
The goal of the project was to create a website for small
business owners that is easily edited by someone with no
programming or computer science knowledge. The best way
to accomplish this goal was to use PHP coding and a MySQL
database [2] [3]. The PHP code creates a user-friendly
interface for editing the website and displays all the
information onto the website. The MySQL database is used to
store all the information for the website and stores the user
names and passwords.
2.1 The Database Structure
The database consists of four tables, each with a
different purpose. All the tables can be edited or updated
through the PHP files. Below each table name, there will be a
display of the descriptive summary for that table.
Table 1 Business_Name - stores the business name that can be retrieved for use on the website
Table 2 Pages - stores the information for the pages
Int'l Conf. e-Learning, e-Bus., EIS, and e-Gov. | EEE'13 | 225
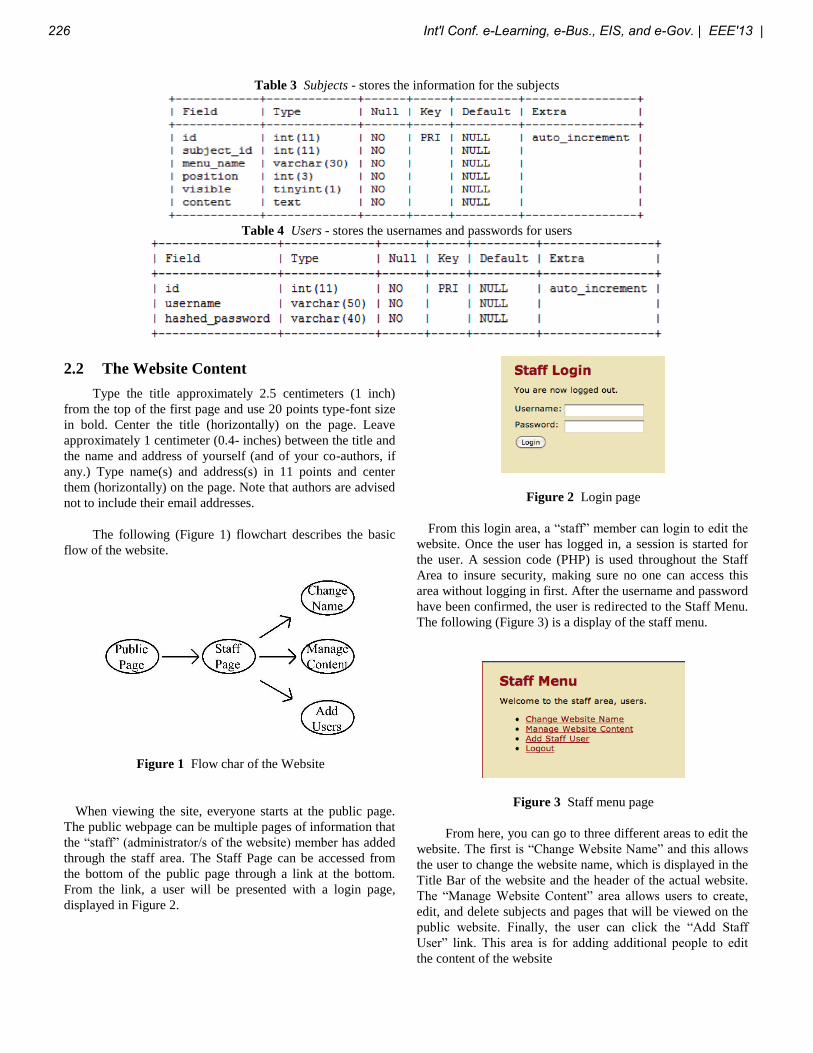
Table 3 Subjects - stores the information for the subjects
Table 4 Users - stores the usernames and passwords for users
2.2 The Website Content
Type the title approximately 2.5 centimeters (1 inch)
from the top of the first page and use 20 points type-font size
in bold. Center the title (horizontally) on the page. Leave
approximately 1 centimeter (0.4- inches) between the title and
the name and address of yourself (and of your co-authors, if
any.) Type name(s) and address(s) in 11 points and center
them (horizontally) on the page. Note that authors are advised
not to include their email addresses.
The following (Figure 1) flowchart describes the basic
flow of the website.
Figure 1 Flow char of the Website
When viewing the site, everyone starts at the public page.
The public webpage can be multiple pages of information that
the “staff” (administrator/s of the website) member has added
through the staff area. The Staff Page can be accessed from
the bottom of the public page through a link at the bottom.
From the link, a user will be presented with a login page,
displayed in Figure 2.
Figure 2 Login page
From this login area, a “staff” member can login to edit the
website. Once the user has logged in, a session is started for
the user. A session code (PHP) is used throughout the Staff
Area to insure security, making sure no one can access this
area without logging in first. After the username and password
have been confirmed, the user is redirected to the Staff Menu.
The following (Figure 3) is a display of the staff menu.
Figure 3 Staff menu page
From here, you can go to three different areas to edit the
website. The first is “Change Website Name” and this allows
the user to change the website name, which is displayed in the
Title Bar of the website and the header of the actual website.
The “Manage Website Content” area allows users to create,
edit, and delete subjects and pages that will be viewed on the
public website. Finally, the user can click the “Add Staff
User” link. This area is for adding additional people to edit
the content of the website
226 Int'l Conf. e-Learning, e-Bus., EIS, and e-Gov. | EEE'13 |
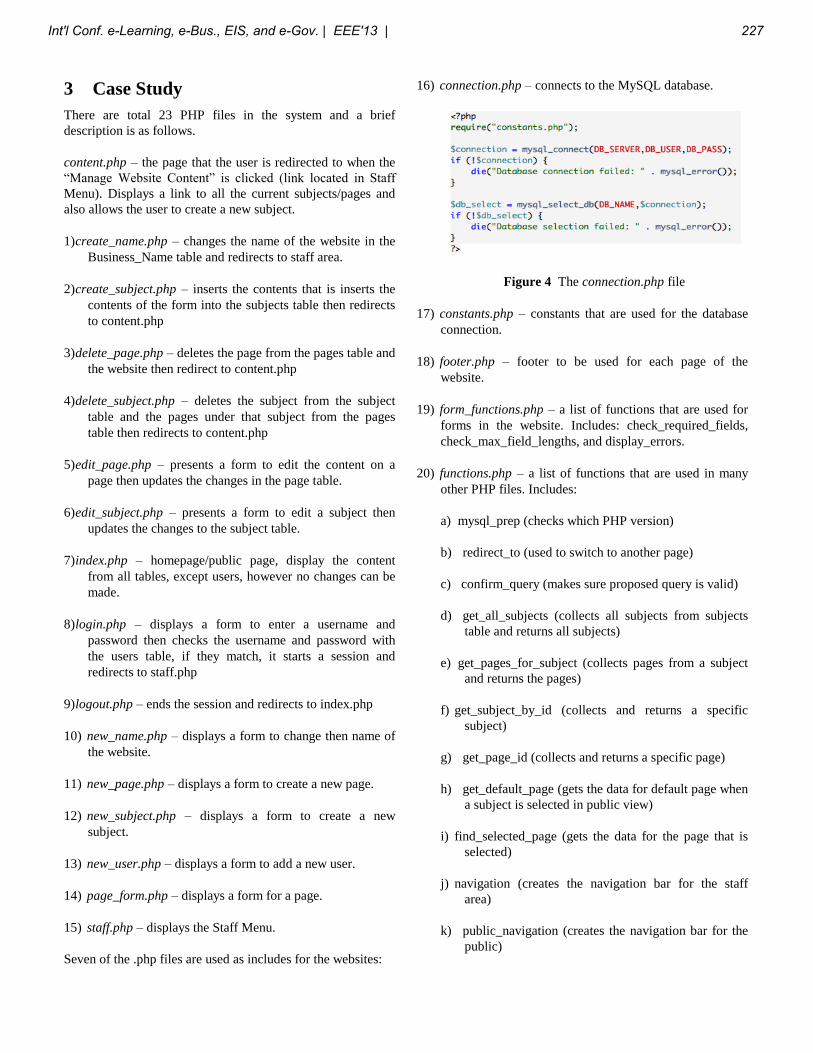
3 Case Study
There are total 23 PHP files in the system and a brief
description is as follows.
content.php – the page that the user is redirected to when the
“Manage Website Content” is clicked (link located in Staff
Menu). Displays a link to all the current subjects/pages and
also allows the user to create a new subject.
1) create_name.php – changes the name of the website in the
Business_Name table and redirects to staff area.
2) create_subject.php – inserts the contents that is inserts the
contents of the form into the subjects table then redirects
to content.php
3) delete_page.php – deletes the page from the pages table and
the website then redirect to content.php
4) delete_subject.php – deletes the subject from the subject
table and the pages under that subject from the pages
table then redirects to content.php
5) edit_page.php – presents a form to edit the content on a
page then updates the changes in the page table.
6) edit_subject.php – presents a form to edit a subject then
updates the changes to the subject table.
7) index.php – homepage/public page, display the content
from all tables, except users, however no changes can be
made.
8) login.php – displays a form to enter a username and
password then checks the username and password with
the users table, if they match, it starts a session and
redirects to staff.php
9) logout.php – ends the session and redirects to index.php
10) new_name.php – displays a form to change then name of
the website.
11) new_page.php – displays a form to create a new page.
12) new_subject.php – displays a form to create a new
subject.
13) new_user.php – displays a form to add a new user.
14) page_form.php – displays a form for a page.
15) staff.php – displays the Staff Menu.
Seven of the .php files are used as includes for the websites:
16) connection.php – connects to the MySQL database.
Figure 4 The connection.php file
17) constants.php – constants that are used for the database
connection.
18) footer.php – footer to be used for each page of the
website.
19) form_functions.php – a list of functions that are used for
forms in the website. Includes: check_required_fields,
check_max_field_lengths, and display_errors.
20) functions.php – a list of functions that are used in many
other PHP files. Includes:
a) mysql_prep (checks which PHP version)
b) redirect_to (used to switch to another page)
c) confirm_query (makes sure proposed query is valid)
d) get_all_subjects (collects all subjects from subjects
table and returns all subjects)
e) get_pages_for_subject (collects pages from a subject
and returns the pages)
f) get_subject_by_id (collects and returns a specific
subject)
g) get_page_id (collects and returns a specific page)
h) get_default_page (gets the data for default page when
a subject is selected in public view)
i) find_selected_page (gets the data for the page that is
selected)
j) navigation (creates the navigation bar for the staff
area)
k) public_navigation (creates the navigation bar for the
public)
Int'l Conf. e-Learning, e-Bus., EIS, and e-Gov. | EEE'13 | 227
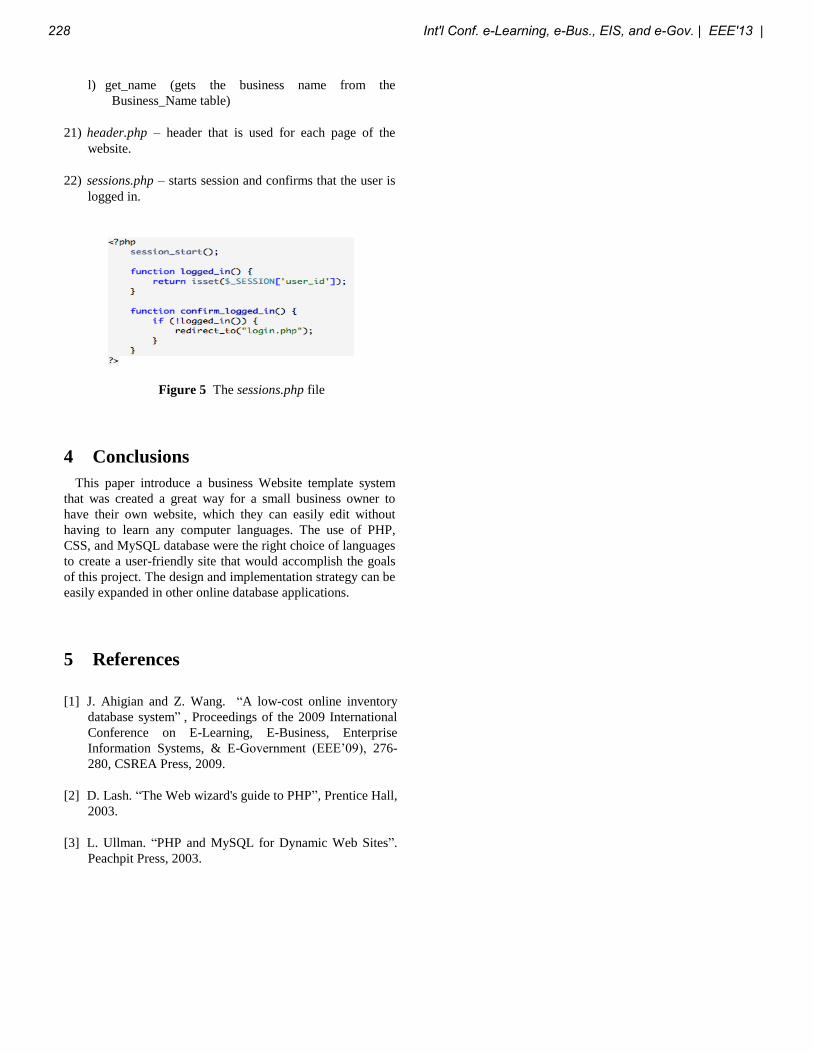
l) get_name (gets the business name from the
Business_Name table)
21) header.php – header that is used for each page of the
website.
22) sessions.php – starts session and confirms that the user is
logged in.
Figure 5 The sessions.php file
4 Conclusions
This paper introduce a business Website template system
that was created a great way for a small business owner to
have their own website, which they can easily edit without
having to learn any computer languages. The use of PHP,
CSS, and MySQL database were the right choice of languages
to create a user-friendly site that would accomplish the goals
of this project. The design and implementation strategy can be
easily expanded in other online database applications.
5 References
[1] J. Ahigian and Z. Wang. “A low-cost online inventory
database system” , Proceedings of the 2009 International
Conference on E-Learning, E-Business, Enterprise
Information Systems, & E-Government (EEE’09), 276-
280, CSREA Press, 2009.
[2] D. Lash. “The Web wizard's guide to PHP”, Prentice Hall,
2003.
[3] L. Ullman. “PHP and MySQL for Dynamic Web Sites”.
Peachpit Press, 2003.
228 Int'l Conf. e-Learning, e-Bus., EIS, and e-Gov. | EEE'13 |
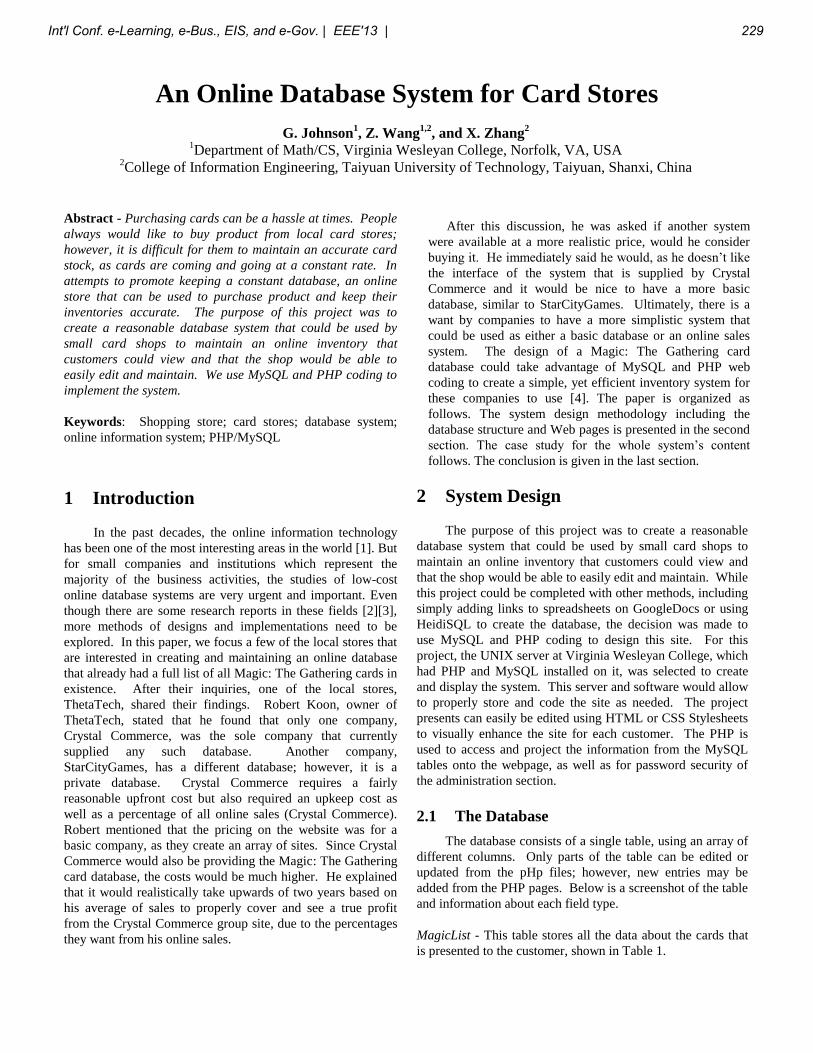
An Online Database System for Card Stores
G. Johnson1, Z. Wang
1,2, and X. Zhang
2
1Department of Math/CS, Virginia Wesleyan College, Norfolk, VA, USA
2College of Information Engineering, Taiyuan University of Technology, Taiyuan, Shanxi, China
Abstract - Purchasing cards can be a hassle at times. People
always would like to buy product from local card stores;
however, it is difficult for them to maintain an accurate card
stock, as cards are coming and going at a constant rate. In
attempts to promote keeping a constant database, an online
store that can be used to purchase product and keep their
inventories accurate. The purpose of this project was to
create a reasonable database system that could be used by
small card shops to maintain an online inventory that
customers could view and that the shop would be able to
easily edit and maintain. We use MySQL and PHP coding to
implement the system.
Keywords: Shopping store; card stores; database system;
online information system; PHP/MySQL
1 Introduction
In the past decades, the online information technology
has been one of the most interesting areas in the world [1]. But
for small companies and institutions which represent the
majority of the business activities, the studies of low-cost
online database systems are very urgent and important. Even
though there are some research reports in these fields [2][3],
more methods of designs and implementations need to be
explored. In this paper, we focus a few of the local stores that
are interested in creating and maintaining an online database
that already had a full list of all Magic: The Gathering cards in
existence. After their inquiries, one of the local stores,
ThetaTech, shared their findings. Robert Koon, owner of
ThetaTech, stated that he found that only one company,
Crystal Commerce, was the sole company that currently
supplied any such database. Another company,
StarCityGames, has a different database; however, it is a
private database. Crystal Commerce requires a fairly
reasonable upfront cost but also required an upkeep cost as
well as a percentage of all online sales (Crystal Commerce).
Robert mentioned that the pricing on the website was for a
basic company, as they create an array of sites. Since Crystal
Commerce would also be providing the Magic: The Gathering
card database, the costs would be much higher. He explained
that it would realistically take upwards of two years based on
his average of sales to properly cover and see a true profit
from the Crystal Commerce group site, due to the percentages
they want from his online sales.
After this discussion, he was asked if another system
were available at a more realistic price, would he consider
buying it. He immediately said he would, as he doesn’t like
the interface of the system that is supplied by Crystal
Commerce and it would be nice to have a more basic
database, similar to StarCityGames. Ultimately, there is a
want by companies to have a more simplistic system that
could be used as either a basic database or an online sales
system. The design of a Magic: The Gathering card
database could take advantage of MySQL and PHP web
coding to create a simple, yet efficient inventory system for
these companies to use [4]. The paper is organized as
follows. The system design methodology including the
database structure and Web pages is presented in the second
section. The case study for the whole system’s content
follows. The conclusion is given in the last section.
2 System Design
The purpose of this project was to create a reasonable
database system that could be used by small card shops to
maintain an online inventory that customers could view and
that the shop would be able to easily edit and maintain. While
this project could be completed with other methods, including
simply adding links to spreadsheets on GoogleDocs or using
HeidiSQL to create the database, the decision was made to
use MySQL and PHP coding to design this site. For this
project, the UNIX server at Virginia Wesleyan College, which
had PHP and MySQL installed on it, was selected to create
and display the system. This server and software would allow
to properly store and code the site as needed. The project
presents can easily be edited using HTML or CSS Stylesheets
to visually enhance the site for each customer. The PHP is
used to access and project the information from the MySQL
tables onto the webpage, as well as for password security of
the administration section.
2.1 The Database
The database consists of a single table, using an array of
different columns. Only parts of the table can be edited or
updated from the pHp files; however, new entries may be
added from the PHP pages. Below is a screenshot of the table
and information about each field type.
MagicList - This table stores all the data about the cards that
is presented to the customer, shown in Table 1.
Int'l Conf. e-Learning, e-Bus., EIS, and e-Gov. | EEE'13 | 229
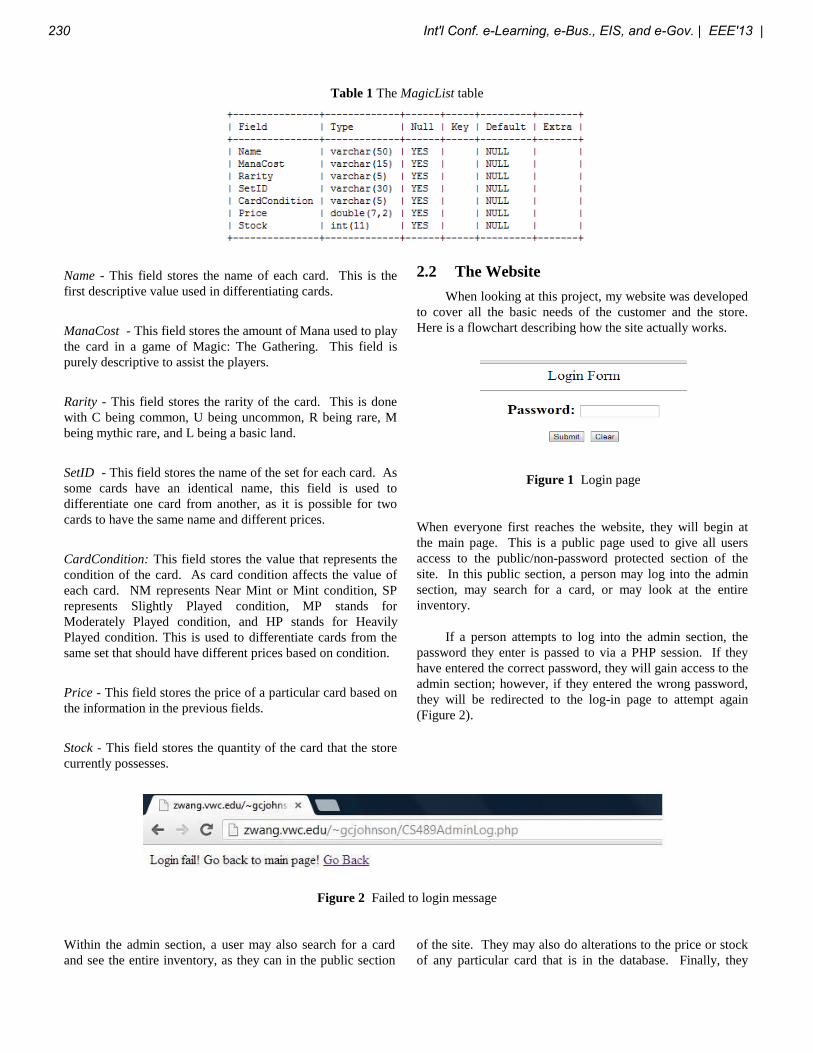
Table 1 The MagicList table
Name - This field stores the name of each card. This is the
first descriptive value used in differentiating cards.
ManaCost - This field stores the amount of Mana used to play
the card in a game of Magic: The Gathering. This field is
purely descriptive to assist the players.
Rarity - This field stores the rarity of the card. This is done
with C being common, U being uncommon, R being rare, M
being mythic rare, and L being a basic land.
SetID - This field stores the name of the set for each card. As
some cards have an identical name, this field is used to
differentiate one card from another, as it is possible for two
cards to have the same name and different prices.
CardCondition: This field stores the value that represents the
condition of the card. As card condition affects the value of
each card. NM represents Near Mint or Mint condition, SP
represents Slightly Played condition, MP stands for
Moderately Played condition, and HP stands for Heavily
Played condition. This is used to differentiate cards from the
same set that should have different prices based on condition.
Price - This field stores the price of a particular card based on
the information in the previous fields.
Stock - This field stores the quantity of the card that the store
currently possesses.
2.2 The Website
When looking at this project, my website was developed
to cover all the basic needs of the customer and the store.
Here is a flowchart describing how the site actually works.
Figure 1 Login page
When everyone first reaches the website, they will begin at
the main page. This is a public page used to give all users
access to the public/non-password protected section of the
site. In this public section, a person may log into the admin
section, may search for a card, or may look at the entire
inventory.
If a person attempts to log into the admin section, the
password they enter is passed to via a PHP session. If they
have entered the correct password, they will gain access to the
admin section; however, if they entered the wrong password,
they will be redirected to the log-in page to attempt again
(Figure 2).
Figure 2 Failed to login message
Within the admin section, a user may also search for a card
and see the entire inventory, as they can in the public section
of the site. They may also do alterations to the price or stock
of any particular card that is in the database. Finally, they
230 Int'l Conf. e-Learning, e-Bus., EIS, and e-Gov. | EEE'13 |
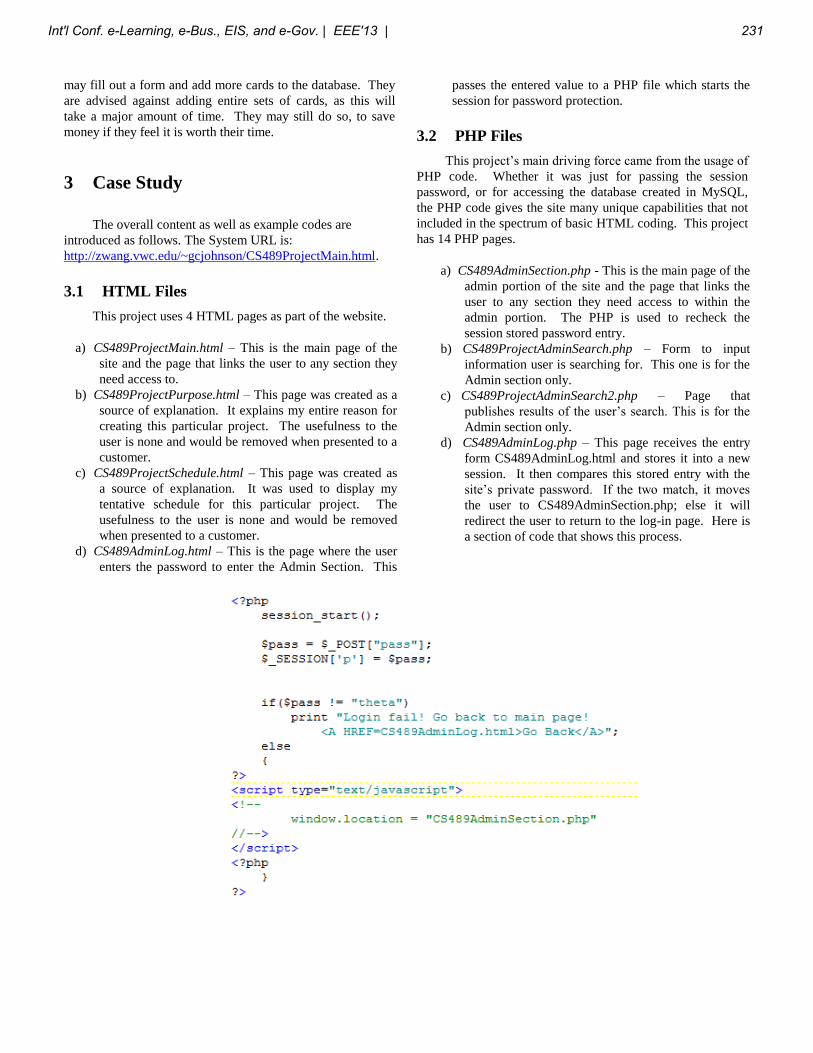
may fill out a form and add more cards to the database. They
are advised against adding entire sets of cards, as this will
take a major amount of time. They may still do so, to save
money if they feel it is worth their time.
3 Case Study
The overall content as well as example codes are
introduced as follows. The System URL is:
http://zwang.vwc.edu/~gcjohnson/CS489ProjectMain.html.
3.1 HTML Files
This project uses 4 HTML pages as part of the website.
a) CS489ProjectMain.html – This is the main page of the
site and the page that links the user to any section they
need access to.
b) CS489ProjectPurpose.html – This page was created as a
source of explanation. It explains my entire reason for
creating this particular project. The usefulness to the
user is none and would be removed when presented to a
customer.
c) CS489ProjectSchedule.html – This page was created as
a source of explanation. It was used to display my
tentative schedule for this particular project. The
usefulness to the user is none and would be removed
when presented to a customer.
d) CS489AdminLog.html – This is the page where the user
enters the password to enter the Admin Section. This
passes the entered value to a PHP file which starts the
session for password protection.
3.2 PHP Files
This project’s main driving force came from the usage of
PHP code. Whether it was just for passing the session
password, or for accessing the database created in MySQL,
the PHP code gives the site many unique capabilities that not
included in the spectrum of basic HTML coding. This project
has 14 PHP pages.
a) CS489AdminSection.php - This is the main page of the
admin portion of the site and the page that links the
user to any section they need access to within the
admin portion. The PHP is used to recheck the
session stored password entry.
b) CS489ProjectAdminSearch.php – Form to input
information user is searching for. This one is for the
Admin section only.
c) CS489ProjectAdminSearch2.php – Page that
publishes results of the user’s search. This is for the
Admin section only.
d) CS489AdminLog.php – This page receives the entry
form CS489AdminLog.html and stores it into a new
session. It then compares this stored entry with the
site’s private password. If the two match, it moves
the user to CS489AdminSection.php; else it will
redirect the user to return to the log-in page. Here is
a section of code that shows this process.
Int'l Conf. e-Learning, e-Bus., EIS, and e-Gov. | EEE'13 | 231
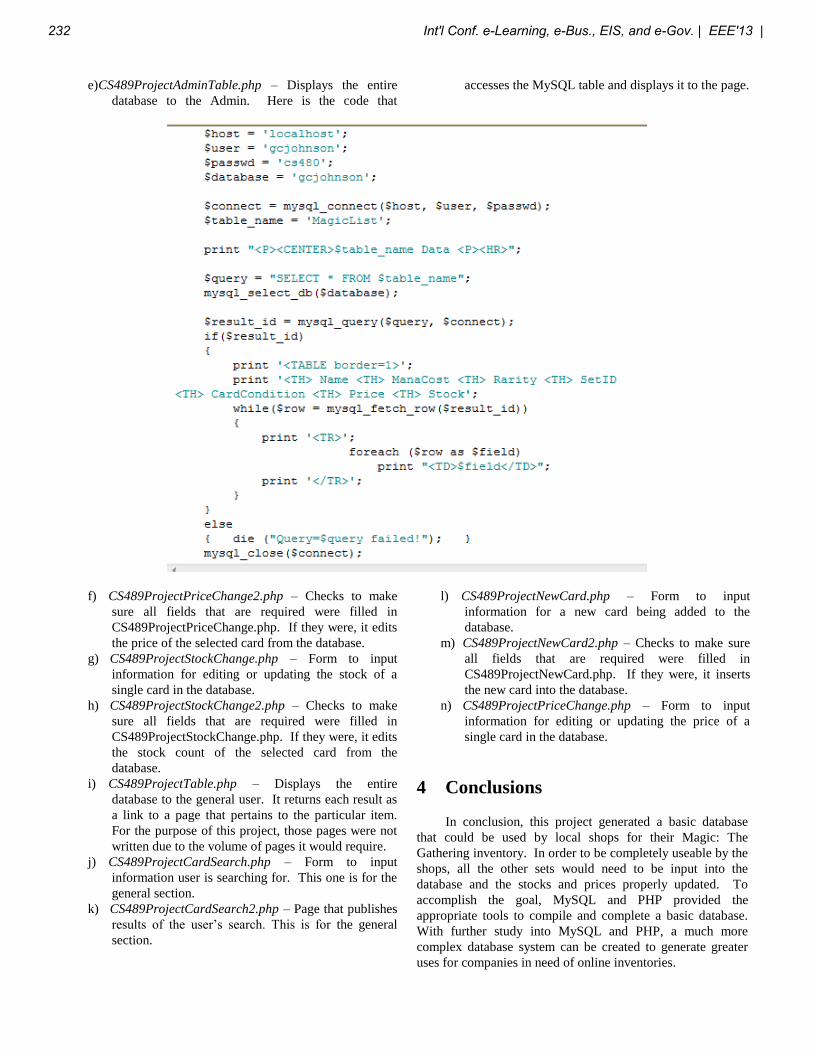
e) CS489ProjectAdminTable.php – Displays the entire
database to the Admin. Here is the code that
accesses the MySQL table and displays it to the page.
f) CS489ProjectPriceChange2.php – Checks to make
sure all fields that are required were filled in
CS489ProjectPriceChange.php. If they were, it edits
the price of the selected card from the database.
g) CS489ProjectStockChange.php – Form to input
information for editing or updating the stock of a
single card in the database.
h) CS489ProjectStockChange2.php – Checks to make
sure all fields that are required were filled in
CS489ProjectStockChange.php. If they were, it edits
the stock count of the selected card from the
database.
i) CS489ProjectTable.php – Displays the entire
database to the general user. It returns each result as
a link to a page that pertains to the particular item.
For the purpose of this project, those pages were not
written due to the volume of pages it would require.
j) CS489ProjectCardSearch.php – Form to input
information user is searching for. This one is for the
general section.
k) CS489ProjectCardSearch2.php – Page that publishes
results of the user’s search. This is for the general
section.
l) CS489ProjectNewCard.php – Form to input
information for a new card being added to the
database.
m) CS489ProjectNewCard2.php – Checks to make sure
all fields that are required were filled in
CS489ProjectNewCard.php. If they were, it inserts
the new card into the database.
n) CS489ProjectPriceChange.php – Form to input
information for editing or updating the price of a
single card in the database.
4 Conclusions
In conclusion, this project generated a basic database
that could be used by local shops for their Magic: The
Gathering inventory. In order to be completely useable by the
shops, all the other sets would need to be input into the
database and the stocks and prices properly updated. To
accomplish the goal, MySQL and PHP provided the
appropriate tools to compile and complete a basic database.
With further study into MySQL and PHP, a much more
complex database system can be created to generate greater
uses for companies in need of online inventories.
232 Int'l Conf. e-Learning, e-Bus., EIS, and e-Gov. | EEE'13 |

5 References
[1] D. Weirich, and Z. Wang, The study of online cataloging
information systems, Proceedings of the 2008
International Conference on Parallel and Distributed
Processing Techniques and Applications (PDPTA’08),
465-470, CSREA Press, 2008
[2] J. Ahigian and Z. Wang, A low-cost online inventory
database system, Proceedings of the 2009 International
Conference on E-Learning, E-Business, Enterprise
Information Systems, & E-Government (EEE’09), 276-
280, CSREA Press, 2009
[3] P. Woodson and Z. J. Wang, A Shopping Store Online
Information System, Proceedings of the first
International Conference on Computing, Measurement,
Control, and Sensor Network, 56-59, IEEE Computer
Society, 2012
[4] D. Lash. The Web wizard's guide to PHP. Prentice Hall,
2003
Int'l Conf. e-Learning, e-Bus., EIS, and e-Gov. | EEE'13 | 233
Abstract — This paper presents a system for mobile
payments denominated S-Wallet using the technology of
Near Field Communications (NFC) currently present in
several smartphone devices. For this system, a protocol
called SWEP was developed with encryption algorithms
(RSA and 3DES). An application for the Android platform
has been also developed in order to carry out performance
tests and security. The protocol presented in this study
proved to be adaptable to different situations of mobile
payment. The S-Wallet system showed satisfactory results
compared to other systems in the literature. The project
carried out in this research can be used to maximize
security, usability and efficiency of mobile payments.
Keywords— Near Field Communications, Android, Mobile
Payments Protocol, Mobile Payments, Mobile Wallet.
1 Introduction
Today, society has witnessed new forms of business
relationship compared to methods of purchase and payment
of the ninth century. The man has totally changed his way
of interacting with society through the creation and
popularization of the Internet occurred in 1994 [1]. After
the introduction of security protocols [2] and technology
such as Digital Subscriber Line (DSL) [3], the World Wide
Web has been used continuously and in the year 2000
happened the “Internet Bubble” [4].
In the “Internet Bubble”, many real-world companies
whether they are telecom operators, financial institutions, or
TV stations sponsored and invested in the creation and
development of web portals for interacting with the Internet
[5]. Emerged in this period the first e-commerce portals (e-
commerce) [6], being performed by platforms such as web
browser, or other types of devices that enable access to the
worldwide web. The market began at this stage a
reformulation, where the individual uses the means of
payment such as credit cards or internet banking to make
payments online.
In parallel to this novelty in the way of interaction
between man and society, there was also an evolution of
telecommunications technologies. The transmission of
voice and data have evolved since the Global System for
Mobile Communications (GSM) [7] and Code Division
Multiple Access (CDMA) [8], to the 2G and 3G networks
with High Speed Downlink Pocket Access Plus (HSPA+)
[9] enabling rapid data transmission between cellular
network, evolving to the current Long Term Evolution
(LTE) [10]. The mobile phone has evolved from a mere
device for voice communication between two people, or
even groups of people, for a multifunction device with
embedded operational system, now called “smartphone”
[11].
Smart in the name and efficient in their functionality,
the integration of an operational system to the smartphone
enabled the reinvention of how humans deal with the
internet, with media and with data. With the ability of just
one touch of your fingers, you can have access to numerous
applications within the Android platform (system created
by Google) [12] or IOs platform (system developed by
Apple) [13].
These applications enable the user interaction with
social networks, reading of news feeds, magazines, and
newspapers. The evolution of devices and mobile
telecommunications networks enabled the human being to
have control over your financial, social and professional life
just by using a network-connected device.
In this environment of technological development, then
we can mention the birth of a new mode of payment
methods. With the wide penetration of smartphone on the
market (today there are about 258 million mobile phones in
Brazil, with 49 million of those using 3G data plan) [14]
and the popularization of e-commerce ($11 billion is the
expected total revenue for 2012) [15] thus arises the market
for e-wallets [16] and m-commerce [17].
M-commerce is defined as mobile payment or m-
payment, where the user makes the payments for purchases
products, services, or accounts via cell phone or
smartphone. This type of payment increases the speed of
financial exchanges performed by the devices, enables
retailers to customize the customer service and reduces
costs for retailers and financial institutions. You can also
consider the m-commerce as a subset of e-commerce, but
with a real interaction between the user and the merchant,
and virtual in how money is represented.
Define also e-wallets or Mobile Wallets as a software
application to perform m-payment that is shipped in the
smartphone with user details (possibly data from your bank
account or credit card). This software allows you to make
payments using this type of device. Users can integrate
inside the smartphone various instruments of debit or credit
in the same application.
The money that was previously used only by paper
money and plastic cards with magnetic stripe or microchip,
is now scanned. Therefore, large technology companies that
perform payments like Google and Paypal, and financial
institutions such as Mastercard and Visa are developing
projects in the sector of mobile payments that is expected to
grow to U.S. $ 172 billion in 2012 [18].
Mobile payments are divided into two types: remote
mobile payments and mobile payments by proximity [19].
S. H. V. C. Silva, E. L. Flôres, G. A. Carrijo, A. C. P. Veiga, and M. B. P. Carneiro
Faculdade de Engenharia Elétrica, Universidade Federal de Uberlândia, Uberlândia, Minas Gerais, Brazil
SWEP Protocol and S-Wallet System - Mobile Payments
using Near Field Communications
234 Int'l Conf. e-Learning, e-Bus., EIS, and e-Gov. | EEE'13 |
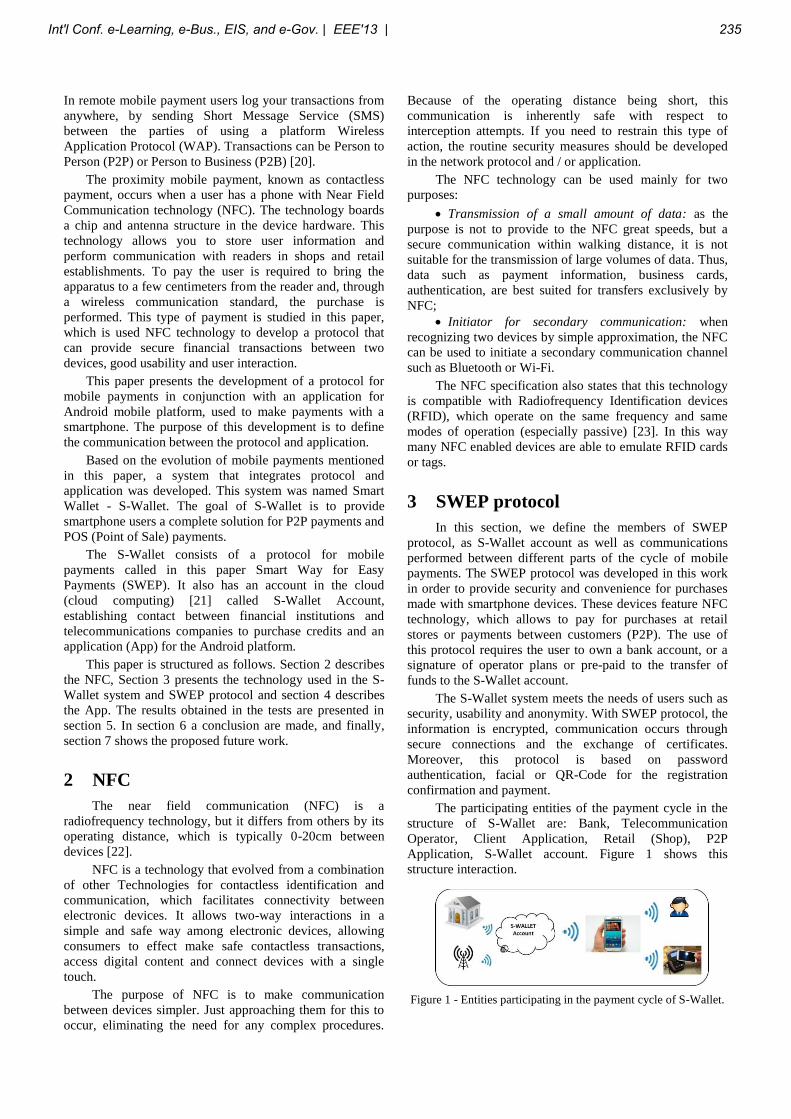
In remote mobile payment users log your transactions from
anywhere, by sending Short Message Service (SMS)
between the parties of using a platform Wireless
Application Protocol (WAP). Transactions can be Person to
Person (P2P) or Person to Business (P2B) [20].
The proximity mobile payment, known as contactless
payment, occurs when a user has a phone with Near Field
Communication technology (NFC). The technology boards
a chip and antenna structure in the device hardware. This
technology allows you to store user information and
perform communication with readers in shops and retail
establishments. To pay the user is required to bring the
apparatus to a few centimeters from the reader and, through
a wireless communication standard, the purchase is
performed. This type of payment is studied in this paper,
which is used NFC technology to develop a protocol that
can provide secure financial transactions between two
devices, good usability and user interaction.
This paper presents the development of a protocol for
mobile payments in conjunction with an application for
Android mobile platform, used to make payments with a
smartphone. The purpose of this development is to define
the communication between the protocol and application.
Based on the evolution of mobile payments mentioned
in this paper, a system that integrates protocol and
application was developed. This system was named Smart
Wallet - S-Wallet. The goal of S-Wallet is to provide
smartphone users a complete solution for P2P payments and
POS (Point of Sale) payments.
The S-Wallet consists of a protocol for mobile
payments called in this paper Smart Way for Easy
Payments (SWEP). It also has an account in the cloud
(cloud computing) [21] called S-Wallet Account,
establishing contact between financial institutions and
telecommunications companies to purchase credits and an
application (App) for the Android platform.
This paper is structured as follows. Section 2 describes
the NFC, Section 3 presents the technology used in the S-
Wallet system and SWEP protocol and section 4 describes
the App. The results obtained in the tests are presented in
section 5. In section 6 a conclusion are made, and finally,
section 7 shows the proposed future work.
2 NFC
The near field communication (NFC) is a
radiofrequency technology, but it differs from others by its
operating distance, which is typically 0-20cm between
devices [22].
NFC is a technology that evolved from a combination
of other Technologies for contactless identification and
communication, which facilitates connectivity between
electronic devices. It allows two-way interactions in a
simple and safe way among electronic devices, allowing
consumers to effect make safe contactless transactions,
access digital content and connect devices with a single
touch.
The purpose of NFC is to make communication
between devices simpler. Just approaching them for this to
occur, eliminating the need for any complex procedures.
Because of the operating distance being short, this
communication is inherently safe with respect to
interception attempts. If you need to restrain this type of
action, the routine security measures should be developed
in the network protocol and / or application.
The NFC technology can be used mainly for two
purposes:
Transmission of a small amount of data: as the
purpose is not to provide to the NFC great speeds, but a
secure communication within walking distance, it is not
suitable for the transmission of large volumes of data. Thus,
data such as payment information, business cards,
authentication, are best suited for transfers exclusively by
NFC;
Initiator for secondary communication: when
recognizing two devices by simple approximation, the NFC
can be used to initiate a secondary communication channel
such as Bluetooth or Wi-Fi.
The NFC specification also states that this technology
is compatible with Radiofrequency Identification devices
(RFID), which operate on the same frequency and same
modes of operation (especially passive) [23]. In this way
many NFC enabled devices are able to emulate RFID cards
or tags.
3 SWEP protocol
In this section, we define the members of SWEP
protocol, as S-Wallet account as well as communications
performed between different parts of the cycle of mobile
payments. The SWEP protocol was developed in this work
in order to provide security and convenience for purchases
made with smartphone devices. These devices feature NFC
technology, which allows to pay for purchases at retail
stores or payments between customers (P2P). The use of
this protocol requires the user to own a bank account, or a
signature of operator plans or pre-paid to the transfer of
funds to the S-Wallet account.
The S-Wallet system meets the needs of users such as
security, usability and anonymity. With SWEP protocol, the
information is encrypted, communication occurs through
secure connections and the exchange of certificates.
Moreover, this protocol is based on password
authentication, facial or QR-Code for the registration
confirmation and payment.
The participating entities of the payment cycle in the
structure of S-Wallet are: Bank, Telecommunication
Operator, Client Application, Retail (Shop), P2P
Application, S-Wallet account. Figure 1 shows this
structure interaction.
Figure 1 - Entities participating in the payment cycle of S-Wallet.
Int'l Conf. e-Learning, e-Bus., EIS, and e-Gov. | EEE'13 | 235
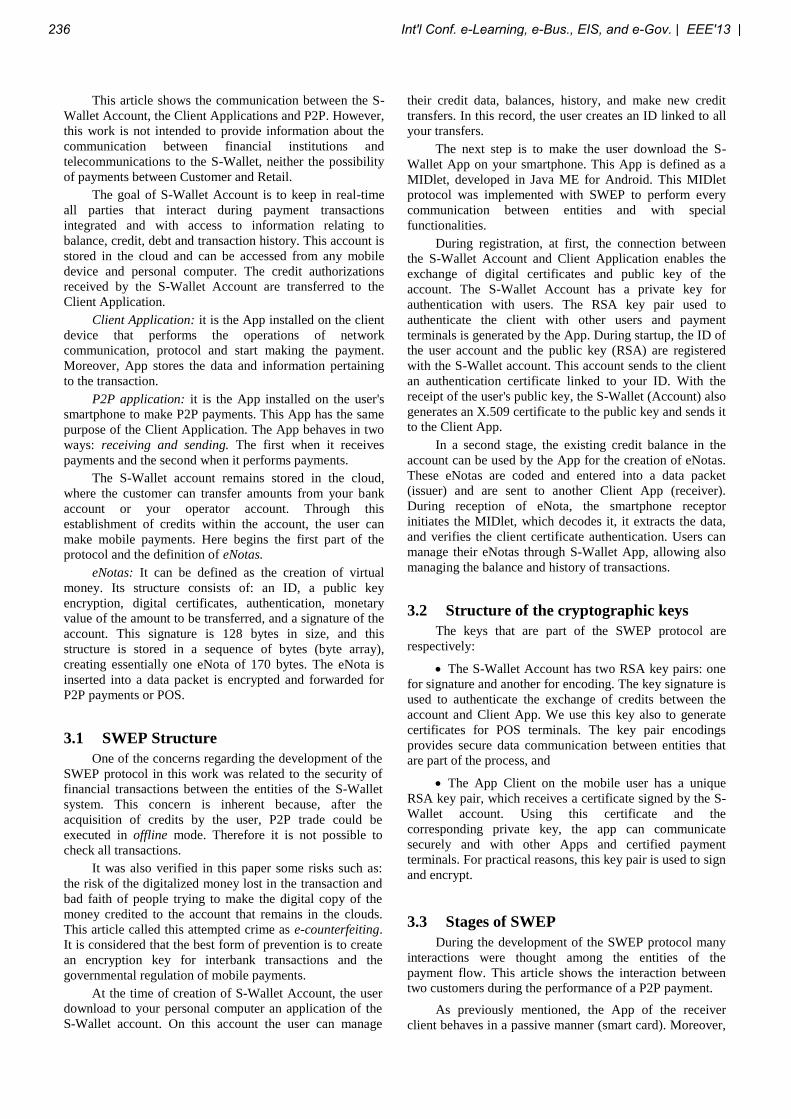
This article shows the communication between the S-
Wallet Account, the Client Applications and P2P. However,
this work is not intended to provide information about the
communication between financial institutions and
telecommunications to the S-Wallet, neither the possibility
of payments between Customer and Retail.
The goal of S-Wallet Account is to keep in real-time
all parties that interact during payment transactions
integrated and with access to information relating to
balance, credit, debt and transaction history. This account is
stored in the cloud and can be accessed from any mobile
device and personal computer. The credit authorizations
received by the S-Wallet Account are transferred to the
Client Application.
Client Application: it is the App installed on the client
device that performs the operations of network
communication, protocol and start making the payment.
Moreover, App stores the data and information pertaining
to the transaction.
P2P application: it is the App installed on the user's
smartphone to make P2P payments. This App has the same
purpose of the Client Application. The App behaves in two
ways: receiving and sending. The first when it receives
payments and the second when it performs payments.
The S-Wallet account remains stored in the cloud,
where the customer can transfer amounts from your bank
account or your operator account. Through this
establishment of credits within the account, the user can
make mobile payments. Here begins the first part of the
protocol and the definition of eNotas.
eNotas: It can be defined as the creation of virtual
money. Its structure consists of: an ID, a public key
encryption, digital certificates, authentication, monetary
value of the amount to be transferred, and a signature of the
account. This signature is 128 bytes in size, and this
structure is stored in a sequence of bytes (byte array),
creating essentially one eNota of 170 bytes. The eNota is
inserted into a data packet is encrypted and forwarded for
P2P payments or POS.
3.1 SWEP Structure
One of the concerns regarding the development of the
SWEP protocol in this work was related to the security of
financial transactions between the entities of the S-Wallet
system. This concern is inherent because, after the
acquisition of credits by the user, P2P trade could be
executed in offline mode. Therefore it is not possible to
check all transactions.
It was also verified in this paper some risks such as:
the risk of the digitalized money lost in the transaction and
bad faith of people trying to make the digital copy of the
money credited to the account that remains in the clouds.
This article called this attempted crime as e-counterfeiting.
It is considered that the best form of prevention is to create
an encryption key for interbank transactions and the
governmental regulation of mobile payments.
At the time of creation of S-Wallet Account, the user
download to your personal computer an application of the
S-Wallet account. On this account the user can manage
their credit data, balances, history, and make new credit
transfers. In this record, the user creates an ID linked to all
your transfers.
The next step is to make the user download the S-
Wallet App on your smartphone. This App is defined as a
MIDlet, developed in Java ME for Android. This MIDlet
protocol was implemented with SWEP to perform every
communication between entities and with special
functionalities.
During registration, at first, the connection between
the S-Wallet Account and Client Application enables the
exchange of digital certificates and public key of the
account. The S-Wallet Account has a private key for
authentication with users. The RSA key pair used to
authenticate the client with other users and payment
terminals is generated by the App. During startup, the ID of
the user account and the public key (RSA) are registered
with the S-Wallet account. This account sends to the client
an authentication certificate linked to your ID. With the
receipt of the user's public key, the S-Wallet (Account) also
generates an X.509 certificate to the public key and sends it
to the Client App.
In a second stage, the existing credit balance in the
account can be used by the App for the creation of eNotas.
These eNotas are coded and entered into a data packet
(issuer) and are sent to another Client App (receiver).
During reception of eNota, the smartphone receptor
initiates the MIDlet, which decodes it, it extracts the data,
and verifies the client certificate authentication. Users can
manage their eNotas through S-Wallet App, allowing also
managing the balance and history of transactions.
3.2 Structure of the cryptographic keys
The keys that are part of the SWEP protocol are
respectively:
The S-Wallet Account has two RSA key pairs: one
for signature and another for encoding. The key signature is
used to authenticate the exchange of credits between the
account and Client App. We use this key also to generate
certificates for POS terminals. The key pair encodings
provides secure data communication between entities that
are part of the process, and
The App Client on the mobile user has a unique
RSA key pair, which receives a certificate signed by the S-
Wallet account. Using this certificate and the
corresponding private key, the app can communicate
securely and with other Apps and certified payment
terminals. For practical reasons, this key pair is used to sign
and encrypt.
3.3 Stages of SWEP
During the development of the SWEP protocol many
interactions were thought among the entities of the
payment flow. This article shows the interaction between
two customers during the performance of a P2P payment.
As previously mentioned, the App of the receiver
client behaves in a passive manner (smart card). Moreover,
236 Int'l Conf. e-Learning, e-Bus., EIS, and e-Gov. | EEE'13 |
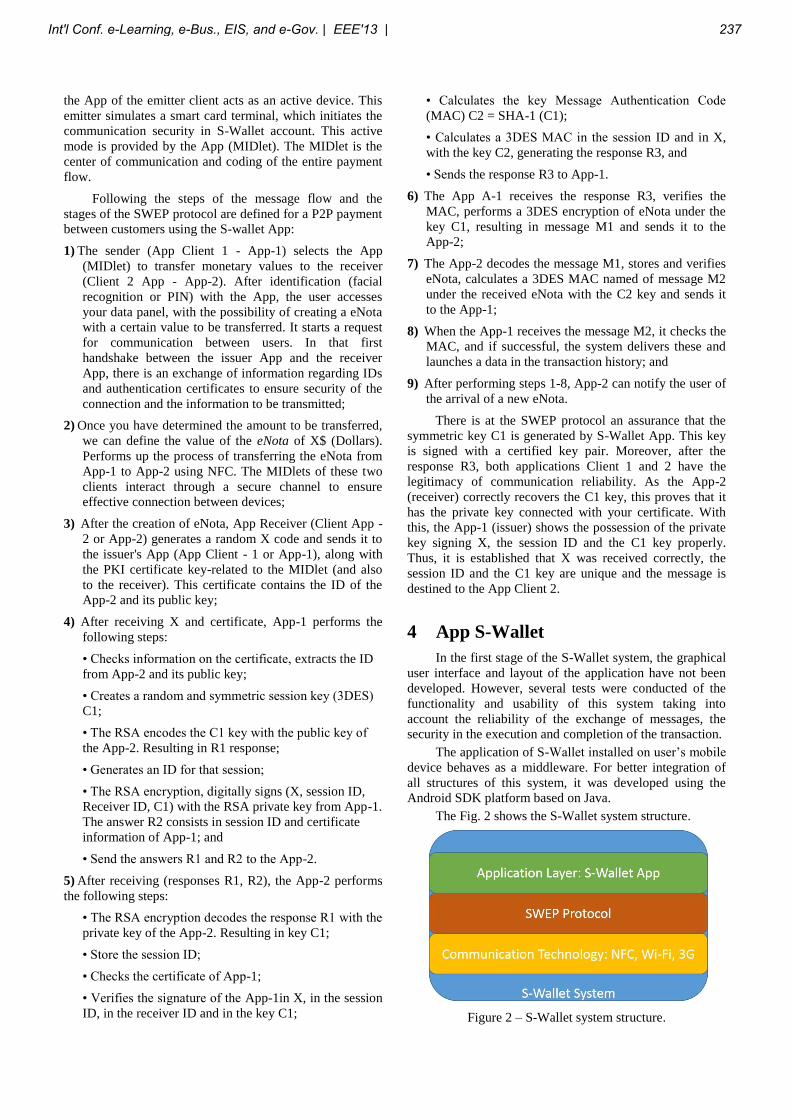
the App of the emitter client acts as an active device. This
emitter simulates a smart card terminal, which initiates the
communication security in S-Wallet account. This active
mode is provided by the App (MIDlet). The MIDlet is the
center of communication and coding of the entire payment
flow.
Following the steps of the message flow and the
stages of the SWEP protocol are defined for a P2P payment
between customers using the S-wallet App:
1) The sender (App Client 1 - App-1) selects the App
(MIDlet) to transfer monetary values to the receiver
(Client 2 App - App-2). After identification (facial
recognition or PIN) with the App, the user accesses
your data panel, with the possibility of creating a eNota
with a certain value to be transferred. It starts a request
for communication between users. In that first
handshake between the issuer App and the receiver
App, there is an exchange of information regarding IDs
and authentication certificates to ensure security of the
connection and the information to be transmitted;
2) Once you have determined the amount to be transferred,
we can define the value of the eNota of X$ (Dollars).
Performs up the process of transferring the eNota from
App-1 to App-2 using NFC. The MIDlets of these two
clients interact through a secure channel to ensure
effective connection between devices;
3) After the creation of eNota, App Receiver (Client App -
2 or App-2) generates a random X code and sends it to
the issuer's App (App Client - 1 or App-1), along with
the PKI certificate key-related to the MIDlet (and also
to the receiver). This certificate contains the ID of the
App-2 and its public key;
4) After receiving X and certificate, App-1 performs the
following steps:
• Checks information on the certificate, extracts the ID
from App-2 and its public key;
• Creates a random and symmetric session key (3DES)
C1;
• The RSA encodes the C1 key with the public key of
the App-2. Resulting in R1 response;
• Generates an ID for that session;
• The RSA encryption, digitally signs (X, session ID,
Receiver ID, C1) with the RSA private key from App-1.
The answer R2 consists in session ID and certificate
information of App-1; and
• Send the answers R1 and R2 to the App-2.
5) After receiving (responses R1, R2), the App-2 performs
the following steps:
• The RSA encryption decodes the response R1 with the
private key of the App-2. Resulting in key C1;
• Store the session ID;
• Checks the certificate of App-1;
• Verifies the signature of the App-1in X, in the session
ID, in the receiver ID and in the key C1;
• Calculates the key Message Authentication Code
(MAC) C2 = SHA-1 (C1);
• Calculates a 3DES MAC in the session ID and in X,
with the key C2, generating the response R3, and
• Sends the response R3 to App-1.
6) The App A-1 receives the response R3, verifies the
MAC, performs a 3DES encryption of eNota under the
key C1, resulting in message M1 and sends it to the
App-2;
7) The App-2 decodes the message M1, stores and verifies
eNota, calculates a 3DES MAC named of message M2
under the received eNota with the C2 key and sends it
to the App-1;
8) When the App-1 receives the message M2, it checks the
MAC, and if successful, the system delivers these and
launches a data in the transaction history; and
9) After performing steps 1-8, App-2 can notify the user of
the arrival of a new eNota.
There is at the SWEP protocol an assurance that the
symmetric key C1 is generated by S-Wallet App. This key
is signed with a certified key pair. Moreover, after the
response R3, both applications Client 1 and 2 have the
legitimacy of communication reliability. As the App-2
(receiver) correctly recovers the C1 key, this proves that it
has the private key connected with your certificate. With
this, the App-1 (issuer) shows the possession of the private
key signing X, the session ID and the C1 key properly.
Thus, it is established that X was received correctly, the
session ID and the C1 key are unique and the message is
destined to the App Client 2.
4 App S-Wallet
In the first stage of the S-Wallet system, the graphical
user interface and layout of the application have not been
developed. However, several tests were conducted of the
functionality and usability of this system taking into
account the reliability of the exchange of messages, the
security in the execution and completion of the transaction.
The application of S-Wallet installed on user’s mobile
device behaves as a middleware. For better integration of
all structures of this system, it was developed using the
Android SDK platform based on Java.
The Fig. 2 shows the S-Wallet system structure.
Figure 2 – S-Wallet system structure.
Int'l Conf. e-Learning, e-Bus., EIS, and e-Gov. | EEE'13 | 237
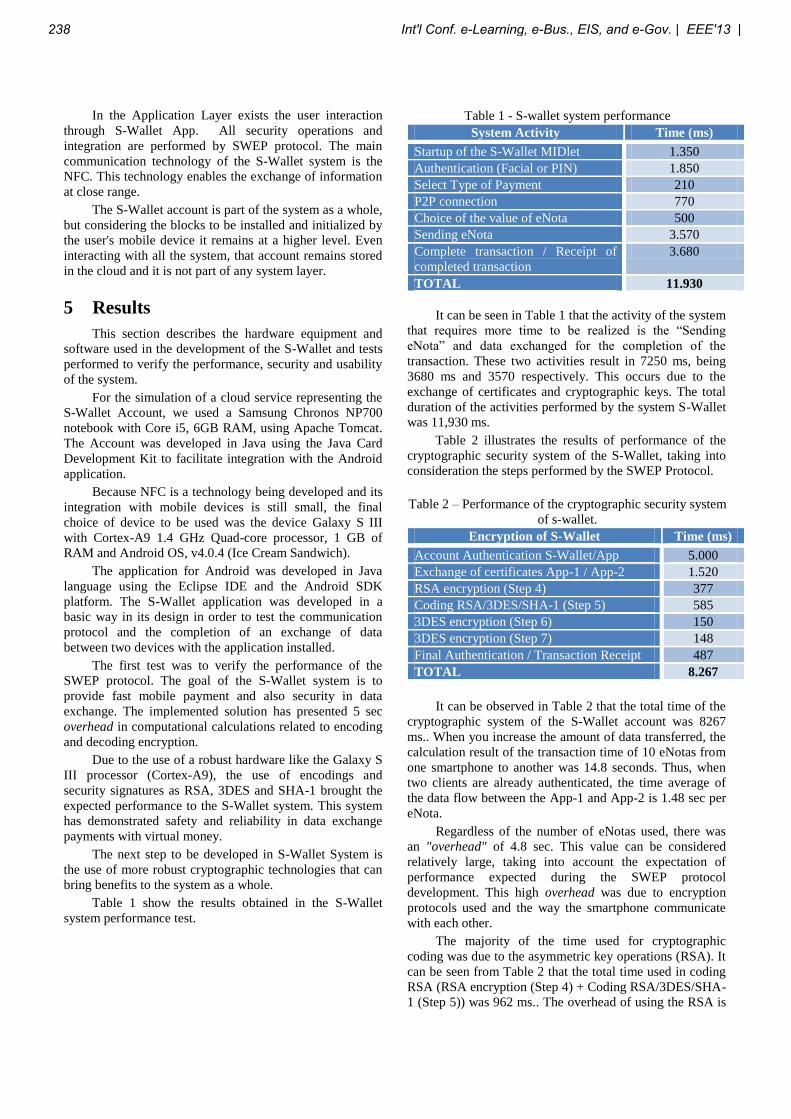
In the Application Layer exists the user interaction
through S-Wallet App. All security operations and
integration are performed by SWEP protocol. The main
communication technology of the S-Wallet system is the
NFC. This technology enables the exchange of information
at close range.
The S-Wallet account is part of the system as a whole,
but considering the blocks to be installed and initialized by
the user's mobile device it remains at a higher level. Even
interacting with all the system, that account remains stored
in the cloud and it is not part of any system layer.
5 Results
This section describes the hardware equipment and
software used in the development of the S-Wallet and tests
performed to verify the performance, security and usability
of the system.
For the simulation of a cloud service representing the
S-Wallet Account, we used a Samsung Chronos NP700
notebook with Core i5, 6GB RAM, using Apache Tomcat.
The Account was developed in Java using the Java Card
Development Kit to facilitate integration with the Android
application.
Because NFC is a technology being developed and its
integration with mobile devices is still small, the final
choice of device to be used was the device Galaxy S III
with Cortex-A9 1.4 GHz Quad-core processor, 1 GB of
RAM and Android OS, v4.0.4 (Ice Cream Sandwich).
The application for Android was developed in Java
language using the Eclipse IDE and the Android SDK
platform. The S-Wallet application was developed in a
basic way in its design in order to test the communication
protocol and the completion of an exchange of data
between two devices with the application installed.
The first test was to verify the performance of the
SWEP protocol. The goal of the S-Wallet system is to
provide fast mobile payment and also security in data
exchange. The implemented solution has presented 5 sec
overhead in computational calculations related to encoding
and decoding encryption.
Due to the use of a robust hardware like the Galaxy S
III processor (Cortex-A9), the use of encodings and
security signatures as RSA, 3DES and SHA-1 brought the
expected performance to the S-Wallet system. This system
has demonstrated safety and reliability in data exchange
payments with virtual money.
The next step to be developed in S-Wallet System is
the use of more robust cryptographic technologies that can
bring benefits to the system as a whole.
Table 1 show the results obtained in the S-Wallet
system performance test.
Table 1 - S-wallet system performance
System Activity Time (ms)
Startup of the S-Wallet MIDlet 1.350
Authentication (Facial or PIN) 1.850
Select Type of Payment 210
P2P connection 770
Choice of the value of eNota 500
Sending eNota 3.570
Complete transaction / Receipt of
completed transaction
3.680
TOTAL 11.930
It can be seen in Table 1 that the activity of the system
that requires more time to be realized is the “Sending
eNota” and data exchanged for the completion of the
transaction. These two activities result in 7250 ms, being
3680 ms and 3570 respectively. This occurs due to the
exchange of certificates and cryptographic keys. The total
duration of the activities performed by the system S-Wallet
was 11,930 ms.
Table 2 illustrates the results of performance of the
cryptographic security system of the S-Wallet, taking into
consideration the steps performed by the SWEP Protocol.
Table 2 – Performance of the cryptographic security system
of s-wallet.
Encryption of S-Wallet Time (ms)
Account Authentication S-Wallet/App 5.000
Exchange of certificates App-1 / App-2 1.520
RSA encryption (Step 4) 377
Coding RSA/3DES/SHA-1 (Step 5) 585
3DES encryption (Step 6) 150
3DES encryption (Step 7) 148
Final Authentication / Transaction Receipt 487
TOTAL 8.267
It can be observed in Table 2 that the total time of the
cryptographic system of the S-Wallet account was 8267
ms.. When you increase the amount of data transferred, the
calculation result of the transaction time of 10 eNotas from
one smartphone to another was 14.8 seconds. Thus, when
two clients are already authenticated, the time average of
the data flow between the App-1 and App-2 is 1.48 sec per
eNota.
Regardless of the number of eNotas used, there was
an "overhead" of 4.8 sec. This value can be considered
relatively large, taking into account the expectation of
performance expected during the SWEP protocol
development. This high overhead was due to encryption
protocols used and the way the smartphone communicate
with each other.
The majority of the time used for cryptographic
coding was due to the asymmetric key operations (RSA). It
can be seen from Table 2 that the total time used in coding
RSA (RSA encryption (Step 4) + Coding RSA/3DES/SHA-
1 (Step 5)) was 962 ms.. The overhead of using the RSA is
238 Int'l Conf. e-Learning, e-Bus., EIS, and e-Gov. | EEE'13 |
another significant reason for the high time of the
transaction for the S-Wallet System.
6 Conclusions
This paper presented a system for mobile payments
called S-Wallet using NFC technology currently present in
several smartphone devices. For this system, we developed
a protocol named SWEP with encryption algorithms (RSA
and 3DES) and certificate exchange between the parties to
make a highly secure communication.
The protocol SWEP fulfilled the requirements of
reliability, safety and speed in the financial transaction of
sending the eNota. In order to perform the tests, the
application for the Android platform was developed in a
simple manner. The S-Wallet system proposed in this
article uses the Android SDK based on JAVA.
The main advantage of S-Wallet system compared to
systems currently developed is that the integration between
the S-Wallet Account, the App and SWEP protocol
provided more security and speed for the transaction of
mobile payments.
At first the S-Wallet System user depends only on
devices online to receive credit on your account. However
during the continuity of transactions, everything else occur
offline.
The efficiency of encryption keys of SWEP protocol
enabled security and usability for the end user.
7 Future work
As future work we intend to develop a protocol with
encryption keys such as AES and ECDSA. These keys can
provide higher speed and higher performance for the S-
Wallet.
The speed of the encryption system can be improved
with the analysis and development of a code that is based
on hybrid algorithms using symmetric and asymmetric
keys.
Moreover, as future work, we will improve the user
interface by developing a more interactive layout. You can
with this layout test the system in the field, bringing the
results that may be studied. These studies will allow us to
compare the S-Wallet System with other existing
technologies, helping to continually improve this system in
future versions.
8 References
[1] T. J. Berners-Lee, R. Cailliau, J-F Groff, B.
Pollermann, (1992) CERN, "World-Wide Web: An
Information Infrastructure for High-Energy Physics",
Proceedings published by World Scientific, Singapore, ed.
D Perret-Gallix, 1992.
[2] E. Rescorla, (2000) “Http over tls”, RFC 2818.
[3] T. Starr, J. M. Cioffi, P. J. Silverman, “Understanding
digital subscriber line technology”, 1999 - Prentice Hall.
[4] A. B. Perkins, M. C. Perkins, “The Internet bubble:
the inside story on why it burst--and what you can do to
profit now!”, 2001 – Harper business.
[5] J. M. Gallaugher, C. E. Downing, “Portal Combat: An
Empirical Study of Competition in the Web Portal
Industry”, Journal of Information Technology
Management. Vol. 11, No. 1-2, 2000, pp. 13-24.
[6] E. Turban, J. K. Lee, D. King, T. P. Liang, and D.
Turban. 2009. “Electronic Commerce 2010 (6th ed..)”.
Prentice Hall Press, Upper Saddle River, NJ, USA.
[7] M. Mouly, Marie-Bernadette Pautet. 1992. “The GSM
System for Mobile Communications”. Telecom Publishing.
[8] Andrew J. Viterbi. 1995. “CDMA: Principles of
Spread Spectrum Communication”. Addison Wesley
Longman Publishing Co., Inc., Redwood City, CA, USA.
[9] Harri Holma and Antti Toskala.
2006. “HSDPA/HSUPA for UMTS: High Speed Radio
Access for Mobile Communications”. John Wiley & Sons.
[10] Stefania Sesia, Issam Toufik, and Matthew Baker.
2009. Lte, the UMTS Long Term Evolution: From Theory
to Practice. Wiley Publishing.
[11] PC Magazine. (2011b). “Smartphone Definition from
PC Magazine Encyclopedia. PC Magazine. Accessed on
August 20th, 2012:
http://www.pcmag.com/encyclopedia_term/0,2542,t=Smart
phone&i=51537,00.asp
[12] Margaret Butler. 2011. Android: Changing the Mobile
Landscape. IEEE Pervasive Computing 10, 1 (January
2011), 4-7.
[13] Sharon P. Hall and Eric Anderson. 2009. Operating
systems for mobile computing. J. Comput. Small Coll. 25,
2 (December 2009), 64-71.
[14] TELECO – Inteligência em Telecomunicações – “3G:
3ª Geração de Celular no Brasil”. Avalable at:
http://www.teleco.com.br/3g_brasil.asp. Data de acesso:
20/08/2012
[15] PLUS Consultoria em e-commerce – “E-commerce
no Brasil”. Avalable at:
http://www.plusecommerce.com.br/p/e-commerce-no-
brasil.html. Data de acesso: 20/08/2012
[16] Gusev, Marjan. "E-Commerce A big step towards E-
Bussiness". Institute of Informatics Faculty
of National Sciences and Mathematics, University St .Cyril
And Methodius”, 2011.
[17] Dahlberg, Tomi, et al. "Past, present and future of
mobile payments research: A literature review." Electronic
Commerce Research and Applications 7.2 (2008): 165-181.
Int'l Conf. e-Learning, e-Bus., EIS, and e-Gov. | EEE'13 | 239

[18] ABRAS – Associação Brasileira de Supermercados –
“Tecnologia poderá impulsionar reinvenção do dinheiro”.
Avalable at:
http://www.abrasnet.com.br/clipping.php?area=5&clipping
=31250. Data de acesso: 21/08/2012.
[19] Urbino, Natacha P., et al. "Mobile Payment: Uma
visão geral." FaSCi-Tech1.3 (2012).
[20] Shy, Oz. "Person-to-person electronic funds transfers:
recent developments and policy issues." FRB of Boston
Public Policy Discussion Paper 10-1 (2010).
[21] Armbrust, Michael, et al. "A view of cloud
computing." Communications of the ACM 53.4 (2010): 50-
58.
[22] Fischer, Jeffrey. "NFC in cell phones: The new
paradigm for an interactive world [Near-Field
Communications]." Communications Magazine, IEEE 47.6
(2009): 22-28.
[23] Michahelles, Florian, et al. "Pervasive RFID and near
field communication technology." Pervasive Computing,
IEEE 6.3 (2007): 94-96.
240 Int'l Conf. e-Learning, e-Bus., EIS, and e-Gov. | EEE'13 |
Multidisciplinarity in Knowledge Transmision
Management System (KTMS) evaluation.
Etienne Z. Gnimpieba, Douglas Jennewein, Luke Fuhrman, Carol M. Lushbough
Computer Science Department, University of South Dakota, 414 E. Clark St. Vermillion, SD 57069, USA,
{Etienne.gnimpieba; Doug.Jennewein; Luke.Fuhrman, Carol.Lushbough}@usd.edu
Corresponding author: [email protected], +1 605 223 0383.
~o~
Abstract: Translational pluridisciplinary
education has become a strong academic
challenge in this century. The internet has
proved its potential for creating online learning
environments to support education. The
development of the web based knowledge
transmission management system (KTMS)
faces many shortcoming, including lack of
pedagogical consideration in the design of web-
based learning Systems, lack of interoperability
and shareable learning objects, and lack of
interdisciplinary integration. These
shortcomings are not easy to identify by
common end users. Decision makers need
formal indicators to guide their choice. This
paper aim to provide a flexible criteria set for
KTMS evaluation involving multidisciplinarity,
sharability and collaborativity.
Keywords: knowledge, learning object, learning
object repositories, evaluation criteria, education,
multidisciplinary.
1. Introduction
Personalized e-commerce improves customer-
relationship management (CRM) to provide better
service by anticipating customer needs even if data
are from different data source. This is because
customer satisfaction is the most important focus
in CRM systems design. Education aims is ensure
that tools improve students’ learning process. A
Knowledge Transmision Management System
(KTMS) is define to be a web portal or tool that
provides resources for learning, teaching, training,
or helping with executing work/problems. It can
be a learning object repository (LOR), learning
management system (LMS), courses management
system (CMS), virtual learning environment
(VLE), computer based training (CBT) portal or a
simple website. Any Knowledge Transmission
Management System (KTMS) must enable users to
personalize their learning in order to adapt to
changing business needs (career profile). These
requirements expose many weaknesses of KTMS:
interoperability, share ability, industry guidance
for manageable system design, and pedagogical
consideration in the design of web-based learning
systems and multidisciplinary management [1].
Among other things, the transversality of certain
disciplines such as bioinformatics does not
facilitate the construction of a linear training
profile, based on a set of pre-requisites of formal
education discipline [2]. This feature is a weakness
because it contradicts the need for specialization
training and the increasing need for crossing
disciplines (interdisciplinarity, pluridisciplinarity).
But it may prove to be a strength in the
construction of a flexible profile, including
adaptability to a particular career profile.
We are witnessing a growing development
of tools for managing the transmission of
knowledge using computer engineering, called
computer-based teaching education (CBTE).
Users need to choose an appropriate tool; and to be
able to evaluate the quality of the results obtained
from using that tool. The existing evaluation
criteria for KTMS tools are based on the specific
needs of particular users or owners of these tools
[3] [4] [5]. In addition, these criteria do not take
into account the multidisciplinarity aspects of the
new generation of academic disciplines
(Bioinformatics, sociolinguistics,
pharmacogenomics, nanotechnology, genetic
toxicology, etc.) [6]. We propose new criteria to
expand these KTMS evaluation criteria. Our
approach is based on the use of communication
Int'l Conf. e-Learning, e-Bus., EIS, and e-Gov. | EEE'13 | 241
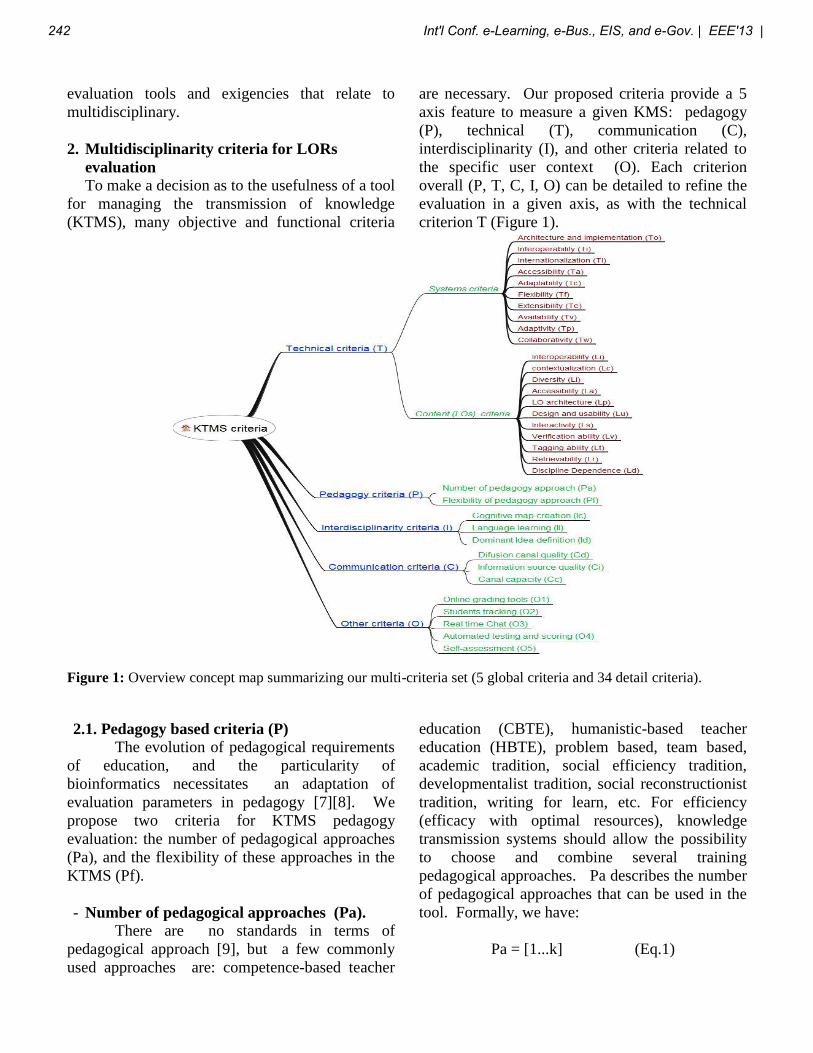
evaluation tools and exigencies that relate to
multidisciplinary.
2. Multidisciplinarity criteria for LORs
evaluation
To make a decision as to the usefulness of a tool
for managing the transmission of knowledge
(KTMS), many objective and functional criteria
are necessary. Our proposed criteria provide a 5
axis feature to measure a given KMS: pedagogy
(P), technical (T), communication (C),
interdisciplinarity (I), and other criteria related to
the specific user context (O). Each criterion
overall (P, T, C, I, O) can be detailed to refine the
evaluation in a given axis, as with the technical
criterion T (Figure 1).
Figure 1: Overview concept map summarizing our multi-criteria set (5 global criteria and 34 detail criteria).
2.1. Pedagogy based criteria (P)
The evolution of pedagogical requirements
of education, and the particularity of
bioinformatics necessitates an adaptation of
evaluation parameters in pedagogy [7][8]. We
propose two criteria for KTMS pedagogy
evaluation: the number of pedagogical approaches
(Pa), and the flexibility of these approaches in the
KTMS (Pf).
- Number of pedagogical approaches (Pa).
There are no standards in terms of
pedagogical approach [9], but a few commonly
used approaches are: competence-based teacher
education (CBTE), humanistic-based teacher
education (HBTE), problem based, team based,
academic tradition, social efficiency tradition,
developmentalist tradition, social reconstructionist
tradition, writing for learn, etc. For efficiency
(efficacy with optimal resources), knowledge
transmission systems should allow the possibility
to choose and combine several training
pedagogical approaches. Pa describes the number
of pedagogical approaches that can be used in the
tool. Formally, we have:
Pa = [1...k] (Eq.1)
242 Int'l Conf. e-Learning, e-Bus., EIS, and e-Gov. | EEE'13 |
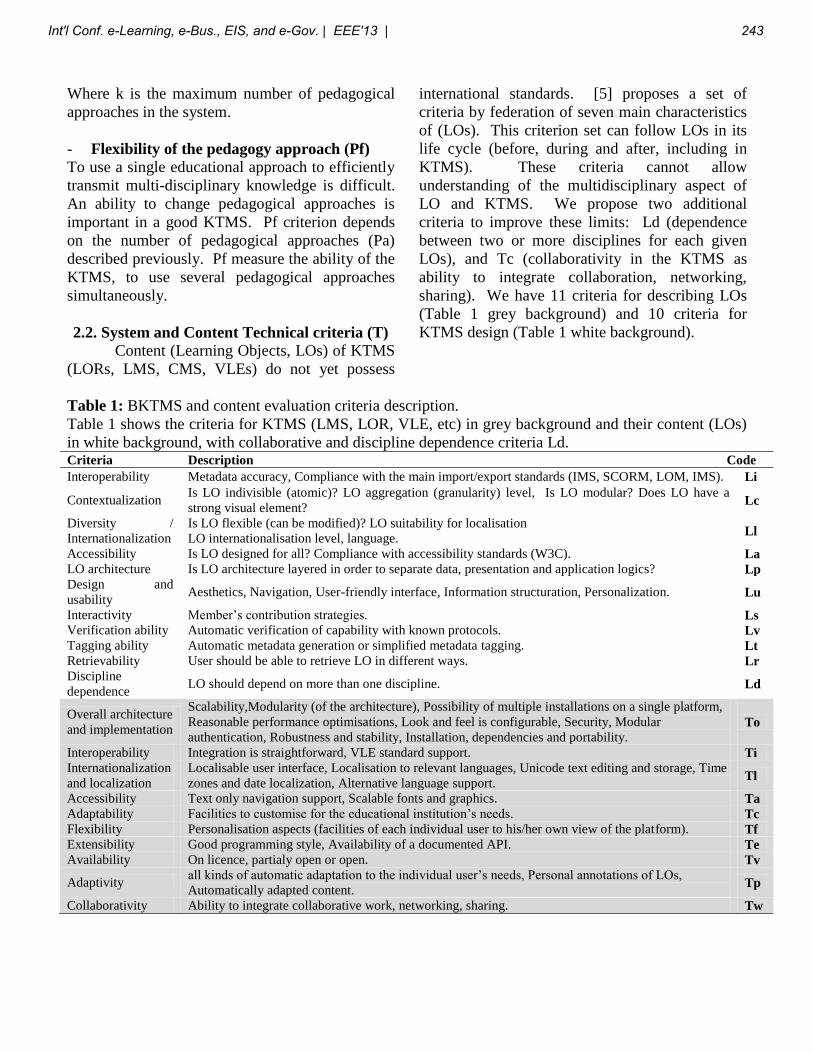
Where k is the maximum number of pedagogical
approaches in the system.
- Flexibility of the pedagogy approach (Pf)
To use a single educational approach to efficiently
transmit multi-disciplinary knowledge is difficult.
An ability to change pedagogical approaches is
important in a good KTMS. Pf criterion depends
on the number of pedagogical approaches (Pa)
described previously. Pf measure the ability of the
KTMS, to use several pedagogical approaches
simultaneously.
2.2. System and Content Technical criteria (T)
Content (Learning Objects, LOs) of KTMS
(LORs, LMS, CMS, VLEs) do not yet possess
international standards. [5] proposes a set of
criteria by federation of seven main characteristics
of (LOs). This criterion set can follow LOs in its
life cycle (before, during and after, including in
KTMS). These criteria cannot allow
understanding of the multidisciplinary aspect of
LO and KTMS. We propose two additional
criteria to improve these limits: Ld (dependence
between two or more disciplines for each given
LOs), and Tc (collaborativity in the KTMS as
ability to integrate collaboration, networking,
sharing). We have 11 criteria for describing LOs
(Table 1 grey background) and 10 criteria for
KTMS design (Table 1 white background).
Table 1: BKTMS and content evaluation criteria description.
Table 1 shows the criteria for KTMS (LMS, LOR, VLE, etc) in grey background and their content (LOs)
in white background, with collaborative and discipline dependence criteria Ld. Criteria Description Code
Interoperability Metadata accuracy, Compliance with the main import/export standards (IMS, SCORM, LOM, IMS). Li
Contextualization Is LO indivisible (atomic)? LO aggregation (granularity) level, Is LO modular? Does LO have a
strong visual element? Lc
Diversity /
Internationalization
Is LO flexible (can be modified)? LO suitability for localisation
LO internationalisation level, language. Ll
Accessibility Is LO designed for all? Compliance with accessibility standards (W3C). La
LO architecture Is LO architecture layered in order to separate data, presentation and application logics? Lp
Design and
usability Aesthetics, Navigation, User-friendly interface, Information structuration, Personalization. Lu
Interactivity Member’s contribution strategies. Ls
Verification ability Automatic verification of capability with known protocols. Lv
Tagging ability Automatic metadata generation or simplified metadata tagging. Lt
Retrievability User should be able to retrieve LO in different ways. Lr
Discipline
dependence LO should depend on more than one discipline. Ld
Overall architecture
and implementation
Scalability,Modularity (of the architecture), Possibility of multiple installations on a single platform,
Reasonable performance optimisations, Look and feel is configurable, Security, Modular
authentication, Robustness and stability, Installation, dependencies and portability. To
Interoperability Integration is straightforward, VLE standard support. Ti
Internationalization
and localization
Localisable user interface, Localisation to relevant languages, Unicode text editing and storage, Time
zones and date localization, Alternative language support. Tl
Accessibility Text only navigation support, Scalable fonts and graphics. Ta
Adaptability Facilities to customise for the educational institution’s needs. Tc
Flexibility Personalisation aspects (facilities of each individual user to his/her own view of the platform). Tf
Extensibility Good programming style, Availability of a documented API. Te
Availability On licence, partialy open or open. Tv
Adaptivity all kinds of automatic adaptation to the individual user’s needs, Personal annotations of LOs,
Automatically adapted content. Tp
Collaborativity Ability to integrate collaborative work, networking, sharing. Tw
Int'l Conf. e-Learning, e-Bus., EIS, and e-Gov. | EEE'13 | 243
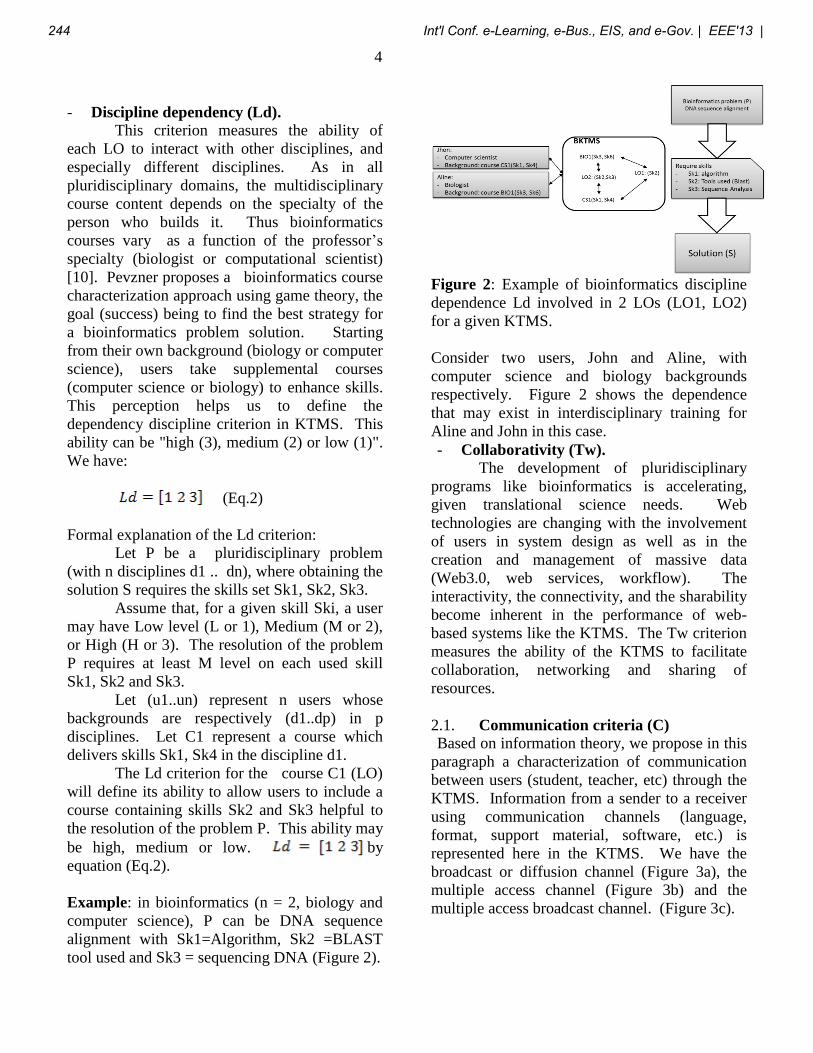
4
- Discipline dependency (Ld). This criterion measures the ability of
each LO to interact with other disciplines, and
especially different disciplines. As in all
pluridisciplinary domains, the multidisciplinary
course content depends on the specialty of the
person who builds it. Thus bioinformatics
courses vary as a function of the professor’s
specialty (biologist or computational scientist)
[10]. Pevzner proposes a bioinformatics course
characterization approach using game theory, the
goal (success) being to find the best strategy for
a bioinformatics problem solution. Starting
from their own background (biology or computer
science), users take supplemental courses
(computer science or biology) to enhance skills.
This perception helps us to define the
dependency discipline criterion in KTMS. This
ability can be "high (3), medium (2) or low (1)".
We have:
(Eq.2)
Formal explanation of the Ld criterion:
Let P be a pluridisciplinary problem
(with n disciplines d1 .. dn), where obtaining the
solution S requires the skills set Sk1, Sk2, Sk3.
Assume that, for a given skill Ski, a user
may have Low level (L or 1), Medium (M or 2),
or High (H or 3). The resolution of the problem
P requires at least M level on each used skill
Sk1, Sk2 and Sk3.
Let (u1..un) represent n users whose
backgrounds are respectively (d1..dp) in p
disciplines. Let C1 represent a course which
delivers skills Sk1, Sk4 in the discipline d1.
The Ld criterion for the course C1 (LO)
will define its ability to allow users to include a
course containing skills Sk2 and Sk3 helpful to
the resolution of the problem P. This ability may
be high, medium or low. by
equation (Eq.2).
Example: in bioinformatics (n = 2, biology and
computer science), P can be DNA sequence
alignment with Sk1=Algorithm, Sk2 =BLAST
tool used and Sk3 = sequencing DNA (Figure 2).
Figure 2: Example of bioinformatics discipline
dependence Ld involved in 2 LOs (LO1, LO2)
for a given KTMS.
Consider two users, John and Aline, with
computer science and biology backgrounds
respectively. Figure 2 shows the dependence
that may exist in interdisciplinary training for
Aline and John in this case.
- Collaborativity (Tw).
The development of pluridisciplinary
programs like bioinformatics is accelerating,
given translational science needs. Web
technologies are changing with the involvement
of users in system design as well as in the
creation and management of massive data
(Web3.0, web services, workflow). The
interactivity, the connectivity, and the sharability
become inherent in the performance of web-
based systems like the KTMS. The Tw criterion
measures the ability of the KTMS to facilitate
collaboration, networking and sharing of
resources.
2.1. Communication criteria (C) Based on information theory, we propose in this
paragraph a characterization of communication
between users (student, teacher, etc) through the
KTMS. Information from a sender to a receiver
using communication channels (language,
format, support material, software, etc.) is
represented here in the KTMS. We have the
broadcast or diffusion channel (Figure 3a), the
multiple access channel (Figure 3b) and the
multiple access broadcast channel. (Figure 3c).
244 Int'l Conf. e-Learning, e-Bus., EIS, and e-Gov. | EEE'13 |
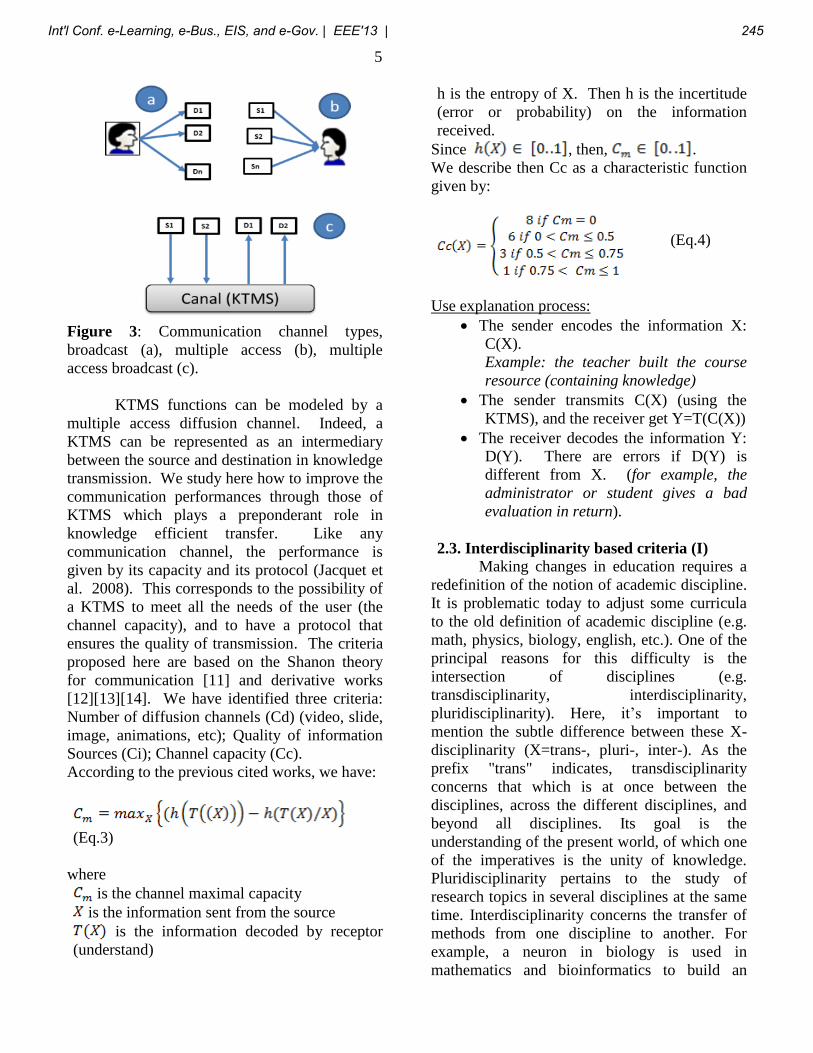
5
Figure 3: Communication channel types,
broadcast (a), multiple access (b), multiple
access broadcast (c).
KTMS functions can be modeled by a
multiple access diffusion channel. Indeed, a
KTMS can be represented as an intermediary
between the source and destination in knowledge
transmission. We study here how to improve the
communication performances through those of
KTMS which plays a preponderant role in
knowledge efficient transfer. Like any
communication channel, the performance is
given by its capacity and its protocol (Jacquet et
al. 2008). This corresponds to the possibility of
a KTMS to meet all the needs of the user (the
channel capacity), and to have a protocol that
ensures the quality of transmission. The criteria
proposed here are based on the Shanon theory
for communication [11] and derivative works
[12][13][14]. We have identified three criteria:
Number of diffusion channels (Cd) (video, slide,
image, animations, etc); Quality of information
Sources (Ci); Channel capacity (Cc).
According to the previous cited works, we have:
(Eq.3)
where
is the channel maximal capacity
is the information sent from the source
is the information decoded by receptor
(understand)
h is the entropy of X. Then h is the incertitude
(error or probability) on the information
received.
Since , then, .
We describe then Cc as a characteristic function
given by:
(Eq.4)
Use explanation process:
The sender encodes the information X:
C(X).
Example: the teacher built the course
resource (containing knowledge)
The sender transmits C(X) (using the
KTMS), and the receiver get Y=T(C(X))
The receiver decodes the information Y:
D(Y). There are errors if D(Y) is
different from X. (for example, the
administrator or student gives a bad
evaluation in return).
2.3. Interdisciplinarity based criteria (I)
Making changes in education requires a
redefinition of the notion of academic discipline.
It is problematic today to adjust some curricula
to the old definition of academic discipline (e.g.
math, physics, biology, english, etc.). One of the
principal reasons for this difficulty is the
intersection of disciplines (e.g.
transdisciplinarity, interdisciplinarity,
pluridisciplinarity). Here, it’s important to
mention the subtle difference between these X-
disciplinarity (X=trans-, pluri-, inter-). As the
prefix "trans" indicates, transdisciplinarity
concerns that which is at once between the
disciplines, across the different disciplines, and
beyond all disciplines. Its goal is the
understanding of the present world, of which one
of the imperatives is the unity of knowledge.
Pluridisciplinarity pertains to the study of
research topics in several disciplines at the same
time. Interdisciplinarity concerns the transfer of
methods from one discipline to another. For
example, a neuron in biology is used in
mathematics and bioinformatics to build an
Int'l Conf. e-Learning, e-Bus., EIS, and e-Gov. | EEE'13 | 245

6
algorithm [15]. This crossing aims to obtain
programs that better reflect the societal and
industrial innovations. Thus, the
Interdisciplinary Criteria becomes a key feature
in KTMS assessment.
The Biggs and Collis model (1982) was
adapted to interdisciplinary programs by [6].
This model allows structuring of an
interdisciplinary program at 3 levels. This view
helps us to begin from the usual program
structure (level 1), and integrate each additional
discipline, using transitions for clarifying
interactions between the disciplines involved. It
also highlights the strength of the collaborative
aspects of the disciplines of knowledge
transmission.
The criteria proposed here measure the
ability of a KTMS to integrate these three levels
in design and content management. This
amounts to measuring the multidisciplinary
flexibility of the system. The three criteria are:
- Pluridisciplinarity cognitive map creation
(Ic).
This criterion measures the ability of KTMS
to create a specific cognitive map for
pluridisciplinary cases (bioinformatics,
pharmacogenomics, etc.).
- Pluridisciplinarity learning language (Il).
This criterion measures the ability of KTMS
to manage a pluridisciplinary language
interacting with languages of others disciplines
(biology language + informatics language
Bioinformatics language, Statistics + biology
Biostatistics). Several dictionaries end glossaries
are available for bioinformatics language
(“Glossary of bioinformatics terms.,” 2007;[17].
These references contain more than 1000 terms
specific to bioinformatics or adapted for the
bioinformatics context. It can be employed for
the development of the bioinformatics
knowledge transmission and learning language
specification performance.
- Dominant idea definition (Id).
This criterion measures the ability of KTMS
to help users in the identification and
specification of the main topic in the
pluridisciplinary course used (case study,
applications, examples).
2.4.Other criteria (O)
Other criteria are related to user’s
specific needs. Five other criteria are proposed
to satisfy context needs related to the grading
(O1), user tracking (O2), chat (O3), test scoring
(O4), and self-work (O5). These criteria are
described in EduTools. These are implemented
by: Online grading tools (O1), Students tracking
(O2), Real time Chat (O3), automated testing
and scoring (O4), Self-assessment (O5).
3.Conclusion
Faced with the KTMS evaluation issue,
we proposed here a set of criteria that allow
decision maker to measure the quality of a given
KTMS. In our proposal, we focused on the
weaknesses of existing criteria and the major
limitations of internet-based KTMS. These
weaknesses are multidisciplinarity,
collaborativity and sharing that were integrated
using communication tools.
The criteria set proposed is also flexible.
This allows them to measure the qualitative and
quantitative aspects of each feature. This work is
far from covering all the needs of educators, but
it still provides a preliminary step toward
opening the door to a standardization of quality
criteria for KTMS.
Terminologies
LOs: Learning Objects
LORs: Learning Object Repository
CBT: Computer Based Training
CMS: course management system
LMS: Learning Management System
KTMS: Knowledge Transmission Management
System
BKTMS: Bioinformatics Knowledge Transmission
Management System
SCORM: Sharable Content Object Reference Model
VLEs: Virtual learning environments
CBTE: competence-based teacher education,
HBTE: humanistic-based teacher education,
IMS: instructional management system
LOM: learning object model
246 Int'l Conf. e-Learning, e-Bus., EIS, and e-Gov. | EEE'13 |
7
Acknowledgments: The authors would like to thank Dr.
Doug Goodman and Jerry Prentice for their helpful
corrections on this work.
Funding: This work was made possible by SD-INBRE
Grant # P20RR016479-09 from the National Center for
Research Resources (NCRR), a component of the National
Institutes of Health (NIH). Its contents are solely the
responsibility of the authors and do not necessarily
represent the official views of NCRR or NIH. NSF Grant
IOS-1126481 Integrating the BioExtract Server with the
iPlant Collaborative.
References
[1]T. Ishaya, “Interoperable Learning Objects
Management,” igi-global.com.
[2]B. E. Goodman, “Targeting relevance: the
challenges of interdisciplinary teaching and
learning.,” The Physiologist, vol. 55, no. 1,
pp. 1, 3–6, Feb. 2012.
[3]M. V Schneider, P. Walter, M.-C. Blatter, J.
Watson, M. D. Brazas, K. Rother, A. Budd,
A. Via, C. W. G. van Gelder, J. Jacob, P.
Fernandes, T. H. Nyrönen, J. De Las Rivas, T.
Blicher, R. C. Jimenez, J. Loveland, J.
McDowall, P. Jones, B. W. Vaughan, R.
Lopez, T. K. Attwood, and C. Brooksbank,
“Bioinformatics Training Network (BTN): a
community resource for bioinformatics
trainers.,” Briefings in bioinformatics, vol. 13,
no. 3, pp. 383–9, Nov. 2011.
[4]P. L. Blyth, “Window shopping.,” Health
facilities management, vol. 13, no. 4, pp. 38,
40, 42, Apr. 2000.
[5]E. Kurilovas and V. D. E, “Multiple Criteria
Comparative Evaluation of E-Learning
Systems and Components,” vol. 20, no. 4, pp.
499–518, 2009.
[6]L. Ivanitskaya, D. Clark, G. Montgomery, and
R. Primeau, “Interdisciplinary Learning :
Process and Outcomes,” vol. 27, no. 2, pp.
95–112, 2002.
[7]S. Fatimah and M. Yassin, “Interdisciplinary
Integration Through Problem-Based Learning
with ICT in Pre- Service Teacher Education,”
no. 2006, pp. 377–385, 2010.
[8]L. K. Michaelsen and M. Sweet, “Team-
Based Learning,” New Directions for
Teaching and Learning, vol. 2011, no. 128,
pp. 41–51, 2011.
[9]F. Korthagen and J. Buitink, “What
pedagogical approaches are there in teacher
education?,” kennisbasislerarenopleiders.nl,
2006.
[10] P. a Pevzner, “Educating biologists in the
21st century: bioinformatics scientists versus
bioinformatics technicians.,” Bioinformatics
(Oxford, England), vol. 20, no. 14, pp. 2159–
61, Sep. 2004.
[11] C. E. Shannon and W. Weaver,
Mathematical Theory of Communication, vol.
27, no. 1. University of Illinois Press, 1949, p.
125.
[12] P. Jacquet, B. Mans, and G. Rodolakis,
Information propagation speed in Delay
Tolerant Networks: Analytic upper
bounds. 2008, pp. 6–10.
[13] W. Szpankowski, Analytic algorithmics,
combinatorics, and information theory.
Ieee, 2005, pp. 210–210.
[14] R. V. L. Hartley, “Transmission of
Information,” Bell System Technical
Journal, vol. 7, no. 3, pp. 535–563, 1928.
[15] K.-C. V. Nicolescu, Basarab, Manifesto of
Transdisciplinarity. New York, New
York, USA: State Univ of New York,
2002, p. 169.
[16] “Glossary of bioinformatics terms.,”
Current protocols in bioinformatics /
editoral board, Andreas D. Baxevanis ...
[et al.], vol. Appendix 2, p. Appendix 2,
Jun. 2007.
[17] J. M. Hancock and M. J. Zvelebil, Eds.,
Dictionary of Bioinformatics and
Computational Biology. Hoboken, NJ,
USA: John Wiley & Sons, Inc., 2004.
Int'l Conf. e-Learning, e-Bus., EIS, and e-Gov. | EEE'13 | 247

248 Int'l Conf. e-Learning, e-Bus., EIS, and e-Gov. | EEE'13 |

SESSION
MANAGEMENT, TOOLS, WEB, INFORMATIONEXTRACTION + APPLICATIONS AND
STANDARDS
Chair(s)
TBA
Int'l Conf. e-Learning, e-Bus., EIS, and e-Gov. | EEE'13 | 249

250 Int'l Conf. e-Learning, e-Bus., EIS, and e-Gov. | EEE'13 |
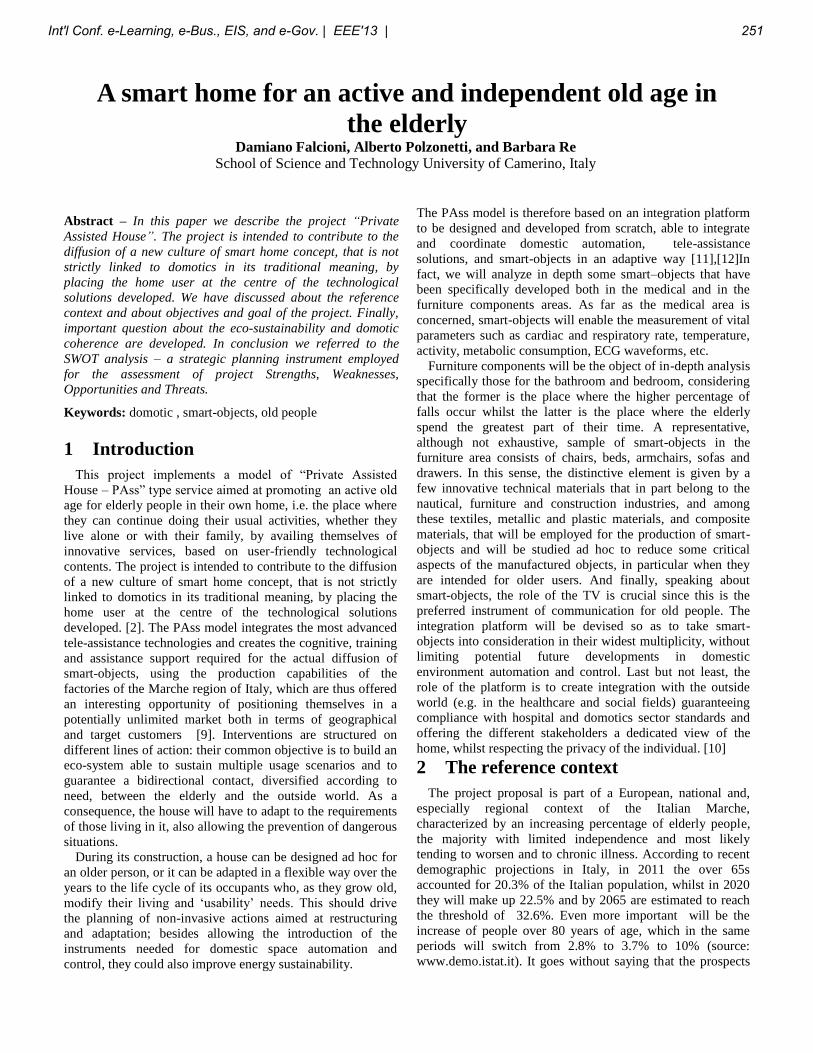
A smart home for an active and independent old age in
the elderly
Damiano Falcioni, Alberto Polzonetti, and Barbara Re
School of Science and Technology University of Camerino, Italy
Abstract – In this paper we describe the project “Private
Assisted House”. The project is intended to contribute to the
diffusion of a new culture of smart home concept, that is not
strictly linked to domotics in its traditional meaning, by
placing the home user at the centre of the technological
solutions developed. We have discussed about the reference
context and about objectives and goal of the project. Finally,
important question about the eco-sustainability and domotic
coherence are developed. In conclusion we referred to the
SWOT analysis – a strategic planning instrument employed
for the assessment of project Strengths, Weaknesses,
Opportunities and Threats.
Keywords: domotic , smart-objects, old people
1 Introduction
This project implements a model of “Private Assisted
House – PAss” type service aimed at promoting an active old
age for elderly people in their own home, i.e. the place where
they can continue doing their usual activities, whether they
live alone or with their family, by availing themselves of
innovative services, based on user-friendly technological
contents. The project is intended to contribute to the diffusion
of a new culture of smart home concept, that is not strictly
linked to domotics in its traditional meaning, by placing the
home user at the centre of the technological solutions
developed. [2]. The PAss model integrates the most advanced
tele-assistance technologies and creates the cognitive, training
and assistance support required for the actual diffusion of
smart-objects, using the production capabilities of the
factories of the Marche region of Italy, which are thus offered
an interesting opportunity of positioning themselves in a
potentially unlimited market both in terms of geographical
and target customers [9]. Interventions are structured on
different lines of action: their common objective is to build an
eco-system able to sustain multiple usage scenarios and to
guarantee a bidirectional contact, diversified according to
need, between the elderly and the outside world. As a
consequence, the house will have to adapt to the requirements
of those living in it, also allowing the prevention of dangerous
situations.
During its construction, a house can be designed ad hoc for
an older person, or it can be adapted in a flexible way over the
years to the life cycle of its occupants who, as they grow old,
modify their living and ‘usability’ needs. This should drive
the planning of non-invasive actions aimed at restructuring
and adaptation; besides allowing the introduction of the
instruments needed for domestic space automation and
control, they could also improve energy sustainability.
The PAss model is therefore based on an integration platform
to be designed and developed from scratch, able to integrate
and coordinate domestic automation, tele-assistance
solutions, and smart-objects in an adaptive way [11],[12]In
fact, we will analyze in depth some smart–objects that have
been specifically developed both in the medical and in the
furniture components areas. As far as the medical area is
concerned, smart-objects will enable the measurement of vital
parameters such as cardiac and respiratory rate, temperature,
activity, metabolic consumption, ECG waveforms, etc.
Furniture components will be the object of in-depth analysis
specifically those for the bathroom and bedroom, considering
that the former is the place where the higher percentage of
falls occur whilst the latter is the place where the elderly
spend the greatest part of their time. A representative,
although not exhaustive, sample of smart-objects in the
furniture area consists of chairs, beds, armchairs, sofas and
drawers. In this sense, the distinctive element is given by a
few innovative technical materials that in part belong to the
nautical, furniture and construction industries, and among
these textiles, metallic and plastic materials, and composite
materials, that will be employed for the production of smart-
objects and will be studied ad hoc to reduce some critical
aspects of the manufactured objects, in particular when they
are intended for older users. And finally, speaking about
smart-objects, the role of the TV is crucial since this is the
preferred instrument of communication for old people. The
integration platform will be devised so as to take smart-
objects into consideration in their widest multiplicity, without
limiting potential future developments in domestic
environment automation and control. Last but not least, the
role of the platform is to create integration with the outside
world (e.g. in the healthcare and social fields) guaranteeing
compliance with hospital and domotics sector standards and
offering the different stakeholders a dedicated view of the
home, whilst respecting the privacy of the individual. [10]
2 The reference context
The project proposal is part of a European, national and,
especially regional context of the Italian Marche,
characterized by an increasing percentage of elderly people,
the majority with limited independence and most likely
tending to worsen and to chronic illness. According to recent
demographic projections in Italy, in 2011 the over 65s
accounted for 20.3% of the Italian population, whilst in 2020
they will make up 22.5% and by 2065 are estimated to reach
the threshold of 32.6%. Even more important will be the
increase of people over 80 years of age, which in the same
periods will switch from 2.8% to 3.7% to 10% (source:
www.demo.istat.it). It goes without saying that the prospects
Int'l Conf. e-Learning, e-Bus., EIS, and e-Gov. | EEE'13 | 251
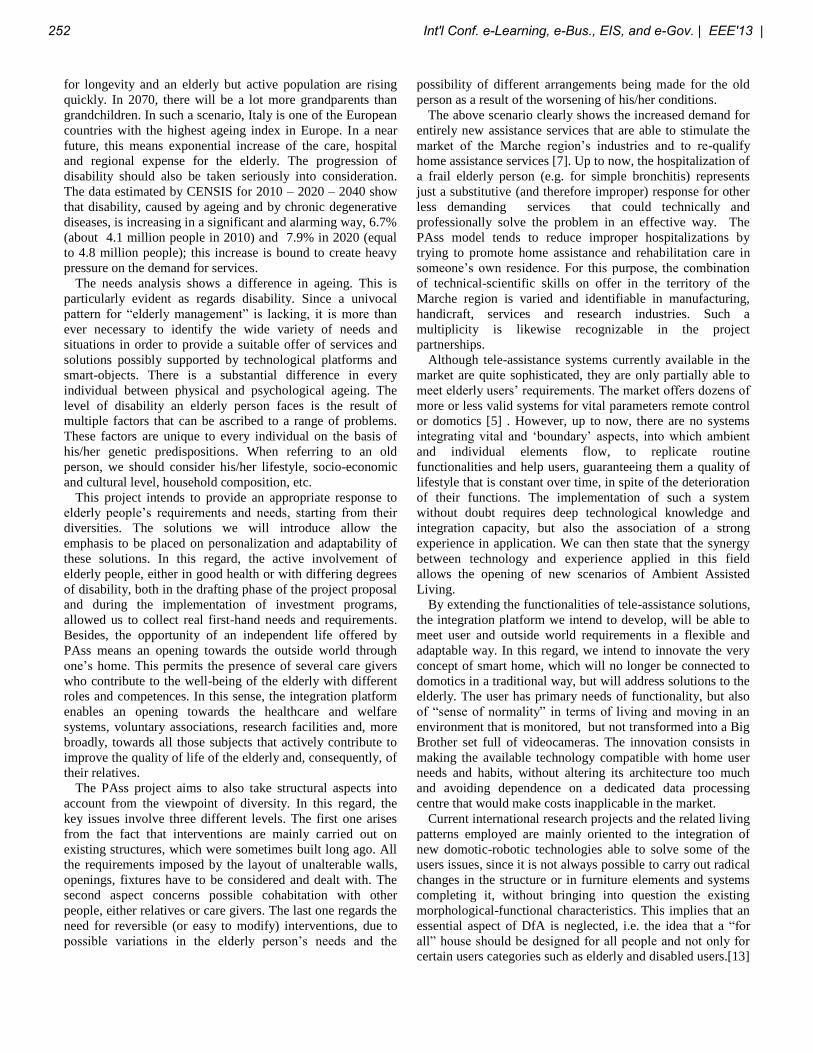
for longevity and an elderly but active population are rising
quickly. In 2070, there will be a lot more grandparents than
grandchildren. In such a scenario, Italy is one of the European
countries with the highest ageing index in Europe. In a near
future, this means exponential increase of the care, hospital
and regional expense for the elderly. The progression of
disability should also be taken seriously into consideration.
The data estimated by CENSIS for 2010 – 2020 – 2040 show
that disability, caused by ageing and by chronic degenerative
diseases, is increasing in a significant and alarming way, 6.7%
(about 4.1 million people in 2010) and 7.9% in 2020 (equal
to 4.8 million people); this increase is bound to create heavy
pressure on the demand for services.
The needs analysis shows a difference in ageing. This is
particularly evident as regards disability. Since a univocal
pattern for “elderly management” is lacking, it is more than
ever necessary to identify the wide variety of needs and
situations in order to provide a suitable offer of services and
solutions possibly supported by technological platforms and
smart-objects. There is a substantial difference in every
individual between physical and psychological ageing. The
level of disability an elderly person faces is the result of
multiple factors that can be ascribed to a range of problems.
These factors are unique to every individual on the basis of
his/her genetic predispositions. When referring to an old
person, we should consider his/her lifestyle, socio-economic
and cultural level, household composition, etc.
This project intends to provide an appropriate response to
elderly people’s requirements and needs, starting from their
diversities. The solutions we will introduce allow the
emphasis to be placed on personalization and adaptability of
these solutions. In this regard, the active involvement of
elderly people, either in good health or with differing degrees
of disability, both in the drafting phase of the project proposal
and during the implementation of investment programs,
allowed us to collect real first-hand needs and requirements.
Besides, the opportunity of an independent life offered by
PAss means an opening towards the outside world through
one’s home. This permits the presence of several care givers
who contribute to the well-being of the elderly with different
roles and competences. In this sense, the integration platform
enables an opening towards the healthcare and welfare
systems, voluntary associations, research facilities and, more
broadly, towards all those subjects that actively contribute to
improve the quality of life of the elderly and, consequently, of
their relatives.
The PAss project aims to also take structural aspects into
account from the viewpoint of diversity. In this regard, the
key issues involve three different levels. The first one arises
from the fact that interventions are mainly carried out on
existing structures, which were sometimes built long ago. All
the requirements imposed by the layout of unalterable walls,
openings, fixtures have to be considered and dealt with. The
second aspect concerns possible cohabitation with other
people, either relatives or care givers. The last one regards the
need for reversible (or easy to modify) interventions, due to
possible variations in the elderly person’s needs and the
possibility of different arrangements being made for the old
person as a result of the worsening of his/her conditions.
The above scenario clearly shows the increased demand for
entirely new assistance services that are able to stimulate the
market of the Marche region’s industries and to re-qualify
home assistance services [7]. Up to now, the hospitalization of
a frail elderly person (e.g. for simple bronchitis) represents
just a substitutive (and therefore improper) response for other
less demanding services that could technically and
professionally solve the problem in an effective way. The
PAss model tends to reduce improper hospitalizations by
trying to promote home assistance and rehabilitation care in
someone’s own residence. For this purpose, the combination
of technical-scientific skills on offer in the territory of the
Marche region is varied and identifiable in manufacturing,
handicraft, services and research industries. Such a
multiplicity is likewise recognizable in the project
partnerships.
Although tele-assistance systems currently available in the
market are quite sophisticated, they are only partially able to
meet elderly users’ requirements. The market offers dozens of
more or less valid systems for vital parameters remote control
or domotics [5] . However, up to now, there are no systems
integrating vital and ‘boundary’ aspects, into which ambient
and individual elements flow, to replicate routine
functionalities and help users, guaranteeing them a quality of
lifestyle that is constant over time, in spite of the deterioration
of their functions. The implementation of such a system
without doubt requires deep technological knowledge and
integration capacity, but also the association of a strong
experience in application. We can then state that the synergy
between technology and experience applied in this field
allows the opening of new scenarios of Ambient Assisted
Living.
By extending the functionalities of tele-assistance solutions,
the integration platform we intend to develop, will be able to
meet user and outside world requirements in a flexible and
adaptable way. In this regard, we intend to innovate the very
concept of smart home, which will no longer be connected to
domotics in a traditional way, but will address solutions to the
elderly. The user has primary needs of functionality, but also
of “sense of normality” in terms of living and moving in an
environment that is monitored, but not transformed into a Big
Brother set full of videocameras. The innovation consists in
making the available technology compatible with home user
needs and habits, without altering its architecture too much
and avoiding dependence on a dedicated data processing
centre that would make costs inapplicable in the market.
Current international research projects and the related living
patterns employed are mainly oriented to the integration of
new domotic-robotic technologies able to solve some of the
users issues, since it is not always possible to carry out radical
changes in the structure or in furniture elements and systems
completing it, without bringing into question the existing
morphological-functional characteristics. This implies that an
essential aspect of DfA is neglected, i.e. the idea that a “for
all” house should be designed for all people and not only for
certain users categories such as elderly and disabled users.[13]
252 Int'l Conf. e-Learning, e-Bus., EIS, and e-Gov. | EEE'13 |
From the methodological viewpoint, the new project will be
based on the international regulation ISO/DIS 13407 – Human
Centred Design Processes for Interactive Systems. The direct
consequence could be the passive acceptance of the restricting
condition about the inclusion of house aids, very expensive
and difficult to integrate as they are. They alter the aesthetic-
functional aspects, in opposite trend vs. the expectations of
users which are more and more sensible to high standards of
domestic spaces architecture and design. For these reasons,
the project is “user centred”, it aims to integrate the three
characterizing aspects of a smart object making them to
interact: furniture, in which all main functions are grouped
(bed, wardrobe, chairs, etc.) developed according to the
reference target, multisensory and multimodal interaction
system through the senses of touch (touch screen), voice
(voice, gestures recognition) of user-friendly interfaces and
use of daily metaphors, integration of innovative technologies
able to recall information (augmented memory) and increase
the surrounding environment vision (augmented reality) of
remote data and information.
In this sense, smart-object will gain an innovation level
mainly through the use of smart or functional materials, i.e.
able to carry out some functions, sensible, i.e. able to be
reactive, active or interactive to external stimuli. [1]
3 Objectives and goals
According to the objectives of the announcement, the PAss
project intends to facilitate active and independent longevity
in the elderly, whilst realizing the wish of most elderly people
to grow old in their own home. This is the reason why the
“Private Assisted House” type of assistance model, which is
the basis of the project proposal, represents an answer to the
heterogeneity of the psycho-physical and social conditions of
the elderly, who may also possibly be disabled. Particular
attention is addressed to inexpensiveness and usability of the
solutions in order to ensure the maximum level of access. The
same importance is given to the role of scalability, since the
house is seen as the place that is able to change with the
passage of time and to adapt itself to the requirements of the
people who live in it. The attention given to energy
requirements will be crucial, favoring smart-grid integration
where the house is both a producer and a consumer of energy.
With reference to feasibility objectives, the “Private
Assisted house” type of assistance model is characterized by a
particular attention to diversities, while answering in a
personalized manner to concrete requirements in terms of:
safety, automation, prevention, and communication. This will
be possible thanks to the intention, common to all the
partners, to build an integration platform. This will allow a
real integration of functionalities of domotics and smart-
objects within the house in addition to enabling basic
functionalities of tele-assistance solutions.
OR 1 – Build a heritage of knowledge,[8] directed at
guiding assistance scenarios according to the “Private
Assisted house” model. This will highlight a multitude of
needs, while offering a useful reference to solve critical states,
typical of such scenarios linked to assistance. To this end it is
necessary to map the entities of analysis, among which we can
list as examples the following: (i) psycho-physical and social
conditions of the elderly person, (ii) the home environment in
terms of structural and functional characteristics, (iii) the
network of assistance where the elderly person is or can be
placed, (iv) smart-objects, and sensoristics in general as a
point of contact with the environment, (v) daily activities,
better known as “activities of everyday life”. A complexity
emerges that is the result of the combination of various
entities which nevertheless allow the creation of personalized
assistance models, which are able to respond to the principle
of a safe life at home, and thus identify possible behavioral
patterns, precursors of a dangerous situation. The temporal
dimension will be matter of study since life conditions,
psycho-physical ones in particular, evolve continuously.
OR 2 – Design and develop an integration platform useful
for the governance of the home. The integration platform
PAss offers a horizontal dimension which allows the various
vertical dimensions (smart-objects, environmental
sensoristics, domotics, etc …) to be enabled in a unitary and
harmonized manner, and also permits a dialogue to be
established with the external world in an adequate manner.
Thanks to the governance level shown, the integration
platform con easily be thought to answer for the scalability
and interoperability of the solutions. In this sense we can
imagine that applications will be the result of a dynamic
integration of data and services which diverse suppliers (third
party platforms) put at the disposal of the home through the
integration platform. Tele-assistance platforms (UniCam and
Aditech), are platforms which, even if with different aims, are
dedicated to medical matters integrating certified devices
according to standard 93/42. The monitoring platform of the
home environment is nevertheless a platform integrating
domotic sensors not typical of the medical field. The said
platforms will be a kind of back-end, their duty will be to
produce data that will be stored, aggregated, integrated, and
shown from the integration platform with the purpose of
synthetizing them and making them available to different
kinds of users, answering to multiple scenarios of use. The
management will be crucial of the normalized information and
of its transformation useful in observing dangerous situations,
and where necessary restoring stimuli and support to the
elderly person. Not less important is the need to offer an
integrated support of the information through the platform.
OR 3 – Identify, design, and develop a series of smart-
objects. Smart-objects, produced within the partnership or
acquired from the market, are classified in two macro-areas:
medical and furnishings. With regard to the medical area this
means ensuring the completeness of analyses with respect to
basic vital parameters. With regard to pieces of furniture,
smart objects will be part of the definition of a complex and
flexible house model, designed as a system of smart items,
addable and repeatable in standard modules. Such items will
be suitable to realize any domestic living environment with an
view to quality and complete accessibility, for a wide range of
Int'l Conf. e-Learning, e-Bus., EIS, and e-Gov. | EEE'13 | 253
users. In particular, house spaces related to the bathroom,
kitchen and bedroom will be studied in depth, since they are
rooms in which an elderly person most needs an assisted
inhabitable environment created through techology which is
the least invasive possible, integrated inside the same smart-
objects and with particular attention to ergonomy, user
interface, and use of ecosustainable materials, evaluated by
means of defining their cost of production in terms of
energetic and environmental impact through the use of
evaluation systems related to their life cycle (LCA). As
regards materials, smart-objects to be introduced will respond
to the needs of athermicity, water resistance, washability,
recyclability and pleasantness of their materials. Of the utmost
importance in this context is fire resistance, which is an issue
common to all materials to be introduced into a house, in
particular with regard to the difficulties involved in removing
elderly or handicapped people.
OR 4 – Design and develop “in visible” and adaptable
sensoristic solutions . The aim is to design and then develop
sensoristic solutions to be placed within the house so as to
ensure a continuous flow of information, useful for
recognizing scenarios (activities-situations-events) originating
within it. In this way, it is possible to observe changes in
respect to usual behavior, which is often symptomatic of a
worsening of psycho-physical health conditions. We intend to
equip the areas of the house with the ability to perceive and
classify the activities which the users carry out within. The
main items of development are the infrastructure, i.e. the
sensoristic component which is able to indirectly monitor
activities and environmental conditions, without the use of
devices to be worn like bracelets or tags, or which could
violate privacy such as video cameras and the home
processor, i.e. the application which analyzes and correlates
data extracted by sensors in real time, recognizing the
activities carried out within the rooms and revealing possible
abnormalities in behavior or risk situations.
OR 5 – Promote a new culture which sees the PAss model
like a pivot of a production capability in the Marche region’s
industries and in the definition of new professional positions
whose main characteristic is to respond to multidisciplinary
needs. By way of example we can mention the definition of a
new designer role of house environments, who develops the
personalization of single houses and who in interacting with
the market is able to develop the personalization of single
houses ensuring an appropriate integration of technological
aids and care services.
4 Eco-sustainability and domotic
coherence of the project
4.1 Impact of the project on the energy efficiency of the
house environment to which it is addressed
The level of sustainability of the project will be identified
through two different, but parallel phases, one addressed at
determining environmental impact of the designed products,
in terms of consumption of used energy (embodied energy)
and of harmful emissions (Co2 pollution) verified by means of
an environmental energy certificate , the other one addressed
at determining energy efficiency in order to achieve the
environmental comfort (hygrothermal, visual, acoustic, air
quality) verified by the energy certificate as well as the
acoustic and air purity certificates.
The determination of overall ecological environmental
impact should take into account not only the use of natural,
biocompatible, or recycled materials, which by themselves do
not ensure the real sustainability of the product, but also the
use of smart materials characterized for the most part, by their
capability of self-configuration, self-monitoring, and self-
healing which contribute, during their life cycle, to add
efficiency, savings and optimization of available energy
resources.
4.2 Impact of the project on active and passive safety of
the home environment at which it is aimed.
The aim of equipping each area of the home with its own
level of intelligence allowing it to “identify” activity and risk
scenarios, allow a drive towards crucial enhancement both in
active and passive safety of the home.
The enhancement of active safety is linked to the possibility
of anticipating risk situations, on the one hand through
indirect behavioral monitoring intended to evaluate the
regularity of performance of “ordinary” daily activities; on the
other hand through automatic recognition of a series of critical
or anyway anomalous situations which allows particular
operations of protection or alerting to be activated. Unlike
standard security systems, in which sensors are used to
identify risk situations which are already ongoing (e.g.
presence of gas, smoke or flooding), PAss aims to create a
preventive system, addressed at anticipating critical situations
and realizing a series of implementations to avoid them. By
way of example, the gas in the kitchen will be automatically
isolated with a solenoid valve when no cooking activity is
taking place, then automatically reactivated when use of the
kitchen is needed; besides the presence of gas and smokes, the
air quality (content of carbon dioxide, powders and carbon
monoxide) will be monitored in order to manage automatic
activation of ventilators, and possibly of alarms in case of
dangerous mixtures. A time activated water flow restrictor
will be used, which is activated in case of any use not in
keeping with the activities carried out, etc.
Through indirect behavioral monitoring (without the use of
sensors that have to be worn and visual sensors), it will be
possible to observe dangerous conditions (e.g falls, the
absence of activity signals during waking hours, etc.), but also
identify inconsistent conditions (e.g. absences from the home
that are not temporary but without any completion of
connected operations, like the closing of windows or doors;
performance of exceptionally fragmented activities that are
not terminated) which may be indicators of confusional states
or stress. Finally it will be possible to automate many
repetitive actions which may be perceived as an intrusive duty
in the use of different devices. By way of example, the
automatic activation and deactivation of anti-intrusion
254 Int'l Conf. e-Learning, e-Bus., EIS, and e-Gov. | EEE'13 |
security equipment will be possible, based on the actual
waking hours of the user and of his/her position within the
home.
4.3 Level of integration of the project with the basic
domotic functions regarding the home
environment at which it is aimed.
The PAss project, is aimed at equipping the areas of the
house with an innovative level of smartness, thus primarily
aiming not to require intensive learning or adaptation to the
introduction of the technology itself.
From this viewpoint, PAss aims to test a set of
technological “proxies”, i.e. of interfaces towards standard
domotic systems able to change their complexity and promote
interoperability. An interface structure will be tested, in this
direction, towards house systems (household appliances,
plants and basic automation already available in general)
which are able to translate commands and settings typically
transmitted by means of remote controls, push-button panels
or complex touch panels with multiple menus, into simple
vocal commands or ones given through wireless systems, that
are automatically contextualized.
We mean in other words to test command repeaters which
acquire information from the completed activity and from the
user position, simplifying operative complexity in a relevant
way. By way of example, it will be possible to command the
opening of a motorized shutter without having to specify the
reason for which this information is acquired by the user
position. Similarly, it will be possible to translate the main
commands of a tv set into vocal commands or onto a single
wireless device, or moreover, to lower the temperature or light
in a particular area.
These proxies are an innovative way to realize
interoperabilità, whose efficacy doesn’t rely on a complex,
even if desirable, standardization of communication among
different domotic systems, but on the interposition between
the user and technology of a smart “normalization” system,
that is able to fill the communication gap.
4.4 Integration level with assistance functions
The PAss project takes into consideration some important
aspects of the living conditions of the elderly [6], [4]. Among
these aspects there is in particular the fact that only a small
percentage have a broadband connection, whilst most of them
use mobiles or landline phones. This state of digital divide is a
symptom of the poor penetration of organized assistance
services within the territory, which is also due to their high
cost, when they are planned in a non structured way. In this
sense, the PAss project intends to trial the integration of the
same smart monitoring system, developed for the automation
support activities, with organized assistance functions in order
to considerably reduce their cost.
The experiment will be used to evaluate three main aspects.
On the one hand the feasibility will be tested of remotely
monitoring, as well as voluntary requests for help, also the
state of health (monitoring of vital parameters through sensors
connected to a network, such as a thermometer,
stetho/phonendoscope, oximeter, etc.) and critical risk
situations (e.g. falls, absence of activity signals during
waking hours, markedly non consistent behaviors which are
an indication of confusional states, presence of smoke or
carbon monoxide, flooding), by automating their recognition
and verification, whilst reducing the cost for surveillance. On
the other hand the feasibility will be tested of connecting local
networks of home and social services which allow
implementation of efficient and economically sustainable
daily assistance activities, such as identification and repair of
faults, support in the supply of consumer products and
medicines, support of organized mobility (with sharing of
times and routes), support of waste disposal, etc.
Finally, a further aspect that will be tested is linked to
mnemonic support in daily activities. Thanks to the smart
system of behavioral analysis, it will be possible to recall, by
means of reminders supported by multimedial appliances,
possible lapses of memory such as the scheduled assumption
of medicines, disposing of waste or simply any other
customary activities. The same system could be trialed for
connection to institutions (e.g. notes about formalities or
deadlines), to services to citizens (e.g. notes about utilities,
events), or simply for adjusting the rhythm of daily life in
general.
4.5 Impact on the user
A possible and more natural use scenario refers to support
of elderly-related activities. The elderly person could take
advantage of the presence of the integration platform and
therefore of uniform access across the different services
available, thanks to sensors and devices placed in the home. In
this context the characteristics of the suggested solution will
make it possible to integrate new devices, including according
to possible changes in the level of independence of the
elderly person, possibly allowing him/her to be able to control
the different aids and devices available at home remotely. In
actual fact, the characteristics proper to the suggested solution
will enable adaptation of the support to the elderly person
with regard to peculiarities both of his/her conditions (with the
introduction of particular sensors and aids), and with reference
to the peculiarities of his/her housing context, i.e. an actual
house or a condominium flat.
Moreover the elderly person could also be assisted by
applications installed on the platform [3]. Such applications
will monitor his/her actions and could support him/her in daily
activities such as the assumption of medicines. The extendible
nature of the suggested solution makes the realization feasible
of any software application, which also integrates information
retrieved from devices and sensors, in order to support the
activities of the elderly.
By way of example we can refer to Mr John Smith, who
lives independently with his family, until progressive ageing,
the departure and absence of his children and the unfortunate
death of his wife require the adaptation of his home in terms
of monitoring. John’s needs then change when, because of a
critical time due to a car accident, he is no longer able to
move around independently within his home. The need for
monitoring evolves with regard to the need to introduce
functions and services which are able to ensure mobility
Int'l Conf. e-Learning, e-Bus., EIS, and e-Gov. | EEE'13 | 255
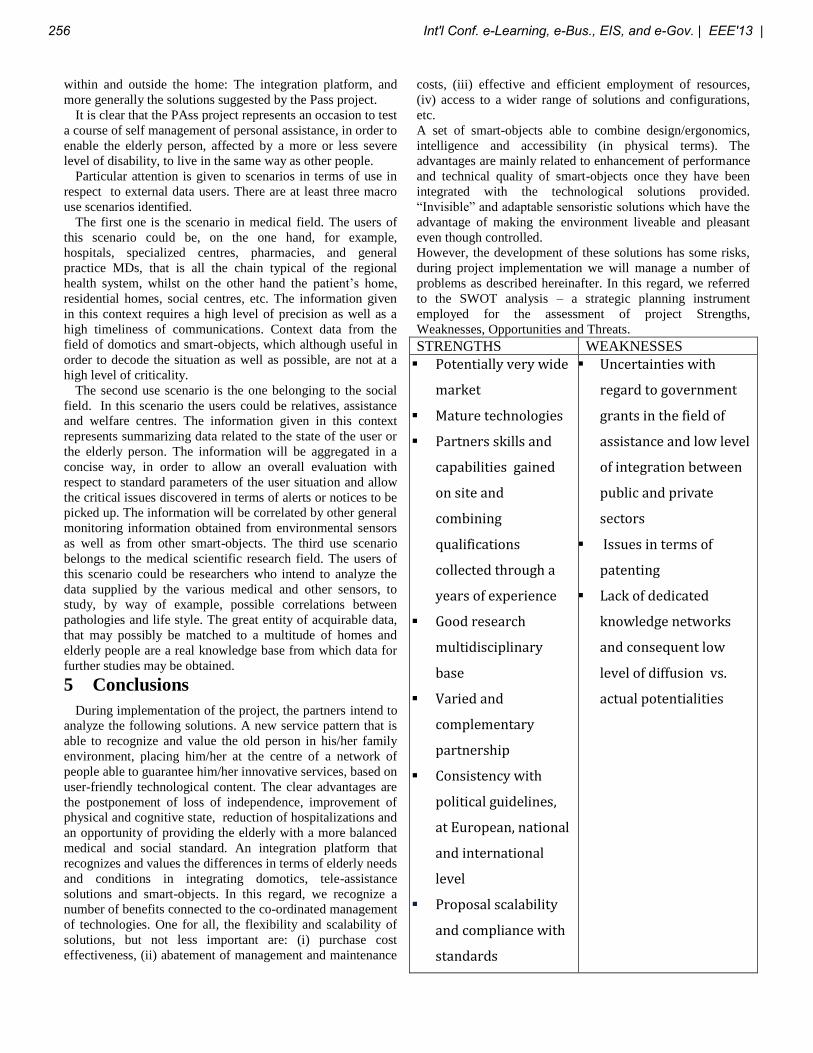
within and outside the home: The integration platform, and
more generally the solutions suggested by the Pass project.
It is clear that the PAss project represents an occasion to test
a course of self management of personal assistance, in order to
enable the elderly person, affected by a more or less severe
level of disability, to live in the same way as other people.
Particular attention is given to scenarios in terms of use in
respect to external data users. There are at least three macro
use scenarios identified.
The first one is the scenario in medical field. The users of
this scenario could be, on the one hand, for example,
hospitals, specialized centres, pharmacies, and general
practice MDs, that is all the chain typical of the regional
health system, whilst on the other hand the patient’s home,
residential homes, social centres, etc. The information given
in this context requires a high level of precision as well as a
high timeliness of communications. Context data from the
field of domotics and smart-objects, which although useful in
order to decode the situation as well as possible, are not at a
high level of criticality.
The second use scenario is the one belonging to the social
field. In this scenario the users could be relatives, assistance
and welfare centres. The information given in this context
represents summarizing data related to the state of the user or
the elderly person. The information will be aggregated in a
concise way, in order to allow an overall evaluation with
respect to standard parameters of the user situation and allow
the critical issues discovered in terms of alerts or notices to be
picked up. The information will be correlated by other general
monitoring information obtained from environmental sensors
as well as from other smart-objects. The third use scenario
belongs to the medical scientific research field. The users of
this scenario could be researchers who intend to analyze the
data supplied by the various medical and other sensors, to
study, by way of example, possible correlations between
pathologies and life style. The great entity of acquirable data,
that may possibly be matched to a multitude of homes and
elderly people are a real knowledge base from which data for
further studies may be obtained.
5 Conclusions
During implementation of the project, the partners intend to
analyze the following solutions. A new service pattern that is
able to recognize and value the old person in his/her family
environment, placing him/her at the centre of a network of
people able to guarantee him/her innovative services, based on
user-friendly technological content. The clear advantages are
the postponement of loss of independence, improvement of
physical and cognitive state, reduction of hospitalizations and
an opportunity of providing the elderly with a more balanced
medical and social standard. An integration platform that
recognizes and values the differences in terms of elderly needs
and conditions in integrating domotics, tele-assistance
solutions and smart-objects. In this regard, we recognize a
number of benefits connected to the co-ordinated management
of technologies. One for all, the flexibility and scalability of
solutions, but not less important are: (i) purchase cost
effectiveness, (ii) abatement of management and maintenance
costs, (iii) effective and efficient employment of resources,
(iv) access to a wider range of solutions and configurations,
etc.
A set of smart-objects able to combine design/ergonomics,
intelligence and accessibility (in physical terms). The
advantages are mainly related to enhancement of performance
and technical quality of smart-objects once they have been
integrated with the technological solutions provided.
“Invisible” and adaptable sensoristic solutions which have the
advantage of making the environment liveable and pleasant
even though controlled.
However, the development of these solutions has some risks,
during project implementation we will manage a number of
problems as described hereinafter. In this regard, we referred
to the SWOT analysis – a strategic planning instrument
employed for the assessment of project Strengths,
Weaknesses, Opportunities and Threats.
STRENGTHS WEAKNESSES
Potentially very wide
market
Mature technologies
Partners skills and
capabilities gained
on site and
combining
qualifications
collected through a
years of experience
Good research
multidisciplinary
base
Varied and
complementary
partnership
Consistency with
political guidelines,
at European, national
and international
level
Proposal scalability
and compliance with
standards
Uncertainties with
regard to government
grants in the field of
assistance and low level
of integration between
public and private
sectors
Issues in terms of
patenting
Lack of dedicated
knowledge networks
and consequent low
level of diffusion vs.
actual potentialities
256 Int'l Conf. e-Learning, e-Bus., EIS, and e-Gov. | EEE'13 |
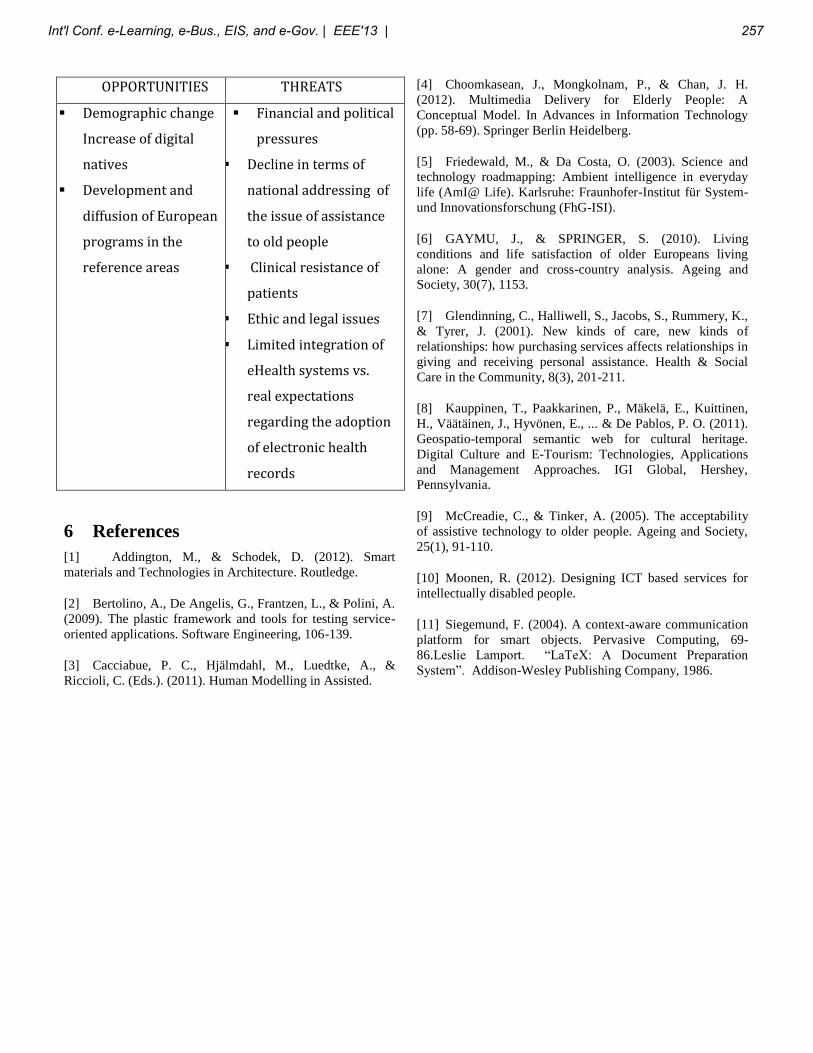
OPPORTUNITIES THREATS
Demographic change
Increase of digital
natives
Development and
diffusion of European
programs in the
reference areas
Financial and political
pressures
Decline in terms of
national addressing of
the issue of assistance
to old people
Clinical resistance of
patients
Ethic and legal issues
Limited integration of
eHealth systems vs.
real expectations
regarding the adoption
of electronic health
records
6 References
[1] Addington, M., & Schodek, D. (2012). Smart
materials and Technologies in Architecture. Routledge.
[2] Bertolino, A., De Angelis, G., Frantzen, L., & Polini, A.
(2009). The plastic framework and tools for testing service-
oriented applications. Software Engineering, 106-139.
[3] Cacciabue, P. C., Hjälmdahl, M., Luedtke, A., &
Riccioli, C. (Eds.). (2011). Human Modelling in Assisted.
[4] Choomkasean, J., Mongkolnam, P., & Chan, J. H.
(2012). Multimedia Delivery for Elderly People: A
Conceptual Model. In Advances in Information Technology
(pp. 58-69). Springer Berlin Heidelberg.
[5] Friedewald, M., & Da Costa, O. (2003). Science and
technology roadmapping: Ambient intelligence in everyday
life (AmI@ Life). Karlsruhe: Fraunhofer-Institut für System-
und Innovationsforschung (FhG-ISI).
[6] GAYMU, J., & SPRINGER, S. (2010). Living
conditions and life satisfaction of older Europeans living
alone: A gender and cross-country analysis. Ageing and
Society, 30(7), 1153.
[7] Glendinning, C., Halliwell, S., Jacobs, S., Rummery, K.,
& Tyrer, J. (2001). New kinds of care, new kinds of
relationships: how purchasing services affects relationships in
giving and receiving personal assistance. Health & Social
Care in the Community, 8(3), 201-211.
[8] Kauppinen, T., Paakkarinen, P., Mäkelä, E., Kuittinen,
H., Väätäinen, J., Hyvönen, E., ... & De Pablos, P. O. (2011).
Geospatio-temporal semantic web for cultural heritage.
Digital Culture and E-Tourism: Technologies, Applications
and Management Approaches. IGI Global, Hershey,
Pennsylvania.
[9] McCreadie, C., & Tinker, A. (2005). The acceptability
of assistive technology to older people. Ageing and Society,
25(1), 91-110.
[10] Moonen, R. (2012). Designing ICT based services for
intellectually disabled people.
[11] Siegemund, F. (2004). A context-aware communication
platform for smart objects. Pervasive Computing, 69-
86.Leslie Lamport. “LaTeX: A Document Preparation
System”. Addison-Wesley Publishing Company, 1986.
Int'l Conf. e-Learning, e-Bus., EIS, and e-Gov. | EEE'13 | 257
The Correlation of Speech and Hand Gestures for
Multimodal Web Interaction
Jing Liu1, Manolya Kavakli
2
Department of Computing, Macquarie University, Sydney, NSW, Australia
Abstract - With the development of Multimodal Interfaces
(MMI) in Human Computer Interaction (HCI), there is an
increasing interest at applying this technology to multimodal
web interaction. Multimodal web interfaces can provide end-
users with a natural, flexible and non-invasive interface that
allow graphical, vocal and gestural interaction with web.
Integration of speech and gestures in an MMI framework is
now the focus of the researchers in this area. In order to
combine speech and gestures in multimodal web interaction, it
is essential to know the correlations between speech and
associated gestures. This paper presents an empirical study
aimed at studying the correlations between speech and hand
gestures from a cognitive aspect. The methodology used in
this paper is the video analysis to investigate the cognitive
actions of speakers in the descriptions of objects using speech
and hand gestures. The speakers' cognitive actions are
analyzed using a cognitive scheme and protocol analysis
method. Our initial findings suggest that speech is highly
correlated with co-verbal hand gestures perceptually and
semantically, regardless of the age, gender, background of the
speakers, or the speed of speech and gesticulation.
Keywords: multimodal web interaction, speech, co-verbal
hand gestures, cognitive actions
1 Introduction
The Multimodal Interaction Activity is an initiative from
W3C aiming to provide means to support multimodal
interaction scenarios on the web. Multimodal interaction
offers significant ease of use and benefits over uni-modal
interaction from many aspects. Hands-free operation is
needed in mobile devices with limited keyboards, as well as
when a traditional desktop computer is unavailable to host the
application user interface for controlling other devices.
Multimodal web interaction is driven by the possibility in
embedded and network-based speech processing for
integrated multimodal web browsers. There is an exciting
range of applications relevant to integrated multimodal web
browsers. For instance, an ambient intelligent web interface is
expected to add value to remote control of home
entertainment systems. It can enable sensors, interactive
screens, input devices for speech, gestures and tactile
information to directly interact with each house and outdoor
device. End-users with disability will also benefit from this
technology [1][2]. VoiceXML is the W3C’s standard XML
format for specifying interactive voice dialogues between a
human and a computer. It allows voice applications to be
developed and deployed in an analogous way to HTML for
visual applications [3]. With the emergence of MMI
integrating speech and gestures [4][5], it is possible to
combine these two input modes in web interfaces to get joint
benefits. A system using personal robot as ubiquitous
multimedia mobile web interfaces enable end-users to access
web by speech and hand gestures [6]. The correlation of
speech and hand gesture is crucial for integrating them in
MMI as well as multimodal web browsers, since the
architecture for MMI is time-sensitive for joint input.
2 Related work
A gesture is a form of non-verbal communication in which
physical actions communicate particular messages, either in
place of speech or together with speech. All speakers use
gestures, although the typology of gesticulation may differ.
They are tightly timed with speech [7]. Iconic gestures are
found to precede the related speech within 2 seconds in [8].
Currently there are three different views about the
relationship between speech and gestures. The first one points
that speech and gestures are separately communicated [9]-
[12]. According to this view, the primary role of gestures is to
compensate for speech, when verbal communication is
temporarily unavailable (e.g. coughing or hard to express by
words). They argue that the process of gesture production has
no effect on the process of speech production or the cognitive
processes related to speech.
The second point of view is proposed initially by Robert
Krauss [13][14]. It states that speech and gestures are linked
reciprocally at a specific point during speech production.
They point that the production of gestures is activated when
speakers come across some difficulties in lexical retrieval.
The activation of gestures in turn activates the lexical affiliate
of that concept in mind, which results in articulating of the
word successfully. According to this view, gestures are linked
with speech only to the extent that it stimulates the activation
of word retrieval in speech at a moment.
The third one articulated by David McNeill [7] argues that
speech and gesture form an integrated system of
communication. The links between speech and gesture are
presented at the different levels of speech production (e.g.
discourse, syntax, semantics and prosody). From this
258 Int'l Conf. e-Learning, e-Bus., EIS, and e-Gov. | EEE'13 |
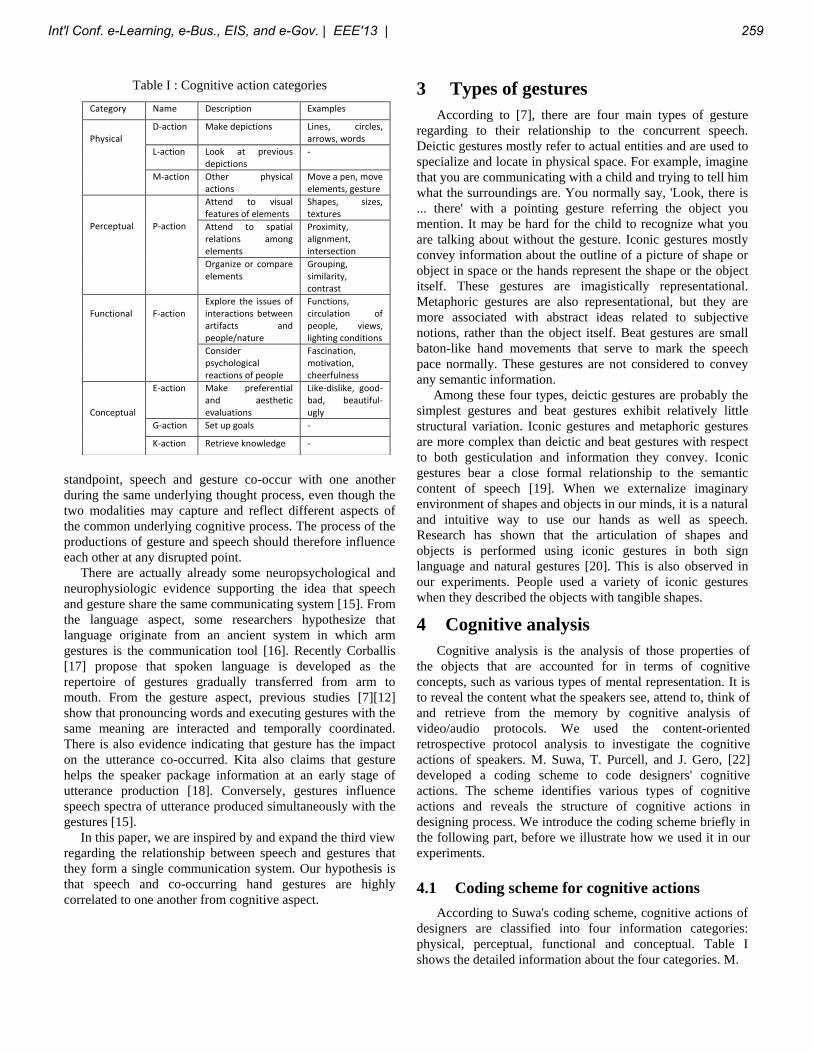
Table I : Cognitive action categories
standpoint, speech and gesture co-occur with one another
during the same underlying thought process, even though the
two modalities may capture and reflect different aspects of
the common underlying cognitive process. The process of the
productions of gesture and speech should therefore influence
each other at any disrupted point.
There are actually already some neuropsychological and
neurophysiologic evidence supporting the idea that speech
and gesture share the same communicating system [15]. From
the language aspect, some researchers hypothesize that
language originate from an ancient system in which arm
gestures is the communication tool [16]. Recently Corballis
[17] propose that spoken language is developed as the
repertoire of gestures gradually transferred from arm to
mouth. From the gesture aspect, previous studies [7][12]
show that pronouncing words and executing gestures with the
same meaning are interacted and temporally coordinated.
There is also evidence indicating that gesture has the impact
on the utterance co-occurred. Kita also claims that gesture
helps the speaker package information at an early stage of
utterance production [18]. Conversely, gestures influence
speech spectra of utterance produced simultaneously with the
gestures [15].
In this paper, we are inspired by and expand the third view
regarding the relationship between speech and gestures that
they form a single communication system. Our hypothesis is
that speech and co-occurring hand gestures are highly
correlated to one another from cognitive aspect.
3 Types of gestures
According to [7], there are four main types of gesture
regarding to their relationship to the concurrent speech.
Deictic gestures mostly refer to actual entities and are used to
specialize and locate in physical space. For example, imagine
that you are communicating with a child and trying to tell him
what the surroundings are. You normally say, 'Look, there is
... there' with a pointing gesture referring the object you
mention. It may be hard for the child to recognize what you
are talking about without the gesture. Iconic gestures mostly
convey information about the outline of a picture of shape or
object in space or the hands represent the shape or the object
itself. These gestures are imagistically representational.
Metaphoric gestures are also representational, but they are
more associated with abstract ideas related to subjective
notions, rather than the object itself. Beat gestures are small
baton-like hand movements that serve to mark the speech
pace normally. These gestures are not considered to convey
any semantic information.
Among these four types, deictic gestures are probably the
simplest gestures and beat gestures exhibit relatively little
structural variation. Iconic gestures and metaphoric gestures
are more complex than deictic and beat gestures with respect
to both gesticulation and information they convey. Iconic
gestures bear a close formal relationship to the semantic
content of speech [19]. When we externalize imaginary
environment of shapes and objects in our minds, it is a natural
and intuitive way to use our hands as well as speech.
Research has shown that the articulation of shapes and
objects is performed using iconic gestures in both sign
language and natural gestures [20]. This is also observed in
our experiments. People used a variety of iconic gestures
when they described the objects with tangible shapes.
4 Cognitive analysis
Cognitive analysis is the analysis of those properties of
the objects that are accounted for in terms of cognitive
concepts, such as various types of mental representation. It is
to reveal the content what the speakers see, attend to, think of
and retrieve from the memory by cognitive analysis of
video/audio protocols. We used the content-oriented
retrospective protocol analysis to investigate the cognitive
actions of speakers. M. Suwa, T. Purcell, and J. Gero, [22]
developed a coding scheme to code designers' cognitive
actions. The scheme identifies various types of cognitive
actions and reveals the structure of cognitive actions in
designing process. We introduce the coding scheme briefly in
the following part, before we illustrate how we used it in our
experiments.
4.1 Coding scheme for cognitive actions
According to Suwa's coding scheme, cognitive actions of
designers are classified into four information categories:
physical, perceptual, functional and conceptual. Table I
shows the detailed information about the four categories. M.
Category Name Description Examples
Physical
D-action Make depictions Lines, circles, arrows, words
L-action Look at previous depictions
-
M-action Other physical actions
Move a pen, move elements, gesture
Perceptual
P-action
Attend to visual features of elements
Shapes, sizes, textures
Attend to spatial relations among elements
Proximity, alignment, intersection
Organize or compare elements
Grouping, similarity, contrast
Functional
F-action
Explore the issues of interactions between artifacts and people/nature
Functions, circulation of people, views, lighting conditions
Consider psychological reactions of people
Fascination, motivation, cheerfulness
Conceptual
E-action Make preferential and aesthetic evaluations
Like-dislike, good-bad, beautiful-ugly
G-action Set up goals -
K-action Retrieve knowledge -
Int'l Conf. e-Learning, e-Bus., EIS, and e-Gov. | EEE'13 | 259
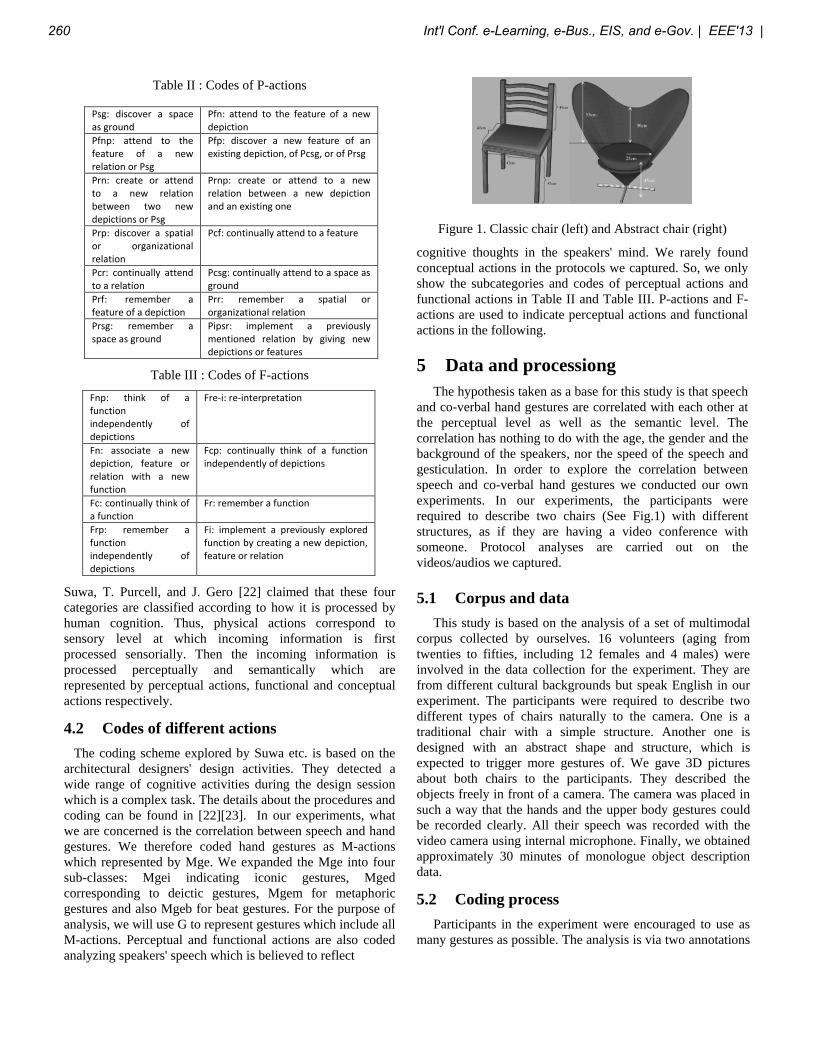
Table II : Codes of P-actions
Table III : Codes of F-actions
Fnp: think of a function independently of depictions
Fre-i: re-interpretation
Fn: associate a new depiction, feature or relation with a new function
Fcp: continually think of a function independently of depictions
Fc: continually think of a function
Fr: remember a function
Frp: remember a function independently of depictions
Fi: implement a previously explored function by creating a new depiction, feature or relation
Suwa, T. Purcell, and J. Gero [22] claimed that these four
categories are classified according to how it is processed by
human cognition. Thus, physical actions correspond to
sensory level at which incoming information is first
processed sensorially. Then the incoming information is
processed perceptually and semantically which are
represented by perceptual actions, functional and conceptual
actions respectively.
4.2 Codes of different actions
The coding scheme explored by Suwa etc. is based on the
architectural designers' design activities. They detected a
wide range of cognitive activities during the design session
which is a complex task. The details about the procedures and
coding can be found in [22][23]. In our experiments, what
we are concerned is the correlation between speech and hand
gestures. We therefore coded hand gestures as M-actions
which represented by Mge. We expanded the Mge into four
sub-classes: Mgei indicating iconic gestures, Mged
corresponding to deictic gestures, Mgem for metaphoric
gestures and also Mgeb for beat gestures. For the purpose of
analysis, we will use G to represent gestures which include all
M-actions. Perceptual and functional actions are also coded
analyzing speakers' speech which is believed to reflect
Figure 1. Classic chair (left) and Abstract chair (right)
cognitive thoughts in the speakers' mind. We rarely found
conceptual actions in the protocols we captured. So, we only
show the subcategories and codes of perceptual actions and
functional actions in Table II and Table III. P-actions and F-
actions are used to indicate perceptual actions and functional
actions in the following.
5 Data and processiong
The hypothesis taken as a base for this study is that speech
and co-verbal hand gestures are correlated with each other at
the perceptual level as well as the semantic level. The
correlation has nothing to do with the age, the gender and the
background of the speakers, nor the speed of the speech and
gesticulation. In order to explore the correlation between
speech and co-verbal hand gestures we conducted our own
experiments. In our experiments, the participants were
required to describe two chairs (See Fig.1) with different
structures, as if they are having a video conference with
someone. Protocol analyses are carried out on the
videos/audios we captured.
5.1 Corpus and data
This study is based on the analysis of a set of multimodal
corpus collected by ourselves. 16 volunteers (aging from
twenties to fifties, including 12 females and 4 males) were
involved in the data collection for the experiment. They are
from different cultural backgrounds but speak English in our
experiment. The participants were required to describe two
different types of chairs naturally to the camera. One is a
traditional chair with a simple structure. Another one is
designed with an abstract shape and structure, which is
expected to trigger more gestures of. We gave 3D pictures
about both chairs to the participants. They described the
objects freely in front of a camera. The camera was placed in
such a way that the hands and the upper body gestures could
be recorded clearly. All their speech was recorded with the
video camera using internal microphone. Finally, we obtained
approximately 30 minutes of monologue object description
data.
5.2 Coding process
Participants in the experiment were encouraged to use as
many gestures as possible. The analysis is via two annotations
Psg: discover a space as ground
Pfn: attend to the feature of a new depiction
Pfnp: attend to the feature of a new relation or Psg
Pfp: discover a new feature of an existing depiction, of Pcsg, or of Prsg
Prn: create or attend to a new relation between two new depictions or Psg
Prnp: create or attend to a new relation between a new depiction and an existing one
Prp: discover a spatial or organizational relation
Pcf: continually attend to a feature
Pcr: continually attend to a relation
Pcsg: continually attend to a space as ground
Prf: remember a feature of a depiction
Prr: remember a spatial or organizational relation
Prsg: remember a space as ground
Pipsr: implement a previously mentioned relation by giving new depictions or features
260 Int'l Conf. e-Learning, e-Bus., EIS, and e-Gov. | EEE'13 |
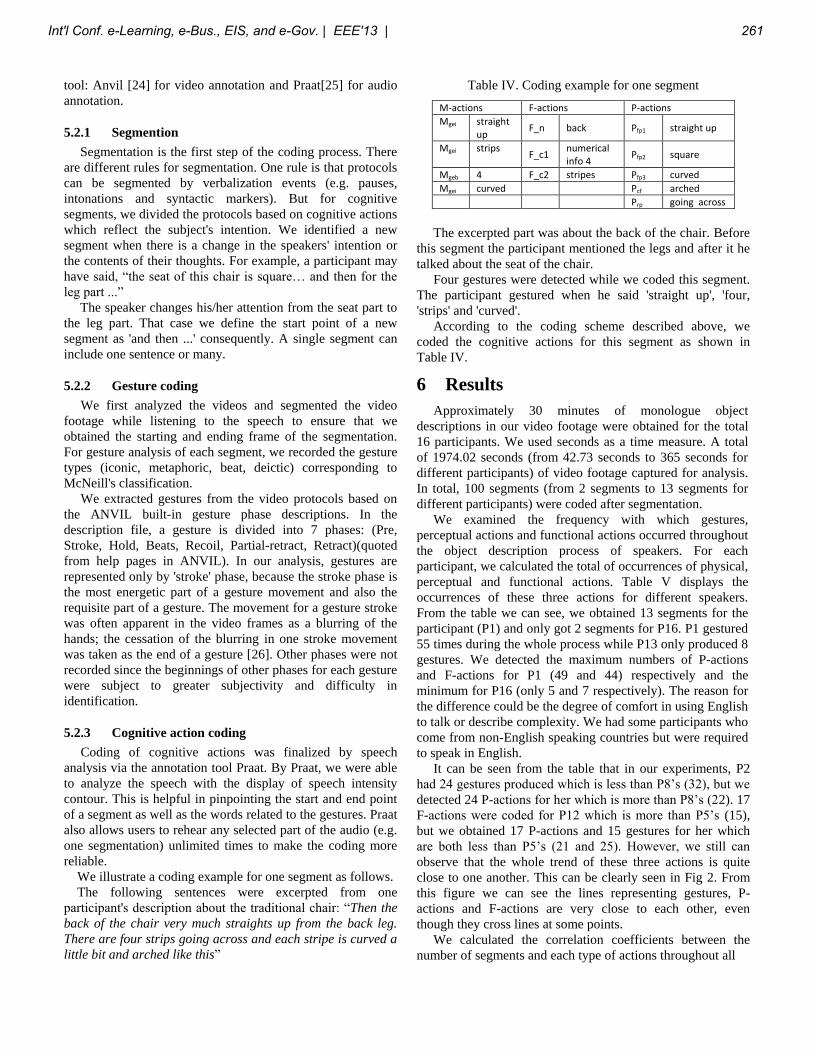
tool: Anvil [24] for video annotation and Praat[25] for audio
annotation.
5.2.1 Segmention
Segmentation is the first step of the coding process. There
are different rules for segmentation. One rule is that protocols
can be segmented by verbalization events (e.g. pauses,
intonations and syntactic markers). But for cognitive
segments, we divided the protocols based on cognitive actions
which reflect the subject's intention. We identified a new
segment when there is a change in the speakers' intention or
the contents of their thoughts. For example, a participant may
have said, “the seat of this chair is square… and then for the
leg part ...”
The speaker changes his/her attention from the seat part to
the leg part. That case we define the start point of a new
segment as 'and then ...' consequently. A single segment can
include one sentence or many.
5.2.2 Gesture coding
We first analyzed the videos and segmented the video
footage while listening to the speech to ensure that we
obtained the starting and ending frame of the segmentation.
For gesture analysis of each segment, we recorded the gesture
types (iconic, metaphoric, beat, deictic) corresponding to
McNeill's classification.
We extracted gestures from the video protocols based on
the ANVIL built-in gesture phase descriptions. In the
description file, a gesture is divided into 7 phases: (Pre,
Stroke, Hold, Beats, Recoil, Partial-retract, Retract)(quoted
from help pages in ANVIL). In our analysis, gestures are
represented only by 'stroke' phase, because the stroke phase is
the most energetic part of a gesture movement and also the
requisite part of a gesture. The movement for a gesture stroke
was often apparent in the video frames as a blurring of the
hands; the cessation of the blurring in one stroke movement
was taken as the end of a gesture [26]. Other phases were not
recorded since the beginnings of other phases for each gesture
were subject to greater subjectivity and difficulty in
identification.
5.2.3 Cognitive action coding
Coding of cognitive actions was finalized by speech
analysis via the annotation tool Praat. By Praat, we were able
to analyze the speech with the display of speech intensity
contour. This is helpful in pinpointing the start and end point
of a segment as well as the words related to the gestures. Praat
also allows users to rehear any selected part of the audio (e.g.
one segmentation) unlimited times to make the coding more
reliable.
We illustrate a coding example for one segment as follows.
The following sentences were excerpted from one
participant's description about the traditional chair: “Then the
back of the chair very much straights up from the back leg.
There are four strips going across and each stripe is curved a
little bit and arched like this”
Table IV. Coding example for one segment
M-actions F-actions P-actions
Mgei straight up
F_n back Pfp1 straight up
Mgei strips F_c1
numerical info 4
Pfp2 square
Mgeb 4 F_c2 stripes Pfp3 curved
Mgei curved Pcf arched
Prp going across
The excerpted part was about the back of the chair. Before
this segment the participant mentioned the legs and after it he
talked about the seat of the chair.
Four gestures were detected while we coded this segment.
The participant gestured when he said 'straight up', 'four,
'strips' and 'curved'.
According to the coding scheme described above, we
coded the cognitive actions for this segment as shown in
Table IV.
6 Results
Approximately 30 minutes of monologue object
descriptions in our video footage were obtained for the total
16 participants. We used seconds as a time measure. A total
of 1974.02 seconds (from 42.73 seconds to 365 seconds for
different participants) of video footage captured for analysis.
In total, 100 segments (from 2 segments to 13 segments for
different participants) were coded after segmentation.
We examined the frequency with which gestures,
perceptual actions and functional actions occurred throughout
the object description process of speakers. For each
participant, we calculated the total of occurrences of physical,
perceptual and functional actions. Table V displays the
occurrences of these three actions for different speakers.
From the table we can see, we obtained 13 segments for the
participant (P1) and only got 2 segments for P16. P1 gestured
55 times during the whole process while P13 only produced 8
gestures. We detected the maximum numbers of P-actions
and F-actions for P1 (49 and 44) respectively and the
minimum for P16 (only 5 and 7 respectively). The reason for
the difference could be the degree of comfort in using English
to talk or describe complexity. We had some participants who
come from non-English speaking countries but were required
to speak in English.
It can be seen from the table that in our experiments, P2
had 24 gestures produced which is less than P8’s (32), but we
detected 24 P-actions for her which is more than P8’s (22). 17
F-actions were coded for P12 which is more than P5’s (15),
but we obtained 17 P-actions and 15 gestures for her which
are both less than P5’s (21 and 25). However, we still can
observe that the whole trend of these three actions is quite
close to one another. This can be clearly seen in Fig 2. From
this figure we can see the lines representing gestures, P-
actions and F-actions are very close to each other, even
though they cross lines at some points.
We calculated the correlation coefficients between the
number of segments and each type of actions throughout all
Int'l Conf. e-Learning, e-Bus., EIS, and e-Gov. | EEE'13 | 261
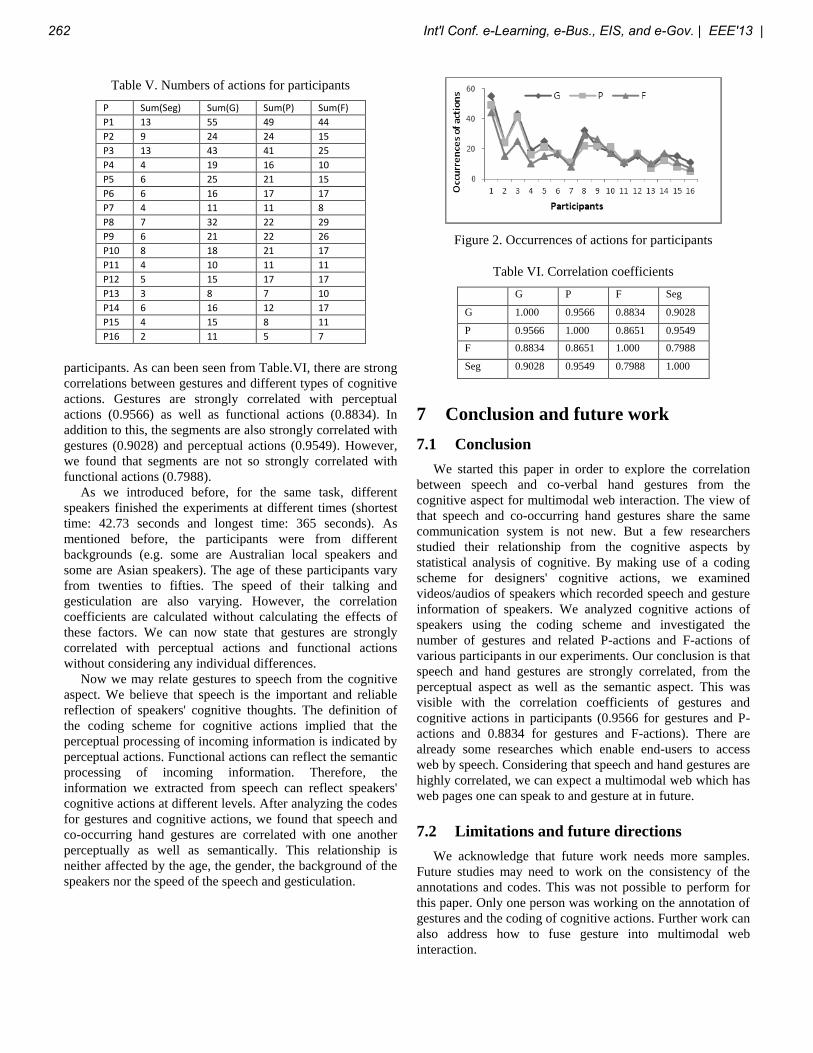
Table V. Numbers of actions for participants
P Sum(Seg) Sum(G) Sum(P) Sum(F)
P1 13 55 49 44
P2 9 24 24 15
P3 13 43 41 25
P4 4 19 16 10
P5 6 25 21 15
P6 6 16 17 17
P7 4 11 11 8
P8 7 32 22 29
P9 6 21 22 26
P10 8 18 21 17
P11 4 10 11 11
P12 5 15 17 17
P13 3 8 7 10
P14 6 16 12 17
P15 4 15 8 11
P16 2 11 5 7
participants. As can been seen from Table.VI, there are strong
correlations between gestures and different types of cognitive
actions. Gestures are strongly correlated with perceptual
actions (0.9566) as well as functional actions (0.8834). In
addition to this, the segments are also strongly correlated with
gestures (0.9028) and perceptual actions (0.9549). However,
we found that segments are not so strongly correlated with
functional actions (0.7988).
As we introduced before, for the same task, different
speakers finished the experiments at different times (shortest
time: 42.73 seconds and longest time: 365 seconds). As
mentioned before, the participants were from different
backgrounds (e.g. some are Australian local speakers and
some are Asian speakers). The age of these participants vary
from twenties to fifties. The speed of their talking and
gesticulation are also varying. However, the correlation
coefficients are calculated without calculating the effects of
these factors. We can now state that gestures are strongly
correlated with perceptual actions and functional actions
without considering any individual differences.
Now we may relate gestures to speech from the cognitive
aspect. We believe that speech is the important and reliable
reflection of speakers' cognitive thoughts. The definition of
the coding scheme for cognitive actions implied that the
perceptual processing of incoming information is indicated by
perceptual actions. Functional actions can reflect the semantic
processing of incoming information. Therefore, the
information we extracted from speech can reflect speakers'
cognitive actions at different levels. After analyzing the codes
for gestures and cognitive actions, we found that speech and
co-occurring hand gestures are correlated with one another
perceptually as well as semantically. This relationship is
neither affected by the age, the gender, the background of the
speakers nor the speed of the speech and gesticulation.
Figure 2. Occurrences of actions for participants
Table VI. Correlation coefficients
G P F Seg
G 1.000 0.9566 0.8834 0.9028
P 0.9566 1.000 0.8651 0.9549
F 0.8834 0.8651 1.000 0.7988
Seg 0.9028 0.9549 0.7988 1.000
7 Conclusion and future work
7.1 Conclusion
We started this paper in order to explore the correlation
between speech and co-verbal hand gestures from the
cognitive aspect for multimodal web interaction. The view of
that speech and co-occurring hand gestures share the same
communication system is not new. But a few researchers
studied their relationship from the cognitive aspects by
statistical analysis of cognitive. By making use of a coding
scheme for designers' cognitive actions, we examined
videos/audios of speakers which recorded speech and gesture
information of speakers. We analyzed cognitive actions of
speakers using the coding scheme and investigated the
number of gestures and related P-actions and F-actions of
various participants in our experiments. Our conclusion is that
speech and hand gestures are strongly correlated, from the
perceptual aspect as well as the semantic aspect. This was
visible with the correlation coefficients of gestures and
cognitive actions in participants (0.9566 for gestures and P-
actions and 0.8834 for gestures and F-actions). There are
already some researches which enable end-users to access
web by speech. Considering that speech and hand gestures are
highly correlated, we can expect a multimodal web which has
web pages one can speak to and gesture at in future.
7.2 Limitations and future directions
We acknowledge that future work needs more samples.
Future studies may need to work on the consistency of the
annotations and codes. This was not possible to perform for
this paper. Only one person was working on the annotation of
gestures and the coding of cognitive actions. Further work can
also address how to fuse gesture into multimodal web
interaction.
262 Int'l Conf. e-Learning, e-Bus., EIS, and e-Gov. | EEE'13 |
8 Acknowledgement
This work was supported in part by the Australian
Research Council Discovery grant DP0988088 to Manolya
Kavakli, titled "A Gesture-Based Interface for Designing in
Virtual Reality"
References
[1] González, Julia, Mercedes Macías, Roberto Rodríguez,
and Fernando Sánchez. "Accessibility metrics of web
pages for blind end-users." In Web Engineering, pp.
374-383. Springer Berlin Heidelberg, 2003.
[2] Knudsen, Lars Emil, and Harald Holone. "A multimodal
approach to accessible web content on smartphones." In
Computers Helping People with Special Needs, pp. 1-8.
Springer Berlin Heidelberg, 2012.
[3] Larson, James A. "W3c speech interface languages:
Voicexml [standards in a nutshell]." Signal Processing
Magazine, IEEE 24.3 (2007): 126-131.
[4] Larson, James A. "W3c speech interface languages:
Voicexml [standards in a nutshell]." Signal Processing
Magazine, IEEE 24.3 (2007): 126-131.
[5] Wachs, Juan Pablo, Mathias Kölsch, Helman Stern, and
Yael Edan." Vision-based hand-gesture
applications." Communications of the ACM 54, no. 2
(2011): 60-71.
[6] Ruiz-del-Solar, Javier. "Personal robots as ubiquitous-
multimedial-mobile web interfaces." In Web
Conference, 2007. LA-WEB 2007. Latin American, pp.
120-127. IEEE, 2007.
[7] D. McNeill, Hand and Mind: What Gestures Reveal
about Thought. Univ. Chicago Press, 1992.
[8] Liu, J. and Kavakli, M. “Temporal Relation between
Speech and Co-verbal Iconic Gestures in Multimodal
Interface Design”, Retrieved April, 2012
[9] B. Butterworth and G. Beattie, “Gestures and silence as
indicators of planning in speech,” in Recent Advances in
the Psychology of Language: Formal and Experimental
Approaches, ed., 1978
[10] U. Hadar, “Two types of gesture and their role in speech
production,” Journal of Language and Social
Psychology, vol. 8, no. 3-4, pp. 221–228, 1989.
[11] U. Hadar, D. Wenkert-Olenik, R. Krauss, and N.
Soroker,“Gesture and the processing of speech:
Neuropsychological evidence,” Brain and language, vol.
62, no. 1, pp. 107–126,
[12] W. Levelt, G. Richardson, and W. La Heij, “Pointing
and voicing in deictic expressions,” Journal of Memory
an Language, vol. 24, no. 2, pp. 133–164, 1985.
[13] R. Krauss, “Why do we gesture when we speak?”
Current Directions in Psychological Science, vol. 7, no.
2, pp. 54–60, 1998.
[14] R. Krauss and U. Hadar, “The role of speech-related
arm/hand gestures in word retrieval,” Gesture, speech,
and sign, pp. 93–116, 1999..
[15] P. Bernardis and M. Gentilucci, “Speech and gesture
share the same communication system,”
Neuropsychologia, vol. 44, no. 2, pp. 178–190, 2006.
[16] D. Armstrong, W. Stokoe, and S. Wilcox, Gesture and
the Nature of Language. Cambridge University Press,
1995.
[17] M. Corballis, From hand to mouth: The origins of
language. Princeton University Press, 2003.
[18] S. Kita, “How representational gestures help speaking,”
Language and gesture, pp. 162–185, 2000.
[19] A. Erol, G. Bebis, M. Nicolescu, R. Boyle, and X.
Twombly, Vision-based hand pose estimation: A
review,” Computer Vision and Image Understanding,
vol. 108, no. 1, pp. 52–73, 2007.
[20] T. Marsh, “An iconic gesture is worth more than a
thousand words,” in Information Visualization, 1998.
Proceedings. 1998 IEEE Conference on. IEEE, 1998, pp.
222–223.
[21] T. A. van Dijk. (2000) Cognitive discourse analysis.
http://www.discourses.org/UnpublishedArticles/cogn-
dis-anal.htm. University of Amsterdam.
[22] M. Suwa, T. Purcell, and J. Gero, “Macroscopic analysis
of design processes based on a scheme for coding
designers’ cognitive actions,” Design studies, vol. 19,
no. 4, pp. 455–483, 1998.
[23] M. Suwa, J. Gero, and T. Purcell, “Analysis of cognitive
processes of a designer as the foundation for support
tools,” in Artificial Intelligence in Design, vol. 98, 1998,
pp. 229–248.
[24] M. Kipp. (2000-2012) The video annotation research
tool. http://www.anvil-software.org/.
[25] P. Boersma and D. Weenink. The video annotation
research tool. University of Amsterdam.
[26] Y. Yasinnik, M. Renwick, and S. Shattuck-Hufnagel,
“The timing of speech-accompanying gestures with
respect to prosody,” Proceedings of Sound to Sense,
MIT, 2004.
Int'l Conf. e-Learning, e-Bus., EIS, and e-Gov. | EEE'13 | 263
A Comparative Study of Multiple Social Network Sites
Based on Google Analytics Data S. M. Horng
Department of Business Administration
National Chengchi University, Taiwan (ROC)
Abstract
This study collects the data from four social network sites to study user behavior. Data
are retrieved from their Google Analytics measures, including visits, percentage of
new visits, bounce rate, average time on page, and average time on site. Through
statistical analyses and in-depth interviews with the founders of the web services,
several patterns from analyzing the measures are identified and categorized into two
groups, visiting behavior and user behavior. Managerial implications are proposed and
discussed based on the analyzed results and discussions with practitioners.
Keywords: Google Analytics, user behavior, social network sites
Introduction
The term “web 2.0” was first documented by O’Reilly (2005) and its impact on
the internet has been studied widely. An important development of web 2.0 services is
the increasing user-generated content on the Web, and the ability to combine parts of
it to form new content. Three web 2.0 collaborative tools, Blogs, Mashups, and Wikis
(Dearstyne, 2007), are predominantly important and have stimulated the development
of internet-based social network sites (referred to as SNS throughout the remainder of
the study). The key success factor of SNS is the high traffic flow representing higher
fees for advertisements and better conditions for any e-commerce application.
However, traffic flow is not the only indicator to be considered; other indicators such
as average time spent on the site, average time spent on pages, et al., are also
important to the long-term development of online services. This study worked with
several web services to collect their Google Analytics measures and is directed at
identifying an index performance model to the SNS. The results could provide online
services guidelines on how to operate their web site and better predict the
development of their online services.
Literature Review
According to Khoo et al. (2008), web metrics or web analytics record and
analyze visitor traffic to and through a web site. Three common tools are identified.
Frist, combinations of user panels and browser logging tools are used to track online
user populations. Second, network traffic data are collected directly from ISP servers.
Third, site-specific server log parsers or page tagging technologies are used to
measure traffic through a particular site. Google analytics is categorized as the third
tool. Of the three most popular web analytics software, Google Analytics,
ClickTracks, and Coremetrics (Chafkin, 2006), Google Analytics is the only one
among the three systems that is free of charge. Several studies have reported its
applications in practice. A library developed several interactive tutorials that covered
basic services, and used Google Analytics to record usage statistics and perform
264 Int'l Conf. e-Learning, e-Bus., EIS, and e-Gov. | EEE'13 |
evaluations (Braender et al., 2009). A university created an interactive learning
platform in which faculty and students could write and comment about emerging
social issues surrounding the web. They also used Google Analytics to gather usage
information (Betty, 2008). A company used website optimization provider SiteSpect
in conjunction with Google Analytics to evaluate the quality of video distribution
(Bannan, 2008). Plaza (2009) utilized data from Google Analytics to develop a
tracking methodology for academics to analyze the effectiveness of visits, and found
that return visits were the main engine for nurturing session length. These applications
of Google Analytics from the literature focused on the performance of a single web
service and improvement by benchmarking, while cross-websites analysis might
provide information on a broader view of online services.
Methodology and Results
Identify case companies and Google Analytics measures for study
The data on Google Analytics are only available for those registering their sites
on Google. Four companies based in Taiwan agreed to provide their Google Analytics
data for this study. For confidential reasons, the companies in this study are
represented as A, B, C, and D. The following is a brief description of them. Company
A combines maps and blogs so that users can post articles on the location indicating
where they live and interact with other users via this platform. Company B provides
an online platform to collect articles on pre-defined topics. In addition to
user-provided contents, articles on different sites can be tagged or recommended on
this site so that users are able to read many high-quality articles devoted to a specific
topic at a single site. Company C is an online service specifically for dining
information. The user can search for restaurants based on several pre-defined topics
such as menu, price, location, et al. In addition, opinions regarding a specific
restaurant are also posted as important references for other users. The last one offers a
free platform for student users, especially campus clubs, to interact on the site.
Table 1. Google Analytics measures used in this study and their definitions
Measure Definition
Visit The number of times your visitors visit to your site (individual sessions
initiated by each of your visitors). If a user is inactive on your site for 30
minutes or more, any future activity will be attributed to a new session.
Users that leave your site and return within 30 minutes will be counted as
part of the original session.
BR Bounce rate is the percentage of single-page visits or visits in which a
person leaves your site from the entrance (landing) page. This metric is
used to measure visit quality – a high bounce rate generally indicates that
site entrance pages are not relevant to your visitors.
% NV The number of new visits by individuals who have never been to the site
before divided by the number of visits.
ATOP Average time on page. Total time on site for all visits divided by the
number of pages.
ATOS Average time on site. Total time on site for all visits divided by the total
number of visits.
Int'l Conf. e-Learning, e-Bus., EIS, and e-Gov. | EEE'13 | 265
Many measures are available on Google Analytics for retrieval. After discussing
with the founders of the four online companies, 15 important variables were identified
including Bounces, Bounce Rate, Entrances, Exits, percent of Exit, Visitors, New
Visits, Percent of New Visits, Time on Page, Average Time on Page, Pageviews, The
Number of Pages per Visit, Time on Site, Average Time on Site, and Visits. Since
some of the variables are combinations of others or highly correlated with each other,
the data are further reduced into five items in which their definitions from Google
(2009) are shown in Table 1.
Data collection
Companies A, B, C, and D recorded data for 480, 1002, 615, and 335 days,
respectively, during the period from 2006 to 2009. In order to analyze the sites only
when they are well established, data with less than 1000 visits per day are further
removed, resulting in 480, 857, 615, and 332 days. Since company A has its data
recorded for members separately from non-members, a total of 6 cases are analyzed,
including case A, case B, case C, case D, case A(m) for members, and case A(n) for
non-members.
Data analysis
A focus group interview with the founders of these websites revealed that visit
was the most important index. They also proposed several questions which became
the research topics of this study. First, what is the relationship between visit and other
indices and what are their managerial implications? Second, how can the abnormal
records of daily visit be identified and what are their managerial implications? The
issue of managerial implications arises for the second question because all of the
companies experience a similar pattern in that the number of visits jumps significantly
in periods of promotional events and then drop to normal levels several days later. It is
difficult to evaluate the long-term effect of promotional events. To answer the first
question, Pearson correlation coefficients are calculated for relationships between
visit and the four other measures, BR, %NV, ATOP, and ATOS. Most of them are
significant at 0.05 levels across the six cases. However, the correlation relationship
might not be consistent over time. In order to identify the pairwise correlation
relationship along a timeline, a moving window of 60 days is used to calculate the
Pearson correlation coefficients over the data collection period. The moving window
works as follows: The first coefficient is calculated based on day one to day 60; the
second coefficient is based on day two to day 61; and so on. A data set of 200 days
produces 141 Pearson correlation coefficients.
Figure 1 shows the correlation relationships between visit and the four other
measures for case C. All of the four correlation coefficients fluctuate over time when
observed individually and none of them show a consistent relationship. Using the data
for the entire collection period to calculate one correlation coefficient might lead to a
misinterpretation of the real relationship between them. The same fluctuating patterns
were observed across all of the other five cases.
266 Int'l Conf. e-Learning, e-Bus., EIS, and e-Gov. | EEE'13 |
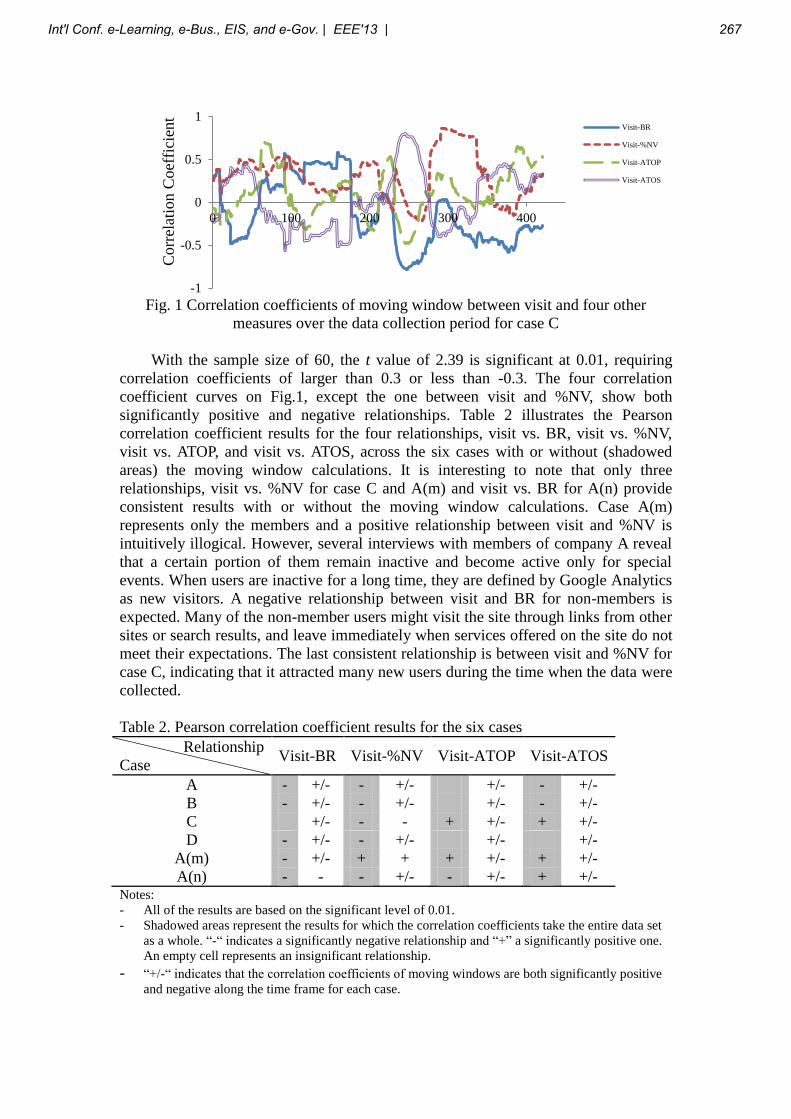
Fig. 1 Correlation coefficients of moving window between visit and four other
measures over the data collection period for case C
With the sample size of 60, the t value of 2.39 is significant at 0.01, requiring
correlation coefficients of larger than 0.3 or less than -0.3. The four correlation
coefficient curves on Fig.1, except the one between visit and %NV, show both
significantly positive and negative relationships. Table 2 illustrates the Pearson
correlation coefficient results for the four relationships, visit vs. BR, visit vs. %NV,
visit vs. ATOP, and visit vs. ATOS, across the six cases with or without (shadowed
areas) the moving window calculations. It is interesting to note that only three
relationships, visit vs. %NV for case C and A(m) and visit vs. BR for A(n) provide
consistent results with or without the moving window calculations. Case A(m)
represents only the members and a positive relationship between visit and %NV is
intuitively illogical. However, several interviews with members of company A reveal
that a certain portion of them remain inactive and become active only for special
events. When users are inactive for a long time, they are defined by Google Analytics
as new visitors. A negative relationship between visit and BR for non-members is
expected. Many of the non-member users might visit the site through links from other
sites or search results, and leave immediately when services offered on the site do not
meet their expectations. The last consistent relationship is between visit and %NV for
case C, indicating that it attracted many new users during the time when the data were
collected.
Table 2. Pearson correlation coefficient results for the six cases
Relationship
Case Visit-BR Visit-%NV Visit-ATOP Visit-ATOS
A - +/- - +/- +/- - +/-
B - +/- - +/- +/- - +/-
C +/- - - + +/- + +/-
D - +/- - +/- +/- +/-
A(m) - +/- + + + +/- + +/-
A(n) - - - +/- - +/- + +/- Notes:
- All of the results are based on the significant level of 0.01.
- Shadowed areas represent the results for which the correlation coefficients take the entire data set
as a whole. “-“ indicates a significantly negative relationship and “+” a significantly positive one.
An empty cell represents an insignificant relationship.
- “+/-“ indicates that the correlation coefficients of moving windows are both significantly positive
and negative along the time frame for each case.
-1
-0.5
0
0.5
1
0 100 200 300 400
Visit-BR
Visit-%NV
Visit-ATOP
Visit-ATOS
Corr
elat
ion
Coef
fici
ent
Int'l Conf. e-Learning, e-Bus., EIS, and e-Gov. | EEE'13 | 267
In order to provide a more profound analysis, the four measures, BR, %NV,
ATOP, and ATOS are divided into two groups: BR and %NV represent visiting state
while ATOP and ATOS indicate user behavior state. Adding visit into each group
results in eight scenarios for each group. Tables 3 and 4 list these 16 scenarios and
their corresponding implications are the results via discussions with the founders of
the case companies.
Table 3. Eight visiting states in combination with conditions of visit, BR, and %NV
Notes: “+”and ”-” represent significant increased and decreased value, respectively, in visit,
%NV”, or BR.
Table 4 Eight user behavior combinations among conditions of visit, BR, and %NV
Notes: “+”and ”-” represent significant increased and decreased value, respectively, in visit,
ATOP, or ATOS.
After examination of the data, Table 5 shows the combinations of visiting states
Conditions
Visiting state
Visits %NV BR Implications
1 + + + A typical situation when the number of visits is
increased by new users, some of whom are not
interested in this site.
2 + - - Attracts many loyal users.
3 + + - Attracts many new users who are interested in this site.
4 + - + Fewer new users and more loyal users who left the site
after a short time.
5 - - - Similar to the first scenario with decreased number of
visits.
6 - + + Higher portion of new users leave the site quickly, or
the sudden drop of regular users causes a higher %NV.
7 - - + Both the numbers of new or regular old users decrease
and they stay on the site for short periods.
8 - + - The portion of new visitors interested in this site
increases and/or the portion of regular users decreases.
Conditions
User behavior
Visits ATOP ATOS Implications
1 + + + Increased users show great interest in this
site.
2 + + - Increased users show less interest in this site.
3 + - + Increased users show great interest in certain
pages.
4 + - - Increased users quickly browse many pages
on the site.
5 - - - The site is dying.
6 - - + Only loyal users visit and show greater
interest in many pages.
7 - + - Only loyal users visit and quickly browse
many pages on the site.
8 - + + Only loyal users visit and stay on certain
pages for long periods of time.
268 Int'l Conf. e-Learning, e-Bus., EIS, and e-Gov. | EEE'13 |
and user behavior for the six cases. To identify the visiting and user behavior states
each case belongs to, the significant correlation coefficients of moving windows
between visit and the four measures, BR, %NV, ATOP, and ATOS are marked for
further analysis. Next, only the visits at the marked period showing significant
growing or dropping patterns are considered. Note that cases B and D have similar
results. When visits increase as indicated by the visiting states of 1, 2, 3, or 4, user
behavior 1, 2, or 4 can be seen in both of the cases, and user behavior 3 (ATOP
decreases and ATOS increases) is never observed. When visits are down as indicated
by visiting states 5, 6, 7, and 8, ATOP and ATOS both increase in cases B and D. It is
speculated that the increasing number of visitors in both cases stay for long periods of
time on several targeted pages related to their promotional events. On the other hand,
loyal users continue visiting both of the sites when the number of total visits is down,
resulting in higher ATOP and ATOS. When considering cases A and C, visiting states
1, 3, 5, and 7 are never found. That is, visits and %NV are negatively correlated. The
founders indicated that their social communities attract a high rate of revisiting users
as well as new visitors. In addition, as the visits drop, ATOP increases in case A and
decreases in case C. The nature of company C, which provides an information-based
web service, might explain this finding.
Table 5 Observed combinations of visiting states and user behavior states for the six
cases
Case
Visiting state
A A(m) A(n) B C D
1 - 4 - 2 - 2
2 1,2,4 - 2 1,2 1,2,3 1,2,4
3 - - - 1,2 - 1,4
4 2,4 2 1,4 4 1,2 -
5 - 8 6 - - 6
6 7,8 - - 8 5 8
7 - - - 8 - 8
8 7,8 6,8 8 8 5,6 8
Note: Except for the first column, the numbers represent user behavior states. Multiple numbers in one
cell indicate more than one user behavior state is observed at that visiting state. The user
behavior states are added in this table only when significant correlation coefficients are observed.
Companies A, B, and D focus on building up their virtual communities while
company C’s strategy is to provide information. Sites A, B, and D are defined as
interaction-based websites and site C is an information-based website. The differences
between these two types of websites can be stated as follows. As visits increase
(visiting states 1, 2, 3, and 4), user behavior 3 is never found on site A, B, and D.
User behavior 5 is not found when visits are down on sites A, B, and D. That is, user
behavior 3 and 5 are the unique features of the users on site C.
After in-depth interviews with the founders of the case companies, positive and
negative indicators for the visiting states are identified. Visiting state 3 is agreed by all
to have the best indicator for the web operation. Visits increase and most of the new
users are also interested in the services or contents of the site. However, one
interviewee indicated that visiting states 2 and 4 do not necessarily signify failure of
the site, but rather might also reflect healthy development of the online service under
the condition of no promotional events. Visiting states 5 and 7 are considered as
Int'l Conf. e-Learning, e-Bus., EIS, and e-Gov. | EEE'13 | 269
indicators of the end of the online services by all of the interviewees. One of the
founders also considered visiting state 4 a warning sign that might result in failure in
the long term.
In terms of user behavior, scenario 1 was unanimously deemed to signify the best
condition. However, a rising ATOS is also important when longevity of the user is
considered. Dependent on business models, user behavior scenarios 5 or 8 are
indicators of the declining stage of a web site.
Conclusions and Future Work
This study collected Google Analytics data from four social network sites.
Through a focus group interview with the founders of the web services, the five most
important measures were identified. Correlation analysis was used to provide a
foundation for the findings. Visits and its relationships with BR and %NV represent
visiting states, and visits and its relationship with ATOP and ATOS signify user
behavior. By combining the actual data analyses and in-depth interviews, the
managerial implications for visiting states and user behavior are both identified.
Although some of the results are case dependent, others are commonly applicable to
all online services.
As indicated previously, identifying abnormal records of visits and studying this
factor’s managerial implication is the second issue proposed by website founders and
is currently addressed by this study. In addition, the differences between members and
non-members of case A are also an intriguing topic requiring further analysis.
References
Bannan, K. J. (2008). RADirect uses Web analytics to improve online video success.
B to B, 93, 14.
Betty, P. (2008). Creation, management, and assessment of library screencasts: The
Regis libraries animated tutorials project. Journal of Library Administration, 48,
295-315.
Braender, L. M., Kapp, C. M. & Years, J. (2009). Using web technology to teach
students about their digital world. Journal of Information Systems Education, 20,
145-153.
Chafkin, M. (2006). Analyze This, Says Google. Inc., 28-30.
Dearstyne, B. W. (2007). Blogs, mashups, & wikis: Oh, My! Information
Management Journal, 41, 25-33.
Google, Google Analytics [computer software], 2009,
http://www.google.com/analytics, accessed on 10/10/2009.
Khoo, M., Pagano, J., Washington, A. L., Recker, M., Palmer, B. & Donahue, R. A.
(2008). Using web metrics to analyze digital libraries. Proceedings of the 8th
ACM/IEEE-CS Joint Conference on Digital Libraries, 375-384.
Plaza, B. (2009). Monitoring web traffic source effectiveness with Google analytics:
An experiment with time series, Aslib Proceedings, 61, 474-482.
270 Int'l Conf. e-Learning, e-Bus., EIS, and e-Gov. | EEE'13 |
WorldComp-EEE 13
Academic Research Quality E-Valuation: An Adaptive Hybrid Model based on Journal Rankings
and Citing Methodologies
Evangelia A.E.C. Lipitakis1 and Alexandra Lipitakis2
Kent Business School, University of Kent Canterbury, Kent CT2 7PE, England
(1) [email protected] (2) [email protected]
Abstract – The quality of the journal of the received citations of large sets of publications for evaluating the quality performance in the case of individual researchers, research groups and academic departments is an interesting research problem. An adaptive model incorporating and examining variables, such as the quality of journals of a set of publication as well as the cited and citing articles within the given set of publications is proposed. This hybrid bibliometric methodology can be used as an alternative methodology to citations counts. The proposed weighted citations are taken into account according to the quality of their publication outlet and the computational procedure is based on weighted parameters affected by the journal quality for the evaluation of the citing and cited papers.The proposed research quality evaluation (RQE) methodology can be considered as a quality performance evaluation approach by using efficient research journal quality ranking indicators and citing methodologies based on weighted parameters. The proposed research quality evaluation methodology by examining the number of citations of a publication as well as its source of publication, evaluates a set of publications by taking into account the following indicators: (i) the total number of publications (productivity), (ii) the number of citations a paper has received (impact) (iii) the quality of the journal that the citing article has been published in (citing quality factor), (iv) the number of cited papers of a publication (impact) and (v) the quality of the journal that the cited article has been published in (cited quality factor). The considered journal quality citing and cited indices are used in combination with predetermined evaluation weight parameters in order to produce an efficient research quality evaluation methodology.
________________________________________________ Contact Author: Evangelia Lipitakis, [email protected]
Keywords: Advanced bibliometric indicators, business and management, citing and cited quality factors, journal quality citing index, journal quality ranking, research impact, research quality e-valuation, quantitative methods, weighted citations
1. Introduction
In the past decades considerable research efforts have been directed towards the areas of research quality evaluation methodologies, journal quality rankings, advanced bibliomeric indicators, e-business and management, and related applications (Todorov and Glanzel, 1988; Doyle and Arthurs, 1995; Garfield, 1999; Glanzel and Moed, 2002, Van Raan, 2003-2004; Hirsch, 2005; Moed, 2005; Nederhof, 2006; Mingers and Harzing, 2007; Truex et al., 2008; Molinary and Molinary, 2008; Mingers and Lipitakis, 2010; Lipitakis and Lipitakis, 2012; Mingers and Lipitakis, 2013). Various advanced bibliometric indicators can be used to efficiently measure the productivity and impact of research at several academic levels, such as at the level of individual researchers, research groups and university departments. The Leiden Methodology (Van Raan, 2003; Waltman et al., 2010 & 2011) which normalizes the citation rate of a set of publications for subject field and time, has been recently tested for the evaluation of research of three leading UK business schools in the area of Business, Economics and Management, (Mingers and Lipitakis, 2013).
Traditionally, citation based metrics have only considered the number of publications a paper has received and not the quality of the citations.
Int'l Conf. e-Learning, e-Bus., EIS, and e-Gov. | EEE'13 | 271
At this point we need to consider the following
research question “In research quality performance evaluation, should we consider and treat all citations equally?” The purpose of our research is to consider the eventuality that all citations are not equal and that they differ in some way. Given that citations come from journals, so far all citations have been treated equally regardless of whether the citations have been received by papers that have been published in high quality journals or low quality journals. This practice does not consider that citations from top journals should, perhaps, count for more than citations from poor quality journals. One basic assumption of bibliometric analysis is that scientists with important and original material endeavour to publish their results vigorously in the open international journal literature. Although journal articles differ widely in importance, it has been noticed that authors in most cases seek to publish in the better and, if possible, the best journals (Glanzel, 1996; Hicks, 1999; Van Raan, 2004).
In this paper, a new research quality evaluation methodology that examines the number of cited and citing articles of a set of publication as well as their source of publication is introduced. More specifically, this new methodology evaluates a set of publications by taking into account the following indicators: (i) the total number of publications (productivity), (ii) the number of citations a paper has received (impact), (iii) the quality of the journal that the citing article has been published in (citing quality factor), (iv) the number of cited papers and (v) the quality of the journal that the cited paper has been published in (cited quality factor). The three first components have been recently proposed by Lipitakis (2013) as part of the Journal Quality Citing (JQC) methodology. The above described indicators based on the previous JQC methodology can be extended for the academic research quality performance assessment. The purpose of our proposed methodology is to weight citations according to the quality of their publication outlet. This methodology is based on weighted parameters affected by the journal quality for the evaluation of each given and received citation. If we assume that high quality journals publish significant and original scientific research then our proposed weighted citations methodology reflects both the productivity and impact of a set of publications in a given field. 2. Citation Methodologies and Journal Ranking Indicators: A Synoptic Literature Review
New methodologies for the evaluation of research quality performance are mainly focused on the efficient use of advanced bibliometric indicators and scientometric information (data), efficient adapted peer reviewing methods
and certain hybrid methodologies for identifying excellent researchers of all types (Nederhof, 2006). Furthermore, new classes of hybrid methodologies incorporating both qualitative and quantitative advantageous elements are being developed. More specifically, certain quantitative elements are present in the class of qualitative methods, while qualitative elements appear also in the quantitative methods. The derivation of new and extended (modified) methodologies for measuring the research output quality of an individual researcher and/or a research unit in science and social sciences is a challenging research topic currently under investigation. Several bibliometric studies have focused more on the citation impact of a journal rather than that of the published research paper (Nederhof, 2006). Various recent studies have focused on new methods of assessing scholarly influence based on journal ranking indicators. For example, a recent study examined the use of the Hirsch-type indices for the evaluation of the scholarly influence of Information Systems (IS) researchers (Truex et al., 2008). Another study assessed the impact of a set of IS journals, publications and researchers using a weighted citations count on authors and institutions where a publication with less authors receives more weight than a pubication with more authors (Lowry et al., 2007a; Chua et al., 2002). The presentation of a method, using advanced statistical methods, is based on cumulative nth citation distributions on a publications ranking classification scheme (Egghe, 2007a) has also been considered. Additionally, a study on the complementary Hirsch type index, the hm, for the comparison of journals within the same subject field (Molinary and Molinary, 2008) has also been presented.
Several research studies measuring the perceived quality of journals have been presented. The use of citation analysis for the evaluation of the 17 most influential management journals in the area of management has been presented (Tahai and Meyer, 1999). The assessment of the relative quality of 30 academic journals in the area of International Business (IB) using two main approaches for journal quality evaluation; surveys and citation analysis, including bibliometric indicators such as the number of total citations, citations per publications and the impact factor has been considered (DuBois and Reeb, 2000). Two approaches for measuring the quality of 29 academic journals in the fields of economics and finance have been introduced; the use of the average age of the received citations and citation counts of the examined journals (McNulty and Boekeloo, 1999). In a recent research study four distinct classes for the classification of 15 “quantifiable research assessment measurements” (RAMs) for journal quality evaluation of 110 academic journals in the field of Statistics & Probability using the ISI subject category classification have been proposed, including journal quality measures such as the 2 year journal impact factor and several of its variations, the h-index, the H-STAR index, the Eigenfactor Index (EI), the Article Influence Index (AII), etc.
272 Int'l Conf. e-Learning, e-Bus., EIS, and e-Gov. | EEE'13 |
Calculations of the harmonic averages of the journal
rankings, as an alternative journal quality measure, by allocating equal weights for all the proposed classes were also given (Chang and McAller, 2012). The evaluation of the 40 top cited journals in the fields of business, economics, finance and management using the so-called “research assessment measurements” (RAMs) and harmonic average of the rankings of the journal ranking indicator of the selected journals has been also presented (Chang et al., 2011). Furthermore, various quantitative studies proposing the use linear programming for determining and assigning weights within a set of journals in a given field have been presented for journal quality ranking (Tse, 2001; Horowitz, 2003; Mingers et al., 2007).
3. On the relationship of the Hybrid RQE method and the PageRank-Eigenfactor algorithms
A set of methodologies similar to the one presented in
this chapter, called the Pagerank algorithm and the Eigenfactor Index has been presented. In the following we state certain similarities our proposed methodology has with the PageRank (Brin and Page, 1998) and Eigenfactor (Bergstrom et al., 2008; Davis, 2008) algorithmic mechanisms. The Pagerank algorithm (Brin and Page, 1998) is used by Google online search engine to assign weights in web pages depending on how heavily they have been used in order to measure their relative importance within a set i.e. the World Wide Web (www). A web page that has received many inbound links from other web pages in the given set, receives a high PageRank and is considered of significant importance. PageRank however, does not rank highly solely the number of inbound links. According to Page and Brin (1999), an incoming link from an important web page (i.e. www.yahoo.com) bares more significantly more weight than many inbound links of obscure web pages. The higher the PageRank of an inbound link, the more the weight it allocates to the recipient web page. Pagerank has been characterized as “an attempt to see how good an approximation to importance can be obtained just from the link structure.” (Page and Brin, 1999, p.3). The same principles rule in the case of the Eigenfactor index; received citations from highly ranked journals carry more weight than received citations from average/lower ranked journals (Bergstrom, 2007; Bergstrom et al., 2008; Davis, 2008; Fersht, 2009).
The concept of the Pagerank algorithm can be adapted to any set of reciprocal interactive entities, in our case a set of publications where the inbound links can be identified as the received citations a paper receives (citing articles) and the outbound links can be identified as the referenced papers (cited articles).
The methodology presented in this chapter proposes a
quantitative method (citation count) that incorporates the quality of the journals of the citing papers (weighted parameters) in a hybrid methodology, based on existing and novel research performance quality assessments. The term hybrid model here denotes the combined use of advanced bibliometric methodologies and journal quality ranking indicators in the modelling process.
4. An Adaptive Model for Evaluating the
Research Quality Performance at individual researcher level
In this section we propose an adaptive model for the evaluation of the research quality performance based on citing and cited quality factors using journal ranking indicators. This generalized adaptive model can be used for evaluating the academic research quality performance at individual researcher level and can be extended for evaluating the research quality performance at research group level, department level and university level involving large scale data processing bibliometric indicators.
An Adaptive Research Quality Evaluation model for computing the total research work of an individual researcher using three level bibliometric indicators can be derived by the following modelling scheme:
TRQEI =∑=
N
J 1RQEIJ = WL1 ∑
=
N
J 1[ (εJP
J JPJ)] +
WL2 [ ∑=
)(
1
JNCG
K (εCG
K,J CGPK,J) ] + WL3 [ ∑=
)(
1
JNCD
LεCD
L,J CDPL,J] ,
(4.1) where TRQEI is the total number of Research Quality
Evaluation journals indicators of all the published papers of the considered individual researcher, RQEI indicator of each one paper of the N-publications of the researcher and
JPJ, J=1,2,…,N, is the number of published papers, with N the total number of publications of the researcher,
CGPK, K=1,2,…,NCG, is the number of citing papers for each published paper, with NCG the number of citing papers.
CDPL, L=1,2,…,NCD, is the number of cided papers in each publication, with NCD the number of cited papers,
The adaptive parameters εJP , εCD , εCG are affecting respectively the variables JP, CDP, CGP. The numerical real values of the adaptive parameters εJP, εCD, εCG can be selected from predetermined values corresponding to the chosen journal quality measure. In a recent study for the determination of an efficient journal quality measure as a weighted parameter for the evaluation of citing articles in the fields of business and management, a class of 8 journal
Int'l Conf. e-Learning, e-Bus., EIS, and e-Gov. | EEE'13 | 273
ranking indicators including the 2 year impact factor, the 5 year impact factor, the h-index, the eigenfactor score, and the immediacy index has been considered (Lipitakis, 2013). The 8 journal ranking indicators have been tested in a dataset of more than 1,000 journals in the wider area of business and management using bibliometric indicators from the ISI Web of Science (WoS) online citation database. The results indicated the 5 year journal impact factor as the most efficient journal quality measure in the given subject areas. In our proposed methodology, in the case of the evaluation of a set of publications in the fields of business and management, the numerical values of the adaptive parameters εJP, εCD, εCG would be affected by the predetermined values of the impact factor 5 year in a given year and subject field (Lipitakis, 2013).
The three terms of the equation (4.1) correspond to three different levels of bibliometric factors, namely (L1) the published journal papers indicator, (L2) the citing papers indicators of each citing paper and (L3) the cited papers indicators of each paper. The weighed real parameters WL1, WL2 and WL3 can be selected from predetermined values of tables with different scales (for example, WL1 ∈ [0.0, 100.0], WL2 ∈ [0.0, 10.0] and WL3∈ [0.0, 2.0]) and correspond to the levels L1 (productivity), L2 and L3 (impact).
Note that the selection of the cited papers in each publication is a matter of personal preference of the researcher depending on several factors, such as the direct relevance of the cited paper with the publication, the scientific status of the top researcher works, the publication outlet of the cited paper, the top academic foundation in which researcher is affiliated to etc.
The total number of Research Quality Evaluation Journals indicator TRQEI can be considered as a function of productivity and impact, i.e.
TRQEI = f (∑=
N
J 1
[ (εJPJ JPJ)] ,
∑=
)(
1
JNCG
K
(εCGK,J CGPK,J) ], CDF), (4.2) (4.2)
where the second term of the function in (4.2) is related to the Journal Quality Citing (JQC) indicator and CDF is the cited papers factor related to the research quality performance (Lipitakis, 2013). The JQC index calculates the weighted citations of a publication, based on weighted parameters affected by the journal quality for the evaluation of each given citation.
In the case that WL1 =WL3 =0.0, the modelling scheme (4.1), leads to the following simplified (impact) function form
TRQEI* = WL2 [ ∑=
)(
1
JNCG
K
(εCGK,J CGPK,J) ] =
= f ( ∑=
)(
1
JNCG
K
(εCGK,J CGPK,J) ). (4.3)
In the case of WL1= WL3=0.0, TRQEI* becomes the Journal Quality Citing methodology (Lipitakis, 2013) which has been used for the assessment of the quality of the journal of the received citations of large sets of publications for the research quality performance evaluation in the case of an academic department or a researcher. Extensive numerical experimentation and statistical analysis of this model for the evaluation of the academic research output (journal articles) of three leading UK business schools in the fields of business, economics, management and O/R & management science using the 5 year journal impact factor as a journal quality ranking weighted parameter for the computation of weighted citations have been recently presented (Lipitakis, 2013). The obtained numerical results have indicated that this research quality methodology can be efficiently used in large scale academic research quality evaluation cases and that in the case of the Journal Quality Citing index produced similar results with to the UK RAE 2008 peer review assessment (Lipitakis, 2013).
The proposed adaptive hybrid model (4.1), a modified model of (4.3) that incorporates and examines more variables, such as the quality of the journals of the publications of the academic/researcher’s research output, as well as publications and journals of the citing articles and cited references of the publications, includes also other publication types (such as books, conference papers, reports, working papers, etc.).
5. Conclusions The quality of the journal of the cited and citing
articles of a set of publications for evaluating the quality performance in the case of individual researchers is investigated. An adaptive model incorporating and examining variables, such as the quality of journals of the cited and citing articles within the set of publications is considered. This hybrid bibliometric methodology, as an alternative methodology to citations counts, examines the quality of the journals of the cited and citing articles that they have been published in and evaluates the quality of the received and given citations (citing and cited articles) in the set of publications. The considered journal quality citing and cited indices are used in combination with predetermined evaluation weight parameters in order to produce an efficient research quality evaluation methodology.
274 Int'l Conf. e-Learning, e-Bus., EIS, and e-Gov. | EEE'13 |
Some early obtained numerical results indicate that
the new research quality evaluation methodology could be also used in large scale academic research quality cases and in the case of the Journal Citing Quality index which is a simplified form of our proposed model, there is a clear degree of concordance with the results of the UK RAE 2008 peer review exercise. The proposed adaptive hybrid RQE model can be considered as a quality performance evaluation approach by using efficient research journal quality ranking indicators and advanced bibliometric indicators based on weighted parameters.
References
BERGSTROM C. (2007): Eigenfactor: Measuring the value and prestige of scholarly journals, C&RL News 68, 314-316
BERGSTROM C., WEST J.D. and WISEMAN M.A. (2008): The Eigenfactor Metrics, The Journal of Neuroscience 28, 11433-11434
BRIN S. and PAGE L. (1998): The anatomy of a large-scale hypertextual Web search engine, Computer Networks and ISDN Systems 30, 107–117.
CHANG C.L. and MCALEER M. (2012): Ranking Journal Quality by Harmonic Mean of Ranks: An Application to ISI Statistics and Probability”, Statistica Neerlandica, 67, 27-53.
CHANG C.L., MCALEER M. and OXLEY L. (2011): What Makes a Great Journal Great in Economics? The Singer Not The Song, Journal of Economic Surveys, 25, 326-361.
CHUA C., CAO L., COUSINS K. and STRAUB D. (2002): Measuring Researcher-Production in Information Systems, Journal of the Association of Information Systems 3, 145-215.
DAVIS P.M. (2008): Eigenfactor: Does the principle of repeated improvement result in better estimates than raw citation counts? Journal of the American Society for Information Science and Technology 59, 2186-2188
DOYLE J. and ARTHURS A. (1995): Judging the quality of research in business schools, Omega, International Journal of Management Science 23, 257–270.
DUBOIS F.L. and REEB D. (2000): Ranking the International Business Journals, Journal of International Business Studies, 31, 689-704.
EGGHE L. (2007): Probabilities for encountering genius, basic, ordinary or insignificant papers based on the cumulative nth citation distribution, Scientometrics 70, 167-181
FERSHT A. (2009): The most influential journals: Impact factor and Eigenfactor, Procs of the National Academy of Sciences of the U.S.A. 106, 6883-6884
GARFIELD E. (1999): Journal Impact Factor: A Brief
Review, Canadian Medical Association Journal 161, 979-980
GLANZEL W. (1996): A bibliometric approach to social sciences, national research performance in 6 selected social science areas 1990-1992, Scientometrics 35, 291-307
GLANZEL W. and MOED H.F. (2002): Journal impact measures in bibliometric research, Scientometrics 53, 171-193
HICKS D. (1999): The Difficulty of Achieving Full Coverage of International Social Science Literature and the Bibliometric Consequences, Scientometrics 44 (2), 193-215
HIRSCH J. (2005): An index to quantify an individual’s scientific research output, Proceedings of The National Academy of Sciences of the U.S.A., 102:46, 16569-16572
HOROWITZ I. (2003): Preference-neutral attribute weights in the journal-ranking problem, Journal of the Operational Research Society, 54, 452-457.
LIPITAKIS A. and LIPITAKIS E.A.E.C. (2012): On the e-valuation of certain e-business strategies on firm performance by adaptive algorithmic modeling: An alternative strategic managerial approach, Computer Technology and Application 3, 38-46
LIPITAKIS EV.A.E.C. (2013): The use of bibliometric methods in evaluation research performance in Business and Management: A study of three UK Business Schools, Doctoral Thesis, KBS, University of Kent, Canterbury, England
LOWRY P.B., KARUGA G.G. and RICHARDSON V.J. (2007): Assessing leading Institutions, Faculty and Articles in premier Information Systems Research Journals, Communications of the Association for Information Systems 20, 142-203
McNULTY, J. E. and BOEKELOO, J. (1999): Two Approaches to Measuring Journal Quality: Application to Finance Journals, Journal of Economics and Finance, 23, 30-38.
MINGERS J. and HARZING A.W. (2007): Ranking journals in business and management: a statistical analysis of the Harzing data set, European Journal of Information Systems 16, 303-316
MINGERS J. and LIPITAKIS EV. A.E.C. (2010): Counting the Citations: A Comparison of Web of Science and Google Scholar in the Field of Business and Management, Scientometrics 85, 613-625
MINGERS J. and LIPITAKIS EV. A.E.C. (2013): Evaluating a Department’s Research: Testing the Leiden Methodology in Business and Management, Information Processing and Management 49, 587–595
Int'l Conf. e-Learning, e-Bus., EIS, and e-Gov. | EEE'13 | 275

MINGERS J. and WALSHAM G. (2010): Towards ethical
information systems: The contribution of discourse ethics, MIS QUARTERLY 34 (4), 833-854
MINGERS J., WATSON K. and SCAPARRA P. (2009): Estimating business and management journal quality from the 2008 Research Assessment Exercise in the UK, Information Processing & Management, 48, 1078-1093
MOED H.F.: Citation Analysis in Research Evaluation, Dordrecht (Netherlands), Springer, 2005
MOLINARY J.F. and MOLINARY A. (2008): A new methodology for ranking scientific institutions, Scientometrics 75, 163-174
NEDERHOF A.J. (2006): Bibliometric monitoring of research performance in the social sciences and humanities, Scientometrics 66, 81-100.
PAGE L. and BRIN S. (1999): The PageRank Citation Ranking: Bringing Order to the Web, Technical Report, Stanford InfoLab [Online]. Availble at: http://ilpubs.stanford.edu:8090/422/ (Accessed 2013).
TAHAI A. and MEYER M.J. (1999): Revealed Preference Study of Management Journals' Direct Influences, Strategic Management Journal, 20, 279-296
TODOROV R. and GLANZEL W. (1988): Journal Citation Measures: A Concise Review, Journal of Information Science 14, 47-56
TRUEX III D.P., CUELLAR M.J. and TAKEDA H. (2008): Assessing scholarly influence: Proposing new metrics, ICIS 2008 Procs, 1-19
TSE A.C.B. (2001): Using mathematical programming to solve large ranking problems, Journal of the Operational Research Society, 52, 1144–1150.
VAN RAAN A.F.J. (2003): The use of bibliometric analysis in research performance assessment and monitoring of interdisciplinary scientific developments, Technology Assessment – Theory and Practice 1, 20–29.
VAN RAAN A.F.J. (2004): Measuring Science: Capita selecta of current main issues, in Moed-Glanzel (eds): Handbook of quantitative science and technology research group, Kluwer Academic, 19-50
WALTMAN L., ECK N.J., LEEUWEN T.N., VISSER M.S. and VAN RAAN A.F. (2010): Towards a new crown indicator: Some theoretical considerations, Journal of Informetrics5, 37-47
WALTMAN L., ECK N.J., LEEUWEN T.N., VISSER M.S. and VAN RAAN A.F. (2011): Towards a new crown indicator: An empirical analysis, Scientometrics 87, 467-481
276 Int'l Conf. e-Learning, e-Bus., EIS, and e-Gov. | EEE'13 |
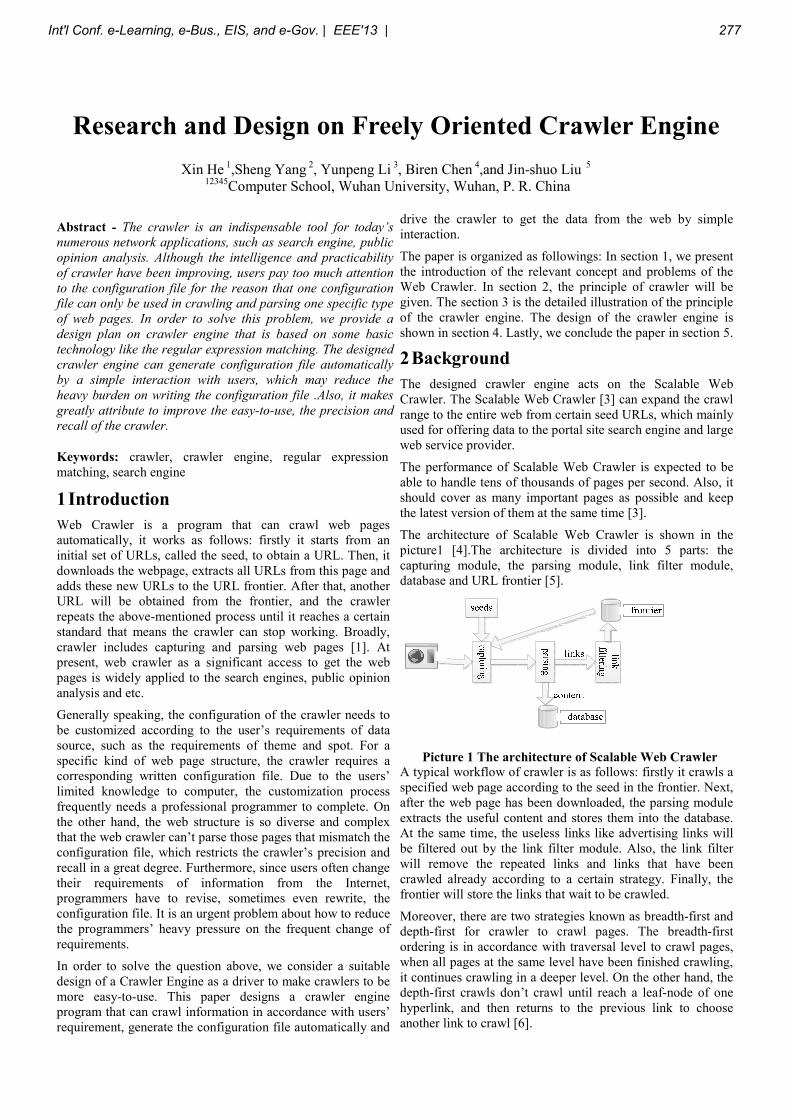
Research and Design on Freely Oriented Crawler Engine
Xin He 1,Sheng Yang
2, Yunpeng Li
3, Biren Chen
4,and Jin-shuo Liu
5
12345
Computer School, Wuhan University, Wuhan, P. R. China
Abstract - The crawler is an indispensable tool for today’s
numerous network applications, such as search engine, public
opinion analysis. Although the intelligence and practicability
of crawler have been improving, users pay too much attention
to the configuration file for the reason that one configuration
file can only be used in crawling and parsing one specific type
of web pages. In order to solve this problem, we provide a
design plan on crawler engine that is based on some basic
technology like the regular expression matching. The designed
crawler engine can generate configuration file automatically
by a simple interaction with users, which may reduce the
heavy burden on writing the configuration file .Also, it makes
greatly attribute to improve the easy-to-use, the precision and
recall of the crawler.
Keywords: crawler, crawler engine, regular expression
matching, search engine
1 Introduction
Web Crawler is a program that can crawl web pages
automatically, it works as follows: firstly it starts from an
initial set of URLs, called the seed, to obtain a URL. Then, it
downloads the webpage, extracts all URLs from this page and
adds these new URLs to the URL frontier. After that, another
URL will be obtained from the frontier, and the crawler
repeats the above-mentioned process until it reaches a certain
standard that means the crawler can stop working. Broadly,
crawler includes capturing and parsing web pages [1]. At
present, web crawler as a significant access to get the web
pages is widely applied to the search engines, public opinion
analysis and etc.
Generally speaking, the configuration of the crawler needs to
be customized according to the user’s requirements of data
source, such as the requirements of theme and spot. For a
specific kind of web page structure, the crawler requires a
corresponding written configuration file. Due to the users’
limited knowledge to computer, the customization process
frequently needs a professional programmer to complete. On
the other hand, the web structure is so diverse and complex
that the web crawler can’t parse those pages that mismatch the
configuration file, which restricts the crawler’s precision and
recall in a great degree. Furthermore, since users often change
their requirements of information from the Internet,
programmers have to revise, sometimes even rewrite, the
configuration file. It is an urgent problem about how to reduce
the programmers’ heavy pressure on the frequent change of
requirements.
In order to solve the question above, we consider a suitable
design of a Crawler Engine as a driver to make crawlers to be
more easy-to-use. This paper designs a crawler engine
program that can crawl information in accordance with users’
requirement, generate the configuration file automatically and
drive the crawler to get the data from the web by simple
interaction.
The paper is organized as followings: In section 1, we present
the introduction of the relevant concept and problems of the
Web Crawler. In section 2, the principle of crawler will be
given. The section 3 is the detailed illustration of the principle
of the crawler engine. The design of the crawler engine is
shown in section 4. Lastly, we conclude the paper in section 5.
2 Background
The designed crawler engine acts on the Scalable Web
Crawler. The Scalable Web Crawler [3] can expand the crawl
range to the entire web from certain seed URLs, which mainly
used for offering data to the portal site search engine and large
web service provider.
The performance of Scalable Web Crawler is expected to be
able to handle tens of thousands of pages per second. Also, it
should cover as many important pages as possible and keep
the latest version of them at the same time [3].
The architecture of Scalable Web Crawler is shown in the
picture1 [4].The architecture is divided into 5 parts: the
capturing module, the parsing module, link filter module,
database and URL frontier [5].
Picture 1 The architecture of Scalable Web Crawler
A typical workflow of crawler is as follows: firstly it crawls a
specified web page according to the seed in the frontier. Next,
after the web page has been downloaded, the parsing module
extracts the useful content and stores them into the database.
At the same time, the useless links like advertising links will
be filtered out by the link filter module. Also, the link filter
will remove the repeated links and links that have been
crawled already according to a certain strategy. Finally, the
frontier will store the links that wait to be crawled.
Moreover, there are two strategies known as breadth-first and
depth-first for crawler to crawl pages. The breadth-first
ordering is in accordance with traversal level to crawl pages,
when all pages at the same level have been finished crawling,
it continues crawling in a deeper level. On the other hand, the
depth-first crawls don’t crawl until reach a leaf-node of one
hyperlink, and then returns to the previous link to choose
another link to crawl [6].
Int'l Conf. e-Learning, e-Bus., EIS, and e-Gov. | EEE'13 | 277
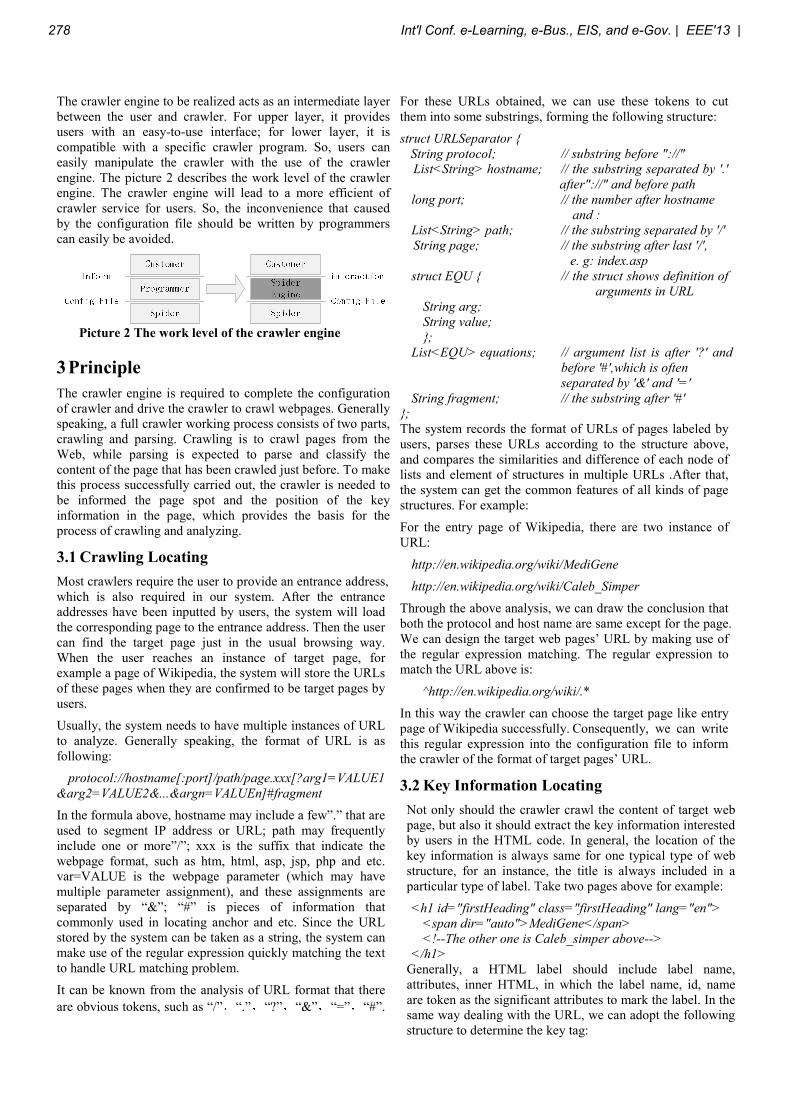
The crawler engine to be realized acts as an intermediate layer
between the user and crawler. For upper layer, it provides
users with an easy-to-use interface; for lower layer, it is
compatible with a specific crawler program. So, users can
easily manipulate the crawler with the use of the crawler
engine. The picture 2 describes the work level of the crawler
engine. The crawler engine will lead to a more efficient of
crawler service for users. So, the inconvenience that caused
by the configuration file should be written by programmers
can easily be avoided.
Picture 2 The work level of the crawler engine
3 Principle
The crawler engine is required to complete the configuration
of crawler and drive the crawler to crawl webpages. Generally
speaking, a full crawler working process consists of two parts,
crawling and parsing. Crawling is to crawl pages from the
Web, while parsing is expected to parse and classify the
content of the page that has been crawled just before. To make
this process successfully carried out, the crawler is needed to
be informed the page spot and the position of the key
information in the page, which provides the basis for the
process of crawling and analyzing.
3.1 Crawling Locating
Most crawlers require the user to provide an entrance address,
which is also required in our system. After the entrance
addresses have been inputted by users, the system will load
the corresponding page to the entrance address. Then the user
can find the target page just in the usual browsing way.
When the user reaches an instance of target page, for
example a page of Wikipedia, the system will store the URLs
of these pages when they are confirmed to be target pages by
users.
Usually, the system needs to have multiple instances of URL
to analyze. Generally speaking, the format of URL is as
following:
protocol://hostname[:port]/path/page.xxx[?arg1=VALUE1
&arg2=VALUE2&...&argn=VALUEn]#fragment
In the formula above, hostname may include a few”.” that are
used to segment IP address or URL; path may frequently
include one or more”/”; xxx is the suffix that indicate the
webpage format, such as htm, html, asp, jsp, php and etc.
var=VALUE is the webpage parameter (which may have
multiple parameter assignment), and these assignments are
separated by “&”; “#” is pieces of information that
commonly used in locating anchor and etc. Since the URL
stored by the system can be taken as a string, the system can
make use of the regular expression quickly matching the text
to handle URL matching problem.
It can be known from the analysis of URL format that there
are obvious tokens, such as “/”,“.”,“?”,“&”,“=”,“#”.
For these URLs obtained, we can use these tokens to cut
them into some substrings, forming the following structure:
struct URLSeparator {
String protocol; // substring before "://" List<String> hostname; // the substring separated by '.'
after"://" and before path
long port; // the number after hostname
and :
List<String> path; // the substring separated by '/' String page; // the substring after last '/',
e. g: index.asp
struct EQU { // the struct shows definition of arguments in URL
String arg;
String value;
};
List<EQU> equations; // argument list is after '?' and
before '#',which is often
separated by '&' and '='
String fragment; // the substring after '#'
};
The system records the format of URLs of pages labeled by
users, parses these URLs according to the structure above,
and compares the similarities and difference of each node of
lists and element of structures in multiple URLs .After that,
the system can get the common features of all kinds of page
structures. For example:
For the entry page of Wikipedia, there are two instance of
URL:
http://en.wikipedia.org/wiki/MediGene
http://en.wikipedia.org/wiki/Caleb_Simper
Through the above analysis, we can draw the conclusion that
both the protocol and host name are same except for the page.
We can design the target web pages’ URL by making use of
the regular expression matching. The regular expression to
match the URL above is:
^http://en.wikipedia.org/wiki/.*
In this way the crawler can choose the target page like entry
page of Wikipedia successfully. Consequently, we can write
this regular expression into the configuration file to inform
the crawler of the format of target pages’ URL.
3.2 Key Information Locating
Not only should the crawler crawl the content of target web
page, but also it should extract the key information interested
by users in the HTML code. In general, the location of the
key information is always same for one typical type of web
structure, for an instance, the title is always included in a
particular type of label. Take two pages above for example:
<h1 id="firstHeading" class="firstHeading" lang="en">
<span dir="auto">MediGene</span>
<!--The other one is Caleb_simper above-->
</h1>
Generally, a HTML label should include label name,
attributes, inner HTML, in which the label name, id, name
are token as the significant attributes to mark the label. In the
same way dealing with the URL, we can adopt the following
structure to determine the key tag:
278 Int'l Conf. e-Learning, e-Bus., EIS, and e-Gov. | EEE'13 |
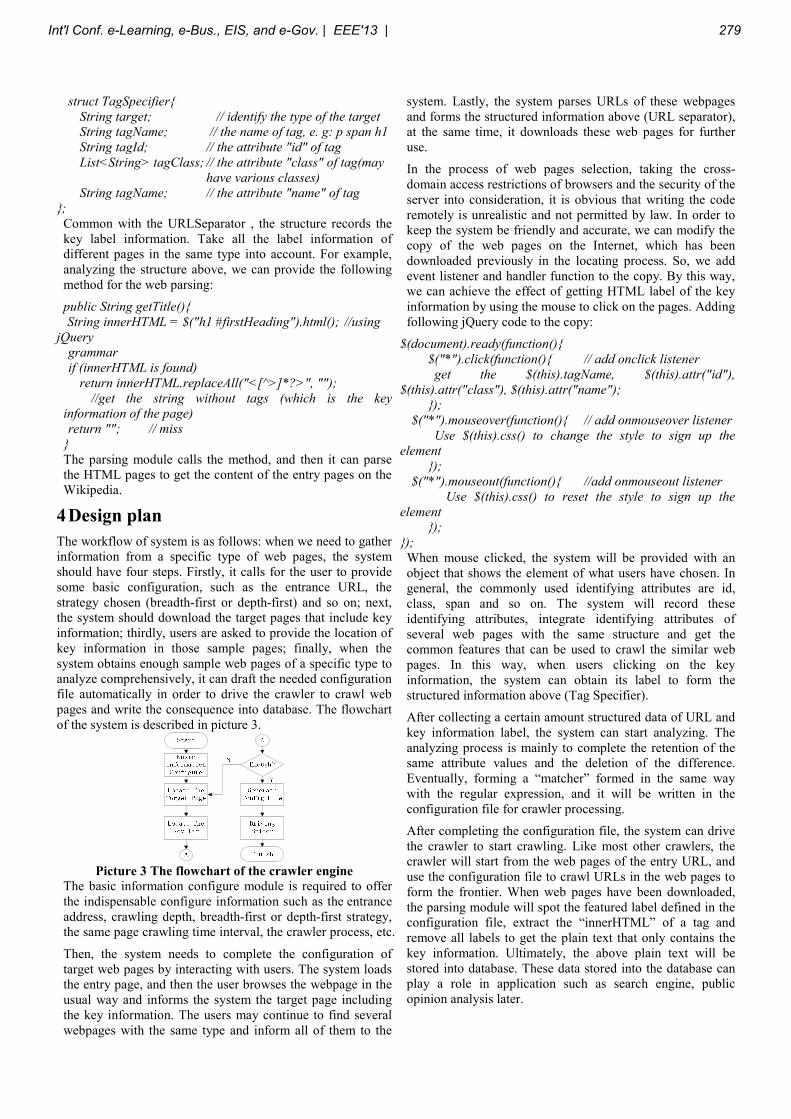
struct TagSpecifier{
String target; // identify the type of the target
String tagName; // the name of tag, e. g: p span h1
String tagId; // the attribute "id" of tag
List<String> tagClass; // the attribute "class" of tag(may
have various classes)
String tagName; // the attribute "name" of tag
};
Common with the URLSeparator , the structure records the
key label information. Take all the label information of
different pages in the same type into account. For example,
analyzing the structure above, we can provide the following
method for the web parsing:
public String getTitle(){
String innerHTML = $("h1 #firstHeading").html(); //using jQuery grammar
if (innerHTML is found)
return innerHTML.replaceAll("<[^>]*?>", "");
//get the string without tags (which is the key
information of the page)
return ""; // miss
}
The parsing module calls the method, and then it can parse
the HTML pages to get the content of the entry pages on the
Wikipedia.
4 Design plan
The workflow of system is as follows: when we need to gather
information from a specific type of web pages, the system
should have four steps. Firstly, it calls for the user to provide
some basic configuration, such as the entrance URL, the
strategy chosen (breadth-first or depth-first) and so on; next,
the system should download the target pages that include key
information; thirdly, users are asked to provide the location of
key information in those sample pages; finally, when the
system obtains enough sample web pages of a specific type to
analyze comprehensively, it can draft the needed configuration
file automatically in order to drive the crawler to crawl web
pages and write the consequence into database. The flowchart
of the system is described in picture 3.
Picture 3 The flowchart of the crawler engine
The basic information configure module is required to offer
the indispensable configure information such as the entrance
address, crawling depth, breadth-first or depth-first strategy,
the same page crawling time interval, the crawler process, etc.
Then, the system needs to complete the configuration of
target web pages by interacting with users. The system loads
the entry page, and then the user browses the webpage in the
usual way and informs the system the target page including
the key information. The users may continue to find several
webpages with the same type and inform all of them to the
system. Lastly, the system parses URLs of these webpages
and forms the structured information above (URL separator),
at the same time, it downloads these web pages for further
use.
In the process of web pages selection, taking the cross-
domain access restrictions of browsers and the security of the
server into consideration, it is obvious that writing the code
remotely is unrealistic and not permitted by law. In order to
keep the system be friendly and accurate, we can modify the
copy of the web pages on the Internet, which has been
downloaded previously in the locating process. So, we add
event listener and handler function to the copy. By this way,
we can achieve the effect of getting HTML label of the key
information by using the mouse to click on the pages. Adding
following jQuery code to the copy:
$(document).ready(function(){
$("*").click(function(){ // add onclick listener
get the $(this).tagName, $(this).attr("id"),
$(this).attr("class"), $(this).attr("name");
});
$("*").mouseover(function(){ // add onmouseover listener
Use $(this).css() to change the style to sign up the
element
});
$("*").mouseout(function(){ //add onmouseout listener
Use $(this).css() to reset the style to sign up the
element
});
});
When mouse clicked, the system will be provided with an
object that shows the element of what users have chosen. In
general, the commonly used identifying attributes are id,
class, span and so on. The system will record these
identifying attributes, integrate identifying attributes of
several web pages with the same structure and get the
common features that can be used to crawl the similar web
pages. In this way, when users clicking on the key
information, the system can obtain its label to form the
structured information above (Tag Specifier).
After collecting a certain amount structured data of URL and
key information label, the system can start analyzing. The
analyzing process is mainly to complete the retention of the
same attribute values and the deletion of the difference.
Eventually, forming a “matcher” formed in the same way
with the regular expression, and it will be written in the
configuration file for crawler processing.
After completing the configuration file, the system can drive
the crawler to start crawling. Like most other crawlers, the
crawler will start from the web pages of the entry URL, and
use the configuration file to crawl URLs in the web pages to
form the frontier. When web pages have been downloaded,
the parsing module will spot the featured label defined in the
configuration file, extract the “innerHTML” of a tag and
remove all labels to get the plain text that only contains the
key information. Ultimately, the above plain text will be
stored into database. These data stored into the database can
play a role in application such as search engine, public
opinion analysis later.
Int'l Conf. e-Learning, e-Bus., EIS, and e-Gov. | EEE'13 | 279
It needs to be noted that the system is often based on a
particular crawler for its corresponding configuration
information. When replacing the crawler and the parsing
module, the engine system needs to rebuild the interface with
the crawler. Generally, the underlying interface changes
don’t have an effect on the interface between the system and
the users. In this case, the system only needs to publish the
corresponding engine update package. This approach is
similar to the approach of three-mode with two-tier interface
in the database.
5 Summary
The system is designed to solve the massive requirement to
crawler configuration that caused by the diverse organization
of the websites and the various structure of web pages.
The characteristic of the system is the configuration
information can be collected and accessed automatically
through a simple interactive way. At the same time, the
system effectively reduces the dependence for programmers
for website updating or other various reasons in the process
of crawler work. By this way, our system not only reduces
the cost of crawler system but also greatly facilitate users,
which creates the possibility for the further promotion and
use of crawlers.
The system can be furthermore applied to search engine,
public opinion analysis and other application. With the
promotion of an efficient and practical crawler engine, these
applications can succeed in crawling the web pages
conveniently and effectively, parse the web pages accurately
and provide a higher quality service for the users.
6 References
[1] ZHOU De-mao,LI Zhou-jun.Survey of High-performance
Web Crawler[J].Computer Science,2009,36(8)
[2] LI Sheng-Tao, YU Zhi-Hua, CHENG Xue-Qi BAI Shuo.
A Survey on Web Crawling [J].Computer Science,2003,2
[3] Bing Liu. Web Data Mining [M].Tsinghua
University Press
[4] Jiang Ke .Design and Implementation of the Focused
Crawler System Based on Customized Domain
Conceptions[D]. Xi An : Xidian University,2007
[5] Sun Li-wei,HE Guo—hui,WU Li一 fa. Research
on the Web Crawler [J]. Computer Knowledge and
technology,2010(15)
[6] Tan Long-Yuan.Design and Implementation of
Crawler Technology for Topics [D].Wuhan University
of Technology,2009
[7] HU Jun-wei, QIN Yi — qing , ZHANG —Wei.Regular expression and its applications to web
information extraction [J].Journal of Beijing Institute of
Machinery
280 Int'l Conf. e-Learning, e-Bus., EIS, and e-Gov. | EEE'13 |

SESSION
POSTERS AND SHORT PAPERS
Chair(s)
TBA
Int'l Conf. e-Learning, e-Bus., EIS, and e-Gov. | EEE'13 | 281

282 Int'l Conf. e-Learning, e-Bus., EIS, and e-Gov. | EEE'13 |
Remote-Access Enhanced Laboratory for the Course
Microprocessors and Systems
Jing Zhang, and Karthik Devarajan
Systems Engineering Dept., University of Arkansas at Little Rock, Little Rock, Arkansas, USA
Abstract - Remote-access of computer systems can
significantly enhance the laboratory for electrical engineering
education. This paper presents our practice of remote-access
of laboratory by using the remote desktop, one standard
feature of Microsoft Windows and Virtual Private Network
(VPN). The remote access has substantially enhanced the
experiments of students in the course “microprocessors and
systems”.
Keywords: e-learning, remote-access, microprocessors,
systems, laboratory
1 Introduction
Remote Desktop is a feature of Microsoft Windows [1].
With Remote Desktop Connection, one can access a remote
computer running Windows from another computer running
Windows that is connected to the same network or to the
Internet and use all of the computer's programs, files, and
network resources of the remote computer. By using this
feature we have developed the remote access of our laboratory
for the course “microprocessors and systems”, which has
enhanced the experiments of students substantially.
2 Remote-Access Enhanced Laboratory
Microsoft Remote Desktop function mstsc.exe creates
connections to a remote computer, which makes it possible for
the remote access of the remote computer and all software
installed in the remote computer. With this function, students
with the remote-access permission of a desktop in the
laboratory can access the desktop inside the laboratory
through the campus network without entering the laboratory.
From home computers, students can use VPN to set the
connection between the home computers to campus network
through internet and then, connect to the laboratory desktop
with mstsc.exe. With Microsoft Remote Desktop and VPN,
we developed the remote-access enhanced laboratory for the
course “microprocessors and systems”. The system is shown
in Figure 1. The development of the remote access is to
enhance the existing laboratory experiments by increasing the
accessing time and flexibility.
The laboratory of microprocessors & systems as shown
in Figure 1 consists of six workstations, in which one
workstation was set in standby state. As shown in Figure 2,
each workstation is equipped with a desktop computer, a
video camera and two experimental systems: 1) 32-bit
microcontroller TMS320F2812 from Texas Instruments and
2) 8-bit microcontroller C8051F380 from Silicon Labs. The
microprocessor systems were connected to the desktop and
operated with IDE (Integrated Development Environment)
software (Code Composer Studio and Silicon Lab IDE) for
development and debugging of programs. It supports up to 20
students each semester. Without remote-access, up to 4
students were assigned to one workstation and completed each
experiment within two hours each week. The laboratory was
open to students only when a teaching assistant is available.
After the development of remote-access capability, students
can access the experimental systems without such time
restriction. Students with the remote-access permission
completed the most experiments individually by sharing
accessing time during a week, which significantly enhanced
the experimental capability of the laboratory.
2.1 Lab Projects and Operation
The lab operation is designed to combine the traditional
one with the remote-access features. During one semester, one
lab project was assigned for each week. We keep one
scheduled lab meeting time per week on Friday. Like the
traditional lab course, the lab meeting time on Friday was two
hours. Different from the traditional lab course, students were
required to use more time during a week to complete each lab
experimental project. Before the scheduled lab meeting
session, they should use remote access to complete the
programming and debugging of programs required for each
project. They attended the meeting time mainly for
experiments which they had to handle with the hardware
circuit, for instance, pressing a button or using a probe of
oscilloscope to measure the waveforms. Students were also
required to submit the report after the two-hour session. The
time-consuming activities for programming and debugging
should be completed before the two-hour session by using
remote access of the lab. Each student was required to
complete the lab individually. In this way all students were
given the same chance to complete a project during a week.
The experimental projects in Spring 2013 included:
Lab 01: Silicon Laboratories IDE
Int'l Conf. e-Learning, e-Bus., EIS, and e-Gov. | EEE'13 | 283
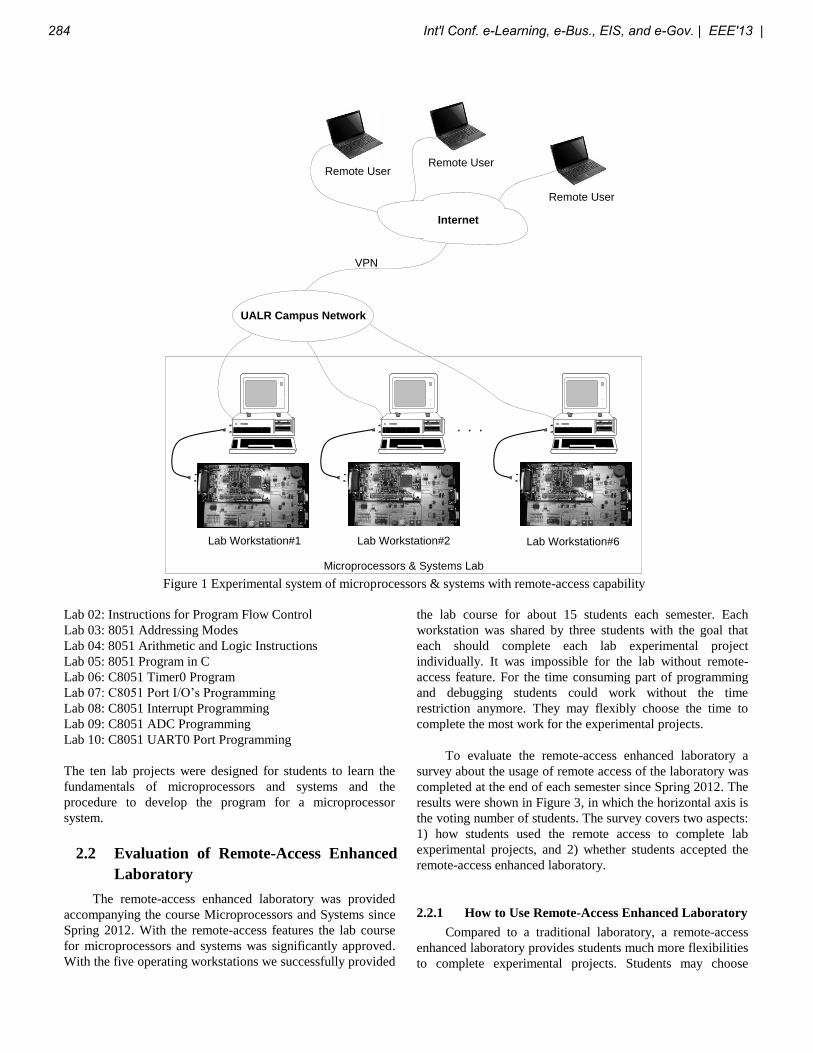
Lab 02: Instructions for Program Flow Control
Lab 03: 8051 Addressing Modes
Lab 04: 8051 Arithmetic and Logic Instructions
Lab 05: 8051 Program in C
Lab 06: C8051 Timer0 Program
Lab 07: C8051 Port I/O’s Programming
Lab 08: C8051 Interrupt Programming
Lab 09: C8051 ADC Programming
Lab 10: C8051 UART0 Port Programming
The ten lab projects were designed for students to learn the
fundamentals of microprocessors and systems and the
procedure to develop the program for a microprocessor
system.
2.2 Evaluation of Remote-Access Enhanced
Laboratory
The remote-access enhanced laboratory was provided
accompanying the course Microprocessors and Systems since
Spring 2012. With the remote-access features the lab course
for microprocessors and systems was significantly approved.
With the five operating workstations we successfully provided
the lab course for about 15 students each semester. Each
workstation was shared by three students with the goal that
each should complete each lab experimental project
individually. It was impossible for the lab without remote-
access feature. For the time consuming part of programming
and debugging students could work without the time
restriction anymore. They may flexibly choose the time to
complete the most work for the experimental projects.
To evaluate the remote-access enhanced laboratory a
survey about the usage of remote access of the laboratory was
completed at the end of each semester since Spring 2012. The
results were shown in Figure 3, in which the horizontal axis is
the voting number of students. The survey covers two aspects:
1) how students used the remote access to complete lab
experimental projects, and 2) whether students accepted the
remote-access enhanced laboratory.
2.2.1 How to Use Remote-Access Enhanced Laboratory
Compared to a traditional laboratory, a remote-access
enhanced laboratory provides students much more flexibilities
to complete experimental projects. Students may choose
Microprocessors & Systems Lab
Internet
VPN
Remote User
Lab Workstation#1 Lab Workstation#2 Lab Workstation#6
UALR Campus Network
Remote UserRemote User
Figure 1 Experimental system of microprocessors & systems with remote-access capability
284 Int'l Conf. e-Learning, e-Bus., EIS, and e-Gov. | EEE'13 |
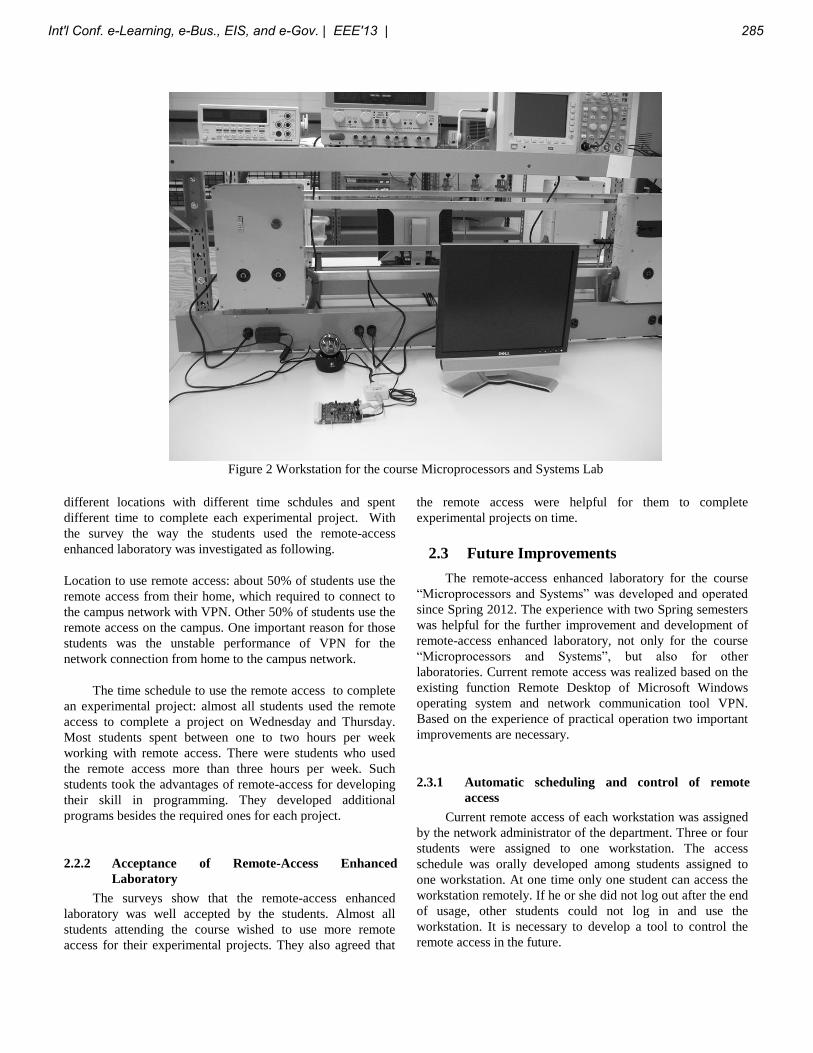
different locations with different time schdules and spent
different time to complete each experimental project. With
the survey the way the students used the remote-access
enhanced laboratory was investigated as following.
Location to use remote access: about 50% of students use the
remote access from their home, which required to connect to
the campus network with VPN. Other 50% of students use the
remote access on the campus. One important reason for those
students was the unstable performance of VPN for the
network connection from home to the campus network.
The time schedule to use the remote access to complete
an experimental project: almost all students used the remote
access to complete a project on Wednesday and Thursday.
Most students spent between one to two hours per week
working with remote access. There were students who used
the remote access more than three hours per week. Such
students took the advantages of remote-access for developing
their skill in programming. They developed additional
programs besides the required ones for each project.
2.2.2 Acceptance of Remote-Access Enhanced
Laboratory
The surveys show that the remote-access enhanced
laboratory was well accepted by the students. Almost all
students attending the course wished to use more remote
access for their experimental projects. They also agreed that
the remote access were helpful for them to complete
experimental projects on time.
2.3 Future Improvements
The remote-access enhanced laboratory for the course
“Microprocessors and Systems” was developed and operated
since Spring 2012. The experience with two Spring semesters
was helpful for the further improvement and development of
remote-access enhanced laboratory, not only for the course
“Microprocessors and Systems”, but also for other
laboratories. Current remote access was realized based on the
existing function Remote Desktop of Microsoft Windows
operating system and network communication tool VPN.
Based on the experience of practical operation two important
improvements are necessary.
2.3.1 Automatic scheduling and control of remote
access
Current remote access of each workstation was assigned
by the network administrator of the department. Three or four
students were assigned to one workstation. The access
schedule was orally developed among students assigned to
one workstation. At one time only one student can access the
workstation remotely. If he or she did not log out after the end
of usage, other students could not log in and use the
workstation. It is necessary to develop a tool to control the
remote access in the future.
Figure 2 Workstation for the course Microprocessors and Systems Lab
Int'l Conf. e-Learning, e-Bus., EIS, and e-Gov. | EEE'13 | 285
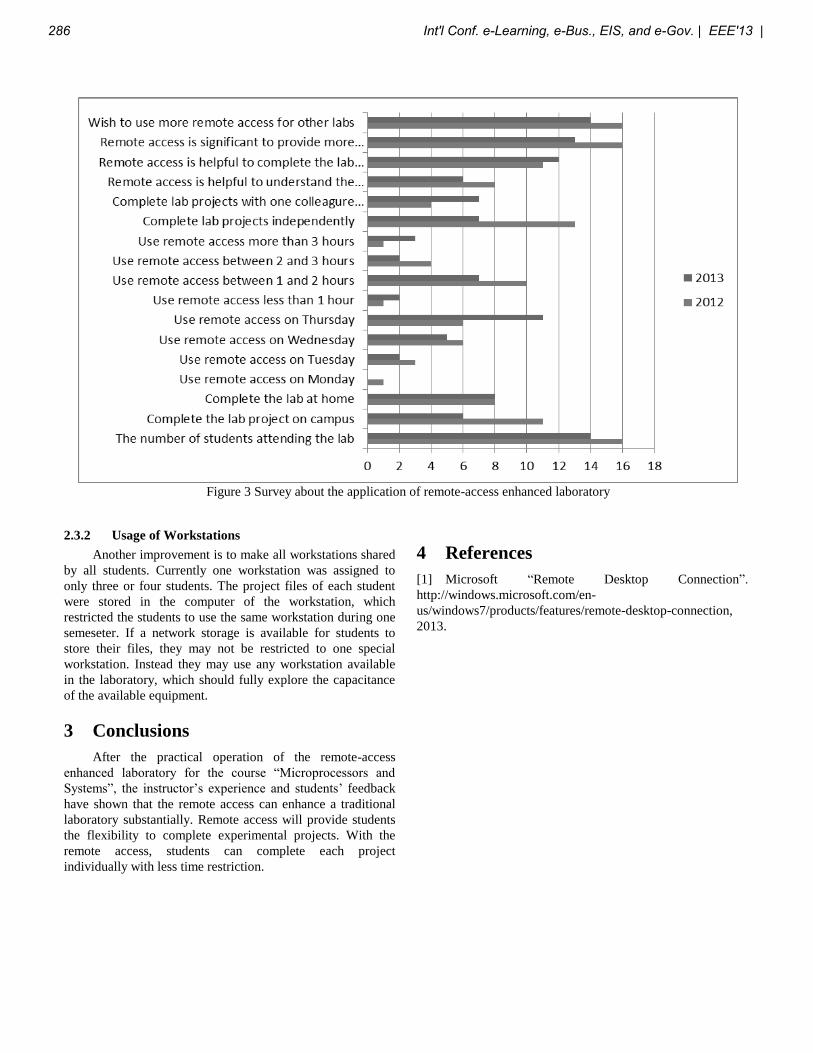
2.3.2 Usage of Workstations
Another improvement is to make all workstations shared
by all students. Currently one workstation was assigned to
only three or four students. The project files of each student
were stored in the computer of the workstation, which
restricted the students to use the same workstation during one
semeseter. If a network storage is available for students to
store their files, they may not be restricted to one special
workstation. Instead they may use any workstation available
in the laboratory, which should fully explore the capacitance
of the available equipment.
3 Conclusions
After the practical operation of the remote-access
enhanced laboratory for the course “Microprocessors and
Systems”, the instructor’s experience and students’ feedback
have shown that the remote access can enhance a traditional
laboratory substantially. Remote access will provide students
the flexibility to complete experimental projects. With the
remote access, students can complete each project
individually with less time restriction.
4 References
[1] Microsoft “Remote Desktop Connection”.
http://windows.microsoft.com/en-
us/windows7/products/features/remote-desktop-connection,
2013.
Figure 3 Survey about the application of remote-access enhanced laboratory
286 Int'l Conf. e-Learning, e-Bus., EIS, and e-Gov. | EEE'13 |
An English Listening Learning Framework based on the Learning Emotion
Yu-Chen Kuo and Tsu-Yang Wang
Department of Computer Science and Information Management Soochow University, Taipei, Taiwan
Abstract - In the context-aware learning, the learners interact with the learning environment to stimulate the learners’ emotions. Learners will be immersed in the context-aware learning environment thus enhance their learning performance. Csikszentmihalyi discovered the learning emotion of the Flow Experience. Then, many other scholars found that, when learners involve in the Flow Experience during learning, they can improve learning efficiency. Therefore, the learning emotion such as the attention and the meditation may affect learners’ learning performance. However, most of scholars had discussed the attention but not meditation. Hence we would like to design an English listening learning system based on the learning emotion. We observe learners’ learning emotion during learning, and give them some aids when they’re unconcentrated or anxious, help them to stay in a good learning emotion. We want to explore the affective the attention and the meditation on learning performance.
Keywords: attention, brainwave, context-awareness learning, meditation, learning emotion
1 Introduction In the traditional learning, each learner learned from the same textbook. But, each learner had his own learning emotion. Some learner was concentrating and some was loosing. Thus, there were only few learners can have good learning performance. The learning performance could be improved if we apply technology into learning.
1.1 Context-awareness learning
With the progress of information technology, e-learning has become a very popular research topic. Applying the information technology into learning, and providing many kinds of e-learning platform, such as notebooks or mobile devices, learners could learn by using these devices without teachers. Motiwalla used mobile device with wireless network to achieve mobile learning [1]. Learners could use the mobile device to learn through the wireless network anytime and anywhere. Thus, Ogata and Yano proposed the Context-Aware Support for Computer-Supported Ubiquitous Learning [2]. Kuo had mentioned that the purpose of the
context-awareness was to make learners to interact with the environment [3]. By doing this, learners can make their learning impressive, and let their learning performance better.
1.2 Learning emotions
In 1975, Csikszentmihalyi, proposed the Flow Experience [4]. He observed some artists, athletes and professional chess player, and found out that when they are completely entered the concentrate mode and didn’t feel any anxiety, their efficiency will totally be improved. Some scholar also found that the Flow Experience can improve learners’ learning performance [5]. Thus, the learning emotions such as the attention and the meditation may affect learners’ learning performance.
1.3 Research motivation
In the past, most of scholars had discussed the effect the attention but not meditation. Hence we design an English listening learning system by using NeuroSky MindSet to identify learners’ attention and meditation [6][7]. We want to find out how’s the attention and the meditation going during learning, to explore the affective of learning performance by the attention and the meditation.
2 Methods We will use the NeuroSky MindSet to observe learners’ brainwave while they’re learning, and identify their attention and meditation. We will divide the learners into 3 groups. There are 2 experimental groups and 1 control group. One of the experimental groups will be aided by the system according to the attention, and the other experimental group will be aided by the system according to the meditation.
2.1 Experimental group for the attention
The process of the experimental group with the aid of attention is shown in Fig. 1. First, the learner will choose a chapter and start learning. Meanwhile, MindSet will start to identify the learner’s attention. If the learner’s attention fell behind the standard, the system will start to play the video of the chapter to help the learner to concentrate on the chapter. After 3 minutes, if the learner’s attention is getting back, then the system will shut the video down; otherwise, system will
Int'l Conf. e-Learning, e-Bus., EIS, and e-Gov. | EEE'13 | 287
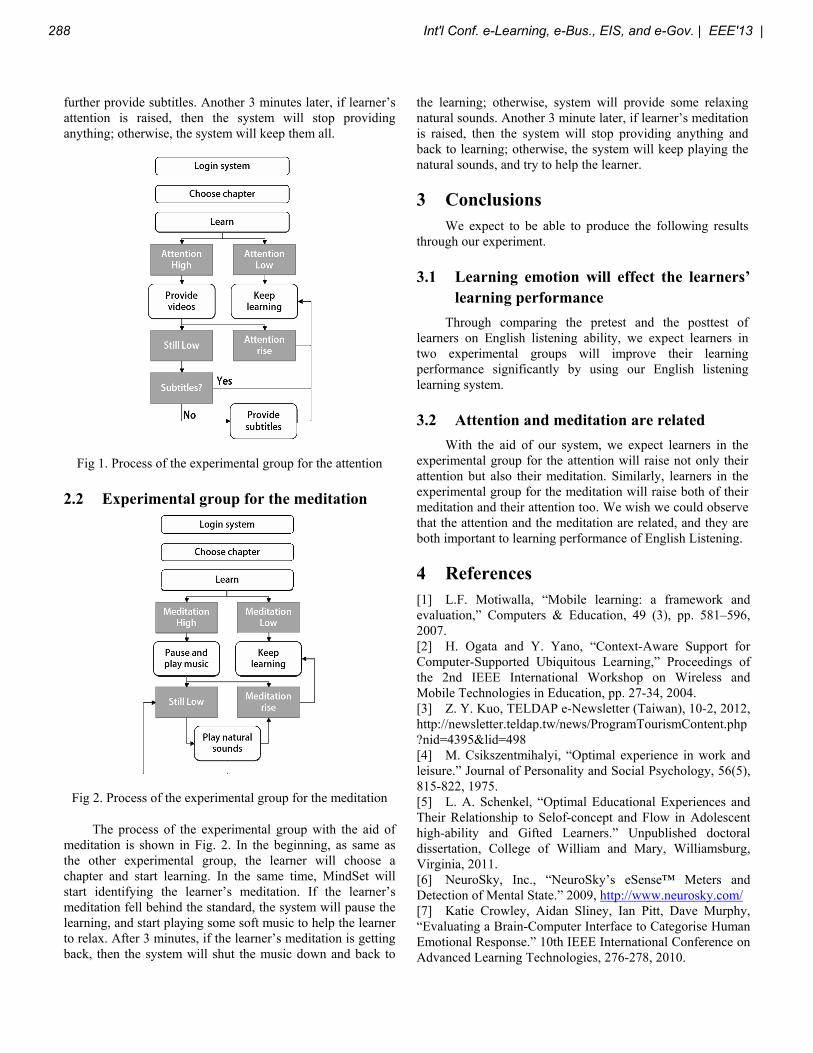
further provide subtitles. Another 3 minutes later, if learner’s attention is raised, then the system will stop providing anything; otherwise, the system will keep them all.
Fig 1. Process of the experimental group for the attention
2.2 Experimental group for the meditation
Fig 2. Process of the experimental group for the meditation
The process of the experimental group with the aid of meditation is shown in Fig. 2. In the beginning, as same as the other experimental group, the learner will choose a chapter and start learning. In the same time, MindSet will start identifying the learner’s meditation. If the learner’s meditation fell behind the standard, the system will pause the learning, and start playing some soft music to help the learner to relax. After 3 minutes, if the learner’s meditation is getting back, then the system will shut the music down and back to
the learning; otherwise, system will provide some relaxing natural sounds. Another 3 minute later, if learner’s meditation is raised, then the system will stop providing anything and back to learning; otherwise, the system will keep playing the natural sounds, and try to help the learner.
3 Conclusions We expect to be able to produce the following results through our experiment.
3.1 Learning emotion will effect the learners’ learning performance
Through comparing the pretest and the posttest of learners on English listening ability, we expect learners in two experimental groups will improve their learning performance significantly by using our English listening learning system.
3.2 Attention and meditation are related
With the aid of our system, we expect learners in the experimental group for the attention will raise not only their attention but also their meditation. Similarly, learners in the experimental group for the meditation will raise both of their meditation and their attention too. We wish we could observe that the attention and the meditation are related, and they are both important to learning performance of English Listening.
4 References [1] L.F. Motiwalla, “Mobile learning: a framework and evaluation,” Computers & Education, 49 (3), pp. 581–596, 2007. [2] H. Ogata and Y. Yano, “Context-Aware Support for Computer-Supported Ubiquitous Learning,” Proceedings of the 2nd IEEE International Workshop on Wireless and Mobile Technologies in Education, pp. 27-34, 2004. [3] Z. Y. Kuo, TELDAP e-Newsletter (Taiwan), 10-2, 2012, http://newsletter.teldap.tw/news/ProgramTourismContent.php?nid=4395&lid=498 [4] M. Csikszentmihalyi, “Optimal experience in work and leisure.” Journal of Personality and Social Psychology, 56(5), 815-822, 1975. [5] L. A. Schenkel, “Optimal Educational Experiences and Their Relationship to Selof-concept and Flow in Adolescent high-ability and Gifted Learners.” Unpublished doctoral dissertation, College of William and Mary, Williamsburg, Virginia, 2011. [6] NeuroSky, Inc., “NeuroSky’s eSense™ Meters and Detection of Mental State.” 2009, http://www.neurosky.com/ [7] Katie Crowley, Aidan Sliney, Ian Pitt, Dave Murphy, “Evaluating a Brain-Computer Interface to Categorise Human Emotional Response.” 10th IEEE International Conference on Advanced Learning Technologies, 276-278, 2010.
288 Int'l Conf. e-Learning, e-Bus., EIS, and e-Gov. | EEE'13 |
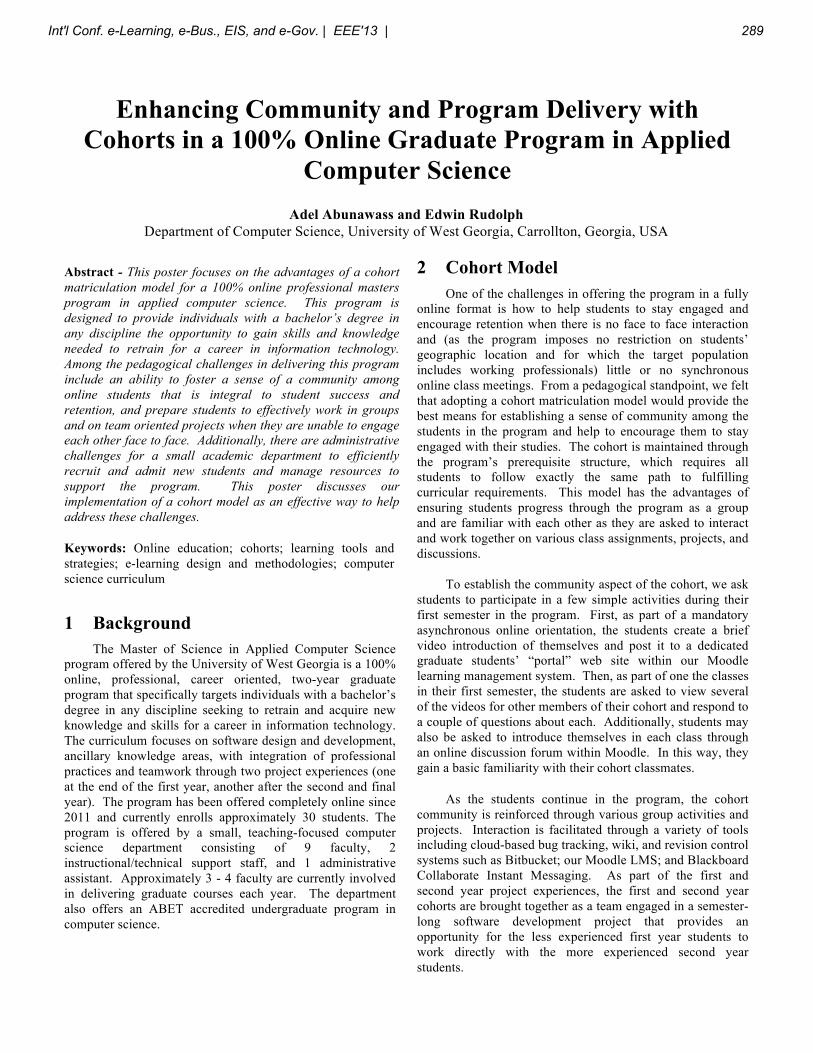
Enhancing Community and Program Delivery with Cohorts in a 100% Online Graduate Program in Applied
Computer Science
Adel Abunawass and Edwin Rudolph Department of Computer Science, University of West Georgia, Carrollton, Georgia, USA
Abstract - This poster focuses on the advantages of a cohort matriculation model for a 100% online professional masters program in applied computer science. This program is designed to provide individuals with a bachelor’s degree in any discipline the opportunity to gain skills and knowledge needed to retrain for a career in information technology. Among the pedagogical challenges in delivering this program include an ability to foster a sense of a community among online students that is integral to student success and retention, and prepare students to effectively work in groups and on team oriented projects when they are unable to engage each other face to face. Additionally, there are administrative challenges for a small academic department to efficiently recruit and admit new students and manage resources to support the program. This poster discusses our implementation of a cohort model as an effective way to help address these challenges.
Keywords: Online education; cohorts; learning tools and strategies; e-learning design and methodologies; computer science curriculum
1 Background The Master of Science in Applied Computer Science program offered by the University of West Georgia is a 100% online, professional, career oriented, two-year graduate program that specifically targets individuals with a bachelor’s degree in any discipline seeking to retrain and acquire new knowledge and skills for a career in information technology. The curriculum focuses on software design and development, ancillary knowledge areas, with integration of professional practices and teamwork through two project experiences (one at the end of the first year, another after the second and final year). The program has been offered completely online since 2011 and currently enrolls approximately 30 students. The program is offered by a small, teaching-focused computer science department consisting of 9 faculty, 2 instructional/technical support staff, and 1 administrative assistant. Approximately 3 - 4 faculty are currently involved in delivering graduate courses each year. The department also offers an ABET accredited undergraduate program in computer science.
2 Cohort Model One of the challenges in offering the program in a fully online format is how to help students to stay engaged and encourage retention when there is no face to face interaction and (as the program imposes no restriction on students’ geographic location and for which the target population includes working professionals) little or no synchronous online class meetings. From a pedagogical standpoint, we felt that adopting a cohort matriculation model would provide the best means for establishing a sense of community among the students in the program and help to encourage them to stay engaged with their studies. The cohort is maintained through the program’s prerequisite structure, which requires all students to follow exactly the same path to fulfilling curricular requirements. This model has the advantages of ensuring students progress through the program as a group and are familiar with each other as they are asked to interact and work together on various class assignments, projects, and discussions. To establish the community aspect of the cohort, we ask students to participate in a few simple activities during their first semester in the program. First, as part of a mandatory asynchronous online orientation, the students create a brief video introduction of themselves and post it to a dedicated graduate students’ “portal” web site within our Moodle learning management system. Then, as part of one the classes in their first semester, the students are asked to view several of the videos for other members of their cohort and respond to a couple of questions about each. Additionally, students may also be asked to introduce themselves in each class through an online discussion forum within Moodle. In this way, they gain a basic familiarity with their cohort classmates.
As the students continue in the program, the cohort community is reinforced through various group activities and projects. Interaction is facilitated through a variety of tools including cloud-based bug tracking, wiki, and revision control systems such as Bitbucket; our Moodle LMS; and Blackboard Collaborate Instant Messaging. As part of the first and second year project experiences, the first and second year cohorts are brought together as a team engaged in a semester-long software development project that provides an opportunity for the less experienced first year students to work directly with the more experienced second year students.
Int'l Conf. e-Learning, e-Bus., EIS, and e-Gov. | EEE'13 | 289

From an administrative perspective, using a cohort model helps our small department efficiently and effectively manage recruitment, admissions, and resource allocation for the program. We admit one cohort each year during the Fall semester; in this way we focus all of our recruitment and admission efforts for the year on the Fall semester rather than repeating and compressing the process every 4 months. From a resource allocation standpoint, requiring students to begin in the Fall and strongly encouraging them to complete the program in two years creates a predictable semester course schedule and expectations for faculty resource requirements.
290 Int'l Conf. e-Learning, e-Bus., EIS, and e-Gov. | EEE'13 |
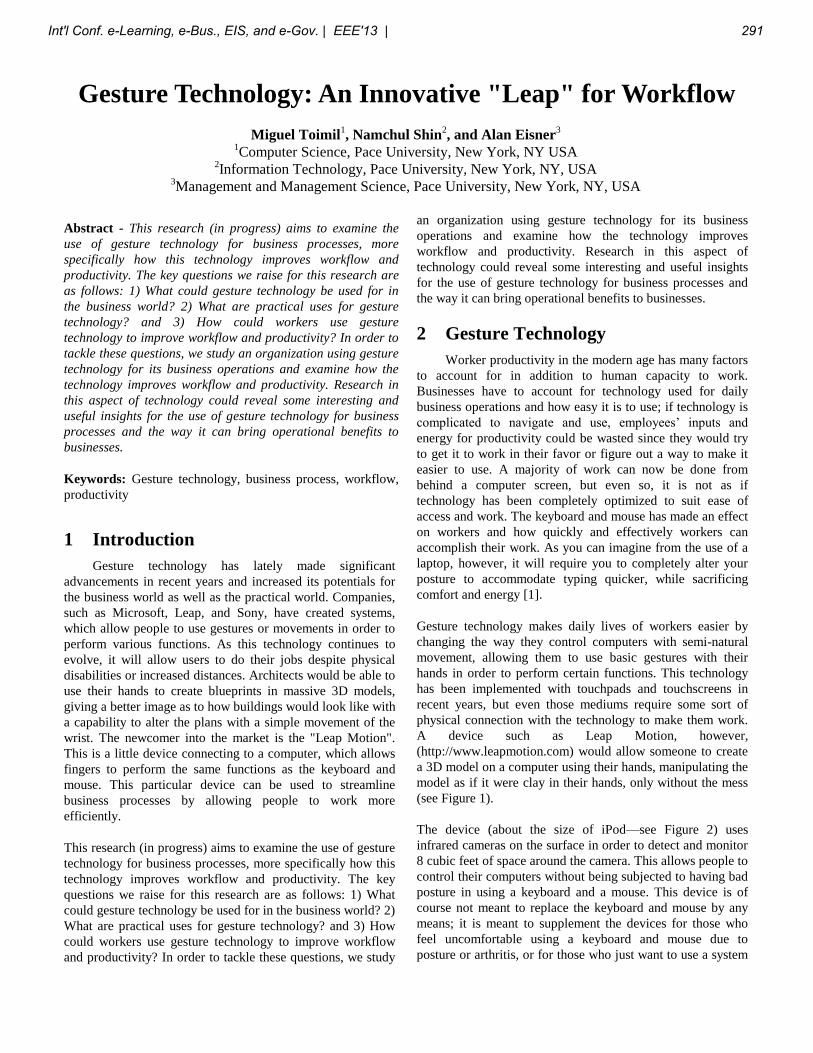
Gesture Technology: An Innovative "Leap" for Workflow
Miguel Toimil1, Namchul Shin
2, and Alan Eisner
3
1Computer Science, Pace University, New York, NY USA
2Information Technology, Pace University, New York, NY, USA
3Management and Management Science, Pace University, New York, NY, USA
Abstract - This research (in progress) aims to examine the
use of gesture technology for business processes, more
specifically how this technology improves workflow and
productivity. The key questions we raise for this research are
as follows: 1) What could gesture technology be used for in
the business world? 2) What are practical uses for gesture
technology? and 3) How could workers use gesture
technology to improve workflow and productivity? In order to
tackle these questions, we study an organization using gesture
technology for its business operations and examine how the
technology improves workflow and productivity. Research in
this aspect of technology could reveal some interesting and
useful insights for the use of gesture technology for business
processes and the way it can bring operational benefits to
businesses.
Keywords: Gesture technology, business process, workflow,
productivity
1 Introduction
Gesture technology has lately made significant
advancements in recent years and increased its potentials for
the business world as well as the practical world. Companies,
such as Microsoft, Leap, and Sony, have created systems,
which allow people to use gestures or movements in order to
perform various functions. As this technology continues to
evolve, it will allow users to do their jobs despite physical
disabilities or increased distances. Architects would be able to
use their hands to create blueprints in massive 3D models,
giving a better image as to how buildings would look like with
a capability to alter the plans with a simple movement of the
wrist. The newcomer into the market is the "Leap Motion".
This is a little device connecting to a computer, which allows
fingers to perform the same functions as the keyboard and
mouse. This particular device can be used to streamline
business processes by allowing people to work more
efficiently.
This research (in progress) aims to examine the use of gesture
technology for business processes, more specifically how this
technology improves workflow and productivity. The key
questions we raise for this research are as follows: 1) What
could gesture technology be used for in the business world? 2)
What are practical uses for gesture technology? and 3) How
could workers use gesture technology to improve workflow
and productivity? In order to tackle these questions, we study
an organization using gesture technology for its business
operations and examine how the technology improves
workflow and productivity. Research in this aspect of
technology could reveal some interesting and useful insights
for the use of gesture technology for business processes and
the way it can bring operational benefits to businesses.
2 Gesture Technology
Worker productivity in the modern age has many factors
to account for in addition to human capacity to work.
Businesses have to account for technology used for daily
business operations and how easy it is to use; if technology is
complicated to navigate and use, employees’ inputs and
energy for productivity could be wasted since they would try
to get it to work in their favor or figure out a way to make it
easier to use. A majority of work can now be done from
behind a computer screen, but even so, it is not as if
technology has been completely optimized to suit ease of
access and work. The keyboard and mouse has made an effect
on workers and how quickly and effectively workers can
accomplish their work. As you can imagine from the use of a
laptop, however, it will require you to completely alter your
posture to accommodate typing quicker, while sacrificing
comfort and energy [1].
Gesture technology makes daily lives of workers easier by
changing the way they control computers with semi-natural
movement, allowing them to use basic gestures with their
hands in order to perform certain functions. This technology
has been implemented with touchpads and touchscreens in
recent years, but even those mediums require some sort of
physical connection with the technology to make them work.
A device such as Leap Motion, however,
(http://www.leapmotion.com) would allow someone to create
a 3D model on a computer using their hands, manipulating the
model as if it were clay in their hands, only without the mess
(see Figure 1).
The device (about the size of iPod—see Figure 2) uses
infrared cameras on the surface in order to detect and monitor
8 cubic feet of space around the camera. This allows people to
control their computers without being subjected to having bad
posture in using a keyboard and a mouse. This device is of
course not meant to replace the keyboard and mouse by any
means; it is meant to supplement the devices for those who
feel uncomfortable using a keyboard and mouse due to
posture or arthritis, or for those who just want to use a system
Int'l Conf. e-Learning, e-Bus., EIS, and e-Gov. | EEE'13 | 291
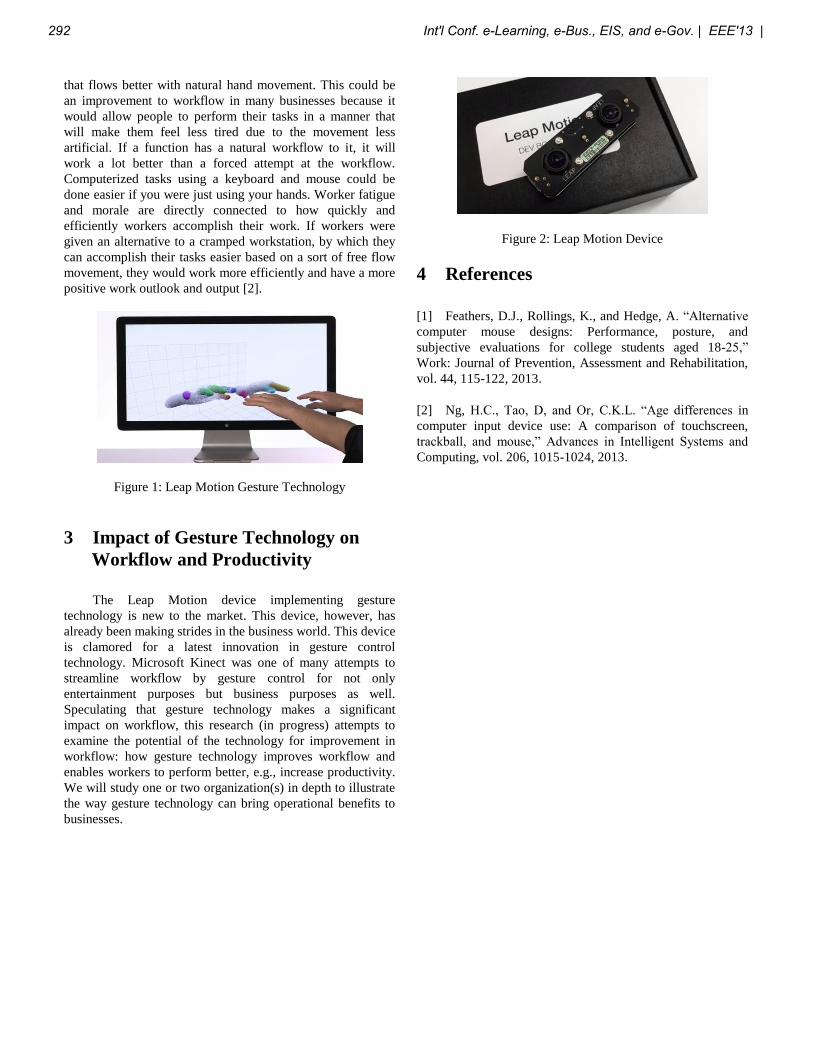
that flows better with natural hand movement. This could be
an improvement to workflow in many businesses because it
would allow people to perform their tasks in a manner that
will make them feel less tired due to the movement less
artificial. If a function has a natural workflow to it, it will
work a lot better than a forced attempt at the workflow.
Computerized tasks using a keyboard and mouse could be
done easier if you were just using your hands. Worker fatigue
and morale are directly connected to how quickly and
efficiently workers accomplish their work. If workers were
given an alternative to a cramped workstation, by which they
can accomplish their tasks easier based on a sort of free flow
movement, they would work more efficiently and have a more
positive work outlook and output [2].
Figure 1: Leap Motion Gesture Technology
3 Impact of Gesture Technology on
Workflow and Productivity
The Leap Motion device implementing gesture
technology is new to the market. This device, however, has
already been making strides in the business world. This device
is clamored for a latest innovation in gesture control
technology. Microsoft Kinect was one of many attempts to
streamline workflow by gesture control for not only
entertainment purposes but business purposes as well.
Speculating that gesture technology makes a significant
impact on workflow, this research (in progress) attempts to
examine the potential of the technology for improvement in
workflow: how gesture technology improves workflow and
enables workers to perform better, e.g., increase productivity.
We will study one or two organization(s) in depth to illustrate
the way gesture technology can bring operational benefits to
businesses.
Figure 2: Leap Motion Device
4 References
[1] Feathers, D.J., Rollings, K., and Hedge, A. “Alternative
computer mouse designs: Performance, posture, and
subjective evaluations for college students aged 18-25,”
Work: Journal of Prevention, Assessment and Rehabilitation,
vol. 44, 115-122, 2013.
[2] Ng, H.C., Tao, D, and Or, C.K.L. “Age differences in
computer input device use: A comparison of touchscreen,
trackball, and mouse,” Advances in Intelligent Systems and
Computing, vol. 206, 1015-1024, 2013.
292 Int'l Conf. e-Learning, e-Bus., EIS, and e-Gov. | EEE'13 |
An Intelligent EFL Learning Platform for the Cultivation
of Students’ Autonomy
Yan Tian
School of Foreign Languages, Shanghai Jiao Tong University,
No. 800, Dongchuan Road, Minhang, Shanghai 200240, China
Abstract - English language learners need individualized
guidance and effective supervision in their autonomous
learning. This paper reports a study on the use of an
intelligent EFL learning platform by a group of students of
English as a foreign language (EFL) in China. Via a
methodology that included the survey questionnaires and
open-ended oral interviews, the study examines learners’
perceptions of the use of an intelligent EFL learning
platform—the Website of Shanghai Jiao Tong University
English Learning Center by a group of 80 Chinese college
students learning English by themselves out of class.
Keywords: intelligent, EFL, learning platform, cultivation,
students’ autonomy
1 Introduction
Learning a foreign language only in classroom is far
from enough for non-English majors at colleges and
universities. Autonomous learning out-of-class is of greater
importance. Therefore, individual guidance and effective
supervision should be provided to cultivate students’
autonomy.
Theoretically speaking, as adult language learners,
college students should be strongly self-motivated and self-
disciplined in their English learning out of class. However, the
fact is that many of them are at a loss what to learn besides
their textbooks, let alone how to learn efficiently. Many of
them used to make self-study plans for their out-of-class
learning, but they usually ended up failing in carrying out the
plan due to poor self-discipline as well as non-effective
supervision.
In order to help Chinese college students to learn
English out of class efficiently, an intelligent EFL learning
platform (http://202.120.60.18) was developed for the
cultivation of their autonomy. This platform is able to obtain
the initial status of a learner by a “Learning Style Test”, a
“Motivation Test” and a series of “Proficiency Tests” of
different language skills, such as listening tests, reading tests,
writing tests and translation tests, with which the system
would provide the learner with the overall recommendations
of his/her online study plans and content arrangements. It is
also able to automatically guide the learner to learning
according to the results of his/her learning style, based on the
“Learning Style Test”, the “Motivation Test” and the
Proficiency Tests, by intelligent management and
classification of learning materials. In addition, it can present
automatic feedback to learners by regular email reminders of
the contents to be covered and tests to be taken before the
deadlines. Furthermore, when students finish the online tests,
it can instantly present their scores (both of objective
questions and of subjective ones) as well as the key answers to
them.
2 Rationales
Both the classroom learning and out-of-class learning of
a foreign language form a complete learning process. For
adult foreign language learners, out of-class learning is more
important because well-planned and efficient autonomous
learning leads to an ultimate success of foreign language
learning.
However, autonomous language learning out-of-class
requires individual guidance and effective supervision which
can be done by an intelligent system. With the current
technology of Artificial Intelligence and Natural Language
Processing, the task of automatic supervision can be fulfilled
at will.
3 Methodology
80 non-English majors from two natural English classes
at Shanghai Jiao Tong University (SJTU) participated in the
experiment. When these subjects entered SJTU in September
2012, they were asked to make their own out-of-class English
leaning plan. Without any interference, they were asked to
complete the questionnaire concerning the implementation of
their self-study plan at the end of the first semester. Then, at
the second semester which began in February 2013, they were
asked to learn English out of class by log in the online
intelligent EFL learning platform, as shown below.
Int'l Conf. e-Learning, e-Bus., EIS, and e-Gov. | EEE'13 | 293
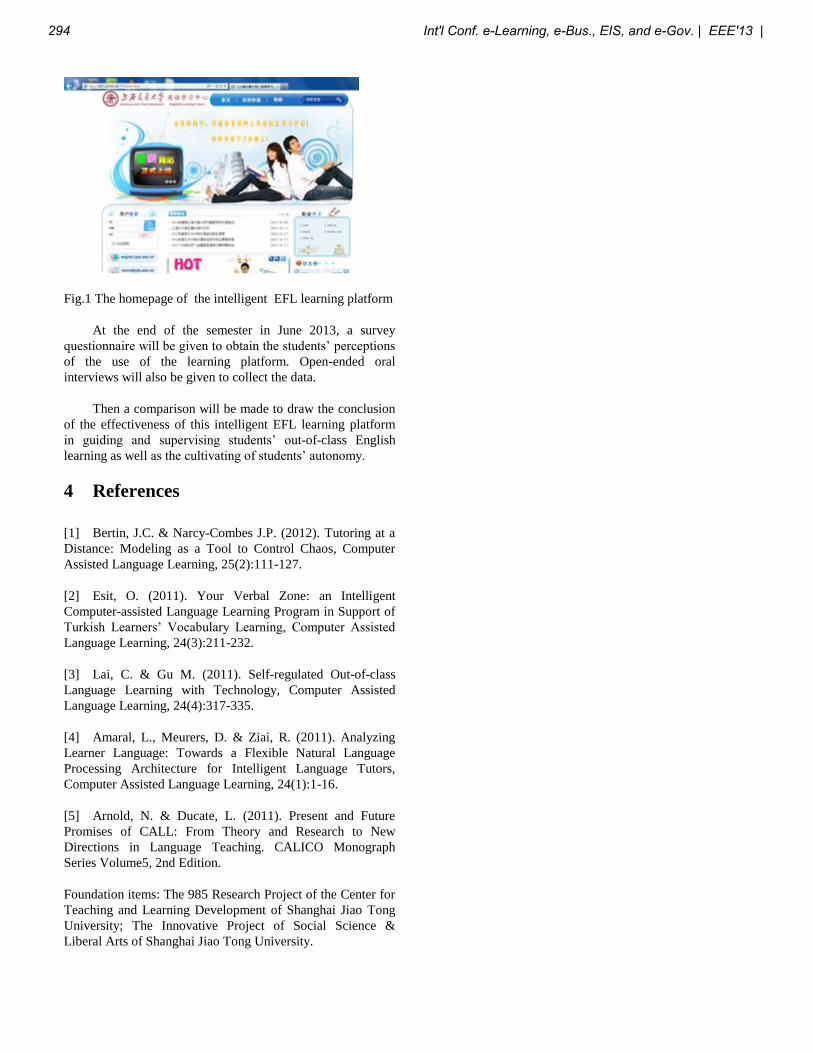
Fig.1 The homepage of the intelligent EFL learning platform
At the end of the semester in June 2013, a survey
questionnaire will be given to obtain the students’ perceptions
of the use of the learning platform. Open-ended oral
interviews will also be given to collect the data.
Then a comparison will be made to draw the conclusion
of the effectiveness of this intelligent EFL learning platform
in guiding and supervising students’ out-of-class English
learning as well as the cultivating of students’ autonomy.
4 References
[1] Bertin, J.C. & Narcy-Combes J.P. (2012). Tutoring at a
Distance: Modeling as a Tool to Control Chaos, Computer
Assisted Language Learning, 25(2):111-127.
[2] Esit, O. (2011). Your Verbal Zone: an Intelligent
Computer-assisted Language Learning Program in Support of
Turkish Learners’ Vocabulary Learning, Computer Assisted
Language Learning, 24(3):211-232.
[3] Lai, C. & Gu M. (2011). Self-regulated Out-of-class
Language Learning with Technology, Computer Assisted
Language Learning, 24(4):317-335.
[4] Amaral, L., Meurers, D. & Ziai, R. (2011). Analyzing
Learner Language: Towards a Flexible Natural Language
Processing Architecture for Intelligent Language Tutors,
Computer Assisted Language Learning, 24(1):1-16.
[5] Arnold, N. & Ducate, L. (2011). Present and Future
Promises of CALL: From Theory and Research to New
Directions in Language Teaching. CALICO Monograph
Series Volume5, 2nd Edition.
Foundation items: The 985 Research Project of the Center for
Teaching and Learning Development of Shanghai Jiao Tong
University; The Innovative Project of Social Science &
Liberal Arts of Shanghai Jiao Tong University.
294 Int'l Conf. e-Learning, e-Bus., EIS, and e-Gov. | EEE'13 |
Acquisition of foreign language vocabulary in the contextof consolidation models
D. Krusko11Department of Informatics, Siberian Federal University, Krasnoyarsk, Russia Federation
Abstract— This paper reviews vocabulary learn-ing evidence using concordance "standard model"of memory consolidation and a new approach,the "multiple memory trace" theory. Based on thefindings of the experiment of the foreign languagevocabulary learning with arbitrary time intervalsbetween repetitions of training information andprecise fixation of the measured parameters, astatistical analysis was conducted and identifiedstatistical regularities of the vocabulary acquisi-tion. This has been hypothesized by the influenceof vocabulary item translation frequency for vo-cabulary memorizing. I reviewed the impact andopportunities of spacing repetitions used. In theexperiment, two different techniques in the learn-ing of vocabulary were used to adequately assessthe strengths and weaknesses of each approachof memory consolidation. Overall, these findingsindicate some discrepancies with standard modelof memory consolidation, as well as the benefits ofthe approach is the combined use of both theories.
Keywords: memory consolidation, multiple trace theory,vocabulary learning
1. IntroductionThere are a number of attempts to describe
the process of forgetting and remembering in-formation through computation models. Each ofthe models is based on a theory of a consoli-dation of information in memory and includes aset of assumptions about the optimal constructionof the educational process. This article examinesthe assumption that multiple trace theory more
accurately describes the process of acquiring vo-cabulary and in particular, that the recall of in-formation from memory has a greater impact onmemorization than passive repetition.
Multiple trace theory (MTT) was formulatedand formed from standard consolidation theorybased on evidence of patients with retrogradeamnesia and damage of brain regions [9]. Themain points of controversy between theories areview on the process to recall the recent and remotememories (including the involvement in this pro-cess of the hippocampal complex) and the fact thatMTT postulates that different types of memory areencoding, storage and retrieval in different ways,while the standard theory does not differentiate.
In particular, the standard consolidation theoryassumed that hippocampal complex (HC) engagesin the process of storing episodic and semanticmemory only to the stabilization of the informa-tion in the memory (consolidation period) andfurther the information may be retrieval fromneocortical circuits without HC. Survey data withretrograde amnesia show that memory loss is sig-nificantly different for autobiographical, episodicand semantic memories. If the memory loss frompatients with temporal lobe lesions for the detailsof autobiographical memory spreads from severalyears, several decades to total loss of autobio-graphical events then episodic and semantic mem-ory are relatively preserved [6].
Most studies on the vocabulary learning de-scribes experiments about acquiring of a foreignlanguage vocabulary that study participants hadnot studied previously. Study of the effect ofan early studied information on the acquisitionof a new information given little attention and
Int'l Conf. e-Learning, e-Bus., EIS, and e-Gov. | EEE'13 | 295
the nature of this process is not clearly under-stood. MTT suggests that our memory about someepisode or some item of the knowledge is a setof distributed and interconnected memory traces.Based on this, I put forward the hypothesis that inmemorizing vocabulary items affects frequency oftheir translations in already studied language.
While most of the debate is on the role of hip-pocampus in the process of retrieving informationfrom memory in order to support one or the othertheory, almost no attention is paid to the functionalfeatures of both theories to practical use.
The purpose of this article is to statisticallyprove the standard consolidation theory and themultiple trace theory based on experimental data,the study of foreign language vocabulary. Quantifythe impact of recall trials and passive study-onlytrials on memorization. The results can be usedto change the approach to the study of foreignlanguage vocabulary, and to refine the existingcomputational models of forgetting and remem-bering information.
2. The standard consolidationand multiple trace theories
Because multiple trace theory was formed fromthe standard consolidation theory due to the accu-mulation of contradictions, some points of viewrelating to the formation, maintenance and re-covery of episodic memory are shared with thestandard consolidation theory. The postulates ofthe theory put forward, which is reflected in thisarticle. Common points in the two theories are [9].• “The hippocampal complex rapidly (and
obligatory) encodes all information that isattended or consciously apprehended. Thisprocess involves what is called short-termconsolidation.
• This information is sparsely encoded in adistributed ensemble of hippocampal complexneurons“.
Interpretation of these items can serve a parti-tion of the memorizing process for at least twostages. During the first stage all information areencoded (it is not necessary that the various types
of information are processed in the same way)before the subsequent preservation. Naturally itis expected that after the information is sparselyencoded in a distributed ensemble of neurons, itbegins to have quite different characteristics inspeed of forgetting and the probability of retrievalfrom a memory. This assumption is reflected inthe working memory models [1], [2].
The following postulates of MTT are differentfrom the standard consolidation theory [9].• “Each re-activation of memory trace occurs in
an altered neuronal and experiential context.• Because the hippocampal complex obligato-
rily encodes all information that is attended,the re-activation of a memory trace results inthe creation of a newly encoded hippocampaltrace, which also is sparse and distributed.
• By virtue of indexing a similar set of neo-cortical neurons encoding the features of theinformation in the memory, each such traceshares some or all of the information aboutthe initial information”.
For example semantic information about theworld as Grand Canyon located in Arizona, sushiis Japan food and etc, being acquired in someevent during the consolidation process separatedfrom the original event and stored independently.
In MTT, as a result of each successful retrievalof information for example in case exam willcreate new traces by replicating the recalled. Ifa memory has more than one trace, then the effectof all of them on memory retrieval is additive:any trace may cause retrieval, and the reliability ofeach trace action is independent of the number oftraces. Therefore, failure in retrieval only occurswhen all traces of a given memory fail. Recallof information in MTT is given a more importantrole in the process of remembering. At the sametime the standard consolidation theory emphasizesthe impact of rehearsal memorized information.With the amount of information rehearsals thestrength of the information in memory increasesand therefore it is less likely that this informationwill be forgotten.
On the basis of the postulates of MTT is rea-sonable to assume that the number of memory
296 Int'l Conf. e-Learning, e-Bus., EIS, and e-Gov. | EEE'13 |
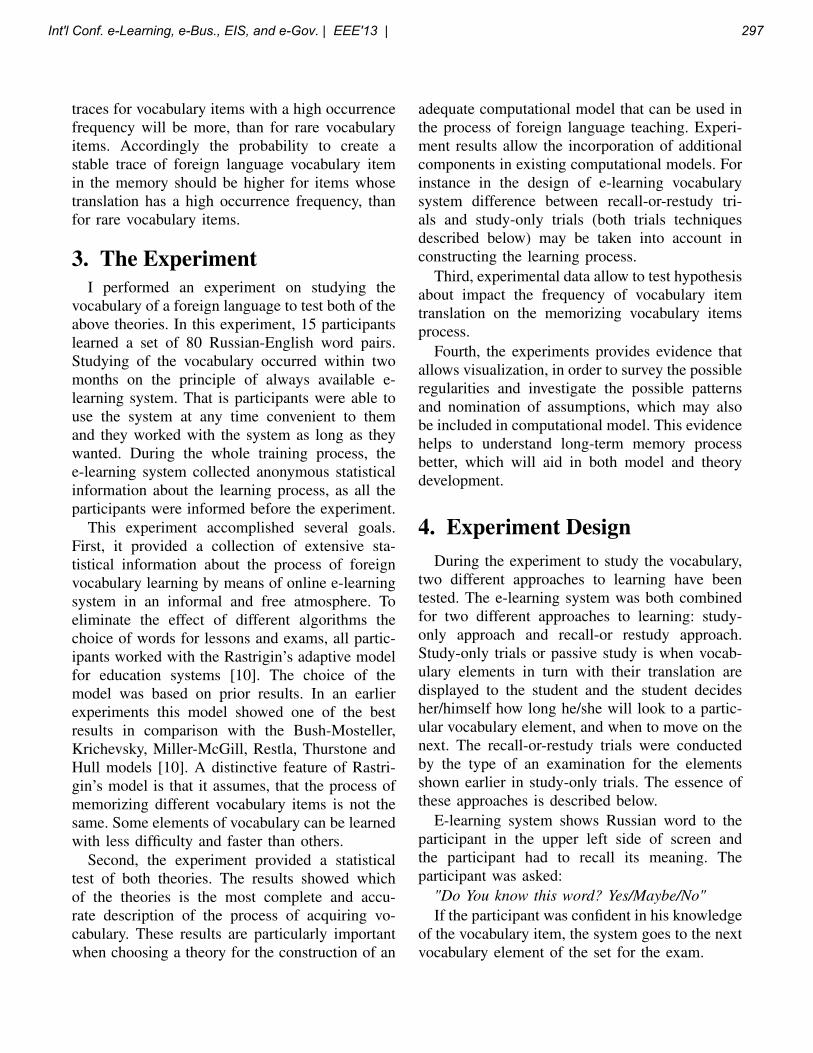
traces for vocabulary items with a high occurrencefrequency will be more, than for rare vocabularyitems. Accordingly the probability to create astable trace of foreign language vocabulary itemin the memory should be higher for items whosetranslation has a high occurrence frequency, thanfor rare vocabulary items.
3. The ExperimentI performed an experiment on studying the
vocabulary of a foreign language to test both of theabove theories. In this experiment, 15 participantslearned a set of 80 Russian-English word pairs.Studying of the vocabulary occurred within twomonths on the principle of always available e-learning system. That is participants were able touse the system at any time convenient to themand they worked with the system as long as theywanted. During the whole training process, thee-learning system collected anonymous statisticalinformation about the learning process, as all theparticipants were informed before the experiment.
This experiment accomplished several goals.First, it provided a collection of extensive sta-tistical information about the process of foreignvocabulary learning by means of online e-learningsystem in an informal and free atmosphere. Toeliminate the effect of different algorithms thechoice of words for lessons and exams, all partic-ipants worked with the Rastrigin’s adaptive modelfor education systems [10]. The choice of themodel was based on prior results. In an earlierexperiments this model showed one of the bestresults in comparison with the Bush-Mosteller,Krichevsky, Miller-McGill, Restla, Thurstone andHull models [10]. A distinctive feature of Rastri-gin’s model is that it assumes, that the process ofmemorizing different vocabulary items is not thesame. Some elements of vocabulary can be learnedwith less difficulty and faster than others.
Second, the experiment provided a statisticaltest of both theories. The results showed whichof the theories is the most complete and accu-rate description of the process of acquiring vo-cabulary. These results are particularly importantwhen choosing a theory for the construction of an
adequate computational model that can be used inthe process of foreign language teaching. Experi-ment results allow the incorporation of additionalcomponents in existing computational models. Forinstance in the design of e-learning vocabularysystem difference between recall-or-restudy tri-als and study-only trials (both trials techniquesdescribed below) may be taken into account inconstructing the learning process.
Third, experimental data allow to test hypothesisabout impact the frequency of vocabulary itemtranslation on the memorizing vocabulary itemsprocess.
Fourth, the experiments provides evidence thatallows visualization, in order to survey the possibleregularities and investigate the possible patternsand nomination of assumptions, which may alsobe included in computational model. This evidencehelps to understand long-term memory processbetter, which will aid in both model and theorydevelopment.
4. Experiment DesignDuring the experiment to study the vocabulary,
two different approaches to learning have beentested. The e-learning system was both combinedfor two different approaches to learning: study-only approach and recall-or restudy approach.Study-only trials or passive study is when vocab-ulary elements in turn with their translation aredisplayed to the student and the student decidesher/himself how long he/she will look to a partic-ular vocabulary element, and when to move on thenext. The recall-or-restudy trials were conductedby the type of an examination for the elementsshown earlier in study-only trials. The essence ofthese approaches is described below.
E-learning system shows Russian word to theparticipant in the upper left side of screen andthe participant had to recall its meaning. Theparticipant was asked:
"Do You know this word? Yes/Maybe/No"If the participant was confident in his knowledge
of the vocabulary item, the system goes to the nextvocabulary element of the set for the exam.
Int'l Conf. e-Learning, e-Bus., EIS, and e-Gov. | EEE'13 | 297
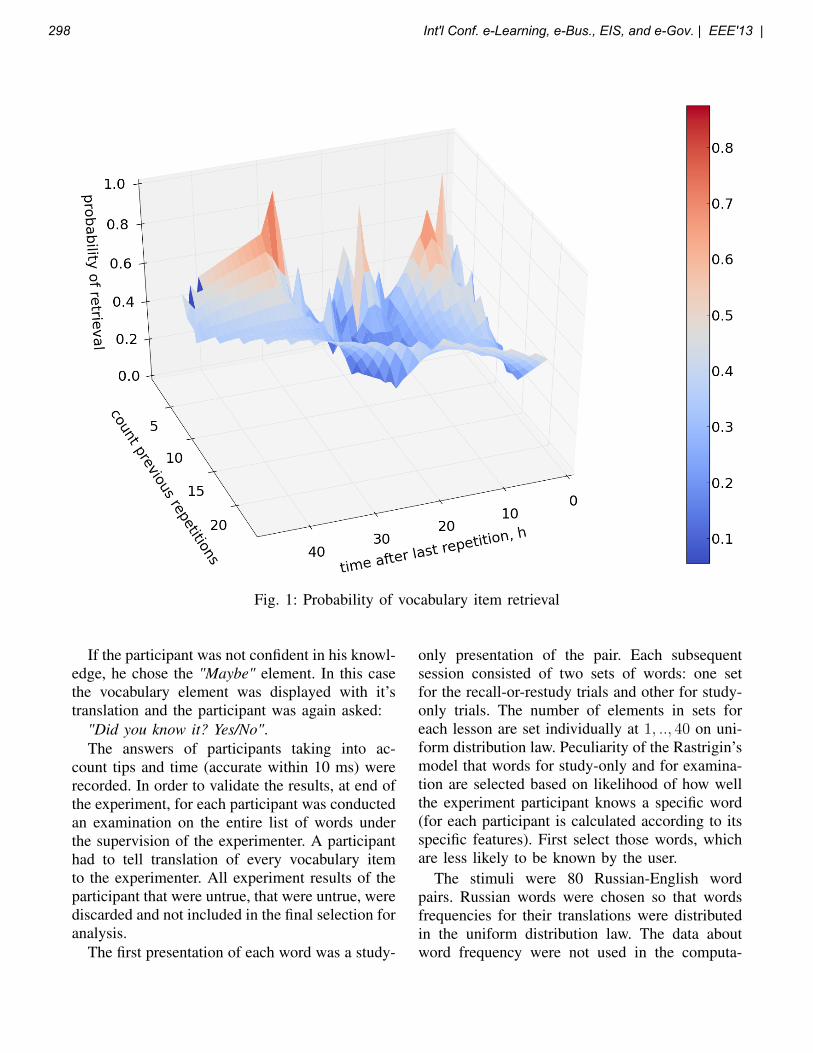
Fig. 1: Probability of vocabulary item retrieval
If the participant was not confident in his knowl-edge, he chose the "Maybe" element. In this casethe vocabulary element was displayed with it’stranslation and the participant was again asked:
"Did you know it? Yes/No".The answers of participants taking into ac-
count tips and time (accurate within 10 ms) wererecorded. In order to validate the results, at end ofthe experiment, for each participant was conductedan examination on the entire list of words underthe supervision of the experimenter. A participanthad to tell translation of every vocabulary itemto the experimenter. All experiment results of theparticipant that were untrue, that were untrue, werediscarded and not included in the final selection foranalysis.
The first presentation of each word was a study-
only presentation of the pair. Each subsequentsession consisted of two sets of words: one setfor the recall-or-restudy trials and other for study-only trials. The number of elements in sets foreach lesson are set individually at 1, .., 40 on uni-form distribution law. Peculiarity of the Rastrigin’smodel that words for study-only and for examina-tion are selected based on likelihood of how wellthe experiment participant knows a specific word(for each participant is calculated according to itsspecific features). First select those words, whichare less likely to be known by the user.
The stimuli were 80 Russian-English wordpairs. Russian words were chosen so that wordsfrequencies for their translations were distributedin the uniform distribution law. The data aboutword frequency were not used in the computa-
298 Int'l Conf. e-Learning, e-Bus., EIS, and e-Gov. | EEE'13 |
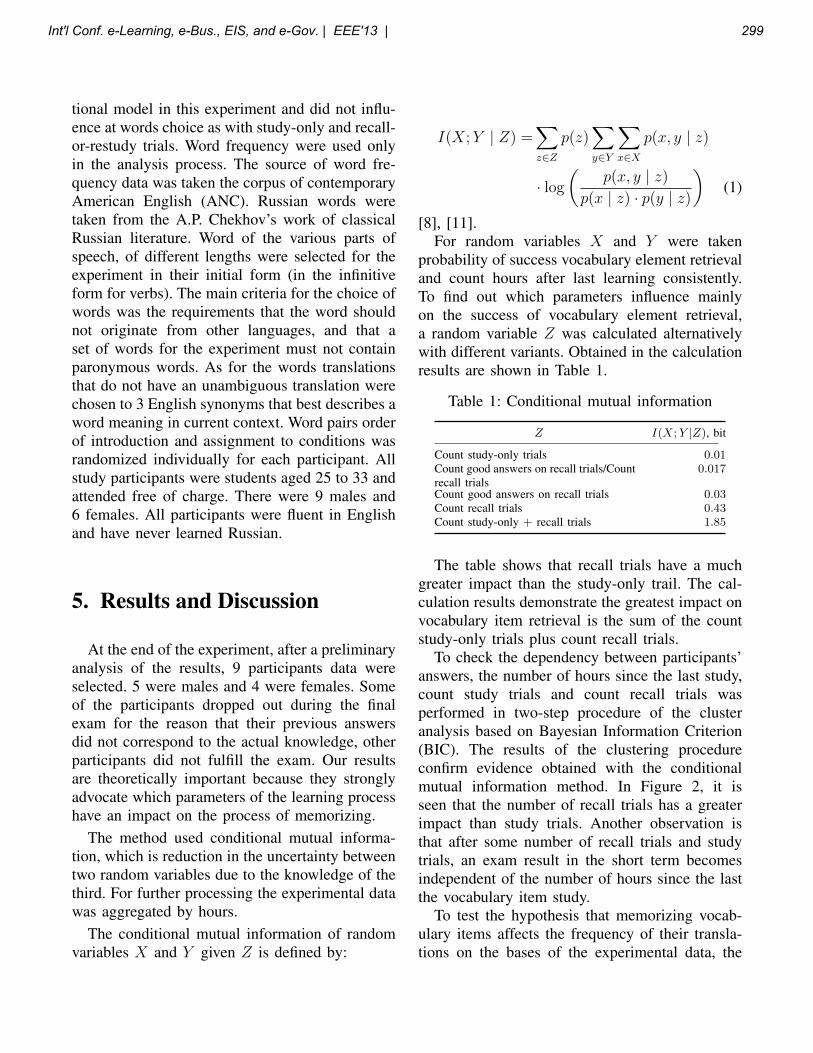
tional model in this experiment and did not influ-ence at words choice as with study-only and recall-or-restudy trials. Word frequency were used onlyin the analysis process. The source of word fre-quency data was taken the corpus of contemporaryAmerican English (ANC). Russian words weretaken from the A.P. Chekhov’s work of classicalRussian literature. Word of the various parts ofspeech, of different lengths were selected for theexperiment in their initial form (in the infinitiveform for verbs). The main criteria for the choice ofwords was the requirements that the word shouldnot originate from other languages, and that aset of words for the experiment must not containparonymous words. As for the words translationsthat do not have an unambiguous translation werechosen to 3 English synonyms that best describes aword meaning in current context. Word pairs orderof introduction and assignment to conditions wasrandomized individually for each participant. Allstudy participants were students aged 25 to 33 andattended free of charge. There were 9 males and6 females. All participants were fluent in Englishand have never learned Russian.
5. Results and Discussion
At the end of the experiment, after a preliminaryanalysis of the results, 9 participants data wereselected. 5 were males and 4 were females. Someof the participants dropped out during the finalexam for the reason that their previous answersdid not correspond to the actual knowledge, otherparticipants did not fulfill the exam. Our resultsare theoretically important because they stronglyadvocate which parameters of the learning processhave an impact on the process of memorizing.
The method used conditional mutual informa-tion, which is reduction in the uncertainty betweentwo random variables due to the knowledge of thethird. For further processing the experimental datawas aggregated by hours.
The conditional mutual information of randomvariables X and Y given Z is defined by:
I(X;Y | Z) =∑z∈Z
p(z)∑y∈Y
∑x∈X
p(x, y | z)
· log(
p(x, y | z)p(x | z) · p(y | z)
)(1)
[8], [11].For random variables X and Y were taken
probability of success vocabulary element retrievaland count hours after last learning consistently.To find out which parameters influence mainlyon the success of vocabulary element retrieval,a random variable Z was calculated alternativelywith different variants. Obtained in the calculationresults are shown in Table 1.
Table 1: Conditional mutual information
Z I(X;Y |Z), bit
Count study-only trials 0.01Count good answers on recall trials/Countrecall trials
0.017
Count good answers on recall trials 0.03Count recall trials 0.43Count study-only + recall trials 1.85
The table shows that recall trials have a muchgreater impact than the study-only trail. The cal-culation results demonstrate the greatest impact onvocabulary item retrieval is the sum of the countstudy-only trials plus count recall trials.
To check the dependency between participants’answers, the number of hours since the last study,count study trials and count recall trials wasperformed in two-step procedure of the clusteranalysis based on Bayesian Information Criterion(BIC). The results of the clustering procedureconfirm evidence obtained with the conditionalmutual information method. In Figure 2, it isseen that the number of recall trials has a greaterimpact than study trials. Another observation isthat after some number of recall trials and studytrials, an exam result in the short term becomesindependent of the number of hours since the lastthe vocabulary item study.
To test the hypothesis that memorizing vocab-ulary items affects the frequency of their transla-tions on the bases of the experimental data, the
Int'l Conf. e-Learning, e-Bus., EIS, and e-Gov. | EEE'13 | 299
Fig. 2: Two step clusteranalyse. answ - answer (1-know, 0 - don’t know), count_exam - count recall trials,count_rep - count study trials, dur - the number of hourssince the last study
relationship between vocabulary item translationfrequency and the ratio of the number of correctanswers to the number of wrong answers in therecall-or-restudy trials was platted (see Figure 3).These evidences correspond to the hypothesis andshow that participants make more correct answersfor vocabulary items whose translation frequencyis higher. A reduction of the correct answersration at the end graphs (frequencies 16 and 38)may be associated with the mismatch interests ofparticipants and a thematic of vocabulary items. Toconfirm the hypothesis it is necessary to conductadditional experiments with a large vocabularyand possibly thematic categorization of vocabularyitems.
For the analysis of additional dependenciesshowed in Figure 1 relationships between the prob-ability of success of vocabulary element retrieval,
Fig. 3: Word frequency and the ratio (p) of thenumber of correct answers to the number of wronganswers
the number of hours since the last study (bothstudy-only and recall-or-restudy) and the numberof repetitions (the number of study-only elementtrials plus the number recall-or-restudy trials). Forgreater clarity, the data for visualization werelimited by the number of repetitions to the valueof 20. The probability of success of vocabularyelement retrieval with the number of repetitionsmore than 20 tend to 1 independent of the numberof hours since the last the vocabulary item study.
In Figure 1 it is seen in particular reducingthe likelihood of the success of vocabulary el-ement retrieval with some increase in the num-ber of repetitions. These findings are consistentwith the results of previous studies [3], [4]. Inparticular by comparing the experimental data ina verbal-learning paradigm with massed intervalsand testing intervals was found that, spaced inter-vals are an advantage with respect to long-termmemory[5]. Based on this findings the spacingeffect was formulated. Further studies have foundenhance in memory consolidation by distributedlearning. Translating this effect on synaptic con-solidation, it is assumed that mechanisms of thesynaptic connections proliferation depends on in-tervals between memory reactivation. If the inter-val since the last memory reactivation is sufficientfor the synthesis of proteins, long-term memory is
300 Int'l Conf. e-Learning, e-Bus., EIS, and e-Gov. | EEE'13 |
strengthen [7].In Figure 1 it is also observed to extremes-
minimum (in the region of 10-12 hours and 19-21 hours) passing further to extremes-maxima. Iassume that these extremes-peaks are associatedwith periods of sleep participants. Memory consol-idation during the sleep has received considerableattention in the standard theory. Experts claim that,the interval of single night will greatly increase thestrength of the memory and presented the possi-bility that the the power of recollection undergoesa process of ripening and maturing during the timewhich intervenes [12].
These findings confirm the effect that recalltrials are more effective than study-only trials [5].Previous studies investigating spaced trials alsodemonstrate enhance long-term memory in com-parison with massed trials [7]. At the same time,research into the effectiveness of the combinedapproach recall or restudy and study-only with op-timal intervals for spaced repetitions is the subjectof further studies.
These evidences generally suggest that the MTTmore accurately describes the process of acquiringvocabulary. However, according to these data are,the sharing of the two theories gives better resultsthan the use of any of the theories separately.
AcknowledgmentThe research was conducted with the support
of the joint program DAAD and Ministry ofEducation and Science of the Russian Federation"Mikhail Lomonosov".
References[1] R. C. Atkinson and R. M. Shiffrin, “Human memory: A
proposed system and its control processes,” The psychologyof learning and motivation: Advances in research and theory,vol. 2, pp. 89–195, 1968.
[2] A. Baddeley, “Working memory: Looking back and lookingforward,” Nature Reviews Neuroscience, vol. 4, no. 10, pp.829–839, 2003.
[3] B. H. Challis, “Spacing effects on cued-memory tests dependon level of processing,” Journal of Experimental Psychology:Learning, Memory, and Cognition, vol. 19, pp. 389–396,1993.
[4] L. J. Cuddy and L. L. Jacoby, “When forgetting helpsmemory: an analysis of repetition effects,” Journal of VerbalLearning and Verbal Behavior, vol. 21, pp. 451–467, 1982.
[5] W. L. Cull, “Untangling the benefits of multiple study op-portunities and repeated testing for cued recall,” AppliedCognitive Psychology, vol. 14, pp. 215–235, 2000.
[6] T. Fujii, M. Moscovitch, and L. Nadel, “Memory consolida-tion, retrograde amnesia, and the temporal lobe,” Handbookof neuropsychology, 2nd edition, vol. 4, 2000.
[7] L. Litman and L. Davachi, “Distributed learning enhances re-lational memory consolidation,” Learning & Memory, vol. 15,no. 9, pp. 711–716, 2008.
[8] K. Makarychev et al., “A new class of non-Shannon-typeinequalities for entropies,” Communications in Informationand Systems N2, vol. 2, pp. 147–166, 2002.
[9] L. Nadel and M. Moscovitch, “Memory consolidation, ret-rograde amnesia and the hyppocampal complex,” CurrentOpinion in Neurobiology, vol. 7, pp. 217–227, 1997.
[10] L. A. Rastrigin and R. H. Erenstein, Adaptive learning witha student model. Zinatne, Riga, 1988.
[11] R. Renner and U. Maurer, “About the mutual (conditional)information,” 2005.
[12] L. R. Squire and P. Alvarez, “Retrograde amnesia and mem-ory consolidation: a neurobiological perspective,” CurrentOpinion in Neurobiology, vol. 5, pp. 169–177, 1995.
Int'l Conf. e-Learning, e-Bus., EIS, and e-Gov. | EEE'13 | 301
Understanding usage behaviors in social network service site -- A study using well-being model and self-determination theory
Nai-Ching Yeh and Judy Chuan-Chuan Lin* Department of Information Management, National Taiwan University of Science and Technology, Taipei, Taiwan, R.O.C.
Department of Computer Science and Information Management, Soochow University, Taipei, Taiwan, R.O.C. [email protected] (* Corresponding Author)
Abstract— The purpose of this study is to explore the predictors of continuance intention towards social networking sites. Based on well-being model and self-determination theory, we proposed the effects of enjoyment, well-being, autonomy, relatedness, and competence on individuals’ intention to continuously participate in social networking sites. Preliminary Data were collected from Facebook. Results showed the significant influences of well-being on enjoyment, while autonomy, relatedness, and competence are important factors stimulating individuals’ well-being. The results also indicated that enjoyment, autonomy, relatedness, and competence are important factors stimulating individuals’ continued intention in a social networking site, whereas well-being affects continuance intention mediating by enjoyment with indirect influence.
Keywords—eWOM; SNS; well-being; self-determination theory
I. INTRODUCTION Social media was seen as an effective channel to approach
consumers for its ability to attract people’s attention. This resulted in large-scale marketing spending in social media advertisement. As a well-known social networking site, Facebook enjoys a rapid uptake in numbers of users. According to statistics, its users have reached 835 million in March 2012 [8]. While Facebook has remarkable performance, it was confronted by the difficulty of retaining its users. For sustainability, social networking practitioners should strengthen users’ continuance intention to keep users on the site, and further create maximum benefits of social influence in business.
The significances of well-being and enjoyment have been considered important in promoting IT usage. From a need perspective, prior studies have provide evidence that self-determination factors as essential needs should be satisfied to sublimate psychological growth and well-being [3], and persevere and perform better in activities [4] , [15]. In spite of well-being model and self-determination theory have significant impacts on individuals’ behavior, the integrated conception of them seems scarce in online social networking. This study, thus, proposed an integrated model by combining well-being model and self-determination theory to predict participants’ continuance intention in social networking sites.
II. RESEARCH MODEL AND HYPOTHESES This research proposed enjoyment, well-being, and the three
self-determination factors as constructs that have effects on individuals’ continuance usage. Furthermore, well-being was seen
as a predictor of enjoyment, while the three self-determination factors were seen as antecedents of well-being.
From motivational perspective, perceived enjoyment has been found to have significant impact on users’ acceptance of technology in various contexts. In the hedonic-oriented online interactive environment, prior studies have shown that users’ enjoyable experiences significantly stimulate their intention toward a specific system, especially voluntary usage. Researchers have also demonstrated that users’ enjoyable experiences significantly affect their continued IT usage intention [9]. Accordingly, the following hypothesis was suggested:
【H1】Enjoyment is positively related to continuance intention towards a social networking website.
In prior research, Fehring et al. [5] have provided evidence that spiritual well-being is associated with positive moods states in elderly people. Moreover, Shin and Lyubomirsky [16] demonstrated that well-being was increased through intentional activities and further cultivates positive feelings. In connection with online contexts, enjoyment was representatively seen as positive affective response to individual experience that reflects generalized feelings such as pleasure, liking, and fun. While enjoyable experience was regarded as an important predictor of usage intention toward social networks, well-being was a trigger that can stimulate individual’s enjoyable feeling. Moreover, well-being can be seen as a potential motivation that promotes individual’s action [10]. In particular, Frey and Stutzer [6] deemed well-being as the core value and the final goal of economic activities. Along this point of view, numerous studies have shown the important role of well-being on promoting IT usage. Based on above noted, the current study emphasized the importance of well-being for enhancing enjoyment and usage intention in social networking sites, and proposed the following hypotheses:
【H2】Well-being is positively related to enjoyment in a social networking website.
【H3】Well-being is positively related to continuance intention towards a social networking website.
Based on Ryan and Deci’s [14] point of view, Reis et al. [12] explored the hypothesis that emotional well-being may be understood in terms of the degree to which the three basic needs- autonomy, competence, and relatedness are satisfied in daily activity. With SDT approach, Burton et al. [2] showed that intrinsic self-regulation is an important predictor of psychological well-being outcomes in educational settings. Moreover, previous
302 Int'l Conf. e-Learning, e-Bus., EIS, and e-Gov. | EEE'13 |
research supported the universality of SDT processes by assessing need satisfaction and well-being simultaneously [11]. As noted, this line of research asserted that satisfaction of basic psychological needs as the important predictors of well-being. These arguments lead to the following hypotheses:
【H4a】Autonomy is positively related to well-being in a social networking website.
【H4b】Relatedness is positively related to well-being in a social networking website.
【H4c】Competence is positively related to well-being in a social networking website.
While SDT as a general theory of motivation that focused on psychological need satisfaction, researchers applied it to explore individuals’ continuance intention of technology usage. Sørebø et al. [17] examined the effects of self-determination theory constructs in the context of teachers’ utilization of e-learning technology. Roca and Gagne [13] also showed that applying SDT to e-learning in a work setting can be useful for predicting continuance intention. As a result of online social networking websites provide platform for social interaction, it seems reasonable to apply SDT into online social context. Therefore, the current research posited the following hypotheses:
【H5a】Autonomy is positively related to continuance intention in a social networking website.
【H5b】Relatedness is positively related to continuance intention in a social networking website.
【 H5c 】 Competence is positively related to continuance intention in a social networking website.
III. METHODOLOGY AND OUTCOME The current study plans to employ an online survey to examine
the research model and test the proposed hypotheses. Measurements of all the constructs were based from prior studies with slight modifications to fit the online social networking context by using five-point Likert scales, ranging from “strongly disagree” (1) to “strongly agree” (5). Enjoyment will be measured with 4-items adapted from Hassanein and Head’s [7] research on online shopping. Well-being will be measured with the 5-items WHO (Five) Well-Being Index [1]. Items on the three self-determination factors (autonomy, relatedness, competence) will be based [17] and modified to assess individuals’ basic need in terms of online social networking, in which, autonomy will be measured with 5-items, and relatedness will be measured with 8-items, while competence will be measured with 5-items. Continuance intention will be measured by 4-items adopted from online technology continued usage research [18].
The purpose of this proposal is to explore the power of social influence, and examine the possible factors affecting user’s well-being and intention to WOM communication. The results are expected to provide better insights for the development as well as the management of a successful social media with great attraction and influence
IV. ACKNOWLEDGMENT The authors would like to express their appreciation to
National Science council of Republic of China for financially supporting this study under Contract Number NSC 99-2410-H-031-046-MY2 and NSC 101-2410-H-031-025-MY2 .
V. REFERENCE [1] Awata, S., Bech, P., Koizumi, Y., Seki, T., Kuriyama, S., Hozawa, A.
Ohmori, K., Nakaya, N., Matsuoka, H., & Tsuji, I. (2007). Validity and utility of the Japanese version of the WHO-Five Well-Being Index in the context of detecting suicidal ideation in elderly community residents. International Psychogeriatrics , 19(1), 77-88.
[2] Burton, K. D., Lydon, J. E., D’Alessandro, D. U., & Koestner, R. (2006). The differential effects of intrinsic and identified motivation on well-being and performance: Prospective, experimental, and implicit approaches to self-determination theory. Journal of Personality and Social Psychology, 91(4), 750-762.
[3] Chen, K. C., & Jang, S. J. (2010). Motivation in online learning: Testing a model of self-determination theory. Computers in Human Behavior, 26, 741-752.
[4] Deci, E. L., Ryan, R. M., Gagné, M., Leone, D. R., Usunov, J., & Kornazheva, B. P. (2001). Need satisfaction, motivation, and well-being in the work organizations of a former eastern bloc country: a cross-cultural study of self-determination. Personality and Social Psychology Bulletin, 27(8), 930–942.
[5] Fehring, R.J., Miller, J.F., & Shaw, C. (1997). Spiritual well-being, religiosity, hope, depression, and other mood states in elderly people coping with cancer. Oncology Nursing Forum, 24(4), 663-71.
[6] Frey, B. S., & Stutzer, A. (2002). What can economists learn from happiness research? Journal of Economic Literature, 40, 402-435.
[7] Hassanein, K., & Head, M. (2007). Manipulating perceived social presence through the web interface and its impact on attitude towards online shopping. International Journal of Human-Computer Studies, 65, 689-708.
[8] Internet World Stats (2012). FACEBOOK users in the world. http://www.internetworldstats.com/facebook.htm (accessed May 15, 2012).IPPF (2012). Understanding young people’s right to decide: Why is it important to develop capacities for autonomous decision-making? International Planned Parenthood Federation.
[9] Kim, B. (2010). An empirical investigation of mobile data service continuance: Incorporating the theory of planned behavior into the expectation–confirmation model. Expert Systems with Applications, 32, 7033-7039.
[10] Layard, R. (2005). Happiness: Lessons from a New Science. New York: Penguin Press.
[11] Milyavskaya, M., & Koestner, R. (2011). Psychological needs, motivation, and well-being: A test of self-determination theory across multiple domains. Personality and Individual Differences, 50, 387-391.
[12] Reis, H. T., Sheldon, K. M., Gable, S. L., Roscoe, J., Ryan, R. M. (2000). Daily well-being- The role of autonomy, competence, and relatedness. Personality & Social Psychology Bulletin, 26, 419-435.
[13] Roca, J. C., & Gagne`, M. (2008). Understanding e-learning continuance intention in the workplace: A self-determination theory perspective. Computers in Human Behavior, 24, 1585-1604.
[14] Ryan, R. M., & Deci, E. L. (2000). Self-determination theory and the facilitation of intrinsic motivation, social development , and well-being. American Psychologist, 55(1), 68-78.
[15] Ryan, R. M., Rigby, C. S., & Przybylski, A. (2006). The motivational pull of video games: A self-determination theory approach. Motivation and Emotion, 30, 347–363.
[16] Shin, N.L., & Lyubomirsky, S. (2009). Enhancing well being and alleviating depressive symptoms with positive psychology interventions: A practicefriendly metaanalysis. Journal of Clinical Psychology, 65(5), 467-487.
[17] Sørebø, Ø, Halvari, H., Gulli, V. F., Kristiansen, R. (2009). The role of self-determination theory in explaining teachers’ motivation to continue to use e-learning technology. Computers & Education, 53, 1177-1187.
[18] Zhang, Y., Fang, Y., Wei, K.-K., & Chen, H. (2010). Exploring the role of psychological safety in promoting the intention to continue sharing knowledge in virtual communities. International Journal of Information Management, 30, 425-436
Int'l Conf. e-Learning, e-Bus., EIS, and e-Gov. | EEE'13 | 303
A systematic review of integration of ICT
in science classrooms
Chiu-Liang Chen, Janet Mei-Chuen Lin, Yi-Jiun Wu, Yu-Wen Huang, & Rong-Ching Chen
Graduate Institute of Information and Computer Education, National Taiwan Normal University, Taiwan
Abstract – In this study we conducted a systematic
review of the literature on the integration of information
and computer technologies (ICT) in science education in
elementary and secondary schools. A total of 227 papers
were selected for manual screening using a set of
predefined inclusion criteria. The screening yielded 172
papers for data extraction and analysis. Data from each
of these 172 papers were extracted with a template
consisting of 16 items, including area, subject, topics,
ICT tools used, purpose of the ICT tools, learning theory,
teaching strategy, learning activities, skills required of
the instructor to implement the integration, participants,
data collected, research findings, etc. These data allowed
us to analyze how ICT tools have been used to improve
science teaching and, in particular, what novel learning
activities, as opposed to traditional classroom teaching
activities, have been made possible by integrating ICT in
instruction, thus providing students with more effective
ways of learning science.
Keywords: ICT integration, systematic reviews, science
education.
1. Introduction
As Light and Pillemer [1] pointed out, “the need for
research synthesis can only be realized when one
understands that in order for the gains of scholarship to
be cumulative, there must be a link between the past and
future research. Often the need for a new study is not as
great as the need for the assimilation of already existing
studies.” Briner & Denyer [2] further stressed that “the
emphasis on empirical contributions rather than reviews
and syntheses has resulted in a voluminous, fragmented
and contested field.”
Information and communications technologies (ICT)
tools have been used in classrooms around the world for
many decades and much has been reported about how
ICT has impacted teaching and learning. The purpose of
this study is to synthesize research findings published
between 2000 and 2012 on the use of ICT in science
classrooms. We are particularly interested in
investigating what novel learning activities, as opposed
to traditional classroom teaching activities, have been
made possible by integrating ICT in science instruction,
thus providing students with more effective ways of
learning science.
2. Method
A systematic review utilizes organized, transparent,
and replicable procedures to comprehensively locate and
synthesize individual studies, and draws conclusions
about what we currently know and do not know about a
given question or topic [2, 3]. The following subsections
describe the major steps of the systematic review we
conducted, including data collection, data extraction, and
data synthesis.
2.1 Data Collection
The entire data collection process we performed is
depicted in Figure 1. To search for articles that involved
the use of ICT tools in education, published in English
between 2000 and 2012, we began with identifying six
databases for searching relevant articles: ACM Digital
Library, EBSCOhost (Wilson Databases), Ed/ITLib,
Education Journals (ProQuest), ERIC, and ISI Web of
Knowledge. The search string used was: (ICT OR
technology OR computer OR system) AND (teach* OR
learn* OR educat* OR instruct* OR pedagogi*).
The initial search returned a total of 45,618 articles.
The articles were managed with EndNote. For each
article we recorded the title of the article, the journal
where the article was published, the year and month of
publication, the volume and issue numbers, names of the
authors, and the abstract. After removing the duplicates
and the articles from non-academic sources, as well as
journals that were irrelevant to our topic, the number of
articles was reduced to 14,524.
The 14,524 papers then were divided into three
groups and screened manually by four researchers.
Articles of Group 1 were examined by researchers A and
B, Group 2 by researchers B and C, and Group 3 by
researchers A and C. The examiners tried to decide if an
article should be included for analysis based on the title
and the abstract of the article; however, if that was not
enough to make the decision, full text was read.
Whenever two examiners of the same group disagreed
304 Int'l Conf. e-Learning, e-Bus., EIS, and e-Gov. | EEE'13 |
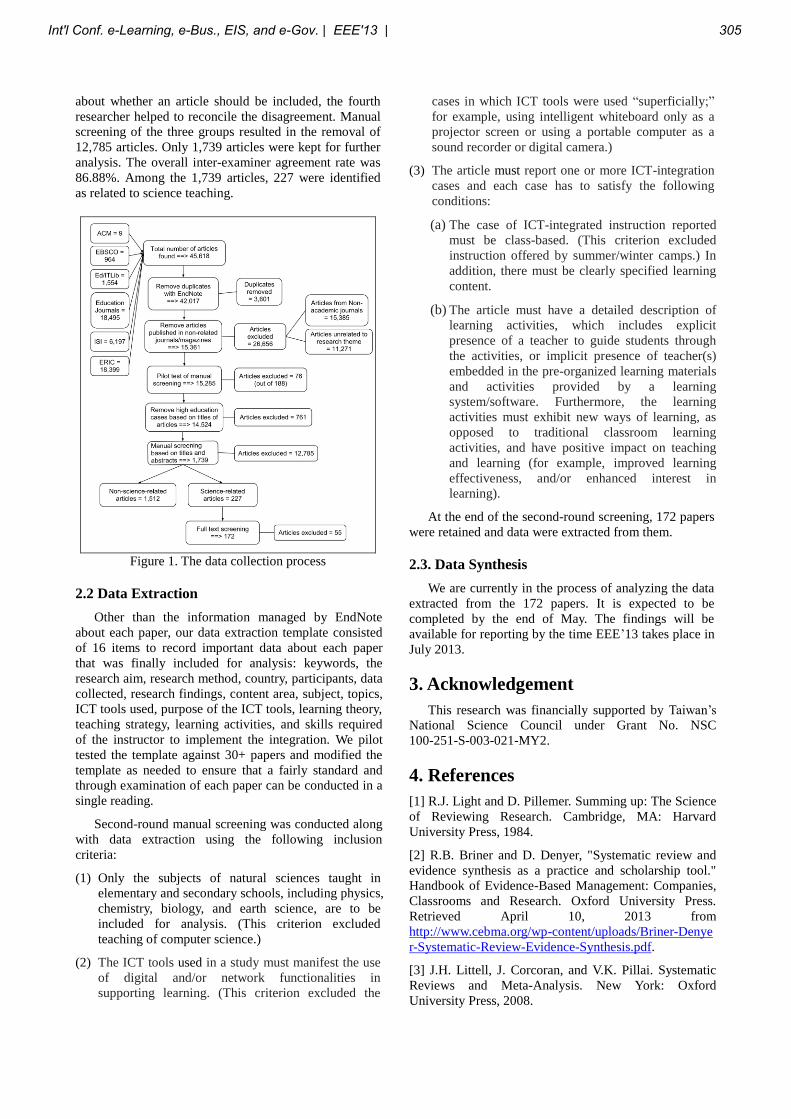
about whether an article should be included, the fourth
researcher helped to reconcile the disagreement. Manual
screening of the three groups resulted in the removal of
12,785 articles. Only 1,739 articles were kept for further
analysis. The overall inter-examiner agreement rate was
86.88%. Among the 1,739 articles, 227 were identified
as related to science teaching.
Figure 1. The data collection process
2.2 Data Extraction
Other than the information managed by EndNote
about each paper, our data extraction template consisted
of 16 items to record important data about each paper
that was finally included for analysis: keywords, the
research aim, research method, country, participants, data
collected, research findings, content area, subject, topics,
ICT tools used, purpose of the ICT tools, learning theory,
teaching strategy, learning activities, and skills required
of the instructor to implement the integration. We pilot
tested the template against 30+ papers and modified the
template as needed to ensure that a fairly standard and
through examination of each paper can be conducted in a
single reading.
Second-round manual screening was conducted along
with data extraction using the following inclusion
criteria:
(1) Only the subjects of natural sciences taught in
elementary and secondary schools, including physics,
chemistry, biology, and earth science, are to be
included for analysis. (This criterion excluded
teaching of computer science.)
(2) The ICT tools used in a study must manifest the use
of digital and/or network functionalities in
supporting learning. (This criterion excluded the
cases in which ICT tools were used “superficially;”
for example, using intelligent whiteboard only as a
projector screen or using a portable computer as a
sound recorder or digital camera.)
(3) The article must report one or more ICT-integration
cases and each case has to satisfy the following
conditions:
(a) The case of ICT-integrated instruction reported
must be class-based. (This criterion excluded
instruction offered by summer/winter camps.) In
addition, there must be clearly specified learning
content.
(b) The article must have a detailed description of
learning activities, which includes explicit
presence of a teacher to guide students through
the activities, or implicit presence of teacher(s)
embedded in the pre-organized learning materials
and activities provided by a learning
system/software. Furthermore, the learning
activities must exhibit new ways of learning, as
opposed to traditional classroom learning
activities, and have positive impact on teaching
and learning (for example, improved learning
effectiveness, and/or enhanced interest in
learning).
At the end of the second-round screening, 172 papers
were retained and data were extracted from them.
2.3. Data Synthesis
We are currently in the process of analyzing the data
extracted from the 172 papers. It is expected to be
completed by the end of May. The findings will be
available for reporting by the time EEE’13 takes place in
July 2013.
3. Acknowledgement
This research was financially supported by Taiwan’s
National Science Council under Grant No. NSC
100-251-S-003-021-MY2.
4. References
[1] R.J. Light and D. Pillemer. Summing up: The Science
of Reviewing Research. Cambridge, MA: Harvard
University Press, 1984.
[2] R.B. Briner and D. Denyer, "Systematic review and
evidence synthesis as a practice and scholarship tool."
Handbook of Evidence-Based Management: Companies,
Classrooms and Research. Oxford University Press.
Retrieved April 10, 2013 from
http://www.cebma.org/wp-content/uploads/Briner-Denye
r-Systematic-Review-Evidence-Synthesis.pdf.
[3] J.H. Littell, J. Corcoran, and V.K. Pillai. Systematic
Reviews and Meta-Analysis. New York: Oxford
University Press, 2008.
Int'l Conf. e-Learning, e-Bus., EIS, and e-Gov. | EEE'13 | 305

306 Int'l Conf. e-Learning, e-Bus., EIS, and e-Gov. | EEE'13 |

SESSION
E-COMMERCE AND PRIVACY + EDUCATIONAND LEARNING METHODS +
KNOWLEDGE-BASED SYSTEMS
Chair(s)
Prof. Hamid ArabniaUniversity of Georgia
Int'l Conf. e-Learning, e-Bus., EIS, and e-Gov. | EEE'13 | 307

308 Int'l Conf. e-Learning, e-Bus., EIS, and e-Gov. | EEE'13 |
Meeting the E-Commerce Privacy Key Concept, A
Conceptual Survey
Seyyed Mohammad Reza Farshchi*,1, Saber Mesgari2, Davud MohammadPur3 1Department of Mathematics, Applied Mathematics, FUM University, Tehran, Iran.
2Department of Electrical Engineering, Amirkabir University of Technology, Tehran, Iran. 3Department of Computer Engineering, University of Zanjan, Zanjan, Iran.
Abstract- User privacy protection is of the utmost
importance. We show that privacy has been acknowledged as
a human right that is beneficial not only to each individual but
also to society as a whole. We describe privacy-related
legislation and address criticism against privacy. We also
summarize the existing approaches to protect privacy. We also
show that currently deployed e-commerce protocols reveal to
service providers user personal data such as user identity and
billing information, as well as the product or services the user
purchases. Such information is sensitive because, e.g., it may
reveal the political views, religion, sexual orientation or
health condition of the user. Frequently without user
awareness, service providers gather that information to
profile users in order to, e.g., offer a personalized service or
discriminate them. Consequently, we study privacy-preserving
e-commerce protocols. First, we categorize them as private
purchase protocols, in which the service provider does not
learn which items are bought by the user, and anonymous
purchase protocols, in which the user identity is not disclosed
to the service provider. And finally, we also summarize our
work on anonymous purchase.
Keywords: Privacy Protocol, Privacy, E-commerce.
1 Introduction
The progress of information and communication
technologies (ICT) has eased the collection, storage and
sharing of web user’s personal information. When users
search the web, engage in online transactions or utilize social
networks, service providers collect and store personal
information for various purposes, e.g., offering a personalized
service, improving usability, or delivering targeted
advertising. Personal information encompasses not only data
such as identity, address and telephone number, but also any
information that reveals users interests, thoughts and beliefs,
such as the search terms employed in search engines.
The progress of profiling techniques has automated the
analysis of user personal data. Service providers apply
profiling techniques to the personal information gathered to
classify users into categories of their interest. Afterwards,
service providers make decisions on how to treat users
depending on how they were profiled, which leads to user
automatic discrimination. Moreover, users are frequently
unaware of the fact that they are being profiled and the
profiling algorithm employed is kept secret by service
providers. Some definition was adopted directly from [1]. Privacy is key in the promotion of liberty, autonomy, self
hood, human relations, and in furthering the existence of a free
society [1]. In particular, it provides freedom from scrutiny,
prejudice, pressure to conform, exploitation, and the judgment
of others [2].
Some scholars have valued privacy as an individual right
that protects the ability to control information about oneself
[3]. Others have broadened the importance of privacy as a
collective right required in a democratic society and key for
political participation, human dignity and autonomy [4]. In a
similar line, some studies highlight the close relation between
privacy and intimacy [5], while others extend the need of
privacy to any type of social relationship [6].
Furthermore, privacy is not only an individual interest
but also a social value [7]. It is a common value in the sense
that all individuals value some privacy, a public value because
of its importance in a democratic political system, and a
collective value because technology and market forces make it
difficult for an individual to have privacy without everybody
sharing a similar level of privacy [8].
E-commerce allows the buying and selling of products
and services through communication networks. Currently
deployed e-commerce protocols typically disclose user data to
the service provider. Those user data consist of information
required by the method of payment employed and the identity
and number of products bought. The former normally
encompasses contact details such as name, address, phone
number or email address, financial details such as bank
account or credit card number, and other personal data such as
birth date or social security number. The latter may reveal
user’s interests and needs. Therefore, currently deployed e-
commerce protocols disclose sensitive user data.
2 Privacy Model
The concept of privacy is frequently used in legal,
political, philosophical and technical literature and multiple
privacy definitions have been proposed. However, there exists
no common definition since its meaning changes with the
discipline in which it is used and even with the different
viewpoints within a field of study. In fact, the concept of
privacy differs depending on the context to which it is
Int'l Conf. e-Learning, e-Bus., EIS, and e-Gov. | EEE'13 | 309
applied. Therefore, a common approach to define privacy
considers several privacy categories [9].
Body privacy relates to protection against body exposure
and seeks to prevent intrusions into an individual’s physical
space or solitude. Compulsory medical treatments or
collection of biometric data are within the scope of body
privacy.
Behavior privacy extends such protection to any aspect of
an individual’s behaviour, including thoughts, feelings and
beliefs. Political affiliation, sexual preferences and religious
practices are important aspects of behavior privacy.
Organization privacy refers to groups, corporations or
societies that wish to conceal their secrets or activities from
other individuals or organizations.
Communication privacy protects individuals’ freedom to
communicate among themselves without monitoring or
interception by other individuals or organizations.
Data privacy is applied to the collection, storage and
sharing of personal data, and is sometimes subdivided into
types such as financial, location or medical privacy depending
on the type of data.
As can be seen, such classifications are based on both
the type of individual and the type of information that require
privacy and the classification’s categories overlap partially.
Due to the progress of ICT, communication privacy and data
privacy are nowadays closely linked and the term information
privacy is employed to encompass both. We are interested in
the protection of information privacy in the context of e-
commerce transactions.
Although most scholars think that privacy is a valuable
concept, there are some critical accounts on privacy. Thomson
claims that privacy is a cluster of rights that overlaps already
existing rights such as property and body security [10].
Similarly, Bork defends that privacy is encompassed by
liberty or autonomy [11]. Posner argues that privacy is
detrimental for economy because, by concealing information,
it harms market efficiency, and that therefore privacy should
only be protected when access to information would reduce its
value [12].
2.1 Privacy vs. Usability
Security and privacy have often been sacrificed for the
sake of usability. Protecting access to a computer with a
password is a classic example [14]. Although everybody
acknowledges that implementing some access control
mechanism is needed from a security perspective, oftentimes
password authentication is disabled for the sake of usability.
In the physical world, however, hardly anyone is willing to
leave his home door unlocked, despite the time costs and
unforseen incidents (e.g. key losses) that locking and
unlocking doors causes.
In the online world, security and privacy are also
undermined to improve usability. Examples include banks that
require easy-to-remember but insecure personal data for an
ongoing debate on the need to trade-off security and privacy
has been fostered by authorities that wish to deploy
surveillance and other privacy invasive measures in order to
prevent crime.
Authentication purposes [15], social networks that
disclose the identities of registered users so that finding
friends is easy, or e-commerce websites that offer a wide array
of payment methods, some of them less secure or less privacy-
preserving than others.
We think that security, privacy and usability are not
conflicting requirements and thus the goal is to design secure
and privacy-preserving systems that are usable. Usability not
only benefits the users’ experience but also improves the
system’s security and privacy. In particular, when users have a
security role, usability plays a crucial role in avoiding security
failures. For example, unusable systems that require users to
have many passwords may lead to weak password choices or
password reuse, which harms the system’s security.
Additionally, to evaluate the usability of systems,
research also focuses on experiment design and on conducting
surveys and interviews to find out both how users perceive
security and privacy in a system and their understanding of the
system’s operation [16].
2.2 Privacy vs. Profiling
Patterns and correlations in large amounts of users’
personal data. Constructing user profiles encompasses
defining the goals of the analysis, collecting the data to be
analyzed, preparing the data by removing some user
attributes, finding correlations and patterns on those data, and
analyzing the results to eliminate irrelevant patterns.
The application of user profiles consists in classifying
users according to the patterns found. User profile application
gives feedback and also allows the refinement of constructed
user profiles.
Profiling is a tool employed in many domains. In the
financial sector, user profiling is employed, e.g., to detect
fraud. In the human resources departments, it is used to
evaluate the candidate’s skills and behavior. In e-commerce,
user profiles are used to classify customers into categories so
as to predict their behaviour and allow for customer
management.
2.3 Privacy vs. Transparency
Transparency, aka openness, refers to a set of policies
and procedures that allows users to access, understand, use
and audit information and activities held by an organization
such as the government, a public society or a private
company. In the case of governments, transparency is often
regarded as a fundamental property for democracy since it
ensures the right to be informed.
310 Int'l Conf. e-Learning, e-Bus., EIS, and e-Gov. | EEE'13 |
Public and private organizations can also benefit from
transparency to improve user’s confidence, insofar as
transparency does not affect intellectual property or research
activities.
We also regard transparency as a useful property that
allows users to control organizations’ activities and that helps
to balance the power between users and organizations.
However, recently, it has been advocated that users should
also lean towards transparency [17]. For example,
Facebook12 managers have claimed that ―more visibility
makes us better people. More transparency should make for a
more tolerant society in which people eventually accept that
everybody sometimes does bad or embarrassing things‖.
Generally, it is claimed that users would enjoy the same
benefits that organizations obtain through transparency, i.e.,
generating trust and being more moral and effective.
However, we argue that user transparency would
provoke a major power imbalance between users and
organizations. User transparency means that users, who are
the vulnerable parties, would give away all their information
to organizations. If user transparency was implemented,
organizations would control users totally.
In the context of privacy protection, transparency often
refers to the set of policies and tools through which users can
monitor how a service provider handles their personal data. It
has been argued that, in so called ―smart environments‖,
privacy protection via data disclosure minimization is not
adequate because data knowledge is necessary to carry out
smart functionalities, and that the goal should be shifted to
providing transparency [18]. However, the claim that data
knowledge is necessary to carry out smart functionalities is
unsupported.
3 Demand and Threat to Privacy
Since old times, human beings have demanded privacy.
Although privacy as a concept did not exist in some cultures
and languages until recently, most cultures have recognized
the individual’s need to withhold certain facts or acts from
The concept of privacy is frequently used in legal, political,
philosophical society. For example, anthropologic studies [19]
have shown that seclusion and restricted access to ceremonies
were utilized to protect privacy. Some studies of animals even
claim that privacy needs are not restricted to humans [20] and
that wildlife documentaries threaten animals’ right to privacy
[5].
However, some studies show that users are either not
aware of data being shared or not aware of the privacy
implications of sharing personal data [4].
Other studies show that they are indeed concerned about
personal data being collected [21] and that service provider’s
techniques to alleviate such concerns, such as privacy policies
or privacy seals, are not well understood [22, 18]. Aside from
that, citizens value privacy protection as a necessary
countermeasure against surveillance and identity theft.
Surveillance. Surveillance can be defined as the process
of monitoring the communications and actions of one or
more individuals.13 Personal surveillance refers to the
case in which only one individual is investigated, while
mass surveillance affects a large group. The purpose of
the latter is commonly to identify individuals from the
group that possess some characteristic.
Surveillance can be carried out via a wide array of techniques.
Physical surveillance involves listening and watching,
possibly remotely in terms of space and time. Communication
surveillance involves intercepting or eavesdropping an
individual’s communications.
We are particularly interested in data surveillance, which
employs users personal data stored in remote servers.
Nowadays, data surveillance is effective thanks to the great
amount of personal data collected by service providers.
Additionally, it is cheaper than other forms of surveillance
because it can be automated. Techniques that allow such
automation include profiling and matching records of the
same user in different servers.
Identity Theft. Identity theft consists in pretending to be
another person by using that person’s identity. Usually,
identity theft is used to gain access to resources or
benefits. Nowadays, identity theft is a real threat to users
whose personal data is stored remotely. Unfortunately,
data breaches are not infrequent and stolen personal data
can be used to impersonate someone else.
As can be seen, privacy protection techniques that seek
to minimize the amount of personal data disclosed to service
providers are useful to prevent both surveillance and identity
theft. Privacy protection is thus necessary to mitigate users’
privacy concerns and to favor their participation in the
information society.
3.1 E-commerce Protocols
Currently deployed e-commerce protocols do not protect
user privacy. The security properties they usually provide are
communication security, i.e., data is exchanged in an
encrypted manner to prevent eavesdropping, authentication
between buyer and merchant and non-repudiation. Therefore,
buyers are authenticated and they disclose which items they
buy to the vendor.
Typically, e-commerce protocols consist of a purchase
phase in which users select the product they want to buy and
reveal this information to the service providers, a payment
phase in which users pay to service providers in order to buy
the selected products, and a delivery phase in which the buyer
receives digital goods or a receipt that allows them to claim
delivery of the purchased products.
A wide array of payment methods is nowadays available:
credit cards, Paypal, billing to mobile phones and landlines,
cash on delivery, cheques, debit cards, electronic money (e.g.
bitcoin), gift cards, postal money order, wire transfer and
Int'l Conf. e-Learning, e-Bus., EIS, and e-Gov. | EEE'13 | 311
invoices. Currently, credits cards represent more than ninety
per cent of online payments in the US, while PayPal is the
fastest growing payment method with more than 100 million
active users worldwide. Therefore, we are going to focus our
analysis on those payment methods.
In the mid-1990s, payment protocols based on credit
cards employed the SSL protocol to secure communications.
Such payment protocols disclosed user personal and financial
data to service providers. In the late 1990s, credit card
companies promoted the use of Secure Electronic Transaction
(SET), a set of security protocols that allowed using the
existing payment card infrastructure in the Internet. From a
privacy perspective, the main feature of SET is that it avoided
the disclosure of user financial information to the service
provider.
Instead, this information was communicated to the
service provider encrypted with the public key of the bank,
which received it from service providers and verified it.
However, SET was not successful because of its deployment
costs and because it required user’s to employ a user public
key certified by the bank.
Currently, most credit card companies employ 3-D
secure, a protocol that employs TLS (the successor of SSL)
for the sake of communication security and adds an
authentication step. When buyers enter the payment phase,
they are redirected from the e-commerce web site to a card
issuing bank web site to authorize the transaction. Typically, a
password-based authentication method is employed, in which
the password is tied to the card. The password is not
communicated to the service provider, which reduces the risks
derived from security breaches in the service provider domain.
To prevent such security breaches, credit card companies
enforce the deployment of the Payment Card Industry Data
Security Standard (PCI DSS) in the service provider domain.
In the next paragraph, we say some tips about the desirable
properties of E-commerce protocols.
One of the main properties an e-commerce protocol
should provide is fairness. Fairness ensures that either service
provider receives a payment and user receives the product, or
both of them receive nothing. In the case of digital goods,
copyright protection is needed to avoid illegal distribution.
Authors in [32] give an overview of copyright protection
protocols. Access control is used for two purposes. First, it is
required to ensure that only entitled users can purchase.
Second, it ensures that only users that have purchased a
service can access it. Profiling techniques are employed to
provide personalized services.
3.2 Private Purchase
Oblivious transfer (OT) was proposed in [23].
Traditionally, security in OT was analyzed in a half-simulation
model where simulation security is required against an
adversarial receiver, but just stand-alone privacy is required
against an adversarial sender. This notion was showed to
admit practical attacks against receiver’s security [24]. Author
at [7], as well as subsequent works [5], present efficient
adaptive OT schemes in a full-simulation model. However,
these works are not universally composable secure.
An adaptive universally composable secure OT scheme
was proposed [25]. They utilize the approach of assisted
decryption used in [26, 11], where the sender sends to the
receiver a collection of ciphertexts and in each transfer phase
helps the receiver to decrypt one of them. As pointed out in
[27], this approach allows for transfer phases with constant
computational and communication complexity, and it is
suitable to ensure that the sender does not change the
messages in each transfer phase, which are important
properties for constructing a private purchase protocol based
on OT. In contrast, in other non-adaptive UC-secure OT
schemes [28, 10], in each transfer phase the receiver hands a
set of keys to the sender, who sends back a collection of
ciphertexts such that the receiver is able to decrypt only one of
them.
The first Priced Oblivious Transfer (POT) scheme [1], as
well as subsequent works [2], analyzes security in the half- simulation model. In [8], it is explained why these protocols
fail even under sequential composition and a practical attack is
shown.
POT is a concrete instantiation of oblivious transfer with
access control protocols. Access control mechanisms for OT
proposed so far can roughly be divided into two groups: those
that do not preserve user anonymity and those that preserve it.
In the first group, conditional oblivious transfer schemes
[13, 20], in which a sender with input x and a receiver with
input y interact in such a way that a transfer is completed only
when q(x, y) = 1 for some public predicate q(·, ·), are non-
adaptive and employ the half-simulation model. On the other
hand, security of both the non-adaptive [1, 29] and the
adaptive [11] Generalized Oblivious Transfer schemes
proposed so far, which can be instantiated as non-adaptive and
adaptive POT schemes respectively, depends on the
underlying OT scheme utilized to implement them, but these
solutions are rather inefficient.
In the second group, we find solutions that employ
anonymous credentials. Author in [2] propose a scheme in
which access control policies are described by a state graph,
such that each state allows access to a subset of the records. In
the initialization phase, the database records are encrypted on
input an index from 1 to N. Additionally, each user obtains a
credential that binds her to a state in the graph. To access a
record, the user proves possession of her credential and proves
that the index of the record is included in the subset of indices
defined by her state. Each access to the database determines a
transition from one state to another, which depends on the
record accessed. The user obtains a new credential that binds
her to her new state. Access control is enforced by limiting the
possible transitions between states.
This scheme has the nice properties that it can be applied
to different OT schemes and that it permits changing the
policies without needing to rerun the initialization phase of the
OT scheme. However, as noted by Camenisch et al. [28], the
scheme is inefficient for two reasons. First, users must obtain a
new credential each time they access the database. Second, a
312 Int'l Conf. e-Learning, e-Bus., EIS, and e-Gov. | EEE'13 |
large class of access control policies cannot be efficiently
expressed via state graphs.
In next section, we introduce some protocols that allow a
user, on input meter readings from a meter and a tariff policy
from the service provider, to compute the fee to be paid, to
reveal the fee to the service provider and to prove to the
service provider that such fee is correct without disclosing any
information on the meter readings. We have considered two
types of meters: tamper-resistant and non-tamper-resistant. For
additional reading you can refer to [1, 35].
In fact, the meter outputs signed readings which are used
by the user to prove correctness of the fee calculation. In the
other word, the proof of correctness of the fee calculation that
is sent by the user to the service provider does not suffice
because such calculation could be done on input fake meter
readings. In this case, the service provider must perform extra
checks to ensure correctness of the fee calculation.
4 Anonymous Billings Protocol
Several protocols propose the anonymization of meter
readings and the aggregation of meter readings of a group of
users to protect user privacy [5, 7]. The NIST privacy
subgroup [15] suggests anonymizing traces of readings, as
proposed by author at [9], but also warns of the ease of re-
identification. These proposals, however, do not explain how
the service provider, after receiving anonymized or
aggregated meter readings, can bill users.
4.1 Access Control
We briefly review our work on access control protocols.
Both protocols provide users with anonymity. Additionally,
the first protocol, based on oblivious transfer, allows the
implementation of anonymous and private purchases
simultaneously, as in [18].
Access control based on anonymous credentials allows
users to prove to a service provider in a privacy-friendly
manner that they possess the credentials required to access a
resource. To achieve perfect privacy, the information that
service providers can learn from the access control protocol
should in principle be just one bit, which indicates whether a
user should be granted access. However, existing anonymous
credential schemes reveal additional information to the service
provider such as the identity of the credential issuer, the
credential type, and constraints on the attributes of the
credential that reveal more than the access decision itself. In
addition, the efficiency of selective attribute disclosure is not
optimal incidental, accidental or deliberate leakages of
information resulting from disclosing the final bill. We show
that by adding some, in the long run small, amount of noise it
is possible to offer strong privacy guarantees on what an
adversary can infer from the final bill. We use new techniques
for differential privacy that could be more widely applicable.
Second, we attempt to minimize the cost of privacy through a
cryptographic oblivious billing mechanism. The true cost of
service provision is tracked across billing periods, but not
revealed to the service provider, which can only verify the
deposited funds cover costs.
This allows customers to determine the levels of privacy
they require and even get a rebate for the additional funds they
used to protect their privacy.
5 Conclusions
We have explained why privacy is necessary and why it
should be protected. We have also shown that currently
deployed e-commerce and consumption billing protocols do
not protect user privacy. We have focused on protocols that
allow users to buy digital goods and to pay their utility
consumption bills without disclosing to the service provider
the items that they buy or the consumption measurements. We
have also survey some tips about protocols that provide users
with anonymity.
Some approaches can be combined into a single protocol
that provides private and anonymous purchases
simultaneously. Additionally, we have described how to
provide those protocols with fairness and copyright protection.
6 References
[1] Alfredo Rial, Privacy-Preserving E-Commerce Protocols, Phd
Thesis, 2013.
[2] A.L. Allen. Uneasy access: Privacy for women in a free society.
Rowman & Littlefield Pub Incorporated, 1988.
[3] Ross Anderson and Shailendra Fuloria. On the security
economics of electricity metering. In The Ninth Workshop on the
Economics of Information Security, 2010.
[4] Benny Applebaum, Yuval Ishai, and Eyal Kushilevitz. From
secrecy to soundness: Efficient verification via secure computation.
In Samson Abramsky, Cyril Gavoille, Claude Kirchner, Friedhelm
Meyer auf der Heide, and Paul G. Spirakis, editors, ICALP (1),
volume 6198 of Lecture Notes in Computer Science, pages 152–163.
Springer, 2010.
[5] N. Asokan, Victor Shoup, and Michael Waidner. Optimistic fair
exchange of digital signatures (extended abstract). In EUROCRYPT,
pages 591–606, 1998.
[6] Man Ho Au, Willy Susilo, and Yi Mu. Constant-size dynamic k-
taa. In Roberto De Prisco and Moti Yung, editors, SCN, volume
4116 of Lecture Notes in Computer Science, pages 111–125.
Springer, 2006.
[7] Gildas Avoine and Serge Vaudenay. Optimistic fair exchange
based on publicly verifiable secret sharing. In Huaxiong Wang, Josef
Pieprzyk, and Vijay Varadharajan, editors, ACISP, volume 3108 of
Lecture Notes in Computer Science, pages 74–85. Springer, 2004.
[8] Josep Balasch, Bart Preneel, Alfredo Rial, Marijn Scheir, and
Ingrid Verbauwhede. Anonymous E-Cash for Resource Constrained
Devices. Cosic internal report, 2012.
Int'l Conf. e-Learning, e-Bus., EIS, and e-Gov. | EEE'13 | 313

[9] Josep Balasch, Alfredo Rial, Carmela Troncoso, Bart Preneel,
Ingrid Verbauwhede, Christophe Geuens, KU Leuven, and Sint-
Michielsstraat ICRI. Pretp: Privacy-preserving electronic toll pricing.
In Usenix Security, volume 10, 2010.
[10] Feng Bao, Robert H. Deng, and Wenbo Mao. Efficient and
practical fair exchange protocols with off-line ttp. In IEEE
Symposium on Security and Privacy, pages 77–85. IEEE Computer
Society, 1998.
[11] Mauro Barni and Franco Bartolini. Watermarking Systems
Engineering: Enabling Digital Assets Security and Other
Applications. CRC Press, 1 edition, February 2004.
[12] Leonard E. Baum and Ted Petrie. Statistical Inference for
Probabilistic Functions of Finite State Markov Chains. The Annals
of Mathematical Statistics, 37(6):1554–1563, 1966.
[13] M. Belenkiy, M. Chase, M. Kohlweiss, and A. Lysyanskaya. P-
signatures and noninteractive anonymous credentials. In R. Canetti,
editor, TCC, volume 4948 of Lecture Notes in Computer Science,
pages 356–374. Springer, 2008.
[14] Mira Belenkiy, Melissa Chase, Markulf Kohlweiss, and Anna
Lysyanskaya.Compact e-cash and simulatable vrfs revisited.
Cryptology ePrint Archive, Report 2009/107, 2009.
http://eprint.iacr.org/.
[15] Mihir Bellare and Oded Goldreich. On defining proofs of
knowledge. In Ernest F. Brickell, editor, CRYPTO ’92, volume 740,
pages 390–420. Springer-Verlag, 1992.
[16] Mihir Bellare and Phillip Rogaway. Random oracles are
practical: A paradigm for designing efficient protocols. In First ACM
Conference on Computer and Communication Security, pages 62–
73. Association for Computing Machinery, 1993.
[17] Siavosh Benabbas, Rosario Gennaro, and Yevgeniy Vahlis.
Verifiable delegation of computation over large datasets. Cryptology
ePrint Archive, Report 2011/132, 2011. http://eprint.iacr.org/.
[18] Paola Benassi. Truste: an online privacy seal program.
Communications of the ACM, 42(2):56–59, 1999.
[19] Oliver Berthold, Hannes Federrath, and Marit Köhntopp.
Project ―anonymity and unobservability in the internet‖. In CFP
’00: Proceedings of the tenth conference on Computers, freedom and
privacy, pages 57–65, New York, NY, USA, 2000. ACM.
[20] Ian F. Blake and Vladimir Kolesnikov. Strong conditional
oblivious transfer and computing on intervals. In In Advances in
Cryptology -ASIACRYPT 2004, pages 515–529. Springer, 2004.
[21] Dan Boneh, Craig Gentry, Ben Lynn, and Hovav Shacham.
Aggregate and verifiably encrypted signatures from bilinear maps. In
Eli Biham, editor, EUROCRYPT, volume 2656 of Lecture Notes in
Computer Science, pages 416–432. Springer, 2003.
[22] R.H. Bork. The tempting of America: the political seduction of
the law. Free Press, 1990.
[23] X. Boyen and B. Waters. Full-domain subgroup hiding and
constant-size group signatures. In T. Okamoto and X. Wang, editors,
Public Key Cryptography, volume 4450 of Lecture Notes in
Computer Science, pages 1–15. Springer, 2007.
[24] Stefan Brands. Untraceable off-line cash in wallets with
observers (extended abstract). In Douglas R. Stinson, editor,
CRYPTO, volume 773 of Lecture Notes in Computer Science, pages
302–318. Springer, 1993.
[25] Stefan Brands. Rapid demonstration of linear relations
connected by boolean operators. In Walter Fumy, editor, Advances
in Cryptology —EUROCRYPT ’97, volume 1233 of LNCS, pages
318–333. Springer Verlag, 1997.
[26] Alex Braunstein, Laura Granka, and Jessica Staddon. Indirect
content privacy surveys: measuring privacy without asking about it.
In Proceedings of the Seventh Symposium on Usable Privacy and
Security, page 15. ACM, 2011.
[27] Leo Breiman. Random forests. Machine Learning, 45(1):5–32,
2001.
[28] J. Camenisch and M. Stadler. Efficient group signature schemes
for large groups. In Burt Kaliski, editor, CRYPTO ’97, volume 1296
of LNCS, pages 410–424. Springer Verlag, 1997.
[29] Jan Camenisch. Group Signature Schemes and Payment
Systems Based on the Discrete Logarithm Problem. PhD thesis, ETH
Zürich, 1998.
[30] Jan Camenisch, Rafik Chaabouni, and Abhi Shelat. Efficient
protocols for set membership and range proofs. In Josef Pieprzyk,
editor, ASIACRYPT, volume 5350 of Lecture Notes in Computer
Science, pages 234–252. Springer, 2008.
[31] Jan Camenisch, Maria Dubovitskaya, and Gregory Neven.
Oblivious transfer with access control. In Ehab Al-Shaer, Somesh
Jha, and Angelos D. Keromytis, editors, ACM Conference on
Computer and Communications Security, pages 131–140. ACM,
2009.
[32] Jan Camenisch, Maria Dubovitskaya, and Gregory Neven.
Unlinkable priced oblivious transfer with rechargeable wallets. In
Radu Sion, editor, Financial Cryptography and Data Security,
volume 6052 of Lecture Notes in Computer Science, pages 66–81.
Springer Berlin Heidelberg, 2010.
[33] William Aiello, Yuval Ishai, and Omer Reingold. Priced
oblivious transfer: How to sell digital goods. In Pfitzmann [103],
pages 119–135.
[34] Alfredo Rial and G. Danezis, Privacy-Preserving Smart
Metering, WPES 2011.
[35] Alfredo Rial and G. Danezis, Privacy-Preserving Smart
Metering. In Information Security Solutions Europe, 2012,
Brussels, Belgium.
314 Int'l Conf. e-Learning, e-Bus., EIS, and e-Gov. | EEE'13 |
Course Management Systems:
Basic Improvements To Course Management Systems Through Modern Design Techniques
Jeff Brandon, Mark Beilfuss, Cameron Henige, Rolando Casipit, Kyle Head, Tom Lagona,
Rodger Lee
Department of Computer Science, Central Michigan University, Mount Pleasant, Michigan, U.S.A
Abstract
Schools rely heavily on web technologies such as
Blackboard to improve the learning experience of students.
Blackboard exists as a tool for instructors to publish
information and give students easy access to it. One of the
most important features of Blackboard is giving instructors
the ability to assign quizzes to students to complete over the
Internet. Unfortunately there are some obvious flaws with
translating a traditionally paper-based activity to the web
which can lead to teaching professionals preferring paper
examinations over entirely digital assignments and
activities. Web based assignments can also facilitate and
environment that allows students to cheat by looking up
answers available online, some question types simply aren’t
easy to represent with existing web technologies, and the
current systems can be difficult to navigate due to lack of a
consistent layout across classrooms. Because of these issues
many instructors are wary of investing in a technology that
has the potential to have a positive impact on student
experience and the environment. We see these problems
which cause a reluctance to adopt these systems into
classrooms and teaching curriculum as a stumbling block
that can be overcome. Taking into account user feedback
and an analysis of known shortcomings with the current
systems we have formulated and designed a system that
attempts to rectify these problems. We have integrated
various methods such as dynamically generated questions
and cheat detection into our solution to make it more
appealing to those in the education industry. Our results
show that many of the concerns raised by instructors can
indeed be solved with the creative application of web
technologies. We have also found that there are some issues
such as access and uptime, which in general can’t be solved
completely without elaborate and expensive processes.
1. Introduction
A course management system shouldn’t be about
how feature rich the environment is. There should be a focus
on how accessible the features are because student
engagement is increased when the instructor uses a CMS to
promote self-discovery of course material.[1] This self-
discovery of material greatly increases knowledge retention
opposed to other methods of teaching such as lecturing. A
grade book system and a system for creating tests would be
the pillars of said system for teachers. These two systems
should be able to interact, with one another seamlessly. The
quiz system should allow an instructor the ability to create
an array of questions with types such as text response,
multiple choice, matching, and more to reflect the style of
question he or she would ask on a pencil and paper style
exam. Not only should the application for quiz making be
robust, but easy and intuitive to use. The simpler the
application is to understand and operate, the more an end
user will return to use the system again in the future.
Through various on campus interviews we have found that
teachers and students said that their main problem with
systems like Blackboard was that it was not easy to use. The
grade book systems did not provide enough relevant data to
keeping track of grades and quizzes limited educators in the
questions they could ask by only allowing a small set of
question types.
In this paper we will discuss how our web-based
grading and quiz systems, key components in any course
management system, are an improvement over current
products such as the Blackboard system. With a focus on
user experience our application will be able to provide a
better end result while still efficiently accomplishing its
stated purpose. Throughout development we will be using
various design techniques and testing solutions that will be
expanded on in sections three and four including the basics
of our system. For now the course management system will
consist of only a grade book and a quiz creation system. We
believe that through a more intuitive user interface, teaching
Int'l Conf. e-Learning, e-Bus., EIS, and e-Gov. | EEE'13 | 315
aids such as Blackboard can be used more effectively in
higher education, both by teachers and students.
In section two we will go into more detail about
how the grading and quiz applications function. In addition
to a more detailed description of the product we will discuss
other web-based software solutions, such as Blackboard, and
define what a course management system is. We will review
user testimony of the two products which we used as a
guideline for our current software solution. Finally a brief
discussion of our approach will be given before a more
thorough explanation in the later sections is laid out.
2. Background and Related Works
First we must define what we mean when we talk
about a web based educational system. A course
management suite, or CMS as it will be referred to
throughout the rest of this document, is a fundamental part
of web based education. A CMS consists of tools to view
and manage grades for the educator to use. It also provides a
window into the students personal grades for the student and
it should be a place where online assignments may be
completed with relative ease and without limitations. This
system is available online and has three general user types:
instructors, students, and admins.
The CMS should also be thought of as an extension
of the classroom where learning can occur rather than a
means to submit homework. The learning that takes place in
a CMS is called Web-Based Learning. Badrul H. Khan is the
author of the book Web-Based Instruction, in which he
states, ”A [Web Based Instruction] learning environment
should include many resources, support collaboration,
implement web based activities as part of the learning
framework, and support both novices and experts”.[2] Based
on this one of our main goals within this project is to design
a user interface that is both easy to learn but does not slow
down the more adept user. A web based instruction or WBI
should also allow for courses to be taught entirely online or
be used as a supplement to a traditional classroom setting.
An immediate benefit of WBI is the paper saved by
proctoring exams and quizzes without using any paper.
Education is still a field where there are plenty of
opportunities for software development; especially for web-
based systems. The most high profile types of web systems
are course management systems and include educational
management systems like Blackboard, WebCT, and
LearningSpace among others. These programs provide a
wide array of services meant for both educators and students
alike. Even though they have functionality ranging from
grade books to quiz systems, there is still room for
improvement in the ways they are implemented and how
they are accessed within the management system itself.
Although course management systems offer a wide range of
tools, faculty primarily use the “static” tools for storing
syllabi and class materials, making announcements, and
handling administrative tasks [3]. Since these programs have
become so ingrained in the education experience, why do
most users find the experience of using them for quizzes so
undesirable? We want to know so that a better system for
web learning can be designed and implemented to improve
the learning of students and the educational abilities of
teachers at all levels of education with a web based exam
and grade system that is intuitive and pleasurable to use.
Historically, course management systems are rigid,
clunky, programs that take months of training to use to their
full potential because all of the features offered are either
hard to navigate to or find. On the tools entry for Blackboard
there are over 15 different options to choose from including:
a grade book, announcements, a discussion board, a glossary
of terms, and many more items used less frequently. While
all of these are helpful features or provide useful information
it is overwhelming for the typical user who only needs to
access one feature at any given time. A professor at the
University of Wisconsin River Falls stated “I started using
the CMS so I could have online quizzing capability. I have
been disappointed with its limited functionality and
inflexibility.”[3] This resentment for the online quiz system
is something that can be avoided with some improvements.
The quiz systems implemented by most course management
systems are typically limited to asking certain types of
questions that may not be appropriate for all courses. In the
case of mathematics it is incredibly difficult to ask a quiz
question that allows for showing the steps a student took to
reach their answer. This can be very relevant to offering
partial credit when a student answers incorrectly but did the
majority of the given task correctly. To take Blackboard for
an example, it only allows a single correct answer to their
quiz questions and many educators like to implement
questions that ask the student to mark several correct
answers from a list of a few options. By adding these
features to the quiz system we hope to make user generated
quizzes more commonplace in the class room without
sacrificing the freedoms associated with the pencil and paper
style examination.
One of the nicest features of a course management
system is the interoperability between the different features.
A student can take a quiz on Blackboard, and once they are
finished they would be able to check their scores instantly; a
teacher requires assuming no further grading. This instant
feedback allows the student to review material, and compare
their scores with the class average while seeing exactly what
they might not understand fully and need to work on; thus
driving better focus in the course. This also is an important
reason the quiz system should be incorporated into the rest
of a CMS so that grades can be immediately recorded
without additional human transcribing. Blackboard also
gives students and teachers access to supplemental materials
that would be difficult to access otherwise. On the Central
Michigan University web page about why to use Blackboard
one of the reasons listed is that “a growing number of
textbook publishers are making materials and test item pools
316 Int'l Conf. e-Learning, e-Bus., EIS, and e-Gov. | EEE'13 |
available for use in Bb.”[3] This means students have more
access to the materials they need to succeed along with other
course materials their professors may have uploaded to the
course page. This ever increasing amount of available
information helps make it easier than ever to provide a
valuable CMS to educators and students eager to save time
and effort using a well-designed system.
3. Application Techniques
The implementation of our project was done in a
software engineering environment. First our idea for our
quiz and grade system was solidified. After this we began to
design models for how the data will be displayed and
accessed to various user types which were also designed in
this phase. When we had a fair understanding of how we
wanted to store and display our data we began to design our
user interface, the database and the tables it would contain,
and decided on which tools we were going to use to
accomplish this. Once this was agreed upon and planned, we
were ready to begin our implementation of a web based quiz
system that was both easy to use and understand.
Our implementation of a course management
system runs on the .net framework, and will be hosted on
Microsoft Server. It uses server-side scripting to retrieve and
format the data, as well as client-side scripting to display the
formatting. The interface of the application will have a
common theme that will be established on the homepage of
the application; a simple and user-friendly system for use in
the classroom. This will provide the user with a sense of
familiarity with the system almost instantly because access
to each feature is readily available from the landing page via
an easy to interpret panel system. The panel system makes
used of meaningful images with labels to make navigation as
streamlined as possible. The interface will use only
components that are necessary to the pages functioning to
avoid cluttering the “real estate” available to the page. The
pages will have dynamically generated content depending on
the task that needs to be accomplished. This task will take
into account a number of factors starting with the user type,
then considering the courses the user is a member of, and
finally the specific quiz or exam the user wishes to observe.
The webpage will be displayed using the HTML format, and
it will be stylized with CSS. The questions and grades are
stored in a database and are retrieved using SQL based on
the user and the courses they are currently enrolled in. When
a student attempts to access either part of the system, the
server will create the page using C#, and user will be
directed to the student page. This will have options to either
view grades or take a quiz or test if any of their course
instructors have assigned them. When a teacher attempts to
access either part of the system, they will be directed to the
teacher page. This page will have options to edit grades in
the case of an error, or create a quiz or test assignment.
When an admin accesses either part of the system, they will
be directed to the admin page. This will be more oriented
towards viewing the database information rather than a
“form” style page. They will be able to edit anything they
need to weather it is question modification or score
updating, the admin will be able to correct any errors
experienced by teachers and students. All types of users will
be required to log in before information will be presented to
them. This is a standard security procedure and is very
important because student specific score information is
sensitive and should not be made available to the public
domain without the express consent of the student. Therefore
these login settings are necessary and achieve the desired
level of security without adding too much hassle for each
end user. The authentication is done through Active
Directory. There will also be a FAQ section to provide help
for any issues that may arise. It will answer questions as well
as show a step-by-step guide through the entire process of
creating a quiz or taking one.
Quizzes will be created in a very basic way, to
begin creating a quiz all that is required from the user is a
name for the quiz and a course for which the quiz is
designed. With this, a quiz is inserted into the database
where it is assigned a unique identifier that will be used to
retrieve the information about that quiz. After the quiz is
created the user can add questions to the quiz one at a time
by first selecting a question type and then entering the user
prompt for the question. From here it will be necessary to
add any other information required by the question, for
instance, a multiple choice question would require the user
to enter in at least two choices for the quiz taker to choose
from. There is no limit to how many options may be added
but there must at least be two. During this phase the quiz
creator is also asked to mark the correct answer(s) to the
given question so that automatic grading can occur when
students finish their quiz or exam. One other important
aspect to question creation is that the user can specify a point
value to each question as they create it to provide weight to
questions that matter more to the students fundamental
understanding of the topic at hand. A default value of ten
points per question is set to begin with otherwise. After all
questions are added, the total point value for the quiz is
determined and displayed accordingly. Admin and educator
users can also view a sample quiz to make sure that the
information that they desired to convey is displayed
properly. If any mistakes should occur, they can be edited
and fixed with ease. After the quiz is successfully completed
the educator can set a date for the quiz to be due by, and also
a date that determines when the assignment should become
visible to the students enrolled in the course for which the
assignment was designed. This concludes our basic
implementations of quiz creation, initialization, and storage
for our projects CMS.
Int'l Conf. e-Learning, e-Bus., EIS, and e-Gov. | EEE'13 | 317
4. Empirical Studies
After speaking with professors that use Blackboard
at Central Michigan University and reviewing the opinions
expressed by Glenda Morgan in her study, we have
determined a few features that should make our system a
better experience for users with a teaching background. One
of our key goals for the system is that it will not experience
visible downtime. This was one of the biggest issues that we
have found with Blackboard. The fact that Blackboard is
such an important system means that it should not be offline
ever, and if it is, should be down for as short a time period as
possible. Each time a server goes down, it will result in
inaccessible assignment pages, and the chance increases that
a student will not be able to complete an assignment before
the scheduled due date. This can create issues for teachers as
well when students ask for extensions on assignments
because they couldn’t complete them at due to the
unexpected down time they could not plan for. This hassle is
one aspect of online education management systems we
hope we can bypass to make the web education experience
more smooth and enjoyable for all parties involved. In
higher education students are working on assignments at all
hours of the day and will need to access a course
management system like Blackboard at a moments notice.
We will use high quality equipment to ensure that there are
minimal outages, and take advantage of modern technology
to achieve a high level of service. This will be one of the
most difficult aspects to perfect because there are several
variables we cannot control that could lead to server
downtime but we hope to mitigate these chances by
allocating resources mindfully and otherwise managing our
resources well.
We have also found that students have taken issue
when a quiz or test becomes interrupted; the student is
locked out and cannot complete the test due to connectivity
problems on the server side of operations. This can be very
frustrating to students because it is as if their time limit on
the exam is unexpectedly cut short when they become
locked out due to connection failure. Since quizzes are
typically already open internet, we will be more lax with the
security of the student, meaning that if their connection gets
interrupted, we can just let them continue where they left
off, rather than going through the hassle of proving that the
network failed. Teachers have also had issues in the past
with the limitations of the types of questions they can
include in a quiz or test. Our system allows for a wide
variety of question types. We will allow for multiple choice,
short answer, images, and even videos. Using these forms of
media will provide a much better system than the one
currently in place because it provides greater flexibility to
educators enabling them to ask types of questions impossible
to provide in paper, like a video prompt.
Teachers will also need to have a very straight-
forward grade input system to make their lives easy. It needs
to have every student on the same page, and should not
require the teacher to “load” a page in order to change the
grades of a different student. Current systems only view the
grades of one student at a time and we hope our multi-
student view system can make entering grades much faster
for teachers and professors who will use our system. We
believe that making the grading system easy for teachers is
an important step in designing a successful CMS because
without accurate grade information, the statistics that we
wish to display will not be accurate. By making the grade
entering process simple and quick we foster a web
environment that will be able to display useful information
to teachers and students alike so long as the important data
entry is completed. These statistics are an important form of
feedback for both teachers and students. Teachers can see
class averages over time and for specific assignments with a
few button clicks. Students can track their progress in the
course throughout the semester and easily calculate what
grades they may need on future assignments so that they can
earn their desired course grade. We hope that this system can
help end the lack of information that leads to students
guessing at their current class standings at the end of
semesters. We also wish to display to the student how their
score compares to the class average for specific assignments
or for the course as a whole.
We have also had many complaints about the sharp
edges of Blackboard. Our system will use more streamlined
layouts, and will still convey the school colors for a more
aesthetically pleasing appearance. Our goal will be to
implement asynchronous javascript and xml or Ajax to help
resolve this issue while providing a more dynamic grading
experience. This would also allow for a student viewing
their grades to see their grade entered in real time as the
professor enters it without having to refresh the page.
Another issue students seem to have is with understanding
the completion status of their grades due to a complex
system used by Blackboard. There is also the issue of
granting extra credit to assignments which, in Blackboard, is
not supported well so workarounds are implemented by
educators that leave students with less than accurate results.
This is because each teacher that implements an extra credit
system is not uniform and often does not convey their extra
credit system easily to the student that wants to calculate his
or her grade accurately. Our system will use clear and
concise language to display the status of a grade. We will
also exclude the extra “fluff” implemented by the current
generation of course management systems. There are
currently very vague words being used as well as extra
columns that we do not find necessary. These are
unnecessary and will be left out of the initial grades display
and will be located in an advanced statistics section for
grade viewing. Overall, the system should be very intuitive
even for non tech-savvy people, and should easily be a much
simpler and reliable system than the system currently in
place. In addition to personal grades we want it to be easy
for educators to compare individual scores with the course
average without additional calculations on their behalf. This
way educators and students can accurately gauge
performance on both an individual level and at the class
level. This is important to teachers who want to create a
class average of say seventy percent so they can determine
the curve they want to apply to students grades and for
318 Int'l Conf. e-Learning, e-Bus., EIS, and e-Gov. | EEE'13 |
educators who wish to gauge how well their material is
getting across to their pupils. This self-assessment tool
should help educators refine their methods further into what
methods of teaching work best for specific course material.
Also this growth helps the teachers become better at their
work, and will improve the learning environment both inside
and outside the classroom.
When implementing our design we faced some
limitations. One obstacle we faced was trying to find a
server to host our website. Because we could not find one
for more permanent use, we hosted our pages locally to run a
working prototype of our design. We were successfully able
to add users to our system that could design quizzes
relatively easily just as we had hoped for. We also had
limited availability of the tools we desired to work with in
the class computer lab so when we did host our project, only
a small subset of group members were available to view the
end result and the demos we wished to show had to be pre-
recorded.
5. Other Considerations
Current course management systems are confusing
for the educators who do not have much background in
using technology, specifically web applications. Some
educators are hesitant to use course management systems
because they can have a steep learning curve for them to
create quizzes without having taken training courses or
calling assistance from university technical support. With
our new course management systems quiz creator, the user
interface is easy to use and understand. The quiz creator is
developed to be a simple step by step process that will not
slow down a more advanced user, but will also facilitate
learning the system for the novice user. We want our system
to be easy to learn but we do not want a “hand holding”
process to get in the way of experienced users because if the
creation system itself slows down the user, it will cause a
reluctance to return to the program after the required skills to
create assignments have been acquired.
The system is very intuitive even for new users of
the system because it is designed with non-tech savvy people
in mind by hiding the unnecessary materials in the quiz
creator and exam pages. This way the average user has the
basic commands and features laid out before them without
the clutter and confusion of the current generation of course
management systems. Buttons are clearly labeled so the user
can go directly to where they want to go and use the added
functions, as the user deems necessary. This made the
system simple to navigate and user-friendly without
sacrificing too much in terms of functionality. Aside from
simplicity, the new course management system saves time
over the existing Blackboard system by utilizing features
that are easy to operate, automatically saving changes made
to quizzes (i.e. answering questions, creating questions, etc.)
and the grade book periodically, and by being optimized for
use in todays high speed world. The entire process is fairly
stream lined because it is designed to focus on one step at a
time. This is advantageous for many reasons. It minimizes
end user confusion and maximizes time spent actually
producing new content for quiz or exam assignments. It also
helps the web pages for quiz creation small which speed up
load times. If the system is too slow or unresponsive for too
long it can leave a sour taste in a user’s mouth which may
lead them to shy away from online course management
suites in the future, which is the last thing we want to do.
Online cheating is another one of the problems with
the current course management systems like Blackboard,
where a teacher cannot assure the integrity of test result.
This problem is addressed with the new Course management
system. Once the quiz or exam is started, the browser is
locked with the test questionnaire and the examinee cannot
open tabs other than those that are part of the current exam.
This system will prevent students to search answers from
online sources, thus online cheating is avoided without the
need of third party applications. There are other methods of
cheating that students could potentially perpetrate that are
beyond the control of this system, but they are the same
methods that could be used to cheat on a traditional pencil
and paper examination that educators know to look for
already so this we view as a non issue.
6. Conclusion
The problem with present Blackboard like course
management system quiz implementations is that users can
create quizzes and examinations, but they are limited to a
specific format that yields undesirable examinations.
Because of this, not every department at an educational
institution can benefit fully from the system. Questions that
are shoehorned into said format can also lead to confusion
among students, thus leading to more time spent making
corrections. Based on interviews from various teachers,
some seldom use the Blackboard system because they are
not comfortable to use it, while others do not use Blackboard
to conduct examination because of its lack of functions that
they need.
The process of implementing our system has been a
valuable software engineering experience for everyone
involved. It provided us with valuable insights into what a
project feels like to work on within the phases of a
development cycle. We look forward to being able to apply
this information in the future on other software engineering
and development projects. By carrying out this
implementation of a quiz system we believe that we are all
stronger developers than before we designed our project. A
CMS was a fitting project for us because we had experience
working with them as students in the past and our group
experience featured knowledge of developing web pages.
We also experienced time limitations at the end of the
Int'l Conf. e-Learning, e-Bus., EIS, and e-Gov. | EEE'13 | 319
semester that resulted in product that could benefit from the
addition of a few features we did not have time to fully
implement.
By using our modern course management system,
Teachers are able to create quizzes, assignments, and exams
with broader functions that are not available with present
course management systems, such as mathematical equation
symbols and the ability to upload multimedia directly into
questions. The system also handles the various interruptions
that can happen during an exam letting the users start from
where they left off by using auto save features. These
features save users a plethora of time that may have
otherwise been spent ironing out problems with connectivity
or reentering answers that were not saved. Students can view
their grade right after the examination as well as view scores
with the class average, after any weighting, as well as any
other operations that may be applied to a student’s grade,
provided that the assignment was in a format that lends itself
to automated grading like multiple choice exams or
matching questions. Even if the entire exam is not made up
of these types of questions, a grade for the portion of the
assignment that was made up of them can be calculated and
returned to the user at the time of exam completion. This
means that any exam that uses a combination of question
styles that can automatically be graded with question styles
that do require grading will be inherently faster to grade for
teachers. The questions left to grade will be the more
difficult styles to grade like short answer, and essay
questions, but that is to be expected. Even by just grading
the simpler question styles, the time spent by educators
grading should be reduced by a factor proportional to the
number of easy to grade questions they place on their
examinations.
The result of using a cleaner, simpler system is
clear. A user-friendly interface, easy to use, anxiety free for
students, will increase the students and teachers interest in
using the system. The integrity of the course is maintained
via a competent security system and the current problems of
the users are addressed accordingly. Through further
revisions of our system, we will continue to design a product
that is not focused on having a feature for every occasion,
but making the course management system a fully integrated
piece of the modern classroom.
References
1. Carmean, C., & Haefner, J. (2002). Mind over matter:
Transforming course management systems into effective
learning environments. EDUCAUSE Review, 37(6), 26-34.
Retrieved from
http://net.educause.edu/ir/library/pdf/erm0261.pdf
2. Kahn, Badrul H, (1997). Web-Based Instruction.
Educational Technology Publications Inc., Eaglewood Cliffs
New Jersey.
3. Morgan, G. (2003). Faculty use of course management
systems. (Vol. 2). Boulder, Colorado: EDUCAUSE.
Retrieved from
http://net.educause.edu/ir/library/pdf/ers0302/rs/ers0302w.p
df
4. Why use Blackboard?. (n.d.). Retrieved from
http://www.cmich.edu/academics/off_campus_online/Bb_C
MU/Pages/Why_use_Blackboard.aspx
320 Int'l Conf. e-Learning, e-Bus., EIS, and e-Gov. | EEE'13 |
Content Development for Distance Education in AdvancedUniversity Mathematics Using Mizar
Takaya IDO1, Hiroyuki OKAZAKI 1, Hiroshi YAMAZAKI 1, Pauline Naomi KAWAMOTO 1,Katsumi WASAKI 1, and Yasunari SHIDAMA 1
1Shinshu University, 4-17-1 Wakasato Nagano-city, Nagano 380-8553, Japan
Abstract— The Mizar project focuses on the formalizationof mathematical theorems and their proofs using a formaldescriptive language. It is an international joint projectconcerning the construction of a library system that willmake automatic verification possible by a computer. Thepurpose of this study is to develops contents for distanceeducation programs in advanced university mathematicsusing Mizar, and here we report on the current situationof this study.
Keywords: Formal Verification, Mizar, Euclidean Algorithm
1. IntroductionWhen teaching mathematical content to students who have
varying levels of knowledge and understanding, making thematerial perfectly understandable without lapses in logiccan be exceedingly difficult. This is not simply limited tothe topic of logic algorithms covered in the present study.Even if an extensive textbook were to be used, a studentwould still need to make an effort to “read between thelines," and a teacher would need to teach in accordancewith the student’s level of understanding. In addition, toconfirm and consolidate that understanding, in all likelihood,it would also be necessary for the students solve somepart2.1 of a proof problem and completely describe thelogical steps taken. Is it truly possible for teachers to explainthe material in the text to each student individually, correctand edit solutions submitted by all students, and followup according to instructions until the student’s answers arecomplete? As a solution to these issues, we have beenresearching and developing a system of teaching materialsthat uses the formal mathematical descriptive language of theMizar processing system to support teachers.[1]1 Mizar isan international joint project in which current work includesusing formal mathematical descriptive language to provideformal descriptions of present mathematical theorems andtheir proofs, thereby forming a system of automatic checkingvia a computer and creating a library.[2] The authors areparticipants in this project, and the system of teachingmaterials introduced in this study is being developed usingthe achievements of Mizar as a resource. We developedthe formalized library on the Euclidean algorithm;[3] it is
1copyright©2012 IEICE
also recorded in the Mizar Project Library and is publicallyavailable at
http://mizar.uwb.edu.pl/version /current/html/ntalgo_1.html
These libraries store complete documentation of every singleresult and proof and link all necessary theorems to themathematical system of axioms from which they are derived.They are presented as self-complete libraries that use formalmathematical descriptive language and have no need foroutside referencing. Upon clicking the “proof" button on thewebpage, every line of the proof is displayed. Furthermore,links for the definitions of all theorems and terminologyused in each library are included, so that by continuallylinking back to definitions, one can return back to the axiomsystem of set theory. The Mizar system is based on Tarski-Grothendieck (TG) set theory and first-order predicate logic.Using a formal descriptive language based on this, Mizardocuments formal proofs of theorems and automaticallydetects mistakes in a proof by using a processing systemknown as the Mizar Proof Checker. Our current researchaims to set up a system of teaching materials that willintegrate both the libraries and proof checker with a general-use CMS system.(CMS system + Mizar)[4][5][6] A groupof students used this system. We present the data and discussthe lessons learned.
2. MANUSCRIPT PREPARATIONIn the process of developing the teaching materi-
als, it is necessary to have a text where all con-tents of the teaching materials are formally described,their validity is expressed as mathematical propositions,and descriptions of complete proofs are provided. Thefull formal developed in this study are available athttp://mizar.uwb.edu.pl/version/current/html/ntalgo_1.html .Because of presentational constraints, from this point on,please refer to the above URL for details whenever “ref-erence webpage" is mentioned. As mentioned in the In-troduction, when clicking on the “proof" button on thewebpage, one can read the complete proof. Furthermore,links are included for all terminology and current theoremsused in the library. In this section, we provide an overviewof how this works.[7][8] The Euclidean algorithm is a well-known algorithm where, given two arbitrary integers a and
Int'l Conf. e-Learning, e-Bus., EIS, and e-Gov. | EEE'13 | 321
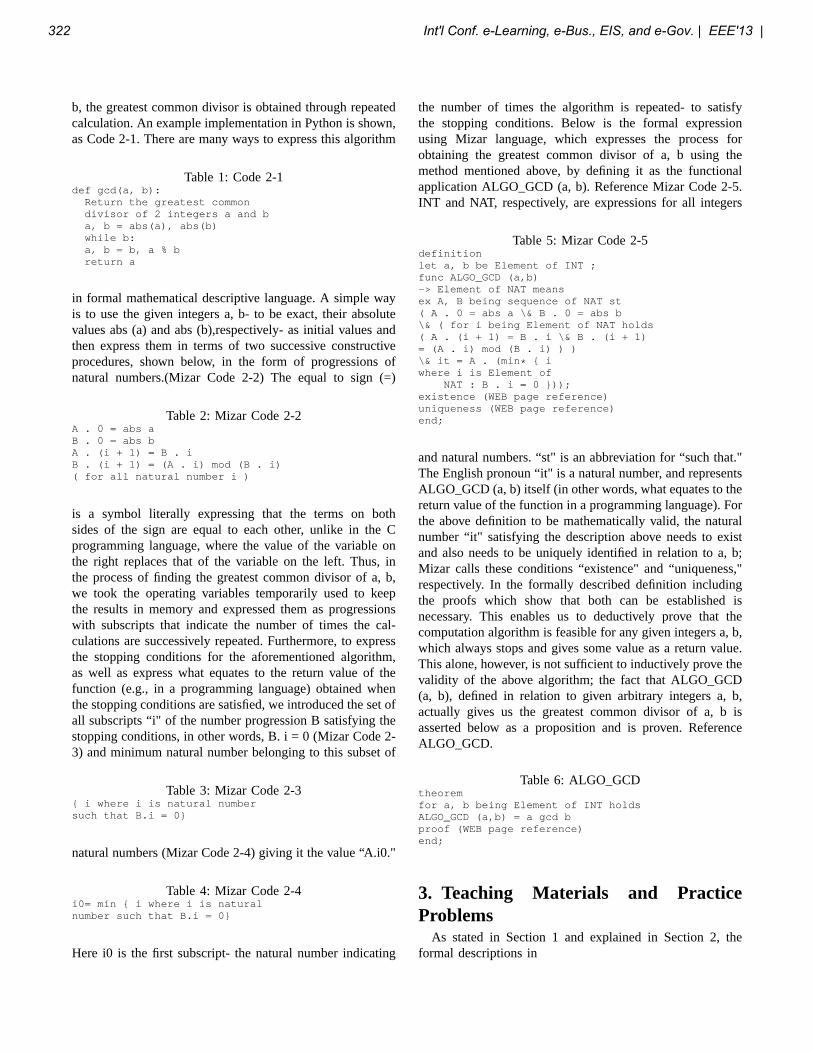
b, the greatest common divisor is obtained through repeatedcalculation. An example implementation in Python is shown,as Code 2-1. There are many ways to express this algorithm
Table 1: Code 2-1def gcd(a, b):
Return the greatest commondivisor of 2 integers a and ba, b = abs(a), abs(b)while b:a, b = b, a % breturn a
in formal mathematical descriptive language. A simple wayis to use the given integers a, b- to be exact, their absolutevalues abs (a) and abs (b),respectively- as initial values andthen express them in terms of two successive constructiveprocedures, shown below, in the form of progressions ofnatural numbers.(Mizar Code 2-2) The equal to sign (=)
Table 2: Mizar Code 2-2A . 0 = abs aB . 0 = abs bA . (i + 1) = B . iB . (i + 1) = (A . i) mod (B . i)( for all natural number i )
is a symbol literally expressing that the terms on bothsides of the sign are equal to each other, unlike in the Cprogramming language, where the value of the variable onthe right replaces that of the variable on the left. Thus, inthe process of finding the greatest common divisor of a, b,we took the operating variables temporarily used to keepthe results in memory and expressed them as progressionswith subscripts that indicate the number of times the cal-culations are successively repeated. Furthermore, to expressthe stopping conditions for the aforementioned algorithm,as well as express what equates to the return value of thefunction (e.g., in a programming language) obtained whenthe stopping conditions are satisfied, we introduced the set ofall subscripts “i" of the number progression B satisfying thestopping conditions, in other words, B. i = 0 (Mizar Code 2-3) and minimum natural number belonging to this subset of
Table 3: Mizar Code 2-3{ i where i is natural numbersuch that B.i = 0}
natural numbers (Mizar Code 2-4) giving it the value “A.i0."
Table 4: Mizar Code 2-4i0= min { i where i is naturalnumber such that B.i = 0}
Here i0 is the first subscript- the natural number indicating
the number of times the algorithm is repeated- to satisfythe stopping conditions. Below is the formal expressionusing Mizar language, which expresses the process forobtaining the greatest common divisor of a, b using themethod mentioned above, by defining it as the functionalapplication ALGO_GCD (a, b). Reference Mizar Code 2-5.INT and NAT, respectively, are expressions for all integers
Table 5: Mizar Code 2-5definitionlet a, b be Element of INT ;func ALGO_GCD (a,b)-> Element of NAT meansex A, B being sequence of NAT st( A . 0 = abs a \& B . 0 = abs b\& ( for i being Element of NAT holds( A . (i + 1) = B . i \& B . (i + 1)= (A . i) mod (B . i) ) )\& it = A . (min * { iwhere i is Element of
NAT : B . i = 0 }));existence (WEB page reference)uniqueness (WEB page reference)end;
and natural numbers. “st" is an abbreviation for “such that."The English pronoun “it" is a natural number, and representsALGO_GCD (a, b) itself (in other words, what equates to thereturn value of the function in a programming language). Forthe above definition to be mathematically valid, the naturalnumber “it" satisfying the description above needs to existand also needs to be uniquely identified in relation to a, b;Mizar calls these conditions “existence" and “uniqueness,"respectively. In the formally described definition includingthe proofs which show that both can be established isnecessary. This enables us to deductively prove that thecomputation algorithm is feasible for any given integers a, b,which always stops and gives some value as a return value.This alone, however, is not sufficient to inductively prove thevalidity of the above algorithm; the fact that ALGO_GCD(a, b), defined in relation to given arbitrary integers a, b,actually gives us the greatest common divisor of a, b isasserted below as a proposition and is proven. ReferenceALGO_GCD.
Table 6: ALGO_GCDtheoremfor a, b being Element of INT holdsALGO_GCD (a,b) = a gcd bproof (WEB page reference)end;
3. Teaching Materials and PracticeProblems
As stated in Section 1 and explained in Section 2, theformal descriptions in
322 Int'l Conf. e-Learning, e-Bus., EIS, and e-Gov. | EEE'13 |
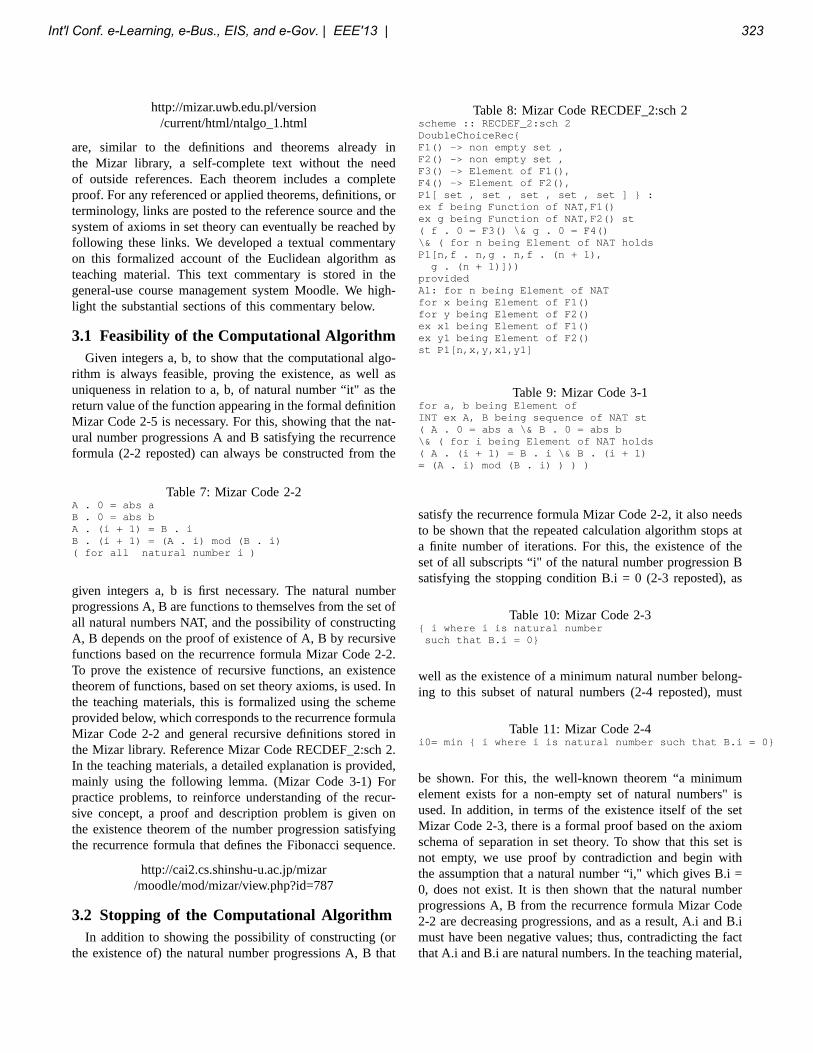
http://mizar.uwb.edu.pl/version/current/html/ntalgo_1.html
are, similar to the definitions and theorems already inthe Mizar library, a self-complete text without the needof outside references. Each theorem includes a completeproof. For any referenced or applied theorems, definitions, orterminology, links are posted to the reference source and thesystem of axioms in set theory can eventually be reached byfollowing these links. We developed a textual commentaryon this formalized account of the Euclidean algorithm asteaching material. This text commentary is stored in thegeneral-use course management system Moodle. We high-light the substantial sections of this commentary below.
3.1 Feasibility of the Computational AlgorithmGiven integers a, b, to show that the computational algo-
rithm is always feasible, proving the existence, as well asuniqueness in relation to a, b, of natural number “it" as thereturn value of the function appearing in the formal definitionMizar Code 2-5 is necessary. For this, showing that the nat-ural number progressions A and B satisfying the recurrenceformula (2-2 reposted) can always be constructed from the
Table 7: Mizar Code 2-2A . 0 = abs aB . 0 = abs bA . (i + 1) = B . iB . (i + 1) = (A . i) mod (B . i)( for all natural number i )
given integers a, b is first necessary. The natural numberprogressions A, B are functions to themselves from the set ofall natural numbers NAT, and the possibility of constructingA, B depends on the proof of existence of A, B by recursivefunctions based on the recurrence formula Mizar Code 2-2.To prove the existence of recursive functions, an existencetheorem of functions, based on set theory axioms, is used. Inthe teaching materials, this is formalized using the schemeprovided below, which corresponds to the recurrence formulaMizar Code 2-2 and general recursive definitions stored inthe Mizar library. Reference Mizar Code RECDEF_2:sch 2.In the teaching materials, a detailed explanation is provided,mainly using the following lemma. (Mizar Code 3-1) Forpractice problems, to reinforce understanding of the recur-sive concept, a proof and description problem is given onthe existence theorem of the number progression satisfyingthe recurrence formula that defines the Fibonacci sequence.
http://cai2.cs.shinshu-u.ac.jp/mizar/moodle/mod/mizar/view.php?id=787
3.2 Stopping of the Computational AlgorithmIn addition to showing the possibility of constructing (or
the existence of) the natural number progressions A, B that
Table 8: Mizar Code RECDEF_2:sch 2scheme :: RECDEF_2:sch 2DoubleChoiceRec{F1() -> non empty set ,F2() -> non empty set ,F3() -> Element of F1(),F4() -> Element of F2(),P1[ set , set , set , set , set ] } :ex f being Function of NAT,F1()ex g being Function of NAT,F2() st( f . 0 = F3() \& g . 0 = F4()\& ( for n being Element of NAT holdsP1[n,f . n,g . n,f . (n + 1),
g . (n + 1)]))providedA1: for n being Element of NATfor x being Element of F1()for y being Element of F2()ex x1 being Element of F1()ex y1 being Element of F2()st P1[n,x,y,x1,y1]
Table 9: Mizar Code 3-1for a, b being Element ofINT ex A, B being sequence of NAT st( A . 0 = abs a \& B . 0 = abs b\& ( for i being Element of NAT holds( A . (i + 1) = B . i \& B . (i + 1)= (A . i) mod (B . i) ) ) )
satisfy the recurrence formula Mizar Code 2-2, it also needsto be shown that the repeated calculation algorithm stops ata finite number of iterations. For this, the existence of theset of all subscripts “i" of the natural number progression Bsatisfying the stopping condition B.i = 0 (2-3 reposted), as
Table 10: Mizar Code 2-3{ i where i is natural number
such that B.i = 0}
well as the existence of a minimum natural number belong-ing to this subset of natural numbers (2-4 reposted), must
Table 11: Mizar Code 2-4i0= min { i where i is natural number such that B.i = 0}
be shown. For this, the well-known theorem “a minimumelement exists for a non-empty set of natural numbers" isused. In addition, in terms of the existence itself of the setMizar Code 2-3, there is a formal proof based on the axiomschema of separation in set theory. To show that this set isnot empty, we use proof by contradiction and begin withthe assumption that a natural number “i," which gives B.i =0, does not exist. It is then shown that the natural numberprogressions A, B from the recurrence formula Mizar Code2-2 are decreasing progressions, and as a result, A.i and B.imust have been negative values; thus, contradicting the factthat A.i and B.i are natural numbers. In the teaching material,
Int'l Conf. e-Learning, e-Bus., EIS, and e-Gov. | EEE'13 | 323
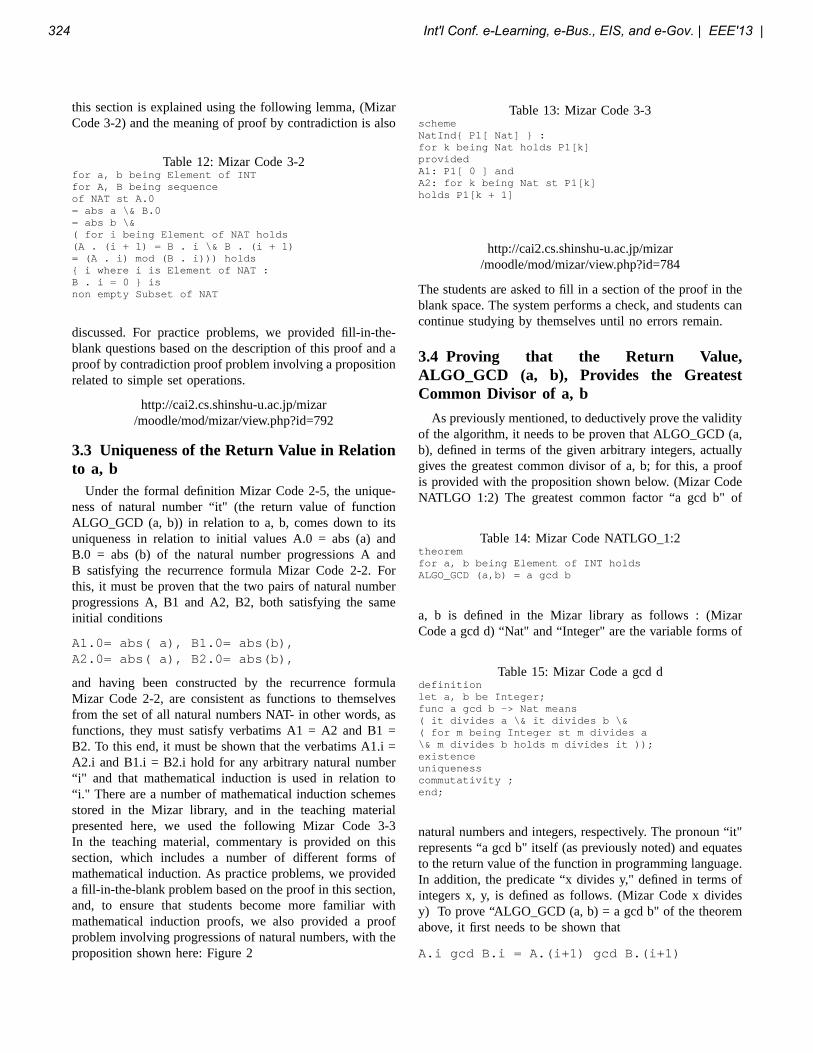
this section is explained using the following lemma, (MizarCode 3-2) and the meaning of proof by contradiction is also
Table 12: Mizar Code 3-2for a, b being Element of INTfor A, B being sequenceof NAT st A.0= abs a \& B.0= abs b \&( for i being Element of NAT holds(A . (i + 1) = B . i \& B . (i + 1)= (A . i) mod (B . i))) holds{ i where i is Element of NAT :B . i = 0 } isnon empty Subset of NAT
discussed. For practice problems, we provided fill-in-the-blank questions based on the description of this proof and aproof by contradiction proof problem involving a propositionrelated to simple set operations.
http://cai2.cs.shinshu-u.ac.jp/mizar/moodle/mod/mizar/view.php?id=792
3.3 Uniqueness of the Return Value in Relationto a, b
Under the formal definition Mizar Code 2-5, the unique-ness of natural number “it" (the return value of functionALGO_GCD (a, b)) in relation to a, b, comes down to itsuniqueness in relation to initial values A.0 = abs (a) andB.0 = abs (b) of the natural number progressions A andB satisfying the recurrence formula Mizar Code 2-2. Forthis, it must be proven that the two pairs of natural numberprogressions A, B1 and A2, B2, both satisfying the sameinitial conditions
A1.0= abs( a), B1.0= abs(b),A2.0= abs( a), B2.0= abs(b),
and having been constructed by the recurrence formulaMizar Code 2-2, are consistent as functions to themselvesfrom the set of all natural numbers NAT- in other words, asfunctions, they must satisfy verbatims A1 = A2 and B1 =B2. To this end, it must be shown that the verbatims A1.i =A2.i and B1.i = B2.i hold for any arbitrary natural number“i" and that mathematical induction is used in relation to“i." There are a number of mathematical induction schemesstored in the Mizar library, and in the teaching materialpresented here, we used the following Mizar Code 3-3In the teaching material, commentary is provided on thissection, which includes a number of different forms ofmathematical induction. As practice problems, we provideda fill-in-the-blank problem based on the proof in this section,and, to ensure that students become more familiar withmathematical induction proofs, we also provided a proofproblem involving progressions of natural numbers, with theproposition shown here: Figure 2
Table 13: Mizar Code 3-3schemeNatInd{ P1[ Nat] } :for k being Nat holds P1[k]providedA1: P1[ 0 ] andA2: for k being Nat st P1[k]holds P1[k + 1]
http://cai2.cs.shinshu-u.ac.jp/mizar/moodle/mod/mizar/view.php?id=784
The students are asked to fill in a section of the proof in theblank space. The system performs a check, and students cancontinue studying by themselves until no errors remain.
3.4 Proving that the Return Value,ALGO_GCD (a, b), Provides the GreatestCommon Divisor of a, b
As previously mentioned, to deductively prove the validityof the algorithm, it needs to be proven that ALGO_GCD (a,b), defined in terms of the given arbitrary integers, actuallygives the greatest common divisor of a, b; for this, a proofis provided with the proposition shown below. (Mizar CodeNATLGO 1:2) The greatest common factor “a gcd b" of
Table 14: Mizar Code NATLGO_1:2theoremfor a, b being Element of INT holdsALGO_GCD (a,b) = a gcd b
a, b is defined in the Mizar library as follows : (MizarCode a gcd d) “Nat" and “Integer" are the variable forms of
Table 15: Mizar Code a gcd ddefinitionlet a, b be Integer;func a gcd b -> Nat means( it divides a \& it divides b \&( for m being Integer st m divides a\& m divides b holds m divides it ));existenceuniquenesscommutativity ;end;
natural numbers and integers, respectively. The pronoun “it"represents “a gcd b" itself (as previously noted) and equatesto the return value of the function in programming language.In addition, the predicate “x divides y," defined in terms ofintegers x, y, is defined as follows. (Mizar Code x dividesy) To prove “ALGO_GCD (a, b) = a gcd b" of the theoremabove, it first needs to be shown that
A.i gcd B.i = A.(i+1) gcd B.(i+1)
324 Int'l Conf. e-Learning, e-Bus., EIS, and e-Gov. | EEE'13 |
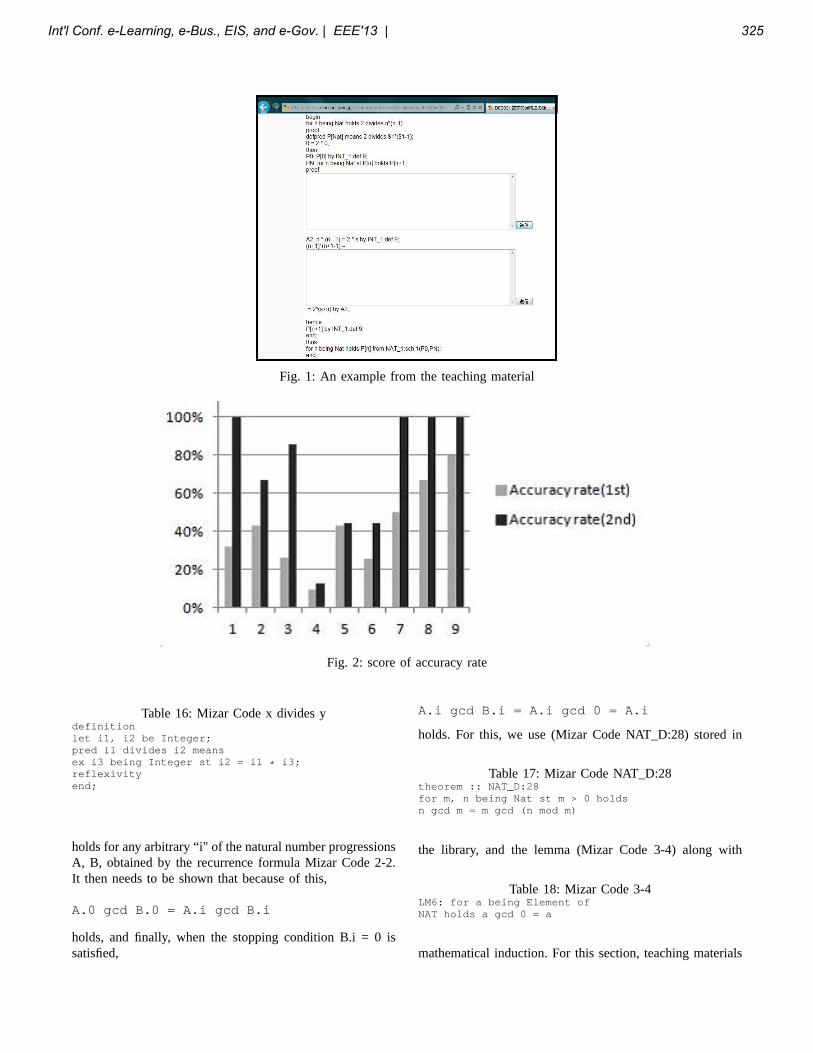
Fig. 1: An example from the teaching material
Fig. 2: score of accuracy rate
Table 16: Mizar Code x divides ydefinitionlet i1, i2 be Integer;pred i1 divides i2 meansex i3 being Integer st i2 = i1 * i3;reflexivityend;
holds for any arbitrary “i" of the natural number progressionsA, B, obtained by the recurrence formula Mizar Code 2-2.It then needs to be shown that because of this,
A.0 gcd B.0 = A.i gcd B.i
holds, and finally, when the stopping condition B.i = 0 issatisfied,
A.i gcd B.i = A.i gcd 0 = A.i
holds. For this, we use (Mizar Code NAT_D:28) stored in
Table 17: Mizar Code NAT_D:28theorem :: NAT_D:28for m, n being Nat st m > 0 holdsn gcd m = m gcd (n mod m)
the library, and the lemma (Mizar Code 3-4) along with
Table 18: Mizar Code 3-4LM6: for a being Element ofNAT holds a gcd 0 = a
mathematical induction. For this section, teaching materials
Int'l Conf. e-Learning, e-Bus., EIS, and e-Gov. | EEE'13 | 325
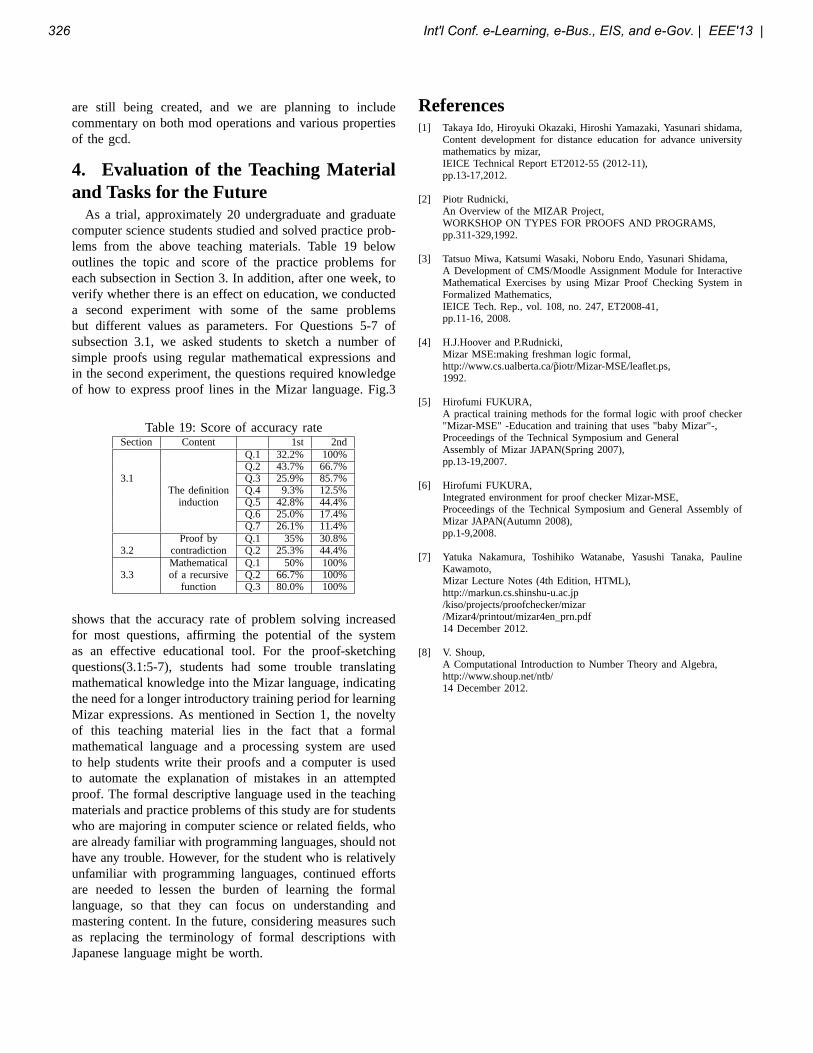
are still being created, and we are planning to includecommentary on both mod operations and various propertiesof the gcd.
4. Evaluation of the Teaching Materialand Tasks for the Future
As a trial, approximately 20 undergraduate and graduatecomputer science students studied and solved practice prob-lems from the above teaching materials. Table 19 belowoutlines the topic and score of the practice problems foreach subsection in Section 3. In addition, after one week, toverify whether there is an effect on education, we conducteda second experiment with some of the same problemsbut different values as parameters. For Questions 5-7 ofsubsection 3.1, we asked students to sketch a number ofsimple proofs using regular mathematical expressions andin the second experiment, the questions required knowledgeof how to express proof lines in the Mizar language. Fig.3
Table 19: Score of accuracy rateSection Content 1st 2nd
Q.1 32.2% 100%Q.2 43.7% 66.7%
3.1 Q.3 25.9% 85.7%The definition Q.4 9.3% 12.5%
induction Q.5 42.8% 44.4%Q.6 25.0% 17.4%Q.7 26.1% 11.4%
Proof by Q.1 35% 30.8%3.2 contradiction Q.2 25.3% 44.4%
Mathematical Q.1 50% 100%3.3 of a recursive Q.2 66.7% 100%
function Q.3 80.0% 100%
shows that the accuracy rate of problem solving increasedfor most questions, affirming the potential of the systemas an effective educational tool. For the proof-sketchingquestions(3.1:5-7), students had some trouble translatingmathematical knowledge into the Mizar language, indicatingthe need for a longer introductory training period for learningMizar expressions. As mentioned in Section 1, the noveltyof this teaching material lies in the fact that a formalmathematical language and a processing system are usedto help students write their proofs and a computer is usedto automate the explanation of mistakes in an attemptedproof. The formal descriptive language used in the teachingmaterials and practice problems of this study are for studentswho are majoring in computer science or related fields, whoare already familiar with programming languages, should nothave any trouble. However, for the student who is relativelyunfamiliar with programming languages, continued effortsare needed to lessen the burden of learning the formallanguage, so that they can focus on understanding andmastering content. In the future, considering measures suchas replacing the terminology of formal descriptions withJapanese language might be worth.
References[1] Takaya Ido, Hiroyuki Okazaki, Hiroshi Yamazaki, Yasunari shidama,
Content development for distance education for advance universitymathematics by mizar,IEICE Technical Report ET2012-55 (2012-11),pp.13-17,2012.
[2] Piotr Rudnicki,An Overview of the MIZAR Project,WORKSHOP ON TYPES FOR PROOFS AND PROGRAMS,pp.311-329,1992.
[3] Tatsuo Miwa, Katsumi Wasaki, Noboru Endo, Yasunari Shidama,A Development of CMS/Moodle Assignment Module for InteractiveMathematical Exercises by using Mizar Proof Checking System inFormalized Mathematics,IEICE Tech. Rep., vol. 108, no. 247, ET2008-41,pp.11-16, 2008.
[4] H.J.Hoover and P.Rudnicki,Mizar MSE:making freshman logic formal,http://www.cs.ualberta.ca/piotr/Mizar-MSE/leaflet.ps,1992.
[5] Hirofumi FUKURA,A practical training methods for the formal logic with proof checker"Mizar-MSE" -Education and training that uses "baby Mizar"-,Proceedings of the Technical Symposium and GeneralAssembly of Mizar JAPAN(Spring 2007),pp.13-19,2007.
[6] Hirofumi FUKURA,Integrated environment for proof checker Mizar-MSE,Proceedings of the Technical Symposium and General Assembly ofMizar JAPAN(Autumn 2008),pp.1-9,2008.
[7] Yatuka Nakamura, Toshihiko Watanabe, Yasushi Tanaka, PaulineKawamoto,Mizar Lecture Notes (4th Edition, HTML),http://markun.cs.shinshu-u.ac.jp/kiso/projects/proofchecker/mizar/Mizar4/printout/mizar4en_prn.pdf14 December 2012.
[8] V. Shoup,A Computational Introduction to Number Theory and Algebra,http://www.shoup.net/ntb/14 December 2012.
326 Int'l Conf. e-Learning, e-Bus., EIS, and e-Gov. | EEE'13 |
The application of web-tracking method for research of localgovernment units’ websites utility
Kesra Nermend, Barbara Wasikowska, and Ammar ShihabFaculty of Economic and administration , Szczecin University, Szczecin, Poland
Abstract - One of the basic qualities of the region'sdevelopment Is an information technology, where is theinformation technology playing essential and vital role inthe development of the region. Especially at this time theinformation technology, it is making progress bedeveloped in the field of Internet and information society,which is makes governments trying hard to improve theinterface of electronic Web Pages and makes it suitablefor future requirements. As yet, however, there is noconstant standard in local government interfaces of thesort used by investment companies to attract investors,customers and other companies. On the other side, theinterfaces of local governments do not meet the followingrequirements. We have analyzed the information ofPolish local government web sites because we did notfind the ideal qualities required, and that satisfy therequirements of successful websites in the world. Theessential goal of this study, is developing Polish localgovernment websites to be more adequate, efficient andUsability for the foreign investor in Poland. The studyalso aims is extracting a good quality and characteristicsfrom websites to be circulated to the other websites.Keywords: local government website, web-tracking,information architecture, Usability website, knowledge-base
1 IntroductionThe goal of the following protocol is to provide
methodological recommendations of optimize Polish localgovernment websites dedicated to foreigner investors inthe Polish cities. The study focuses on analyzing andimproving the usability usually carried out in relation tocommercial online systems such as electronic tradingsystems, social websites, e-banking or tourist systems.This Study is testing a service facility of Polish localgovernment websites in terms of economic usability forforeigners visiting Poland for tourism, investment andbusiness. The model of structured content focused onimproving the information architecture and usabilitytesting. The proposed method allows the selection of theoptimal procedure in the local governments in order toachieve an adequate range of information and contentprovide adequately to the users' needs. The range ofdesign includes the organizational process, navigationproject and outlining search systems that would assist theuser with obtaining information. The role of study is to
help decision-makers to identification of specific websitequality lacks. One of the problems of Polish localgovernment websites involved with localization andlanguage selection, which can bear upon the usability of awebsite. For example, we observed that some citywebsites have much more information in the Polishlanguage than in English, and increase frustration forforeigner users. In addition, some websites use textualtranslation engines, which gives results in limited andweak translations.Previous research has also shown that a user may become
frustrated when page-load times exceed 8 to 10 secondswithout feedback.Another problem involves user behavior in differentcultures. Some foreigners users have extensive internetexperience and some have less, and their interestsseriously. French people have different interests frompeople from the U.S., for example, and both havedifferent interests from Middle Eastern people.• In the use of multivariate methods analysis,
Comparative studies Internet service facility inresearching gives us ready to perform the schedulingof the local government websites in terms ofusefulness of information for foreigners visiting thePolish local government web site.
• The use of web tracking method in the knowledgebase integrated with a web browser canOpportunities and to identify and assess the quality ofservice information website.
Link methods of analysis multivariate and measurementdata allows the development of information structures,which can be more efficient and enhance the interface ofPolish local government websites.Designing complex internet systems requiresconsideration of a set of functional aspects. Utility, whichidentified as an attribute specifying the ease of usinginteractive devices and applications, is becomingincreasingly influential. Local government websitesusually have different specification and objectives. Astudy conducted in this area is not as widely implementedas in commercial systems. Recently available publicationshave exhibited new dedicated research which focuses onsystems of certain cities or regions. They can be adecisive factor for foreigners choosing a holidaydestination, businessmen looking for investment locations
Int'l Conf. e-Learning, e-Bus., EIS, and e-Gov. | EEE'13 | 327

or potential students choosing the place of their futureeducation. Building information infrastructure based onwell developed networks and shared database are thecontemporary need and prerogative of public institutions.Consequently, The optimization and evaluate proceduresin the Polish local Government website and quality ofinterfaces of cities in order to achieve an adequate rangeof available information and content relevant to the user'sneeds. As methods by which citizens can influence theextent of government failure at the local governmentlevel, both exit and voice have various limitations [6]. Inthe last few years, There still does not exist a consensusabout how to evaluate the results of the investments in e-government projects. Because the fact that isn't all theresults of the e-government innovation processes. On theother hand, the complexity itself of the concept of e-government makes it difficult to define an evaluationsystem that can be applied to all the areas covered by thatconcept (e-Democracy, e-Administration, e-Services) [4].Joint development of the Internet is the processof interaction by a group of localgovernments cooperating. This process enables citizens totrack and trace the status of the interface and access to thesite and evaluate the application the modification on thesite. [5]. The difference between a website with novisitors from the search engines and a website that is fullof visitors from the search engines is optimal. SearchEngine Optimization is the difference between loss andprofit on the Internet in the local government website. [2]
2. Evaluating website local government:
Web site optimization focuses on how "computer programs"at Google and the other search engines will perceive yourwebsite with the goal of getting them to recommend (rankings)your website to as many people as possible who are searchingfor keywords relating to your products and services.
2.2 Website Design:
For most businesses, the best choice is a combination of bothworlds. The website should be well optimized to get searchengines and recommend websites. At the same time, thewebsite needs to be well designed to convert "visitors" tobuyers.
How to tell a Good Website Optimizer from a Bad WebsiteOptimizer?
There is a few uncomplicated questions make it easy todifferentiate between a good and poor website optimizer.
We have seen far too many people lose time, money andsometimes their dreams, because they hired a websitecompany that failed to market their products and servicessuccessfully [3]. For years, many people assumed that
websites were like magic because they saw the commercialsand heard stories of people building websites and getting rich.Many people assumed when create a good website would besoon have lots of new clients wanting to buy your productsand services.
The truth is that websites are not magic. A good website thatattracts new clients from Google and the other search enginescan make your company a substantial profit. On the otherhand, a poor website was like putting your advertisement inlast year's phone book after everyone has already thrown it inthe trash.
3. Methodology:
3.1 1 Data Collect:
This Study is testing a service facility of Polish localgovernment websites in terms of economic usability forforeigners visiting Poland for tourism, investment andbusiness. The modeling and optimization of the structuralcontent focused on improving the information architecture andusability testing. We Determined the main and sub-main factorin Polish local government websites for collecting datainformation. Given the limited analysis-oriented researchwhich would also determine some standards for localgovernmental websites, the methodology proposed for thisstudy is a comparative analysis. This method enablesidentification of model sites and specifying indicators ofmultidimensional-input evaluation from the point of usabilityand information access. In order to evaluate city websites,each of them should be assigned to certain variables that arenecessary to determine their suitability. The variables shouldbe selected in a way that would reflect the strengths andweaknesses of the chosen approach. The usefulness of thewebsite to the visitors not residing in a given city has beenconsidered into account. This could be tourists, potentialinvestors, students, etc. The aims of the research is tocomparative analysis of websites in selected Polish cities andperforming their ranking by means of aggregative vectormeasurement.The study involved the analysis of 20 cities, where theinformation published on the websites available in twolanguages: Polish, and English. Nine categories have defined,each of them classified into subgroups:1. Education (kindergartens, elementary schools, middleschools, high schools, colleges, exchanging text books)2. Tourism and tourist attractions (mountains, rivers, marineareas, forests, monuments, recreational areas, museums)3. Hotels (4-5 star, 1-3 star hotels, guest houses, motels, youthhostels)4. Restaurants (pubs and clubs, bars, cafés, casinos,restaurants)5. Transportation (airports, parking lots, buses, taxi, airport,parking, trams, trains, railway, ticket Price)6. Accommodation
328 Int'l Conf. e-Learning, e-Bus., EIS, and e-Gov. | EEE'13 |
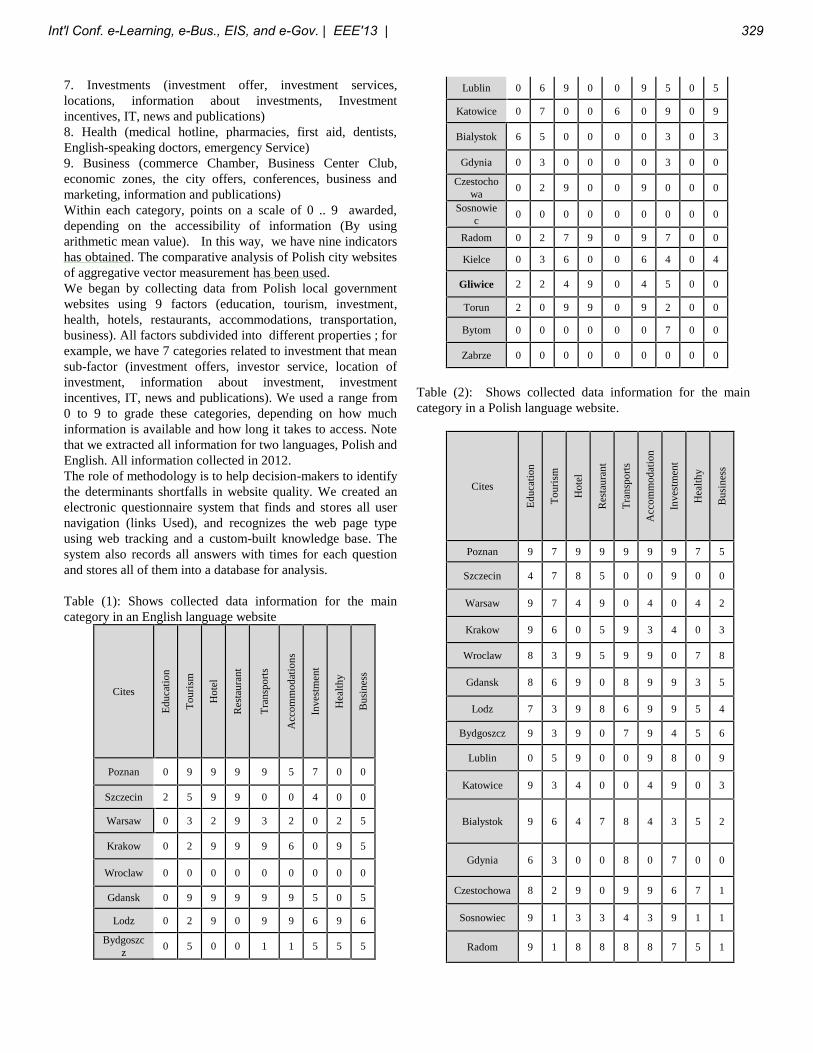
7. Investments (investment offer, investment services,locations, information about investments, Investmentincentives, IT, news and publications)8. Health (medical hotline, pharmacies, first aid, dentists,English-speaking doctors, emergency Service)9. Business (commerce Chamber, Business Center Club,economic zones, the city offers, conferences, business andmarketing, information and publications)Within each category, points on a scale of 0 .. 9 awarded,depending on the accessibility of information (By usingarithmetic mean value). In this way, we have nine indicatorshas obtained. The comparative analysis of Polish city websitesof aggregative vector measurement has been used.We began by collecting data from Polish local governmentwebsites using 9 factors (education, tourism, investment,health, hotels, restaurants, accommodations, transportation,business). All factors subdivided into different properties ; forexample, we have 7 categories related to investment that meansub-factor (investment offers, investor service, location ofinvestment, information about investment, investmentincentives, IT, news and publications). We used a range from0 to 9 to grade these categories, depending on how muchinformation is available and how long it takes to access. Notethat we extracted all information for two languages, Polish andEnglish. All information collected in 2012.The role of methodology is to help decision-makers to identifythe determinants shortfalls in website quality. We created anelectronic questionnaire system that finds and stores all usernavigation (links Used), and recognizes the web page typeusing web tracking and a custom-built knowledge base. Thesystem also records all answers with times for each questionand stores all of them into a database for analysis.
Table (1): Shows collected data information for the maincategory in an English language website
Cites
Educ
atio
n
Tour
ism
Hot
el
Resta
uran
t
Tran
spor
ts
Acc
omm
odat
ions
Inve
stmen
t
Hea
lthy
Busin
ess
Poznan 0 9 9 9 9 5 7 0 0
Szczecin 2 5 9 9 0 0 4 0 0
Warsaw 0 3 2 9 3 2 0 2 5
Krakow 0 2 9 9 9 6 0 9 5
Wroclaw 0 0 0 0 0 0 0 0 0
Gdansk 0 9 9 9 9 9 5 0 5
Lodz 0 2 9 0 9 9 6 9 6
Bydgoszcz 0 5 0 0 1 1 5 5 5
Lublin 0 6 9 0 0 9 5 0 5
Katowice 0 7 0 0 6 0 9 0 9
Bialystok 6 5 0 0 0 0 3 0 3
Gdynia 0 3 0 0 0 0 3 0 0
Czestochowa 0 2 9 0 0 9 0 0 0
Sosnowiec 0 0 0 0 0 0 0 0 0
Radom 0 2 7 9 0 9 7 0 0
Kielce 0 3 6 0 0 6 4 0 4
Gliwice 2 2 4 9 0 4 5 0 0
Torun 2 0 9 9 0 9 2 0 0
Bytom 0 0 0 0 0 0 7 0 0
Zabrze 0 0 0 0 0 0 0 0 0
Table (2): Shows collected data information for the maincategory in a Polish language website.
Cites
Educ
atio
n
Tour
ism
Hot
el
Resta
uran
t
Tran
spor
ts
Acc
omm
odat
ion
Inve
stmen
t
Hea
lthy
Busin
ess
Poznan 9 7 9 9 9 9 9 7 5
Szczecin 4 7 8 5 0 0 9 0 0
Warsaw 9 7 4 9 0 4 0 4 2
Krakow 9 6 0 5 9 3 4 0 3
Wroclaw 8 3 9 5 9 9 0 7 8
Gdansk 8 6 9 0 8 9 9 3 5
Lodz 7 3 9 8 6 9 9 5 4
Bydgoszcz 9 3 9 0 7 9 4 5 6
Lublin 0 5 9 0 0 9 8 0 9
Katowice 9 3 4 0 0 4 9 0 3
Bialystok 9 6 4 7 8 4 3 5 2
Gdynia 6 3 0 0 8 0 7 0 0
Czestochowa 8 2 9 0 9 9 6 7 1
Sosnowiec 9 1 3 3 4 3 9 1 1
Radom 9 1 8 8 8 8 7 5 1
Int'l Conf. e-Learning, e-Bus., EIS, and e-Gov. | EEE'13 | 329
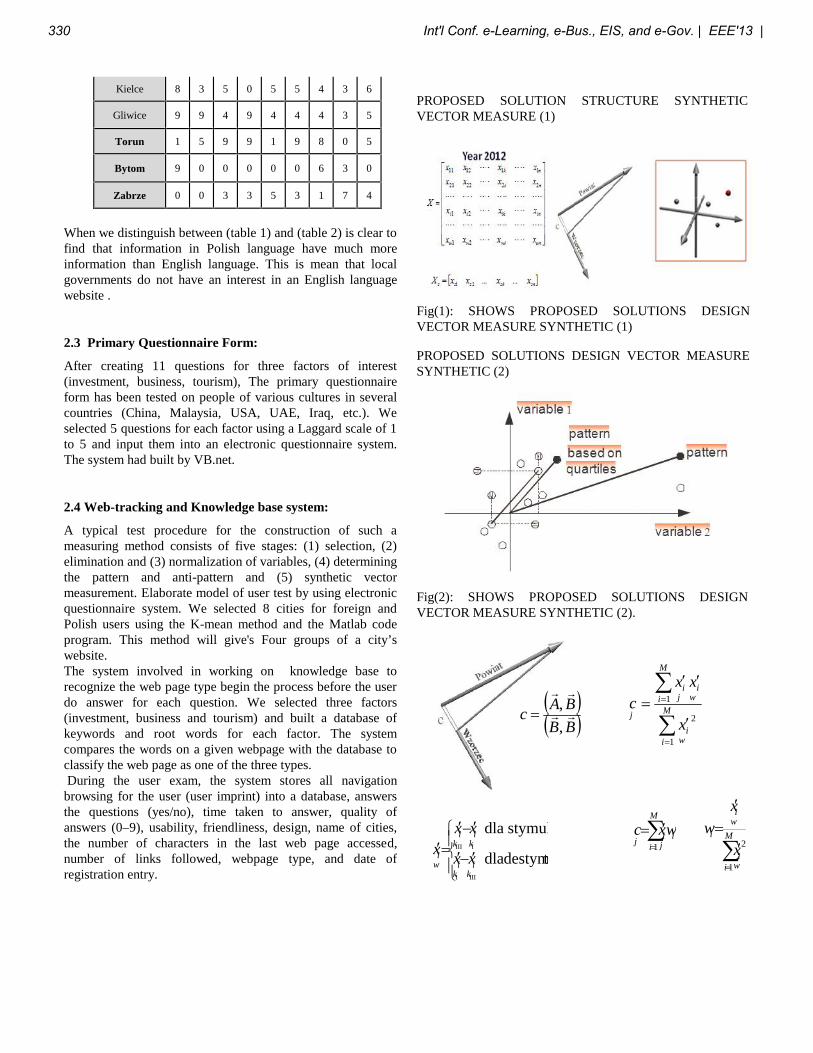
Kielce 8 3 5 0 5 5 4 3 6
Gliwice 9 9 4 9 4 4 4 3 5
Torun 1 5 9 9 1 9 8 0 5
Bytom 9 0 0 0 0 0 6 3 0
Zabrze 0 0 3 3 5 3 1 7 4
When we distinguish between (table 1) and (table 2) is clear tofind that information in Polish language have much moreinformation than English language. This is mean that localgovernments do not have an interest in an English languagewebsite .
2.3 Primary Questionnaire Form:
After creating 11 questions for three factors of interest(investment, business, tourism), The primary questionnaireform has been tested on people of various cultures in severalcountries (China, Malaysia, USA, UAE, Iraq, etc.). Weselected 5 questions for each factor using a Laggard scale of 1to 5 and input them into an electronic questionnaire system.The system had built by VB.net.
2.4 Web-tracking and Knowledge base system:
A typical test procedure for the construction of such ameasuring method consists of five stages: (1) selection, (2)elimination and (3) normalization of variables, (4) determiningthe pattern and anti-pattern and (5) synthetic vectormeasurement. Elaborate model of user test by using electronicquestionnaire system. We selected 8 cities for foreign andPolish users using the K-mean method and the Matlab codeprogram. This method will give's Four groups of a city’swebsite.The system involved in working on knowledge base torecognize the web page type begin the process before the userdo answer for each question. We selected three factors(investment, business and tourism) and built a database ofkeywords and root words for each factor. The systemcompares the words on a given webpage with the database toclassify the web page as one of the three types.During the user exam, the system stores all navigation
browsing for the user (user imprint) into a database, answersthe questions (yes/no), time taken to answer, quality ofanswers (0–9), usability, friendliness, design, name of cities,the number of characters in the last web page accessed,number of links followed, webpage type, and date ofregistration entry.
PROPOSED SOLUTION STRUCTURE SYNTHETICVECTOR MEASURE (1)
Fig(1): SHOWS PROPOSED SOLUTIONS DESIGNVECTOR MEASURE SYNTHETIC (1)
PROPOSED SOLUTIONS DESIGN VECTOR MEASURESYNTHETIC (2)
Fig(2): SHOWS PROPOSED SOLUTIONS DESIGNVECTOR MEASURE SYNTHETIC (2).
M
i wi
M
i wi
ji
jx
xxc
1
2
1 BB
BAc
,,
tdestymulandla
stymulantdla
IIII
IIII
ki
ki
ki
ki
wi xx
xxx
M
ii
jijwxc
1
M
i wi
wi
i
x
xw
1
2
330 Int'l Conf. e-Learning, e-Bus., EIS, and e-Gov. | EEE'13 |
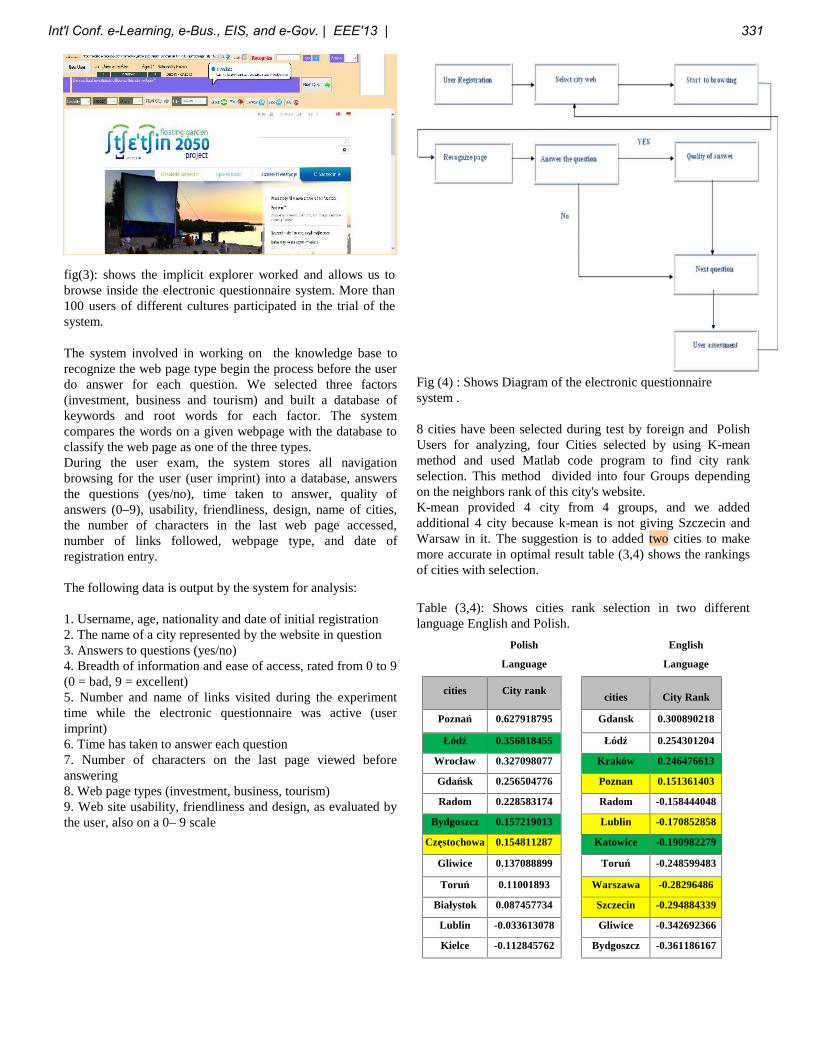
fig(3): shows the implicit explorer worked and allows us tobrowse inside the electronic questionnaire system. More than100 users of different cultures participated in the trial of thesystem.
The system involved in working on the knowledge base torecognize the web page type begin the process before the userdo answer for each question. We selected three factors(investment, business and tourism) and built a database ofkeywords and root words for each factor. The systemcompares the words on a given webpage with the database toclassify the web page as one of the three types.During the user exam, the system stores all navigationbrowsing for the user (user imprint) into a database, answersthe questions (yes/no), time taken to answer, quality ofanswers (0–9), usability, friendliness, design, name of cities,the number of characters in the last web page accessed,number of links followed, webpage type, and date ofregistration entry.
The following data is output by the system for analysis:
1. Username, age, nationality and date of initial registration2. The name of a city represented by the website in question3. Answers to questions (yes/no)4. Breadth of information and ease of access, rated from 0 to 9(0 = bad, 9 = excellent)5. Number and name of links visited during the experimenttime while the electronic questionnaire was active (userimprint)6. Time has taken to answer each question7. Number of characters on the last page viewed beforeanswering8. Web page types (investment, business, tourism)9. Web site usability, friendliness and design, as evaluated bythe user, also on a 0– 9 scale
Fig (4) : Shows Diagram of the electronic questionnairesystem .
8 cities have been selected during test by foreign and PolishUsers for analyzing, four Cities selected by using K-meanmethod and used Matlab code program to find city rankselection. This method divided into four Groups dependingon the neighbors rank of this city's website.K-mean provided 4 city from 4 groups, and we addedadditional 4 city because k-mean is not giving Szczecin andWarsaw in it. The suggestion is to added two cities to makemore accurate in optimal result table (3,4) shows the rankingsof cities with selection.
Table (3,4): Shows cities rank selection in two differentlanguage English and Polish.
Polish
Language
English
Language
cities City rank cities City Rank
Poznań 0.627918795 Gdansk 0.300890218
Łódź 0.356818455 Łódź 0.254301204
Wrocław 0.327098077 Kraków 0.246476613
Gdańsk 0.256504776 Poznan 0.151361403
Radom 0.228583174 Radom -0.158444048
Bydgoszcz 0.157219013 Lublin -0.170852858
Częstochowa 0.154811287 Katowice -0.190982279
Gliwice 0.137088899 Toruń -0.248599483
Toruń 0.11001893 Warszawa -0.28296486
Białystok 0.087457734 Szczecin -0.294884339
Lublin -0.033613078 Gliwice -0.342692366
Kielce -0.112845762 Bydgoszcz -0.361186167
Int'l Conf. e-Learning, e-Bus., EIS, and e-Gov. | EEE'13 | 331

Warszawa -0.121313587 Kielce -0.394656442
Kraków -0.127732333 Częstochowa -0.474687161
Szczecin -0.24010667 Białystok -0.580116427
Sosnowiec -0.246101711 Bytom -0.723229225
Zabrze -0.25567629 Gdynia -0.747166266
Katowice -0.307492287 Sosnowiec -0.871013565
Gdynia -0.423679691 Wrocław -0.871013565
Bytom -0.574957731 Zabrze -0.871013565
Fig(5):Shows the K-mean result
Group No. K-mean Group No.
K-mean
method
1 0.437278442 1 -0.204454645
2 0.161669116 2 -0.806687237
3 -0.399318711 3 -0.400667713
4 -0.180610215 4 0.20575736
1 Łódź 1 Katowice
2 Bydgoszcz 2 Gdynia
3 Gdynia 3 Kielce
4 Kraków 4 Krakow
Table (6):Shows cities selected in the web-tracking system
Cities Web Polish Language Web English Language
Białystok 0.087457734 -0.580116427
Bydgoszcz 0.157219013 -0.361186167
Bytom -0.574957731 -0.723229225
Częstochowa 0.154811287 -0.474687161
Gdańsk 0.256504776 0.300890218
Gdynia -0.423679691 -0.747166266
Gliwice 0.137088899 -0.342692366
Katowice -0.307492287 -0.190982279
Kielce -0.112845762 -0.394656442
Kraków -0.127732333 0.246476613
Łódź 0.356818455 0.254301204
Lublin -0.033613078 -0.170852858
Poznań 0.627918795 0.151361403
Radom 0.228583174 -0.158444048
Sosnowiec -0.246101711 -0.871013565
Szczecin -0.24010667 -0.294884339
Toruń 0.11001893 -0.248599483
Warszawa -0.121313587 -0.28296486
Wrocław 0.327098077 -0.871013565
Zabrze -0.25567629 -0.871013565
3. Empirical study
Table (7): Shows the values of variables assigned to websitesof Polish city in the Polish language.
Towns
Education
Tour ism
Hotels
Restaurants
Transport
Accom
modations
Investments
Health
Business
Białystok 9 6 4 7 8 4 3 5 2
Bydgoszcz 9 3 9 0 7 9 4 5 6
Bytom 9 0 0 0 0 0 6 3 0
Częstochowa 8 2 9 0 9 9 6 7 1
Gdańsk 8 6 9 0 8 9 9 3 5
Gdynia 6 3 0 0 8 0 7 0 0
Gliwice 9 9 4 9 4 4 4 3 5
Katowice 9 3 4 0 0 4 9 0 3
Kielce 8 3 5 0 5 5 4 3 6
Kraków 9 6 0 5 9 3 4 0 3
Łódź 7 3 9 8 6 9 9 5 4
Lublin 0 5 9 0 0 9 8 0 9
Poznań 9 7 9 9 9 9 9 7 5
Radom 9 1 8 8 8 8 7 5 1
Sosnowiec 9 1 3 3 4 3 9 1 1
Szczecin 4 7 8 5 0 0 9 0 0
Toruń 1 5 9 9 1 9 8 0 5
Warszawa 9 7 4 9 0 4 0 4 2
Wrocław 8 3 9 5 9 9 0 7 8
Zabrze 0 0 3 3 5 3 1 7 4
332 Int'l Conf. e-Learning, e-Bus., EIS, and e-Gov. | EEE'13 |
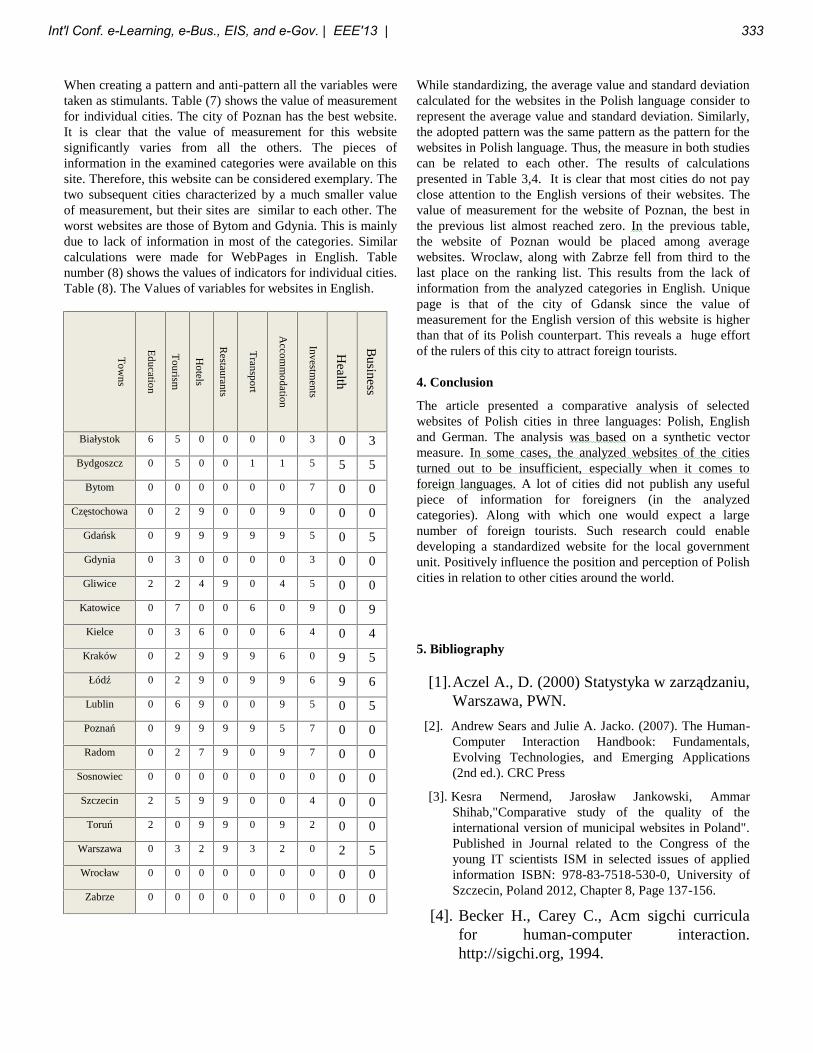
When creating a pattern and anti-pattern all the variables weretaken as stimulants. Table (7) shows the value of measurementfor individual cities. The city of Poznan has the best website.It is clear that the value of measurement for this websitesignificantly varies from all the others. The pieces ofinformation in the examined categories were available on thissite. Therefore, this website can be considered exemplary. Thetwo subsequent cities characterized by a much smaller valueof measurement, but their sites are similar to each other. Theworst websites are those of Bytom and Gdynia. This is mainlydue to lack of information in most of the categories. Similarcalculations were made for WebPages in English. Tablenumber (8) shows the values of indicators for individual cities.Table (8). The Values of variables for websites in English.
Towns
Education
Tourism
Hotels
Restaurants
Transport
Accom
modation
Investments
Health
BusinessBiałystok 6 5 0 0 0 0 3 0 3
Bydgoszcz 0 5 0 0 1 1 5 5 5Bytom 0 0 0 0 0 0 7 0 0
Częstochowa 0 2 9 0 0 9 0 0 0Gdańsk 0 9 9 9 9 9 5 0 5Gdynia 0 3 0 0 0 0 3 0 0Gliwice 2 2 4 9 0 4 5 0 0
Katowice 0 7 0 0 6 0 9 0 9Kielce 0 3 6 0 0 6 4 0 4
Kraków 0 2 9 9 9 6 0 9 5Łódź 0 2 9 0 9 9 6 9 6
Lublin 0 6 9 0 0 9 5 0 5Poznań 0 9 9 9 9 5 7 0 0Radom 0 2 7 9 0 9 7 0 0
Sosnowiec 0 0 0 0 0 0 0 0 0Szczecin 2 5 9 9 0 0 4 0 0
Toruń 2 0 9 9 0 9 2 0 0Warszawa 0 3 2 9 3 2 0 2 5Wrocław 0 0 0 0 0 0 0 0 0Zabrze 0 0 0 0 0 0 0 0 0
While standardizing, the average value and standard deviationcalculated for the websites in the Polish language consider torepresent the average value and standard deviation. Similarly,the adopted pattern was the same pattern as the pattern for thewebsites in Polish language. Thus, the measure in both studiescan be related to each other. The results of calculationspresented in Table 3,4. It is clear that most cities do not payclose attention to the English versions of their websites. Thevalue of measurement for the website of Poznan, the best inthe previous list almost reached zero. In the previous table,the website of Poznan would be placed among averagewebsites. Wroclaw, along with Zabrze fell from third to thelast place on the ranking list. This results from the lack ofinformation from the analyzed categories in English. Uniquepage is that of the city of Gdansk since the value ofmeasurement for the English version of this website is higherthan that of its Polish counterpart. This reveals a huge effortof the rulers of this city to attract foreign tourists.
4. Conclusion
The article presented a comparative analysis of selectedwebsites of Polish cities in three languages: Polish, Englishand German. The analysis was based on a synthetic vectormeasure. In some cases, the analyzed websites of the citiesturned out to be insufficient, especially when it comes toforeign languages. A lot of cities did not publish any usefulpiece of information for foreigners (in the analyzedcategories). Along with which one would expect a largenumber of foreign tourists. Such research could enabledeveloping a standardized website for the local governmentunit. Positively influence the position and perception of Polishcities in relation to other cities around the world.
5. Bibliography
[1].Aczel A., D. (2000) Statystyka w zarządzaniu,Warszawa, PWN.
[2]. Andrew Sears and Julie A. Jacko. (2007). The Human-Computer Interaction Handbook: Fundamentals,Evolving Technologies, and Emerging Applications(2nd ed.). CRC Press
[3]. Kesra Nermend, Jarosław Jankowski, AmmarShihab,"Comparative study of the quality of theinternational version of municipal websites in Poland".Published in Journal related to the Congress of theyoung IT scientists ISM in selected issues of appliedinformation ISBN: 978-83-7518-530-0, University ofSzczecin, Poland 2012, Chapter 8, Page 137-156.
[4]. Becker H., Carey C., Acm sigchi curriculafor human-computer interaction.http://sigchi.org, 1994.
Int'l Conf. e-Learning, e-Bus., EIS, and e-Gov. | EEE'13 | 333
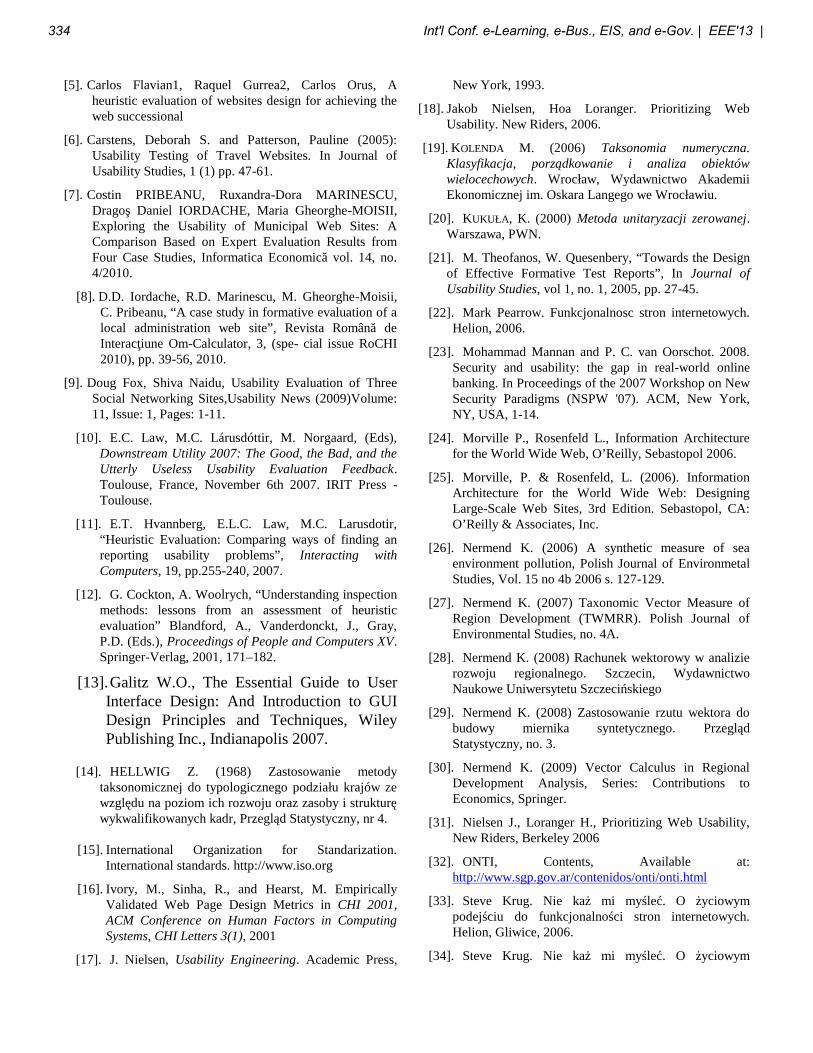
[5]. Carlos Flavian1, Raquel Gurrea2, Carlos Orus, Aheuristic evaluation of websites design for achieving theweb successional
[6]. Carstens, Deborah S. and Patterson, Pauline (2005):Usability Testing of Travel Websites. In Journal ofUsability Studies, 1 (1) pp. 47-61.
[7]. Costin PRIBEANU, Ruxandra-Dora MARINESCU,Dragoş Daniel IORDACHE, Maria Gheorghe-MOISII,Exploring the Usability of Municipal Web Sites: AComparison Based on Expert Evaluation Results fromFour Case Studies, Informatica Economică vol. 14, no.4/2010.
[8]. D.D. Iordache, R.D. Marinescu, M. Gheorghe-Moisii,C. Pribeanu, “A case study in formative evaluation of alocal administration web site”, Revista Română deInteracţiune Om-Calculator, 3, (spe- cial issue RoCHI2010), pp. 39-56, 2010.
[9]. Doug Fox, Shiva Naidu, Usability Evaluation of ThreeSocial Networking Sites,Usability News (2009)Volume:11, Issue: 1, Pages: 1-11.
[10]. E.C. Law, M.C. Lárusdóttir, M. Norgaard, (Eds),Downstream Utility 2007: The Good, the Bad, and theUtterly Useless Usability Evaluation Feedback.Toulouse, France, November 6th 2007. IRIT Press -Toulouse.
[11]. E.T. Hvannberg, E.L.C. Law, M.C. Larusdotir,“Heuristic Evaluation: Comparing ways of finding anreporting usability problems”, Interacting withComputers, 19, pp.255-240, 2007.
[12]. G. Cockton, A. Woolrych, “Understanding inspectionmethods: lessons from an assessment of heuristicevaluation” Blandford, A., Vanderdonckt, J., Gray,P.D. (Eds.), Proceedings of People and Computers XV.Springer-Verlag, 2001, 171–182.
[13].Galitz W.O., The Essential Guide to UserInterface Design: And Introduction to GUIDesign Principles and Techniques, WileyPublishing Inc., Indianapolis 2007.
[14]. HELLWIG Z. (1968) Zastosowanie metodytaksonomicznej do typologicznego podziału krajów zewzględu na poziom ich rozwoju oraz zasoby i strukturęwykwalifikowanych kadr, Przegląd Statystyczny, nr 4.
[15]. International Organization for Standarization.International standards. http://www.iso.org
[16]. Ivory, M., Sinha, R., and Hearst, M. EmpiricallyValidated Web Page Design Metrics in CHI 2001,ACM Conference on Human Factors in ComputingSystems, CHI Letters 3(1), 2001
[17]. J. Nielsen, Usability Engineering. Academic Press,
New York, 1993.
[18]. Jakob Nielsen, Hoa Loranger. Prioritizing WebUsability. New Riders, 2006.
[19]. KOLENDA M. (2006) Taksonomia numeryczna.Klasyfikacja, porządkowanie i analiza obiektówwielocechowych. Wrocław, Wydawnictwo AkademiiEkonomicznej im. Oskara Langego we Wrocławiu.
[20]. KUKUŁA, K. (2000) Metoda unitaryzacji zerowanej.Warszawa, PWN.
[21]. M. Theofanos, W. Quesenbery, “Towards the Designof Effective Formative Test Reports”, In Journal ofUsability Studies, vol 1, no. 1, 2005, pp. 27-45.
[22]. Mark Pearrow. Funkcjonalnosc stron internetowych.Helion, 2006.
[23]. Mohammad Mannan and P. C. van Oorschot. 2008.Security and usability: the gap in real-world onlinebanking. In Proceedings of the 2007 Workshop on NewSecurity Paradigms (NSPW '07). ACM, New York,NY, USA, 1-14.
[24]. Morville P., Rosenfeld L., Information Architecturefor the World Wide Web, O’Reilly, Sebastopol 2006.
[25]. Morville, P. & Rosenfeld, L. (2006). InformationArchitecture for the World Wide Web: DesigningLarge-Scale Web Sites, 3rd Edition. Sebastopol, CA:O’Reilly & Associates, Inc.
[26]. Nermend K. (2006) A synthetic measure of seaenvironment pollution, Polish Journal of EnvironmetalStudies, Vol. 15 no 4b 2006 s. 127-129.
[27]. Nermend K. (2007) Taxonomic Vector Measure ofRegion Development (TWMRR). Polish Journal ofEnvironmental Studies, no. 4A.
[28]. Nermend K. (2008) Rachunek wektorowy w analizierozwoju regionalnego. Szczecin, WydawnictwoNaukowe Uniwersytetu Szczecińskiego
[29]. Nermend K. (2008) Zastosowanie rzutu wektora dobudowy miernika syntetycznego. PrzeglądStatystyczny, no. 3.
[30]. Nermend K. (2009) Vector Calculus in RegionalDevelopment Analysis, Series: Contributions toEconomics, Springer.
[31]. Nielsen J., Loranger H., Prioritizing Web Usability,New Riders, Berkeley 2006
[32]. ONTI, Contents, Available at:http://www.sgp.gov.ar/contenidos/onti/onti.html
[33]. Steve Krug. Nie każ mi myśleć. O życiowympodejściu do funkcjonalności stron internetowych.Helion, Gliwice, 2006.
[34]. Steve Krug. Nie każ mi myśleć. O życiowym
334 Int'l Conf. e-Learning, e-Bus., EIS, and e-Gov. | EEE'13 |
podejściu do funkcjonalności stron internetowych.Helion, Gliwice, 2006.
[35]. Vredenburg, K., Mao, J.-Y., Smith, P. W., & Carey,T. (2002). A survey of user-centered design practice.Proceedings of CHI 2002, 471-478. New York, NY:ACM.
[36]. Younghwa Lee and Kenneth A. Kozar. 2009.Designing usable online stores: A landscape preferenceperspective. Inf. Manage. 46, 1 (January 2009), 31-41.
[37]. Zimmerman Donald E., Akerelrea Carol A., UsabilityTesting: An Evaluation Process for InternetCommunications, John Wiley & Sons, Inc., TheInternet Encyclopedia, 2004
Int'l Conf. e-Learning, e-Bus., EIS, and e-Gov. | EEE'13 | 335
Towards Open Distance and Electronic Learning (OdeL)
Mmafani Serote¹, Mokateko Mathimbi¹ and Munienge Mbodila² 1School of Computing, University of South Africa, Mukleuneuck Ridge, South Africa
2Department of Computer Science, Science foundation Unit, University of Venda, Thohoyandou, South Africa
Abstract - In the past decade, learning has moved from
classrooms and print-based to involve more technology use
such as online platforms, mobile devices and Social media.
There has been recent widespread use of mobile devices to
support learning activities in a bid to keep up with the said
future of learning as electronic learning. This research draws
from the question of whether media influence learning, and
tried to establish if teaching information technology in open
distance using electronic media influences learning.
Education is viewed as a social practice and therefore online
learning environments are expected to support the learning
process during social interactions following the social
learning theory. Mobile and electronic learning (e-Learning)
are fast becoming the new panache in learning. Learners
utilize their mobile phones to connect with other learners and
to network. In computer mediated communication, learners
can work with media like e-mails, short message service
(SMS), Facebook, twitter, etc. Generally learners have been
noted to use their mobile phones as learning devices to
access teaching material located on the module website and
also to communicate with the fellow learners on the module,
creating focus groups on social networks for live message
exchange and content sharing. This study will be a
qualitative research and will concentrate on learning using
e-learning content such as discussion forums and podcasts as
teaching tools to facilitate the learning process.
Keywords: Computer Mediated Communication, Learning,
Social Media, e-Learning, OdeL, Social Learning, ODLP
1 Introduction
The process of teaching and learning has progressively
moved from classroom and paper mode of delivery to online
platforms and mobile devices, particularly towards Social
media (Carter 1996). Many researches as asked the question,
“Do media influence learning?” This is the question on
which this research is based. The research tries to address
this question. The use of social media for learning has moved
learning to mobile devices and smart phones as most of these
have internet browsing capabilities and social networking
applications. Lan & Si 2010 comment on the advantage of
using these mobile devices for learning purposes by
suggesting that because of the mobile devices’ portability and
availability, they are therefore able to speed up
communication and message delivery and subsequently
contribute by positively influencing learning.
Chen et al. 2008 support this view by reporting that learners
with smart phones and mobile devices were recorded to have
logged into the academic reminder system double the number
of times as the ones with desktops and laptops. With the
widespread use of mobile devices for learning comes a new
era, the electronic-learning (e-learning) or learning on the go
era. McLoughlin & Lee ( in Dabbagh & Kitsantas 2012:3)
reflected this phenomenon in yet another way when they
noted that learning on demand is becoming a modern society
lifestyle type; which suggests that flexibility and mobility in
learning are becoming a need for the day to day functioning
of society. This growing need for online learning requires for
higher education institutions to use technology and media in
the delivery of distance learning content. Learners in
distance learning institutions no longer want to wait for the
post office mail to receive their study content, they now
require it on the go; as and when it becomes available. They
also require this content to be accessible wherever they are
and give rise to the need for e-learning. This is aligned with
the views of (Harasim 2002; Swan & Shea 2005) that
learning is a social process, which brings about the need for
on demand and online delivery of study content.
2 Overview of online (electronic) teaching
and learning
E-learning has been defined as the use of information
technology tools for learning. This includes formal and
informal learning. Cross as well as Selwyn (in Dabbagh &
Kitsantas 2012:3) define the concept of formal and informal
learning. They assert that formal learning is well structured
and driven by institutions such as schools, whereas informal
learning is dependent on the learner and obtained in their
interactions and experiences and is driven by their areas of
interest. E-learning was used for informal learning during
the Web 1.0 period however; it has gained popularity into the
formal learning space with the introduction of Web 2.0
technologies. Cormode & Krishnamurthy (in Greenhow et al.
2009:1) explain that there was an introduction of the “first-
generation web” or “Web 1.0”, ten years ago and it was
welcomed as the latest and greatest education and
communication resource as compared to the older
information and teaching resources such as books, overhead
336 Int'l Conf. e-Learning, e-Bus., EIS, and e-Gov. | EEE'13 |
transparency and classroom lectures. Greenhow et al. went
on to point out the introduction of the “web 2.0” technology
in the twenty first century. The web 2 was then adapted as
the new and better tool as the successor of web 1. This was
due to the technical nature of web 1 and the relative usability
of “web 2.0” tools. Dabbagh & Kitsantas 2012, report on
social media as a network of diverse communication tools
with a focus on social aspects of the internet for sharing ideas
and working together to reach common goals. It is this aspect
of social media that allows for mobile devices to be used for
teaching and learning because social media is accessible on
most mobile devices.
According to the findings of prior research as documented by
(Lan & Sie 2010), the use of mobile devices to support
learning activities has been reported to be beneficial because
it encourages learner-to-learner interaction, the same
interaction which was reported by (Moore & Kearsley 2005)
to be motivating and stimulating for learners. A view
supported by (Richardson & Swan 2003) as they have
asserted that this interaction is critical in learning. Due to
the idea that education is viewed as a social practice, and
learners often use mobile devices for social networking per
the social learning theory, it follows that mobile devices
should be capable of being used as learning tools to support
online learning. The social learning theory further perceives
learning to take place during social interactions in a
community with similar interests (Wenger, 2000). Therefore
by virtue of social networks and discussion forums being
social environments, learning should take place in this
platform as well.
Barron (in Greenhow et al. 2009:121) and Dabbagh &
Kitsantas 2012 present similar concepts referred to as a
learning ecology and the personal learning environments
respectively. A learning ecology is based on the view that
individuals are presented with and are active in many online
settings, they create their own learning contexts in and
across these settings; these individuals also engage in interest
driven activities which serve as permeable contextual
boundaries. The learning ecology can become self-
sustainable given sufficient time, flexibility and the necessary
resources. According to McGloughlin (in n Dabbagh &
Kitsantas 2012:4), personal learning environments can help
integrate formal (classroom) and informal (social) learning
in the context of higher education, by creating personal and
social learning contexts to support learner-centered
education systems that use rich online media. Daft & Lengel
(in Connell et al. 2001:118) define media richness as:
“The ability of information to change understanding within a
time interval. Communication transactions that can
overcome different frames of reference or clarify ambiguous
issues to change understanding in a timely manner are
considered rich. Communications that require a long time to
enable understanding or that cannot overcome different
perspectives are lower in richness. In a sense, richness
pertains to the learning capacity of a communication”. Media
richness depends on four factors, response time, how fast
can the responses be; multiple cues, whether the media can
convey voice, tone and presence; language variety, meanings
that can be used from language symbols; and personal focus,
customization by users to their own preferences (Connell et
al. 2001). Media are classified in descending richness as
follows:
• Facet-face (FTF);
• video, telephone;
• computer-mediated communication (CMC);
• addressed written communication;
• unaddressed written communication and
• formal numeric text
Therefore after FTF, video and telephone, CMC is the next
richest media to use for communication. This implies that
using CMC for teaching should be an improvement on FTF,
video and telephone. For the rich media to be effective in
teaching and learning it has to convey the physical presence
of the communicating participants; and this is the medium’s
social presence (Connell et al. 2001). This is the
fundamental principle of the social presence theory.
3 Overview of the Open distance
electronic learning (ODeL)
In a bid to stay ahead of the game, distance educators
find themselves trying out many technologies to enhance or
improve the learner learning experience and facilitate their
course work. They often find themselves utilizing a variety of
media which can get overwhelming as the different
technologies might require a variety of different skills
(Carter 1996). Lee et al. 2004 have advised that there should
be careful selection of user friendly tools as part of
institutional strategies for e-learning. They also recommend
that educators are trained on how to use the selected tools
and they also have reflection sessions to discuss areas of
concern. There are high- end course management platforms
or systems such as Blackboard, Moodle, and Sakai, which
might come with a golden price tag and could require some
technical configurations and installation processes; which
could be disadvantageous for non-technical educators and
learners, if they do not have the required skill. This further
implies that those without the required skill will not make
optimum use of the tools’ functionality. Greenhow et al.
2009, came to the conclusion that it is no longer feasible for
anyone to be literate in every available online technology.
They further pointed out that digital literacy includes
knowing which technologies are fit for the user’s intended
purpose, knowing when to use these technologies, when to
use them, how and which functions to use. Cao And Hong
2011 reiterate this view and summarize the basics for social
media utilization in teaching by proposing factors affecting
Int'l Conf. e-Learning, e-Bus., EIS, and e-Gov. | EEE'13 | 337
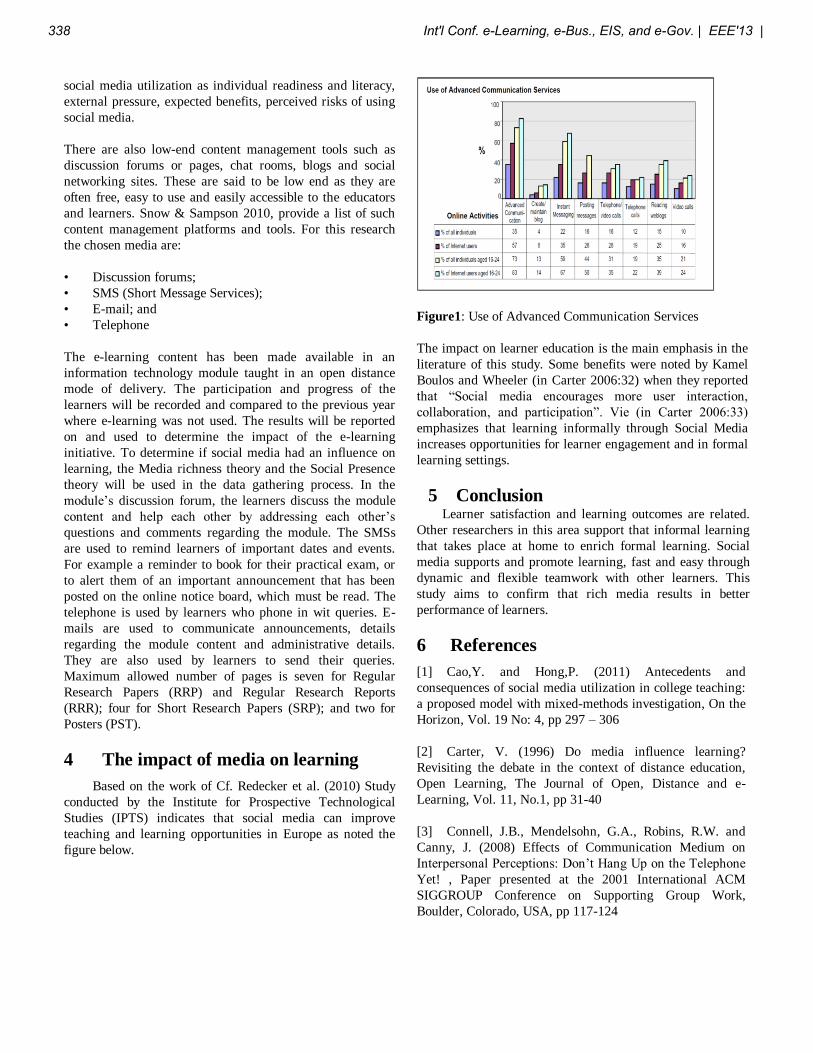
social media utilization as individual readiness and literacy,
external pressure, expected benefits, perceived risks of using
social media.
There are also low-end content management tools such as
discussion forums or pages, chat rooms, blogs and social
networking sites. These are said to be low end as they are
often free, easy to use and easily accessible to the educators
and learners. Snow & Sampson 2010, provide a list of such
content management platforms and tools. For this research
the chosen media are:
• Discussion forums;
• SMS (Short Message Services);
• E-mail; and
• Telephone
The e-learning content has been made available in an
information technology module taught in an open distance
mode of delivery. The participation and progress of the
learners will be recorded and compared to the previous year
where e-learning was not used. The results will be reported
on and used to determine the impact of the e-learning
initiative. To determine if social media had an influence on
learning, the Media richness theory and the Social Presence
theory will be used in the data gathering process. In the
module’s discussion forum, the learners discuss the module
content and help each other by addressing each other’s
questions and comments regarding the module. The SMSs
are used to remind learners of important dates and events.
For example a reminder to book for their practical exam, or
to alert them of an important announcement that has been
posted on the online notice board, which must be read. The
telephone is used by learners who phone in wit queries. E-
mails are used to communicate announcements, details
regarding the module content and administrative details.
They are also used by learners to send their queries.
Maximum allowed number of pages is seven for Regular
Research Papers (RRP) and Regular Research Reports
(RRR); four for Short Research Papers (SRP); and two for
Posters (PST).
4 The impact of media on learning
Based on the work of Cf. Redecker et al. (2010) Study
conducted by the Institute for Prospective Technological
Studies (IPTS) indicates that social media can improve
teaching and learning opportunities in Europe as noted the
figure below.
Figure1: Use of Advanced Communication Services
The impact on learner education is the main emphasis in the
literature of this study. Some benefits were noted by Kamel
Boulos and Wheeler (in Carter 2006:32) when they reported
that “Social media encourages more user interaction,
collaboration, and participation”. Vie (in Carter 2006:33)
emphasizes that learning informally through Social Media
increases opportunities for learner engagement and in formal
learning settings.
5 Conclusion Learner satisfaction and learning outcomes are related.
Other researchers in this area support that informal learning
that takes place at home to enrich formal learning. Social
media supports and promote learning, fast and easy through
dynamic and flexible teamwork with other learners. This
study aims to confirm that rich media results in better
performance of learners.
6 References
[1] Cao,Y. and Hong,P. (2011) Antecedents and
consequences of social media utilization in college teaching:
a proposed model with mixed-methods investigation, On the
Horizon, Vol. 19 No: 4, pp 297 – 306
[2] Carter, V. (1996) Do media influence learning?
Revisiting the debate in the context of distance education,
Open Learning, The Journal of Open, Distance and e-
Learning, Vol. 11, No.1, pp 31-40
[3] Connell, J.B., Mendelsohn, G.A., Robins, R.W. and
Canny, J. (2008) Effects of Communication Medium on
Interpersonal Perceptions: Don’t Hang Up on the Telephone
Yet! , Paper presented at the 2001 International ACM
SIGGROUP Conference on Supporting Group Work,
Boulder, Colorado, USA, pp 117-124
338 Int'l Conf. e-Learning, e-Bus., EIS, and e-Gov. | EEE'13 |
[4] Dabbagh, N. and Kitsantas, A. (2012) Personal
Learning Environments, social media, and self-regulated
learning: A natural formula for connecting formal and
informal learning, Internet and Higher Education, Vol. 15,
pp 3–8
[5] Dalsgaard, C.( 2006) Social software: E-learning
beyond learning management systems , Institute of
Information and Media Studies, University of Aarhus,
Denmark, online [http://www.imv.au.dk]
[6] Greenhow, C., Robelia, B. and Hughes,J.E. Greenhow,
C., Robelia, B., & Hughes, J.E. (2009) Research on
Learning and Teaching with Web 2.0: Bridging
Conversations, Educational Researcher, Vol38, No.4, 280-
283
[7] Harasim, L. (2002) What makes online learning
communities successful? The role of collaborative learning
in social and intellectual development
[8] Lan, Y.F., and Sie, S. (2010) Using RSS to support
mobile learning based on media richness theory, Computers
and Education, Vol. 55, pp 723 – 732
[9] Lee, C.S., Tan, D.T.H, and Goh, W.S. (2004) The
Next Generation of E-Learning: strategies for media rich
online teaching and engaged learning , Journal of Distance
Education Technologies, Vol. 2, No 4, pp 1-17
[10] Redecker, C., Ala-Mutka, K and Punie, Y. (2010)
Study conducted by the Institute for Prospective
Technological Studies (IPTS) on Learning in Europe 2.0
POLICY BRIEF, Joint Research Centre: Institute for
Prospective Technological Studies, pp 1-17
[11] Richardson, J. C., & Swan, K. (2003). Examining
social presence in online courses in relation to learners'
perceived learning and satisfaction. Journal of Asynchronous
Learning Networks, 7(1), 68-88.
[12] Snow, E. and Sampson, P. (2010) Course Platforms for
Teaching Online, Teaching Geoscience Online - A
Workshop for Digital Faculty, University of South Florida,
University of Texas, University of Michigan, [online]
http://serc.carleton.edu/NAGTWorkshops/online/platforms.h
tml accessed 20 December 2012.
[13] Swan, K & Shea, P. (2005). The development of
virtual learning communities. In. S. R. Hiltz & R.
Goldman, Asynchronous Learning Networks: The Research
Frontier. New York: Hampton Press,
239-260.
[14] Wenger, E. (2000) Communities of Practice and Social
Learning Systems, Sage, London, vol. 7, No. 2, pp 225-246
Int'l Conf. e-Learning, e-Bus., EIS, and e-Gov. | EEE'13 | 339
Interactive Social Distance Learning Environment
Maram A. Alshareef
Educational Diploma Program, King Abdulaziz University,
Kingdom of Saudi Arabia, P.O. Box 80254, Jeddah 21589.
Abstract— this paper presents a results of a study conducted
for student enrolled in communication skills course in King
Abdulazize University, Saudi Arabia. The study is to evaluate
the success of an interactive social learning environment. A
survey was offered to students in classes who used Twitter in
order to identify areas where the survey aim succeeded. The
survey results proved that the posts in twits in Twitter were the
areas of greatest concern.
Index Distance Learning Environment, Twitter, Web 2.0,
Social Learning, Student Satisfaction.
I. INTRODUCTION
These days, students forced educational institutions to
move from traditional teaching methods to social learning.
Higher Education students are integrating ICT completely in
their everyday life and call for educational institutions to
support their digital learning styles. In addition, instructors are
increasingly taking up social computing applications in their
work and free time. Different types of collaborative content
applications, such as Facebook, Twitter, Blogs and Wikis, are
used by people of all ages, supporting the collaborative
creation and sharing of knowledge between young and old,
students and experts, inside and outside organizations and
educational institutions. This paper focuses on using Twitter as
an interactive social learning environment.
The study conducted in King Abdulaziz University
Students to present the impact of using Twitter to identify areas
where the survey aims succeeded. The survey results proved
that the posts in Twitter among students were the areas of
greatest concern.
As a result, traditional teaching and learning methods in
educational institutions should be adapted to provide
accommodation the learning needs of the new generation of
digital native students and instructors. Recently, Web 2.0
concepts have started to open new doors for more effective
learning and have the potential to overcome many of the
limitations of traditional learning models. Social computing
tools in Web 2.0 [7] have a potential to support both, students
in higher education institutions and instructors updating their
skills in new ways. In this paper, we show in which way the
Web 2.0 tools [7], under development at the King Abdul Aziz
University , puts crucial success factors for Web 2.0 enhanced
learning into practice, applying well known concepts like
social learning.
In this study, we use Twitters as tools of social interactive
distance learning. By browsing the nominated noble works and
the comments made by peers as well as instructors on students’
blogs, students are empowered to stimulate new ideas different
from each other. Survey results show that students who took
the lab courses are satisfied with turning in lab results through
blog posting, getting instructor's in-class interactions, piracy
reduction, and social learning.
Socially outgoing users aim for more involvement in
ongoing interactions by making use of the rules and procedures
in the Twitter. They tend to specialize in one usage procedure
(such as answering questions or greeting newcomers).
Understanding the influence that socially outgoing learners
have on the success of social interaction in a learning context
helps the adoption and adaptation of Web 2.0 services [7] for
learning environments.
II. RELATED WORK
Web 2.0 technologies are potentially playing a key role in
the context of learning and knowledge transfer by transforming
the information society into a knowledge society [1]. Research
on the prospective role of Web 2.0 services in supporting social
interaction with educational merits is being recently explored
by several scholars, including [5]. The social interactions
supported by Web 2.0 services are characterized by power laws
and log normal distributions which generally imply that only a
small percentage of participants remain active above the
threshold required for the interaction’s continuance and
development [1].
A blog is a website comprising blog posts, or content
written by the blogger, which are typically organized into
categories and sorted in reverse chronological order [Wright
2006].
By methods and techniques of Twitter analysis, researchers
can study how information flows through network ties, how
people acquire information and resources, and how cleavages
and coalitions operate. Therefore, in addition to studying on
whole networks, researchers are also interest in discovering
densely-knit clusters or cliques and looking for cohesive
subgroups [12].
Picking up the valuable pieces of information from the
blogs that we follow would often require tiresome reading,
unless somehow we are informed about the relevance of an
item [9]. While technology is important, keeping in touch with
social science will be just as important. Twitter analysis [10]
helps identify the structural features of a computer supported
collaborative learning group or community and the relevance
that we are looking for. In addition, learning from peers [6] or
340 Int'l Conf. e-Learning, e-Bus., EIS, and e-Gov. | EEE'13 |
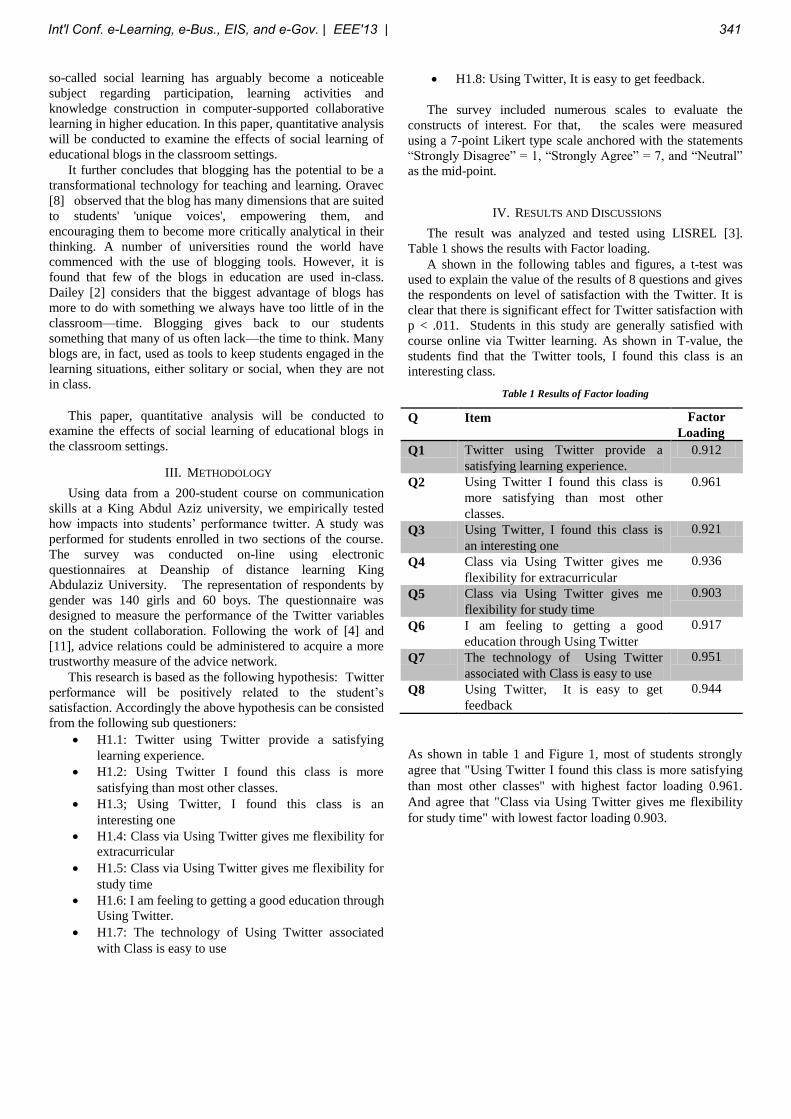
so-called social learning has arguably become a noticeable
subject regarding participation, learning activities and
knowledge construction in computer-supported collaborative
learning in higher education. In this paper, quantitative analysis
will be conducted to examine the effects of social learning of
educational blogs in the classroom settings.
It further concludes that blogging has the potential to be a
transformational technology for teaching and learning. Oravec
[8] observed that the blog has many dimensions that are suited
to students' 'unique voices', empowering them, and
encouraging them to become more critically analytical in their
thinking. A number of universities round the world have
commenced with the use of blogging tools. However, it is
found that few of the blogs in education are used in-class.
Dailey [2] considers that the biggest advantage of blogs has
more to do with something we always have too little of in the
classroom—time. Blogging gives back to our students
something that many of us often lack—the time to think. Many
blogs are, in fact, used as tools to keep students engaged in the
learning situations, either solitary or social, when they are not
in class.
This paper, quantitative analysis will be conducted to
examine the effects of social learning of educational blogs in
the classroom settings.
III. METHODOLOGY
Using data from a 200-student course on communication
skills at a King Abdul Aziz university, we empirically tested
how impacts into students’ performance twitter. A study was
performed for students enrolled in two sections of the course.
The survey was conducted on-line using electronic
questionnaires at Deanship of distance learning King
Abdulaziz University. The representation of respondents by
gender was 140 girls and 60 boys. The questionnaire was
designed to measure the performance of the Twitter variables
on the student collaboration. Following the work of [4] and
[11], advice relations could be administered to acquire a more
trustworthy measure of the advice network.
This research is based as the following hypothesis: Twitter
performance will be positively related to the student’s
satisfaction. Accordingly the above hypothesis can be consisted
from the following sub questioners:
H1.1: Twitter using Twitter provide a satisfying
learning experience.
H1.2: Using Twitter I found this class is more
satisfying than most other classes.
H1.3; Using Twitter, I found this class is an
interesting one
H1.4: Class via Using Twitter gives me flexibility for
extracurricular
H1.5: Class via Using Twitter gives me flexibility for
study time
H1.6: I am feeling to getting a good education through
Using Twitter.
H1.7: The technology of Using Twitter associated
with Class is easy to use
H1.8: Using Twitter, It is easy to get feedback.
The survey included numerous scales to evaluate the
constructs of interest. For that, the scales were measured
using a 7-point Likert type scale anchored with the statements
“Strongly Disagree” = 1, “Strongly Agree” = 7, and “Neutral”
as the mid-point.
IV. RESULTS AND DISCUSSIONS
The result was analyzed and tested using LISREL [3].
Table 1 shows the results with Factor loading.
A shown in the following tables and figures, a t-test was
used to explain the value of the results of 8 questions and gives
the respondents on level of satisfaction with the Twitter. It is
clear that there is significant effect for Twitter satisfaction with
p < .011. Students in this study are generally satisfied with
course online via Twitter learning. As shown in T-value, the
students find that the Twitter tools, I found this class is an
interesting class.
Table 1 Results of Factor loading
Q Item Factor
Loading
Q1 Twitter using Twitter provide a
satisfying learning experience.
0.912
Q2 Using Twitter I found this class is
more satisfying than most other
classes.
0.961
Q3 Using Twitter, I found this class is
an interesting one
0.921
Q4 Class via Using Twitter gives me
flexibility for extracurricular
0.936
Q5 Class via Using Twitter gives me
flexibility for study time
0.903
Q6 I am feeling to getting a good
education through Using Twitter
0.917
Q7 The technology of Using Twitter
associated with Class is easy to use
0.951
Q8 Using Twitter, It is easy to get
feedback
0.944
As shown in table 1 and Figure 1, most of students strongly
agree that "Using Twitter I found this class is more satisfying
than most other classes" with highest factor loading 0.961.
And agree that "Class via Using Twitter gives me flexibility
for study time" with lowest factor loading 0.903.
Int'l Conf. e-Learning, e-Bus., EIS, and e-Gov. | EEE'13 | 341
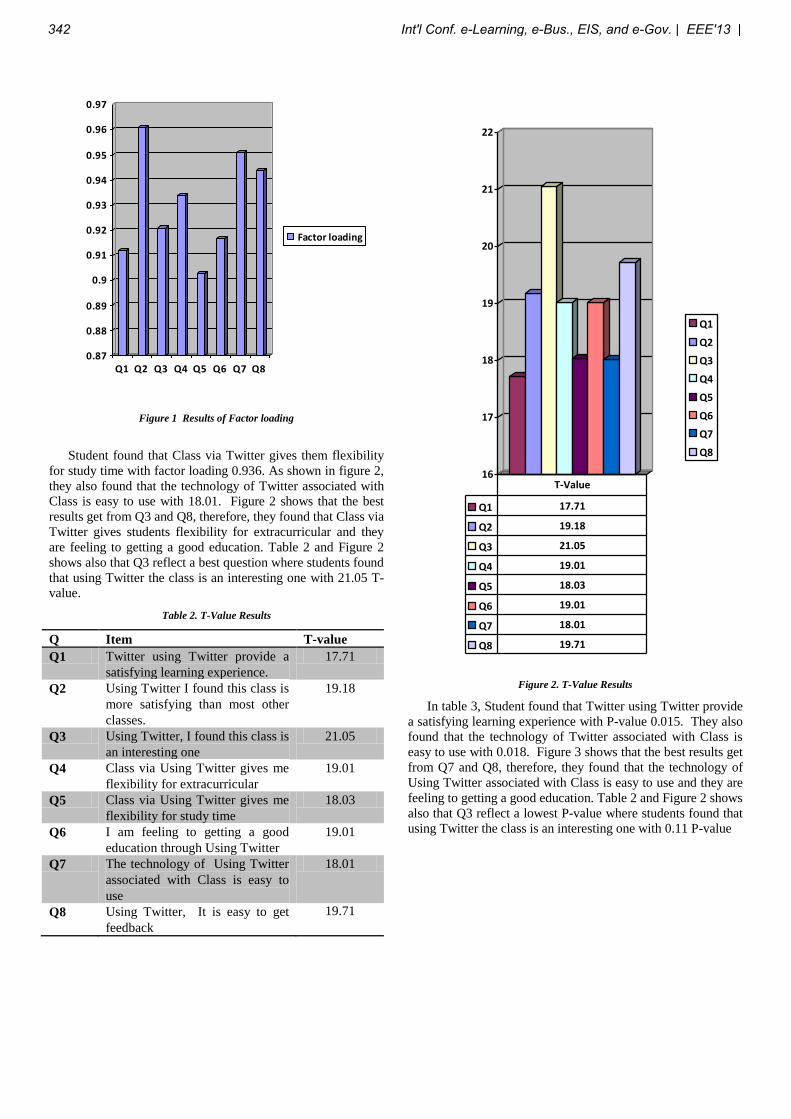
0.87
0.88
0.89
0.9
0.91
0.92
0.93
0.94
0.95
0.96
0.97
Q1 Q2 Q3 Q4 Q5 Q6 Q7 Q8
Factor loading
Figure 1 Results of Factor loading
Student found that Class via Twitter gives them flexibility
for study time with factor loading 0.936. As shown in figure 2,
they also found that the technology of Twitter associated with
Class is easy to use with 18.01. Figure 2 shows that the best
results get from Q3 and Q8, therefore, they found that Class via
Twitter gives students flexibility for extracurricular and they
are feeling to getting a good education. Table 2 and Figure 2
shows also that Q3 reflect a best question where students found
that using Twitter the class is an interesting one with 21.05 T-
value.
Table 2. T-Value Results
Q Item T-value
Q1 Twitter using Twitter provide a
satisfying learning experience.
17.71
Q2 Using Twitter I found this class is
more satisfying than most other
classes.
19.18
Q3 Using Twitter, I found this class is
an interesting one
21.05
Q4 Class via Using Twitter gives me
flexibility for extracurricular
19.01
Q5 Class via Using Twitter gives me
flexibility for study time
18.03
Q6 I am feeling to getting a good
education through Using Twitter
19.01
Q7 The technology of Using Twitter
associated with Class is easy to
use
18.01
Q8 Using Twitter, It is easy to get
feedback
19.71
16
17
18
19
20
21
22
Q1
Q2
Q3
Q4
Q5
Q6
Q7
Q8
Q1 17.71
Q2 19.18
Q3 21.05
Q4 19.01
Q5 18.03
Q6 19.01
Q7 18.01
Q8 19.71
T-Value
Figure 2. T-Value Results
In table 3, Student found that Twitter using Twitter provide
a satisfying learning experience with P-value 0.015. They also
found that the technology of Twitter associated with Class is
easy to use with 0.018. Figure 3 shows that the best results get
from Q7 and Q8, therefore, they found that the technology of
Using Twitter associated with Class is easy to use and they are
feeling to getting a good education. Table 2 and Figure 2 shows
also that Q3 reflect a lowest P-value where students found that
using Twitter the class is an interesting one with 0.11 P-value
342 Int'l Conf. e-Learning, e-Bus., EIS, and e-Gov. | EEE'13 |
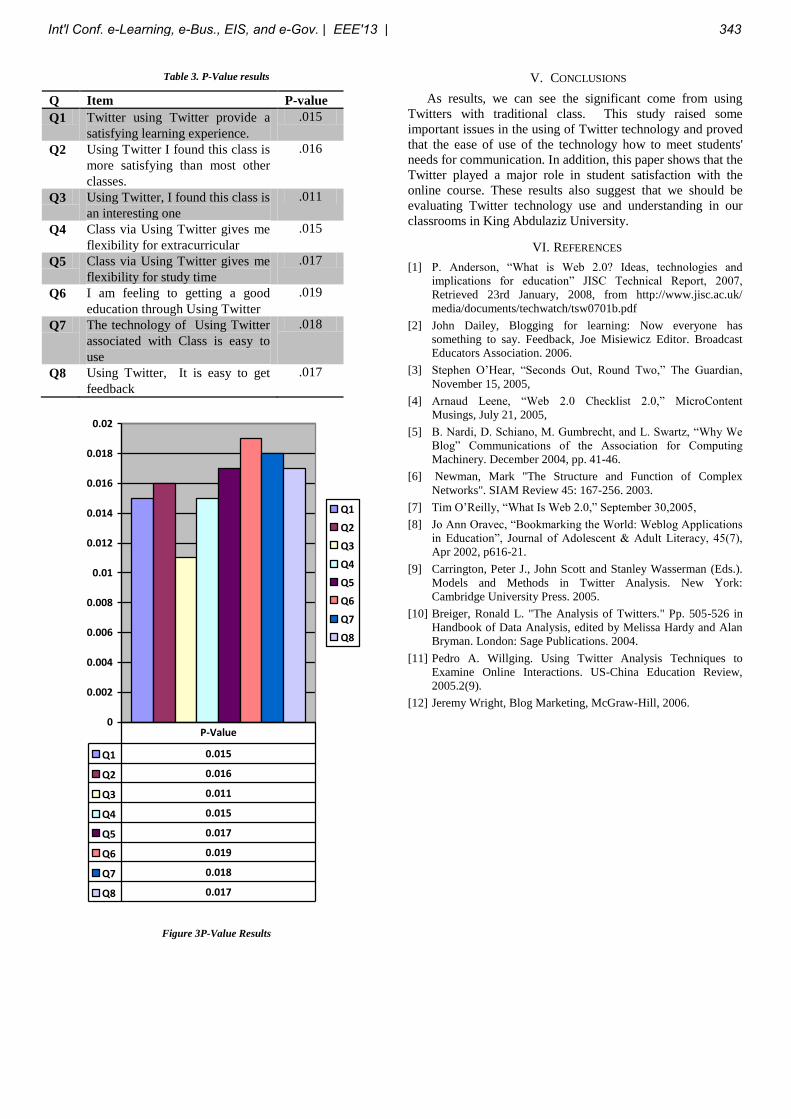
Table 3. P-Value results
Q Item P-value
Q1 Twitter using Twitter provide a
satisfying learning experience.
.015
Q2 Using Twitter I found this class is
more satisfying than most other
classes.
.016
Q3 Using Twitter, I found this class is
an interesting one
.011
Q4 Class via Using Twitter gives me
flexibility for extracurricular
.015
Q5 Class via Using Twitter gives me
flexibility for study time
.017
Q6 I am feeling to getting a good
education through Using Twitter
.019
Q7 The technology of Using Twitter
associated with Class is easy to
use
.018
Q8 Using Twitter, It is easy to get
feedback
.017
0
0.002
0.004
0.006
0.008
0.01
0.012
0.014
0.016
0.018
0.02
Q1
Q2
Q3
Q4
Q5
Q6
Q7
Q8
Q1 0.015
Q2 0.016
Q3 0.011
Q4 0.015
Q5 0.017
Q6 0.019
Q7 0.018
Q8 0.017
P-Value
Figure 3P-Value Results
V. CONCLUSIONS
As results, we can see the significant come from using
Twitters with traditional class. This study raised some
important issues in the using of Twitter technology and proved
that the ease of use of the technology how to meet students'
needs for communication. In addition, this paper shows that the
Twitter played a major role in student satisfaction with the
online course. These results also suggest that we should be
evaluating Twitter technology use and understanding in our
classrooms in King Abdulaziz University.
VI. REFERENCES
[1] P. Anderson, “What is Web 2.0? Ideas, technologies and
implications for education” JISC Technical Report, 2007,
Retrieved 23rd January, 2008, from http://www.jisc.ac.uk/
media/documents/techwatch/tsw0701b.pdf
[2] John Dailey, Blogging for learning: Now everyone has
something to say. Feedback, Joe Misiewicz Editor. Broadcast
Educators Association. 2006.
[3] Stephen O’Hear, “Seconds Out, Round Two,” The Guardian,
November 15, 2005,
[4] Arnaud Leene, “Web 2.0 Checklist 2.0,” MicroContent
Musings, July 21, 2005,
[5] B. Nardi, D. Schiano, M. Gumbrecht, and L. Swartz, “Why We
Blog” Communications of the Association for Computing
Machinery. December 2004, pp. 41-46.
[6] Newman, Mark "The Structure and Function of Complex
Networks". SIAM Review 45: 167-256. 2003.
[7] Tim O’Reilly, “What Is Web 2.0,” September 30,2005,
[8] Jo Ann Oravec, “Bookmarking the World: Weblog Applications
in Education”, Journal of Adolescent & Adult Literacy, 45(7),
Apr 2002, p616-21.
[9] Carrington, Peter J., John Scott and Stanley Wasserman (Eds.).
Models and Methods in Twitter Analysis. New York:
Cambridge University Press. 2005.
[10] Breiger, Ronald L. "The Analysis of Twitters." Pp. 505-526 in
Handbook of Data Analysis, edited by Melissa Hardy and Alan
Bryman. London: Sage Publications. 2004.
[11] Pedro A. Willging. Using Twitter Analysis Techniques to
Examine Online Interactions. US-China Education Review,
2005.2(9).
[12] Jeremy Wright, Blog Marketing, McGraw-Hill, 2006.
Int'l Conf. e-Learning, e-Bus., EIS, and e-Gov. | EEE'13 | 343
Overcoming the barriers to implement electronic learning in
Higher education (HE)
Dr. Nasreddin B. ElZoghbi , Sir. Abdulbasit S. Khashkhush
E-Mail: " [email protected] " "[email protected] " University of Tripoli Faculty of Science Salford University,
Computer Science Dept. P.O.Box 13270 great Manchester M5 4WT,
Tripoli Libya UK.
Abstract
Technological innovations have not only brought benefits to business, but to Higher Education, worldwide. Colleges and universities are using E-learning to make learning more accessible and efficient. This paper assessed the attitudes of staff member towards challenges to embracing e-learning. However, Libya is a very wide State and the distribution of the population is concentrated in certain & specified areas make the academic education sometimes difficult either due to distance from the educational centres or due to lack of time or due to handicapped body or others. E-Learning system enables students of all ages and abilities the chance to learn anywhere, at any time and at their own pace. This paper aims to shed light on the role of e-Learning in the Libyan Education System and how it can be improved as well as discussing in general the effectiveness of this system in Libyan higher education by focusing on the factors that affect the up take of this system in Libya. Nevertheless, in this paper the semi-structured interviews with the senior leaders within two universities had been used to identify the factors that affect e-Learning. The paper concludes that at present “e-Learning” does not apply. Nevertheless this is not to say that it cannot be achieved in the future. It suggests that e-Learning requires a minimum technological plat form. However, this paper focuses on two public universities (University of Tripoli and the Al-Zawia University, and hence the generalisation of the findings outside of these universities cannot be validated. However, the paper’s findings appear to be
intuitively general sable beyond the subject topic. This paper can support capacity building in e-Learning systems in Libya by the identification of needs, which is an important initial stage in any capacity building programme. Overall This is an original approach to the evaluation of the status of e- learning in Higher Education (HE) in Libya. Keywords : Overcome e- learning barriers; Attitudes towards e- learning, ICT infrastructure, e- learning Factors, Libyan Higher Education, Introduction:
The World has been seeing rapid changes in all aspects of life. All countries have been Subject to fierce competition in almost all aspects of life including economic, and educational, along with the information technology revolution which achieved major shifts in improving computer applications, such shifts resulted in improving the competitiveness of the future graduates in the fields of construction & enterprise. In order to improve the competitiveness of the coming generations, traditional education should be revised and further developed through designing and introducing new educative programs using developed ICT facilities. Despite the importance of E-Learning in Higher Education (HE) and human development in Libya, implementation of E- learning is facing a number of challenges in Libyan universities. Those challenges can be summarized as follows: ____________________________________________________________________
344 Int'l Conf. e-Learning, e-Bus., EIS, and e-Gov. | EEE'13 |
_______ Leadership; ICT infrastructure; Finance; Culture; Instructors & learners; Lack of Strategy; and Technical expertise. Regardless of these challenges the future is optimistic, offering innovative and advanced opportunities to implement e-learning. The E- learning program, if established in Libya, will help to solve the problems resulting from a shortage of traditional education institutions that hold an
increasing number of students who wish to study at university providing them with a chance to learn and promote scientific cooperation and research in order to reach every individual in the community. E-learning would also provide education for those who missed such opportunities and give provide them with knowledge of technological developments to continue in other areas of technical development.
Definition of E-learning:
There is a wide range of definitions for E-
learning. E- learning offers opportunities
to learn anywhere without being in a
lecture theatre (Yieke, 2005); E- learning is
defined as learning facilitated and
supported through the use of information
and communications technology. E-
learning is no longer simply associated
with distance or remote learning, but forms
part of a conscious choice of the best and
most appropriate ways of promoting
effective learning. Khan (2000) defines
that E- learning encompasses web-based
learning (WBL); internet-based training
(IBT); advanced distributing learning
(ADL); and online learning (OL). More
simply, E-learning can be thought of as
anything that incorporates technology with
interactivity to support learning, training
and communication among groups and
between individuals. Basically, technology
has given us the opportunity to learn
anywhere, anytime, and at our own pace.
Additionally E-learning is using
technology to deliver learning and training
programs (Knowledge passed through the
internet, network, or standalone computer).
Therefore it is any technology-mediated
learning using computers whether from a
distance or in a classroom setting (
Nicholas Croft 2010).
Higher Education context in Libya: Libya is an Arab country located in Northern Africa and it covers a land area about 1,759,540 sq km. The capital of Libya is Tripoli and the main language spoken is Arabic. Italian and English languages are widely understood in the major cities of Libya. The total population of Libya is approximately 5.5 million, of which 1.7 million are students; over 270,000 of whom study at the tertiary level (Clark, 2004). El-Hawat (2003) reported that in the academic year 1975/76 the number of university students was estimated to be 13,418. This number has increased to more than 200,000 of which about an additional 65,000 students enrolled in the higher technical and vocational sector. The consequence of this
rapid increase in the number of students in HE in Libya has resulted in an increase in the number of institutions providing HE. The university sector in Libya started in the early 1950s with the establishment of the “Libyan University”. It has campuses in Benghazi and Tripoli and it has grown over the years to incorporate Faculties of Arts and Education; Faculty of Science; Faculty of Economics and Faculty of Commerce, Law, and Agriculture. Libya has a history of sending university students abroad. In 1978, more than 3,000 students were studying in the United States alone. However, by 2002 those figure had dropped to just 33 as a result of sanctions imposed in 1986, which restricted travel to the United States by Libyan nationals. According to the British Council (British
Int'l Conf. e-Learning, e-Bus., EIS, and e-Gov. | EEE'13 | 345
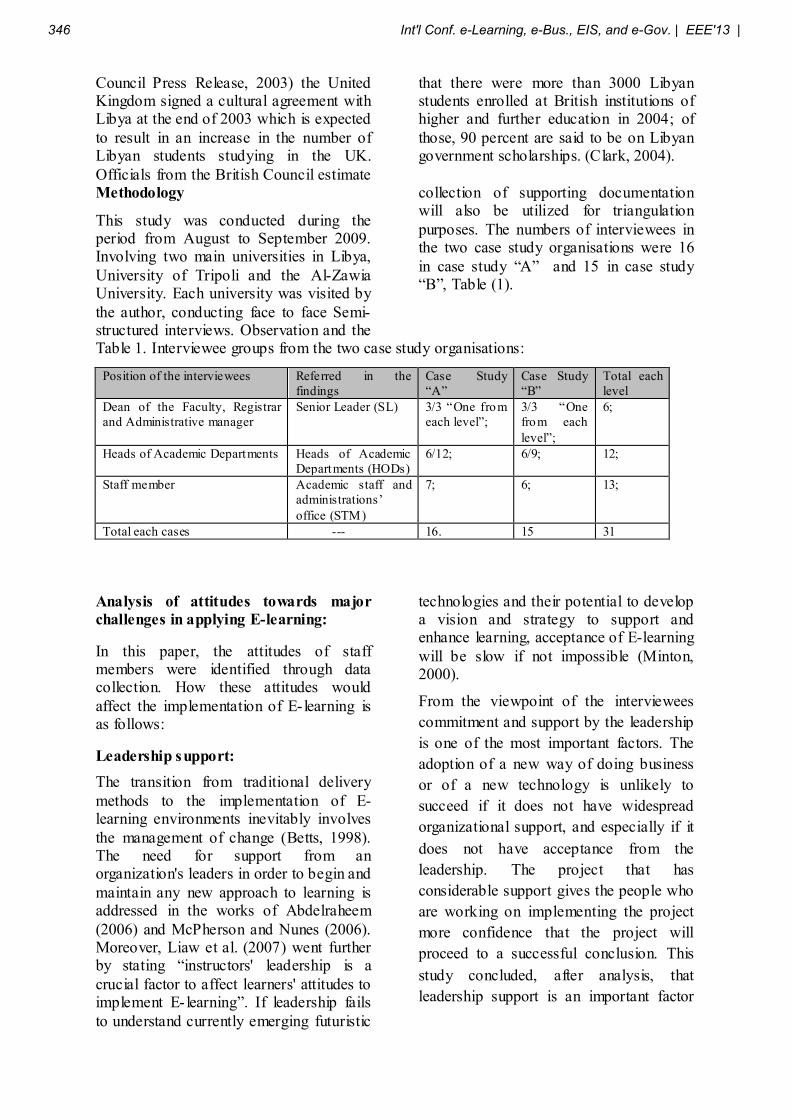
Council Press Release, 2003) the United Kingdom signed a cultural agreement with Libya at the end of 2003 which is expected to result in an increase in the number of Libyan students studying in the UK. Officials from the British Council estimate
that there were more than 3000 Libyan students enrolled at British institutions of higher and further education in 2004; of those, 90 percent are said to be on Libyan government scholarships. (Clark, 2004).
Methodology
This study was conducted during the period from August to September 2009. Involving two main universities in Libya, University of Tripoli and the Al-Zawia University. Each university was visited by the author, conducting face to face Semi-structured interviews. Observation and the
collection of supporting documentation will also be utilized for triangulation purposes. The numbers of interviewees in the two case study organisations were 16 in case study “A” and 15 in case study “B”, Table (1).
Table 1. Interviewee groups from the two case study organisations:
Position of the interviewees Referred in the findings
Case Study “A”
Case Study “B”
Total each level
Dean of the Faculty, Registrar and Administrative manager
Senior Leader (SL) 3/3 “One from each level”;
3/3 “One from each level”;
6;
Heads of Academic Departments Heads of Academic Departments (HODs)
6/12; 6/9; 12;
Staff member Academic staff and administrations’ office (STM)
7; 6; 13;
Total each cases --- 16. 15 31
Analysis of attitudes towards major challenges in applying E-learning:
In this paper, the attitudes of staff members were identified through data collection. How these attitudes would affect the implementation of E- learning is as follows:
Leadership support:
The transition from traditional delivery methods to the implementation of E-learning environments inevitably involves the management of change (Betts, 1998). The need for support from an organization's leaders in order to begin and maintain any new approach to learning is addressed in the works of Abdelraheem (2006) and McPherson and Nunes (2006). Moreover, Liaw et al. (2007) went further by stating “instructors' leadership is a crucial factor to affect learners' attitudes to implement E- learning”. If leadership fails to understand currently emerging futuristic
technologies and their potential to develop a vision and strategy to support and enhance learning, acceptance of E-learning will be slow if not impossible (Minton, 2000).
From the viewpoint of the interviewees
commitment and support by the leadership
is one of the most important factors. The
adoption of a new way of doing business
or of a new technology is unlikely to
succeed if it does not have widespread
organizational support, and especially if it
does not have acceptance from the
leadership. The project that has
considerable support gives the people who
are working on implementing the project
more confidence that the project will
proceed to a successful conclusion. This
study concluded, after analysis, that
leadership support is an important factor
346 Int'l Conf. e-Learning, e-Bus., EIS, and e-Gov. | EEE'13 |
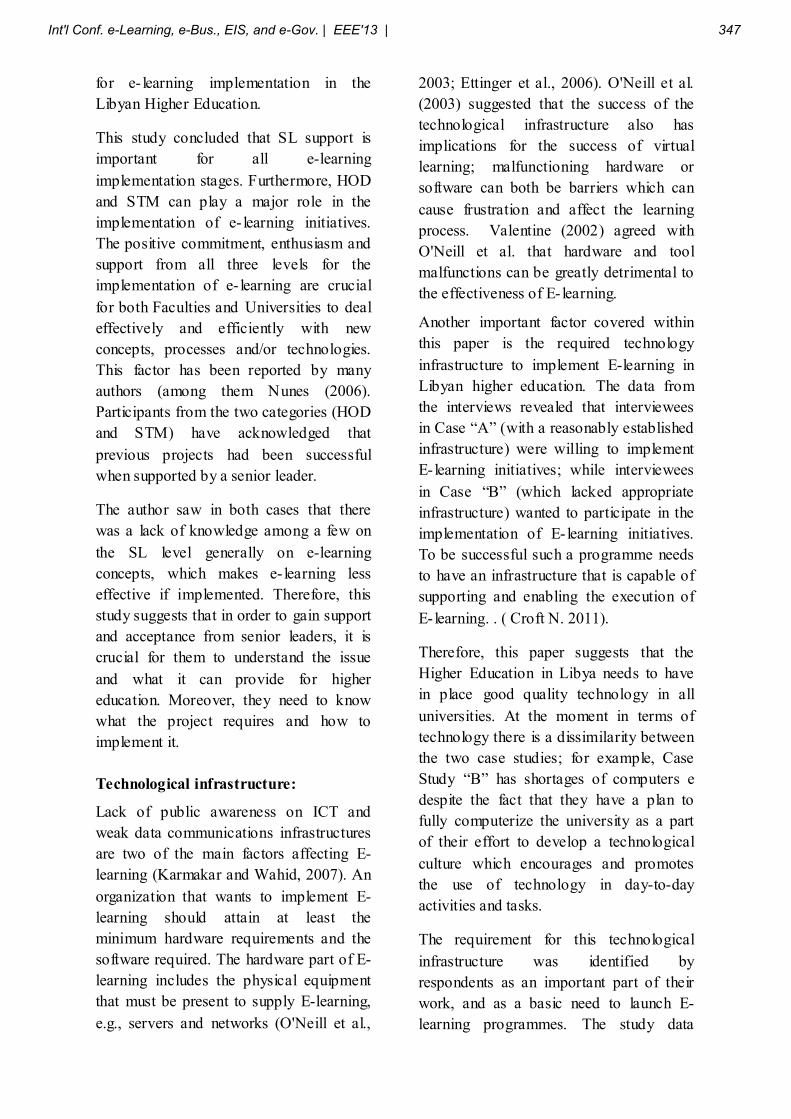
for e- learning implementation in the
Libyan Higher Education.
This study concluded that SL support is
important for all e-learning
implementation stages. Furthermore, HOD
and STM can play a major role in the
implementation of e- learning initiatives.
The positive commitment, enthusiasm and
support from all three levels for the
implementation of e- learning are crucial
for both Faculties and Universities to deal
effectively and efficiently with new
concepts, processes and/or technologies.
This factor has been reported by many
authors (among them Nunes (2006).
Participants from the two categories (HOD
and STM) have acknowledged that
previous projects had been successful
when supported by a senior leader.
The author saw in both cases that there
was a lack of knowledge among a few on
the SL level generally on e-learning
concepts, which makes e- learning less
effective if implemented. Therefore, this
study suggests that in order to gain support
and acceptance from senior leaders, it is
crucial for them to understand the issue
and what it can provide for higher
education. Moreover, they need to know
what the project requires and how to
implement it.
Technological infrastructure:
Lack of public awareness on ICT and
weak data communications infrastructures
are two of the main factors affecting E-
learning (Karmakar and Wahid, 2007). An
organization that wants to implement E-
learning should attain at least the
minimum hardware requirements and the
software required. The hardware part of E-
learning includes the physical equipment
that must be present to supply E-learning,
e.g., servers and networks (O'Neill et al.,
2003; Ettinger et al., 2006). O'Neill et al.
(2003) suggested that the success of the
technological infrastructure also has
implications for the success of virtual
learning; malfunctioning hardware or
software can both be barriers which can
cause frustration and affect the learning
process. Valentine (2002) agreed with
O'Neill et al. that hardware and tool
malfunctions can be greatly detrimental to
the effectiveness of E- learning.
Another important factor covered within
this paper is the required technology
infrastructure to implement E-learning in
Libyan higher education. The data from
the interviews revealed that interviewees
in Case “A” (with a reasonably established
infrastructure) were willing to implement
E- learning initiatives; while interviewees
in Case “B” (which lacked appropriate
infrastructure) wanted to participate in the
implementation of E- learning initiatives.
To be successful such a programme needs
to have an infrastructure that is capable of
supporting and enabling the execution of
E- learning. . ( Croft N. 2011).
Therefore, this paper suggests that the
Higher Education in Libya needs to have
in place good quality technology in all
universities. At the moment in terms of
technology there is a dissimilarity between
the two case studies; for example, Case
Study “B” has shortages of computers e
despite the fact that they have a plan to
fully computerize the university as a part
of their effort to develop a technological
culture which encourages and promotes
the use of technology in day-to-day
activities and tasks.
The requirement for this technological
infrastructure was identified by
respondents as an important part of their
work, and as a basic need to launch E-
learning programmes. The study data
Int'l Conf. e-Learning, e-Bus., EIS, and e-Gov. | EEE'13 | 347
showed that Case Study “A” enjoyed the
best technological infrastructure capability,
while Case Study “B” showed the lowest
standard of technological infrastructure,
but the author expects the level of
technology use among Libyan Staff
member will increase in coming years, as
the plan is to provide the university in
Case Study “B” with computers and
sufficient technology.
Funds:
The consideration of the initial cost as well
as the continuing costs of installing,
maintaining, using and upgrading
technology, and the human capital costs to
support E- learning, is very important
(Valentine, 2002). Marengo and Marengo
(2005) demonstrated that the costs of
technological infrastructure include digital
content costs, maintenance costs, content
hosting costs, hardware and software costs
and costs of E- learning staff. Staff costs
include tutoring costs, administration and
management costs and Expert in
Multimedia Technology (ETM) costs. In
addition, Marengo and Marengo (2005)
stated that, in cases where the hardware
and software supplied by the faculty to
circulate the contents (software, document,
etc..) are not sufficient, the E-learning
evaluation needs to take into account the
cost of items, such as the purchase of a
server and its relative software. The lack of
money can be problematical for the
implementation of E- learning particularly
with the continuous labour costs of
instructors (Cho and Berge, 2002; James-
Gordon et al., 2003; Berge and
Muilenburg, 2006).
The majority (87.5%, 14) of the
interviewees agreed that the university has
enough financial resources to cover the
expenses and technical requirements of
adopting and providing E- learning (Figure
1). The author found in the interviews that
this factor was not of significance to the
interviewees. They confirmed that the
entire funding for any project comes from
a single source; that the government is
based on political decision-taking and thus
if the universities decide to adopt E-
learning, there would be no problem in
funding. Only one STM from Case Study
“A” responded ‘don't know about the
availability’ in answer to this particular
question.
Most of the interviewees stated if they
wanted to request anything the university
is able to afford it. One senior leader from
Case Study “A” and another one in the
same position in Case Study “B” reported
that if a decision is taken on the adoption
and implementation of any project, such as
E- learning for example, it will be passed
together with a budget from the finance
sector and that a decision on E-learning
implementation must come from the
General People’s Committee of HE. The
author agrees that this is the system in
Libya in all public sectors.
The author concluded that funding is not a
significant factor in Libya because if a
decision is taken to implement E-learning,
funding will be approved by the
government, and thus in Libya it is a
different scenario to that stated in the
literature where other sources say that it is
possible that E-learning could be
undertaken either by the government or by
private investment or by partnership.
348 Int'l Conf. e-Learning, e-Bus., EIS, and e-Gov. | EEE'13 |
Figure1 Case Study “A”: Number of respondents who confirmed that funding could be made
available.
Resistance to changes:
Resistance to change is one of the
important factors affecting the
implementation of E- learning (Minton,
2000; Cho and Berge, 2002; Berge and
Muilenburg, 2006; Ettinger et al., 2006).
This resistance to change in some
countries is usually because of the high
percentage of illiteracy in those countries
(Karmakar and Wahid, 2007). Moreover,
Habibu (2003) stated that resistance to
change is one of the factors that should be
considered when implementing E-learning.
It relates particularly to non-technical
issues which includes academic staff,
administrators, and/or managers. This
resistance can be divided into three main
reasons: fear of ICT; lack of time to
design, develop and maintain support for
online classes’ materials, and fear of
exposing the quality of work. Lecturers are
one of the major factors that contribute to
the success of E- learning. For lecturers,
implementation of E- learning programmes
represents a change in teaching style and
materials. The precise nature of the change
is difficult to quantify (O'Neill et al.,
2003). O'Neill et al. (2003) stressed that
human resources should be committed to
the project at an early stage and lecturers
should be selected based on their attitude
towards technology. According to Liaw et
al. (2007) personal attitude is a major
factor affecting usage of IT. . ( Croft N.
2011).
Understanding a user's attitudes toward E-
learning facilities is important for the
creation of appropriate E-learning
environments for teaching and learning.
The acceptance and implementation of
electronic learning involves altering
human behaviour and activities. The
majority of the respondents (81.3%)
agreed that there is a natural resistance to
change for different reasons. The senior
leaders believed that their Heads of
Department and their staff members
resisted change because they fear using
technology; because they lack time to
design on- line teaching materials; and
because E- learning might expose the
quality of their work and may lead to a
reduction in jobs.
Resistance to change and staff culture are
important factors affecting the
implementation of E- learning The
implementation of electronic learning
involves changing individual behaviour
and activities and the majority of the
Int'l Conf. e-Learning, e-Bus., EIS, and e-Gov. | EEE'13 | 349
respondents agreed that there is a usual
resistance to change and adoption of any
new technology for different reasons.
In the two case studies, Case Study “A”
and Case Study “B”, the majority agreed
that the reasons for resistance to change
are a lack of time, fear of technology and
fear that the staff member is exposing the
quality of their work. But some of
respondents added other reasons which
were: fear of losing their jobs, fear of
using the English language and time
pressures on their work load.
Staff education/training:
One of the most challenging factors for
STM and universities around the world is
technology and the need for continuous
training for keeping up-to-date with
advanced technology.
Staff education and knowledge is another
important factor for the successful
adoption of E- learning systems, University
staff members need to be aware of the
need to continue learning and to utilise IT
technological infrastructures to acquire and
manage knowledge. Training to use E-
learning systems will ensure that they can
utilise the full potential and capabilities
offered by ICT tools. If universities
provided staff with adequate and quality
training to facilitate the use of technology
and E- learning systems then staff would,
in all probability, find E- learning systems
easy to use. It is important that universities
promote and educate staff to use E-
learning systems rather than forcing them
to do so.
Technical expertise:
Lack of personal technological expertise in
solving technical problems is one of the
main factors affecting an E-learning
programme (O'Neill et al., 2003; Berge
and Muilenburg, 2006). Valentine (2002)
added one overlooked factor in the success
or failure of E- learning programmes, i.e.
the role that technicians play in E- learning.
The author noted in the findings that there
were disparities between Case Study “A”
and Case Study “B”. In Case Study “A” it
was noted that the most of the answers
from SL, HOD and STM indicated that
they have some professionals who
undertake the maintenance of equipment
(for example, computers) and that they
also have some expertise in programming,
multimedia technology and experts in
information technology, and project
management. In Case Study “B” most of
the answers from the interviewees
indicated that there was a shortage of such
professionals who can maintain equipment
such as hardware and multimedia
technology; there was also a shortage of
specialists in software programming such
as project management and information
systems.
Strategy:
From the literature and the findings, the
setting up of a strategy was found to be an
important factor for the implementation of
E- learning in the Libyan case studies.
This study concluded that the strategy has
not only to be directed from the leadership,
it also has to be established within each
faculty to enable all participants/staff to
work towards realizing the goals and
objectives of such a programme and to
ensure that work is undertaken towards
achieving the essential goal of
implementing E-learning.
The findings revealed that a strategy for
the implementation of E- learning in Libya
was non-existent. This was supported by
SL, HOD and STM in Case Study “A” and
350 Int'l Conf. e-Learning, e-Bus., EIS, and e-Gov. | EEE'13 |

HOD and STM from Case Study “B”. One
of the STMs stated that the technology was
available and the adoption of E-learning
should be a part of the University strategy.
Therefore, this study suggests that Higher
Education in Libya needs to have a
comprehensive and clear strategic plan to
implement E-learning programmes, and
the author believes that postgraduate
programmes with their fewer students
could be used as a pilot for E-learning
systems after an E-learning strategy has
been introduced.
Overcoming factors that affect the
initiation of E-learning in Libyan HEIs:
Overcoming the factors that prevent the
implementation of E- learning programmes
in Libya is very important to Libyan HE,
because the country needs to develop its
HE universities and education system to
reach everybody in the rural areas and to
face an increasing demand for higher
education and a growing number of
students. Therefore, it should take urgent
steps to overcome these factors.
Firstly, as this study suggests in the
discussion on strategy, ministry of Higher
Education in Libya needs to have a
complete strategy plan to implement E-
learning programmes with specific guiding
principles to follow in E-learning
development, and should submit a draft to
the universities on an E- learning strategy,
so that they can commence preliminary
steps to implement E- learning and
encourage strategic projects in Libya HE.
The strategy should encompass project
management and educational objectives;
technology infrastructure, training and
usage support; comprehensive E- learning-
related training programmes and a strategy
for technical support and maintenance. (
Croft N. 2011)
Another point is equality in the technical
infrastructure in all Libyan HE universities
and faculties. This is very important as it
will enable them to share information,
collaborate, and allow staff to gain
knowledge and skills by technology. They
should all have a good infrastructure as the
researcher noted that there was a notable
difference between the two case studies:
Case Study A had a good infrastructure
and Case Study B had a lack of
infrastructure and in Case Study B many
of the interviewees acknowledged the need
to launch a technology infrastructure as a
prerequisite for the implementation of E-
learning initiatives.
Moreover, HE should organize seminars
and workshops, lectures and conferences
about the value and benefits of E-learning
to increase the overall awareness of a
technology culture and the fact that it
should be launched at all levels in the HE
universities.
The implementation of E- learning should
be understood well in advance and
awareness by staff in Libyan HE
universities must be raised by staff
attending lectures (there was a lack of
attendance at such events in Case A),
seminars and conferences. All this must
take place in order to raise the awareness
of electronic culture (Case Study B) within
the STM to allow for the application of
electronic learning, because currently the
STM culture, especially within the older
generations, hinders the implementation of
E- learning.
Furthermore, Libyan HE should establish
an independent training department to
unify the training strategy in order to
implement such a programme and to
determine training objectives, needs &
types, to provide quality training, and to
Int'l Conf. e-Learning, e-Bus., EIS, and e-Gov. | EEE'13 | 351

select targeted individuals and the quality
of trainees for E-learning.
The training department should also
respond to the training needs of each HE
university with particular regard to E-
learning and should implement a clear plan
for training in order to increase the
capacity and development of staff
knowledge and skills.
The training should include technology
especially training on computer skills,
introduce ICDL and the internet and it
should include training on the English
language. Additionally if the STM gained
more knowledge, skills, and experience of
technology and became more ICT literate,
then they would be more prepared to use
such programmes.
The ICDL exists to assist individuals in
performing their work and duties by using
computers and to perform the required
tasks. The ICDL system encompasses
seven training units: the basic concepts of
information technology; using a computer
and managing files; word processing;
spreadsheets; databases; presentations, and
information and communications. ICDL
courses will provide trainees with a solid
foundation of basic skills to help them use
computer skills efficiently and with full
confidence especially for the older
generation STM. New computers users and
staff with a poor knowledge of the English
language can use the Arabic version of
ICDL.
In addition, there is a need to utilise
training taken abroad if it is not available
in Libya in order to increase the
effectiveness of STM in the use of
technology and to increase their technical
skills so that they can be technically
qualified.
As a result, training should have a strategy
which should be addressed early on with
other strategies and should encourage
STM through a motivation and reward
system.
A further point which should help
overcome resistance to change is a reward
system which is likely to increase energy,
creativity, provide complete and better
services and improve productivity from
STM to help in the implementation of E-
learning. Also this reward system should
be aligned to motivate staff performance
that is consistent with the universities’
strategy, to attract and retain people with
the skills and knowledge required to
conform with the HE strategic goals, and
to create a supportive culture and structure.
( Nicholas Croft 2010)
Conclusion:
The implementation of E- learning can
create enormous changes within a Libyan
HE university, so it can expect to face
factors such as resistance to change as the
institution changes the way instructors
teach, managers manage, and reforms are
undertaken of the current work process by
changing boring routine work, eliminating
bureaucracy, and improving transparency.
The factors affecting the implementation of E-learning should be well understood in advance and increasing awareness by the staff in Libyan HE universities must be raised by staff members attending lectures, seminars and conferences. The failure of Libyan HE Institutions to accept and develop a vision and strategy to understand the current emerging advanced technologies will seriously undermine any potential to implement the E-learning process. As a result, training should have a strategy which should be addressed early alongside other strategies and should encourage STM through a motivation and reward system. E- learning requires a minimum technological platform which
352 Int'l Conf. e-Learning, e-Bus., EIS, and e-Gov. | EEE'13 |
includes necessary hardware, adequate telecommunication capabilities and access to software. Lecturers should be selected based on their experience, potential and outlook toward new technology. Experts in multimedia technology have to support teachers in the activities of organization and management and, to some extent, the development of E- learning courses as well. The implementation of E-learning programmes represents a change in teaching style and materials.
This paper has contributed to the discussion how Overcoming factors that affect the initiation of E-learning in Libyan HE.
References:
Abdelraheem, A., Y., (2006) "The implementation of E-learning in the Arab University: Challenges and opportunities". In Proceeding of APRU DLI Tokyo, Japan. Berge, Z., and Muilenburg, L., Y., (2006) "Barriers to distance Education: Perceptions of K-12 Educators". Retrieved September 21 2007 from: http://www.emoderators.com/barriers/barriersK12.html. Betts, K., S., (1998) "An Institutional Overview: Factors Influencing Faculty Participation in Distance Education in Postsecondary Education in the United States: An Institutional Study". Online Journal of Distance Learning Administration, Vol. 1 No. 3. Retrieved November 28, 2007 from: http://www.westga.edu/%7Edistance/betts13.html. British Council Press Release. 18 Dec. 2003. “British Council Signs Major Agreement With Libya.” Cho, S., K., and Berge, Z., (2002) "Overcoming Barriers to Distance Training and Education" Journal of USDLA Vol. 16(1). Retrieved September 21 2007 from: http://www.emoderators.com/barriers/cho.html.
Clark, N., (2004) "World Education News and Views" available at: http://www.wes.org/ewenr/PF/04Jul/PFP/ractical.htm 02/05/2007
Croft, N. , Dalton, A. and Grant, M. (2011)
Overcoming isolation in distance learning:
Building a learning community through time,
space and sector. Working Paper. Higher
Education Academy Centre for Education in
the Built Environment (CEBE).
El-Hawat, A., (2004) "African Higher Education: An International Reference Handbook" (Damtew Teferra and Philip. G. Altbach, eds., Indiana University Press, 2003), pp. 391-402. Ettinger, A., Holton, V., and Blass, E., (2006) "E-learning experience: Key questions to ask when considering implementing E-learning" Industrial and Commercial Training. Vol. 38, No. 3, PP. 143-147. Habibu, A., (2003) "E-learning Challenges In Africa Case Study Uganda, Institute of Computer Science Makerere University Uganda" Retrieved August, 30, 2007 from: http://www.google.co.uk/search?q=introuction+to+%22E-learning+challenges. James-Gordon, Y., Young, A., and Bal, J., (2003) "External environment forces affecting E-learning providers" Marketing Intelligence & Planning. Vol. 21, No. 3, PP. 168-172 Karmakar, C., K., Wahid, CM., M., (2007) "Prospects Of E-learning in the context of current ICT Infrastructure of Bangladesh" Retrieved November 05,2007 from: http://www.codewitz.net/papers/MMT_83-89_FullPaper_Wahid_Karmakar.pdf. Khan, B., H., (2000) "A framework for web-based learning". Englewood Cliffs, NJ: Educational Technology Publications. Liaw, S., Huang, H., and Chen, G., (2007) "Surveying instructor and learner attitudes toward E-learning". Computer & Education, No. 49, 1066-1080.
Int'l Conf. e-Learning, e-Bus., EIS, and e-Gov. | EEE'13 | 353
McPherson, M., and Nunes, M., B. (2006) "Organisational issues for E-learning Critical success factors as identified by HE practitioners". International Journal of Educational Management, Vol. 20, No. 7, pp.542-558. Marengo, A., and Marengo, V., (2005) "measuring the Economic Benefits of E-learning: A Proposal for New Index for Academic Environments". Journal of Information Technology, Vol. 4, PP.329-346. Minton, M., C., (2000) "Is Your Organization Ready for E-learning?" Communication Project Magazine. Vol. 3.1, available at: http://www.comproj.com/Minton.htm. Nicholas Croft, Alice Dalton, and Marcus
Grant: (2010) Overcoming Isolation in
Distance Learning: Building a Learning
Community through Time and Space. Journal
for Education in the Built Environment 5(1).
O'Neill, K., Singh, G., and O'Donoghue, J., (2004) "Implementing eLearning Programmes for Higher Education: A Review of the Literature" Journal of Information Technology Education. Vol. 3, PP. 313-323. Valentine, D., (2002) "Distance Learning: Promises, Problem, and Possibilities" Online Journal of Distance Learning Administration, Vol. V No. III. Retrieved December 22, 2007 from http://www.westga.edu/~distance/ojdla/fall53/valentine53.html. Yieke, F., A., (2005), "Toward Alternatives in Higher Education: The Benefits and Challenges of E-learning in Africa", CODESRIA Bulletin No. 3&4, PP. 73-75
354 Int'l Conf. e-Learning, e-Bus., EIS, and e-Gov. | EEE'13 |
Improving Student Success Rate
With Online Homework
Larry Wang, Zhu Cao
Mathematics Department, Southern Polytechnic State University, Marietta, GA, USA
Abstract - The aim of this paper is to demonstrate how online
homework improves student success rates in PreCalculus and
Calculus I courses. WeBWorK, provided by the Mathematical
Association of America, was adopted as the online homework
system. In the spring of 2013, the system was implemented in
two classes, one section of PreCalculus and one section of
Calculus I. As a result, the pass rates of both sections with
WeBWorK were well above other sections without WeBWorK
(about 17% higher). This paper also shows how the WeBWorK
system was used.
Keywords: Online grading, WeBWorK, pass rate.
1 Introduction
As one of the core areas in college, Math often becomes
a hurdle for students. The pass rate in this subject shows that
math courses can hinder students’ success in college
endeavors. Currently, the pass rates in most sections of College
Algebra, PreCalculus, and Calculus I at our institution are
very low (around 60%). The cause of failure is partially due to
the lack of interaction between teachers and students. With
oversized classes (usually 30 or more students in a class), the
instructor does not have enough time to grade homework.
Some students do not work on suggested homework problems
at all. Consequently, these students do poorly on the tests.
They feel frustrated and lose their interest in the subject. An
online homework system can help improve this situation. An
online homework system will help make up for the lack of
interaction between teachers and students. Students will likely
do their homework online because many of them are used to
and prefer a technological environment. If students complete
their homework, they will come to class prepared and ready to
participate in discussion. As a result, students will be
motivated to learn and will be able to succeed in the course.
The following two tables show the dramatic increases in pass
rates with the WeBWorK system.
2 WeBWorK
WeBWorK is an open-source online homework system
for math and science courses. It is supported by the
Mathematical Association of America and the National
Science Foundation and comes with a National Problem
Library (NPL) of over 20,000 homework problems. Problems
in the NPL target most lower division undergraduate math
courses and some advanced courses. Supported courses
include college algebra, discrete mathematics, probability and
statistics, single and multivariable calculus, differential
equations, linear algebra, and complex analysis. Over 300
colleges, universities, and high schools have successfully used
WeBWorK. Unlike other commercial online homework
softwares, WeBWork is free to students. It is also easier to
manage and popularize the system. WeBWorK provides the
tools needed to assign and grade homework easily. Students can do their homework from anywhere and at any time as
long as they can access the internet. The assignments do not
have to be completed all at once. They can also be printed out
and worked on by students. Students receive feedback
immediately after they submit their answers. They can keep
trying until they get the correct answer or reach a limit of tries
set by the instructor. The instant feedback either gives
immediate gratification for correct answers or drives students
to work hard in trying again: in both scenarios the student is
more engaged in the homework. After the due date, students
can view the solutions to the problems. WeBWorK offers
students a personalized, interactive learning environment,
where they can learn at their own pace and measure their own
progress. In addition, WeBWorK provides different sets of
problems for different students. This feature allows students
to work together, yet still figure out how to solve the problems
independently. Thus the common problem of academic
dishonesty is avoided while still allowing students to work
together.
3 Implementation
In the spring of 2013, WeBWorK was adopted in one
section of PreCalculus and one section of Calculus I offered at
Southern Polytechnic State University. Students were assigned
homework through WeBWorK once every two weeks. Each of
the assignments consisted of 10-20 questions with multiple
parts and a due date. They were given four or five tries for
each problem, depending on the difficulty of the problem.
Usually, they were given one week to work on each
assignment. During the weeks in which there was no
WeBWorK homework, traditional homework was assigned.
The homework contributed to about 15% of the final course
grade. Students still took the regular quizzes, tests, and a
Int'l Conf. e-Learning, e-Bus., EIS, and e-Gov. | EEE'13 | 355
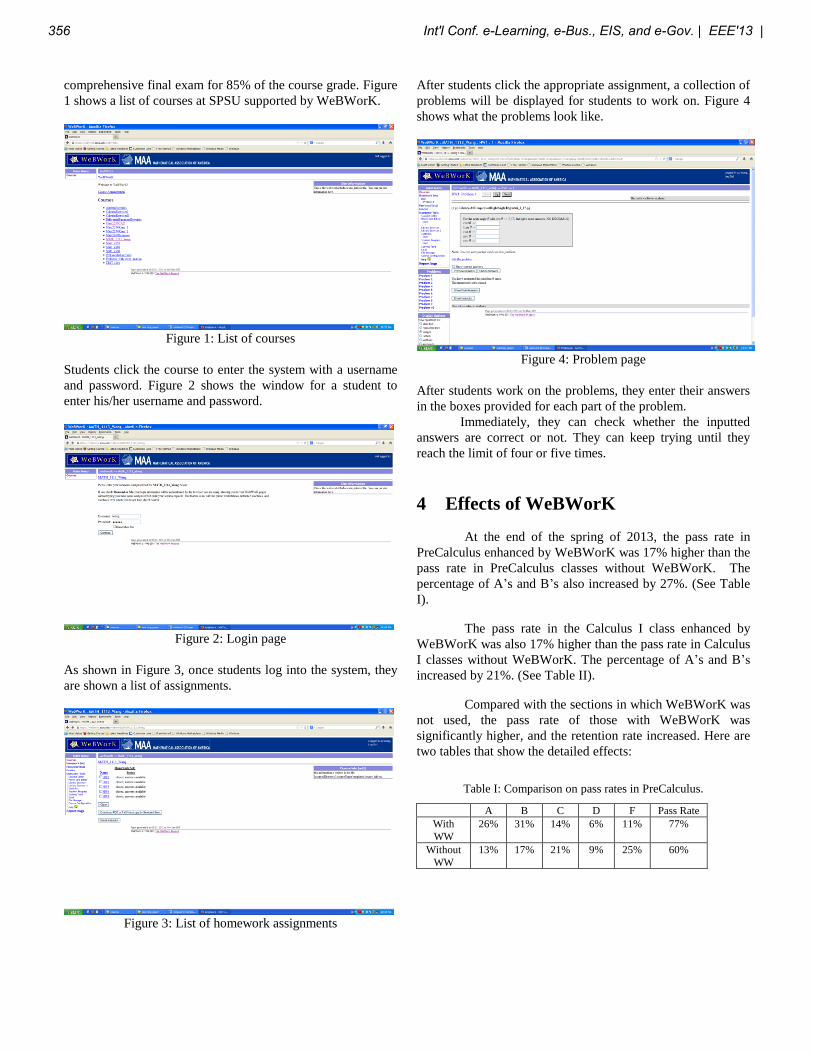
comprehensive final exam for 85% of the course grade. Figure
1 shows a list of courses at SPSU supported by WeBWorK.
Figure 1: List of courses
Students click the course to enter the system with a username
and password. Figure 2 shows the window for a student to
enter his/her username and password.
Figure 2: Login page
As shown in Figure 3, once students log into the system, they
are shown a list of assignments.
Figure 3: List of homework assignments
After students click the appropriate assignment, a collection of
problems will be displayed for students to work on. Figure 4
shows what the problems look like.
Figure 4: Problem page
After students work on the problems, they enter their answers
in the boxes provided for each part of the problem.
Immediately, they can check whether the inputted
answers are correct or not. They can keep trying until they
reach the limit of four or five times.
4 Effects of WeBWorK
At the end of the spring of 2013, the pass rate in
PreCalculus enhanced by WeBWorK was 17% higher than the
pass rate in PreCalculus classes without WeBWorK. The
percentage of A’s and B’s also increased by 27%. (See Table
I).
The pass rate in the Calculus I class enhanced by
WeBWorK was also 17% higher than the pass rate in Calculus
I classes without WeBWorK. The percentage of A’s and B’s
increased by 21%. (See Table II).
Compared with the sections in which WeBWorK was
not used, the pass rate of those with WeBWorK was
significantly higher, and the retention rate increased. Here are
two tables that show the detailed effects:
Table I: Comparison on pass rates in PreCalculus.
A B C D F Pass Rate
With
WW
26% 31% 14% 6% 11% 77%
Without
WW
13% 17% 21% 9% 25% 60%
356 Int'l Conf. e-Learning, e-Bus., EIS, and e-Gov. | EEE'13 |
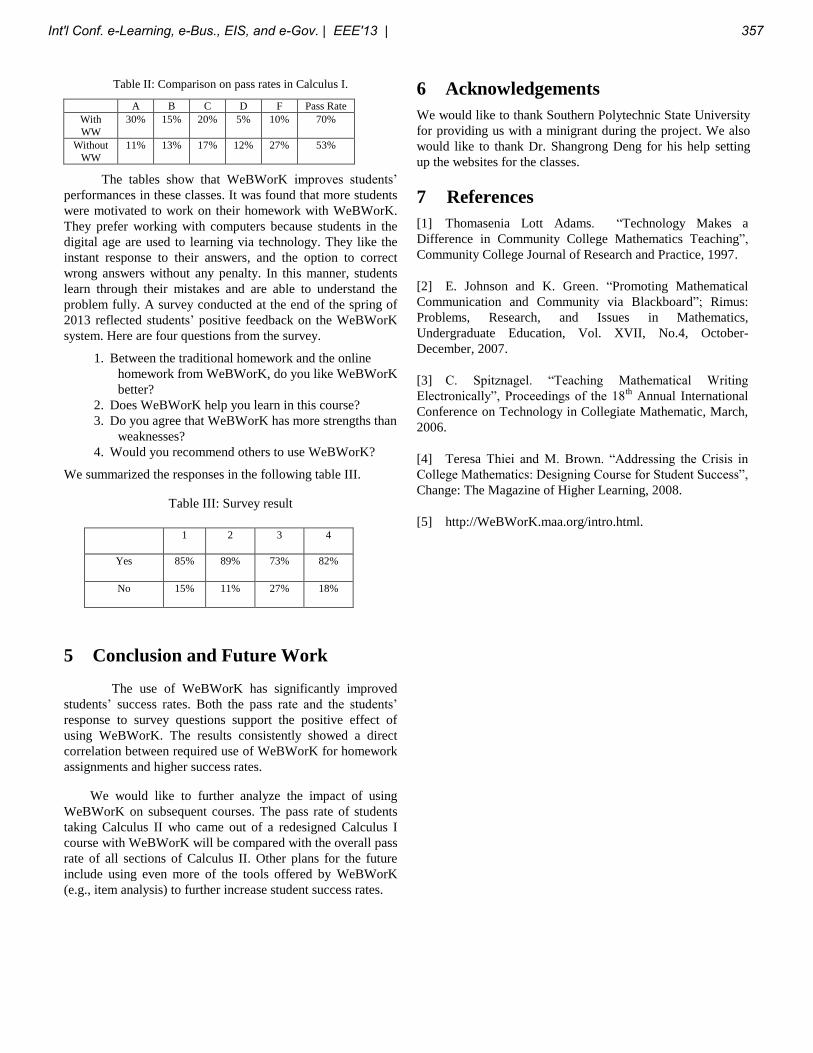
Table II: Comparison on pass rates in Calculus I.
A B C D F Pass Rate
With
WW
30% 15% 20% 5% 10% 70%
Without
WW
11% 13% 17% 12% 27% 53%
The tables show that WeBWorK improves students’
performances in these classes. It was found that more students
were motivated to work on their homework with WeBWorK.
They prefer working with computers because students in the
digital age are used to learning via technology. They like the
instant response to their answers, and the option to correct
wrong answers without any penalty. In this manner, students
learn through their mistakes and are able to understand the
problem fully. A survey conducted at the end of the spring of
2013 reflected students’ positive feedback on the WeBWorK
system. Here are four questions from the survey.
1. Between the traditional homework and the online
homework from WeBWorK, do you like WeBWorK
better?
2. Does WeBWorK help you learn in this course?
3. Do you agree that WeBWorK has more strengths than
weaknesses?
4. Would you recommend others to use WeBWorK?
We summarized the responses in the following table III.
Table III: Survey result
5 Conclusion and Future Work
The use of WeBWorK has significantly improved
students’ success rates. Both the pass rate and the students’
response to survey questions support the positive effect of
using WeBWorK. The results consistently showed a direct
correlation between required use of WeBWorK for homework
assignments and higher success rates.
We would like to further analyze the impact of using
WeBWorK on subsequent courses. The pass rate of students
taking Calculus II who came out of a redesigned Calculus I
course with WeBWorK will be compared with the overall pass
rate of all sections of Calculus II. Other plans for the future
include using even more of the tools offered by WeBWorK
(e.g., item analysis) to further increase student success rates.
6 Acknowledgements
We would like to thank Southern Polytechnic State University
for providing us with a minigrant during the project. We also
would like to thank Dr. Shangrong Deng for his help setting
up the websites for the classes.
7 References
[1] Thomasenia Lott Adams. “Technology Makes a
Difference in Community College Mathematics Teaching”,
Community College Journal of Research and Practice, 1997.
[2] E. Johnson and K. Green. “Promoting Mathematical
Communication and Community via Blackboard”; Rimus:
Problems, Research, and Issues in Mathematics,
Undergraduate Education, Vol. XVII, No.4, October-
December, 2007.
[3] C. Spitznagel. “Teaching Mathematical Writing
Electronically”, Proceedings of the 18th
Annual International
Conference on Technology in Collegiate Mathematic, March,
2006.
[4] Teresa Thiei and M. Brown. “Addressing the Crisis in
College Mathematics: Designing Course for Student Success”,
Change: The Magazine of Higher Learning, 2008.
[5] http://WeBWorK.maa.org/intro.html. 1 2 3 4
Yes 85% 89% 73% 82%
No 15% 11% 27% 18%
Int'l Conf. e-Learning, e-Bus., EIS, and e-Gov. | EEE'13 | 357
Information Transfer Model in Hotel Chain Management
Niran Chawla Computer and Engineering Management
Assumption University Bangkok, Thailand [email protected]
Montri Wiboonrat* College of Graduate Study in Management
Khon Kaen University Bangkok, Thailand [email protected]
Abstract –In the modern world the main focus of hotel competition is not only between different hotel services but also information facility to customers. As the satisfaction of the value customer is of utmost importance for the successfulness of the whole value chain, effective management of information and process transfer is crucial. The challenge of reduced operating costs while increasing customer’s satisfaction is the new challenge for doing hotel business. This research question derived from real case study with budget hotel chains, B2 hotel with 18 branches. In-depth interview with owner and 30% of hotel staffs were conducted to understand the existing problems, limitations, and exceed operation costs of information technology service management that deployed in 18 hotel branches. The study aims to highlight the feature of the concept of information transfer model (ITM) and hotel information chain management (HICM) in hotel management. The results of the research provide a model of how the HICM can improve hotel process management, reduce operations costs, and increase customer satisfactions.
Keywords: Hotel information chain management, information transfer model, hotel chain management, information chain management.
1 Introduction Globalization and increasingly competitive markets has driven both local and international hotels to develop their standards to ensure that they are ahead or at least keeping pace with their competitors. Technological changes and organizational improvements are important for effective integration of information chains. Many hotels, especially small and medium hotel (SMH), have not deployed IT to increase more customer expectation and completive advantage. However, in the 21st century, IT investment in hotel industry has increased drastically. Emerging of electronic transactions over Internet is stimulated the competition among online received and access information from hotel industries. Online information application has been generally deployed throughout hospitality industry. The hotel technology infrastructure must support advanced customer service applications, which provide front-desk staff with the tools and capabilities that they need to anticipate customer needs and deliver excellent services. Hotel information chain management (HICM) supports to increase management
efficiency [4], to help the hotel operate profitably in spite of rising utility, labor, medical, and other operational costs [2].
According to [1] research, conducted in the U.S.A. in year 2008, there are three main instances in which hotel management considers IT to be particularly beneficial to the hotel workplace: (1) the increase in customer satisfaction, (2) employee efficiency, and (3) increasing revenue. It is notable that hotel management holds no strong belief that IT can be used as a tool for lowering expenses or improving the efficiency of their back office systems. More than half of the respondents considered IT an asset for enhancing the customer experiences [3]. The hotel business challenge is how to design a cost effective communication infrastructure that delivers advanced customer services and helps hotel staffs exceed customer expectation and to build customer loyalty. In order to improve the IT criteria of the Thailand Hotels Standard (THS), this research intends to determine the level of knowledge of currently available information technology (IT) systems, to gauge hotelier’s understanding of future IT requirements in the hotel industry that can benefit hotel management professionals, and gain an understanding of the IT requirements of the hotel industry in the near future. This research was developed a conceptual model of HICM that how hotel business process can be used to analyze the existing processes and help in renovation and integration of those processes, with a special emphasis on an inter-organizational level. It particularizes how IT and smart card (e-Money) technology would help such hotels to reduce total implementation costs by shortening develop period; minimize risk to construction for new branch hotel project by using stable and standard open platform; provide real time services to client at anytime, anywhere, and anyone; create competitive advantage among budget hotel chains [8][9]; easy to interface and connect with any other hotel chain; secure the foundation of HICM model in order to overseas expansion.
2 Information chain management
Communication technologies in the 21st century are changing the ways we live forever. Information chain management (ICM) is a portal of interchange information of each party. In this research, ICM is acting as centralized portal for all hotel breaches to access, update, exchange, and distribute their latest customer information or any
358 Int'l Conf. e-Learning, e-Bus., EIS, and e-Gov. | EEE'13 |
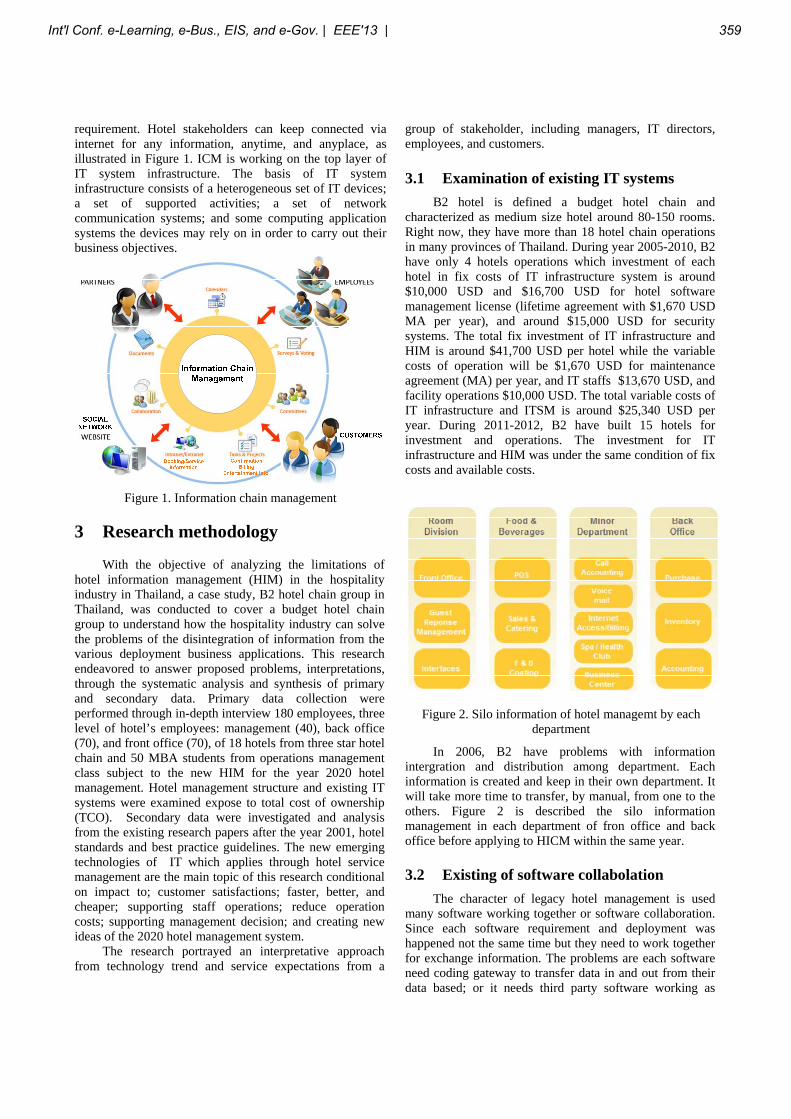
requirement. Hotel stakeholders can keep connected via internet for any information, anytime, and anyplace, as illustrated in Figure 1. ICM is working on the top layer of IT system infrastructure. The basis of IT system infrastructure consists of a heterogeneous set of IT devices; a set of supported activities; a set of network communication systems; and some computing application systems the devices may rely on in order to carry out their business objectives.
Figure 1. Information chain management
3 Research methodology
With the objective of analyzing the limitations of hotel information management (HIM) in the hospitality industry in Thailand, a case study, B2 hotel chain group in Thailand, was conducted to cover a budget hotel chain group to understand how the hospitality industry can solve the problems of the disintegration of information from the various deployment business applications. This research endeavored to answer proposed problems, interpretations, through the systematic analysis and synthesis of primary and secondary data. Primary data collection were performed through in-depth interview 180 employees, three level of hotel’s employees: management (40), back office (70), and front office (70), of 18 hotels from three star hotel chain and 50 MBA students from operations management class subject to the new HIM for the year 2020 hotel management. Hotel management structure and existing IT systems were examined expose to total cost of ownership (TCO). Secondary data were investigated and analysis from the existing research papers after the year 2001, hotel standards and best practice guidelines. The new emerging technologies of IT which applies through hotel service management are the main topic of this research conditional on impact to; customer satisfactions; faster, better, and cheaper; supporting staff operations; reduce operation costs; supporting management decision; and creating new ideas of the 2020 hotel management system. The research portrayed an interpretative approach from technology trend and service expectations from a
group of stakeholder, including managers, IT directors, employees, and customers.
3.1 Examination of existing IT systems B2 hotel is defined a budget hotel chain and characterized as medium size hotel around 80-150 rooms. Right now, they have more than 18 hotel chain operations in many provinces of Thailand. During year 2005-2010, B2 have only 4 hotels operations which investment of each hotel in fix costs of IT infrastructure system is around $10,000 USD and $16,700 USD for hotel software management license (lifetime agreement with $1,670 USD MA per year), and around $15,000 USD for security systems. The total fix investment of IT infrastructure and HIM is around $41,700 USD per hotel while the variable costs of operation will be $1,670 USD for maintenance agreement (MA) per year, and IT staffs $13,670 USD, and facility operations $10,000 USD. The total variable costs of IT infrastructure and ITSM is around $25,340 USD per year. During 2011-2012, B2 have built 15 hotels for investment and operations. The investment for IT infrastructure and HIM was under the same condition of fix costs and available costs.
Figure 2. Silo information of hotel managemt by each department
In 2006, B2 have problems with information intergration and distribution among department. Each information is created and keep in their own department. It will take more time to transfer, by manual, from one to the others. Figure 2 is described the silo information management in each department of fron office and back office before applying to HICM within the same year. 3.2 Existing of software collabolation The character of legacy hotel management is used many software working together or software collaboration. Since each software requirement and deployment was happened not the same time but they need to work together for exchange information. The problems are each software need coding gateway to transfer data in and out from their data based; or it needs third party software working as
Int'l Conf. e-Learning, e-Bus., EIS, and e-Gov. | EEE'13 | 359
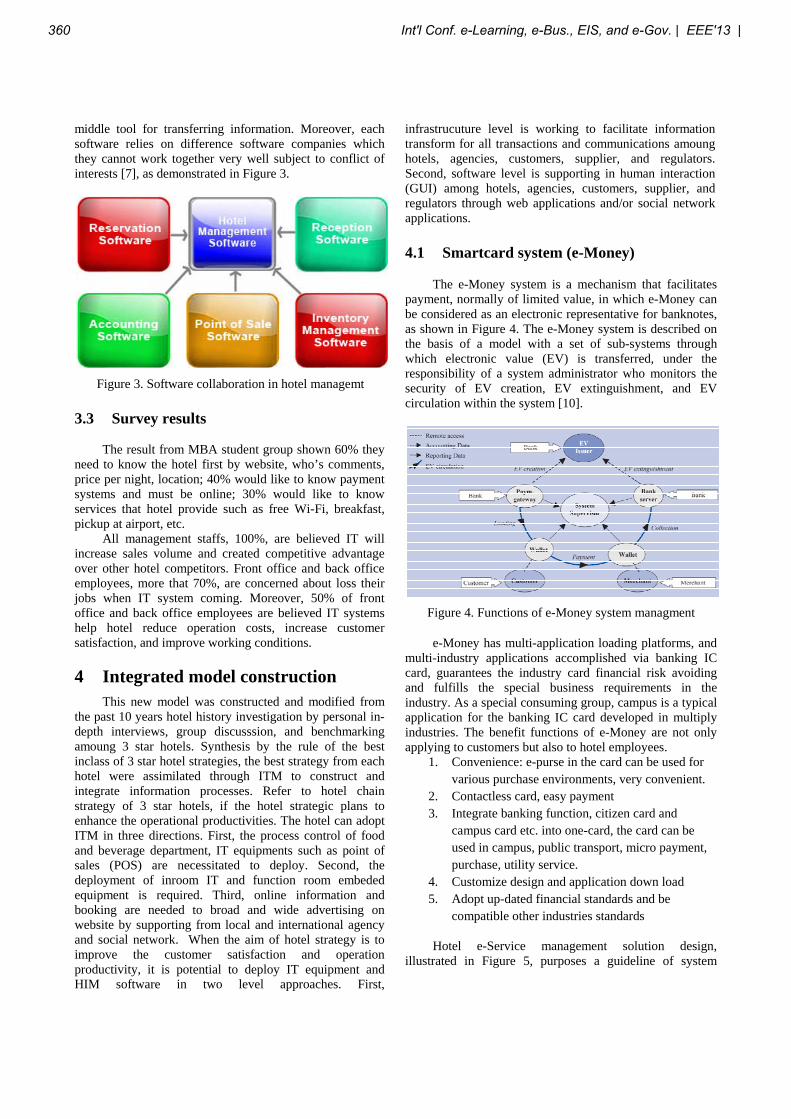
middle tool for transferring information. Moreover, each software relies on difference software companies which they cannot work together very well subject to conflict of interests [7], as demonstrated in Figure 3.
Figure 3. Software collaboration in hotel managemt
3.3 Survey results The result from MBA student group shown 60% they need to know the hotel first by website, who’s comments, price per night, location; 40% would like to know payment systems and must be online; 30% would like to know services that hotel provide such as free Wi-Fi, breakfast, pickup at airport, etc. All management staffs, 100%, are believed IT will increase sales volume and created competitive advantage over other hotel competitors. Front office and back office employees, more that 70%, are concerned about loss their jobs when IT system coming. Moreover, 50% of front office and back office employees are believed IT systems help hotel reduce operation costs, increase customer satisfaction, and improve working conditions.
4 Integrated model construction This new model was constructed and modified from
the past 10 years hotel history investigation by personal in-depth interviews, group discusssion, and benchmarking amoung 3 star hotels. Synthesis by the rule of the best inclass of 3 star hotel strategies, the best strategy from each hotel were assimilated through ITM to construct and integrate information processes. Refer to hotel chain strategy of 3 star hotels, if the hotel strategic plans to enhance the operational productivities. The hotel can adopt ITM in three directions. First, the process control of food and beverage department, IT equipments such as point of sales (POS) are necessitated to deploy. Second, the deployment of inroom IT and function room embeded equipment is required. Third, online information and booking are needed to broad and wide advertising on website by supporting from local and international agency and social network. When the aim of hotel strategy is to improve the customer satisfaction and operation productivity, it is potential to deploy IT equipment and HIM software in two level approaches. First,
infrastrucuture level is working to facilitate information transform for all transactions and communications amoung hotels, agencies, customers, supplier, and regulators. Second, software level is supporting in human interaction (GUI) among hotels, agencies, customers, supplier, and regulators through web applications and/or social network applications.
4.1 Smartcard system (e-Money)
The e-Money system is a mechanism that facilitates payment, normally of limited value, in which e-Money can be considered as an electronic representative for banknotes, as shown in Figure 4. The e-Money system is described on the basis of a model with a set of sub-systems through which electronic value (EV) is transferred, under the responsibility of a system administrator who monitors the security of EV creation, EV extinguishment, and EV circulation within the system [10].
Figure 4. Functions of e-Money system managment
e-Money has multi-application loading platforms, and multi-industry applications accomplished via banking IC card, guarantees the industry card financial risk avoiding and fulfills the special business requirements in the industry. As a special consuming group, campus is a typical application for the banking IC card developed in multiply industries. The benefit functions of e-Money are not only applying to customers but also to hotel employees.
1. Convenience: e-purse in the card can be used for various purchase environments, very convenient.
2. Contactless card, easy payment 3. Integrate banking function, citizen card and
campus card etc. into one-card, the card can be used in campus, public transport, micro payment, purchase, utility service.
4. Customize design and application down load 5. Adopt up-dated financial standards and be
compatible other industries standards
Hotel e-Service management solution design, illustrated in Figure 5, purposes a guideline of system
360 Int'l Conf. e-Learning, e-Bus., EIS, and e-Gov. | EEE'13 |
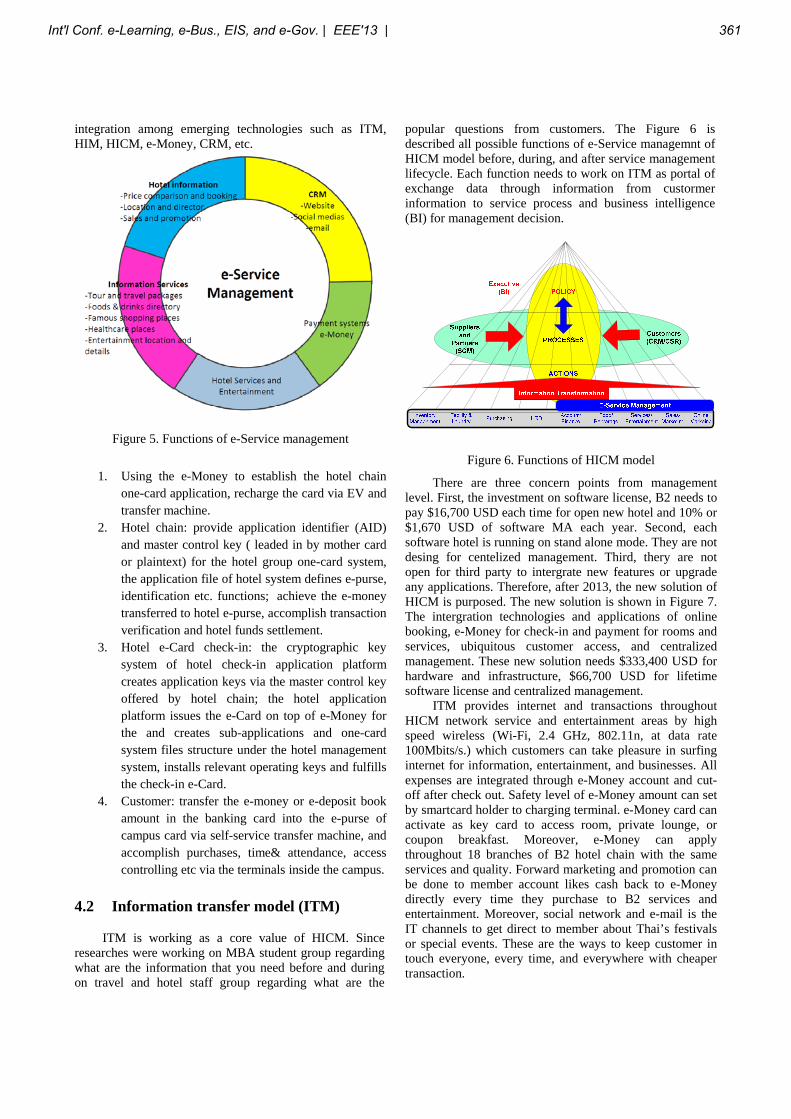
integration among emerging technologies such as ITM, HIM, HICM, e-Money, CRM, etc.
Figure 5. Functions of e-Service management
1. Using the e-Money to establish the hotel chain
one-card application, recharge the card via EV and transfer machine.
2. Hotel chain: provide application identifier (AID) and master control key ( leaded in by mother card or plaintext) for the hotel group one-card system, the application file of hotel system defines e-purse, identification etc. functions; achieve the e-money transferred to hotel e-purse, accomplish transaction verification and hotel funds settlement.
3. Hotel e-Card check-in: the cryptographic key system of hotel check-in application platform creates application keys via the master control key offered by hotel chain; the hotel application platform issues the e-Card on top of e-Money for the and creates sub-applications and one-card system files structure under the hotel management system, installs relevant operating keys and fulfills the check-in e-Card.
4. Customer: transfer the e-money or e-deposit book amount in the banking card into the e-purse of campus card via self-service transfer machine, and accomplish purchases, time& attendance, access controlling etc via the terminals inside the campus.
4.2 Information transfer model (ITM)
ITM is working as a core value of HICM. Since researches were working on MBA student group regarding what are the information that you need before and during on travel and hotel staff group regarding what are the
popular questions from customers. The Figure 6 is described all possible functions of e-Service managemnt of HICM model before, during, and after service management lifecycle. Each function needs to work on ITM as portal of exchange data through information from custormer information to service process and business intelligence (BI) for management decision.
Figure 6. Functions of HICM model
There are three concern points from management level. First, the investment on software license, B2 needs to pay $16,700 USD each time for open new hotel and 10% or $1,670 USD of software MA each year. Second, each software hotel is running on stand alone mode. They are not desing for centelized management. Third, thery are not open for third party to intergrate new features or upgrade any applications. Therefore, after 2013, the new solution of HICM is purposed. The new solution is shown in Figure 7. The intergration technologies and applications of online booking, e-Money for check-in and payment for rooms and services, ubiquitous customer access, and centralized management. These new solution needs $333,400 USD for hardware and infrastructure, $66,700 USD for lifetime software license and centralized management. ITM provides internet and transactions throughout HICM network service and entertainment areas by high speed wireless (Wi-Fi, 2.4 GHz, 802.11n, at data rate 100Mbits/s.) which customers can take pleasure in surfing internet for information, entertainment, and businesses. All expenses are integrated through e-Money account and cut-off after check out. Safety level of e-Money amount can set by smartcard holder to charging terminal. e-Money card can activate as key card to access room, private lounge, or coupon breakfast. Moreover, e-Money can apply throughout 18 branches of B2 hotel chain with the same services and quality. Forward marketing and promotion can be done to member account likes cash back to e-Money directly every time they purchase to B2 services and entertainment. Moreover, social network and e-mail is the IT channels to get direct to member about Thai’s festivals or special events. These are the ways to keep customer in touch everyone, every time, and everywhere with cheaper transaction.
Int'l Conf. e-Learning, e-Bus., EIS, and e-Gov. | EEE'13 | 361
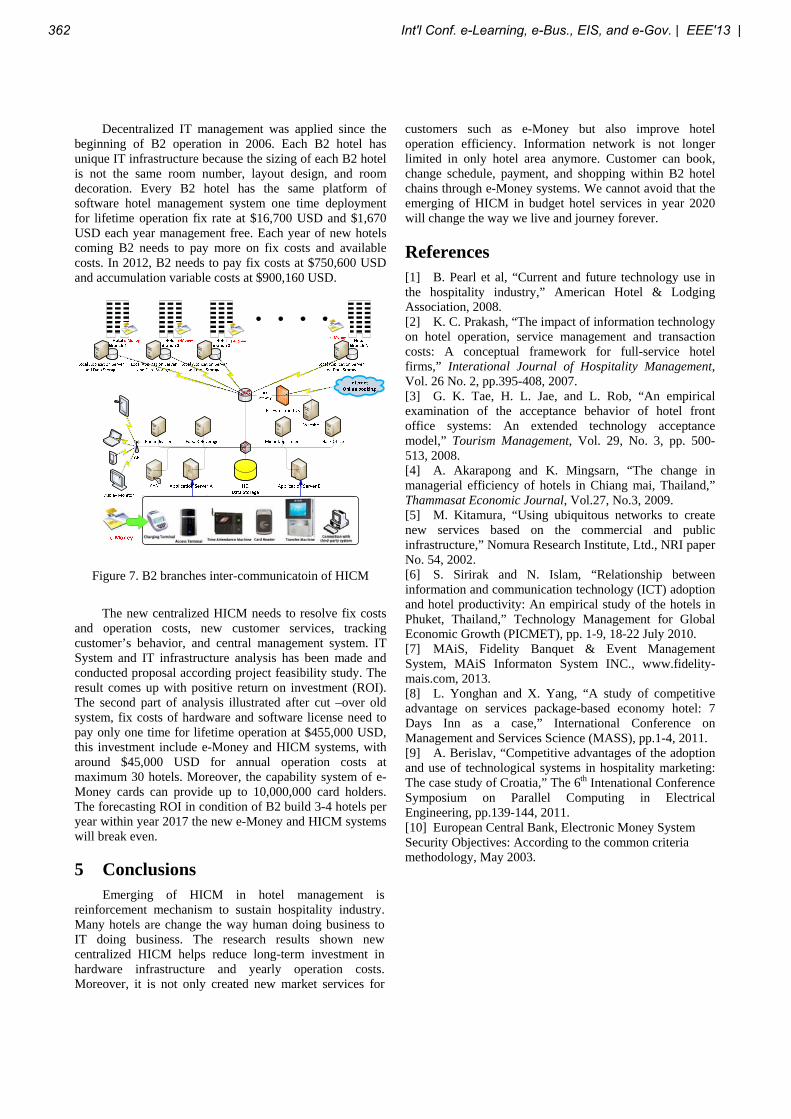
Decentralized IT management was applied since the beginning of B2 operation in 2006. Each B2 hotel has unique IT infrastructure because the sizing of each B2 hotel is not the same room number, layout design, and room decoration. Every B2 hotel has the same platform of software hotel management system one time deployment for lifetime operation fix rate at $16,700 USD and $1,670 USD each year management free. Each year of new hotels coming B2 needs to pay more on fix costs and available costs. In 2012, B2 needs to pay fix costs at $750,600 USD and accumulation variable costs at $900,160 USD.
Figure 7. B2 branches inter-communicatoin of HICM
The new centralized HICM needs to resolve fix costs and operation costs, new customer services, tracking customer’s behavior, and central management system. IT System and IT infrastructure analysis has been made and conducted proposal according project feasibility study. The result comes up with positive return on investment (ROI). The second part of analysis illustrated after cut –over old system, fix costs of hardware and software license need to pay only one time for lifetime operation at $455,000 USD, this investment include e-Money and HICM systems, with around $45,000 USD for annual operation costs at maximum 30 hotels. Moreover, the capability system of e-Money cards can provide up to 10,000,000 card holders. The forecasting ROI in condition of B2 build 3-4 hotels per year within year 2017 the new e-Money and HICM systems will break even. 5 Conclusions Emerging of HICM in hotel management is reinforcement mechanism to sustain hospitality industry. Many hotels are change the way human doing business to IT doing business. The research results shown new centralized HICM helps reduce long-term investment in hardware infrastructure and yearly operation costs. Moreover, it is not only created new market services for
customers such as e-Money but also improve hotel operation efficiency. Information network is not longer limited in only hotel area anymore. Customer can book, change schedule, payment, and shopping within B2 hotel chains through e-Money systems. We cannot avoid that the emerging of HICM in budget hotel services in year 2020 will change the way we live and journey forever.
References [1] B. Pearl et al, “Current and future technology use in the hospitality industry,” American Hotel & Lodging Association, 2008. [2] K. C. Prakash, “The impact of information technology on hotel operation, service management and transaction costs: A conceptual framework for full-service hotel firms,” Interational Journal of Hospitality Management, Vol. 26 No. 2, pp.395-408, 2007. [3] G. K. Tae, H. L. Jae, and L. Rob, “An empirical examination of the acceptance behavior of hotel front office systems: An extended technology acceptance model,” Tourism Management, Vol. 29, No. 3, pp. 500-513, 2008. [4] A. Akarapong and K. Mingsarn, “The change in managerial efficiency of hotels in Chiang mai, Thailand,” Thammasat Economic Journal, Vol.27, No.3, 2009. [5] M. Kitamura, “Using ubiquitous networks to create new services based on the commercial and public infrastructure,” Nomura Research Institute, Ltd., NRI paper No. 54, 2002. [6] S. Sirirak and N. Islam, “Relationship between information and communication technology (ICT) adoption and hotel productivity: An empirical study of the hotels in Phuket, Thailand,” Technology Management for Global Economic Growth (PICMET), pp. 1-9, 18-22 July 2010. [7] MAiS, Fidelity Banquet & Event Management System, MAiS Informaton System INC., www.fidelity-mais.com, 2013. [8] L. Yonghan and X. Yang, “A study of competitive advantage on services package-based economy hotel: 7 Days Inn as a case,” International Conference on Management and Services Science (MASS), pp.1-4, 2011. [9] A. Berislav, “Competitive advantages of the adoption and use of technological systems in hospitality marketing: The case study of Croatia,” The 6th Intenational Conference Symposium on Parallel Computing in Electrical Engineering, pp.139-144, 2011. [10] European Central Bank, Electronic Money System Security Objectives: According to the common criteria methodology, May 2003.
362 Int'l Conf. e-Learning, e-Bus., EIS, and e-Gov. | EEE'13 |
A Framework for Enabling Incidental Learning on the Web Hongxue (Harris) Wang School of Computing and Information Systems Athabasca University Alberta, Canada
Abstract
Incidental learning is learning something without intent, which usually happens at the time that is not dedicated to learn that thing. Examples of such time include work, game play and activities for leisure. In today’s life of many people, a lot of time is spent on the surfing the Web. Should incidental learning be effectively implemented for individuals using the Web, it would make learning more effective for many. This can be especially true for adult learners since they most likely have less time dedicated to learning, or don’t have any dedicated time for learning at all. In this paper we present a framework for enabling incidental learning on the Web. The framework identify six key elements for incidental learning on the web, describe a general process of incidental learning, two types of incidental learning and nine scenarios of incidental learning on the web. Finally, the framework prescribes a list of theories and essential technologies that are important for enabling incidental learning on the web.
Keywords: incidental learning, informal learning, web-based learning, e-learning
Introduction
Incidental learning is learning without intent, which happens at the time that is not dedicated to learn what is learned through the incidental learning session [1]. In today’s society, we are given at least two advantages in developing and implementing enabling technologies and systems for incidental learning on the Web. The first one is that many individuals are spending a lot of time on the Web. This would make incidental learning on the web be able to occur more often. Imagine that such an “incident” could occur only once a year or even only once a lifetime, it might be enough to trigger a scientific invention for a well-prepared scientist, but wouldn’t be enough for someone to learn substantially on a subject. As such, it makes more sense now for us to develop enabling technologies and systems for incidental learning on the web because more and more people will benefit from the technologies and systems more often. The second advantage we are given is the unprecedented availability on the world-wide web of knowledge of almost all subjects. This greatly ensures the feasibility of the research and development of technologies and systems in terms of source of knowledge and information. Because the information and knowledge needed to feed the learners on the Web is widely available, a software or intelligent agent should be able to collect the particular knowledge and information especially for an individual based on his/her overall learning goals and feed the individual in a way without his or her notice. As such, the enabling technologies and systems developed from this research could be used to learn knowledge in various topics and subjects!
In brief, the theories, technologies and systems developed from this research are intended to make incidental learning happen to learners while they are browsing the web; to make incidental learning on the
Int'l Conf. e-Learning, e-Bus., EIS, and e-Gov. | EEE'13 | 363

web serve at least one of the learning goals the learners may have at the time; and to make incidental learning on the web more effective.
Significance and Contributions of the Research
Incidental learning brings at least two benefits to learners. One is that it effectively utilizes the times or tiny fractions of time that are not designated for learning; the second is that people will be able to learn with a pleasure but without pressure. They would be much happier to learn with less or no stress. Imagining that you could learn something effectively for a purpose or purposes while you are browsing the Web for pleasure, and imagining that people, such as our students, could build their knowledge and skills to satisfy the requirements of a course or courses while you are working or playing with the Web, isn’t it wonderful and very significant in education and research? The benefits can be more obvious for students taking online courses or other distance learning courses. As we know, most of these students are part-time as they often have other business to do other than completing courses. They cannot afford to take leave to study in traditional universities in the classroom, and they don’t usually have a big trunk of their time to spend on a course study. However, they do spend time on the web for various reasons and purposes. If enabling technologies and systems are available for incidental learning on the web, it will help these learners greatly, because these students will be able to utilize fractions of their time to learn while they are working, playing or doing other things. The framework presented in this paper is intended to set a firm step towards the enabling technologies and systems.
Key elements of incidental learning
For a system that helps learners to realize incidental learning on the web, some key elements are needed:
1. Learner’s capability of learning – this is the very basic requirement for incidental learning, or any learning to occur. An agent system designed for enabling incidental learning on the web must do its best to know what the learner is capable of learning. A learner may be capable of learning X but not Y. it won’t help the learner to keep firing up incidental learning sessions that teach the learner something he or she is incapable of.
2. Learner’s desire to learn -- without any desire to learn, no learning can be effective. The desire can be fostered gradually through certain enabling technologies. This may be the hardest part for an agent to do – to know whether the learner has the desire to learn at a specific time. The information may be gathered during the time learner is browsing the web, or after two or three tries of firing up an incidental learning session – when the learner has simply ignored. In any case, it is important for the agent system to know if the learner has the desire to learn at a given time; otherwise it would definitely be an annoying thing to the learner to keep firing up one incidental learning session after another.
3. Learning goals of the leaner – what topics and subjects the learner is interested in, at what level the learner is in a particular area or topic.
4. Triggers to fire up an incidental learning session – the system needs to be fired up at the right time while the learner is on the web. The triggers should be within the web document the learner is reading, together with the learner’s motion such as mouse click.
364 Int'l Conf. e-Learning, e-Bus., EIS, and e-Gov. | EEE'13 |

5. Available learning content – the system must be able to get the right learning content to form a learning session for the learner. The content can be in a learning object repository, or mined from the web on the fly.
6. An effective incidental learning session – the session must be well controlled and properly sized in terms of both content and duration.
These key elements must be fully considered in the design and development of enabling technologies and systems for incidental learning on the web.
General process of incidental learning on the web
Incidental learning may happen consciously or unconsciously. In the former case, the learning session happens incidentally while the learning is doing something else, but during the session, the learner consciously knows she or he is in the learning session, and knows what he is supposed to learn. With consciousness, the learner could be more motivated during the session, and the learning should be more effective.
In the latter case, not only does the learning session, if it can be called a learning session, occur incidentally, the learner doesn’t even know he or she is in a learning session, and what she or he is learning either.
For some learners, learning with a clear purpose or consciously should be more effective, while for learners who are really tired of learning certain things in certain area, incidental learning unconsciously should be more effective too.
While the learners may learn consciously or unconsciously, the agent system enabling incidental learning on the web must know what a particular learner is supposed to learn in a specific learning session. Hence, the process of incidental learning on the web can be generally depicted as follows:
1. Identify the point of interest within the context of what the learner is doing, or browsing in the case of web-based incidental learning;
2. Further develop the point of interest into a specific learning objective or objectives which are part of the learner’s learning goals at the time;
3. Form a small learning session with content dynamically generated from the web or learning object repositories, and bring the learner into the learning session;
4. Present the learning session to the learner and/or bring the learner into the learning session; 5. Closing the session once the learner is done, or has left the session, and book keeping the learning
session.
Types of Incidental Learning and Scenarios on the Web
The unique feature of incidental learning is that learning occurred incidentally in the view of the learner. Although the occurrence of learning may seem to be random (that’s why incidental learning is also called random learning), the knowledge and skills acquired through it don’t need to be random, especially when
Int'l Conf. e-Learning, e-Bus., EIS, and e-Gov. | EEE'13 | 365

the incidental learning session is enabled by an intelligent agent system. That is to say, the learning outcome can be either expected or unexpected by the learner. We then have the following two types of incidental learning:
1. incidental learning from which something expected has been learned, we use letter E to refer to such learning, use letter E with a subscript to refer a learning goal that may consists of small gradients of learning goals or knowledge, denoted by letter e with or with a subscript.
2. incidental learning from which something unexpected has been learned, we use letter U to refer to such learning, use letter U with a subscript to refer a learning goal that may consists of small gradients of learning goals or knowledge, denoted by letter u with or with a subscript.
Let E={E1, E2, …, Em} represent the learning goals identified for a particular learner at a given time, and each Ei={ei1, ei2, …, eik}, where each eij represents a small learning goal or knowledge gradient; we further let U={U1, U2, …, Um} represent the learning goals identified for a particular learner at a given time, and each Ui={ui1, ui2, …, uik}, where each uij represents a small learning goal or knowledge gradient, we then may have the following different scenarios of incidental learning on the web:
1. incidental learning towards a consistent learning goal expected for the learner
In this scenario, the learner is going through several incidental-learning sessions fed by the agent, and all the knowledge gradients covered by the incidental learning sessions serve the same learning goal. After each incidental learning session, the learner will go back to his or her non-learning web browsing;
2. Incidental learning spread several learning goals, but all expected for the learner
In this scenario, the learner is going through several incidental-learning sessions fed by the agent, but the knowledge gradients covered by the incidental learning sessions serve the several different learning goals. After each incidental learning session, the learner will go back to his or her non-learning web browsing;
3. One incidental learning after another serves the same learning goal
In this scenario, the learner is going through one incidental-learning session after another fed by the agent, and all the knowledge gradients covered by the incidental learning sessions serve the same learning goal.
Ei1 Ei2 Ei3
Ei1 Ej1 Ek1 Ej2
Ei1 Ei2 Ei3 Ei4
366 Int'l Conf. e-Learning, e-Bus., EIS, and e-Gov. | EEE'13 |
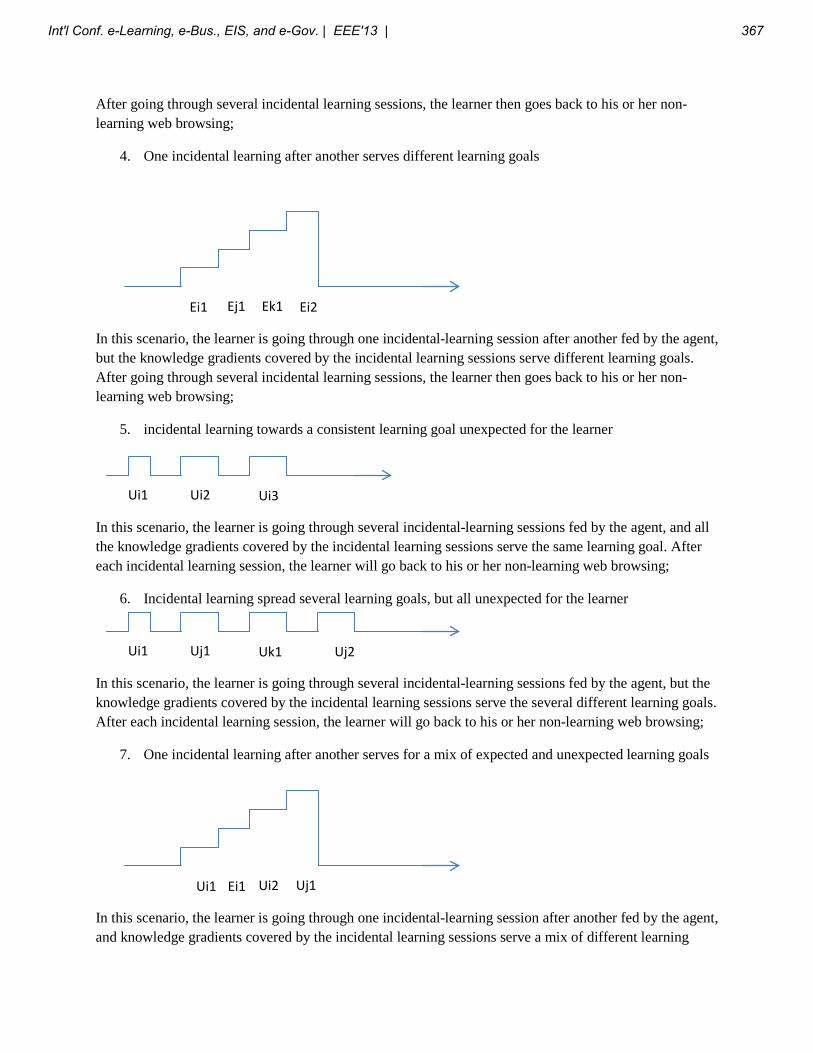
After going through several incidental learning sessions, the learner then goes back to his or her non-learning web browsing;
4. One incidental learning after another serves different learning goals
In this scenario, the learner is going through one incidental-learning session after another fed by the agent, but the knowledge gradients covered by the incidental learning sessions serve different learning goals. After going through several incidental learning sessions, the learner then goes back to his or her non-learning web browsing;
5. incidental learning towards a consistent learning goal unexpected for the learner
In this scenario, the learner is going through several incidental-learning sessions fed by the agent, and all the knowledge gradients covered by the incidental learning sessions serve the same learning goal. After each incidental learning session, the learner will go back to his or her non-learning web browsing;
6. Incidental learning spread several learning goals, but all unexpected for the learner
In this scenario, the learner is going through several incidental-learning sessions fed by the agent, but the knowledge gradients covered by the incidental learning sessions serve the several different learning goals. After each incidental learning session, the learner will go back to his or her non-learning web browsing;
7. One incidental learning after another serves for a mix of expected and unexpected learning goals
In this scenario, the learner is going through one incidental-learning session after another fed by the agent, and knowledge gradients covered by the incidental learning sessions serve a mix of different learning
Ei1 Ej1 Ei2 Ek1
Ui1 Ui2 Ui3
Ui1 Uj1 Uk1 Uj2
Ui1 Ei1 Ui2 Uj1
Int'l Conf. e-Learning, e-Bus., EIS, and e-Gov. | EEE'13 | 367
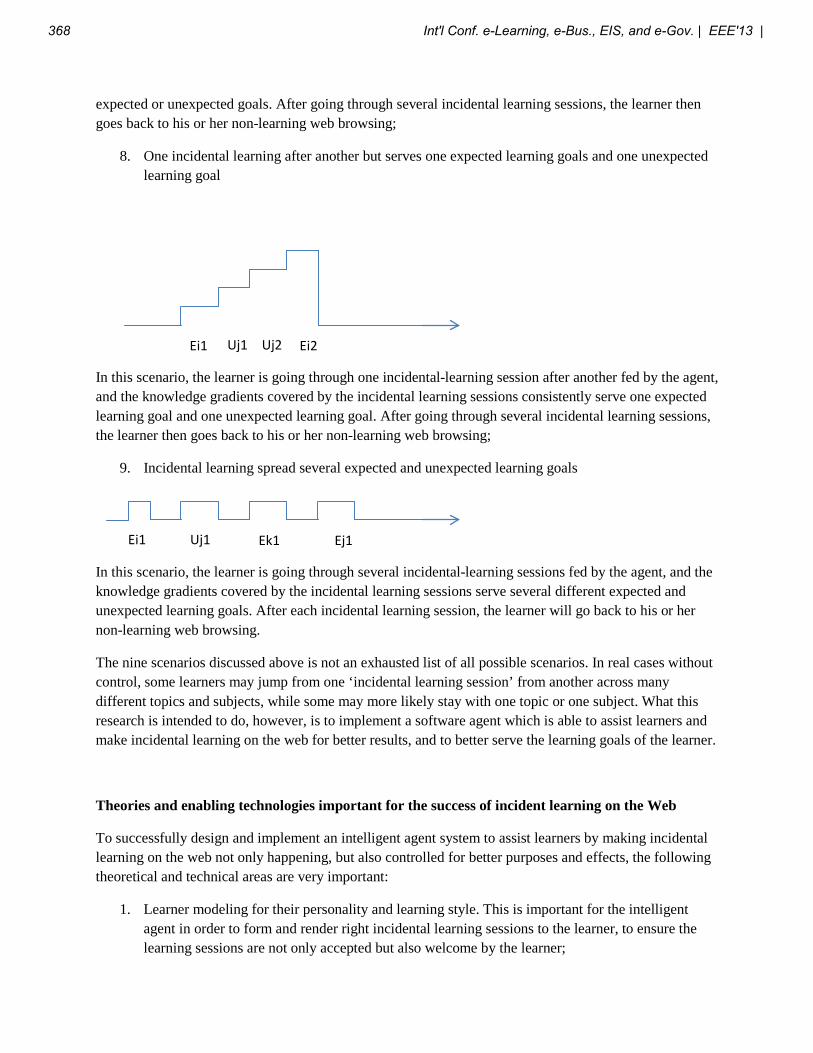
expected or unexpected goals. After going through several incidental learning sessions, the learner then goes back to his or her non-learning web browsing;
8. One incidental learning after another but serves one expected learning goals and one unexpected learning goal
In this scenario, the learner is going through one incidental-learning session after another fed by the agent, and the knowledge gradients covered by the incidental learning sessions consistently serve one expected learning goal and one unexpected learning goal. After going through several incidental learning sessions, the learner then goes back to his or her non-learning web browsing;
9. Incidental learning spread several expected and unexpected learning goals
In this scenario, the learner is going through several incidental-learning sessions fed by the agent, and the knowledge gradients covered by the incidental learning sessions serve several different expected and unexpected learning goals. After each incidental learning session, the learner will go back to his or her non-learning web browsing.
The nine scenarios discussed above is not an exhausted list of all possible scenarios. In real cases without control, some learners may jump from one ‘incidental learning session’ from another across many different topics and subjects, while some may more likely stay with one topic or one subject. What this research is intended to do, however, is to implement a software agent which is able to assist learners and make incidental learning on the web for better results, and to better serve the learning goals of the learner.
Theories and enabling technologies important for the success of incident learning on the Web
To successfully design and implement an intelligent agent system to assist learners by making incidental learning on the web not only happening, but also controlled for better purposes and effects, the following theoretical and technical areas are very important:
1. Learner modeling for their personality and learning style. This is important for the intelligent agent in order to form and render right incidental learning sessions to the learner, to ensure the learning sessions are not only accepted but also welcome by the learner;
Ei1 Uj1 Ei2 Uj2
Ei1 Uj1 Ek1 Ej1
368 Int'l Conf. e-Learning, e-Bus., EIS, and e-Gov. | EEE'13 |

2. Learning and building learning goals for the learner. The main purpose of intelligent agent system is to not only make incidental learning on the web happen, but also happen to serve the learner’s learning goals. Therefore, knowing what the learning goals are is very important.
3. Data/web mining to build incidental learning session dynamically. The system should be able to discover and select the best fit learning objects or material to form an incidental learning session whenever a trigger for a learning session is identified for the learner. Therefore, it is important for the agent system to do data mining on the web.
4. Doing effective learning analytics for adjust and fine-tune the learner models for better incidental learning sessions. Each incidental learning session should be evaluated after it’s over, and the learner actions and performance during the sessions should be analyzed.
5. Intelligent agent technologies. While the proposed framework and the theories and technologies listed above are important for developing an intelligent agent for enabling incidental learning on the web, agent theories and technologies developed over the last few decades by researchers and practitioners in computing and AI community in particular are definitely a great asset for the success.
The above may not have covered all the important theories and technologies for designing and developing an intelligent agent for enabling incidental learning on the Web, but they do form a core or base for anyone to do further research and development in this direction.
Discussions
We presented in this paper a framework for enabling incidental learning on the Web. In the framework we have identified some key elements for enabling incidental learning on the web. These key elements are important for the design and implementation of any agent system for enabling incidental learning on the web. We further discussed the general process of incidental learning on the web, two types of incidental learning, as well as several scenarios of web-based incidental learning. These are all parts of the entire framework on which intelligent system can be built to enable web-based incidental learning.
References
1. Baskett, H. K. M., Workplace Factors Which Enhance Self-directed Learning, a report of a project on self-directed learning in the workplace, a paper presented to the Seventh International Symposium on Self-Directed Learning, West Palm Beach, Florida, January 21-23, 1993. Available online at http://www.eric.ed.gov/PDFS/ED359354.pdf
2. Baylor, A.L. Perceived disorientation and incidental learning in a Web-based environment: Internal and external factors J of Educational Multimedia and Hypermedia Vol. 10/3 227-251:2001
3. Elley, W.B. (Dez 2005), [http//cela.albany.edu/reports/inpraise/main.html In praise of incidental learning: Lessons from some empirical findings on lan guage acquisition: 1997]
4. Kerka, Sandra 2000, Trends and Issues 2000 Alert No.18, Incidental learning 5. Marsick, V.J. & KJ Watkins (2001). Informal and incidental learning, new directions for adult and
continuing education 89 25-34. 6. Mayer, R.E., Heiser, J. & Lonn,S. (2001). Cognitive constraints on multimedia learning: when presenting
more material results in less understanding. Journal of educational psychology, 93 pp.187-198 7. Schank, Roger, C. & Ch. Cleary (1995). Engines for Education, Lawrence Erlbaum Ass. Publishers
Hillsdale NJ, pp. 95-105 (Incidental learning chapter).
Int'l Conf. e-Learning, e-Bus., EIS, and e-Gov. | EEE'13 | 369
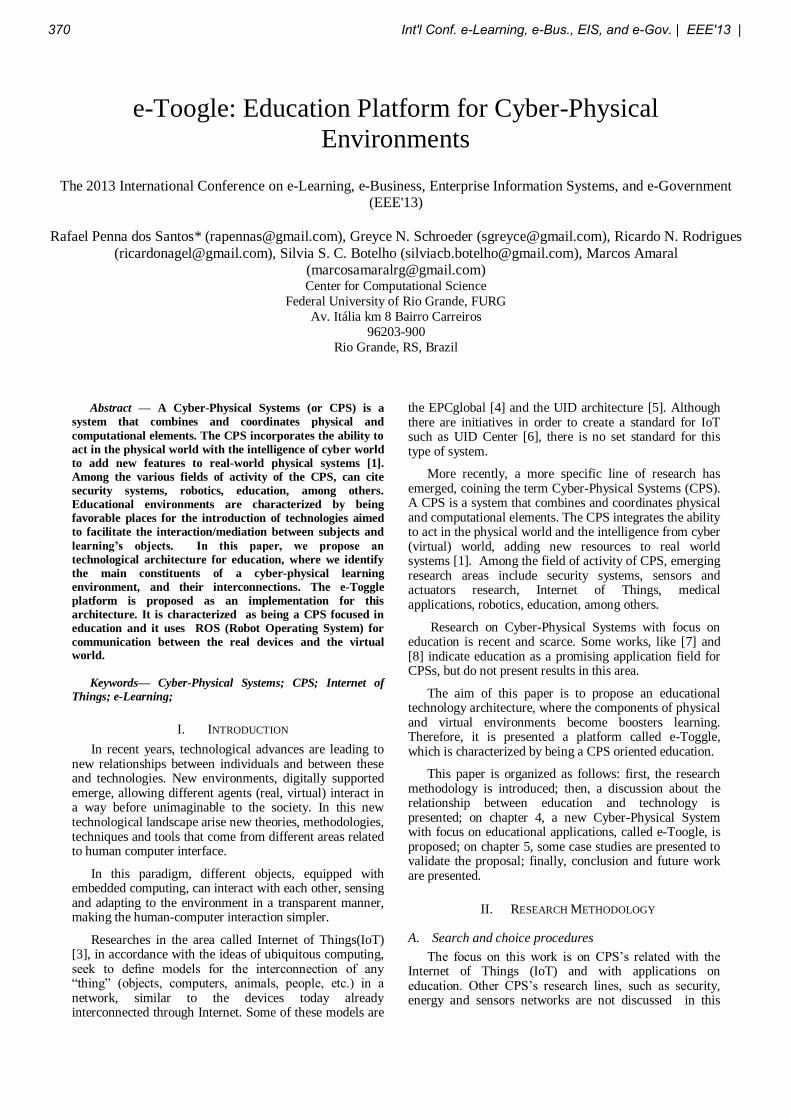
e-Toogle: Education Platform for Cyber-Physical
Environments
The 2013 International Conference on e-Learning, e-Business, Enterprise Information Systems, and e-Government (EEE'13)
Rafael Penna dos Santos* ([email protected]), Greyce N. Schroeder ([email protected]), Ricardo N. Rodrigues
([email protected]), Silvia S. C. Botelho ([email protected]), Marcos Amaral ([email protected]) Center for Computational Science
Federal University of Rio Grande, FURG
Av. Itália km 8 Bairro Carreiros
96203-900
Rio Grande, RS, Brazil
Abstract — A Cyber-Physical Systems (or CPS) is a
system that combines and coordinates physical and
computational elements. The CPS incorporates the ability to
act in the physical world with the intelligence of cyber world
to add new features to real-world physical systems [1].
Among the various fields of activity of the CPS, can cite
security systems, robotics, education, among others.
Educational environments are characterized by being
favorable places for the introduction of technologies aimed
to facilitate the interaction/mediation between subjects and
learning’s objects. In this paper, we propose an
technological architecture for education, where we identify
the main constituents of a cyber-physical learning
environment, and their interconnections. The e-Toggle
platform is proposed as an implementation for this
architecture. It is characterized as being a CPS focused in
education and it uses ROS (Robot Operating System) for
communication between the real devices and the virtual world.
Keywords— Cyber-Physical Systems; CPS; Internet of
Things; e-Learning;
I. INTRODUCTION
In recent years, technological advances are leading to new relationships between individuals and between these and technologies. New environments, digitally supported emerge, allowing different agents (real, virtual) interact in a way before unimaginable to the society. In this new technological landscape arise new theories, methodologies, techniques and tools that come from different areas related to human computer interface.
In this paradigm, different objects, equipped with embedded computing, can interact with each other, sensing and adapting to the environment in a transparent manner, making the human-computer interaction simpler.
Researches in the area called Internet of Things(IoT) [3], in accordance with the ideas of ubiquitous computing, seek to define models for the interconnection of any “thing” (objects, computers, animals, people, etc.) in a network, similar to the devices today already interconnected through Internet. Some of these models are
the EPCglobal [4] and the UID architecture [5]. Although there are initiatives in order to create a standard for IoT such as UID Center [6], there is no set standard for this type of system.
More recently, a more specific line of research has emerged, coining the term Cyber-Physical Systems (CPS). A CPS is a system that combines and coordinates physical and computational elements. The CPS integrates the ability to act in the physical world and the intelligence from cyber (virtual) world, adding new resources to real world systems [1]. Among the field of activity of CPS, emerging research areas include security systems, sensors and actuators research, Internet of Things, medical applications, robotics, education, among others.
Research on Cyber-Physical Systems with focus on education is recent and scarce. Some works, like [7] and [8] indicate education as a promising application field for CPSs, but do not present results in this area.
The aim of this paper is to propose an educational technology architecture, where the components of physical and virtual environments become boosters learning. Therefore, it is presented a platform called e-Toggle, which is characterized by being a CPS oriented education.
This paper is organized as follows: first, the research methodology is introduced; then, a discussion about the relationship between education and technology is presented; on chapter 4, a new Cyber-Physical System with focus on educational applications, called e-Toogle, is proposed; on chapter 5, some case studies are presented to validate the proposal; finally, conclusion and future work are presented.
II. RESEARCH METHODOLOGY
A. Search and choice procedures
The focus on this work is on CPS’s related with the Internet of Things (IoT) and with applications on education. Other CPS’s research lines, such as security, energy and sensors networks are not discussed in this
370 Int'l Conf. e-Learning, e-Bus., EIS, and e-Gov. | EEE'13 |
article. The emphasis of this review is on an empirical search instead of non-empirical explanations.
The empirical search for references was carried out in two phases. On the first phase, we searched for articles on Google Scholar, crossing the keywords Cyber-Physical Systems with keywords Internet of Things and education. On the second phase, we conducted a new search on some citations of papers from first phase. The search on Google Scholar was considered sufficient as it contemplates all major electronic databases.
In may 2013, our search returned 221 papers. After reading the abstracts, 30 were selected for further analysis. These 30 papers were divided in four categories as described in the next section.
B. Data Analysis
The review of these works follows guidelines established by [9], who stated that the purpose of a survey is to summarize the accumulated knowledge base on the topic of interest and highlight issues yet to investigate. Our data analysis proceeded as follows.
Every article found and selected in the empirical search has been read. The categories were not pre-determined before reviewing, but emerged from data instead. Using the constant comparative method [10], the first articles was read and its contents was observed to form a categorization attempt according to the research topic. The results of the first paper were noted. The following article was then selected and read. Its content was matched with the firs article. If it was similar, it was put in the same category as the first one (together with its specificity) and the third article was processed. Otherwise, the second content represented the first entry in a new research category. This process was repeated until all 30 articles have been read and examined. It should be noted that it is possible that a single article produces more than one research category.
C. Search results
We identify four main research categories: (a) System Project, Architecture and Modeling, (b) Survey papers, (c) Frameworks and (d) Applications.
Category 1: System Project, Architecture and Modeling
This category covers a wide range of articles, since it comprises all those which involve the steps of design, architecture and modeling of cyber-physical systems. This section presents only the main works.
[11] presents a research on developing a REST-style architecture for CPS. It is proposed a way to solve the requirements of CPS architecture through RESTful principles.
In [12], a concept lattice-based event model for CPS is introduced. Under this model, a CPS event is uniformly represented by three components: event type, its internal attributes, and its external attributes. The internal and external attributes together characterize the type, spatio-temporal properties of the event as well as the components that observe it. A set of event composition rules are defined where the CPS event composition is based on a
CPS concept lattice. A real-life smart home example is used to illustrate the proposed event model.
In [13], a new seven layer sensor modeling approach is presented. The proposed architecture enables one to describe a sensor right from its physical properties to end functionality; where it defines the sensor services to talk with end applications.
Finally, [14] focuses on the challenges of modeling cyber-physical systems that arise from the intrinsic heterogeneity, concurrency, and sensitivity to timing of such systems. It uses a portion of an aircraft vehicle management systems (VMS), specifically the fuel management subsystem, to illustrate the challenges and then discusses technologies that at least partially address the challenges.
Category 2: Survey articles
Similarly to the previous one, this category also covers a wide range of articles, because it is composed of all those articles intended to produce a bibliographic review. This section also present only the main survey articles found in the empirical search.
One of the major references in the case of CPS surveys is “Cyber-Physical Systems: A New Frontier” [15]. This article first reviews some of the challenges and promises of CPS, followed by an articulation of some specific challenges and promises that are more closely related to the Sensor Networks, Ubiquitous and Trustworthy Computing.
[7] presents a future vision for cyber-physical systems and identifies some specific grand challenges, beyond research and educational challenges that must be addressed. It also discusses the resulting societal and economic impact of such advances in CPS.
At [16] the features of CPSs are described, and the research progresses are summarized from different perspectives such as energy control, secure control, transmission and management, control technique, system resource allocation, and model-based software design. After, the research challenges and some suggestions for future work are in brief outlined.
Yet, other important works on CPS surveys deserve to be mentioned as: Advances in Cyber-Physical Systems Research [17], and Cyber-Physical Systems: Close Encounters Between Two Parallel Worlds [Point of View] [8];
Category 3: Frameworks
Several frameworks for different applications appeared in our empirical search. The ones related with the subject of this article are briefly described below.
[18] presents a novel framework, based on CPS concept, for a networked interactive home based intelligent motor rehabilitation system to facilitate functional recovery post-stroke. Patients use proper rehabilitation appliances to conduct continuous, repetitive rehabilitation trainings while wireless sensor networks (WSN) collect data related to the patients' functional activities. Within this framework, it is expected that important information
Int'l Conf. e-Learning, e-Bus., EIS, and e-Gov. | EEE'13 | 371
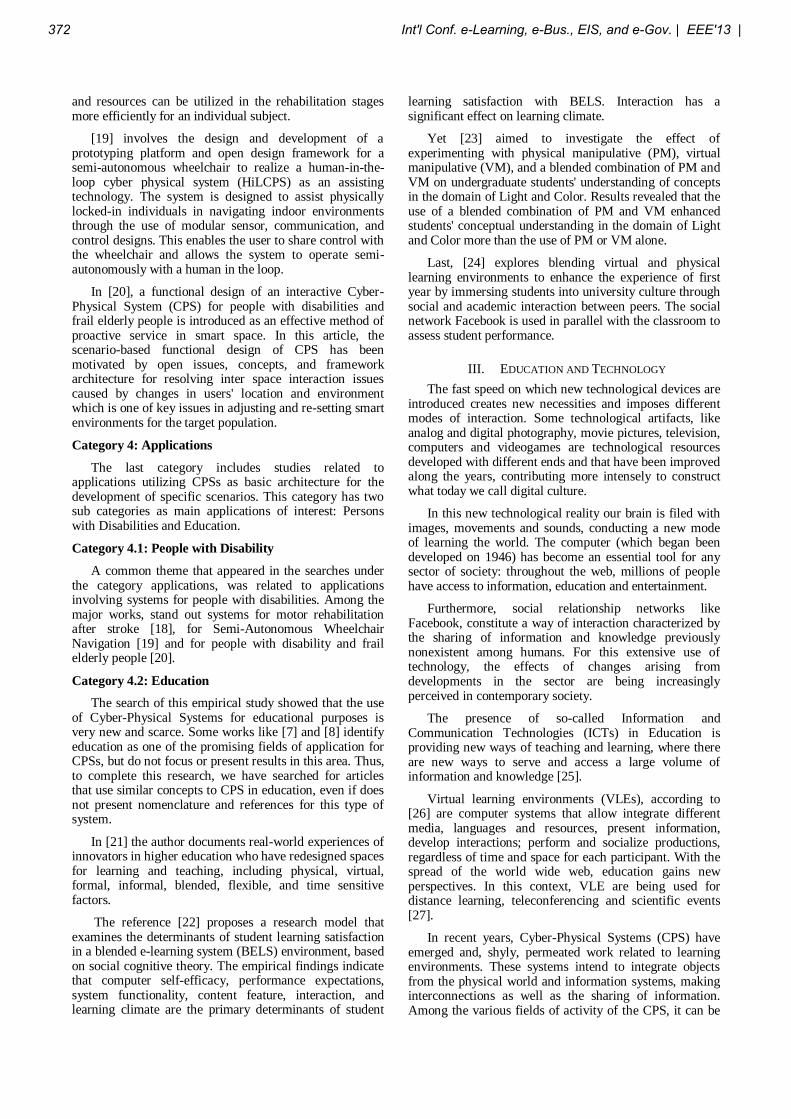
and resources can be utilized in the rehabilitation stages more efficiently for an individual subject.
[19] involves the design and development of a prototyping platform and open design framework for a semi-autonomous wheelchair to realize a human-in-the-loop cyber physical system (HiLCPS) as an assisting technology. The system is designed to assist physically locked-in individuals in navigating indoor environments through the use of modular sensor, communication, and control designs. This enables the user to share control with the wheelchair and allows the system to operate semi-autonomously with a human in the loop.
In [20], a functional design of an interactive Cyber-Physical System (CPS) for people with disabilities and frail elderly people is introduced as an effective method of proactive service in smart space. In this article, the scenario-based functional design of CPS has been motivated by open issues, concepts, and framework architecture for resolving inter space interaction issues caused by changes in users' location and environment which is one of key issues in adjusting and re-setting smart environments for the target population.
Category 4: Applications
The last category includes studies related to applications utilizing CPSs as basic architecture for the development of specific scenarios. This category has two sub categories as main applications of interest: Persons with Disabilities and Education.
Category 4.1: People with Disability
A common theme that appeared in the searches under the category applications, was related to applications involving systems for people with disabilities. Among the major works, stand out systems for motor rehabilitation after stroke [18], for Semi-Autonomous Wheelchair Navigation [19] and for people with disability and frail elderly people [20].
Category 4.2: Education
The search of this empirical study showed that the use of Cyber-Physical Systems for educational purposes is very new and scarce. Some works like [7] and [8] identify education as one of the promising fields of application for CPSs, but do not focus or present results in this area. Thus, to complete this research, we have searched for articles that use similar concepts to CPS in education, even if does not present nomenclature and references for this type of system.
In [21] the author documents real-world experiences of innovators in higher education who have redesigned spaces for learning and teaching, including physical, virtual, formal, informal, blended, flexible, and time sensitive factors.
The reference [22] proposes a research model that examines the determinants of student learning satisfaction in a blended e-learning system (BELS) environment, based on social cognitive theory. The empirical findings indicate that computer self-efficacy, performance expectations, system functionality, content feature, interaction, and learning climate are the primary determinants of student
learning satisfaction with BELS. Interaction has a significant effect on learning climate.
Yet [23] aimed to investigate the effect of experimenting with physical manipulative (PM), virtual manipulative (VM), and a blended combination of PM and VM on undergraduate students' understanding of concepts in the domain of Light and Color. Results revealed that the use of a blended combination of PM and VM enhanced students' conceptual understanding in the domain of Light and Color more than the use of PM or VM alone.
Last, [24] explores blending virtual and physical learning environments to enhance the experience of first year by immersing students into university culture through social and academic interaction between peers. The social network Facebook is used in parallel with the classroom to assess student performance.
III. EDUCATION AND TECHNOLOGY
The fast speed on which new technological devices are introduced creates new necessities and imposes different modes of interaction. Some technological artifacts, like analog and digital photography, movie pictures, television, computers and videogames are technological resources developed with different ends and that have been improved along the years, contributing more intensely to construct what today we call digital culture.
In this new technological reality our brain is filed with images, movements and sounds, conducting a new mode of learning the world. The computer (which began been developed on 1946) has become an essential tool for any sector of society: throughout the web, millions of people have access to information, education and entertainment.
Furthermore, social relationship networks like Facebook, constitute a way of interaction characterized by the sharing of information and knowledge previously nonexistent among humans. For this extensive use of technology, the effects of changes arising from developments in the sector are being increasingly perceived in contemporary society.
The presence of so-called Information and Communication Technologies (ICTs) in Education is providing new ways of teaching and learning, where there are new ways to serve and access a large volume of information and knowledge [25].
Virtual learning environments (VLEs), according to [26] are computer systems that allow integrate different media, languages and resources, present information, develop interactions; perform and socialize productions, regardless of time and space for each participant. With the spread of the world wide web, education gains new perspectives. In this context, VLE are being used for distance learning, teleconferencing and scientific events [27].
In recent years, Cyber-Physical Systems (CPS) have emerged and, shyly, permeated work related to learning environments. These systems intend to integrate objects from the physical world and information systems, making interconnections as well as the sharing of information. Among the various fields of activity of the CPS, it can be
372 Int'l Conf. e-Learning, e-Bus., EIS, and e-Gov. | EEE'13 |
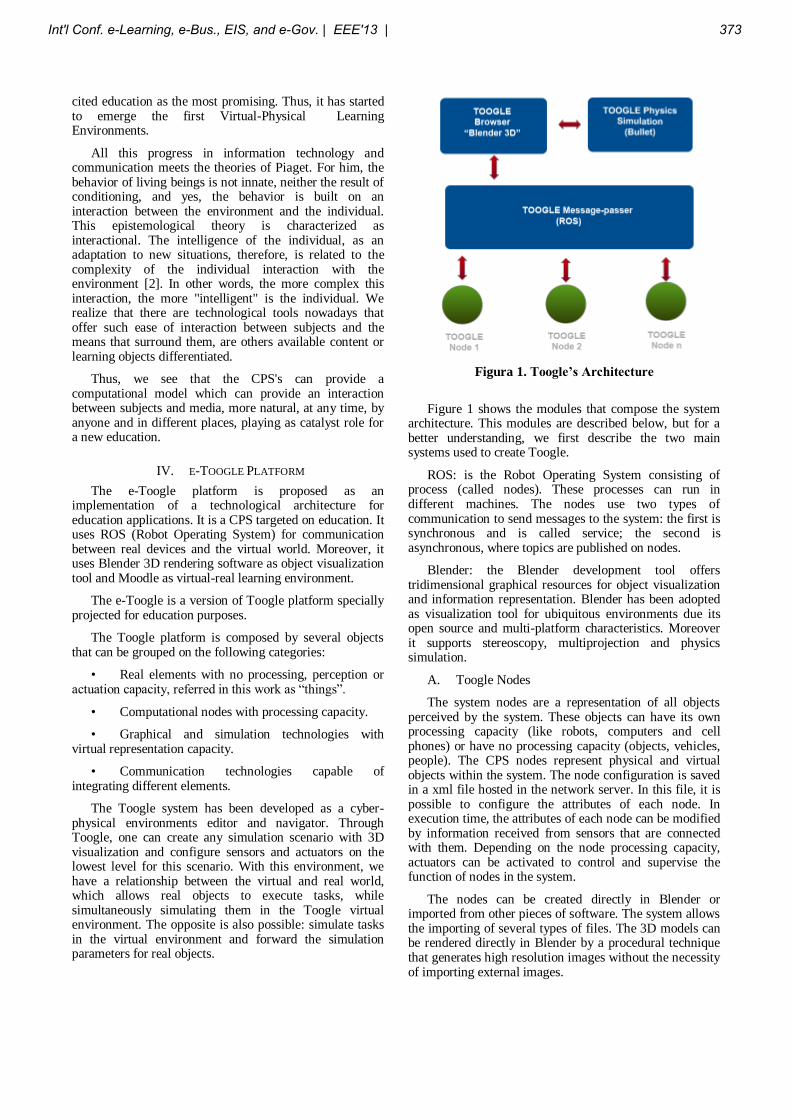
cited education as the most promising. Thus, it has started to emerge the first Virtual-Physical Learning Environments.
All this progress in information technology and communication meets the theories of Piaget. For him, the behavior of living beings is not innate, neither the result of conditioning, and yes, the behavior is built on an interaction between the environment and the individual. This epistemological theory is characterized as interactional. The intelligence of the individual, as an adaptation to new situations, therefore, is related to the complexity of the individual interaction with the environment [2]. In other words, the more complex this interaction, the more "intelligent" is the individual. We realize that there are technological tools nowadays that offer such ease of interaction between subjects and the means that surround them, are others available content or learning objects differentiated.
Thus, we see that the CPS's can provide a computational model which can provide an interaction between subjects and media, more natural, at any time, by anyone and in different places, playing as catalyst role for a new education.
IV. E-TOOGLE PLATFORM
The e-Toogle platform is proposed as an implementation of a technological architecture for education applications. It is a CPS targeted on education. It uses ROS (Robot Operating System) for communication between real devices and the virtual world. Moreover, it uses Blender 3D rendering software as object visualization tool and Moodle as virtual-real learning environment.
The e-Toogle is a version of Toogle platform specially projected for education purposes.
The Toogle platform is composed by several objects that can be grouped on the following categories:
• Real elements with no processing, perception or actuation capacity, referred in this work as “things”.
• Computational nodes with processing capacity.
• Graphical and simulation technologies with virtual representation capacity.
• Communication technologies capable of integrating different elements.
The Toogle system has been developed as a cyber-physical environments editor and navigator. Through Toogle, one can create any simulation scenario with 3D visualization and configure sensors and actuators on the lowest level for this scenario. With this environment, we have a relationship between the virtual and real world, which allows real objects to execute tasks, while simultaneously simulating them in the Toogle virtual environment. The opposite is also possible: simulate tasks in the virtual environment and forward the simulation parameters for real objects.
Figura 1. Toogle’s Architecture
Figure 1 shows the modules that compose the system architecture. This modules are described below, but for a better understanding, we first describe the two main systems used to create Toogle.
ROS: is the Robot Operating System consisting of process (called nodes). These processes can run in different machines. The nodes use two types of communication to send messages to the system: the first is synchronous and is called service; the second is asynchronous, where topics are published on nodes.
Blender: the Blender development tool offers tridimensional graphical resources for object visualization and information representation. Blender has been adopted as visualization tool for ubiquitous environments due its open source and multi-platform characteristics. Moreover it supports stereoscopy, multiprojection and physics simulation.
A. Toogle Nodes
The system nodes are a representation of all objects perceived by the system. These objects can have its own processing capacity (like robots, computers and cell phones) or have no processing capacity (objects, vehicles, people). The CPS nodes represent physical and virtual objects within the system. The node configuration is saved in a xml file hosted in the network server. In this file, it is possible to configure the attributes of each node. In execution time, the attributes of each node can be modified by information received from sensors that are connected with them. Depending on the node processing capacity, actuators can be activated to control and supervise the function of nodes in the system.
The nodes can be created directly in Blender or imported from other pieces of software. The system allows the importing of several types of files. The 3D models can be rendered directly in Blender by a procedural technique that generates high resolution images without the necessity of importing external images.
Int'l Conf. e-Learning, e-Bus., EIS, and e-Gov. | EEE'13 | 373
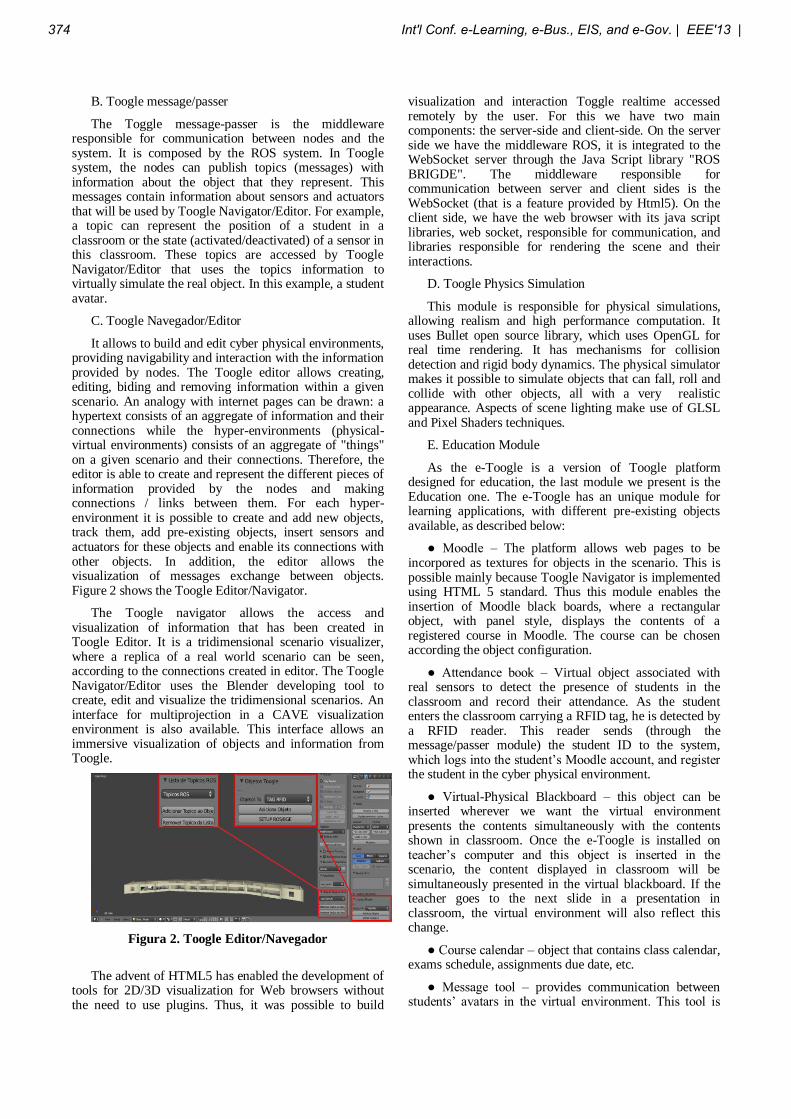
B. Toogle message/passer
The Toggle message-passer is the middleware responsible for communication between nodes and the system. It is composed by the ROS system. In Toogle system, the nodes can publish topics (messages) with information about the object that they represent. This messages contain information about sensors and actuators that will be used by Toogle Navigator/Editor. For example, a topic can represent the position of a student in a classroom or the state (activated/deactivated) of a sensor in this classroom. These topics are accessed by Toogle Navigator/Editor that uses the topics information to virtually simulate the real object. In this example, a student avatar.
C. Toogle Navegador/Editor
It allows to build and edit cyber physical environments, providing navigability and interaction with the information provided by nodes. The Toogle editor allows creating, editing, biding and removing information within a given scenario. An analogy with internet pages can be drawn: a hypertext consists of an aggregate of information and their connections while the hyper-environments (physical-virtual environments) consists of an aggregate of "things" on a given scenario and their connections. Therefore, the editor is able to create and represent the different pieces of information provided by the nodes and making connections / links between them. For each hyper-environment it is possible to create and add new objects, track them, add pre-existing objects, insert sensors and actuators for these objects and enable its connections with other objects. In addition, the editor allows the visualization of messages exchange between objects. Figure 2 shows the Toogle Editor/Navigator.
The Toogle navigator allows the access and visualization of information that has been created in Toogle Editor. It is a tridimensional scenario visualizer, where a replica of a real world scenario can be seen, according to the connections created in editor. The Toogle Navigator/Editor uses the Blender developing tool to create, edit and visualize the tridimensional scenarios. An interface for multiprojection in a CAVE visualization environment is also available. This interface allows an immersive visualization of objects and information from Toogle.
Figura 2. Toogle Editor/Navegador
The advent of HTML5 has enabled the development of tools for 2D/3D visualization for Web browsers without the need to use plugins. Thus, it was possible to build
visualization and interaction Toggle realtime accessed remotely by the user. For this we have two main components: the server-side and client-side. On the server side we have the middleware ROS, it is integrated to the WebSocket server through the Java Script library "ROS BRIGDE". The middleware responsible for communication between server and client sides is the WebSocket (that is a feature provided by Html5). On the client side, we have the web browser with its java script libraries, web socket, responsible for communication, and libraries responsible for rendering the scene and their interactions.
D. Toogle Physics Simulation
This module is responsible for physical simulations, allowing realism and high performance computation. It uses Bullet open source library, which uses OpenGL for real time rendering. It has mechanisms for collision detection and rigid body dynamics. The physical simulator makes it possible to simulate objects that can fall, roll and collide with other objects, all with a very realistic appearance. Aspects of scene lighting make use of GLSL and Pixel Shaders techniques.
E. Education Module
As the e-Toogle is a version of Toogle platform designed for education, the last module we present is the Education one. The e-Toogle has an unique module for learning applications, with different pre-existing objects available, as described below:
● Moodle – The platform allows web pages to be incorpored as textures for objects in the scenario. This is possible mainly because Toogle Navigator is implemented using HTML 5 standard. Thus this module enables the insertion of Moodle black boards, where a rectangular object, with panel style, displays the contents of a registered course in Moodle. The course can be chosen according the object configuration.
● Attendance book – Virtual object associated with real sensors to detect the presence of students in the classroom and record their attendance. As the student enters the classroom carrying a RFID tag, he is detected by a RFID reader. This reader sends (through the message/passer module) the student ID to the system, which logs into the student’s Moodle account, and register the student in the cyber physical environment.
● Virtual-Physical Blackboard – this object can be inserted wherever we want the virtual environment presents the contents simultaneously with the contents shown in classroom. Once the e-Toogle is installed on teacher’s computer and this object is inserted in the scenario, the content displayed in classroom will be simultaneously presented in the virtual blackboard. If the teacher goes to the next slide in a presentation in classroom, the virtual environment will also reflect this change.
● Course calendar – object that contains class calendar, exams schedule, assignments due date, etc.
● Message tool – provides communication between students’ avatars in the virtual environment. This tool is
374 Int'l Conf. e-Learning, e-Bus., EIS, and e-Gov. | EEE'13 |
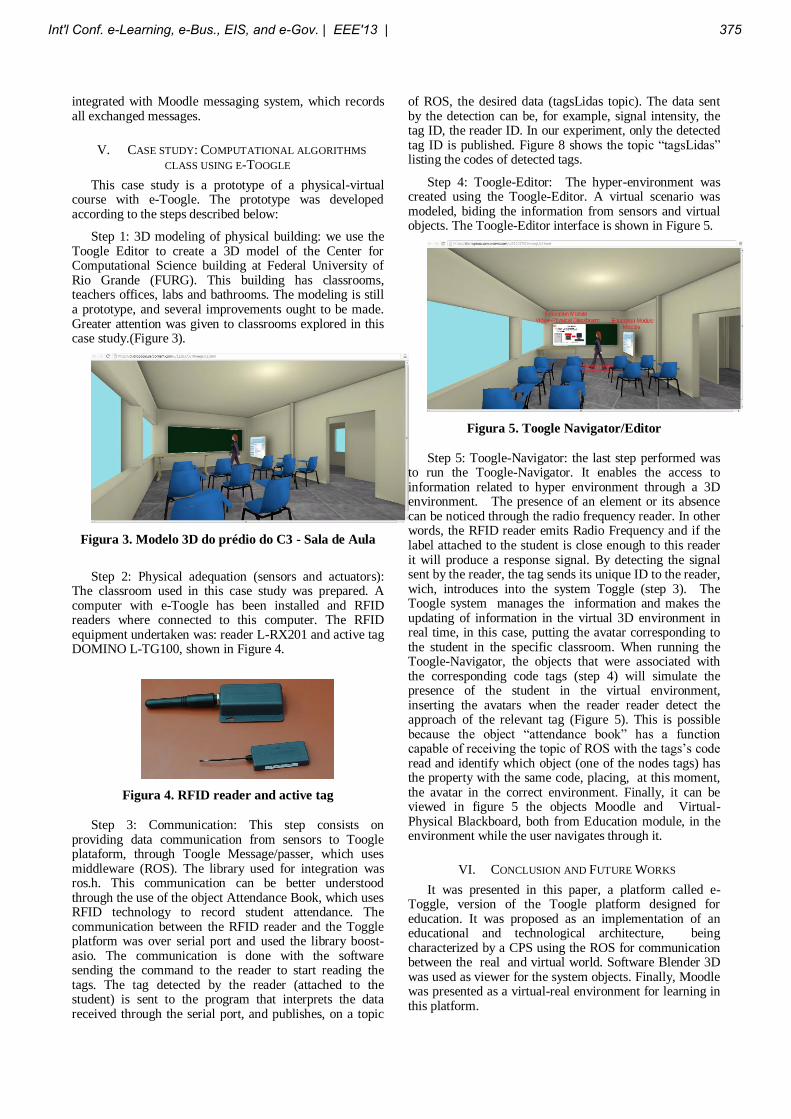
integrated with Moodle messaging system, which records all exchanged messages.
V. CASE STUDY: COMPUTATIONAL ALGORITHMS
CLASS USING E-TOOGLE
This case study is a prototype of a physical-virtual course with e-Toogle. The prototype was developed according to the steps described below:
Step 1: 3D modeling of physical building: we use the Toogle Editor to create a 3D model of the Center for Computational Science building at Federal University of Rio Grande (FURG). This building has classrooms, teachers offices, labs and bathrooms. The modeling is still a prototype, and several improvements ought to be made. Greater attention was given to classrooms explored in this case study.(Figure 3).
Figura 3. Modelo 3D do prédio do C3 - Sala de Aula
Step 2: Physical adequation (sensors and actuators): The classroom used in this case study was prepared. A computer with e-Toogle has been installed and RFID readers where connected to this computer. The RFID equipment undertaken was: reader L-RX201 and active tag DOMINO L-TG100, shown in Figure 4.
Figura 4. RFID reader and active tag
Step 3: Communication: This step consists on
providing data communication from sensors to Toogle plataform, through Toogle Message/passer, which uses middleware (ROS). The library used for integration was ros.h. This communication can be better understood through the use of the object Attendance Book, which uses RFID technology to record student attendance. The communication between the RFID reader and the Toggle platform was over serial port and used the library boost-asio. The communication is done with the software sending the command to the reader to start reading the tags. The tag detected by the reader (attached to the student) is sent to the program that interprets the data received through the serial port, and publishes, on a topic
of ROS, the desired data (tagsLidas topic). The data sent by the detection can be, for example, signal intensity, the tag ID, the reader ID. In our experiment, only the detected tag ID is published. Figure 8 shows the topic “tagsLidas” listing the codes of detected tags.
Step 4: Toogle-Editor: The hyper-environment was created using the Toogle-Editor. A virtual scenario was modeled, biding the information from sensors and virtual objects. The Toogle-Editor interface is shown in Figure 5.
Figura 5. Toogle Navigator/Editor
Step 5: Toogle-Navigator: the last step performed was
to run the Toogle-Navigator. It enables the access to information related to hyper environment through a 3D environment. The presence of an element or its absence can be noticed through the radio frequency reader. In other words, the RFID reader emits Radio Frequency and if the label attached to the student is close enough to this reader it will produce a response signal. By detecting the signal sent by the reader, the tag sends its unique ID to the reader, wich, introduces into the system Toggle (step 3). The Toogle system manages the information and makes the updating of information in the virtual 3D environment in real time, in this case, putting the avatar corresponding to the student in the specific classroom. When running the Toogle-Navigator, the objects that were associated with the corresponding code tags (step 4) will simulate the presence of the student in the virtual environment, inserting the avatars when the reader reader detect the approach of the relevant tag (Figure 5). This is possible because the object “attendance book” has a function capable of receiving the topic of ROS with the tags’s code read and identify which object (one of the nodes tags) has the property with the same code, placing, at this moment, the avatar in the correct environment. Finally, it can be viewed in figure 5 the objects Moodle and Virtual-Physical Blackboard, both from Education module, in the environment while the user navigates through it.
VI. CONCLUSION AND FUTURE WORKS
It was presented in this paper, a platform called e-Toggle, version of the Toogle platform designed for education. It was proposed as an implementation of an educational and technological architecture, being characterized by a CPS using the ROS for communication between the real and virtual world. Software Blender 3D was used as viewer for the system objects. Finally, Moodle was presented as a virtual-real environment for learning in this platform.
Int'l Conf. e-Learning, e-Bus., EIS, and e-Gov. | EEE'13 | 375

The architecture of e-Toggle was presented with 5 modules: Toggle Nodes, Toggle message / passer, Toggle Browser / Editor, Toggle physical simulator and Education Module. Finally, we presented a use case to validate the platform and use the results as feedback.
As future work, we intend to improve the education module, enabling new virtual/physical objects to be developed. It is important to emphasize that the focus from the present moment, where the platform is implemented and tested, becomes the creation of learning objects that provide greater interaction among individuals and the environment, providing an environment that, according to Piaget, provides learning of higher quality.
We also aim, at a second moment, the deployment of the prototype in some courses offered at the Center for Computational Sciences at Federal University of Rio Grande, so that new actual tests can be made, and the results can be used to determine new platform requirements.
Finally, it is also the intention of this work to create a Non-Restrictive Module, where the focus will be the development of objects that seek to minimize the restrictions of space-time, sensory and performance found by people with needs or not, at the educational environments.
REFERENCES
[1] Shunqing Yan, Yongxin Zhu, Qiannan Zhang, Qin Wang, Ming
Ni, Guangwei Xie, "A Case Study of CPNS Intelligence:
Provenance Reasoning over Tracing Cross Contamination in Food Supply Chain," 2012 32nd International Conference on Distributed
Computing Systems Workshops, pp. 330-335, 2012 32nd International Conference on Distributed Computing Systems
Workshops, 2012.
[2] Jean Piaget, “A Epistemologia Genética e a Pesquisa Psicológica”. Rio de Janeiro: Freitas Bastos, 1974.
[3] E. Zouganeli and I. Svinnset, “Connected objects and the internet
of things x2014; a paradigm shift,” in Photonics in Switching, 2009. PS ’09. International Conference on, 2009, pp. 1–4.
[4] Y. Huang and G. Li, “Descriptive models for /internet of things,” in Intelligent Control and Information Processing (ICICIP), 2010
International Conference on, 2010, pp. 483–486.
[5] N. Koshizuka and K. Sakamura, “Ubiquitous id: Standards for ubiquitous computing and the internet of things,” Pervasive
Computing, IEEE, vol. 9, no. 4, pp. 98 –101, october-december 2010.
[6] uID Center, “http://www.uidcenter.org/,” Apr 2011.
[7] Ragunathan (Raj) Rajkumar, Insup Lee, Lui Sha, and John
Stankovic. 2010. Cyber-physical systems: the next computing revolution. In Proceedings of the 47th Design Automation
Conference (DAC '10). ACM, New York, NY, USA, 731-736. DOI=10.1145/1837274.1837461
http://doi.acm.org/10.1145/1837274.1837461.
[8] Poovendran, R., "Cyber–Physical Systems: Close Encounters Between Two Parallel Worlds [Point of View]," Proceedings of the
IEEE , vol.98, no.8, pp.1363,1366, Aug. 2010.
[9] Creswell, J. (1994). Research design qualitative and quantitative approaches. Thousand Oaks: Sage Publications..
[10] Lincoln, Y. S., & Guba, E. G. (1985). Naturalistic inquiry. Beverly Hills, CA: Sage Publications..
[11] Qiang Li, Weijun Qin, Bing Han, Ruicong Wang, Limin Sun. A
case study on REST-style architecture for cyber-physical systems: Restful smart gateway. Comput. Sci. Inf. Syst 01/2011; 8:1317-
1329. pp.1317-1329.
[12] Ying Tan, Mehmet C. Vuran, Steve Goddard, Yue Yu, Miao Song,
and Shangping Ren. 2010. A concept lattice-based event model for Cyber-Physical Systems. In Proceedings of the 1st ACM/IEEE
International Conference on Cyber-Physical Systems (ICCPS '10). ACM, New York, NY, USA, 50-60.
[13] Chattopadhyay, D.; Dasgupta, R., "A novel comprehensive sensor
model for cyber physical system: Interoperability for heterogeneous sensor," Sensing Technology (ICST), 2012 Sixth
International Conference on , vol., no., pp.179,183, 18-21 Dec. 2012
[14] Derler, Patricia and Lee, Edward A. and Sangiovanni-Vincentelli,
Alberto L. Addressing Modeling Challenges in Cyber-Physical Systems. UCB/EECS-2011-17.
[15] Lui Sha; Gopalakrishnan, S.; Xue Liu; Qixin Wang, "Cyber-
Physical Systems: A New Frontier," Sensor Networks, Ubiquitous and Trustworthy Computing, 2008. SUTC '08. IEEE International
Conference on , vol., no., pp.1,9, 11-13 June 2008.
[16] Jianhua Shi; Jiafu Wan; Hehua Yan; Hui Suo, "A survey of Cyber-Physical Systems," Wireless Communications and Signal
Processing (WCSP), 2011 International Conference on , vol., no., pp.1,6, 9-11 Nov. 2011 doi: 10.1109/WCSP.2011.6096958.
[17] Advances in Cyber-Physical Systems Research. Jiafu Wan, Hehua
Yan, Hui Suo, Fang Li. TIIS 01/2011; 5:1891-1908. pp.1891-1908.
[18] Xuan Ma, Xikai Tu, Jian Huang, and Jiping He. 2011. A cyber-
physical system based framework for motor rehabilitation after stroke. In Proceedings of the 1st International Conference on
Wireless Technologies for Humanitarian Relief (ACWR '11). ACM, New York, NY, USA, 285-290.
[19] Ross Desmond, Matt Dickerman, James Fleming.. Human-in-the-
Loop Cyber Physical Systems: Modular Designs for Semi-Autonomous Wheelchair Navigation.
[20] Shinyoung Lim, Lawrence Chung, Oakyoung Han, and Jae-Hyun
Kim. 2011. An interactive cyber-physical system (CPS) for people with disability and frail elderly people. In Proceedings of the 5th
International Conference on Ubiquitous Information Management and Communication (ICUIMC '11). ACM, New York, NY, USA, ,
Article 113 , 8 pages.
[21] Mike Keppell, Kay Souter, Matthew Riddle. Physical and Virtual Learning Spaces in Higher Education: Concepts for the Modern
Learning Environment. 2011.
[22] Jen-Her Wu, Robert D. Tennyson, Tzyh-Lih Hsia, A study of student satisfaction in a blended e-learning system environment,
Computers & Education, Volume 55, Issue 1, August 2010, Pages 155-164, ISSN 0360-1315, 10.1016/j.compedu.2009.12.012.
[23] Olympiou, G. and Zacharia, Z. C. (2012), Blending physical and
virtual manipulatives: An effort to improve students' conceptual understanding through science laboratory experimentation. Sci.
Ed., 96: 21–47. doi: 10.1002/sce.20463
[24] Joshua McCarthy. Blended learning environments: Using social
networking sites to enhance the first year experience .Australasian Journal of Educational Technology 2010, 26(6), 729-740.
[25] Caparróz, A.S.C. & Lopes, M.C.P. 2008. Desafios e perspectivas
em ambientes virtuais de aprendizagem: inter-relações, formação tecnológica e prática docente. Educação Formação e Tecnologias,
(1), 50-58.
[26] Almeida, M.E.B. 2003. Educação a distância na internet: abordagens e contribuições dos ambientes digitais de
aprendizagem. Educação e Pesquisa, (29), 327-340.
[27] Tarouco, L.M.R.; Konrath, M.L.P.; Carvalho, M.J.S.; Ávila, B.G. 2006. Formação de professores para produção e uso de objetos de
aprendizagem. Revista Novas Tecnologias na Educação, (4), 1-10.
376 Int'l Conf. e-Learning, e-Bus., EIS, and e-Gov. | EEE'13 |
Learning Online: The Role of Attitudes Towards Online Communication
Nicola Marsden IT Department, Heilbronn University, Heilbronn, Germany
Abstract – In educating students to professionally deal with remote collaboration, educators are faced with attitu-dinal structures – both their own and their students – with might have an influence on their actual online behavior. In an exploratory factor analysis three factors which represent different attitudes found towards online communication were identified. In this paper these three dimensions are presented and future research based on these findings is outlined.
Keywords: attitudes, factor analysis, online collaboration, computer-mediated communication
1 Introduction Attitudes towards online communication can influence the approach a person takes towards working and learning online. For educators, this is relevant from several perspec-tives: (1) most learning today involves some extend of online communication, (2) preparing the students to effec-tively communicate online is a key competence students have to acquire, (3) students' attitudes might be homogene-ous or they might differ from one another in their ap-proaches and this is relevant for the approach taking to teaching them, (4) teachers' own attitudes need to be re-flected and might be similar or dissimilar to their students' attitudes.
Thus researching the attitudinal structure people have to-wards online communication can help to improve learning and preparing students for communicating in their future work environment. Yet only few studies have focused on attitudes towards online communication and learning (Hammoud, Love & Brinkman, 2008; Korkmaz, 2012; Ku, Tseng & Akarasriworn, 2013). One reason to consider attitudes is that although the relationship between attitudes and actions is difficult, there is a connection and attitudes
and resulting actions may lead to self-fulfilling prophecies (cf. Walther & Bazarova, 2007) – as a result one could argue that in understanding choice of media, mode of communication, preferences in collaboration platforms etc. attitudes should be taken into consideration.
Attitudes towards online communication reflect the ap-proaches taken by scientific theories to a certain extend (Götz & Marsden, 2010). In an exploratory factor analysis (Marsden, 2013) three different approaches were identified based on Walther and Parks (2002): The first factor repre-sents a focus on deficits of online communication, the second one a focus on social cues in online communica-tion, and the third one a focus on the hyperpersonal options of online communication.
2 Attitudinal Structure Regarding Online Communication
The factors identified as dimensions of attitudes towards online communication (Marsden, 2013) can be described as follows:
Deficit Approach
People who take this approach focus on deficits of online communication and the necessity to make the right choice of media. The loss of (social) information is considered crucial and face to face has a decisive lead over online communication that can not be replicated. Thus it is im-portant to choose an appropriate mode of communication for the task at hand and watch out for different things online and face to face.
Looking at scientific theories which are based on this ap-proach on finds the notion that there has to be a match between information richness and media richness (Daft &
Int'l Conf. e-Learning, e-Bus., EIS, and e-Gov. | EEE'13 | 377
Lengel, 1986; Daft, Lengel, & Trevino, 1987). The basic assumption is that people choose a medium according to the cues they need. Some types of messages might be con-veyed more efficiently in one medium than in another – thus it is important to match the message and the medium. A cue system or bandwidth is taken as a causal property: As bandwidth gets lower, certain aspects of communica-tion are assumed to change. These differences include a decline in civility, coordination, empathy, and friendliness. There is assumed to be an optimal match between the mes-sage equivocality or uncertainty and the chosen media such that efficiency and effectiveness is optimal.
Social Cues Approach
Individuals taking this approach focus on relationships to others: The basic assumption is that – online or offline – people will find appropriate ways to socialize, and that online communication offers many options to build up positive relationships with others – the idea that communi-cation via mail or online has many disadvantages is reject-ed.
Scientific theories based on this approach focus on the fact that online communication brings in new cues which are not available in face to face communication – thus offering more or other ways to communicate. For example, com-municators can exchange social information through tim-ing (e.g. night versus day time) or style (spelling, signature, emoticons etc.) of verbal messages online. This line of research has shown that the absence of certain cues can enhance communication arguing that cues present in face to face interaction might actually have negative effects: Physical appearance can lead to the attribution of a multi-tude of qualities via the halo effect, markers of taste, age, habitus, signs of out-group-membership etc can lead to a biased perception. Thus the absence of cues in online communication can, under certain circumstances, forge stronger group identities than face to face interaction (Spears and Lea, 1992, 1994). Based on the theories of social identity and self-categorization (e.g., Turner, Hogg, Oakes, Reicher, & Wetherell, 1987) individuals are con-ceptualized to have multiple layers of self that become relevant depending on which social identity is salient. When personal identities are salient, the person behaves according to the norms, beliefs and standards which corre-spond to his or her unique identity. When social identities are salient, the behavior is based on the norms of the group with which one is identified. This process is enhanced by online communication that lacks multimedia cues and renders the partners visually anonymous: Under conditions of visual anonymity, people act in ways more normative to the salient group (Postmes, Spears, & Lea, 1998; Spears & Lea, 1992). When pictures or videos are added, these ef-fects diminish: Individuating information conveyed through physical appearance leads to the individuals being evaluated independently and with less group bias (Lea &
Spears, 1995; Lea, Spears, & de Groot, 2001). Based on this approach, online communication makes group mem-berships and social identity more salient and promotes greater group identification.
Cues Bent and Twisted Approach
People with this approach hold attitudes which focus on the new chances and advantages of online communication: Face to face communication is considered as something that can actually be negative and online communication is taken to offer possibilities for communication which are even better than face to face communication and can actu-ally improve communication.
A related scientific theory to this approach is Walther's (1996) hyperpersonal theory. It argues that online commu-nication can be even more personal that face to face com-munication („hyperpersonal“), because in an asynchronous online setting, sender, receiver, channel, and feedback can work together to promote more socially desirable levels of interaction than face to face communication (Walther, 1996): In online communication, individualizing cues such as appearance, which are necessarily available in face to face interaction are not readily available. The cues availa-ble can be manipulated by the sender to customize his or her self-presentation. In asynchronous interactions, the sender can mindfully compose the message, edit and re-view the content before sending it to the receiver. The focus of all cognitive resources can be on the message construction and the cognitive load can be divided over a longer time than in face to face communication. In combi-nation with these identity optimizing effects, the receiver tends to formulate idealized perceptions of the sender, interpreting the information available in terms of a com-mon identity with the sender. Thus a positive feedback loop can lead to an interaction which is more positive than a face to face interaction might have been.
3 Future Research Based on the finding that these different approaches have been identified as dimensions in an exploratory factor analysis future research should a.) confirm the attitudinal structure and b.) study the practical implications this atti-tudes have for learning and working online. Therefore, the development of a scale is planned which allows for an objective, valid, and reliable measure of the three ap-proaches. Then hypotheses regarding affective, cognitive and behavioral components of these attitudes will be de-rived and tested.
4 References Daft, R. L., & Lengel, R. H. (1986). Organizational infor-mation requirements, media richness, and structural deter-minants. Management Science, Vol. 32, pp. 554–571.
378 Int'l Conf. e-Learning, e-Bus., EIS, and e-Gov. | EEE'13 |
Daft, R. L., Lengel, R. H., & Trevino, L. K. (1987). Mes-sage equivocality, media selection, and manager perfor-mance: Implications for information systems. MIS Quar-terly, Vol. 11, pp. 355–368.
Götz, K. & Marsden, N. (2010). Soziale Interaktionen im Netz. In: R. Holten & D. Nittel (Eds.): Theorie und Empirie von E-Learning. Einsatzchancen in Hochschule und Weiterbildung. Bielefeld: Bertelsmann, pp. 81-94.
Hammoud, L.; Love, S.; Brinkman, W.-P. (2008). The affect of lecturers' attitude on students' use of an online learning environment. ECCE '08: Proceedings of the 15th European conference on Cognitive ergonomics.
Korkmaz, Ö. (2012). A validity and reliability study of the Online Cooperative Learning Attitude Scale (OCLAS). Computers & Education, Vol. 59, Issue 4, pp. 1162-1169. Ku, H.-Y.; Tseng, H. W.; Akarasriworn, C. (2013). Com-puters in Human Behavior. Vol. 29 Issue 3, pp. 922-929.
Lea, M., & Spears, R. (1995). Love at first byte? Building personal relationships over computer networks. In J. T. Wood & S. Duck (Eds.), Under-studied relationships: Off the beaten track. Thousand Oaks, CA: Sage, pp. 197-233.
Lea, M., Spears, R., & de Groot, D. (2001). Knowing me, knowing you: Anonymity effects on social identity proces-ses within groups. Personality & Social Psychology Bulle-tin, Vol. 27, pp. 526–537.
Marsden, N. (2013). Attitudes towards Online Communi-cation: An Exploratory Factor Analysis. In: Proceeding of SIGMIS-CPR’13, May 30–June 1, 2013, Cincinnati, Ohio, USA.
Postmes, T., Spears, R., & Lea, M. (1998). Breaching or building social boundaries? SIDE effects of computer-mediated communication. Communication Research, Vol. 25, pp. 689–715.
Spears, R., & Lea, M. (1992). Social influence and the influence of the ‘social’ in computer-mediated communica-tion. In M. Lea (Ed.), Contexts of computer-mediated communication. New York, NY: Harvester Wheatsheaf, pp. 30–65.
Spears, R., & Lea, M. (1994). Panacea or panopticum? The hidden power of computer-mediated communication. Communication Research, 21, 427–459.
Turner, J. C., Hogg, M. A., Oakes, P. J., Reicher, S. D., & Wetherell, M. S. (1987). Rediscovering the social group: A self-categorization theory. Oxford, UK: Blackwell.
Walther, J. B. (1996) Computer-Mediated Communication: Impersonal, Interpersonal, and Hyperpersonal Interaction. Communication Research, Vol. 23, pp. 3-43.
Walther, J. B. & Bazarova, N. N. (2007), Misattribution in Virtual Groups: The Effects of Member Distribution on Self-Serving Bias and Partner Blame. Human Communica-tion Research, Vol. 33, pp. 1-26.
Walther, J. B. & Parks, M. R. (2002). Cues filtered out, cues filtered in computer-mediated communication and relationships. In M. L. Knapp & J. A. Daly (Eds.), Hand-book of interpersonal communication (3rd edition). Thou-sand Oaks, CA: Sage, pp. 529-563.
Int'l Conf. e-Learning, e-Bus., EIS, and e-Gov. | EEE'13 | 379

380 Int'l Conf. e-Learning, e-Bus., EIS, and e-Gov. | EEE'13 |


