Embed Size (px)
Citation preview
Citation: Chang, D.-W.; Lu, C.-W.; Tu,
Y.-J.; Cheng, S.-H. Settlements and
Subgrade Reactions of Surface Raft
Foundations Subjected to Vertically
Uniform Load. Appl. Sci. 2022, 12,
5484. https://doi.org/10.3390/
app12115484
Academic Editor: Chiara Bedon
Received: 18 April 2022
Accepted: 26 May 2022
Published: 28 May 2022
Publisher’s Note: MDPI stays neutral
with regard to jurisdictional claims in
published maps and institutional affil-
iations.
Copyright: © 2022 by the authors.
Licensee MDPI, Basel, Switzerland.
This article is an open access article
distributed under the terms and
conditions of the Creative Commons
Attribution (CC BY) license (https://
creativecommons.org/licenses/by/
4.0/).
applied sciences
Article
Settlements and Subgrade Reactions of Surface RaftFoundations Subjected to Vertically Uniform LoadDer-Wen Chang 1, Chih-Wei Lu 2, Yu-Jhang Tu 1 and Shih-Hao Cheng 3,*
1 Department of Civil Engineering, Tamkang University, New Taipei City 25165, Taiwan;[email protected] (D.-W.C.); [email protected] (Y.-J.T.)
2 Department of Civil and Construction Engineering, National Taiwan University of Science and Technology,Taipei City 10607, Taiwan; [email protected]
3 Taiwan Building Technology Center, National Taiwan University of Science and Technology,Taipei City 10607, Taiwan
* Correspondence: [email protected]
Abstract: The settlements and corresponding soil reactions of a surface raft foundation subjected tovertically uniform load at the sites of granular or cohesive soils have been qualitatively introduced toengineers in the past. This study intends to verify the foundation load-response mechanism usingthree-dimensional finite-element analyses. The Mohr–Coulomb soil model was used to simulate thenonlinear effects of the granular and cohesive soils. The coefficients of subgrade reactions of the soilwere back-calculated and compared to those obtained from the rigid foundation model. For all thesquare surface rafts studied, non-uniform settlements with the largest value at the center can be found.For the smallest rafts located in clay, the soil reactions were found to be rather consistent. For largerrafts in clay, the soil reactions would be changed according to the soil stiffness and raft dimensions.For surface rafts in sand, the effects of soil stiffness on soil reactions appeared to be insignificant. Thesoil reactions were generally higher at the center and varied with raft dimensions. For the smallestraft in sand, large soil reactions can be found at the edge. The coefficients of subgrade reactionswere found to be more consistent with the smallest values occurring at the center. The results of thisstudy indicate that the load-response mechanism of the raft foundation is rather complicated. Suchload-response mechanisms are strongly affected by the relative rigidity of the foundation dependingon soil stiffness and foundation dimensions.
Keywords: raft foundation; settlement; soil reactions; coefficient of subgrade reaction; finite-element analysis
1. Introduction
The settlements of a raft foundation under vertical loads can be estimated using ei-ther analytical or numerical solutions. The analytical formula provides a relatively simplesolution; however, it has a shortcoming when modeling variations of foundation settle-ments. For numerical solutions, one-dimensional (1D) beams on elastic foundation (i.e., theWinkler foundation) or two-dimensional (2D) plates underlain by a set of soil springscan be used to model the foundation. A three-dimensional (3D) structure–foundation–soilsystem can also be adopted as a more rigorous analysis. The relative stiffness (or rigidity)of the foundation is typically important in affecting the load-response mechanism of thefoundation. Design engineers must know that the performance of a raft foundation canbe influenced by the rigidity of that foundation. It has been generally noted that rigidfoundations under vertical loads would result in more uniform settlements and variablecontact pressures of the soils (i.e., soil reactions). On the contrary, flexible foundations canexert large differential settlements and more consistent contact pressures of the soils.
To estimate foundation rigidity, the relative stiffness of a raft foundation (Kr) can beevaluated using the formula suggested by the ACI committee 336 report, DIN 4018 code,
Appl. Sci. 2022, 12, 5484. https://doi.org/10.3390/app12115484 https://www.mdpi.com/journal/applsci
Appl. Sci. 2022, 12, 5484 2 of 15
and IS 2950-1 code [1–3]. Ignoring the superstructure, the value of Kr can be simplycomputed as follows,
Kr =Eb
12E
(dL
)3, (1)
where Eb is the Young’s modulus of the concrete raft, E is the Young’s modulus of the soil, dis the thickness of the raft, and L is the length of the raft. A rigid or flexible raft is indicatedby Kr > 0.5 or Kr < 0.5, respectively. Alternatively, the effect of changes in the Poisson’sratios of the foundation and soil can be expressed by Equation (2) [4].
Kr =Eb
(1− υ2)
12E(1− υb2)
(dL
)3, (2)
where υb and υ are the Poisson’s ratio of the concrete and the soil, respectively. Per thedefinition used by Brown [5] in their finite element (FE) analysis, Kr < 0.05, 0.05 < Kr < 5,and Kr > 5 represent flexible, semi-rigid, and rigid foundations, respectively. The detailedexpressions of Equation (2) can be found in Pantelidis and Gravanis [6]. Moreover, ElGendy [7] reported that Kr can be calculated following the Egyptian code [8]:
Kr =EbE
(dL
)3. (3)
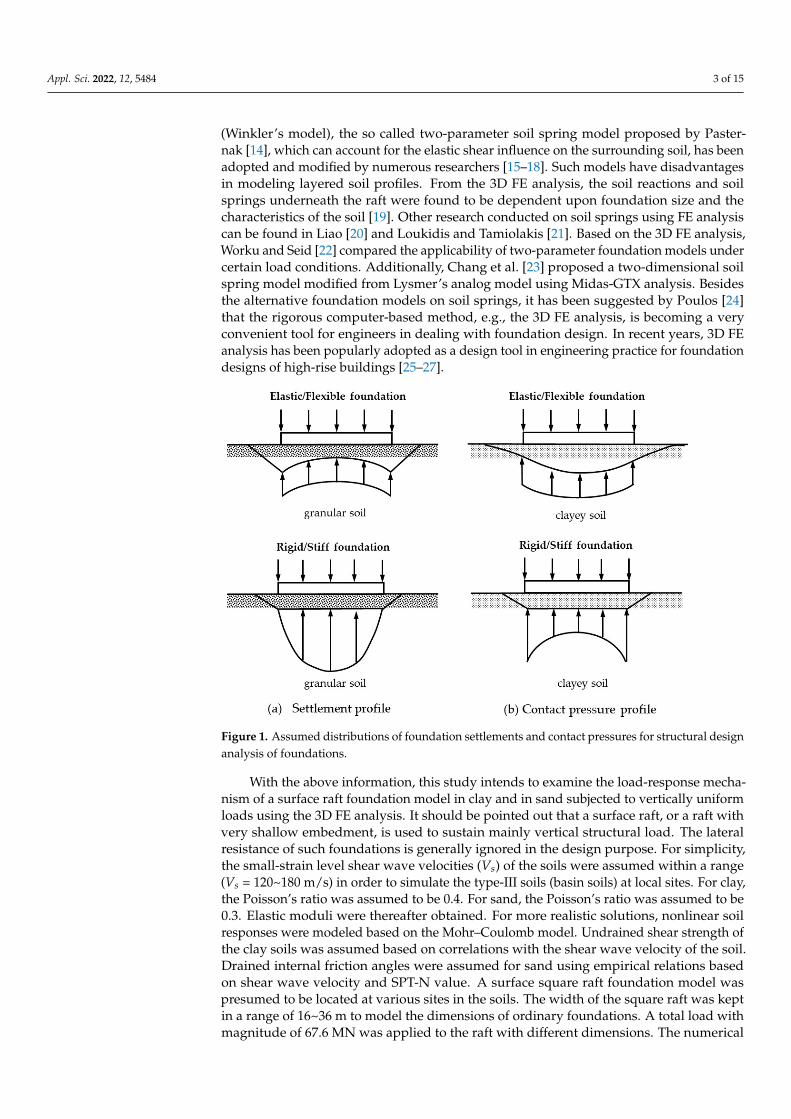
According to El Gendy [7], Kr < 0.005, 0.005 < Kr < 2 and Kr > 2 can represent forflexible, semi-rigid, and rigid foundations, respectively. In calculating Kr values of thefoundations, this study found that the Egyptian code is more stringent than others insatisfying the flexible foundation. When a 2D raft foundation is considered as a 1D beamand implemented with a vertically uniform load, the settlements and contact pressures (orthe soil reactions) of the foundation are not only dependent of the rigidity of the foundationbut also affected by the type of soil underneath the foundation. Figure 1 depicts qualitativeplots of the foundation settlements and the contact pressure of the soil for a raft foundationsubjected to a vertically uniform load. For granular soil such as sand, if the foundationis elastic (i.e., flexible), the settlement is larger at the edges and smaller at the center;corresponding stress of the soil reaction is relatively uniform. For rigid foundations in sand,uniform settlements can be expected and the stress of the soil reaction is larger at the centerand negligible at the edges. For a flexible foundation on clayey soil with similar load, thesettlements will be larger at the center and the stress of the soil reaction will tend to beuniform. Rigid foundations in clayey soil will result in uniform settlements, and the stress ofthe soil reaction is smaller at the center and higher at the edges. The above information hasbeen assumed in structural design and analysis of the foundation for many years. Earlierdiscussions of the contact pressures under the foundation can be found in Barden [9] basedon the approximate calculation method. A number of studies were carried out taking thefoundation–soil system as a two-dimensional structure subjected to combined static loadsand/or dynamic load. Until recent years, the effects of the three-dimensional geometry ofthe foundation–soil system were found to be important in affecting the actual responsesof the structure system [10,11]. Therefore, it is worthwhile to investigate the principles offoundation settlements and distribution of contact pressure with 3D solutions.
At present, the foundation settlements and soil reactions of arbitrarily loaded founda-tions can be easily estimated using either numerical or physical models. While the physicalmodel is usually scaled, thus resulting in stress levels incomparable to the real foundation,rigorous numerical methods such as the 3D FE analyses can provide a more convenientand effective solution to engineering problems. Kumar et al. [12] and Roy et al. [13] havedemonstrated the advantages of employing analytical and numerical analyses for certainfoundation problems. As the resulting coefficient of subgrade reaction (i.e., the soil springconstant, ks) plays a key role in the structural design of foundations, numerous soil springmodels have been developed since 1950. Besides the beam on elastic foundation model
Appl. Sci. 2022, 12, 5484 3 of 15
(Winkler’s model), the so called two-parameter soil spring model proposed by Paster-nak [14], which can account for the elastic shear influence on the surrounding soil, has beenadopted and modified by numerous researchers [15–18]. Such models have disadvantagesin modeling layered soil profiles. From the 3D FE analysis, the soil reactions and soilsprings underneath the raft were found to be dependent upon foundation size and thecharacteristics of the soil [19]. Other research conducted on soil springs using FE analysiscan be found in Liao [20] and Loukidis and Tamiolakis [21]. Based on the 3D FE analysis,Worku and Seid [22] compared the applicability of two-parameter foundation models undercertain load conditions. Additionally, Chang et al. [23] proposed a two-dimensional soilspring model modified from Lysmer’s analog model using Midas-GTX analysis. Besidesthe alternative foundation models on soil springs, it has been suggested by Poulos [24]that the rigorous computer-based method, e.g., the 3D FE analysis, is becoming a veryconvenient tool for engineers in dealing with foundation design. In recent years, 3D FEanalysis has been popularly adopted as a design tool in engineering practice for foundationdesigns of high-rise buildings [25–27].
Appl. Sci. 2022, 12, x FOR PEER REVIEW 3 of 16
Figure 1. Assumed distributions of foundation settlements and contact pressures for structural de-sign analysis of foundations.
At present, the foundation settlements and soil reactions of arbitrarily loaded foundations can be easily estimated using either numerical or physical models. While the physical model is usually scaled, thus resulting in stress levels incomparable to the real foundation, rigorous numerical methods such as the 3D FE analyses can provide a more convenient and effective solution to engineering problems. Kumar et al. [12] and Roy et al. [13] have demonstrated the advantages of employing analytical and numerical anal-yses for certain foundation problems. As the resulting coefficient of subgrade reaction (i.e., the soil spring constant, ks) plays a key role in the structural design of foundations, numerous soil spring models have been developed since 1950. Besides the beam on elas-tic foundation model (Winkler’s model), the so called two-parameter soil spring model proposed by Pasternak [14], which can account for the elastic shear influence on the surrounding soil, has been adopted and modified by numerous researchers [15–18]. Such models have disadvantages in modeling layered soil profiles. From the 3D FE analysis, the soil reactions and soil springs underneath the raft were found to be dependent upon foundation size and the characteristics of the soil [19]. Other research conducted on soil springs using FE analysis can be found in Liao [20] and Loukidis and Tamiolakis [21]. Based on the 3D FE analysis, Worku and Seid [22] compared the applicability of two-parameter foundation models under certain load conditions. Additionally, Chang et al. [23] proposed a two-dimensional soil spring model modified from Lysmer’s analog model using Midas-GTX analysis. Besides the alternative foundation models on soil springs, it has been suggested by Poulos [24] that the rigorous computer-based method, e.g., the 3D FE analysis, is becoming a very convenient tool for engineers in dealing with foundation design. In recent years, 3D FE analysis has been popularly adopted as a de-sign tool in engineering practice for foundation designs of high-rise buildings [25–27].
With the above information, this study intends to examine the load-response mechanism of a surface raft foundation model in clay and in sand subjected to vertically uniform loads using the 3D FE analysis. It should be pointed out that a surface raft, or a raft with very shallow embedment, is used to sustain mainly vertical structural load. The lateral resistance of such foundations is generally ignored in the design purpose. For simplicity, the small-strain level shear wave velocities (Vs) of the soils were assumed within a range (Vs = 120~180 m/s) in order to simulate the type-III soils (basin soils) at local
Figure 1. Assumed distributions of foundation settlements and contact pressures for structural designanalysis of foundations.
With the above information, this study intends to examine the load-response mecha-nism of a surface raft foundation model in clay and in sand subjected to vertically uniformloads using the 3D FE analysis. It should be pointed out that a surface raft, or a raft withvery shallow embedment, is used to sustain mainly vertical structural load. The lateralresistance of such foundations is generally ignored in the design purpose. For simplicity,the small-strain level shear wave velocities (Vs) of the soils were assumed within a range(Vs = 120~180 m/s) in order to simulate the type-III soils (basin soils) at local sites. For clay,the Poisson’s ratio was assumed to be 0.4. For sand, the Poisson’s ratio was assumed to be0.3. Elastic moduli were thereafter obtained. For more realistic solutions, nonlinear soilresponses were modeled based on the Mohr–Coulomb model. Undrained shear strength ofthe clay soils was assumed based on correlations with the shear wave velocity of the soil.Drained internal friction angles were assumed for sand using empirical relations basedon shear wave velocity and SPT-N value. A surface square raft foundation model waspresumed to be located at various sites in the soils. The width of the square raft was keptin a range of 16~36 m to model the dimensions of ordinary foundations. A total load withmagnitude of 67.6 MN was applied to the raft with different dimensions. The numerical
Appl. Sci. 2022, 12, 5484 4 of 15
results of the foundation settlements, soil reactions, and the coefficients of the soil reactionsare presented and discussed in following sections.
2. Numerical Modeling
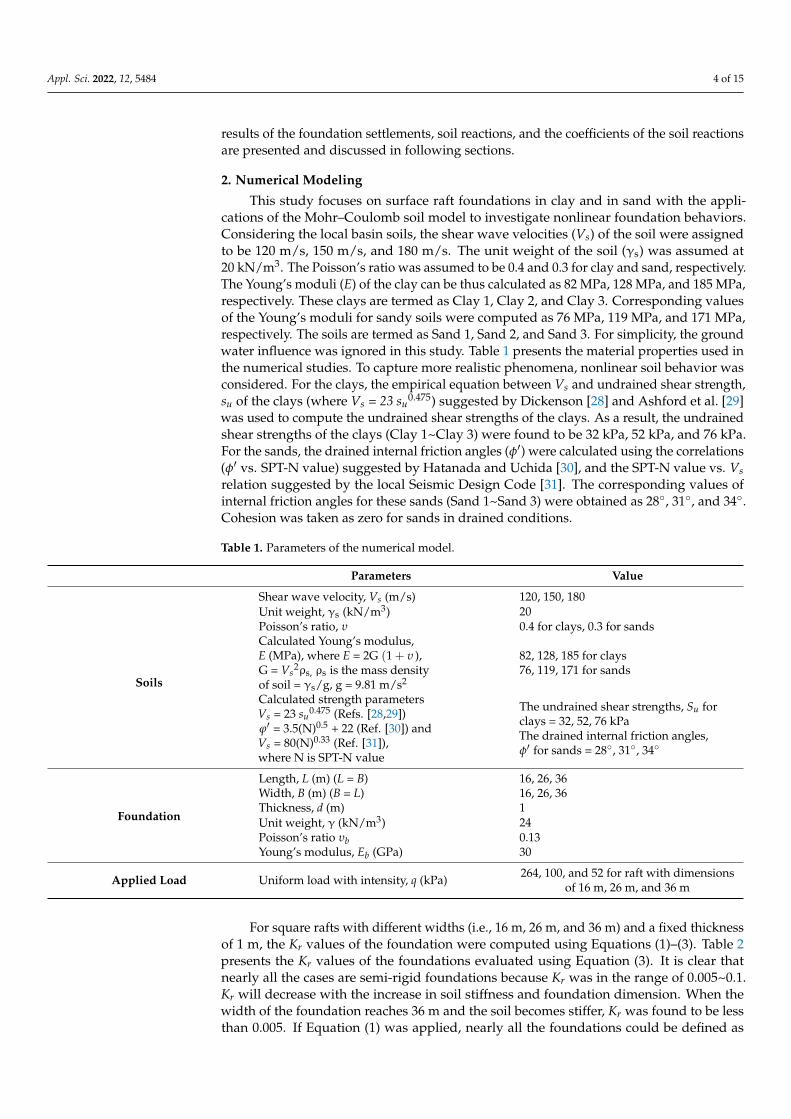
This study focuses on surface raft foundations in clay and in sand with the appli-cations of the Mohr–Coulomb soil model to investigate nonlinear foundation behaviors.Considering the local basin soils, the shear wave velocities (Vs) of the soil were assignedto be 120 m/s, 150 m/s, and 180 m/s. The unit weight of the soil (γs) was assumed at20 kN/m3. The Poisson’s ratio was assumed to be 0.4 and 0.3 for clay and sand, respectively.The Young’s moduli (E) of the clay can be thus calculated as 82 MPa, 128 MPa, and 185 MPa,respectively. These clays are termed as Clay 1, Clay 2, and Clay 3. Corresponding valuesof the Young’s moduli for sandy soils were computed as 76 MPa, 119 MPa, and 171 MPa,respectively. The soils are termed as Sand 1, Sand 2, and Sand 3. For simplicity, the groundwater influence was ignored in this study. Table 1 presents the material properties used inthe numerical studies. To capture more realistic phenomena, nonlinear soil behavior wasconsidered. For the clays, the empirical equation between Vs and undrained shear strength,su of the clays (where Vs = 23 su
0.475) suggested by Dickenson [28] and Ashford et al. [29]was used to compute the undrained shear strengths of the clays. As a result, the undrainedshear strengths of the clays (Clay 1~Clay 3) were found to be 32 kPa, 52 kPa, and 76 kPa.For the sands, the drained internal friction angles (φ′) were calculated using the correlations(φ′ vs. SPT-N value) suggested by Hatanada and Uchida [30], and the SPT-N value vs. Vsrelation suggested by the local Seismic Design Code [31]. The corresponding values ofinternal friction angles for these sands (Sand 1~Sand 3) were obtained as 28◦, 31◦, and 34◦.Cohesion was taken as zero for sands in drained conditions.
Table 1. Parameters of the numerical model.
Parameters Value
Soils
Shear wave velocity, Vs (m/s) 120, 150, 180Unit weight, γs (kN/m3) 20Poisson’s ratio, υ 0.4 for clays, 0.3 for sandsCalculated Young’s modulus,E (MPa), where E = 2G (1 + υ ),G = Vs
2ρs, ρs is the mass densityof soil = γs/g, g = 9.81 m/s2
82, 128, 185 for clays76, 119, 171 for sands
Calculated strength parametersVs = 23 su
0.475 (Refs. [28,29])ϕ′ = 3.5(N)0.5 + 22 (Ref. [30]) andVs = 80(N)0.33 (Ref. [31]),where N is SPT-N value
The undrained shear strengths, Su forclays = 32, 52, 76 kPaThe drained internal friction angles,φ′ for sands = 28◦, 31◦, 34◦
Foundation
Length, L (m) (L = B) 16, 26, 36Width, B (m) (B = L) 16, 26, 36Thickness, d (m) 1Unit weight, γ (kN/m3) 24Poisson’s ratio υb 0.13Young’s modulus, Eb (GPa) 30
Applied Load Uniform load with intensity, q (kPa) 264, 100, and 52 for raft with dimensionsof 16 m, 26 m, and 36 m
For square rafts with different widths (i.e., 16 m, 26 m, and 36 m) and a fixed thicknessof 1 m, the Kr values of the foundation were computed using Equations (1)–(3). Table 2presents the Kr values of the foundations evaluated using Equation (3). It is clear thatnearly all the cases are semi-rigid foundations because Kr was in the range of 0.005~0.1.Kr will decrease with the increase in soil stiffness and foundation dimension. When thewidth of the foundation reaches 36 m and the soil becomes stiffer, Kr was found to be lessthan 0.005. If Equation (1) was applied, nearly all the foundations could be defined as
Appl. Sci. 2022, 12, 5484 5 of 15
flexible foundations. Thus, the results can be used to interpret the behaviors of semi-rigidor flexible foundations; the possible influence of foundation thickness was ruled out inthis study.
Table 2. Rigidity factor Kr of the model foundation in this study.
Size(L = B)
The Relative Stiffness of a Raft Foundation (Kr)
Clay 1 Clay 2 Clay 3 Sand 1 Sand 2 Sand 3
16 m 0.0891 0.0570 0.0396 0.0959 0.0614 0.042626 m 0.0207 0.0133 0.0092 0.0224 0.0143 0.009936 m 0.0078 0.0050 0.0035 0.0084 0.0054 0.0037
3D Midas-GTS NX analysis [32] was adopted in the study. Such analysis has been usedin many engineering design projects. The first author has adopted Midas-GTS analysis toinvestigate raft foundations and piled raft foundations for many years [33,34]. Agreeableresults obtained from the 3D Midas-GTS analysis on elastic and inelastic soils have beensuccessfully compared to those from 3D PLAXIS analysis [35,36].
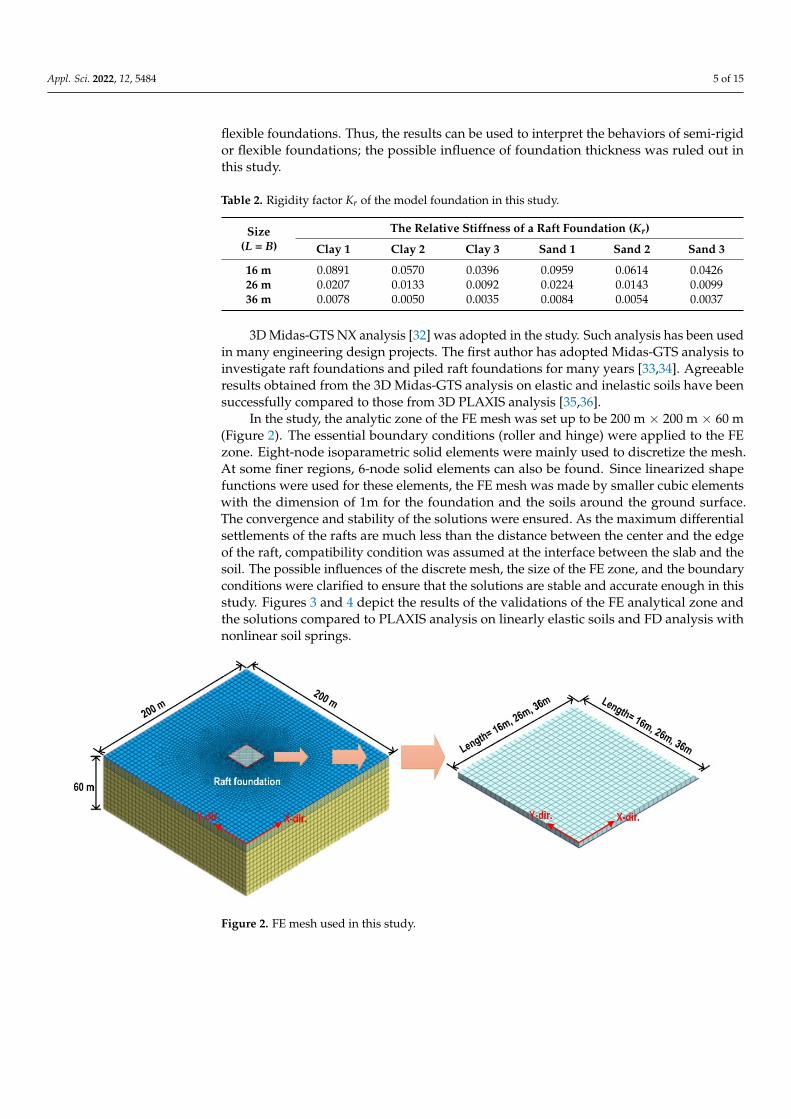
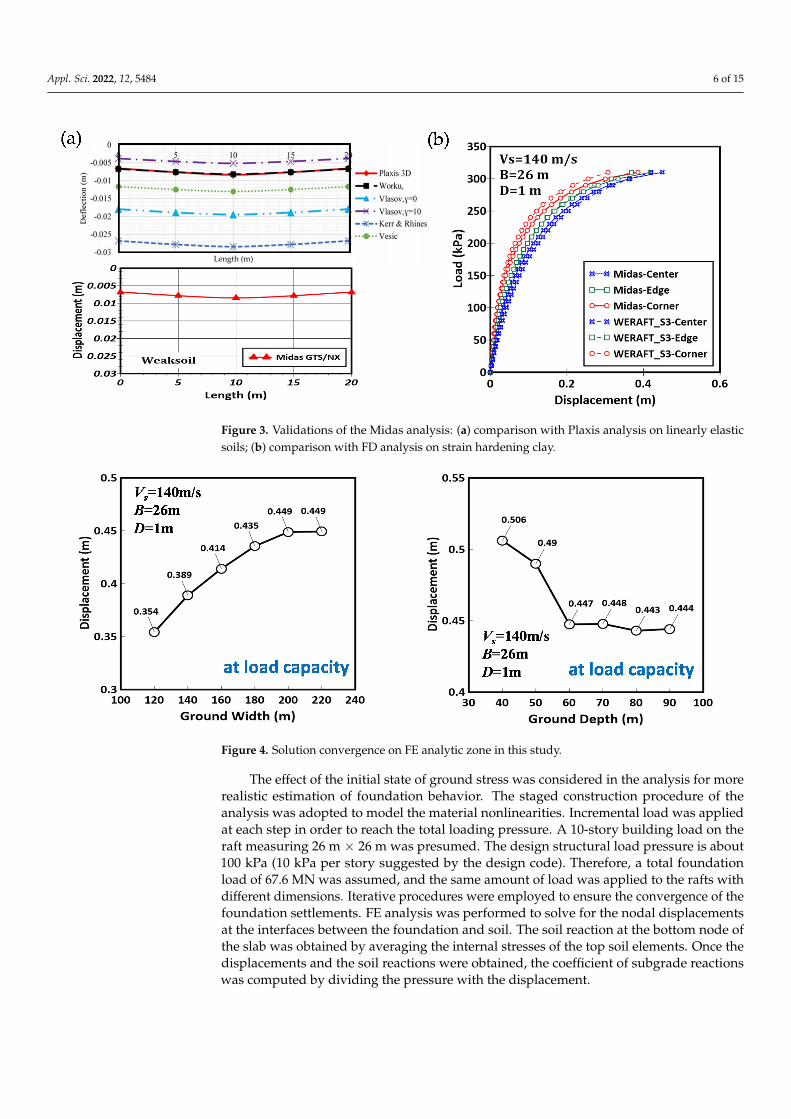
In the study, the analytic zone of the FE mesh was set up to be 200 m × 200 m × 60 m(Figure 2). The essential boundary conditions (roller and hinge) were applied to the FEzone. Eight-node isoparametric solid elements were mainly used to discretize the mesh.At some finer regions, 6-node solid elements can also be found. Since linearized shapefunctions were used for these elements, the FE mesh was made by smaller cubic elementswith the dimension of 1m for the foundation and the soils around the ground surface.The convergence and stability of the solutions were ensured. As the maximum differentialsettlements of the rafts are much less than the distance between the center and the edgeof the raft, compatibility condition was assumed at the interface between the slab and thesoil. The possible influences of the discrete mesh, the size of the FE zone, and the boundaryconditions were clarified to ensure that the solutions are stable and accurate enough in thisstudy. Figures 3 and 4 depict the results of the validations of the FE analytical zone andthe solutions compared to PLAXIS analysis on linearly elastic soils and FD analysis withnonlinear soil springs.
Appl. Sci. 2022, 12, x FOR PEER REVIEW 6 of 16
gence of the foundation settlements. FE analysis was performed to solve for the nodal displacements at the interfaces between the foundation and soil. The soil reaction at the bottom node of the slab was obtained by averaging the internal stresses of the top soil elements. Once the displacements and the soil reactions were obtained, the coefficient of subgrade reactions was computed by dividing the pressure with the displacement.
Figure 2. FE mesh used in this study.
Figure 3. Validations of the Midas analysis: (a) comparison with Plaxis analysis on linearly elastic soils; (b) comparison with FD analysis on strain hardening clay.
Length (m)
Figure 2. FE mesh used in this study.
Appl. Sci. 2022, 12, 5484 6 of 15
Appl. Sci. 2022, 12, x FOR PEER REVIEW 6 of 16
gence of the foundation settlements. FE analysis was performed to solve for the nodal displacements at the interfaces between the foundation and soil. The soil reaction at the bottom node of the slab was obtained by averaging the internal stresses of the top soil elements. Once the displacements and the soil reactions were obtained, the coefficient of subgrade reactions was computed by dividing the pressure with the displacement.
Figure 2. FE mesh used in this study.
Figure 3. Validations of the Midas analysis: (a) comparison with Plaxis analysis on linearly elastic soils; (b) comparison with FD analysis on strain hardening clay.
Length (m)
Figure 3. Validations of the Midas analysis: (a) comparison with Plaxis analysis on linearly elasticsoils; (b) comparison with FD analysis on strain hardening clay.
Appl. Sci. 2022, 12, x FOR PEER REVIEW 7 of 16
Figure 4. Solution convergence on FE analytic zone in this study.
3. Observations and Discussions To monitor the settlements, the contact pressure, and the coefficient of subgrade
reaction of the surface raft under vertically uniform load at clayey and sandy sites, fol-lowing studies were planned. The effects of soil stiffness and foundation rigidity were discussed. The observations can help engineers to better understand the foundation load-response mechanism.
3.1. Foundation Settlements Figure 5 illustrates the settlements across the middle section of the raft in different
soils. It is clear that all the foundation models in the study were semi-rigid and/or flexible foundations because of the presence of differential settlements. The maximum settlement of the raft always occurred at the center. As the soil became stiffer (from Clay 1 to Clay 3), the maximum settlement decreased and more uniform settlements were found. The in-fluence of soil stiffness was more clearly observed in clay (Figure 5a–c). For foundations in sand, the effect of soil stiffness became relatively insignificant. Similarly, when the soil stiffness increased (from Sand 1 to Sand 3), more uniform settlements were observed (Figure 5d–f). Figure 5 also depicts the effects of raft dimension on foundation settle-ments. Since the total load applied to the rafts was kept the same, rafts with smaller di-mensions should result in larger settlements. The foundation settlements were highly affected by the soil stiffness. While the rigidity of the foundation can be increased by reducing the raft dimensions and soil stiffness, more uniform settlements of the raft can be found in Figure 5a,d. For soils with the same stiffness, granular soils can provide bet-ter resistances in minimizing the foundation settlements.
Figure 4. Solution convergence on FE analytic zone in this study.
The effect of the initial state of ground stress was considered in the analysis for morerealistic estimation of foundation behavior. The staged construction procedure of theanalysis was adopted to model the material nonlinearities. Incremental load was appliedat each step in order to reach the total loading pressure. A 10-story building load on theraft measuring 26 m × 26 m was presumed. The design structural load pressure is about100 kPa (10 kPa per story suggested by the design code). Therefore, a total foundationload of 67.6 MN was assumed, and the same amount of load was applied to the rafts withdifferent dimensions. Iterative procedures were employed to ensure the convergence of thefoundation settlements. FE analysis was performed to solve for the nodal displacementsat the interfaces between the foundation and soil. The soil reaction at the bottom node ofthe slab was obtained by averaging the internal stresses of the top soil elements. Once thedisplacements and the soil reactions were obtained, the coefficient of subgrade reactionswas computed by dividing the pressure with the displacement.
Appl. Sci. 2022, 12, 5484 7 of 15
3. Observations and Discussions
To monitor the settlements, the contact pressure, and the coefficient of subgradereaction of the surface raft under vertically uniform load at clayey and sandy sites, fol-lowing studies were planned. The effects of soil stiffness and foundation rigidity werediscussed. The observations can help engineers to better understand the foundation load-response mechanism.
3.1. Foundation Settlements
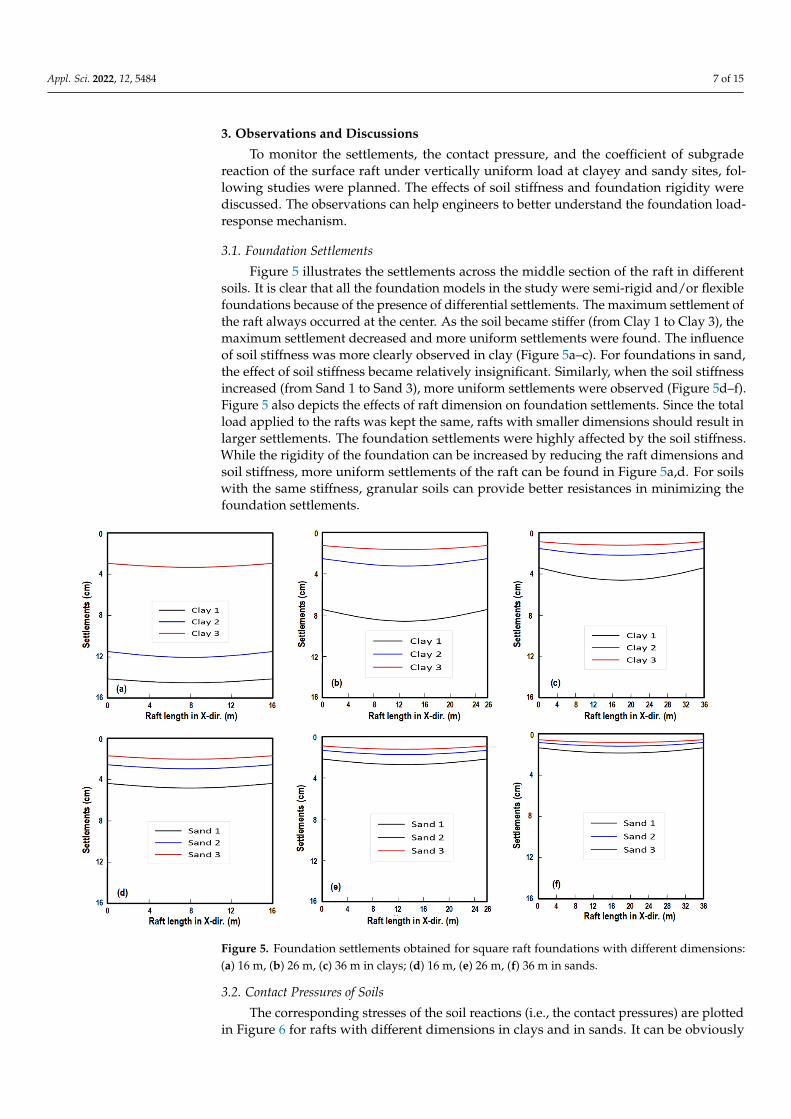
Figure 5 illustrates the settlements across the middle section of the raft in differentsoils. It is clear that all the foundation models in the study were semi-rigid and/or flexiblefoundations because of the presence of differential settlements. The maximum settlement ofthe raft always occurred at the center. As the soil became stiffer (from Clay 1 to Clay 3), themaximum settlement decreased and more uniform settlements were found. The influenceof soil stiffness was more clearly observed in clay (Figure 5a–c). For foundations in sand,the effect of soil stiffness became relatively insignificant. Similarly, when the soil stiffnessincreased (from Sand 1 to Sand 3), more uniform settlements were observed (Figure 5d–f).Figure 5 also depicts the effects of raft dimension on foundation settlements. Since the totalload applied to the rafts was kept the same, rafts with smaller dimensions should result inlarger settlements. The foundation settlements were highly affected by the soil stiffness.While the rigidity of the foundation can be increased by reducing the raft dimensions andsoil stiffness, more uniform settlements of the raft can be found in Figure 5a,d. For soilswith the same stiffness, granular soils can provide better resistances in minimizing thefoundation settlements.
Appl. Sci. 2022, 12, x FOR PEER REVIEW 8 of 16
Figure 5. Foundation settlements obtained for square raft foundations with different dimensions: (a) 16 m, (b) 26 m, (c) 36 m in clays; (d) 16 m, (e) 26 m, (f) 36 m in sands.
3.2. Contact Pressures of Soils The corresponding stresses of the soil reactions (i.e., the contact pressures) are plot-
ted in Figure 6 for rafts with different dimensions in clays and in sands. It can be obvi-ously seen that the contact pressures from the soil elements were varied at different lo-cations under the foundation. For the smallest raft in clay, the contact pressures appeared to be more consistent (Figure 6a). For such rafts in very soft clays, the stresses of the soil reactions were found to be much smaller than those exerted in stiffer clays. Notice that the load pressures applied to the smallest raft were around 264 kPa, adding up with the weight of the concrete slab, the total load transmitted to the bottom of the foundation should approximate 288 kPa. The soil reactions for Clay 2 and Clay 3 with the smallest raft can reflect such levels of the pressure. It is believed that the total amount of energy carried out by the underneath soils is key in presenting the settlements and the contact pressures. When the raft became larger (Figure 6b,c), load pressures applied to the raft became 100 kpa and 52 kpa, respectively. The contact pressures of Clay 1 appeared to be larger at the edge and smaller at the center. Sharp changes in the contact pressures near to the edge are believed to be activated by the discontinuity of the foundation geometry in these cases. For the cases in Clay 2, the distributions of the contact pressures were varying from Figure 6b,c. Higher contact pressures were found in the center of the foundation for Clay 2. For the rafts in Clay 3, larger contact pressures were found at the center of the foundation. These observations implied that the contact pressures of a raft foundation in clay are far more complicated than those revealed commonly.
Figure 5. Foundation settlements obtained for square raft foundations with different dimensions:(a) 16 m, (b) 26 m, (c) 36 m in clays; (d) 16 m, (e) 26 m, (f) 36 m in sands.
3.2. Contact Pressures of Soils
The corresponding stresses of the soil reactions (i.e., the contact pressures) are plottedin Figure 6 for rafts with different dimensions in clays and in sands. It can be obviously
Appl. Sci. 2022, 12, 5484 8 of 15
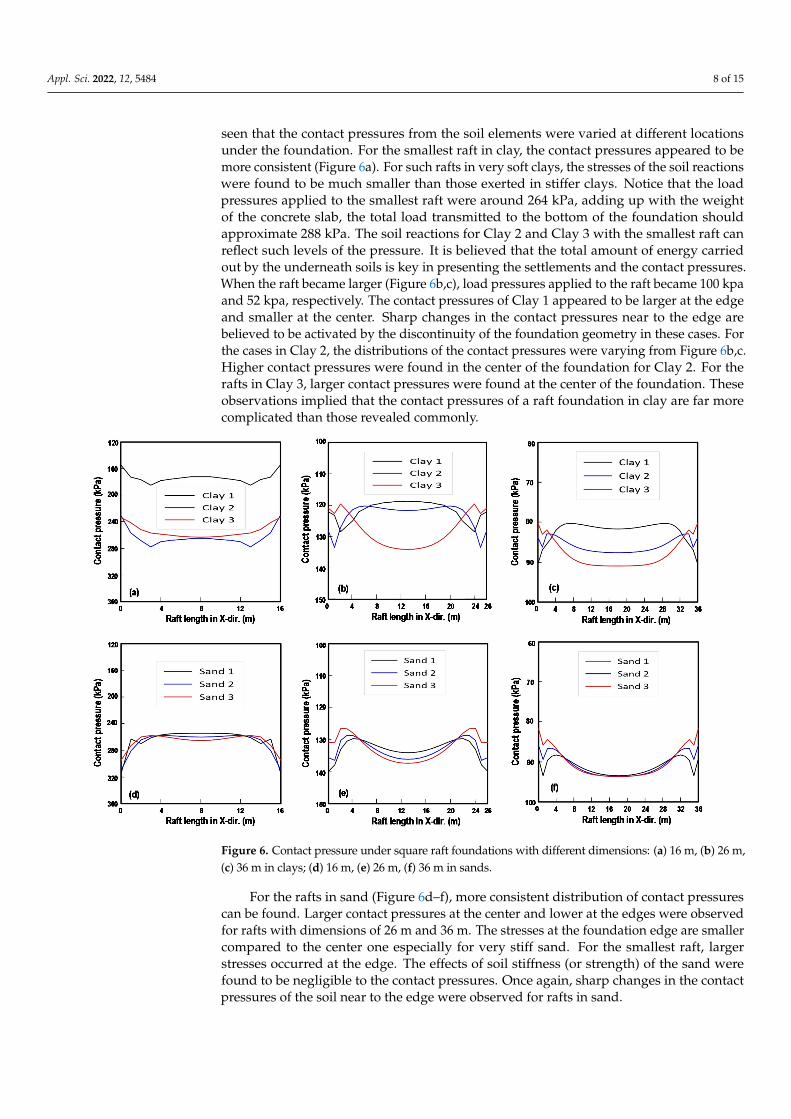
seen that the contact pressures from the soil elements were varied at different locationsunder the foundation. For the smallest raft in clay, the contact pressures appeared to bemore consistent (Figure 6a). For such rafts in very soft clays, the stresses of the soil reactionswere found to be much smaller than those exerted in stiffer clays. Notice that the loadpressures applied to the smallest raft were around 264 kPa, adding up with the weightof the concrete slab, the total load transmitted to the bottom of the foundation shouldapproximate 288 kPa. The soil reactions for Clay 2 and Clay 3 with the smallest raft canreflect such levels of the pressure. It is believed that the total amount of energy carriedout by the underneath soils is key in presenting the settlements and the contact pressures.When the raft became larger (Figure 6b,c), load pressures applied to the raft became 100 kpaand 52 kpa, respectively. The contact pressures of Clay 1 appeared to be larger at the edgeand smaller at the center. Sharp changes in the contact pressures near to the edge arebelieved to be activated by the discontinuity of the foundation geometry in these cases. Forthe cases in Clay 2, the distributions of the contact pressures were varying from Figure 6b,c.Higher contact pressures were found in the center of the foundation for Clay 2. For therafts in Clay 3, larger contact pressures were found at the center of the foundation. Theseobservations implied that the contact pressures of a raft foundation in clay are far morecomplicated than those revealed commonly.
Appl. Sci. 2022, 12, x FOR PEER REVIEW 9 of 16
Figure 6. Contact pressure under square raft foundations with different dimensions: (a) 16 m, (b) 26 m, (c) 36 m in clays; (d) 16 m, (e) 26 m, (f) 36 m in sands.
For the rafts in sand (Figure 6d–f), more consistent distribution of contact pressures can be found. Larger contact pressures at the center and lower at the edges were ob-served for rafts with dimensions of 26 m and 36 m. The stresses at the foundation edge are smaller compared to the center one especially for very stiff sand. For the smallest raft, larger stresses occurred at the edge. The effects of soil stiffness (or strength) of the sand were found to be negligible to the contact pressures. Once again, sharp changes in the contact pressures of the soil near to the edge were observed for rafts in sand.
3.3. Coefficient of Subgrade Reaction (ks) Figure 7 presents the coefficient of subgrade reaction for raft foundations with dif-
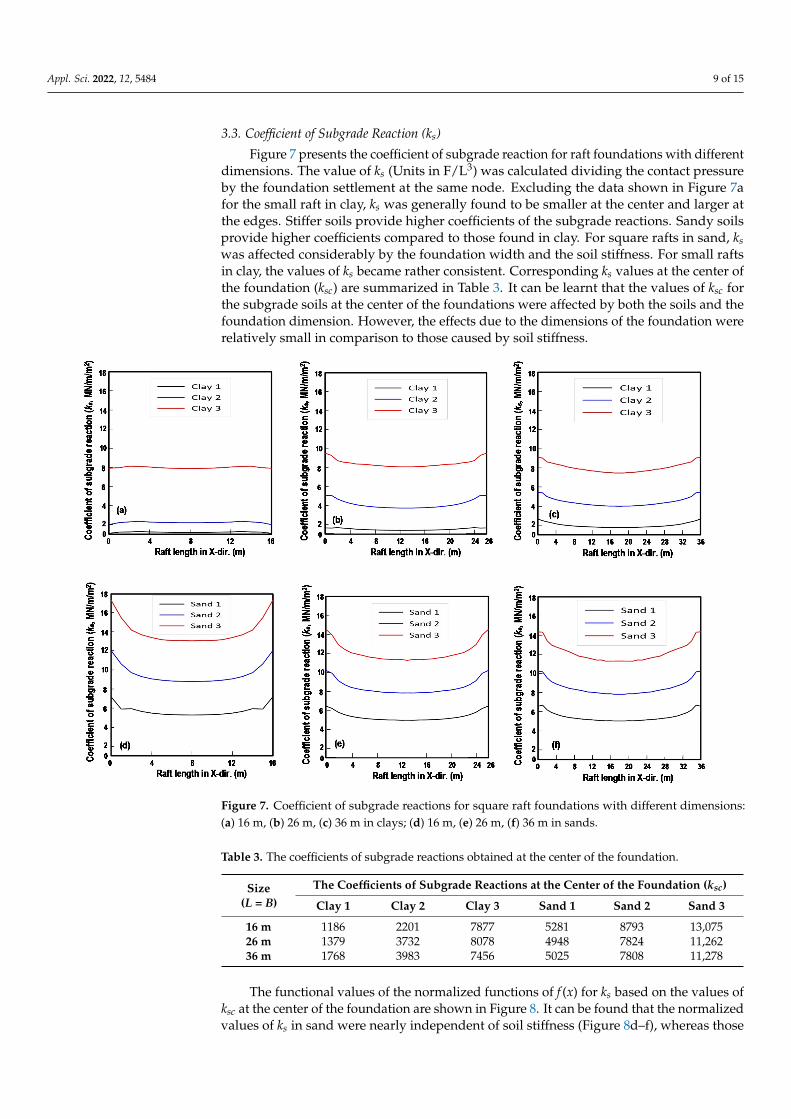
ferent dimensions. The value of ks (Units in F/L3) was calculated dividing the contact pressure by the foundation settlement at the same node. Excluding the data shown in Figure 7a for the small raft in clay, ks was generally found to be smaller at the center and larger at the edges. Stiffer soils provide higher coefficients of the subgrade reactions. Sandy soils provide higher coefficients compared to those found in clay. For square rafts in sand, ks was affected considerably by the foundation width and the soil stiffness. For small rafts in clay, the values of ks became rather consistent. Corresponding ks values at the center of the foundation (ksc) are summarized in Table 3. It can be learnt that the val-ues of ksc for the subgrade soils at the center of the foundations were affected by both the soils and the foundation dimension. However, the effects due to the dimensions of the foundation were relatively small in comparison to those caused by soil stiffness.
Figure 6. Contact pressure under square raft foundations with different dimensions: (a) 16 m, (b) 26 m,(c) 36 m in clays; (d) 16 m, (e) 26 m, (f) 36 m in sands.
For the rafts in sand (Figure 6d–f), more consistent distribution of contact pressurescan be found. Larger contact pressures at the center and lower at the edges were observedfor rafts with dimensions of 26 m and 36 m. The stresses at the foundation edge are smallercompared to the center one especially for very stiff sand. For the smallest raft, largerstresses occurred at the edge. The effects of soil stiffness (or strength) of the sand werefound to be negligible to the contact pressures. Once again, sharp changes in the contactpressures of the soil near to the edge were observed for rafts in sand.
Appl. Sci. 2022, 12, 5484 9 of 15
3.3. Coefficient of Subgrade Reaction (ks)
Figure 7 presents the coefficient of subgrade reaction for raft foundations with differentdimensions. The value of ks (Units in F/L3) was calculated dividing the contact pressureby the foundation settlement at the same node. Excluding the data shown in Figure 7afor the small raft in clay, ks was generally found to be smaller at the center and larger atthe edges. Stiffer soils provide higher coefficients of the subgrade reactions. Sandy soilsprovide higher coefficients compared to those found in clay. For square rafts in sand, kswas affected considerably by the foundation width and the soil stiffness. For small raftsin clay, the values of ks became rather consistent. Corresponding ks values at the center ofthe foundation (ksc) are summarized in Table 3. It can be learnt that the values of ksc forthe subgrade soils at the center of the foundations were affected by both the soils and thefoundation dimension. However, the effects due to the dimensions of the foundation wererelatively small in comparison to those caused by soil stiffness.
Appl. Sci. 2022, 12, x FOR PEER REVIEW 10 of 16
Figure 7. Coefficient of subgrade reactions for square raft foundations with different dimensions: (a) 16 m, (b) 26 m, (c) 36 m in clays; (d) 16 m, (e) 26 m, (f) 36 m in sands.
Table 3. The coefficients of subgrade reactions obtained at the center of the foundation.
Size (L = B)
The Coefficients of Subgrade Reactions at the Center of the Foundation (ksc) Clay 1 Clay 2 Clay 3 Sand 1 Sand 2 Sand 3
16 m 1186 2201 7877 5281 8793 13075 26 m 1379 3732 8078 4948 7824 11262 36 m 1768 3983 7456 5025 7808 11278
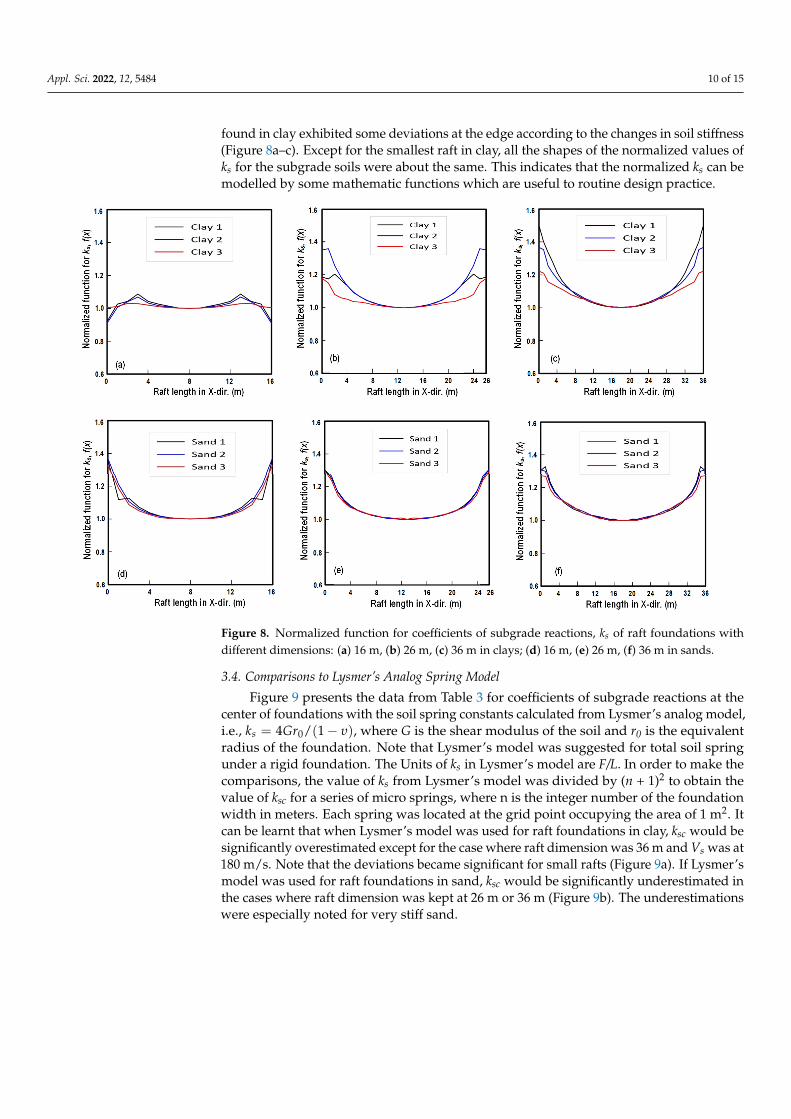
The functional values of the normalized functions of f(x) for ks based on the values of ksc at the center of the foundation are shown in Figure 8. It can be found that the normal-ized values of ks in sand were nearly independent of soil stiffness (Figure 8d–f), whereas those found in clay exhibited some deviations at the edge according to the changes in soil stiffness (Figure 8a–c). Except for the smallest raft in clay, all the shapes of the normalized values of ks for the subgrade soils were about the same. This indicates that the normalized ks can be modelled by some mathematic functions which are useful to routine design practice.
Figure 7. Coefficient of subgrade reactions for square raft foundations with different dimensions:(a) 16 m, (b) 26 m, (c) 36 m in clays; (d) 16 m, (e) 26 m, (f) 36 m in sands.
Table 3. The coefficients of subgrade reactions obtained at the center of the foundation.
Size(L = B)
The Coefficients of Subgrade Reactions at the Center of the Foundation (ksc)
Clay 1 Clay 2 Clay 3 Sand 1 Sand 2 Sand 3
16 m 1186 2201 7877 5281 8793 13,07526 m 1379 3732 8078 4948 7824 11,26236 m 1768 3983 7456 5025 7808 11,278
The functional values of the normalized functions of f (x) for ks based on the values ofksc at the center of the foundation are shown in Figure 8. It can be found that the normalizedvalues of ks in sand were nearly independent of soil stiffness (Figure 8d–f), whereas those
Appl. Sci. 2022, 12, 5484 10 of 15
found in clay exhibited some deviations at the edge according to the changes in soil stiffness(Figure 8a–c). Except for the smallest raft in clay, all the shapes of the normalized values ofks for the subgrade soils were about the same. This indicates that the normalized ks can bemodelled by some mathematic functions which are useful to routine design practice.
Appl. Sci. 2022, 12, x FOR PEER REVIEW 11 of 16
Figure 8. Normalized function for coefficients of subgrade reactions, ks of raft foundations with different dimensions: (a) 16 m, (b) 26 m, (c) 36 m in clays; (d) 16 m, (e) 26 m, (f) 36 m in sands.
3.4. Comparisons to Lysmer’s Analog Spring Model Figure 9 presents the data from Table 3 for coefficients of subgrade reactions at the
center of foundations with the soil spring constants calculated from Lysmer’s analog model, i.e., ( )04 / 1= −sk Gr υ , where G is the shear modulus of the soil and r0 is the equivalent radius of the foundation. Note that Lysmer’s model was suggested for total soil spring under a rigid foundation. The Units of ks in Lysmer’s model are F/L. In order to make the comparisons, the value of ks from Lysmer’s model was divided by (n + 1)2 to obtain the value of ksc for a series of micro springs, where n is the integer number of the foundation width in meters. Each spring was located at the grid point occupying the area of 1 m2. It can be learnt that when Lysmer’s model was used for raft foundations in clay, ksc would be significantly overestimated except for the case where raft dimension was 36 m and Vs was at 180 m/s. Note that the deviations became significant for small rafts (Figure 9a). If Lysmer’s model was used for raft foundations in sand, ksc would be signif-icantly underestimated in the cases where raft dimension was kept at 26 m or 36 m (Fig-ure 9b). The underestimations were especially noted for very stiff sand.
In Figure 10, the values of ksc are plotted against the corresponding values of foun-dation rigidity Kr obtained from Equation (3). It can be seen that the influence of Kr on ksc was relatively small for those obtained from this study in comparison to those from Lysmer’s model. For the foundation models studied with Kr in the range of 0.005–0.1, the value of ksc was found to be mainly affected by soil stiffness. Similarly, the values of ksc predicted from Lysmer’s model in clay were overestimated compared to those obtained from this study. The values of ksc from Lysmer’s model in sand would be underestimated compared to those from this study. The deviations of ksc in sand became trivial as the foundation rigidity increased, especially for low stiffness sand.
Figure 8. Normalized function for coefficients of subgrade reactions, ks of raft foundations withdifferent dimensions: (a) 16 m, (b) 26 m, (c) 36 m in clays; (d) 16 m, (e) 26 m, (f) 36 m in sands.
3.4. Comparisons to Lysmer’s Analog Spring Model
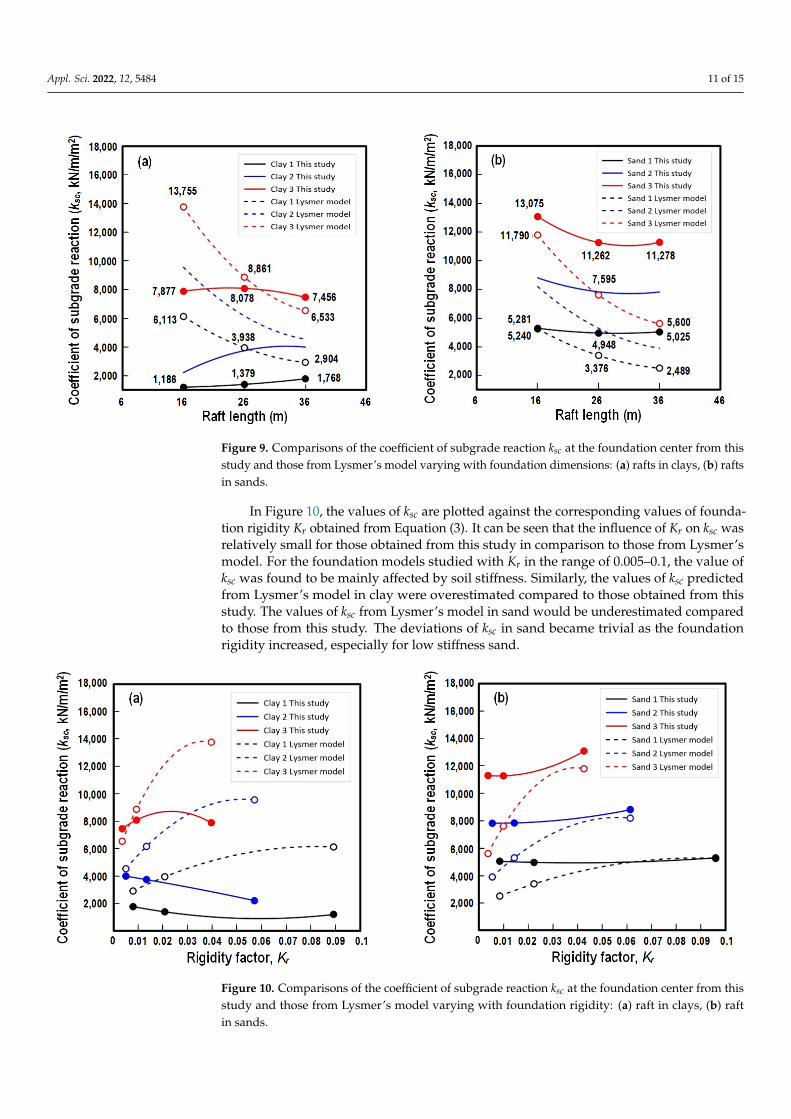
Figure 9 presents the data from Table 3 for coefficients of subgrade reactions at thecenter of foundations with the soil spring constants calculated from Lysmer’s analog model,i.e., ks = 4Gr0/(1− υ), where G is the shear modulus of the soil and r0 is the equivalentradius of the foundation. Note that Lysmer’s model was suggested for total soil springunder a rigid foundation. The Units of ks in Lysmer’s model are F/L. In order to make thecomparisons, the value of ks from Lysmer’s model was divided by (n + 1)2 to obtain thevalue of ksc for a series of micro springs, where n is the integer number of the foundationwidth in meters. Each spring was located at the grid point occupying the area of 1 m2. Itcan be learnt that when Lysmer’s model was used for raft foundations in clay, ksc would besignificantly overestimated except for the case where raft dimension was 36 m and Vs was at180 m/s. Note that the deviations became significant for small rafts (Figure 9a). If Lysmer’smodel was used for raft foundations in sand, ksc would be significantly underestimated inthe cases where raft dimension was kept at 26 m or 36 m (Figure 9b). The underestimationswere especially noted for very stiff sand.
Appl. Sci. 2022, 12, 5484 11 of 15Appl. Sci. 2022, 12, x FOR PEER REVIEW 12 of 16
Figure 9. Comparisons of the coefficient of subgrade reaction ksc at the foundation center from this study and those from Lysmer’s model varying with foundation dimensions: (a) rafts in clays, (b) rafts in sands.
Figure 10. Comparisons of the coefficient of subgrade reaction ksc at the foundation center from this study and those from Lysmer’s model varying with foundation rigidity: (a) raft in clays, (b) raft in sands.
3.5. Modeling of ks The values of ksc for the raft models with different dimensions were obtained to
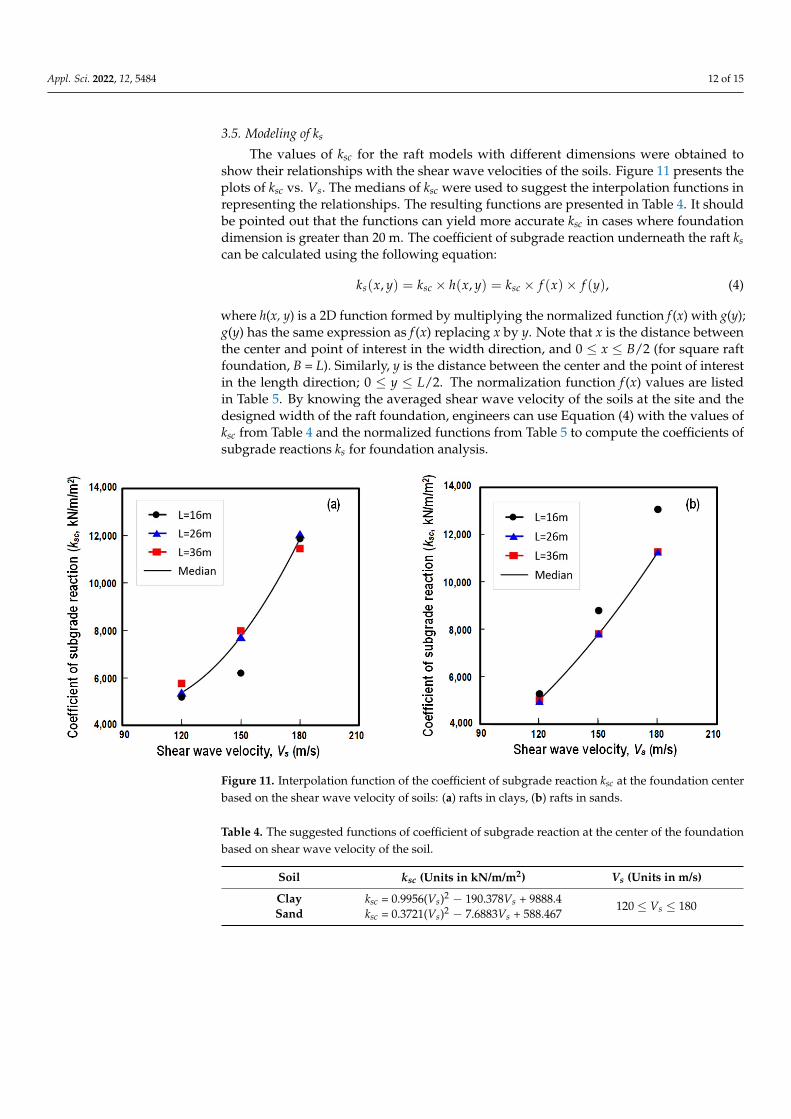
show their relationships with the shear wave velocities of the soils. Figure 11 presents the plots of ksc vs. Vs. The medians of ksc were used to suggest the interpolation functions in representing the relationships. The resulting functions are presented in Table 4. It should be pointed out that the functions can yield more accurate ksc in cases where foundation dimension is greater than 20 m. The coefficient of subgrade reaction underneath the raft ks can be calculated using the following equation:
Figure 9. Comparisons of the coefficient of subgrade reaction ksc at the foundation center from thisstudy and those from Lysmer’s model varying with foundation dimensions: (a) rafts in clays, (b) raftsin sands.
In Figure 10, the values of ksc are plotted against the corresponding values of founda-tion rigidity Kr obtained from Equation (3). It can be seen that the influence of Kr on ksc wasrelatively small for those obtained from this study in comparison to those from Lysmer’smodel. For the foundation models studied with Kr in the range of 0.005–0.1, the value ofksc was found to be mainly affected by soil stiffness. Similarly, the values of ksc predictedfrom Lysmer’s model in clay were overestimated compared to those obtained from thisstudy. The values of ksc from Lysmer’s model in sand would be underestimated comparedto those from this study. The deviations of ksc in sand became trivial as the foundationrigidity increased, especially for low stiffness sand.
Appl. Sci. 2022, 12, x FOR PEER REVIEW 12 of 16
Figure 9. Comparisons of the coefficient of subgrade reaction ksc at the foundation center from this study and those from Lysmer’s model varying with foundation dimensions: (a) rafts in clays, (b) rafts in sands.
Figure 10. Comparisons of the coefficient of subgrade reaction ksc at the foundation center from this study and those from Lysmer’s model varying with foundation rigidity: (a) raft in clays, (b) raft in sands.
3.5. Modeling of ks The values of ksc for the raft models with different dimensions were obtained to
show their relationships with the shear wave velocities of the soils. Figure 11 presents the plots of ksc vs. Vs. The medians of ksc were used to suggest the interpolation functions in representing the relationships. The resulting functions are presented in Table 4. It should be pointed out that the functions can yield more accurate ksc in cases where foundation dimension is greater than 20 m. The coefficient of subgrade reaction underneath the raft ks can be calculated using the following equation:
Figure 10. Comparisons of the coefficient of subgrade reaction ksc at the foundation center from thisstudy and those from Lysmer’s model varying with foundation rigidity: (a) raft in clays, (b) raftin sands.
Appl. Sci. 2022, 12, 5484 12 of 15
3.5. Modeling of ks
The values of ksc for the raft models with different dimensions were obtained toshow their relationships with the shear wave velocities of the soils. Figure 11 presents theplots of ksc vs. Vs. The medians of ksc were used to suggest the interpolation functions inrepresenting the relationships. The resulting functions are presented in Table 4. It shouldbe pointed out that the functions can yield more accurate ksc in cases where foundationdimension is greater than 20 m. The coefficient of subgrade reaction underneath the raft kscan be calculated using the following equation:
ks(x, y) = ksc × h(x, y) = ksc × f (x)× f (y), (4)
where h(x, y) is a 2D function formed by multiplying the normalized function f (x) with g(y);g(y) has the same expression as f (x) replacing x by y. Note that x is the distance betweenthe center and point of interest in the width direction, and 0 ≤ x ≤ B/2 (for square raftfoundation, B = L). Similarly, y is the distance between the center and the point of interestin the length direction; 0 ≤ y ≤ L/2. The normalization function f (x) values are listedin Table 5. By knowing the averaged shear wave velocity of the soils at the site and thedesigned width of the raft foundation, engineers can use Equation (4) with the values ofksc from Table 4 and the normalized functions from Table 5 to compute the coefficients ofsubgrade reactions ks for foundation analysis.
Appl. Sci. 2022, 12, x FOR PEER REVIEW 13 of 16
( ) ( ) ( ) ( ), ,= × = × ×s sc sck x y k h x y k f x f y , (4)
where h(x, y) is a 2D function formed by multiplying the normalized function f(x) with g(y); g(y) has the same expression as f(x) replacing x by y. Note that x is the distance be-tween the center and point of interest in the width direction, and 0 ≤ x ≤ B/2 (for square raft foundation, B = L). Similarly, y is the distance between the center and the point of interest in the length direction; 0 ≤ y ≤ L/2. The normalization function f(x) values are listed in Table 5. By knowing the averaged shear wave velocity of the soils at the site and the designed width of the raft foundation, engineers can use Equation (4) with the values of ksc from Table 4 and the normalized functions from Table 5 to compute the coefficients of subgrade reactions ks for foundation analysis.
Figure 11. Interpolation function of the coefficient of subgrade reaction ksc at the foundation center based on the shear wave velocity of soils: (a) rafts in clays, (b) rafts in sands.
Table 4. The suggested functions of coefficient of subgrade reaction at the center of the foundation based on shear wave velocity of the soil.
Soil ksc (Units in kN/m/m2) Vs (Units in m/s) Clay ksc = 0.9956(Vs)2 -190.378Vs + 9888.4 120 ≤ Vs ≤ 180 Sand ksc = 0.3721(Vs)2 -7.6883Vs + 588.467
Table 5. The normalized function f(x) for the coefficient of subgrade reaction.
L f(x) Where 0 ≤ x ≤ L/2 (Unit of x: m)
Sand 1~Sand 3 Clay 1 Clay 2 Clay 3
16 m 0.00534x2 + 0.9662, r2 =
0.954 −0.0001x4 + 0.00555x2+ 0.9924,
r2 = 0.967 −0.000096x4 + 0.0049x2+
0.9905, r2 = 0.979 −0.000026x4 + 0.00167x2+
0.9992, r2 = 0.938
26 m 0.00172x2 + 0.9758, r2 =
0.963 0.00131x2 + 1.0054, r2 = 0.962 0.002255x2 + 0.9788, r2 =
0.983 0.000944x2 + 0.992,
r2 = 0.955
36 m 0.00091x2 + 0.9883, r2 = 0.978
0.0014x2 + 0.9709, r2 = 0.978 0.00108x2 + 0.9897, r2 = 0.985 0.00065x2 + 1.0037,
r2 = 0.995
Figure 11. Interpolation function of the coefficient of subgrade reaction ksc at the foundation centerbased on the shear wave velocity of soils: (a) rafts in clays, (b) rafts in sands.
Table 4. The suggested functions of coefficient of subgrade reaction at the center of the foundationbased on shear wave velocity of the soil.
Soil ksc (Units in kN/m/m2) Vs (Units in m/s)
Clay ksc = 0.9956(Vs)2 − 190.378Vs + 9888.4 120 ≤ Vs ≤ 180Sand ksc = 0.3721(Vs)2 − 7.6883Vs + 588.467
Appl. Sci. 2022, 12, 5484 13 of 15
Table 5. The normalized function f (x) for the coefficient of subgrade reaction.
Lf (x) Where 0 ≤ x ≤ L/2 (Unit of x: m)
Sand 1~Sand 3 Clay 1 Clay 2 Clay 3
16 m 0.00534x2 + 0.9662,r2 = 0.954
−0.0001x4 + 0.00555x2+ 0.9924,r2 = 0.967
−0.000096x4 + 0.0049x2+ 0.9905,r2 = 0.979
−0.000026x4 + 0.00167x2+ 0.9992,r2 = 0.938
26 m 0.00172x2 + 0.9758,r2 = 0.963
0.00131x2 + 1.0054,r2 = 0.962
0.002255x2 + 0.9788,r2 = 0.983
0.000944x2 + 0.992,r2 = 0.955
36 m 0.00091x2 + 0.9883,r2 = 0.978
0.0014x2 + 0.9709,r2 = 0.978
0.00108x2 + 0.9897,r2 = 0.985
0.00065x2 + 1.0037,r2 = 0.995
4. Concluding Remarks
The foundation settlements, contact pressure of the soil, and the coefficient of thesubgrade reaction were investigated for square raft foundations located at the surface ofclayey and sandy ground under a uniform vertical load. The Mohr–Coulomb model wasused to model the soils, with the strength parameter corresponding to various shear wavevelocities of the soil (Vs ≤ 180 m/s). The findings are summarized as follows:
(1) For the raft foundation models simulated in this study, the rigidity of the foundationKr was calculated following the Egyptian code. The values of Kr were in the rangeof 0.005–0.1, indicating that the foundations were semi-rigid. The maximum founda-tion settlements were found at the center of the foundation models. The foundationsettlements decreased with increases in soil stiffness.
(2) The contact pressure distribution was significantly affected by the rigidity factor ofthe foundation and the soil stiffness. For the rafts with L = 16 m in clay, the contactpressure was relatively consistent. For the raft with L ≥ 26 m in very soft clay, thecontact pressure was found to be low at the center and high at the edges. As theclays became stiffer, a higher contact pressure was then noted at the center. For thefoundation with L = 16 m in sandy soil, the contact pressure was independent of soilstiffness and was low at the center. For the foundation with L ≥ 26 m in sandy soil,high contact pressure was observed at the center. This pattern was more prominent insoil with higher soil stiffness. Owing to the discontinuity of the structure geometry,sudden changes in contact pressures near to the edges were observed in all cases;however, it was negligible for high soil stiffness.
(3) Unlike the distributions of contact pressure, the distributions of coefficients of sub-grade reactions of the soils under the raft were found to be more consistent. Theywill be generally lower at the center and become higher at the edge. For the smallestrafts in clay, the coefficients of subgrade reaction would be slightly varied underthe foundation.
(4) The coefficient of subgrade reactions ks is suggested by mathematic function. Thevalue of ks can be determined by multiplying the reference value ksc at the centerof the foundation with a 2D polynomial function. For raft foundations in sand, thefunctions are only dependent on foundation dimensions. For raft foundations in clay,the functions are dependent on both soil stiffness and foundation dimension.
(5) With the presumed design loads, the coefficient of subgrade reaction ksc at the centerof foundations was found to be 1186~1768 kN/m/m2, 2201~3983 kN/m/m2, and7456~8078 kN/m/m2 for Clay 1, Clay 2, and Clay 3, respectively. Similarly, forSand 1, Sand 2, and Sand 3, the value of ksc was found to be 4948~5281 kN/m/m2,7808~8793 kN/m/m2, and 11,262~13,075 kN/m/m2, respectively. It is noted that thevalue of ksc will be affected by foundation dimensions.
(6) It should be noted that the actual stiffness of sand in the field could be much higherthan the values obtained in this study. Much higher values of ksc for sand should beexpected in actual applications. In spite of the possible influence of ksc, the suggestedfunctions are applicable to sand because the influence of soil stiffness was found to betrivial to the proposed functions in sand.
Appl. Sci. 2022, 12, 5484 14 of 15
(7) For raft foundations in clay, if Lysmer’s analog spring model is used, it will generallyoverestimate the value of ks. For raft foundations in sand, Lysmer’s model willunderestimate the value of ks, especially for foundations with low rigidity.
Author Contributions: The conceptualization, methodology, writing—original draft preparation,and validation have been made by D.-W.C., C.-W.L., Y.-J.T. and S.-H.C.; formal analysis, writing—review, and editing by D.-W.C. and S.-H.C.; and prepared figures and tables by Y.-J.T. and S.-H.C.All the authors have reviewed the manuscript. All authors have read and agreed to the publishedversion of the manuscript.
Funding: This study is supported by MOST through research grant 109-2813-C-032-009-E.
Acknowledgments: Besides the fund from MOST, this study also thanks for the support by theTaiwan Building Technology Center from the Featured Areas Research Center Program funded by theMinistry of Education in Taiwan. The authors would like to express their sincere gratitude towardsthe supports which made this research possible.
Conflicts of Interest: The authors declare no conflict of interest.
References1. ACI Committee 336. Suggested analysis and design procedures for combined footings and mats. Struct. J. 1988, 86, 304–324.2. DIN 4018; Berechnung der Sohldruckverteilung unter Flächengründungen Einschl. DIN-Normenausschuss Bauwesen (NABau):
Berlin, Germany, 1974.3. IS 2950; Code of Practice for Design and Construction of Raft Foundations: Part 1. Bureau of Indian Standards: Delhi, India, 1981.4. Milovic, D. Stresses and Displacements for Shallow Foundations; Elsevier Science: Amsterdam, The Netherlands, 1992.5. Brown, P.T. Numerical Analyses of Uniformly Loaded Circular Rafts on Deep Elastic Foundations. Geotechnique 1969, 19, 399–404.
[CrossRef]6. Pantelidis, L.; Gravanis, E. Elastic Settlement Analysis of Rigid Rectangular Footings on Sands and Clays. Geosciences 2020, 10, 491.
[CrossRef]7. El Gendy, M. An analysis for determination of foundation rigidity. In Proceedings of the 8th International Colloquium on
Structural and Geotechnical Engineering, Ain Shams University, Cairo, Egypt, 15–17 December 1998.8. ECP 196; A Egyptian Code for Soil Mechanics-Design and Construction of Foundations: Part 3. The Housing and Building
Research Center (HBRC): Cairo, Egypt, 1995.9. Barden, L. Distribution of Contact Pressure Under Foundations. Geotechnique 1962, 12, 181–198. [CrossRef]10. Dash, S.K.; Saikia, R.; Nimbalkar, S. Contact pressure distribution on subgrade soil underlying geocell reinforced foundation
Beds. Front. Built Environ. 2019, 5, 137. [CrossRef]11. Fattah, M.Y.; Salim, N.M.; Alwan, K.K. Contact pressure distribution under circular shallow foundation subjected to vertical and
rocking vibration modes. J. Build. Eng. 2019, 26, 100908. [CrossRef]12. Kumar, A.; Choudhury, D.; Katzenbach, R. Effect of Earthquake on Combined Pile–Raft Foundation. Int. J. Geomech. 2016, 16, 04016013.
[CrossRef]13. Roy, J.; Kumar, A.; Choudhury, D. Pseudostatic approach to analyze combined pile-raft foundation. Int. J. Geomech. 2020, 20, 06020028.
[CrossRef]14. Pasternak, P.L. On a New Method of an Elastic Foundation by Means of Two Foundation Constants; Gosstroiizdat: Moscow, Russia, 1954.15. Vlasov, V.N.; Leont’ev, N.N. Beams, Plates and Shells on Elastic Foundations; Israel Program for Scientific Translations: Jerusalem,
Israel, 1960.16. Kerr, A.D.; Rhines, W.J. A Further Study of Elastic Foundation Models; Rep. S-67-1; New York University School of Engineering and
Science: Bronx, NY, USA, 1967.17. Ozgan, K.; Daloglu, A.T. Effect of transverse shear strains on plates resting on elastic foundation using modified Vlasov model.
Thin-Walled Struct. 2008, 46, 1236–1250. [CrossRef]18. Worku, A. Development of a calibrated Pasternak foundation model for practical use. Int. J. Geotech. Eng. 2014, 8, 26–33.
[CrossRef]19. Jeong, S.; Park, J.; Hong, M.; Lee, J. Variability of subgrade reaction modulus on flexible mat foundation. Geomech. Eng. 2017,
13, 757–774.20. Liao, S.S.C. Estimating the coefficient of subgrade reaction for plane strain conditions. Proc. Inst. Civ. Eng.-Geotech. Eng. 1995,
113, 166–181. [CrossRef]21. Loukidis, D.; Tamiolakis, G.-P. Spatial distribution of Winkler spring stiffness for rectangular mat foundation analysis. Eng. Struct.
2017, 153, 443–459. [CrossRef]22. Worku, A.; Seid, T. Application of a robust subgrade model in the analysis of plates on an elastic foundation. Int. J. Geomech. 2020,
20, 04020192. [CrossRef]
Appl. Sci. 2022, 12, 5484 15 of 15
23. Chang, D.W.; Hung, M.H.; Jeong, S.S. Modified Lysmer’s Analog model for two dimensional mat settlements under verticallyuniform load. Geomech. Eng. 2021, 25, 221–231.
24. Poulos, H.G. Pile-raft foundation: Design and applications. Geotechnique 2001, 51, 95–113. [CrossRef]25. Poulos, H.G. The Design of Foundations for High-rise Buildings. Proc. Inst. Civ. Eng. 2010, 163, 27–32. [CrossRef]26. Katzenbach, R.; Leppla, S.; Choudhury, D. Foundation Systems for High-Rise Structures; CRC Press: Boca Raton, FL, USA, 2016;
pp. 154–196.27. Shehata, H.F.; EI-Zahaby, K.M. New trends in foundation design using the finite element analysis method. In Proceedings of the
4th Geo-China International Conference, Jinan, China, 25–27 July 2016.28. Dickenson, S.E. Dynamic Response of Soft and Deep Cohesive Soils during the Loma Prieta Earthquake of October 17, 1989.
Ph.D. Thesis, University of California, Berkeley, CA, USA, 1994.29. Ashford, S.A.; Jakrapiyanun, W.; Lukkunaprasit, P. Amplification of earthquake ground motion in Bangkok. In Proceedings of
the 12th World Conference on Earthquake Engineering, Auckland, New Zealand, 30 January–4 February 2000.30. Hatanaka, M.; Uchida, A. Empirical correlation between penetration resistance and internal friction angle of sandy soils. Soil
Found. 1996, 36, 1–9. [CrossRef]31. Ministry of the Inderior. Seismic Design Code for Buildings; Construction and Planning Agency, Ministry of the Interior: Taipei,
Taiwan, 2011. (In Chinese)32. Midas. Midas GTS NX User Manual; Midas Ltd., Co.: Tokyo, Japan, 2017.33. Chang, D.-W.; Lien, H.-W.; Wang, T. Finite difference analysis of vertically loaded raft foundation based on the plate theory with
boundary concern. J. GeoEngineering 2018, 13, 135–147.34. Chang, D.-W.; Lien, H.-W.; Hu, G.-Y.; Chuang, Y.-A. Developing a three dimensional finite-difference analysis for piled raft
foundation settlements under vertical loads. In Proceedings of the 4th International Conference on Deep Foundations, SantaCruz, Bolivia, 23–24 May 2019.
35. Ryltenius, A. FEM Modeling of Piled Raft Foundations in Two and Three Dimensions. Master’s Thesis, Lund University, Lund,Sweden, 2011.
36. Vu, A.; Pham, D.; Nguyen, Y.; He, Y. 3D finite element analysis on behaviour of piled raft foundations. Appl. Mech. Mater. 2014,580–583, 3–8. [CrossRef]


