Embed Size (px)
Citation preview

A C T A O E C O L O G I C A 3 0 ( 2 0 0 6 ) 2 3 8 – 2 4 7
ava i lab le a t www.sc ienced i rec t . com
journa l homepage : www.e lsev ie r . com/ loca te /ac toec
Original article
Sexual regeneration traits linked to black cherry(Prunus serotina Ehrh.) invasiveness
Marie Pairon a,*, Olivier Chabrerie b, Carolina Mainer Casado a, Anne-Laure Jacquemart a
a Unité d’Écologie et de Biogéographie, Université catholique de Louvain, 4–5, Place Croix-du-Sud, 1348 Louvain-la-Neuve, Belgiumb Département de Botanique (EA 3301), Faculté de Pharmacie, Université de Picardie-Jules-Verne, 1, rue des Louvels, 80037 Amiens cedex,France
A R T I C L E I N F O
Article history:
Received 11 January 2006
Accepted 6 May 2006
Available online 12 June 2006
Keywords:
Fruit production
Seed dispersal
Survival rate
Invasive species
Spatial patterns
Geostatistics
Autocorrelation
* Corresponding author. Tel.: +32 10 47 3431;E-mail address: [email protected] (M. Pair
1146-609X/$ - see front matter © 2006 Elsdoi:10.1016/j.actao.2006.05.002
A B S T R A C T
In order to better understand the invasive capacity of black cherry (Prunus serotina Ehrh.),the regeneration dynamics of the species was studied during two consecutive years in a
Belgian Pine plantation. Flower and fruit production, seed rain, dispersal and viability aswell as the survival of seedlings of different ages were assessed. Despite the low fruit/flower ratio, fruit production was high (up to 8940 fruits per tree) as trees produced huge
quantities of flowers. Both flower and fruit productions were highly variable betweenyears and among individuals. The production variability between individuals was not cor-related with plant size variables. Fruits were ripe in early September and a majority fell inthe vicinity of the parent tree. A wide range of bird species dispersed 18% of the fruits at
the end of October. Sixty-two percent of the fruits were viable and mean densities of 611fruits m–2 were recorded on the forest floor. High mortality among young seedlings wasobserved and 95.3% of the fruits failed to give 4-year-old saplings. Nevertheless, the few
saplings older than 4 years (1.32 m–2) presented a high survival rate (86%). All these regen-eration traits are discussed in order to determine the main factors explaining the blackcherry invasive success in Europe.
© 2006 Elsevier Masson SAS. All rights reserved.
1. Introduction
The introduction of invasive species into new habitats hasserious consequences on ecological and economic systems(Wilcove et al., 1998; Simberloff, 2003), posing one of thegreatest of all threats to ecosystem integrity especially inconjunction with other anthropogenic changes such as habi-tat destruction or fragmentation and climate change (Vitou-sek et al., 1997).
One of the main problems linked with biological invasionsis the identification of the key factors playing a role in theinvasive species’ capacity to disperse and adapt to newenvironments. By developing a quantitative understanding
fax: +32 10 47 3490.on).
evier Masson SAS. All ri
of the factors affecting growth, survival and fecundity,insights can be gained into which factors determine howpopulations persist and increase in exotic ecosystems (Buck-ley et al., 2003). Numerous studies have tried to identifythese key factors, but no simple biological or ecological pre-dictor of invasion success has been found (Sakai et al., 2001).Nevertheless, some plant traits seem to be more relevant forinvasion success than others. They include high geneticvariability, polyploidy, early and consistent reproduction,effective seed dispersal in time and space, fast populationgrowth and ability of vegetative growth (Rejmánek, 1995;Pysek et al., 1995; Rejmánek and Richardson, 1996; Sakai etal., 2001; Rejmánek, 2003; Lloret et al., 2005). Successfulroutes and processes of regeneration seem therefore to be amajor inherent characteristic of invasive species. A detailedexamination of the different steps of the species life cycle isnecessary if we want to understand the dynamics of biologi-
ghts reserved.

239A C T A O E C O L O G I C A 3 0 ( 2 0 0 6 ) 2 3 8 – 2 4 7
cal invasions. The different steps of the life cycle includeseed production and dispersion, successful establishment ofseedlings and saplings, and maturation of the plant to pro-duce fruits (Wang and Smith, 2002; Shiferaw et al., 2004). Allthese steps involve a wide variety of both biotic and environ-mental factors ranging from frugivore behaviour that deter-mines the spatial patterns of seed dispersal to the environ-mental conditions that play an important role in individualseedling establishment.
Because biotic factors such as seed dispersal or competi-tion are not easily measured, their impact on seed and seed-ling distribution patterns has been poorly studied (Kollmannand Pirl, 1995). Analysing spatial autocorrelation of seed rainor seedling distribution can help to clarify the role these bio-tic factors play in the spatial patterns observed (Schwarz etal., 2003).
Black cherry (Prunus serotina Ehrh.) was one of the firstNorthern American tree species introduced into Europe(Starfinger et al., 2003). Widespread in its natural range,which covers most of eastern North America (Muys et al.,1993), it was introduced several times for different purposes.First cultivated as an ornamental tree, it later interested for-esters to produce high quality timber on poor soils. However,timber production has never been successful, and the spe-cies has therefore been planted to serve as wind and fire-break, to improve litter quality in coniferous plantations,and to serve as shelter (Starfinger, 1997; Starfinger et al.,2003). Massive underplanting and filling of conifer standsoccurred until the late fifties. Because of its successful estab-lishment strategy in disturbed areas, black cherry has sinceinvaded several types of woodlands, but also locally ecologi-cally valuable areas such as bogs, dry grasslands and heath-lands (Starfinger et al., 2003). It grows now spontaneously inmost European countries. Because of the dense shrub layersit can build up and the consequent alteration of light condi-tions, black cherry is thought to impede the natural rejuve-nation of forests and to reduce the ground layer species rich-ness and cover (Muys et al., 1993; Honnay et al., 1999).
In its natural range, the species is of minor occurrence inheavily shaded climax forests but is highly opportunistic anddominates secondary successions started by logging, fire orwindthrow (Mulligan and Munro, 1981).
The successful establishment of black cherry has beenattributed to various factors that are more or less correlatedto the invasive species plant traits described. Indeed, thespecies is allotetraploid (Pairon and Jacquemart, 2005), show-ing therefore high genetic variability, has high tolerance to awide range of soil types and climatic conditions, high repro-ductive potential expressed in large seed crops, effectiveseed dispersal by birds, rapid growth, and effective vegetativeregeneration after disturbance (Auclair and Cottam, 1970;Marquis, 1990; Muys et al., 1993; Starfinger, 1997).
The species life cycle has not been investigated in detailin its exotic range and studies on such characteristics asseed production, seed dispersal, germination, seedling andsapling recruitment can provide insight into the regenerationability of the species, and thereby its invasive capacity.
In this study we propose to (1) evaluate flower and fruitproduction of this invasive tree species, (2) describe fruitavailability, bird assemblage and overall percentage of fruits
eaten, (3) analyse seed rain spatial patterns and understandwhich characteristics of the surrounding adult trees explainbest the spatial patterns in seed distribution observed, (4)test the viability of seeds on the forest floor and the exis-tence of selection of fruits with viable seeds by birds, and(5) investigate seedling and sapling survival.
2. Material and methods
2.1. Study site
The study site is situated in a forest mainly dominated bybeech (Fagus sylvatica L.) in central Belgium (lat. 50°79′ N.,long. 4°71′ E.). The site has an altitude of 50 m and a meanannual temperature of 9.4 °C with a mean monthly lowesttemperature of 2.7 °C (January) and a mean monthly maxi-mum temperature of 16.8 °C (July). Annual precipitation is835 mm and dominating winds come from West-Southwest(Dethioux, 1955). Soils are moderately dry with a sand tosandy loam texture. The study was located in a pine planta-tion of 22,900 m2 embedded in beech forest and the experi-mental plot (5500 m2) was situated at the edge of this planta-tion. The plot was chosen for its homogeneity inenvironmental conditions, its relative isolation from otherknown black cherry sources, and the high density of Prunusserotina in the understory that had neither been planted normanaged. The pines were Pinus sylvestris L. and Pinus nigraArn., and had been planted in 1927 and 1940, respectively.The circumferences at breast height (CBH) ranged from 21to 86 cm for the Prunus serotina trees and from 84 to 180 cmfor the Pinus sp.
2.2. Flower and fruit production
In 2004 and 2005, six trees were chosen at the edge of theexperimental plot to evaluate the flower and fruit production.They were chosen randomly outside of the experimental plotbecause fruits needed to be removed from the trees for count-ing, which would have lowered the fruit number in the plot. Aproportion of the total number of branches was collectedfrom each tree, and this proportion was evaluated by count-ing the total number of branches (Smith, 1975; Speroni and deViana, 1998). This proportion ranged from 5% to 25%. Thebranch collection was made at the end of July, i.e. a monthbefore fruit ripening. On each inflorescence, the number offruits was determined, and the number of flowers producedwas evaluated by summing the number of fruits and thenumber of floral scars. Black cherry blooms at the end ofMay in Belgium but floral scars are still visible on the inflor-escence after fruit maturation. In order to link the productionto tree characteristics, circumference at breast height (CBH),age and crown diameter in two directions were measured.Fruit set was calculated as the fruit/flower ratio.
2.3. Seed rain and seed dispersal
In order to collect falling fruits, seed traps were placed in theplot on July 9, 2004 on the nodes of a 10 × 10 m grid. A seed

240 A C T A O E C O L O G I C A 3 0 ( 2 0 0 6 ) 2 3 8 – 2 4 7
trap was made of a wooden frame of 50 × 50 cm, and 5 cmdepth with a hardware cloth top (2 cm openings) and anylon screen bottom. On nine nodes systematically chosen,a 4 × 4 m permanent quadrat was established for seedlingsrecords. Each quadrat was divided in four equal parts. Anadditional seed trap was placed in the part situated at theopposite side of the grid node in order to measure the spatialheterogeneity of the seed rain (distance between the twotraps in a quadrat = 2.8 m). Traps were emptied weekly fromearly September to beginning of December 2004 until the endof seed fall. Fruits were counted and separated into three dif-ferent categories: (1) fruits with mesocarp, (2) fruits withoutmesocarp, and (3) aborted fruits. The ‘total number of fruits’refers hereafter to the sum of fruits with and without meso-carp. A distinction was made between these two fruits typesbecause they were putatively dispersed by two differentmeans: gravity (fruits with mesocarp) and birds (fruits with-out mesocarp). The pulp of fruits with mesocarp was washedaway; all fruits were soaked in a fungicide solution (2% Rov-ral, Bayer Cropscience, Monheim, Germany) for 5 min andkept thereafter at 4 °C for 3–5 months until further treat-ment.
Because black cherry fruits are mainly dispersed by birds(Smith, 1975; Mulligan and Munro, 1981; Hoppes, 1988; Mar-quis, 1990; Deckers et al., 2005), bird community compositionwas determined in the plot on October 27, 2004 after the sud-den increase observed in the number of fruits without meso-carp collected on October, 21. The different legitimate frugi-vores observed were several species of thrushes (Turdusiliacus L., T. viscivorus L., T. pilaris L., T. philomelos Brehm, Turdusmerula L.), woodpigeons (Columba palumbus L.), carrion crows(Corvus corone L.), Eurasian jays (Garrulus glandarius L.), greattits (Parus major L.), and European robins (Erithacus rubeculaL.).
The following variables were calculated in order toexplain the seed rain pattern: the number of adult treeswithin a 5 m radius of the trap, the distance to the closestadult tree, the circumference of this tree, and the basal areaof the trees at various distance classes (0–5 m and 0–10 m)from the trap.
Spatial patterns of seed deposition and of vegetation vari-ables were analysed by geostatistical analyses (Rossi et al.,1995). These analyses test for the different autocorrelationamong values of a particular variable taken at differentpoints in the plot i.e. if the value at one point is dependanton its spatial position. Experimental semi-variograms(Legendre and Fortin, 1989) were calculated using VARIOWIN,version 2.2 (Pannatier, 1996). When data presented spatialstructure, i.e. when the semi-variograms were not flat, anon linear curve (exponential or spherical) was fitted (Modelprogram: VARIOWIN). This curve was used to calculate themodel range (A), the sill (C + Co) and the nugget variance(Co). The model range is the distance at which the semi-var-iance stops increasing. It indicates the limit of spatial depen-dence or autocorrelation and therefore gives the size of thepatch (here, the seed rain patch size) where the values of avariable are aggregated in space. The sill represents the ordi-nate value of the flat portion of the variogram, where thesemi-variance is no longer a function of distance, and thenugget variance measures the unexplained part of the total
variance (Legendre and Fortin, 1989). On the basis of thesevalues, the index of spatial dependence (ISD) was calculated(ISD = C/(C + Co); Gross et al., 1995; Chabrerie and Alard,2005). It describes the proportion of the total sample variancethat can be explained by spatial dependence over the dis-tance examined.
When both seed rain and vegetation variables exhibitedspatial dependence, cross-variograms were calculatedbetween the seed rain and the variables to test whether theobserved spatial pattern of the vegetation could explain theobserved seed distribution pattern.
2.4. Seed viability
Seed viability was assessed with two different methods afterfour months of cold stratification (4 °C). The flotationmethod involves putting seeds in water to see whether theyfloat (non viable) or sink (viable) (Tierney and Fahey, 1998;Osunkoya and Swanborough, 2001). The tetrazolium methodis based on a measure of the respiratory activity in seeds.Half embryos are incubated in a dilute (1%) tetrazolium solu-tion that turns red when it comes in contact with hydrogenderived from enzymes in the respiratory process. A dark redcolour indicates viability, a pink colour a reduced viabilityand a white colour no viability (Schmidt, 2000). The flotationmethod was carried out on all seeds (total number of 5942and 1117 seeds coming from fruits with and without meso-carp, respectively) whereas the tetrazolium method was per-formed on a subsample of the seed traps (340 and 157embryos, respectively). Two different classes (viable andnon-viable) were made after these tests. Because viabilityrates were not significantly different between both tests(t = –0.23, P = 0.817 for fruits with mesocarp and t = 1.18,P = 0.242, for fruits without mesocarp), only the results ofthe flotation test will be further presented.
2.5. Seedling survival rates
As mentioned above, nine quadrats of 4 × 4 m were createdwithin the stand, each divided into four equal parts of2 × 2 m. Two parts were used to assess the seed input thanksto seed traps and the two remaining parts were used forseedling counts. Whenever possible, differences betweenseedlings of different years were made. They were classifiedin seedlings of the year (age 0—class A), seedlings of age 1–2(class B), seedlings of age 3 or more in 2004 and age 3 in 2005(class C), and seedlings of age 4 and more (hereafter calledsaplings) in 2005 (class D). Seedling and sapling age wasdetermined by counting the number of winter bud scalescar rings. All saplings were tagged in order to individuallyfollow their fate from one year to the next. Counts were per-formed in July 2004 and 2005.
2.6. Data analysis
Normality was checked with Shapiro and Wilk tests, andparametric (one way ANOVA) or non parametric (Kruskal–Wallis, Spearman correlation) tests were performed. TheSAS software (SAS, 1999) was used for all statistical analysis.Mean ± S.E. are given throughout this contribution.

241A C T A O E C O L O G I C A 3 0 ( 2 0 0 6 ) 2 3 8 – 2 4 7
3. Results
3.1. Flower and fruit production
The mean total number of flowers per tree was not signifi-cantly different between years at 47,586 in 2004 and 40,722in 2005 (Kruskal–Wallis χ2 = 0.923, P = 0.337). However, themean number of flowers per inflorescence was differentbetween years (Kruskal–Wallis χ2 = 130.962, P < 0.0001) andindividuals (Table 1). The fruit/flower ratio differed alsobetween years (Kruskal–Wallis χ2 = 5.043, P = 0.024). Thisratio remained low as only 13.4% and 3.1% (in 2004 and2005, respectively) of the flowers set fruits. More precisely,the low fruit set in 2005 can be attributed to a lower meannumber of fruits per infructescence (3.2 and 1.0 in 2004 and2005, respectively, Kruskal-Wallis χ2 = 171.266, P < 0.0001) anda lower percentage of inflorescences that set fruits (80.6± 14.9% and 54.0 ± 8.9% in 2004 and 2005, respectively). Eventhough the fruit set was low, the seed crop was large (5354and 1386 mean total number of fruits per tree in 2004 and2005) due to the high number of flowers produced.
No significant correlations were found in 2004 and 2005between the flower and fruit number per tree and the plantsize variables considered (i.e. the CBH and the mean crowndiameter) despite the differences among trees observed inboth flower and fruit production. However, the age of thetree was weakly but significantly positively correlated withfruit production in 2005 (rs = 0.91, P = 0.013).
3.2. Seed rain and seed dispersal
The number of fruits falling (m–2) in the stand was differentfrom one collection date to the other for the three differenttypes of fruits collected (Fig. 1). Aborted fruits, representing25.3% of the total number of collected fruits, were mainlyfound at the first collect (85.1 ± 10.1 fruits m–2) while thehighest number of fruits with mesocarp was collected at thebeginning of October (79.6 ± 10.8 fruits m–2). The collectedfruits without mesocarp presented a peak at the end of Octo-ber (18.4 ± 3.8 fruits m–2).
Table 1 – Characteristics of the trees chosen as well as estimatinvaded Belgian pine plantation. Tree characteristics are: age,diameter (MCD), the trees are ordered after MCD. The estimatefruittotn, respectively), mean numbers of flowers and fruits perespectively) and fruit/flower ratio (fruit set) are given for eachnumber of branches that represented 10%, 10%, 25%, 5%, 15%,ordered in the table, respectively
Tree Flowertotn Mean flower/infl Fruittotn
2004 2005 2004 2005 2004 20054 20,190 26,234 21.7 ± 0.4 24.3 ± 0.3 2470 10403 17,580 0 17.1 ± 0.6 – 1250 02 51,607 20,420 26.7 ± 0.2 26.2 ± 0.6 10,253 4801 43,920 1760 22.2 ± 0.6 22.0 ± 2.0 4760 405 18,940 1220 19.3 ± 0.2 24.4 ± 1.01 4453 406 133,280 194,700 35.4 ± 0.8 40.8 ± 0.7 8940 6720Mean 47,586 40,722 25.3 33.5 5354 1387S.E. 18,115 31,128 3.6 4.3 1451 1079KW χ2 458.7*** 170.9****** P < 0.001, ** P < 0.01.
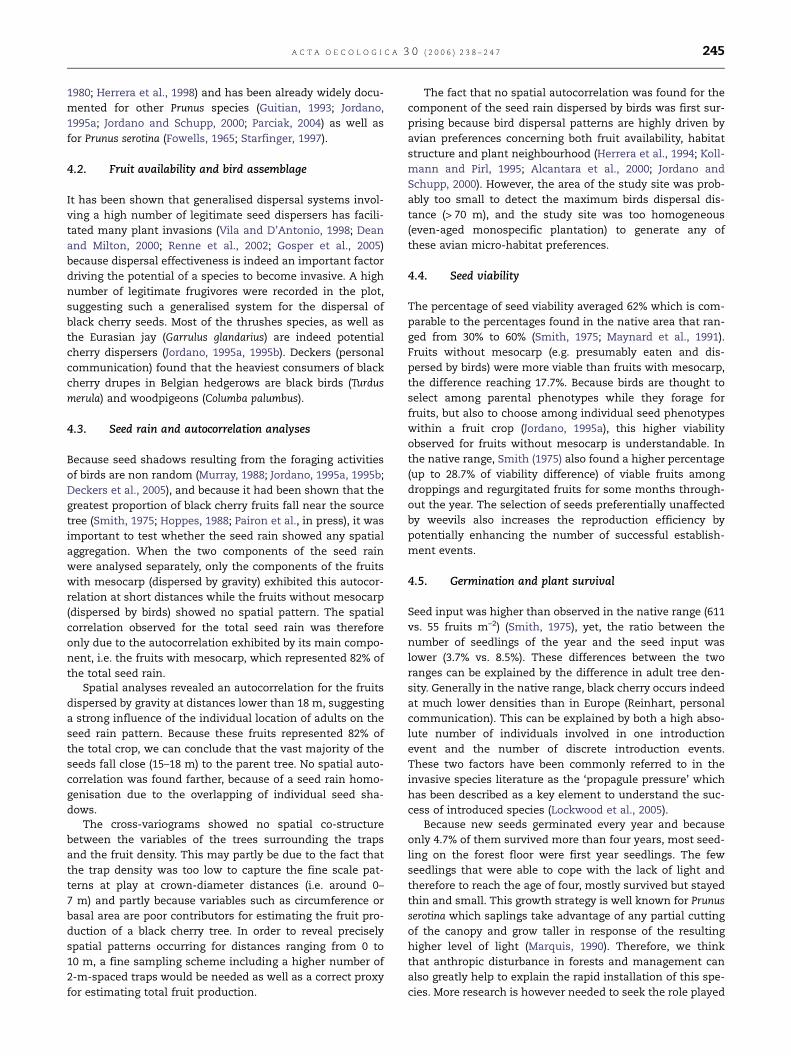
The density of fruits with mesocarp in the traps was sig-nificantly positively correlated with the density of adult treeswithin a 5 m radius of the trap and with the basal area of thetrees within this radius (Table 2). The density of fruits with-out mesocarp was significantly positively correlated with thelast variable as well.
On the main regular grid (N = 53 traps spaced by 10 m dis-tance), the semi-variograms of the total fruit number and ofthe density of fruits with and without mesocarp exhibited a100% nugget effect, revealing the absence of any spatial auto-correlation. At this scale of the investigation, seed rain distri-bution was homogeneous throughout the sampled domain.However, semi-variograms calculated using the total data set(i.e. including the supplementary traps of the quadrats,N = 62 traps, minimal distance between traps = 2.8 m)showed the presence of a low spatial autocorrelation fortotal number of fruits and fruits with mesocarp (Fig. 2a, b),suggesting that the seed rain pattern was detectable onlywhen distances less than 10 m were considered betweendata points. The total fruit density in two data points wereautocorrelated when these points were separated by lessthan 15.7 m (model range, Fig. 2a). This distance was higherfor the density of fruits with mesocarp (model range = 18.2 m,Fig. 2c). This range of 18 m represents the size of the dia-meter of the seed rain patches under Prunus serotina trees.As the mean crown diameter of trees reached 6.6 m, thisresult indicates that the densities of fruits decline rapidlybeyond plant canopies. No clear spatial structure was foundfor the number of fruits without mesocarp (Fig. 2c), indicat-ing a homogeneous dispersal by birds at the scale of thestudy.
The variables calculated on the trees surrounding thetraps that were positively correlated with the density offruits with mesocarp (i.e. the adult tree number and theirbasal area within a 5 m radius) showed spatial dependence.The magnitude of this dependence was higher for the num-ber of adult trees within a 5 m radius of the trap (ISD = 0.88)than for the basal area at the same distances (ISD = 0.53)(Fig. 3a, c). Despite the fact that both tree variables and seedrain of fruits with mesocarp were spatially autocorrelatedvariables, they did not show a spatial co-structure. Indeed,
es of flower and fruit productions of Prunus serotina in ancircumference at breast height (CBH), and mean crownd total numbers of flowers and fruits (flowertotn andr inflorescence ± S.E. (mean flower/infl and mean fruit/infr,tree. The flower and fruit numbers were estimated on aand 5% of the total number of branches for the six trees as
Mean fruit/infr Fruit set Age CBH(cm)
MCD(m)
2004 2005 2004 20052.2 ± 0.2 0.9 ± 0.1 0.12 0.04 12 34 5.51.1 ± 0.1 – 0.07 0.00 14 35 6.55.0 ± 0.2 0.6 ± 0.1 0.20 0.02 15 39 5.91.9 ± 0.2 0.5 ± 0.5 0.11 0.02 17 40 7.04.1 ± 0.2 0.8 ± 0.2 0.24 0.03 16 40 6.02.1 ± 0.2 1.2 ± 0.1 0.07 0.03 28 51 8.83.2 1.0 0.13 0.03 17.0 40 6.61.2 0.5 0.03 0.01 2.3 2.4 0.5269.9*** 15.1**
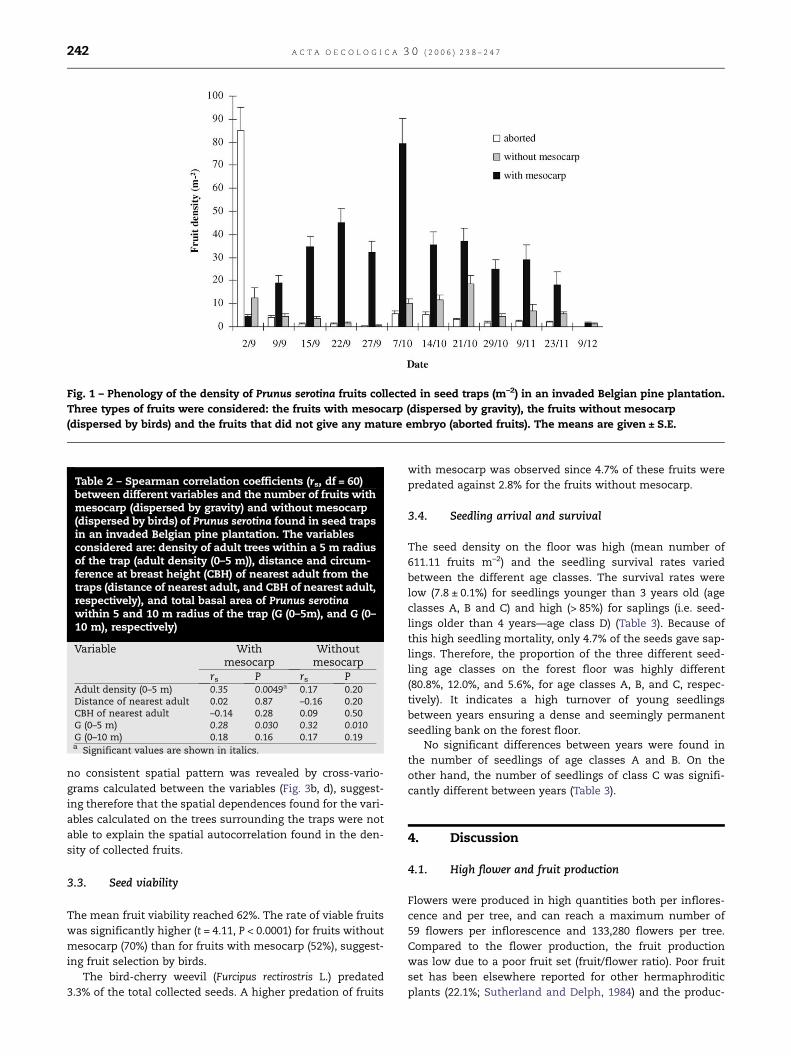
Fig. 1 – Phenology of the density of Prunus serotina fruits collected in seed traps (m–2) in an invaded Belgian pine plantation.Three types of fruits were considered: the fruits with mesocarp (dispersed by gravity), the fruits without mesocarp(dispersed by birds) and the fruits that did not give any mature embryo (aborted fruits). The means are given ± S.E.
Table 2 – Spearman correlation coefficients (rs, df = 60)between different variables and the number of fruits withmesocarp (dispersed by gravity) and without mesocarp(dispersed by birds) of Prunus serotina found in seed trapsin an invaded Belgian pine plantation. The variablesconsidered are: density of adult trees within a 5 m radiusof the trap (adult density (0–5 m)), distance and circum-ference at breast height (CBH) of nearest adult from thetraps (distance of nearest adult, and CBH of nearest adult,respectively), and total basal area of Prunus serotinawithin 5 and 10 m radius of the trap (G (0–5m), and G (0–10 m), respectively)
Variable Withmesocarp
Withoutmesocarp
rs P rs PAdult density (0–5 m) 0.35 0.0049a 0.17 0.20Distance of nearest adult 0.02 0.87 –0.16 0.20CBH of nearest adult –0.14 0.28 0.09 0.50G (0–5 m) 0.28 0.030 0.32 0.010G (0–10 m) 0.18 0.16 0.17 0.19a Significant values are shown in italics.
242 A C T A O E C O L O G I C A 3 0 ( 2 0 0 6 ) 2 3 8 – 2 4 7
no consistent spatial pattern was revealed by cross-vario-grams calculated between the variables (Fig. 3b, d), suggest-ing therefore that the spatial dependences found for the vari-ables calculated on the trees surrounding the traps were notable to explain the spatial autocorrelation found in the den-sity of collected fruits.
3.3. Seed viability
The mean fruit viability reached 62%. The rate of viable fruitswas significantly higher (t = 4.11, P < 0.0001) for fruits withoutmesocarp (70%) than for fruits with mesocarp (52%), suggest-ing fruit selection by birds.
The bird-cherry weevil (Furcipus rectirostris L.) predated3.3% of the total collected seeds. A higher predation of fruits
with mesocarp was observed since 4.7% of these fruits werepredated against 2.8% for the fruits without mesocarp.
3.4. Seedling arrival and survival
The seed density on the floor was high (mean number of611.11 fruits m–2) and the seedling survival rates variedbetween the different age classes. The survival rates werelow (7.8 ± 0.1%) for seedlings younger than 3 years old (ageclasses A, B and C) and high (> 85%) for saplings (i.e. seed-lings older than 4 years—age class D) (Table 3). Because ofthis high seedling mortality, only 4.7% of the seeds gave sap-lings. Therefore, the proportion of the three different seed-ling age classes on the forest floor was highly different(80.8%, 12.0%, and 5.6%, for age classes A, B, and C, respec-tively). It indicates a high turnover of young seedlingsbetween years ensuring a dense and seemingly permanentseedling bank on the forest floor.
No significant differences between years were found inthe number of seedlings of age classes A and B. On theother hand, the number of seedlings of class C was signifi-cantly different between years (Table 3).
4. Discussion
4.1. High flower and fruit production
Flowers were produced in high quantities both per inflores-cence and per tree, and can reach a maximum number of59 flowers per inflorescence and 133,280 flowers per tree.Compared to the flower production, the fruit productionwas low due to a poor fruit set (fruit/flower ratio). Poor fruitset has been elsewhere reported for other hermaphroditicplants (22.1%; Sutherland and Delph, 1984) and the produc-

Fig. 2 – Semi-variograms for Prunus serotina seed rain collected in all traps (N = 62 traps; minimum spacing: 2.83 m) set inan invaded Belgian pine plantation. Semi-variograms allow the study of the seed rain spatial pattern and measure the localspatial variation of a variable by describing how sample data are related with distance. When variables were spatiallystructured, i.e. the semi-variograms were not flat, a spherical model was fitted. Model parameters: A, range; C, spatialvariance; Co, nugget variance; C + Co, sill; and ISD, index of spatial dependence. Semi-variograms show that thedistribution of total fruit rain (a) and fruits dispersed by gravity (b) are spatially structured, forming seed rain patches of 15–18 m. Seed rain dispersed by birds (c) presents no spatial structure in the pine plantation (c).
243A C T A O E C O L O G I C A 3 0 ( 2 0 0 6 ) 2 3 8 – 2 4 7
tion of an excess of flowers by Prunus species has alreadybeen widely documented (Guitian, 1993; Jordano, 1993; Jor-dano and Schupp, 2000; Kollmann and Pflugshaupt, 2001;Pflugshaupt et al., 2002).
High variation in individual fecundity was observed andthe numbers of flowers and fruits per inflorescence were dif-ferent among individuals and highly variable within thesame year. A similar variation of individual production hasbeen observed for other Prunus (Guitian, 1994; Jordano,
1995a) or other Rosaceae species (Ågren, 1988). Some authorsfound a good correlation between such individual variationsand plant size variables such as height and circumference,e.g. Jordano (1993), Jordano and Schupp (2000) for P. mahaleb,and Deckers et al. (2005) for P. serotina in hedgerows. How-ever, in our study, plant size variables such as the circumfer-ence at breast height or mean crown diameter were not cor-related with fruit production. Marquis (1990) similarly foundno good correlations between black cherry production and

Fig. 3 – Semi-variogram of the variables measured on the vegetation surrounding the traps (a, c) and cross-variograms ofthese variables versus the density of fruits with mesocarp collected in all traps (b, d) set in an invaded Belgian pineplantation. The vegetation variables are the density of Prunus serotina within a 5 m radius of the trap (a) and the basal areaof the Prunus serotina within the same radius (c). Although surrounding vegetation variables are spatially structured (a, c),they do not exhibit a co-structure with the distribution of fruits with mesocarp and do not explain the seed rain patterns(b, d).
Table 3 – Mean seed, seedling and sapling densities (m–2) in permanent quadrats of a Prunus serotina population in aninvaded Belgian pine plantation. Age class A represents seedlings of the year, B seedlings of age 1–2 years, C seedlings ofage 3 and more in 2004 and of age 4 in 2005 and D saplings of age 4 and more in 2005. The number of individuals followedfor each age class is given between brackets. The survival rates are calculated by comparing the seedling numbers of oneclass in 2005 with seedlings of the age class below in 2004 (e.g. age class B in 2005 is compared with age class A in 2004).Survival rates of age class A in 2005 are given by comparing the seedlings of this age class to the number of seeds collectedin autumn 2004 (seed input). The chi-square values given are the result of the Kruskal–Wallis test made to compare thegermination and total number of seedlings of different age classes between the two years (n = 18)
Age 2004 2005 χ2 P Survival rateSeed input – – 611.11 ± 113.88 (2754) – – – –
A 19.61 ± 3.46 (1412) 18.94 ± 3.32 (1364) 29.17 0.46 0.04 ± 0.001B 5.43 ± 1.28 (391) 2.81 ± 0.84 (202) 20.09 0.33 0.16 ± 0.03C 1.43 ± 0.52 (103) 0.39 ± 0.23 (28) 23.20 0.010a 0.04 ± 0.02D – – 1.32 ± 0.51 (95) – – 0.86 ± 0.06a Significant values are shown in italics.
244 A C T A O E C O L O G I C A 3 0 ( 2 0 0 6 ) 2 3 8 – 2 4 7
plant size variables. He noted that some individuals in Amer-ican forests never produced large quantities of fruits evenwhen they reached an adequate age and crown composition.Intrinsic factors such as genetic effects or health state, andother environmental factors such as light intensity or soilheterogeneity could thus play an important role in determin-ing the individual productivity of black cherry.
Our results also showed a difference in fruit productionbetween the two consecutive years of the study, suggestinga high variation in number of fruits available for dispersionfrom one year to another. This phenomenon of alternatebearing, in which species alternate supra-annual schedulesinvolving either high or low-production years is commonfor most polycarpic woody plants and trees (Silvertown,
245A C T A O E C O L O G I C A 3 0 ( 2 0 0 6 ) 2 3 8 – 2 4 7
1980; Herrera et al., 1998) and has been already widely docu-mented for other Prunus species (Guitian, 1993; Jordano,1995a; Jordano and Schupp, 2000; Parciak, 2004) as well asfor Prunus serotina (Fowells, 1965; Starfinger, 1997).
4.2. Fruit availability and bird assemblage
It has been shown that generalised dispersal systems invol-ving a high number of legitimate seed dispersers has facili-tated many plant invasions (Vila and D’Antonio, 1998; Deanand Milton, 2000; Renne et al., 2002; Gosper et al., 2005)because dispersal effectiveness is indeed an important factordriving the potential of a species to become invasive. A highnumber of legitimate frugivores were recorded in the plot,suggesting such a generalised system for the dispersal ofblack cherry seeds. Most of the thrushes species, as well asthe Eurasian jay (Garrulus glandarius) are indeed potentialcherry dispersers (Jordano, 1995a, 1995b). Deckers (personalcommunication) found that the heaviest consumers of blackcherry drupes in Belgian hedgerows are black birds (Turdusmerula) and woodpigeons (Columba palumbus).
4.3. Seed rain and autocorrelation analyses
Because seed shadows resulting from the foraging activitiesof birds are non random (Murray, 1988; Jordano, 1995a, 1995b;Deckers et al., 2005), and because it had been shown that thegreatest proportion of black cherry fruits fall near the sourcetree (Smith, 1975; Hoppes, 1988; Pairon et al., in press), it wasimportant to test whether the seed rain showed any spatialaggregation. When the two components of the seed rainwere analysed separately, only the components of the fruitswith mesocarp (dispersed by gravity) exhibited this autocor-relation at short distances while the fruits without mesocarp(dispersed by birds) showed no spatial pattern. The spatialcorrelation observed for the total seed rain was thereforeonly due to the autocorrelation exhibited by its main compo-nent, i.e. the fruits with mesocarp, which represented 82% ofthe total seed rain.
Spatial analyses revealed an autocorrelation for the fruitsdispersed by gravity at distances lower than 18 m, suggestinga strong influence of the individual location of adults on theseed rain pattern. Because these fruits represented 82% ofthe total crop, we can conclude that the vast majority of theseeds fall close (15–18 m) to the parent tree. No spatial auto-correlation was found farther, because of a seed rain homo-genisation due to the overlapping of individual seed sha-dows.
The cross-variograms showed no spatial co-structurebetween the variables of the trees surrounding the trapsand the fruit density. This may partly be due to the fact thatthe trap density was too low to capture the fine scale pat-terns at play at crown-diameter distances (i.e. around 0–7 m) and partly because variables such as circumference orbasal area are poor contributors for estimating the fruit pro-duction of a black cherry tree. In order to reveal preciselyspatial patterns occurring for distances ranging from 0 to10 m, a fine sampling scheme including a higher number of2-m-spaced traps would be needed as well as a correct proxyfor estimating total fruit production.
The fact that no spatial autocorrelation was found for thecomponent of the seed rain dispersed by birds was first sur-prising because bird dispersal patterns are highly driven byavian preferences concerning both fruit availability, habitatstructure and plant neighbourhood (Herrera et al., 1994; Koll-mann and Pirl, 1995; Alcantara et al., 2000; Jordano andSchupp, 2000). However, the area of the study site was prob-ably too small to detect the maximum birds dispersal dis-tance (> 70 m), and the study site was too homogeneous(even-aged monospecific plantation) to generate any ofthese avian micro-habitat preferences.
4.4. Seed viability
The percentage of seed viability averaged 62% which is com-parable to the percentages found in the native area that ran-ged from 30% to 60% (Smith, 1975; Maynard et al., 1991).Fruits without mesocarp (e.g. presumably eaten and dis-persed by birds) were more viable than fruits with mesocarp,the difference reaching 17.7%. Because birds are thought toselect among parental phenotypes while they forage forfruits, but also to choose among individual seed phenotypeswithin a fruit crop (Jordano, 1995a), this higher viabilityobserved for fruits without mesocarp is understandable. Inthe native range, Smith (1975) also found a higher percentage(up to 28.7% of viability difference) of viable fruits amongdroppings and regurgitated fruits for some months through-out the year. The selection of seeds preferentially unaffectedby weevils also increases the reproduction efficiency bypotentially enhancing the number of successful establish-ment events.
4.5. Germination and plant survival
Seed input was higher than observed in the native range (611vs. 55 fruits m–2) (Smith, 1975), yet, the ratio between thenumber of seedlings of the year and the seed input waslower (3.7% vs. 8.5%). These differences between the tworanges can be explained by the difference in adult tree den-sity. Generally in the native range, black cherry occurs indeedat much lower densities than in Europe (Reinhart, personalcommunication). This can be explained by both a high abso-lute number of individuals involved in one introductionevent and the number of discrete introduction events.These two factors have been commonly referred to in theinvasive species literature as the ‘propagule pressure’ whichhas been described as a key element to understand the suc-cess of introduced species (Lockwood et al., 2005).
Because new seeds germinated every year and becauseonly 4.7% of them survived more than four years, most seed-ling on the forest floor were first year seedlings. The fewseedlings that were able to cope with the lack of light andtherefore to reach the age of four, mostly survived but stayedthin and small. This growth strategy is well known for Prunusserotina which saplings take advantage of any partial cuttingof the canopy and grow taller in response of the resultinghigher level of light (Marquis, 1990). Therefore, we thinkthat anthropic disturbance in forests and management canalso greatly help to explain the rapid installation of this spe-cies. More research is however needed to seek the role played

De
246 A C T A O E C O L O G I C A 3 0 ( 2 0 0 6 ) 2 3 8 – 2 4 7
by disturbance and management in invasions of forests byblack cherry.
De
De
Fo
Go
Gr
Gu
Gu
He
He
5. Conclusion
Black cherry shares numerous traits with other invasiveplant species that can help to explain its invasiveness in Eur-opean forests. Despite a poor fruit/flower ratio, it can pro-duce many seeds even in the understory of a pine plantation.The seed rain can be divided in two different components.The largest, representing 82% of the seed crop, is the gravitydispersal component. These gravity dispersed seeds fallclose to the parent plant, their density decreased rapidlybeyond the tree canopy and showed spatial autocorrelation(patch size of 15–18 m). The second is the bird dispersal com-ponent that is carried away further by a large bird assem-blage and did not show any spatial pattern at the scale ofinvestigation.
Despite the low germination and survival rates for seed-lings younger than 4 years old, the density of seeds is sohigh that the forest floor is entirely covered with seedlingsevery year. Establishment is further facilitated by the highsurvival rate of saplings.
Ho
Ho
Jor
Jor
Acknowledgements
We would like to thank Thomas Degen for providing theseed traps, Baptiste Bataille for the bird point count, andJean-Claude Kracq for showing us the site. We also thankthe two anonymous referees whose comments have greatlyimproved this paper. We would also like to thank M. Byrneand N. Burrows for making a sabbatical infrastructure avail-able for A.L.J.
The work was supported financially by the Fonds Spé-ciaux de Recherche (FSR) of the Université Catholique deLouvain (UCL) and the Belgian Scientific Policy (BelSPo–InPlanBel). Marie Pairon is research fellow of the BelgianNational Fund of Scientific Research and Anne-Laure Jacque-mart is research associate in the same institution.
Jor
Ko
Ko
Le
Llo
Lo
Ma
R E F E R E N C E S
Ågren, J., 1988. Between-year variation in flowering and fruitset in frost-prone and frost-sheltered populations of dioe-cious Rubus chamaemorus. Oecologia 76, 175–183.
Alcantara, J.M., Rey, J.R., Valera, F., Sanchez-Lafuente, A.M.,2000. Factors shaping the seedfall pattern of a bird-dis-persed plant. Ecology 81, 1937–1950.
Auclair, A., Cottam, G., 1970. Dynamics of black cherry (Pru-nus serotina Ehrh.) in southern wisconsin oak forests.Ecol. Monogr. 41, 153–177.
Buckley, Y.M., Briese, D.T., Rees, M., 2003. Demography andmanagement of the invasive plant species Hypericum per-foratum. I. Using multi-level mixed-effects models forcharacterizing growth, survival and fecundity in a long-term data set. J. Appl. Ecol. 40, 481–493.
Chabrerie, O., Alard, D., 2005. Comparison of three seed traptypes in a chalk grassland: toward a standardised proto-col. Plant Ecol. 176, 101–112.
an, W.R.J., Milton, S.J., 2000. Directed dispersal of Opuntiaspecies in the Karoo, South Africa: are crows the responsi-ble agents? J.Arid Env. 45, 305–314.ckers, B., Verheyen, K., Hermy, M., Muys, B., 2005. Effects oflandscape structure on the invasive spread of black cherryPrunus serotina in an agricultural landscape in Flanders,Belgium. Ecography 28, 99–109.thioux, M.H., 1955. Aperçu de la végétation de la forêt deMeerdael et des bois environnants. Agricultura 3, 261–291.wells, H., 1965. Silvics of forest trees of the United States.Agriculture Handbook 271, 539–545.sper, C.R., Stansbury, C.D., Vivian-Smith, G., 2005. Seed dis-persal of fleshy-fruited invasive plants by birds: contribut-ing factors and management options. Diversity Distrib. 11,549–558.oss, K.L., Pregitzer, K.S., Burton, A.J., 1995. Spatial variationin nitrogen availability in three successional plant com-munities. J. Ecolology 83, 357–367.itian, J., 1993. Why Prunus mahaleb (Rosaceae) producesmore flowers than fruits? Am. J. Bot. 80, 1305–1309.itian, J., 1994. Selective fruit abortion in Prunus mahaleb(Rosaceae). Am. J. Bot. 81, 1555–1558.rrera, C.M., Jordano, P., Guitián, J., Traveset, A., 1998.Annual variability in seed production by woody plantsand the masting concept: reassessment of principles andrelationship to pollination and seed dispersal. Am. Nat.152, 576–594.rrera, C.M., Jordano, P., López-Soria, L., Amat, J.A., 1994.Recruitment of a mast-fruiting, bird-dispersed tree: brid-ging frugivore activity and seedling establishment. Ecol.Monogr. 64, 315–344.nnay, O., Endels, P., Vereecken, H., Hermy, M., 1999. Therole of patch area and habitat diversity in explainingnative plant species richness in disturbed suburban forestpatches in northern Belgium. Diversity Distrib. 5, 129–141.ppes, W.G., 1988. Seedfall pattern of several species ofbird-dispersed plants in an Illinois woodland. Evolution69, 320–329.dano, P., 1993. Pollination biology of Prunus mahaleb L.:deferred consequences of gender variation for fecundityand seed size. Biol. J. Linn. Soc. 50, 65–84.dano P., 1995a. Frugivore-mediated selection on fruit andseed size: birds and St. Lucie’s cherry, Prunus mahaleb.Ecology 76, 2627–2639. Jordano, P., 1995b. Spatial and tem-poral variation in the avian-frugivore assemblage of Pru-nus mahaleb: patterns and consequences. Oikos 71, 479–491.dano, P., Schupp, E.W., 2000. Seed disperser effectiveness:the quantity component and patterns of seed rain for Pru-nus mahaleb. Ecol. Monogr. 70, 591–615.llmann, J., Pirl, M., 1995. Spatial pattern of seed rain of fle-shy-fruited plants in a scrubland-grassland transition.Acta Oecol. 16, 313–329.llmann, J., Pflugshaupt, K., 2001. Flower and fruit charac-teristics in small and isolated populations of a fleshy-fruited shrub. Plant Biol. 3, 62–71.gendre, P., Fortin, M.J., 1989. Spatial pattern and ecologicalanalysis. Vegetatio 80, 107–138.ret, F., Medail, F., Brundu, G., Camarda, I., Moragues, E.,Rita, J., et al., 2005. Species attributes and invasion successby alien plants on Mediterranean islands. J. Ecol. 93, 512–520.ckwood, J.L., Cassey, P., Blackburn, T., 2005. The role of pro-pagule pressure in explaining species invasions. TrendsEcol. Evol. 20, 223–228.rquis, D., 1990. Prunus serotina Ehrh. Black cherry. In:USDA Forest Services (Ed.), Silvics of North America: 2Hardwoods. USDA Forest Services, Washington D.C, pp.594–602.

Ma
Mu
Mu
Mu
Os
Pa
Pa
Pa
Pa
Pfl
Py
Re
Re
Re
Re
Ro
SA
Sa
Sc
Sc
Sh
Sil
Sim
Sm
Sp
Sta
Sta
Su
Tie
Vil
Vit
Wa
W
247A C T A O E C O L O G I C A 3 0 ( 2 0 0 6 ) 2 3 8 – 2 4 7
ynard, C., Havanagh, K., Fuernkranz, H., Draw, A., 1991.Black cherry (Prunus serotina Ehrh.). Biotechnology Agricul-ture Forestry 16, 3–22.lligan, G., Munro, D., 1981. The biology of Canadian weeds.51. Prunus virginiana L. and P. serotina Ehrh. Can. J. Pl. Sci.61, 977–992.rray, K.G., 1988. Avian seed dispersal of three neotropicalgap-dependent plants. Ecol. Monogr. 58, 271–298.ys B., Maddelein D., Lust N., 1993. Ecology, practice andpolicy of black cherry (Prunus serotina Ehrh.) managementin Belgium. In: Gjerstad E.V. (Ed.), Proceedings of the inter-national conference on forest vegetation management:ecology, practice and policy, Auburn University, Auburn,pp. 86–93.unkoya, O.O., Swanborough, P.W., 2001. Reproductive andecophysiological attributes of the rare Gardenia actinocarpa(Rubiaceae) compared with its common co-occurring con-gener, G. ovularis. Aust. J. Bot. 49, 471–478.iron, M.C., Jacquemart, A.L., 2005. Disomic segregation ofmicrosatellites in the tetraploid Prunus serotina Ehrh.(Rosaceae). J.Am.Soc.Hort.Sc. 130, 729–734.iron, M., Jonard, M., Jacquemart, A.L., 2006. Modeling seeddispersal of black cherry an invasive forest tree: howmicrosatellites may help? Can. J. For. Res. 36, 1385–1394.nnatier, V., 1996. Variowin. Software for spatial data analy-sis in 2D. Springer Verlag, New York.rciak, W., 2004. Environmental variation in seed number,size, and dispersal of a fleshy-fruited plant. Ecology 83,780–793.ugshaupt, K., Kollmann, J., Fischer, M., Roy, B., 2002. Pollenquantity and quality affect fruit abortion in small popula-tions of a rare fleshy-fruited shrub. Basic Appl. Ecol. 3,319–327.sek, P., Prach, K., Smilauer, P., 1995. Relating invasion suc-cess to plant traits: an analysis of the Czech alien flora. In:Pysek, P., Prack, K., Rejmánek, M., Wade, M. (Eds.), Plantinvasions: general aspects and special problems. SPB Aca-demic Publishing, Amsterdam, pp. 39–59.jmánek, M., 1995. What makes a species invasive? In:Pysek, P., Prack, K., Rejmánek, M., Wade, M. (Eds.), Plantinvasions: general aspects and special problems. SPB Aca-demic Publishing, Amsterdam, pp. 3–13.jmánek, M., 2003. A theory of seed plant invasiveness: thefirst sketch. Biol. Conserv. 78, 171–181.jmánek, M., Richardson, D.M., 1996. What attributes makessome plant species more invasive? Ecology 77, 1655–1661.nne, I.J., Barrow, W.C., Randall, L.A.J., Bridges, W.C., 2002.Generalized avian dispersal syndrome contributes to Chi-nese tallow tree (Sapium sebiferum, Euphorbiaceae) inva-siveness. Diversity Distrib. 8, 285–295.ssi, J.P., Lavelle, P., Tondoh, J.E., 1995. Statistical tool for soilbiology.10. Geostatistical analysis. Eur. J. Soil Biol. 31, 173–181.
S Institute Inc, 1999. SAS user’s guide, version 8, SAS insti-tute Inc., Cary, N.C.kai, A.K., Allendorf, F.W., Holt, J.S., Lodge, D.M., Molofsky, J.,With, K.A., et al., 2001. The population biology of invasivespecies. Ann. Rev. Ecol. Syst. 32, 305–332.hmidt, L., 2000. Seed testing. In: Schmidt, L. (Ed.), Guide tohandling of tropical and subtropical forest seed. DANIDAForest Seed Center, Humlebaek, pp. 330–362 (chapter 11).hwarz, P.A., Fahey, T.J., McCulloch, C.E., 2003. Factors con-trolling spatial variation of tree species abundance in aforested landscape. Ecology 84, 1862–1878.iferaw, H., Teketay, D., Nemomissa, S., Assefa, F., 2004.Some biological characteristics that foster the invasion ofProsopis juliflora (Sw.) DC. at Middle Awash Rift Valley Area,north-eastern Ethiopia. J.Arid Env. 58, 135–154.vertown, J.W., 1980. The evolutionary ecology of mastseedling in trees. Biol. J. Linn. Soc. 14, 235–250.berloff, D., 2003. Confronting introduced species : a formof xenophobia? Biol. Invasions 5, 179–192.ith, A., 1975. Invasion and ecesis of bird-disseminatedwoody plants in a temperate forest sere. Ecology 56, 19–34.eroni, F., de Viana, M., 1998. Fruit and seed production inGleditsia triacanthos. In: Starfinger, U. (Ed.), Plant invasions.Ecological mechanisms and human responses. BackhuysPublishers, Leiden, pp. 155–160.rfinger, U., 1997. Introduction and naturalization of Prunusserotina in Central Europe. In: Brock, J.H. (Ed.), Plant inva-sions. Studies from North America and Europe, BackhuysPublishers, Leiden, pp. 161–171.rfinger, U., Kowarik, I., Rode, M., Schepker, H., 2003. Fromdesirable ornamental plant to pest to accepted addition tothe flora? the perception of an alien tree species throughcenturies. Biol. Invasions 5, 323–335.therland, S., Delph, L.F., 1984. On the importance of malefitness in plants. I. Patterns of fruit-set. Ecology 65, 1093–1104.rney, G.L., Fahey, T.J., 1998. Soil seed bank dynamics of pincherry in a northern hardwood forest, New Hampshire,USA. Can. J. For. Res. 28, 1471–1480.a, M., D’Antonio, C.M., 1998. Fruit choice and seed disper-sal of invasive vs. noninvasive Carpobrotus (Aizoaceae) incoastal California. Ecology 79, 1053–1060.ousek, P.M., D’Antonio, C.M., Loope, L.L., Rejmánek, M.,Westbrooks, R., 1997. Introduced species: a significantcomponent of human-caused global change. New ZealandJ. Ecol. 21, 1–16.ng, B.C., Smith, T.B., 2002. Closing the seed dispersal loop.Trends Ecol. Evol. 17, 379–385.ilcove, D.S., Rothstein, D., Dubow, J., Phillips, A., Losos, E.,1998. Quantifying threats to imperiled species in the Uni-ted States. BioScience 48, 607–615.


