Embed Size (px)
Citation preview

Quantitative method for in vitro matrigel invasivenessmeasurement through image analysis software
Gabriel Gallo-Oller • Juan A. Rey •
Javier Dotor • Javier S. Castresana
Received: 16 December 2013 / Accepted: 20 June 2014 / Published online: 3 July 2014
� Springer Science+Business Media Dordrecht 2014
Abstract The determination of cell invasion by matrigel
assay is usually evaluated by counting cells able to pass
through a porous membrane and attach themselves to the
other side, or by an indirect quantification of eluted specific
cell staining dye by means of optical density measurement.
This paper describes a quantitative analytical imaging
approach for determining the invasiveness of tumor cells
using a simple method, based on images processing with
the public domain software, ImageJ. Images obtained by
direct capture are split into the red channel, and the gen-
erated image is used to measure the area that cells cover in
the picture. To overcome the several disadvantages that
classical cell invasion determinations present, we propose
this method because it generates more accurate and sensi-
tive determinations, and it could be a reasonable option for
improving the quality of the results. The cost-effective
alternative method proposed is based on this simple and
robust software that is worldwide affordable.
Keywords Image analysis � Invasion � Matrigel � ImageJ
Introduction
Cell invasion requires a cell to migrate through an extracel-
lular matrix or basement membrane extract and is a pivotal
process to achieving functions such as wound repair, cell
differentiation, angiogenesis, embryonic development, tumor
invasion and metastasis. Cell invasion involves important
mechanisms for a wide array of biological processes exhibited
by normal cells and by metastatic tumor cells. Tumor cell
invasion into the surrounding tissues and metastasis to distant
sites of the body constitute the most lethal effects of solid
tumors (glioblastoma, melanoma, prostate, breast, bladder,
liver and lung cancer among others) [1–4]. These two char-
acteristics, invasion and metastasis, are major causes of
treatment failure and death for cancer patients [5] and involve
complex interactions between cancer cells and their extra-
cellular environment. They include multistep processes
involving cell adhesion, motility, and enzyme-dependent
infiltration of extracellular matrix [1, 2, 6].
The in vitro quantitative assessment of tumor cell trans-
migration across artificial anatomic barriers is a useful and
widespread tool in the study of tumor cell invasion capacity
[7]. The most widely used method consists of a porous filter
used as a barrier to determine the ability of cells to penetrate
and migrate to the opposite side of the filter [6]. This widely
used ‘‘invasion assay’’ requires wells with membrane bot-
toms, called inserts, was first described in 1986 by Terranova
et al. [8] and then standardized by Albini et al. [9]. In this
model, a matrix of solidified basement membrane compo-
nents (such as matrigel) is required, allowing the evaluation
of adhesion, local degradation and/or locomotion into the
region of the matrix [5, 9].
G. Gallo-Oller � J. S. Castresana
Brain Tumor Biology Unit-CIFA, University of Navarra School
of Sciences, Pamplona, Spain
J. A. Rey
IdiPaz Research Unit, La Paz University Hospital, Madrid, Spain
J. Dotor (&)
Digna Biotech, Orense 85, Edificio Lexington, 28020 Madrid,
Spain
e-mail: [email protected]
J. S. Castresana (&)
Department of Biochemistry and Genetics, University of
Navarra School of Sciences, Irunlarrea 1, 31008 Pamplona,
Spain
e-mail: [email protected]
123
Mol Biol Rep (2014) 41:6335–6341
DOI 10.1007/s11033-014-3556-0

The two main types of analysis in matrigel invasiveness
are direct quantification by counting transmigrated cells,
and indirect quantification of the eluted cell staining dye
and subsequent optical density (OD) measurement [6].
Several limitations have been found in the first approach.
Firstly, the quantitative measurement is carried out manu-
ally by visually counting the cells that have migrated
through the matrix, something which is subjective, time-
consuming and laborious due to the large, single filter area
and the multi-chambers and replicates to be evaluated.
Secondly, the sampling of a single filter often yields fluc-
tuating results due to the non-uniformed distribution and
overlapping of migrated cells, resulting in cell aggregates.
Thirdly, the percentage of migrated cells varies, depending
on the number of cells initially placed on the upper surface;
this makes comparison of published results a great chal-
lenge [6, 7, 10].
In spite of some drawbacks, cell counting is probably the
most sensitive and accurate method of quantifying cell
number. However, the difficulties in scoring total cell num-
ber by visual counting make it time-consuming and tedious
for investigators to determine a true percentage of migration
and/or invasion [11, 12]. In 1993 Muir et al. [6] proposed the
indirect test for assessing cell invasion, based on OD mea-
surements of the eluted cell staining dye. In some cases, and
based on our experience, this test might present lower sen-
sitivity. For example, the need to correct for high background
due to unspecific dyes binding to the matrigel, resulted in
slightly lower values [6]. Although increasing number of
replicates and the use of multichamber formats have been
included as partial solutions for solving the limitations of the
indirect approach, these strategies can be replaced by rapid
and semiautomatic methods for assessing cell number in
filter-based assays [6, 7].
Therefore, a third approach for improving cell invasion
determination might be a computer-assisted image analysis
system which could guarantee a nonsubjective and efficient
quantification. The use of software or computer devices
provides a more objective quantification, and generally
highly reproducible results [13]. The computerized image
analysis allows the transformation of a qualitative percep-
tion into quantitative parameters, improving the capability
of measurement over large sets of images, reducing inter
and intra observer variations, and increasing the robustness
of the technique [13, 14].
There are a good number of free software systems that
are often applied in biomedicine which do not require
advanced computer skills. One of them, ImageJ, is a Java-
based image-processing and analysis program, designed at
the National Institutes of Health. ImageJ is already avail-
able as freeware and is widely used in several scientific
fields [15]. The use of ImageJ and other image analysis
programs can be found elsewhere, including area
calculation, particle counting, shape and size analysis, dot
blot analysis, color analysis, and other applications [15–
21]. Using the ‘‘area method’’, described by Girish et al.
[22], the total area occupied by stained cells can be selected
using ImageJ’s thresholding tool.
ImageJ is a well-known and useful program for biology
image analysis [23], and several reports indicate their use
for invasion assay analysis, although no protocol descrip-
tion has been made [24–26]. The aim of this paper is to
describe the use of ImageJ software and its application for
assessing in vitro cell invasion. With this purpose in mind,
we have carried out experiments in order to show inva-
siveness by matrigel. We compared the indirect quantifi-
cation by elution of cell dye and further OD measurement,
versus the direct image analysis with ImageJ.
Materials and methods
Cell lines and cell culture
Two glioblastoma-derived cell lines were used in this work:
A172 and U87-MG, both provided by the American Type
Culture Collection (ATCC, Manassas, VA). A172 was grown
with RPMI/GlutaMAXTM medium, and U87-MG with Dul-
beccos modified Eagles medium/GlutaMAXTM plus nones-
sential aminoacids at 5 %. Both media were supplemented
with heat-inactivated 10 % fetal bovine serum, 1 % penicil-
lin/streptomycin and 0.1 % amphotericin B. All cell lines and
assays were grown and performed, respectively, at 37 �C in a
humidified atmosphere of 5 % CO2.
Matrigel invasion assay
Matrigel concentrations were optimized based on the
migration capability of each cell line and according to a
previous in vitro assay optimization process (data not
shown). Final concentrations of 2.7 or 1.6 lg/ll of Matrigel
(BD Matrigel TM Basement Membrane Matrix Growth
Factor Reduced, BD Biosciences, Bedford, MA) for A172 or
U87-MG cell lines, were respectively adjusted in the upper
face of every insert (24-Millicell Culture Plate Filter Inserts,
0.8 lm PET, Millipore, Billerica, MA, USA), and incubated
at 37 �C for 30 min until solidified. Cells (2.5 9 105) were
resuspended in their respective culture media supplemented
with 0.5 % FBS in the absence (control group) or presence
(treated group) of 100 lg/ml of P144, a TGF-b inhibitor
peptide [27, 28], and then added to the upper chamber. The
lower reservoirs contained a medium supplemented with
10 % FBS. After 24 h of incubation, cells on the upper sur-
face of the membranes were removed with cotton swabs, and
cells on the lower surface of the membranes were fixed and
stained with crystal violet (PANREAC, Castellar del Valles,
6336 Mol Biol Rep (2014) 41:6335–6341
123

Barcelona, Spain) at 0.5 %. To cover most of the filter area at
1009 magnification (109 plan objective and 109 ocular
lenses), 10–15 images of each filter were acquired with an
inverted light microscope NIKON ECLIPSE TS100 (NI-
KON, Melville, NY, USA) with Digital SGHT DS-LS
camera (NIKON, Melville, NY, USA). Then, the solubilized
dye was measured on a microplate reader Spectra MR
(DYNEX Technologies, Chantilly, VA, USA) at 560 nm.
Three independent experiments were performed for each
condition.
TGF-b inhibitors have been widely proposed and are
being developed as antitumoral therapies in patients with
cancer [29]. For this reason we decided to use an available
and well know TGF-b inhibitor peptide (P144) with
established antimetastatic activity [13]. In the context of
this work P144 is used as a cell invasiveness inhibitor to
check for the sensitivity of the analytical method.
Image analysis
This method was based on a similar previous procedure
developed for stained liver tissue quantification, and it was
first applied to invasiveness assays in this work. Image
analysis was performed using the public domain, free soft-
ware ImageJ (NIH, Bethesda, Maryland, USA; http://rsb.
info.nih.gov/ij/), a Java application which runs in most
operative systems. A modified macro for quantifying stained
liver tissue (http://rsbweb.nih.gov/ij/docs/examples/stained-
sections/index.html) was applied. The images in JPEG for-
mat were first split into red, green and blue channels using the
RGB stack command. Once the blue and green channels
were discarded, the images were performed through red
channel, since this channel showed less background levels.
Threshold was manually adjusted until only stained cells
were highlighted in red. Next, Set Measurements dialogue
Fig. 1 Image processing steps
Mol Biol Rep (2014) 41:6335–6341 6337
123
was checked for: ‘‘Area’’, ‘‘Area Fraction’’, ‘‘Limit to
Threshold’’ and ‘‘Display Label’’. The obtained data quan-
tify the area and the area percentage of the image covered by
stained cells. After adjustment of conditions for invasiveness
quantification in the first image, subsequent images require
minimal threshold tuning to compensate light and back-
ground variability among images (Fig. 1).
Statistical analysis
The data were expressed as the mean ± standard deviation
of triplicated wells per group from at least three independent
experiments. According the normal distribution, data were
analyzed by Mann–Whitney U test or t test. All the statistical
analysis as well as Pearsons correlation coefficient and the
Bland–Altman analysis were generated using GraphPad
Prism for Windows version 5.04. Differences were consid-
ered significant when the p-value was lower than 0.05.
Results and discussion
Invasiveness by colorimetric determination
Invasion assays were performed using 24-Millicell Culture
Plate Filter Inserts, 0.8 lm PET (Millipore, Billerica, MA,
USA) coated with matrigel. After 24 h, invading cells
attached to the lower surface of the membranes were
indirectly measured by elution of the dye. The number of
cells that migrated to the lower surface could not be
determined by counting, due to non-uniform distribution of
the migrated cells, some cell aggregation, and overlapping
of the tested cell lines.
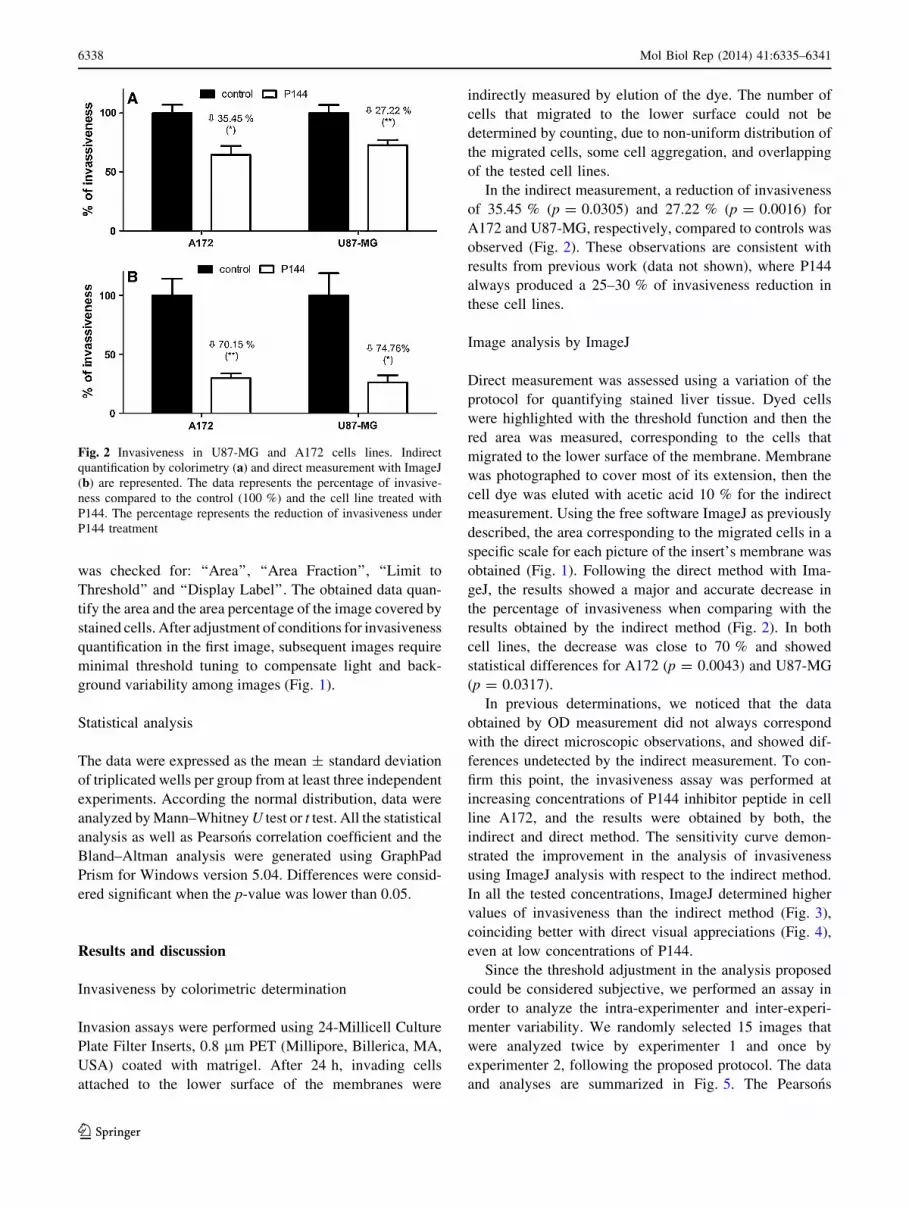
In the indirect measurement, a reduction of invasiveness
of 35.45 % (p = 0.0305) and 27.22 % (p = 0.0016) for
A172 and U87-MG, respectively, compared to controls was
observed (Fig. 2). These observations are consistent with
results from previous work (data not shown), where P144
always produced a 25–30 % of invasiveness reduction in
these cell lines.
Image analysis by ImageJ
Direct measurement was assessed using a variation of the
protocol for quantifying stained liver tissue. Dyed cells
were highlighted with the threshold function and then the
red area was measured, corresponding to the cells that
migrated to the lower surface of the membrane. Membrane
was photographed to cover most of its extension, then the
cell dye was eluted with acetic acid 10 % for the indirect
measurement. Using the free software ImageJ as previously
described, the area corresponding to the migrated cells in a
specific scale for each picture of the insert’s membrane was
obtained (Fig. 1). Following the direct method with Ima-
geJ, the results showed a major and accurate decrease in
the percentage of invasiveness when comparing with the
results obtained by the indirect method (Fig. 2). In both
cell lines, the decrease was close to 70 % and showed
statistical differences for A172 (p = 0.0043) and U87-MG
(p = 0.0317).
In previous determinations, we noticed that the data
obtained by OD measurement did not always correspond
with the direct microscopic observations, and showed dif-
ferences undetected by the indirect measurement. To con-
firm this point, the invasiveness assay was performed at
increasing concentrations of P144 inhibitor peptide in cell
line A172, and the results were obtained by both, the
indirect and direct method. The sensitivity curve demon-
strated the improvement in the analysis of invasiveness
using ImageJ analysis with respect to the indirect method.
In all the tested concentrations, ImageJ determined higher
values of invasiveness than the indirect method (Fig. 3),
coinciding better with direct visual appreciations (Fig. 4),
even at low concentrations of P144.
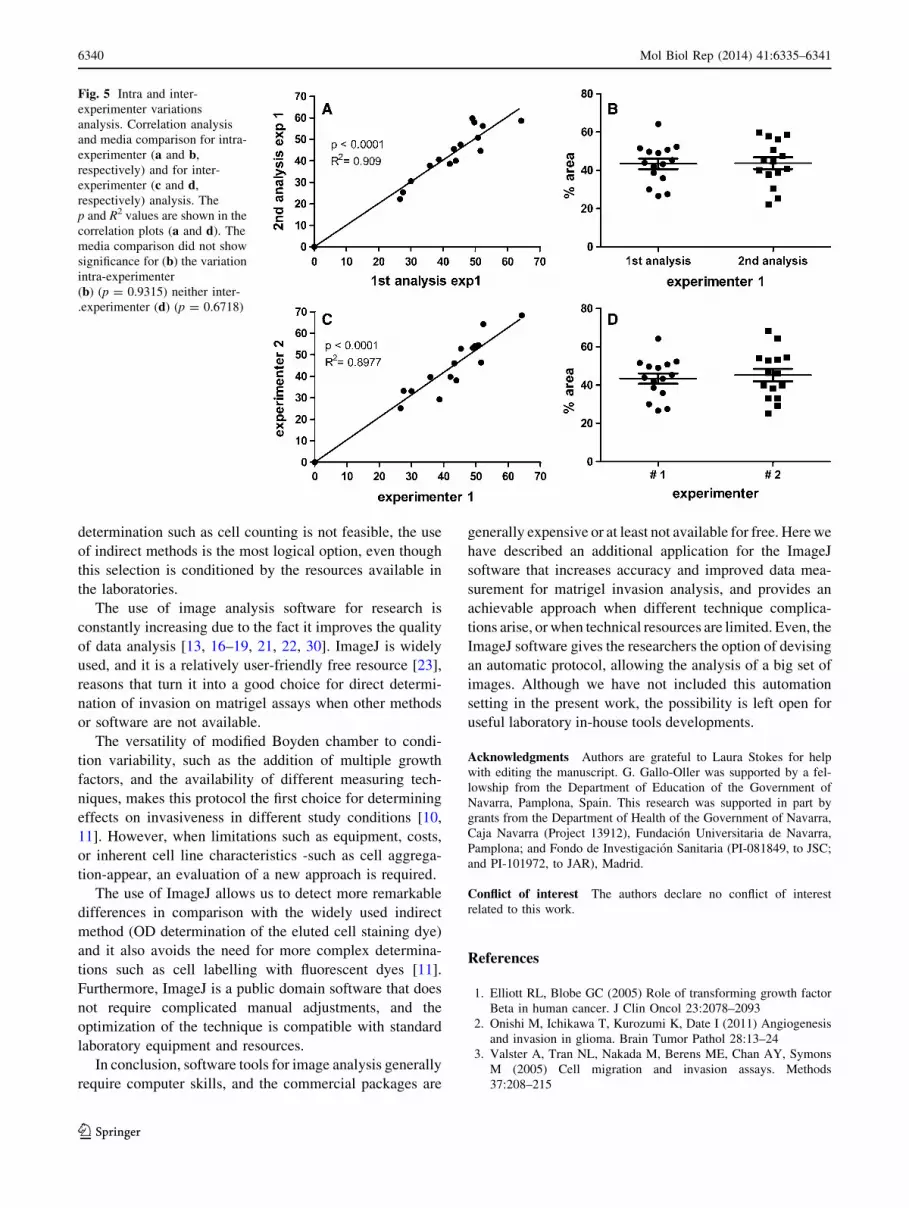
Since the threshold adjustment in the analysis proposed
could be considered subjective, we performed an assay in
order to analyze the intra-experimenter and inter-experi-
menter variability. We randomly selected 15 images that
were analyzed twice by experimenter 1 and once by
experimenter 2, following the proposed protocol. The data
and analyses are summarized in Fig. 5. The Pearsons
Fig. 2 Invasiveness in U87-MG and A172 cells lines. Indirect
quantification by colorimetry (a) and direct measurement with ImageJ
(b) are represented. The data represents the percentage of invasive-
ness compared to the control (100 %) and the cell line treated with
P144. The percentage represents the reduction of invasiveness under
P144 treatment
6338 Mol Biol Rep (2014) 41:6335–6341
123

coefficient showed correlation between the two results
obtained by the same experimenter (p \ 0.0001), coincid-
ing with no statistical differences between the two media
obtained (p [ 0.05). The Bland–Altman analysis showed
the concordance between the two sets of observations (data
not shown). Respect to the inter-experimenter variation; the
data obtained by two different experimenters showed
similar results. Taken together, resulting data showed that
the method is not significantly affected by variations due to
intra and inter-experimenters analysis. Considering the
automation option offered by IMAGEJ, these external
variation factors could even be substantially diminished.
Probably the most widely used method for in vitro
migration/invasion analysis is the modified Boyden
Chamber, due to the plasticity of the assay incorporating
changes and variations that can be adapted to specific
requirements [10–12]. We already summarized the differ-
ent limitations of this technique [6, 7, 10]: from protocol
optimization for each cell line to the selection of a specific
measurement method according to the availability of the
resources. The data analysis obtained with this approach
can be processed in different ways. In this work, we
measured invasion using the basic protocol of the modified
Boyden chamber, coating the membrane with matrigel, and
carrying out two different analyses: an indirect colorimetric
assay and an image analysis using the ImageJ software.
We demonstrated that the new approach by ImageJ
introduces an improvement in the quality and sensitivity of
cell invasion data. In our first assays, we already consid-
ered that the dye elution protocol introduced some vari-
ability in our results, as the decrease in the percentage of
cell invasion did not correspond with visual observations
(Fig. 4). We selected an indirect assay based on OD
determination of a diluted cell staining dye because (1) we
could not perform direct counting of transmigrated cells
due cell aggregation, and (2) this OD method is the most
widely used determination method, due to the fact that
other indirect methods are more time-consuming and
require specific equipment [11].
As we expected, the data obtained with ImageJ always
showed remarkable differences between cell invasion val-
ues for control and P144-treated groups. The relative
invasion values dropped from 70–74 to 27–35 % in the
same inserts analyzed in the P144-treated cells. To confirm
this observation, we carried out a concentration–response
sensitive curve to discard possible effects due to the pep-
tide concentration used. Again, the analysis with ImageJ
showed a lower value of invasion in all cases, supporting
optimized method accuracy.
Despite the fact that our initial measurements were
based on direct observation (Fig. 4), the incorporation of
ImageJ analysis improved our results. When a direct
Fig. 3 Dose–response sensitivity curve in A172 cell line. The
comparison between the two different methods used is represented.
The determination by ImageJ always found more accurate data than
the OD 560 nm determination, in all P144 concentrations. The
logarithm scale of the P144 concentrations tested are graphed on the
X axis. The percentage represents the reduction of invasiveness
compared to the control. Each point represents the mean of at least
three independent experiments. The dotted line represents 100 % of
the control value
Fig. 4 Direct visual observation. Representative areas of transmigrated cells in the lower face of inserts in control (a) and P144-treated (b) cell
lines. Direct observation by optic microscopy evidences more remarkable differences than by OD measurement
Mol Biol Rep (2014) 41:6335–6341 6339
123
determination such as cell counting is not feasible, the use
of indirect methods is the most logical option, even though
this selection is conditioned by the resources available in
the laboratories.
The use of image analysis software for research is
constantly increasing due to the fact it improves the quality
of data analysis [13, 16–19, 21, 22, 30]. ImageJ is widely
used, and it is a relatively user-friendly free resource [23],
reasons that turn it into a good choice for direct determi-
nation of invasion on matrigel assays when other methods
or software are not available.
The versatility of modified Boyden chamber to condi-
tion variability, such as the addition of multiple growth
factors, and the availability of different measuring tech-
niques, makes this protocol the first choice for determining
effects on invasiveness in different study conditions [10,
11]. However, when limitations such as equipment, costs,
or inherent cell line characteristics -such as cell aggrega-
tion-appear, an evaluation of a new approach is required.
The use of ImageJ allows us to detect more remarkable
differences in comparison with the widely used indirect
method (OD determination of the eluted cell staining dye)
and it also avoids the need for more complex determina-
tions such as cell labelling with fluorescent dyes [11].
Furthermore, ImageJ is a public domain software that does
not require complicated manual adjustments, and the
optimization of the technique is compatible with standard
laboratory equipment and resources.
In conclusion, software tools for image analysis generally
require computer skills, and the commercial packages are
generally expensive or at least not available for free. Here we
have described an additional application for the ImageJ
software that increases accuracy and improved data mea-
surement for matrigel invasion analysis, and provides an
achievable approach when different technique complica-
tions arise, or when technical resources are limited. Even, the
ImageJ software gives the researchers the option of devising
an automatic protocol, allowing the analysis of a big set of
images. Although we have not included this automation
setting in the present work, the possibility is left open for
useful laboratory in-house tools developments.
Acknowledgments Authors are grateful to Laura Stokes for help
with editing the manuscript. G. Gallo-Oller was supported by a fel-
lowship from the Department of Education of the Government of
Navarra, Pamplona, Spain. This research was supported in part by
grants from the Department of Health of the Government of Navarra,
Caja Navarra (Project 13912), Fundacion Universitaria de Navarra,
Pamplona; and Fondo de Investigacion Sanitaria (PI-081849, to JSC;
and PI-101972, to JAR), Madrid.
Conflict of interest The authors declare no conflict of interest
related to this work.
References
1. Elliott RL, Blobe GC (2005) Role of transforming growth factor
Beta in human cancer. J Clin Oncol 23:2078–2093
2. Onishi M, Ichikawa T, Kurozumi K, Date I (2011) Angiogenesis
and invasion in glioma. Brain Tumor Pathol 28:13–24
3. Valster A, Tran NL, Nakada M, Berens ME, Chan AY, Symons
M (2005) Cell migration and invasion assays. Methods
37:208–215
Fig. 5 Intra and inter-
experimenter variations
analysis. Correlation analysis
and media comparison for intra-
experimenter (a and b,
respectively) and for inter-
experimenter (c and d,
respectively) analysis. The
p and R2 values are shown in the
correlation plots (a and d). The
media comparison did not show
significance for (b) the variation
intra-experimenter
(b) (p = 0.9315) neither inter-
.experimenter (d) (p = 0.6718)
6340 Mol Biol Rep (2014) 41:6335–6341
123

4. Koul HK, Pal M, Koul S (2013) Role of p38 MAP kinase signal
transduction in solid tumors. Genes Cancer 4:342–359
5. Sieuwerts AM, Klijn JG, Foekens JA (1997) Assessment of the
invasive potential of human gynecological tumor cell lines with
the in vitro Boyden chamber assay: influences of the ability of
cells to migrate through the filter membrane. Clin Exp Metastasis
15:53–62
6. Muir D, Sukhu L, Johnson J, Lahorra MA, Maria BL (1993)
Quantitative methods for scoring cell migration and invasion in
filter-based assays. Anal Biochem 215:104–109
7. Li YH, Zhu C (1999) A modified Boyden chamber assay for
tumor cell transendothelial migration in vitro. Clin Exp Metas-
tasis 17:423–429
8. Terranova VP, Hujanen ES, Loeb DM, Martin GR, Thornburg L,
Glushko V (1986) Use of a reconstituted basement membrane to
measure cell invasiveness and select for highly invasive tumor
cells. Proc Natl Acad Sci USA 83:465–469
9. Albini A, Iwamoto Y, Kleinman HK, Martin GR, Aaronson SA,
Kozlowski JM, McEwan RN (1987) A rapid in vitro assay for
quantitating the invasive potential of tumor cells. Cancer Res
47:3239–3245
10. Hulkower KI, Herber RL (2011) Cell migration and invasion
assays as tools for drug discovery. Pharmaceutics 3:107–124
11. Kirilova A, Lockwood G, Choi P, Bana N, Haider MA, Brock
KK, Eccles C, Dawson LA (2008) Three-dimensional motion of
liver tumors using cine-magnetic resonance imaging. Int J Radiat
Oncol Biol Phys 71:1189–1195
12. Cassola VF, Lima VJ, Kramer R, Khoury HJ (2010) FASH and
MASH: female and male adult human phantoms based on poly-
gon mesh surfaces: I. Development of the anatomy. Phys Med
Biol 55:133–162
13. Prasad K, Prabhu GK (2012) Image analysis tools for evaluation
of microscopic views of immunohistochemically stained speci-
men in medical research—a review. J Med Syst 36:2621–2631
14. Tourassi GD (1999) Journey toward computer-aided diagnosis:
role of image texture analysis. Radiology 213:317–320
15. Bearer EL (2003) Overview of image analysis, image importing,
and image processing using freeware. Curr Protoc Mol Biol
Chapter 14:Unit 14 15
16. Prodanov D, Heeroma J, Marani E (2006) Automatic mor-
phometry of synaptic boutons of cultured cells using granulo-
metric analysis of digital images. J Neurosci Methods
151:168–177
17. Carmona R, Macias D, Guadix JA, Portillo V, Perez-Pomares JM,
Munoz-Chapuli R (2007) A simple technique of image analysis
for specific nuclear immunolocalization of proteins. J Microsc
225:96–99
18. McAtee PA, Hallett IC, Johnston JW, Schaffer RJ (2009) A rapid
method of fruit cell isolation for cell size and shape measure-
ments. Plant Methods 5:5
19. Safadi RA, Musleh AS, Al-Khateeb TH, Hamasha AA (2010)
Analysis of immunohistochemical expression of k19 in oral
epithelial dysplasia and oral squamous cell carcinoma using color
deconvolution-image analysis method. Head Neck Pathol
4:282–289
20. Cai Z, Chattopadhyay N, Liu WJ, Chan C, Pignol JP, Reilly RM
(2011) Optimized digital counting colonies of clonogenic assays
using ImageJ software and customized macros: comparison with
manual counting. Int J Radiat Biol 87:1135–1146
21. Kim US, Kim SJ, Baek SH, Kim HK, Sohn YH (2011) Quanti-
tative analysis of optic disc color. Korean J Ophthalmol
25:174–177
22. Girish V, Vijayalakshmi A (2004) Affordable image analysis
using NIH Image/ImageJ. Indian J Cancer 41:47
23. Collins TJ (2007) ImageJ for microscopy. Biotechniques
43:25–30
24. Hood JL, Pan H, Lanza GM, Wickline SA (2009) Paracrine
induction of endothelium by tumor exosomes. Lab Invest
89:1317–1328
25. Kitzing TM, Wang Y, Pertz O, Copeland JW, Grosse R (2010)
Formin-like 2 drives amoeboid invasive cell motility downstream
of RhoC. Oncogene 29:2441–2448
26. Kam Y, Karperien A, Weidow B, Estrada L, Anderson AR,
Quaranta V (2009) Nest expansion assay: a cancer systems
biology approach to in vitro invasion measurements. BMC Res
Notes 2:130
27. Ezquerro IJ, Lasarte JJ, Dotor J, Castilla-Cortazar I, Bustos M,
Penuelas I, Blanco G, Rodriguez C, Lechuga Mdel C, Greenwel
P, Rojkind M, Prieto J et al (2003) A synthetic peptide from
transforming growth factor beta type III receptor inhibits liver
fibrogenesis in rats with carbon tetrachloride liver injury. Cyto-
kine 22:12–20
28. Llopiz D, Dotor J, Casares N, Bezunartea J, Diaz-Valdes N, Ruiz
M, Aranda F, Berraondo P, Prieto J, Lasarte JJ, Borras-Cuesta F,
Sarobe P (2009) Peptide inhibitors of transforming growth factor-
beta enhance the efficacy of antitumor immunotherapy. Int J
Cancer 125:2614–2623
29. Akhurst RJ, Hata A (2012) Targeting the TGFbeta signalling
pathway in disease. Nat Rev Drug Discov 11:790–811
30. Maximova OA, Taffs RE, Pomeroy KL, Piccardo P, Asher DM
(2006) Computerized morphometric analysis of pathological
prion protein deposition in scrapie-infected hamster brain. J His-
tochem Cytochem 54:97–107
Mol Biol Rep (2014) 41:6335–6341 6341
123
![Quantitative positron emission tomography of mGluR5 in rat brain with [ 18 F]PSS232 at minimal invasiveness and reduced model complexity](https://img.pdfslide.net/doc/110x75/6344edf9df19c083b107d348/quantitative-positron-emission-tomography-of-mglur5-in-rat-brain-with-18-fpss232.jpg)


