Embed Size (px)
Citation preview

Blood First Edition Paper, prepublished online April 27, 2004; DOI 10.1182/blood-2003-10-3485
Copyright (c) 2004 American Society of Hematology
Natural Killer T Cells Accelerate Atherogenesis in Mice
Short title: NKT cells and atherosclerosis in mice
Yukihito Nakai,1,2 Kazuya Iwabuchi,1 Satoshi Fujii,2 Naoki Ishimori, 1,2,8 Nyambayar Dashtsoodol,1
Keiko Watano, 1,2 Tetsuya Mishima,1,2 Chikako Iwabuchi,1 Shinya Tanaka,3 Jelena S. Bezbradica,4
Toshinori Nakayama,5 Masaru Taniguchi,6 Sachiko Miyake,7 Takashi Yamamura,7
Akira Kitabatake,2 Sebastian Joyce,4 Luc Van Kaer,4 and Kazunori Onoé1
1Division of Immunobiology, Research Section of Pathophysiology, Institute for Genetic Medicine,
Hokkaido University, Sapporo, Japan
2Department of Cardiovascular Medicine, Graduate School of Medicine, Hokkaido University,
Sapporo, Japan
3Laboratory of Molecular and Cellular Pathology, Graduate School of Medicine, Hokkaido
University, Sapporo, Japan
4Department of Microbiology and Immunology, School of Medicine, Vanderbilt University,
Nashville, Tennessee
5Department of Immunology, Graduate School of Medicine, Chiba University, Chiba, Japan
6Laboratory of Immune Regulation, RIKEN Research Center for Allergy and Immunology,
Yokohama, Japan
7Department of Immunology, National Institute of Neuroscience, NCNP, Kodaira, Japan
8The Jackson Laboratory, Bar Harbor, Maine
Correspondence: Kazuya Iwabuchi / Kazunori Onoé, Division of Immunobiology, Research
Section of Pathophysiology, Institute for Genetic Medicine, Hokkaido
2
University, Kita-15 Nishi-7, Kita-ku, Sapporo 060-0815, Japan
Tel: 81-11-706-5532; Fax: 81-11-706-7545
E-mail: [email protected] (KI) / [email protected] (KO)
Words in text: 4999
Scientific heading: Hemostasis, Thrombosis and Vascular Biology
The present study was supported in parts by Grant-in-aid for Scientific Research S, B, Houga from
the Ministry of Education, Culture, Science, Sports and Technology (MEXT), Japan (KO, SF, KI)
and grants from The Noastec Foundation (KI, SF, AK, KO), Mochida Memorial Foundation for
Medical and Pharmaceutical Research (KI), The Akiyama Foundation (KI, YN, TM, CI), Daiwa
Securities Health Foundation (KI, CI, KN, SF), The Suhara Memorial Foundation (KI, YN, ND, CI,
SF), The Program for Promotion of Fundamental Studies in Health Sciences of the Pharmaceuticals,
and Medical Devices Agency (PMDA) (TY) and National Institutes of Health grants AI50953,
NS44044, HL68744 (LVK), and AI42284 (SJ).

3
Abstract
We have investigated the potential role of CD1d-restricted natural killer T (NKT) cells in the
development of atherosclerosis in mice. When fed an atherogenic diet (AD), NKT cell-deficient
CD1d-/- mice had significantly smaller atherosclerotic lesions than AD-fed C57BL/6 (WT) mice. A
significant reduction of atherosclerotic lesions was also demonstrated in AD-fed, low-density
lipoprotein receptor deficient (Ldlr-/-) mice reconstituted with CD1d-/- bone marrow cells, as
compared with the lesions observed in Ldlr-/- mice reconstituted with WT marrow cells. In addition,
repeated injection of α-GalCer or the related glycolipid OCH to apolipoprotein E knockout (apoE-/-)
mice during the early phase of atherosclerosis significantly enlarged the lesion areas compared to
mice injected with vehicle control. However, administration of α-GalCer to apoE-/- mice with
established lesions did not significantly increase the lesion area, but considerably decreased the
collagen content. Development of atherosclerosis in either AD-fed WT or apoE-/- mice was
associated with the presence of Vα14Jα18 transcripts in the atherosclerotic arterial walls, indicating
that NKT cells were recruited to these lesions. Thioglycolate-elicited macrophages pulsed with
oxidized low-density lipoproteins expressed enhanced CD1d levels and induced NKT cells to
produce interferon-γ, a potentially pro-atherogenic Th1 cytokine. Collectively, we conclude that
NKT cells are pro-atherogenic in mice.
4
Introduction
Atherosclerosis is an inflammatory vascular disease that involves components of the innate and
acquired immune systems.1-3 Several studies have suggested that lymphocytes, which are detected
in atherosclerotic lesions in both human and mouse,4,5 play a pro-atherogenic role.6-8 Recently, the
role of distinct lymphocyte subsets in the development of atherosclerosis has been evaluated. For
example, emerging evidence indicates that T helper 1 (Th1) cells are pro-atherogenic9, whereas Th2
cells are anti-atherogenic.10,11 These observations are further supported by the finding that Th1
cytokines (e.g., interferon-γ [IFN-γ] and interleukin-12 [IL-12]) are important in the progression of
atherosclerosis,12-15 and that among Th2 cytokines, IL-10 is anti-atherogenic.16 On the other hand,
recent studies have suggested that B cells play a protective role in atherogenesis.17,18
NKT cells are a unique subset of lymphocytes that possess surface markers and functions of
both T and NK cells.19-23 Several characteristics of NKT cells suggest that they may play a role in
the atherogenic process. Most NKT cells express an invariant Vα14Jα18 T cell receptor (TCR)-Vα
chain paired with a restricted set of TCR-Vβ chains. These classical NKT cells recognize lipid
antigens presented by the major histocompatibility complex (MHC) class I-like molecule CD1d,
produce copious amounts of IFN-γ and IL-4 upon activation,22 and constitutively express
Fas-ligand.23 Moreover, NKT cells play a protective role in several autoimmune diseases, infections,
and tumor progression/metastasis.20 Protective effects of NKT cells and their ligands in
autoimmunity are largely attributed to their capacity to promote Th2 immune responses.24,25
However, in some situations NKT cells can contribute to the development of Th1 immune
responses as well26. Therefore, it was difficult to predict whether NKT cells would play a pro- or
anti-atherogenic role.2
To date, few studies have investigated the role of CD1d and CD1d-dependent T cells in

5
atherogenesis. CD1d-expressing cells are present in human atherosclerotic plaques,27 suggesting
that NKT cells may be recruited to the lesions. Furthermore, treatment of apolipoprotein E
knockout (apoE-/-) mice28, a model of severe atherosclerosis, with lipopolysaccharide (LPS) resulted
in NKT cell recruitment to the atherosclerotic plaques.29 However, whether NKT cells are directly
involved in the development or regulation of atherosclerosis remains to be investigated.
In the present study, we compared atherosclerotic lesions induced by an atherogenic diet (AD)
between NKT cell-deficient CD1d-/- 30 and wild-type C57BL/6 (WT) mice, and between
low-density lipoprotein receptor deficient (Ldlr-/-) mice31 reconstituted with bone marrow (BM)
cells from CD1d-/- mice and Ldlr-/- mice reconstituted with BM of WT mice. Moreover we
examined whether NKT cell ligands (α-galactosylceramide32 [α-GalCer] and OCH33) can modulate
atherogenesis in apoE-/- mice. Our findings consistently demonstrate that NKT cells play a
pro-atherogenic role. Possible mechanisms underlying the pro-atherogenic role of NKT cells are
discussed.

6
Materials and Methods
Glycolipids
α-GalCer (Pharmaceutical Research Laboratories, Kirin Brewery Co., Ltd., Gunma, Japan) and
OCH were dissolved in either 0.5% polysorbate-20 at 220 µg/ml, or dimethyl sulfoxide at 100
µg/ml, respectively, and further diluted with phosphate buffered saline (PBS) before use.
Mice
Female WT (Japan SLC, Hamamatsu, Japan), CD1d-/- 30 (Vanderbilt University, Nashville,
Tennessee), Jα18-/- 34 (Chiba University, Chiba, Japan), Ldlr-/- and apoE-/- (The Jackson Laboratory,
Bar Harbor, Maine) mice with the C57BL/6 genetic background were used throughout the study.
WT and CD1d-/- mice were fed either with a regular chow diet or the AD (15% fat, 1.25%
cholesterol, and 0.5% cholic acid; Nihon-nohsan, Yokohama, Japan) from 10 to 30 weeks of age.
All animal care and experimental procedures conform to the regulations of the Committee of
Hokkaido University on Animal Experimentation.
BM transplantation (BMT)
BMT was performed with lethally irradiated (9.5 Gy) Ldlr-/- mice as recipients, as previously
described.35 Briefly, recipient mice were injected with T cell-depleted BM cells (5 x 10⁶) from WT
mice (Thy1.1 in BMT protocol, referred to as [WT -> Ldlr-/-]), CD1d-/- mice ([CD1d-/- -> Ldlr-/-]) or
Ldlr-/- mice ([Ldlr-/- -> Ldlr-/-]). The treated mice were administered oxytetracyclin (Pfizer Japan,
Tokyo, Japan) via drinking water for 4 weeks and then placed on the AD for 5 weeks.
Reconstitution was assessed by evaluating thymocyte expression of CD1d for CD1d-/- donors, and
both Thy1.1 (donor) and Thy1.2 (recipient) for WT donors, using flow cytometry.

7
Induction of atherosclerotic lesions
1) Early-phase studies
ApoE-/- mice were divided into 4 groups (n = 10 each): one group received intraperitoneal (i.p.)
injections of 0.1 µg/g body weight (BW) α-GalCer; one group received its vehicle; and the
remaining groups were administered with 0.3 µg/gBW OCH or its vehicle, respectively. Injections
were started at 8 weeks of age and repeated every two weeks. At 13 weeks of age, mice were
sacrificed and used for experiments. Blood samples were consecutively collected from the
retro-orbital plexus at 0, 2, 5, 12, 24, 48 and 72 hours after injection of either α-GalCer or OCH and
the levels of IFN-γ and IL-4 were quantitated by enzyme-linked immunosorbent assay (ELISA;
Biosource, Camarillo, California).
2) Late-phase studies
Ten mice received either an i.p. injection of 0.1 µg/gBW α-GalCer or vehicle every week starting
from 8 weeks of age. One week after the eleventh injection, mice were sacrificed and used for
experiments.
Blood chemistry
Amounts of total-cholesterol, high-density lipoprotein (HDL)-cholesterol and triglyceride
concentrations in sera were determined with colorimetric assay kits (Kyowa Medex, Tokyo, and
Serotekku, Sapporo, Japan). Individual serum alanine-aminotransferase and total bilirubin were
quantitated by Fuji Drychem system (Fujifilm Medical, Osaka, Japan).
Quantitative analyses of atherosclerotic lesion areas
Atherosclerotic lesions were analyzed as previously described.35 In brief, the basal portion of the

8
heart and proximal aortic root were excised and embedded in OCT compound and frozen in liquid
nitrogen. Eight serial cryosections of 10 µm-thickness at 80 µm intervals throughout the aortic sinus
were stained with Oil red O (Sigma, St Louis, Missouri) and hematoxylin. Lesions were quantified
by computerized image analysis system. For the advanced lesions, the entire aorta was examined by
the en-face method, as described elsewhere.36
Characterization of atherosclerotic lesions
Immunohistochemistry was performed on 8 µm-thick cryosections as previously described.37 Rat
monoclonal antibodies (mAb) to mouse macrophages (MOMA-2; Serotec, Oxford, UK), hamster
anti-mouse CD3 (BD Biosciences, San Jose, California), anti-α-smooth muscle actin (DAKO,
Glostrup, Denmark), rat anti-mouse IFN-γ (BioSource), rat anti-mouse IL-10 (ENDOGEN, Illinois),
biotinylated secondary antibodies to the respective primary reagents, and streptavidin-horseradish
peroxidase (DAKO) were used for detection. Signals were developed with DBA kits (Vector
Laboratories, Burlingame, California). The number of CD3+ cells per cross-section of lesion area
was counted at x 400 magnification. Elastica-Masson staining was performed to analyze the
composition of the lesion, using 3 aortic cross-sections/animal from 10 animals. The percentage of
collagen-rich matrix areas among the total lesion areas was defined as collagen contents. Total cell
numbers per lesion were also counted.
Reverse transcription-polymerase chain reaction (RT-PCR)
WT (fed the chow diet or the AD), apoE-/- and Jα18-/- mice were sacrificed after an
overnight-fasting period. After whole body perfusion with cold RNase-free PBS, aortae from the
ascending to the end of the thoracic aorta were removed, dissected longitudinally and washed
meticulously in cold PBS to remove attached hematocytes and tissue fragments outside the aortae.

9
RNA extraction and RT-PCR were performed as described previously.38
Flow cytometry
Splenocytes were prepared by lysing red blood cells with Tris-NH4Cl solution. Hepatic
mononuclear cells (HMNCs) were isolated using 33% Percoll (Amersham Pharmacia Biotech, New
Jersey), as previously reported.39 Cells were incubated with 2.4G2 mAb (anti-FcγR) to block
non-specific staining, and stained with a combination of the following mAb conjugates. For
lymphocytes: biotinylated-anti-Thy1.1 (OX7), FITC-anti-Thy1.2 (Coulter, Miami, FL), -CD1d
(1B1), and -TCRβ (H57-597), and phycoerythrin (PE)-anti-NK1.1 (PK136) (all from BD
Biosciences except Thy1.2); for macrophages: biotinylated-anti-H-2Kb (AF6-88.5), -I-Ab
(AF6-120.1), -CD40 (3/23) and -mouse (BALB/c) IgG2a,κ (G155-178; BD Biosciences),
FITC-anti-CD1d (1B1) and -rat IgG2b (LODNP57; IMMUNOTECH, Marseille, France), and
PE-anti-Mac-1 (CL8941; Cedarlane, Hornby, Ontario, Canada). Streptavidin-APC (BD
Biosciences) was used for detection of biotinylated mAb. Mouse CD1d/α-GalCer tetramers were
prepared as previously described.40 Cells were incubated with FITC-anti-TCRβ and PE-anti-NK1.1,
and then with APC-α-GalCer-loaded CD1d-tetramers. Propidium iodide (Sigma) positive cells were
electronically gated out from the analysis and stained cells were analyzed with a FACSCaliburTM
flow cytometer as described elsewhere.38
In vitro culture of splenocytes from AD- or chow-fed WT mice treated with α-GalCer
Splenocytes were obtained from either AD- or chow-fed WT mice 2 to 12 hours after intravenous
injection with 0.1 µg/gBW α-GalCer. Cells were suspended in RPMI-1640 supplemented with 10%
fetal calf serum, 100 U/ml penicillin, 100 µg/ml streptomycin and 5 x 10⁻⁵ M 2-mercaptoethanol

10
(culture medium) and cultured in 24-well plates at 5 x 10⁶/ml for 1.5 hours without additional
stimulation. Culture supernatants were harvested and quantitated for IL-4 levels with ELISA kits
(Biosource) and for IFN-γ and IL-10 with Cytometric Bead Array kits (BD Biosciences) by flow
cytometry, according to the manufacturer’s instructions.
Response of HMNCs to oxidized low-density lipoproteins (OxLDL) in vitro
Peritoneal cells were harvested from young WT or CD1d-/- mice 4 days after i.p. injection of 4.05%
thioglycolate. The cells were suspended at a concentration of 2 x 10⁶/ml in culture medium,
incubated at 37°C for 24-48 hours with LDL, OxLDL (10 and 50 µg/ml; Biomedical Technologies,
Stoughton, Massachusetts) or vehicle alone, and used for flow cytometric analysis. For cytokine
analysis, the peritoneal cells (2 x 10⁵/well) were cultured in 96-well plates at 37°C for 2 hours and
washed to remove non-adherent cells. The adherent cells were incubated at 37°C for 48 hours with
lipoproteins described above. After incubation, each well was washed 3 times and the adherent
macrophages were irradiated with 30 Gy of X-rays. HMNCs isolated from WT mice (2 x 10⁵/well)
were cultured with these macrophages in the presence of recombinant human IL-2 (1000 U/ml;
Takeda Chemical Industries, Osaka, Japan) for 24 hours. The supernatant was quantitated for IFN-γ
and IL-4 levels with ELISA kits (Biosource).
Statistical Analysis
Results were expressed as means ± SE. Statistical analysis was performed by either Student’s t test
or the Mann-Whitney rank sum test. All data analyses were performed using Statview software
(Abacus Concept, Berkeley, California). Values with P < .05 were considered to be statistically
significant.

11
Results
Development of atherosclerotic lesions in CD1d-/- mice
WT (n = 20) and CD1d-/- (n = 18) mice were fed on the AD for 20 weeks. All mice on the AD
appeared to be generally in good health throughout the study except for the development of
diet-induced liver steatosis and its consequential liver damage. When the sizes of atherosclerotic
lesions in aortae were compared, the lesions in CD1d-/- mice were smaller than those in WT mice
(Figure 1A). The mean lesion areas in CD1d-/- mice (2,292 ± 397 µm2) were significantly smaller as
compared with those in WT mice (5,627 ± 580 µm2) (P = .014) (Figure 1B). These findings
demonstrate that CD1d deficiency results in a reduction of atherosclerotic lesion areas. Concerning
serum lipid profiles, total-cholesterol, HDL cholesterol and triglyceride levels were not significantly
different between WT (137.9 ± 8.0 mg/dl, 36.3 ± 1.6 mg/dl and 57.5 ± 3.4 mg/dl, respectively) and
CD1d-/- (140.2 ± 14.7 mg/dl, 38.1 ± 2.4 mg/dl and 59.9 ± 4.4 mg/dl, respectively) mice.
Histological findings of liver sections stained with Hematoxylin-Eosin revealed typical steatosis to
a similar extent in WT and CD1d-/- mice fed on the AD (data not shown). Serum
alanine-aminotransferase and total bilirubin levels in WT and CD1d-/- mice also fell within similar
levels (WT: 111.3 ± 6.9 U/l, 0.6 ± 0.1 mg/dl; CD1d-/-: 108.2 ± 14.5 U/l, 0.6 ± 0.1 mg/dl,
respectively).
Flow cytometric analyses of NKT cells
Using flow cytometry we analyzed NKT cells in the liver, spleen and peripheral blood of WT mice
fed either the chow diet or the AD. NK1.1+TCRβint (i.e., NKT) cells represented 18.1 ± 2.6% of the
HMNC of WT mice on the chow diet (Figure 1C, top panel). Among NK1.1+TCRβint cells, 84.2 ±
4.1% stained with α-GalCer-loaded CD1d tetramers. It should be noted that the mean proportion of

12
total NK1.1+TCRβint cells in HMNC of AD-fed WT mice (8.7 ± 2.3%) was significantly lower than
that in chow-fed WT mice (P = .009). This was attributed to the considerable reduction of
CD1d/α-GalCer tetramer+ cells in AD-fed mice. The proportion of CD1d/α-GalCer tetramer- cells
remained unaltered among chow- and AD-fed animals. Similarly, a mild reduction in the prevalence
of tetramer+ NKT cells among splenocytes of AD-fed mice was noted (Figure 1C, bottom panel, P
=.07), but the proportion of total NK1.1+TCRβint cells was unchanged. In CD1d-/- mice, the
proportion of NK1.1+TCRβint HMNC was markedly smaller than that in WT mice, and tetramer+
cells were not detected. Of note, the proportion of NK1.1+TCRβint cells in CD1d-/- mice was
unaffected by AD-feeding (1.5 ± 0.3% on the chow diet vs 1.9 ± 0.4% on the AD). Similar results
were obtained with splenocytes of CD1d-/- mice. No significant changes were seen in conventional
T cell subsets (CD4+, CD8+), γδ-T cells, and NK cells by AD-feeding in both WT and CD1d-/- mice
(data not shown).
Production of cytokines by splenocytes from AD- or chow-fed WT mice treated with
α-GalCer
Our results indicate that AD-feeding quantitatively and qualitatively alters the Vα14 NKT cell
population of WT mice. One hallmark of NKT cells is their capacity to rapidly produce cytokines
upon TCR engagement.22,41 To examine whether AD feeding influences the functional status of
NKT cells, we administered a synthetic glycolipid, α-GalCer, to AD- or chow-fed WT mice and 2
or 12 hours later we measured the amounts of IFN-γ, IL-4 and IL-10 produced by splenocytes in
vitro. At 2 hours after α-GalCer injection, IFN-γ levels were significantly higher in AD-fed WT
splenocytes than in chow-fed WT splenocytes (P = .034) (Figure 2). In contrast, IL-4 and IL-10
levels were significantly lower in AD-fed WT splenocytes than in chow-fed WT splenocytes (P
= .021, P = .047, respectively). At 12 hours, IFN-γ levels were slightly higher in AD-fed WT

13
splenocytes (P = .094), amounts of IL-4 decreased to undetectable levels in both groups, and IL-10
levels were still significantly lower in AD-fed WT splenocytes (P = .009). Experiments using
HMNC from AD- and chow-fed WT mice showed similar results (data not shown). Since NKT cells
(in particular CD1d/α-GalCer tetramer+ NKT cells) were decreased in AD-fed WT mice (Figure
1C), these findings indicate that NKT cells in AD-fed WT mice exhibit enhanced capacity to
produce cytokines, in particular IFN-γ. It should be noted that AD feeding of WT mice shifted the
cytokine production pattern in response to α-GalCer stimulation towards a Th1 profile. Importantly,
it has been reported that Th1 responses are pro-atherogenic.10-14
Development of atherosclerosis in Ldlr-/- mice reconstituted with BM cells from CD1d-/- or
WT mice.
Next, to examine whether NKT cell deficiency is directly related to the reduction of atherosclerotic
lesions, [WT -> Ldlr-/-] and [CD1d-/- -> Ldlr-/-] BM chimeric mice (n=7 in each group) were
prepared. Four weeks after BMT, almost all thymocytes from [CD1d-/- -> Ldlr-/-] chimeras used in
these experiments were CD1d- and thus of donor origin(Figure 3A). In addition, thymocytes from
[WT -> Ldlr-/-] chimeras were mostly Thy1.1+ (donor) (donor chimerism = 99.0 ± 0.81 %). AD
feeding for 5 weeks led to similar levels of hypercholesterolemia in both groups (total cholesterol or
HDL-cholesterol: [WT -> Ldlr-/-]: 2147 ± 144 mg/dl or 15.0 ± 3.5 mg/dl; [CD1d-/- -> Ldlr-/-]: 2207
± 119 mg/dl or 15.9 ± 1.6 mg/dl, respectively). However, the atherosclerotic lesions in [CD1d-/- ->
Ldlr-/-] mice were significantly smaller than those in [WT -> Ldlr-/-] mice (Figure 3C and 3D).
Immunohistochemistry revealed that the main components of the lesions were MOMA-2+
macrophages in both groups (Figure 3E upper). Notably, CD3+ cells were significantly more
abundant in [WT -> Ldlr-/-] mice than in [CD1d-/- -> Ldlr-/-] mice (Figure 3E middle and 3F, P
= .006) and IFN-γ positive cells, probably lymphocytes, were detected at more significant numbers

14
in [WT -> Ldlr-/-] chimeras compared to [CD1d-/- -> Ldlr-/-] chimeras (Figure 3E lower). There were
no overt differences in the staining patterns of α-smooth muscle actin and IL-10 between these two
groups (data not shown). Mice reconstituted with syngeneic BMT ([Ldlr-/- -> Ldlr-/-]) showed the
same atherosclerotic lesions as those in [WT -> Ldlr-/-] mice (data not shown).
Effects of NKT cell activation on the development of early atherosclerotic lesions in apoE-/-
mice
To examine influences of NKT cell activation on the development of atherosclerosis, we
administered α-GalCer or OCH to apoE-/- mice. ApoE-/- mice spontaneously develop severe
atherosclerosis early in life.8, 9, 35 It has been reported that α-GalCer and OCH activate NKT cells
with differential patterns of cytokine production.33
In an early-phase study, apoE-/- mice were i.p. injected 3 times with either 0.1 µg/gBW
α-GalCer, 0.3 µg/gBW OCH, or the respective vehicle at 8, 10 and 12 weeks of age. At 13 weeks of
age the mice were sacrificed and examined for atherosclerotic lesions. No significant differences in
the physiological status and serum lipid profiles were observed between experimental and control
groups (α-GalCer or OCH vs their vehicle; data not shown). α-GalCer administration increased
atherosclerotic lesion areas of apoE-/- mice as compared to the vehicle control group (34,705 ±
5,908 µm2 vs 20,895 ± 2,155 µm2; P = .039) (Figure 4A, 4B). Major components of the
atherosclerotic lesions in α-GalCer-treated mice included MOMA-2+ macrophages (Figure 4C).
OCH administration also increased atherosclerotic lesion areas compared to the control (28,519 ±
2,822 µm2 vs 19,863 ± 1,813 µm2; P = .048) (Figure 4D). The lesion areas in the OCH-treated
group, however, were relatively smaller than those in the α-GalCer-treated group. To determine a
potential mechanism for the differences observed between the α-GalCer- and OCH-treated mice we
evaluated the sequential pattern of IFN-γ and IL-4 production in the serum after glycolipid injection.

15
Both glycolipids induced robust cytokine production; however, while IL-4 production was similar,
α-GalCer induced more IFN-γ than OCH, which is consistent with prior reports (Figure 4E).33
Effects of long-term administration of α-GalCer on advanced atherosclerotic lesions in
apoE-/- mice
In a late-phase study, we analyzed the lesions in 19-week-old apoE-/- mice that had received 11 i.p.
injections of either α-GalCer or its vehicle. Again, no significant differences were observed in the
physiological status and serum lipid profiles between α-GalCer- and vehicle-treated mice (data not
shown). The mean lesion areas in the aortic sinus were slightly larger in the α-GalCer group than in
the control group (197,448 ± 18,259 µm2 vs 160,703 ± 16,320 µm2) (Figure 5A). In addition,
assessment of lesion areas by the en-face method showed slightly enlarged lesion areas in the
α-GalCer group (5.8 ± 1.0%) compared to the control group (4.7 ± 0.9%) (Figure 5B). These results
suggest that activation of NKT cells exerts only slight influences on the development of advanced
atherosclerotic lesions in apoE-/- mice. These findings are consistent with a previous report
suggesting that lymphocytes are mostly involved in the early phase of atherogenesis.6
Figure 5C shows representative histological analyses of the atherosclerotic lesions of
α-GalCer- and vehicle-treated animals. Of note, the collagen content stained with Elastica-Masson
was smaller in the α-GalCer-treated group than in the control group. When mean collagen content
was compared between these two groups, the collagen content in the α-GalCer-treated group was
significantly smaller than in the control group (7.3 ± 1.1% and 14.9 ± 2.4%, respectively; P = .040)
(Figure 5D). However, the total cell number within the lesion per slice was significantly larger in
the α-GalCer-treated group than in the control group (Figure 5E, P = .009). These findings suggest
that NKT cell activation in the late phase of atherosclerosis alters the quality of the lesion from
collagen-rich to one that is characterized by high cellularity.

16
Vα14Jα18 TCR-α mRNA expression in atherosclerotic lesions of apoE-/- and AD-fed WT
mice
Next, we examined atherosclerotic lesions by nested RT-PCR for detection of the invariant
Vα14Jα18 TCR-α rearrangement that is characteristic of classical NKT cells. We were able to
amplify the Vα14Jα18 rearrangement in the atherosclerotic tissues of apoE-/- mice and of WT mice
on the AD (Figure 6), but we were unable to detect this rearrangement in the aortae of WT mice on
the chow diet. Although we were unable to quantify numbers of NKT cells in the lesion, our results
clearly demonstrate that the presence of Vα14Jα18-positive cells is restricted to the atherosclerotic
lesions.
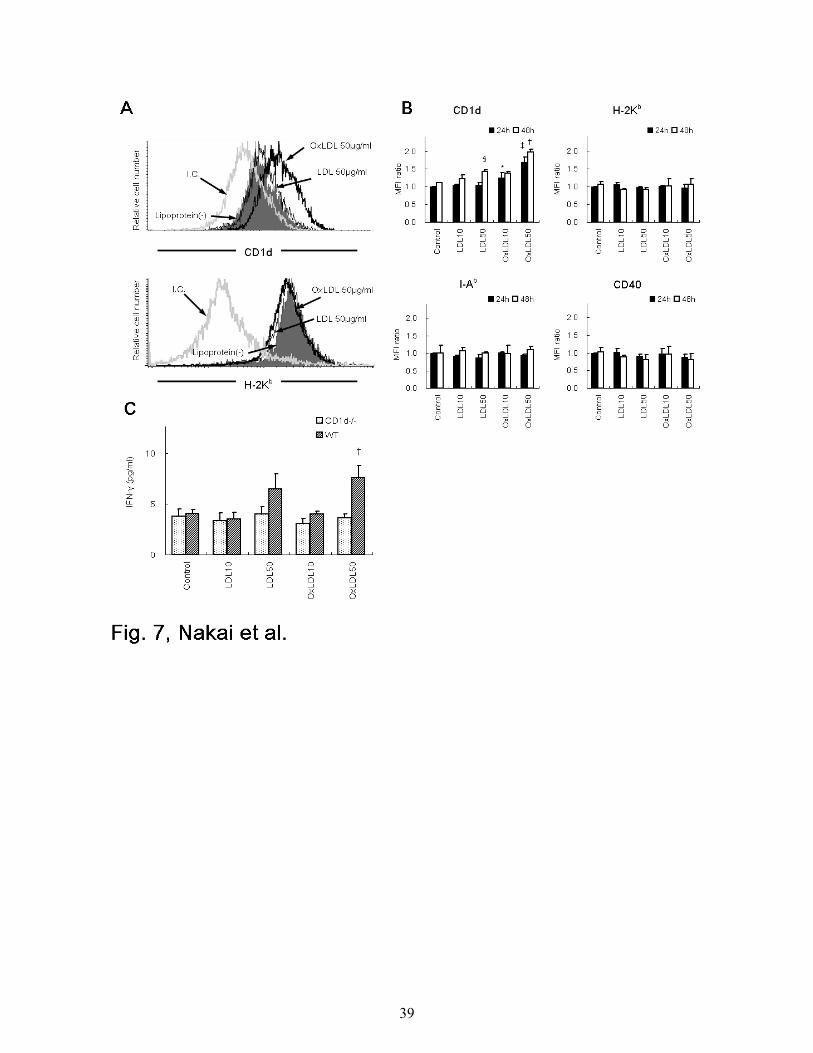
CD1d expression and IFN-γ production by WT peritoneal macrophages treated with LDL
or OxLDL
Classical NKT cells recognize glycolipid antigens in the context of CD1d.19,21,24-26,32,33 To
investigate the mechanism by which NKT cells are activated and promote atherogenesis, peritoneal
exudate macrophages were harvested from WT mice, treated with LDL, OxLDL or medium alone
for 24 or 48 hours, and examined for expression of several surface molecules. The expression of
CD1d on WT macrophages was enhanced by incubation with OxLDL for 24 hours, but not with
LDL or medium alone (Figure 7A, top). No increase in the expression of MHC class I (H-2Kb)
molecules was induced on macrophages by OxLDL (Figure 7A, bottom). In addition, CD1d
expression was specifically enhanced by OxLDL, in a dose-dependent manner (Figure 7B). No
enhancement of H-2Kb, I-Ab and CD40 expression was seen by treatment with LDL or OxLDL.
When cultured for a longer time (48 hrs) with OxLDL, CD1d expression was further augmented
(Figure 7B). Of note, at a high dose (50 µg/ml) and after a long incubation period (48 hours), LDL

17
enhanced CD1d levels on macrophages (Figure 7B).
We then examined whether the enhanced expression of CD1d on OxLDL-treated macrophages
related to their capacity to stimulate NKT cells. We mixed HMNCs isolated from WT mice
(containing 15 - 30% NKT cells) with irradiated peritoneal macrophages from either WT or CD1d-/-
mice treated with LDL or OxLDL for 48 hours. After culture for 24 hours, IFN-γ and IL-4 levels in
the supernatants were quantitated. NKT cells produced significantly higher amounts of IFN-γ in the
cultures with OxLDL (50 µg/ml)-treated peritoneal exudate cells from WT mice compared to
control cultures (Figure 7C). CD1d-/- macrophages treated in the same manner induced no
enhancement of IFN-γ production. No IL-4 was detected in the supernatant in our culture conditions
(data not shown).
18
Discussion
In this study we demonstrate, using three atherosclerosis models (apoE+/+ mice fed with AD, Ldlr-/-
chimeras fed with AD, and apoE-/- mice fed with normal chow), that NKT cells play a significant
role in the development of atherosclerosis. In addition, we show that NKT cell activation modulates
the disease process.
The atherosclerotic lesion areas in AD-fed CD1d-/- mice were significantly smaller than those
in AD-fed WT mice (Figure 1B). Since the development of invariant NKT cells is markedly
hampered in CD1d-/- mice,30 our findings suggest that NKT cell-deficiency is related to the
amelioration of atherosclerosis. It has been reported that AD induces inflammatory cytokines in the
liver due to its high concentration of cholesterol and cholic acid42, and may alter the physiological
conditions. In the present study, WT and CD1d-/- mice were subjected to AD-feeding in an identical
manner. These two groups of mice showed comparable degrees of liver steatosis and similar levels
of serum alanine-aminotransferase and total bilirubin. Thus, we conclude that the significant
differences in the atherosclerotic lesions between WT and CD1d-/- groups of mice are directly
related to the presence and absence, respectively, of the intact CD1d-restricted T cell population.
The prevalence of NKT cells (mainly the CD1d/α-GalCer tetramer+ fraction) among HMNCs
of WT mice substantially decreased by feeding the AD. A slight reduction of NKT cells was also
observed in splenocytes of the AD-fed WT mice (Figure 1C). One characteristic of NKT cells is the
prominent production of cytokines, IFN-γ and IL-4, shortly after stimulation of these cells via the
TCR.22,41 We found that, despite their decreased NKT cell numbers, upon stimulation with
α-GalCer, spleen cells from AD-fed WT mice produced levels of IFN-γ, IL-4 and IL-10 comparable
to those from chow-fed WT mice. Of note, the cytokine production pattern of spleen cell cultures of
AD-fed WT mice shifted towards a Th1 profile, especially 2 hours after α-GalCer stimulation

19
(Figure 2). This pattern of cytokine production would be expected to promote atherosclerosis.10-14
However, the mechanism underlying this altered cytokine production pattern, with the concomitant
decrease of NKT cells, remains elusive. One possibility is that the decrease of NKT cells in AD-fed
WT mice is due to a depletion of this population by activation-induced cell death (AICD). This may
be mediated by the CD1d-restricted presentation of lipid antigens such as OxLDL that accumulate
during hyperlipidemia. An alternative explanation would be that chronic stimulation of the NKT
cell population results in the continuous down-modulation of NK1.1 and TCR marker expression,
resulting in the apparent loss of these cells.43 Furthermore, the decreased population of NKT cells
might be attributed to migration of these cells from liver or spleen to other peripheral tissues such
as the atherosclerotic lesion. In this context, we were able to detect mRNA corresponding to the
invariant Vα14Jα18 TCR, which is characteristic of NKT cells and prerequisite for α-GalCer
stimulation, within atherosclerotic lesions of AD-fed but not chow-fed WT mice by nested RT-PCR
(Figure 6). The mechanisms that lead to NKT cell loss during AD-feeding will be further addressed
in future studies.
To examine the role of NKT cells in a more advanced atherosclerosis model, we reconstituted
lethally irradiated Ldlr-/- mice with BM cells from CD1d-/- or WT mice. It has been reported that
lack of LDL receptors aggravates the development of atherosclerosis in AD-fed mice. Indeed, using
[WT -> Ldlr-/-] chimeras, Boisvert et al44 reported that AD fed chimeras showed severe
atherosclerotic lesions where donor-derived leukocytes were present. In the present study, we
observed that significantly large atherosclerotic lesions developed in [WT -> Ldlr-/-] chimeras
compared to those in [CD1d-/- -> Ldlr-/-] chimeras (Figure 3). These findings demonstrate that NKT
cell deficiency indeed ameliorates atherosclerosis in AD-fed animals. Immunohistochemistry in this
BMT model demonstrated that the number of CD3+ cells within the lesion was significantly larger
in [WT -> Ldlr-/-] than that in [CD1d-/- -> Ldlr-/-] mice. These findings suggest that these CD3+ cells

20
contain NKT cells. Furthermore, we demonstrated NKT cell (Vα14Jα18) messages in lesions of
other animal models by RT-PCR (Figure 6). However, thus far immunohistochemical identification
of NKT cells in the lesion has been unsuccessful and will be pursued in future studies.
Complementary to the above results, we showed that activation of NKT cells by α-GalCer or
OCH in apoE-/- mice, before significant lesions had been formed (early phase study), resulted in an
increase of atherosclerotic lesion areas (Figure 4). Results with OCH were unexpected to us,
because it was reported that OCH favors a Th2 shift of NKT cells33. It has been suggested that a
Th2 bias suppresses atherogenesis.10,11 Consistent with prior reports33, we found that a single
injection of α-GalCer induced prominent production of IFN-γ and IL-4, whereas OCH induced little
IFN-γ but similar levels of IL-4 (Figure 4E). However, after multiple administrations, IFN-γ
induction in response to α-GalCer became reduced to levels similar to OCH. In contrast, repeated
injection of these glycoplipids did not alter IL-4 induction. Although a number of studies support
the idea that the Th1 cytokine, IFN-γ, is pro-atherogenic, the precise role of the Th2 cytokine, IL-4,
in atherogenesis remains elusive.45 Our finding that both α-GalCer and OCH exacerbate
atherosclerosis during the early stage of the disease process, but to a different degree (Figure 4A
and D), may be attributed to differences in the amounts and kinetics of IFN-γ and IL-4 production.
We found that peritoneal exudate macrophages expressed augmented levels of CD1d after culture
with OxLDL (either 10 µg/ml or 50 µg/ml) or LDL (50 µg/ml) (Figure 7A, B). Although intact LDL
is not captured by macrophages, it is plausible that LDL is degraded by peroxidases released from
macrophages during the incubation period and involved in the enhancement of CD1d expression.
Furthermore, these macrophages with high CD1d expression stimulated NKT cells to produce low
but significant levels of IFN-γ in vitro (Figure 7C). Thus, the enhancement of CD1d expression on
OxLDL-pulsed macrophages appeared to result in their augmented capacity to induce IFN-γ
production by HMNCs. This finding may be of importance, because physiologically degraded lipids

21
are abundantly present in the atherosclerotic lesions, and may provide a source of physiological
ligands for NKT cells.
In the late phase study to evaluate the effects of α-GalCer on atherosclerosis in apoE-/- mice,
α-GalCer administration failed to induce an enlargement of the lesion size, but instead decreased
the collagen content (Figure 5C, D) and increased total cell numbers (Figure 5E) within the
atherosclerotic lesions. It has been reported that IFN-γ decreases collagen synthesis13 and plays a
role in plaque stability. Accordingly, it is possible that IFN-γ, which is produced upon α-GalCer
stimulation, decreases collagen synthesis. Thus, NKT cell activation at the late phase may alter the
lesion structure from a stable to an unstable state.
Ostos et al29 demonstrated that LPS-treated apoE-/- mice have increased atherosclerotic lesion
sizes compared to PBS-treated control apoE-/- mice. In atherosclerotic lesions of these LPS-treated
mice increased numbers of IL-4-producing NK1.1+ cells were detected by immunohistochemistry.
In our present study, the invariant Vα14Jα18 TCR was detected in aortic specimens with
atherosclerotic lesions of either AD-fed WT or apoE-/- mice (Figure 6). These findings again favor
the idea that NKT cells play a pro-atherogenic role in situ. However, it is also possible that NKT
cells are activated in other tissues, such as the liver or spleen, and systemically affect the
atherogenic process. Thus, the precise location where NKT cells are activated and demonstrate their
effector functions during progression of atherosclerosis remains to be elucidated. Although Th1
and Th2 cytokines are probably important, other factors such as chemokines and the capacity of
NKT cells to exhibit cytotoxicity should be considered in further investigations.23,34
In summary, we have demonstrated that NKT cells accelerate atherogenesis in mouse models
for this disease. In addition, we show that NKT cell activation in the early phase of the disease
process exacerbates atherogenesis, and that NKT cell activation in the late phase of the disease
promotes plaque instability. Because NKT cells and CD1d molecules are highly conserved among

22
different species,46 our present results may be applicable to elucidation of the pathophysiology of
atherosclerosis in human and offer a novel approach for controlling the atherogenic process by
intervening with certain NKT cell functions.

23
Acknowledgements
We are grateful to Kirin Brewery Company and Takeda Chemical Industries for providing α-GalCer
and recombinant human IL-2, respectively. We also thank Ms Keiko Kato and Ms Mizuho Kasai for
technical assistance.

24
References
1. Ross R. Atherosclerosis - an inflammatory disease. N Engl J Med. 1999; 340: 115-126.
2. Binder CJ, Horkko S, Dewan A, et al. Innate and acquired immunity in atherogenesis. Nat Med.
2002; 8: 1218-1226.
3. Hansson GK, Libby P, Shoebeck U, Yan ZQ. Innate and adaptive immunity in the pathogenesis
of atherosclerosis. Circ Res. 2002; 91: 281-291.
4. Jonasson L, Holm J, Skalli O, Bondjers G., Hansson GK. Regional accumulations of T cells
macrophages, and smooth muscle cells in the human atherosclerotic plaque. Arteriosclerosis.
1986; 6: 131-138.
5. Roselaar SE, Kakkanathu PX, Daugherty A. Lymphocyte populations in atherosclerotic lesions
of apoE-/- and LDL receptor-/- mice: decreasing density with disease progression. Arterioscler
Thromb Vasc Biol. 1996; 16: 1013-1018.
6. Song L, Leung C, Schindler C. Lymphocytes are important in early atherosclerosis. J Clin
Invest. 2001; 108: 251-259.
7. Dansky HM, Charlton SA, Harper MM, Smith JD. T and B lymphocytes play a minor role in
atherosclerotic plaque formation in the apolipoprotein E-deficient mouse. Proc Natl Acad Sci U
S A. 1997; 94: 4642-4646.
8. Reardon CA, Blachowicz L, White T, et al. Effect of immune deficiency on lipoproteins and
atherosclerosis in male apolipoprotein E-deficient mice. Arterioscler Thromb Vasc Biol. 2001;
21: 1011-1016.
9. Zhou X, Nicoletti A, Elhage R, Hansson GK. Transfer of CD4+ T cells aggravates
atherosclerosis in immunodeficient apolipoprotein E knockout mice. Circulation. 2000; 102:
2919-2922.

25
10. Huber SA, Sakkinen P, David C, Newell MK, Tracy RP. T-helper-cell phenotype regulates
atherosclerosis in mice under conditions of mild hypercholesterolemia. Circulation. 2001; 103:
2610-2616.
11. Laurat E, Poirier B, Tupin E, et al. In vivo downregulation of T helper cell 1 immune responses
reduces atherogenesis in apolipoprotein E-knockout mice. Circulation. 2001; 104: 197-202.
12. Gupta S, Pablo AM, Jiang X, Wang N, Tall AR, Schindler C. IFN-γ potentiates atherosclerosis
in apoE knock-out mice. J Clin Invest. 1997; 99: 2752-2761.
13. Whitman SC, Ravisankar P, Elam H, Daugherty A. Exogenous interferon-γ enhances
atherosclerosis in apolipoprotein E-/- mice. Am J Pathol. 2000; 157: 1819-1824.
14. Tellides G, Tereb DA, Kirkiles-Smith NC, et al. Interferon-γ elicits arteriosclerosis in the
absence of leukocytes. Nature. 2000; 403: 207-211.
15. Lee TS, Yen HC, Pan CC, Chau LY. The role of interleukin-12 in the development of
atherosclerosis in apoE-deficient mice. Arterioscler Thromb Vasc Biol. 1999; 19: 734-742.
16. Pinderski LJ, Fischbein MP, Subbanagounder G, et al. Overexpression of interleukin-10 by
activated T lymphocytes inhibits atherosclerosis in LDL receptor-deficient mice by altering
lymphocyte and macrophage phenotypes. Circ Rec. 2001; 89: 930-934.
17. Caligiuri G, Nicoletti A, Poirier B, Hansson GK. Protective immunity carried by B cells of
hypercholesterolemic mice. J Clin Invest. 2002; 109: 745-753.
18. Major AS, Fazio S, Linton MF. B-lymphocyte deficiency increases atherosclerosis in LDL
receptor-null mice. Arterioscler Thromb Vasc Biol. 2002; 22: 1892-1898.
19. Godfrey DI, Hammond KJ, Poulton LD, Smyth MJ, Baxter AG. NKT cells: fact, functions and
fallacies. Immunol Today. 2000; 21: 573-583.
20. Wilson MT, Singh AK, Van Kaer L. Immunotherapy with ligands of natural killer T cells.
Trends Mol Med. 2002; 8: 225-231.

26
21. Arase H, Arase N, Ogasawara K, Good RA, Onoé K. An NK1.1+ CD4+8- single-positive
thymocyte subpopulation that expresses a highly skewed T-cell antigen receptor Vβ family.
Proc Natl Acad Sci U S A. 1992; 89: 6506-6510.
22. Arase H, Arase N, Nakagawa K, Good RA, Onoé K. NK1.1+ CD4+8- thymocytes with specific
lymphokine secretion. Eur J Immunol. 1993; 23: 307-310.
23. Arase H, Arase N, Kobayashi Y, et al. Cytotoxicity of fresh NK1.1+ T cell receptor αβ+
thymocytes against a CD4+8+ thymocyte population associated with intact Fas expression on
the target. J Exp Med. 1994; 180: 423-432.
24. Singh N, Hong S, Scherer DC, et al. Activation of NK T cells by CD1d and
α-galactosylceramide directs conventional T cells to the acquisition of a Th2 phenotype. J
Immunol. 1999; 163: 2373-2377.
25. Burdin N, Brossay L, Kronenberg M. Immunization with α-galactosylceramide polarizes
CD1-reactive NK T cells towards Th2 cytokine synthesis. Eur J Immunol. 1999; 29:
2014-2025.
26. Cui J, Watanabe N, Kawano T, et al. Inhibition of T helper cell type 2 cell differentiation and
immunoglobulin E response by ligand-activated Vα14 natural killer T cells. J Exp Med. 1999;
190: 783-792.
27. Melian A, Geng YJ, Sukhove GK, Libby P, Porcelli SA. CD1 expression in human
atherosclerosis. A potential mechanism for T cell activation by foam cells. Am J Pathol. 1999;
155: 775-786.
28. Ishibashi S, Brown MS, Goldstein JL, et al. Hypercholesterolemia in low density lipoprotein
receptor knockout mice and its reversal by adenovirus-mediated gene delivery. J Clin Invest.
1993; 92: 883-893.
29. Ostos MA, Recalde D, Zakin MM, Scott-Algara D. Implication of natural killer T cells in

27
atherosclerosis development during a LPS-induced chronic inflammation. FEBS Lett. 2002;
519: 23-29.
30. Mendiratta SK, Martin WD, Hong S, Boesteanu A, Joyce S, Van Kaer L. CD1d1 mutant mice
are deficient in natural T cells that promptly produce IL-4. Immunity. 1997; 6: 469-477.
31. Piedrahita JA, Zhang SH, Hagaman JR, Oliver PM, Maeda N. Generation of mice carrying a
mutant apolipoprotein E gene inactivated by gene targeting in embryonic stem cells. Proc Natl
Acad Sci U S A. 1992; 89: 4471-4475.
32. Kawano T, Cui J, Koezuka Y, et al. CD1d-restricted and TCR-mediated activation of Vα14
NKT cells by glycosylceramides. Science. 1997; 278: 1626-1629.
33. Miyamoto K, Miyake S, Yamamura T. A synthetic glycolipid prevents autoimmune
encephalomyelitis by inducing TH2 bias of natural killer T cells. Nature. 2001; 413: 531-534.
34. Cui J, Shin T, Kawano T, et al. Requirement for Vα14 NKT cells in IL-12-mediated rejection
of tumors. Science. 1997; 278: 1623-1626.
35. Ishimori N, Iwabuchi K, Fujii S, et al. Mixed allogenic chimerism with wild-type strains
ameliorates atherosclerosis in apolipoprotein E-deficient mice. J Leukoc Biol. 2001; 69:
732-740.
36. Paigen B, Morrow A, Holmes PA, Mitchell D, Williams RA. Quantitative assessment of
atherosclerotic lesions in mice. Atherosclerosis. 1987; 68: 231-240.
37. Ato M, Iwabuchi K, Shimada S, Mukaida N, Onoé K. Augmented expression of tumor necrosis
factor-α induced by lipopolysaccharide in spleen of human monocyte chemoattractant
protein-1 transgenic mouse enhances the lipopolysaccharide sensitivity of the marginal zone
macrophages. Immunology. 2002; 106: 554-563.
38. Iwabuchi K, Iwabuchi C, Tone S, et al. Defective development of NK1.1+ T-cell antigen
receptor α/β+ cells in zeta-associated protein 70 null mice with an accumulation of NK1.1+

28
CD3- NK-like cells in the thymus. Blood. 2001; 97: 1765-1775.
39. Watanabe H, Ohtsuka K, Kimura M, et al. Details of an isolation method for hepatic
mononuclear cells in mice. J Immunol Methods. 1992; 146: 145-154.
40. Stanic AK, De Silva AD, Park JJ, et al. Defective presentation of the CD1d1-restricted natural
Vα14Jα18 NKT lymphocyte antigen caused by β-D-glucosylceramide synthase deficiency.
Proc Natl Acad Sci U S A. 2003; 100: 1849-1854.
41. Yoshimoto T, Bendelac A, Hu-Li J, Paul WE. Defective IgE production by SJL mice is linked
to the absence of CD4+, NK1.1+ T cells that promptly produce interleukin 4. Proc Natl Acad Sci
U S A. 1995; 92: 11931-11934.
42. Berliner JA, Navab M, Fogelman AM, et al. Atherosclerosis, basic mechanisms: oxidation,
inflammation, nad genetics. Circulation. 1995; 91: 2488-2496.
43. Wilson MT, Johansson C, Olivares-Villagomez D, et al. The response of natural killer T cells to
glycolipid antigens is characterized by surface receptor down-modulation and expansion. Proc
Natl Acad Sci U S A. 2003; 100: 10913-10918.
44. Boisvert WA, Spangenberg J, Curtiss LK. Role of leukocyte-specific LDL receptors on plasma
lipoprotein cholesterol and atherosclerosis in mice. Arterioscler Thromb Vasc Biol. 1997; 17:
340-347.
45. King VL, Szilvassy SJ, Daugherty A. Interleukin-4 deficiency decreases atherosclerotic lesion
formation in a site-specific manner in female LDL receptor-/- mice. Arterioscler Thromb Vasc
Biol. 2002; 22: 456-461.
46. Brossay L, Chioda M, Burdin N, et al. CD1d-mediated recognition of an α-glycosylceramide
by natural killer T cells is highly conserved through mammalian evolution. J Exp Med. 1998;
188: 1521-1528.

29
Figure legends
Figure 1. Atherosclerotic lesion areas in WT and CD1d-/- mice fed on the AD.
(A) Representative histological sections of WT and CD1d-/- mice fed on the AD. Arrows represent
the Oil red O-positive atherosclerotic lesions typically observed within the internal elastic lamina.
(B) Mean lesion areas of WT and CD1d-/- mice. Each symbol represents the lesion area of an
individual mouse. Horizontal bars and numbers represent the mean of all mice within each group
and vertical bars represent SEM. (C) Prevalence of NKT cells in WT and CD1d-/- mice. HMNCs
and splenocytes were prepared and stained with FITC-anti-TCRαβ, PE-anti-NK1.1 and
APC-CD1d/α-GalCer tetramer, as described in Materials and Methods. Open columns represent the
proportion of total NKT cells and closed columns represent the proportion of CD1d/α-GalCer
tetramer+ cells. Each value represents the mean ± SE calculated from more than 5 experiments.
Statistical analyses were performed with the Mann-Whitney rank sum test.†P < .01 (for both
closed columns and open columns), *P < .05
Figure 2. Production of cytokines by splenocytes from AD- or chow-fed WT mice treated
with α-GalCer.
Splenocytes were obtained from either AD- or chow-fed WT mice 2 or 12 hours after intravenous
injection with 0.1 µg/gBW α-GalCer. Cells were cultured for 1.5 hours without additional
stimulation. Culture supernatants were harvested and IFN-γ, IL-4 and IL-10 levels were quantitated.
Values are means ± SE. Statistical analyses were performed with the Mann-Whitney rank sum test.
*P < .05, **P < .01
Figure 3. Atherosclerotic lesions in Ldlr-/- mice reconstituted with BM cells from CD1d-/- or

30
WT mice.
(A) Representative CD1d expression pattern on thymocytes from [WT -> Ldlr-/-] and [CD1d-/- ->
Ldlr-/-] mice. Red lines and filled histograms indicate CD1d staining and isotype control,
respectively. (B) Thy1.1 and Thy1.2 expression on thymocytes from [WT -> Ldlr-/-] and [CD1d-/- ->
Ldlr-/-] chimeras. Representative results of Thy1.1 and Thy1.2 stainings are shown in the right
panels with their respective isotype controls (left panels). (C) Representative histological sections
of [WT -> Ldlr-/-] and [CD1d-/- -> Ldlr-/-] mice stained with Oil red O (original magnification, 40 x).
Arrow heads represent Oil red O-positive lesions. (D) Lesion area in [WT -> Ldlr-/-] and [CD1d-/- ->
Ldlr-/-] mice. Each symbol represents the lesion area of an individual mouse. Horizontal bars and
numbers represent the mean of all mice within each group. **P < .01 (E) A representative
immunohistochemical section of [WT -> Ldlr-/-] and [CD1d-/- -> Ldlr-/-] mice. Sections were stained
with anti-MOMA-2, -CD3 and -IFN-γ mAb (original magnification, x 200). Arrow heads represent
respective mAb-positive cells. (F) Numbers of CD3+ cells per cross-section of lesion area. **P
< .01
Figure 4. Effects of α-GalCer and OCH on the early phase of atherosclerosis.
(A) ApoE-/- mice were i.p. injected 3 times with α-GalCer or the vehicle alone as described in
Materials and Methods. Five weeks later, mice were examined for development of atherosclerosis.
Each symbol represents the lesion area of an individual mouse. Horizontal bars and numbers
represent the mean of all mice within each group and vertical bars represent SEM. (B)
Representative histological sections of the α-GalCer group and its control group stained with Oil
red O (original magnification, 40 x). (C) A representative immunohistochemical section of the
α-GalCer group stained with MOMA-2 and a serial section stained with H-E (original
magnification, x 200). (D) ApoE-/- mice were injected with OCH or vehicle. Mean lesion areas

31
(OCH vs vehicle) are indicated as in Figure 4A. (E) Serum concentration of cytokines after
administration of either α-GalCer or OCH. Mean concentrations (n = 3) of IFN-γ (top) and IL-4
(bottom) in α-GalCer ( ) and OCH ( ) groups are shown after the first injection (left), the
second injection (middle) and the third injection (right). Statistical analyses were performed with
the Mann-Whitney rank sum test. *P < .05
Figure 5. Effect of intensive α-GalCer administration on the late phase of atherosclerosis.
ApoE-/- mice were weekly injected with α-GalCer or vehicle for a period of 11 weeks and examined
for atherosclerosis at 19 weeks of age. (A) Mean lesion areas of each group are indicated as in
Figure 4A. (B) Proportions of the Oil red O-positive area to the whole lumen of the entire aorta
were assessed by the en-face method. (C) Representative histology of aortic sections from the
α-GalCer group (top) or the control group (bottom) (Elastica-Masson staining). The collagen
content is stained as blue in the lesion. Note that the blue region (arrow heads) in the
α-GalCer-treated mouse is smaller than that in the control mouse. (D) Morphometric analysis of
collagen contents of the atherosclerotic lesion. Mean lesion areas staining blue were quantitated
with 3 aortic cross-sections per animal from a total of 10 animals. Statistical analyses were
performed with the Mann-Whitney rank sum test. *P < .05 (E) Total cell numbers per cross-section
of lesion area. Values are means ± SE. **P < .01
Figure 6. Vα14Jα18 mRNA in the atherosclerotic lesions.
Expression of Vα14Jα18 mRNA in the atherosclerotic lesion was examined with RT-PCR. A
sample from WT spleen was used as a positive control, and a sample from Jα18-/- spleen was used
as a negative control. Note that Vα14Jα18 expression is detected only in the atherosclerotic tissues
of apoE-/- mice (on the chow diet) and WT mice on the AD. A representative result from three

32
separate experiments is shown.
Figure 7. CD1d expression and IFN-γ production by WT peritoneal macrophages treated
with LDL or OxLDL.
WT peritoneal macrophages were treated with LDL or OxLDL or without additional lipoproteins
(control) for 24 hours. (A) Representative histograms of CD1d or H-2Kb expression on the
macrophages. I.C. represents each isotype control for either anti-CD1d or anti-H-2Kb mAb. Cells
with PIlow and Mac-1high phenotype were gated for analysis. (B) Mean fluorescence intensity (MFI)
for CD1d, H-2Kb, I-Ab or CD40 staining on WT peritoneal macrophages treated with either LDL or
OxLDL (10, 50 µg/ml). Each column represents a ratio of MFI of a respective surface molecule to
controls at either 24 hours (closed columns) or 48 hours (open columns). Values are means ± SE of
three independent experiments. * P < .05 vs control (24 h); ‡ P < .01 vs control, LDL10 or LDL50
(24 h); §P < .05 vs control (48 h); †P < .01 vs control, LDL10, LDL50 or OxLDL10 (48 h). (C)
Production of IFN-γ in the supernatant of the mixed culture of HMNCs with CD1d-/- or WT
macrophages. HMNCs were cultured for 24 hours with peritoneal macrophages treated with LDL or
OxLDL from either CD1d-/- or WT mice. Then, IFN-γ levels in the supernatant of the mixed culture
were analyzed by ELISA. Values are means ± SE of three independent experiments. † P < .05 vs
control, LDL10 or OxLDL10 (WT), P < .01 vs OxLDL50 (CD1d-/-).

33

34

35

36

37

38
39


