Embed Size (px)
Citation preview

Working Paper Series

SIBLING COMPOSITION DURING CHILDHOOD AND ADULT BLOOD PRESSURE IN A
NATIVE AMAZONIAN SOCIETY OF BOLIVIA
WU ZENG,1,* EDUARDO A. UNDURRAGA,1 COLLEEN NYBERG,2 DAN T.A.
EISENBERG,3 SABITA PARIDA,1 ARIELA ZYCHERMAN,4 OYUNBILEG MAGVANJAV,1
VICTORIA REYES-GARCÍA,1, 5 SUSAN TANNER,6 BOLIVIAN TAPS STUDY TEAM,7
AND RICARDO GODOY,1
1 Heller School for Social Policy and Management, Brandeis University, Waltham, MA 02454,
USA
2 Department of Anthropology, University of Massachusetts Boston, Boston, MA 02126, USA
3 Department of Anthropology, Northwestern University, Evanston, IL 60208, USA
4 Teachers College, Columbia University, New York, NY 10027
5ICREA and Institut de Ciència i Tecnologia Ambientals, Universitat Autònoma de Barcelona,
08193 Bellatera, Barcelona, Spain
6 Department of Anthropology, University of Georgia, Athens, Georgia 30602
7 Tsimane’ Amazonian Panel Study, Correo Central, San Borja, Beni, Bolivia
* Correspondence to: Wu Zeng, Heller School for Social Policy and Management, Brandeis
University, Waltham, MA 02454-9110.
E-mail: [email protected]
The Cultural and Physical Anthropology Programs of the National Science Foundation (NSF),
Sibling composition and blood pressure
1

USA, provided funding for this research. The funders had no role in the study design, data
collection, analysis, decision to publish, or in the preparation of the manuscript. Dan T. A.
Eisenberg was supported by an NSF Graduate Research Fellowship. The IRB for research with
human subjects of Northwestern University (project number 0007) and the Great Tsimane’
Council approved the study. Before enrollment in the study we obtained oral rather than written
assent from participants because a large share of the studied population is illiterate.
Word count: Abstract 221; Text (excluding abstract, cover page, and acknowledgements) 6,556; 4 tables, 3 figures.
Sibling composition and blood pressure
2

ABSTRACT
Some early life events (e.g., low birth weight) are associated with adult blood pressure, but we
do not know whether these early life events also include sibling composition (number of older
brothers, younger brothers, older sisters, younger sisters). We draw on human capital theory to
test hypotheses about the association between sibling composition among adults (≥16 years of
age) and their systolic and diastolic blood pressure (SBP, DBP) in a native Amazonian society of
forager-farmers in Bolivia (Tsimane’). We collected data in 2007 from 426 adults in all 213
households of 13 villages. Household random-effects multiple regressions were run with SBP or
DBP as outcomes; covariates included the four sibling categories and control variables (e.g.,
sex, age, education). We found that mean SBP and DBP were 115 (SD=14) and 65 (SD=10)
mmHg, higher than other native Amazonian societies. Having an additional older sister had
statistically significant positive effects only on DBP, but the effect size was small (1-1.5%). The
effect was more prominent as people aged. Having an additional younger brother was associated
with higher SBP and DBP among young people. As people aged the effect of having a younger
brother waned. Again the effect size was small (maximum: 2.7-2.9%). Certain types of sibling
bear a statistically significant association with adult blood pressure, but the effect sizes were
biologically insignificant .
Key words: Hypertension, cardiovascular health, systolic, diastolic, Tsimane’ Amazonian Panel
Study (TAPS), sibship size
Sibling composition and blood pressure
3

INTRODUCTION
Research on the developmental origins of health has documented links between
early life events (e.g., low birth weight) and higher adult blood pressure [1-6]. Blood pressure is
an important indicator of adult health because it predicts risks of cardiovascular diseases [7-8],
the leading cause of death in industrializing nations [9]. Among the most important aspects of
early life is sibling composition, defined as the number of older brothers, younger brothers, older
sisters, and younger sister of a person. By being mentors, competitors, role models, and allies,
the type and number of siblings affects the current and future well-being of a person [10-11].
The literature linking (a) adult health with either (b) sibling size or with birth order is
large [11], but the literature linking sibling composition with health is smaller. Lawson and
Mace [12] followed 13,176 British children from birth to 10 years of age and found that an
additional older sibling of either sex depressed the growth rate and height of younger siblings.
Garg and Morduch [13] studied 5,203 children in Ghana and found that an additional sister was
associated with a greater Z score of height-for-age among older siblings. Wang et al. [14]
studied 7,959 junior high-school students in Japan and found that the risk of being overweight
among boys was negatively associated with the number of older sisters, whereas the risk of being
overweight among girls was negatively associated with the number of any siblings. Several
studies [15-20] suggest that having older siblings protects against the risk for allergies and
respiratory infections.
We draw two conclusions from this literature. First, there seems to be a link between
sibling composition and health among children, but we do not know if the links persist into
adulthood. Second, researchers have generally examined how broad categories of siblings (e.g.,
Sibling composition and blood pressure
4

sisters versus brothers; older versus younger siblings) affect health, but they have paid less
attention to the comparative effects of specific sibling categories (e.g., older brothers) on health.
We equate the term sibling size with the total number of siblings, and use it instead of the
synonym sibship size. We shall have more to say about the term sibling composition, but for the
most part we use it to refer to the specific number of older brothers, older sisters, younger
brothers, and younger sisters of a person.
There are several theories that have been applied to study the effect of sibling
composition on adult outcomes. Among these theories, we draw on the neoclassical theory of
human capital [21-22] to guide the empirical analysis. We do so because of its parsimony, clarity
of broad predictions, and because it has been widely used by economists [10, 13, 23-24] to
estimate the effects of sibling composition on many indicators of adult well-being, including
health (but not blood pressure). Furthermore, the neoclassical theory of human capital
complements and extends early life history theory [25-26] by explaining why events beyond
maternal, fetal, or infant health might affect adult health. There are other theoretical approaches
one could have used, including role models [11], equity heuristics used by parents [27], resource
dilution [28], sex-minority theory [25], and evolutionary models [12, 29-30]. Some of these
approaches are more useful when examining other topics, such as parental favoritism in
investments between girls and boys and between older and younger siblings[31], and the ensuing
health consequences of these investments, rather than identifying with precision the type of
sibling that might affect adult health the most. Despite their strengths, none of the theories
(including human capital theory) predicts the specific type of sibling likely to affect adult health.
Sibling composition and blood pressure
5

The neoclassical theory of human capital starts by assuming that parents try to behave
altruistically and that they try to maximize the well-being of all their children. However, parents
adjust their goals in response to at least three factors: sex biases in the economy, resource
constraints (e.g., time, income), and mechanisms for lifting the constraints through such things as
reciprocity or credit.
Through market signal mechanism, the theory of human capital predicts a sex-bias in
investment in children. If parents live in an economy with a pro-male bias, then boys will earn
higher wages than girls when children reach adulthood. If so, then parents will likely skew
investments to children whose sex is favored in the labor market [32]. When parents are
resource-constrained and cannot lift the constraints, they will skew investments to the offspring
with the potential of earning the highest wage as an adult. Under such conditions, holding
constant the number of siblings in the household, having more brothers will harm the health of
girls because brothers will compete for and dilute the fixed amount of parental resources
available to invest in the health of all offspring, particularly sons.
Additionally, the neoclassical theory of human capital makes clear predictions about the
strength of the effects of sibling composition on parental investments. It predicts that the effects
will be most marked in societies with a sharp gender bias in the labor market, and among
households facing more binding resource constraints and fewer possibilities of lifting those
constraints. At the other extreme, in more affluent economies without a wage premium for one
sex over the other, and with well-functioning credit markets, one should expect sibling
composition to exert weaker effects on parental investments among children. In between the
extremes -- within a society with a particular type of gender bias -- sibling composition should be
Sibling composition and blood pressure
6

more marked among poorer households because they have fewer possibilities of lifting resource
constraints.
If one accepts the three building blocks of the theory of human capital – market signals,
binding resource constraints, and access to mechanisms to ease these constraints – then linking
sibling composition to adult health becomes a straight-forward task. Poorer households without
access to mechanisms to ease binding resource constraints will invest more in, say, boys over
girls in response to market signals, and thus the addition of a girl will have a differential impact
on parental investments in boys over girls. Boys will accumulate more schooling and enjoy
better health than their sisters. Since schooling and adult health are positively associated [33],
children who accumulate more schooling early in life should have better adult health. Thus,
sibling composition should affect adult health through direct and indirect paths: in an economy
with a male bias, boys will have better child health, and this should contribute to better adult
health, and in these societies boys will accumulate more schooling, which should also contribute
to better adult health.
The neoclassical theory of human capital serves well as an initial platform to explain why
parents might skew investments to children of one sex over the other in response to signals from
the market, and in response to their own resource constraints, but the theory poses several
empirical challenges. First, the theory does not explain the particulars of why or how older or
younger sisters or younger and older brothers might affect adult health. In an economy that
favors boys over girls, it may not be any additional brother who competes for resources and
erodes the health of other siblings, but only an additional older (or younger) brother. Second,
human capital theory is silent about how to identify the resource constraints (e.g., credit, time)
Sibling composition and blood pressure
7

that matter most. Third, human capital theory has little to say about the multiple benefits and
costs that additional siblings might bring – benefits and costs that could well cancel each other
out. For example, in an economy with a pro-male bias, an additional younger brother might
increase sibling rivalry and lower per-capita parental educational investments among children,
but the additional younger brother might help in household chores and so free up time for school
work among older siblings. These countervailing effects plus the cultural specificity of resource
constraints might explain in part why empirical findings about the effects of sibling composition
on child or adult outcomes have been so mixed [10]. Note that many of these deficiencies are
also shared by other approaches.
As an exploratory study, we use a sample of 206 men and 220 non-pregnant women ≥ 16
years of age from a foraging and farming society of native Amazonians in Bolivia (Tsimane’)
surveyed during 2007 to estimate the association between (a) systolic blood pressure (SBP) and
diastolic blood pressure (DBP) (outcome variables) and (b) the number of younger sisters,
younger brothers, older sisters, and older brothers people currently had (main explanatory
variables).
AIMS
Aim 1: To test two hypotheses from the theory of human capital about the effects of sibling
composition on adult blood pressure:
H1: Sibling composition bears an association with adult blood pressure.
H2: The effects of sibling composition will be more marked among Tsimane’ with fewer
resources.
Sibling composition and blood pressure
8

Aim 2: To complement Aim 1, we try to answer the question: “what type of sibling will bear the
strongest association with adult blood pressure?”
Besides these two aims, we also contribute to the small literature
on blood pressure among contemporary native Amazonians. Descriptive studies of adult blood
pressure among native Amazonians matter because they provide the benchmark against which to
assess changes in blood pressure as these populations become increasingly integrated into the
market economy. Market exposure changes diet, physical activity, and stress, which contribute to
changes in blood pressure.
THE TSIMANE’
Setting
The Tsimane’ are a native Amazonian society of farmers and foragers who live mainly in
the department of Beni, Bolivia. They number ~8,000 people and live in ~120 villages, each of
which has an average of 19.3 households (standard deviation [SD] = 11.8 households).
Tsimane’ have been in sporadic contact with Westerners since the early 1950s [34,35]. Tsimane’
subsistence centers on hunting, fishing, plant foraging, and slash-and-burn farming. 75% of
Tsimane’ practice preferential, bilateral, cross-cousin marriage, meaning that a man marries the
daughter of his mother’s brother or his father’s sister [36]. Elsewhere [37,38,] we have shown
that Tsimane’ society is relatively egalitarian between the sexes, particularly in early life; we
have found no significant differences in anthropometric indicators of nutritional status,
schooling, academic skills, spoken Spanish language skills, or infant or childhood mortality.
Two recent publications contain ethnographies, histories, and descriptions of the
geographic setting of the Tsimane’ [34,35]. Recent publications also contain descriptions of the
Sibling composition and blood pressure
9

general health of the Tsimane’ [39-41]. Since background material has been covered elsewhere,
we limit the discussion of this section to sibling composition.
Sibling size and sibling composition
Adult Tsimane’ had an average of 5.8 siblings and a median of six siblings (SD = 3.0
siblings; range: 0-14). Table 1 suggests that between younger sisters and younger brothers, or
between older sisters and older brothers, the number of brothers exceeded the number of sisters.
Specifically, Tsimane’ had an average of 1.4 younger sisters (SD = 1.4), but they had an average
of 1.7 younger brothers (SD = 1.6). The difference was statistically significant (t = 4.33,
p=0.001). On average, Tsimane’ had 1.5 older brothers (SD = 1.5), but they had only 1.3 older
sisters (SD = 1.3). The difference between the mean number of brothers and sisters was
statistically significant (t = 2.68; p = 0.007).
INSERT TABLE 1 ABOUT HERE
The skewed ratio in the number of brothers compared with the number of
sisters could reflect (a) greater omission when recalling the number of sisters than when recalling
the number of brothers and (b) selective mortality of females in the past.
Tsimane’ children have roles and responsibilities for other siblings, and the roles and
responsibilities are clearer for girls than for boys. The oldest unmarried sister still living at home
is responsible for her youngest sibling. This means that by the time the youngest child is old
enough to walk, the older sister, even if she is young, is given the responsibility of watching the
newly mobile younger sibling. Responsibilities include watching the child, cleaning up after the
child stools or urinates, making sure the child is fed, making sure the child receives gifts or food
equally to the other children in the family, comforting the crying child, changing the child’s
Sibling composition and blood pressure
10

clothing, and bathing the child. The oldest sister retains this responsibility for the youngest
sibling as more children enter the family. Middle sisters then take care of second and third
youngest siblings. The mother is the primary caregiver for the youngest child, though if a
babysitter is needed she will turn to the oldest daughter to take her place. This responsibility of
the oldest sister is only relinquished once she has her own children. If she moves into her own
house before having her own children and remains near to her mother’s house, the oldest sister
maintains her responsibility for the youngest walking sibling. In the past (and to a lesser extent
today) Tsimane’ practiced sororal polygyny, so sisters would accompany each other into
adulthood and share all household responsibilities
Boys do not have as many responsibilities to their siblings as girls do. If a boy is the
oldest sibling, the mother continues to care for the youngest children until there is a girl in a
care-giving position. Rather, when they get older, the boy’s responsibilities become clearer in a
financial capacity, particularly towards their brothers. Older brothers help younger brothers
construct homes and find paid work and a wife. Younger brothers will seek the appropriate
sibling to ask for money or to help answer experiential questions.
MATERIALS AND VARIABLES
Materials
Information comes from the 2007 survey of an annual panel study among all Tsimane’ in
13 Tsimane’ villages along the Maniqui River, department of Beni [43]. The panel study started
in 2002 and continued uninterruptedly until 2010. At the start of the panel, we selected the 13
villages to capture geographic variation in proximity to the market town of San Borja (mean
Sibling composition and blood pressure
11
village-to-town distance = 25.96 km; SD = 16.70 km), the only town along the Maniqui River.
For this article we use the 2007 survey because it is the only time we asked about sibling
composition and measured blood pressure at the same time.
The 2007 survey included 426 adults or people ≥ 16 years of age (non-pregnant women =
220; men = 206) who came from 213 households. We chose 16 years of age as a cut-off to
define adulthood because at that age Tsimane’ set up their households and stop attending school.
The median age of first union for women was 16 years (SD = 3.14) and the median age of first
union for men was 19 years (SD = 3.14).
Surveyors visited villages twice during June-September, 2007. During the first visit,
surveyors collected socioeconomic and demographic data. During the second visit, surveyors
took anthropometric measures, asked about perceived health, and measured blood pressure.
Surveys took place in the home of study participants, but blood pressure and anthropometric
measures were taken in the village school. Four Bolivian university graduates did the surveys
and four Tsimane’ who worked in the panel study from its beginning translated survey questions.
Variables: Blood pressure and sibling composition
Using an automatic blood pressure monitor (Omron HEM-711DLX; rating 6V 4W),
surveyors took three measures of blood pressure for each adult on the upper left arm according to
standard protocol, with the participant’s feet on the floor and arm rested at heart level. Each
participant was seated and rested for at least five minutes before the initial measure and for a
minimum of two minutes between successive measures. Participants remained still until we
completed the three measures. For the analysis we used the average of the three measures. A
Sibling composition and blood pressure
12

recent university graduate with a bachelor’s degree in biology and a Tsimane’ translator who had
worked in the project from the beginning took blood pressure; Nyberg and Tanner trained the
staff to measure blood pressure.
Surveyors asked each adult in the household for the current number of living younger
sisters, older sisters, younger brothers, and older brothers. We took two steps to reduce errors in
the measure of sibling composition. First, we only asked about siblings from the same mother;
we did not ask about half siblings on the father’s side to reduce the response burden on
participants. Second, we only asked about currently living siblings. Asking retrospective
questions about a person’s sibling composition during childhood would have provided a better
metric of the possible sibling rivalry faced by the target subject when the subject was a child, but
the measure would have been vulnerable to recall bias from omission. Based on the four
categories of siblings, we calculated sibling size and an index of birth order, expressed as (birth
order -1)/(sibling size -1)[10]. The index of birth-order allows us to address the concern that
children with low birth order tend to have a higher probability of being in a small household.
We transformed sibling size to its natural logarithm in the analysis.
Control variables
In the regressions of Table 3 we control for a person’s: (a) current age, (b) sex (men = 1;
women =0), (c) maximum schooling level attained (hereafter, education), and (d) standing
height, a proxy for long-term health. We use education as a proxy for resource constrain since
education is documented to be positively associated with income [44,45]. In the regressions of
Sibling composition and blood pressure
13

Table 4 we drop (d) and include monetary income from wage labor and from the sale of local
goods for the 14 days before the interview
ANALYSIS
We analyzed the data in two stages.
[a]. First stage: Effect of different sibling categories. We first estimated the effects of
different sibling categories on blood pressure. To enhance statistical power, we did the analysis
with women and men combined, but controlled for the person’s sex and for interaction effects
between sibling categories and sex. Table 3 contains those results. One problem with using
different sibling categories as explanatory variables is that it leaves out the possibility of more
general effects of total sibling size. For this reason we move to the second stage.
[b]. Second stage: Effect of total sibling size and birth order. In the second stage we
merged different sibling categories and estimated the effect of total sibling size and birth order
on blood pressure, separately for women and for men. Those results are shown in Table 4.
The regressions used in both stages include the natural logarithm of either systolic or
diastolic blood pressure as an outcome. We used a household random-effects model to address
individual household impacts. We did not use ordinary least squares (OLS) regressions since
OLS regressions are unable to deal with household heterogeneity and would produce inefficient
estimates. For the statistical analysis we used Stata for Windows, version 10 (Stata Corporation,
College Station, Texas).
RESULTS
Description of blood pressure among Tsimane’
Sibling composition and blood pressure
14

Figures 1-2 show the distribution of systolic and diastolic blood pressure separately for
adult women and men. Adults in the sample had a mean systolic blood pressure of 115 mmHg
(mmHg = millimeters of mercury) and a median systolic blood pressure of 114 mmHg (SD =
14.84). Mean and median diastolic blood pressure were both 65 mmHg (SD = 10.82). Diastolic
blood pressure had more variation than systolic blood pressure; the coefficients of variation (SD/
mean) for systolic and diastolic blood pressure were 0.13 and 0.17. After controlling for age,
men had 9.10 mmHg or 7.97% higher systolic blood pressure than women (103 mmHg) and 3.84
mmHg or 5.79% higher diastolic blood pressure than women (61 mmHg). The differences in
mean systolic or diastolic blood pressure between women and men were statistically significant
at the 99% confidence interval.
INSERT FIGURES 1-2 ABOUT HERE
Only 5.87% of the sample (25 out of 426) had hypertension, defined as diastolic blood
pressure >90 mmHg or systolic blood pressure >140 mmHg. Our estimate of 5.87% is slightly
higher than an estimate from an earlier study (3.5%) done by other researchers [50] with a
different sample of Tsimane’. A χ2 test showed no statistically significant difference between the
share of women (12 out of 220 [5.40%]) and the share of men (13 out of 206 [6.30%]) with
hypertension (χ2=0.15; p = 0.70). A larger share of the sample, 30.75% (131 out of 426), showed
evidence of pre-hypertension, defined as follow: 80 mmHg ≤ diastolic ≤ 89 mmHg or 120
mmHg ≤ systolic ≤ 139 mmHg. 41.75% of the men but only 20.45% of the women had pre-
hypertension, and of the 131 people with pre-hypertension, 65.65% were men and 34.35% were
women.
Sibling composition and blood pressure
15

Comparison with other native Amazonian societies
In Table 2 we summarize published studies on mean blood pressure among other native
Amazonian societies. To enhance the validity of the comparison, we specify the age and the sex
composition of the comparison group, and then compute the statistic for the same demographic
group among the Tsimane’. For example, if a study estimated systolic blood pressure among
women 21-40 years of age, we compute the same statistic for Tsimane’ women 21-40 years of
age.
INSERT TABLE 2 ABOUT HERE
We found five published studies of blood pressure among other native
Amazonian societies besides the Tsimane’. Studies contained an average of 144 people, roughly
evenly split between women (mean = 70) and men (mean = 75). The sample size of our study
(men = 206; women = 220) was larger than the sample size of the other studies.
The results of Table 2 suggest that Tsimane' had higher systolic blood pressure and, for
the most part, also higher diastolic blood pressure than other native Amazonian groups. Only the
Cofán of Ecuador, and the Parakateje and Karib Xingu of Brazil had higher diastolic blood
pressure than the Tsimane’. The sample used in this article may be capturing the higher end of
the distribution of blood pressure among native Amazonians. Since this study took place in 2007
and most of the studies summarized in Table 2 took place on or about the same time
(1994-2009), we doubt that the differences could reflect secular changes in blood pressure in the
region.
Regression results
Sibling composition and blood pressure
16

[A]. The effect of different sibling categories (Table 3, section I). Among the four
categories of siblings, the number of older sisters bore a consistent association with adult blood
pressure, but only when using diastolic blood pressure as an outcome, and even then results
varied across models (Table 3, section I, row b, Columns A2, B2, C2). Overall, the addition of
an older sister was associated with an increase in diastolic blood pressure among adults of the
following amounts: (i) 1.05% (p=0.04; column A2) if we only include main effects and (ii)
1.27-1.58% if in addition to main effects we include interaction effects with the person’s sex
(1.58%, p=0.022, column B2) or education (1.27%, p=0.044, column C2).
Column D2 provides more details regarding the impact of older sisters. The main direct
effect on diastolic blood pressure of having an older sister ceased to be positive or statistically
significant (section I, row b, column D2) after interacting sibling categories with age. The
interaction effects between older sisters and age show that the positive effect of having an older
sister on adult diastolic blood pressure grew more prominent as people aged (section IV, row a,
column D2). Having an additional older sister was associated with 0.06% increases of diastolic
blood pressure for every one year increase in age.
Besides the number of older sisters, the number of younger brothers (row c) also affected
adult systolic and diastolic blood pressure. Although having an additional younger brother
showed no statistically significant overall impact on blood pressure, having an additional
younger brother was associated with 2.7-2.9% higher systolic and diastolic blood pressure
(section I, row c, column D) when people were 16 years old. As people aged, the impact of
having more young brothers waned by 0.06-0.08% per year (section IV, column D).
Sibling composition and blood pressure
17

The addition of one more younger sister lowered diastolic (but not systolic) blood
pressure by 1.5% (section I, column A2; p=0.01) or 3.5% (section I, column D2; p=0.001), but it
had not effect on systolic blood pressure, and even with diastolic blood pressure the effect was
found in only two of the four regressions. Last, we found no evidence that the number of older
brothers (section I, row d) bore an association with adult blood pressure.
INSERT TABLE 3 ABOUT HERE
The results of section V suggest no consistent, systematic joint effect of the four
categories of siblings on either systolic or diastolic adult blood pressure. In rows a-b, section V,
we show the results of F tests to assess whether the total number of sisters (older + younger) had
the same effect on blood pressure as the total number of brothers (older + younger) (row a) and
whether the total number of younger sibling (younger sisters + younger brothers) had the same
effect as the total number of older siblings (older sisters + older brothers) (row b). Out of the 16
tests, only four were statistically significant at the 95% confidence interval or above.
[B]. Additional analysis: Effects of total sibling size and birth order (Table 4). The broad
conclusion of the analysis presented so far is that for the most part, specific categories of sibling
do not affect adult blood pressure in a consistent way, and when they do, the size effect is
biologically small. It is possible that the weak effects might stem from our having done the
analysis with disaggregated sibling categories; merging different sibling categories into more
conventional groups or variables, such as sibling size or birth order, might produce stronger
results. In the next section we present the results of additional analysis without specific sibling
categories, but with the total number of siblings (sibling size) or birth order as the main
Sibling composition and blood pressure
18

explanatory variables, and additional estimates for a wide range of interaction effects. Table 4
contains the regression results of the additional analysis.
INSERT TABLE 4 ABOUT HERE
First, of the 16 coefficients for the main direct effects of the total number of siblings
(sibling size) and birth order (section I, rows a-b), only one coefficient was statistically
significant. A 20% increase in the number of siblings was associated with a 1.9 %-increase in
systolic blood pressure (p=0.08) among men without education at age 16. Lumping or splitting
different sibling groups produced essentially the same weak results.
Second, we found no evidence of interaction effects between sibling size and age [row e]
or between birth order [row f] and age. None of the eight coefficients measuring interaction
effects between age and sibling size or between age and birth order was statistically significant.
Third, we found no evidence of interaction effects between education and sibling size
(row c) and little evidence of interaction effects between education and birth order (row d). Of
the eight coefficients indicating interact effects between education and either sibling size (row c)
or birth order (row d), only one was statistically significant. Although the main effect of
education is not shown in Table 4, the significant interaction effect with education suggests a
stronger negative association between a women’s birth order and her systolic blood pressure as
the level of education increases. For a woman with one year of education, an increase in the
birth order index of 0.1 was associated with a 1.2% drop in systolic blood pressure (p=0.00) (row
d). Again, note the biologically modest (albeit statistically significant) effect of birth order on
adult blood pressure.
Sibling composition and blood pressure
19

Fourth, we found significant three-way interaction effects between sibling size,
education, and age on systolic blood pressure (row g). Two out of the four coefficients for
interaction effects were statistically significant, and the effect was consistent across gender, but
only for systolic blood pressure. The three-way interaction suggests that the impact of sibling
size on blood pressure depends on the level of education and age. Among women, as education
and age increased, a 20% increase in the number of siblings was associated with an additional
reduction in systolic blood pressure of 0.032% (p=0.00) per year of education per year of age.
Among men, as education and age increased, the effect of an additional 20% increase in the total
number of sibling on systolic blood pressure was 0.010% per year of education per year of age
(p=0.06). All these three-way interaction effects are net of main effects and secondary
interaction effects. As an illustration, in Figure 3 we plot the effect of the three-way interaction,
examining how the impact of sibling size on systolic blood pressure varies by age and the level
of education of men.
INSERT FIGUE 3 ABOUT HERE
Limitations
Parameter estimates for the four sibling categories of Table 3 or for the
variable sibling size or birth order of Table 4 might be biased if (a) people reported the number
of siblings with random measurement error from poor recall and (or) (b) we omitted variables
linked with both blood pressure and with sibling categories or with sibling size and birth order.
We had no instrumental variables to correct for random measurement error of sibling categories.
Correcting for random measurement error would have produced larger coefficients and stronger
statistical results. Thus, if random measurement error was the only methodological shortcoming
Sibling composition and blood pressure
20
affecting our regression results, then one could read the coefficients of Tables 3-4 as lower
bounds of true magnitudes.
We tried to control for some confounders by including a person’s education
(a proxy for permanent or lifetime income) and their height (a proxy for long-run health), but we
had no data to control for other variables, such as parental attributes or preferences about ideal
sibling composition [7] or other aspects of early life. Sibling composition is endogenous because
parents have some choice in the number of daughters and sons or total sibling size in a
household. In addition, sibling composition might result from endogenous biological
characteristics of parents [51, 52]. Unfortunately, we do not have data on these omitted
variables.
DISCUSSION AND CONCLUSIONS
Aim 1: Test hypotheses.
H1. Sibling composition bears an association with adult blood pressure. We found that
having an additional older sister or an additional younger brother was associated with higher
adult blood pressure. Having an additional older sister had statistically significant positive effects
on diastolic blood pressure overall, but the size effect was small (1-1.5%). The effect increased
as people aged. Having an additional younger brother was associated with higher adult blood
pressure. As people aged, the effect diminished. Having an additional older brothers had no
effect on adult blood pressure.
H2. The effects of sibling composition will be more marked among Tsimane’ with fewer
resources. Human capital theory predicts stronger effects of sibling composition on blood
Sibling composition and blood pressure
21

pressure among people with less education, since people with more education have more
employment opportunities and higher income. If so, then the interaction effects of education
with sibling categories (Table 3, section III) or education with number of sibling (sibling size) or
with birth order (Table 4, section II) should have been significant. Most of these interaction
effects were insignificant, suggesting that resource constraints within Tsimane’ society do not
affect blood pressure.
Aim 2: What type of sibling will bear the strongest association with adult blood pressure? We
noted in the introduction that human capital theory and other theoretical approaches do not make
predictions about the specific type of sibling likely to affect adult health. For this reason, we
tried to identify the sibling type most closely associated with adult blood pressure, and found that
among all siblings, younger brothers and older sisters had the strongest effects on blood pressure.
For example, the regression coefficients of Table 3 (section I, row c, column D) suggest that
having a younger brother was associated with 2.7% higher systolic blood pressure and with 2.9%
higher diastolic blood pressure, and that younger brothers also had interaction effects with age
(section IV, row c, column D). The effect of having an additional younger brother waned by
0.06% per year of age. The effect of having an additional older sister on blood pressure was
small, amounted to only about 1%, and applied only to diastolic blood pressure (section I, row
b); this effect grew by +0.06% per year of age.
Younger brothers and older sisters might affect blood pressure through different
mechanisms. Studies suggest that the presence of younger siblings is associated with poorer
mental health and behavior problems. Children see the arrival of a younger sibling as a stressor
Sibling composition and blood pressure
22

because the newborn competes for parental investments [53]. In a pro-male economy, having
additional younger brothers would exert a larger impact. The persistence of such stressors would
results in higher blood pressure [54]. As time goes by, people are more independent from their
parents, and thus the effect wanes. The persistence in the effect of having an additional older
sisters may result primarily from the role that older sisters play in a family. As noted, among the
Tsimane’ older sisters have more caretaking responsibilities for younger siblings, and this
support may last through the adulthood of younger siblings.
In closing, we turn to two topics: the value of examining how disaggregated
sibling categories might affect adult health and a possible reason for the weak effects. One
striking result of section I, Table 4, is the weakness of the standard coefficients of sibling size or
birth order on adult blood pressure. Contrast those results with the results of section I, Table 3.
What the disaggregated analysis buys is the ability to see that some types of sibling increase
blood pressure, but others decrease it. For example, in column A we see that having a younger
and an older sister produce effects on blood pressure of roughly similar magnitudes, but of
opposite signs. Thus, the more conventional approach of examining total sibling size or birth
order on health outcomes might, by construction, blur the significant role played by specific
types of sibling.
The weak association between sibling types and adult blood pressure raises the question
of the type of early life event likely to have a lasting impact. Perhaps only large adverse shocks
experienced in early life (e.g., maternal smoking) leave an imprint on adult health; next to those
large adverse shocks, sibling composition might be too modest to produce lasting effects. As
Sibling composition and blood pressure
23

noted in the introduction, childhood sibling composition affects contemporaneous health
outcomes during childhood, but those links do not seem to persist into adulthood.
Sibling composition and blood pressure
24
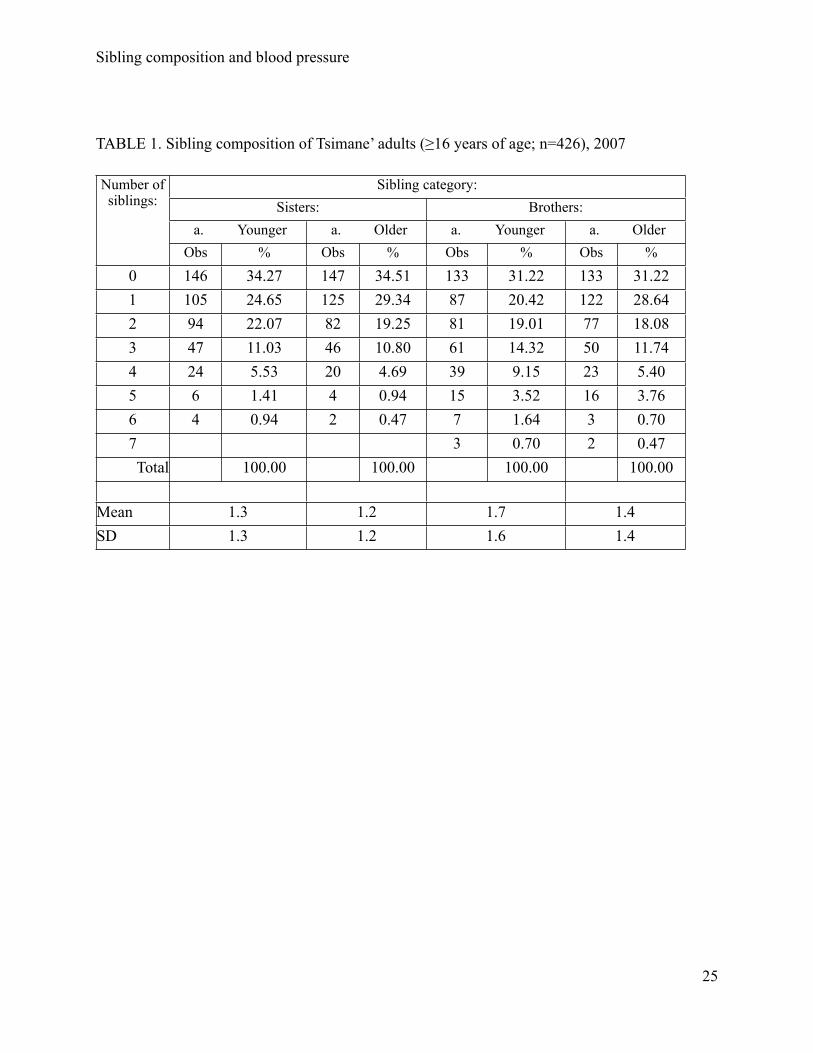
TABLE 1. Sibling composition of Tsimane’ adults (≥16 years of age; n=426), 2007
Number of siblings:
Sibling category:Sisters: Brothers:
a. Younger a. Older a. Younger a. OlderObs % Obs % Obs % Obs %
0 146 34.27 147 34.51 133 31.22 133 31.221 105 24.65 125 29.34 87 20.42 122 28.642 94 22.07 82 19.25 81 19.01 77 18.083 47 11.03 46 10.80 61 14.32 50 11.744 24 5.53 20 4.69 39 9.15 23 5.405 6 1.41 4 0.94 15 3.52 16 3.766 4 0.94 2 0.47 7 1.64 3 0.707 3 0.70 2 0.47Total 100.00 100.00 100.00 100.00
Mean 1.3 1.2 1.7 1.4SD 1.3 1.2 1.6 1.4
Sibling composition and blood pressure
25

TABLE 2. Comparison of mean diastolic (DBP) and systolic blood pressure (SBP) among other
native Amazonian societies and Tsimane'
Other native Amazonian societies: Tsimane’:Study Group Sex Age N DPB SBP DBP SBP n
1 Cofán M 21-76 43 70 NA 68 NR 168F 27 68 64 179
2 Yanomano M20-59
99 64 101 68 120 160F 96 56 90 64 110 169
Xingu M 99 65 103 68 120 160F 99 59 96 64 110 169
3 Karaja M >17 26 66 106 68 120 197F 37 64 103 64 111 207
4 Parakateje M 20-79 56 73 111 68 120 178F 34 70 107 64 111 190
5 Karib Xingu M 20-79 125 70 107 68 120 178F 126 65 100 64 111 190
Notes: NA= not available; NR=not relevant for the comparison. Study: 1=Fitton (2005)[46];
2=Mancilha-Carvahol et al. (2003)[47]; 3=Silva and Eckhardt (1994)[48]; 4=Tavares et al.
(2003) [49]; 5=Gimeno et al. (2009)[55].
Sibling composition and blood pressure
26

TABLE 3. Household random-effect multiple linear regressions with natural logarithm of blood
pressure as an outcome and sibling composition as main explanatory variables, Tsimane’ adults
(≥ 16 years of age; n=426), 2007
Covariates:
Dependent variable - natural logarithm of mean of three readings of systolic or diastolic blood pressure:
A B C D
1. Systolic
2.Diastolic 1.Systolic 2.Diastolic 1.Systolic 2.Diastolic 1.Systolic 2.Diastolic
I. Direct effects of sibling (Q1):
a.#- younger sisters -0.001 -0.015** -0.002 -0.009 -0.003 -0.007 -0.007 -0.035**
b.#-older sisters 0.002 0.010** 0.008 0.015** 0.002 0.012** -0.011 -0.015
c.#-younger brothers 0.0004 0.006 -0.009** 0.008 -0.006 0.004 0.027*** 0.029***
d.#-older brothers -0.001 -0.006 -0.003 -0.007 -0.004 -0.010 0.001 0.013
II. Interaction: sibling and male:
a.#-younger sisters*male ^ ^ 0.003 -0.014 ^ ^ ^ ^
b.#-older sisters*male ^ ^ -0.015 -0.012 ^ ^ ^ ^
c.#-younger brothers*male ^ ^ 0.016** -0.002 ^ ^ ^ ^
d.#-older brothers*male ^ ^ 0.007 0.001 ^ ^ ^ ^
III. Interaction: sibling and education:
a.#-younger sisters*education ^ ^ ^ ^ -0.001 -0.003 ^ ^
b.#-older sisters*education ^ ^ ^ ^ 0.00001 -0.001 ^ ^
c.#-younger brothers*education
^ ^ ^ ^ 0.002** 0.0009 ^ ^
d.#-older brothers*education ^ ^ ^ ^ 0.001 0.001 ^ ^ IV. Interaction: sibling and agea.#-younger sisters*age ^ ^ ^ ^ ^ ^ 0.0001 0.0005
b.#-older sisters*age ^ ^ ^ ^ ^ ^ 0.0003 0.0006**
c.#-younger brothers*age ^ ^ ^ ^ ^ ^ -0.0008*** -0.0006**
d.#-older brothers*age ^ ^ ^ ^ ^ ^ -0.00005 -0.0005
V. Results of F test for joint statistical significance of various combinations of sibling categories:
a. Sisters = brothers0.01 0.13 2.68 0.13 0.39 0.41 5.03** 11.89***
a. Younger = older0.17 2.27 3.92** 0.77 1.38 0.24 3.85** 0.04
Note: Regressions include robust standard errors, clustering by household, constant, and the
following controls (none shown): sex, age, standing height, and education. **, and ***
significant at the ≤5% and ≤1% level.
Sibling composition and blood pressure
27

TABLE 4. Household random-effect multiple linear regressions with natural logarithm of blood
pressure as an outcome and sibling size and birth order as main explanatory variables, Tsimane’
adults (≥ 16 years of age; n=426), 2007
Covariates
Female MaleBasic model Full model Basic model Full model
Systolic Diastolic Systolic Diastolic Systolic Diastolic Systolic DiastolicI. Direct effects of total sibling size and birth order
[a] Sibling size -0.009 0.008 -0.027 0.009 0.027 0.010 0.0934* 0.116[b] Birth order 0.025 0.058 0.071 0.051 -0.025 0.006 0.017 -0.022
II. Interaction effects[c] Sibling size * education ^ ^ 0.029 0.008 ^ ^ -0.002 -0.018[d] Birth order*education ^ ^ -0.1215*** -0.050 ^ ^ -0.012 0.017[e] Sibling size * age ^ ^ 0.001 0.000 ^ ^ -0.002 -0.002[f] Birth order*age ^ ^ -0.001 0.002 ^ ^ 0.000 0.001[g] Sibling size * education*age ^ ^ -0.0016*** -0.001 ^ ^ -0.0005* 0.000[h] Birth order*education*age ^ ^ 0.0082*** 0.002 ^ ^ 0.0004 -0.001
Note: Same notes as in Table 3, except a person’s birth order is determined as (birth order-1)/
(sibling size-1), monetary income for the two weeks before the interview is added as additional
control variables, and age is relative to 16 for ease of interpretation. .
Sibling composition and blood pressure
28

Figure 1. Comparison of systolic blood pressure between adult (≥ 16 years of age) Tsimane’
women (n = 220) and men (n = 206), 2007
Sibling composition and blood pressure
29

Figure 2. Comparison of diastolic blood pressure between adult (≥ 16 years of age) Tsimane’
women (n = 220) and men (n = 206), 2007
Sibling composition and blood pressure
30
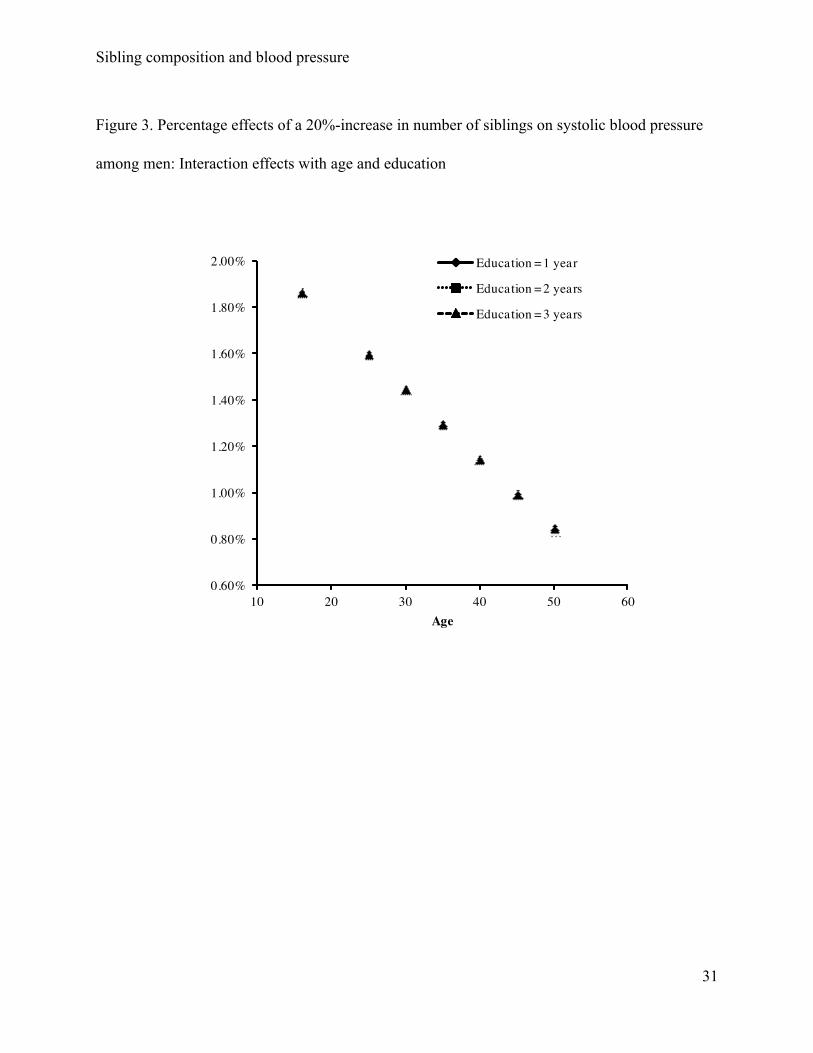
Figure 3. Percentage effects of a 20%-increase in number of siblings on systolic blood pressure
among men: Interaction effects with age and education
Sibling composition and blood pressure
31

LITERATURE CITED
1. Barker DJ, Osmond C, Golding J, Kuh D, Wadsworth ME (1989) Growth in utero, blood
pressure in childhood and adult life, and mortality from cardiovascular disease. British
Medical Journal 298: 564-567.
2. Barker DJ (2006) Birth weight and hypertension. Hypertension 48: 431-436.
3. Blane D, Hart CL, Smith GD, Gillis CR, Hole DJ, et al. (1996. ) Association of cardiovascular
disease risk factors with socioeconomic position during childhood and during adulthood
British Medical Journal 313: 1434-1438.
4. Cruickshank JK, Mzayek F, Liu L, Kieltyka L, Sherwin R, et al. (2005) Origins of the black/
white difference in blood pressure: roles of birth weight, postnatal growth, early blood
pressure and adolescent body size. Circulation 111: 1932-1937.
5. Huxley RR, Shiell AW, Law CM (2000) The role of size at birth and postnatal catch-up growth
in determining systolic blood pressure: A systematic review of the literature. Journal of
Hypertension 18: 815-831.
6. Forrest CB, Riley AW (2004) Childhood origins of adult health: a basis for life-course health
policy. Health Affairs 23: 155-164.
7. Pastor-Barriuso R, Banegas JR, Damian J, Appel LJ, Guallar E. (2003) Systolic blood
pressure, diastolic blood pressure, and pulse pressure: an evaluation of their joint effect
on mortality. Ann Intern Med 139:731–73
8. Beevers DG. 2004. Epidemiological, pathophysiological and clinical significance of systolic,
diastolic and pulse pressure. J Hum Hypertens 18: 531–533.
Sibling composition and blood pressure
32

9. Gaziano TA. (2007). Reducing the growing burden of cardiovascular disease in the
developing world. Health Affairs 26 (1): 13-24
10. Dayioðlu M, Murat K, Aysit T (2009) Impact of sib size, birth order and sex composition on
school enrolment in urban Turkey. Oxford Bulletin of Economics and Statistics 71:
399-426.
11. Steelman L, Powell B, Werum R, Carter S (2002) Reconsidering the effects of sibling
configuration: Recent advances and challenges. Annual Review of Sociology 28:
243-269.
12. Lawson DW, Mace R (2008) Sibling configuration and childhood growth in contemporary
British families. International Journal of Epidemiology 37: 1408-1421.
13. Garg A, Morduch J (1998) Sibling rivalry and the gender gap: Evidence form child health
outcomes in Ghana. Journal of Population Economics 11: 471-293.
14. Wang H, Sekine M, Chen X, Kanayama H, Yamagami T, et al. (2007) Sib-size, birth order
and risk of overweight in junior high school students in Japan: Results of the Toyama
Birth Cohort Study. Preventive Medicine 44: 45-51.
15. Karmaus W, Botezan C (2002) Does a higher number of siblings protect against the
development of allergy and asthma? Journal of Epidemiology and Community Health 56:
209-217.
16. Karmaus W, Arshad H, Mattes J (2001) Does the sibling effect have its origin in utero?
Investigating birth order, cord blood immunoglobulin E concentration, and allergic
sensitization at age 4 years. American Journal of Epidemiology 154: 909-915.
Sibling composition and blood pressure
33

17. Ohfuji S, Miyake Y, Arakawa M, Tanaka K, Sasaki S (2009) Sibship size and prevalence of
allergic disorders in Japan: The Ryukyus Child Health Study. Pediatrics Allergy and
Immunology 20: 377-384.
18. Miyake Y, Yura A, Iki M (2004) Cross-sectional study of allergic disorders in relation to
familial factors in Japanese adolescents. Acta Paediatr 93: 380-385.
19. Westergaard T, Klaus R, Wohlfhrt J, Andersen PK, Aaby P, et al. (2005) Sibship
Characteristics and Risk of Allergic Rhinitis and Asthma. American Journal of
Epidemiology 162: 125-132.
20. Bernsen R, de Johan J, van der Johannes W (2003) Birth order and sibship size as
independent risk factors for asthma, allergy, and eczema. Pediatrics, Allergy and
Immunology 14: 464-469.
21. Becker GS (1991) A treatise on the family. Cambridge, Massachusetts: Harvard University
Press.
22. Behrman JR (1997) Intra-household distribution and the family. Handbook of Population and
Family Economics. Ed. Rosenzweig MR and Stark O, Amsterdam: Elsevier Science B.V.,
pp. 125-87.
23. Morduch J (2000) Sibling rivalry in Africa. American Economic Review 90: 405-409.
24. Butcher K, Case A (1994) The effect of sibling sex composition on women's education and
earnings. The Quarterly Journal of Economics 109: 531-563.
25. Kuzawa CW (2005). The fetal origins of developmental plasticity. Introduction to the special
issue. American Journal of Human Biology 17:1-19.
Sibling composition and blood pressure
34

26. Kuzawa CW, Elizabeth AQ (2009). Developmental origins of adult function and health:
Evolutionary hypotheses. Annual Review of Anthropology 38: 131-47.
27. Hertwig R, Davis JN, Sulloway FJ (2002) Parental investment: how an equity motive can
produce inequality. Psychological Bulletin 128:728-745.
28. Downey D (2001) Number of siblings and intellectual development: The resource dilution
explanation. American Psychologist 56:497-504 .
29. Lawson DW, Mace R (2009) Trade-offs in modern parenting: a longitudinal study of sibling
competition for parental care. Evolution & Human Behavior 30: 170-183
30. Lawson DW, Mace R (2011) Parental investment and the optimisation of human family size.
Philosophical Transactions of the Royal Society B: Biological Sciences 366: 333-343
31. Jeon J (2008) Evolution of parental favoritism among different-aged offspring. Behavioral
Ecology 19:344-352
32. Gibson MA, Sear R (2010) Does wealth increase parental investment biases in child
education? Evidence from two African populations on the cusp of the fertility transition.
Current Anthropology 51: 693-701.
33. Wolfe BL, Haveman RH (2002) Social and non-market benefits from education in an
advanced economy, Education in the 21st Century: Meeting the Challenges of a
Changing World, Federal Reserve Bank of Boston.
34. Ringhofer L (2010) Fishing, foraging, and farming in the Bolivian Amazon on a local society
in transition. New York: Springer.
35. Huanca T (2008) Tsimane' oral tradition, landscape, and identity in tropical forest. La Paz:
Wagui.
Sibling composition and blood pressure
35
36. Godoy RA, Eisenberg DTAE, Reyes-García V, Huanca T, Leonard WT, et al. (2008)
Assortative mating and offspring well-being. Theory and empirical findings from a native
Amazonian society in Bolivia. Evolution and Human Behavior 29: 201-210.
37. Godoy RA, Nyberg C, Eisenberg DTAE, Magvanjav O, Shinnar E, et al. (2010) Short but
catching up: Statural growth among native Amazonian Bolivian Children. American
Journal of Human Biology 22: 336-347.
38. Zeng W, Jovel KR, Undurrage EA, Broesch J, Eisenberg DTAE, et al. (2010) Sib
composition and child educational attainment: Theory and evidence from native
Amazonians in Bolivia. Economics of Education Review (under review).
39. Tanner S, Leonard WR, Mcdade TW, Reyes-García V, Godoy R, et al. (2009) Influence of
helminth infections on childhood nutritional status in lowland Bolivia. American Journal
of Human Biology 21: 651-656.
40. Nyberg C ( 2009) Market integration, stress, and health: an exploration of hypothalamic-
pituitary-adrenal dynamics among the Tsimane' of the Bolivian Amazon. PhD
dissertation, Department of Anthropology, Northwestern University.
41. Godoy RA, Leonard WR, Reyes-García V, Goodman E, McDade T, et al. (2006) Physical
stature of adult Tsimane' Amerindians, Bolivian Amazon in the 20th century. Economics
and Human Biology 4: 184-205.
42. Navara K (2009) Humans at tropical latitudes produce more females. Biology Letters 5:
524-527.
43. Leonard WR, Godoy RA (2008) Tsimane' Amazonian Panel Study (TAPS): The first five
years (2002-2006) available to the public. Economics and Human Biology 6: 299-301.
Sibling composition and blood pressure
36

44. Alba-Ramirez A, San Segundo MJ (1995) The return to education in Spain. Economics of
Education Review 14:155-166,
45. Ashenfelter O, Rouse CE (1998) Income, schooling, and ability: evidence from a new sample
of twins. Quarterly Journal of Economics 113: 253-284
46. Fitton LJ (2005) Aging in Amazonia: Blood pressure and culture change among the Cofán of
Ecuador. Journal of Cross-Cultural Gerontology 2: 159-179.
47. Mancilha-Carvalho JJ, de Souza e Silva NA (2003) The Yanomami Indians in the
INTERSALT study. Arq Bras Cardiol 80: 295-300.
48. Silva HP, Eckhardt RB (1994) Westernization and blood pressure variation in four
Amazonian populations. Collegium Antropologicum 18: 81-87.
49. Tavares EF, Vieira-Filho JP, Andriolo A, Sanudo A, Gimeno SG, et al. (2003) Metabolic
profile and cardiovascular risk patterns of an Indian tribe living the Amazon region of
Brazil. Human Biology 75: 31-46.
50. Gurven, M., H. Kaplan, J. Winking, D. E. Rodriguez, S. Vasunilashorn, J. K. Kim, C. Finch,
and E. Crimmings. (2009). Inflammation and infection do not promote arterial aging and
cardiovascular disease risk factors among lean horticulturalists. PLoS ONE 4(8): e6590.
51. Ruder A (1985) Paternal-age and birth-order effect on the human secondary sex ratio.
American Journal of Human Genetics 37: 362-372.
52. Khoury MJ, Erickson JD, James LM (1984) Paternal effects on the human sex ratio at birth:
evidence from interracial crosses. American Journal of Human Genetics 36: 1103-1111.
53. Lawson DW, Mace R (2010) Siblings and childhood mental health: Evidence for a later-born
advantage. Social Science & Medicine. 70: 2061-69.
Sibling composition and blood pressure
37

54. Matthews KA, Katholi CR, McCreath H, Whooley M, Williams DR, Zhu S, Markovitz H
(2004) Blood pressure reactivitity to physchological stress predicts hypertension in the
CARDIA study. Circulation 110: 74-78.
55. Gimeno, S.G.A., Rodrigues, D., Canó, E.N., Lima, E.E.S., Schaper, M, Pagliaro, H, Lafer,
M, Baruzzi, R.G. 2009. Cardiovascular risk factors among Brazilian Karib indigenous
peoples: Upper Xingu, Central Brazil, 2000-3. Journal of Epidemiology and Community
Health 63:299-304.
Sibling composition and blood pressure
38


